Attached files
| file | filename |
|---|---|
| EX-31.2 - EXHIBIT 31.2 - MCKESSON CORP | mck_exhibit312x3312016.htm |
| EX-10.18 - EXHIBIT 10.18 - MCKESSON CORP | mck_exhibit1018x3312016.htm |
| EX-10.14 - EXHIBIT 10.14 - MCKESSON CORP | mck_exhibit1014x3312016.htm |
| EX-21 - EXHIBIT 21 - MCKESSON CORP | mck_exhibit21x3312016.htm |
| EX-24 - EXHIBIT 24 - MCKESSON CORP | mck_exhibit24x3312016.htm |
| EX-12 - EXHIBIT 12 - MCKESSON CORP | mck_exhibit12x33116.htm |
| EX-10.19 - EXHIBIT 10.19 - MCKESSON CORP | mck_exhibit1019x3312016.htm |
| EX-23 - EXHIBIT 23 - MCKESSON CORP | mck_exhbit23x3312016.htm |
| EX-31.1 - EXHIBIT 31.1 - MCKESSON CORP | mck_exhibit311x3312016.htm |
| EX-32 - EXHIBIT 32 - MCKESSON CORP | mck_exhibit32x3312016.htm |
UNITED STATES
SECURITIES AND EXCHANGE COMMISSION
Washington, D.C. 20549
FORM 10-K
x | ANNUAL REPORT PURSUANT TO SECTION 13 OR 15(d) OF THE SECURITIES EXCHANGE ACT OF 1934 |
For the fiscal year ended March 31, 2016
OR
TRANSITION REPORT PURSUANT TO SECTION 13 OR 15(d) OF THE SECURITIES EXCHANGE ACT OF 1934 | |
For the transition period from to
Commission File Number: 1-13252
McKESSON CORPORATION
(Exact name of registrant as specified in its charter)
Delaware | 94-3207296 | |
(State or other jurisdiction of incorporation or organization) | (I.R.S. Employer Identification No.) | |
One Post Street, San Francisco, California | 94104 | |
(Address of principal executive offices) | (Zip Code) | |
(415) 983-8300
(Registrant’s telephone number, including area code)
Securities registered pursuant to Section 12(b) of the Act:
(Title of each class) | (Name of each exchange on which registered) | |
Common stock, $0.01 par value | New York Stock Exchange | |
Securities registered pursuant to Section 12(g) of the Act: None
Indicate by check mark if the registrant is a well-known seasoned issuer, as defined in Rule 405 of the Securities Act. Yes x No ¨
Indicate by check mark if the registrant is not required to file reports pursuant to Section 13 or 15(d) of the Act. Yes ¨ No x
Indicate by check mark whether the registrant (1) has filed all reports required to be filed by Section 13 or 15(d) of the Securities Exchange Act of 1934 during the preceding 12 months (or for such shorter period that the registrant was required to file such reports), and (2) has been subject to such filing requirements for the past 90 days. Yes x No ¨
Indicate by check mark whether the registrant has submitted electronically and posted on its corporate Web site, if any, every Interactive Data File required to be submitted and posted pursuant to Rule 405 of Regulation S-T (§232.405 of this chapter) during the preceding 12 months (or for such shorter period that the registrant was required to submit and post such files). Yes x No ¨
Indicate by check mark if disclosure of delinquent filers pursuant to Item 405 of Regulation S-K (§229.405 of this chapter) is not contained herein, and will not be contained, to the best of registrant’s knowledge, in definitive proxy or information statements incorporated by reference in Part III of this Form 10-K or any amendment to this Form 10-K. x
Indicate by check mark whether the registrant is a large accelerated filer, an accelerated filer, a non-accelerated filer, or a smaller reporting company. See the definitions of “large accelerated filer,” “accelerated filer” and “smaller reporting company” in Rule 12b-2 of the Exchange Act. (Check one):
Large accelerated filer | x | Accelerated filer | ¨ | |||
Non-accelerated filer | ¨ (Do not check if a smaller reporting company) | Smaller reporting company | ¨ | |||
Indicate by check mark whether the registrant is a shell company (as defined in Rule 12b-2 of the Act).
Yes ¨ No x
The aggregate market value of the voting and non-voting common equity held by non-affiliates of the registrant, computed by reference to the closing price as of the last business day of the registrant’s most recently completed second fiscal quarter, September 30, 2015, was approximately $42.5 billion.
Number of shares of common stock outstanding on April 30, 2016: 225,020,523
DOCUMENTS INCORPORATED BY REFERENCE
Portions of the registrant’s Proxy Statement for its 2016 Annual Meeting of Stockholders are incorporated by reference into Part III of this Annual Report on Form 10-K.
McKESSON CORPORATION
TABLE OF CONTENTS
Item | Page | |
1. | ||
1A. | ||
1B. | ||
2. | ||
3. | ||
4. | ||
5. | ||
6. | ||
7. | ||
7A. | ||
8. | ||
9. | ||
9A. | ||
9B. | ||
10. | ||
11. | ||
12. | ||
13. | ||
14. | ||
15. | ||
McKESSON CORPORATION
PART I
Item 1. | Business. |
General
McKesson Corporation (“McKesson,” the “Company,” the “Registrant” or “we” and other similar pronouns) is a global pharmaceutical distribution services and information technology company, currently ranked 11th on the Fortune 500. We deliver a comprehensive offering of pharmaceuticals and medical supplies and provide services to help our customers improve the efficiency and effectiveness of their healthcare operations. We work with payers, healthcare providers, pharmacies, pharmaceutical companies and others across the healthcare industry to improve patients’ access to high-quality care and make healthcare safer while enhancing efficiency and reducing costs.
The Company’s fiscal year begins on April 1 and ends on March 31. Unless otherwise noted, all references in this document to a particular year shall mean the Company’s fiscal year.
Our Annual Report on Form 10-K, Quarterly Reports on Form 10-Q, Current Reports on Form 8-K and amendments to those reports filed or furnished pursuant to Section 13(a) or 15(d) of the Securities Exchange Act of 1934, as amended (the “Exchange Act,”) are available free of charge on our website (www.mckesson.com under the “Investors — Financial Information — SEC Filings” caption) as soon as reasonably practicable after we electronically file such material with, or furnish it to, the Securities and Exchange Commission (“SEC” or the “Commission”). The content on any website referred to in this Annual Report on Form 10-K is not incorporated by reference into this report, unless expressly noted otherwise.
The public may also read or copy any materials that we file with the SEC at the SEC’s Public Reference Room at 100 F Street, N.E., Washington, DC 20549. The public may obtain information on the operation of the Public Reference Room by calling the SEC at 1-800-SEC-0330. The SEC maintains a website that contains reports, proxy and information statements, and other information regarding issuers, including the Company, that file electronically with the SEC. The address of the website is www.sec.gov.
Business Segments
We operate our business through two segments: McKesson Distribution Solutions and McKesson Technology Solutions.
Our Distribution Solutions segment distributes branded and generic pharmaceutical drugs and other healthcare-related products worldwide and provides practice management, technology, clinical support and business solutions to community-based oncology and other specialty practices. This segment also provides specialty pharmaceutical solutions for pharmaceutical manufacturers including offering multiple distribution channels and clinical trial access to our network of oncology physicians. It also provides medical-surgical supply distribution, equipment, logistics and other services to healthcare providers within the United States. Additionally, this segment operates retail pharmacies in Europe and supports independent pharmacy networks within North America. It also sells financial, operational and clinical solutions to pharmacies (retail, hospital, alternate site) and provides consulting, outsourcing and other services.
The Technology Solutions segment delivers enterprise-wide clinical, patient care, financial, supply chain and strategic management technology solutions, as well as connectivity, outsourcing and other services, including remote hosting and managed services, to healthcare organizations.
Net revenues for our segments for the last three years were as follows:
Years Ended March 31, | ||||||||||||||||||
(Dollars in billions) | 2016 | 2015 | 2014 | |||||||||||||||
Distribution Solutions | $ | 188.0 | 98 | % | $ | 176.0 | 98 | % | $ | 134.1 | 98 | % | ||||||
Technology Solutions | 2.9 | 2 | 3.1 | 2 | 3.3 | 2 | ||||||||||||
Total | $ | 190.9 | 100 | % | $ | 179.1 | 100 | % | $ | 137.4 | 100 | % | ||||||
3
McKESSON CORPORATION
Distribution Solutions Segment
Our Distribution Solutions segment consists of the following businesses: North America pharmaceutical distribution and services, International pharmaceutical distribution and services and Medical-Surgical distribution and services.
North America pharmaceutical distribution and services
Our North America pharmaceutical distribution and services business is comprised of the following business units: U.S. Pharmaceutical Distribution, McKesson Specialty Health, McKesson Canada, and McKesson Pharmacy Technology & Services.
U.S. Pharmaceutical Distribution: This business supplies branded, specialty and generic pharmaceuticals and other healthcare-related products to customers throughout the United States in three primary customer channels: (1) retail national accounts (including national and regional chains, food/drug combinations, mail order pharmacies and mass merchandisers); (2) independent retail pharmacies; and (3) institutional healthcare providers (including hospitals, health systems, integrated delivery networks, clinics and alternate site providers). This business also provides solutions and services to pharmaceutical manufacturers. This business sources materials and products from a wide-array of different suppliers, including certain generic pharmaceutical drugs produced through a contract-manufacturing program.
Our U.S. pharmaceutical distribution business operates and serves thousands of customer locations through a network of 31 distribution centers, as well as a primary redistribution center, a strategic redistribution center and two repackaging facilities, serving all 50 states and Puerto Rico. We invest in technology and other systems at all of our distribution centers to enhance safety and reliability and to provide the best product availability for our customers. For example, in most of our distribution centers we use Acumax® Plus, an award-winning technology that integrates and tracks all internal inventory-related functions such as receiving, put-away and order fulfillment. Acumax® Plus uses bar code technology, wrist-mounted computer hardware and radio frequency signals to provide customers with real-time product availability and industry-leading order quality and fulfillment in excess of 99.9% adjusted accuracy. In addition, we offer Mobile ManagerSM, which integrates portable handheld technology with Acumax® Plus to give customers complete ordering and inventory control. We also offer McKesson ConnectSM, an internet-based ordering system that provides item lookup and real-time inventory availability as well as ordering, purchasing, third-party reconciliation and account management functionality. Together, these features help ensure customers have the right products at the right time for their facilities and patients.
To maximize distribution efficiency and effectiveness, we follow the Six Sigma methodology — an analytical approach that emphasizes setting high-quality objectives, collecting data and analyzing results to a fine degree in order to improve processes, reduce costs and minimize errors. We continue to implement information systems to help achieve greater consistency and accuracy both internally and for our customers.
The major customer groups of our U.S. Pharmaceutical Distribution business can be categorized as retail national accounts, independent retail pharmacies and institutional healthcare providers.
Retail National Accounts — Business solutions that help national account customers increase revenues and profitability. Solutions include:
• | Central FillSM — Prescription refill service that enables pharmacies to more quickly refill prescriptions remotely, more accurately and at a lower cost, while reducing inventory levels and improving customer service. |
• | Redistribution Centers — Two facilities totaling over 750,000 square feet that offer access to inventory for single source warehouse purchasing, including pharmaceuticals and biologics. These distribution centers also provide the foundation for a two-tiered distribution network that supports best-in-class direct store delivery. |
• | McKesson SynerGx® — Generic pharmaceutical purchasing program and inventory management that helps pharmacies maximize their cost savings with a broad selection of generic drugs, competitive pricing and one-stop shopping. |
• | RxPakSM — Bulk-to-bottle repackaging service that leverages our purchasing scale and supplier relationships to provide pharmaceuticals at reduced prices, help increase inventory turns and reduce working capital investment. |
4
McKESSON CORPORATION
• | Inventory Management — An integrated solution comprising forecasting software and automated replenishment technologies that reduce inventory-carrying costs. |
• | ExpressRx Track™ — Pharmacy automation solution featuring state-of-the-art robotics, upgraded imaging and expanded vial capabilities, and industry-leading speed and accuracy in a radically small footprint. |
Independent Retail Pharmacies — Solutions for managed care contracting, branding and advertising, merchandising, purchasing, operational efficiency and automation that help independent pharmacists focus on patient care while improving profitability. Solutions include:
• | Health Mart® — Health Mart® is a national network of more than 4,600 independently-owned pharmacies and is one of the industry’s most comprehensive pharmacy franchise programs. Health Mart® provides franchisees support for managed care contracting, branding and local marketing solutions, the Health Mart private label line of products, merchandising solutions and programs for enhanced patient support. |
• | AccessHealth® — Comprehensive managed care and reconciliation assistance services that help independent pharmacies save time, access competitive reimbursement rates and improve cash flow. |
• | McKesson Reimbursement AdvantageSM (“MRA”) — MRA is one of the industry’s most comprehensive reimbursement optimization packages, comprising financial services (automated claim resubmission), analytic services and customer care. |
• | McKesson OneStop Generics® — Generic pharmaceutical purchasing program that helps pharmacies maximize their cost savings with a broad selection of generic drugs, competitive pricing and one-stop shopping. |
• | Sunmark® — Complete line of more than 600 products that provide retail independent pharmacies with value-priced alternatives to national brands. |
• | FrontEdge™ — Strategic planning, merchandising and price maintenance program that helps independent pharmacies maximize store profitability. |
• | McKesson Sponsored Clinical Services (SCS) Network — Access to patient-support services that allow pharmacists to earn service fees and to develop stronger patient relationships. |
Institutional Healthcare Providers — Electronic ordering/purchasing and supply chain management systems that help customers improve financial performance, increase operational efficiencies and deliver better patient care. Solutions include:
• | Fulfill-RxSM — Ordering and inventory management system that empowers hospitals to optimize the often complicated and disjointed processes related to unit-based cabinet replenishment and inventory management. |
• | Asset Management — Award-winning inventory optimization and purchasing management program that helps institutional providers lower costs while ensuring product availability. |
• | SKY Packaging — Blister-format packaging containing the most widely prescribed dosages and strengths in generic oral-solid medications. SKY Packaging enables acute care, long-term care and institutional pharmacies to provide cost-effective, uniform packaging. |
• | McKesson Plasma and BioLogics — A full portfolio of plasma-derivatives and biologic products. |
• | McKesson OneStop Generics® — Described above. |
McKesson Specialty Health (“MSH”): This business provides a range of solutions to oncology and other specialty practices operating in communities across the country, to pharmaceutical and biotechnology suppliers who manufacture specialty drugs and vaccines, and to payers and hospitals. MSH is focused on three core business lines: Manufacturer Solutions, Practice Management and Provider Solutions.
5
McKESSON CORPORATION
Manufacturer Solutions help manufacturers accelerate the approval and successful commercialization of specialty pharmaceuticals across the product life cycle. MSH’s offerings include supply chain services, including specialty pharmacy services and third party logistics (“3PL”), provider and patient engagement programs, clinical trial support, patient assistance programs, reimbursement services, and analytics. In addition, MSH helps manufacturers minimize reimbursement challenges while offering affordable, safe access to therapies through Risk Evaluation and Mitigation Strategies (“REMS”) programs.
In April 2016, we completed the acquisition of Biologics, Inc (“Biologics”), a Cary, North Carolina-based company that provides oncology pharmacy services to providers and patients as well as solutions for manufacturers and payers. For manufacturers, Biologics helps optimize speed-to-therapy, enhance patient adherence and improve patient access to therapy. In addition, Biologics works with manufacturers to develop custom strategies to enhance the clinical and commercial success of their products at each stage of the life-cycle.
Practice Management provides a variety of solutions, including practice operations, healthcare information technology, revenue cycle management and managed care contracting solutions, evidence-based guidelines and quality measurements to support The U.S. Oncology Network, one of the nation’s largest network of integrated, community-based oncology practices dedicated to advancing high-quality, evidence-based cancer care. We also support U.S. Oncology Research, one of the nation’s largest research networks, specializing in oncology clinical trials.
In April 2016, we also completed the acquisition of Vantage Oncology Holdings LLC (“Vantage”), a leading national provider of integrated oncology and radiation services headquartered in Manhattan Beach, California. Vantage’s comprehensive oncology management services model, including its focus on community-based radiation oncology, medical oncology, and other integrated cancer care services, complements and strengthens the existing offerings of McKesson and The US Oncology Network, while allowing patients to access the care they need in an efficient and cost effective way.
Provider Solutions offers community specialists (oncologists, rheumatologists, ophthalmologists, urologists, neurologists, and other specialists) an extensive set of customizable products and services designed to strengthen core practice operations, enhance value-based care delivery, and expand their service offering to patients. Tools and services include specialty drug distribution and group purchasing organization (“GPO”) services, technology solutions, practice consulting services, and vaccine distribution, including our exclusive distributor relationship with the Centers for Disease Control and Prevention’s (“CDC”) Vaccines for Children program. Community-based physicians in this business line have broad flexibility and choice to select the products and commitment levels that best meet their practice needs.
When we classify a pharmaceutical product or service as “specialty,” we consider the following factors: diseases requiring complex treatment regimens such as cancer and rheumatoid arthritis; ongoing clinical monitoring requirements, high-cost, special handling, storage and delivery requirements and, in some cases, exclusive distribution arrangements. Our use of the term “specialty” to define a portion of our distribution business may not be comparable to that used by other industry participants, including our competitors.
McKesson Canada: McKesson Canada is one of the largest pharmaceutical distributors in Canada. McKesson Canada, through its network of 14 distribution centers, provides logistics and distribution for manufacturers - delivering their products to retail pharmacies, hospitals, long-term care centers, clinics and institutions throughout Canada and through its network of infusion clinics, offers specialty services and adherence programs. Beyond pharmaceutical distribution, logistics and order fulfillment, McKesson Canada provides automation solutions to its retail and hospital customers, dispensing millions of doses each year. McKesson Canada also provides health information exchange solutions that streamline clinical and administrative communication and retail banner services that help independent pharmacists compete and grow through innovative services and operation support. In partnership with other McKesson businesses, McKesson Canada provides a full range of services to Canadian manufacturers and healthcare providers, contributing to the quality and safety of care for patients.
In March 2016, we entered into an agreement to purchase Rexall Health from Katz Group for $3 billion Canadian dollars (or, approximately $2.3 billion U.S. dollars using the currency exchange ratio of 0.77 Canadian dollar to 1 U.S. dollar as of March 31, 2016). Rexall Health, which operates approximately 470 retail pharmacies in Canada, particularly in Ontario and Western Canada, will enhance our Canadian pharmaceutical supply chain. The acquisition is subject to regulatory approval and is expected to close during the second half of calendar year 2016.
6
McKESSON CORPORATION
McKesson Pharmacy Technology & Services: This business provides offerings that allow large retail chains, hospital outpatient pharmacies and small and independent pharmacies to meet the high demand for prescriptions while maximizing profits and optimizing operations. It supplies integrated pharmacy management systems, automated dispensing systems and related services to retail, outpatient, central fill, specialty and mail order pharmacies. Solutions include:
• | EnterpriseRx® — A Software as a Service (SaaS) pharmacy management system, that allows large retail chain, health system and retail independent pharmacies to meet demand for prescriptions while maximizing profits and optimizing operations. |
• | Pharmaserv® — A fully integrated, server-based pharmacy management system that gives the customer complete control of their pharmacy data. |
• | PharmacyRx — A cost-effective, SaaS-based pharmacy management system that can be installed quickly and makes processing prescriptions fast and easy. |
• | McKesson 340B Solution Suite and Macro Helix® — Software as a Service (SaaS)-based solutions that help providers manage, track and report on medication replenishment associated with the federal 340B Drug Pricing Program. |
• | Supplylogix® — Develops and delivers practical supply chain intelligence solutions to pharmacy and related businesses and provides a wide array of services to healthcare providers nationwide. |
International pharmaceutical distribution and services
Our international pharmaceutical distribution and services business provides distribution and services to the pharmaceutical and healthcare sectors primarily in Europe. The pharmaceutical wholesale business supplies pharmaceuticals and other healthcare-related products generally to retail pharmacies and institutional customers. Its wholesale network consists of approximately 109 branches that deliver to over 65,000 pharmacies daily in ten European countries. This business functions as a vital link between manufacturers and pharmacies in supplying pharmaceuticals to patients, and generally procures the pharmaceuticals approved in each country as well as other products sold in pharmacies directly from the manufacturers. Pharmaceutical and other healthcare-related products are stored at regional wholesale branches with the support of its efficient warehousing management system. The retail pharmacy business serves patients and consumers in six European countries directly through over 2,200 of its own pharmacies and over 4,500 participant pharmacies operating under brand partnership arrangements. The retail business provides traditional prescription pharmaceuticals, non-prescription products and medical services and operates under the Lloyds Pharmacy brand in the United Kingdom (“U.K.”), which accounted for approximately 71% of the total volume of the retail pharmacy business for the year ended March 31, 2016.
In April 2016, we completed the acquisition of the pharmaceutical distribution business of UDG Healthcare Plc (“UDG”) based in Ireland and the U.K. for $412 million. The acquired UDG business primarily provides pharmaceutical and other healthcare products to retail and hospital pharmacies. We also expect to complete the acquisition of the pharmacy business of J Sainsbury Plc (“Sainsbury”) based in the U.K. during the first quarter of 2017. Once completed, these acquisitions will further enhance our retail pharmacy service capabilities in Ireland and the U.K.
In 2015, we committed to a plan to sell our Brazilian pharmaceutical distribution business, which we acquired through our February 2014 acquisition. The sale is expected to close during the first half of 2017. Refer to Financial Note 9, “Discontinued Operations”, to the consolidated financial statements appearing in this Annual Report on Form 10-K.
Medical-Surgical distribution and services
This business provides medical-surgical supply distribution, equipment, logistics and other services to healthcare providers including physicians’ offices, surgery centers, extended care facilities, homecare and occupational health sites through a network of distribution centers within the U.S. This business is a leading distributor of supplies to the full range of alternate-site healthcare facilities, including physicians’ offices, clinics and surgery centers (primary care), long-term care and homecare sites (extended care). Through a variety of products and services geared towards the supply chain, our Medical-Surgical Distribution business is focused on helping its customers operate more efficiently while providing one of the industry’s most extensive product offerings, including our own private label line.
7
McKESSON CORPORATION
Technology Solutions Segment
Our Technology Solutions segment provides a comprehensive portfolio of information technology and services to help healthcare organizations improve quality of care and ensure patient safety, reduce the cost and variability of care and better manage their resources and revenue stream. The Technology Solutions segment markets its products and services to integrated delivery networks, hospitals, physician practices, home healthcare providers, retail pharmacies and payers.
The product portfolio for the Technology Solutions segment is designed to address a wide array of healthcare clinical and business performance needs ranging from medication safety and information access to revenue cycle management, resource utilization and physician adoption of electronic health records (“EHR”). Analytics software enables organizations to measure progress as they automate care processes for optimal clinical outcomes, business and operating results and regulatory compliance. To ensure that organizations achieve the maximum value for their information technology investment, we also offer a wide range of services to support the implementation and use of solutions as well as to assist with business and clinical redesign, process re-engineering and staffing (both information technology and back-office).
Our Technology Solutions segment consists of the following businesses: McKesson Health Solutions, Connected Care and Analytics (“CCA”), Imaging and Workflow Solutions, Business Performance Services and Enterprise Information Solutions.
McKesson Health Solutions: We offer a suite of services and software products designed to manage the cost and quality of care for payers, providers, hospitals and government organizations. Solutions include:
• | InterQual® Criteria for clinical decision support and utilization management; |
• | Clear CoverageTM for point-of-care utilization management, coverage determination and network compliance; |
• | Claims payment solutions to facilitate accurate and efficient medical claim payments; |
• | Business intelligence tools for measuring, reporting and improving clinical and financial performance; |
• | Network management tools to enable health plans to transform the performance of their networks; and |
• | RelayHealth® financial solutions to facilitate communication between healthcare providers and patients, and to aggregate data for claims management and trend analysis, and optimize revenue cycle management processes. |
Connected Care and Analytics: We provide health information exchange solutions that streamline clinical and administrative communication among patients, providers, payers, pharmacies, manufacturers, government entities and financial institutions through our vendor-neutral RelayHealth® and its intelligent network, RelayHealth® pharmacy solutions which help our customers to accelerate the delivery of high-quality care and improve financial performance through online consultation of physicians by patients, electronic prescribing by physicians, and point-of-service resolution of pharmacy claims by payers. We provide clinical and analytical software to support management workflows and analytics for optimization of hospital departments and a comprehensive solution for homecare. We also provide performance management solutions designed to enhance an organization’s ability to plan and optimize quality care delivery. Enterprise visibility and performance analytics provide business intelligence that enables providers to manage capacity, outcomes, productivity and patient flow.
Imaging and Workflow Solutions: We offer medical imaging and information management systems for healthcare enterprises, including a picture archiving communications system, a radiology information system and a comprehensive cardiovascular information system. Our enterprise-wide approach to medical imaging enables organizations to take advantage of specialty-specific workstations while building an integrated image repository that manages all of the images and information captured throughout the care continuum.
8
McKESSON CORPORATION
Business Performance Services: We help providers focus their resources on delivering healthcare while managing their revenue cycle operations and information technology through a comprehensive suite of managed services. Services include full and partial revenue cycle outsourcing, remote hosting and business office administration. We also provide a complete solution for physician practices of all sizes, whether they are independent or employed, that includes software, revenue cycle outsourcing and connectivity services. Software solutions include practice management and EHR software for physicians of every size and specialty. Our physician practice offering includes outsourced billing, collection, data input, medical coding, billing, contract management, cash collections, accounts receivable management and extensive reporting of metrics related to the physician practice. We also offer a full suite of physician and hospital consulting services, including financial management, coding and compliance services, revenue cycle services and strategic services.
Enterprise Information Solutions: We provide comprehensive clinical and financial information systems for hospitals and health systems of all sizes. These systems are designed to improve the safety and quality of patient care and improve clinical, financial and operational performance. We also provide professional services to help customers achieve business results from their software or automation investment. In addition, workflow management solutions assist caregivers with staffing and maintaining labor rule continuity between scheduling, time and attendance and payroll. We also offer a comprehensive supply chain management solution that integrates enterprise resource planning applications, including financials, materials, human resources/payroll, scheduling, point of use, surgical and anesthesia services and enterprise-wide analytics.
Business Combinations, Discontinued Operations and Other Divestitures
We have undertaken additional strategic initiatives in recent years designed to further focus on our core healthcare businesses and enhance our competitive position. We expect to continue to undertake such strategic initiatives in the future. These initiatives are detailed in Financial Notes 2, 5, and 9 “Business Combinations,” “Divestiture of Businesses,” and “Discontinued Operations,” to the consolidated financial statements appearing in this Annual Report on Form 10-K.
Competition
Our Distribution Solutions segment faces a highly competitive global environment with strong competition from international, national, regional and local full-line, short-line and specialty distributors, service merchandisers, self-warehousing chain drug stores, manufacturers engaged in direct distribution, third-party logistics companies and large payer organizations. In addition, this segment faces competition from various other service providers and from pharmaceutical and other healthcare manufacturers as well as other potential customers of the segment, which may from time-to-time decide to develop, for their own internal needs, supply management capabilities that would otherwise be provided by the segment. In all areas, key competitive factors include price, quality of service, breadth of product lines, innovation and, in some cases, convenience to the customer.
Our Technology Solutions segment experiences substantial competition from many companies, including other software services firms, consulting firms, shared service vendors, certain hospitals and hospital groups, payers, care management organizations, hardware vendors and internet-based companies with technology applicable to the healthcare industry. Competition varies in size from small to large companies, in geographical coverage and in scope and breadth of products and services offered.
Patents, Trademarks, Copyrights and Licenses
McKesson and its subsidiaries hold patents, copyrights, trademarks and trade secrets related to McKesson products and services. We pursue patent protection for our innovation, and obtain copyrights covering our original works of authorship, when such protection is advantageous. Through these efforts, we have developed a portfolio of patents and copyrights in the U.S. and worldwide. In addition, we have registered or applied to register certain trademarks and service marks in the U.S. and in foreign countries.
We believe that, in the aggregate, McKesson’s confidential information, patents, copyrights, and trademarks are important to its operations and market position, but we do not consider any of our businesses to be dependent upon any one patent, copyright, trademark, or trade secret, or any family or families of the same. We cannot guarantee that our intellectual property portfolio will be sufficient to deter misappropriation, theft, or misuse of our technology, nor that we can successfully enjoin infringers. We periodically receive notices alleging that our products or services infringe on third party patents and other intellectual property rights. These claims may result in McKesson entering settlement agreements, paying damages, discontinuing use or sale of accused products, or ceasing other activities. While the outcome of any litigation or dispute is inherently uncertain, we do not believe that the resolution of any of these infringement notices would have a material adverse impact on our results of operation.
9
McKESSON CORPORATION
We hold inbound licenses for certain intellectual property that is used internally, and in some cases, utilized in McKesson’s products or services. While it may be necessary in the future to seek or renew licenses relating to various aspects of our products and services, we believe, based upon past experience and industry practice, such licenses generally can be obtained on commercially reasonable terms. We believe our operations and products and services are not materially dependent on any single license or other agreement with any third party.
Other Information about the Business
Customers: During 2016, sales to our ten largest customers, including group purchasing organizations (“GPOs”) accounted for approximately 52.4% of our total consolidated revenues. Sales to our largest customer, CVS Health (“CVS”), accounted for approximately 20.3% of our total consolidated revenues. At March 31, 2016, trade accounts receivable from our ten largest customers were approximately 32% of total trade accounts receivable. Accounts receivable from CVS were approximately 18% of total trade accounts receivable. We also have agreements with GPOs, each of which functions as a purchasing agent on behalf of member hospitals, pharmacies and other healthcare providers, as well as with government entities and agencies. The accounts receivables balances are with individual members of the GPOs, and therefore no significant concentration of credit risk exists. Substantially all of these revenues and accounts receivable are included in our Distribution Solutions segment.
Suppliers: We obtain pharmaceutical and other products from manufacturers, none of which accounted for more than 6% of our purchases in 2016. The loss of a supplier could adversely affect our business if alternate sources of supply are unavailable. We believe that our relationships with our suppliers, as a whole, are good. The ten largest suppliers in 2016 accounted for approximately 44% of our purchases.
A significant portion of our distribution arrangements with the manufacturers provides us compensation based on a percentage of our purchases. In addition, we have certain distribution arrangements with pharmaceutical manufacturers that include an inflation-based compensation component whereby we benefit when the manufacturers increase their prices as we sell our existing inventory at the new higher prices. For these manufacturers, a reduction in the frequency and magnitude of price increases, as well as restrictions in the amount of inventory available to us, could have a material adverse impact on our gross profit margin.
Research and Development: Research and development costs were $392 million, $392 million and $457 million during 2016, 2015 and 2014. These costs do not include $30 million, $34 million and $40 million of costs capitalized for software held for sale during 2016, 2015 and 2014. Development expenditures are primarily incurred by our Technology Solutions segment. Our Technology Solutions segment’s product development efforts apply computer technology and installation methodologies to specific information processing needs of hospitals and other customers. We believe that a substantial and sustained commitment to such expenditures is important to the long-term success of this business. Additional information regarding our development activities is included in Financial Note 1, “Significant Accounting Policies,” to the consolidated financial statements appearing in this Annual Report on Form 10-K.
Environmental Regulation: Our operations are subject to regulations under various federal, state, local and foreign laws concerning the environment, including laws addressing the discharge of pollutants into the air and water, the management and disposal of hazardous substances and wastes, and the cleanup of contaminated sites. We could incur substantial costs, including cleanup costs, fines and civil or criminal sanctions and third-party damage or personal injury claims, if in the future we were to violate or become liable under environmental laws.
We are committed to maintaining compliance with all environmental laws applicable to our operations, products and services and to reducing our environmental impact across all aspects of our business. We meet this commitment through an environmental strategy and sustainability program.
We sold our chemical distribution operations in 1987 and retained responsibility for certain environmental obligations. Agreements with the Environmental Protection Agency and certain states may require environmental assessments and cleanups at several closed sites. These matters are described further in Financial Note 24, “Commitments and Contingent Liabilities,” to the consolidated financial statements appearing in this Annual Report on Form 10-K.
10
McKESSON CORPORATION
The liability for environmental remediation and other environmental costs is accrued when the Company considers it probable and can reasonably estimate the costs. Environmental costs and accruals, including that related to our legacy chemical distribution operations, are presently not material to our operations or financial position. Although there is no assurance that existing or future environmental laws applicable to our operations or products will not have a material adverse impact on our operations or financial condition, we do not currently anticipate material capital expenditures for environmental matters. Other than the expected expenditures that may be required in connection with our legacy chemical distribution operations, we do not anticipate making substantial capital expenditures either for environmental issues, or to comply with environmental laws and regulations in the future. The amount of our capital expenditures for environmental compliance was not material in 2016 and is not expected to be material in the next year.
Employees: On March 31, 2016, we employed approximately 68,000 full-time equivalent employees.
Financial Information About Foreign and Domestic Operations: Certain financial information relating to foreign and domestic operations is included in Financial Note 27, “Segments of Business,” to the consolidated financial statements appearing in this Annual Report on Form 10-K. See “Risk Factors” in Part I, Item 1A below for information regarding risks associated with our foreign operations.
Forward-Looking Statements
This Annual Report on Form 10-K, including “Management’s Discussion and Analysis of Financial Condition and Results of Operations” in Item 7 of Part II of this report and the “Risk Factors” in Item 1A of Part I of this report, contains forward-looking statements within the meaning of section 27A of the Securities Act of 1933, as amended and section 21E of the Securities Exchange Act of 1934, as amended. Some of these statements can be identified by use of forward-looking words such as “believes,” “expects,” “anticipates,” “may,” “will,” “should,” “seeks,” “approximately,” “intends,” “plans” or “estimates,” or the negative of these words, or other comparable terminology. The discussion of financial trends, strategy, plans or intentions may also include forward-looking statements. Forward-looking statements involve risks and uncertainties that could cause actual results to differ materially from those projected, anticipated, or implied. Although it is not possible to predict or identify all such risks and uncertainties, they may include, but are not limited to, the factors discussed in Item 1A of Part I of this report under “Risk Factors.” The reader should not consider the list to be a complete statement of all potential risks and uncertainties.
These and other risks and uncertainties are described herein and in other information contained in our publicly available SEC filings and press releases. Readers are cautioned not to place undue reliance on these forward-looking statements, which speak only as of the date such statements were first made. Except to the extent required by federal securities laws, we undertake no obligation to publicly release the result of any revisions to these forward-looking statements to reflect events or circumstances after the date hereof, or to reflect the occurrence of unanticipated events.
Item 1A. | Risk Factors |
The risks described below could have a material adverse impact on our financial position, results of operations, liquidity and cash flows. Although it is not possible to predict or identify all such risks and uncertainties, they may include, but are not limited to, the factors discussed below. Our business operations could also be affected by additional factors that are not presently known to us or that we currently consider not to be material. The reader should not consider this list to be a complete statement of all risks and uncertainties.
Changes in the United States healthcare industry and regulatory environment could have a material adverse impact on our results of operations.
Many of our products and services are intended to function within the structure of the healthcare financing and reimbursement system currently being used in the United States. In recent years, the healthcare industry in the United States has changed significantly in an effort to enhance efficiencies, reduce costs and improve patient outcomes. These changes have included cuts in Medicare and Medicaid reimbursement levels, changes in the basis for payments, shifting away from fee-for-service and towards value-based payments and risk-sharing models, increases in the use of managed care, consolidation of pharmaceutical and medical-surgical supply distributors and the development of large, sophisticated purchasing groups. We expect the healthcare industry in the United States to continue to change and for healthcare delivery models to evolve in the future.
11
McKESSON CORPORATION
Changes in the healthcare industry’s or our pharmaceutical suppliers’ pricing, selling, inventory, distribution or supply policies or practices could significantly reduce our revenues and net income. Due to the diverse range of healthcare supply management and healthcare information technology products and services that we offer, such changes could have a material adverse impact on our results of operations, while not affecting some of our competitors who offer a narrower range of products and services.
The majority of our U.S. pharmaceutical distribution business agreements with manufacturers are structured to ensure that we are appropriately and predictably compensated for the services we provide. However, failure to successfully renew these contracts in a timely and favorable manner could have a material adverse impact on our results of operations. Certain distribution business agreements we entered into with manufacturers continue to have pharmaceutical price inflation as a component of our compensation. Consequently, our results of operations could be adversely affected if the frequency or magnitude of pharmaceutical price increases declines, which we do not control. In addition, we distribute generic pharmaceuticals, which can be subject to both price deflation and price inflation. During 2016, our Distribution Solutions segment experienced weaker generic pharmaceutical pricing trends, which are expected to continue in 2017. Continued volatility in the availability, pricing trends or reimbursement of these generic drugs, or significant fluctuations in the nature, frequency and magnitude of generic pharmaceutical launches, could have a material adverse impact on our results of operations. Additionally, any future changes in branded and generics drug pricing could be significantly different than our projections.
Generic drug manufacturers are increasingly challenging the validity or enforceability of patents on branded pharmaceutical products. During the pendency of these legal challenges, a generics manufacturer may begin manufacturing and selling a generic version of the branded product prior to the final resolution of its legal challenge over the branded product’s patent. To the extent we source, contract manufacture, and distribute such generic products, the brand-name company could assert infringement claims against us. While we generally obtain indemnification against such claims from generic manufacturers as a condition of distributing their products, there can be no assurances that these rights will be adequate or sufficient to protect us.
The healthcare industry is highly regulated, and further regulation of our distribution businesses and technology products and services could impose increased costs, negatively impact our profit margins and the profit margins of our customers, delay the introduction or implementation of our new products, or otherwise negatively impact our business and expose the Company to litigation and regulatory investigations.
Healthcare Fraud: We are subject to extensive and frequently changing local, state and federal laws and regulations relating to healthcare fraud, waste and abuse. Local, state and federal governments continue to strengthen their position and scrutiny over practices involving fraud, waste and abuse affecting Medicare, Medicaid and other government healthcare programs. Our relationships with pharmaceutical and medical-surgical product manufacturers and healthcare providers, as well as our provision of products and services to government entities, subject our business to laws and regulations on fraud and abuse, which among other things: (1) prohibit persons from soliciting, offering, receiving or paying any remuneration in order to induce the referral of a patient for treatment or to induce the ordering or purchasing of items or services that are in any way paid for by Medicare, Medicaid or other government-sponsored healthcare programs; (2) impose a number of restrictions upon referring physicians and providers of designated health services under Medicare and Medicaid programs; and (3) prohibit the knowing submission of a false or fraudulent claim for payment to, and knowing retention of an overpayment by, a federal healthcare program such as Medicare and Medicaid. Many of the regulations applicable to us, including those relating to marketing incentives, are vague or indefinite and have not been interpreted by the courts. The regulations may be interpreted or applied by a prosecutorial, regulatory, or judicial authority in a manner that could require us to make changes in our operations. If we fail to comply with applicable laws and regulations, we could become liable for damages and suffer civil and criminal penalties, including the loss of licenses or our ability to participate in Medicare, Medicaid and other federal and state healthcare programs.
12
McKESSON CORPORATION
Reimbursements: Both our profit margins and the profit margins of our customers may be adversely affected by laws and regulations reducing reimbursement rates for pharmaceuticals, medical treatments and related services, or changing the methodology by which reimbursement levels are determined. For example, the Patient Protection and Affordable Care Act and the Health Care and Education Reconciliation Act (collectively the “Affordable Care Act”), signed into law in 2010, revised, subject to rulemaking, the federal upper limits (“FUL”) for Medicaid reimbursement for multiple source generic drugs available for purchase by retail community pharmacies on a nationwide basis. On January 21, 2016, the Centers for Medicare and Medicaid Services (“CMS”) released the Covered Outpatient Drugs final rule with comment. The final rule, with limited exceptions, establishes the FUL to be 175% of the weighted average (determined on the basis of utilization) of the most recently reported monthly average manufacturer price (“AMP”) using a smoothing process. States had until May 2016 to implement the FULs. Additionally, the final rule established actual acquisition cost as the basis by which states should determine their ingredient cost reimbursement, addressed the sufficiency of dispensing fees to reflect the cost of the pharmacist’s professional services and cost to dispense drugs to Medicaid beneficiaries, and clarified that states are required to evaluate the sufficiency of both ingredient cost and professional dispensing fee when proposing changes to either component. Use of the revised AMP-based FUL may result in a reduction in the Medicaid reimbursement rates to our customers for certain pharmaceuticals, which could indirectly impact the prices that we can charge our customers and cause corresponding declines in our profitability.
The federal government may adopt measures that could reduce Medicare and/or Medicaid spending, or impose additional requirements on healthcare entities. For example, under the terms of the Budget Control Act of 2011, an automatic 2% reduction of Medicare program payments for all healthcare providers became generally effective for services provided on or after April 1, 2013. This automatic reduction is known as “sequestration.” Medicare generally reimburses physicians for Part B drugs at the rate of average sales price (“ASP”) plus 6%. The implementation of sequestration pursuant to the Budget Control Act of 2011 has effectively reduced reimbursement below the ASP plus 6% level for the duration of sequestration (which lasts through fiscal 2024 in the absence of additional legislation). As another example, the Medicare Access and CHIP Reauthorization Act (“MACRA”), signed into law in April 2015, seeks to reform Medicare reimbursement policy for physician fee schedule services and adopts a series of policy changes affecting a wide range of providers and suppliers. Most notably, MACRA repeals the statutory Sustainable Growth Rate formula, which has called for cuts in Medicare rates in recent years, but which Congress routinely stepped in to override the full application of the formula. Instead, after a period of stable payment updates, MACRA links physician payment updates to quality and value measurements and participation in alternative payment models. MACRA also extends certain expiring Medicare and other health policy provisions, including extending the Children’s Health Insurance Program. Additionally, concerns held by federal policymakers about the federal deficit and national debt levels could result in enactment of further federal spending reductions, further entitlement reform legislation affecting the Medicare program, or both. We cannot predict what alternative or additional deficit reduction initiatives or Medicare payment reductions, if any, will ultimately be enacted into law, or the timing or affect any such initiatives or reductions will have on us.
There can be no assurance that the preceding changes would not have a material adverse impact on our results of operations.
Operating, Security and Licensure Standards: We are subject to the operating and security standards of the Drug Enforcement Administration (“DEA”), the U.S. Food and Drug Administration (“FDA”), various state boards of pharmacy, state health departments, the U.S. Department of Health and Human Services (“HHS”), the CMS and other comparable agencies. Certain of our businesses may be required to register for permits and/or licenses with, and comply with operating and security standards of, the DEA, FDA, HHS, CMS, various state boards of pharmacy, state health departments and/or comparable state agencies as well as foreign agencies and certain accrediting bodies, depending upon the type of operations and location of product development, manufacture, distribution, and sale. For example, we are required to hold valid DEA and state-level registrations and licenses, meet various security and operating standards and comply with the Controlled Substances Act and its accompanying regulations governing the sale, marketing, packaging, holding, distribution, and disposal of controlled substances.
As part of these operating, security and licensure standards, we regularly receive requests for information and occasionally subpoenas from government authorities. In some instances, these can lead to monetary penalties and/or license revocation. In March 2015, we reached an agreement in principle with the DEA and Department of Justice pursuant to which we agreed to pay the sum of $150 million to settle all potential administrative and civil claims relating to investigations about the Company’s suspicious order reporting practices for controlled substances.
Although we have enhanced our procedures to ensure compliance, there can be no assurance that a regulatory agency or tribunal would conclude that our operations are compliant with applicable laws and regulations. In addition, there can be no assurance that we will be able to maintain or renew existing permits, licenses or any other regulatory approvals or obtain without significant delay future permits, licenses or other approvals needed for the operation of our businesses. Any noncompliance by us with applicable laws and regulations or the failure to maintain, renew or obtain necessary permits and licenses could lead to litigation and have a material adverse impact on our results of operations.
13
McKESSON CORPORATION
Pedigree Tracking: There have been increasing efforts by Congress and state and federal agencies, including state boards of pharmacy and departments of health and the FDA, to regulate the pharmaceutical distribution system in order to prevent the introduction of counterfeit, adulterated and/or mislabeled drugs into the pharmaceutical distribution system, otherwise known as pedigree tracking. In November 2013, Congress passed and the President signed into law the Drug Quality and Security Act (“DQSA”). The DQSA establishes federal standards requiring supply-chain stakeholders to participate in an electronic, interoperable, lot-level prescription drug track and trace system. The law also preempts state drug pedigree requirements. The DSQA also establishes new requirements for drug wholesale distributors and third party logistics providers, including licensing requirements in states that had not previously licensed such entities.
In addition, the Food and Drug Administration Amendments Act of 2007, which went into effect on October 1, 2007, requires the FDA to establish standards and identify and validate effective technologies for the purpose of securing the pharmaceutical supply chain against counterfeit drugs. These standards may include track-and-trace or authentication technologies, such as radio frequency identification devices and other similar technologies. On March 26, 2010, the FDA released the Serialized Numerical Identifier (“SNI”) guidance for manufacturers who serialize pharmaceutical packaging. We expect to be able to accommodate these SNI regulations in our distribution operations. The DQSA and other pedigree tracking laws and regulations could increase the overall regulatory burden and costs associated with our pharmaceutical distribution business, and could have a material adverse impact on our results of operations.
Privacy: State, federal and foreign laws regulate the confidentiality of personal information, how that information may be used, and the circumstances under which such information may be released. These regulations govern the disclosure and use of confidential personal and patient medical record information and require the users of such information to implement specified privacy and security measures. Regulations currently in place, including regulations governing electronic health data transmissions, continue to evolve and are often unclear and difficult to apply. Although we modified our policies, procedures and systems to comply with the current requirements of applicable state, federal and foreign laws, including the Health Insurance Portability and Accountability Act of 1996 (“HIPAA”) and the Health Information Technology for Economic and Clinical Health (“HITECH”) Act portion of the American Recovery and Reinvestment Act of 2009, new laws and regulations in this area could further restrict our or our customers’ ability to obtain, use or disseminate personal or patient information, or could require us to incur significant additional costs to re-design our products or services in a timely manner, either of which could have a material adverse impact on our results of operations. In addition, the HITECH Act expanded HIPAA privacy and security requirements and increased financial penalties for violations. It also extended certain provisions of the federal privacy and security standards to us in our capacity as a business associate of our payer and provider customer. These standards may be interpreted by a regulatory authority in a manner that could require us to make a material change to our operations. Furthermore, our failure to maintain the confidentiality of personal information in accordance with applicable regulatory requirements could expose us to breach of contract claims, tort damages, fines and penalties, costs for remediation, media attention and harm to our customer relationships and reputation.
Healthcare Reform: The Affordable Care Act significantly expanded health insurance coverage to uninsured Americans and changed the way healthcare is financed by both governmental and private payers. While certain provisions of the Affordable Care Act took effect immediately, others have delayed effective dates or require further rulemaking action or regulatory guidance by governmental agencies to implement and/or finalize (e.g. nondiscrimination in health programs and activities, excise tax on high-cost employer-sponsored health coverage). We do not currently anticipate that the Affordable Care Act or any resulting federal and state healthcare reforms will have a material impact on our financial position and results of operations. However, given the scope of the changes made and under consideration, as well as the uncertainties associated with implementation of healthcare reforms, we cannot predict their full effect on the Company at this time.
14
McKESSON CORPORATION
Interoperability and Meaningful Use Requirement: There is increasing demand among customers, industry groups and government authorities that healthcare information technology products provided by various vendors be compatible with each other. In 2013, in order to address this demand for interoperability we and a number of other healthcare information technology (“IT”) companies co-founded the CommonWell Health Alliance with the aim of developing a standard for data sharing among doctors, hospitals, clinics and pharmacies. Certain federal and state agencies also are developing standards that could become mandatory for software and systems purchased by these agencies, or used by our customers. With respect to legislation addressing interoperability, MACRA promotes and defines interoperability, requires metrics to measure interoperability, and requires vendors and providers to attest that they are not blocking data. Regarding meaningful use requirements, the HITECH Act requires meaningful use of “certified” healthcare information technology products by healthcare providers in order to receive stimulus funds from the federal government. Further, the 21st Century Cures bill that passed the U.S. House of Representatives last year contained language focused on promoting greater interoperability of health IT. Specifically the bill creates penalties for so-called “information blocking” by IT vendors or providers. The bill also carves most health IT products out of the FDA’s jurisdiction, but includes a clawback provision that would enable FDA to regulate products on a case-by-case basis if it determined they pose a risk to patient safety. Finally, the bill included additional funding for the National Institutes of Health, and the FDA. The Senate is currently considering similar legislation with final passage possible this year.
Although several of our healthcare information technology products have received certification, rules regarding meaningful use may be changed or supplemented in the future. As a result of interoperability and meaningful requirements, we may incur increased development costs and delays in receiving certification for our products, and changing or supplementing rules also may lengthen our sales and implementation cycle. We also may incur costs in periods prior to the corresponding recognition of revenue. To the extent these requirements subsequently are changed or supplemented, or we are delayed in receiving certification for our products, customers may postpone or cancel their decisions to purchase or implement these products.
FDA Regulation of Medical Software: The FDA has increasingly focused on the regulation of medical software and health information technology products as medical devices under the federal Food, Drug and Cosmetic Act. For example, in 2011 the FDA issued a rule on medical device data systems that regulates certain software that electronically stores, transfers or displays data originating from medical devices as Class 1 medical devices themselves (i.e., those devices deemed by the FDA to be low risk and subject to the least regulatory controls). However, in February 2015, the FDA issued guidance to inform manufacturers and distributors of medical device data systems that it did not intend to enforce compliance with regulatory controls that apply to medical device data systems, medical image storage devices, and medical image communication devices. If the FDA chooses to regulate more of our products as medical devices, or subsequently changes or reverses its guidance regarding not enforcing regulatory controls for certain medical device products, it can impose extensive requirements upon us. If we fail to comply with the applicable requirements, the FDA could respond by imposing fines, injunctions or civil penalties, requiring recalls or product corrections, suspending production, refusing to grant pre-market clearance of products, withdrawing clearances and initiating criminal prosecution. Any additional FDA regulations governing health information technology products, once issued, may increase the cost and time to market of new or existing products or may prevent us from marketing our products. The 21st Century Cures bill would also change the way health IT would be regulated by the FDA. The bill also carves most health IT products out of the FDA’s jurisdiction, but includes a clawback provision that would enable FDA to regulate products on a case-by-case basis if it determined they pose a risk to patient safety. The Senate is currently considering similar legislation with final passage probable this year.
Standards for Submission of Healthcare Claims: HHS previously adopted two rules that impact healthcare claims submitted for reimbursement. The first rule modified the standards for electronic healthcare transactions (e.g., eligibility, claims submission and payment and electronic remittance) from Version 4010/4010A to Version 5010. The second rule updated and expanded the standard medical code sets for diagnosis and procedure coding from International Classification of Diseases, Ninth Revision (“ICD-9”) to International Classification of Diseases, Tenth Revision (“ICD-10”). The compliance date for ICD-10 conversion was postponed from October 1, 2014 to October 1, 2015. Updating systems to Version 5010 for electronic healthcare transactions (e.g., eligibility, claims submission and payment and electronic remittance) is required for use of the ICD-10 code set. Generally, claims submitted not using Version 5010 and ICD-10 will not be processed, and health plans not accepting transactions using Version 5010 and ICD-10 may experience significant increases in customer service inquiries. We may incur increased development costs and delays in delivering solutions and upgrading our software and systems as the healthcare industry moves towards compliance with these rules. In addition, these rules may lengthen our sales and implementation cycle and we may incur costs in periods prior to the corresponding recognition of revenue. Delays in providing software and systems that are in compliance with these rules may result in postponement or cancellation of our customers’ decisions to purchase our software and systems.
15
McKESSON CORPORATION
Medical Billing and Coding: Medical billing, coding and collection activities are governed by numerous federal and state civil and criminal laws. In connection with these laws, we may be subjected to federal or state government investigations and possible penalties may be imposed upon us, false claims actions may have to be defended, private payers may file claims against us and we may be excluded from Medicare, Medicaid or other government-funded healthcare programs. Any such proceeding or investigation could have a material adverse impact on our results of operations.
Our foreign operations subject us to a number of operating, economic, political and regulatory risks that may have a material adverse impact on our financial position and results of operations.
We have operations based in, and we source and contract manufacture pharmaceutical and medical-surgical products in, a number of foreign countries. The Company’s acquisition of Celesio AG (“Celesio”) significantly increases the importance of our foreign operations to our future operations and growth.
Our foreign operations expose us to a number of risks including changes in trade protection laws, policies and measures and other regulatory requirements affecting trade and investment; changes in licensing regimes for pharmacies; unexpected regulatory, social, political, or economic changes in a specific country or region; changes in intellectual property, privacy and data protection; import/export regulations and trade sanctions in both the United States and foreign countries and difficulties in staffing and managing foreign operations. Political changes, labor strikes, acts of war or terrorism and natural disasters, some of which may be disruptive, can interfere with our supply chain, our customers and all of our activities in a particular location. We may also be affected by potentially adverse tax consequences and difficulties associated with repatriating cash generated or held abroad.
Foreign operations are also subject to risks of violations of laws prohibiting improper payments and bribery, including the U.S. Foreign Corrupt Practices Act, the U.K. Bribery Act and similar regulations in foreign jurisdictions. The U.K. Bribery Act, for example, prohibits both domestic and international bribery, as well as bribery across both private and public sectors. An organization that fails to prevent bribery committed by anyone associated with the organization can be charged under the U.K. Bribery Act unless the organization can establish the defense of having implemented adequate procedures to prevent bribery. Failure to comply with these laws could subject us to civil and criminal penalties that could have a material adverse impact on our financial position and results of operations.
We also may experience difficulties and delays inherent in sourcing products and contract manufacturing from foreign countries, including but not limited to: (1) difficulties in complying with the requirements of applicable federal, state and local governmental authorities in the United States and of foreign regulatory authorities; (2) inability to increase production capacity commensurate with demand or the failure to predict market demand; (3) other manufacturing or distribution problems including changes in types of products produced, limits to manufacturing capacity due to regulatory requirements, physical limitations, or scarce or inadequate resources that could impact continuous supply; and (4) damage to our reputation due to real or perceived quality issues. For example, the FDA has conducted investigations and banned certain generics manufacturers from selling certain raw materials and drug ingredients in the U.S. from overseas plants due to quality issues. Difficulties in manufacturing or access to raw materials could result in production shutdowns, product shortages and other similar delays in product manufacturing that could have a material adverse impact on our financial position and results of operations.
Changes in the Canadian healthcare industry and regulatory environment could have a material adverse impact on our results of operations.
Provincial governments in Canada provide partial funding for the purchase of pharmaceuticals and independently regulate the sale and reimbursement of drugs. Provincial governments in Canada have introduced significant changes in recent years in an effort to reduce the costs of publicly funded health programs. For instance, to reduce the cost for taxpayers, provincial governments have taken steps to reform the rules regarding the sale of generic drugs. These changes include the significant lowering of prices for generic pharmaceuticals and, in some provinces, changes to the allowable amounts of professional allowances paid to pharmacists by generic manufacturers. These reforms may adversely affect the distribution of drugs as well as the pricing for prescription drugs for the Company’s operations in Canada. Other provinces have implemented or are considering similar changes, which would also lower pharmaceutical pricing and service fees. Individually or in combination, such changes in the Canadian healthcare environment may significantly reduce our Canadian revenue and operating profit.
16
McKESSON CORPORATION
General European economic conditions, together with austerity measures being taken by certain European governments, could have a material adverse impact on our results of operations.
The Company’s acquisition of Celesio increased our assets and operations within Europe and, accordingly, our exposure to economic conditions in Europe. A slowdown within the European economy could affect our business in Europe by reducing the prices our customers may be able or willing to pay for our products and services. A slowdown may also reduce the demand for our products. Either of these could result in a material adverse impact on our results of operations.
In addition, in many European countries the government provides or subsidizes healthcare to consumers and regulates pharmaceutical prices, patient eligibility, and reimbursement levels to control costs for the government-sponsored healthcare system. In recent years, in response to the recessionary environment and financial crisis in Europe, a number of European governments have announced or implemented austerity measures to reduce healthcare spending and constrain overall government expenditures. These measures, which include efforts aimed at reforming healthcare coverage and reducing healthcare costs, continue to exert pressure on the pricing of and reimbursement timelines for pharmaceuticals and may cause our customers to purchase fewer of our products and services and reduce the prices they are willing to pay.
Countries with existing healthcare-related austerity measures may impose additional laws, regulations, or requirements on the healthcare industry. In addition, European governments that have not yet imposed healthcare-related austerity measures may impose them in the future. New austerity measures may be similar to or vary from existing austerity measures and could have a material adverse impact on our results of operations.
Changes in the European regulatory environment regarding privacy and data protection regulations could have a material adverse impact on our results of operations.
In Europe, we are subject to the 1995 European Union (“EU”) Directive on Data Protection (“1995 Data Protection Directive”), which requires EU member states to impose minimum restrictions on the collection and use of personal data that, in some respects, are more stringent, and impose more significant burdens on subject businesses, than current privacy standards in the United States. We may also face audits or investigations by one or more foreign government agencies relating to our compliance with these regulations that could result in the imposition of penalties or fines. The EU member state regulations establish several obligations that organizations must follow with respect to use of personal data, including a prohibition on the transfer of personal information from the EU to other countries whose laws do not protect personal data to an adequate level of privacy or security. In addition, certain member states have adopted more stringent data protection standards. The Company had addressed these requirements by certification to the U.S.-EU Safe Harbor Frameworks prior to such Frameworks being invalidated in October 2015 by the European Court of Justice. Although recent negotiations between the U.S. and the EU have yielded the likely successor to the Safe Harbor Framework, the EU-U.S. Privacy Shield, this new framework has not yet been approved by all of the necessary EU regulatory bodies. In the interim, we are pursuing alternative methods of compliance, but those methods may be subject to scrutiny by data protection authorities in EU member states. On December 15, 2015, the European Parliament and the Council of the European Union (Council) reached a political agreement on the future EU data protection legal framework. Subject to formal adoption by the European Parliament in the first half of 2016, the General Data Protection Regulation (“GDPR”) will replace the 1995 Data Protection Directive. Although the GDPR has not yet been finalized and minor modifications remain possible, the GDPR will have significant impacts on how businesses can collect and process the personal data of EU individuals. The GDPR is expected to become effective sometime in 2018, two years after its final adoption in 2016. The costs of compliance with, and other burdens imposed by, such laws, regulations and policies that are applicable to us may limit the use and adoption of our products and solutions and could have a material adverse impact on our results of operations.
Our results of operations, which are stated in U.S. dollars, could be adversely impacted by fluctuations in foreign currency exchange rates.
We conduct our business worldwide in U.S. dollars and the functional currencies of our foreign subsidiaries, including Euro, British pound sterling and Canadian dollar. Changes in foreign currency exchange rates could have a significant adverse impact on our financial results that are reported in the U.S. dollar. We are also exposed to foreign currency exchange rate risk related to our foreign subsidiaries, including intercompany loans denominated in non-functional currencies.
We may from time to time enter into foreign currency contracts or other derivative instruments intended to hedge a portion of our foreign currency exchange rate risks. Additionally, we may use foreign currency borrowings to hedge some of our foreign currency exchange rate risks. These hedging activities may not completely offset the adverse financial effects of unfavorable movements in foreign currency exchange rates during the time the hedges are in place.
17
McKESSON CORPORATION
Our business could be hindered if we are unable to complete and integrate acquisitions successfully.
An element of our strategy is to identify, pursue and consummate acquisitions that either expand or complement our business. Integration of acquisitions involves a number of significant risks, including the diversion of management’s attention to the assimilation of the operations of businesses we have acquired; difficulties in the integration of operations and systems; the realization of potential operating synergies; the assimilation and retention of the personnel of the acquired companies; accounting, regulatory or compliance issues that could arise, including internal control over financial reporting; and challenges retaining the customers of the combined businesses. Further, acquisitions may have a material adverse impact on our operating results if unanticipated expenses or charges to earnings were to occur, including unanticipated depreciation and amortization expenses over the useful lives of certain assets acquired, as well as costs related to potential impairment charges, assumed litigation and unknown liabilities. In addition, we may potentially require additional financing in order to fund future acquisitions, which may or may not be attainable and is subject to potential volatility in the credit markets. If we are unable to successfully complete and integrate strategic acquisitions in a timely manner, our business and our growth strategies could be negatively affected.
On February 6, 2014, we completed the acquisition of 77.6% of the then outstanding common shares of Celesio and certain convertible bonds of Celesio. Upon the acquisition, our ownership of Celesio’s fully diluted shares was 75.6%. Celesio is an international wholesale and retail company and provider of logistics and services to the pharmaceutical and healthcare sectors. On December 2, 2014, we obtained the ability to pursue the integration of the two companies upon the effectiveness of the domination and profit and loss transfer agreement (the “Domination Agreement”).
Achieving the anticipated benefits of our acquisition of Celesio is subject to a number of risks and uncertainties, including foreign exchange fluctuations, challenges of managing new international operations, and whether we can ensure continued performance or market growth of Celesio’s products and services. The integration process is subject to a number of uncertainties and no assurance can be given that the anticipated benefits of the transaction will be realized or, if realized, the timing of its realization. It is possible that the integration process could take longer than anticipated, and could result in the loss of employees, the disruption of each company’s ongoing businesses, processes and systems, or inconsistencies in standards, controls, procedures, practices, policies and compensation arrangements. Any of these events could adversely affect our ability to achieve the anticipated benefits of the Celesio acquisition and which could have a material adverse impact on our financial position, results of operations, liquidity and cash flows.
Any significant diversion of management’s attention away from the ongoing businesses, and any difficulties encountered in the acquisition, transition and integration process, could adversely affect our financial results. Moreover, the failure to achieve the anticipated benefits of the Celesio acquisition could result in increased costs or decreases in the amount of expected revenues, and could adversely affect our future business, financial position and operating results. Events outside of our control, including the market price of Celesio shares that we did not acquire in the acquisition, changes in regulations and laws, as well as economic trends, could also adversely affect our ability to realize the expected benefits from our acquisition of Celesio.
Our business and results of operations could be impacted if we fail to manage and complete divestitures.
We regularly evaluate our portfolio in order to determine whether an asset or business may no longer help us meet our objectives. For example, during the fourth quarter of 2015, we committed to a plan to sell our Brazilian pharmaceutical distribution business and a small business from our Distribution Solutions segment, as well as a small business from our Technology Solutions segment. When we decide to sell assets or a business, we may encounter difficulty in finding buyers or alternative exit strategies on acceptable terms in a timely manner, which could delay the achievement of our strategic objectives. We may also experience greater dissynergies than expected, and the impact of the divestiture on our revenue growth may be larger than projected. After reaching an agreement with a buyer, we are subject to satisfaction of pre-closing conditions as well as to necessary regulatory and governmental approvals, which, if not satisfied or obtained, may prevent us from completing the sale. Dispositions may also involve continued financial involvement in the divested business, such as through continuing equity ownership, guarantees, indemnities or other financial obligations. Under these arrangements, performance by the divested businesses or other conditions outside of our control could have a material adverse impact on our results of operations.
18
McKESSON CORPORATION
We are subject to legal and regulatory proceedings that could have a material adverse impact on our financial position and results of operations.
From time to time and in the ordinary course of our business, we and certain of our subsidiaries may become involved in various legal and regulatory proceedings involving false claims, healthcare fraud and abuse, antitrust, class actions, commercial, employment, environmental, intellectual property, licensing, tort and other various claims. All such legal proceedings are inherently unpredictable, and the outcome can result in excessive verdicts and/or injunctive relief that may affect how we operate our business or we may enter into settlements of claims for monetary payments. In some cases, substantial non-economic remedies or punitive damages may be sought. For some complaints filed against the Company, we are currently unable to estimate the amount of possible losses that might be incurred should these legal proceedings be resolved against the Company.
The outcome of litigation and other legal matters is always uncertain and outcomes that are not justified by the evidence or existing law can occur. The Company believes that it has valid defenses to the legal matters pending against it and is defending itself vigorously. Nevertheless, it is possible that resolution of one or any combination of more than one legal matter could result in a material adverse impact on our financial position or results of operations.
Litigation is costly, time-consuming and disruptive to normal business operations. The defense of these matters could also result in continued diversion of our management’s time and attention away from business operations, which could also harm our business. Even if these matters are not resolved against us, the uncertainty and expense associated with unresolved legal proceedings could harm our business and reputation.
Competition and industry consolidation may erode our profit.
Our Distribution Solutions segment faces a highly competitive global environment with strong competition from international, national, regional and local full-line, short-line and specialty distributors, service merchandisers, self-warehousing chain drug stores, manufacturers engaged in direct distribution, third-party logistics companies and large payer organizations. In addition, this segment faces competition from various other service providers and from pharmaceutical and other healthcare manufacturers as well as other potential customers of the segment, which may from time-to-time decide to develop, for their own internal needs, supply management capabilities that would otherwise be provided by the segment. In all areas, key competitive factors include price, quality of service, breadth of product lines, innovation and, in some cases, convenience to the customer.
In addition, in recent years, the healthcare industry has been subject to increasing consolidation. As a result, a small number of very large pharmaceutical suppliers could control a significant share of the market. Accordingly, we could depend on fewer suppliers for our products and therefore we may be less able to negotiate price terms with suppliers. Many of our customers, including healthcare organizations that purchase our products and services, have also consolidated to create larger enterprises with greater market power. If this consolidation trend continues among our customers, suppliers and competitors, it could reduce the number of market participants and give the resulting enterprises greater bargaining power, which may lead to erosion of the prices for our products and services. It would also increase counter-party credit risk as the number of market participants decreases. In addition, when our customers combine, they often consolidate infrastructure including IT systems, which in turn may erode the diversity of our customer and revenue base.
Our Technology Solutions segment experiences substantial competition from many companies, including other software services firms, consulting firms, shared service vendors, certain hospitals and hospital groups, payers, care management organizations, hardware vendors and internet-based companies with technology applicable to the healthcare industry. Competition varies in size from small to large companies, in geographical coverage and in scope and breadth of products and services offered.
These competitive pressures and industry consolidation could have a material adverse impact on our results of operations.
19
McKESSON CORPORATION
A material reduction in purchases or the loss of a large customer or group purchasing organization, as well as substantial defaults in payment by a large customer or group purchasing organization, could have a material adverse impact on our financial position and results of operations.
In recent years, a significant portion of our revenue growth has been with a limited number of large customers. During 2016, sales to our ten largest customers, including group purchasing organizations (“GPOs”) accounted for approximately 52.4% of our total consolidated revenues. Sales to our largest customer, CVS Health (“CVS”), accounted for approximately 20.3% of our total consolidated revenues. At March 31, 2016, trade accounts receivable from our ten largest customers were approximately 32% of total trade accounts receivable. Accounts receivable from CVS were approximately 18% of total trade accounts receivable. As a result, our sales and credit concentration is significant. We also have agreements with GPOs, each of which functions as a purchasing agent on behalf of member hospitals, pharmacies and other healthcare providers, as well as with government entities and agencies. A material default in payment, a material reduction in purchases from these or any other large customers, or the loss of a large customer or GPO could have a material adverse impact on our financial position, results of operations and liquidity.
We generally sell our products and services to customers on credit that is short-term in nature and unsecured. Any adverse change in general economic conditions can adversely reduce sales to our customers, affect consumer buying practices or cause our customers to delay or be unable to pay accounts receivable owed to us, which may in turn materially reduce our revenue growth and cause a material decrease in our profitability and cash flow. Further, interest rate fluctuations and changes in capital market conditions may also affect our customers’ ability to obtain credit to finance their business under acceptable terms, which in turn may materially reduce our revenue growth and cause a decrease in our profitability.
Contracts with foreign and domestic government entities and their agencies pose additional risks relating to future funding and compliance.
Contracts with foreign and domestic government entities and their agencies are subject to various uncertainties, restrictions and regulations, including oversight audits by various government authorities. Government contracts also are exposed to uncertainties associated with funding. Contracts with the U.S. federal government, for example, are subject to the uncertainties of Congressional funding. Governments are typically under no obligation to maintain funding at any specific level, and funds for government programs may even be eliminated. As a result, our government clients may terminate our contracts for convenience or decide not to renew our contracts with little or no prior notice. The loss of such contracts could have a material adverse impact on our results of operations.
In addition, because government contracts are subject to specific procurement regulations and a variety of other socio-economic requirements, we must comply with such requirements. For example, for contracts with the U.S. federal government, with certain exceptions, we must comply with the Federal Acquisition Regulation, the U.S. False Claims Act, the Procurement Integrity Act, the Buy American Act and the Trade Agreements Act. We must also comply with various other domestic and foreign government regulations and requirements as well as various statutes related to employment practices, environmental protection, recordkeeping and accounting. These regulations and requirements affect how we transact business with our clients and, in some instances, impose additional costs on our business operations. Government contracts also contain terms that expose us to higher levels of risk and potential liability than non-government contracts.
We also are subject to government audits, investigations, and oversight proceedings. For example, government agencies routinely review and audit government contractors to determine whether contractors are complying with specific contractual or legal requirements. If we violate these rules or regulations, fail to comply with a contractual or other requirement, or do not satisfy an audit, a variety of penalties can be imposed by a government including monetary damages and criminal and civil penalties. In addition, any of our government contracts could be terminated or we could be suspended or debarred from all government contract work. The occurrence of any of these actions could harm our reputation and could have a material adverse impact on our results of operations.
20
McKESSON CORPORATION
Our future results could be materially affected by a number of public health issues whether occurring in the United States or abroad.
Public health issues, whether occurring in the United States or abroad, could disrupt our operations, disrupt the operations of suppliers or customers, or have a broader adverse impact on consumer spending and confidence levels that would negatively affect our suppliers and customers. We have developed contingency plans to address infectious disease scenarios and the potential impact on our operations, and we will continue to update these plans as necessary. However, there can be no assurance that these plans will be effective in eliminating the negative impact of any such diseases on the Company’s operating results. We may be required to suspend operations in some or all of our locations, which could have a material adverse impact on our financial position and results of operations.
We rely on sophisticated computer systems to perform our business operations. Although we and our customers use a variety of security measures to protect our and their computer systems, a failure or compromise of our or our customers’ computer systems from a cyberattack, natural disaster, or malfunction may result in material adverse operational and financial consequences.
Our business relies on the secure electronic transmission, storage, and hosting of sensitive information, including protected health information, financial information and other sensitive information relating to our customers, company and workforce. We routinely process, store and transmit large amounts of data in our operations, including sensitive personal information, protected health information, financial information, and confidential information relating to our business or third parties. Some of the data that we process, store and transmit may travel outside of the United States. Additionally, we outsource some important IT functions to external service providers worldwide.
Despite our implementation of a variety of security measures, our and our customers’ computer systems could be subject to cyberattacks and unauthorized access, such as physical and electronic break-ins or unauthorized tampering. Like other global companies, we and our customers have experienced threats to data and systems, including malware and ransomware attacks, unauthorized access, system failures, and disruptions.
A failure or compromise of our or our customers’ computer systems may jeopardize the confidential, proprietary, and sensitive information processed, stored, and transmitted through such computer systems. Such an event may result in significant damage to our reputation, financial losses, litigation, increased costs, regulatory penalties, customer attrition, brand impairment, or other business harm. These risks may increase in the future as we continue to expand our internet and mobile strategies and to build an integrated digital enterprise.
We could experience losses or liability not covered by insurance.
In order to provide prompt and complete service to our major Distribution Solutions segment’s customers, we maintain significant product inventory at certain of our distribution centers. While we seek to maintain property insurance coverage in amounts sufficient for our business, there can be no assurance that our property insurance will be adequate or available on acceptable terms. One or more large casualty losses caused by fire, earthquake or other natural disaster in excess of our coverage limits could have a material adverse impact on our results of operations.
Our business exposes us to risks that are inherent in the distribution, manufacturing, dispensing and administration of pharmaceuticals and medical-surgical supplies, the provision of ancillary services, the conduct of our payer businesses and the provision of products that assist clinical decision making and relate to patient medical histories and treatment plans. If customers or individuals assert liability claims against our products and/or services, any ensuing litigation, regardless of outcome, could result in a substantial cost to us, divert management’s attention from operations and decrease market acceptance of our products. We attempt to limit our liability to customers by contract; however, the limitations of liability set forth in the contracts may not be enforceable or may not otherwise protect us from liability for damages. Additionally, we may be subject to claims that are not explicitly covered by contract, such as a claim directly by a patient. We also maintain general liability coverage; however, this coverage may not continue to be available on acceptable terms, may not be available in sufficient amounts to cover one or more large claims against us and may include larger self-insured retentions or exclusions for certain products. In addition, the insurer might disclaim coverage as to any future claim. A successful product or professional liability claim not fully covered by our insurance could have a material adverse impact on our results of operations.
21
McKESSON CORPORATION
The acquisition of Celesio exposes us to additional risks related to providing pharmacy services. Pharmacies are exposed to risks inherent in the packaging and distribution of pharmaceuticals and other healthcare products, such as with respect to improper filling of prescriptions, labeling of prescriptions, adequacy of warnings, unintentional distribution of counterfeit drugs and expiration of drugs. Although we maintain liability insurance, the coverage may not be adequate to protect us against future claims. If our insurance coverage proves to be inadequate or unavailable, or we suffer reputational harm as a result of an error or omission, it could have a material adverse impact on our results of operations.
The failure of our healthcare technology businesses to attract and retain customers due to challenges in software product integration or to keep pace with technological advances may significantly reduce our results of operations.
Our healthcare technology businesses, the bulk of which resides in our Technology Solutions segment, deliver enterprise‑wide and single entity clinical, patient care, financial, supply chain and strategic management software solutions to hospitals, physicians, homecare providers, retail and mail order pharmacies and payers. Challenges integrating software products could impair our ability to attract and retain customers and could have a material adverse impact on our consolidated results of operations and a disproportionate impact on the results of operations of our Technology Solutions segment.
Future advances in healthcare information technology could lead to new technologies, products or services that are competitive with the technology products and services offered by our various businesses. Such technological advances could also lower the cost of such products and services or otherwise result in competitive pricing pressure or render our products obsolete.
The success of our technology businesses will depend, in part, on our ability to be responsive to technological developments, pricing pressures and changing business models. To remain competitive in the evolving healthcare information technology marketplace, our technology businesses must also develop new products and services on a timely basis. The failure to develop competitive products and to introduce new products and services on a timely basis could curtail the ability of our technology businesses to attract and retain customers, and thereby could have a material adverse impact on our results of operations.
Proprietary protections may not be adequate, and products may be found to infringe the rights of third parties.
We rely on a combination of trade secret, patent, copyright and trademark laws, nondisclosure and other contractual provisions and technical measures to protect our proprietary rights in our products and solutions. There can be no assurance that these protections will be adequate or that our competitors will not independently develop products or services that are equivalent or superior to ours. In addition, despite protective measures, we may be subject to unauthorized use of our technology due to copying, reverse-engineering or other infringement. Although we believe that our products and services do not infringe the proprietary rights of third parties, from time to time third parties have asserted infringement claims against us, and there can be no assurance that third parties will not assert infringement claims against us in the future. If we were found to be infringing others’ rights, we may be required to pay substantial damage awards and forced to develop non-infringing products or services, obtain a license or cease selling or using the products or services that contain the infringing elements. Additionally, we may find it necessary to initiate litigation to protect our trade secrets, to enforce our patent, copyright and trademark rights and to determine the scope and validity of the proprietary rights of others. These types of litigation can be costly and time consuming. These litigation expenses, damage payments or costs of developing replacement products or services could have a material adverse impact on our results of operations.
System errors or failures of our products or services to conform to specifications could cause unforeseen liabilities or injury, harm our reputation and have a material adverse impact on our results of operations.
The software and technology services that we sell or operate are complex. As with complex systems offered by others, our software and technology services may contain errors, especially when first introduced. For example, our Technology Solutions segment’s systems are intended to provide information to healthcare professionals in the course of delivering patient care. Therefore, users of our software and technology services have a greater sensitivity to errors than the general market for software products. If clinicians’ use of our software and technology services leads to faulty clinical decisions or injury to patients, we could be subject to claims or litigation by our customers, clinicians or patients. In addition, such failures could damage our reputation and could negatively affect future sales.
Failure of a customer’s system to perform in accordance with our documentation could constitute a breach of warranty and could require us to incur additional expense in order to make the system comply with the documentation. If such failure is not remedied in a timely manner, it could constitute a material breach under a contract, allowing the client to cancel the contract, obtain refunds of amounts previously paid or assert claims for significant damages.
22
McKESSON CORPORATION
Various risks could interrupt customers’ access to their data residing in our service center, exposing us to significant costs.
We provide remote hosting services that involve operating both our software and the software of third-party vendors for our customers. The ability to access the systems and the data that we host and support on demand is critical to our customers. Our operations and facilities are vulnerable to interruption and/or damage from a number of sources, many of which are beyond our control, including, without limitation: (1) power loss and telecommunications failures; (2) fire, flood, hurricane and other natural disasters; (3) software and hardware errors, failures or crashes; and (4) cyber attacks, computer viruses, hacking and other similar disruptive problems. We attempt to mitigate these risks through various means including disaster recovery plans, separate test systems and change controls, information security procedures, and continued development and enhancement of our cyber security, but our precautions may not protect against all risks. If customers’ access is interrupted because of problems in the operation of our facilities, we could be exposed to significant claims, particularly if the access interruption is associated with problems in the timely delivery of medical care. If customers’ access is interrupted from failure or breach of our operational or information security systems, or those of our contractors or third party service providers, we could suffer reputational harm or be exposed to liabilities arising from the unauthorized and improper use or disclosure of confidential or proprietary information. We must maintain disaster recovery and business continuity plans that rely upon third-party providers of related services and if those vendors fail us at a time that our center is not operating correctly, we could incur a loss of revenue and liability for failure to fulfill our contractual service commitments. Any significant instances of system downtime could negatively affect our reputation and ability to sell our remote hosting services.
The length of our sales and implementation cycles for our Technology Solutions segment could have a material adverse impact on our future results of operations.
Many of the solutions offered by our Technology Solutions segment have long sales and implementation cycles, which could range from a few months to two years or more from initial contact with the customer to completion of implementation. How and when to implement, replace, or expand an information system, or modify or add business processes, are major decisions for healthcare organizations. Many of the solutions we provide typically require significant capital expenditures and time commitments by the customer. Any decision by our customers to delay or cancel implementation could have a material adverse impact on our results of operations. Furthermore, delays or failures to meet milestones established in our agreements may result in a breach of contract, termination of the agreement, damages and/or penalties as well as a reduction in our margins or a delay in our ability to recognize revenue.
We may be required to record a significant charge to earnings if our goodwill or intangible assets become impaired.
We are required under U.S. generally accepted accounting principles (“GAAP”) to test our goodwill for impairment annually or more frequently if indicators for potential impairment exist. Indicators that are considered include significant changes in performance relative to expected operating results, significant changes in the use of the assets, significant negative industry, or economic trends or a significant decline in the Company’s stock price and/or market capitalization for a sustained period of time. In addition, we periodically review our intangible assets for impairment when events or changes in circumstances, such as a divestiture, indicate the carrying value may not be recoverable. Factors that may be considered a change in circumstances indicating that the carrying value of our intangible assets may not be recoverable include slower growth rates, the loss of a significant customer, or divestiture of a business or asset for less than its carrying value. We may be required to record a significant charge to earnings in our consolidated financial statements during the period in which any impairment of our goodwill or intangible assets is determined. This could have a material adverse impact on our results of operations. There are inherent uncertainties in management’s estimates, judgments and assumptions used in assessing recoverability of goodwill and intangible assets. Any changes in key assumptions, including failure to meet business plans, a further deterioration in the market or other unanticipated events and circumstances, may affect the accuracy or validity of such estimates and could potentially result in an impairment charge.
23
McKESSON CORPORATION
Tax legislation initiatives or challenges to our tax positions could have a material adverse impact on our results of operations.
We are a large multinational corporation with operations in the United States and international jurisdictions. As such, we are subject to the tax laws and regulations of the United States federal, state and local governments and of many international jurisdictions. From time to time, legislation may be enacted that could adversely affect our tax positions. There can be no assurance that our effective tax rate and the resulting cash flow will not be adversely affected by these changes in legislation. For example, if legislation is passed to repeal the LIFO (last-in, first-out) method of inventory accounting for income tax purposes, it would adversely impact our cash flow. Additionally, if legislation is passed to change the current U.S. taxation treatment of income from foreign operations, or if legislation is passed at the state level to establish or increase taxation on the basis of our gross revenues, it may adversely impact our tax expense. The tax laws and regulations of the various countries where we have major operations are extremely complex and subject to varying interpretations. For example, we operate in various countries that collect value added taxes (“VAT”). The determination of the manner in which a VAT applies to our foreign operations is subject to varying interpretations arising from the complex nature of the tax laws and regulations. Although we believe that our historical tax positions are sound and consistent with applicable laws, regulations and existing precedent, there can be no assurance that these tax positions will not be challenged by relevant tax authorities or that we would be successful in any such challenge. Even if we are successful in maintaining our positions, we may incur significant expense in defending challenges to our tax positions by tax authorities that could have a material impact on our financial position and results of operations.
In addition, as jurisdictions enact legislation to implement the recommendations of the recently concluded base erosion and profit shifting project undertaken by the Organization for Economic Cooperation and Development or as a result of the European Commission’s investigations into illegal state aid, changes to long-standing tax principles may result which could adversely impact our tax expense.
Volatility and disruption to the global capital and credit markets may adversely affect our ability to access credit, our cost of credit and the financial soundness of our customers and suppliers.
Volatility and disruption in the global capital and credit markets, including the bankruptcy or restructuring of certain financial institutions, reduced lending activity by other financial institutions, decreased liquidity and increased costs in the commercial paper market and the reduced market for securitizations, may adversely affect the availability and cost of credit already arranged and the availability, terms and cost of credit in the future, including any arrangements to renew or replace our current credit or financing arrangements. Although we believe that our operating cash flow, financial assets, current access to capital and credit markets, including our existing credit and sales facilities, will give us the ability to meet our financing needs for the foreseeable future, there can be no assurance that volatility and disruption in the global capital and credit markets will not impair our liquidity or increase our costs of borrowing.
Our business could also be negatively impacted if our customers or suppliers experience disruptions resulting from tighter capital and credit markets or a slowdown in the general economy. As a result, customers may modify, delay or cancel plans to purchase or implement our products or services and suppliers may increase their prices, reduce their output or change their terms of sale. Additionally, if customers’ or suppliers’ operating and financial performance deteriorates or if they are unable to make scheduled payments or obtain credit, customers may not be able to pay, or may delay payment of accounts receivable owed to us and suppliers may restrict credit, impose different payment terms or be unable to make payments due to us for fees, returned products or incentives. Any inability of customers to pay us for our products and services or any demands by suppliers for different payment terms, may have a material adverse impact on our results of operations and cash flow.
Changes in accounting standards issued by the Financial Accounting Standards Board (“FASB”) or other standard-setting bodies may adversely affect our financial statements.
Our financial statements are subject to the application of U.S. GAAP, which is periodically revised and/or expanded. From time to time, we are required to adopt new or revised accounting standards issued by recognized authoritative bodies, including the FASB and the SEC. It is possible that future accounting standards we are required to adopt, such as the amended guidance for revenue recognition, leases, and share based payments, may require changes to the current accounting treatment that we apply to our consolidated financial statements and may require us to make significant changes to our systems. Such changes could result in a material adverse impact on our financial position and results of operations.
24
McKESSON CORPORATION
We could face significant liability if we withdraw from participation in one or more multiemployer pension plans in which we participate, or if one or more multiemployer plans in which we participate is reported to have underfunded liabilities.
We participate in various multiemployer pension plans. In the event that we withdraw from participation in one of these plans, then applicable law could require us to make additional cash contributions to the plans in installments. Our withdrawal liability for any multiemployer plan would depend on the extent of the plan’s funding of vested benefits. The multiemployer plans could have significant unfunded vested liabilities. Such underfunding may increase in the event other employers become insolvent or withdraw from the applicable plan or upon the inability or failure of withdrawing employers to pay their withdrawal liability. In addition, such underfunding may increase as a result of lower than expected returns on pension fund assets or other funding deficiencies. The occurrence of any of these events could have a material adverse impact on our consolidated financial position, results of operations or cash flows.
We may not realize the expected benefits from our restructuring and business process initiatives.
On March 14, 2016, the Company committed to a restructuring plan to lower its operating costs (“Cost Alignment Plan”). The Cost Alignment Plan primarily consists of a reduction in workforce and business process initiatives that will be substantially implemented prior to the end of 2019. Expense reduction initiatives could yield unintended consequences such as distraction of our management and employees, business disruption, attrition beyond any planned reduction in workforce, inability to attract or retain key personnel, and reduced employee productivity which could negatively affect our business, sales, financial condition and results of operations. Moreover, our restructuring and business process initiatives result in charges and expenses that impact our operating results. We cannot guarantee that the activities under any restructuring and business initiative will result in the desired efficiencies and estimated cost savings.
We may experience difficulties with outsourcing and similar third party relationships.
Our ability to conduct our business might be negatively impacted if we experience difficulties with outsourcing and managing similar third-party relationships. We outsource certain business and administrative functions and rely on third parties to perform certain services on our behalf. If we fail to develop, implement and monitor our outsourcing strategies, such strategies prove to be ineffective or fail to provide expected cost savings, or our third party providers fail to perform as anticipated, we may experience operational difficulties and increased costs may adversely affect the results of our operations.
We may face risks associated with our retail expansion.
In recent years, we have expanded our retail operations through a number of acquisitions. As we expand our retail footprint, we may face risks that are different from those we currently encounter. Our expansion into additional retail markets, such as those in Europe and Canada, could result in increased competitive, merchandising and distribution challenges. We may encounter difficulties in attracting customers to our retail locations due to a lack of customer familiarity with our brands and our lack of familiarity with local customer preferences and seasonal differences in the market. Our ability to expand successfully will depend on acceptance of our retail store experience by customers, including our ability to design our stores in a manner that resonates locally and to offer the correct product assortment to appeal to consumers. Furthermore, our continued growth in the retail sector may strain relations with certain of our distribution customers who also compete in the retail pharmacy sector. There can be no assurance that our retail locations will be received as well as, or achieve net sales or profitability levels consistent with, our projected targets or be comparable to those of our existing stores in the time periods estimated by us, or at all. If our retail expansion fails to achieve, or unable to sustain, acceptable net sales and profitability levels, our business, results of operations and growth prospects may be materially adversely affected.
Our retail stores may require additional management time and attention. Failure to properly supervise the operation and maintain the consistency of the customer experience in those retail stores could result in loss of customers and potentially adversely affect our results of operations.
25
McKESSON CORPORATION
We may be unable to keep existing retail store locations or open new retail locations in desirable places, which could materially adversely affect our results of operations.
We may be unable to keep existing retail locations or open new retail locations in desirable places in the future. We compete with other retailers and businesses for suitable retail locations. Local land use, local zoning issues, environmental regulations and other regulations may affect our ability to find suitable retail locations and also influence the cost of leasing or buying them. We also may have difficulty negotiating real estate leases for new stores, renewing real estate leases for existing stores or negotiating purchase agreements for new sites on acceptable terms. In addition, construction, environmental, zoning and real estate delays may negatively affect retail location openings and increase costs and capital expenditures. If we are unable to keep up our existing retail store locations or open new retail store locations in desirable places and on favorable terms, our results of operations could be materially adversely affected.
Item 1B. | Unresolved Staff Comments. |
None.
Item 2. | Properties. |
Because of the nature of our principal businesses, our plant, warehousing, retail pharmacies, office and other facilities are operated in widely dispersed locations, primarily throughout North America and Europe. The warehouses and retail pharmacies are typically owned or leased on a long-term basis. We consider our operating properties to be in satisfactory condition and adequate to meet our needs for the next several years without making capital expenditures materially higher than historical levels. Information as to material lease commitments is included in Financial Note 22, “Lease Obligations,” to the consolidated financial statements appearing in this Annual Report on Form 10-K.
Item 3. | Legal Proceedings. |
Certain legal proceedings in which we are involved are discussed in Financial Note 24, “Commitments and Contingent Liabilities,” to the consolidated financial statements appearing in this Annual Report on Form 10-K.
Item 4. | Mine Safety Disclosures. |
Not applicable.
26
McKESSON CORPORATION
Executive Officers of the Registrant
The following table sets forth information regarding the executive officers of the Company, including their principal occupations during the past five years. The number of years of service with the Company includes service with predecessor companies.
There are no family relationships between any of the executive officers or directors of the Company. The executive officers are elected on an annual basis generally and their term expires at the first meeting of the Board of Directors (“Board”) following the annual meeting of stockholders, or until their successors are elected and have qualified, or until death, resignation or removal, whichever is sooner.
Name | Age | Position with Registrant and Business Experience | ||
John H. Hammergren | 57 | Chairman of the Board since July 2002; President and Chief Executive Officer since April 2001; and a director since July 1999. Service with the Company — 20 years. | ||
James A. Beer | 55 | Executive Vice President and Chief Financial Officer since October 2013; Executive Vice President and Chief Financial Officer, Symantec Corporation from 2006 to October 2013; Senior Vice President and Chief Financial Officer, AMR Corporation and its principal subsidiary, American Airlines, Inc., from 2004 to 2006, Service with the Company — 2 years. | ||
Patrick J. Blake | 52 | Executive Vice President and Group President since June 2009; President of McKesson Specialty Care Solutions (now McKesson Specialty Health) from April 2006 to June 2009. Service with the Company — 20 years. | ||
Jorge L. Figueredo | 55 | Executive Vice President, Human Resources since May 2008; Service with the Company — 8 years. | ||
Paul C. Julian | 60 | Executive Vice President and Group President since April 2004. Service with the Company — 20 years. | ||
Kathleen D. McElligott | 60 | Executive Vice President, Chief Information Officer and Chief Technology Officer since July 2015; Chief Information Officer and Vice President, Information Technology, Emerson Electric from 2010 to July 2015. Service with the Company — 9 months. | ||
Bansi Nagji | 51 | Executive Vice President, Corporate Strategy and Business Development since February 2015; Principal, Deloitte Consulting, LLP and Global Leader, Monitor Deloitte (which was formed by the global merger of Monitor Group with Deloitte) from January 2013 to February 2015; President, Monitor Group from July 2012 to January 2013; Partner, Monitor Group from 2001 to January 2013. Service with the Company — 1 year, 3 months. | ||
Lori A. Schechter | 54 | Executive Vice President, General Counsel and Chief Compliance Officer since June 2014; Associate General Counsel from January 2012 to June 2014; Litigation Partner, Morrison & Foerster LLP from January 1995 to December 2011. Service with the Company — 4 years. | ||
27
McKESSON CORPORATION
PART II
Item 5. | Market for the Registrant’s Common Equity, Related Stockholder Matters and Issuer Purchases of Equity Securities. |
(a) | Market Information: The principal market on which the Company’s common stock is traded is the New York Stock Exchange (“NYSE”). |
The following table sets forth the high and low sales prices for our common stock as reported on NYSE for each quarterly period of the two most recently completed fiscal years:
2016 | 2015 | ||||||||||||
High | Low | High | Low | ||||||||||
First quarter | $ | 243.61 | $ | 219.51 | $ | 192.03 | $ | 162.90 | |||||
Second quarter | $ | 236.86 | $ | 160.10 | $ | 200.00 | $ | 185.66 | |||||
Third quarter | $ | 202.20 | $ | 169.00 | $ | 214.37 | $ | 178.28 | |||||
Fourth quarter | $ | 196.84 | $ | 148.29 | $ | 232.69 | $ | 205.72 | |||||
(b) | Holders: The number of record holders of the Company’s common stock at March 31, 2016 was approximately 6,204. |
(c) | Dividends: In July 2015, the Company’s quarterly dividend was raised from $0.24 to $0.28 per common share for dividends declared after such date, until further action by the Company’s Board of Directors (the “Board”). The Company declared regular cash dividends of $1.08 and $0.96 per share in the years ended March 31, 2016 and 2015. |
The Company anticipates that it will continue to pay quarterly cash dividends in the future. However, the payment and amount of future dividends remain within the discretion of the Board and will depend upon the Company’s future earnings, financial condition, capital requirements and other factors.
(d) | Securities Authorized for Issuance under Equity Compensation Plans: Information relating to this item is provided under Part III, Item 12, to this Annual Report on Form 10-K. |
(e) | Share Repurchase Plans: Stock repurchases may be made from time to time in open market transactions, privately negotiated transactions, through accelerated share repurchase (“ASR”) programs, or by any combination of such methods. The timing of any repurchases and the actual number of shares repurchased will depend on a variety of factors, including our stock price, corporate and regulatory requirements, restrictions under our debt obligations and other market and economic conditions. |
In May and October 2015, the Board authorized the repurchase of up to $500 million and $2 billion of the Company’s common stock.
In 2014, we made no share repurchases. In 2015, we repurchased 1.5 million shares for $340 million at an average price of $226.55 per share. In 2016, we repurchased 4.5 million shares of the Company’s common stock for $854 million through open market transactions at an average price per share of $192.27. In February 2016, we entered into an ASR program with a third party financial institution to repurchase $650 million of the Company’s common stock. The ASR program was completed during the fourth quarter and we repurchased 4.2 million shares at an average price per share of $154.04. All share repurchases were funded with cash on hand.
The total authorization outstanding for repurchases of the Company’s common stock was $1.0 billion at March 31, 2016. In 2016, we retired 115.5 million or $7.8 billion of the Company’s previously repurchased treasury shares. Under the applicable state law, these shares resumed the status of authorized and unissued shares upon retirement.
28
McKESSON CORPORATION
The following table provides information on the Company’s share repurchases during the fourth quarter of 2016:
Share Repurchases (1) | |||||||||||||
(In millions, except price per share) | Total Number of Shares Purchased | Average Price Paid per Share | Total Number of Shares Purchased as Part of Publicly Announced Programs | Approximate Dollar Value of Shares that May Yet Be Purchased Under the Programs | |||||||||
January 1, 2016 - January 31, 2016 | — | $ | — | — | $ | 1,646 | |||||||
February 1, 2016 - February 29, 2016 | 3.2 | 154.04 | 3.2 | 1,148 | |||||||||
March 1, 2016 - March 31, 2016 | 1.0 | 154.04 | 1.0 | 996 | |||||||||
Total | 4.2 | 4.2 | $ | 996 | |||||||||
(1) | This table does not include shares tendered to satisfy the exercise price in connection with cashless exercises of employee stock options or shares tendered to satisfy tax-withholding obligations in connection with employee equity awards. |
29
McKESSON CORPORATION
(f) | Stock Price Performance Graph*: The following graph compares the cumulative total stockholder return on the Company’s common stock for the periods indicated with the Standard & Poor’s 500 Index and the S&P 500 Health Care Index. The S&P 500 Health Care Index was selected as a comparator because it is generally available to investors and broadly used by other companies in the same industry. |
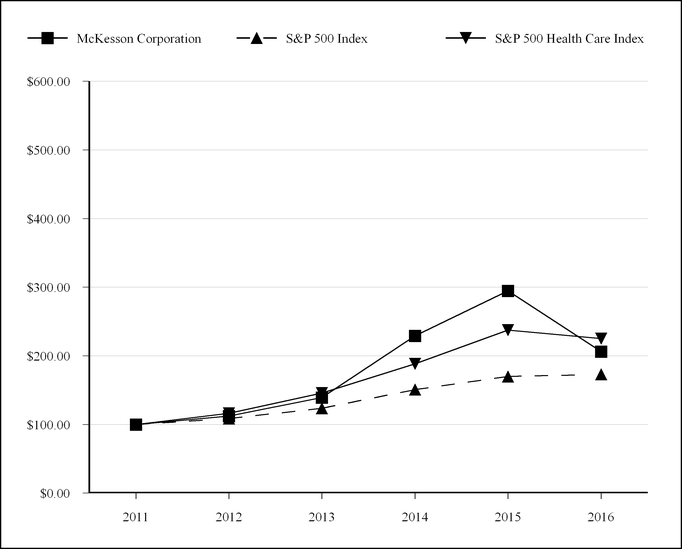
March 31, | |||||||||||||||||||||||
2011 | 2012 | 2013 | 2014 | 2015 | 2016 | ||||||||||||||||||
McKesson Corporation | $ | 100.00 | $ | 112.13 | $ | 139.12 | $ | 229.03 | $ | 294.79 | $ | 206.10 | |||||||||||
S&P 500 Index | $ | 100.00 | $ | 108.54 | $ | 123.69 | $ | 150.73 | $ | 169.92 | $ | 172.95 | |||||||||||
S&P 500 Health Care Index | $ | 100.00 | $ | 116.36 | $ | 145.65 | $ | 188.21 | $ | 237.45 | $ | 225.15 | |||||||||||
* Assumes $100 invested in McKesson Common Stock and in each index on March 31, 2011 and that all dividends are reinvested.
30
McKESSON CORPORATION
Item 6. | Selected Financial Data. |
FIVE-YEAR HIGHLIGHTS
As of and for the Years Ended March 31, | ||||||||||||||||||||
(In millions, except per share data and ratios) | 2016 | 2015 | 2014 | 2013 | 2012 | |||||||||||||||
Operating Results | ||||||||||||||||||||
Revenues | $ | 190,884 | $ | 179,045 | $ | 137,392 | $ | 122,196 | $ | 122,453 | ||||||||||
Percent change | 6.6 | % | 30.3 | % | 12.4 | % | (0.2 | )% | 9.5 | % | ||||||||||
Gross profit | $ | 11,416 | $ | 11,411 | $ | 8,352 | $ | 6,881 | $ | 6,435 | ||||||||||
Income from continuing operations before income taxes | 3,250 | 2,657 | 2,171 | 1,950 | 1,915 | |||||||||||||||
Income (loss) after income taxes | ||||||||||||||||||||
Continuing operations | 2,342 | 1,842 | 1,414 | 1,363 | 1,394 | |||||||||||||||
Discontinued operations | (32 | ) | (299 | ) | (156 | ) | (25 | ) | 9 | |||||||||||
Net income | 2,310 | 1,543 | 1,258 | 1,338 | 1,403 | |||||||||||||||
Net (income) loss attributable to noncontrolling interests (1) | (52 | ) | (67 | ) | 5 | — | — | |||||||||||||
Net income attributable to McKesson Corporation | 2,258 | 1,476 | 1,263 | 1,338 | 1,403 | |||||||||||||||
Financial Position | ||||||||||||||||||||
Working capital | $ | 3,366 | $ | 3,173 | $ | 3,221 | $ | 1,813 | $ | 1,917 | ||||||||||
Days sales outstanding for: (2) | ||||||||||||||||||||
Customer receivables | 28 | 26 | 29 | 26 | 24 | |||||||||||||||
Inventories | 32 | 31 | 33 | 33 | 31 | |||||||||||||||
Drafts and accounts payable | 59 | 54 | 54 | 51 | 49 | |||||||||||||||
Total assets | $ | 56,563 | $ | 53,870 | $ | 51,759 | $ | 34,786 | $ | 33,093 | ||||||||||
Total debt, including capital lease obligations | 8,154 | 9,844 | 10,594 | 4,873 | 3,980 | |||||||||||||||
Total McKesson stockholders’ equity (3) | 8,924 | 8,001 | 8,522 | 7,070 | 6,831 | |||||||||||||||
Payments for property, plant and equipment | 488 | 376 | 278 | 241 | 221 | |||||||||||||||
Acquisitions, net of cash and cash equivalents acquired | 40 | 170 | 4,634 | 1,873 | 1,051 | |||||||||||||||
Common Share Information | ||||||||||||||||||||
Common shares outstanding at year-end | 225 | 232 | 231 | 227 | 235 | |||||||||||||||
Shares on which earnings per common share were based | ||||||||||||||||||||
Diluted | 233 | 235 | 233 | 239 | 251 | |||||||||||||||
Basic | 230 | 232 | 229 | 235 | 246 | |||||||||||||||
Diluted earnings (loss) per common share attributable to McKesson Corporation (4) | ||||||||||||||||||||
Continuing operations | $ | 9.84 | $ | 7.54 | $ | 6.08 | $ | 5.69 | $ | 5.56 | ||||||||||
Discontinued operations | (0.14 | ) | (1.27 | ) | (0.67 | ) | (0.10 | ) | 0.04 | |||||||||||
Total | 9.70 | 6.27 | 5.41 | 5.59 | 5.60 | |||||||||||||||
Cash dividends declared | 249 | 226 | 214 | 192 | 202 | |||||||||||||||
Cash dividends declared per common share | 1.08 | 0.96 | 0.92 | 0.80 | 0.80 | |||||||||||||||
Book value per common share (4) (5) | 39.66 | 34.49 | 36.89 | 31.15 | 29.07 | |||||||||||||||
Market value per common share - year-end | 157.25 | 226.20 | 176.57 | 107.96 | 87.77 | |||||||||||||||
Supplemental Data | ||||||||||||||||||||
Debt to capital ratio (6) | 43.7 | % | 50.3 | % | 55.4 | % | 40.6 | % | 36.8 | % | ||||||||||
Average McKesson stockholders’ equity (7) | $ | 8,688 | $ | 8,703 | $ | 7,803 | $ | 7,294 | $ | 7,108 | ||||||||||
Return on McKesson stockholders’ equity (8) | 26.0 | % | 17.0 | % | 16.2 | % | 18.3 | % | 19.7 | % | ||||||||||
Footnotes to Five-Year Highlights:
(1) | Primarily reflects guaranteed dividends and annual recurring compensation that McKesson became obligated to pay to the noncontrolling shareholders of Celesio AG upon the effectiveness of the Domination Agreement in December 2014. |
(2) | Based on year-end balances and sales or cost of sales for the last 90 days of the year. |
(3) | Excludes noncontrolling and redeemable noncontrolling interests. |
(4) | Certain computations may reflect rounding adjustments. |
(5) | Represents McKesson stockholders’ equity divided by year-end common shares outstanding. |
(6) | Ratio is computed as total debt divided by the sum of total debt and McKesson stockholders’ equity excluding accumulated other comprehensive income (loss). |
(7) | Represents a five-quarter average of McKesson stockholders’ equity. |
(8) | Ratio is computed as net income attributable to McKesson Corporation for the last four quarters, divided by a five-quarter average of McKesson stockholders’ equity. |
31
Item 7. | Management’s Discussion and Analysis of Financial Condition and Results of Operations. |
GENERAL
Management’s discussion and analysis of financial condition and results of operations, referred to as the Financial Review, is intended to assist the reader in the understanding and assessment of significant changes and trends related to the results of operations and financial position of the Company together with its subsidiaries. This discussion and analysis should be read in conjunction with the consolidated financial statements and accompanying financial notes in Item 8 of Part II of this Annual Report on Form 10-K. The Company’s fiscal year begins on April 1 and ends on March 31. Unless otherwise noted, all references to a particular year shall mean the Company’s fiscal year.
Certain statements in this report constitute forward-looking statements. See Item 1 - Business - Forward-Looking Statements in Part I of this Annual Report on Form 10-K for additional factors relating to these statements; also see Item 1A - Risk Factors in Part I of this Annual Report on Form 10-K for a list of certain risk factors applicable to our business, financial condition and results of operations.
We conduct our business through two operating segments: McKesson Distribution Solutions and McKesson Technology Solutions. Refer to Financial Note 27, “Segments of Business,” to the consolidated financial statements appearing in this Annual Report on Form 10-K for a description of these segments.
32
RESULTS OF OPERATIONS
Overview:
(Dollars in millions, except per share data) | Years Ended March 31, | Change | |||||||||||||||||
2016 | 2015 | 2014 | 2016 | 2015 | |||||||||||||||
Revenues | $ | 190,884 | $ | 179,045 | $ | 137,392 | 7 | % | 30 | % | |||||||||
Gross Profit | $ | 11,416 | $ | 11,411 | $ | 8,352 | - | % | 37 | % | |||||||||
Operating Expenses | $ | 7,871 | $ | 8,443 | $ | 5,913 | (7 | ) | % | 43 | % | ||||||||
Income from Continuing Operations Before Income Taxes | $ | 3,250 | $ | 2,657 | $ | 2,171 | 22 | % | 22 | % | |||||||||
Income Tax Expense | (908 | ) | (815 | ) | (757 | ) | 11 | 8 | |||||||||||
Income from Continuing Operations | 2,342 | 1,842 | 1,414 | 27 | 30 | ||||||||||||||
Loss from Discontinued Operations, Net of Tax | (32 | ) | (299 | ) | (156 | ) | (89 | ) | 92 | ||||||||||
Net Income | 2,310 | 1,543 | 1,258 | 50 | 23 | ||||||||||||||
Net (Income) Loss Attributable to Noncontrolling Interests | (52 | ) | (67 | ) | 5 | (22 | ) | (1,440 | ) | ||||||||||
Net Income Attributable to McKesson Corporation | $ | 2,258 | $ | 1,476 | $ | 1,263 | 53 | % | 17 | % | |||||||||
Diluted Earnings (Loss) Per Common Share Attributable to McKesson Corporation | |||||||||||||||||||
Continuing Operations | $ | 9.84 | $ | 7.54 | $ | 6.08 | 31 | % | 24 | % | |||||||||
Discontinued Operations | (0.14 | ) | (1.27 | ) | (0.67 | ) | (89 | ) | 90 | ||||||||||
Total | $ | 9.70 | $ | 6.27 | $ | 5.41 | 55 | % | 16 | % | |||||||||
Weighted Average Diluted Common Shares | 233 | 235 | 233 | (1 | ) | % | 1 | % | |||||||||||
Revenues for 2016 and 2015 increased 7% and 30% compared to the same periods a year ago. Excluding unfavorable foreign currency effects of 2%, revenues increased 9% for 2016. Revenues benefited from market growth and expanded volume with existing customers within our North America pharmaceutical distribution businesses. Revenues for 2015 also increased as a result of our February 2014 acquisition of Celesio AG (“Celesio”). Market growth reflects growing drug utilization, which includes newly launched drugs and price increases, partially offset by price deflation associated with brand to generic drug conversions.
Gross profit was flat in 2016 and increased 37% in 2015 compared to the same periods a year ago. Excluding unfavorable foreign currency effects of 4%, gross profit increased 4% in 2016. Gross profit margin decreased in 2016 primarily due to a lower sell margin within our North America distribution business driven by increased customer sales volume with some of our largest customers, partially offset by higher buy margin including benefits from our global procurement arrangements, lower LIFO-related inventory charges and $76 million in cash receipts representing our share of antitrust legal settlements. Additionally, this business has been experiencing weaker generic pharmaceutical pricing trends, which are expected to continue in 2017. Gross profit margin increased in 2015 primarily due to our Celesio acquisition, higher buy margin including the effects of generic price increases and our mix of business, partially offset by lower sell profit. Gross profit included LIFO-related inventory charges of $244 million, $337 million and $311 million in 2016, 2015 and 2014.
Operating expenses decreased 7% and increased 43% in 2016 and 2015 compared to the same periods a year ago. Excluding unfavorable foreign currency effects of 5%, operating expenses decreased 2% in 2016 primarily due to pre-tax gains of $103 million from the sale of two businesses and lower acquisition-related expenses, partially offset by pre-tax restructuring charges of $203 million, as further discussed below. Additionally, 2015 operating expenses included a pre-tax and after-tax $150 million charge associated with the settlement of controlled substance distribution claims with the Drug Enforcement Administration (“DEA”), Department of Justice (“DOJ”) and various U.S. Attorney’s offices.
33
On March 14, 2016, the Company committed to a restructuring plan to lower its operating costs (“Cost Alignment Plan”). The Cost Alignment Plan primarily consists of a reduction in workforce and business process initiatives that will be substantially implemented prior to the end of 2019. During the fourth quarter of 2016, we recorded $229 million of pre-tax restructuring charges primarily representing severance and employee-related costs. The charges were included in our results as follows: $26 million in cost of sales and $203 million in operating expenses.
Operating expenses increased in 2015 primarily due to our business acquisitions, including increases in acquisition-related expenses and intangible asset amortization, and higher compensation and benefit costs. Additionally, operating expenses for 2015 included the $150 million settlement charge and for 2014, included $68 million of pre-tax charges associated with our Average Wholesale Price (“AWP”) litigation.
Income from continuing operations before income taxes increased in 2016 compared with the prior year primarily due to lower operating expenses, and increased in 2015 primarily due to higher gross profit, partially offset by higher operating and interest expense.
Our reported income tax rates were 27.9%, 30.7% and 34.9% in 2016, 2015 and 2014. Income tax expense for 2014 included a charge of $122 million relating to our litigation with the Canadian Revenue Agency (“CRA”).
Net income attributable to noncontrolling interests for 2016 and 2015 primarily reflects the recurring annual compensation and the guaranteed dividends that McKesson is obligated to pay to the noncontrolling shareholders of Celesio under the domination and profit and loss transfer agreement (the “Domination Agreement”), which became effective in December 2014.
Loss from discontinued operations, net of tax, for 2015 included pre-tax non-cash impairment charges of $241 million ($235 million after-tax) associated with our Brazilian pharmaceutical distribution business, which we acquired through our acquisition of Celesio. On January 31, 2016, we entered into an agreement to sell this business to a third party. The sale is expected to be completed during the first half of 2017, subject to regulatory approval and customary closing conditions. We expect to recognize an after-tax charge of approximately $80 million to $100 million upon the disposition of the business within discontinued operations as a result of settlement of certain indemnifications. Loss from discontinued operations, net of tax, for 2014 included a non-cash pre-tax and after-tax impairment charge of $80 million related to our International Technology business, which was sold in part in 2015.
Net income attributable to McKesson Corporation was $2,258 million, $1,476 million and $1,263 million in 2016, 2015 and 2014. Diluted earnings per common share attributable to McKesson Corporation from continuing operations were $9.84, $7.54 and $6.08 and diluted loss per common share attributable to McKesson Corporation from discontinued operations were $0.14, $1.27 and $0.67 in 2016, 2015 and 2014.
We have recently acquired or have agreements to acquire a number of businesses whose financial results will be reported within our Distribution Solutions segment from their respective acquisition date. These businesses are described in Financial Note 2, “Business Combinations” to the consolidated financial statements appearing in this Annual Report on Form 10-K for additional information.
34
Revenues:
Years Ended March 31, | Change | ||||||||||||||||||
(Dollars in millions) | 2016 | 2015 | 2014 | 2016 | 2015 | ||||||||||||||
Distribution Solutions | |||||||||||||||||||
North America pharmaceutical distribution & services | $ | 158,469 | $ | 143,711 | $ | 123,929 | 10 | % | 16 | % | |||||||||
International pharmaceutical distribution & services | 23,497 | 26,358 | 4,485 | (11 | ) | 488 | |||||||||||||
Medical-Surgical distribution & services | 6,033 | 5,907 | 5,648 | 2 | 5 | ||||||||||||||
Total Distribution Solutions | 187,999 | 175,976 | 134,062 | 7 | 31 | ||||||||||||||
Technology Solutions - products and services | 2,885 | 3,069 | 3,330 | (6 | ) | (8 | ) | ||||||||||||
Total Revenues | $ | 190,884 | $ | 179,045 | $ | 137,392 | 7 | % | 30 | % | |||||||||
Revenues increased 7% and 30% in 2016 and 2015 compared to the same periods a year ago. Excluding unfavorable foreign currency effects of 2%, revenues increased 9% in 2016. These increases were primarily driven by our Distribution Solutions segment, which accounted for approximately 98% of our consolidated revenues.
Distribution Solutions
North America pharmaceutical distribution and services revenues increased over the last two years primarily due to market growth, expanded business with existing customers and our mix of business. These increases were partially offset by customer losses. Market growth reflects growing drug utilization, which includes newly launched drugs and price increases, partially offset by price deflation associated with brand to generic drug conversions. Additionally, our 2015 revenues benefited from newly launched drugs for the treatment of Hepatitis C.
International pharmaceutical distribution and services revenues for 2016 decreased 11%. Excluding unfavorable foreign currency effects of 12%, revenues increased 1% in 2016 primarily reflecting higher revenues in the United Kingdom due to a new distribution agreement with a manufacturer, which was almost fully offset by lower revenues in Norway associated with the loss of a hospital contract. Revenues increased in 2015 primarily due to our acquisition of Celesio in February 2014.
Medical-Surgical distribution and services revenues increased over the last two years primarily due to market growth. Revenues for 2016 were unfavorably affected by the sale of our ZEE Medical business in the second quarter of 2016.
Our Distribution Solutions segment is experiencing customer consolidation, including business combinations that impact our customers.
Technology Solutions
Technology Solutions revenues decreased over the last two years primarily due to a decline in hospital software revenues, partially offset by higher revenues in our other businesses. Additionally, 2016 revenues decreased as a result of the sale of our nurse triage business and the transition of our workforce business within our International Technology business to a third party during the first quarter of 2016. Revenues decreased in 2015 compared to 2014 primarily due to a decline in hospital software revenues, the planned elimination of a product line and lower revenues from the workforce business within our International Technology business, which was transitioned to another service provider during the first quarter of 2016. These decreases were partially offset by higher revenues in our other businesses.
35
Gross Profit:
Years Ended March 31, | Change | |||||||||||||||||||||
(Dollars in millions) | 2016 | 2015 | 2014 | 2016 | 2015 | |||||||||||||||||
Gross Profit | ||||||||||||||||||||||
Distribution Solutions (1) (2) | $ | 9,948 | $ | 9,937 | $ | 6,745 | - | % | 47 | % | ||||||||||||
Technology Solutions (2) | 1,468 | 1,474 | 1,607 | - | (8 | ) | ||||||||||||||||
Total | $ | 11,416 | $ | 11,411 | $ | 8,352 | - | % | 37 | % | ||||||||||||
Gross Profit Margin | ||||||||||||||||||||||
Distribution Solutions | 5.29 | % | 5.65 | % | 5.03 | % | (36 | ) | bp | 62 | bp | |||||||||||
Technology Solutions | 50.88 | 48.03 | 48.26 | 285 | (23 | ) | ||||||||||||||||
Total | 5.98 | 6.37 | 6.08 | (39 | ) | 29 | ||||||||||||||||
bp - basis points
(1) | Gross profit for our Distribution Solutions segment includes LIFO expenses of $244 million, $337 million and $311 million for 2016, 2015 and 2014, and for 2016 and 2014 includes $76 million and $37 million of net cash proceeds representing our share of antitrust legal settlements. |
(2) | Gross profit includes pre-tax restructuring charges of $5 million and $21 million for the Cost Alignment Plan within our Distribution Solutions segment and Technology Solutions segment in 2016. |
Gross profit was flat in 2016 and increased 37% in 2015 compared to the same periods a year ago. Excluding unfavorable foreign currency effects of 4%, gross profit increased 4% in 2016. Gross profit margin decreased in 2016 and increased in 2015. These changes were primarily due to our Distribution Solutions segment.
Distribution Solutions
Distribution Solutions segment’s gross profit was flat in 2016 and increased in 2015. Excluding unfavorable foreign currency effects of 4%, gross profit increased 4% in 2016. Gross profit margin decreased in 2016 primarily due to a lower sell margin within our North America distribution business driven by increased customer sales volume with some of our largest customers, partially offset by higher buy margin including benefits from our global procurement arrangements, lower LIFO-related inventory charges and $76 million in cash receipts representing our share of antitrust legal settlements. Additionally, this business has been experiencing weaker generic pharmaceutical pricing trends, which are expected to continue in 2017. Buy margin primarily reflects volume and timing of compensation we receive from pharmaceutical manufacturers, including the effects of price increases of both branded and generic drugs.
Gross profit margin increased in 2015 primarily due to our Celesio acquisition, higher buy margin including the effects of generic price increases and our mix of business, partially offset by lower sell profit. Gross profit margin for 2015 was unfavorably affected by the increased sales associated with newly launched drugs for the treatment of Hepatitis C. Additionally, gross profit margin for 2014 included a $50 million charge for the reversal of a fair value step-up of inventory acquired through our Celesio acquisition and $37 million of cash receipts representing our share of antitrust settlements.
Our LIFO-related inventory expenses were $244 million, $337 million and $311 million in 2016, 2015 and 2014. Our North America distribution business uses the LIFO method of accounting for the majority of its inventories, which results in cost of sales that more closely reflects replacement cost than under other accounting methods. The business’ practice is to pass on to customers published price changes from suppliers. Manufacturers generally provide us with price protection, which limits price-related inventory losses. A LIFO expense is recognized when the net effect of price increases on pharmaceutical and non-pharmaceutical products held in inventory exceeds the net impact of price declines, including the effect of branded pharmaceutical products that have lost market exclusivity. A LIFO credit is recognized when the net effect of price declines exceeds the net impact of price increases on pharmaceutical and non-pharmaceutical products held in inventory. Our annual LIFO expense is affected by changes in year-end inventory quantities, product mix and manufacturer pricing practices, which may be influenced by market and other external influences. Changes to any of the above factors could have a material impact to our annual LIFO expense. LIFO expense decreased in 2016 primarily due to the impact of lower price increases.
36
As a result of cumulative net price deflation, at March 31, 2013, pharmaceutical inventories at LIFO were more than market and accordingly, a $60 million lower-of-cost or market (“LCM”) reserve reduced inventories to market. Starting in 2014, we have experienced net inflation in our pharmaceutical inventories and LIFO-related charges were incurred, and accordingly, the $60 million LCM reserve was fully released resulting in an increase in gross profit. As of March 31, 2016 and 2015, pharmaceutical inventories at LIFO did not exceed market.
Technology Solutions
Technology Solutions segment’s gross profit decreased over the last two years. Gross profit margin increased in 2016 and decreased in 2015. In addition to changes in our mix of business, gross profit margin was impacted by:
2016 vs. 2015: Gross profit margin benefited from the sale of our nurse triage business, transitioning of our workforce business within our International Technology business to a third party, and higher pull-through of deferred revenue. These increases were partially offset by $49 million of pre-tax reduction-in-force severance charges, including charges associated with the Cost Alignment Plan. Additionally, in 2015 we recorded a $34 million pre-tax non-cash charge representing a catch-up in depreciation and amortization expense associated with our workforce business within our International Technology business. This business, which was previously designated as a discontinued operation, was reclassified to a continuing operation in 2015 when we decided to retain the business.
2015 vs. 2014: In 2015, gross profit margin was negatively impacted by the $34 million non-cash depreciation and amortization charge, partially offset by a decrease in product alignment charges. In 2014, we recorded $57 million of pre-tax product alignment charges, which primarily relate to employee severance and asset impairments. Charges were recorded in our 2014 financial results as follows: $34 million in cost of sales and $23 million in operating expenses. Additionally, gross profit margin was favorably impacted by the planned elimination of a product line.
Operating Expenses:
Years Ended March 31, | Change | |||||||||||||||||||
(Dollars in millions) | 2016 | 2015 | 2014 | 2016 | 2015 | |||||||||||||||
Operating Expenses | ||||||||||||||||||||
Distribution Solutions (1) (2) (3) | $ | 6,436 | $ | 6,938 | $ | 4,301 | (7 | ) | % | 61 | % | |||||||||
Technology Solutions (1) (2) | 951 | 1,039 | 1,161 | (8 | ) | (11 | ) | |||||||||||||
Corporate | 484 | 466 | 451 | 4 | 3 | |||||||||||||||
Total | $ | 7,871 | $ | 8,443 | $ | 5,913 | (7 | ) | % | 43 | % | |||||||||
Operating Expenses as a Percentage of Revenues | ||||||||||||||||||||
Distribution Solutions | 3.42 | % | 3.94 | % | 3.21 | % | (52 | ) | bp | 73 | bp | |||||||||
Technology Solutions | 32.96 | 33.85 | 34.86 | (89 | ) | (101 | ) | |||||||||||||
Total | 4.12 | 4.72 | 4.30 | (60 | ) | 42 | ||||||||||||||
(1) | Operating expenses for 2016 include pre-tax charges associated with the Cost Alignment Plan of $156 million, $30 million and $17 million within our Distribution Solutions and Technology Solutions segments, and Corporate. |
(2) | Operating expenses for 2016 include pre-tax gains of $52 million from the sale of our ZEE Medical business within our Distribution Solutions segment and $51 million from the sale of our nurse triage business within our Technology Solutions segment. |
(3) | Operating expenses for 2015 and 2014 include pre-tax claim and litigation charges of $150 million and $68 million. |
Operating expenses for 2016 decreased 7% and increased 43% in 2015 compared to the same periods a year ago. Excluding unfavorable foreign currency effects of 5%, operating expenses decreased 2% for 2016.
On March 14, 2016, the Company committed to a restructuring plan to lower its operating costs, as previously discussed. The Cost Alignment Plan primarily consists of a reduction in workforce and business process initiatives that will be substantially implemented prior to the end of 2019. Business process initiatives primarily include plans to reduce operating costs of our distribution and pharmacy operations, administrative support functions, and technology platforms, as well as the disposal and abandonment of certain non-core businesses.
37
As a result of the Cost Alignment Plan, the Company expects to record total pre-tax charges of approximately $270 million to $290 million. During the fourth quarter of 2016, we recorded $229 million of pre-tax restructuring charges primarily representing severance and employee-related costs. The charges were included in our results as follows: $26 million in cost of sales and $203 million in operating expenses. Estimated remaining charges primarily consist of exit-related costs and accelerated depreciation and amortization, which are largely attributed to our Distribution Solutions segment. Estimated savings in 2017 as a result of this plan are approximately $200 million to $220 million. Additional information on our Cost Alignment Plan is included in Financial Note 3, “Restructuring” to the consolidated financial statements appearing in this Annual Report on Form 10-K.
Distribution Solutions
Distribution Solutions segment’s operating expenses for 2016 decreased 7% compared to the prior year. Excluding unfavorable foreign currency effects of 5%, operating expenses decreased 2%. Operating expenses and operating expenses as a percentage of revenues decreased primarily due to a $150 million charge associated with the settlement of controlled substance distribution claims recorded in the prior year, lower acquisition-related expenses relating to integration activities for our acquisitions and the sale of our ZEE Medical business, including a $52 million pre-tax gain on sale. These decreases were partially offset by pre-tax charges of $156 million associated with the Cost Alignment Plan, higher compensation and benefit costs and bad debt expense.
Operating expense and operating expenses as a percentage of revenues increased in 2015 compared to the prior year primarily due to our business acquisitions, including increases in acquisition-related expenses and intangible asset amortization, and higher compensation and benefit costs. Operating expenses in 2015 also included a $150 million charge associated with the settlement of controlled substance distribution claims with the DEA, DOJ and various U.S. Attorney’s offices, and 2014 operating expenses included $68 million of charges associated with our AWP litigation. Refer to Financial Note 24, “Commitments and Contingent Liabilities,” to the consolidated financial statements in this Annual Report on Form 10-K for further information on the controlled substance distribution claims and the AWP litigation.
Technology Solutions
Technology Solutions segment’s operating expenses and operating expenses as a percentage of revenues in 2016 decreased compared to the prior year primarily due to the sale of our nurse triage business in the first quarter of 2016, including a pre-tax gain on sale of $51 million, and lower compensation and benefit costs. These decreases were partially offset by pre-tax charges of $30 million for the Cost Alignment Plan as well as the write-off of internal-use software. Operating expenses and operating expenses as a percentage of revenue in 2015 decreased from the comparable year primarily due to lower research and development expenses, integration-related expenses and severance charges.
Corporate
Corporate expenses increased in 2016 compared to the prior year primarily due to pre-tax charges of $17 million associated with the Cost Alignment Plan, partially offset by lower acquisition-related expenses and a decrease in compensation and benefit costs. Corporate expenses increased in 2015 compared to the prior year primarily due to higher compensation and benefit costs and asset impairments, partially offset by lower acquisition-related expenses and lower costs associated with corporate initiatives.
Acquisition Expenses and Related Adjustments
Acquisition expenses and related adjustments, which include transaction and integration expenses that are directly related to acquisitions by the Company were $114 million, $224 million and $218 million in 2016, 2015 and 2014. Expenses primarily related to our business acquisitions and integrations of our February 2014 acquisition of Celesio and February 2013 acquisition of PSS World Medical, Inc. (“PSSI”).
38
Years Ended March 31, | |||||||||||
(Dollars in millions) | 2016 | 2015 | 2014 | ||||||||
Cost of Sales | $ | — | $ | 1 | $ | 3 | |||||
Operating Expenses | |||||||||||
Transaction closing expenses | 10 | 6 | 39 | ||||||||
Restructuring, severance and relocation | — | 57 | 43 | ||||||||
Outside service fees | 27 | 66 | 27 | ||||||||
Other | 73 | 94 | 46 | ||||||||
Total | 110 | 223 | 155 | ||||||||
Other Income, Net | 4 | — | 14 | ||||||||
Interest Expense - bridge loan fees | — | — | 46 | ||||||||
Total Acquisition Expenses and Related Adjustments | $ | 114 | $ | 224 | $ | 218 | |||||
Acquisition expenses and related adjustments by segment were as follows:
Years Ended March 31, | |||||||||||
(Dollars in millions) | 2016 | 2015 | 2014 | ||||||||
Cost of Sales | $ | — | $ | 1 | $ | 3 | |||||
Operating Expenses and Other Income, Net | |||||||||||
Distribution Solutions | 112 | 211 | 120 | ||||||||
Technology Solutions | — | — | 15 | ||||||||
Corporate | 2 | 12 | 34 | ||||||||
Total | 114 | 223 | 169 | ||||||||
Corporate - Interest Expense | — | — | 46 | ||||||||
Total Acquisition Expenses and Related Adjustments | $ | 114 | $ | 224 | $ | 218 | |||||
During 2016, 2015 and 2014, we incurred $9 million, $109 million and $129 million of acquisition-related expenses for our acquisition of Celesio and $70 million, $110 million, and $68 million for our acquisition of PSSI. These expenses primarily include restructuring, severance, employee retention incentives, outside service fees and other costs to integrate the business, and bridge loan fees. Additionally, our acquisition-related expenses for our PSSI acquisition include amounts associated with distribution center rationalization and information technology conversions to common platforms. Integration activities for our PSSI acquisition are substantially completed.
Amortization Expenses of Acquired Intangible Assets
Amortization expenses of acquired intangible assets in connection with acquisitions recorded in operating expenses were $423 million, $483 million and $308 million in 2016, 2015 and 2014. Amortization expenses decreased in 2016 primarily due to foreign currency effects and intangible assets that were fully amortized. Amortization expenses increased in 2015 primarily due to our Celesio acquisition.
Amortization expense by segment was as follows:
Years Ended March 31, | |||||||||||
(Dollars in millions) | 2016 | 2015 | 2014 | ||||||||
Distribution Solutions | $ | 389 | $ | 442 | $ | 255 | |||||
Technology Solutions | 34 | 40 | 52 | ||||||||
Corporate | — | 1 | 1 | ||||||||
Total | $ | 423 | $ | 483 | $ | 308 | |||||
39
Other Income, Net:
Years Ended March 31, | Change | ||||||||||||||||||
(Dollars in millions) | 2016 | 2015 | 2014 | 2016 | 2015 | ||||||||||||||
Distribution Solutions | $ | 41 | $ | 48 | $ | 28 | (15 | ) | % | 71 | % | ||||||||
Technology Solutions | 2 | 3 | 2 | (33 | ) | 50 | |||||||||||||
Corporate | 15 | 12 | 2 | 25 | 500 | ||||||||||||||
Total | $ | 58 | $ | 63 | $ | 32 | (8 | ) | % | 97 | % | ||||||||
Other income, net in 2016 approximated the prior year and increased in 2015 primarily due to our acquisition of Celesio which included higher equity investment income. Additionally, 2014 other income, net included a loss on a foreign exchange option relating to our acquisition of Celesio.
Segment Operating Profit, Corporate Expenses, Net and Interest Expense:
Years Ended March 31, | Change | |||||||||||||||||||
(Dollars in millions) | 2016 | 2015 | 2014 | 2016 | 2015 | |||||||||||||||
Segment Operating Profit (1) (2) | ||||||||||||||||||||
Distribution Solutions | $ | 3,553 | $ | 3,047 | $ | 2,472 | 17 | % | 23 | % | ||||||||||
Technology Solutions | 519 | 438 | 448 | 18 | (2 | ) | ||||||||||||||
Subtotal | 4,072 | 3,485 | 2,920 | 17 | 19 | |||||||||||||||
Corporate Expenses, Net (2) | (469 | ) | (454 | ) | (449 | ) | 3 | 1 | ||||||||||||
Interest Expense | (353 | ) | (374 | ) | (300 | ) | (6 | ) | 25 | |||||||||||
Income From Continuing Operations Before Income Taxes (2) | $ | 3,250 | $ | 2,657 | $ | 2,171 | 22 | % | 22 | % | ||||||||||
Segment Operating Profit Margin | ||||||||||||||||||||
Distribution Solutions | 1.89 | % | 1.73 | % | 1.84 | % | 16 | bp | (11 | ) | bp | |||||||||
Technology Solutions | 17.99 | 14.27 | 13.45 | 372 | 82 | |||||||||||||||
(1) | Segment operating profit includes gross profit, net of operating expenses, plus other income, net, for our two operating segments. |
(2) | In connection with the Cost Alignment Plan, the Company recorded pre-tax restructuring charges of $229 million in 2016. Pre-tax charges were recorded as follows: $161 million, $51 million and $17 million within our Distribution Solutions segment, Technology Solutions segment and Corporate expenses, net. |
Segment Operating Profit
Distribution Solutions: Operating profit increased over the last two years primarily due to growth in our business and for 2015 due to our business acquisitions. Operating profit margin for 2016 increased due to lower operating expenses as a percentage of revenues, partially offset by a decline in gross profit margin. Operating profit and operating profit margin in 2016 includes $161 million of pre-tax charges associated with the Cost Alignment Plan, lower LIFO charges, and a $52 million pre-tax gain on the sale of our ZEE Medical business. Operating profit margin for 2015 decreased primarily due to our acquisition of Celesio and the unfavorable impact from the newly launched drugs for Hepatitis C, partially offset by our other mix of business. In 2015 and 2014, operating profit and operating profit margin includes $150 million and $68 million of reserve adjustments for estimated probable losses related to our controlled substance distribution claims and AWP litigation.
40
Technology Solutions: Operating profit and operating profit margin increased in 2016 primarily due to higher gross profit margin and a decrease in operating expenses as a percentage of revenue. Operating profit and operating profit margin for 2016 includes a $51 million pre-tax gain from the sale of our nurse triage business and $51 million of pre-tax charges associated with the Cost Alignment Plan. Operating profit margin increased in 2015 from 2014 primarily due to lower operating expenses as a percentage of revenues, partially offset by a decline in gross profit margin. In 2015 and 2014, operating profit and operating profit margin were unfavorably affected by $34 million and $57 million of charges associated with a depreciation and amortization catch-up related to 2014, and product alignment and impairment charges.
Corporate: Corporate expenses, net, increased over the last two years primarily due to higher operating expenses as previously discussed.
Interest Expense: Interest expense decreased in 2016 compared to the prior year primarily due to repayments of debt and certain foreign currency-denominated credit facilities. Interest expense increased in 2015 compared to the prior year primarily due to the March 2014 issuance of $4.1 billion of new debt to fund the acquisition of Celesio and due to interest on Celesio’s debt. Interest expense for 2014 also included $46 million of bridge loan fees associated with the initial funding of the acquisition of Celesio. Partially offsetting these increases, interest expense benefited from the repayment of debt in the fourth quarter of 2014.
Interest expense fluctuates based on timing, amounts and interest rates of term debt repaid and new term debt issued, as well as amounts incurred associated with financing fees.
Income Taxes
During 2016, 2015 and 2014, income tax expense related to continuing operations was $908 million, $815 million and $757 million, which included net discrete tax benefits of $42 million and $33 million in 2016 and 2015 and a net discrete tax expense of $94 million in 2014. Our reported income tax rates were 27.9%, 30.7% and 34.9% in 2016, 2015 and 2014. Fluctuations in our reported income tax rates are primarily due to changes within our business mix, including varying proportions of income attributable to foreign countries that have lower income tax rates, and discrete items.
Significant judgments and estimates are required in determining the consolidated income tax provision and evaluating income tax uncertainties. Although our major taxing jurisdictions include the U.S. and Canada, we are subject to income taxes in numerous foreign jurisdictions. Our income tax expense, deferred tax assets and liabilities and uncertain tax liabilities reflect management’s best assessment of estimated current and future taxes to be paid. We believe that we have made adequate provision for all income tax uncertainties.
We received reassessments from the Canada Revenue Agency (“CRA”) related to a transfer pricing matter impacting years 2003 through 2013. During 2016, we reached an agreement to settle the transfer pricing matter for years 2003 through 2013 and recorded a net discrete tax benefit of $8 million.
The Internal Revenue Service (“IRS”) is currently examining our U.S. corporation income tax returns for 2007 through 2009 and may issue a Revenue Agent Report during the first quarter of 2017. We believe that adequate amounts have been reserved for any adjustments that may ultimately result from these examinations, and we do not anticipate a significant impact to our gross unrecognized tax benefits. During 2015, we reached an agreement with the IRS to settle all outstanding issues relating to years 2003 through 2006 and recognized discrete tax benefits of $55 million to record previously unrecognized tax benefits and related interest.
41
Loss from Discontinued Operations, Net of Tax
Losses from discontinued operations, net of tax, were $32 million, $299 million and $156 million in 2016, 2015 and 2014.
In 2015, we committed to a plan to sell our Brazilian pharmaceutical distribution business within our Distribution Solutions segment, which we acquired through our February 2014 acquisition of Celesio. Loss from discontinued operations, net for 2015 included $241 million of non-cash pre-tax ($235 million after-tax) impairment charges, which were recorded to reduce the carrying value of this business to its estimated fair value, less costs to sell. On January 31, 2016, we entered into an agreement to sell the Brazilian pharmaceutical distribution business to a third party. The sale is expected to be completed during the first half of 2017, subject to regulatory approval and customary closing conditions. We expect to recognize an after-tax charge of approximately $80 million to $100 million upon the disposition of the business within discontinued operations as a result of settlement of certain indemnifications.
Loss from discontinued operations, net for 2015 also included a pre-tax and after-tax loss of $6 million from the sale of a software business within our International Technology business. Loss from discontinued operations, net for 2014, included a pre-tax and after-tax loss of $5 million and $7 million within our discontinued operations from the sale of our Hospital Automation business. Additionally, during 2014, we recorded an $80 million non-cash pre-tax and after-tax impairment charge to reduce the carrying value of our International Technology business to its estimated fair value less costs to sell. Refer to Financial Note 9, “Discontinued Operations,” to the consolidated financial statements appearing in this Annual Report on Form 10-K for additional information.
Net Income (Loss) Attributable to Noncontrolling Interests: Net income attributable to noncontrolling interests for 2016 and 2015 primarily represents the guaranteed dividends and the annual recurring compensation that we are obligated to pay to the noncontrolling shareholders of Celesio under the Domination Agreement. Net loss attributable to noncontrolling interests for 2014 primarily represents the portion of Celesio’s net loss that was not allocable to McKesson Corporation. Refer to Financial Note 10, “Noncontrolling Interests and Redeemable Noncontrolling Interests,” to the consolidated financial statements appearing in this Annual Report on Form 10-K for additional information.
Net Income Attributable to McKesson Corporation: Net income attributable to McKesson Corporation was $2,258 million, $1,476 million and $1,263 million in 2016, 2015 and 2014 and diluted earnings per common share were $9.70, $6.27 and $5.41.
Weighted Average Diluted Common Shares Outstanding: Diluted earnings per common share was calculated based on a weighted average number of shares outstanding of 233 million, 235 million and 233 million for 2016, 2015 and 2014. Weighted average diluted common shares outstanding is affected by the exercise and settlement of share-based awards and in 2016 and 2014, the cumulative effect of share repurchases.
Foreign Operations
Our foreign operations represented approximately 17%, 20% and 11% of our consolidated revenues in 2016, 2015 and 2014. Foreign operations are subject to certain risks, including currency fluctuations. We monitor our operations and adopt strategies responsive to changes in the economic and political environment in each of the countries in which we operate. We conduct our business worldwide in local currencies including Euro, British pound sterling and Canadian dollar. As a result, the comparability of our results reported in U.S. dollars can be affected by changes in foreign currency exchange rates. In discussing our operating results, we may use the term “foreign currency effect”, which refers to the effect of changes in foreign currency exchange rates used to convert the local currency results of foreign countries where the functional currency is not the U.S. dollar. We present this information to provide a framework for assessing how our business performed excluding the effect of foreign currency rate fluctuations. In computing foreign currency effect, we translate our current year results in local currencies into U.S dollars by applying average foreign exchange rates of the corresponding prior year periods, and we subsequently compare those results to the previously reported results of the comparable prior year periods in U.S. dollars. Additional information regarding our foreign operations is included in Financial Note 27, “Segments of Business,” to the consolidated financial statements appearing in this Annual Report on Form 10-K.
42
Business Combinations
Refer to Financial Notes 2 and 16, “Business Combinations” and “Debt and Financing Activities,” to the consolidated financial statements appearing in this Annual Report on Form 10-K for additional information.
2017 Outlook
Information regarding the Company’s 2017 outlook is contained in our Form 8-K dated May 5, 2016. This Form 8-K should be read in conjunction with the sections Item 1 - Business - Forward-Looking Statements and Item 1A - Risk Factors in Part I of this Annual Report on Form 10-K.
43
CRITICAL ACCOUNTING POLICIES AND ESTIMATES
We consider an accounting estimate to be critical if the estimate requires us to make assumptions about matters that were uncertain at the time the accounting estimate was made and if different estimates that we reasonably could have used in the current period, or changes in the accounting estimate that are reasonably likely to occur from period to period, could have a material impact on our financial condition or results from operations. Below are the estimates that we believe are critical to the understanding of our operating results and financial condition. Other accounting policies are described in Financial Note 1, “Significant Accounting Policies,” to the consolidated financial statements appearing in this Annual Report on Form 10-K. Because of the uncertainty inherent in such estimates, actual results may differ from these estimates.
Allowance for Doubtful Accounts: We provide short-term credit and other customer financing arrangements to customers who purchase our products and services. Other customer financing primarily relates to guarantees provided to our customers, or their creditors, regarding the repurchase of inventories. We also provide financing to certain customers related to the purchase of pharmacies, which serve as collateral for the loans. We estimate the receivables for which we do not expect full collection based on historical collection rates and specific knowledge regarding the current creditworthiness of our customers and record an allowance in our consolidated financial statements for these amounts.
In determining the appropriate allowance for doubtful accounts, which includes general and specific reserves, the Company reviews accounts receivable aging, industry trends, customer financial strength, credit standing, historical write-off trends and payment history to assess the probability of collection. If the frequency and severity of customer defaults due to our customers’ financial condition or general economic conditions change, our allowance for uncollectible accounts may require adjustment. As a result, we continuously monitor outstanding receivables and other customer financing and adjust allowances for accounts where collection may be in doubt. During 2016, sales to our ten largest customers, including group purchasing organizations (“GPOs”) accounted for approximately 52.4% of our total consolidated revenues. Sales to our largest customer, CVS Health (“CVS”), accounted for approximately 20.3% of our total consolidated revenues. At March 31, 2016, trade accounts receivable from our ten largest customers were approximately 32% of total trade accounts receivable. Accounts receivable from CVS were approximately 18% of total trade accounts receivable. As a result, our sales and credit concentration is significant. We also have agreements with GPOs, each of which functions as a purchasing agent on behalf of member hospitals, pharmacies and other healthcare providers, as well as with government entities and agencies. The accounts receivables balances are with individual members of the GPOs, and therefore no significant concentration of credit risk exists. A material default in payment, a material reduction in purchases from these or any other large customers, or the loss of a large customer or GPO could have a material adverse impact on our financial position, results of operations and liquidity.
Reserve methodologies are assessed annually based on historical losses and economic, business and market trends. In addition, reserves are reviewed quarterly and updated if unusual circumstances or trends are present. We believe the reserves maintained and expenses recorded in 2016 are appropriate and consistent with historical methodologies employed. At this time, we are not aware of any internal process or customer issues that might lead to a significant increase in our allowance for doubtful accounts as a percentage of net revenue in the foreseeable future.
At March 31, 2016, trade and notes receivables were $14,685 million prior to allowances of $212 million. In 2016, 2015 and 2014, our provision for bad debts was $113 million, $67 million and $36 million. At March 31, 2016 and 2015, the allowance as a percentage of trade and notes receivables was 1.4% and 1.1%. An increase or decrease of a hypothetical 0.1% in the 2016 allowance as a percentage of trade and notes receivables would result in an increase or decrease in the provision for bad debts of approximately $15 million. The selected 0.1% hypothetical change does not reflect what could be considered the best or worst case scenarios. Additional information concerning our allowance for doubtful accounts may be found in Schedule II included in this Annual Report on Form 10-K.
Inventories: We report inventories at the lower of cost or market (“LCM”). Inventories for our Distribution Solutions segment consist of merchandise held for resale. For our Distribution Solutions segment, the majority of the cost of domestic inventories is determined using the LIFO method. The majority of the cost of inventories held in foreign locations is based on weighted average purchase price using the first-in, first-out method (“FIFO”). Technology Solutions segment inventories consist of computer hardware with cost generally determined by the standard cost method, which approximates average cost. Rebates, cash discounts and other incentives received from vendors relating to the purchase or distribution of inventory are considered as product discounts and are accounted for as a reduction in the cost of inventory and are recognized when the inventory is sold. Total inventories were $15.3 billion and $14.3 billion at March 31, 2016 and 2015.
44
The LIFO method was used to value approximately 74% and 73% of our inventories at March 31, 2016 and 2015. If we had used the FIFO method of inventory valuation, which approximates current replacement costs, inventories would have been approximately $1,012 million and $768 million higher than the amounts reported at March 31, 2016 and 2015. These amounts are equivalent to our LIFO reserves. Our LIFO valuation amount includes both pharmaceutical and non-pharmaceutical products. In 2016, 2015, and 2014, we recognized net LIFO expense of $244 million, $337 million and $311 million within our consolidated statements of operations. A LIFO expense is recognized when the net effect of price increases on pharmaceutical and non-pharmaceutical products held in inventory exceeds the impact of price declines including the effect of branded pharmaceutical products that have lost market exclusivity. A LIFO credit is recognized when the net effect of price declines exceeds the impact of price increases on pharmaceutical and non-pharmaceutical products held in inventory.
We believe that the average inventory costing method provides a reasonable estimation of the current cost of replacing inventory (i.e., “market”). As such, our LIFO inventory is valued at the lower of LIFO or market. As of March 31, 2016 and 2015, inventories at LIFO did not exceed market.
In determining whether inventory valuation issues exist, we consider various factors including estimated quantities of slow-moving inventory by reviewing on-hand quantities, outstanding purchase obligations and forecasted sales. Shifts in market trends and conditions, changes in customer preferences due to the introduction of generic drugs or new pharmaceutical products or the loss of one or more significant customers are factors that could affect the value of our inventories. We write down inventories which are considered excess and obsolete as a result of these reviews. These factors could make our estimates of inventory valuation differ from actual results.
Business Combinations: We account for acquired businesses using the acquisition method of accounting, which requires that once control of a business is obtained, 100% of the assets acquired and liabilities assumed, including amounts attributed to noncontrolling interests, be recorded at the date of acquisition at their respective fair values. Any excess of the purchase price over the estimated fair values of the net assets acquired is recorded as goodwill. Acquisition-related expenses and related restructuring costs are expensed as incurred.
Several valuation methods may be used to determine the fair value of assets acquired and liabilities assumed. For intangible assets, we typically use the income method. This method starts with a forecast of all of the expected future net cash flows associated with each asset. These cash flows are then adjusted to present value by applying an appropriate discount rate that reflects the risk factors associated with the cash flow streams. Some of the more significant estimates and assumptions inherent in the income method or other methods include the amount and timing of projected future cash flows, the discount rate selected to measure the risks inherent in the future cash flows and the assessment of the asset’s life cycle and the competitive trends impacting the asset, including consideration of any technical, legal, regulatory, or economic barriers to entry. Determining the useful life of an intangible asset also requires judgment as different types of intangible assets will have different useful lives and certain assets may even be considered to have indefinite useful lives. Refer to Financial Note 2, “Business Combinations,” to the consolidated financial statements appearing in this Annual Report on Form 10-K for additional information regarding our acquisitions.
Goodwill and Intangible Assets: As a result of acquiring businesses, we have $9,786 million and $9,817 million of goodwill at March 31, 2016 and 2015 and $3,021 million and $3,441 million of intangible assets, net at March 31, 2016 and 2015. We maintain goodwill assets on our books unless the assets are considered to be impaired. We perform an impairment test on goodwill balances annually in the fourth quarter or more frequently if indicators for potential impairment exist. Indicators that are considered include significant changes in performance relative to expected operating results, significant changes in the use of the assets, significant negative industry or economic trends, or a significant decline in the Company’s stock price and/or market capitalization for a sustained period of time.
Goodwill impairment testing is conducted at the reporting unit level, which is generally defined as a component — one level below our Distribution Solutions and Technology Solutions operating segments, for which discrete financial information is available and segment management regularly reviews the operating results of that reporting unit.
45
The first step in goodwill testing requires us to compare the estimated fair value of a reporting unit to its carrying value. This step may be performed utilizing either a qualitative or quantitative assessment. If the carrying value of the reporting unit is lower than its estimated fair value, no further evaluation is necessary. If the carrying value of the reporting unit is higher than its estimated fair value, the second step must be performed to measure the amount of impairment loss. Under the second step, the implied fair value of goodwill is calculated in a hypothetical analysis by subtracting the fair value of all assets and liabilities of the reporting unit, including any unrecognized intangibles assets, from the fair value of the reporting unit calculated in the first step of the impairment test. If the carrying value of goodwill for the reporting unit exceeds the implied fair value of goodwill, an impairment charge is recorded for that excess.
To estimate the fair value of our reporting units, we use a combination of the market approach and the income approach. Under the market approach, we estimate fair value by comparing the business to similar businesses, or guideline companies whose securities are actively traded in public markets. Under the income approach, we use a discounted cash flow model in which cash flows anticipated over several periods, plus a terminal value at the end of that time horizon, are discounted to their present value using an appropriate expected rate of return. In addition, we compare the aggregate of the reporting units’ fair values to our market capitalization as further corroboration of the fair values.
Some of the more significant estimates and assumptions inherent in the goodwill impairment estimation process using the market approach include the selection of appropriate guideline companies, the determination of market value multiples for both the guideline companies and the reporting unit, the determination of applicable premiums and discounts based on any differences in marketability between the business and the guideline companies and for the income approach, the required rate of return used in the discounted cash flow method, which reflects capital market conditions and the specific risks associated with the business. Other estimates inherent in both the market and income approaches include long-term growth rates, projected revenues and earnings and cash flow forecasts for the reporting units.
Estimates of fair value result from a complex series of judgments about future events and uncertainties and rely heavily on estimates and assumptions at a point in time. Judgments made in determining an estimate of fair value may materially impact our results of operations. The valuations are based on information available as of the impairment review date and are based on expectations and assumptions that have been deemed reasonable by management. Any changes in key assumptions, including failure to meet business plans, a further deterioration in the market or other unanticipated events and circumstances, may affect the accuracy or validity of such estimates and could potentially result in an impairment charge. In 2016, 2015 and 2014, we concluded that there were no impairments of goodwill as the fair value of each reporting unit exceeded its carrying value.
Currently, all of our intangible assets are subject to amortization and are amortized based on the pattern of their economic consumption or on a straight-line basis over their estimated useful lives, ranging from one to thirty-eight years. We review intangible assets for impairment whenever events or changes in circumstances indicate that the carrying value of the assets may not be recoverable. Determination of recoverability is based on the lowest level of identifiable estimated future undiscounted cash flows resulting from use of the asset and its eventual disposition. Measurement of any impairment loss is based on the excess of the carrying value of the asset over its fair value. Assumptions and estimates about future values and remaining useful lives of our purchased intangible assets are complex and subjective. They can be affected by a variety of factors, including external factors such as industry and economic trends, and internal factors such as changes in our business strategy and our internal forecasts. There were no material impairments of intangibles in 2016, 2015 or 2014 within our continuing operations. Our ongoing consideration of all the factors described previously could result in impairment charges in the future, which could adversely affect our net income.
Supplier Reserves: We establish reserves against amounts due from suppliers relating to various price and rebate incentives, including deductions or billings taken against payments otherwise due to them. These reserve estimates are established based on judgment after considering the status of current outstanding claims, historical experience with the suppliers, the specific incentive programs and any other pertinent information available. We evaluate the amounts due from suppliers on a continual basis and adjust the reserve estimates when appropriate based on changes in factual circumstances. As of March 31, 2016 and 2015, supplier reserves were $144 million and $167 million. The final outcome of any outstanding claims may differ from our estimate. All of the supplier reserves at March 31, 2016 and 2015 pertain to our Distribution Solutions segment. An increase or decrease in the supplier reserve as a hypothetical 0.1% of trade payables at March 31, 2016 would result in an increase or decrease in the cost of sales of approximately $29 million in 2016. The selected 0.1% hypothetical change does not reflect what could be considered the best or worst case scenarios.
46
Income Taxes: Our income tax expense and deferred tax assets and liabilities reflect management’s best assessment of estimated current and future taxes to be paid. We are subject to income taxes in the U.S. and numerous foreign jurisdictions. Significant judgments and estimates are required in determining the consolidated income tax provision and in evaluating income tax uncertainties. We review our tax positions at the end of each quarter and adjust the balances as new information becomes available.
Deferred income taxes arise from temporary differences between the tax and financial statement recognition of revenue and expense. In evaluating our ability to recover our deferred tax assets, we consider all available positive and negative evidence including our past operating results, the existence of cumulative net operating losses in the most recent years and our forecast of future taxable income. In estimating future taxable income, we develop assumptions including the amount of future federal, state and foreign pre-tax operating income, the reversal of temporary differences and the implementation of feasible and prudent tax planning strategies. These assumptions require significant judgment about the forecasts of future taxable income and are consistent with the plans and estimates we use to manage the underlying businesses. We had deferred income tax assets (net of valuation allowances) of $1,272 million and $1,189 million at March 31, 2016 and 2015 and deferred tax liabilities of $3,947 million and $3,791 million. Deferred tax assets primarily consist of timing differences on our compensation and benefit related accruals and net operating loss and credit carryforwards. Deferred tax liabilities primarily consist of basis differences for inventory valuation (including inventory valued at LIFO) and intangible assets. We established valuation allowances of $267 million and $229 million for 2016 and 2015 against certain deferred tax assets, which primarily relate to state and foreign net operating loss carryforwards for which the ultimate realization of future benefits is uncertain. Changes in tax laws and rates could also affect recorded deferred tax assets and liabilities in the future. Should tax laws change, including those laws pertaining to LIFO, our cash flows could be materially impacted.
In addition, the calculation of our tax liabilities includes estimates for uncertainties in the application of complex tax regulations across multiple global jurisdictions where we conduct our operations. We recognize liabilities for tax and related interest for issues in the U.S. and other tax jurisdictions based on our estimate of whether, and the extent to which, additional taxes and related interest will be due. These tax liabilities and related interest are reflected net of the impact of related tax loss carryforwards, as such tax loss carryforwards will be applied against these tax liabilities and will reduce the amount of cash tax payments due upon the eventual settlement with the tax authorities. These estimates may change due to changing facts and circumstances; however, due to the complexity of these uncertainties, the ultimate resolution may result in a settlement that differs from our current estimate of tax liabilities and related interest. If our current estimate of tax and interest liabilities is less than the ultimate settlement, an additional charge to income tax expense may result. If our current estimate of tax and interest liabilities is more than the ultimate settlement, a reduction to income tax expense may be recognized.
An increase or decrease of a hypothetical 1% in our 2016 effective tax rate as applied to income from continuing operations would result in an increase or decrease in the provision for income taxes of approximately $33 million for 2016.
Loss Contingencies: We are subject to various claims, including claims with customers and vendors, pending and potential legal actions for damages, investigations relating to governmental laws and regulations and other matters arising out of the normal conduct of our business. When a loss is considered probable and reasonably estimable, we record a liability in the amount of our best estimate for the ultimate loss. However, the likelihood of a loss with respect to a particular contingency is often difficult to predict and determining a meaningful estimate of the loss or a range of loss may not be practicable based on the information available and the potential effect of future events and decisions by third parties that will determine the ultimate resolution of the contingency. Moreover, it is not uncommon for such matters to be resolved over many years, during which time relevant developments and new information must be reevaluated at least quarterly to determine both the likelihood of potential loss and whether it is possible to reasonably estimate a range of possible loss. When a loss is probable but a reasonable estimate cannot be made, disclosure of the proceeding is provided.
Disclosure is also provided when it is reasonably possible that a loss will be incurred or when it is reasonably possible that the amount of a loss will exceed the recorded provision. We review all contingencies at least quarterly to determine whether the likelihood of loss has changed and to assess whether a reasonable estimate of the loss or range of the loss can be made. As discussed above, development of a meaningful estimate of loss or a range of potential loss is complex when the outcome is directly dependent on negotiations with or decisions by third parties, such as regulatory agencies, the court system and other interested parties. Such factors bear directly on whether it is possible to reasonably estimate a range of potential loss and boundaries of high and low estimate.
47
FINANCIAL CONDITION, LIQUIDITY AND CAPITAL RESOURCES
We expect our available cash generated from operations and our short-term investment portfolio, together with our existing sources of liquidity from our revolving credit facilities, accounts receivable factoring facilities and commercial paper issuance, will be sufficient to fund our long-term and short-term capital expenditures, working capital and other cash requirements. In addition, we may access the long-term debt capital markets from time to time. We are in the process of acquiring certain businesses, and the cost of these acquisitions may be partially funded through the issuance of debt.
Net cash flow from operating activities was $3,672 million in 2016 compared to $3,112 million in 2015 and $3,136 million in 2014. Operating activities over the last three years were affected by an increase in drafts and accounts payable reflecting longer payment terms for certain purchases and increases in receivables and inventories primarily associated with our revenue growth. Cash flows from operations can be significantly impacted by factors such as the timing of receipts from customers and payments to vendors. Additionally, working capital is primarily a function of sales and purchase volumes, inventory requirements and vendor payment terms.
Net cash used in investing activities was $1,557 million in 2016 compared to $677 million in 2015 and $5,046 million in 2014. Investing activities for 2016 include $40 million of net cash payments for acquisitions, $488 million and $189 million in capital expenditures for property, plant and equipment, and capitalized software, and $210 million of net cash proceeds from sales of businesses. Additionally, we prepaid $939 million for acquisitions that closed subsequent to year end.
Investing activities for 2015 included $170 million of net cash payments for acquisitions, $376 million and $169 million in capital expenditures for property, plant and equipment, and capitalized software, and $15 million of cash proceeds from sales of our automation business and an equity investment. Investing activities for 2014 included $4,634 million of net cash payments for acquisitions, including $4,497 million for our acquisition of Celesio. Investing activities in 2014 also included $278 million and $141 million in capital expenditures for property, plant and equipment, and capitalized software, and $97 million of cash proceeds from sales of our automation business and equity investment.
Financing activities utilized $3,453 million and $968 million of cash in 2016 and 2015 and generated net cash of $3,619 million in 2014. Financing activities for 2016 include cash receipts of $1,561 million and payments of $1,688 million from short-term borrowings. We made repayments on long-term debt of $1,598 million in 2016. Financing activities in 2016 also include $1,504 million of cash paid for stock repurchases and $244 million of dividends paid.
Financing activities for 2015 include cash receipts of $3,100 million and payments of $3,152 million from short-term borrowings. Long-term debt repayments in 2015 were primarily cash paid on promissory notes. Financing activities in 2015 also reflect a cash payment of $32 million to acquire approximately 1 million additional common shares of Celesio through the tender offers we completed in 2015. Additionally, financing activities for 2015 include $340 million of cash paid for stock repurchases and $227 million of dividends paid.
Financing activities for 2014 include cash receipts of $6,080 million and cash paid of $6,132 million from short-term borrowings, which includes $4,957 million in borrowings under a senior bridge loan facility in connection with our acquisition of Celesio and $400 million under our accounts receivable sales facility in February 2014. These borrowings were fully repaid in March 2014. Financing activities for 2014 also include cash receipts of $4,124 million from the issuance of long-term debt in March 2014 and cash paid of $348 million for repayments of long-term debt. Additionally, financing activities for 2014 included $130 million of cash payments for stock repurchases and $214 million of dividends paid.
The Company’s Board has authorized the repurchase of McKesson’s common stock from time-to-time in open market transactions, privately negotiated transactions, accelerated share repurchase (“ASR”) programs, or by any combination of such methods. The timing of any repurchases and the actual number of shares repurchased will depend on a variety of factors, including our stock price, corporate and regulatory requirements, restrictions under our debt obligations and other market and economic conditions.
The Board authorized the repurchase of the Company’s common stock up to $2 billion in October 2015 and up to $500 million in May 2015. In 2016, we repurchased 8.7 million of our shares through both an ASR program and open market transactions, and in 2015 repurchased 1.5 million of our shares all through open market transactions. All share repurchases were funded with cash on hand.
48
Years Ended March 31, | |||||||||||
(In millions, except per share data) | 2016 | 2015 | 2014 | ||||||||
Number of shares repurchased (1) | 8.7 | 1.5 | — | ||||||||
Average price paid per share | $ | 173.64 | $ | 226.55 | $ | — | |||||
Total value of shares repurchased (1) | $ | 1,504 | $ | 340 | $ | — | |||||
(1) | Excludes shares surrendered for tax withholding. |
At March 31, 2016, the total authorization outstanding was $1.0 billion available under the October 2015 share repurchase plan for future repurchases of the Company’s common stock.
We believe that our operating cash flow, financial assets and current access to capital and credit markets, including our existing credit facilities, will give us the ability to meet our financing needs for the foreseeable future. However, there can be no assurance that continued or increased volatility and disruption in the global capital and credit markets will not impair our liquidity or increase our costs of borrowing.
Selected Measures of Liquidity and Capital Resources:
March 31, | ||||||||||||||
(Dollars in millions) | 2016 | 2015 | 2014 | |||||||||||
Cash and cash equivalents | $ | 4,048 | $ | 5,341 | $ | 4,193 | ||||||||
Working capital | 3,366 | 3,173 | 3,221 | |||||||||||
Debt to capital ratio (1) | 43.7 | % | 50.3 | % | 55.4 | % | ||||||||
Return on McKesson stockholders’ equity (2) | 26.0 | 17.0 | 16.2 | |||||||||||
(1) | Ratio is computed as total debt divided by the sum of total debt and McKesson stockholders’ equity, which excludes noncontrolling and redeemable noncontrolling interests and accumulated other comprehensive income (loss). |
(2) | Ratio is computed as net income attributable to McKesson Corporation for the last four quarters, divided by a five-quarter average of McKesson stockholders’ equity, which excludes noncontrolling and redeemable noncontrolling interests. |
Cash equivalents, which are available-for-sale, are carried at fair value. Cash equivalents are primarily invested in AAA rated prime and U.S. government money market funds denominated in U.S. dollars, AAA rated prime money market funds denominated in Euros, overnight repurchase agreements collateralized by U.S. government securities, Canadian government securities and/or securities that are guaranteed or sponsored by the U.S. government and an AAA rated prime money market fund denominated in British pound sterling.
The remaining cash and cash equivalents are deposited with several financial institutions. We mitigate the risk of our short-term investment portfolio by depositing funds with reputable financial institutions and monitoring risk profiles and investment strategies of money market funds.
Our cash and cash equivalents balance as of March 31, 2016 included approximately $2.2 billion of cash held by our subsidiaries outside of the United States. Our primary intent is to utilize this cash in foreign operations and acquisitions as well as to fund certain research and development activities for an indefinite period of time. Although the vast majority of cash held outside the United States is available for repatriation, doing so could subject us to U.S. federal, state and local income tax.
Working capital primarily includes cash and cash equivalents, receivables and inventories net of drafts and accounts payable, short-term borrowings, current portion of long-term debt, deferred revenue and other current liabilities. Our Distribution Solutions segment requires a substantial investment in working capital that is susceptible to large variations during the year as a result of inventory purchase patterns and seasonal demands. Inventory purchase activity is a function of sales activity and other requirements.
Consolidated working capital increased at March 31, 2016 compared to March 31, 2015 primarily due to increases in receivables and inventories and a decrease in deferred tax liabilities, partially offset by an increase in drafts and accounts payable. Consolidated working capital decreased at March 31, 2015 compared to March 31, 2014 primarily due to increases in drafts and accounts payable, partially offset by increases in receivables and inventories.
49
Our debt to capital ratio improved over the last two years primarily due to a decrease in our debt.
In July 2015, the quarterly dividend was raised from $0.24 to $0.28 per common share for dividends declared after such date, until further action by the Board. Dividends were $1.08 per share in 2016, $0.96 per share in 2015 and $0.92 per share in 2014. The Company anticipates that it will continue to pay quarterly cash dividends in the future. However, the payment and amount of future dividends remain within the discretion of the Board and will depend upon the Company’s future earnings, financial condition, capital requirements and other factors. In 2016, 2015 and 2014, we paid total cash dividends of $244 million, $227 million and $214 million. Additionally, as required under the Domination Agreement, we are obligated to pay an annual recurring compensation amount of €0.83 per Celesio share (effective January 1, 2015) to the noncontrolling shareholders of Celesio.
Contractual Obligations:
The table and information below presents our significant financial obligations and commitments at March 31, 2016:
Years | |||||||||||||||||||
(In millions) | Total | Within 1 | Over 1 to 3 | Over 3 to 5 | After 5 | ||||||||||||||
On balance sheet | |||||||||||||||||||
Long-term debt (1) | $ | 8,147 | $ | 1,612 | $ | 2,550 | $ | 5 | $ | 3,980 | |||||||||
Other (2) (3) | 643 | 198 | 269 | 54 | 122 | ||||||||||||||
Off balance sheet | |||||||||||||||||||
Interest on borrowings (4) | 2,725 | 298 | 456 | 322 | 1,649 | ||||||||||||||
Purchase obligations (5) | 4,750 | 4,668 | 68 | 14 | — | ||||||||||||||
Operating lease obligations (6) | 1,970 | 363 | 561 | 377 | 669 | ||||||||||||||
Other (7) | 340 | 194 | 18 | 24 | 104 | ||||||||||||||
Total | $ | 18,575 | $ | 7,333 | $ | 3,922 | $ | 796 | $ | 6,524 | |||||||||
(1) | Represents maturities of the Company’s long-term obligations including an immaterial amount of capital lease obligations. |
(2) | Includes our estimated benefit payments, including assumed executive lump sum payments, for the unfunded benefit plans and minimum funding requirements for the pension plans. Actual lump sum payments could significantly differ from the estimated amounts depending on the timing of executive retirements and the lump sum interest rate in effect upon retirement. |
(3) | Includes our estimated severance payments associated with the Cost Alignment Plan. |
(4) | Primarily represents interest that will become due on our fixed rate long-term debt obligations. |
(5) | A purchase obligation is defined as an arrangement to purchase goods or services that is enforceable and legally binding on the Company. These obligations primarily relate to inventory purchases, capital commitments and outsourcing service agreements. |
(6) | Represents minimum rental payments for operating leases. |
(7) | Includes agreements under which we have guaranteed the repurchase of our customers’ inventory and our customers’ debt in the event these customers are unable to meet their obligations to those financial institutions. |
The contractual obligations table above excludes the following obligations:
At March 31, 2016, the liability recorded for uncertain tax positions, excluding associated interest and penalties, was approximately $409 million. The ultimate amount and timing of any related future cash settlements cannot be predicted with reasonable certainty.
Our banks and insurance companies have issued $142 million of standby letters of credit and surety bonds at March 31, 2016. These were issued on our behalf and are mostly related to our customer contracts and to meet the security requirements for statutory licenses and permits, court and fiduciary obligations and our workers’ compensation and automotive liability programs.
As of March 31, 2016, we have entered into agreements to acquire companies of which approximately $3.4 billion is anticipated to be paid in 2017; of this amount, $0.7 billion was paid in April 2017.
50
The carrying value of redeemable noncontrolling interests related to Celesio was $1.41 billion at March 31, 2016, which exceeded the maximum redemption value of $1.28 billion. The balance of redeemable noncontrolling interests is reported at the greater of its carrying value or its maximum redemption value at each reporting date. Upon the effectiveness of the Domination Agreement on December 2, 2014, the noncontrolling shareholders of Celesio received a put right that enables them to put their Celesio shares to McKesson at €22.99 per share, which price is increased annually for interest in the amount of 5 percentage points above a base rate published by the German Bundesbank semiannually, less any compensation amount or guaranteed dividend already paid (“Put Amount”). The redemption value is the Put Amount adjusted for exchange rate fluctuations each period. The ultimate amount and timing of any future cash payments related to the Put Amount are uncertain.
Additionally, we are obligated to pay an annual recurring compensation of €0.83 per Celesio share (the “Compensation Amount”) to the noncontrolling shareholders of Celesio under the Domination Agreement, which became effective in December 2014. The Compensation Amount is recognized ratably during the applicable annual period. The Domination Agreement does not have an expiration date and can be terminated by McKesson without cause in writing no earlier than March 31, 2020.
Refer to Financial Note 10, “Noncontrolling Interests and Redeemable Noncontrolling Interests,” to the consolidated financial statements appearing in this Annual Report on Form 10-K for additional information.
Credit Resources:
We fund our working capital requirements primarily with cash and cash equivalents as well as short-term borrowings from our credit facilities and commercial paper issuances. Funds necessary for future debt maturities and our other cash requirements are expected to be met by existing cash balances, cash flow from operations, existing credit sources and other capital market transactions. Detailed information regarding our debt and financing activities is included in Financial Note 16, “Debt and Financing Activities,” to the consolidated financial statements appearing in this Annual Report on Form 10-K.
RELATED PARTY BALANCES AND TRANSACTIONS
Information regarding our related party balances and transactions is included in Financial Note 26, “Related Party Balances and Transactions,” to the consolidated financial statements appearing in this Annual Report on Form 10-K.
NEW ACCOUNTING PRONOUNCEMENTS
New accounting pronouncements that we have recently adopted, as well as those that have been recently issued but not yet adopted by us, are included in Financial Note 1, “Significant Accounting Policies,” to the consolidated financial statements appearing in this Annual Report on Form 10-K.
51
Item 7A. | Quantitative and Qualitative Disclosures about Market Risk |
Interest rate risk: Our long-term debt bears interest predominately at fixed rates, whereas our short-term borrowings are at variable interest rates. At March 31, 2016, we had $35 million in outstanding debt with variable interest rates.
Our cash and cash equivalents balances earn interest at variable rates. At March 31, 2016, we had $4 billion in cash and cash equivalents. The effect of a hypothetical 50 bp increase in the underlying interest rate on our cash and cash equivalents, net of short-term borrowings and variable rate debt, would have resulted in a favorable impact to earnings in 2016 and 2015 of approximately $26 million and $19 million.
Foreign exchange risk: We conduct our business worldwide in U.S. dollars and the functional currencies of our foreign subsidiaries, including Euro, British pound sterling and Canadian dollar. Changes in foreign currency exchange rates could have a material adverse impact on our financial results that are reported in U.S. dollars. We are also exposed to foreign exchange rate risk related to our foreign subsidiaries, including intercompany loans denominated in non-functional currencies.
We have certain foreign exchange rate risk programs that use foreign currency forward contracts and cross currency swaps. The forward contracts and cross currency swaps are designated to reduce the income statement effects from fluctuations in foreign exchange rates and have been designated as cash flow hedges. These programs reduce but do not entirely eliminate foreign exchange risk.
As of March 31, 2016 and 2015, the effect of a hypothetical adverse 10% change in the underlying foreign currency exchange rates would have impacted the fair value of our foreign exchange contracts by approximately $131 million and $223 million. However, our risk management programs are designed such that the potential loss in value of these risk management portfolios described above would be largely offset by changes in the value of the underlying exposure. Refer to Financial Note 20, “Hedging Activities,” for more information on our foreign currency forward contracts and cross currency swaps.
The selected hypothetical change in interest rates and foreign currency exchange rates does not reflect what could be considered the best or worst case scenarios.
52
McKESSON CORPORATION
Item 8. | Financial Statements and Supplementary Data |
INDEX TO CONSOLIDATED FINANCIAL INFORMATION
Page | |
Consolidated Financial Statements: | |
53
McKESSON CORPORATION
MANAGEMENT’S ANNUAL REPORT ON INTERNAL CONTROL OVER FINANCIAL REPORTING
The management of McKesson Corporation is responsible for establishing and maintaining an adequate system of internal control over financial reporting, as such term is defined in Exchange Act Rules 13a-15(f) and 15d-15(f). With the participation of the Chief Executive Officer and the Chief Financial Officer, our management conducted an assessment of the effectiveness of our internal control over financial reporting based on the framework and criteria established in Internal Control—Integrated Framework (2013), issued by the Committee of Sponsoring Organizations of the Treadway Commission. Based on this assessment, our management has concluded that our internal control over financial reporting was effective as of March 31, 2016.
Deloitte & Touche LLP, an independent registered public accounting firm, audited the financial statements included in this Annual Report on Form 10-K and has also audited the effectiveness of the Company’s internal control over financial reporting as of March 31, 2016. This audit report appears on page 55 of this Annual Report on Form 10-K.
May 5, 2016
/s/ John H. Hammergren |
John H. Hammergren |
Chairman of the Board, President and Chief Executive Officer |
(Principal Executive Officer) |
/s/ James A. Beer |
James A. Beer |
Executive Vice President and Chief Financial Officer |
(Principal Financial Officer) |
54
McKESSON CORPORATION
REPORT OF INDEPENDENT REGISTERED PUBLIC ACCOUNTING FIRM
To the Board of Directors and Stockholders of
McKesson Corporation
San Francisco, California
We have audited the accompanying consolidated balance sheets of McKesson Corporation and subsidiaries (the “Company”) as of March 31, 2016 and 2015, and the related consolidated statements of operations, comprehensive income, stockholders’ equity, and cash flows for each of the three fiscal years in the period ended March 31, 2016. Our audits also included the consolidated financial statement schedule listed in the Index at Item 15. We also have audited the Company’s internal control over financial reporting as of March 31, 2016, based on criteria established in Internal Control—Integrated Framework (2013) issued by the Committee of Sponsoring Organizations of the Treadway Commission. The Company’s management is responsible for these financial statements and financial statement schedule, for maintaining effective internal control over financial reporting, and for its assessment of the effectiveness of internal control over financial reporting, included in the accompanying Management’s Annual Report on Internal Control Over Financial Reporting. Our responsibility is to express an opinion on these financial statements and financial statement schedule, and an opinion on the Company’s internal control over financial reporting based on our audits.
We conducted our audits in accordance with the standards of the Public Company Accounting Oversight Board (United States). Those standards require that we plan and perform the audits to obtain reasonable assurance about whether the financial statements are free of material misstatement and whether effective internal control over financial reporting was maintained in all material respects. Our audits of the financial statements included examining, on a test basis, evidence supporting the amounts and disclosures in the financial statements, assessing the accounting principles used and significant estimates made by management, and evaluating the overall financial statement presentation. Our audit of internal control over financial reporting included obtaining an understanding of internal control over financial reporting, assessing the risk that a material weakness exists, and testing and evaluating the design and operating effectiveness of internal control based on the assessed risk. Our audits also included performing such other procedures as we considered necessary in the circumstances. We believe that our audits provide a reasonable basis for our opinions.
A company’s internal control over financial reporting is a process designed by, or under the supervision of, the company’s principal executive and principal financial officers, or persons performing similar functions, and effected by the company’s board of directors, management, and other personnel to provide reasonable assurance regarding the reliability of financial reporting and the preparation of financial statements for external purposes in accordance with generally accepted accounting principles. A company’s internal control over financial reporting includes those policies and procedures that (1) pertain to the maintenance of records that, in reasonable detail, accurately and fairly reflect the transactions and dispositions of the assets of the company; (2) provide reasonable assurance that transactions are recorded as necessary to permit preparation of financial statements in accordance with generally accepted accounting principles, and that receipts and expenditures of the company are being made only in accordance with authorizations of management and directors of the company; and (3) provide reasonable assurance regarding prevention or timely detection of unauthorized acquisition, use, or disposition of the company’s assets that could have a material effect on the financial statements.
Because of the inherent limitations of internal control over financial reporting, including the possibility of collusion or improper management override of controls, material misstatements due to error or fraud may not be prevented or detected on a timely basis. Also, projections of any evaluation of effectiveness of the internal control over financial reporting to future periods are subject to the risk that controls may become inadequate because of changes in conditions, or that the degree of compliance with the policies or procedures may deteriorate.
55
McKESSON CORPORATION
In our opinion, the consolidated financial statements referred to above present fairly, in all material respects, the financial position of McKesson Corporation and subsidiaries as of March 31, 2016 and 2015, and the results of their operations and their cash flows for each of the three years in the period ended March 31, 2016, in conformity with accounting principles generally accepted in the United States of America. Also, in our opinion, such financial statement schedule, when considered in relation to the basic consolidated financial statements taken as a whole, presents fairly, in all material respects, the information set forth therein. Also, in our opinion, the Company maintained, in all material respects, effective internal control over financial reporting as of March 31, 2016, based on the criteria established in Internal Control—Integrated Framework (2013) issued by the Committee of Sponsoring Organizations of the Treadway Commission.
As discussed in Note 1 to the financial statements, the Company early adopted the Financial Accounting Standards Board Accounting Standards Update No. 2015-17, Balance Sheet Classification of Deferred Taxes, as of March 31, 2016 on a prospective basis.
/s/ Deloitte & Touche LLP |
San Francisco, California |
May 5, 2016 |
56
McKESSON CORPORATION
CONSOLIDATED STATEMENTS OF OPERATIONS
(In millions, except per share amounts)
Years Ended March 31, | |||||||||||
2016 | 2015 | 2014 | |||||||||
Revenues | $ | 190,884 | $ | 179,045 | $ | 137,392 | |||||
Cost of Sales | (179,468 | ) | (167,634 | ) | (129,040 | ) | |||||
Gross Profit | 11,416 | 11,411 | 8,352 | ||||||||
Operating Expenses | |||||||||||
Selling, distribution and administrative expenses | (7,276 | ) | (7,901 | ) | (5,388 | ) | |||||
Research and development | (392 | ) | (392 | ) | (457 | ) | |||||
Restructuring charges | (203 | ) | — | — | |||||||
Claim and litigation charges | — | (150 | ) | (68 | ) | ||||||
Total Operating Expenses | (7,871 | ) | (8,443 | ) | (5,913 | ) | |||||
Operating Income | 3,545 | 2,968 | 2,439 | ||||||||
Other Income, Net | 58 | 63 | 32 | ||||||||
Interest Expense | (353 | ) | (374 | ) | (300 | ) | |||||
Income from Continuing Operations Before Income Taxes | 3,250 | 2,657 | 2,171 | ||||||||
Income Tax Expense | (908 | ) | (815 | ) | (757 | ) | |||||
Income from Continuing Operations | 2,342 | 1,842 | 1,414 | ||||||||
Loss from Discontinued Operations, Net of Tax | (32 | ) | (299 | ) | (156 | ) | |||||
Net Income | 2,310 | 1,543 | 1,258 | ||||||||
Net (Income) Loss Attributable to Noncontrolling Interests | (52 | ) | (67 | ) | 5 | ||||||
Net Income Attributable to McKesson Corporation | $ | 2,258 | $ | 1,476 | $ | 1,263 | |||||
Earnings (Loss) Per Common Share Attributable to McKesson Corporation | |||||||||||
Diluted | |||||||||||
Continuing operations | $ | 9.84 | $ | 7.54 | $ | 6.08 | |||||
Discontinued operations | (0.14 | ) | (1.27 | ) | (0.67 | ) | |||||
Total | $ | 9.70 | $ | 6.27 | $ | 5.41 | |||||
Basic | |||||||||||
Continuing operations | $ | 9.96 | $ | 7.66 | $ | 6.19 | |||||
Discontinued operations | (0.14 | ) | (1.29 | ) | (0.68 | ) | |||||
Total | $ | 9.82 | $ | 6.37 | $ | 5.51 | |||||
Weighted Average Common Shares | |||||||||||
Diluted | 233 | 235 | 233 | ||||||||
Basic | 230 | 232 | 229 | ||||||||
See Financial Notes
57
McKESSON CORPORATION
CONSOLIDATED STATEMENTS OF COMPREHENSIVE INCOME
(In millions)
Years Ended March 31, | |||||||||||
2016 | 2015 | 2014 | |||||||||
Net Income | $ | 2,310 | $ | 1,543 | $ | 1,258 | |||||
Other Comprehensive Income (Loss), Net of Tax | |||||||||||
Foreign currency translation adjustments arising during the period | 113 | (1,855 | ) | 53 | |||||||
Unrealized gains (losses) on cash flow hedges arising during the period | 9 | (10 | ) | (6 | ) | ||||||
Retirement-related benefit plans | 50 | (124 | ) | 36 | |||||||
Other Comprehensive Income (Loss), Net of Tax | 172 | (1,989 | ) | 83 | |||||||
Comprehensive Income (Loss) | 2,482 | (446 | ) | 1,341 | |||||||
Comprehensive (Income) Loss Attributable to Noncontrolling Interests | (72 | ) | 212 | (16 | ) | ||||||
Comprehensive Income (Loss) Attributable to McKesson Corporation | $ | 2,410 | $ | (234 | ) | $ | 1,325 | ||||
See Financial Notes
58
McKESSON CORPORATION
CONSOLIDATED BALANCE SHEETS
(In millions, except per share amounts)
March 31, | |||||||
2016 | 2015 | ||||||
ASSETS | |||||||
Current Assets | |||||||
Cash and cash equivalents | $ | 4,048 | $ | 5,341 | |||
Receivables, net | 17,980 | 15,914 | |||||
Inventories, net | 15,335 | 14,296 | |||||
Prepaid expenses and other | 1,074 | 1,119 | |||||
Total Current Assets | 38,437 | 36,670 | |||||
Property, Plant and Equipment, Net | 2,278 | 2,045 | |||||
Goodwill | 9,786 | 9,817 | |||||
Intangible Assets, Net | 3,021 | 3,441 | |||||
Other Noncurrent Assets | 3,041 | 1,897 | |||||
Total Assets | $ | 56,563 | $ | 53,870 | |||
LIABILITIES, REDEEMABLE NONCONTROLLING INTERESTS AND STOCKHOLDERS’ EQUITY | |||||||
Current Liabilities | |||||||
Drafts and accounts payable | $ | 28,585 | $ | 25,166 | |||
Short-term borrowings | 7 | 135 | |||||
Deferred revenue | 919 | 1,078 | |||||
Deferred tax liabilities | — | 1,820 | |||||
Current portion of long-term debt | 1,612 | 1,529 | |||||
Other accrued liabilities | 3,948 | 3,769 | |||||
Total Current Liabilities | 35,071 | 33,497 | |||||
Long-Term Debt | 6,535 | 8,180 | |||||
Long-Term Deferred tax liabilities | 2,734 | 859 | |||||
Other Noncurrent Liabilities | 1,809 | 1,863 | |||||
Commitments and Contingent Liabilities (Note 24) | — | — | |||||
Redeemable Noncontrolling Interests | 1,406 | 1,386 | |||||
McKesson Corporation Stockholders’ Equity | |||||||
Preferred stock, $0.01 par value, 100 shares authorized, no shares issued or outstanding | — | — | |||||
Common stock, $0.01 par value, 800 shares authorized at March 31, 2016 and 2015, 271 and 384 shares issued at March 31, 2016 and 2015 | 3 | 4 | |||||
Additional Paid-in Capital | 5,845 | 6,968 | |||||
Retained Earnings | 8,360 | 12,705 | |||||
Accumulated Other Comprehensive Loss | (1,561 | ) | (1,713 | ) | |||
Other | (2 | ) | (7 | ) | |||
Treasury Shares, at Cost, 46 and 152 at March 31, 2016 and 2015 | (3,721 | ) | (9,956 | ) | |||
Total McKesson Corporation Stockholders’ Equity | 8,924 | 8,001 | |||||
Noncontrolling Interests | 84 | 84 | |||||
Total Equity | 9,008 | 8,085 | |||||
Total Liabilities, Redeemable Noncontrolling Interests and Equity | $ | 56,563 | $ | 53,870 | |||
See Financial Notes
59
McKESSON CORPORATION
CONSOLIDATED STATEMENTS OF STOCKHOLDERS’ EQUITY
Years Ended March 31, 2016, 2015 and 2014
(In millions, except per share amounts)
McKesson Corporation Stockholders’ Equity | |||||||||||||||||||||||||||||||||||||
Common Stock | Additional Paid-in Capital | Other Capital | Retained Earnings | Accumulated Other Comprehensive Income (Loss) | Treasury | Noncontrolling Interests | Total Equity | ||||||||||||||||||||||||||||||
Shares | Amount | Common Shares | Amount | ||||||||||||||||||||||||||||||||||
Balances, March 31, 2013 | 376 | $ | 4 | $ | 6,078 | $ | 14 | $ | 10,402 | $ | (65 | ) | (149 | ) | $ | (9,363 | ) | $ | — | $ | 7,070 | ||||||||||||||||
Issuance of shares under employee plans | 5 | — | 177 | (1 | ) | (130 | ) | 47 | |||||||||||||||||||||||||||||
Share-based compensation | 160 | 160 | |||||||||||||||||||||||||||||||||||
Tax benefit related to issuance of shares under employee plans | 92 | 92 | |||||||||||||||||||||||||||||||||||
Acquisition of Celesio | 1,500 | 1,500 | |||||||||||||||||||||||||||||||||||
Conversion of Celesio convertible bonds | 33 | 280 | 313 | ||||||||||||||||||||||||||||||||||
Other comprehensive income | 62 | 21 | 83 | ||||||||||||||||||||||||||||||||||
Net income (loss) | 1,263 | (5 | ) | 1,258 | |||||||||||||||||||||||||||||||||
Repurchase of common stock | 14 | — | (14 | ) | — | ||||||||||||||||||||||||||||||||
Cash dividends declared, $0.92 per common share | (214 | ) | (214 | ) | |||||||||||||||||||||||||||||||||
Other | (2 | ) | 9 | 2 | 9 | ||||||||||||||||||||||||||||||||
Balances, March 31, 2014 | 381 | $ | 4 | $ | 6,552 | $ | 23 | $ | 11,453 | $ | (3 | ) | (150 | ) | $ | (9,507 | ) | $ | 1,796 | $ | 10,318 | ||||||||||||||||
Issuance of shares under employee plans | 3 | — | 152 | — | (109 | ) | 43 | ||||||||||||||||||||||||||||||
Share-based compensation | 165 | 165 | |||||||||||||||||||||||||||||||||||
Tax benefit related to issuance of shares under employee plans | 105 | 105 | |||||||||||||||||||||||||||||||||||
Purchase of noncontrolling interests | (2 | ) | (60 | ) | (62 | ) | |||||||||||||||||||||||||||||||
Reclassification of noncontrolling interests to redeemable noncontrolling interests | (1,500 | ) | (1,500 | ) | |||||||||||||||||||||||||||||||||
Other comprehensive income | (1,710 | ) | (174 | ) | (1,884 | ) | |||||||||||||||||||||||||||||||
Net income | 1,476 | 5 | 1,481 | ||||||||||||||||||||||||||||||||||
Repurchase of common stock | (2 | ) | (340 | ) | (340 | ) | |||||||||||||||||||||||||||||||
Cash dividends declared, $0.96 per common share | (226 | ) | (226 | ) | |||||||||||||||||||||||||||||||||
Other | (4 | ) | (30 | ) | 2 | 17 | (15 | ) | |||||||||||||||||||||||||||||
Balances, March 31, 2015 | 384 | $ | 4 | $ | 6,968 | $ | (7 | ) | $ | 12,705 | $ | (1,713 | ) | (152 | ) | $ | (9,956 | ) | $ | 84 | $ | 8,085 | |||||||||||||||
Issuance of shares under employee plans | 3 | — | 123 | (1 | ) | (109 | ) | 14 | |||||||||||||||||||||||||||||
Share-based compensation | 130 | 130 | |||||||||||||||||||||||||||||||||||
Tax benefit related to issuance of shares under employee plans | 117 | 117 | |||||||||||||||||||||||||||||||||||
Other comprehensive income | 152 | 152 | |||||||||||||||||||||||||||||||||||
Net income | 2,258 | 8 | 2,266 | ||||||||||||||||||||||||||||||||||
Repurchase of common stock | (9 | ) | (1,504 | ) | (1,504 | ) | |||||||||||||||||||||||||||||||
Retirement of common stock | (116 | ) | (1 | ) | (1,493 | ) | (6,354 | ) | 116 | 7,848 | — | ||||||||||||||||||||||||||
Cash dividends declared, $1.08 per common share | (249 | ) | (249 | ) | |||||||||||||||||||||||||||||||||
Other | 5 | (8 | ) | (3 | ) | ||||||||||||||||||||||||||||||||
Balances, March 31, 2016 | 271 | $ | 3 | $ | 5,845 | $ | (2 | ) | $ | 8,360 | $ | (1,561 | ) | (46 | ) | $ | (3,721 | ) | $ | 84 | $ | 9,008 | |||||||||||||||
See Financial Notes
60
McKESSON CORPORATION
CONSOLIDATED STATEMENTS OF CASH FLOWS
(In millions)
Years Ended March 31, | |||||||||||
2016 | 2015 | 2014 | |||||||||
Operating Activities | |||||||||||
Net income | $ | 2,310 | $ | 1,543 | $ | 1,258 | |||||
Adjustments to reconcile to net cash provided by operating activities: | |||||||||||
Depreciation | 281 | 306 | 185 | ||||||||
Amortization | 604 | 711 | 550 | ||||||||
Deferred taxes | 64 | 171 | 17 | ||||||||
Share-based compensation expense | 123 | 174 | 160 | ||||||||
Gain from sales of businesses | (103 | ) | — | — | |||||||
Impairment charges and impairment of equity investment | 8 | 241 | 80 | ||||||||
Charges associated with last-in-first-out inventory method | 244 | 337 | 311 | ||||||||
Other non-cash items | 108 | 47 | 130 | ||||||||
Changes in operating assets and liabilities, net of acquisitions: | |||||||||||
Receivables | (1,957 | ) | (2,821 | ) | (868 | ) | |||||
Inventories | (1,251 | ) | (2,144 | ) | (1,182 | ) | |||||
Drafts and accounts payable | 3,302 | 4,718 | 2,412 | ||||||||
Deferred revenue | (120 | ) | (141 | ) | (81 | ) | |||||
Taxes | (78 | ) | (222 | ) | 218 | ||||||
Claim and litigation charges | — | 150 | 68 | ||||||||
Litigation settlement payments | — | — | (105 | ) | |||||||
Other | 137 | 42 | (17 | ) | |||||||
Net cash provided by operating activities | 3,672 | 3,112 | 3,136 | ||||||||
Investing Activities | |||||||||||
Payments for property, plant and equipment | (488 | ) | (376 | ) | (278 | ) | |||||
Capitalized software expenditures | (189 | ) | (169 | ) | (141 | ) | |||||
Acquisitions, net of cash and cash equivalents acquired | (40 | ) | (170 | ) | (4,634 | ) | |||||
Proceeds from sale of businesses and equity investment, net | 210 | 15 | 97 | ||||||||
Restricted cash for acquisitions | (939 | ) | — | 46 | |||||||
Other | (111 | ) | 23 | (136 | ) | ||||||
Net cash used in investing activities | (1,557 | ) | (677 | ) | (5,046 | ) | |||||
Financing Activities | |||||||||||
Proceeds from short-term borrowings | 1,561 | 3,100 | 6,080 | ||||||||
Repayments of short-term borrowings | (1,688 | ) | (3,152 | ) | (6,132 | ) | |||||
Proceeds from issuances of long-term debt | — | 3 | 4,124 | ||||||||
Repayments of long-term debt | (1,598 | ) | (353 | ) | (348 | ) | |||||
Common stock transactions: | |||||||||||
Issuances | 123 | 152 | 177 | ||||||||
Share repurchases, including shares surrendered for tax withholding | (1,612 | ) | (450 | ) | (130 | ) | |||||
Dividends paid | (244 | ) | (227 | ) | (214 | ) | |||||
Other | 5 | (41 | ) | 62 | |||||||
Net cash (used in) provided by financing activities | (3,453 | ) | (968 | ) | 3,619 | ||||||
Effect of exchange rate changes on cash and cash equivalents | 45 | (319 | ) | 28 | |||||||
Net (decrease) increase in cash and cash equivalents | (1,293 | ) | 1,148 | 1,737 | |||||||
Cash and cash equivalents at beginning of year | 5,341 | 4,193 | 2,456 | ||||||||
Cash and cash equivalents at end of year | $ | 4,048 | $ | 5,341 | $ | 4,193 | |||||
Supplemental Cash Flow Information | |||||||||||
Cash paid for: | |||||||||||
Interest | $ | 337 | $ | 359 | $ | 255 | |||||
Income taxes, net of refunds | $ | 923 | $ | 866 | $ | 508 | |||||
Non-cash item: | |||||||||||
Fair value of debt assumed on acquisitions | $ | — | $ | — | $ | (2,312 | ) | ||||
Conversion of Celesio’s convertible bonds to equity | $ | — | $ | — | $ | 313 | |||||
See Financial Notes
61
1. | Significant Accounting Policies |
Nature of Operations: McKesson Corporation (“McKesson,” the “Company,” the “Registrant” or “we” and other similar pronouns) delivers a comprehensive offering of pharmaceuticals and medical supplies and provides services to help our customers improve the efficiency and effectiveness of their healthcare operations. We manage our business through two operating segments, McKesson Distribution Solutions and McKesson Technology Solutions, as further described in Financial Note 27, “Segments of Business.”
Basis of Presentation: The consolidated financial statements and accompanying notes are prepared in accordance with U. S. generally accepted accounting principles (“GAAP”). The consolidated financial statements of McKesson include the financial statements of all wholly-owned subsidiaries and majority-owned or controlled companies. For those consolidated subsidiaries where our ownership is less than 100%, the portion of the net income or loss allocable to the noncontrolling interests is reported as “Net Income Attributable to Noncontrolling Interests” on the consolidated statements of operations. All significant intercompany balances and transactions have been eliminated in consolidation.
We consider ourselves to control an entity if we are the majority owner of and have voting control over such entity. We also assess control through means other than voting rights (“variable interest entities” or “VIEs”) and determine which business entity is the primary beneficiary of the VIE. We consolidate VIEs when it is determined that we are the primary beneficiary of the VIE. Investments in business entities in which we do not have control, but have the ability to exercise significant influence over operating and financial policies, are accounted for using the equity method and our proportionate share of income or loss is recorded in other income, net. Equity investments in non-publicly traded entities are primarily accounted for using the cost method. Intercompany transactions and balances have been eliminated.
Fiscal Period: The Company’s fiscal year begins on April 1 and ends on March 31. Unless otherwise noted, all references to a particular year shall mean the Company’s fiscal year.
Reclassifications: Certain prior year amounts have been reclassified to conform to the current year presentation.
Use of Estimates: The preparation of financial statements in conformity with U.S. GAAP requires that we make estimates and assumptions that affect the reported amounts in the consolidated financial statements and accompanying notes. Actual amounts could differ from those estimated amounts.
Cash and Cash Equivalents: All highly liquid debt and money market instruments purchased with original maturity of three months or less at the date of acquisition are included in cash and cash equivalents.
Cash equivalents, which are available-for-sale, are carried at fair value. Cash equivalents are primarily invested in AAA rated prime and U.S. government money market funds denominated in U.S. dollars, AAA rated prime money market funds denominated in Euros, overnight repurchase agreements collateralized by U.S. government securities, Canadian government securities and/or securities that are guaranteed or sponsored by the U.S. government and an AAA rated prime money market fund denominated in British pound sterling.
The remaining cash and cash equivalents are deposited with several financial institutions. Deposits may exceed the amounts insured by the Federal Deposit Insurance Corporation in the U.S. and similar deposit insurance programs in other jurisdictions. We mitigate the risk of our short-term investment portfolio by depositing funds with reputable financial institutions and monitoring risk profiles and investment strategies of money market funds.
Restricted Cash: Cash that is subject to legal restrictions or is unavailable for general operating purposes is classified as restricted cash and is included within “Prepaid expenses and other” and “Other Noncurrent Assets” in the consolidated balance sheets. At March 31, 2016, our restricted cash balance was $939 million, which represents cash paid into the escrow accounts for acquisitions that closed on April 1, 2016. There was no material restricted cash balance at March 31, 2015.
Marketable Securities Available-for-Sale: We carry our marketable securities, which are available-for-sale, at fair value and they are included in prepaid expenses and other in the consolidated balance sheets. The unrealized gains and losses, net of the related tax effect, computed in marking these securities to market have been reported within stockholders’ equity. At March 31, 2016 and 2015, marketable securities were not material.
62
In determining whether an other-than-temporary decline in market value has occurred, we consider the duration that, and extent to which, the fair value of the investment is below its cost, the financial condition and future prospects of the issuer or underlying collateral of a security, and our intent and ability to retain the security in order to allow for an anticipated recovery in fair value. Other-than-temporary declines in fair value from amortized cost for available-for-sale equity securities that we intend to sell or would more likely than not be required to sell before the expected recovery of the amortized cost basis are charged to other income, net, in the period in which the loss occurs.
Concentrations of Credit Risk and Receivables: Our trade receivables are subject to a concentration of credit risk with customers primarily in our Distribution Solutions segment. During 2016, sales to our ten largest customers, including group purchasing organizations (“GPOs”) accounted for approximately 52.4% of our total consolidated revenues. Sales to our largest customer, CVS Health (“CVS”), accounted for approximately 20.3% of our total consolidated revenues. At March 31, 2016, trade accounts receivable from our ten largest customers were approximately 32% of total trade accounts receivable. Accounts receivable from CVS were approximately 18% of total trade accounts receivable. As a result, our sales and credit concentration is significant. We also have agreements with GPOs, each of which functions as a purchasing agent on behalf of member hospitals, pharmacies and other healthcare providers, as well as with government entities and agencies. The accounts receivables balances are with individual members of the GPOs, and therefore no significant concentration of credit risk exists. A default in payment, a material reduction in purchases from these or any other large customers, or the loss of a large customer or customer groups could have a material adverse impact on our financial condition, results of operations and liquidity. In addition, trade receivables are subject to a concentration of credit risk with customers in the institutional, retail and healthcare provider sectors, which can be affected by a downturn in the economy and changes in reimbursement policies. This credit risk is mitigated by the size and diversity of the customer base as well as its geographic dispersion. We estimate the receivables for which we do not expect full collection based on historical collection rates and ongoing evaluations of the creditworthiness of our customers. An allowance is recorded in our consolidated financial statements for these amounts.
Financing Receivables: We assess and monitor credit risk associated with financing receivables, namely lease and notes receivables, through regular review of our collection experience in determining our allowance for loan losses. On an ongoing basis, we also evaluate credit quality of our financing receivables utilizing aging of receivables and write-offs, as well as considering existing economic conditions, to determine if an allowance is necessary. Financing receivables are derecognized if legal title to them has been transferred and all related risks and rewards incidental to ownership have passed to the buyer. As of March 31, 2016 and 2015, financing receivables and the related allowance were not material to our consolidated financial statements.
Inventories: We report inventories at the lower of cost or market (“LCM”). Inventories for our Distribution Solutions segment consist of merchandise held for resale. For our Distribution Solutions segment, the majority of the cost of domestic inventories is determined using the last-in, first-out (“LIFO”) method. The majority of the cost of inventories held in foreign locations is based on weighted average purchase prices using the first-in, first-out method (“FIFO”). Technology Solutions segment inventories consist of computer hardware with cost generally determined by the standard cost method, which approximates average cost. Rebates, cash discounts, and other incentives received from vendors are recognized within cost of sales upon the sale of the related inventory.
The LIFO method was used to value approximately 74% and 73% of our inventories at March 31, 2016 and 2015. If we had used the FIFO method of inventory valuation, which approximates current replacement costs, inventories would have been approximately $1,012 million and $768 million higher than the amounts reported at March 31, 2016 and 2015, respectively. These amounts are equivalent to our LIFO reserves. Our LIFO valuation amount includes both pharmaceutical and non-pharmaceutical products. In 2016, 2015 and 2014, we recognized LIFO related expenses of $244 million, $337 million and $311 million in cost of sales within our consolidated statements of operations. A LIFO expense is recognized when the net effect of price increases on pharmaceutical and non-pharmaceutical products held in inventory exceeds the impact of price declines, including the effect of branded pharmaceutical products that have lost market exclusivity. A LIFO credit is recognized when the net effect of price declines exceeds the impact of price increases on pharmaceutical and non-pharmaceutical products held in inventory.
We believe that the average inventory costing method provides a reasonable estimation of the current cost of replacing inventory (i.e., “market”). As such, our LIFO inventory is valued at the lower of LIFO or market. Due to cumulative net price deflation from 2005 to 2013, we had a lower-of-cost or market (“LCM”) reserve of $60 million at March 31, 2013 which reduced pharmaceutical inventories at LIFO to market. During 2014, the LCM reserve of $60 million was released, resulting in an increase in gross profit. As of March 31, 2016 and 2015, inventories at LIFO did not exceed market.
63
Shipping and Handling Costs: We include costs to pack and deliver inventory to our customers in selling, distribution and administrative expenses. Shipping and handling costs of $789 million, $819 million, $535 million were included in our selling, distribution and administrative expenses in 2016, 2015 and 2014.
Property, Plant and Equipment: We state our property, plant and equipment (“PPE”) at cost and depreciate them under the straight-line method at rates designed to distribute the cost of PPE over estimated service lives ranging from one to thirty years. When certain events or changes in operating conditions occur, an impairment assessment may be performed on the recoverability of the carrying amounts.
Goodwill: Goodwill is tested for impairment on an annual basis in the fourth quarter or more frequently if indicators for potential impairment exist. Impairment testing is conducted at the reporting unit level, which is generally defined as a component, one level below our Distribution Solutions and Technology Solutions operating segments, for which discrete financial information is available and segment management regularly reviews the operating results of that unit.
The first step in goodwill testing requires us to compare the estimated fair value of a reporting unit to its carrying value. This step may be performed utilizing either a qualitative or quantitative assessment. If the carrying value of the reporting unit is lower than its estimated fair value, no further evaluation is necessary. If the carrying value of the reporting unit is higher than its estimated fair value, the second step must be performed to measure the amount of impairment loss. Under the second step, the implied fair value of goodwill is calculated in a hypothetical analysis by subtracting the fair value of all assets and liabilities of the reporting unit, including any unrecognized intangible assets, from the fair value of the reporting unit calculated in the first step of the impairment test. If the carrying value of goodwill for the reporting unit exceeds the implied fair value of goodwill, an impairment charge is recorded for that excess.
To estimate the fair value of our reporting units, we use a combination of the market approach and the income approach. Under the market approach, we estimate fair value by comparing the business to similar businesses or guideline companies whose securities are actively traded in public markets. Under the income approach, we use a discounted cash flow model in which cash flows anticipated over several periods, plus a terminal value at the end of that time horizon, are discounted to their present value using an appropriate expected rate of return. The discount rate used for cash flows reflects capital market conditions and the specific risks associated with the business. In addition, we compare the aggregate of the reporting units’ fair value to the Company’s market capitalization as a further corroboration of the fair values. The testing requires a complex series of assumptions and judgment by management in projecting future operating results, selecting guideline companies for comparisons and assessing risks. The use of alternative assumptions and estimates could affect the fair values and change the impairment determinations.
Intangible Assets: Currently all of our intangible assets are subject to amortization and are amortized based on the pattern of their economic consumption or on a straight-line basis over their estimated useful lives, ranging from one to thirty-eight years. We review intangible assets for impairment whenever events or changes in circumstances indicate that the carrying value of the assets may not be recoverable. Determination of recoverability is based on the lowest level of identifiable estimated future undiscounted cash flows resulting from use of the asset and its eventual disposition. Measurement of any impairment loss is based on the excess of the carrying value of the asset over its fair market value.
Capitalized Software Held for Sale: Development costs for software held for sale, which primarily pertain to our Technology Solutions segment, are capitalized once a project has reached the point of technological feasibility. Completed projects are amortized after reaching the point of general availability using the straight-line method based on an estimated useful life of approximately three years. At each balance sheet date, or earlier if an indicator of an impairment exists, we evaluate the recoverability of unamortized capitalized software costs based on estimated future undiscounted revenues net of estimated related costs over the remaining amortization period.
Capitalized Software Held for Internal Use: We capitalize costs of software held for internal use during the application development stage of a project and amortize those costs over their estimated useful lives ranging from one to ten years. As of March 31, 2016 and 2015, capitalized software held for internal use was $435 million, net of accumulated amortization of $1,130 million and $1,112 million, and was included in other assets in the consolidated balance sheets.
64
Insurance Programs: Under our insurance programs, we seek to obtain coverage for catastrophic exposures as well as those risks required to be insured by law or contract. It is our policy to retain a significant portion of certain losses primarily related to workers’ compensation and comprehensive general, product and vehicle liability. Provisions for losses expected under these programs are recorded based upon our estimate of the aggregate liability for claims incurred as well as for claims incurred but not yet reported. Such estimates utilize certain actuarial assumptions followed in the insurance industry.
Revenue Recognition:
Distribution Solutions
Revenues for our Distribution Solutions segment are recognized when persuasive evidence of an arrangement exists, product is delivered and title passes to the customer or when services have been rendered and there are no further obligations to the customer, the price is fixed or determinable, and collection of the amounts are reasonably assured.
Revenues for our Distribution Solutions segment include large volume sales of pharmaceuticals primarily to a limited number of large customers who warehouse their own products. We order bulk product from the manufacturer, receive and process the product primarily through our central distribution facility and deliver the bulk product (generally in the same form as received from the manufacturer) directly to our customers’ warehouses. We also record revenues for direct store deliveries of shipments from the manufacturer to our customers. We assume the primary liability to the manufacturer for these products.
Revenues are recorded gross when we are the primary party obligated in the transaction, take title to and possession of the inventory, are subject to inventory risk, have latitude in establishing prices, assume the risk of loss for collection from customers as well as delivery or return of the product, are responsible for fulfillment and other customer service requirements, or the transactions have several but not all of these indicators.
Revenues are recorded net of sales returns, allowances, rebates and other incentives. Our sales return policy generally allows customers to return products only if they can be resold for value or returned to suppliers for credit. Sales returns are accrued based on estimates at the time of sale to the customer. Sales returns from customers were approximately $3.1 billion in 2016, $2.7 billion in 2015 and $1.9 billion in 2014. Taxes collected from customers and remitted to governmental authorities are presented on a net basis; that is, they are excluded from revenues.
Our Distribution Solutions segment also engages in multiple-element arrangements, which may contain a combination of various products and services. Revenue from a multiple-element arrangement is allocated to the separate elements based on their relative selling price and recognized in accordance with the revenue recognition criteria applicable to each element. Relative selling price is determined based on vendor-specific objective evidence (“VSOE”) of selling price, if available, third-party evidence (“TPE”), if VSOE of selling price is not available, or estimated selling price (“ESP”), if neither VSOE of selling price nor TPE is available.
Technology Solutions
Revenues for our Technology Solutions segment are generated primarily by licensing software and software systems (consisting of software, hardware and maintenance support), providing software as a service (“Saas”) or SaaS-based solutions and providing claims processing, outsourcing and professional services. Revenue for this segment is recognized as follows:
Software systems are marketed under information systems agreements as well as service agreements. Perpetual software arrangements are recognized at the time of delivery or under the percentage-of-completion method if the arrangements require significant production, modification or customization of the software. Contracts accounted for under the percentage-of-completion method are generally measured based on the ratio of labor hours incurred to date to total estimated labor hours to be incurred. Changes in estimates to complete and revisions in overall profit estimates on these contracts are charged to earnings in the period in which they are determined. We accrue for contract losses if and when the current estimate of total contract costs exceeds total contract revenue.
Revenue from time-based software license agreements is recognized ratably over the term of the agreement. Software implementation fees are recognized as the work is performed or under the percentage-of-completion method. Maintenance and support agreements are marketed under annual or multi-year agreements and are recognized ratably over the period covered by the agreements. Hardware revenues are generally recognized upon delivery.
65
SaaS-based subscription, content and transaction processing fees are generally marketed under annual and multi-year agreements and are recognized ratably over the contracted terms beginning on the service start date for fixed fee arrangements and recognized as transactions are performed beginning on the service start date for per-transaction fee arrangements. Remote processing service fees are recognized monthly as the service is performed. Outsourcing service revenues are recognized as the service is performed.
We also offer certain products on an application service provider basis, making our software functionality available on a remote hosting basis from our data centers. The data centers provide system and administrative support, as well as hosting services. Revenue on products sold on an application service provider basis is recognized on a monthly basis over the term of the contract beginning on the service start date of products hosted.
This segment engages in multiple-element arrangements, which may contain any combination of software, hardware, implementation, SaaS-based offerings, consulting services or maintenance services. For multiple-element arrangements that do not include software, revenue is allocated to the separate elements based on their relative selling price and recognized in accordance with the revenue recognition criteria applicable to each element. Relative selling price is determined based on VSOE of selling price if available, TPE, if VSOE of selling price is not available, or ESP if neither VSOE of selling price nor TPE is available. For multiple-element arrangements accounted for in accordance with specific software accounting guidance when some elements are delivered prior to others in an arrangement and VSOE of fair value exists for the undelivered elements, revenue for the delivered elements is recognized upon delivery of such items. The segment establishes VSOE for hardware and implementation and consulting services based on the price charged when sold separately, and for maintenance services, based on renewal rates offered to customers. Revenue for the software element is recognized under the residual method only when fair value has been established for all of the undelivered elements in an arrangement. If fair value cannot be established for any undelivered element, all of the arrangement’s revenue is deferred until the delivery of the last element or until the fair value of the undelivered element is determinable. For multiple-element arrangements with both software elements and nonsoftware elements, arrangement consideration is allocated between the software elements as a whole and nonsoftware elements. The segment then further allocates consideration to the individual elements within the software group, and revenue is recognized for all elements under the applicable accounting guidance and our policies described above.
Supplier Incentives: Fees for service and other incentives received from suppliers, relating to the purchase or distribution of inventory, are generally reported as a reduction to cost of sales. We consider these fees and other incentives to represent product discounts and as a result, the amounts are recognized within cost of sales upon the sale of the related inventory.
Supplier Reserves: We establish reserves against amounts due from suppliers relating to various fees for services and price and rebate incentives, including deductions taken against payments otherwise due to them. These reserve estimates are established based on judgment after considering the status of current outstanding claims, historical experience with the suppliers, the specific incentive programs and any other pertinent information available. We evaluate the amounts due from suppliers on a continual basis and adjust the reserve estimates when appropriate based on changes in factual circumstances. All adjustments to supplier reserves are included in cost of sales. The ultimate outcome of any outstanding claims may be different than our estimate. As of March 31, 2016 and 2015 supplier reserves were $144 million and $167 million. All of the supplier reserves at March 31, 2016 and 2015 pertain to our Distribution Solutions segment.
Income Taxes: We account for income taxes under the asset and liability method, which requires the recognition of deferred tax assets and liabilities for the expected future tax consequences of events that have been included in the financial statements. Under this method, deferred tax assets and liabilities are determined based on the difference between the financial statements and the tax basis of assets and liabilities using enacted tax rates in effect for the year in which the differences are expected to reverse. Tax benefits from uncertain tax positions are recognized when it is more likely than not that the position will be sustained upon examination, including resolutions of any related appeals or litigation processes, based on the technical merits. The amount recognized is measured as the largest amount of tax benefit that is greater than 50 percent likely of being realized upon effective settlement. Deferred taxes are not provided on undistributed earnings of our foreign operations that are considered to be permanently reinvested.
66
Foreign Currency Translation: The reporting currency of the Company and its subsidiaries is the U.S. dollar. Our foreign subsidiaries generally consider their local currency to be their functional currency. Foreign currency-denominated assets and liabilities of these foreign subsidiaries are translated into U.S. dollars at year-end exchange rates and revenues and expenses are translated at average exchange rates during the corresponding period, and stockholders’ equity accounts are primarily translated at historical exchange rates. Foreign currency translation adjustments are included in other comprehensive income or loss in the statements of consolidated comprehensive income, and the cumulative effect is included in the stockholders’ equity section of the consolidated balance sheets. Realized gains and losses from currency exchange transactions are recorded in operating expenses in the consolidated statements of operations and were not material to our consolidated results of operations in 2016, 2015 or 2014. We release cumulative translation adjustment from stockholders’ equity into net income as a gain or loss only upon complete or substantially complete liquidation of a controlling interest in a subsidiary or a group of assets within a foreign entity. We also release all or a pro rata portion of the cumulative translation adjustment into net income upon the sale of an equity method investment that is a foreign entity.
Derivative Financial Instruments: Derivative financial instruments are used principally in the management of foreign currency exchange and interest rate exposures and are recorded on the consolidated balance sheets at fair value. If a derivative is designated as a fair value hedge, the changes in the fair value of the derivative and of the hedged item attributable to the hedged risk are recognized as a charge or credit to earnings. If the derivative is designated as a cash flow hedge, the effective portions of changes in the fair value of the derivative are included in other comprehensive income or loss in the statements of consolidated comprehensive income, and the cumulative effect is included in the stockholders’ equity section of the consolidated balance sheets. The cumulative changes in fair value are reclassified to the consolidated statements of operations when the hedged item affects earnings. We periodically evaluate hedge effectiveness, and ineffective portions of changes in the fair value of cash flow hedges are recognized as a charge or credit to earnings. Derivative instruments not designated as hedges are marked-to-market at the end of each accounting period with the change included in earnings.
Comprehensive Income: Comprehensive income consists of two components, net income and other comprehensive income. Other comprehensive income refers to revenue, expenses, and gains and losses that under GAAP are recorded as an element of stockholders’ equity but are excluded from net income. Our other comprehensive income primarily consists of foreign currency translation adjustments from those subsidiaries where the local currency is the functional currency, unrealized gains and losses on cash flow hedges, as well as unrealized gains and losses on retirement-related benefit plans.
Noncontrolling Interests and Redeemable Noncontrolling Interests: Noncontrolling interests represent the portion of profit or loss, net assets and comprehensive income that is not allocable to McKesson Corporation. In 2016 and 2015, net income attributable to noncontrolling interests primarily represents guaranteed dividends and recurring compensation that McKesson is obligated to pay to the noncontrolling shareholders of Celesio AG (“Celesio”). Noncontrolling interests with redemption features, such as put rights, that are not solely within the Company’s control are considered redeemable noncontrolling interests. Redeemable noncontrolling interests are presented outside of Stockholders’ Equity on our consolidated balance sheet. Refer to Financial Note 10, “Noncontrolling Interests and Redeemable Noncontrolling Interests,” for more information.
Share-Based Compensation: We account for all share-based compensation transactions using a fair-value based measurement method. The share-based compensation expense, for the portion of the awards that is ultimately expected to vest, is recognized on a straight-line basis over the requisite service period. The compensation expense recognized has been classified in the consolidated statements of operations or capitalized on the consolidated balance sheets in the same manner as cash compensation paid to our employees.
Loss Contingencies: We are subject to various claims, including claims with customers and vendors, pending and potential legal actions for damages, investigations relating to governmental laws and regulations and other matters arising out of the normal conduct of our business. When a loss is considered probable and reasonably estimable, we record a liability in the amount of our best estimate for the ultimate loss. However, the likelihood of a loss with respect to a particular contingency is often difficult to predict and determining a meaningful estimate of the loss or a range of loss may not be practicable based on the information available and the potential effect of future events and decisions by third parties that will determine the ultimate resolution of the contingency. Moreover, it is not uncommon for such matters to be resolved over many years, during which time relevant developments and new information must be reevaluated at least quarterly to determine both the likelihood of potential loss and whether it is possible to reasonably estimate a range of possible loss. When a material loss is probable but a reasonable estimate cannot be made, disclosure of the proceeding is provided.
67
Disclosure is also provided when it is reasonably possible that a loss will be incurred or when it is reasonably possible that the amount of a loss will exceed the recorded provision. We review all contingencies at least quarterly to determine whether the likelihood of loss has changed and to assess whether a reasonable estimate of the loss or range of the loss can be made. As discussed above, development of a meaningful estimate of loss or a range of potential loss is complex when the outcome is directly dependent on negotiations with or decisions by third parties, such as regulatory agencies, the court system and other interested parties. Such factors bear directly on whether it is possible to reasonably estimate a range of potential loss and boundaries of high and low estimate.
Business Combinations: We account for acquired businesses using the acquisition method of accounting, which requires that once control is obtained of a business, 100% of the assets acquired and liabilities assumed, including amounts attributed to noncontrolling interests, be recorded at the date of acquisition at their respective fair values. Any excess of the purchase price over the estimated fair values of the net assets acquired is recorded as goodwill. Acquisition-related expenses and related restructuring costs are expensed as incurred.
Several valuation methods may be used to determine the fair value of assets acquired and liabilities assumed. For intangible assets, we typically use the income method. This method starts with a forecast of all of the expected future net cash flows for each asset. These cash flows are then adjusted to present value by applying an appropriate discount rate that reflects the risk factors associated with the cash flow streams. Some of the more significant estimates and assumptions inherent in the income method or other methods include the amount and timing of projected future cash flows, the discount rate selected to measure the risks inherent in the future cash flows and the assessment of the asset’s life cycle and the competitive trends impacting the asset, including consideration of any technical, legal, regulatory, or economic barriers to entry. Determining the useful life of an intangible asset also requires judgment as different types of intangible assets will have different useful lives and certain assets may even be considered to have indefinite useful lives.
Recently Adopted Accounting Pronouncements
Deferred Income Taxes: In November 2015, amended guidance was issued for the balance sheet classification of deferred income taxes. The amended guidance requires the classification of all deferred tax assets and liabilities as noncurrent on the balance sheet instead of separating deferred taxes into current and noncurrent amounts. The amended guidance would have been effective for us commencing in the first quarter of 2018, however, early adoption was permitted. We early adopted this amended guidance in the fourth quarter of 2016 on a prospective basis. As a result, we reclassified current net deferred tax liabilities of approximately $2 billion on our consolidated balance sheet as of March 31, 2016. Our March 31, 2015 balances were not retrospectively adjusted. The adoption of this guidance had no impact on our condensed consolidated statements of earnings, comprehensive income or cash flows. This amended guidance only resulted in a change in presentation of our deferred income taxes on our consolidated balance sheet as of March 31, 2016.
Discontinued Operations: In the first quarter of 2016, we adopted amended guidance for reporting of discontinued operations and disclosures of disposals of components. The amended guidance revises the criteria for disposals to qualify as discontinued operations and permits significant continuing involvement and continuing cash flows with the discontinued operation. In addition, the amended guidance requires additional disclosures for discontinued operations and new disclosures for individually material disposal transactions that do not meet the definition of a discontinued operation. Refer to Financial Note 5, “Divestiture of Businesses,” for more information regarding the impact of this amended guidance on our consolidated financial statements.
Cumulative Translation Adjustment: In the first quarter of 2015, we adopted amended guidance for a parent’s accounting for the cumulative translation adjustment upon derecognition of certain subsidiaries or group of assets within a foreign entity or of an investment in a foreign entity. The amended guidance requires the release of any cumulative translation adjustment into net income only upon complete or substantially complete liquidation of a controlling interest in a subsidiary or a group of assets within a foreign entity. Also, it requires the release of all or a pro rata portion of the cumulative translation adjustment to net income in the case of sale of an equity method investment that is a foreign entity. The adoption of this amended guidance did not have a material effect on our consolidated financial statements.
68
Recently Issued Accounting Pronouncements Not Yet Adopted
Share-Based Payments: In March 2016, amended guidance was issued for employee share-based payment awards. The amended guidance makes several modifications related to the accounting for forfeitures, employer tax withholding on share-based compensation and excess tax benefits or deficiencies. The amended guidance also clarifies the statement of cash flows presentation for share-based awards. The amended guidance is effective for us prospectively commencing in the first quarter of 2018. Early adoption is permitted. We are currently evaluating the impact of this amended guidance on our consolidated financial statements.
Investments: In March 2016, amended guidance was issued to simplify the transition to the equity method of accounting. This standard eliminates the requirement that when an existing cost method investment qualifies for use of the equity method, an investor must restate its historical financial statements, as if the equity method had been used during all previous periods. Additionally, at the point an investment qualifies for the equity method, any unrealized gain or loss in accumulated other comprehensive income (loss) will be recognized through earnings. The amended guidance is effective for us prospectively commencing in the first quarter of 2018. Early adoption is permitted. We are currently evaluating the impact of this amended guidance on our consolidated financial statements.
Derivatives and Hedging: In March 2016, amended guidance was issued for derivative instrument novations. The amendments clarify that a novation, a change in the counterparty, to a derivative instrument that has been designated as a hedging instrument does not, in and of itself, require dedesignation of that hedging relationships provided all other hedge accounting criteria continue to be met. The amended guidance is effective for us commencing in the first quarter of 2018, The amended guidance allows for either prospective or modified retrospective adoption. Early adoption is permitted. We are currently evaluating the impact of this amended guidance on our consolidated financial statements.
Leases: In February 2016, amended guidance was issued for lease arrangements. The amended standard will require recognition on the balance sheet for all leases with terms longer than 12 months: a lease liability, which is a lessee’s obligation to make lease payments arising from a lease, measured on a discounted basis; and a right-of-use asset, which is an asset that represents the lessee’s right to use, or control the use of, a specified asset for the lease term. The amended guidance is effective for us commencing in the first quarter of 2020, on a modified retrospective basis. Early adoption is permitted. We are currently evaluating the impact of this amended guidance on our consolidated financial statements.
Financial Instruments: In January 2016, amended guidance was issued that requires equity investments to be measured at fair value with changes in fair value recognized in net income and enhanced disclosures about those investments. This guidance also simplifies the impairment assessments of equity investments without readily determinable fair value. The investments that are accounted for under the equity method of accounting or result in consolidation of the investee are excluded from the scope of this amended guidance. The amended guidance will become effective for us commencing in the first quarter of 2019 and will be adopted through a cumulative-effect adjustment. Early adoption is not permitted except for certain provisions. We are currently evaluating the impact of this amended guidance on our consolidated financial statements.
Business Combinations: In September 2015, amended guidance was issued for an acquirer’s accounting for measurement-period adjustments. The amended guidance eliminates the requirement that an acquirer in a business combination account for measurement-period adjustments retrospectively and instead requires that measurement-period adjustments be recognized during the period in which it determines the adjustment. In addition, the amended guidance requires that the acquirer record, in the same period’s financial statements, the effect on earnings of changes in depreciation, amortization, or other income effects, if any, as a result of the change to the provisional amounts, calculated as if the accounting had been completed at the acquisition date. The amended guidance is effective for us prospectively commencing in the first quarter of 2017. Early adoption is permitted. We do not expect the adoption of this amended guidance to have a material effect on our consolidated financial statements.
Inventory: In July 2015, amended guidance was issued for the subsequent measurement of inventory. The amended guidance requires entities to measure inventory at the lower of cost or net realizable value. Net realizable value is the estimated selling prices in the ordinary course of business, less reasonably predictable costs of completion, disposal, and transportation. The requirement would replace the current lower of cost or market evaluation. Accounting guidance is unchanged for inventory measured using last-in, first-out (“LIFO”) or the retail method. The amended guidance will become effective for us commencing in the first quarter of 2018. Early adoption is permitted. We are currently evaluating the impact of this amended guidance on our consolidated financial statements.
69
Fair Value Measurement: In May 2015, amended guidance was issued that limits disclosures and removes the requirement to categorize investments within the fair value hierarchy if the fair value of the investment is measured using the net asset value per share practical expedient. The amended guidance will become effective for us commencing in the first quarter of 2017. Early adoption is permitted. This amended guidance is primarily expected to affect our annual disclosures related to our pension benefits. We do not expect the adoption of this amended guidance to have a material effect on our consolidated financial statements.
Fees Paid in a Cloud Computing Arrangement: In April 2015, amended guidance was issued for a customer’s accounting for fees paid in a cloud computing arrangement. The amended guidance requires customers to determine whether or not an arrangement contains a software license element. If the arrangement contains a software element, the related fees paid should be accounted for as an acquisition of a software license. If the arrangement does not contain a software license, it is accounted for as a service contract. The amended guidance will become effective for us commencing in the first quarter of 2017. Early adoption is permitted. We do not expect the adoption of this amended guidance to have a material effect on our consolidated financial statements.
Debt Issuance Costs: In April 2015, amended guidance was issued for the balance sheet presentation of debt issuance costs. The amended guidance requires debt issuance costs related to a recognized debt liability to be reported in the balance sheet as a direct deduction from the carrying amount of that debt liability. The recognition and measurement guidance for debt issuance costs are not affected by the amended guidance. In August 2015, a clarification was added to this amended guidance that debt issuance costs related to line-of-credit arrangements can continue to be deferred and presented as an asset on the balance sheet. The amended guidance will become effective for us commencing in the first quarter of 2017. Early adoption is permitted. We do not expect the adoption of this amended guidance to have a material effect on our consolidated financial statements.
Consolidation: In February 2015, amended guidance was issued for consolidating legal entities in which a reporting entity holds a variable interest. The amended guidance modifies the evaluation of whether limited partnerships and similar legal entities are VIEs and changes the consolidation analysis of reporting entities that are involved with VIEs that have fee arrangements and related party relationships. The amended guidance will become effective for us commencing in the first quarter of 2017. Early adoption is permitted. We do not expect the adoption of this amended guidance to have a material effect on our consolidated financial statements.
Revenue Recognition: In May 2014, amended guidance was issued for recognizing revenue from contracts with customers. The amended guidance eliminates industry specific guidance and applies to all companies. Revenues will be recognized when an entity satisfies a performance obligation by transferring control of a promised good or service to a customer in an amount that reflects the consideration to which the entity expects to be entitled for that good or service. Revenue from a contract that contains multiple performance obligations is allocated to each performance obligation generally on a relative standalone selling price basis. The amended guidance also requires additional quantitative and qualitative disclosures. In March 2016, amended guidance was issued to clarify implementation guidance on principal versus agent considerations. In April 2016, another amended guidance was issued to permit an entity, as an accounting policy election, to account for shipping and handling activities that occur after the customer has obtained control of a good as an activity to fulfill the promise to transfer the good. The April 2016 amendment also provided clarifications on determining whether a promised license provides a customer with a right to use or a right to access an entity’s intellectual property. These amended standards are all effective for us commencing in the first quarter of 2019 and allow for either full retrospective adoption or modified retrospective adoption. Early adoption is permitted but not prior to our first quarter of 2018. We are currently evaluating the impact of this amended guidance on our consolidated financial statements.
70
2. | Business Combinations |
Acquisition of Celesio AG
On February 6, 2014, we completed the acquisition of 77.6% of the then outstanding common shares of Celesio and certain convertible bonds of Celesio for cash consideration of $4.5 billion, net of cash acquired (the “Acquisition”). Upon the acquisition, our ownership of Celesio’s fully diluted common shares was 75.6% and, as required, we consolidated Celesio’s debt with a fair value of $2.3 billion as a liability on our consolidated balance sheet. The Acquisition was initially funded by utilizing a senior bridge loan, our existing accounts receivable sales facility and cash on hand. Celesio is an international wholesale and retail company and a provider of logistics and services to the pharmaceutical and healthcare sectors. Celesio’s headquarters is in Stuttgart, Germany and it operates in 14 countries around the world. The acquisition of Celesio expanded our global geographic area. Financial results for continuing operations of Celesio are included within our International pharmaceutical distribution and services business, which is part of our Distribution Solutions segment, since the date of Acquisition.
From February 7, 2014 through March 31, 2014, substantially all of the convertible bonds issued by Celesio (held by both third parties and us) were converted into an additional 20.9 million common shares of Celesio and approximately $30 million in cash. At March 31, 2014, we owned approximately 75.4% of Celesio’s outstanding and fully diluted common shares.
Included in the purchase price allocation were acquired identifiable intangibles of $2.3 billion, the fair value of which was primarily determined by applying the income approach using unobservable inputs for projected cash flows and discount rates. These inputs are considered Level 3 under the fair value measurements and disclosure guidance. The fair value of the debt acquired was determined by quoted market prices in a less active market and other observable inputs from available market information, which are considered to be Level 2 inputs under the fair value measurements and disclosure guidance. The fair value of the noncontrolling interests for the Celesio common shares that were not acquired by McKesson was $1,505 million and was determined by a quoted market price that is considered to be a Level 1 input under the fair value measurements and disclosure guidance.
The excess of the purchase price and the noncontrolling interests over the fair value of the acquired net assets of $4.2 billion has been allocated to goodwill, which primarily reflects the expected future benefits to be realized upon integrating the business. Most of the goodwill is not expected to be deductible for tax purposes.
Refer to Financial Note 10, “Noncontrolling Interests and Redeemable Noncontrolling Interests” for information on the domination and profit and loss transfer agreement entered into between McKesson and Celesio during fiscal 2015.
Other Acquisitions
In July 2015, we entered into an agreement to purchase the pharmacy business of J Sainsbury Plc (“Sainsbury”) based in the United Kingdom (“U.K.”). Under the terms of the agreement, on February 29, 2016, we made an advance cash payment of $174 million representing the full purchase consideration, which is included in “Other Noncurrent Assets” within our consolidated balance sheet at March 31, 2016. The advance payment bears interest at an annual rate of 3.3%, compounded daily, from February 29, 2016 until the closing of the transaction. The interest will be paid to us in full on the closing date. The U.K. business is currently being reviewed by the U.K. Competition and Markets Authority (the “U.K. CMA”). We anticipate obtaining U.K. CMA clearance during the first quarter of 2017. Once completed, this acquisition will further enhance our retail pharmacy service capabilities in the U.K. Upon closing, the acquired Sainsbury business will be included in our International pharmaceutical distribution and services business within our Distribution Solutions segment.
In September 2015, we entered into an agreement to purchase the pharmaceutical distribution business of UDG Healthcare Plc (“UDG”) based in Ireland and the U.K. During the fourth quarter of 2016, we paid the net purchase consideration of $412 million into an escrow account, which is included in “Other Noncurrent Assets” within our consolidated balance sheet at March 31, 2016. The acquisition was completed on April 1, 2016. The acquired UDG business primarily provides pharmaceutical and other healthcare products to retail and hospital pharmacies. The acquisition of UDG will expand our offerings and strengthen our market position in Ireland and the U.K. The U.K. business is currently being reviewed by the U.K. CMA and as a result, we have limited control over this portion of the acquired business. We anticipate obtaining U.K. CMA clearance during the second half of 2017. Upon closing, financial results for this acquisition will be included in our International pharmaceutical distribution and services business within our Distribution Solutions segment.
71
On April 1, 2016, we acquired Vantage Oncology Holdings LLC (“Vantage”), which is headquartered in Manhattan Beach, California. Vantage provides comprehensive oncology management services, including radiation oncology, medical oncology, and other integrated cancer care services, through over 51 cancer treatment facilities in 13 states. The net purchase consideration of $527 million was paid into an escrow account prior to year end, and is included in “Other Noncurrent Assets” within our consolidated balance sheet at March 31, 2016. Also on April 1, 2016, we acquired Biologics, Inc. (“Biologics”) for gross purchase consideration of $700 million, which was funded from cash on hand. Biologics is the largest independent oncology-focused specialty pharmacy in the U.S., which is headquartered in Cary, North Carolina. The financial results of Vantage and Biologics will be included within our Distribution Solutions segment from the date of acquisition. These acquisitions will collectively enhance our specialty pharmaceutical distribution scale and oncology-focused pharmacy offerings, solutions for manufacturers and payers, and expand the scope of our community-based oncology and practice management services.
In March 2016, we entered into an agreement to purchase Rexall Health from Katz Group for $3 billion Canadian dollars (or, approximately $2.3 billion U.S. dollars using the currency exchange ratio of 0.77 Canadian dollar to 1 U.S. dollar as of March 31, 2016). Rexall Health, which operates approximately 470 retail pharmacies in Canada, particularly in Ontario and Western Canada, will enhance our Canadian pharmaceutical supply chain. The acquisition is subject to regulatory approval and expected to close during the second half of calendar year 2016. Upon closing, the acquired business will be included within our Distribution Solutions segment.
During the last three years, we also completed a number of other acquisitions within our Distribution Solutions segment. Financial results for our business acquisitions have been included in our consolidated financial statements since their respective acquisition dates. Purchase prices for our business acquisitions have been allocated based on estimated fair values at the date of acquisition. Goodwill recognized for our business acquisitions is generally not expected to be deductible for tax purposes. However, if we acquire the assets of a company, the goodwill may be deductible for tax purposes.
3. Restructuring
On March 14, 2016, we committed to a restructuring plan to lower our operating costs (the “Cost Alignment Plan”). The Cost Alignment Plan primarily consists of a reduction in workforce, and business process initiatives that will be substantially implemented prior to the end of 2019. Business process initiatives primarily include plans to reduce operating costs of our distribution and pharmacy operations, administrative support functions, and technology platforms, as well as the disposal and abandonment of certain non-core businesses. As a result of the Cost Alignment Plan, we expect to record total pre-tax charges of approximately $270 million to $290 million, of which $229 million of pre-tax charges were recorded during the fourth quarter of 2016. Estimated remaining charges primarily consist of exit-related costs and accelerated depreciation and amortization, which are largely attributed to our Distribution Solutions segment.
72
Restructuring charges for our Cost Alignment Plan during the fourth quarter of 2016 consisted of the following:
(In millions) | Distribution Solutions | Technology Solutions | Corporate | Total | |||||||||||
Severance and employee-related costs, net (1) | $ | 147 | $ | 44 | $ | 16 | $ | 207 | |||||||
Exit-related costs | 3 | 1 | 1 | 5 | |||||||||||
Asset impairments and accelerated depreciation and amortization (2) | 11 | 6 | — | 17 | |||||||||||
Total | $ | 161 | $ | 51 | $ | 17 | $ | 229 | |||||||
Cost of Sales | $ | 5 | $ | 21 | $ | — | $ | 26 | |||||||
Operating Expenses | 156 | 30 | 17 | 203 | |||||||||||
Total | $ | 161 | $ | 51 | $ | 17 | $ | 229 | |||||||
(1) | Severance and employee-related costs, net, include charges of $117 million and $90 million, for a total of $207 million, for a reduction in workforce and business process initiatives. |
(2) | Asset impairments and accelerated depreciation and amortization charges primarily include impairments for capitalized software projects and software licenses due to abandonments. |
The following table summarizes the activity related to the restructuring liabilities associated with the Cost Alignment Plan for the quarter and year ended March 31, 2016:
Quarter and Year Ended March 31, 2016 | ||||||||||||||||||||||||
(In millions) | Balance March 31, 2015 | Net restructuring charges recognized | Non-cash charges | Cash Payments | Other | Balance March 31, 2016 (1) | ||||||||||||||||||
2016 Cost Alignment Plan | ||||||||||||||||||||||||
Distribution Solutions | $ | — | $ | 161 | $ | (4 | ) | $ | (1 | ) | $ | — | $ | 156 | ||||||||||
Technology Solutions | — | 51 | (3 | ) | — | (3 | ) | 45 | ||||||||||||||||
Corporate | — | 17 | 5 | — | (1 | ) | 21 | |||||||||||||||||
Total 2016 Cost Alignment Plan | $ | — | $ | 229 | $ | (2 | ) | $ | (1 | ) | $ | (4 | ) | $ | 222 | |||||||||
(1) | The reserve balances as of March 31, 2016 include $172 million recorded in other accrued liabilities and $50 million recorded in other noncurrent liabilities in our consolidated balance sheet. |
4. | Asset Impairments and Product Alignment Charges |
In 2014, we recorded pre-tax charges totaling $57 million in our Technology Solutions segment. These charges primarily consist of $35 million of product alignment charges, $15 million of integration-related expenses and $7 million of reduction-in-workforce severance charges. Included in the total charge was $35 million for severance for employees primarily in our research and development, customer services and sales functions, and $15 million for asset impairments which primarily represents the write-off of deferred costs related to a product that will no longer be developed. Charges were recorded in our consolidated statement of operations as follows: $34 million in cost of sales and $23 million in operating expenses.
5. | Divestiture of Businesses |
During the second quarter of 2016, we sold our ZEE Medical business within our Distribution Solutions segment for total proceeds of $134 million and recorded a pre-tax gain of $52 million ($29 million after-tax) from this sale.
During the first quarter of 2016, we also sold our nurse triage business within our Technology Solutions segment for net sale proceeds of $84 million and recorded a pre-tax gain of $51 million ($38 million after-tax) from the sale.
73
These divestitures did not meet the criteria to qualify as discontinued operations under the amended accounting guidance, which became effective for us in the first quarter of 2016. Accordingly, pre-tax gains from both divestitures were recorded in operating expenses within continuing operations of our consolidated statements of operations. Pre and after-tax income of these businesses were not material for the year ended March 31, 2016.
6. | Share-Based Compensation |
We provide share-based compensation to our employees, officers and non-employee directors, including stock options, an employee stock purchase plan, restricted stock units (“RSUs”), performance-based restricted stock units (“PeRSUs”) and total shareholder return units (“TSRUs”) (collectively, “share-based awards”). Most of our share-based awards are granted in the first quarter of each fiscal year.
Compensation expense for the share-based awards is recognized for the portion of awards ultimately expected to vest. We estimate the number of share-based awards that will ultimately vest primarily based on historical experience. The estimated forfeiture rate established upon grant is re-assessed throughout the requisite service period and is adjusted when actual forfeitures occur. The actual forfeitures in future reporting periods could be higher or lower than current estimates.
The compensation expense recognized has been classified in the consolidated statements of operations or capitalized in the consolidated balance sheets in the same manner as cash compensation paid to our employees. There was no material share-based compensation expense capitalized as part of the cost of an asset in 2016, 2015 and 2014.
Impact on Net Income
The components of share-based compensation expense and related tax benefits are as follows:
Years Ended March 31, | |||||||||||
(In millions) | 2016 | 2015 | 2014 | ||||||||
Restricted stock unit awards (1) | $ | 88 | $ | 137 | $ | 126 | |||||
Stock options | 22 | 24 | 22 | ||||||||
Employee stock purchase plan | 13 | 13 | 12 | ||||||||
Share-based compensation expense (2) | 123 | 174 | 160 | ||||||||
Tax benefit for share-based compensation expense (3) | (41 | ) | (61 | ) | (55 | ) | |||||
Share-based compensation expense, net of tax | $ | 82 | $ | 113 | $ | 105 | |||||
(1) | Includes compensation expense recognized for RSUs, PeRSUs and TSRUs. Our TSRUs were awarded beginning in 2015. |
(2) | 2016 includes non-cash credits of $14 million representing the reversal of previously recognized share-based compensation, which was recorded due to employee terminations associated with the March 2016 restructuring plan. |
(3) | Income tax benefit is computed using the tax rates of applicable tax jurisdictions. Additionally, a portion of pre-tax compensation expense is not tax-deductible. |
Stock Plans
In July 2013, our stockholders approved the 2013 Stock Plan to replace the 2005 Stock Plan. These stock plans provide our employees, officers and non-employee directors the opportunity to receive equity-based, long-term incentives in the form of stock options, restricted stock, RSUs, PeRSUs, TSRUs and other share-based awards. The 2013 Stock Plan reserves 30 million shares plus the remaining number of shares reserved but unused under the 2005 Stock Plan. As of March 31, 2016, 29 million shares remain available for future grant under the 2013 Stock Plan.
Stock Options
Stock options are granted with an exercise price at no less than the fair market value and those options granted under the stock plans generally have a contractual term of seven years and follow a four-year vesting schedule.
74
Compensation expense for stock options is recognized on a straight-line basis over the requisite service period and is based on the grant-date fair value for the portion of the awards that is ultimately expected to vest. We use the Black-Scholes options-pricing model to estimate the fair value of our stock options. Once the fair value of an employee stock option is determined, current accounting practices do not permit it to be changed, even if the estimates used are different from actual. The options-pricing model requires the use of various estimates and assumptions as follows:
• | Expected stock price volatility is based on a combination of historical volatility of our common stock and implied market volatility. We believe that this market-based input provides a reasonable estimate of our future stock price movements and is consistent with employee stock option valuation considerations. |
• | Expected dividend yield is based on historical experience and investors’ current expectations. |
• | The risk-free interest rate for periods within the expected life of the option is based on the constant maturity U.S. Treasury rate in effect at the time of grant. |
• | Expected life of the options is based primarily on historical employee stock option exercises and other behavior data and reflects the impact of changes in contractual life of current option grants compared to our historical grants. |
Weighted-average assumptions used to estimate the fair value of employee stock options were as follows:
Years Ended March 31, | |||||
2016 | 2015 | 2014 | |||
Expected stock price volatility | 21% | 22% | 22% | ||
Expected dividend yield | 0.4% | 0.6% | 0.7% | ||
Risk-free interest rate | 1.4% | 1.3% | 0.7% | ||
Expected life (in years) | 4 | 4 | 4 | ||
The following is a summary of stock options outstanding at March 31, 2016:
Options Outstanding | Options Exercisable | |||||||||||||||||||
Range of Exercise Prices | Number of Options Outstanding at Year End (In millions) | Weighted- Average Remaining Contractual Life (Years) | Weighted- Average Exercise Price | Number of Options Exercisable at Year End (In millions) | Weighted- Average Exercise Price | |||||||||||||||
$ | 40.46 | – | $ | 140.19 | 3 | 2 | $ | 83.62 | 2 | $ | 78.01 | |||||||||
140.20 | – | 239.93 | 1 | 6 | 206.58 | — | 180.24 | |||||||||||||
4 | 2 | |||||||||||||||||||
75
The following table summarizes stock option activity during 2016:
(In millions, except per share data) | Shares | Weighted- Average Exercise Price | Weighted- Average Remaining Contractual Term (Years) | Aggregate Intrinsic Value (2) | |||||||
Outstanding, March 31, 2015 | 5 | $ | 95.01 | 4 | $ | 539 | |||||
Granted | 1 | 236.77 | |||||||||
Cancelled | (1) | 149.19 | |||||||||
Exercised | (1) | 63.75 | |||||||||
Outstanding, March 31, 2016 | 4 | $ | 118.95 | 3 | $ | 201 | |||||
Vested and expected to vest (1) | 3 | $ | 118.21 | 3 | $ | 200 | |||||
Vested and exercisable, March 31, 2016 | 2 | 85.15 | 2 | 173 | |||||||
(1) | The number of options expected to vest takes into account an estimate of expected forfeitures. |
(2) | The intrinsic value is calculated as the difference between the period-end market price of the Company’s common stock and the exercise price of “in-the-money” options. |
The following table provides data related to stock option activity:
Years Ended March 31, | |||||||||||
(In millions, except per share data) | 2016 | 2015 | 2014 | ||||||||
Weighted-average grant date fair value per stock option | $ | 44.04 | $ | 35.49 | $ | 21.45 | |||||
Aggregate intrinsic value on exercise | $ | 107 | $ | 153 | $ | 144 | |||||
Cash received upon exercise | $ | 47 | $ | 76 | $ | 111 | |||||
Tax benefits realized related to exercise | $ | 42 | $ | 60 | $ | 55 | |||||
Total fair value of stock options vested | $ | 18 | $ | 20 | $ | 24 | |||||
Total compensation cost, net of estimated forfeitures, related to unvested stock options not yet recognized, pre-tax | $ | 20 | $ | 22 | $ | 29 | |||||
Weighted-average period in years over which stock option compensation cost is expected to be recognized | 2 | 2 | 1 | ||||||||
Restricted Stock Unit Awards
RSUs, which entitle the holder to receive at the end of a vesting term a specified number of shares of the Company’s common stock, are accounted for at fair value at the date of grant. Total compensation expense for RSUs under our stock plans is determined by the product of the number of shares that are expected to vest and the grant date market price of the Company’s common stock. The Compensation Committee determines the vesting terms at the time of grant. These awards generally vest in three to four years. We recognize expense for RSUs on a straight-line basis over the requisite service period.
Non-employee directors receive an annual grant of RSUs, which vest immediately and are expensed upon grant. The director may elect to receive the underlying shares immediately or defer receipt of the shares if they meet director stock ownership guidelines. The shares will be automatically deferred for those directors who do not meet the director stock ownership guidelines. At March 31, 2016, approximately 146 thousand RSUs for our directors are vested.
76
PeRSUs are RSUs for which the number of RSUs awarded is conditional upon the attainment of one or more performance objectives over a specified period. Each year, the Compensation Committee approves the target number of PeRSUs representing the base number of awards that could be granted if performance goals are attained. PeRSUs are accounted for as variable awards until the performance goals are reached at which time the grant date is established. Total compensation expense for PeRSUs is determined by the product of the number of shares eligible to be awarded and expected to vest, and the market price of the Company’s common stock, commencing at the inception of the requisite service period. During the performance period, the compensation expense for PeRSUs is re-computed using the market price and the performance modifier at the end of a reporting period. At the end of the performance period, if the goals are attained, the awards are granted and classified as RSUs and accounted for on that basis. We recognize compensation expense for these awards on a straight-line basis over the requisite aggregate service period of generally four years.
TSRUs replaced PeRSUs for our executive officers beginning in 2015. The number of vested TSRUs is assessed at the end of a three-year performance period and is conditioned upon attainment of a total shareholder return metric relative to a peer group of companies. We use the Monte Carlo simulation model to measure the fair value of TSRUs. TSRUs have a requisite service period of approximately three years. Expense is attributed to the requisite service period on a straight-line basis based on the fair value of the TSRUs. For TSRUs that are designated as equity awards, the fair value is measured at the grant date. For TSRUs that are eligible for cash settlement and designated as liability awards, we measure the fair value at the end of each reporting period and also adjust a corresponding liability on our balance sheet for changes in fair value.
The weighted-average assumptions used to estimate the fair value of TSRUs are as follows:
Years Ended March 31, | |||
2016 | 2015 | ||
Expected stock price volatility | 18% | 21% | |
Expected dividend yield | 0.4% | 0.5% | |
Risk-free interest rate | 0.9% | 0.7% | |
Expected life (in years) | 3 | 3 | |
The following table summarizes restricted stock unit award activity during 2016:
(In millions, except per share data) | Shares | Weighted- Average Grant Date Fair Value Per Share | |||
Nonvested, March 31, 2015 | 4 | $ | 129.57 | ||
Granted | 1 | 240.35 | |||
Cancelled | (1) | 159.17 | |||
Vested | (1) | 89.44 | |||
Nonvested, March 31, 2016 | 3 | $ | 176.59 | ||
The following table provides data related to restricted stock unit award activity:
Years Ended March 31, | |||||||||||
(In millions) | 2016 | 2015 | 2014 | ||||||||
Total fair value of shares vested | $ | 104 | $ | 126 | $ | 184 | |||||
Total compensation cost, net of estimated forfeitures, related to nonvested restricted stock unit awards not yet recognized, pre-tax | $ | 144 | $ | 206 | $ | 236 | |||||
Weighted-average period in years over which restricted stock unit award cost is expected to be recognized | 2 | 2 | 2 | ||||||||
77
Employee Stock Purchase Plan (“ESPP”)
The Company has an ESPP under which 21 million shares have been authorized for issuance. The ESPP allows eligible employees to purchase shares of our common stock through payroll deductions. The deductions occur over three-month purchase periods and the shares are then purchased at 85% of the market price at the end of each purchase period. Employees are allowed to terminate their participation in the ESPP at any time during the purchase period prior to the purchase of the shares. The 15% discount provided to employees on these shares is included in compensation expense. The shares related to funds outstanding at the end of a quarter are included in the calculation of diluted weighted average shares outstanding. These amounts have not been significant. Shares issued under the ESPP were not material in 2016, 2015, and 2014. At March 31, 2016, 4 million shares remain available for issuance.
7. | Other Income, Net |
Years Ended March 31, | |||||||||||
(In millions) | 2016 | 2015 | 2014 | ||||||||
Interest income | $ | 18 | $ | 20 | $ | 16 | |||||
Equity in earnings, net (1) | 15 | 12 | — | ||||||||
Other, net (1) | 25 | 31 | 16 | ||||||||
Total | $ | 58 | $ | 63 | $ | 32 | |||||
(1) | Primarily recorded within our Distribution Solutions segment. |
8. | Income Taxes |
Years Ended March 31, | |||||||||||
(In millions) | 2016 | 2015 | 2014 | ||||||||
Income from continuing operations before income taxes | |||||||||||
U.S. | $ | 2,319 | $ | 1,893 | $ | 1,554 | |||||
Foreign | 931 | 764 | 617 | ||||||||
Total income from continuing operations before income taxes | $ | 3,250 | $ | 2,657 | $ | 2,171 | |||||
Income tax expense related to continuing operations consists of the following:
Years Ended March 31, | |||||||||||
(In millions) | 2016 | 2015 | 2014 | ||||||||
Current | |||||||||||
Federal | $ | 658 | $ | 453 | $ | 484 | |||||
State | 96 | 90 | 64 | ||||||||
Foreign | 90 | 101 | 193 | ||||||||
Total current | 844 | 644 | 741 | ||||||||
Deferred | |||||||||||
Federal | 95 | 195 | 24 | ||||||||
State | 42 | 53 | 10 | ||||||||
Foreign | (73 | ) | (77 | ) | (18 | ) | |||||
Total deferred | 64 | 171 | 16 | ||||||||
Income tax expense | $ | 908 | $ | 815 | $ | 757 | |||||
78
During 2016, 2015 and 2014, income tax expense related to continuing operations was $908 million, $815 million and $757 million, which included net discrete tax benefits of $42 million and $33 million in 2016 and 2015 and net discrete tax expenses of $94 million in 2014. Discrete tax benefits in 2016 included a $19 million benefit related to enacted tax law changes in foreign jurisdictions and a $25 million benefit due to the reversal of a tax reserve related to the treatment of share-based compensation expense in an intercompany cost-sharing agreement. Discrete tax benefit in 2015 included a $55 million benefit related to an agreement reached with the Internal Revenue Service (“IRS”) to settle all outstanding issues relating to years 2003 through 2006. Discrete tax expense for 2014 primarily related to a $122 million charge regarding an unfavorable decision from the Tax Court of Canada with respect to transfer pricing issues.
Our reported income tax rates were 27.9%, 30.7%, and 34.9% in 2016, 2015 and 2014. The fluctuations in our reported income tax rates are primarily due to changes within our business mix, including varying proportions of income attributable to foreign countries that have lower income tax rates and discrete items.
The reconciliation between our effective tax rate on income from continuing operations and statutory tax rate is as follows:
Years Ended March 31, | |||||||||||
(In millions) | 2016 | 2015 | 2014 | ||||||||
Income tax expense at federal statutory rate | $ | 1,137 | $ | 930 | $ | 760 | |||||
State income taxes net of federal tax benefit | 92 | 81 | 57 | ||||||||
Foreign income taxed at various rates | (295 | ) | (247 | ) | (177 | ) | |||||
Canadian litigation | (8 | ) | — | 122 | |||||||
Controlled substance distribution reserve | — | 58 | — | ||||||||
Unrecognized tax benefits and settlements | (6 | ) | 10 | (6 | ) | ||||||
Tax credits | (18 | ) | (10 | ) | (6 | ) | |||||
Other, net | 6 | (7 | ) | 7 | |||||||
Income tax expense | $ | 908 | $ | 815 | $ | 757 | |||||
At March 31, 2016, undistributed earnings of our foreign operations totaling $5,831 million were considered to be permanently reinvested. No deferred tax liability has been recognized on the basis difference created by such earnings since it is our intention to utilize those earnings in the foreign operations as well as to fund certain research and development activities for an indefinite period of time. The determination of the amount of deferred taxes on these earnings is not practicable because the computation would depend on a number of factors that cannot be known until a decision to repatriate the earnings is made.
79
Deferred tax balances consisted of the following:
March 31, | |||||||
(In millions) | 2016 | 2015 | |||||
Assets | |||||||
Receivable allowances | $ | 110 | $ | 83 | |||
Deferred revenue | 77 | 72 | |||||
Compensation and benefit related accruals | 710 | 681 | |||||
Net operating loss and credit carryforwards | 367 | 316 | |||||
Other | 275 | 266 | |||||
Subtotal | 1,539 | 1,418 | |||||
Less: valuation allowance | (267 | ) | (229 | ) | |||
Total assets | 1,272 | 1,189 | |||||
Liabilities | |||||||
Inventory valuation and other assets | (2,619 | ) | (2,333 | ) | |||
Fixed assets and systems development costs | (326 | ) | (324 | ) | |||
Intangibles | (981 | ) | (1,073 | ) | |||
Other | (21 | ) | (61 | ) | |||
Total liabilities | (3,947 | ) | (3,791 | ) | |||
Net deferred tax liability | $ | (2,675 | ) | $ | (2,602 | ) | |
Current net deferred tax asset (1) | $ | — | $ | 27 | |||
Current net deferred tax liability (1) | — | (1,820 | ) | ||||
Long-term deferred tax asset | 59 | 50 | |||||
Long-term deferred tax liability | (2,734 | ) | (859 | ) | |||
Net deferred tax liability | $ | (2,675 | ) | $ | (2,602 | ) | |
(1) | Upon the adoption of the amended accounting guidance, we reclassified current net deferred tax liabilities and current net deferred tax assets as noncurrent on our consolidated balance sheet as of March 31, 2016. Our March 31, 2015 balances were not retrospectively reclassified. |
We assess the available positive and negative evidence to determine whether deferred tax assets are more likely than not to be realized. As a result of this assessment, valuation allowances have been recorded on certain deferred tax assets in various tax jurisdictions. The valuation allowance was approximately $267 million and $229 million in 2016 and 2015. The increase of $38 million in valuation allowances in the current year relate primarily to net operating losses incurred in certain tax jurisdictions for which no tax benefit was recognized.
We have federal, state and foreign net operating loss carryforwards of $35 million, $1,790 million and $889 million. Federal and state net operating losses will expire at various dates from 2017 through 2036. Substantially all of our foreign net operating losses have indefinite lives.
We received reassessments from the Canada Revenue Agency (“CRA”) related to a transfer pricing matter impacting years 2003 through 2013. During 2016, we reached an agreement to settle the transfer pricing matter for years 2003 through 2013 and recorded a net discrete tax benefit of $8 million.
We are subject to the continuous examination of our income tax returns by the IRS and other authorities. The IRS is currently examining our U.S. corporation income tax returns for 2007 through 2009 and may issue a Revenue Agent Report during the first quarter of 2017. We believe that adequate amounts have been reserved for any adjustments that may ultimately result from these examinations.
80
The following table summarizes the activity related to our gross unrecognized tax benefits for the last three years:
Years Ended March 31, | |||||||||||
(In millions) | 2016 | 2015 | 2014 | ||||||||
Unrecognized tax benefits at beginning of period | $ | 616 | $ | 647 | $ | 560 | |||||
Additions based on tax positions related to prior years | 116 | 62 | 106 | ||||||||
Reductions based on tax positions related to prior years | (62 | ) | (18 | ) | (23 | ) | |||||
Additions based on tax positions related to current year | 28 | 27 | 23 | ||||||||
Reductions based on settlements | (141 | ) | (65 | ) | (4 | ) | |||||
Reductions based on the lapse of the applicable statutes of limitations | (6 | ) | (12 | ) | (7 | ) | |||||
Exchange rate fluctuations | 4 | (25 | ) | (8 | ) | ||||||
Unrecognized tax benefits at end of period | $ | 555 | $ | 616 | $ | 647 | |||||
As of March 31, 2016, we had $555 million of unrecognized tax benefits, of which $380 million would reduce income tax expense and the effective tax rate, if recognized. During the next twelve months, it is reasonably possible that audit resolutions and the expiration of statutes of limitations could potentially reduce our unrecognized tax benefits by up to $125 million. However, this amount may change as we continue to have ongoing negotiations with various taxing authorities throughout the year.
We report interest and penalties on income taxes as income tax expense. We recognized income tax expense of $12 million in 2016, income tax benefit of $24 million in 2015 and income tax expense of $48 million in 2014, related to interest and penalties in our consolidated statements of operations. The income tax benefit for interest and penalties recognized in 2015 was primarily due to the lapses of statutes of limitations. As of March 31, 2016 and 2015, we had accrued $77 million and $122 million cumulatively in interest and penalties on unrecognized tax benefits.
We file income tax returns in the U.S. federal jurisdiction, various U.S. state jurisdictions and various foreign jurisdictions. We are subject to audit by the IRS for fiscal years 2007 through the current fiscal year. We are generally subject to audit by taxing authorities in various U.S. states and in foreign jurisdictions for fiscal years 2006 through the current fiscal year.
9. | Discontinued Operations |
Brazil Distribution Business
During the fourth quarter of 2015, we committed to a plan to sell our Brazilian pharmaceutical distribution business, which we acquired through our February 2014 acquisition of Celesio, from our Distribution Solutions segment. Accordingly, the results of operations and cash flows of this business are classified as discontinued operations for all periods presented in our consolidated financial statements.
During the fourth quarter of 2015, we recorded $241 million of non-cash pre-tax ($235 million after-tax) impairment charges to reduce the carrying value of this Brazilian distribution business to its estimated fair value less costs to sell. The impairment charge reduced the carrying value of property, plant and equipment, other long-lived assets and goodwill by $31 million. The remaining difference between the business’ fair value and carrying value of $210 million was recorded as a liability and was included in other accrued liabilities in our consolidated balance sheet at March 31, 2015. Cumulative foreign currency translation losses of $17 million were included in the assessment of this business’ carrying value for purposes of calculating the impairment charge. Cumulative foreign currency translation losses, net of tax, were included in Accumulated Other Comprehensive Income on our consolidated balance sheet at March 31, 2015.
On January 31, 2016, we entered into an agreement to sell our Brazilian pharmaceutical distribution business to a third party. The sale is expected to be completed during the first half of 2017, subject to regulatory approval and customary closing conditions. We expect to recognize an after-tax charge of approximately $80 million to $100 million upon the disposition of the business within discontinued operations as a result of settlement of certain indemnification matters.
81
Technology Solutions Businesses
In 2014, we committed to a plan to sell our International Technology and our Hospital Automation businesses from our Technology Solutions segment. As required, in 2014, we classified the results of operations and cash flows of these businesses as discontinued operations for all applicable periods presented in our consolidated financial statements. Depreciation and amortization expense was not recognized from the date these businesses were classified as held for sale. During the third quarter of 2014, we completed the sale of our Hospital Automation business and recorded a pre-tax and after-tax loss of $5 million and $7 million.
During the third quarter of 2014, we recorded an $80 million non-cash pre-tax and after-tax impairment charge to reduce the carrying value of our International Technology business to its estimated fair value less costs to sell. The impairment charge was primarily attributed to goodwill and other long-lived assets and as a result, there was no tax benefit associated with this charge.
During the first quarter of 2015, we decided to retain the workforce business within our International Technology business. This business consists of workforce management solutions for the National Health Service in the United Kingdom. We reclassified the workforce business, which had been designated as a discontinued operation since the first quarter of 2014, to continuing operations in the first quarter of 2015. As a result, during the first quarter of 2015, we recorded non-cash pre-tax charges of $34 million ($27 million after-tax) primarily associated with depreciation and amortization expense for 2014 when the business was classified as held for sale. The non-cash charge was recorded in our consolidated statement of operations primarily in cost of sales.
During the second quarter of 2015, we completed the sale of a software business within our International Technology business and recorded a pre-tax and after-tax loss of $6 million.
A summary of results of discontinued operations is as follows:
Years Ended March 31, | |||||||||||
(In millions) | 2016 | 2015 | 2014 | ||||||||
Revenues | $ | 1,603 | $ | 2,196 | $ | 637 | |||||
Loss from discontinued operations | $ | (24 | ) | $ | (321 | ) | $ | (177 | ) | ||
Loss on sale | — | (6 | ) | (5 | ) | ||||||
Loss from discontinued operations before income tax | (24 | ) | (327 | ) | (182 | ) | |||||
Income tax (expense) benefit | (8 | ) | 28 | 26 | |||||||
Loss from discontinued operations, net of tax | $ | (32 | ) | $ | (299 | ) | $ | (156 | ) | ||
A summary of carrying amounts of major classes of assets and liabilities included as part of discontinued operations is as follow:
March 31, | |||||||
(In millions) | 2016 | 2015 | |||||
Receivables, net | $ | 289 | $ | 314 | |||
Inventories, net | 266 | 254 | |||||
Other assets | 80 | 92 | |||||
Total assets of discontinued operations (1) | 635 | 660 | |||||
Drafts and account payable | 264 | 209 | |||||
Short-term borrowings | 142 | 126 | |||||
Other liabilities | 254 | 328 | |||||
Total liabilities of discontinued operations (1) | $ | 660 | $ | 663 | |||
(1) Assets and liabilities of discontinued operations are included under the captions “Prepaid expenses and other” and “Other accrued liabilities” within our consolidated balance sheets.
82
10. | Noncontrolling Interests and Redeemable Noncontrolling Interests |
Domination and Profit and Loss Transfer Agreement
On May 22, 2014, Celesio and McKesson, through its wholly-owned subsidiary, Celesio Holdings Deutschland GmbH & Co. KGaA (“Celesio Holdings,” formerly known as McKesson Deutschland GmbH & Co. KGaA or Dragonfly GmbH & Co. KGaA), entered into the domination and profit and loss transfer agreement (the “Domination Agreement”). The Domination Agreement was approved at the general shareholders’ meeting of Celesio on July 15, 2014, approved by the Stuttgart Higher Regional Court for registration on December 2, 2014, and was registered in the commercial register of Celesio at the local court of Stuttgart on December 2, 2014. As a result, McKesson obtained the ability to pursue integration of the two companies on December 2, 2014. All litigation relating to the registration of the Domination Agreement has been resolved with no adverse impact on the effectiveness of the Domination Agreement or McKesson’s ability to direct the activities of Celesio.
Upon the effectiveness of the Domination Agreement, Celesio subordinated its management to McKesson and undertook to transfer all of its annual profits to McKesson, and McKesson undertook to compensate any annual losses incurred by Celesio and to grant, subject to a potential court review, the noncontrolling shareholders of Celesio (i) an annual recurring compensation of €0.83 per Celesio share (“Compensation Amount”), (ii) a one-time dividend for Celesio’s fiscal year ended December 31, 2014 of €0.83 per Celesio share reduced accordingly for any dividend paid by Celesio in relation to its fiscal year ended December 31, 2014 (“Guaranteed Dividend”) and (iii) a right to put (“Put Right”) their Celesio shares at €22.99 per share increased annually for interest in the amount of 5 percentage points above a base rate published by the German Bundesbank semiannually, less any Compensation Amount or Guaranteed Dividend already paid in respect of the relevant time period (“Put Amount”). The Domination Agreement does not have an expiration date and can be terminated by McKesson without cause in writing no earlier than March 31, 2020.
Under the Domination Agreement, the noncontrolling shareholders of Celesio ceased to participate in their percentage ownership of Celesio’s profits and losses, but instead became entitled to receive the one-time Guaranteed Dividend in December 2014 and the Compensation Amount from January 2015. As a result, during 2016 and 2015, we recorded a total attribution of net income to the noncontrolling shareholders of Celesio of $44 million and $62 million. All amounts were recorded in our consolidated statement of operations within the caption, “Net Income Attributable to Noncontrolling Interests,” and the corresponding liability balance was recorded within other accrued liabilities on our consolidated balance sheet.
Appraisal Proceedings
Subsequent to the Domination Agreement’s registration, certain noncontrolling shareholders of Celesio initiated appraisal proceedings (“Appraisal Proceedings”) with the Stuttgart Regional Court to challenge the Compensation Amount, Guaranteed Dividend and/or Put Amount. As long as any Appraisal Proceedings are pending, the Compensation Amount, Guaranteed Dividend and/or Put Amount will be paid as specified currently in the Domination Agreement. If any such Appraisal Proceedings result in an adjustment to the Compensation Amount, Guaranteed Dividend and/or Put Amount, Celesio Holdings would be required to make certain additional payments for any shortfall to all Celesio noncontrolling shareholders who previously received the Guaranteed Dividend, Compensation Amount and/or Put Amount. The Put Right specified in the Domination Agreement may be exercised until two months after the announcement regarding the end of the Appraisal Proceedings. In addition, if the Domination Agreement is terminated, the Put Right may be exercised for a two-month period after the date of termination.
Redeemable Noncontrolling Interests
Upon the effectiveness of the Domination Agreement, the noncontrolling interests in Celesio became redeemable as a result of the Put Right. Accordingly, the carrying value of noncontrolling interests related to Celesio of $1.5 billion was reclassified from “Total Equity” to “Redeemable Noncontrolling Interests” on our consolidated balance sheet during the third quarter of 2015. The balance of redeemable noncontrolling interests is reported at the greater of its carrying value or its maximum redemption value at each reporting date. The redemption value is the Put Amount adjusted for exchange rate fluctuations each period. At March 31, 2016 and 2015, the carrying value of redeemable noncontrolling interests of $1.41 billion and $1.39 billion exceeded the maximum redemption value of $1.28 billion and $1.21 billion. At March 31, 2016 and 2015, we owned approximately 76% of Celesio’s outstanding common shares.
83
Changes in noncontrolling interests and redeemable noncontrolling interests were as follows:
(In millions) | Noncontrolling interests | Redeemable Noncontrolling Interests | ||||
Balance, March 31, 2014 | $ | 1,796 | $ | — | ||
Net income attributable to noncontrolling interests (1) | 5 | 62 | ||||
Other comprehensive loss | (174 | ) | (105 | ) | ||
Purchase of noncontrolling interests (2) (3) (4) | (60 | ) | (9 | ) | ||
Reclassification from Total Equity to Redeemable Noncontrolling Interests (5) | (1,500 | ) | 1,500 | |||
Reclassification of guaranteed dividends and recurring compensation to other accrued liabilities | — | (62 | ) | |||
Other | 17 | — | ||||
Balance, March 31, 2015 | 84 | 1,386 | ||||
Net income attributable to noncontrolling interests (1) | 8 | 44 | ||||
Other comprehensive loss | — | 20 | ||||
Reclassification of recurring compensation to other accrued liabilities | — | (44 | ) | |||
Other | (8 | ) | — | |||
Balance, March 31, 2016 | $ | 84 | $ | 1,406 | ||
(1) | Redeemable noncontrolling interests for 2015 include the Guaranteed Dividend of $50 million and the Compensation Amount of $12 million, and for 2016 include the Compensation Amount of $44 million. |
(2) | Includes $35 million decrease in noncontrolling interests resulting from the April 2014 completion of McKesson’s tender offer for approximately 1 million additional Celesio shares. |
(3) | Includes $25 million decrease in noncontrolling interests resulting from the July 2014 purchase of the remaining ownership interests in a wholesale distributor in Brazil. |
(4) | Decrease in redeemable noncontrolling interests reflects the exercise of the Put Right by the noncontrolling shareholders of Celesio. |
(5) | Includes net foreign currency losses of $138 million attributable to noncontrolling interests. |
84
11. | Earnings Per Common Share |
Basic earnings per common share are computed by dividing net income by the weighted average number of common shares outstanding during the reporting period. Diluted earnings per common share are computed similar to basic earnings per common share except that it reflects the potential dilution that could occur if dilutive securities or other obligations to issue common stock were exercised or converted into common stock.
The computations for basic and diluted earnings per common share are as follows:
Years Ended March 31, | |||||||||||
(In millions, except per share amounts) | 2016 | 2015 | 2014 | ||||||||
Income from continuing operations | $ | 2,342 | $ | 1,842 | $ | 1,414 | |||||
Net (income) loss attributable to noncontrolling interests | (52 | ) | (67 | ) | 5 | ||||||
Income from continuing operations attributable to McKesson | 2,290 | 1,775 | 1,419 | ||||||||
Loss from discontinued operations, net of tax | (32 | ) | (299 | ) | (156 | ) | |||||
Net income attributable to McKesson | $ | 2,258 | $ | 1,476 | $ | 1,263 | |||||
Weighted average common shares outstanding: | |||||||||||
Basic | 230 | 232 | 229 | ||||||||
Effect of dilutive securities: | |||||||||||
Options to purchase common stock | 1 | 1 | 1 | ||||||||
Restricted stock units | 2 | 2 | 3 | ||||||||
Diluted | 233 | 235 | 233 | ||||||||
Earnings (loss) per common share attributable to McKesson: (1) | |||||||||||
Diluted | |||||||||||
Continuing operations | $ | 9.84 | $ | 7.54 | $ | 6.08 | |||||
Discontinued operations | (0.14 | ) | (1.27 | ) | (0.67 | ) | |||||
Total | $ | 9.70 | $ | 6.27 | $ | 5.41 | |||||
Basic | |||||||||||
Continuing operations | $ | 9.96 | $ | 7.66 | $ | 6.19 | |||||
Discontinued operations | (0.14 | ) | (1.29 | ) | (0.68 | ) | |||||
Total | $ | 9.82 | $ | 6.37 | $ | 5.51 | |||||
(1) | Certain computations may reflect rounding adjustments. |
Potentially dilutive securities include outstanding stock options, restricted stock units, and performance-based and other restricted stock units. Approximately 2 million, 1 million and 2 million of potentially dilutive securities were excluded from the computations of diluted net earnings per common share in 2016, 2015 and 2014, as they were anti-dilutive.
12. Receivables, Net
March 31, | |||||||
(In millions) | 2016 | 2015 | |||||
Customer accounts | $ | 14,519 | $ | 13,117 | |||
Other | 3,711 | 2,965 | |||||
Total | 18,230 | 16,082 | |||||
Allowances | (250 | ) | (168 | ) | |||
Net | $ | 17,980 | $ | 15,914 | |||
Other receivables primarily include amounts due from suppliers and customer unbilled receivables. The allowances are primarily for estimated uncollectible accounts.
85
13. | Property, Plant and Equipment, Net |
March 31, | |||||||
(In millions) | 2016 | 2015 | |||||
Land | $ | 228 | $ | 207 | |||
Building, machinery, equipment and other | 3,556 | 3,237 | |||||
Total property, plant and equipment | 3,784 | 3,444 | |||||
Accumulated depreciation | (1,506 | ) | (1,399 | ) | |||
Property, plant and equipment, net | $ | 2,278 | $ | 2,045 | |||
14. | Goodwill and Intangible Assets, Net |
Changes in the carrying amount of goodwill were as follows:
(In millions) | Distribution Solutions | Technology Solutions | Total | ||||||||
Balance, March 31, 2014 | $ | 8,078 | $ | 1,849 | $ | 9,927 | |||||
Goodwill acquired | 93 | — | 93 | ||||||||
Amount reclassified to assets held-for-sale | (14 | ) | (1 | ) | (15 | ) | |||||
Acquisition accounting, transfers and other adjustments | 625 | — | 625 | ||||||||
Foreign currency translation adjustments, net | (788 | ) | (25 | ) | (813 | ) | |||||
Balance, March 31, 2015 | $ | 7,994 | $ | 1,823 | $ | 9,817 | |||||
Goodwill acquired | 21 | — | 21 | ||||||||
Acquisition accounting, transfers and other adjustments | 8 | — | 8 | ||||||||
Goodwill disposed | (59 | ) | (27 | ) | (86 | ) | |||||
Foreign currency translation adjustments, net | 23 | 3 | 26 | ||||||||
Balance, March 31, 2016 | $ | 7,987 | $ | 1,799 | $ | 9,786 | |||||
As of March 31, 2016 and 2015, the accumulated goodwill impairment losses were $36 million in our Technology Solutions segment.
Information regarding intangible assets is as follows:
March 31, 2016 | March 31, 2015 | ||||||||||||||||||||||||
(Dollars in millions) | Weighted Average Remaining Amortization Period (Years) | Gross Carrying Amount | Accumulated Amortization | Net Carrying Amount | Gross Carrying Amount | Accumulated Amortization | Net Carrying Amount | ||||||||||||||||||
Customer lists | 7 | $ | 2,652 | $ | (1,324 | ) | $ | 1,328 | $ | 2,683 | $ | (1,116 | ) | $ | 1,567 | ||||||||||
Service agreements | 14 | 959 | (269 | ) | 690 | 957 | (215 | ) | 742 | ||||||||||||||||
Pharmacy licenses | 25 | 857 | (121 | ) | 736 | 874 | (65 | ) | 809 | ||||||||||||||||
Trademarks and trade names | 14 | 314 | (96 | ) | 218 | 315 | (82 | ) | 233 | ||||||||||||||||
Technology | 2 | 195 | (182 | ) | 13 | 213 | (184 | ) | 29 | ||||||||||||||||
Other | 3 | 163 | (127 | ) | 36 | 162 | (101 | ) | 61 | ||||||||||||||||
Total | $ | 5,140 | $ | (2,119 | ) | $ | 3,021 | $ | 5,204 | $ | (1,763 | ) | $ | 3,441 | |||||||||||
86
Amortization expense of intangible assets was $431 million, $494 million and $319 million for 2016, 2015 and 2014. Estimated annual amortization expense of intangible assets is as follows: $355 million, $337 million, $308 million, $281 million and $262 million for 2017 through 2021, and $1,478 million thereafter. All intangible assets were subject to amortization as of March 31, 2016 and 2015.
15. | Capitalized Software Held for Sale, Net |
Changes in the carrying amount of capitalized software held for sale, net, which is included in other assets in the consolidated balance sheets, were as follows:
Years Ended March 31, | |||||||||||
(In millions) | 2016 | 2015 | 2014 | ||||||||
Balance, at beginning of period | $ | 91 | $ | 103 | $ | 126 | |||||
Amounts capitalized | 30 | 34 | 40 | ||||||||
Amortization expense | (37 | ) | (40 | ) | (50 | ) | |||||
Impairment charges | — | — | (12 | ) | |||||||
Disposal | (5 | ) | — | — | |||||||
Foreign currency translations adjustments, net | (1 | ) | (6 | ) | (1 | ) | |||||
Balance, at end of period | $ | 78 | $ | 91 | $ | 103 | |||||
87
16. | Debt and Financing Activities |
Long-term debt consisted of the following:
March 31, | |||||||
(In millions) | 2016 | 2015 | |||||
U.S. Dollar notes (1) | |||||||
Floating Rate Notes due September 10, 2015 | $ | — | $ | 400 | |||
0.95% Notes due December 4, 2015 | — | 500 | |||||
3.25% Notes due March 1, 2016 | — | 600 | |||||
5.70% Notes due March 1, 2017 | 500 | 500 | |||||
1.29% Notes due March 10, 2017 | 700 | 700 | |||||
1.40% Notes due March 15, 2018 | 500 | 499 | |||||
7.50% Notes due February 15, 2019 | 350 | 349 | |||||
2.28% Notes due March 15, 2019 | 1,100 | 1,100 | |||||
4.75% Notes due March 1, 2021 | 599 | 599 | |||||
2.70% Notes due December 15, 2022 | 400 | 400 | |||||
2.85% Notes due March 15, 2023 | 400 | 400 | |||||
3.80% Notes due March 15, 2024 | 1,100 | 1,100 | |||||
7.65% Debentures due March 1, 2027 | 175 | 175 | |||||
6.00% Notes due March 1, 2041 | 493 | 493 | |||||
4.88% Notes due March 15, 2044 | 800 | 800 | |||||
Foreign currency notes (2) | |||||||
4.00% Bonds due October 18, 2016 | 403 | 388 | |||||
4.50% Bonds due April 26, 2017 | 583 | 563 | |||||
Lease and other obligations | 44 | 143 | |||||
Total debt | 8,147 | 9,709 | |||||
Less current portion | (1,612 | ) | (1,529 | ) | |||
Total long-term debt | $ | 6,535 | $ | 8,180 | |||
(1) | Interest on these notes is payable semiannually each year. These notes are unsecured and unsubordinated obligations of the Company. |
(2) | Interest on these Euro-denominated bonds is due annually each year. |
Long-Term Debt
Our long-term debt includes both U.S. dollar and foreign currency denominated borrowings. At March 31, 2016 and March 31, 2015, $8,147 million and $9,709 million of total debt were outstanding, of which $1,612 million and $1,529 million were included under the caption “Current portion of long-term debt” within our consolidated balance sheets.
On March 5, 2014, we issued floating rate notes due September 10, 2015 in an aggregate principal amount of $400 million (“Floating Rate Notes”), 1.29% notes due March 10, 2017 in an aggregate principal amount of $700 million (“2017 Notes”), 2.28% notes due March 15, 2019 in an aggregate principal amount of $1,100 million (“2019 Notes”), 3.80% notes due March 15, 2024 in an aggregate principal amount of $1,100 million (“2024 Notes”) and 4.88% notes due March 15, 2044 in an aggregate principal amount of $800 million (“2044 Notes”). Interest on the 2017 Notes is payable on March 10 and September 10 of each year. Interest on the 2019 Notes, the 2024 Notes and the 2044 Notes is payable on March 15 and September 15 of each year. We utilized the net proceeds from the issuance of these notes (each note constitutes a “Series”) of $4,068 million, net of discounts and offering expenses, to repay the borrowings under our 2014 Bridge Loan, as further described below.
88
Each Series constitutes an unsecured and unsubordinated obligation of the Company and ranks equally with all of the Company’s existing and, from time-to-time, future unsecured and unsubordinated indebtedness outstanding. Each Series is governed by materially similar indentures and officers’ certificate specifying certain terms of each Series. Upon 30 days notice to holders of a Series, we may redeem that Series at any time prior to maturity, in whole or in part, for cash at redemption prices that include accrued and unpaid interest and a make-whole premium, as specified in the indenture and officers’ certificate relating to that Series. In the event of the occurrence of both (1) a change of control of the Company and (2) a downgrade of a Series below an investment grade rating by each of Fitch Ratings, Moody’s Investors Service, Inc. and Standard & Poor’s Ratings Services within a specified period, an offer must be made to purchase that Series from the holders at a price in cash equal to 101% of the then outstanding principal amount of that Series, plus accrued and unpaid interest to, but not including, the date of repurchase. The indenture and the related officers’ certificate for each Series, subject to the exceptions and in compliance with the conditions as applicable, specify that we may not incur liens, enter into sale and leaseback transactions or consolidate, merge or sell all or substantially all of our assets. The indentures also contain customary events of default provisions.
Senior Bridge Term Loan Facilities
In connection with our acquisition of Celesio, in January 2014, we entered into a $5.5 billion 364‑day unsecured Senior Bridge Term Loan Agreement (the “2014 Bridge Loan”) under terms substantially similar to those in our existing revolving credit facility. On February 4, 2014, we borrowed $4,957 million under this facility with such proceeds and cash on hand used to fund the acquisition of Celesio. On March 10, 2014, we repaid $4,076 million of the 2014 Bridge Loan borrowings with funds obtained from the issuance of long-term debt. On March 11, 2014, we repaid the remaining balance of the 2014 Bridge Loan borrowings using funds drawn on our Accounts Receivable Sales Facility and cash on hand. On April 30, 2014, the commitments under the 2014 Bridge Loan automatically terminated upon the settlement of the tender offers for the remaining common shares of Celesio. During the time it was outstanding, the 2014 Bridge Loan borrowings bore interest at 1.39% per annum, based on the London Interbank Offered Rate plus a margin based on the Company’s credit rating. Interest expense for 2014 included a total of $46 million of fees related to the 2014 Bridge Loan and a bridge loan agreement entered into during the third quarter of 2014 in anticipation of an earlier acquisition of Celesio.
Other Information
Scheduled future payments of long-term debt are $1,612 million in 2017, $1,092 million in 2018, $1,458 million in 2019, $3 million in 2020, $2 million in 2021 and $3,980 million thereafter.
In 2016, we repaid our $400 million floating rate notes due September 10, 2015 at maturity, $500 million 0.95% notes due December 4, 2015 at maturity and $600 million 3.25% notes due March 1, 2016 at maturity. In 2014, we repaid our $350 million 6.50% Notes due February 15, 2014.
Revolving Credit Facilities
During the third quarter of 2016, we entered into a syndicated $3.5 billion five-year senior unsecured revolving credit facility (the “Global Facility”). The Global Facility has a $3.15 billion aggregate sublimit of availability in Canadian dollars, British pound sterling and Euros. The remaining terms and conditions of the Global Facility are substantially similar to those previously in place under the $1.3 billion revolving credit facility which was terminated in October 2015. There were no borrowings outstanding under this facility as of March 31, 2016.
The Global Facility contains a financial covenant which obligates the Company to maintain a debt to capital ratio of no greater than 65% and other customary investment grade covenants. If we do not comply with these covenants, our ability to use the Global Facility may be suspended and repayment of any outstanding balances under the Global Facility may be required. At March 31, 2016, we were in compliance with all covenants.
At March 31, 2015, we had a syndicated $1.3 billion five-year senior unsecured revolving credit facility with the original expiration date in September 2016, as well as a syndicated €500 million five-year senior unsecured revolving credit facility with the original expiration date in February 2018. Both revolving credit facilities were terminated in connection with the execution of a new $3.5 billion global facility in October 2015, as discussed above. There were no borrowings outstanding under these facilities during the last three years, and as of March 31, 2015.
89
We also maintain bilateral credit lines primarily denominated in Euros with a total committed and uncommitted balance of $427 million. These credit lines have interest rates ranging from 0.18% to 6.00%. During 2016 and 2015, we borrowed $641 million and $225 million and repaid $635 million and $267 million under these credit lines primarily related to short‑term borrowings. Borrowings and repayments during 2014 were not material. As of March 31, 2016 and 2015, there were $28 million and $29 million outstanding under these credit lines.
Accounts Receivable Facilities
Following the execution of the Global Facility, we also terminated an accounts receivable sales facility (the “AR Facility”) with a committed balance of $1.35 billion during the third quarter of 2016. There were no borrowings outstanding under the AR Facility during 2016 and 2015. In 2014, we borrowed $550 million under the AR Facility and repaid $550 million. At March 31, 2015, there were no secured borrowings and related securitized accounts receivable outstanding under the AR Facility. The AR Facility contained requirements relating to the performance of the accounts receivable and covenants relating to the Company. If we did not comply with these covenants, our ability to use the AR Facility would have been suspended and repayment of any outstanding balances under the AR Facility would have been required. At March 31, 2015, we were in compliance with all covenants.
We also have Accounts Receivable Factoring Facilities (the “Factoring Facilities”) denominated in foreign currencies. Transactions under these facilities are accounted for as secured borrowings and have interest rates ranging from 0.85% to 1.26%. During 2016, 2015 and 2014, we borrowed $919 million, $2,875 million and $570 million and repaid $1,055 million, $2,908 million and $575 million in short-term borrowings under these facilities. At March 31, 2016 and 2015, there were $7 million and $135 million in secured borrowings outstanding under these facilities. All of the Factoring Facilities expired through April 2016.
Commercial Paper
We maintain a commercial paper program to support our working capital requirements and for other general corporate purposes. In November 2015, we replaced the existing program with a new commercial paper program through which the Company can issue up to $3.5 billion in outstanding notes. There were no material commercial paper issuances during the last three years and no amounts outstanding at March 31, 2016.
17. | Variable Interest Entities |
We evaluate our ownership, contractual and other interests in entities to determine if they are variable interest entities (“VIEs”), if we have a variable interest in those entities and the nature and extent of those interests. These evaluations are highly complex and involve judgment and the use of estimates and assumptions based on available historical information and management’s judgment, among other factors. Based on our evaluations, if we determine we are the primary beneficiary of such VIEs, we consolidate such entities into our financial statements.
Consolidated Variable Interest Entities
We consolidate VIEs when we have the power to direct the activities that most significantly impact the VIE’s economic performance and the obligation to absorb losses or the right to receive benefits of the VIE and, as a result, are considered the primary beneficiary of the VIE. We consolidate certain single-lessee leasing entities where we, as the lessee, have the majority risk of the leased assets due to our minimum lease payment obligations to these leasing entities. As a result of absorbing this risk, the leases provide us with the power to direct the operations of the leased properties and the obligation to absorb losses or the right to receive benefits of the entity. Consolidated VIEs have an immaterial impact on our consolidated statements of operations and cash flows. Total assets and liabilities included in our consolidated balance sheet for these VIEs were $119 million and $44 million at March 31, 2016 and $144 million and $51 million at March 31, 2015.
90
Investments in Unconsolidated Variable Interest Entities
We are involved with VIEs which we do not consolidate because we do not have the power to direct the activities that most significantly impact their economic performance and thus are not considered the primary beneficiary of the entities. Our relationships include equity investments and lending, leasing, contractual or other relationships with the VIEs. Our most significant relationships are with oncology and other specialty practices. Under these practice arrangements, we generally own or lease all of the real estate and equipment used by the affiliated practices and manage the practices’ administrative functions. We also have relationships with certain pharmacies in Europe with whom we may provide financing, have equity ownership and/or a supply agreement whereby we supply the vast majority of the pharmacies’ purchases. Our maximum exposure to loss (regardless of probability) as a result of all unconsolidated VIEs were $1.1 billion and $1.2 billion at March 31, 2016 and 2015, which primarily represents the value of intangible assets related to service agreements, equity investments and lease and loan receivables. These amounts exclude the customer loan guarantees discussed in Financial Note 23, “Financial Guarantees and Warranties.” We believe that there is no material loss exposure on these assets or from these relationships.
18. | Pension Benefits |
We maintain a number of qualified and nonqualified defined benefit pension plans and defined contribution plans for eligible employees.
Defined Benefit Pension Plans
Eligible U.S. employees who were employed by the Company as of December 31, 1995 are covered under the Company-sponsored defined benefit retirement plan. In 1997, the plan was amended to freeze all plan benefits as of December 31, 1996. Benefits for the defined benefit retirement plan are based primarily on age of employees at date of retirement, years of creditable service and the average of the highest 60 months of pay during the 15 years prior to the plan freeze date. We also have defined benefit pension plans for eligible employees outside of the U.S., as well as an unfunded nonqualified supplemental defined benefit plan for certain U.S. executives.
91
Our non-U.S. defined benefit pension plans cover eligible employees located predominantly in Norway, United Kingdom and Germany. Benefits for these plans are based primarily on each employee’s final salary, with annual adjustments for inflation. The obligations in Norway are largely related to the state-regulated pension plan which is managed by the Norwegian Public Service Pension Fund (“SPK”). According to the terms of the SPK, the plan assets of state regulated plans in Norway must correspond very closely to the pension obligation calculated using the principles codified in Norwegian law. The shortfall may not exceed 1% of the obligation. If the shortfall exceeds this threshold, it must be remedied within two years. In the United Kingdom, we have subsidiaries that participate in a joint pension plan. This plan is largely funded by contractual trust arrangements that hold Company assets that may only be used to pay pension obligations. The Trustee Board decides on the minimum contribution to the plan in association with selected employees of the entity. A valuation is performed at regular intervals in order to determine the amount of the contribution and to ensure that the minimum contribution is made. The pension obligation in Germany is unfunded with the exception of the contractual trust arrangement used to fund pensions of Celesio’s Management Board.
Defined benefit plan assets and obligations are measured as of the Company’s fiscal year-end.
The net periodic expense for our pension plans, which includes net pension expense of Celesio beginning February 2014, is as follows:
U.S. Plans | Non-U.S. Plans | ||||||||||||||||||||||
Years Ended March 31, | Years Ended March 31, | ||||||||||||||||||||||
(In millions) | 2016 | 2015 | 2014 | 2016 | 2015 | 2014 | |||||||||||||||||
Service cost - benefits earned during the year | $ | 4 | $ | 1 | $ | 4 | $ | 20 | $ | 16 | $ | 6 | |||||||||||
Interest cost on projected benefit obligation | 18 | 19 | 19 | 24 | 34 | 11 | |||||||||||||||||
Expected return on assets | (19 | ) | (21 | ) | (20 | ) | (30 | ) | (30 | ) | (12 | ) | |||||||||||
Amortization of unrecognized actuarial loss, prior service costs and net transitional obligation | 42 | 19 | 32 | 3 | 3 | 4 | |||||||||||||||||
Curtailment/settlement loss (gain) | 2 | — | — | — | 6 | (1 | ) | ||||||||||||||||
Net periodic pension expense | $ | 47 | $ | 18 | $ | 35 | $ | 17 | $ | 29 | $ | 8 | |||||||||||
The projected unit credit method is utilized in measuring net periodic pension expense over the employees’ service life for the pension plans. Unrecognized actuarial losses exceeding 10% of the greater of the projected benefit obligation or the market value of assets are amortized straight-line over the average remaining future service periods.
92
Information regarding the changes in benefit obligations and plan assets for our pension plans is as follows:
U.S. Plans | Non-U.S. Plans | ||||||||||||||
Years Ended March 31, | Years Ended March 31, | ||||||||||||||
(In millions) | 2016 | 2015 | 2016 | 2015 | |||||||||||
Change in benefit obligations | |||||||||||||||
Benefit obligation at beginning of period (1) | $ | 583 | $ | 540 | $ | 963 | $ | 934 | |||||||
Service cost | 4 | 1 | 20 | 16 | |||||||||||
Interest cost | 18 | 19 | 24 | 34 | |||||||||||
Actuarial loss (gain) | (13 | ) | 53 | (64 | ) | 194 | |||||||||
Benefit payments | (54 | ) | (30 | ) | (35 | ) | (49 | ) | |||||||
Amendments | — | — | (2 | ) | (6 | ) | |||||||||
Expenses paid | (3 | ) | — | — | — | ||||||||||
Foreign exchange impact and other | — | — | (7 | ) | (160 | ) | |||||||||
Benefit obligation at end of period (1) | $ | 535 | $ | 583 | $ | 899 | $ | 963 | |||||||
Change in plan assets | |||||||||||||||
Fair value of plan assets at beginning of period | $ | 298 | $ | 300 | $ | 612 | $ | 590 | |||||||
Actual return on plan assets | (3 | ) | 16 | 2 | 88 | ||||||||||
Employer and participant contributions | 24 | 12 | 44 | 73 | |||||||||||
Benefits paid | (54 | ) | (30 | ) | (35 | ) | (49 | ) | |||||||
Expenses paid | (3 | ) | — | — | — | ||||||||||
Foreign exchange impact and other | — | — | (16 | ) | (90 | ) | |||||||||
Fair value of plan assets at end of period | $ | 262 | $ | 298 | $ | 607 | $ | 612 | |||||||
Funded status at end of period | $ | (273 | ) | $ | (285 | ) | $ | (292 | ) | $ | (351 | ) | |||
Amounts recognized on the balance sheet | |||||||||||||||
Assets | $ | — | $ | — | $ | 21 | $ | — | |||||||
Current liabilities | (2 | ) | (17 | ) | (11 | ) | (6 | ) | |||||||
Long-term liabilities | (271 | ) | (268 | ) | (302 | ) | (345 | ) | |||||||
Total | $ | (273 | ) | $ | (285 | ) | $ | (292 | ) | $ | (351 | ) | |||
(1) | The benefit obligation is the projected benefit obligation. |
The following table provides the projected benefit obligation, accumulated benefit obligation and fair value of plan assets for all our pension plans with an accumulated benefit obligation in excess of plan assets.
U.S. Plans | Non-U.S. Plans | ||||||||||||||
March 31, | March 31, | ||||||||||||||
(In millions) | 2016 | 2015 | 2016 | 2015 | |||||||||||
Projected benefit obligation | $ | 535 | $ | 583 | $ | 899 | $ | 963 | |||||||
Accumulated benefit obligation | 535 | 583 | 855 | 897 | |||||||||||
Fair value of plan assets | 262 | 298 | 607 | 612 | |||||||||||
93
Amounts recognized in accumulated other comprehensive income (pre-tax) consist of:
U.S. Plans | Non-U.S. Plans | ||||||||||||||
March 31, | March 31, | ||||||||||||||
(In millions) | 2016 | 2015 | 2016 | 2015 | |||||||||||
Net actuarial loss | $ | 185 | $ | 220 | $ | 133 | $ | 175 | |||||||
Prior service credit | — | — | (11 | ) | (6 | ) | |||||||||
Total | $ | 185 | $ | 220 | $ | 122 | $ | 169 | |||||||
Other changes in accumulated other comprehensive income (pre-tax) were as follows:
U.S. Plans | Non-U.S. Plans | ||||||||||||||||||||||
Years Ended March 31, | Years Ended March 31, | ||||||||||||||||||||||
(In millions) | 2016 | 2015 | 2014 | 2016 | 2015 | 2014 | |||||||||||||||||
Net actuarial loss (gain) | $ | 9 | $ | 58 | $ | (31 | ) | $ | (38 | ) | $ | 117 | $ | 12 | |||||||||
Prior service credit | — | — | (8 | ) | (5 | ) | (8 | ) | — | ||||||||||||||
Amortization of: | |||||||||||||||||||||||
Net actuarial loss | (44 | ) | (27 | ) | (32 | ) | (5 | ) | (5 | ) | (4 | ) | |||||||||||
Prior service credit (cost) | — | 8 | — | 2 | 2 | 2 | |||||||||||||||||
Foreign exchange impact and other | — | — | (1 | ) | (1 | ) | (8 | ) | 4 | ||||||||||||||
Total recognized in other comprehensive loss (income) | $ | (35 | ) | $ | 39 | $ | (72 | ) | $ | (47 | ) | $ | 98 | $ | 14 | ||||||||
We expect to amortize $15 million of actuarial loss for the pension plans from stockholders’ equity to pension expense in 2017. Comparable 2016 amounts were $1 million of prior service credit and $47 million of actuarial loss.
Projected benefit obligations related to our unfunded U.S. plans were $175 million and $189 million at March 31, 2016 and 2015. Pension obligations for our unfunded plans are based on the recommendations of independent actuaries. Projected benefit obligations relating to our unfunded non-U.S. plans were $272 million and $222 million at March 31, 2016 and 2015. Funding obligations for our non-U.S. plans vary based on the laws of each non-U.S. jurisdiction.
Expected benefit payments, including assumed executive lump sum payments, for our pension plans are as follows: $59 million, $174 million, $110 million, $66 million and $65 million for 2017 to 2021 and $327 million for 2022 through 2026. Expected benefit payments are based on the same assumptions used to measure the benefit obligations and include estimated future employee service. Expected contributions to be made for our pension plans are $15 million for 2017.
Weighted-average assumptions used to estimate the net periodic pension expense and the actuarial present value of benefit obligations were as follows:
U.S. Plans | Non-U.S. Plans | ||||||||||||||||
Years Ended March 31, | Years Ended March 31, | ||||||||||||||||
2016 | 2015 | 2014 | 2016 | 2015 | 2014 | ||||||||||||
Net periodic pension expense | |||||||||||||||||
Discount rates | 3.36 | % | 3.74 | % | 3.39 | % | 2.36 | % | 3.85 | % | 3.95 | % | |||||
Rate of increase in compensation | 4.00 | 4.00 | 4.00 | 2.80 | 3.11 | 2.66 | |||||||||||
Expected long-term rate of return on plan assets | 6.75 | 7.25 | 7.25 | 4.87 | 5.39 | 5.71 | |||||||||||
Benefit obligation | |||||||||||||||||
Discount rates | 3.27 | % | 3.18 | % | 3.58 | % | 2.84 | % | 2.50 | % | 3.92 | % | |||||
Rate of increase in compensation | 4.00 | 4.00 | 4.00 | 2.98 | 3.24 | 3.27 | |||||||||||
94
Our defined benefit pension plan liabilities are valued using a discount rate based on a yield curve developed from a portfolio of high quality corporate bonds rated AA or better whose maturities are aligned with the expected benefit payments of our plans. For March 31, 2016, our U.S. defined benefit liabilities are valued using a weighted average discount rate of 3.27%, which represents an increase of 9 basis points from our 2015 weighted-average discount rate of 3.18%. Our non-U.S defined benefit pension plan liabilities are valued using a weighted-average discount rate of 2.84%, which represents an increase of 34 basis points from our 2015 weighted-average discount rate of 2.50%.
Sensitivity to changes in the weighted-average discount rate for our pension plans is as follows:
U.S. Plans | Non-U.S. Plans | ||||||||||
(In millions) | One Percentage Point Increase | One Percentage Point Decrease | One Percentage Point Increase | One Percentage Point Decrease | |||||||
Increase (decrease) on projected benefit obligation | $ | (35) | $ | 41 | $ | (85) | $ | 101 | |||
Increase (decrease) on net periodic pension cost | — | — | (4) | 6 | |||||||
Plan Assets
Investment Strategy: The overall objective for U. S. pension plan assets is to generate long-term investment returns consistent with capital preservation and prudent investment practices, with a diversification of asset types and investment strategies. Periodic adjustments are made to provide liquidity for benefit payments and to rebalance plan assets to their target allocations.
The target allocations for U.S. plan assets at March 31, 2016 and 2015 are 50% equity investments, 45% fixed income investments including cash and cash equivalents and 5% real estate. Equity investments include common stock, preferred stock, and equity commingled funds. Fixed income investments include corporate bonds, government securities, mortgage-backed securities, asset-backed securities, other directly held fixed income investments, and fixed income commingled funds. The real estate investment is in a commingled real estate fund.
For both U.S. and non-U.S. plan assets, the investment strategies are subject to local regulations and the asset/liability profiles of the plans in each individual country. Plan assets of the non-U.S. plans are broadly invested in a manner appropriate to the nature and duration of the expected future retirement benefits payable under the plans. Plan assets are primarily invested in high-quality corporate and government bond funds and equity securities. Assets are properly diversified to avoid excessive reliance on any particular asset, issuer or group of undertakings so as to avoid accumulations of risk in the portfolio as a whole.
We develop the expected long-term rate of return assumption based on the projected performance of the asset classes in which plan assets are invested. The target asset allocation was determined based on the liability and risk tolerance characteristics of the plans and at times may be adjusted to achieve overall investment objectives.
Fair Value Measurements: The following tables represent our pension plan assets as of March 31, 2016 and 2015, using the fair value hierarchy by asset class. The fair value hierarchy has three levels based on the reliability of the inputs used to determine fair value. Level 1 refers to fair values determined based on unadjusted quoted prices in active markets for identical assets. Level 2 refers to fair values estimated using significant other observable inputs and Level 3 includes fair values estimated using significant unobservable inputs.
95
U.S. Plans | Non-U.S. Plans | ||||||||||||||||||||||||||||||
March 31, 2016 | March 31, 2016 | ||||||||||||||||||||||||||||||
(In millions) | Level 1 | Level 2 | Level 3 | Total | Level 1 | Level 2 | Level 3 | Total | |||||||||||||||||||||||
Cash and cash equivalents | $ | 4 | $ | — | $ | — | $ | 4 | $ | 4 | $ | — | $ | — | $ | 4 | |||||||||||||||
Equity securities: | |||||||||||||||||||||||||||||||
Common and preferred stock | 16 | — | — | 16 | — | — | — | — | |||||||||||||||||||||||
Equity commingled funds | — | 165 | — | 165 | 6 | 150 | — | 156 | |||||||||||||||||||||||
Fixed income securities: | |||||||||||||||||||||||||||||||
Government securities | — | 12 | — | 12 | 23 | 68 | — | 91 | |||||||||||||||||||||||
Corporate bonds | — | 12 | — | 12 | 1 | 14 | — | 15 | |||||||||||||||||||||||
Mortgage-backed securities | — | 14 | — | 14 | — | — | — | — | |||||||||||||||||||||||
Asset-backed securities and other | — | 22 | — | 22 | — | — | — | — | |||||||||||||||||||||||
Fixed income commingled funds | — | — | — | — | 66 | 120 | — | 186 | |||||||||||||||||||||||
Other: | |||||||||||||||||||||||||||||||
Real estate funds | — | — | 17 | 17 | — | — | 24 | 24 | |||||||||||||||||||||||
Other | — | — | — | — | 21 | 107 | 3 | 131 | |||||||||||||||||||||||
Total | $ | 20 | $ | 225 | $ | 17 | $ | 262 | $ | 121 | $ | 459 | $ | 27 | $ | 607 | |||||||||||||||
U.S. Plans | Non-U.S. Plans | ||||||||||||||||||||||||||||||
March 31, 2015 | March 31, 2015 | ||||||||||||||||||||||||||||||
(In millions) | Level 1 | Level 2 | Level 3 | Total | Level 1 | Level 2 | Level 3 | Total | |||||||||||||||||||||||
Cash and cash equivalents | $ | 55 | $ | 1 | $ | — | $ | 56 | $ | 8 | $ | — | $ | — | $ | 8 | |||||||||||||||
Equity securities: | |||||||||||||||||||||||||||||||
Common and preferred stock | 18 | — | — | 18 | — | — | — | — | |||||||||||||||||||||||
Equity commingled funds | — | 138 | — | 138 | 7 | 149 | — | 156 | |||||||||||||||||||||||
Fixed income securities: | |||||||||||||||||||||||||||||||
Government securities | — | 14 | — | 14 | 26 | 53 | — | 79 | |||||||||||||||||||||||
Corporate bonds | — | 14 | — | 14 | — | 13 | — | 13 | |||||||||||||||||||||||
Mortgage-backed securities | — | 14 | — | 14 | — | — | — | — | |||||||||||||||||||||||
Asset-backed securities and other | — | 26 | — | 26 | — | — | — | — | |||||||||||||||||||||||
Fixed income commingled funds | — | — | — | — | 64 | 127 | — | 191 | |||||||||||||||||||||||
Other: | |||||||||||||||||||||||||||||||
Real estate funds | — | — | 18 | 18 | — | — | 26 | 26 | |||||||||||||||||||||||
Other commingled funds | — | — | — | — | — | 13 | — | 13 | |||||||||||||||||||||||
Other | — | — | — | — | 7 | 115 | 4 | 126 | |||||||||||||||||||||||
Total | $ | 73 | $ | 207 | $ | 18 | $ | 298 | $ | 112 | $ | 470 | $ | 30 | $ | 612 | |||||||||||||||
96
Cash and cash equivalents - Cash and cash equivalents include short-term investment funds that maintain daily liquidity and aim to have constant unit values of $1.00. The funds invest in short-term fixed income securities and other securities with debt-like characteristics emphasizing short-term maturities and high credit quality. Directly held cash and cash equivalents are classified as Level 1 investments. Cash and cash equivalents include money market funds and other commingled funds, which have daily net asset values derived from the underlying securities; these are classified as Level 1 investments.
Common and preferred stock - This investment class consists of common and preferred shares issued by U.S. and non-U.S. corporations. Common shares are traded actively on exchanges and price quotes are readily available. Preferred shares may not be actively traded. Holdings of common shares are generally classified as Level 1 investments. Preferred shares are classified as Level 2 investments.
Equity commingled funds - Some equity investments are held in commingled funds, which have daily net asset values derived from quoted prices for the underlying securities in active markets; these are classified as Level 1 or Level 2 investments.
Fixed income securities - Government securities consist of bonds and debentures issued by central governments or federal agencies; corporate bonds consist of bonds and debentures issued by corporations; mortgage-backed securities consist of debt obligations secured by a mortgage or pool of mortgages; and asset-backed securities primarily consist of debt obligations secured by an asset or pool of assets other than mortgages. Inputs to the valuation methodology include quoted prices for similar assets in active markets, and inputs that are observable for the asset, either directly or indirectly, for substantially the full term of the asset. Multiple prices and price types are obtained from pricing vendors whenever possible, enabling cross-provider price validations. Fixed income securities are generally classified as Level 1 or Level 2 investments.
Fixed income commingled funds - Some fixed income investments are held in exchange traded or commingled funds, which have daily net asset values derived from the underlying securities; these are classified as Level 1 or 2 investments.
Real estate funds - The value of the real estate funds is reported by the fund manager and is based on a valuation of the underlying properties. Inputs used in the valuation include items such as cost, discounted future cash flows, independent appraisals and market based comparable data. The real estate funds are classified as Level 3 investments.
Other commingled funds - The other commingled funds are invested in equities, bonds, commodities, other alternative investments and cash and cash equivalents. These funds are valued based on the weekly net asset values derived from the quoted prices for the underlying securities in active markets and, for alternative investments, based on other valuation techniques. Other commingled funds are classified as Level 1 or Level 2 investments.
Other - At March 31, 2016 and 2015, this includes $40 million and $39 million of plan asset value relating to the SPK. In principle, the SPK is organized as a pay-as-you-go system guaranteed by the Norwegian government as it holds no Company-owned assets to back the pension liabilities. The Company pays a pension premium used to fund the plan, which is paid directly to the Norwegian government who establishes an account for each participating employer to keep track of the financial status of the plan, including managing the contributions and the payments. Further, the investment return credited to this account is determined annually by the SPK based on the performance of long-term government bonds.
97
The following table represents a reconciliation of Level 3 plan assets held during the years ended March 31, 2016 and 2015:
U.S. Plans | Non-U.S. Plans | ||||||||||||||||||
(In millions) | Real Estate Funds | Total | Real Estate Funds | Other | Total | ||||||||||||||
Balance at March 31, 2014 | $ | 16 | $ | 16 | $ | 7 | $ | 5 | $ | 12 | |||||||||
Acquisitions | — | — | — | — | — | ||||||||||||||
Unrealized gain on plan assets still held | 2 | 2 | 1 | — | 1 | ||||||||||||||
Purchases, sales and settlements | — | — | 18 | (1 | ) | 17 | |||||||||||||
Balance at March 31, 2015 | $ | 18 | $ | 18 | $ | 26 | $ | 4 | $ | 30 | |||||||||
Acquisitions | — | — | — | — | — | ||||||||||||||
Unrealized gain on plan assets still held | 1 | 1 | (2 | ) | (1 | ) | (3 | ) | |||||||||||
Purchases, sales and settlements | (2 | ) | (2 | ) | — | — | — | ||||||||||||
Balance at March 31, 2016 | $ | 17 | $ | 17 | $ | 24 | $ | 3 | $ | 27 | |||||||||
Multiemployer Plans
The Company contributes to a number of multiemployer pension plans under the terms of collective-bargaining agreements that cover union-represented employees in the U.S. In 2016, we also contributed to the Pensjonsordningen for Apoteketaten (“POA”), a mandatory multiemployer pension scheme for our pharmacy employees in Norway, managed by the association of Norwegian Pharmacies.
The risks of participating in these multiemployer plans are different from single-employer pension plans in the following aspects: (i) assets contributed to the multiemployer plan by one employer may be used to provide benefits to employees of other participating employers; (ii) if a participating employer stops contributing to the plan, the unfunded obligations of the plan may be borne by the remaining participating employers; and (iii) if the Company chooses to stop participating in some of its multiemployer plans, the Company may be required to pay those plans an amount based on the underfunded status of the plan, referred to as a withdrawal liability. Actions taken by other participating employers may lead to adverse changes in the financial condition of a multiemployer benefit plan and our withdrawal liability and contributions may increase.
Contributions and amounts accrued for U.S. Plans were not material for the years ended March 31, 2016, 2015, and 2014. Contributions to the POA for non-U.S. Plans exceeding 5% of total plan contributions were $23 million, $24 million and $5 million in 2016, 2015 and 2014. Based on actuarial calculations, we estimate the funded status for our non-U.S. Plans to be approximately 66% as of March 31, 2016. No amounts were accrued for liability associated with the POA as we have no intention to withdraw from the plan.
Defined Contribution Plans
We have a contributory profit sharing investment plan (“PSIP”) for U.S. eligible employees. Eligible employees may contribute to the PSIP up to 75% of their eligible compensation on a pre-tax or post-tax basis not to exceed IRS limits. The Company makes matching contributions in an amount equal to 100% of the employee’s first 3% of pay contributed and 50% for the next 2% of pay contributed. The Company also may make an additional annual matching contribution for each plan year to enable participants to receive a full match based on their annual contribution. The Company also contributed to non-U.S. plans that are available in certain countries. Contribution expenses for the PSIP and non-U.S. plans were $99 million, $103 million and $83 million for the years ended March 31, 2016, 2015, and 2014.
98
19. | Postretirement Benefits |
We maintain a number of postretirement benefits, primarily consisting of healthcare and life insurance (“welfare”) benefits, for certain eligible U.S. employees. Eligible employees consist of those who retired before March 31, 1999 and those who retired after March 31, 1999, but were an active employee as of that date, after meeting other age-related criteria. We also provide postretirement benefits for certain U.S. executives. Defined benefit plan obligations are measured as of the Company’s fiscal year-end.
The net periodic expense for our postretirement welfare benefits is as follows:
Years Ended March 31, | |||||||||||
(In millions) | 2016 | 2015 | 2014 | ||||||||
Service cost - benefits earned during the year | $ | 1 | $ | 1 | $ | 2 | |||||
Interest cost on accumulated benefit obligation | 4 | 5 | 5 | ||||||||
Amortization of unrecognized actuarial gain and prior service credit | — | (4 | ) | (1 | ) | ||||||
Curtailment gain | — | — | (2 | ) | |||||||
Net periodic postretirement expense | $ | 5 | $ | 2 | $ | 4 | |||||
Information regarding the changes in benefit obligations for our postretirement welfare plans is as follows:
Years Ended March 31, | |||||||
(In millions) | 2016 | 2015 | |||||
Benefit obligation at beginning of period | $ | 118 | $ | 119 | |||
Service cost | 1 | 1 | |||||
Interest cost | 4 | 5 | |||||
Plan amendments | (16 | ) | — | ||||
Actuarial loss | 3 | 5 | |||||
Benefit payments | (11 | ) | (12 | ) | |||
Curtailment gain | (1 | ) | — | ||||
Benefit obligation at end of period | $ | 98 | $ | 118 | |||
The components of the amount recognized in accumulated other comprehensive income for the Company’s other postretirement benefits at March 31, 2016 and 2015 were net actuarial losses of $4 million and $1 million and net prior service credits of $16 million and $1 million. Other changes in benefit obligations recognized in other comprehensive income were net actuarial losses of $3 million in 2016 and $9 million in 2015 and net prior service credits of $16 million in 2016.
We estimate that the amortization of the actuarial loss from stockholders’ equity to other postretirement expense in 2017 will be $1 million. Comparable 2016 amount was a gain of $1 million.
Other postretirement benefits are funded as claims are paid. Expected benefit payments for our postretirement welfare benefit plans are as follows: $11 million, $9 million, $9 million, $8 million and $8 million for 2017 to 2021 and $34 million cumulatively for 2022 through 2026. Expected benefit payments are based on the same assumptions used to measure the benefit obligations and include estimated future employee service. Expected contributions to be made for our postretirement welfare benefit plans are $11 million for 2017.
Weighted-average discount rates used to estimate postretirement welfare benefit expenses were 3.59%, 4.07% and 3.84% for 2016, 2015 and 2014. Weighted-average discount rates for the actuarial present value of benefit obligations were 3.68%, 3.61% and 4.08% for 2016, 2015 and 2014.
99
Actuarial gain or loss for the postretirement welfare benefit plan is amortized to income or expense over a three-year period. The assumed healthcare cost trends used in measuring the accumulated postretirement benefit obligation were 6.50% and 6.75% for prescription drugs, 7.00/6.50% and 7.25/6.75% for ages pre-65/post-65 medical and 5.00% for dental in 2016 and 2015. For 2016, 2015 and 2014, a one-percentage-point increase or decrease in the assumed healthcare cost trend rate would not have a material impact on the postretirement benefit obligations.
Pursuant to various collective bargaining agreements, we contribute to multiemployer health and welfare plans that cover union-represented employees. Our liability is limited to the contractual dollar obligations set forth by the collective bargaining agreements. Contributions to the plans and amounts accrued were not material for the years ended March 31, 2016, 2015, and 2014.
20. | Hedging Activities |
In the normal course of business, we are exposed to interest rate and foreign exchange rate fluctuations. At times, we limit these risks through the use of derivatives such as interest rate swaps, cross currency swaps and foreign currency forward contracts. In accordance with our policy, derivatives are only used for hedging purposes. We do not use derivatives for trading or speculative purposes.
Interest rate risk
From time to time, we may enter into interest rate swaps which involve the exchange of floating and fixed-rate interest payments. Our interest rate swaps that were outstanding at March 31, 2014 all matured during the first half of 2015. These contracts were not designated for hedge accounting and, accordingly, changes in the fair value of these swaps were recorded directly in earnings. Amounts recorded to earnings were not material for 2015 and 2014.
Foreign currency exchange risk
We conduct our business worldwide in U.S. dollars and the functional currencies of our foreign subsidiaries, including Euro, British pound sterling and Canadian dollar. Changes in foreign currency exchange rates could have a material adverse impact on our financial results that are reported in U.S. dollars. We are also exposed to foreign currency exchange rate risk related to our foreign subsidiaries, including intercompany loans denominated in non-functional currencies. We have certain foreign currency exchange rate risk programs that use foreign currency forward contracts and cross currency swaps. These forward contracts and cross currency swaps are generally used to offset the potential income statement effects from intercompany loans denominated in non-functional currencies. These programs reduce but do not entirely eliminate foreign exchange rate risk.
Derivatives Designated as Hedges
At March 31, 2016 and 2015, we had forward contracts to hedge the U.S. dollar against cash flows denominated in Canadian dollars with total gross notional amounts of $323 million and $399 million, which were designated as cash flow hedges. These contracts will mature between March 2017 and March 2020.
During the fourth quarter of 2016, we entered into cross currency swaps to convert fixed-rate British pound sterling denominated borrowings to fixed-rate U.S. dollar borrowings. For our cross currency swap transactions, we agree with another party to exchange, at specified intervals, one currency for another currency at a fixed exchange rate, generally set at inception, calculated by reference to an agreed upon notional amount. The notional amount of each currency is exchanged at the inception and termination of the currency swap by each party. These cross currency swaps are designed to reduce the income statement effects from fluctuations in foreign exchange rates and have been designated as cash flow hedges. The cross currency swaps mature from February 2018 to March 2019 and have a total gross notional amount of approximately $546 million.
For forward contracts and currency swaps that are designated as cash flow hedges, the effective portion of changes in the fair values of hedges is recorded into accumulated other comprehensive income and reclassified into earnings in the same period in which the hedged transaction affects earnings. Changes in fair values representing hedge ineffectiveness are recognized in current earnings. Gain or losses on these hedges recorded in other comprehensive income and earnings were not material in 2016, 2015 and 2014.
100
Derivatives Not Designated as Hedges
We also have a number of forward contracts to primarily hedge the Euro against cash flows denominated in British pound sterling and other European currencies. At March 31, 2016 and 2015, the total gross notional amounts of these contracts were $876 million and $1,755 million.
These contracts will mature through December 2016 and none of these contracts were designated for hedge accounting. Changes in the fair values for contracts not designated as hedges are recorded directly into earnings and accordingly, net gains of $60 million and net losses of $189 million were recorded within operating expenses in 2016 and 2015. The losses from these contracts are largely offset by changes in the value of the underlying intercompany foreign currency loans. Gains and losses from these contracts were not material in 2014.
Information regarding the fair value of derivatives on a gross basis is as follows:
Balance Sheet Caption | March 31, 2016 | March 31, 2015 | ||||||||||||||||||
Fair Value of Derivative | U.S. Dollar Notional | Fair Value of Derivative | U.S. Dollar Notional | |||||||||||||||||
(In millions) | Asset | Liability | Asset | Liability | ||||||||||||||||
Derivatives designated for hedge accounting | ||||||||||||||||||||
Foreign exchange contracts (current) | Prepaid expenses and other | $ | 16 | $ | — | $ | 80 | $ | 14 | $ | — | $ | 76 | |||||||
Foreign exchange contracts (non-current) | Other Noncurrent Assets | 46 | — | 243 | 53 | — | 323 | |||||||||||||
Cross currency swaps (non-current) | Other Noncurrent Liabilities | — | 8 | 546 | — | — | — | |||||||||||||
Total | $ | 62 | $ | 8 | $ | 67 | $ | — | ||||||||||||
Derivatives not designated for hedge accounting | ||||||||||||||||||||
Foreign exchange contracts (current) | Prepaid expenses and other | $ | 23 | $ | — | $ | 680 | $ | 7 | $ | — | $ | 493 | |||||||
Foreign exchange contracts (current) | Other accrued liabilities | — | — | 196 | — | 79 | 1,262 | |||||||||||||
Total | $ | 23 | $ | — | $ | 7 | $ | 79 | ||||||||||||
Refer to Financial Note 21, “Fair Value Measurements,” for more information on these recurring fair value measurements.
101
21. | Fair Value Measurements |
Fair value is defined as the price that would be received to sell an asset or paid to transfer a liability in an orderly transaction between market participants at the measurement date. There is a three-level hierarchy that prioritizes the inputs used in determining fair value by their reliability and preferred use, as follows:
Level 1 - Valuations based on quoted prices in active markets for identical assets or liabilities.
Level 2 - Valuations based on quoted prices in active markets for similar assets and liabilities, quoted prices for identical or similar assets or liabilities in inactive markets, or other inputs that are observable or can be corroborated by observable market data.
Level 3 - Valuations based on inputs that are both significant to the fair value measurement and unobservable.
At March 31, 2016 and 2015, the carrying amounts of cash, certain cash equivalents, restricted cash, marketable securities, receivables, drafts and accounts payable, short-term borrowings and other current liabilities approximated their estimated fair values because of the short maturity of these financial instruments.
Our long-term debt is carried at amortized cost. The carrying amounts and estimated fair values of these liabilities were $8.1 billion and $8.6 billion at March 31, 2016 and $9.7 billion and $10.4 billion at March 31, 2015. The estimated fair value of our long-term debt was determined using quoted market prices in a less active market and other observable inputs from available market information, which are considered to be Level 2 inputs, and may not be representative of actual values that could have been realized or that will be realized in the future.
Assets Measured at Fair Value on a Recurring Basis
Our financial assets measured at fair value on a recurring basis consist of the following:
March 31, 2016 | March 31, 2015 | ||||||||||||||||||||||||
(In millions) | Level 1 | Level 2 | Level 3 | Total | Level 1 | Level 2 | Level 3 | Total | |||||||||||||||||
Cash Equivalents | |||||||||||||||||||||||||
Money market funds (1) | $ | 2,413 | $ | — | $ | — | $ | 2,413 | $ | 2,880 | $ | — | $ | — | $ | 2,880 | |||||||||
Time deposits (2) | — | — | — | — | — | 94 | — | 94 | |||||||||||||||||
Repurchase agreements (2) | — | — | — | — | 1,243 | — | — | 1,243 | |||||||||||||||||
Total cash equivalents | $ | 2,413 | $ | — | $ | — | $ | 2,413 | $ | 4,123 | $ | 94 | $ | — | $ | 4,217 | |||||||||
(1) Gross unrealized gain and losses were not material for the years ended March 31, 2016 and 2015 based on quoted prices of identical investments.
(2) The carrying amounts of these cash equivalents approximated their estimated fair values because of their short maturities.
Fair values of our marketable securities were determined using quoted prices in active markets for identical assets, which are considered Level 1 inputs under the fair value measurements and disclosure guidance. Fair values for our marketable securities were not material at March 31, 2016 and 2015.
Fair values of our forward foreign currency contracts were determined using quoted market prices of similar instruments in an active market and other observable inputs from available market information. Fair values of our foreign currency swaps were determined using quoted foreign currency exchange rates and other observable inputs from available market information. These inputs are considered Level 2 under the fair value measurements and disclosure guidance, and may not be representative of actual values that could have been realized or that will be realized in the future.
Refer to Financial Note 20, “Hedging Activities,” for fair value and other information on our foreign currency derivatives including foreign currency forward contracts and swaps.
There were no transfers between Level 1, Level 2 or Level 3 of the fair value hierarchy during the years ended March 31, 2016 and 2015.
102
Assets Measured at Fair Value on a Nonrecurring Basis
We measure certain long-lived assets and goodwill at fair value on a nonrecurring basis when they are deemed to be other-than-temporarily impaired. If the cost of an investment exceeds its fair value, we evaluate, among other factors, our intent to hold the investment, general market conditions, the duration and extent to which the fair value is less than cost and the financial outlook for the industry and location. An impairment charge is recorded when the cost of the asset exceeds its fair value and this condition is determined to be other-than-temporary.
Fiscal 2015
As discussed in Financial Note 9, “Discontinued Operations,” during the fourth quarter of 2015, we recorded a $241 million pre-tax ($235 million after-tax) non-cash impairment charge to reduce the carrying value of our Brazilian distribution business to its estimated fair value, less cost to sell. The fair value of this business was determined using income and market valuation approaches. Under the income approach, we used a discounted cash flow (“DCF”) analysis based on the estimated future results. This valuation approach is considered a Level 3 fair value measurement due to the use of significant unobservable inputs related to the timing and amount of future cash flows based on projections of revenues and operating costs and discounting those cash flows to their present value. The key inputs and assumptions of the DCF method are the projected cash flows, the terminal value of the business and the discount rate. Under the market approach, we apply valuation multiples of reasonably similar publicly traded companies to the operating data of the subject business to derive the estimated fair value. This valuation approach is also considered a Level 3 fair value measurement. The key inputs for the market valuation approach were revenues and a selection of market multiples. The ultimate loss from the sale of the business may be higher or lower than our current assessment of the business’ fair value.
Fiscal 2014
As discussed in Financial Note 9, “Discontinued Operations,” during 2014, we recorded an $80 million non-cash pre-tax and after-tax impairment charge to reduce the carrying value of our International Technology business to its estimated fair value, less costs to sell. The impairment charge was primarily the result of the terms of the preliminary purchase offers received for this business during 2014. Accordingly, the fair value measurement is classified as Level 3 in the fair value hierarchy.
22. | Lease Obligations |
We lease facilities and equipment almost solely under operating leases. At March 31, 2016, future minimum lease payments required under operating leases that have initial or remaining noncancelable lease terms in excess of one year for years ending March 31 are:
(In millions) | Noncancelable Operating Leases | ||
2017 | $ | 363 | |
2018 | 309 | ||
2019 | 252 | ||
2020 | 209 | ||
2021 | 168 | ||
Thereafter | 669 | ||
Total minimum lease payments (1) | $ | 1,970 | |
(1) | Minimum lease payments have not been reduced by minimum sublease rentals of $45 million due under future noncancelable subleases. |
103
Rental expense under operating leases was $433 million, $440 million and $298 million in 2016, 2015 and 2014. We recognize rent expense on a straight-line basis over the term of the lease, taking into account, when applicable, lessor incentives for tenant improvements, periods where no rent payment is required and escalations in rent payments over the term of the lease. Deferred rent is recognized for the difference between the rent expense recognized on a straight-line basis and the payments made per the terms of the lease. Remaining terms for facilities leases generally range from one to fourteen years, while remaining terms for equipment leases range from one to eight years. Most real property leases contain renewal options (generally for five-year increments) and provisions requiring us to pay property taxes and operating expenses in excess of base period amounts. Sublease rental income was not material for 2016, 2015 and 2014.
23. | Financial Guarantees and Warranties |
Financial Guarantees
We have agreements with certain of our customers’ financial institutions, mainly in Canada and Europe, under which we have guaranteed the repurchase of our customers’ inventory or our customers’ debt in the event these customers are unable to meet their obligations to those financial institutions. For our inventory repurchase agreements, among other requirements, inventories must be in resalable condition and any repurchase would be at a discount. The inventory repurchase agreements mostly relate to certain Canadian customers and generally range from one to two years. Customers’ debt guarantees range from one to twelve years and are primarily provided to facilitate financing for certain customers. The majority of our customers’ debt guarantees are secured by certain assets of the customer. At March 31, 2016, the maximum amounts of inventory repurchase guarantees and customers’ debt guarantees were $201 million and $139 million, of which $1 million had been accrued. The expirations of these financial guarantees are as follows: $194 million, $8 million, $10 million, $12 million and $12 million from 2017 through 2021 and $104 million thereafter.
At March 31, 2016, our banks and insurance companies have issued $142 million of standby letters of credit and surety bonds, which were issued on our behalf mostly related to our customer contracts and in order to meet the security requirements for statutory licenses and permits, court and fiduciary obligations and our workers’ compensation and automotive liability programs. Additionally, at March 31, 2016, we have a commitment to contribute up to $4 million to a non-consolidated investment for building and equipment construction.
Our software license agreements generally include certain provisions for indemnifying customers against liabilities if our software products infringe a third party’s intellectual property rights. To date, we have not incurred any material costs as a result of such indemnification agreements and have not accrued any liabilities related to such obligations.
In conjunction with certain transactions, primarily divestitures, we may provide routine indemnification agreements (such as retention of previously existing environmental, tax and employee liabilities) whose terms vary in duration and often are not explicitly defined. Where appropriate, obligations for such indemnifications are recorded as liabilities. Because the amounts of these indemnification obligations often are not explicitly stated, the overall maximum amount of these commitments cannot be reasonably estimated. Other than obligations recorded as liabilities at the time of divestiture, we have historically not made material payments as a result of these indemnification provisions.
Warranties
In the normal course of business, we provide certain warranties and indemnification protection for our products and services. For example, we provide warranties that the pharmaceutical and medical-surgical products we distribute are in compliance with the U.S. Food, Drug and Cosmetic Act and other applicable laws and regulations. We have received the same warranties from our suppliers, which customarily are the manufacturers of the products. In addition, we have indemnity obligations to our customers for these products, which have also been provided to us from our suppliers, either through express agreement or by operation of law.
104
We also provide warranties regarding the performance of software and products we sell. Our liability under these warranties is to bring the product into compliance with previously agreed upon specifications. For software products, this may result in additional project costs, which are reflected in our estimates used for the percentage-of-completion method of accounting for software installation services within these contracts. In addition, most of our customers who purchase our software and automation products also purchase annual maintenance agreements. Revenues from these maintenance agreements are recognized on a straight-line basis over the contract period and the cost of servicing product warranties is charged to expense when claims become estimable. Accrued warranty costs were not material to the consolidated balance sheets.
24. | Commitments and Contingent Liabilities |
In addition to commitments and obligations in the ordinary course of business, we are subject to various claims, including claims with customers and vendors, pending and potential legal actions for damages, investigations relating to governmental laws and regulations and other matters arising out of the normal conduct of our business. As described below, many of these proceedings are at preliminary stages and many seek an indeterminate amount of damages.
When a loss is considered probable and reasonably estimable, we record a liability in the amount of our best estimate for the ultimate loss. However, the likelihood of a loss with respect to a particular contingency is often difficult to predict and determining a meaningful estimate of the loss or a range of loss may not be practicable based on the information available and the potential effect of future events and decisions by third parties that will determine the ultimate resolution of the contingency. Moreover, it is not uncommon for such matters to be resolved over many years, during which time relevant developments and new information must be reevaluated at least quarterly to determine both the likelihood of potential loss and whether it is possible to reasonably estimate a range of possible loss. When a loss is probable but a reasonable estimate cannot be made, disclosure of the proceeding is provided.
Disclosure also is provided when it is reasonably possible that a loss will be incurred or when it is reasonably possible that the amount of a loss will exceed the recorded provision. We review all contingencies at least quarterly to determine whether the likelihood of loss has changed and to assess whether a reasonable estimate of the loss or range of loss can be made. As discussed above, development of a meaningful estimate of loss or a range of potential loss is complex when the outcome is directly dependent on negotiations with or decisions by third parties, such as regulatory agencies, the court system and other interested parties. Such factors bear directly on whether it is possible to reasonably estimate a range of potential loss and boundaries of high and low estimates.
We are party to the legal proceedings described below. Unless otherwise stated, we are currently unable to estimate a range of reasonably possible losses for the unresolved proceedings described below. Should any one or a combination of more than one of these proceedings be successful, or should we determine to settle any or a combination of these matters, we may be required to pay substantial sums, become subject to the entry of an injunction or be forced to change the manner in which we operate our business, which could have a material adverse impact on our financial position or results of operations.
I. Litigation and Claims
On September 7, 2007, McKesson Specialty Arizona Inc. was served with a complaint filed in the New York Supreme Court, New York County by PSKW, LLC, alleging that McKesson Specialty Arizona misappropriated trade secrets and confidential information in launching its LoyaltyScript® program, PSKW, LLC v. McKesson Specialty Arizona Inc., Index No. 602921/07. PSKW later amended its complaint twice to add additional, but related claims. The trial presentation of evidence has completed. The parties are engaged in post-trial briefing.
105
On April 16, 2013, the Company’s wholly-owned subsidiary, U.S. Oncology, Inc. (“USON”), was served with a third amended qui tam complaint filed in the United States District Court for the Eastern District of New York by two relators, purportedly on behalf of the United States, twenty-one states and the District of Columbia, against USON and five other defendants, alleging that USON solicited and received illegal “kickbacks” from Amgen in violation of the Anti-Kickback Statute, the False Claims Act, and various state false claims statutes, and seeking damages, treble damages, civil penalties, attorneys’ fees and costs of suit, all in unspecified amounts, United States ex rel. Piacentile v. Amgen Inc., et al., CV 04-3983 (SJ). Previously, the United States declined to intervene in the case as to all allegations and defendants except for Amgen. On February 5, 2013, the United States filed a motion to dismiss the claims pled against Amgen. On September 30, 2013, the court granted the United States’ motion to dismiss. On April 4, 2014, USON filed a motion to dismiss the claims pled against it. The court has not yet ruled on USON’s motion.
On May 17, 2013, the Company was served with a complaint filed in the United States District Court for the Northern District of California by True Health Chiropractic Inc., alleging that McKesson sent unsolicited marketing faxes in violation of the Telephone Consumer Protection Act of 1991 (“TCPA”), as amended by the Junk Fax Protection Act of 2005 or JFPA, True Health Chiropractic Inc., et al. v. McKesson Corporation, et al., CV-13-02219 (HG). True Health Chiropractic later amended its complaint, adding McLaughlin Chiropractic Associates as an additional named plaintiff and McKesson Technologies Inc. as a defendant. True Health Chiropractic and McLaughlin Chiropractic Associates purport to represent all persons who were sent marketing faxes that did not contain proper opt-out notices and from whom the Company and McKesson Technologies, Inc. did not obtain prior express permission from June 2009 to the present. In July 2015, True Health Chiropractic and McLaughlin Chiropractic Associates filed a motion for class certification. The court has not yet ruled on True Health Chiropractic and McLaughlin Chiropractic Associates’ motion. In August 2015, McKesson was granted a waiver from the opt-out requirement from the Federal Communications Commission (“FCC”). Whether the FCC has the authority to grant such a waiver is currently on appeal before the United States Circuit Court of Appeals for the District of Columbia Circuit.
On May 21, 2014, four hedge funds managed by Magnetar Capital filed a complaint against Celesio Holdings (formerly known as “Dragonfly GmbH & Co KGaA”), a wholly-owned subsidiary of the Company, in a German court in Frankfurt, Germany, alleging that Celesio Holdings violated German takeover law in connection with the Company’s acquisition of Celesio by paying more to some holders of Celesio’s convertible bonds than it paid to the shareholders of Celesio’s stock, Magnetar Capital Master Fund Ltd. et al. v. Dragonfly GmbH & Co KGaA, No. 3- 05 O 44/14. On December 5, 2014, the court dismissed Magnetar’s lawsuit. Magnetar subsequently appealed that ruling. On January 19, 2016, the Appellate Court reversed the lower court’s ruling and entered judgment against Celesio Holdings. On February 22, 2016, Celesio Holdings filed a notice of appeal.
On June 17, 2014, U.S. Oncology Specialty, LP (“USOS”) was served with a fifth amended qui tam complaint filed in July 2008 in the United States District Court for the Eastern District of New York by a relator against USOS, among others, alleging that USOS solicited and received illegal “kickbacks” from Amgen in violation of the Anti-Kickback Statute, the False Claims Act, and various state false claims statutes, and seeking damages, treble damages, civil penalties, attorneys’ fees and costs of suit, all in unspecified amounts, United States ex rel. Hanks v. Amgen, Inc., et al., CV-08-03096 (SJ). Previously, the United States declined to intervene in the case as to all allegations and defendants except for Amgen. On August 1, 2014, USOS filed a motion to dismiss the claims pled against it and the hearing occurred on October 7, 2014. The court has not yet ruled on USOS’s motion.
On January 26, 2016, the Company was served with an amended complaint filed in the Circuit Court of Boone County, West Virginia, by three relators, including the Attorney General of West Virginia, purportedly on behalf of the State of West Virginia, alleging that since 2007, the Company has oversupplied controlled substances to West Virginia and failed to report suspicious orders of controlled substances in violation of the West Virginia Controlled Substances Act, the West Virginia Consumer Credit and Protection Act, as well as common law claims for negligence, public nuisance and unjust enrichment, and seeking injunctive relief, monetary damages and civil penalties, State of West Virginia ex rel. Morrisey v. McKesson Corporation, Civil Action No.: 16-C-1. On February 23, 2016, the Company removed this action to the United States District Court for the Southern District of West Virginia (Civil Action No.: 2:16-cv-01772). On March 21, 2016, the Company filed a motion for judgment on the pleadings. On March 24, 2016, the State of West Virginia filed a motion to remand the matter to state court. The court has not yet ruled on either motion.
106
On January 28, 2016, the Company was served with a qui tam lawsuit, filed in the United States District Court, for the Southern District of Texas by a relator, purportedly on behalf of the United States, 29 states and the District of Columbia, against the Company and two other defendants, alleging that the defendants reported materially inaccurate data to manufacturers, which caused manufacturers to submit inaccurate Average Manufacturer Prices (“AMPs”) to the Centers for Medicare and Medicaid Services from January 1, 2004 to the present, in violation of the False Claims Act and various state false claims statutes, and seeking damages, treble damages, civil penalties, attorneys’ fees, interest and costs of suit, United States ex rel. Green v. AmerisourceBergen, et al., 4:15-CV-00379. The United States declined to intervene in the case as to all allegations and defendants. On April 18, 2016, the Company, along with the other defendants, filed a joint motion to dismiss the claims pled against them.
II. Government Subpoenas and Investigations
From time-to-time, the Company receives subpoenas or requests for information from various government agencies. The Company generally responds to such subpoenas and requests in a cooperative, thorough and timely manner. These responses sometimes require time and effort and can result in considerable costs being incurred by the Company. Such subpoenas and requests also can lead to the assertion of claims or the commencement of civil or criminal legal proceedings against the Company and other members of the health care industry, as well as to settlements.
For example, in the fourth quarter of 2015, the Company reached an agreement in principle with the Drug Enforcement Administration (“DEA”), Department of Justice (“DOJ”) and various U.S. Attorney’s offices to settle all potential administrative and civil claims relating to investigations about the Company’s suspicious order reporting practices for controlled substances. The global settlement with the DEA and DOJ is subject to the execution of final settlement agreements. Under the terms of the agreement in principle, the Company has agreed to pay the sum of $150 million, implement certain remedial measures and have the following distribution centers’ DEA registrations suspended for the specified products and time periods: Aurora, Colorado: all controlled substances for three years; Livonia, Michigan: all controlled substances for two years; Washington Courthouse, Ohio: all controlled substances for the two-year period following completion of the Livonia suspension; and Lakeland, Florida: hydromorphone products for one year. Throughout the terms of these suspensions, the Company will be permitted to continue to ship controlled substances from its Livonia, Washington Courthouse and Lakeland distribution centers to customers that purchase products under its pharmaceutical prime vendor contract with the Department of Veterans Affairs. The Company expects that the suspensions will not result in a supply disruption to any customer. Customers located in the distribution center service areas described above will receive controlled substances from a different distribution center during the applicable suspension periods. As a result of our agreement in principle, during the fourth quarter of 2015, we recorded a $150 million pre-tax and after-tax charge relating to these claims.
III. Environmental Matters
Primarily as a result of the operation of the Company’s former chemical businesses, which were fully divested by 1987, the Company is involved in various matters pursuant to environmental laws and regulations. The Company has received claims and demands from governmental agencies relating to investigative and remedial actions purportedly required to address environmental conditions alleged to exist at five sites where it, or entities acquired by it, formerly conducted operations and the Company, by administrative order or otherwise, has agreed to take certain actions at those sites, including soil and groundwater remediation.
Based on a determination by the Company’s environmental staff, in consultation with outside environmental specialists and counsel, the current estimate of the Company’s probable loss associated with the remediation costs for these five sites is $8.1 million, net of amounts anticipated from third parties. The $8.1 million is expected to be paid out between April 2016 and March 2046. The Company’s estimated probable loss for these environmental matters has been entirely accrued for in the accompanying consolidated balance sheets.
In addition, the Company has been designated as a Potentially Responsible Party (“PRP”) under the Superfund law for environmental assessment and cleanup costs as the result of its alleged disposal of hazardous substances at 15 sites. With respect to these sites, numerous other PRPs have similarly been designated and while the current state of the law potentially imposes joint and several liability upon PRPs, as a practical matter, costs of these sites are typically shared with other PRPs. At one of these sites, the United States Environmental Protection Agency has selected a preferred remedy with an estimated cost of approximately $1.38 billion. It is not certain at this point in time what proportion of this estimated liability will be borne by the Company or by the numerous other PRPs. Accordingly, the Company’s estimated probable loss at those 15 sites is approximately $26 million, which has been entirely accrued for in the accompanying consolidated balance sheets. However, it is possible that the ultimate costs of these matters may exceed or be less than the reserves.
107
IV. Value Added Tax Assessments
We operate in various countries outside the United States which collect value added taxes (“VAT”). The determination of the manner in which a VAT applies to our foreign operations is subject to varying interpretations arising from the complex nature of the tax laws. We have received assessments for VAT which are in various stages of appeal. We disagree with these assessments and believe that we have strong legal arguments to defend our tax positions. Certain VAT assessments relate to years covered by an indemnification agreement. Due to the complex nature of the tax laws, it is not possible to estimate the outcome of these matters. However, based on the currently available information, we believe the ultimate outcome of these matters will not have a material adverse effect on our financial position, cash flows or results of operations.
V. Average Wholesale Price (“AWP”) Litigation
The Company has a reserve relating to AWP public entity claims, which is reviewed at least quarterly and whenever events or circumstances indicate changes. We recorded $68 million of pre-tax charges relating to changes in the Company’s AWP litigation reserve, including accrued interest, in 2014. All charges were recorded in operating expenses within our Distribution Solutions segment. Cash payments of $105 million were made in 2014. At March 31, 2016 and 2015, the reserve for this matter was not material.
VI. Other Matters
The Company is involved in various other litigation, governmental proceedings and claims, not described above, that arise in the normal course of business. While it is not possible to determine the ultimate outcome or the duration of such litigation, governmental proceedings or claims, the Company believes, based on current knowledge and the advice of counsel, that such litigation, proceedings and claims will not have a material impact on the Company’s financial position or results of operations.
25. | Stockholders’ Equity |
Each share of the Company’s outstanding common stock is permitted one vote on proposals presented to stockholders and is entitled to share equally in any dividends declared by the Company’s Board of Directors (the “Board”).
In July 2015, the quarterly dividend was raised from $0.24 to $0.28 per common share for dividends declared after such date, until further action by the Board. Dividends were $1.08 per share in 2016, $0.96 per share in 2015 and $0.92 per share in 2014. The Company anticipates that it will continue to pay quarterly cash dividends in the future. However, the payment and amount of future dividends remain within the discretion of the Board and will depend upon the Company’s future earnings, financial condition, capital requirements and other factors.
Share Repurchase Plans
Stock repurchases may be made from time-to-time in open market transactions, privately negotiated transactions, through accelerated share repurchase (“ASR”) programs, or by any combination of such methods. The timing of any repurchases and the actual number of shares repurchased will depend on a variety of factors, including our stock price, corporate and regulatory requirements, restrictions under our debt obligations and other market and economic conditions.
108
Information regarding the share repurchase activity over the last three years is as follows:
Share Repurchases (1) | ||||||||||
(In millions, except price per share data) | Total Number of Shares Purchased (2) (3) | Average Price Paid Per Share | Approximate Dollar Value of Shares that May Yet Be Purchased Under the Programs | |||||||
Balance, March 31, 2013 | $ | 340 | ||||||||
Shares repurchased | — | $ | — | — | ||||||
Balance, March 31, 2014 | $ | 340 | ||||||||
Shares repurchased | 1.5 | $ | 226.55 | (340 | ) | |||||
Balance, March 31, 2015 | $ | — | ||||||||
Shares repurchase plans authorized | ||||||||||
May 2015 | 500 | |||||||||
October 2015 | 2,000 | |||||||||
Shares repurchased | 8.7 | $ | 173.64 | (1,504 | ) | |||||
Balance, March 31, 2016 | $ | 996 | ||||||||
(1) | This table does not include shares tendered to satisfy the exercise price in connection with cashless exercises of employee stock options or shares tendered to satisfy tax withholding obligations in connection with employee equity awards. |
(2) | All of the shares purchased were part of the publicly announced programs. |
(3) | The number of shares purchased reflects rounding adjustments. |
In 2016, our share repurchases were transacted through both open market transactions and an ASR program with a third party financial institution. In 2015, all of our share repurchases were conducted through open market transactions. All share repurchases were funded with cash on hand.
In 2016, we repurchased 4.5 million of the Company’s shares for $854 million through open market transactions at an average price per share of $192.27. In February 2016, we entered into an ASR program with a third party financial institution to repurchase $650 million of the Company’s common stock. The ASR program was completed during the fourth quarter and we repurchased 4.2 million shares at an average price per share of $154.04. During 2016, we completed the May 2015 share repurchase authorization. At March 31, 2016, $1.0 billion remained available for future authorized repurchases of the Company’s common stock under the October 2015 authorization.
In 2016, we retired 115.5 million or $7.8 billion by the Company’s treasury shares previously repurchased. Under the applicable state law, these shares resume the status of authorized and unissued shares upon retirement. In accordance with our accounting policy, we allocate any excess of share repurchase price over par value between additional paid-in capital and retained earnings. Accordingly, our retained earnings and additional paid-in capital were reduced by $6.35 billion and $1.5 billion during 2016.
109
Other Comprehensive Income (Loss)
Information regarding other comprehensive income (loss) including noncontrolling interests and redeemable noncontrolling interests, net of tax, by component is as follows:
Years Ended March 31, | |||||||||||
(In millions) | 2016 | 2015 | 2014 | ||||||||
Foreign currency translation adjustments(1) | |||||||||||
Foreign currency translation adjustments arising during period, net of income tax expense (benefit) of ($23), nil and nil (2) (3) | $ | 113 | $ | (1,845 | ) | $ | 9 | ||||
Reclassified to income statement, net of income tax expense of nil, nil and 24(4) | — | (10 | ) | 44 | |||||||
113 | (1,855 | ) | 53 | ||||||||
Unrealized gains (losses) on cash flow hedges | |||||||||||
Unrealized gains (losses) on cash flow hedges arising during period, net of income tax benefit of nil, nil and nil | 6 | (13 | ) | (6 | ) | ||||||
Reclassified to income statement, net of income tax expense of nil, nil and nil | 3 | 3 | — | ||||||||
9 | (10 | ) | (6 | ) | |||||||
Changes in retirement-related benefit plans | |||||||||||
Net actuarial gain (loss) and prior service credit (cost) arising during period, net of income tax expense (benefit) of $13, ($66) and $16 (5) | 23 | (140 | ) | 17 | |||||||
Amortization of actuarial loss, prior service cost and transition obligation, net of income tax expense of $18, $6 and $12 (6) | 30 | 11 | 22 | ||||||||
Foreign currency translation adjustments and other, net of income tax expense of nil, nil and nil | (3 | ) | 4 | (4 | ) | ||||||
Reclassified to income statement, net of income tax expense of nil, nil, and $1 | — | 1 | 1 | ||||||||
50 | (124 | ) | 36 | ||||||||
Other Comprehensive Income (Loss), net of tax | $ | 172 | $ | (1,989 | ) | $ | 83 | ||||
(1) | Foreign currency translation adjustments result from the conversion of non-U.S. dollar financial statements of our foreign subsidiaries into the Company’s reporting currency, U.S. dollars, and were primarily related to our foreign subsidiary, Celesio, in 2016 and 2015. |
(2) | The 2016 net foreign currency translation gains of $113 million were primarily due to the recovery of the Euro against the U.S. dollar, partly offset by the weakening of the Canadian dollar and British pound sterling against the U.S. dollar during the period between April 1, 2015 and March 31, 2016. The 2015 foreign currency translation losses of $1,855 million were primarily due to the weakening of the Euro against U.S. dollar during the period between April 1, 2014 and March 31, 2015. |
(3) | 2016 includes net foreign currency translation gains of $16 million and 2015 includes net foreign currency translations losses of $267 million attributable to noncontrolling and redeemable noncontrolling interests. |
(4) | These net foreign currency losses were reclassified from accumulated other comprehensive income (loss) to discontinued operations within our consolidated statement of operations due to the sale of certain businesses. |
(5) | The net gains of $4 million and net losses of $12 million attributable to noncontrolling and redeemable noncontrolling interests in 2016 and 2015. |
(6) | Pre-tax amount was reclassified into cost of sales and operating expenses in the consolidated statements of operations. The related tax expense was reclassified into income tax expense in the consolidated statements of operations. |
110
Accumulated Other Comprehensive Income (Loss)
Information regarding changes in our accumulated other comprehensive income (loss) by component are as follows:
(In millions) | Foreign Currency Translation Adjustments, Net of Tax | Unrealized Losses on Cash Flow Hedges, Net of Tax | Unrealized Net Gains (Losses) and Other Components of Benefit Plans, Net of Tax | Total Accumulated Other Comprehensive Income (Loss) | |||||||||||
Balance at March 31, 2014 | $ | 168 | $ | (11 | ) | $ | (160 | ) | $ | (3 | ) | ||||
Other comprehensive income (loss) before reclassifications | (1,845 | ) | (13 | ) | (136 | ) | (1,994 | ) | |||||||
Amounts reclassified to earnings | (10 | ) | 3 | 12 | 5 | ||||||||||
Other comprehensive income (loss) | $ | (1,855 | ) | $ | (10 | ) | $ | (124 | ) | $ | (1,989 | ) | |||
Less: amounts attributable to noncontrolling and redeemable interests | (267 | ) | — | (12 | ) | (279 | ) | ||||||||
Other comprehensive income (loss) attributable to McKesson | $ | (1,588 | ) | $ | (10 | ) | $ | (112 | ) | $ | (1,710 | ) | |||
Balance at March 31, 2015 | $ | (1,420 | ) | $ | (21 | ) | $ | (272 | ) | $ | (1,713 | ) | |||
Other comprehensive income (loss) before reclassifications | 113 | 6 | 23 | 142 | |||||||||||
Amounts reclassified to earnings and other | — | 3 | 27 | 30 | |||||||||||
Other comprehensive income (loss) | $ | 113 | $ | 9 | $ | 50 | $ | 172 | |||||||
Less: amounts attributable to noncontrolling and redeemable interests | 16 | — | 4 | 20 | |||||||||||
Other comprehensive income (loss) attributable to McKesson | $ | 97 | $ | 9 | $ | 46 | $ | 152 | |||||||
Balance at March 31, 2016 | $ | (1,323 | ) | $ | (12 | ) | $ | (226 | ) | $ | (1,561 | ) | |||
26. | Related Party Balances and Transactions |
Celesio has investments in pharmacies located across Europe that are accounted for under the equity-method. Celesio maintains distribution arrangements with these pharmacies for the sale of related goods and services under which revenues of $112 million and $114 million are included in our consolidated statement of operations in 2016 and 2015, and receivables of $8 million and $9 million are included in our consolidated balance sheet for the year ended March 31, 2016 and 2015.
111
27. | Segments of Business |
We report our operations in two operating segments: McKesson Distribution Solutions and McKesson Technology Solutions. The factors for determining the reportable segments included the manner in which management evaluates the performance of the Company combined with the nature of the individual business activities. We evaluate the performance of our operating segments on a number of measures, including operating profit before interest expense, income taxes and results from discontinued operations.
The Distribution Solutions segment distributes branded and generic pharmaceutical drugs and other healthcare-related products worldwide and provides medical-surgical supply distribution, equipment, logistics and other services to healthcare providers within the United States. This segment provides practice management, technology, clinical support and business solutions to community-based oncology and other specialty practices. It also provides specialty pharmaceutical solutions for pharmaceutical manufacturers including offering multiple distribution channels and clinical trial access to our network of oncology physicians. Additionally, this segment operates retail pharmacies in Europe and supports independent pharmacy networks within North America. It also sells financial, operational and clinical solutions to pharmacies (retail, hospital, alternate site) and provides consulting, outsourcing and other services.
The McKesson Technology Solutions segment delivers enterprise-wide clinical, patient care, financial, supply chain, strategic management software solutions, as well as connectivity, outsourcing and other services, including remote hosting and managed services, to healthcare organizations.
Corporate includes expenses associated with Corporate functions and projects and the results of certain investments. Corporate expenses are allocated to the operating segments to the extent that these items can be directly attributable to the segment.
112
Financial information relating to our reportable operating segments and reconciliations to the consolidated totals is as follows:
Years Ended March 31, | |||||||||||
(In millions) | 2016 | 2015 | 2014 | ||||||||
Revenues | |||||||||||
Distribution Solutions (1) | |||||||||||
North America pharmaceutical distribution and services | $ | 158,469 | $ | 143,711 | $ | 123,929 | |||||
International pharmaceutical distribution and services | 23,497 | 26,358 | 4,485 | ||||||||
Medical-Surgical distribution and services | 6,033 | 5,907 | 5,648 | ||||||||
Total Distribution Solutions | 187,999 | 175,976 | 134,062 | ||||||||
Technology Solutions - products and services | 2,885 | 3,069 | 3,330 | ||||||||
Total Revenues | $ | 190,884 | $ | 179,045 | $ | 137,392 | |||||
Operating profit | |||||||||||
Distribution Solutions (2) (4) | $ | 3,553 | $ | 3,047 | $ | 2,472 | |||||
Technology Solutions (3) (4) | 519 | 438 | 448 | ||||||||
Total | 4,072 | 3,485 | 2,920 | ||||||||
Corporate Expenses, Net (4) | (469 | ) | (454 | ) | (449 | ) | |||||
Interest Expense | (353 | ) | (374 | ) | (300 | ) | |||||
Income From Continuing Operations Before Income Taxes | $ | 3,250 | $ | 2,657 | $ | 2,171 | |||||
Depreciation and amortization (5) | |||||||||||
Distribution Solutions | $ | 669 | $ | 750 | $ | 446 | |||||
Technology Solutions | 107 | 156 | 169 | ||||||||
Corporate | 109 | 111 | 120 | ||||||||
Total | $ | 885 | $ | 1,017 | $ | 735 | |||||
Expenditures for long-lived assets (6) | |||||||||||
Distribution Solutions | $ | 306 | $ | 301 | $ | 179 | |||||
Technology Solutions | 15 | 27 | 47 | ||||||||
Corporate | 167 | 48 | 52 | ||||||||
Total | $ | 488 | $ | 376 | $ | 278 | |||||
Revenues, net by geographic area (7) | |||||||||||
United States | $ | 158,255 | $ | 142,810 | $ | 122,426 | |||||
Foreign | 32,629 | 36,235 | 14,966 | ||||||||
Total | $ | 190,884 | $ | 179,045 | $ | 137,392 | |||||
113
(1) | Revenues derived from services represent less than 2% of this segment’s total revenues. |
(2) | Distribution Solutions operating profit for the year ended March 31, 2016, 2015, and 2014 include $244 million, $337 million, and $311 million in pre-tax charges related to our last-in, first-out (“LIFO”) method of accounting for inventories. LIFO expense was less in 2016 primarily due to lower net price increases. For the year ended March 31, 2016 includes $76 million of net cash proceeds representing our share of net settlements of antitrust class action lawsuits as well as a pre-tax gain of $52 million recognized from the sale of our ZEE Medical business. |
(3) | Technology Solutions operating profit for the year ended March 31, 2016 includes a pre-tax gain of $51 million recognized from the sale of our nurse triage business, and for year ended March 31, 2015 includes a non-cash pre-tax charge of $34 million related to the retained workforce business within our International Technology business. |
(4) | During the fourth quarter of 2016, the Company approved the Cost Alignment Plan to reduce its operating expenses and recorded pre-tax restructuring charges of $229 million. Pre-tax charges were recorded as follows: $161 million, $51 million and $17 million within our Distribution Solutions segment, Technology Solutions segment and Corporate. |
(5) | Amounts primarily include amortization of acquired intangible assets purchased in connection with business acquisitions, capitalized software held for sale and capitalized software for internal use. |
(6) | Long-lived assets consist of property, plant and equipment. |
(7) | Net revenues were attributed to geographic areas based on the customers’ shipment locations. |
Segment assets and property, plant and equipment, net by geographic areas were as follows:
March 31, | |||||||
(In millions) | 2016 | 2015 | |||||
Segment assets | |||||||
Distribution Solutions | $ | 47,088 | $ | 43,982 | |||
Technology Solutions | 3,072 | 3,281 | |||||
Total | 50,160 | 47,263 | |||||
Corporate | |||||||
Cash and cash equivalents | 4,048 | 5,341 | |||||
Other | 2,355 | 1,266 | |||||
Total | $ | 56,563 | $ | 53,870 | |||
Property, plant and equipment, net | |||||||
United States | $ | 1,500 | $ | 1,273 | |||
Foreign | 778 | 772 | |||||
Total | $ | 2,278 | $ | 2,045 | |||
114
28. | Quarterly Financial Information (Unaudited) |
The quarterly results of operations are not necessarily indicative of the results that may be expected for the entire year. Selected quarterly financial information for the last two years is as follows:
(In millions, except per share amounts) | First Quarter | Second Quarter | Third Quarter | Fourth Quarter | |||||||||||
Fiscal 2016 | |||||||||||||||
Revenues | $ | 47,546 | $ | 48,761 | $ | 47,899 | $ | 46,678 | |||||||
Gross profit (1) (2) (3) | 2,848 | 2,844 | 2,872 | 2,852 | |||||||||||
Income after income taxes: | |||||||||||||||
Continuing operations (1) (3) (4) | $ | 599 | $ | 636 | $ | 642 | $ | 465 | |||||||
Discontinued operations | (10 | ) | (6 | ) | 5 | (21 | ) | ||||||||
Net income | $ | 589 | $ | 630 | $ | 647 | $ | 444 | |||||||
Net income attributable to McKesson | $ | 576 | $ | 617 | $ | 634 | $ | 431 | |||||||
Earnings (loss) per common share attributable to McKesson (5) | |||||||||||||||
Diluted | |||||||||||||||
Continuing operations | $ | 2.50 | $ | 2.65 | $ | 2.71 | $ | 1.97 | |||||||
Discontinued operations | (0.05 | ) | (0.02 | ) | 0.02 | (0.09 | ) | ||||||||
Total | $ | 2.45 | $ | 2.63 | $ | 2.73 | $ | 1.88 | |||||||
Basic | |||||||||||||||
Continuing operations | $ | 2.53 | $ | 2.68 | $ | 2.74 | $ | 1.99 | |||||||
Discontinued operations | (0.04 | ) | (0.02 | ) | 0.02 | (0.09 | ) | ||||||||
Total | $ | 2.49 | $ | 2.66 | $ | 2.76 | $ | 1.90 | |||||||
(1) | Gross profit for the first, second, third and fourth quarters of 2016 included pre-tax charges related to our last-in-first-out (“LIFO”) method of accounting for inventories of $91 million, $91 million, $33 million and $29 million. |
(2) | Gross profit for the first and third quarters of 2016 included $59 million and $17 million of cash proceeds representing our share of net settlements of antitrust class action lawsuits against drug manufacturers. |
(3) | Financial results for the fourth quarter of 2016 include pre-tax restructuring charges of $229 million within our continuing operations. Charges were recorded as follows: $26 million in cost of sales and $203 million in operating expenses. |
(4) | Financial results for the first quarter of 2016 include an after-tax gain of $38 million from the sale of our nurse triage business, and for the second quarter of 2016 include an after-tax gain of $29 million from the sale of ZEE Medical business. |
(5) | Certain computations may reflect rounding adjustments. |
115
(In millions, except per share amounts) | First Quarter | Second Quarter | Third Quarter | Fourth Quarter | |||||||||||
Fiscal 2015 | |||||||||||||||
Revenues | $ | 43,476 | $ | 44,160 | $ | 46,484 | $ | 44,925 | |||||||
Gross profit (1) | 2,732 | 2,864 | 2,898 | 2,917 | |||||||||||
Income after income taxes | |||||||||||||||
Continuing operations (1) (2) | $ | 419 | $ | 491 | $ | 521 | $ | 411 | |||||||
Discontinued operations (3) | (8 | ) | (14 | ) | (10 | ) | (267 | ) | |||||||
Net income | $ | 411 | $ | 477 | $ | 511 | $ | 144 | |||||||
Net income attributable to McKesson | $ | 403 | $ | 469 | $ | 472 | $ | 132 | |||||||
Earnings per common share attributable to McKesson (4) | |||||||||||||||
Diluted | |||||||||||||||
Continued operations | $ | 1.76 | $ | 2.05 | $ | 2.04 | $ | 1.69 | |||||||
Discontinued operations | (0.04 | ) | (0.06 | ) | (0.04 | ) | (1.13 | ) | |||||||
Total | $ | 1.72 | $ | 1.99 | $ | 2.00 | $ | 0.56 | |||||||
Basic | |||||||||||||||
Continuing operations | $ | 1.79 | $ | 2.08 | $ | 2.07 | $ | 1.72 | |||||||
Discontinued operations | (0.04 | ) | (0.06 | ) | (0.04 | ) | (1.15 | ) | |||||||
Total | $ | 1.75 | $ | 2.02 | $ | 2.03 | $ | 0.57 | |||||||
(1) | Gross profit for the first, second, third and fourth quarters of 2015 included pre-tax charges related to our LIFO method of accounting for inventories of $98 million, $94 million, $95 million and $50 million. |
(2) | Financial results for the fourth quarter of 2015 included a non-cash after-tax charge of $150 million related to the settlement of controlled substance distribution claims. |
(3) | Discontinued operations for the fourth quarter of 2015 included $235 million non-cash after-tax impairment charges related to our Brazilian pharmaceutical distribution business. |
(4) | Certain computations may reflect rounding adjustments. |
116
McKESSON CORPORATION
Item 9. | Changes in and Disagreements with Accountants on Accounting and Financial Disclosure. |
None.
Item 9A. | Controls and Procedures. |
Disclosure Controls and Procedures
Our Chief Executive Officer and our Chief Financial Officer, with the participation of other members of the Company’s management, have evaluated the effectiveness of the Company’s “disclosure controls and procedures” (as such term is defined in Exchange Act Rules 13a-15(e) and 15d-15(e)) as of the end of the period covered by this report and have concluded that our disclosure controls and procedures are effective based on their evaluation of these controls and procedures as required by paragraph (b) of Exchange Act Rules 13a-15 or 15d-15.
Internal Control over Financial Reporting
Management’s report on the Company’s internal control over financial reporting (as such term is defined in Exchange Act Rules 13a-15(f) and 15d-15(f)) and the related report of our independent registered public accounting firm are included in this Annual Report on Form 10-K, under the headings, “Management’s Annual Report on Internal Control Over Financial Reporting” and “Report of Independent Registered Public Accounting Firm” and are incorporated herein by reference.
Changes in Internal Controls
There were no changes in our internal control over financial reporting identified in connection with the evaluation required by paragraph (d) of Exchange Act Rules 13a-15 or 15d-15 that occurred during our fourth quarter of 2016 that have materially affected, or are reasonably likely to materially affect, our internal control over financial reporting.
Item 9B. | Other Information. |
None.
117
McKESSON CORPORATION
PART III
Item 10. | Directors, Executive Officers and Corporate Governance. |
Information about our Directors is incorporated by reference from the discussion under Item 1 of our Proxy Statement for the 2016 Annual Meeting of Stockholders (the “Proxy Statement”) under the heading “Election of Directors.” Information about compliance with Section 16(a) of the Exchange Act is incorporated by reference from the discussion under the heading “Section 16(a) Beneficial Ownership Reporting Compliance” in our Proxy Statement. Information about our Audit Committee, including the members of the committee and our Audit Committee Financial Expert, is incorporated by reference from the discussion under the headings “Audit Committee,” “Audit Committee Financial Expert” and “Audit Committee Report” in our Proxy Statement.
Information about the Code of Conduct applicable to all employees, officers and directors can be found on our website, www.mckesson.com, under the caption “Investors - Corporate Governance.” The Company’s Corporate Governance Guidelines and Charters for the Audit, Compensation and Governance Committees can also be found on our website under the same caption.
The Company intends to post on its website required information regarding any amendment to, or waiver from, the Code of Conduct that applies to our Chief Executive Officer, Chief Financial Officer, Controller and persons performing similar functions within four business days after any such amendment or waiver.
Item 11. | Executive Compensation. |
Information with respect to this item is incorporated by reference from the discussion under the heading “Executive Compensation” in our Proxy Statement.
Item 12. | Security Ownership of Certain Beneficial Owners and Management and Related Stockholder Matters. |
Information about security ownership of certain beneficial owners and management is incorporated by reference from the discussion under the heading “Principal Shareholders” in our Proxy Statement.
The following table sets forth information as of March 31, 2016 with respect to the plans under which the Company’s common stock is authorized for issuance:
Plan Category (In millions, except per share amounts) | Number of securities to be issued upon exercise of outstanding options, warrants and rights | Weighted-average exercise price of outstanding options, warrants and rights (1) | Number of securities remaining available for future issuance under equity compensation plans (excluding securities reflected in the first column) | |||||
Equity compensation plans approved by security holders | 6.4 (2) | $ | 118.95 | 33.0 (3) | ||||
Equity compensation plans not approved by security holders | — | $ | — | — | ||||
(1) | The weighted-average exercise price set forth in this column is calculated excluding outstanding restricted stock unit (“RSU”) awards, since recipients are not required to pay an exercise price to receive the shares subject to these awards. |
(2) | Represents option and RSU awards outstanding under the following plans: (i) 1997 Non-Employee Directors’ Equity Compensation and Deferral Plan; (ii) the 2005 Stock Plan; and (iii) the 2013 Stock Plan. |
(3) | Represents 4,373,049 shares available for purchase under the 2000 Employee Stock Purchase Plan and 28,608,465 shares available for grant under the 2013 Stock Plan. |
The following are descriptions of equity plans that have been approved by the Company’s stockholders. The plans are administered by the Compensation Committee of the Board of Directors, except for the portion of the 2013 Stock Plan and 2005 Stock Plan related to non-employee directors, which is administered by the Board of Directors or its Governance Committee.
118
McKESSON CORPORATION
2013 Stock Plan: The 2013 Stock Plan was adopted by the Board of Directors on May 22, 2013 and approved by the Company’s stockholders on July 31, 2013. The 2013 Stock Plan permits the grant of awards in the form of stock options, stock appreciation rights, restricted stock (“RS”), restricted stock units (“RSUs”), performance-based restricted stock units (“PeRSUs”), performance shares and other share-based awards. The number of shares reserved for issuance under the 2013 Stock Plan equals the sum of (i) 30,000,000 shares, (ii) the number of shares reserved but unissued under the 2005 Stock Plan as of the effective date of the 2013 Stock Plan, and (iii) the number of shares that become available for reuse under the 2005 Stock Plan following the effective date of the 2013 Stock Plan. For any one share of common stock issued in connection with an RS, RSU, performance share or other full share award, three and one-half shares shall be deducted from the shares available for future grants. Shares of common stock not issued or delivered as a result of the net exercise of a stock option, including in respect of the payment of applicable taxes, or shares repurchased on the open market with proceeds from the exercise of options shall not be returned to the reserve of shares available for issuance under the 2013 Stock Plan. Shares withheld to satisfy tax obligations relating to the vesting of a full-share award shall be returned to the reserve of shares available for issuance under the 2013 Stock Plan.
Stock options are granted at no less than fair market value and those options granted under the 2013 Stock Plan generally have a contractual term of seven years. Options generally become exercisable in four equal annual installments beginning one year after the grant date. The vesting of RS or RSUs is determined by the Compensation Committee at the time of grant. RS and RSUs generally vest over four years. PeRSUs vest three years following the end of the performance period. Beginning in May 2014, the Company’s executive officers are annually granted performance awards called Total Shareholder Return Units (“TSRUs”), which have a three-year performance period and are payable in shares without an additional vesting period.
Non-employee directors may be granted an award on the date of each annual meeting of the stockholders for up to 5,000 RSUs, as determined by the Board. Such non-employee director award is fully vested on the date of the grant.
2005 Stock Plan: The 2005 Stock Plan was adopted by the Board of Directors on May 25, 2005 and approved by the Company’s stockholders on July 27, 2005. The 2005 Stock Plan permits the granting of up to 42.5 million shares in the form of stock options, RS, RSUs, PeRSUs, performance shares and other share-based awards. For any one share of common stock issued in connection with an RS, RSU, performance share or other full-share award, two shares shall be deducted from the shares available for future grants. Shares of common stock not issued or delivered as a result of the net exercise of a stock option, shares withheld to satisfy tax obligations relating to the vesting of a full-share award or shares repurchased on the open market with proceeds from the exercise of options shall not be returned to the reserve of shares available for issuance under the 2005 Stock Plan.
Following the effectiveness of the 2013 Stock Plan, no further shares were made subject to award under the 2005 Stock Plan. Shares reserved but unissued under the 2005 Stock Plan as of the effective date of the 2013 Stock Plan, and shares that become available for reuse under the 2005 Stock Plan following the effectiveness of the 2013 Stock Plan, will be available for awards under the 2013 Stock Plan.
Stock options are granted at no less than fair market value and those options granted under the 2005 Stock Plan generally have a contractual term of seven years. Options generally become exercisable in four equal annual installments beginning one year after the grant date. The vesting of RS or RSUs is determined by the Compensation Committee at the time of grant. RS and RSUs generally vest over four years. PeRSUs vest three years following the end of the performance period.
Non-employee directors may be granted an award on the date of each annual meeting of the stockholders for up to 5,000 RSUs, as determined by the Board. Such non-employee director award is fully vested on the date of the grant.
1997 Non-Employee Directors’ Equity Compensation and Deferral Plan: The 1997 Non-Employee Directors’ Equity Compensation and Deferral Plan was approved by the Company’s stockholders on July 30, 1997; however, stockholder approval of the 2005 Stock Plan on July 27, 2005 had the effect of terminating the 1997 Non-Employee Directors’ Equity Compensation and Deferral Plan such that no new awards would be granted under the 1997 Non-Employee Directors’ Equity Compensation and Deferral Plan.
2000 Employee Stock Purchase Plan (the “ESPP”): The ESPP is intended to qualify as an “employee stock purchase plan” within the meaning of Section 423 of the Internal Revenue Code. In March 2002, the Board amended the ESPP to allow for participation in the plan by employees of certain of the Company’s international and other subsidiaries. As to those employees, the ESPP does not qualify under Section 423 of the Internal Revenue Code. Currently, 21.1 million shares have been approved by stockholders for issuance under the ESPP.
119
McKESSON CORPORATION
The ESPP is implemented through a continuous series of three-month purchase periods (“Purchase Periods”) during which contributions can be made toward the purchase of common stock under the plan.
Each eligible employee may elect to authorize regular payroll deductions during the next succeeding Purchase Period, the amount of which may not exceed 15% of a participant’s compensation. At the end of each Purchase Period, the funds withheld by each participant will be used to purchase shares of the Company’s common stock. The purchase price of each share of the Company’s common stock is 85% of the fair market value of each share on the last day of the applicable Purchase Period. In general, the maximum number of shares of common stock that may be purchased by a participant for each calendar year is determined by dividing $25,000 by the fair market value of one share of common stock on the offering date.
There currently are no equity awards outstanding that were granted under equity plans that were not submitted for approval by the Company’s stockholders.
Item 13. | Certain Relationships and Related Transactions, and Director Independence. |
Information with respect to certain transactions with management is incorporated by reference from the Proxy Statement under the heading “Certain Relationships and Related Transactions.” Additional information regarding certain related party balances and transactions is included in the Financial Review section of this Annual Report on Form 10-K and Financial Note 26, “Related Party Balances and Transactions,” to the consolidated financial statements appearing in this Annual Report on Form 10‑K.
Item 14. | Principal Accounting Fees and Services. |
Information regarding principal accounting fees and services is set forth under the heading “Ratification of Appointment of Deloitte & Touche LLP as the Company’s Independent Registered Public Accounting Firm for Fiscal 2017” in our Proxy Statement and all such information is incorporated herein by reference.
120
McKESSON CORPORATION
PART IV
Item 15. | Exhibits and Financial Statement Schedule. |
Page | |
(a)(1) Consolidated Financial Statements | |
(a)(2) Financial Statement Schedule | |
All other schedules not included have been omitted because of the absence of conditions under which they are required or because the required information, where material, is shown in the financial statements, financial notes or supplementary financial information. | |
121
McKESSON CORPORATION
SIGNATURES
Pursuant to the requirements of Section 13 or 15(d) of the Securities Exchange Act of 1934, the registrant has duly caused this report to be signed on its behalf by the undersigned, thereunto duly authorized.
MCKESSON CORPORATION | |||
Date: May 5, 2016 | /s/ James A. Beer | ||
James A. Beer | |||
Executive Vice President and Chief Financial Officer | |||
Pursuant to the requirements of the Securities Exchange Act of 1934, this report has been signed below by the following persons on behalf of the Registrant and in the capacities and on the date indicated:
* | * | |
John H. Hammergren Chairman of the Board, President and Chief Executive Officer (Principal Executive Officer) | M. Christine Jacobs, Director | |
* | * | |
James A. Beer Executive Vice President and Chief Financial Officer (Principal Financial Officer) | Donald R. Knauss, Director | |
* | * | |
Nigel A. Rees Senior Vice President and Controller (Principal Accounting Officer) | Marie L. Knowles, Director | |
* | * | |
Andy D. Bryant, Director | David M. Lawrence, M.D., Director | |
* | * | |
Wayne A. Budd, Director | Edward A. Mueller, Director | |
* | * | |
N. Anthony Coles, M.D., Director | Susan R. Salka, Director | |
* | /s/ Lori A. Schechter | |
Alton F. Irby III, Director | Lori A. Schechter *Attorney-in-Fact | |
Date: May 5, 2016 | ||
122
McKESSON CORPORATION
SCHEDULE II
SUPPLEMENTARY CONSOLIDATED FINANCIAL STATEMENT SCHEDULE
VALUATION AND QUALIFYING ACCOUNTS
For the Years Ended March 31, 2016, 2015 and 2014
(In millions)
Additions | |||||||||||||||||||
Description | Balance at Beginning of Year | Charged to Costs and Expenses | Charged to Other Accounts (3) | Deductions From Allowance Accounts (1) | Balance at End of Year (2) | ||||||||||||||
Year Ended March 31, 2016 | |||||||||||||||||||
Allowances for doubtful accounts | $ | 141 | $ | 113 | $ | 2 | $ | (44 | ) | $ | 212 | ||||||||
Other allowances | 33 | — | (3 | ) | 11 | 41 | |||||||||||||
$ | 174 | $ | 113 | $ | (1 | ) | $ | (33 | ) | $ | 253 | ||||||||
Year Ended March 31, 2015 | |||||||||||||||||||
Allowances for doubtful accounts | $ | 112 | $ | 67 | $ | — | $ | (38 | ) | $ | 141 | ||||||||
Other allowances | 22 | 8 | — | 3 | 33 | ||||||||||||||
$ | 134 | $ | 75 | $ | — | $ | (35 | ) | $ | 174 | |||||||||
Year Ended March 31, 2014 | |||||||||||||||||||
Allowances for doubtful accounts | $ | 121 | $ | 36 | $ | (11 | ) | $ | (34 | ) | $ | 112 | |||||||
Other allowances | 15 | — | 10 | (3 | ) | 22 | |||||||||||||
$ | 136 | $ | 36 | $ | (1 | ) | $ | (37 | ) | $ | 134 | ||||||||
2016 | 2015 | 2014 | |||||||||||
(1) | Deductions: | ||||||||||||
Written off | $ | (33 | ) | $ | (34 | ) | $ | (39 | ) | ||||
Credited to other accounts | — | (1 | ) | 2 | |||||||||
Total | $ | (33 | ) | $ | (35 | ) | $ | (37 | ) | ||||
(2) | Amounts shown as deductions from current and non-current receivables | $ | 253 | $ | 174 | $ | 134 | ||||||
(3) | Primarily represents reclassifications from other balance sheet accounts. | ||||||||||||
123
McKESSON CORPORATION
EXHIBIT INDEX
The agreements included as exhibits to this report are included to provide information regarding their terms and not intended to provide any other factual or disclosure information about the Company or the other parties to the agreements. The agreements may contain representations and warranties by each of the parties to the applicable agreement that were made solely for the benefit of the other parties to the applicable agreement, and;
• | should not in all instances be treated as categorical statements of fact, but rather as a way of allocating the risk to one of the parties if those statements prove to be inaccurate; |
• | may apply standards of materiality in a way that is different from what may be viewed as material to you or other investors; and |
• | were made only as of the date of the applicable agreement or such other date or dates as may be specified in the agreement and are subject to more recent developments. |
Accordingly, these representations and warranties may not describe the actual state of affairs as of the date they were made or at any other time.
Exhibits identified under “Incorporated by Reference” in the table below are on file with the Commission and are incorporated by reference as exhibits hereto.
Incorporated by Reference | |||||
Exhibit Number | Description | Form | File Number | Exhibit | Filing Date |
3.1 | Amended and Restated Certificate of Incorporation of the Company, as filed with the Delaware Secretary of State on July 27, 2011. | 8-K | 1-13252 | 3.1 | August 2, 2011 |
3.2 | Amended and Restated By-Laws of the Company, as amended July 29, 2015. | 8-K | 1-13252 | 3.1 | July 31, 2015 |
4.1 | Indenture, dated as of March 11, 1997, by and between the Company, as issuer, and The First National Bank of Chicago, as trustee. | 10-K | 1-13252 | 4.4 | June 19, 1997 |
4.2 | Officers’ Certificate, dated as of March 11, 1997, and related Form of 2027 Note. | S-4 | 333-30899 | 4.2 | July 8, 1997 |
4.3 | Indenture, dated as of March 5, 2007, by and between the Company, as issuer, and The Bank of New York Trust Company, N.A., as trustee. | 8-K | 1-13252 | 4.1 | March 5, 2007 |
4.4 | Officers’ Certificate, dated as of March 5, 2007, and related Form of 2017 Note. | 8-K | 1-13252 | 4.2 | March 5, 2007 |
4.5 | Officers’ Certificate, dated as of February 12, 2009, and related Form of 2014 Note and Form of 2019 Note. | 8-K | 1-13252 | 4.2 | February 12, 2009 |
4.6 | First Supplemental Indenture, dated as of February 28, 2011, to the Indenture, dated as of March 5, 2007, among the Company, as issuer, the Bank of New York Mellon Trust Company, N.A. (formerly known as The Bank of New York Trust Company, N.A.), and Wells Fargo Bank, National Association, as trustee, and related Form of 2016 Note, Form of 2021 Note and Form of 2041 Note. | 8-K | 1-13252 | 4.2 | February 28, 2011 |
4.7 | Indenture, dated as of December 4, 2012, by and between the Company, as issuer, and Wells Fargo Bank, National Association, as trustee. | 8-K | 1-13252 | 4.1 | December 4, 2012 |
4.8 | Officers’ Certificate, dated as of December 4, 2012, and related Form of 2015 Note and Form of 2022 Note. | 8-K | 1-13252 | 4.2 | December 4, 2012 |
4.9 | Officers’ Certificate, dated as of March 8, 2013, and related Form of 2018 Note and Form of 2023 Note. | 8-K | 1-13252 | 4.2 | March 8, 2013 |
4.10 | Officers’ Certificate, dated as of March 10, 2014, and related Form of Floating Rate Note, Form of 2017 Note, Form of 2019 Note, Form of 2024 Note, and Form of 2044 Note. | 8-K | 1-13252 | 4.2 | March 10, 2014 |
124
McKESSON CORPORATION
Incorporated by Reference | |||||
Exhibit Number | Description | Form | File Number | Exhibit | Filing Date |
10.1* | McKesson Corporation 1997 Non-Employee Directors’ Equity Compensation and Deferral Plan, as amended through January 29, 2003. | 10-K | 1-13252 | 10.4 | June 10, 2004 |
10.2* | McKesson Corporation Supplemental Profit Sharing Investment Plan, as amended and restated on January 29, 2003. | 10-K | 1-13252 | 10.6 | June 6, 2003 |
10.3* | McKesson Corporation Supplemental Profit Sharing Investment Plan II, as amended and restated on July 29, 2014. | 10-Q | 1-13252 | 10.1 | October 28, 2014 |
10.4* | McKesson Corporation Deferred Compensation Administration Plan, as amended and restated as of October 28, 2004. | 10-K | 1-13252 | 10.6 | May 13, 2005 |
10.5* | McKesson Corporation Deferred Compensation Administration Plan II, as amended and restated as of October 28, 2004, and Amendment No. 1 thereto effective July 25, 2007. | 10-K | 1-13252 | 10.7 | May 7, 2008 |
10.6* | McKesson Corporation Deferred Compensation Administration Plan III, as amended and restated July 29, 2014. | 10-Q | 1-13252 | 10.2 | October 28, 2014 |
10.7* | McKesson Corporation Executive Benefit Retirement Plan, as amended and restated on October 24, 2008. | 10-Q | 1-13252 | 10.3 | October 29, 2008 |
10.8* | McKesson Corporation Executive Survivor Benefits Plan, as amended and restated as of January 20, 2010. | 8-K | 1-13252 | 10.1 | January 25, 2010 |
10.9* | McKesson Corporation Severance Policy for Executive Employees, as amended and restated as of April 23, 2013. | 10-K | 1-13252 | 10.11 | May 7, 2013 |
10.10* | McKesson Corporation Change in Control Policy for Selected Executive Employees, as amended and restated on October 26, 2010. | 10-Q | 1-13252 | 10.2 | February 1, 2011 |
10.11* | McKesson Corporation Management Incentive Plan, effective July 29, 2015. | 8-K | 1-13252 | 10.1 | July 31, 2015 |
10.12* | Form of Statement of Terms and Conditions Applicable to Awards Pursuant to the McKesson Corporation Management Incentive Plan, effective May 26, 2015. | 10-Q | 1-13252 | 10.1 | July 29, 2015 |
10.13* | McKesson Corporation Long-Term Incentive Plan, as amended and restated, effective May 26, 2015. | 10-Q | 1-13252 | 10.2 | July 29, 2015 |
10.14† | Forms of Statement of Terms and Conditions Applicable to Awards Pursuant to the McKesson Corporation Long-Term Incentive Plan, effective May 24, 2016. | — | — | — | — |
10.15* | McKesson Corporation 2005 Stock Plan, as amended and restated on July 28, 2010. | 10-Q | 1-13252 | 10.4 | July 30, 2010 |
10.16* | Forms of (i) Statement of Terms and Conditions, (ii) Stock Option Grant Notice and (iii), Restricted Stock Unit Agreement, each as applicable to Awards under the McKesson Corporation 2005 Stock Plan. | 10-Q | 1-13252 | 10.2 | July 26, 2012 |
10.17* | McKesson Corporation 2013 Stock Plan, as adopted on May 22, 2013. | 8-K | 1-13252 | 10.1 | August 2, 2013 |
10.18† | Forms of Statement of Terms and Conditions Applicable to Awards Pursuant to the McKesson Corporation 2013 Stock Plan. | — | — | — | — |
10.19† | Form of Commercial Paper Dealer Agreement between McKesson Corporation, as Issuer, and the Dealer | — | — | — | — |
125
McKESSON CORPORATION
Incorporated by Reference | |||||
Exhibit Number | Description | Form | File Number | Exhibit | Filing Date |
10.20 | Credit Agreement, dated as of October 22, 2015, among the Company and Certain Subsidiaries, as Borrowers, Bank of America, N.A. as Administrative Agent, Bank of America, N.A. (acting through its Canada Branch), Citibank, N.A. and Barclays Bank PLC, as Swing Line Lenders, Wells Fargo Bank, National Association as L/C Issuer, Barclays Bank PLC, Citibank N.A., Wells Fargo Bank, National Association as Co-Syndication Agents, Goldman Sachs Bank USA, JPMorgan Chase Bank, N.A., The Bank of Tokyo-Mitsubishi UFJ, Ltd. as Co-Documentation Agents, and The Other Lenders Party Thereto, and Merrill Lynch, Pierce, Fenner & Smith Incorporated, Barclays Bank PLC, Citigroup Global Markets Inc., Goldman Sachs Bank USA, J.P. Morgan Securities, LLC, The Bank of TokyoMitsubishi UFJ, Ltd. and Wells Fargo Securities, LLC as Joint Lead Arrangers and Joint Book Runners. | 8-K | 1-13252 | 10.1 | October 23, 2015 |
10.21 | Amendment No. 2, dated January 30, 2014, and Amendment No. 1, dated November 15, 2013, to the Credit Agreement and the Credit Agreement dated as of September 23, 2011, among the Company and McKesson Canada Corporation, collectively, the Borrowers, Bank of America, N.A. as Administrative Agent, Bank of America, N.A. (acting through its Canada branch), as Canadian Administrative Agent, JPMorgan Chase Bank, N.A. and Wells Fargo Bank, National Association, as Co-Syndication Agents, Wells Fargo Bank, National Association as L/C Issuer, The Bank of Tokyo-Mitsubishi UFJ, LTD., The Bank of Nova Scotia and U.S. Bank National Association as Co-Documentation Agents, and The Other Lenders Party Thereto, and Merrill Lynch, Pierce, Fenner & Smith Incorporated, Sole Lead Arranger and Sole Book Manager. | 8-K | 1-3252 | 10.1 | February 5, 2014 |
10.22* | Amended and Restated Employment Agreement, effective as of November 1, 2008, by and between the Company and its Chairman, President and Chief Executive Officer. | 10-Q | 1-13252 | 10.10 | October 29, 2008 |
10.23* | Letter dated March 27, 2012 relinquishing certain rights provided in the Amended and Restated Employment Agreement by and between the Company and its Chairman, President and Chief Executive Officer. | 8-K | 1-13252 | 10.1 | April 2, 2012 |
10.24* | Letter dated February 27, 2014 relinquishing certain rights provided in the McKesson Corporation Executive Benefit Retirement Plan by and between the Company and its Chairman, President and Chief Executive Officer. | 8-K | 1-13252 | 10.1 | February 28, 2014 |
10.25* | Amended and Restated Employment Agreement, effective as of November 1, 2008, by and between the Company and its Executive Vice President and Group President. | 10-Q | 1-13252 | 10.12 | October 29, 2008 |
10.26* | Form of Director and Officer Indemnification Agreement. | 10-K | 1-13252 | 10.27 | May 4, 2010 |
12† | Computation of Ratio of Earnings to Fixed Charges. | — | — | — | — |
21† | List of Subsidiaries of the Registrant. | — | — | — | — |
23† | Consent of Independent Registered Public Accounting Firm, Deloitte & Touche LLP. | — | — | — | — |
24† | Power of Attorney. | — | — | — | — |
31.1† | Certification of Chief Executive Officer Pursuant to Rule 13a-14(a) and Rule 15d-14(a) of the Securities Exchange Act of 1934, as amended, and adopted pursuant to Section 302 of the Sarbanes-Oxley Act of 2002. | — | — | — | — |
31.2† | Certification of Chief Financial Officer Pursuant to Rule 13a-14(a) and Rule 15d-14(a) of the Securities Exchange Act of 1934 as amended, and adopted pursuant to Section 302 of the Sarbanes-Oxley Act of 2002. | — | — | — | — |
126
McKESSON CORPORATION
Incorporated by Reference | |||||
Exhibit Number | Description | Form | File Number | Exhibit | Filing Date |
32†† | Certification Pursuant to 18 U.S.C. Section 1350, as adopted pursuant to Section 906 of the Sarbanes-Oxley Act of 2002. | — | — | — | — |
101† | The following materials from the McKesson Corporation Annual Report on Form 10-K for the fiscal year ended March 31, 2014, formatted in Extensible Business Reporting Language (XBRL): (i) the Consolidated Statements of Operations, (ii) Consolidated Statements of Comprehensive Income, (iii) Consolidated Balance Sheets, (iv) Consolidated Statements of Stockholders' Equity, (v) Consolidated Statements of Cash Flows, and (vi) related Financial Notes. | — | — | — | — |
________________
* | Management contract or compensation plan or arrangement in which directors and/or executive officers are eligible to participate. |
† | Filed herewith. |
†† | Furnished herewith. |
Registrant agrees to furnish to the Commission upon request a copy of each instrument defining the rights of security holders with respect to issues of long-term debt of the registrant, the authorized principal amount of which does not exceed 10% of the total assets of the registrant.
127
McKESSON CORPORATION
DIRECTORS AND OFFICERS | ||
BOARD OF DIRECTORS | CORPORATE OFFICERS | |
John H. Hammergren | John H. Hammergren | |
Chairman of the Board, | Chairman of the Board, | |
President and Chief Executive Officer, | President and Chief Executive Officer, | |
McKesson Corporation | McKesson Corporation | |
Andy D. Bryant | James A. Beer | |
Chairman of the Board, | Executive Vice President and Chief Financial Officer | |
Intel Corporation | ||
Patrick J. Blake | ||
Wayne A. Budd | Executive Vice President and Group President | |
Senior Counsel, | ||
Goodwin Procter LLP | Jorge L. Figueredo | |
Executive Vice President, Human Resources | ||
N. Anthony Coles, M. D. | ||
Chairman and Chief Executive Officer, | Paul C. Julian | |
Yumanity Therapeutics, LLC | Executive Vice President and Group President | |
Alton F. Irby III | Bansi Nagji | |
Chairman and Founding Partner, | Executive Vice President, | |
London Bay Capital | Corporate Strategy and Business Development | |
M. Christine Jacobs | Kathleen D. McElligott | |
Chairman of the Board, President and | Executive Vice President, Chief Information Officer and | |
Chief Executive Officer, Retired, | Chief Technology Officer | |
Theragenics Corporation | ||
Lori A. Schechter | ||
Donald R. Knauss | Executive Vice President, General Counsel and | |
Executive Chairman of the Board, Retired, | Chief Compliance Officer | |
The Clorox Company | ||
Brian P. Moore | ||
Marie L. Knowles | Senior Vice President and Treasurer | |
Executive Vice President and | ||
Chief Financial Officer, Retired, | Nigel A. Rees | |
Atlantic Richfield Company | Senior Vice President and Controller | |
David M. Lawrence, M.D. | John G. Saia | |
Chairman of the Board and | Secretary | |
Chief Executive Officer, Retired, | ||
Kaiser Foundation Health Plan, Inc. and | ||
Kaiser Foundation Hospitals | ||
Edward A. Mueller | ||
Chairman of the Board and | ||
Chief Executive Officer, Retired, | ||
Qwest Communications International Inc. | ||
Susan R. Salka | ||
Chief Executive Officer and President, | ||
AMN Healthcare Services, Inc. | ||
128
McKESSON CORPORATION
CORPORATE INFORMATION
Common Stock
McKesson Corporation common stock is listed on the New York Stock Exchange (ticker symbol MCK) and is quoted in the daily stock tables carried by most newspapers.
Stockholder Information
Wells Fargo Shareowner Services, 1110 Centre Pointe Curve, Suite 101, Mendota Heights, MN 55120-4100 acts as transfer agent, registrar, dividend-paying agent and dividend reinvestment plan agent for McKesson Corporation stock and maintains all registered stockholder records for the Company. For information about McKesson Corporation stock or to request replacement of lost dividend checks, stock certificates or 1099-DIVs, or to have your dividend check deposited directly into your checking or savings account, stockholders may call Wells Fargo Shareowner Services’ telephone response center at (866) 614-9635. For the hearing impaired call (651) 450-4144. Wells Fargo Shareowner Services also has a website—www.wellsfargo.com/shareownerservices—that stockholders may use 24 hours a day to request account information.
Dividends and Dividend Reinvestment Plan
Dividends are generally paid on the first business day of January, April, July and October. McKesson Corporation’s Dividend Reinvestment Plan offers stockholders the opportunity to reinvest dividends in common stock and to purchase additional shares of common stock. Stock in an individual’s Dividend Reinvestment Plan is held in book entry at the Company’s transfer agent, Wells Fargo Shareowner Services. For more information, or to request an enrollment form, call Wells Fargo Shareowner Services’ telephone response center at (866) 614-9635. From outside the United States, call +1-651-450-4064.
Annual Meeting
McKesson Corporation’s Annual Meeting of Stockholders will be held at 8:30 a.m. EDT, on July 27, 2016 at the McKesson Corporation Medical-Surgical office at 9954 Mayland Drive, Richmond, VA 23233.
129