Attached files
| file | filename |
|---|---|
| EX-99.3 - EX-99.3 - Zendesk, Inc. | zen-ex993_463.htm |
| EX-99.1 - EX-99.1 - Zendesk, Inc. | zen-ex991_7.htm |
| EX-10.4 - EX-10.4 - Zendesk, Inc. | zen-ex104_462.htm |
| 8-K - 8-K - Zendesk, Inc. | zen-8k_20160428.htm |
Exhibit 99.2

Overview This month marks our second full year as a public company, and as we look back, we are proud of the impact we have had helping our more than 75,000 paid customer accounts around the world build better customer relationships. We have begun elevating our brand and growing our portfolio of products so that we can have an even bigger impact in the future across organizations large and small and in initiatives beyond customer support. Three Months Ended March 31, GAAP results20162015 Revenue$68,459$42,234 Gross profit46,94327,944 Gross margin68.6%66.2% Operating loss$(26,687)$(18,845) Operating margin-39.0%-44.6% Net loss$(27,171)$(19,168) Net loss per share(0.30)(0.25) Non-GAAP results Non-GAAP gross profit$49,955$29,461 Non-GAAP gross margin73.0%69.8% Non-GAAP operating loss$(6,794)$(7,487) Non-GAAP operating margin-9.9%-17.7% Non-GAAP net loss$(7,278)$(7,810) Non-GAAP net loss per share(0.08)(0.10) For additional information regarding the “Non-GAAP results” financial measures discussed in this letter, please see “Non-GAAP results” and “About non-GAAP financial measures” below.
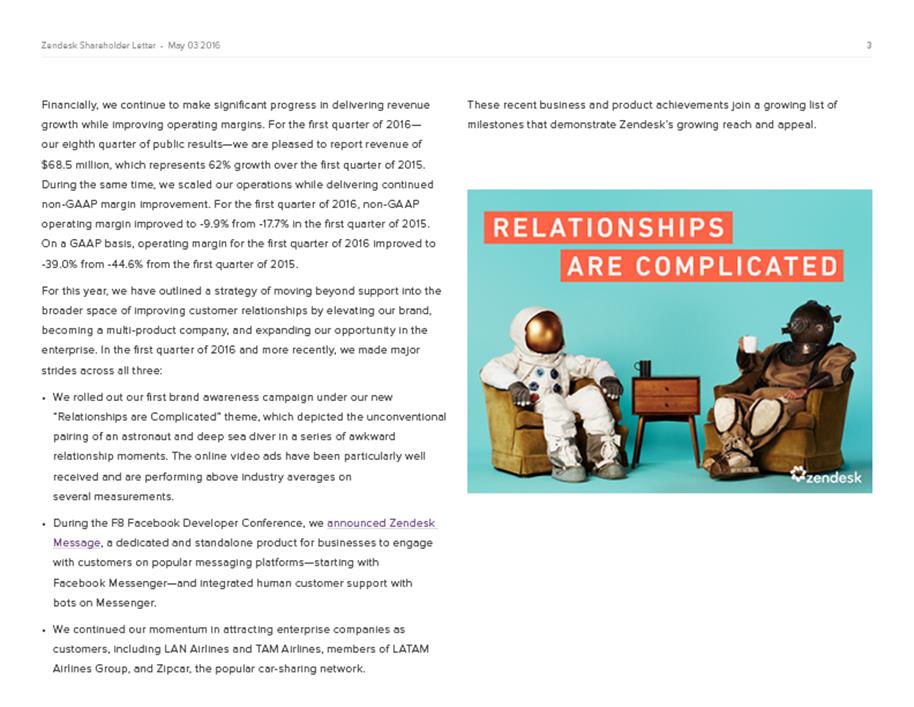
Financially, we continue to make significant progress in delivering revenue growth while improving operating margins. For the first quarter of 2016—our eighth quarter of public results—we are pleased to report revenue of $68.5 million, which represents 62% growth over the first quarter of 2015. During the same time, we scaled our operations while delivering continued non-GAAP margin improvement. For the first quarter of 2016, non-GAAP operating margin improved to -9.9% from -17.7% in the first quarter of 2015. On a GAAP basis, operating margin for the first quarter of 2016 improved to -39.0% from -44.6% from the first quarter of 2015. For this year, we have outlined a strategy of moving beyond support into the broader space of improving customer relationships by elevating our brand, becoming a multi-product company, and expanding our opportunity in the enterprise. In the first quarter of 2016 and more recently, we made major strides across all three: We rolled out our first brand awareness campaign under our new “Relationships are Complicated” theme, which depicted the unconventional pairing of an astronaut and deep sea diver in a series of awkward relationship moments. The online video ads have been particularly well received and are performing above industry averages on several measurements. During the F8 Facebook Developer Conference, we announced Zendesk Message, a dedicated and standalone product for businesses to engage with customers on popular messaging platforms—starting with Facebook Messenger—and integrated human customer support with bots on Messenger. We continued our momentum in attracting enterprise companies as customers, including LAN Airlines and TAM Airlines, members of LATAM Airlines Group, and Zipcar, the popular car-sharing network. These recent business and product achievements join a growing list of milestones that demonstrate Zendesk’s growing reach and appeal.
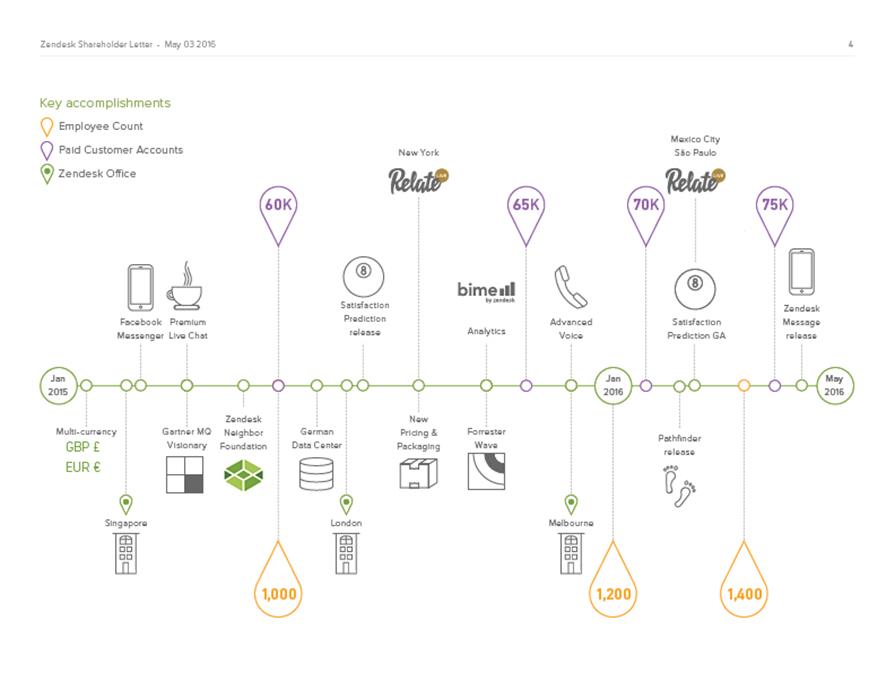
Key accomplishments
Key leaders join management team To continue delivering on our growth and expansion strategy, we are expanding our executive management team with proven leaders who have deep experience in scaling enterprise software companies and world-class brands. Elena Gomez, former senior vice president of finance and strategy at Salesforce, succeeds Alan Black as chief financial officer. Bryan Cox, former senior vice president of global customer operations at VMware, joins as our first chief revenue officer. Tom Keiser, former executive vice president of product operations and chief information officer at GAP Inc., becomes our first chief information officer. As our new CFO, Gomez will bring more than two decades of experience in finance and operations, as well as invaluable knowledge of the dynamic of SaaS business growth from her five years at Salesforce. Prior to Salesforce, Gomez has a proven track record of strategic financial leadership at Fortune 500 companies including Visa and Charles Schwab. She will help lead Zendesk’s next stage of growth as we seek to become a $1 billion revenue company in 2020. Cox most recently oversaw three key pillars of VMware’s global customer operations organization—including software license compliance, online sales, and the renewals business—an important part of VMware’s more than $6 billion in annual revenue. At Zendesk, he will lead all revenue-generating teams. Keiser has led major global technology initiatives for consumer product and retail companies throughout his 20-year career. At Zendesk, he will focus on building out the IT, security, and data architecture systems across the company’s worldwide offices for our next stage of global growth.
Elevating our brand Our brand remains a key differentiator for Zendesk, even as the company and our products have evolved over the years. Taking that brand and awareness to the next level is a major focus for us as we seek to move beyond our customer service roots and reach deeper into the enterprise market. With our first “Relationships Are Complicated” brand campaign, we focused on delivering creative video ads to potential buyers on the popular digital and online media they view as consumers. The campaign is aimed at expanding our brand awareness as we broaden our reach in the enterprise and into new product areas. A growing part of our brand story is our Relate initiative, which was designed to attract and retain an audience of potential customers even during times when they are not ready to buy software. It includes an online publication and live event series. During the first quarter of 2016, we steadily grew our Relate website traffic and held two successful live events: more than 1,200 people attended our Relate Live São Paulo event, and another 300 attended a smaller Relate event in Mexico City. Next week, we will host our first Relate Live event in our hometown of San Francisco with more than400 people currently registered. Another core component of our brand is corporate social responsibility. In April, all three Zendesk founders returned to Copenhagen and our startup roots to launch a new initiative to support socially minded startups, starting with Be My Eyes. Be My Eyes is an app that connects the visually impaired with a network of sighted people through live mobile video and is a great example of a new generation of social networks centered around microvolunteering. Through this new initiative, select startups can qualify for a $25,000 financial contribution, office hours with Zendesk’s executive team, and assistance from key personnel to build and scale their socially minded business. The initiative is an extension of the Zendesk Loves Startups program, which assists qualified startups with free Zendesk software for a year.
Multi-product addresses customer relationships We have made progress towards becoming a multi-product company to address the broad range of customer relationships. Addressing the entire customer lifecycle is important as the lines blur across support, sales, and marketing and customers increasingly expect ongoing, trusted relationships with businesses. Our new Zendesk Message product is an awesome example. We announced an early access program for the product in April. In addition, we worked together with Facebook and digital shopping platform Spring to integrate human chat into a Messenger bot experience that allows users to shop, discover, or browse Spring’s assortment in a natural, conversational way. This combination of a bot-driven shopping experience within messaging demonstrates how sales, marketing, and support are merging in digital channels, and we believe we are well positioned to lead this trend. We now also have a broad spectrum of Zendesk Voice options for fast, affordable, and reliable phone support for companies of any size with the introduction of the Basic Voice package in the first quarter of 2016, following the launch of Advanced Voice in the fourth quarter of 2015. We believe these additional options give us an opportunity to both attract new customers and sell to our existing customers. In fact, a recent survey of our existing customers suggests that 78% of those who offer phone support do not have it integrated with Zendesk, either through Zendesk Voice or our Computer Telephony Integration (CTI) partners. Other advancements across our product portfolio so far in 2016 include: General availability of our Satisfaction Prediction feature, our first machine learning offering that helps organizations spot potentially negative customer interactions and turn them into positive ones. More than 7 million customer interactions have been predicted so far among our customers using the feature, to better prioritize interactions and respond to customers. The launch of Pathfinder, an official Zendesk app that helps support agents be more efficient by giving them insight into which Help Center articles and self-service information a customer visited before requesting help. Advancements to Play and to routing automation features—for both our customer service and live chat platforms—to help larger teams and enterprises better manage the assignment and handling of customer interactions.
Low-touch key to frictionless adoption Making it easy and frictionless to initiate a trial and buy Zendesk through our self-service and low-touch model was the key to our earliest success, and it continues to be a core component of how we acquire customers and expand them over time. We saw strong growth in the first quarter of 2016 in our paid customer accounts, which now total more than 75,000. We view that growth as a sign of the health of our self-service and low-touch model. That channel focuses on strong organic discovery of Zendesk, an engaging trial experience and easy onboarding. It primarily targets small and medium-sized businesses and early-stage companies, but it can be the entry point into Zendesk for departments or projects within larger companies. A few notable customers that joined us or expanded with us in the first quarter of 2016 include: Wistia, an internet video hosting and analytics company Lightspeed POS, a cloud-based, point-of-sale solution and ecommerce solution Native Instruments, a leading manufacturer of software and hardware for computer-based audio production As we continue to support our self-service and low-touch channel, we are also developing important partner relationships. During the first quarter of 2016, we built a product integration with Microsoft for Office 365. We were subsequently featured on stage at Microsoft’s BUILD developer conference in March. We plan to work with more partners and resellers over the coming months.
Enterprise competitiveness highlighted In the enterprise, we’re continuing to see improvements in the competitiveness of our offering and the growth of larger deals. Our product development efforts around scaling, security and compliance have made us more competitive. At the same time, we saw growth in both the number and size of larger deals in the first quarter of 2016 as compared to the same quarter a year ago. Over the past two years, we have increasingly gained industry recognition as a key player in the enterprise, which we consider to be organizations with 500 or more employees. We’ve risen in industry analyst evaluations of vendors, including being named a strong performer in the Forrester Wave for Customer Service Solutions for Midsize Teams published in the fourth quarter of 2015. Zendesk also was named to CRM Magazine’s CRM Service Leaders list for Web support and to its 2016 CRM Service Rising Stars list in the March 2016 issue. One of our strategies in the enterprise is to land global call center deals as companies seek to replace outdated technology with modern solutions, and we’re seeing progress as our enterprise sales and marketing efforts have gained momentum over time. Our recent win with LAN Airlines and TAM Airlines, members of LATAM Airlines Group, is an example of a company which selected Zendesk to help improve their call center and customer care operations to serve the group’s network of 137 destinations in 25 countries. In approximately four months, the first 1,000 LATAM agents began using Zendesk as part of a global roll-out, and the software has already helped to reduce complexity and improve efficiency. Other recent enterprise customers selecting and implementing Zendesk include: Zipcar, which will use Zendesk to take its world-class call center and member services to the next level of customer care Lending Club, the world’s largest online credit marketplace Salvation Army, a worldwide charitable organization operating 7,500+ centers in communities across the United States SWBC, a financial services company that provides insurance, mortgage, and investment services to financial institutions, businesses, and individuals
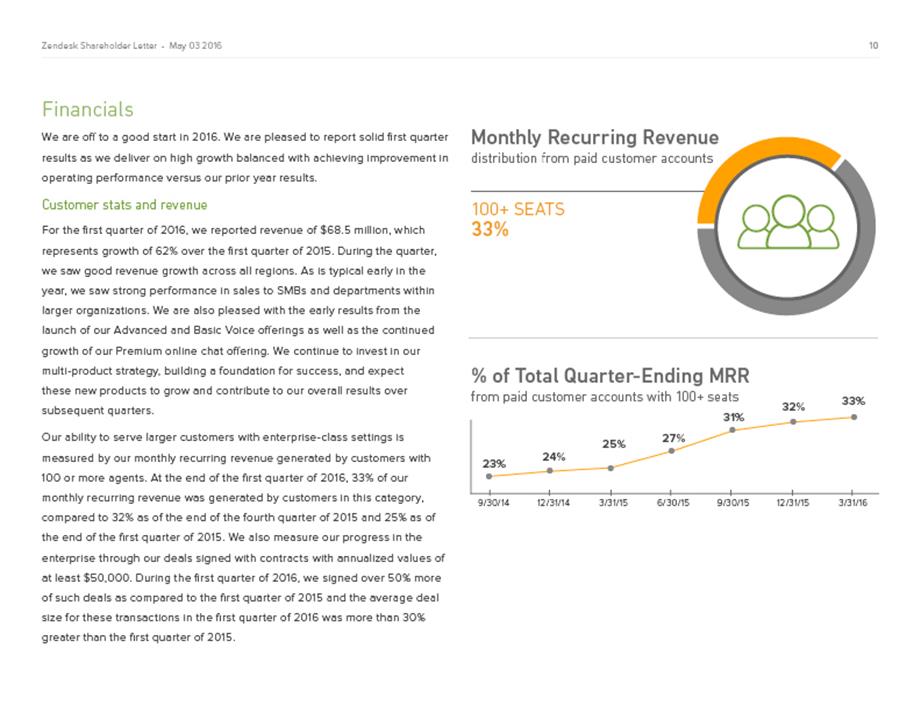
Financials We are off to a good start in 2016. We are pleased to report solid first quarter results as we deliver on high growth balanced with achieving improvement in operating performance versus our prior year results. Customer stats and revenue For the first quarter of 2016, we reported revenue of $68.5 million, which represents growth of 62% over the first quarter of 2015. During the quarter, we saw good revenue growth across all regions. As is typical early in the year, we saw strong performance in sales to SMBs and departments within larger organizations. We are also pleased with the early results from the launch of our Advanced and Basic Voice offerings as well as the continued growth of our Premium online chat offering. We continue to invest in our multi-product strategy, building a foundation for success, and expect these new products to grow and contribute to our overall results over subsequent quarters. Our ability to serve larger customers with enterprise-class settings is measured by our monthly recurring revenue generated by customers with 100 or more agents. At the end of the first quarter of 2016, 33% of our monthly recurring revenue was generated by customers in this category, compared to 32% as of the end of the fourth quarter of 2015 and 25% as of the end of the first quarter of 2015. We also measure our progress in the enterprise through our deals signed with contracts with annualized values of at least $50,000. During the first quarter of 2016, we signed over 50% more of such deals as compared to the first quarter of 2015 and the average deal size for these transactions in the first quarter of 2016 was more than 30% greater than the first quarter of 2015.
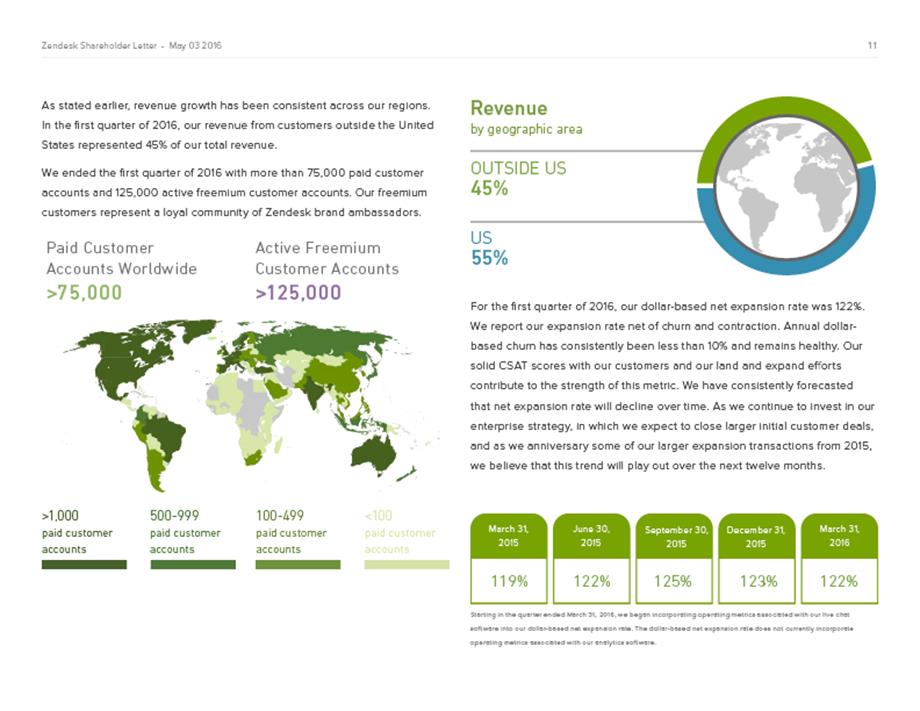
As stated earlier, revenue growth has been consistent across our regions. In the first quarter of 2016, our revenue from customers outside the United States represented 45% of our total revenue. We ended the first quarter of 2016 with more than 75,000 paid customer accounts and 125,000 active freemium customer accounts. Our freemium customers represent a loyal community of Zendesk brand ambassadors. For the first quarter of 2016, our dollar-based net expansion rate was 122%. We report our expansion rate net of churn and contraction. Annual dollar-based churn has consistently been less than 10% and remains healthy. Our solid CSAT scores with our customers and our land and expand efforts contribute to the strength of this metric. We have consistently forecasted that net expansion rate will decline over time. As we continue to invest in our enterprise strategy, in which we expect to close larger initial customer deals, and as we anniversary some of our larger expansion transactions from 2015, we believe that this trend will play out over the next twelve months.
Operating expenses and cash flow Non-GAAP gross margin increased to 73.0% in the first quarter of 2016 compared to 72.7% in the fourth quarter of 2015. Non-GAAP gross margin in the first quarter of 2015 was 69.8%. GAAP gross margin was unchanged at 68.6% in the first quarter of 2016 from the fourth quarter of 2015. GAAP gross margin in the first quarter of 2015 was 66.2%. Our non-GAAP operating loss for the first quarter of 2016 was $6.8 million, which was ahead of our outlook for the quarter—driven primarily by strong revenue growth and scale—compared to non-GAAP operating loss for the fourth quarter of 2015 of $6.6 million. Non-GAAP operating loss for the first quarter of 2015 was $7.5 million. Our GAAP operating loss for the first quarter of 2016 was $26.7 million, compared to GAAP operating loss for the fourth quarter of 2015 of $24.4 million. GAAP operating loss for the first quarter of 2015 was $18.8 million. Non-GAAP operating margin improved to -9.9% in the first quarter of 2016 from -10.5% in the fourth quarter of 2015 and -17.7% in the first quarter of 2015, a reflection of our efforts to scale our operations. GAAP operating margin was -39.0% in the first quarter of 2016 compared to -38.9% in the fourth quarter of 2015 and -44.6% in the first quarter of 2015. Our non-GAAP net loss for the first quarter of 2016 was $7.3 million or $0.08 per share, compared to non-GAAP net loss in the fourth quarter of 2015 of $6.7 million or $0.07 per share, and non-GAAP net loss in the first quarter of 2015 of $7.8 million or $0.10 per share. Our GAAP net loss for the first quarter of 2016 was $27.2 million or $0.30 per share compared to GAAP net loss in the fourth quarter of 2015 of $24.5 million or $0.27 per share, and GAAP net loss in the first quarter of 2015 of $19.2 million or $0.25 per share. Our GAAP net loss for the first quarter of 2016 included $19.0 million in share-based compensation and related expenses (including $0.8 million of employer tax related to employee stock transactions and $0.5 million of amortized share-based compensation capitalized in internal-use software), and $0.9 million of amortization of purchased intangibles. Along with the improvement in non-GAAP operating margin, during the first quarter of 2016, we generated $4.6 million of net cash from operating activities and were near breakeven on a free cash flow basis. Cash flows exceeded our expectations and were influenced by favorable timing of collections of accounts receivable and timing on accounts payable and other disbursements. We ended the first quarter of 2016 with $217.8 million of cash and equivalents, and we had an additional $36.5 million of short-term marketable securities. Weighted average shares used to compute both GAAP and non-GAAP net loss per share for the first quarter of 2016 was 90.5 million.
Guidance For the second quarter of 2016, we expect revenue to be in the range of $71.0 million to $73.0 million and we expect our non-GAAP operating loss to range between $7.5 and $8.5 million. We expect our GAAP operating loss for the second quarter of 2016 to range between $28.0 and $29.0 million. Our GAAP operating loss is estimated to include share-based compensation and related expenses of approximately $19.6 million, and amortization of purchased intangibles of approximately $0.9 million. For the full year of 2016, we expect revenue to be in the range of $300.0 to $305.0 million. We expect our non-GAAP operating loss for the full year of 2016 to range between $27.0 to $28.0 million, and we expect our GAAP operating loss to range between $111.0 and $112.0 million. Our GAAP operating loss for the full year of 2016 is estimated to include share-based compensation and related expenses of approximately $80.3 million, and amortization of purchased intangibles of approximately $3.7 million. Regarding cash flows, the timing of our data center investments and our recent decision to supplement our co-located data center investments with hosted data center locations will impact our future net cash from operating activities as we plan our continued expansion. We currently estimate our net cash from operating activities for the second quarter of 2016 will be near breakeven. For the fourth quarter of 2016 we expect our net cash from operating activities and free cash flow to be positive. Separately, we maintain our target to be free cash flow positive for the full year of 2017. Finally, we estimate we will have approximately 92.0 million weighted average shares outstanding for the second quarter of 2016 and 92.6 million weighted average shares outstanding for full year of 2016, each based only on current shares outstanding and anticipated activity associated with equity incentive plans.
Earnings call and webcast information Zendesk will host a conference call to answer questions at 2:00 p.m. Pacific Time, 5:00 p.m. Eastern Time, on Tuesday, May 3, 2016. A live webcast of the conference call will be available at https://investor.zendesk.com. The conference call can also be accessed by dialing 877-201-0168 or +1 647-788-4901 (outside the U.S. and Canada). The conference ID is 85341528. A replay of the call via webcast will be available at https://investor.zendesk.com or by dialing 855-859-2056 or +1 404-537-3406 (outside the U.S. and Canada) and entering passcode 85341528. The dial-in replay will be available until the end of day May 5, 2016. The webcast replay will be available for 12 months. We plan to release second quarter 2016 earnings results on August 2, 2016 after the market closes and will host a conference call and earnings webcast at 2:00 p.m. Pacific Time, 5:00 p.m. Eastern Time on the same day to discuss our next quarter results. Mikkel Svane CEO, Founder and Chairman of the Board Alan Black CFO
Forward-Looking Statements This press release contains forward-looking statements, including, among other things, statements regarding Zendesk’s future financial performance, its continued investment to grow its business, and progress towards its long-term financial objectives. The words such as “may,” “should,” “will,” “believe,” “expect,” “anticipate,” “target,” “project,” and similar phrases that denote future expectation or intent regarding Zendesk’s financial results, operations and other matters are intended to identify forward-looking statements. You should not rely upon forward-looking statements as predictions of future events. The outcome of the events described in these forward-looking statements is subject to known and unknown risks, uncertainties, and other factors that may cause Zendesk’s actual results, performance, or achievements to differ materially, including (i) adverse changes in general economic or market conditions; (ii) Zendesk’s ability to adapt its customer service platform to changing market dynamics and customer preferences or achieve increased market acceptance of its platform; (iii) Zendesk’s expectation that the future growth rate of its revenues will decline, and that as its costs increase, Zendesk may not be able to generate sufficient revenues to achieve or sustain profitability; (iv) Zendesk’s limited operating history, which makes it difficult to evaluate its prospects and future operating results; (v) Zendesk’s ability to effectively manage its growth and organizational change; (vi) the market in which Zendesk operates is intensely competitive, and Zendesk may not compete effectively; (vii) the development of the market for software as a service business software applications; (viii) Zendesk’s ability to sell its live chat software as a standalone service and more fully integrate its live chat software with its customer service platform; (ix) Zendesk’s ability to integrate We Are Cloud SAS with its existing corporate operations, to sell its analytics software as a standalone service and to integrate Zendesk’s analytics software with Zendesk’s customer service platform; (x) breaches in Zendesk’s security measures or unauthorized access to its customers’ data; (xi) service interruptions or performance problems associated with Zendesk’s technology and infrastructure; (xii) real or perceived errors, failures, or bugs in its products; (xiii) Zendesk’s substantial reliance on its customers renewing their subscriptions and purchasing additional subscriptions; and (xiv) Zendesk’s ability to effectively expand its sales capabilities. The forward-looking statements contained in this press release are also subject to additional risks, uncertainties, and factors, including those more fully described in Zendesk’s filings with the Securities and Exchange Commission, including its Annual Report on Form 10-K for the year ended December 31, 2015. Further information on potential risks that could affect actual results will be included in the subsequent periodic and current reports and other filings that Zendesk makes with the Securities and Exchange Commission from time to time, including its Quarterly Report on Form 10-Q for the quarter ended March 31, 2016. Forward-looking statements represent Zendesk’s management’s beliefs and assumptions only as of the date such statements are made. Zendesk undertakes no obligation to update any forward-looking statements made in this press release to reflect events or circumstances after the date of this press release or to reflect new information or the occurrence of unanticipated events, except as required by law.
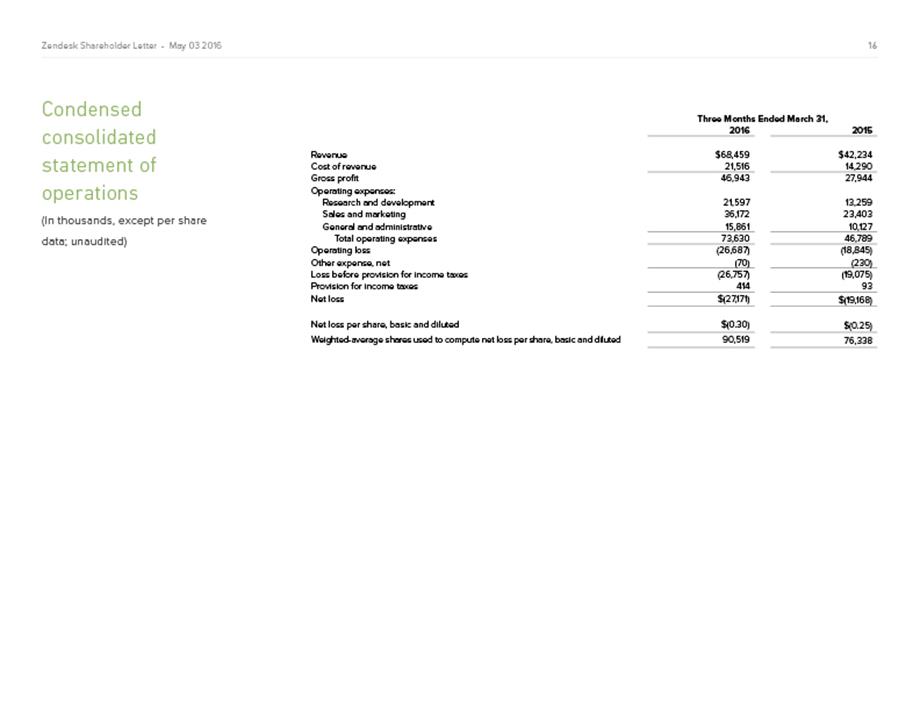
Condensed Consolidated Statement of Operations (In thousands, except per share data; unaudited) Three Months Ended March 31, 20162015 Revenue$ 68,459 $ 42,234 Cost of revenue 21,516 14,290 Gross profit46,943 27,944 Operating expenses: Research and development21,597 13,259 Sales and marketing36,172 23,403 General and administrative15,861 10,127 Total operating expenses73,630 46,789 Operating loss(26,687)(18,845) Other expense, net(70)(230) Loss before provision for income taxes(26,757)(19,075) Provision for income taxes414 93 Net loss $ (27,171)$ (19,168) Net loss per share, basic and diluted$ (0.30)$ (0.25) Weighted-average shares used to compute net loss per share, basic and diluted90,519 76,338
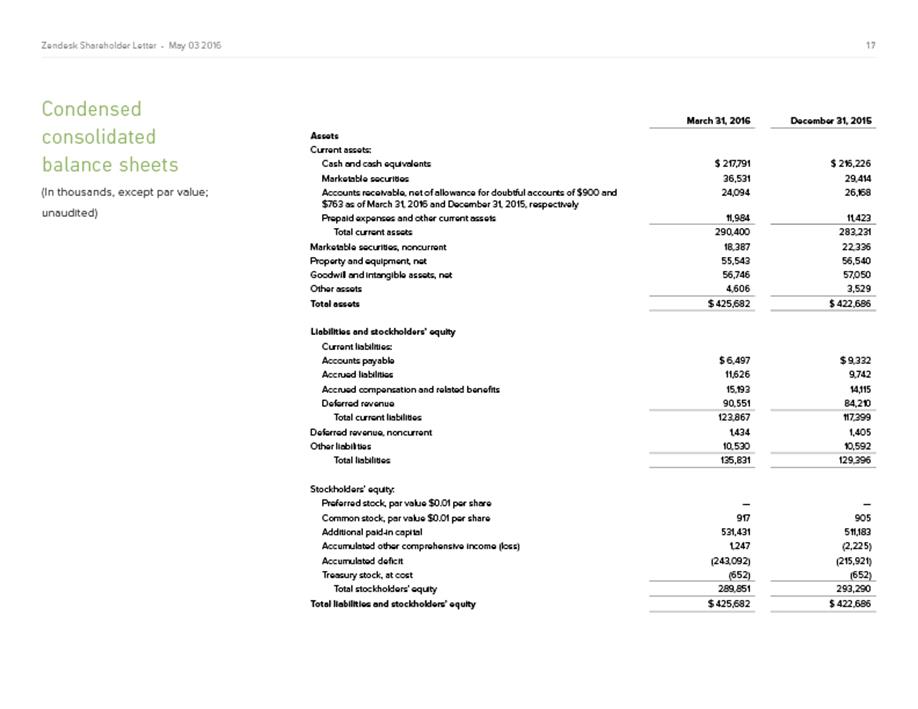
Condensed Consolidated Balance Sheets (In thousands, except par value; unaudited) March 31, December 31, 20162015 Assets Current assets: Cash and cash equivalents$ 217,791$ 216,226 Marketable securities36,53129,414 Accounts receivable, net of allowance for doubtful accounts of $900 and $763 as of March 31, 2016 and December 31, 2015, respectively24,09426,168 Prepaid expenses and other current assets11,98411,423 Total current assets290,400283,231 Marketable securities, noncurrent18,38722,336 Property and equipment, net55,54356,540 Goodwill and intangible assets, net56,74657,050 Other assets4,6063,529 Total assets$ 425,682$ 422,686 Liabilities and stockholders’ equity Current liabilities: Accounts payable$ 6,497$ 9,332 Accrued liabilities11,6269,742 Accrued compensation and related benefits15,19314,115 Deferred revenue90,55184,210 Total current liabilities123,867117,399 Deferred revenue, noncurrent1,4341,405 Other liabilities10,53010,592 Total liabilities135,831129,396 Stockholders’ equity: Preferred stock, par value $0.01 per share——Common stock, par value $0.01 per share917905 Additional paid-in capital531,431511,183 Accumulated other comprehensive income (loss)1,247(2,225) Accumulated deficit(243,092)(215,921) Treasury stock, at cost(652)(652) Total stockholders’ equity289,851293,290 Total liabilities and stockholders’ equity$ 425,682$ 422,686
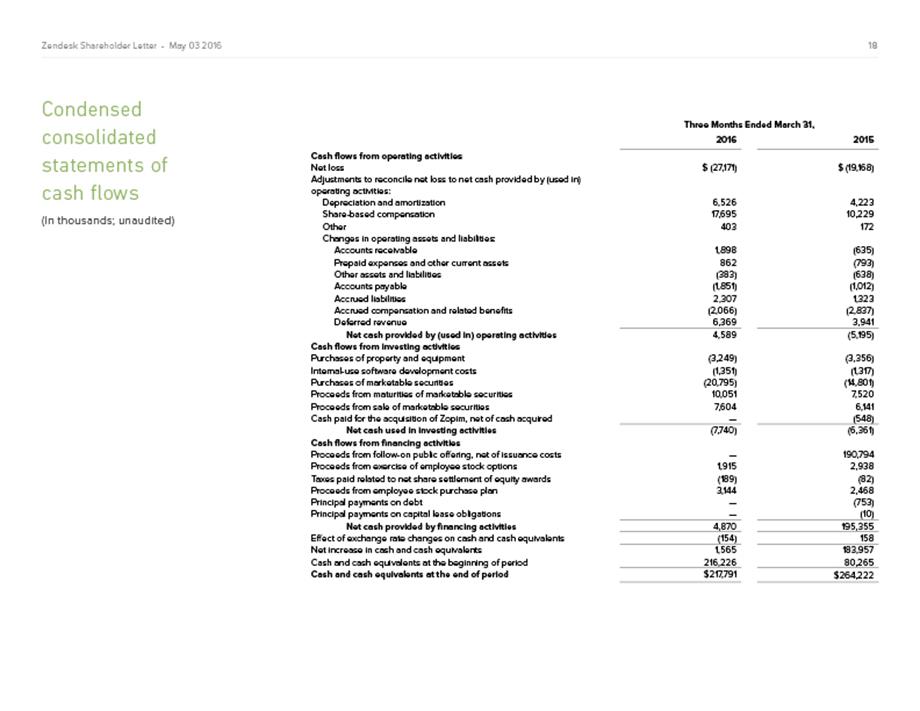
Condensed Consolidated Statements of Cash Flows (In thousands; unaudited) Three Months Ended March 31, 20162015 Cash flows from operating activities Net loss$ (27,171)$ (19,168) Adjustments to reconcile net loss to net cash provided by (used in) operating activities: Depreciation and amortization6,5264,223 Share-based compensation17,69510,229 Other403172 Changes in operating assets and liabilities: Accounts receivable1,898(635) Prepaid expenses and other current assets862(793) Other assets and liabilities(383)(638) Accounts payable(1,851)(1,012) Accrued liabilities2,3071,323 Accrued compensation and related benefits(2,066)(2,837) Deferred revenue6,3693,941 Net cash provided by (used in) operating activities4,589(5,195) Cash flows from investing activities Purchases of property and equipment(3,249)(3,356) Internal-use software development costs(1,351)(1,317) Purchases of marketable securities(20,795)(14,801) Proceeds from maturities of marketable securities10,0517,520 Proceeds from sale of marketable securities7,6046,141 Cash paid for the acquisition of Zopim, net of cash acquired—(548) Net cash used in investing activities(7,740)(6,361) Cash flows from financing activities Proceeds from follow-on public offering, net of issuance costs—190,794 Proceeds from exercise of employee stock options1,9152,938 Taxes paid related to net share settlement of equity awards(189)(82) Proceeds from employee stock purchase plan3,1442,468 Principal payments on debt—(753) Principal payments on capital lease obligations—(10) Net cash provided by financing activities4,870195,355 Effect of exchange rate changes on cash and cash equivalents(154)158 Net increase in cash and cash equivalents1,565183,957 Cash and cash equivalents at the beginning of period216,22680,265 Cash and cash equivalents at the end of period$ 217,791$ 264,222
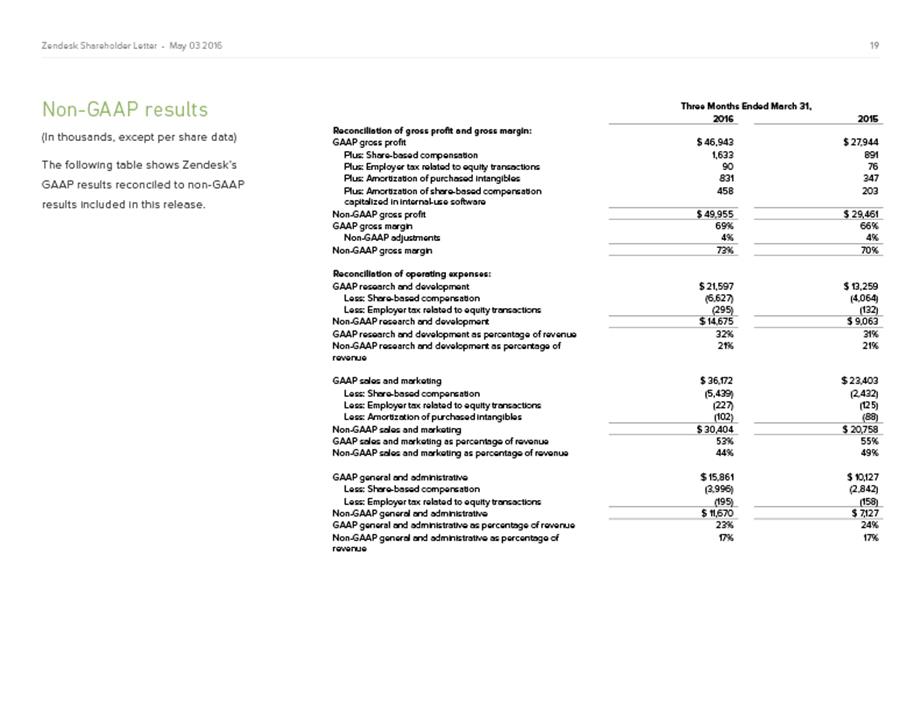
GAAP Results Reconciled to Non-GAAP Results (In thousands) Three Months Ended March 31, 20162015 Reconciliation of gross profit and gross margin: GAAP gross profit$ 46,943$ 27,944 Plus: Share-based compensation1,633891 Plus: Employer tax related to equity transactions9076 Plus: Amortization of purchased intangibles831347 Plus: Amortization of share-based compensation capitalized in internal-use software458203 Non-GAAP gross profit$ 49,955$ 29,461 GAAP gross margin69%66% Non-GAAP adjustments4%4% Non-GAAP gross margin73%70% Reconciliation of operating expenses: GAAP research and development$ 21,597$ 13,259 Less: Share-based compensation(6,627)(4,064) Less: Employer tax related to equity transactions(295)(132) Non-GAAP research and development$ 14,675$ 9,063 GAAP research and development as percentage of revenue32%31% Non-GAAP research and development as percentage of revenue21%21% GAAP sales and marketing$ 36,172$ 23,403 Less: Share-based compensation(5,439)(2,432) Less: Employer tax related to equity transactions(227)(125) Less: Amortization of purchased intangibles(102)(88) Non-GAAP sales and marketing$ 30,404$ 20,758 GAAP sales and marketing as percentage of revenue53%55% Non-GAAP sales and marketing as percentage of revenue44%49% GAAP general and administrative$ 15,861$ 10,127 Less: Share-based compensation(3,996)(2,842) Less: Employer tax related to equity transactions(195)(158) Non-GAAP general and administrative$ 11,670$ 7,127 GAAP general and administrative as percentage of revenue23%24% Non-GAAP general and administrative as percentage of revenue17%17%
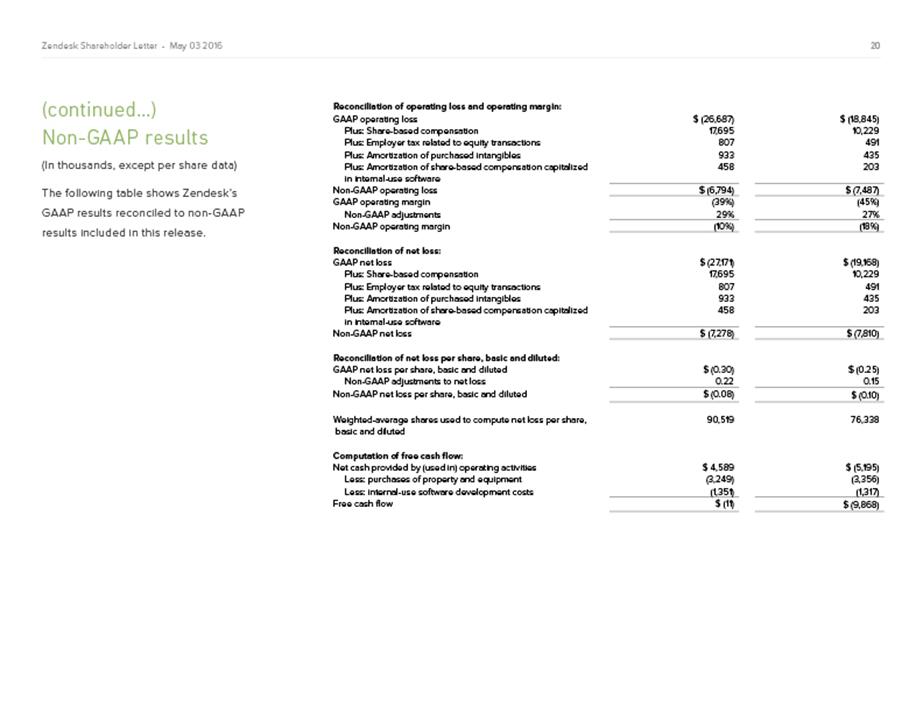
Reconciliation of operating loss and operating margin: GAAP operating loss$ (26,687)$ (18,845) Plus: Share-based compensation17,69510,229 Plus: Employer tax related to equity transactions807491 Plus: Amortization of purchased intangibles933435 Plus: Amortization of share-based compensation capitalized in internal-use software458203 Non-GAAP operating loss$ (6,794)$ (7,487) GAAP operating margin(39%)(45%) Non-GAAP adjustments29%27% Non-GAAP operating margin(10%)(18%) Reconciliation of net loss: GAAP net loss$ (27,171)$ (19,168) Plus: Share-based compensation17,69510,229 Plus: Employer tax related to equity transactions807491 Plus: Amortization of purchased intangibles933435 Plus: Amortization of share-based compensation capitalized in internal-use software458203 Non-GAAP net loss$ (7,278)$ (7,810) Reconciliation of net loss per share, basic and diluted: GAAP net loss per share, basic and diluted$ (0.30)$ (0.25) Non-GAAP adjustments to net loss0.220.15 Non-GAAP net loss per share, basic and diluted$ (0.08)$ (0.10) Weighted-average shares used to compute net loss per share, basic and diluted90,51976,338 Computation of free cash flow: Net cash provided by (used in) operating activities$ 4,589$ (5,195) Less: purchases of property and equipment(3,249)(3,356) Less: internal-use software development costs(1,351)(1,317) Free cash flow$ (11)$ (9,868)
About non-GAAP financial measures To provide investors and others with additional information regarding Zendesk’s results, the following non-GAAP financial measures were disclosed: non-GAAP gross profit and gross margin, non-GAAP operating expenses, non-GAAP operating loss and operating margin, non-GAAP net loss, non-GAAP net loss per share, basic and diluted, non-GAAP weighted-average shares used to compute net loss per share, basic and diluted, and free cash flow. Specifically, Zendesk excludes the following from its historical and prospective non-GAAP financial measures, as applicable: Share-based Compensation and Amortization of Share-based Compensation Capitalized in Internal-use Software: Zendesk utilizes share-based compensation to attract and retain employees. It is principally aimed at aligning their interests with those of its stockholders and at long-term retention, rather than to address operational performance for any particular period. As a result, share-based compensation expenses vary for reasons that are generally unrelated to financial and operational performance in any particular period. Employer Tax Related to Employee Stock Transactions: Zendesk views the amount of employer taxes related to its employee stock transactions as an expense that is dependent on its stock price, employee exercise and other award disposition activity, and other factors that are beyond Zendesk’s control. As a result, employer taxes related to its employee stock transactions vary for reasons that are generally unrelated to financial and operational performance in any particular period. Amortization of Purchased Intangibles and Acquisition Related Expenses: Zendesk views amortization of purchased intangible assets, including the amortization of the cost associated with an acquired entity’s developed technology, as items arising from pre-acquisition activities determined at the time of an acquisition. While these intangible assets are evaluated for impairment regularly, amortization of the cost of purchased intangibles is an expense that is not typically affected by operations during any particular period. Zendesk views acquisition related expenses as events that are not necessarily reflective of operational performance during a period. In particular, Zendesk believes the consideration of measures that exclude such expenses can assist in the comparison of operational performance in different periods which may or may not include such expenses. Zendesk provides disclosures regarding its free cash flow, which is defined as net cash from operating activities, less purchases of property and equipment and internal-use software development costs. Zendesk uses free cash flow, among other measures, to evaluate the ability of its operations to generate cash that is available for purposes other than capital expenditures and capitalized software development costs. Zendesk believes that information regarding free cash flow provides investors with an important perspective on the cash available to fund ongoing operations. Zendesk uses non-GAAP financial information to evaluate its ongoing operations and for internal planning and forecasting purposes. Zendesk's management does not itself, nor does it suggest that investors should, consider such non-GAAP financial measures in isolation from, or as a substitute for, financial information prepared in accordance with GAAP. Zendesk presents such non-GAAP financial measures in reporting its financial results to provide investors with an additional tool to evaluate Zendesk's operating results. Zendesk believes these non-GAAP financial measures are useful because they allow for greater transparency with respect to key metrics used by management in its financial and operational decision-making. This allows investors and others to better understand and evaluate Zendesk’s operating results and future prospects in the same manner as management. Zendesk's management believes it is useful for itself and investors to review, as applicable, both GAAP information that may include items such as share-based compensation expense, amortization of share-based compensation capitalized in internal-use software, amortization of purchased intangibles, transaction costs related to acquisitions, and the non-GAAP measures that exclude such information in order to assess the performance of Zendesk's business and for planning and forecasting in subsequent periods. When Zendesk uses such a non-GAAP financial measure, it provides, when determinable without unreasonable effort, a reconciliation of the non-GAAP financial measure to the most closely comparable GAAP financial measure. When such reconciliation is not determinable without unreasonable effort, Zendesk provides the reconciling information that is determinable without unreasonable effort and identifies the information that would need to be added or subtracted from the non-GAAP measure to arrive at the most directly comparable GAAP measure. Investors are encouraged to review the related GAAP financial measures and the reconciliation of these non-GAAP financial measures to their most directly comparable GAAP financial measure as detailed above.
About operating metrics Zendesk reviews a number of operating metrics to evaluate its business, measure performance, identify trends, formulate business plans, and make strategic decisions. These include the number of paid customer accounts for its customer service platform and live chat software, dollar-based net expansion rate, monthly recurring revenue represented by its churned customers, and the percentage of its monthly recurring revenue originating from customers with more than 100 agents. Zendesk defines the number of paid customer accounts at the end of any particular period as the sum of the number of accounts on its customer service platform, exclusive of its Starter plan, free trials or other free services, and the number of accounts using its live chat software, exclusive of free trials or other free services, each as of the end of the period and as identified by a unique account identifier. Use of Zendesk’s customer service platform and live chat software requires separate subscriptions and each of these accounts are treated as a separate paid customer account. Existing customers may also expand their utilization of our customer service platform or live chat software by adding new accounts and a single consolidated organization or customer may have multiple accounts across each of Zendesk’s customer service platform and live chat software to service separate subsidiaries, divisions, or work processes. Each of these accounts is also treated as a separate paid customer account. Zendesk does not currently incorporate accounts using its analytics software into the determination of the number of paid customer accounts. Accounts that subscribe to Zendesk’s Essential plan are included in the determination of the number of paid customer accounts. Zendesk’s dollar-based net expansion rate provides a measurement of its ability to increase revenue across its existing customer base through expansion of authorized agents associated with a paid customer account, upgrades in subscription plan, and the purchase of additional features on Zendesk’s customer service platform, such as voice subscriptions, as offset by churn, contraction in authorized agents associated with a paid customer account, and downgrades in subscription plans. Zendesk’s dollar-based net expansion rate is based upon monthly recurring revenue for a set of paid customer accounts on its customer service platform and live chat software. Monthly recurring revenue for a paid customer account is a legal and contractual determination made by assessing the contractual terms of each paid customer account, as of the date of determination, as to the revenue Zendesk expects to generate in the next monthly period for that paid customer account, assuming no changes to the subscription and without taking into account any one-time discounts or any platform usage above the subscription base, if any, that may be applicable to such subscription. Monthly recurring revenue is not determined by reference to historical revenue, deferred revenue or any other United States generally accepted accounting principles, or GAAP, financial measure over any period. It is forward-looking and contractually derived as of the date of determination. Zendesk calculates its dollar-based net expansion rate by dividing the retained revenue net of contraction and churn by Zendesk’s base revenue. Zendesk defines its base revenue as the aggregate monthly recurring revenue of the paid customer accounts on Zendesk’s customer service platform and live chat software as of the date one year prior to the date of calculation. Zendesk defines the retained revenue net of contraction and churn as the aggregate monthly recurring revenue of the same customer base included in the measure of base revenue at the end of the annual period being measured. The dollar-based net expansion rate is also adjusted to eliminate the effect of certain activities that we identify involving the transfer of agents between paid customer accounts, consolidation of customer accounts, or the split of a single paid customer account into multiple paid customer accounts. In addition, the dollar-based net expansion rate is adjusted to include paid customer accounts in the customer base used to determine retained revenue net of contraction and churn that share common corporate information with customers in the customer base that is used to determine the base revenue. Giving effect to this consolidation results in Zendesk’s dollar-based net expansion rate being calculated across approximately 66,500 customers, as compared to the approximately 75,600 total paid customer accounts as of March 31, 2016. To the extent that Zendesk can determine that the underlying customers do not share common corporate information, Zendesk does not aggregate paid customer accounts associated with reseller and other similar channel arrangements for the purposes of determining its dollar-based net expansion rate. While not material, Zendesk believes the failure to account for these activities would otherwise skew the dollar-based net expansion metrics associated with customers that maintain multiple paid customer accounts on its customer service platform or live chat software and paid customer accounts associated with reseller and other similar channel arrangements.
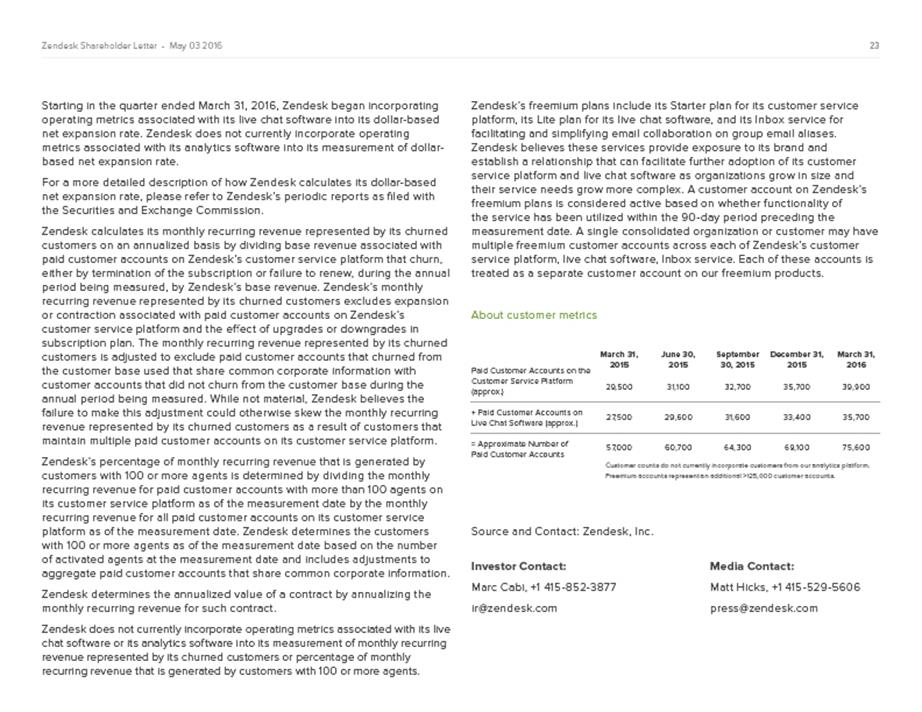
Starting in the quarter ended March 31, 2016, Zendesk began incorporating operating metrics associated with its live chat software into its dollar-based net expansion rate. Zendesk does not currently incorporate operating metrics associated with its analytics software into its measurement of dollar-based net expansion rate. For a more detailed description of how Zendesk calculates its dollar-based net expansion rate, please refer to Zendesk’s periodic reports as filed with the Securities and Exchange Commission. Zendesk calculates its monthly recurring revenue represented by its churned customers on an annualized basis by dividing base revenue associated with paid customer accounts on Zendesk’s customer service platform that churn, either by termination of the subscription or failure to renew, during the annual period being measured, by Zendesk’s base revenue. Zendesk’s monthly recurring revenue represented by its churned customers excludes expansion or contraction associated with paid customer accounts on Zendesk’s customer service platform and the effect of upgrades or downgrades in subscription plan. The monthly recurring revenue represented by its churned customers is adjusted to exclude paid customer accounts that churned from the customer base used that share common corporate information with customer accounts that did not churn from the customer base during the annual period being measured. While not material, Zendesk believes the failure to make this adjustment could otherwise skew the monthly recurring revenue represented by its churned customers as a result of customers that maintain multiple paid customer accounts on its customer service platform. Zendesk’s percentage of monthly recurring revenue that is generated by customers with 100 or more agents is determined by dividing the monthly recurring revenue for paid customer accounts with more than 100 agents on its customer service platform as of the measurement date by the monthly recurring revenue for all paid customer accounts on its customer service platform as of the measurement date. Zendesk determines the customers with 100 or more agents as of the measurement date based on the number of activated agents at the measurement date and includes adjustments to aggregate paid customer accounts that share common corporate information. Zendesk determines the annualized value of a contract by annualizing the monthly recurring revenue for such contract. Zendesk does not currently incorporate operating metrics associated with its live chat software or its analytics software into its measurement of monthly recurring revenue represented by its churned customers or percentage of monthly recurring revenue that is generated by customers with 100 or more agents. Zendesk’s freemium plans include its Starter plan for its customer service platform, its Lite plan for its live chat software, and its Inbox service for facilitating and simplifying email collaboration on group email aliases. Zendesk believes these services provide exposure to its brand and establish a relationship that can facilitate further adoption of its customer service platform and live chat software as organizations grow in size and their service needs grow more complex. A customer account on Zendesk’s freemium plans is considered active based on whether functionality of the service has been utilized within the 90-day period preceding the measurement date. A single consolidated organization or customer may have multiple freemium customer accounts across each of Zendesk’s customer service platform, live chat software, Inbox service. Each of these accounts is treated as a separate customer account on our freemium products. About customer metrics March 31, 2015 June 30, 2015 September 30, 2015 December 31, 2015 March 31, 2016 Paid Customer Accounts on the Customer Engagement Platform (approx.) 29,500 31,100 32,700 35,700 39,900+ Paid Customer Accounts on Live Chat Platform (approx.) 27,500 29,600 31,600 33,400 35,700 = Approximate Number of Paid Customer Accounts 57,000 60,700 64,300 69,100 75,600 Customer counts do not currently incorporate customers from our analytics platform. Freemium accounts represent an additional >125,000 customer accounts.