Attached files
| file | filename |
|---|---|
| EX-23.1 - EX-23.1 - Zendesk, Inc. | zen-ex231_9.htm |
| EX-31.2 - EX-31.2 - Zendesk, Inc. | zen-ex312_7.htm |
| EX-31.1 - EX-31.1 - Zendesk, Inc. | zen-ex311_6.htm |
| EX-32.1 - EX-32.1 - Zendesk, Inc. | zen-ex321_8.htm |
| EX-10.9 - EX-10.9 - Zendesk, Inc. | zen-ex109_312.htm |
| EX-21.1 - EX-21.1 - Zendesk, Inc. | zen-ex211_225.htm |
| EX-10.2 - EX-10.2 - Zendesk, Inc. | zen-ex102_391.htm |
| EX-10.10 - EX-10.10 - Zendesk, Inc. | zen-ex1010_311.htm |
UNITED STATES
SECURITIES AND EXCHANGE COMMISSION
Washington, D.C. 20549
FORM 10-K
(Mark One)
|
x |
ANNUAL REPORT PURSUANT TO SECTION 13 OR 15(d) OF THE SECURITIES EXCHANGE ACT OF 1934 |
For the fiscal year ended December 31, 2015
OR
|
¨ |
TRANSITION REPORT PURSUANT TO SECTION 13 OR 15(d) OF THE SECURITIES EXCHANGE ACT OF 1934 |
FOR THE TRANSITION PERIOD FROM TO
Commission File Number 001-36456
ZENDESK, INC.
(Exact name of Registrant as specified in its Charter)
|
Delaware |
|
26-4411091 |
|
( State or other jurisdiction of incorporation or organization) |
|
(I.R.S. Employer |
|
|
|
|
|
1019 Market Street San Francisco, CA |
|
94103 |
|
(Address of principal executive offices) |
|
(Zip Code) |
Registrant’s telephone number, including area code: (415) 418-7506
Securities registered pursuant to Section 12(b) of the Act: Common Stock, Par Value $0.01 Per Share; Common stock traded on the New York Stock Exchange
Securities registered pursuant to Section 12(g) of the Act: None
Indicate by check mark if the Registrant is a well-known seasoned issuer, as defined in Rule 405 of the Securities Act. YES ¨ NO x
Indicate by check mark if the Registrant is not required to file reports pursuant to Section 13 or 15(d) of the Act. YES ¨ NO x
Indicate by check mark whether the Registrant: (1) has filed all reports required to be filed by Section 13 or 15(d) of the Securities Exchange Act of 1934 during the preceding 12 months (or for such shorter period that the Registrant was required to file such reports), and (2) has been subject to such filing requirements for the past 90 days. YES x NO ¨
Indicate by check mark whether the Registrant has submitted electronically and posted on its corporate Web site, if any, every Interactive Data File required to be submitted and posted pursuant to Rule 405 of Regulation S-T (§232.405 of this chapter) during the preceding 12 months (or for such shorter period that the Registrant was required to submit and post such files). YES x NO ¨
Indicate by check mark if disclosure of delinquent filers pursuant to Item 405 of Regulation S-K (§229.405) is not contained herein, and will not be contained, to the best of Registrant’s knowledge, in definitive proxy or information statements incorporated by reference in Part III of this Form 10-K or any amendment to this Form 10-K. o
Indicate by check mark whether the Registrant is a large accelerated filer, an accelerated filer, a non-accelerated filer, or a smaller reporting company. See the definition of “large accelerated filer”, “accelerated filer”, and “smaller reporting company” in Rule 12b-2 of the Exchange Act. (Check one):
|
Large accelerated filer |
|
x |
|
Accelerated filer |
|
o |
|
|
|
|
|
|||
|
Non-accelerated filer |
|
¨ (Do not check if a small reporting company) |
|
Smaller reporting company |
|
¨ |
Indicate by check mark whether the Registrant is a shell company (as defined in Rule 12b-2 of the Exchange Act). YES ¨ NO x
The aggregate market value of common stock held by non-affiliates of the registrant, computed by reference to the closing price at which the common stock was sold on June 30, 2015, the last business day of the registrant's most recently completed second fiscal quarter, as reported on the New York Stock Exchange, was approximately $1,203 million. Shares of common stock held by each executive officer, director and holder of 5% or more of the outstanding common stock have been excluded in that such persons may be deemed to be affiliates. This determination of affiliate status does not reflect a determination that such persons are affiliates of the registrant for any other purpose.
The number of shares of Registrant’s Common Stock outstanding as of January 31, 2016 was 90,507,351.
DOCUMENTS INCORPORATED BY REFERENCE
Portions of the registrant's definitive Proxy Statement for its 2015 Annual Meeting of Stockholders are incorporated by reference in Part III of this Annual Report on Form 10-K. Such Proxy Statement will be filed with the U.S. Securities and Exchange Commission within 120 days after the end of the fiscal year ended December 31, 2015. Except with respect to information specifically incorporated by reference in this Form 10-K, the Proxy Statement is not deemed to be filed as part of this Form 10-K.
|
|
|
|
|
Page |
|
|
|
|||
|
|
|
|||
|
|
|
|
||
|
Item 1. |
|
|
4 |
|
|
|
|
|
|
|
|
Item 1A. |
|
|
15 |
|
|
|
|
|
|
|
|
Item 1B. |
|
|
38 |
|
|
|
|
|
|
|
|
Item 2. |
|
|
38 |
|
|
|
|
|
|
|
|
Item 3. |
|
|
38 |
|
|
|
|
|
|
|
|
Item 4. |
|
|
38 |
|
|
|
|
|||
|
|
|
|||
|
|
|
|
||
|
Item 5. |
|
|
39 |
|
|
|
|
|
|
|
|
Item 6. |
|
|
40 |
|
|
|
|
|
|
|
|
Item 7. |
|
Management’s Discussion and Analysis of Financial Condition and Results of Operations |
|
42 |
|
|
|
|
|
|
|
Item 7A. |
|
|
54 |
|
|
|
|
|
|
|
|
Item 8. |
|
|
58 |
|
|
|
|
|
|
|
|
Item 9. |
|
Changes in and Disagreements With Accountants on Accounting and Financial Disclosure |
|
85 |
|
|
|
|
|
|
|
Item 9A. |
|
|
85 |
|
|
|
|
|
|
|
|
Item 9B. |
|
|
85 |
|
|
|
|
|||
|
|
|
|||
|
|
|
|
||
|
Item 10. |
|
|
86 |
|
|
|
|
|
|
|
|
Item 11. |
|
|
86 |
|
|
|
|
|
|
|
|
Item 12. |
|
Security Ownership of Certain Beneficial Owners and Management and Related Stockholder Matters |
|
86 |
|
|
|
|
|
|
|
Item 13. |
|
Certain Relationships and Related Transactions, and Director Independence |
|
86 |
|
|
|
|
|
|
|
Item 14. |
|
|
86 |
|
|
|
|
|||
|
|
|
|||
|
|
|
|
||
|
Item 15. |
|
|
87 |
|
2
SPECIAL NOTE REGARDING FORWARD-LOOKING STATEMENTS
This Annual Report on Form 10-K contains forward-looking statements within the meaning of Section 27A of the Securities Act of 1933, as amended, or the Securities Act, and Section 21E of the Securities Exchange Act of 1934, as amended, or the Exchange Act, which statements involve substantial risks and uncertainties. Forward-looking statements generally relate to future events or our future financial or operating performance. In some cases, you can identify forward-looking statements because they contain words such as “may,” “will,” “should,” “expects,” “plans,” “anticipates,” “could,” “intends,” “target,” “projects,” “contemplates,” “believes,” “estimates,” “predicts,” “potential” or “continue” or the negative of these words or other similar terms or expressions that concern our expectations, strategy, plans or intentions. Forward-looking statements contained in this Annual Report on Form 10-K include, but are not limited to, statements about:
|
|
· |
our future financial performance, including our revenue, cost of revenue, gross profit, operating expenses, ability to generate positive cash flow, and ability to achieve and maintain profitability; |
|
|
· |
the sufficiency of our cash and cash equivalents, and marketable securities to meet our liquidity needs; |
|
|
· |
our ability to attract and retain customers to use our customer service platform, live chat software, and analytics software, and to optimize the pricing for such software; |
|
|
· |
the evolution of technology affecting our platform, services, and markets; |
|
|
· |
our ability to innovate and provide a superior customer experience; |
|
|
· |
our ability to successfully expand in our existing markets and into new markets; |
|
|
· |
the attraction and retention of qualified employees and key personnel; |
|
|
· |
worldwide economic conditions and their impact on information technology spending; |
|
|
· |
our ability to effectively manage our growth and future expenses; |
|
|
· |
our ability to successfully offer our live chat software and our analytics software as standalone services or further integrate such software with our customer service platform; our ability to maintain, protect, and enhance our intellectual property; |
|
|
· |
our ability to comply with modified or new laws and regulations applying to our business, including privacy and data security regulations; |
|
|
· |
our ability to securely maintain customer data; |
|
|
· |
our ability to maintain and enhance our brand; and |
|
|
· |
the increased expenses and administrative workload associated with being a public company. |
We caution you that the foregoing list may not contain all of the forward-looking statements made in this Annual Report on Form 10-K.
You should not rely upon forward-looking statements as predictions of future events. We have based the forward-looking statements contained in this Annual Report on Form 10-K primarily on our current expectations and projections about future events and trends that we believe may affect our business, financial condition, results of operations and prospects. The outcome of the events described in these forward-looking statements is subject to risks, uncertainties and other factors described in “Risk Factors” and elsewhere in this Annual Report on Form 10-K. Moreover, we operate in a very competitive and rapidly changing environment. New risks and uncertainties emerge from time to time, and it is not possible for us to predict all risks and uncertainties that could have an impact on the forward-looking statements contained in this Annual Report on Form 10-K. We cannot assure you that the results, events and circumstances reflected in the forward-looking statements will be achieved or occur, and actual results, events, or circumstances could differ materially from those described in the forward-looking statements.
The forward-looking statements made in this Annual Report on Form 10-K relate only to events as of the date on which the statements are made. We undertake no obligation to update any forward-looking statements made in this Annual Report on Form 10-K to reflect events or circumstances after the date of this Annual Report on Form 10-K or to reflect new information or the occurrence of unanticipated events, except as required by law. We may not actually achieve the plans, intentions, or expectations disclosed in our forward-looking statements and you should not place undue reliance on our forward-looking statements. Our forward-looking statements do not reflect the potential impact of any future acquisitions, mergers, dispositions, joint ventures, or investments we may make.
3
Overview
Zendesk believes the fundamental relationship between organizations and their customers is changing. As consumers, we have more choices, have access to more information, and are more connected than ever before. We expect to be heard, engaged, and valued by the organizations we interact with. At the same time, organizations are increasingly recognizing the value of these deeper relationships. As a result, a new customer service philosophy is emerging.
Zendesk was formed to help organizations capitalize on this profound shift. We are a software development company that provides a SaaS customer service platform. Our beautifully simple platform helps organizations engage with people in new ways that foster long-term customer loyalty and satisfaction. We empower organizations to better answer customers’ questions, and to solve their problems through the channels that people use every day when seeking help, such as email, chat, voice, social media, and websites. Our platform also helps people find answers on their own through knowledge bases and communities, capitalizing on the increasing customer preference for self-service. Our customer engagement capabilities allow organizations to proactively serve their customers, reaching out to those who may need help and soliciting feedback about their experience. The openness of our customer service platform makes it easy for organizations to integrate with other applications and embed our platform’s functionality natively into their own websites and mobile applications. Our platform consolidates the data from customer interactions and provides organizations with powerful analytics and performance benchmarking. We also provide SaaS live chat software that can be utilized independently to facilitate proactive communications between organizations and their customers or integrated easily into our platform.
Our business model is designed to drive organic growth, leverage positive word-of-mouth, and remove friction from the evaluation and purchasing process. We enable and encourage customers to try our products through free trials and subscribe to them directly through our website. Our sales team largely focuses on a land and expand strategy, which leverages this grassroots adoption and seeks to expand our footprint within organizations.
As of December 31, 2015, we had approximately 69,100 paid customer accounts for our customer service platform and live chat software in the aggregate. This includes approximately 35,700 customer accounts for paid subscription plans on our customer service platform (other than our low-cost Starter plan) and approximately 33,400 customer accounts for paid subscription plans of our live chat software. Organizations are able to access “freemium” plans on our customer service platform and live chat software, as well as email collaboration software, that are provided by us free of charge or at very low cost. As of December 31, 2015, we had more than 121,100 active accounts using these services. Our customers represent organizations across a broad array of sizes, industries, and geographies. They are located in 150 countries and territories and provide service through our customer service platform in over 40 languages.
In October 2015, we completed the acquisition of We Are Cloud SAS, or WAC, a maker of analytics software. Over time, we expect to integrate our analytics software across our products to become a core technology within our customer service platform and to enable us to enhance the data analytics capabilities across our products. We also expect to continue to sell our analytics software on a standalone basis.
Our financial performance reflects our significant customer growth and strong customer retention and expansion. For the years ended December 31, 2015, 2014, and 2013, our revenue was $208.8 million, $127.0 million, and $72.0 million, respectively, representing a 64% growth rate from 2014 to 2015 and a 76% growth rate from 2013 to 2014. For the years ended December 31, 2015, 2014, and 2013 we derived $92.5 million, or 44%, $54.8 million, or 43%, and $29.6 million, or 41%, respectively, of our revenue from customers located outside of the United States.
We were founded in Copenhagen, Denmark in 2007. We reincorporated in Delaware in 2009. Our principal executive offices are located at 1019 Market Street, San Francisco, California 94103, and our telephone number is (415) 418-7506. Our website address is www.zendesk.com. Information contained on or that can be accessed through our website does not constitute part of this Annual Report on Form 10-K and inclusions of our website address in this Annual Report on Form 10-K are inactive textual references only. Unless expressly indicated or the context requires otherwise, the terms “Zendesk,” “company,” “we,” “us,” and “our” in this Annual Report on Form 10-K refer to Zendesk, Inc., a Delaware corporation, and its consolidated subsidiaries.
4
Zendesk’s mission is to help organizations and their customers build better relationships. Our comprehensive customer service platform is carefully designed for organizations to address the new customer-driven economy, in which customer service is a key business principle. Our intuitive customer service platform facilitates listening to the customer, finding the best possible answer, communicating through the appropriate channel, and sharing the knowledge gained with the whole organization.
|
|
· |
Beautifully Simple. We have an overarching philosophy to be beautifully simple. This approach begins with the look and feel of our customer service platform. We take intuitive design elements that people have grown to expect from consumer software and incorporate them into our customer service platform. The complexity of our underlying technology is wrapped in an easy-to-use interface built to simplify the tough work of customer service. However, beautifully simple at Zendesk extends far beyond that. We offer a free trial and a transparent purchase process with numerous self-service options that are suitable for small and medium sized businesses, or SMBs, and enterprise departments as well as assisted options for larger customers. Once purchased, our customer service platform provides fast results due to an easy set-up with a detailed tutorial and we assist organizations with questions or concerns through our product support team, community forum, and other software tools. |
|
|
· |
Omni-Channel and Contextual. Our customer service platform is built to support customers across a wide variety of integrated channels—email, voice, social media, and websites. We offer live chat as a standalone service and as a means to integrate chat-enabled agents into our customer service platform. We also offer upgraded features for the voice channel as an add-on subscription to our customer service platform. With little to no setup, our customer service platform can receive, manage, track, and report on customer interactions regardless of where they occur. This enables employees to listen to and engage with customers through the appropriate channels. In addition, our customer service platform provides important contextual information around customer issues by encouraging employee collaboration and enabling real-time information sharing. Based on our belief that the best customer service involves a whole organization, our customer service platform makes it easy for multiple departments to work together on as well as stay informed about customer interactions. |
|
|
· |
Affordable. We believe that customer service practices and philosophy affect the bottom line and that by using our customer service platform organizations can successfully manage customer service in a manner that generates a high return on investment. We believe our subscription plans are significantly less expensive and offer greater pricing transparency than many legacy customer support software applications (especially when software updates, ongoing maintenance and consultant fees required for integration, installation, customization, and training are taken into account). Furthermore, our customer service platform is designed to increase productivity by enabling faster responses, customer self-service tools, and automation. |
|
|
· |
Natively Mobile. Mobile apps were not an afterthought at Zendesk. We have designed our customer service platform to enable great customer service on-the-go. Through native mobile apps, employees can access our customer service platform anywhere with robust product functionality, an elegant interface, and performance analytics. Our help centers are mobile optimized, allowing people to quickly find answers on their own with mobile devices. |
|
|
· |
Cloud-Based Architecture. The dynamic cloud-based architecture that powers our customer service platform allows SMBs and large enterprises alike to invest their time and energy in their customers rather than managing their software. This architecture automates frequent software updates and introduction of new features while also allowing our platform to easily scale within organizations. Configurations made with simple tools, including workflow automations and best practice templates, tailor the functionality and design of our customer service platform to an organization’s particular needs and keep customer service efforts of any size organized. |
|
|
· |
Open Platform. Integrations openly exchange information and product functionality between our customer service platform and other applications, leading to better informed customer conversations. Our platform includes over 350 pre-built integrations with CRM, e-commerce, telephony, live chat, and other apps, which are enabled through our app marketplace. Developed with our open APIs, our platform can also be customized, integrated, or expanded upon with private apps. Through Zendesk Embeddables, we enable customers to simply and natively integrate critical functionality directly into their own websites and applications, including optimized integrations for mobile applications. |
|
|
· |
Proactive and Predictive Engagement. Our customer service platform is designed to provide customer service on the customer’s terms. Organizations are equipped to proactively communicate with customers at the most relevant and critical moments. For example, organizations can automatically trigger workflow to proactively reach out to customers that may signal they have had a bad experience or need particular attention. We also offer organizations tools that assist organizations with making predictions on potential customer service outcomes, enabling organizations to turn potential bad customer service interactions into good interactions. |
5
Growth Strategy
Zendesk was founded in 2007, aiming to help organizations build successful long-term relationships with their customers. We strive to continue the work our three founders began when they looked at the state of customer service and said: “we can do better.” We are focused on the following key areas of growth:
|
|
· |
Introducing New Products and Broadening Our Platform Functionality. We are continuously investing in building a customer service platform that elegantly facilitates and improves customer service and ultimately creates successful long-term customer relationships. Significant research and development efforts are currently focused on broadening our existing customer engagement, data analytics and reporting, and communication tools. We intend to continue to develop new products and functionality to expand our platform and support that mission. In addition, we may selectively pursue acquisition opportunities of technologies that can broaden the functionality of our platform. |
|
|
· |
Furthering Our Data-Driven Approach. We believe our platform is unique for empowering a data-driven approach to customer interactions. For example, we have introduced the Zendesk Benchmark to enable organizations to compare their critical customer service performance metrics with their peers. Through Zendesk Insights, organizations can compute and display advanced analytics based on their raw data. In October 2015, we completed the acquisition of WAC. Over time, we expect to integrate this analytics software to become a core technology within our customer service platform and to enable us to further integrate data analytics capabilities across our products. We also expect to continue to develop and sell our analytics software on a standalone basis. |
|
|
· |
Maintaining Leadership in SMB Market. Our customer base today includes a large number of SMBs across industries and geographies. Our customer service platform’s ease-of-use, fast results, and flexible pricing are well suited for their needs. We will continue to expand sales in existing organizations, target new organizations, and advance our leadership position in the SMB market. |
|
|
· |
Expanding Our Enterprise Customer Base. Larger enterprises make up an increasing portion of our customer base. Our enterprise sales strategy is focused on land and expand, in which we sell our customer service platform into a single department or location and grow by adding agents in other departments, product divisions, and geographies. In addition to increasing the number of users, our customers often upgrade to our more expensive and feature rich subscription plans. We intend to continue to invest in research and development efforts designed to introduce features that are important to larger enterprises. We expect our recent sales initiatives to increase sales to new larger enterprises as well as increase our penetration in existing customers through expansion and subscription plan upgrades. |
|
|
· |
Continuing to Increase Our Global Customer Footprint. We serve a global market. As of December 31, 2015, 2014, and 2013, we generated 44%, 43%, and 41%, respectively, of our revenue outside of the United States. Our international sales efforts will be focused on certain countries outside of the United States, including Brazil, France, Germany, Japan, and the United Kingdom, where we have demonstrated significant organic customer traction or believe represent particularly strategic opportunities. |
|
|
· |
Broaden Our Integrations and Partnerships. Our customer service platform is deep and extendible, with over 350 applications integrated with our software, and a network of partner and third-party developers building additional applications which integrate with and embed our platform’s functionality. By growing this Zendesk ecosystem, we plan to build on relationships with third-party organizations and developers who further extend our customer service platform into new customers and use cases. |
|
|
· |
Developing Our Brand. We are focused on strengthening our reputation as a differentiated and category-defining company in customer service. Our brand attributes—airy, humble, charming, and uncomplicated—distinguish us from the traditional attitudes about organizations and the customer relationship. Our marketing emphasizes our customer service platform’s ease-of-use and unique aesthetic in a voice that we believe is memorable and fun (especially relative to legacy enterprise software). We currently host user-groups across the country, and regularly create other opportunities and events to bring together the best in the business to discuss and network. We also regularly publish content with advice for organizations of all sizes about becoming more customer-focused and effectively managing customer service. We believe these branding efforts and thought leadership have accelerated our growth to date and will fuel our future growth by driving organic leads. |
6
The Zendesk Customer Service Platform
Our customer service platform allows organizations to focus on the customer service experience within an environment designed for ease-of-use and efficiency. We offer a range of subscription plans to meet the needs of SMBs and larger organizations with the appropriate level of advanced features and product support.
Customer Support
Our platform provides organizations with a single customer service interface to manage all their one-on-one customer interactions, no matter where those conversations start or who needs to be involved to resolve them. Our platform facilitates customer service in an efficient way through application of business rules and automations. This allows for both a reduction in ticket backlog and scaling up to accommodate growing organizations with large global audiences. Our platform is currently available in 14 languages for customer service agents. Key features include:
|
|
· |
Single Omni-Channel Interface. Our customer service platform pulls in customer questions—from email, chat, voice, and social media—and brings them into our beautifully simple interface. |
|
|
· |
Email. Consolidate customer emails from multiple customer accounts into one interface for routing, assignments, and a single system of record for all conversations. |
|
|
· |
Chat. Communicate live with one on one chat sessions, which allow customers to initiate real-time support from employees through a web interface. All chat conversations are automatically transcribed into a ticket. We offer our live chat software on a standalone basis and provide a seamless integration of this software as the primary means through which we offer chat functionality on our customer service platform. |
|
|
· |
Voice. Make or receive calls through our customer service platform. Organizations can natively create support phone numbers or use existing telephony systems through our open API. Voicemails are automatically transcribed into a ticket and employees can record key information from calls in tickets. Through our Advanced Voice service, we offer organizations upgraded features for communicating with their customers, including interactive voice response capabilities, the ability to provide additional context when transferring voice conversations between agents, and advanced features to analyze these voice interactions at an additional cost per enabled agent. |
|
|
· |
Social Media. Convert Tweets and Facebook posts into tickets and reply through our customer service platform to keep a record of all conversations in one interface. |
|
|
· |
Business Rules. Initiate workflows triggered by ticket field changes or time-based conditions. Our customer service platform comes with pre-configured business rules that we recommend as best practices. |
|
|
· |
Add-on Features. For Professional and Enterprise plan subscribers, choose to add additional features that are important to support critical business needs. These add-ons include features such as data encryption at rest, the ability to specify the region in which account data is stored, enhanced disaster recovery, priority support, the ability to allow non-support employees to collaborate internally, and the ability to provide support for multiple business units from a single instance of our customer service platform. |
|
|
· |
Mobile Apps. View and respond to requests through our native agent mobile apps for the iPhone, iPad, Android devices, Windows Phone, and Kindle Fire. Our channel agnostic SaaS architecture ensures the same information and product functionality is available regardless of the device used. |
Customer Self-Service Help Center
Our customer service platform helps organizations track and predict common questions and provides a seamless path to answers. This allows customers to help themselves, find what they need, and minimize their frustration. Available in more than 40 languages for end-users, help centers can be formatted with our self-service optimized themes and customized with organization-specific functionality. Key features include:
|
|
· |
Knowledge Base. Create a repository of articles, support documents, and how-to-guides that answers customers’ most popular questions. Sections within the knowledge base can be restricted to certain groups of customers or internal employees. Moderators can easily manage multi-lingual content in one place. |
|
|
· |
Community. Provide customers an opportunity to engage with one another along with the organization through the community. Customers can start a discussion, ask a question, or suggest an idea. Posts can be organized by topic and followed by customers. |
|
|
· |
Customer Portal. Allow customers to view their customer service history, track outstanding requests, and manage community subscriptions through the customer portal. |
7
With customer engagement, customer service becomes less about the ticket and more about people. Our customer service platform lets organizations gather customer data and proactively engage with customers based on the insights the data provides. This turns interactions into proactive conversations and makes them more meaningful, personal, and productive. Key features include:
|
|
· |
Custom User and Organization Fields. Create custom user and organization fields to provide context for proactive customer service and set customer-centric workflows around these fields. |
|
|
· |
Customer Lists. Organize customers into lists based on tags and user fields to enable proactive engagement with those customers. |
|
|
· |
Customer Satisfaction Ratings. Automatically send a customer satisfaction survey after a customer service request is solved to collect feedback. |
|
|
· |
Net Promoter Score. Send a simple, single question survey to customers to measure willingness to recommend a product or service and enable organizations to easily identify vocal promoters and detractors as well as customers most likely to spread positive or negative sentiment. |
|
|
· |
Apps and Integrations. Provide full context for customer interactions through third-party apps and integrations that allow our customer service platform to plug into other important sources of customer and employee data, such as third-party applications for CRM, time tracking, bug tracking, and e-commerce. |
Leveraging Strategic Analytics
Our customer service platform offers unique tools for organizations to understand their customers and track the efficiency and effectiveness of their customer service. Key features include:
|
|
· |
Reporting and Analytics. Track real-time key performance indicators at the customer interaction, agent, or department level through customer service dashboards that are built into our interface. Metrics included cover customer satisfaction, first response time, ticket volume, and usage of self-service features. Through Zendesk Insights, organizations with advanced plans can create custom reports and filter data, as well as compute and display advanced analytics based on their raw data that is updated as frequently as every hour. As we integrate our analytics software across our products, we expect that such software will enable us to provide additional analytics capabilities within our customer service platform. |
|
|
· |
Zendesk Benchmark. Compare customer service performance against similarly-sized organizations in the same industry and geographic region with the Zendesk Benchmark. Aggregating data to create relevant indices, performance metrics are shown on managers’ interfaces for real-time feedback and published in a quarterly report on our website. |
Zendesk Embeddables
Through Zendesk Embeddables, we make it simple to extend our customer service platform and live chat software and integrate critical functionality natively into an organization’s website or mobile application. Key features include:
|
|
· |
Web Widgets. Easily incorporate contact forms, knowledge base search, and our live chat software directly into websites to allow customers to seek and obtain support at the point of interaction with an organization. Our web widgets are optimized for mobile browsing and tuned to customer browser settings to ensure fidelity in language settings. |
|
|
· |
Mobile SDK. Build support natively and intuitively directly into mobile applications on both the iOS and Android platforms. Using our SDK, native support in applications is highly customizable, allowing organizations to better maintain their brand in the support environment and highly contextual, enabling organizations to capture and collect information about device and application usage to improve the customer experience. |
|
|
· |
Zendesk APIs. Through custom development, tie together our customer support, customer self-service, and customer engagement elements in even more advanced customizations. We construct our own software from the same APIs that we make available, demonstrating our commitment to the Zendesk developer community and up-to-date code. |
8
We currently offer a number of subscription plans for our customer service platform that vary based on the level of advanced features and dedicated product support. After a free trial, our customers use a credit card or execute a service order to purchase a subscription plan, typically for a monthly or annual subscription term. Our packaging and pricing philosophy is centered in transparency and simplicity, with all information publicly available on our website. Our subscription plans include:
|
|
· |
Essential. The Essential plan provides access to our customer service platform for employees to customer communications gathered through email, social media, and websites, as well as performance analytics comparisons with the Zendesk Benchmark. |
|
|
· |
Team. Well-suited for small organizations and enterprise departments, the Team plan provides organizations more control over workflow, including options for group views and customer business rules, and allows employees to engage with customers through more channels, including community forums. Team plan subscribers also have the ability to use our public apps with their subscription, to receive email-based product support and to track performance with customer satisfaction metrics and dashboards. |
|
|
· |
Professional. To upgrade customer service for organizations of all sizes, extra features in the Professional plan include custom analytics through Zendesk Insights, multi-lingual content management, and internal knowledge base for employees. Professional plan subscribers have the ability to develop their own private apps for use on our customer support platform. In addition to email, customers on our Professional plan receive product support from our dedicated customer advocates via phone. |
|
|
· |
Enterprise. As our deployments grow across departments to be the primary customer service software solution, the Enterprise plan incorporates tools to share customer interactions with the whole organization including unlimited light agents. In addition, we provide 24/7 email, phone and chat support to drive customer success during deployment and ongoing use. |
Live Chat Software
Through our live chat software we enable organizations to communicate in real-time with their customers through online chat. Our live chat software offers advanced features to capture, analyze, and automate these conversations, enabling organizations to more effectively engage with their customers, including by proactively reaching out to them before they’ve indicated a need for support. We offer our live chat software on a standalone basis and also integrate it as a means to provide chat functionality on our customer service platform for chat enabled agents.
Subscription Plans
We currently offer three subscription plans for our live chat software that vary based on the level of advanced features provided. As with the subscription plans for our customer service platform, we provide all prospective customers a free trial. Following this free trial, our customers may use a credit card or execute a service order to purchase a subscription plan, typically for a monthly or annual subscription term. Customers that do not purchase a paid subscription plan, or who terminate a paid subscription plan, are defaulted into the Lite plan. Our subscription plans include the following:
|
|
· |
Lite. The Lite plan enables organizations of any size to engage their customers using chat at no cost. An organization is a permitted a single agent enabled to engage in chat on a non-concurrent basis. Up to 14 days of chat history is maintained. |
|
|
· |
Basic. The Basic plan allows agents to engage in unlimited number of concurrent chats, group chat enabled employees into up to two relevant departments, and deploy up to two triggers to help identify high value visitors and initiate conversations with them. Basic plan subscribers have full access to their chat history and the ability to fully customize their chat window. |
|
|
· |
Advanced. The Advanced plan enables organizations to group chat enabled employees into an unlimited number of departments, deploy unlimited triggers, and establish operating schedules where agents are shown as available or not visible automatically. In addition, our Advanced plan offers powerful analytics to enable organizations to track and monitor activity and increase efficiency. |
|
|
· |
Premium. The Premium plan enables organizations to track both broad and specific agent metrics, as well as real time metrics. The Premium plan also permits subscribers with additional options to customize the experience for the customers seeking support via the chat. In addition, our Premium plan offer subscribers with 24/7 chat-based support. |
9
Through our analytics software, we enable organizations to analyze and visualize data from a diverse set of applications. Our analytics software allows subscribers to connect and build queries across multiple data sources and analyze results through a variety of data visualizations. Over time, we expect to integrate our analytics software across our products to become a core technology within our customer service platform and to enable us to enhance the data analytics capabilities across our products.
Subscription Plans
We currently offer two subscription plans for our analytics software that are based on the level of advanced features provided. As with the subscription plans for our other products, we provide prospective customers with a free trial. Following this free trial, our customers may use a credit card or execute a service order to purchase a subscription plan, typically for a monthly or annual subscription term. Our subscription plans include the following:
|
|
· |
Base Plan. The Base plan enables organizations to quickly visualize their data that may be stored in a variety of data sources. This plan is designed to allow organizations to use our data connectors to quickly build and deploy visualizations of this data. |
|
|
· |
Big Data. The Big Data plan enables organizations to connect to a wider set of data sources, with a focus on connections to and integrations of data from larger and more complex data sources as compared to our Base plan. |
Customers
As of December 31, 2015, we had approximately 69,100 paid customer accounts for our customer service platform and live chat software in the aggregate. This includes approximately 35,700 customer accounts for paid subscription plans on our customer service platform (other than our low-cost Starter plan) and approximately 33,400 customer accounts for paid subscription plans of our live chat software.
Our freemium plans include the Starter plan for our customer service platform, our Lite plan for live chat software, and our Zendesk Inbox service for facilitating and simplifying email collaboration on group email aliases. We believe these services provide exposure to our brand and establish a relationship that can facilitate further adoption of our customer service platform and live chat software as organizations grow in size and their service needs grow more complex. As of December 31, 2015, we had more than 121,100 active customer accounts on our freemium plans. A customer account on our freemium plans is considered active based on whether functionality of the service has been utilized within the 90-day period preceding the measurement date. In the quarter ended December 31, 2015, we introduced our Essential plan for our customer service platform. This plan replaced our Starter plan as the least expensive paid plan on our customer service platform. Following the introduction of our Essential plan, we no longer made our Starter plan available for new accounts. Accounts that subscribe to our Essential plan are included in the determination of the number of paid customer accounts.
Our customers represent organizations across a broad array of sizes, industries, and geographies. Our customers are located in 150 countries and territories and provide service through our customer service platform in over 40 languages.
Sales and Marketing
Subscriptions to our customer service platform and live chat software are designed to be easy to purchase. A substantial number of our customers subscribe to our customer service platform or live chat software with limited or no direct interaction with our sales team.
We also deploy a direct sales approach, which includes an inside sales team based in three regional hubs: the Americas, EMEA (Europe, Middle East, and Africa), and APAC (Asia-Pacific). This team qualifies and manages prospective and current customers, aiming to initiate, retain, and expand their use of our customer service platform and live chat software over time. Our inside sales team partners with technical sales and product engineers to provide pre-sales technical support and is also responsible for driving renewals of existing contracts.
We are developing and expanding our field sales and marketing teams responsible for discovery, qualification, and account management for larger organizations. We expect to increase penetration into larger organizations through a land and expand strategy whereby we attempt to capitalize on the limited use of our customer service platform and live chat software by a functional or geographic department to expand the use of our solutions throughout other parts of the organization.
10
We also utilize indirect sales channels, including referral partners and resellers, as well as implementation partners. These channels provide additional sales coverage, particularly in geographic markets where we may have limited presence, as well as implementation services to our customers. Sales from indirect channels have not been significant to date, but we plan to continue to invest in these relationships to help us in certain markets and to complement our direct sales efforts.
Our marketing efforts are focused on generating awareness of our products, creating sales leads, establishing and promoting our brand, and cultivating a community of successful and vocal customers. Based on our belief that the best method to sell subscriptions to our platform is to actively use and explore their capabilities, one focus of the marketing team is to drive and encourage free trials and the successful conversion of trials to paid subscriptions. At any time during this limited-time trial, the prospective customer may elect to subscribe to simply-priced plans by providing their credit card information. We utilize both online and offline marketing initiatives, including search engine and email marketing, display and video advertising, blogs, corporate communications, whitepapers, case studies, user events, conferences and webinars.
As of December 31, 2015, we had 511 employees in our sales and marketing organization. Our sales and marketing expenses were $114.1 million, $77.9 million and $37.6 million for the years ended December 31, 2015, 2014, and 2013, respectively.
Product Support and Professional Services
We strive to exemplify the great customer service that organizations of all sizes can provide with our customer service platform and live chat software by offering multi-channel service from our product support team, a rich self-help knowledge center with detailed product guides, and active community forums for agents, managers, and developers.
We offer different levels of product support for our platform based upon the subscription plans purchased by our customers. Essential and Starter plan customers rely exclusively on our knowledge base and community forums for support. Support from our product support team is offered to all other subscribers, with 24/7 email, voice, and chat support available for our Enterprise plan subscribers. Regardless of the plan purchased, our customer service platform provides an intuitive interface, connectivity to our self-help knowledge base and community forums, and step-by-step tutorials to help employees learn, use and deploy our platform effectively.
Along with our global partners, our professional services team assists our customers in implementing more complex deployments of our customer service platform. These services include mapping our customer service platform to new and existing business processes, data migration, and integration with existing systems. Service engagements are typically scoped on a time and materials or project milestone basis and billed separately from the subscription to our customer service platform.
Through Zen U, our training platform, we offer courses to help our customers quickly learn how to effectively use our customer service platform as well as implement customer service best practices. Courses are available online, in-person at events, and, as requested by certain customers, on-site. Zen U sessions are typically targeted at specific levels of employee seniority and product experience, such as agent essentials or administrator expert, to more effectively tailor training to intended audiences.
We maintain separate dedicated product support teams for our live chat software and our analytics software. In the future, we intend to integrate the separate dedicated product support team for our live chat software into our support organization.
Technology
The technology infrastructure used for our customer service platform and live chat software is designed to provide an available and scalable multi-tenant cloud-based platform with industry-standard security measures. We utilize industry leading hardware and software components to provide for and enable the rapid growth of our business. We employ virtualization to maximize utilization where appropriate. Maintaining the integrity and security of our technology infrastructure is critical to our business, and as such we leverage industry-standard security and monitoring tools to ensure performance across our network.
The architecture and deployment of our customer service platform and live chat software are described and guided by the key characteristics below:
|
|
· |
Reliability. Our customers are highly dependent on our customer service platform, which is designed to be available 24 hours a day, 365 days a year. Servers and software components are replicated to ensure fault-tolerance and high availability. Customer data is backed up and is stored in remote data centers. We regularly report to customers on platform availability and technical operations matters through our website and social media alerts. |
|
|
· |
Scalability. Our application infrastructure is highly scalable and regularly processes more than 100 million data driven requests that each require the processing of specific data, on a daily basis. |
11
We originally utilized third-party managed hosting facilities located in the United States exclusively for hosting our customer service platform. Beginning in 2012, we added use of third-party data centers in which we lease space and where we manage our own hosting and network equipment, or self-managed colocation data centers. We currently operate out of four third-party data centers in which we lease space and where we manage our own hosting and network equipment, or self-managed colocation data centers, located in California, Virginia, Ireland, and Germany. We intend to increase capacity in self-managed colocation data centers and/or with third-party managed hosting services over time to support our growth.
Our self-managed and third-party managed hosting services utilized for our platform provide both physical security measures, including year-round manned security, biometric access controls and video surveillance systems, and systems security measures, including firewalls, environmental controls, and redundant power and Internet connectivity. These facilities have SSAE16 or ISO 27001 attestations or equivalent certifications with respect to service availability and information security management.
We utilize managed hosting facilities located in the United States to host our analytics software. In the future, we intend to conform our analytics software to the technical and other operational and security measures applicable to our customer service platform and live chat software.
Research and Development
Our research and development organization is responsible for the development, design, and testing of all aspects of our platform and other products. We invest heavily in these efforts to continuously improve and innovate. In addition to our hosted software solution, we have developed multi-functional APIs that we utilize to build our products as well as facilitate integrations of our products with third-party applications.
Our global research and development team is based in San Francisco, California; Copenhagen, Denmark; Melbourne, Australia; Dublin, Ireland; Singapore; and Montpelier, France. To foster rapid innovation, our team is further apportioned into smaller, agile development teams.
We deploy new features, functionality, and technologies across our products through weekly software releases or updates in order to minimize disruption and provide for constant improvement.
To create a roadmap that meets our customers’ needs, we emphasize collaboration during the development process. Customers provide input through feedback forums, dialogue with our product support team, and feature utilization. As a result of using our platform internally to support our customers, we also develop new or improved features based on our employees’ feedback.
As of December 31, 2015, we had 324 employees in our research and development organization. Our research and development expenses were $62.6 million, $36.4 million and $15.3 million for the years ended December 31, 2015, 2014, and 2013, respectively.
Competition
There are a number of established and emerging competitors in the broader customer service software market. This market is fragmented, rapidly evolving, and highly competitive, with relatively low barriers to entry in some segments. We consider the principal competitive differentiators in our market to include:
|
|
· |
Ease-of-deployment and use; |
|
|
· |
Enablement of customer communications across channels; |
|
|
· |
Availability of self-service options; |
|
|
· |
Data analytics and performance recommendations; |
|
|
· |
Mobile and multi-device capabilities; |
|
|
· |
Proactive outreach tools; |
12
|
|
· |
Customization and integration with third-party applications; |
|
|
· |
Brand recognition and thought leadership; and |
|
|
· |
Total cost of ownership for the customer (including software updates, ongoing maintenance, and consultant fees). |
While we believe that we successfully compete with respect to these dynamics, given the large number, disparate sizes and varying areas of focus of other customer service software companies with which we compete, we may not always compare favorably with respect to some or all of the foregoing factors.
For small to medium-sized organizations, we often compete with general use computer applications and other tools that organizations have adapted for customer service, including shared accounts for email communication, phone banks for voice communication, and pen and paper, text editors, and spreadsheets for tracking and management. For larger organizations, we compete with custom software systems and large enterprise software vendors, including salesforce.com, Inc., Oracle Corporation, Verint Systems, Inc., and Microsoft Corporation. Additionally, for organizations seeking software to support employee service and other internal use cases, we compete with companies such as ServiceNow, Inc., BMC Software, Inc., Atlassian Pty Ltd, and Hewlett-Packard Enterprise Co. In addition, we compete with a number of smaller SaaS providers with focused customer service applications, including desk.com (a salesforce.com service), Kayako Helpdesk Pvt. Ltd., Freshdesk, Inc., Brightwurks, Inc. (Help Scout), SupportBee, Inc., and Tenmiles Technologies Pvt. Ltd. (Happy Fox). We also compete with a number of providers of live chat software, including LivePerson, Inc, BoldChat (a LogMeIn, Inc. service), Velaro, Inc., SnapEngage, LLC, Habla, Inc. (Olark), and LiveChat, Inc. and a number of providers of analytics software, including Tableau Software, Inc., Looker Data Sciences, Inc., and Domo, Inc. Pricing pressures and increased competition generally could result in reduced sales, reduced margins, losses or the failure of our customer service platform and live chat software to achieve or maintain more widespread market acceptance, any of which could harm our business.
In order to maintain and improve our competitive position in the market, we remain focused in our development, operations, and sales and marketing efforts on evolving customer service needs of all organizations.
Intellectual Property
We rely on a combination of patent, trade secret, copyright, and trademark laws, a variety of contractual arrangements, such as license agreements, assignment agreements, confidentiality and non-disclosure agreements, and confidentiality procedures and technical measures to gain rights to and protect the intellectual property used in our business.
We have developed a patent program, and a strategy to identify, apply for, and secure patents for innovative aspects of our platform and technology. We have two issued U.S. patents and five U.S. patent applications pending. We also have four pending patent applications in jurisdictions outside of the United States. We intend to pursue additional patent protection to the extent we believe it would be beneficial and cost-effective.
We actively pursue registration of our trademarks, logos, service marks, and domain names in the United States and in other key jurisdictions. We are the registered holder of a variety of United States and international domain names that include the term Zendesk, Zopim or certain variations. We use several trademarks for our products and services, including “Zendesk,” “Zopim,” and several logos and images.
We also rely on certain intellectual property rights that we license from third parties, including under certain open source licenses. Though such third-party technologies may not continue to be available to us on commercially reasonable terms, we believe that alternative technologies would be available to us.
Our policy is to require employees and independent contractors to sign agreements assigning to us any inventions, trade secrets, works of authorship, developments and other processes generated by them on our behalf and agreeing to protect our confidential information, and all of our key employees and contractors have done so. In addition, we generally enter into confidentiality agreements with our vendors and customers. We also control and monitor access to, and distribution of our software, documentation, and other proprietary information.
13
As a company we are highly focused on our customers and their success. To support this focus, we highly value simplicity, agility, sincerity, as well as a sense of humor and humility often absent from enterprises that sell business software. These values guide our communication, work, and company culture and are a cornerstone of the team of employees that we have assembled and seek to develop. We are a global and diverse group of individuals that strive to balance work with play and a focus on big-scale thinking.
We believe strongly in our obligation to participate in and improve the communities where we work and live. We do this through an active program of corporate social responsibility. In 2015, we launched the Zendesk Neighbor Foundation, a nonprofit organization to provide financial and strategic support to organizations that operate near our offices across the world. We have committed to provide a $1 donation to the foundation for every new agent added during the first year of a new subscription to paid subscription plans on our customer service platform and to our live chat software. In addition, we have entered into and implemented a series of community benefits agreements, including extensive volunteer efforts, workforce development and training, financial support for critical community programs, and promotion of local arts and culture, with the communities in which our offices are located and our employees live and work.
As of December 31, 2015, we had a total of 1,268 employees, including 532 employees located outside the United States. Although we have statutory employee representation obligations in certain countries, our U.S. employees are not represented by a labor union. We have not experienced any work stoppages, and we consider our relations with our employees to be good.
Regulatory Considerations
The legal environment of Internet-based businesses is evolving rapidly in the United States and elsewhere. The manner in which existing laws and regulations are applied in this environment, and how they will relate to our business in particular, both in the United States and internationally, is often unclear. For example, we sometimes cannot be certain which laws will be deemed applicable to us given the global nature of our business, including with respect to such topics as data privacy and security, pricing, credit card fraud, advertising, taxation, content regulation, and intellectual property ownership and infringement.
Our customers, and those with whom they communicate using our customer service platform and live chat software, upload and store customer service and other data onto our platform and provide access to their data sources to our analytics software, generally without any restrictions imposed by us. This presents legal challenges to our business and operations, such as rights of privacy or intellectual property rights related to the content loaded onto our platform. Both in the United States and internationally, we must monitor and comply with a host of legal concerns regarding the data stored and processed on our platform or within our analytics software as well as the operation of our business. These laws include, without limitation, the following:
|
|
· |
Data Privacy and Security Laws. Data privacy and security with respect to the collection of personally identifiable information, or PII, continues to be the focus of worldwide legislation and regulation. We are subject to data privacy and security regulation by data protection authorities in countries throughout the world, by the U.S. federal government and by the states in which we conduct our business. In recent years, there have been a number of well-publicized data breaches involving the improper use and disclosure of individuals’ personal information of individuals. Many governing authorities have responded to these incidents by enacting laws requiring holders of personal information to maintain safeguards and to take certain actions in response to a data breach, such as providing prompt notification of the breach to affected individuals and public officials or amending existing laws to expand compliance obligations. |
In the European Union, where U.S. companies must meet specified privacy and security standards, Directive 95/46/EC on the protection of individuals with regard to the processing of personal data and on the free movement of such data established in the European Union, or the Data Protection Directive, and data protection laws of each of the European Member countries require comprehensive information privacy and security protections for consumers with respect to PII collected about them. We have in the past relied on adherence to the U.S. Department of Commerce’s Safe Harbor Privacy Principles and compliance with the U.S.-EU and U.S.-Swiss Safe Harbor Frameworks as agreed to and set forth by the U.S. Department of Commerce, and the European Union and Switzerland, which established a means for legitimating the transfer of personally identifiable information, or PII, by U.S. companies doing business in Europe from the European Economic Area to the U.S. As a result of a recent opinion of the European Union Court of Justice regarding the adequacy of the U.S.-EU Safe Harbor Framework, the U.S.-EU Safe Harbor Framework is no longer deemed to be a valid method to ensure compliance with restrictions set forth in the Data Protection Directive and data protection legislation of individual member states restricting the transfer of data outside of the European Economic Area. On February 2, 2016, European Union and U.S. officials announced an agreement on a new framework, the EU-U.S. Privacy Shield, to replace the U.S.-EU Safe Harbor Framework. Details regarding the new EU-U.S. Privacy Shield have not been finalized, published, or interpreted. We have and expect to continue to engage in efforts to ensure that data transfers from the European Economic Area comply with the Data Protection Directive and the data protection legislation of individual member states.
14
Certain laws and regulations that protect the collection, use and disclosure of particular types of data may hinder our ability to provide services to customers and potential customers subjected to such laws. For example, the Gramm-Leach-Bliley Act of 1999 imposes specific obligations on companies that process certain financial data on behalf of covered entities. We do not currently certify that our customer service platform, live chat software, or analytics software complies with these regulations. In order to compete in such highly regulated markets we will have to invest in additional resources, establish processes, and introduce additional measures to satisfy regulatory requirements applicable to companies serving such covered entities.
|
|
· |
Copyrights. U.S. and international copyright and trademark laws protect the rights of third parties from infringement of their intellectual property. Our customers and those with whom they communicate on our customer service platform can generally use our customer service platform to upload and present a wide variety of content. We maintain an active copyright infringement policy and respond to takedown requests by third-party intellectual property right owners that might result from content uploaded to our customer service platform. As our business expands to other countries, we must also respond to regional and country-specific intellectual property considerations, including takedown and cease-and-desist notices in foreign languages, and we must build infrastructure to support these processes. The Digital Millennium Copyright Act, or DMCA, also applies to our business. This statute provides relief for claims of circumvention of copyright-protected technologies but includes a safe harbor that is intended to reduce the liability of online service providers for listing or linking to third-party websites or hosting content that infringes copyrights of others. The copyright infringement policies that we have implemented for our customer service platform and live chat software are intended to satisfy the DMCA safe harbor. |
Geographic Information
For a description of our revenue and long-lived assets by geographic location, see Note 12 of the Notes to our Consolidated Financial Statements included elsewhere in this Annual Report on Form 10-K.
Additional Information
Our website is located at http://www.zendesk.com, and our investor relations website is located at http://investor.zendesk.com. Copies of our Annual Reports on Form 10-K, Quarterly Reports on Form 10-Q, Current Reports on Form 8-K, and amendments to these reports filed or furnished pursuant to Section 13(a) or 15(d) of the Securities Exchange Act of 1934, as amended, or the Exchange Act, are available, free of charge, on our investor relations website as soon as reasonably practicable after we file such material electronically with or furnish it to the Securities and Exchange Commission, or the SEC. The SEC also maintains a website that contains our SEC filings. The address of the site is http://www.sec.gov. Further, a copy of this Annual Report on Form 10-K is located at the SEC’s Public Reference Room at 100 F Street, NE, Washington, D.C. 20549. Information on the operation of the Public Reference Room can be obtained by calling the SEC at 1-800-SEC-0330.
We webcast our earnings calls and certain events we participate in or host with members of the investment community on our investor relations website. Additionally, we provide notifications of news or announcements regarding our financial performance, including SEC filings, investor events, press and earnings releases, and blogs as part of our investor relations website. Zendesk has used, and intends to continue to use, our investor relations website, as well as our Twitter accounts (@Zendesk), as means of disclosing material non-public information and for complying with its disclosure obligations under Regulation FD. Further corporate governance information, including our certificate of incorporation, bylaws, governance guidelines, board committee charters, and code of business conduct and ethics, is also available on our investor relations website under the heading “Corporate Governance.” The contents of our websites are not intended to be incorporated by reference into this Annual Report on Form 10-K or in any other report or document we file with the SEC, and any references to our websites are intended to be inactive textual references only.
A description of the risks and uncertainties associated with our business is set forth below. You should carefully consider such risks and uncertainties, together with the other information contained in this report, and in our other public filings. If any of such risks and uncertainties actually occurs, our business, financial condition or operating results could differ materially from the plans, projections and other forward-looking statements included in the section titled “Management’s Discussion and Analysis of Financial Condition and Results of Operations” and elsewhere in this report and in our other public filings. In addition, if any of the following risks and uncertainties, or if any other risks and uncertainties, actually occurs, our business, financial condition or operating results could be harmed substantially, which could cause the market price of our stock to decline, perhaps significantly.
15
We derive, and expect to continue to derive, substantially all of our revenue and cash flows from our customer service platform. If we fail to adapt this platform to changing market dynamics and customer preferences or to achieve increased market acceptance of our customer service platform, our business, results of operations, financial condition, and growth prospects would be harmed.
We derive, and expect to continue to derive, substantially all of our revenue and cash flows from sales of subscriptions to our customer service platform. As such, the market acceptance of this platform is critical to our success. Demand for our customer service platform is affected by a number of factors, many of which are beyond our control, such as continued market acceptance of our platform by customers for existing and new use cases, the timing of development and release of new products, features, and functionality introduced by our competitors, technological change, and growth or contraction in our addressable market. We expect that an increasing focus on customer satisfaction and the growth of various communications channels will profoundly impact the market for customer support software and blur distinctions between traditionally separate systems for customer support, marketing automation, and customer relationship management, enabling new competitors to emerge. If we are unable to meet customer demands to manage customer experiences through flexible solutions designed to address all these needs or otherwise achieve more widespread market acceptance of our customer service platform, our business, results of operations, financial condition, and growth prospects will be adversely affected.
We have a history of losses and we expect our revenue growth rate to decline. As our costs increase, we may not be able to generate sufficient revenue to achieve and sustain our profitability.
We have incurred net losses in each year since our inception, including net losses of $24.5 million and $17.5 million in the three months ended December 31, 2015 and 2014, respectively, and net losses of $84.1 million and $67.4 million for the fiscal year ended December 31, 2015 and 2014, respectively. We had an accumulated deficit of $215.9 million at December 31, 2015. For the three months ended December 31, 2015 and 2014, our revenue was $62.6 million and $38.5 million, respectively, representing a 63% growth rate. For the fiscal year ended December 31, 2015 and 2014, our revenue was $208.8 million and $127.0 million, respectively, representing a 64% growth rate. We expect that our revenue growth rate will decline over time. We may not be able to generate sufficient revenue to achieve and sustain profitability as we also expect our costs to increase in future periods. We expect to continue to expend substantial financial and other resources on:
|
— |
development of our customer service platform, live chat software, and analytics software, including investments in our research and development team, the development or acquisition of new products, features and functionality, and improvements to the scalability, availability, and security of our customer service platform, live chat software, and analytics software; |
|
— |
our technology infrastructure, including expansion of our activities in self-managed and third-party managed hosting facilities, enhancements to our network operations and infrastructure, and hiring of additional employees for our operations team; |
|
— |
sales and marketing, including a significant expansion of our direct sales organization; |
|
— |
additional international expansion in an effort to increase our customer base and sales; and |
|
— |
general administration, including legal, accounting, and other expenses related to being a public company. |
These investments may not result in increased revenue or growth of our business. If we fail to continue to grow our revenue, our operating results, and business would be harmed.
We have a limited operating history, which makes it difficult to evaluate our prospects and future operating results.
We incorporated and first launched our customer service platform in 2007. As a result of our limited operating history, our ability to forecast our future operating results is limited and subject to a number of uncertainties, including our ability to plan for and model future growth. Our historical revenue growth has been inconsistent, and should not be considered indicative of our future performance. Further, in future periods, our revenue could decline for a number of reasons, including any reduction in demand for our customer service platform, live chat software, or analytics software, increased competition, contraction of our overall market, or our failure, for any reason, to capitalize on growth opportunities. We have encountered and will encounter risks and uncertainties frequently experienced by growing companies in rapidly changing industries, such as the risks and uncertainties described herein. If our assumptions regarding these risks and uncertainties, which we use to plan our business, are incorrect or change, or if we do not address these risks successfully, our operating and financial results could differ materially from our expectations, and our business could suffer.
16
If we are not able to develop enhancements to our customer service platform, live chat software, or analytics software that achieve market acceptance and that keep pace with technological developments, our business would be harmed.
Our ability to attract new customers and increase revenue from existing customers depends in large part on our ability to enhance and improve our customer service platform, live chat software, and analytics software and to introduce new products and services. In order to grow our business, we must develop products and services that reflect the changing nature of customer service, and expand beyond customer service to other areas of managing relationships with customers. The success of any enhancement to our customer service platform, live chat software, or analytics software depends on several factors, including timely completion, adequate quality testing, and market acceptance. Any new product or service that we develop may not be introduced in a timely or cost-effective manner, may contain defects, or may not achieve the market acceptance necessary to generate sufficient revenue. If we are unable to successfully develop new products or services, enhance our existing customer service platform, live chat software, and analytics software to meet customer requirements or otherwise gain market acceptance, our business and operating results will be harmed.
Because our customer service platform, live chat software, and analytics software are available over the Internet, we need to continuously modify and enhance them to keep pace with changes in Internet-related hardware, software, communications, and database technologies and standards. If we are unable to respond in a timely and cost-effective manner to these rapid technological developments and changes in standards, our customer service platform, live chat software, and analytics software may become less marketable, less competitive, or obsolete, and our operating results will be harmed.
If we fail to effectively manage our growth and organizational change in a manner that preserves the key aspects of our culture, our business and operating results could be harmed.
We have experienced and may continue to experience rapid growth and organizational change, which has placed, and may continue to place, significant demands on our management, operational, and financial resources. For example, our headcount has grown from 806 employees as of December 31, 2014 to 1,268 employees on December 31, 2015. In addition, we have established subsidiaries in Denmark, the United Kingdom, Australia, Ireland, Japan, the Philippines, Brazil, and Germany since our inception in 2007, and, as a result of the acquisitions of Zopim and WAC, we also have subsidiaries in Singapore and France. We may continue to expand our international operations into other countries in the future. We have also experienced significant growth in the number of customers, end users, transactions, and data that our customer service platform and our associated hosting infrastructure support. Finally, our organizational structure is becoming more complex and we may need to scale and adapt our operational, financial, and management controls, as well as our reporting systems and procedures to manage this complexity. We will require significant capital expenditures and the allocation of valuable management resources to grow and change in these areas without undermining our corporate culture of rapid innovation, simplicity in design, and attention to customer satisfaction that has been critical to our growth so far. If we fail to manage our anticipated growth and change in a manner that preserves the key aspects of our culture, the quality of our products and services may suffer, which could negatively affect our brand and reputation and harm our ability to retain and attract customers.
The market in which we participate is intensely competitive, and if we do not compete effectively, our operating results could be harmed.
The market for customer service solutions is fragmented, rapidly evolving, and highly competitive, with relatively low barriers to entry. Among the small to medium sized organizations that make up a large proportion of our customers, we often compete with general use computer applications and other tools, which these organizations use to provide support and which can be deployed for little or no cost. These include shared accounts for email communication, phone banks for voice communication, and pen and paper, text editors, and spreadsheets for tracking and management. With respect to larger organizations and enterprises seeking to deploy a customer service software system, we have many competitors that are larger and which have greater name recognition, much longer operating histories, more established customer relationships, larger marketing budgets, and significantly greater resources than we do.
Our competitors may be able to respond more quickly and effectively than we can to new or changing opportunities, technologies, standards, or customer requirements. With the introduction of new technologies, the evolution of our platform, and new market entrants, we expect competition to intensify in the future. Pricing pressures and increased competition generally could result in reduced sales, reduced margins, losses, or the failure of our platform to achieve or maintain more widespread market acceptance, any of which could harm our business.
We face competition from in-house software systems, large integrated systems vendors, and smaller companies offering alternative SaaS applications. Our competitors vary in size and in the breadth and scope of the products and services they offer. We face substantial competition from salesforce.com, Inc., Oracle Corporation, Verint Systems, Inc., and Microsoft Corporation, each of which can bundle competing products and services with other software offerings, or offer them at a low price as part of a larger sale. In addition, we compete with a number of other SaaS providers with focused customer support applications, including desk.com (a salesforce.com service), Kayako Helpdesk Pvt. Ltd., Freshdesk, Inc., Brightwurks, Inc. (Help Scout), SupportBee, Inc., and Tenmiles
17
Technologies Pvt. Ltd. (Happy Fox), many of which offer free or significantly discounted prices for their services. For organizations seeking software to support employee service and other internal use cases, we compete with companies such as ServiceNow, Inc., BMC Software, Inc., Atlassian Pty Ltd, and Hewlett-Packard Company. We compete with a number of providers of live chat software, including Live Person, Inc., BoldChat (a LogMeIn, Inc. service), Velaro, Inc. Snap Engage, LLC, Habla, Inc. (Olark), and LiveChat, Inc. and a number of providers of analytics software, including Tableau Software, Inc., Looker Data Sciences, Inc., and Domo, Inc. Further, other established SaaS providers not currently focused on customer support, live chat software, or analytics software may expand their services to compete with us. Many of our current and potential competitors have established marketing relationships, access to larger customer bases, pre-existing customer relationships, and major distribution agreements with consultants, system integrators, and resellers. Additionally, some existing and potential customers, particularly large organizations, have elected, and may in the future elect, to develop their own internal customer support software system. Certain of our competitors have partnered with, or have acquired, and may in the future partner with or acquire, other competitors to offer services, leveraging their collective competitive positions, which makes, or would make, it more difficult to compete with them. For all of these reasons, we may not be able to compete successfully against our current and future competitors or retain existing customers, which would harm our business.
If the market for SaaS business software applications develops more slowly than we expect or declines, our business would be adversely affected.
The market for SaaS business software applications is less mature than the market for on-premise business software applications, and the adoption rate of SaaS business software applications may be slower among subscribers in industries with heightened data security interests or business practices requiring highly customizable application software. Our success will depend to a substantial extent on the widespread adoption of SaaS business applications in general, and of SaaS customer service applications in particular. Many organizations have invested substantial personnel and financial resources to integrate traditional on-premise business software applications into their businesses, and therefore may be reluctant or unwilling to migrate to SaaS applications. It is difficult to predict customer adoption rates and demand for our customer service platform, live chat software, and analytics software, the future growth rate and size of the SaaS business applications market or the entry of competitive applications. The expansion of the SaaS business applications market depends on a number of factors, including the cost, performance, and perceived value associated with SaaS, as well as the ability of SaaS providers to address data security and privacy concerns. Additionally, government agencies have adopted, or may adopt, laws and regulations regarding the collection, use, and transfer of personal information obtained from consumers and other individuals, or may seek to access information on our platform, either of which may reduce the overall demand for our platform. If we or other SaaS providers experience data security incidents, loss of customer data, disruptions in delivery, or other problems, the market for SaaS business applications, including our customer service platform, live chat software, and analytics software, may be negatively affected. If SaaS business applications do not continue to achieve market acceptance, or there is a reduction in demand for SaaS business applications caused by a lack of customer acceptance, technological challenges, weakening economic conditions, data security or privacy concerns, governmental regulation, competing technologies and products, or decreases in information technology spending, it would result in decreased revenue and our business would be adversely affected.
If we are not successful in selling our live chat software or analytics software as standalone services or more fully integrating our live chat software or analytics software with our customer service platform, our business could be harmed.
As a result of the acquisitions of Zopim and WAC, we now sell our live chat software and analytics software as standalone services. Our live chat software can also be integrated with our customer service platform as a means to enable live chat functionality for agents and this integration is now the primary means by which we offer chat functionality on our customer service platform. We expect to integrate our analytics software with our customer service platform and other products as a component of these services.
We have limited experience selling separate products in general, and both live chat software and analytics software in particular, and as a result, our live chat software and analytics software may not gain acceptance with our customers and potential customers.
Our reliance on our live chat software as a primary means of enabling chat functionality in connection with our customer service platform may not be successful. In particular, we currently charge a separate subscription fee per chat-enabled agent. If our customers do not purchase our live chat software as a standalone service or as integrated with our customer service platform, our business, revenue, and operating results could be harmed.
Our plans to integrate our analytics software with our customer service platform, our live chat software, and our other products may not be successful. If our customers do not purchase our analytics software as a standalone service or as integrated with our customer service platform, or our other products, our business, revenue, and operating results could be harmed.
18
If our network or computer systems are breached or unauthorized access to customer data is otherwise obtained, our customer service platform, live chat software, and analytics software may be perceived as insecure, we may lose existing customers or fail to attract new customers, and we may incur significant liabilities.
Use of our customer service platform, live chat software, and analytics software involve the storage, transmission, and processing of our customers’ proprietary data, including personal or identifying information regarding their customers or employees. Unauthorized access to or security breaches of our customer service platform, live chat software, or analytics software could result in the loss of data, loss of intellectual property or trade secrets, loss of business, severe reputational damage adversely affecting customer or investor confidence, regulatory investigations and orders, litigation, indemnity obligations, damages for contract breach, penalties for violation of applicable laws or regulations, or contractual obligations, and significant costs for remediation that may include liability for stolen assets or information and repair of system damage that may have been caused, incentives offered to customers or other business partners in an effort to maintain business relationships after a breach, and other liabilities. Notifications related to a security breach regarding or pertaining to any of such service providers could impact our reputation, harm customer confidence, hurt our sales and expansion into new markets, or cause us to lose existing customers. We have incurred and expect to incur significant expenses to prevent, investigate, and remediate, security breaches and vulnerabilities, including deploying additional personnel and protection technologies, training employees, and engaging third-party experts and consultants. Our errors and omissions insurance coverage covering certain security and privacy damages and claim expenses may not be sufficient to compensate for all liability.
We have experienced significant breaches and identified significant vulnerabilities of our security measures and the security measures deployed by third-party vendors upon which we rely and our customer service platform, live chat software, and analytics software are at risk for future breaches as a result of third-party action, employee, vendor, or contractor error, malfeasance, or other factors.
We have only been offering our live chat software since the completion of our acquisition of Zopim in March 2014 and have only been offering our analytics software since the completion of our acquisition of WAC in October 2015. The systems, networks, personnel, equipment, and vendors utilized to provide our live chat software and analytics software have historically been separate from those utilized in connection with our customer service platform and have not been subject to the same security reviews and assessments as those used to provide our customer service platform. Our failure to complete these assessments and implement improvements to the security measures deployed to protect our live chat software and analytics software in a timely manner could increase our risk of a security breach with respect to these services, which would harm our business as a whole.
Because the techniques used and vulnerabilities exploited to obtain unauthorized access or to sabotage systems change frequently and generally are not identified until they are launched against a target, we may be unable to anticipate these techniques or vulnerabilities or to implement adequate preventative measures. We may also experience security breaches that may remain undetected for an extended period.
Because data security is a critical competitive factor in our industry, we make numerous statements in our privacy policies, terms of service and data processing agreements, through our certifications to privacy standards, and in our marketing materials, providing assurances about the security of our customer service platform, live chat software, and analytics software including detailed descriptions of security measures we employ. Should any of these statements be untrue or become untrue, even through circumstances beyond our reasonable control, we may face claims of misrepresentation or deceptiveness by the U.S. Federal Trade Commission, state and foreign regulators, and private litigants.
19
Our continued growth depends in part on the ability of our existing and potential customers to access our customer service platform, live chat software, and analytics software at any time and within an acceptable amount of time. Our customer service platform, live chat software, and analytics software are proprietary, and we rely on the expertise of members of our engineering, operations, and software development teams for their continued performance. We have experienced, and may in the future experience, disruptions, outages, and other performance problems due to a variety of factors, including infrastructure changes, introductions of new functionality, human or software errors, capacity constraints due to an overwhelming number of users accessing our customer service platform, live chat software, or analytics software simultaneously, distributed denial of service attacks, or other security related incidents. In some instances, we may not be able to identify the cause or causes of these performance problems within an acceptable period of time. It may become increasingly difficult to maintain and improve our performance, especially during peak usage times and as our customer service platform, live chat software, and analytics software become more complex and our user traffic increases. If our customer service platform, live chat software, or analytics software is unavailable or if our users are unable to access our customer service platform, live chat software, or analytics software within a reasonable amount of time or at all, our business would be negatively affected. In addition, a significant portion of our infrastructure does not currently support the mirroring of data. Therefore, in the event of any of the factors described above, or certain other failures of our infrastructure, customer data may be permanently lost. Moreover, some of our customer agreements and certain subscription plans include performance guarantees and service level standards that obligate us to provide credits or termination rights in the event of a significant disruption in our platform. To the extent that we do not effectively address capacity constraints, upgrade our systems as needed, and continually develop our technology and network architecture to accommodate actual and anticipated changes in technology, our business and operating results may be adversely affected.
Real or perceived errors, failures, or bugs in our customer service platform, live chat software, or analytics software could adversely affect our operating results and growth prospects.
Because our customer service platform, live chat software, and analytics software are complex, undetected errors, failures, vulnerabilities, or bugs may occur, especially when updates are deployed. Our customer service platform, live chat software, and analytics software are often used in connection with large-scale computing environments with different operating systems, system management software, equipment, and networking configurations, which may cause errors or failures of our customer service platform, our live chat software, our analytics software or other aspects of the computing environment into which they are deployed. In addition, deployment of our customer service platform, live chat software, or analytics software into complicated, large-scale computing environments may expose undetected errors, failures, vulnerabilities, or bugs in our customer service platform, live chat software, or analytics software. We have discovered and expect will continue to discover software errors, failures, vulnerabilities, and bugs in our customer service platform, live chat software, and analytics software, some of which have or may only be discovered and remediated after deployment to customers. Real or perceived errors, failures, vulnerabilities, or bugs in our customer service platform, live chat software, or analytics software could result in negative publicity, loss of or delay in market acceptance of our customer service platform, live chat software, or analytics software, loss of competitive position, or claims by customers for losses sustained by them. In such an event, we may be required, or may choose, for customer relations or other reasons, to expend additional resources in order to help correct the problem.
Incorrect or improper implementation or use of our customer service platform, live chat software, or analytics software could result in customer dissatisfaction and negatively affect our business, results of operations, financial condition, and growth prospects.
Our customer service platform, live chat software, and analytics software are deployed in a wide variety of technology environments and into a broad range of complex workflows. Increasingly, our customer service platform, live chat software, and analytics software have been integrated into large-scale, complex technology environments, and specialized use cases, and we believe our future success will depend on our ability to increase use of our customer service platform, live chat software, and analytics software in such deployments. We often assist our customers in implementing our customer service platform, live chat software, and analytics software, but many customers attempt to implement even complex deployments themselves. If we or our customers are unable to implement our customer service platform, live chat software, or analytics software successfully, or unable to do so in a timely manner, customer perceptions of our customer service platform, our live chat software, and our analytics software, and company may be impaired, our reputation and brand may suffer, and customers may choose not to renew or expand the use of our customer service platform, live chat software, or analytics software.
Our customers and third-party partners may need training in the proper use of our customer service platform, live chat software, or analytics software to maximize its potential. If our customer service platform, live chat software, or analytics software is not implemented or used correctly or as intended, inadequate performance may result. Because our customers rely on our customer service platform, live chat software, and analytics software to manage a wide range of operations, and drive a number of their internal processes, the incorrect or improper implementation or use of our customer service platform, live chat software, or analytics software,
20
our failure to train customers on how to efficiently and effectively use our customer service platform, or our failure to provide adequate product support to our customers, may result in negative publicity or legal claims against us. Also, as we continue to expand our customer base, any failure by us to properly provide these services will likely result in lost opportunities for additional subscriptions to our customer service platform, live chat software, and analytics software.
Any failure to offer high-quality product support may adversely affect our relationships with our customers and our financial results.
In deploying and using our customer service platform, live chat software, and analytics software, our customers depend on our product support team to resolve complex technical and operational issues. We may be unable to respond quickly enough to accommodate short-term increases in customer demand for product support. We also may be unable to modify the nature, scope, and delivery of our product support to compete with changes in product support services provided by our competitors. Increased customer demand for product support, without corresponding revenue, could increase costs and adversely affect our operating results. Our sales are highly dependent on our business reputation and on positive recommendations from our existing customers. Any failure to maintain high-quality product support, or a market perception that we do not maintain high-quality product support, could adversely affect our reputation, our ability to sell our customer service platform, live chat software, and analytics software to existing and prospective customers, our business, operating results, and financial position.
We depend on our executive officers and other key employees and the loss of one or more of these employees or an inability to attract and retain highly skilled employees could adversely affect our business.
Our success depends largely upon the continued services of our executive officers and other key employees. We rely on our leadership team in the areas of research and development, operations, security, marketing, sales, support, general and administrative functions, and on individual contributors in our research and development and operations. From time to time, there may be changes in our executive management team resulting from the hiring or departure of executives, which could disrupt our business. We do not have employment agreements with our executive officers or other key personnel that require them to continue to work for us for any specified period and, therefore, they could terminate their employment with us at any time. The loss of one or more of our executive officers, especially our Chief Executive Officer, or key employees could have an adverse effect on our business.
In addition, to execute our growth plan, we must attract and retain highly qualified personnel. Competition for these personnel in the San Francisco Bay Area, where our headquarters is located, and in other locations where we maintain offices, is intense, especially for engineers experienced in designing and developing software and SaaS applications and experienced sales professionals. We have, from time to time experienced, and we expect to continue to experience, difficulty in hiring and retaining employees with appropriate qualifications. Many of the companies with which we compete for experienced personnel have greater resources than we have. If we hire employees from competitors or other companies, their former employers may attempt to assert that these employees or we have breached their legal obligations, resulting in a diversion of our time and resources. In addition, job candidates and existing employees often consider the value of the equity awards they receive in connection with their employment. If the perceived or actual value of our equity awards declines, it may adversely affect our ability to recruit and retain highly skilled employees. If we fail to attract new personnel or fail to retain and motivate our current personnel, our business and future growth prospects could be adversely affected.
We are highly dependent upon free trials of our customer service platform, live chat software, and analytics software and other inbound lead generation strategies to drive our sales and revenue. If these strategies fail to continue to generate sales opportunities or do not convert into paying customers, our business and results of operations would be harmed.
We are highly dependent upon our marketing strategy of offering free trials of our customer service platform, our live chat software, and analytics software and other inbound lead generation strategies to generate sales opportunities. These strategies may not be successful in continuing to generate sufficient sales opportunities necessary to increase our revenue. Many early users never convert from the trial version to a paid version of our customer service platform, live chat software, or analytics software. Further, we often depend on individuals within an organization who initiate the trial versions of our customer service platform, live chat software, and analytics software being able to convince decision makers within their organization to convert to a paid version. Many of these organizations have complex and multi-layered purchasing requirements. To the extent that these users do not become, or are unable to convince others to become, paying customers, we will not realize the intended benefits of this marketing strategy and our ability to grow our revenue will be adversely affected.
We face a number of risks in our strategy to increasingly target larger organizations for sales of our customer service platform, live chat software, and analytics software and, if we do not manage these efforts effectively, our business and results of operations could be adversely affected.
As we target more of our sales efforts to larger organizations, we expect to incur higher costs and longer sales cycles and we may be less effective at predicting when we will complete these sales. In this market segment, the decision to subscribe to our customer service platform, live chat software, or analytics software may require the approval of more technical personnel and management levels within a potential customer’s organization than we have historically encountered, and if so, these types of sales
21
would require us to invest more time educating these potential customers. In addition, larger organizations may demand more features and integration services. We have limited experience in developing and managing sales channels and distribution arrangements for larger organizations. As a result of these factors, these sales opportunities may require us to devote greater research and development, sales, product support, and professional services resources to individual customers, resulting in increased costs and reduced profitability, and would likely lengthen our typical sales cycle, which could strain our resources. Additionally, we may be required to increase our investments in our field sales and marketing efforts in order to target these larger organizations, increasing the costs associated with sales. Moreover, these transactions may require us to delay recognizing the associated revenue we derive from these customers until any technical or implementation requirements have been met, and larger customers may demand discounts to the subscription prices they pay for our customer service platform, live chat software, or analytics software. Furthermore, because we have limited experience selling to larger organizations, our investment in marketing our customer service platform, live chat software, and analytics software to these potential customers may not be successful, which could harm our results of operations and our overall ability to grow our customer base. Following sales to larger organizations, we may have fewer opportunities to expand usage of our customer service platform, live chat software, and analytics software or sell additional functionality, and we may experience increased subscription terminations as compared to our experience with smaller organizations, any of which could harm our results of operations.
Failure to effectively expand our sales capabilities could harm our ability to increase our customer base and achieve broader market acceptance of our platform.
Increasing our customer base and achieving broader market acceptance of our customer service platform, live chat software, and analytics software will depend, to a significant extent, on our ability to effectively expand our sales and marketing operations and activities. We are substantially dependent on our direct sales force to obtain new customers. From December 31, 2014 to December 31, 2015, our sales and marketing organization increased from 303 to 511 employees. We plan to continue to expand our direct sales force both domestically and internationally and to increase the proportion of our sales professionals that have experience in selling to larger organizations. There is significant competition for experienced sales and marketing professionals with the skills and technical knowledge that we require. Our ability to achieve significant revenue growth in the future will depend, in part, on our success in recruiting, training, and retaining a sufficient number of experienced sales and marketing professionals. New hires require significant training and time before they achieve full productivity, particularly in new sales segments and territories. Our recent hires and planned hires may not become as productive as quickly as we expect, and we may be unable to hire or retain sufficient numbers of qualified individuals in the future in the markets where we do business. We cannot predict whether, or to what extent, our sales will increase as we expand our sales and marketing functions or how long it will take for new personnel to become productive. Our business will be harmed if our sales and marketing efforts do not generate a significant increase in revenue.
We employ a pricing model that subjects us to various challenges that could make it difficult for us to derive sufficient value from our customers.
We generally charge our customers for their use of our customer service platform based on the number of users they enable as “agents” to provide customer service under their customer account. At the same time, we provide features and functionality within our customer service platform that enable our customers to promote customer self-service and otherwise efficiently and cost-effectively address product support requests without the need for substantial human interaction. As a result of these features, customer agent staffing requirements may be minimized and our revenue may be adversely impacted.
We separately charge for the use of our live chat software. Historically, we provided limited chat functionality within our customer service platform for no additional charge. With the integration of our live-chat software into our customer service platform, we now generally require a separate subscription to enable chat functionality in connection with our customer service platform. We do not know whether our customers or the market in general will accept this change in our pricing model and if it fails to gain acceptance our business and results of operations could be harmed.
We sell our analytics software as a standalone service and generally charge our customers for their use of our analytics software based on the number and type of users they enable, as well as the features and functionality enabled. We do not know whether the current pricing model for our analytics software will result in our current and potential customers enabling a significant number of users to allow us to derive sufficient value from the provision of such software.
Our terms of service generally prohibit the sharing of user logins and passwords. These restrictions may be improperly circumvented or otherwise bypassed by certain users and, if they are, we may not be able to capture the full value for the use of our customer service platform. We license access and use of our customer service platform, live chat software, and analytics software exclusively for our customers’ internal use only. If customers improperly resell or otherwise make our customer service platform or live chat software available to their customers, it may cannibalize our sales or commoditize our customer service platform, live chat software, and analytics software in the market. Additionally, if a customer that has received a volume discount from us offers our customer service platform to its customers in violation of our terms of service, we may experience price erosion and be unable to capture sufficient value from the use of our customer service platform, live chat software, or analytics software by those customers.
22
While our terms of service provide us the ability to enforce our terms, our customers may resist or refuse to allow us to audit their usage, in which case we may have to pursue legal recourse to enforce our rights. Any such enforcement action would require us to spend money, distract management, and potentially adversely affect our relationship with our customers.
We do not have the history with our subscription or pricing models necessary to accurately predict optimal pricing necessary to attract new customers and retain existing customers.
We have limited experience with respect to determining the optimal prices for our customer service platform, live chat software, and analytics software and as a result, we have in the past and expect in the future that we will need to change our pricing model from time to time. As the market for our customer service platform, live chat software, and analytics software matures, or as new competitors introduce new products or services that compete with ours, we may be unable to attract new customers at the same price or based on the same pricing models as we have used historically. Pricing decisions may also impact the mix of adoption among our subscription plans and negatively impact our overall revenue. Moreover, larger organizations, which are a primary focus of our direct sales efforts, may demand substantial price concessions. As a result, in the future we may be required to reduce our prices, which could adversely affect our revenue, gross margin, profitability, financial position, and cash flow.
Our financial results may fluctuate due to increasing variability in our sales cycles.
We plan our expenses based on certain assumptions about the length and variability of our sales cycle. These assumptions are based upon historical trends for sales cycles and conversion rates associated with our existing customers, many of whom to date have been small to medium-sized organizations that make purchasing decisions with limited interaction with our sales or other personnel. As we continue to focus on and become more dependent on sales to larger organizations, we expect our sales cycles to lengthen and become less predictable. This may adversely affect our financial results. Factors that may influence the length and variability of our sales cycle include:
|
— |
the need to educate prospective customers about the uses and benefits of our customer service platform and live chat software; |
|
— |
the discretionary nature of purchasing and budget cycles and decisions; |
|
— |
the competitive nature of evaluation and purchasing processes; |
|
— |
evolving functionality demands; |
|
— |
announcements or planned introductions of new products, features, or functionality by us or our competitors; and |
|
— |
lengthy purchasing approval processes. |
Our increasing dependence on sales to larger organizations may increase the variability of our financial results. If we are unable to close one or more expected significant transactions with these customers in a particular period, or if an expected transaction is delayed until a subsequent period, our operating results for that period, and for any future periods in which revenue from such transaction would otherwise have been recognized, may be adversely affected.
23
Our quarterly results may fluctuate for various other reasons, and if we fail to meet the expectations of analysts or investors, our stock price and the value of an investment in our common stock could decline substantially.
Our quarterly financial results may fluctuate as a result of a variety of other factors, many of which are outside of our control. If our quarterly financial results fall below the expectations of investors or any securities analysts who follow our stock, the price of our common stock could decline substantially. Some of the important factors that may cause our revenue, operating results, and cash flows to fluctuate from quarter to quarter include:
|
— |
our ability to attract new customers, retain and increase sales to existing customers, and satisfy our customers’ requirements; |
|
— |
the number of new employees added; |
|
— |
the rate of expansion and productivity of our sales force; |
|
— |
changes in our or our competitors’ pricing policies; |
|
— |
the amount and timing of operating costs and capital expenditures related to the operations and expansion of our business; |
|
— |
new products, features, or functionalities introduced by our competitors; |
|
— |
significant security breaches, technical difficulties, or interruptions to our customer service platform or live chat software; |
|
— |
the timing of customer payments and payment defaults by customers; |
|
— |
general economic conditions that may adversely affect either our customers’ ability or willingness to purchase additional subscriptions, delay a prospective customer’s purchasing decision, reduce the value of new subscription contracts, or affect customer retention; |
|
— |
changes in the relative and absolute levels of product support and professional services we provide; |
|
— |
changes in foreign currency exchange rates; |
|
— |
extraordinary expenses such as litigation or other dispute-related settlement payments; |
|
— |
the impact of new accounting pronouncements; and |
|
— |
the timing of the grant or vesting of equity awards to employees. |
Many of these factors are outside of our control, and the occurrence of one or more of them might cause our revenue, operating results, and cash flows to vary widely. As such, we believe that quarter-to-quarter comparisons of our revenue, operating results, and cash flows may not be meaningful and should not be relied upon as an indication of future performance.
Unfavorable conditions in our industry or the global economy or reductions in information technology spending could limit our ability to grow our business and negatively affect our operating results.
Our operating results may vary based on the impact of changes in our industry or the global economy on us or our customers. The revenue growth and potential profitability of our business depend on demand for business software applications and services generally and for customer service systems in particular. In addition, our revenue is entirely dependent on the number of users of our customer service platform, live chat software, or analytics software at each of our customers, which in turn is influenced by the employment and hiring patterns of our customers. To the extent that weak economic conditions cause our customers and prospective customers to freeze or reduce their hiring for personnel providing service and support, demand for our customer service platform, live chat software, and analytics software may be negatively affected. Historically, during economic downturns there have been reductions in spending on information technology and customer service systems as well as pressure for extended billing terms and other financial concessions. If economic conditions deteriorate, our customers and prospective customers may elect to decrease their information technology and customer service budgets, which would limit our ability to grow our business and negatively affect our operating results.
Our business depends substantially on our customers renewing their subscriptions and purchasing additional subscriptions from us. Any decline in our customer retention or expansion would harm our future operating results.
24
In order for us to maintain or improve our operating results, it is important that our customers renew their subscriptions when the initial contract term expires and add additional authorized agents to their customer accounts. Even though the majority of our revenue is derived from subscriptions to our customer service platform that have terms longer than one month, a significant portion of the subscriptions to our customer service platform have monthly terms. Our customers have no obligation to renew their subscriptions, and our customers may not renew subscriptions with a similar contract period or with the same or a greater number of agents. Some of our customers have elected not to renew their agreements with us and we do not have enough history to accurately predict long-term customer retention.
Our customer retention may decline or fluctuate as a result of a number of factors, including our customers’ satisfaction with our customer service platform, live chat software, or analytics software, our product support, our prices, the prices of competing software systems, mergers and acquisitions affecting our customer base, the effects of global economic conditions, or reductions in our customers’ spending levels. Our future success is also substantially dependent on our ability to sell more subscriptions to our current customers. If our customers do not renew their subscriptions, renew on less favorable terms or fail to add more agents, our revenue may decline, and we may not realize improved operating results from our customer base.
If we are unable to develop and maintain successful relationships with channel partners, our business, operating results, and financial condition could be adversely affected.
To date, we have been primarily dependent on our direct sales force to sell subscriptions to our customer service platform, live chat software, and analytics software. Although we have developed certain channel partners, such as referral partners, resellers, and integration partners, these channels have resulted in limited revenue to date. We believe that continued growth in our business is dependent upon identifying, developing, and maintaining strategic relationships with additional channel partners that can drive substantial revenue. Our agreements with our existing channel partners are non-exclusive, meaning our channel partners may offer customers the products of several different companies, including products that compete with ours. They may also cease marketing our customer service platform, live chat software, and analytics software with limited or no notice and with little or no penalty. We expect that any additional channel partners we identify and develop will be similarly non-exclusive and not bound by any requirement to continue to market our customer service platform, live chat software, or analytics software. If we fail to identify additional channel partners, in a timely and cost-effective manner, or at all, or are unable to assist our current and future channel partners in independently selling and deploying our customer service platform, live chat software, or analytics software, our business, results of operations, and financial condition could be adversely affected. Additionally, customer retention and expansion attributable to customers acquired through our channel partners may differ significantly from customers acquired through our direct sales efforts. If our channel partners do not effectively market and sell our customer service platform, live chat software, or analytics software, or fail to meet the needs of our customers, our reputation and ability to grow our business may also be adversely affected.
Sales by channel partners are more likely than direct sales to involve collectability concerns, in particular sales by our channel partners into developing markets, and accordingly, variations in the mix between revenue attributable to sales by channel partners and revenue attributable to direct sales may result in fluctuations in our operating results.
If we are not able to maintain and enhance our brand, our business, operating results, and financial condition may be adversely affected.
We believe that maintaining and enhancing our reputation as a differentiated and category-defining company in customer service is critical to our relationships with our existing customers and to our ability to attract new customers. The successful promotion of our brand attributes will depend on a number of factors, including our marketing efforts, our ability to continue to develop high-quality software, and our ability to successfully differentiate our customer service platform from competitive products and services. We are highly dependent upon “consumer” tactics, including an emphasis on simplicity and a sense of humor in our advertising, to build our brand and develop brand loyalty. We do not have sufficient history to know if such brand promotion activities will ultimately be successful or yield increased revenue relative to traditional enterprise software marketing strategies. In addition, independent industry analysts often provide reviews of our customer service platform, as well as products and services offered by our competitors, and perception of our platform in the marketplace may be significantly influenced by these reviews. If these reviews are negative, or less positive as compared to those of our competitors’ products and services, our brand may be adversely affected. It may also be difficult to maintain and enhance our brand in connection with sales through channel or strategic partners.
The promotion of our brand requires us to make substantial expenditures, and we anticipate that the expenditures will increase as our market becomes more competitive, as we expand into new markets, and as more sales are generated through our channel partners. To the extent that these activities yield increased revenue, this revenue may not offset the increased expenses we incur. If we do not successfully maintain and enhance our brand, our business may not grow, we may have reduced pricing power relative to competitors, and we could lose customers or fail to attract potential customers, all of which would adversely affect our business, results of operations, and financial condition.
25
Our international sales and operations subject us to additional risks that can adversely affect our business, operating results, and financial condition.
In the three months ended December 31, 2015 and 2014, we derived 44% and 45% of our revenue from customers located outside of the United States, respectively, and for each of the fiscal years ended December 31, 2015 and 2014, we derived 44% and 43% of our revenue from customers located outside of the United States, respectively. We are continuing to expand our international operations as part of our growth strategy. We currently have sales personnel and sales and product support operations in the United States and certain countries across Europe, Australia, Asia, and South America. Our sales organization outside the United States is substantially smaller than our sales organization in the United States and to date a very limited portion of our sales has been driven by resellers or other channel partners. We believe our ability to convince new customers to subscribe to our customer service platform, live chat software, and analytics software or to convince existing customers to renew or expand their use of these services is directly correlated to the level of engagement we obtain with the customer. To the extent we are unable to effectively engage with non-U.S. customers due to our limited sales force capacity and limited channel partners, we may be unable to effectively grow in international markets.
Our international operations subject us to a variety of additional risks and challenges, including:
|
— |
increased management, travel, infrastructure, and legal compliance costs associated with having multiple international operations; |
|
— |
longer payment cycles and difficulties in enforcing contracts, collecting accounts receivable, or satisfying revenue recognition criteria, especially in emerging markets; |
|
— |
increased financial accounting and reporting burdens and complexities; |
|
— |
requirements or preferences for domestic products; |
|
— |
differing technical standards, existing or future regulatory and certification requirements and required features and functionality; |
|
— |
economic conditions in each country or region and general economic uncertainty around the world; |
|
— |
compliance with foreign privacy and security laws and regulations and the risks and costs of non-compliance; |
|
— |
compliance with laws and regulations for foreign operations, including anti-bribery laws (such as the U.S. Foreign Corrupt Practices Act of 1977, as amended, the U.S. Travel Act, and the U.K. Bribery Act 2010), import and export control laws, tariffs, trade barriers, economic sanctions, and other regulatory or contractual limitations on our ability to sell our customer service platform or live chat software in certain foreign markets, and the risks and costs of non-compliance; |
|
— |
heightened risks of unfair or corrupt business practices in certain geographies and of improper or fraudulent sales arrangements that may impact our financial results and result in restatements of our consolidated financial statements; |
|
— |
fluctuations in currency exchange rates and related effect on our operating results; |
|
— |
difficulties in repatriating or transferring funds from or converting currencies in certain countries; |
|
— |
communication and integration problems related to entering new markets with different languages, cultures, and political systems; |
|
— |
differing labor standards, including restrictions related to, and the increased cost of, terminating employees in some countries; |
|
— |
the need for localized software and licensing programs; |
|
— |
the need for localized language support; |
|
— |
reduced protection for intellectual property rights in some countries and practical difficulties of enforcing rights abroad; and |
|
— |
compliance with the laws of numerous foreign taxing jurisdictions, including withholding obligations, and overlapping of different tax regimes. |
Any of these risks could adversely affect our international operations, reduce our international revenue, or increase our operating costs, adversely affecting our business, operating results, financial condition, and growth prospects.
Compliance with laws and regulations applicable to our international operations substantially increases our cost of doing business in foreign jurisdictions. We may be unable to keep current with changes in government requirements as they change from
26
time to time. Failure to comply with these regulations could have adverse effects on our business. In many foreign countries it is common for others to engage in business practices that are prohibited by our internal policies and procedures or U.S. or other regulations applicable to us. Although we have implemented policies and procedures designed to ensure compliance with these laws and policies, there can be no assurance that all of our employees, contractors, partners, and agents will comply with these laws and policies. Violations of laws or key control policies by our employees, contractors, partners, or agents could result in delays in revenue recognition, financial reporting misstatements, enforcement actions, disgorgement of profits, fines, civil and criminal penalties, damages, injunctions, other collateral consequences, or the prohibition of the importation or exportation of our platform and services and could adversely affect our business and results of operations.
We are subject to governmental export and import controls that could impair our ability to compete in international markets or subject us to liability if we violate the controls.
We are subject to U.S. export controls, and we incorporate encryption technology into our customer service platform, live chat software, and analytics software that is enabled through mobile applications and other software we may be deemed to export. These encryption products and the underlying technology may be exported outside of the United States only with the required export authorizations, including by license, a license exception or other appropriate government authorizations, including the filing of an encryption registration. We previously deployed mobile applications prior to obtaining the required export authorizations. Accordingly, we have not fully complied with applicable encryption controls in U.S. export administration regulations. As discussed further below, in 2013, we filed final voluntary disclosures to relevant U.S. enforcement authorities regarding our failure to obtain required export authorizations.
Furthermore, U.S. export control laws and economic sanctions prohibit the shipment of certain products and services to countries, governments, territories, and persons targeted by U.S. sanctions. While we are currently taking precautions to prevent our customer service platform and live chat software from being enabled by persons targeted by U.S. sanctions, including IP blocking and periodic customer screening against U.S. government lists of prohibited persons, such measures may be circumvented. Given the technical limitations in developing measures that will prevent access to internet based services from particular geographies or by particular individuals, we have previously identified and expect we will continue to identify customer accounts for our customer service platform and live chat software that we suspect originate from countries which are subject to U.S. embargoes.
We are aware that trials of and subscriptions to our customer service platform and live chat software have been initiated by persons and organizations in countries that are the subject of U.S. embargoes. Our provision of service in these instances was likely in violation of U.S. export control and sanctions laws. We have terminated the accounts of such organizations as we have become aware of them, implemented certain measures designed to prevent future unauthorized access by such persons and organizations and filed voluntary self disclosures with the U.S. Department of Commerce’s Bureau of Industry and Security, or BIS, and the U.S. Department of Treasury’s Office of Foreign Assets Control, or OFAC, concerning prior potential violations. BIS and OFAC have completed their investigations of U.S. export controls laws and U.S. sanctions laws and have issued, in the case of OFAC, cautionary letters, and in the case of BIS, warning letters. No monetary penalties or other sanctions were imposed by either agency in connection with their investigations.
Prior to our acquisition of WAC, WAC’s service was provided from servers based in the United States to persons and organizations located in jurisdictions that are subject to U.S. economic sanctions. WAC also made available for download from the United States certain encryption-functionality software without first having obtained U.S. government authorization to export such software. In these instances, WAC may have acted in violation of U.S. export controls and sanctions laws. In connection with the acquisition, WAC terminated the subscriptions of any customers believed to be located in restricted jurisdictions, screened its customers against applicable U.S. government lists of prohibited persons, and obtained U.S. government authorization to export its software. WAC has also filed initial voluntary disclosures with OFAC and BIS to alert these agencies of the apparent violations, and will supplement those disclosures with final reports after completing its investigation.
If we are found to be in violation of U.S. sanctions or export control laws, it could result in fines or penalties for us and for individuals, including civil penalties of up to $250,000 or twice the value of the transaction, whichever is greater, per violation, and in the event of conviction for a criminal violation, fines of up to $1 million and possible incarceration for responsible employees and managers for willful and knowing violations. Each instance in which we provide service through our customer service platform or live chat software or in which unlicensed encryption functionality software is downloaded may constitute a separate violation of these laws.
If our channel partners fail to obtain appropriate import, export or re-export licenses or permits, we may also be adversely affected, through reputational harm as well as other negative consequences including government investigations and penalties. We presently incorporate sanctions compliance requirements in our channel partner agreements for our customer service platform and live chat software. Complying with export control and sanctions regulations for a particular sale may be time-consuming and may result in the delay or loss of sales opportunities. Failure to comply with export control and sanctions regulations for a particular sale may
27
expose us to government investigations and penalties, which could have an adverse effect on our business, operating results, and financial condition.
In addition, various countries regulate the import of certain encryption technology, including import permitting and licensing requirements, and have enacted laws that could limit our ability to offer our platform or distribute our platform or could limit our customers’ ability to implement our platform in those countries. Changes in our customer service platform, live chat software, or analytics software or future changes in export and import regulations may create delays in the introduction of our customer service platform, live chat software, or analytics software in international markets or prevent our customers with international operations from deploying our platform globally. Any change in export or import regulations, economic sanctions or related legislation, or change in the countries, governments, persons, or technologies targeted by such regulations, could result in decreased use of our customer service platform, live chat software, or analytics software by, or in our decreased ability to export or sell our customer service platform, live chat software, or analytics software to, existing or potential customers with international operations. Any decreased use of our customer service platform, live chat software, or analytics software or limitation on our ability to export or sell our customer service platform, live chat software, or analytics software would likely adversely affect our business operations and financial results.
We recognize revenue over the term of our customer contracts. Consequently, downturns or upturns in new sales may not be immediately reflected in our operating results and may be difficult to discern.
We generally recognize subscription revenue from customers ratably over the terms of their contracts and a majority of our revenue is derived from subscriptions that have terms longer than one month. As a result, a portion of the revenue we report in each quarter is derived from the recognition of deferred revenue relating to subscriptions entered into during previous quarters. Consequently, a decline in new or renewed subscriptions with terms that are longer than monthly in any single quarter may have a small impact on our revenue results for that quarter. However, such a decline will negatively affect our revenue in future quarters. Accordingly, the effect of significant downturns in sales and market acceptance of our customer service platform, live chat software, and analytics software, and potential changes in our pricing policies or rate of expansion or retention, may not be fully reflected in our results of operations until future periods. We may also be unable to reduce our cost structure in line with a significant deterioration in sales. In addition, because we believe a substantial percentage of subscriptions to our customer service platform, live chat software, and analytics software are shorter than most comparable SaaS companies and because we have many variations of billing cycles, our deferred revenue may be a less meaningful indicator of our future financial results than for other SaaS companies. In addition, a significant majority of our costs are expensed as incurred, while revenue is recognized over the life of the agreement with our customer. As a result, increased growth in the number of our customers could continue to result in our recognition of more costs than revenue in the earlier periods of the terms of our agreements. Our subscription model also makes it difficult for us to rapidly increase our revenue through additional sales in any period, as revenue from new customers must be recognized over the applicable subscription term.
Certain of our operating results and financial metrics may be difficult to predict as a result of seasonality.
We may be impacted by seasonal trends, which may become more apparent as our business matures. We do not have sufficient experience in selling our live chat software and analytics software to determine if demand for these services are or will be subject to material seasonality. Since a large percentage of our subscriptions are monthly, customers are able to rapidly increase and decrease the number of authorized agents for whom they require a subscription quickly and easily, thereby potentially increasing the impact of seasonality on our revenue. This seasonality may be reflected to a much lesser extent, and sometimes may not be immediately apparent, in our revenue, due to the fact that we recognize subscription revenue over the term of our agreement. To the extent we experience this seasonality, it may cause fluctuations in our operating results and financial metrics, and make forecasting our future operating results and financial metrics difficult.
Our ongoing and planned investments in self-managed colocation data centers and third-party managed hosting services are expensive and complex, have resulted, and will result, in a negative impact on our cash flows and may negatively impact our financial results.
We have made and will continue to make substantial investments in our self-managed colocation data centers and third-party managed hosting services to support our growth and provide enhanced levels of service to our customers. We made capital expenditures relating to hosting equipment for use in these data centers of $3.8 million and $0.2 million in the three months ended December 31, 2015 and 2014, respectively, and $15.6 million and $6.2 million in the year ended December 31, 2015 and 2014, respectively. We have transitioned from primarily a managed-service hosting model, where a third party manages most aspects of our hosting operations, to a model in which a significant amount of our services are managed through self-managed colocation data centers, where we have more direct control over the hosting infrastructure and its operation. This has and may continue to have a negative impact on our cash flows and gross profit as we invest in capital assets to establish and expand our use of these self-managed colocation data centers and scale these facilities to expected demand. If we are required to make larger investments in our self-managed colocation data centers than we anticipated or if we require significant managed hosting services to support our growth, the negative impact on our operating results would likely exceed our initial expectations.
28
Our business and growth depend in part on the success of our strategic relationships with third parties, including technology partners, channel partners, and professional services partners.
We depend on, and anticipate that we will continue to depend on, various third-party relationships in order to sustain and grow our business. We are highly dependent upon third-party technology partners for certain critical features and functionality of our platform. For example, the voice features available on our customer service platform are highly dependent on our technology integration with Twilio Inc. Failure of this or any other technology provider to maintain, support, or secure its technology platforms in general, and our integrations in particular, or errors or defects in its technology, could materially and adversely impact our relationship with our customers, damage our reputation and brand, and harm our business and operating results. Any loss of the right to use any of this hardware or software could result in delays or difficulties in our ability to provide our platform until equivalent technology is either developed by us or, if available, identified, obtained, and integrated.
For deployments of our customer service platform into complex technology environments and workflows, we are highly dependent on third-party implementation consultants to provide professional services to our customers. The failure of these third-party consultants to perform their services adequately may disrupt or damage the relationship between us and our customer, damage our brand, and harm our business.
Identifying, negotiating, and documenting relationships with strategic third parties such as technology partners and implementation providers require significant time and resources. In addition, integrating third-party technology is complex, costly, and time-consuming. Our agreements with technology partners and implementation providers are typically limited in duration, non-exclusive, and do not prohibit them from working with our competitors or from offering competing services. Our competitors may be effective in providing incentives to third parties to favor their products or services or to prevent or reduce subscriptions to our platform.
If we are unsuccessful in establishing or maintaining our relationships with these strategic third parties, our ability to compete in the marketplace or to grow our revenue could be impaired and our operating results would suffer. Even if we are successful, we cannot assure you that these relationships will result in improved operating results.
If we fail to integrate our customer service platform, live chat software, and analytics software with a variety of operating systems, software applications, and hardware that are developed by others, our customer service platform, live chat software, and analytics software may become less marketable, less competitive, or obsolete, and our operating results would be harmed.
Our customer service platform, live chat software, and analytics software must integrate with a variety of network, hardware, and software platforms, and we need to continuously modify and enhance our customer service platform, live chat software, and analytics software to adapt to changes in cloud-enabled hardware, software, networking, browser, and database technologies. In particular, we have developed our platform to be able to easily integrate with third-party SaaS applications, including the applications of software providers that compete with us, through the interaction of application platform interfaces, or APIs. In general, we rely on the fact that the providers of such software systems, including salesforce.com, continue to allow us access to their APIs to enable these customer integrations. To date, we have not relied on a long-term written contract to govern our relationship with these providers. Instead, we are subject to the standard terms and conditions for application developers of such providers, which govern the distribution, operation, and fees of such software systems, and which are subject to change by such providers from time to time. Our business may be harmed if any provider of such software systems:
|
— |
discontinues or limits our access to its APIs; |
|
— |
modifies its terms of service or other policies, including fees charged to, or other restrictions on us or other application developers; |
|
— |
changes how customer information is accessed by us or our customers; |
|
— |
establishes more favorable relationships with one or more of our competitors; or |
|
— |
otherwise favors its own competitive offerings over ours. |
We believe a significant component of our value proposition to customers is the ability to optimize and configure our customer service platform, live chat software, and analytics software to communicate with these third-party SaaS applications through our respective APIs. If we are not permitted or able to integrate with these and other third-party SaaS applications in the future, demand for our customer service platform could be adversely impacted and business and operating results would be harmed. In addition, an increasing number of individuals within organizations are utilizing mobile devices to access the Internet and corporate resources and to conduct business. We have designed mobile applications to provide access to our customer service platform, live chat software, and analytics software through these devices. If we cannot provide effective functionality through these mobile applications as required by organizations and individuals that widely use mobile devices, we may experience difficulty attracting and retaining customers. Failure of our customer service platform, live chat software, or analytics software to operate effectively with future infrastructure platforms and technologies could also reduce the demand for our platform, resulting in customer dissatisfaction and harm to our business. If we
29
are unable to respond to changes in a cost-effective manner, our platform may become less marketable, less competitive, or obsolete and our operating results may be negatively impacted.
We may acquire or invest in companies, which may divert our management’s attention and result in additional dilution to our stockholders. We may be unable to integrate acquired businesses and technologies successfully or achieve the expected benefits of such acquisitions.
We may evaluate and consider potential strategic transactions, including acquisitions of, or investments in, businesses, technologies, services, products, and other assets in the future. We also may enter into relationships with other businesses to expand our products and services, which could involve preferred or exclusive licenses, additional channels of distribution, discount pricing, or investments in other companies.
Any acquisition, including our acquisitions of Zopim and WAC, investment or business relationship may result in unforeseen operating difficulties and expenditures. In particular, we may encounter difficulties assimilating or integrating the businesses, technologies, products, personnel, or operations of the acquired companies, particularly if the key personnel of the acquired company choose not to work for us, their software is not easily adapted to work with our platform, or we have difficulty retaining the customers of any acquired business due to changes in ownership, management, or otherwise. For example, we only recently completed our acquisitions of Zopim and WAC, and substantially all of the acquisition and integration risks remain. Acquisitions, including our acquisitions of Zopim and WAC, may also disrupt our business, divert our resources, and require significant management attention that would otherwise be available for development of our existing business. Moreover, the anticipated benefits of any acquisition, investment, or business relationship may not be realized or we may be exposed to unknown risks or liabilities.
Negotiating these transactions can be time-consuming, difficult, and expensive, and our ability to complete these transactions may often be subject to approvals that are beyond our control. Consequently, these transactions, even if announced, may not be completed. For one or more of those transactions, we may:
|
— |
issue additional equity securities that would dilute our existing stockholders; |
|
— |
use cash that we may need in the future to operate our business; |
|
— |
incur large charges or substantial liabilities; |
|
— |
incur debt on terms unfavorable to us or that we are unable to repay; |
|
— |
encounter difficulties retaining key employees of the acquired company or integrating diverse software codes or business cultures; and |
|
— |
become subject to adverse tax consequences, substantial depreciation, or deferred compensation charges. |
Because our customer service platform, live chat software, and analytics software can be used to collect and store personal information, domestic and international privacy and data security concerns could result in additional costs and liabilities to us or inhibit sales of our customer service platform, live chat software, or analytics software.
Personal privacy and data security have become significant issues in the United States, Europe, and in many other jurisdictions where we offer our customer service platform, live chat software, or analytics software. The regulatory framework for privacy and security issues worldwide is rapidly evolving and is likely to remain uncertain for the foreseeable future. Many federal, state, and foreign government bodies and agencies have adopted, or are considering adopting, laws and regulations regarding the collection, use, and disclosure of personal information. In the United States, these include rules and regulations promulgated under the authority of federal agencies and state attorneys general and consumer protection agencies. Internationally, virtually every jurisdiction in which we operate has established its own data security and privacy legal framework with which we or our customers must comply, including Directive 95/46/EC on the protection of individuals with regard to the processing of personal data and on the free movement of such data established in the European Union, or the Data Protection Directive, and data protection legislation of the individual member states subject to the Data Protection Directive. The Data Protection Directive will likely be replaced in time with the pending European General Data Protection Regulation, which may impose additional obligations and risk upon our business. In many jurisdictions enforcement actions and consequences for non-compliance are also rising.
30
We have in the past relied on adherence to the U.S. Department of Commerce’s Safe Harbor Privacy Principles and compliance with the U.S.-EU and U.S.-Swiss Safe Harbor Frameworks as agreed to and set forth by the U.S. Department of Commerce, and the European Union and Switzerland, which established a means for legitimating the transfer of personally identifiable information, or PII, by U.S. companies doing business in Europe from the European Economic Area to the U.S. As a result of a recent opinion of the European Union Court of Justice, or ECJ, regarding the adequacy of the U.S.-EU Safe Harbor Framework, the U.S.-EU Safe Harbor Framework is no longer deemed to be a valid method to ensure compliance with restrictions set forth in the Data Protection Directive and data protection legislation of individual member states restricting the transfer of data outside of the European Economic Area. On February 2, 2016, European Union and U.S. officials announced an agreement on a new framework, the EU-U.S. Privacy Shield, to replace the U.S.-EU Safe Harbor Framework. Details regarding the new EU-U.S. Privacy Shield have not been finalized, published, or interpreted. We have and expect to continue to engage in efforts to ensure that data transfers from the European Economic Area comply with the Data Protection Directive and the data protection legislation of individual member states. These efforts may be deemed unacceptable by the data protection authorities of individual member states or by current or prospective customers. Failure to comply with data protection regulations may result in data protecting authorities and other privacy regimes imposing additional obligations to obtain consent from data subjects by or on behalf of our customers. Additionally, the inability to guarantee compliance or otherwise provide acceptable privacy assurances may inhibit the sale and use of our software in the European Union and certain other markets, which could, were it to occur, harm our business and operating results.
In addition to government regulation, privacy advocates and industry groups may propose new and different self-regulatory standards that either legally or contractually apply to us. Further, our customers may require us to comply with more stringent privacy and data security contractual requirements.
Because the interpretation and application of many privacy and data protection laws, commercial frameworks and standards are uncertain, it is possible that these laws, frameworks, and standards may be interpreted and applied in a manner that is inconsistent with our existing data management practices or the features of our customer service platform, live chat software, or analytics software. If so, in addition to the possibility of fines, lawsuits, breach of contract claims, and other claims and penalties, we could be required to fundamentally change our business activities and practices or modify our customer service platform, live chat software, and analytics software, which could have an adverse effect on our business. Any inability to adequately address privacy and security concerns, even if unfounded, or comply with applicable privacy and security or data security laws, regulations and policies, could result in additional cost and liability to us, damage our reputation, inhibit sales, and adversely affect our business.
Furthermore, the costs of compliance with, and other burdens imposed by, the laws, regulations, and policies that are applicable to the businesses of our customers may limit the use and adoption of, and reduce the overall demand for, our customer service platform, live chat software, or analytics software. Privacy and data security concerns, whether valid or not valid, may inhibit market adoption of our customer service platform, live chat software, or analytics software, particularly in certain industries and foreign countries.
We may be sued by third parties for alleged infringement of their proprietary rights.
There is considerable patent and other intellectual property development activity in our industry. Our future success depends in part on not infringing upon the intellectual property rights of others. From time to time, our competitors or other third parties may claim that we are infringing upon their intellectual property rights, and we may be found to be infringing upon such rights. We may receive claims from third parties, including our competitors, that our customer service platform, live chat software, and analytics software and underlying technology infringe or violate a third party’s intellectual property rights, and we may be found to be infringing upon such rights. We may be unaware of the intellectual property rights of others that may cover some or all of our technology. Any claims or litigation could cause us to incur significant expenses and, if successfully asserted against us, could require that we pay substantial damages or ongoing royalty payments, prevent us from offering our customer service platform, live chat software, or analytics software, or require that we comply with other unfavorable terms. We may also be obligated to indemnify our customers or business partners in connection with any such litigation and to obtain licenses, modify our customer service platform, live chat software, or analytics software, or refund subscription fees, which could further exhaust our resources. In addition, we may incur substantial costs to resolve claims or litigation, whether or not successfully asserted against us, which could include payment of significant settlement, royalty or license fees, modification of our customer service platform, live chat software, and analytics software, or refunds to customers of subscription fees. Even if we were to prevail in the event of claims or litigation against us, any claim or litigation regarding our intellectual property could be costly and time-consuming and divert the attention of our management and other employees from our business operations. Such disputes could also disrupt our customer service platform, live chat software, or analytics software, adversely impacting our customer satisfaction and ability to attract customers.
31
Indemnity provisions in various agreements potentially expose us to substantial liability for intellectual property infringement and other losses.
Our agreements with customers and other third parties may include indemnification or other provisions under which we agree to indemnify or otherwise be liable to them for losses suffered or incurred as a result of claims of intellectual property infringement, damages caused by us to property or persons, or other liabilities relating to or arising from our customer service platform, live chat software, or analytics software or other acts or omissions. The term of these contractual provisions often survives termination or expiration of the applicable agreement. Large indemnity payments or damage claims from contractual breach could harm our business, operating results, and financial condition. From time to time, customers require us to indemnify or otherwise be liable to them for breach of confidentiality or failure to implement adequate security measures with respect to their data stored, transmitted, or processed by our customer service platform, live chat software, or analytics software. Although we normally contractually limit our liability with respect to such obligations, we may still incur substantial liability related to them. Any dispute with a customer with respect to such obligations could have adverse effects on our relationship with that customer and other current and prospective customers, reduce demand for our customer service platform, and harm our business and operating results.
Our use of “open source” software could negatively affect our ability to sell our customer service platform, live chat software, and analytics software and subject us to possible litigation.
We use open source software in our customer service platform, live chat software, and analytics software and expect to continue to use open source software in the future. We may face claims from others claiming ownership of, or seeking to enforce the terms of, an open source license, including by demanding release of the open source software, derivative works or our proprietary source code that was developed using such software. These claims could also result in litigation, require us to purchase a costly license or require us to devote additional research and development resources to change our customer service platform, live chat software, or analytics software, any of which would have a negative effect on our business and operating results. In addition, if the license terms for the open source software we utilize change, we may be forced to reengineer our customer service platform, live chat software, or analytics software or incur additional costs. Although we have implemented policies to regulate the use and incorporation of open source software into our customer service platform, live chat software, and analytics software, we cannot be certain that we have not incorporated open source software in our customer service platform, live chat software, and analytics software in a manner that is inconsistent with such policies.
Any failure to protect our intellectual property rights could impair our ability to protect our proprietary technology and our brand.
Our success and ability to compete depend in part upon our intellectual property. We currently have two issued patents and have a limited number of patent applications, none of which may result in an issued patent. We primarily rely on copyright, trade secret and trademark laws, trade secret protection, and confidentiality or license agreements with our employees, customers, partners, and others to protect our intellectual property rights. However, the steps we take to protect our intellectual property rights may be inadequate.
In order to protect our intellectual property rights, we may be required to spend significant resources to monitor and protect these rights. Litigation brought to protect and enforce our intellectual property rights could be costly, time-consuming, and distracting to management, and could result in the impairment or loss of portions of our intellectual property. Furthermore, our efforts to enforce our intellectual property rights may be met with defenses, counterclaims, and countersuits attacking the validity and enforceability of our intellectual property rights. Our failure to secure, protect, and enforce our intellectual property rights could adversely affect our brand and adversely impact our business.
We may not be able to secure additional financing on favorable terms, or at all, to meet our future capital needs.
We have funded our operations since inception primarily through sales of equity securities, capital lease arrangements, loans for equipment, and subscription payments by our customers for use of our customer service platform, live chat software, and analytics software. We do not know when or if our operations will generate sufficient cash to fund our ongoing operations. In the future, we may require additional capital to respond to business opportunities, challenges, acquisitions, a decline in the level of subscriptions for our customer service platform, or unforeseen circumstances. We may not be able to timely secure additional debt or equity financing on favorable terms, or at all. Any debt financing obtained by us could involve restrictive covenants relating to financial and operational matters, which may make it more difficult for us to obtain additional capital and to pursue business opportunities, including potential acquisitions. Additionally, we may not be able to generate sufficient cash to service any debt financing obtained by us, which may force us to reduce or delay capital expenditures or sell assets or operations. If we raise additional funds through further issuances of equity, convertible debt securities or other securities convertible into equity, our existing stockholders could suffer significant dilution in their percentage ownership of our company, and any new equity securities we issue could have rights, preferences and privileges senior to those of holders of our common stock. If we are unable to obtain adequate financing or financing on terms satisfactory to us, when we require it, our ability to continue to grow or support our business and to respond to business challenges could be significantly limited.
32
We face exposure to foreign currency exchange rate fluctuations.
As our international operations expand, our exposure to the effects of fluctuations in currency exchange rates grows. While we have primarily transacted with customers in U.S. dollars historically, we expect to continue to expand the number of transactions with our customers that are denominated in foreign currencies in the future. Fluctuations in the value of the U.S. dollar and foreign currencies may make our subscriptions more expensive for international customers, which could harm our business. Additionally, we incur expenses for employee compensation and other operating expenses at our non-U.S. locations in the local currency for such locations. Fluctuations in the exchange rates between the U.S. dollar and other currencies could result in an increase to the U.S. dollar equivalent of such expenses. These fluctuations could cause our results of operations to differ from our expectations or the expectations of our investors. Additionally, such foreign currency exchange rate fluctuations could make it more difficult to detect underlying trends in our business and results of operations.
Our international subsidiaries maintain net assets that are denominated in currencies other than the functional operating currencies of these entities. Accordingly, changes in the value of foreign currencies relative to the U.S. dollar can affect our operating results due to transactional and translational remeasurements that are reflected in our results of operations. To the extent that fluctuations in currency exchange rates cause our results of operations to differ from our expectations or the expectations of our investors, the trading price of our common stock could be adversely affected.
In September 2015, we implemented a hedging program to mitigate the impact of foreign currency fluctuations on our cash flows and earnings. The use of such hedging activities may not offset any or more than a portion of the adverse financial effects of unfavorable movements in foreign exchange rates over the limited time the hedges are in place. Moreover, the use of hedging instruments may introduce additional risks if we are unable to structure effective hedges with such instruments, which could adversely affect our financial condition and operating results.
Taxing authorities may successfully assert that we should have collected or in the future should collect sales and use, value added or similar taxes, and we could be subject to liability with respect to past or future sales, which could adversely affect our results of operations.
We do not collect sales and use, value added and similar taxes in all jurisdictions in which we have sales, based on our understanding that such taxes are not applicable. Sales and use, value added, and similar tax laws and rates vary greatly by jurisdiction. Certain jurisdictions in which we do not collect such taxes may assert that such taxes are applicable, which could result in tax assessments, penalties, and interest, and we may be required to collect such taxes in the future. Such tax assessments, penalties, and interest, or future requirements may adversely affect our results of operations.
Our international operations subject us to potentially adverse tax consequences.
We generally conduct our international operations through subsidiaries and report our taxable income in various jurisdictions worldwide based upon our business operations in those jurisdictions. Our intercompany relationships and transactions are subject to complex regulations, including transfer pricing regulations administered by taxing authorities in various jurisdictions. Our tax returns are generally subject to examination by taxing authorities and the relevant taxing authorities may disagree with our determinations as to the value of assets sold or acquired or income and expenses attributable to specific jurisdictions or transactions. If such a disagreement were to occur, and our position were not sustained, we could be required to pay additional taxes, interest and penalties, which could result in one-time tax charges, higher effective tax rates, reduced cash flows, and lower overall profitability of our operations. We believe that our financial statements reflect adequate reserves to cover such a contingency, but there can be no assurances in that regard and any one-time charges associated with any disagreement may exceed the amount of our reserves and adversely affect our results of operations.
If our goodwill or intangible assets become impaired, we may be required to record a significant charge to earnings.
We review our intangible assets for impairment when events or changes in circumstances indicate the carrying value may not be recoverable. Goodwill is required to be tested for impairment at least annually. As of December 31, 2015, we had a total of $45.3 million and $11.7 million of goodwill and intangible assets related to our acquisitions of WAC and Zopim, respectively. An adverse change in market conditions, particularly if such change has the effect of changing one of our critical assumptions or estimates, could result in a change to the estimation of fair value that could result in an impairment charge to our goodwill or intangible assets. Any such charges may have a material negative impact on our operating results.
33
Our ability to use our net operating losses to offset future taxable income may be subject to certain limitations.
As of December 31, 2015, we had federal and state net operating loss carryforwards, or NOLs, of $243.0 million and $67.2 million, respectively, due to prior period losses. In general, under Section 382 of the Internal Revenue Code of 1986, as amended, or the Code, a corporation that undergoes an “ownership change” is subject to limitations on its ability to utilize its NOLs to offset future taxable income. Our existing NOLs may be subject to limitations arising from previous ownership changes, including in connection with our initial public offering, or IPO or our follow-on public offering. Future changes in our stock ownership, some of which are outside of our control, could result in an ownership change under Section 382 of the Code. Furthermore, our ability to utilize NOLs of companies that we may acquire in the future may be subject to limitations. There is also a risk that due to regulatory changes, such as suspensions on the use of NOLs, or other unforeseen reasons, our existing NOLs could expire or otherwise be unavailable to offset future income tax liabilities. For these reasons, we may not be able to realize a tax benefit from the use of our NOLs, whether or not we attain profitability.
Our estimates of market opportunity and forecasts of market growth may prove to be inaccurate, and even if the market in which we compete achieves the forecasted growth, our business could fail to grow at similar rates, if at all.
Market opportunity estimates and growth forecasts are subject to significant uncertainty and are based on assumptions and estimates that may not prove to be accurate. Our estimates and forecasts relating to the size and expected growth of the customer relationship management market may prove to be inaccurate. Even if the market in which we compete meets our size estimates and forecasted growth, our business could fail to grow at similar rates, if at all.
We depend and rely upon SaaS technologies from third parties to operate our business and interruptions or performance problems with these technologies may adversely affect our business and operating results.
We rely heavily on hosted SaaS applications from third parties in order to operate critical functions of our business, including billing and order management, enterprise resource planning, and financial accounting services. If these services become unavailable due to extended outages, interruptions, or because they are no longer available on commercially reasonable terms, our expenses could increase, our ability to manage finances could be interrupted and our processes for managing sales of our platform and supporting our customers could be impaired until equivalent services, if available, are identified, obtained, and implemented, all of which could adversely affect our business.
Changes in laws and regulations related to the Internet or changes in the Internet infrastructure itself may diminish the demand for our platform, cause us to incur additional expenses or otherwise have a negative impact on our business.
The future success of our business depends upon the continued use of the Internet as a primary medium for commerce, communication, and business applications. Federal, state, or foreign government bodies or agencies have in the past adopted, and may in the future adopt, laws or regulations affecting the use of the Internet as a commercial medium. Changes in these laws or regulations could require us to modify our platform in order to comply with these changes or substantially increase costs associated with the operation of our customer service platform, live chat software, and analytics software. Additionally, the adoption of any laws, regulations, or practices limiting Internet neutrality, could allow Internet service providers to block, degrade or interfere with our products or services. These laws, regulations, or practices could decrease the demand for, or the usage of, our products and services, increase our cost of doing business and adversely affect our operating results. In addition, government agencies or private organizations have imposed and may impose additional taxes, fees, or other charges for accessing the Internet or commerce conducted via the Internet. These laws or charges could limit the growth of Internet-related commerce or communications generally, or result in reductions in the demand for Internet-based platforms and services such as ours. In addition, the use of the Internet as a business tool could be adversely affected due to delays in the development or adoption of new standards and protocols to handle increased demands of Internet activity, security, reliability, cost, ease-of-use, accessibility, and quality of service. The performance of the Internet and its acceptance as a business tool has been adversely affected by “viruses,” “worms,” and similar malicious programs and the Internet has experienced a variety of outages and other delays as a result of damage to portions of its infrastructure.
Catastrophic events may disrupt our business.
Our corporate headquarters are located in San Francisco, California and we operate in or utilize data centers that are located in North America, Europe, and Asia. Key features and functionality of our customer service platform are enabled by third parties that are headquartered in California and operate in or utilize data centers in the United States and Europe. Additionally, we rely on our network and third-party infrastructure and enterprise applications, internal technology systems, and our website for our development, marketing, operational support, hosted services, and sales activities. In the event of a major earthquake, hurricane, or catastrophic event such as fire, power loss, telecommunications failure, cyber-attack, war, or terrorist attack, we may be unable to continue our operations and may endure system interruptions, reputational harm, delays in our application development, lengthy interruptions in our platform, breaches of data security, and loss of critical data, all of which could have an adverse effect on our future operating results.
34
Risks Related to Ownership of Our Common Stock
Our stock price has been, and may continue to be, volatile or may decline regardless of our operating performance resulting in substantial losses for our stockholders.
The trading price of our common stock has been, and may continue to be, volatile and could fluctuate widely regardless of our operating performance. The market price of our common stock may fluctuate significantly in response to numerous factors, many of which are beyond our control, including:
|
— |
actual or anticipated fluctuations in our operating results; |
|
— |
the financial projections we may provide to the public, any changes in these projections or our failure to meet these projections; |
|
— |
failure of securities analysts to initiate or maintain coverage of our company, changes in financial estimates and publication of other news by any securities analysts who follow our company, or our failure to meet these estimates or the expectations of investors; |
|
— |
ratings changes by any securities analysts who follow our company; |
|
— |
announcements by us or our competitors of significant technical innovations, acquisitions, strategic partnerships, joint ventures, or capital commitments; |
|
— |
changes in operating performance and stock market valuations of other technology companies generally, or those in our industry in particular; |
|
— |
price and volume fluctuations in the overall stock market from time to time, including as a result of trends in the economy as a whole; |
|
— |
changes in accounting standards, policies, guidelines, interpretations, or principles; |
|
— |
actual or anticipated developments in our business or our competitors’ businesses or the competitive landscape generally; |
|
— |
developments or disputes concerning our intellectual property or our products, or third-party proprietary rights; |
|
— |
announced or completed acquisitions of businesses or technologies by us or our competitors; |
|
— |
new laws or regulations or new interpretations of existing laws, or regulations applicable to our business; |
|
— |
any major change in our board of directors or management; |
|
— |
sales of shares of our common stock by us or our stockholders; |
|
— |
lawsuits threatened or filed against us; and |
|
— |
other events or factors, including those resulting from war, incidents of terrorism, or responses to these events. |
In addition, the stock markets have experienced extreme price and volume fluctuations that have affected and continue to affect the market prices of equity securities of many technology companies. Stock prices of many technology companies have fluctuated in a manner unrelated or disproportionate to the operating performance of those companies. In the past, stockholders have instituted securities class action litigation following periods of market volatility. If we were to become involved in securities litigation, it could subject us to substantial costs, divert resources and the attention of management from operating our business, and adversely affect our business, results of operations, financial condition, and cash flows.
Our directors, officers, and principal stockholders beneficially own a significant percentage of our stock and will be able to exert significant influence over matters subject to stockholder approval.
As of December 31, 2015, our directors, officers, five percent or greater stockholders, and their respective affiliates beneficially owned in the aggregate approximately 29.4% of our outstanding common stock. As a result, these stockholders have the ability to influence us through this ownership position. These stockholders may be able to exert significant influence in matters requiring stockholder approval. For example, these stockholders may be able to exert significant influence in elections of directors, amendments of our organizational documents, and approval of any merger, sale of assets, or other major corporate transaction. This may prevent or discourage unsolicited acquisition proposals or offers for our common stock that you may feel are in your best interest as one of our stockholders.
35
Substantial future sales of shares of our common stock could cause the market price of our common stock to decline.
The market price of our common stock could decline as a result of substantial sales of our common stock, particularly sales by our directors, executive officers and significant stockholders or the perception in the market that holders of a large number of shares intend to sell their shares.
Additionally, the shares of common stock subject to outstanding options and restricted stock unit awards under our equity incentive plans and the shares reserved for future issuance under our equity incentive plans will become eligible for sale in the public market in the future, subject to certain legal and contractual limitations.
Certain holders of our common stock have rights, subject to some conditions, to require us to file registration statements covering their shares or to include their shares in registration statements that we may file for ourselves or our stockholders.
Anti-takeover provisions in our charter documents and under Delaware law could make an acquisition of our company more difficult, limit attempts by our stockholders to replace or remove our current management and limit the market price of our common stock.
Provisions in our certificate of incorporation and bylaws may have the effect of delaying or preventing a change of control or changes in our management. Our certificate of incorporation and bylaws include provisions that:
|
— |
authorize our board of directors to issue, without further action by the stockholders, shares of undesignated preferred stock with terms, rights, and preferences determined by our board of directors that may be senior to our common stock; |
|
— |
require that any action to be taken by our stockholders be effected at a duly called annual or special meeting and not by written consent; |
|
— |
specify that special meetings of our stockholders can be called only by our board of directors, the Chair of our board of directors, or our Chief Executive Officer; |
|
— |
establish an advance notice procedure for stockholder proposals to be brought before an annual meeting, including proposed nominations of persons for election to our board of directors; |
|
— |
establish that our board of directors is divided into three classes, Class I, Class II, and Class III, with each class serving three-year staggered terms; |
|
— |
prohibit cumulative voting in the election of directors; |
|
— |
provide that our directors may be removed only for cause; |
|
— |
provide that vacancies on our board of directors may be filled only by a majority of directors then in office, even though less than a quorum; and |
|
— |
require the approval of our board of directors or the holders of at least seventy-five percent (75%) of our outstanding shares of capital stock to amend our bylaws and certain provisions of our certificate of incorporation. |
These provisions may frustrate or prevent any attempts by our stockholders to replace or remove our current management by making it more difficult for stockholders to replace members of our board of directors, which is responsible for appointing the members of our management. In addition, because we are incorporated in Delaware, we are governed by the provisions of Section 203 of the Delaware General Corporation Law, which generally prohibits a Delaware corporation from engaging in any of a broad range of business combinations with any “interested” stockholder for a period of three years following the date on which the stockholder became an “interested” stockholder. Any delay or prevention of a change of control transaction or changes in our management could cause the market price of our common stock to decline.
The requirements of being a public company may strain our resources, divert management’s attention, and affect our ability to attract and retain executive management and qualified board members.
As a public company, we are subject to the reporting requirements of the Exchange Act, the Sarbanes-Oxley Act, the Dodd-Frank Wall Street Reform and Consumer Protection Act of 2010, the listing requirements of the exchanges and other markets upon which our common stock is listed, and other applicable securities rules and regulations. Compliance with these rules and regulations increase our legal and financial compliance costs, make some activities more difficult, time-consuming, or costly, and increase demand on our systems and resources. The Exchange Act requires, among other things, that we file annual, quarterly and current reports with respect to our business and operating results. The Sarbanes-Oxley Act requires, among other things, that we maintain effective disclosure controls and procedures and internal control over financial reporting. In order to maintain and, if required,
36
improve our disclosure controls and procedures and internal control over financial reporting to meet this standard, significant resources and management oversight may be required. We are required to disclose changes made in our internal control and procedures on a quarterly basis and we are required to furnish a report by management on, among other things, the effectiveness of our internal control over financial reporting As a result of the complexity involved in complying with the rules and regulations applicable to public companies, our management’s attention may be diverted from other business concerns, which could adversely affect our business and operating results. Although we have already hired additional employees to assist us in complying with these requirements, we may need to hire more employees in the future or engage outside consultants, which will increase our operating expenses.
In addition, changing laws, regulations, and standards relating to corporate governance and public disclosure are creating uncertainty for public companies, increasing legal and financial compliance costs, and making some activities more time consuming. These laws, regulations, and standards are subject to varying interpretations, in many cases due to their lack of specificity, and, as a result, their application in practice may evolve over time as new guidance is provided by regulatory and governing bodies. This could result in continuing uncertainty regarding compliance matters and higher costs necessitated by ongoing revisions to disclosure and governance practices. We intend to invest substantial resources to comply with evolving laws, regulations, and standards, and this investment may result in increased general and administrative expenses and a diversion of management’s time and attention from business operations to compliance activities. If our efforts to comply with new laws, regulations and standards differ from the activities intended by regulatory or governing bodies due to ambiguities related to their application and practice, regulatory authorities may initiate legal proceedings against us and our business may be adversely affected.
Being a public company and these new rules and regulations have made it more expensive for us to obtain director and officer liability insurance, and in the future we may be required to accept reduced coverage or incur substantially higher costs to obtain coverage. These factors could also make it more difficult for us to attract and retain qualified members of our board of directors, particularly to serve on our audit committee and compensation committee, and qualified executive officers.
As a result of disclosure of information in our filings with the SEC, our business and financial condition have become more visible, which we believe may result in threatened or actual litigation, including by competitors and other third parties. If such claims are successful, our business and operating results could be adversely affected, and even if the claims do not result in litigation or are resolved in our favor, these claims, and the time and resources necessary to resolve them, could divert the resources of our management and adversely affect our business and operating results.
We do not intend to pay dividends on our common stock so any returns will be limited to changes in the value of our common stock.
We have never declared or paid any cash dividends on our common stock. We currently anticipate that we will retain future earnings for the development, operation, and expansion of our business, and do not anticipate declaring or paying any cash dividends for the foreseeable future. In addition, our ability to pay cash dividends on our common stock may be prohibited or limited by the terms of our future debt financing arrangements. Any return to stockholders will therefore be limited to the increase, if any, of our stock price, which may never occur.
If securities or industry analysts do not continue to publish research or publish inaccurate or unfavorable research about our business, our stock price and trading volume could decline.
The trading market for our common stock depends in part on the research and reports that securities or industry analysts publish about us or our business. If industry analysts cease coverage of us, the trading price for our common stock would be negatively affected. If one or more of the analysts who cover us downgrade our common stock or publish inaccurate or unfavorable research about our business, our common stock price would likely decline. If one or more of these analysts cease coverage of us or fail to publish reports on us regularly, demand for our common stock could decrease, which might cause our common stock price and trading volume to decline.
Our charter documents designate the Court of Chancery of the State of Delaware as the sole and exclusive forum for certain types of actions and proceedings that may be initiated by our stockholders, which could limit our stockholders’ ability to obtain a favorable judicial forum for disputes with us or our directors, officers, or other employees.
Our certificate of incorporation and bylaws provide that, unless we consent in writing to the selection of an alternative forum, the Court of Chancery of the State of Delaware shall be the sole and exclusive forum for (A) any derivative action or proceeding brought on our behalf, (B) any action asserting a claim of breach of a fiduciary duty owed by any of our directors, officers or other employees to us or our stockholders, (C) any action asserting a claim arising pursuant to any provision of the Delaware General Corporation Law, our certificate of incorporation or our bylaws, or (D) any action asserting a claim against us governed by the internal affairs doctrine. Any person or entity purchasing or otherwise acquiring any interest in shares of our capital stock shall be deemed to have notice of and consented to the provisions of our certificate of incorporation described above. This choice of forum provision may
37
limit a stockholder’s ability to bring a claim in a judicial forum that it finds favorable for disputes with us or our directors, officers, or other employees, which may discourage such lawsuits against us and our directors, officers, and other employees. Alternatively, if a court were to find these provisions of our certificate of incorporation inapplicable to, or unenforceable in respect of, one or more of the specified types of actions or proceedings, we may incur additional costs associated with resolving such matters in other jurisdictions, which could adversely affect our business, financial condition, or results of operations.
Item 1B. Unresolved Staff Comments.
None.
Our corporate headquarters are located in San Francisco, California. We operate in San Francisco under two leases for approximately 72,900 and 34,900 square feet of space, respectively. These leases expire in August 2022 and October 2019, respectively.
We also lease office space in various locations in North America, South America, Europe, Australia and Asia. We intend to procure additional space as we add employees and expand geographically. We believe our facilities are adequate and sufficient for our current needs and that, should it be needed, suitable additional or alternative space will be available to accommodate any such expansion of our operations.
From time to time, we may be subject to legal proceedings and claims in the ordinary course of business. We have received, and may in the future continue to receive, claims from third parties asserting, among other things, infringement of their intellectual property rights. Future litigation may be necessary to defend ourselves, our partners and our customers by determining the scope, enforceability, and validity of third-party proprietary rights, or to establish our proprietary rights. The results of any current or future litigation cannot be predicted with certainty, and regardless of the outcome, litigation can have an adverse impact on us because of defense and settlement costs, diversion of management resources, and other factors.
Item 4. Mine Safety Disclosures.
Not Applicable.
38
Item 5. Market for Registrant’s Common Equity, Related Stockholder Matters and Issuer Purchases of Equity Securities.
Market Information for Common Stock
Our common stock has been listed on the New York Stock Exchange under the symbol “ZEN” since May 15, 2014, the date of our initial public offering.
The following table sets forth for the indicated periods the high and low intra-day sales prices of our common stock as reported by the New York Stock Exchange.
|
|
|
High |
|
|
Low |
|
||
|
Year ended December 31, 2014 |
|
|
|
|
|
|
|
|
|
Second quarter (from May 15, 2014) |
|
$ |
18.75 |
|
|
$ |
11.06 |
|
|
Third quarter |
|
$ |
28.05 |
|
|
$ |
15.50 |
|
|
Fourth quarter |
|
$ |
28.20 |
|
|
$ |
19.39 |
|
|
Year ended December 31, 2015 |
|
|
|
|
|
|
|
|
|
First quarter |
|
$ |
26.08 |
|
|
$ |
22.16 |
|
|
Second quarter |
|
$ |
24.50 |
|
|
$ |
20.57 |
|
|
Third quarter |
|
$ |
23.24 |
|
|
$ |
19.63 |
|
|
Fourth quarter |
|
$ |
27.33 |
|
|
$ |
19.15 |
|
Stock Performance Graph
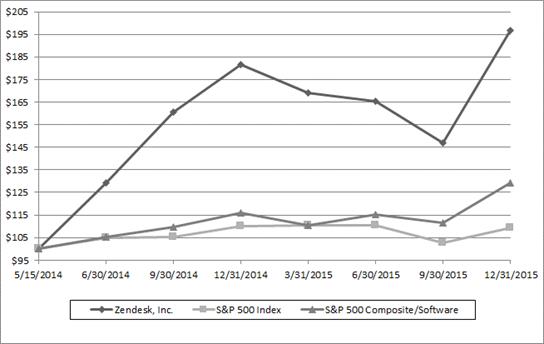
|
|
Base Period |
|
|
|
|
|
|
|
|
|
|
|
|
|
|
|
|
|
|
|
|
|
|
|
|
|
|
|
|
|
|
|
Company / Index |
5/15/2014 |
|
|
6/30/2014 |
|
|
9/30/2014 |
|
|
12/31/2014 |
|
|
3/31/2015 |
|
|
6/30/2015 |
|
|
9/30/2015 |
|
|
12/31/2015 |
|
||||||||
|
Zendesk, Inc. |
|
100.00 |
|
|
|
129.41 |
|
|
|
160.76 |
|
|
|
181.46 |
|
|
|
168.95 |
|
|
|
165.38 |
|
|
|
146.76 |
|
|
|
196.87 |
|
|
S&P 500 Index |
|
100.00 |
|
|
|
104.78 |
|
|
|
105.42 |
|
|
|
110.05 |
|
|
|
110.53 |
|
|
|
110.28 |
|
|
|
102.63 |
|
|
|
109.25 |
|
|
S&P 500 Composite/Software |
|
100.00 |
|
|
|
105.09 |
|
|
|
109.57 |
|
|
|
115.84 |
|
|
|
110.53 |
|
|
|
115.11 |
|
|
|
111.50 |
|
|
|
129.28 |
|
Holders
As of December 31, 2015, there were approximately 69 holders of record of our common stock. However, because many of our shares of common stock are held by brokers and other institutions on behalf of stockholders, we are unable to accurately estimate the total number of stockholders represented by these record holders.
39
We have never declared or paid any cash dividend on our capital stock. We currently intend to retain any future earnings and do not expect to pay any dividends in the foreseeable future. Any future determination to declare cash dividends will be made at the discretion of our board of directors, subject to applicable laws, and will depend on a number of factors, including our financial condition, operating results, capital requirements, contractual restrictions, general business conditions, and other factors that our board of directors may deem relevant. Currently, our credit facility prohibits the payment of any dividends without obtaining the lender’s prior written consent, other than dividends payable solely in our common stock.
Issuer Purchases of Equity Securities
No shares of our common stock were repurchased during the three months ended December 31, 2015.
Securities Authorized for Issuance Under Equity Compensation Plans
See Item 12, “Security Ownership of Certain Beneficial Owners and Management and Related Stockholder Matters” for information regarding securities authorized for issuance.
Item 6. Selected Financial Data.
The consolidated statements of operations data and the consolidated balance sheets data are derived from our audited consolidated financial statements and should be read together with “Management’s Discussion and Analysis of Financial Condition and Results of Operations”, our consolidated financial statements and the related notes included elsewhere in this filing. Our historical data results are not necessarily indicative of our results in any future period.
40
|
|
Year Ended December 31, |
|
||||||||||||||
|
|
|
2015 |
|
|
2014 |
|
|
2013 |
|
|
2012 |
|
||||
|
|
|
|
|
|
|
|
|
|
|
|
|
|
|
|
|
|
|
Revenue |
|
$ |
208,768 |
|
|
$ |
127,049 |
|
|
$ |
72,045 |
|
|
$ |
38,228 |
|
|
Cost of revenue (1) |
|
|
67,184 |
|
|
|
46,047 |
|
|
|
24,531 |
|
|
|
13,253 |
|
|
Gross profit |
|
|
141,584 |
|
|
|
81,002 |
|
|
|
47,514 |
|
|
|
24,975 |
|
|
Operating expenses (1): |
|
|
|
|
|
|
|
|
|
|
|
|
|
|
|
|
|
Research and development |
|
|
62,615 |
|
|
|
36,403 |
|
|
|
15,288 |
|
|
|
14,816 |
|
|
Sales and marketing |
|
|
114,052 |
|
|
|
77,875 |
|
|
|
37,622 |
|
|
|
22,749 |
|
|
General and administrative |
|
|
47,902 |
|
|
|
32,869 |
|
|
|
16,437 |
|
|
|
11,558 |
|
|
Total operating expenses |
|
|
224,569 |
|
|
|
147,147 |
|
|
|
69,347 |
|
|
|
49,123 |
|
|
Operating loss |
|
|
(82,985 |
) |
|
|
(66,145 |
) |
|
|
(21,833 |
) |
|
|
(24,148 |
) |
|
Other expense, net |
|
|
(729 |
) |
|
|
(1,533 |
) |
|
|
(517 |
) |
|
|
(96 |
) |
|
Loss before provision for (benefit from) income taxes |
|
|
(83,714 |
) |
|
|
(67,678 |
) |
|
|
(22,350 |
) |
|
|
(24,244 |
) |
|
Provision for (benefit from) income taxes |
|
|
338 |
|
|
|
(263 |
) |
|
|
221 |
|
|
|
121 |
|
|
Net loss |
|
|
(84,052 |
) |
|
|
(67,415 |
) |
|
|
(22,571 |
) |
|
|
(24,365 |
) |
|
Accretion of redeemable convertible preferred stock |
|
|
— |
|
|
|
(18 |
) |
|
|
(49 |
) |
|
|
(50 |
) |
|
Deemed dividend to investors in relation to the tender offer |
|
|
— |
|
|
|
— |
|
|
|
— |
|
|
|
(8,326 |
) |
|
Net loss attributable to common stockholders |
|
$ |
(84,052 |
) |
|
$ |
(67,433 |
) |
|
$ |
(22,620 |
) |
|
$ |
(32,741 |
) |
|
|
|
|
|
|
|
|
|
|
|
|
|
|
|
|
|
|
|
Net loss per share attributable to common stockholders, basic and diluted |
|
$ |
(0.99 |
) |
|
$ |
(1.26 |
) |
|
$ |
(1.04 |
) |
|
$ |
(1.67 |
) |
|
Weighted-average shares used to compute net loss per share attributable to common stockholders, basic and diluted |
|
|
84,926 |
|
|
|
53,571 |
|
|
|
21,674 |
|
|
|
19,629 |
|
|
__________ |
|
|
|
|
|
|
|
|
|
|
|
|
|
|
|
|
|
(1) Includes share-based compensation expense as follows: |
|
|
|
|
|
|
|
|
|
|
|
|
|
|
|
|
|
|
|
Year Ended December 31, |
|
|||||||||||||
|
|
|
2015 |
|
|
2014 |
|
|
2013 |
|
|
2012 |
|
||||
|
Cost of revenue |
|
$ |
4,541 |
|
|
$ |
2,464 |
|
|
$ |
254 |
|
|
$ |
129 |
|
|
Research and development |
|
|
19,414 |
|
|
|
10,918 |
|
|
|
635 |
|
|
|
4,117 |
|
|
Sales and marketing |
|
|
14,759 |
|
|
|
10,680 |
|
|
|
1,210 |
|
|
|
1,313 |
|
|
General and administrative |
|
|
13,842 |
|
|
|
8,077 |
|
|
|
2,755 |
|
|
|
4,081 |
|
|
|
|
As of December 31, |
|
|||||||||||||
|
Consolidated Balance Sheet Data: |
|
2015 |
|
|
2014 |
|
|
2013 |
|
|
2012 |
|
||||
|
Cash and cash equivalents |
|
$ |
216,226 |
|
|
$ |
80,265 |
|
|
$ |
53,725 |
|
|
$ |
48,668 |
|
|
Marketable securities |
|
|
29,414 |
|
|
|
42,204 |
|
|
|
12,114 |
|
|
|
— |
|
|
Working Capital |
|
|
165,832 |
|
|
|
60,856 |
|
|
|
31,706 |
|
|
|
33,524 |
|
|
Property and equipment, net |
|
|
56,540 |
|
|
|
41,895 |
|
|
|
15,431 |
|
|
|
8,472 |
|
|
Goodwill and intangible assets, net |
|
|
57,050 |
|
|
|
14,152 |
|
|
|
— |
|
|
|
— |
|
|
Total assets |
|
|
422,686 |
|
|
|
205,788 |
|
|
|
92,736 |
|
|
|
64,058 |
|
|
Deferred Revenue |
|
|
85,615 |
|
|
|
51,731 |
|
|
|
29,048 |
|
|
|
15,130 |
|
|
Credit facility |
|
|
— |
|
|
|
6,952 |
|
|
|
23,760 |
|
|
|
— |
|
|
Total liabilities |
|
|
129,396 |
|
|
|
92,082 |
|
|
|
67,643 |
|
|
|
22,943 |
|
|
Stockholders' equity |
|
|
293,290 |
|
|
|
113,706 |
|
|
|
(46,276 |
) |
|
|
(30,205 |
) |
41
Item 7. Management’s Discussion and Analysis of Financial Condition and Results of Operations.
MANAGEMENT’S DISCUSSION AND ANALYSIS OF FINANCIAL CONDITION
AND RESULTS OF OPERATIONS
The following discussion and analysis of our financial condition and results of operations should be read in conjunction with the section titled “Selected Consolidated Financial Data” and consolidated financial statements and related notes thereto included elsewhere in this Annual Report on Form 10-K. This discussion contains forward-looking statements that involve risks and uncertainties. Our actual results could differ materially from those discussed below. Factors that could cause or contribute to such differences include, but are not limited to, those identified below and those discussed in the section titled “Risk Factors” included elsewhere in this Annual Report on Form 10-K.
Overview
Zendesk’s mission is to help organizations and their customers build better relationships. We are a software development company that provides a SaaS customer service platform that enables our customers to provide tailored support through multiple channels, establish effective self-service support resources, proactively serve customers through customer engagement capabilities, integrate with other applications, and consolidate and analyze data from customer interactions. We also provide SaaS live chat software that can be utilized independently to facilitate proactive communications between organizations and their customers or integrated easily into our platform.
Our business model is designed to drive organic growth, leverage positive word-of-mouth, and remove friction from the evaluation and purchasing process. We offer a range of subscription account plans for our customer service platform, live chat software, and analytics software that vary in pricing based on functionality, the type and, for our customer service platform, the amount of product support we offer and service-level guarantees.
Our largest source of qualified sales leads is free trials of our customer service platform commenced by prospects. For larger organizations, our sales team focuses on a land and expand strategy, which leverages this grassroots adoption and seeks to expand our footprint within organizations. More recently we are developing and expanding our field sales and marketing teams primarily responsible for lead discovery, qualification, and account management for larger organizations. Many of our existing customers to date have been small to medium sized organizations that make purchasing decisions with limited interaction with our sales or other personnel; as we continue to focus on and become more dependent on sales to larger organizations and increase our investment in paid sources of qualified leads, we expect the percentage of qualified leads that come unpaid sources, such as organic search and customer referrals, to decrease and our sales cycles to lengthen and become less predictable.
In October 2015, we completed the acquisition of WAC. With the acquisition, we added technology that we anticipate will allow our customers to understand the ever-increasing diversity of data about their end customers. Over time, we expect this analytics software to become a core technology within our customer service platform, enabling us to further integrate data analytics capabilities across our products. We also expect to continue to sell our analytics software on a standalone basis.
For the year ended December 31, 2015, 2014, and 2013, our revenue was $208.8 million, $127.0 million, and $72.0 million, respectively, representing a 64% growth rate from 2014 to 2015 and 76% growth rate from 2013 to 2014. For the years ended December 31, 2015, 2014, and 2013 we derived $92.5 million, or 44%, $54.8 million, or 43%, and $29.6 million, or 41%, respectively, of our revenue from customers located outside of the United States. We expect that the rate of growth in our revenue will decline as our business scales, even if our revenue continues to grow in absolute terms. For the years ended December 31, 2015, 2014, and 2013, we generated net losses of $84.1 million, $67.4 million, and $22.6 million, respectively. We intend to invest aggressively to drive continued growth and market leadership.
The growth of our business and our future success depends on many factors, including our ability to continue to innovate, maintain our leadership in the small and medium-sized business, or SMB, market, expand our enterprise customer base, and increase our global customer footprint. While these areas represent significant opportunities for us, we also face significant risks and challenges that we must successfully address in order to sustain the growth of our business and improve our operating results. We anticipate that we will expand our operations and headcount in the near term. The expected addition of new personnel and the investments that we anticipate will be necessary to manage our anticipated growth, including investments in additional capacity in data centers, leasehold improvements and related fixed assets, will make it more difficult for us to achieve profitability. Many of these investments will occur in advance of experiencing any direct benefit and will make it difficult to determine if we are allocating our resources efficiently.
42
We have focused on rapidly growing our business and plan to continue to invest for long-term growth. We expect to continue to invest in additional data center capacity and personnel to support our growth. The amount and timing of these investments will vary based on our estimates of projected growth. We also expect to continue to grow our customer support organization including expanding our product support and professional services teams. While we have moved significant portions of the hosting for our core platform to self-managed colocation data centers, improvements to our gross margin from such move have been partially offset by other hosting expenses, primarily related to the support of our platform infrastructure. Over time, we anticipate that we will continue to gain economies of scale by utilizing capacity within our self-managed colocation data centers, efficient use of other hosting resources, and reducing the need for direct incremental personnel costs resulting from growth in our number of customers. As a result, we expect our gross margin to improve in the future, although our gross margin may fluctuate from period to period as our revenue fluctuates and as a result of the timing and amount of investments to expand our product support team, investments in additional personnel, equipment, and facilities to support our platform architecture, increased share-based compensation expenses, as well as amortization costs associated with acquired intangible assets and capitalized internal-use software.
We expect our operating expenses to continue to increase in absolute dollars in future periods. We have invested, and expect to continue to invest, in our software development efforts to introduce new products, broaden the functionality of our customer service platform, our live chat software, and our analytics software and to further integrate these products and services. We plan to continue to expand our sales and marketing organizations, particularly in connection with our efforts to expand our enterprise customer base. We also expect to incur additional general and administrative costs in order to support the growth of our business and the infrastructure required to comply with our obligations as a public company.
Key Business Metrics
We review a number of operating metrics, including the following key metrics, to evaluate our business, measure our performance, identify trends affecting our business, formulate business plans, and make strategic decisions.
Number of Paid Customer Accounts. We believe that our ability to increase our number of paid accounts on our customer service platform and live chat software is an indicator of our market penetration, the growth of our business, and our potential future business opportunities. We define the number of paid customer accounts as the sum of the number of accounts on our customer service platform, exclusive of our Starter plan, free trials or other free services, and the number of accounts using our live chat software, exclusive of free trials or other free services, each as of the end of the period and as identified by a unique account identifier. Use of our customer service platform and live chat software requires separate subscriptions and each of these accounts are treated as separate paid customer account. Existing customers may also expand their utilization of our customer service platform or live chat software by adding new accounts and a single consolidated organization or customer may have multiple accounts across each of our customer service platform and live chat software to service separate subsidiaries, divisions, or work processes. Each of these accounts is also treated as a separate paid customer account. An increase in the number of paid customer accounts generally correlates to an increase in the number of authorized agents licensed to use our platform, which directly affects our revenue and results of operations. We view growth in this metric as a measure of our success in converting new sales opportunities. We do not currently incorporate accounts using our analytics software into determination of the number of paid customer accounts. We had approximately 69,100 paid customer accounts as of December 31, 2015, including approximately 35,700 paid customer accounts on our customer service platform and approximately 33,400 paid customer accounts using our live chat software. As the total number of paid customer accounts increases, we expect the rate of growth in the number of paid customer accounts to decline.
In the quarter ended December 31, 2015, we introduced our Essential plan for our customer service platform. This plan replaced our Starter plan as the least expensive paid plan on our customer service platform. Following the introduction of our Essential plan, we no longer made our Starter plan available for new accounts. Accounts that subscribe to our Essential plan are included in the determination of the number of paid customer accounts.
Dollar-Based Net Expansion Rate. Our ability to generate revenue is dependent upon our ability to maintain our relationships with our customers and to increase their utilization of our customer service platform. We believe we can achieve this by focusing on delivering value and functionality that retains our existing customers, expands the number of authorized agents associated with an existing paid customer account on our customer service platform, and results in upgrades to higher-priced subscription plans. Maintaining customer relationships allows us to sustain and increase revenue to the extent customers maintain or increase the number of authorized agents licensed to use our customer service platform. We assess our performance in this area by measuring our dollar-based net expansion rate. Our dollar-based net expansion rate provides a measurement of our ability to increase revenue across our existing customer base through expansion of authorized agents associated with a paid customer account on our customer service platform, and upgrades in subscription plan, as offset by churn, contraction in authorized agents associated with a paid customer account on our customer service platform, and downgrades in subscription plans. We do not currently incorporate operating metrics associated with our live chat software or our analytics software into our measurement of dollar-based net expansion rate.
43
Our dollar-based net expansion rate is based upon our monthly recurring revenue for a set of paid customer accounts on our customer service platform. Monthly recurring revenue for a paid customer account is a legal and contractual determination made by assessing the contractual terms of each paid customer account, as of the date of determination, as to the revenue we expect to generate in the next monthly period for that paid customer account, assuming no changes to the subscription and without taking into account any one-time discounts or any platform usage above the subscription base, if any, that may be applicable to such subscription. Monthly recurring revenue is not determined by reference to historical revenue, deferred revenue or any other United States generally accepted accounting principles, or GAAP, financial measure over any period. It is forward-looking and contractually derived as of the date of determination.
We calculate our dollar-based net expansion rate by dividing our retained revenue net of contraction and churn by our base revenue. We define our base revenue as the aggregate monthly recurring revenue of the paid customer accounts on our customer service platform as of the date one year prior to the date of calculation. We define our retained revenue net of contraction and churn as the aggregate monthly recurring revenue of the same customer base included in our measure of base revenue at the end of the annual period being measured. Our dollar-based net expansion rate is also adjusted to eliminate the effect of certain activities that we identify involving the transfer of agents between paid customer accounts, consolidation of customer accounts, or the split of a single paid customer account into multiple paid customer accounts. In addition, our dollar-based net expansion rate is adjusted to include paid customer accounts in the customer base used to determine retained revenue net of contraction and churn that share common corporate information with customers in the customer base that is used to determine our base revenue. Giving effect to this consolidation results in our dollar-based net expansion rate being calculated across approximately 32,300 customers, as compared to the approximately 35,700 total paid customer accounts as of December 31, 2015. To the extent that we can determine that the underlying customers do not share common corporate information, we do not aggregate paid customer accounts associated with reseller and other similar channel arrangements for the purposes of determining our dollar-based net expansion rate. While not material, we believe the failure to account for these activities would otherwise skew our dollar-based net expansion metrics associated with customers that maintain multiple paid customer accounts on our customer service platform and paid customer accounts associated with reseller and other similar channel arrangements.
Our dollar-based net expansion rate was 123% as of December 31, 2015. We expect our dollar-based net expansion rate to decline over time as our aggregate monthly recurring revenue grows.
Components of Results of Operations
Revenue
We derive substantially all of our revenue from subscription services, which are comprised of subscription fees from customer accounts on our customer service platform and, to a lesser extent, live chat and analytics software. Each subscription may have multiple authorized users, and we refer to each such user as an “agent.” The number of agents ranges from one to thousands for various customer accounts. Our pricing is generally established on a per agent basis. We offer a range of subscription account plans that vary in pricing based on functionality and, for our customer service platform, the type and amount of product support, and service-level commitments. Certain arrangements provide for unlimited usage for a fixed fee or incremental fees above a fixed maximum number of monthly agents during the subscription term. We sell subscription services under contractual agreements that vary in length, ranging between one month and multiple years, with the majority of subscriptions having a term of either one month or one year.
Subscription fees are generally non-refundable regardless of the actual use of the service. Subscription revenue is typically affected by the number of customer accounts, number of agents, and the type of plan purchased by our customers, and is recognized ratably over the contractual term of the arrangement beginning on the date that our services are made available to our customers. Subscription services purchased online are typically paid for via a credit card on the date of purchase while subscription services purchased through our internal sales organization are generally billed with monthly, quarterly, or annual payment frequencies. Due to our mixed contract lengths and billing frequencies, the annualized value of the arrangements we enter into with our customers may not be fully reflected in deferred revenue at any single point in time. Accordingly, we do not believe that the change in deferred revenue for any period is an accurate indicator of future revenue for a given period of time. Additionally, because of the mix of payment frequencies and contract lengths, we do not believe that backlog is a meaningful performance metric.
We derive an immaterial amount of revenue from implementation, voice usage, and training services, for which we recognize revenue upon completion.
44
Cost of Revenue, Gross Margin, and Operating Expenses
Cost of Revenue. Cost of revenue consists primarily of personnel costs (including salaries, share-based compensation, and benefits) for employees associated with our platform infrastructure, product support, and professional service organizations, depreciation, hosting, and other expenses associated with our data centers, amortization expense associated with capitalized internal-use software, payment processing fees, third party license fees, amortization expense associated with acquired intangible assets, and allocated shared costs. We allocate shared costs such as facilities, shared information technology and security costs to all departments based on headcount. As such, allocated shared costs are reflected in cost of revenue and each operating expense category.
Currently, we primarily operate out of four self-managed colocation data centers, in which we manage our own network equipment and systems, located in California, Virginia, Ireland, and Germany. Our live chat software was originally hosted in a managed hosting facility in Florida and in January 2015, we migrated all accounts to our self-managed colocation facility in Ireland. In addition, we utilize third-party managed hosting facilities located in North America, Europe, and Asia to support our platform infrastructure, for certain research and development purposes, and to host our analytics software. We intend to increase capacity in self-managed colocation data centers and/or with third-party managed hosting services over time to support our growth.
We intend to continue to invest additional resources in our platform infrastructure, product support, and professional service organizations, through acquisitions and organically. We expect that recent and future business acquisitions will result in increased amortization expense of intangible assets such as acquired technology. As we continue to invest in technology innovation, we expect to incur ongoing capitalized internal-use software costs and related amortization. We expect these investments in technology to not only expand the capability of our customer service platform, live chat software, and analytics software but also increase the efficiency of how we deliver these services, enabling us to improve our gross margin over time. The level and timing of investment in these areas could affect our cost of revenue in the future. To the extent that we continue to rely on third-party technology to provide certain functionality within our products or for certain subscription plans, we expect third- party license fees for technology that is incorporated in such products and subscription plans to remain significant over time as we increase the number of customers using such products and subscription plans.
Gross Margin. Gross margin is gross profit expressed as a percentage of revenue. Our gross margin may fluctuate from period to period as our revenue fluctuates and as a result of the timing and amount of investments to expand our product support and professional services teams, investments in additional personnel, equipment, and facilities to support our platform architecture, increased share-based compensation expenses, as well as the amortization of certain acquired intangible assets and costs associated with capitalized internal-use software. Although we expect that certain third- party technology license fees will remain significant, we expect these costs to decrease over time as we take steps necessary to secure long term access to such technology.
Research and Development. Research and development expenses consist primarily of personnel costs (including salaries, share-based compensation, and benefits) for employees associated with our research and development organization and allocated shared costs.
We focus our research and development efforts on the continued development of our customer service platform, live chat software, and analytics software, including the development and deployment of new features and functionality and enhancements to our software architecture and integration across our products. We expect that, in the future, research and development expenses will increase in absolute dollars. However, we expect our research and development expenses to decrease modestly as a percentage of our revenue in the long-term, although this may fluctuate from period to period depending on fluctuations in revenue and the timing and extent of our research and development expenses. In particular, these expenses are sensitive to the impact of share-based compensation which may cause these expenses to fluctuate from period to period.
Sales and Marketing. Sales and marketing expenses consist of personnel costs (including salaries, commissions, share-based compensation, and benefits) for employees associated with our sales and marketing organizations, costs of marketing activities, and allocated shared costs. Marketing activities include online lead generation, advertising, promotional events, and public and community relations. Sales commissions and other incremental costs to acquire contracts are expensed as incurred.
45
We focus our sales and marketing efforts on generating awareness of our products, establishing and promoting our brand, and cultivating a community of successful and vocal customers. We plan to continue investing in sales and marketing by increasing the number of direct sales employees, developing our field sales and marketing teams, expanding our indirect sales channels, building brand awareness, and sponsoring additional marketing events, which we believe will enable us to add new customers and increase penetration within our existing customer base. Because we do not have a long history of undertaking or growing many of these activities, we cannot predict whether, or to what extent, our revenue will increase as we invest in these strategies. We expect our sales and marketing expenses to continue to increase in absolute dollars and continue to be our largest operating expense category for the foreseeable future. Our sales and marketing expenses as a percentage of our revenue over time may fluctuate from period to period depending on fluctuations in revenue and the timing and extent of our sales and marketing expenses. In particular, these expenses are sensitive to the impact of share-based compensation which may cause these expenses to fluctuate from period to period.
General and Administrative. General and administrative expenses consist primarily of personnel costs (including salaries, share-based compensation, and benefits) for our executive, finance, legal, human resources, and other administrative employees. In addition, general and administrative expenses include fees for third-party professional services, including legal, tax, and accounting services, and other corporate expenses and allocated shared costs.
We expect to incur incremental costs associated with supporting the growth of our business, both in terms of size and geographic expansion, and the infrastructure required to be a public company. Such costs include increases in our finance, legal, and human resources personnel, additional legal, tax, and accounting services fees, insurance costs, board of directors’ compensation and costs of achieving and maintaining compliance with Section 404 of the Sarbanes-Oxley Act of 2002, or the Sarbanes-Oxley Act, executing significant transactions, including acquisitions, and other costs associated with being a public company. As a result, we expect our general and administrative expenses to continue to increase in absolute dollars for the foreseeable future. However, we expect our general and administrative expenses to decrease modestly as a percentage of our revenue in the long-term, although this may fluctuate from period to period depending on fluctuations in revenue and the timing and extent of our general and administrative expenses. In particular, these expenses are sensitive to the impact of share-based compensation which may cause these expenses to fluctuate from period to period.
Other Expense, Net
Other expense, net consists primarily of foreign currency gains (losses) and interest expense associated with our credit facility (terminated in June 2015), offset by interest income from marketable securities.
Provision for (Benefit from) Income Taxes
Provision for (benefit from) income taxes consists of federal and state income taxes in the United States and income taxes in certain foreign jurisdictions. See Note 11 of the Notes to our Consolidated Financial Statements included elsewhere in this Annual Report on Form 10-K.
Results of Operations for Fiscal Years 2015, 2014, and 2013
The following tables set forth our results of operations for the periods presented in dollars and as a percentage of our revenue:
|
|
|
Year Ended December 31, |
|
|||||||||
|
|
|
2015 |
|
|
2014 |
|
|
2013 |
|
|||
|
|
|
(In thousands) |
|
|||||||||
|
Revenue |
|
$ |
208,768 |
|
|
$ |
127,049 |
|
|
$ |
72,045 |
|
|
Cost of revenue (1) |
|
|
67,184 |
|
|
|
46,047 |
|
|
|
24,531 |
|
|
Gross profit |
|
|
141,584 |
|
|
|
81,002 |
|
|
|
47,514 |
|
|
Operating expenses (1): |
|
|
|
|
|
|
|
|
|
|
|
|
|
Research and development |
|
|
62,615 |
|
|
|
36,403 |
|
|
|
15,288 |
|
|
Sales and marketing |
|
|
114,052 |
|
|
|
77,875 |
|
|
|
37,622 |
|
|
General and administrative |
|
|
47,902 |
|
|
|
32,869 |
|
|
|
16,437 |
|
|
Total operating expenses |
|
|
224,569 |
|
|
|
147,147 |
|
|
|
69,347 |
|
|
Operating loss |
|
|
(82,985 |
) |
|
|
(66,145 |
) |
|
|
(21,833 |
) |
|
Other expense, net |
|
|
(729 |
) |
|
|
(1,533 |
) |
|
|
(517 |
) |
|
Loss before provision for (benefit from) income taxes |
|
|
(83,714 |
) |
|
|
(67,678 |
) |
|
|
(22,350 |
) |
|
Provision for (benefit from) income taxes |
|
|
338 |
|
|
|
(263 |
) |
|
|
221 |
|
|
Net loss |
|
$ |
(84,052 |
) |
|
$ |
(67,415 |
) |
|
$ |
(22,571 |
) |
46
(1) Includes share-based compensation expense as follows:
|
|
|
Year Ended December 31, |
|
|||||||||
|
|
|
2015 |
|
|
2014 |
|
|
2013 |
|
|||
|
|
|
(In thousands) |
|
|||||||||
|
Cost of revenue |
|
$ |
4,541 |
|
|
$ |
2,464 |
|
|
$ |
254 |
|
|
Research and development |
|
|
19,414 |
|
|
|
10,918 |
|
|
|
635 |
|
|
Sales and marketing |
|
|
14,759 |
|
|
|
10,680 |
|
|
|
1,210 |
|
|
General and administrative |
|
|
13,842 |
|
|
|
8,077 |
|
|
|
2,755 |
|
|
|
|
Year Ended December 31, |
|
|||||||||
|
|
|
2015 |
|
|
2014 |
|
|
2013 |
|
|||
|
|
|
(As a percentage of revenue) |
|
|||||||||
|
Revenue |
|
|
100.0 |
% |
|
|
100.0 |
% |
|
|
100.0 |
% |
|
Cost of revenue (1) |
|
|
32.2 |
|
|
|
36.2 |
|
|
|
34.0 |
|
|
Gross profit |
|
|
67.8 |
|
|
|
63.8 |
|
|
|
66.0 |
|
|
Operating expenses (1): |
|
|
|
|
|
|
|
|
|
|
|
|
|
Research and development |
|
|
30.0 |
|
|
|
28.7 |
|
|
|
21.2 |
|
|
Sales and marketing |
|
|
54.6 |
|
|
|
61.3 |
|
|
|
52.2 |
|
|
General and administrative |
|
|
22.9 |
|
|
|
25.9 |
|
|
|
22.8 |
|
|
Total operating expenses |
|
|
107.6 |
|
|
|
115.8 |
|
|
|
96.3 |
|
|
Operating loss |
|
|
(39.7 |
) |
|
|
(52.1 |
) |
|
|
(30.3 |
) |
|
Other expense, net |
|
|
(0.3 |
) |
|
|
(1.2 |
) |
|
|
(0.7 |
) |
|
Loss before provision for (benefit from) income taxes |
|
|
(40.1 |
) |
|
|
(53.3 |
) |
|
|
(31.0 |
) |
|
Provision for (benefit from) income taxes |
|
|
0.2 |
|
|
|
(0.2 |
) |
|
|
0.3 |
|
|
Net loss |
|
|
(40.3 |
%) |
|
|
(53.1 |
%) |
|
|
(31.3 |
%) |
|
|
(1) |
Includes share-based compensation expense as follows: |
|
|
|
Year Ended December 31, |
|
|||||||||
|
|
|
2015 |
|
|
2014 |
|
|
2013 |
|
|||
|
|
|
(As a percentage of revenue) |
|
|||||||||
|
Cost of revenue |
|
|
2.2 |
% |
|
|
1.9 |
% |
|
|
0.4 |
% |
|
Research and development |
|
|
9.3 |
|
|
|
8.6 |
|
|
|
0.9 |
|
|
Sales and marketing |
|
|
7.1 |
|
|
|
8.4 |
|
|
|
1.7 |
|
|
General and administrative |
|
|
6.6 |
|
|
|
6.4 |
|
|
|
3.8 |
|
Prior to our IPO, we granted RSUs and certain stock options with both a service condition and a performance condition, or Performance Awards. The service condition for substantially all of the Performance Awards is satisfied over four years. The performance condition was satisfied upon the effectiveness of the registration statement related to our IPO. No share-based compensation expense had been recognized for the Performance Awards prior to the IPO. Upon the satisfaction of the performance condition in May 2014, we recognized a cumulative share-based compensation expense for the portion of the Performance Awards that had met the service condition, with the remaining unrecognized share-based compensation expense recorded over the remaining requisite service period using the accelerated attribution method, net of estimated forfeitures. For the year ended December 31, 2015 and 2014, share-based compensation expense related to the Performance Awards was $6.1 million and $12.7 million, including $0.2 million and $0.9 million in cost of revenue, $4.3 million and $7.8 million in research and development, $1.0 million and $2.4 million in sales and marketing, and $0.6 million and $1.6 million in general and administrative expenses, respectively.
Revenue
|
|
|
Year Ended December 31, |
|
|
2014 to 2015 |
|
|
2013 to 2014 |
|
|||||||||||
|
|
|
2015 |
|
|
2014 |
|
|
2013 |
|
|
% Change |
|
|
% Change |
|
|||||
|
|
|
(In thousands, except percentages) |
|
|||||||||||||||||
|
Revenue |
|
$ |
208,768 |
|
|
$ |
127,049 |
|
|
$ |
72,045 |
|
|
|
64 |
% |
|
|
76 |
% |
47
Revenue increased $81.7 million, or 64%, in 2015 compared to 2014. Of the total increase in revenue, $65.7 million, or 31%, was attributable to revenue from new accounts acquired from January 1, 2015 through December 31, 2015, net of churn and contraction, and $143.1 million, or 69%, was attributable to revenue from accounts existing on or before December 31, 2014, net of churn and contraction.
Revenue increased $55.0 million, or 76%, in 2014 compared to 2013. Of the total increase in revenue, $44.2 million, or 35%, was attributable to revenue from new accounts acquired from January 1, 2014 through December 31, 2014, net of churn and contraction, and $82.8 million, or 65%, was attributable to revenue from accounts existing on or before December 31, 2013, net of churn and contraction.
Historically, we had determined the acquisition date of a customer account based on the date when the account was established. Starting in the quarter ended March 31, 2015, we adjusted the acquisition date of customer accounts to eliminate the effect of certain activities that we identify as involving the transfer of agents from an existing customer account to a new customer account, or the split of an existing customer account into multiple customer accounts. In addition, revenue from customer accounts that share common corporate information is treated as being generated from a single customer account. The acquisition date of customer accounts that share common corporate information is determined using the establishment date of the earliest customer account. The increases in revenue attributable to new and existing accounts from 2013 to 2014 have been retrospectively adjusted to apply the revised customer acquisition date methodology.
Cost of Revenue and Gross Margin
|
|
|
Year Ended December 31, |
|
|
2014 to 2015 |
|
|
2013 to 2014 |
|
|||||||||||
|
|
|
2015 |
|
|
2014 |
|
|
2013 |
|
|
% Change |
|
|
% Change |
|
|||||
|
|
|
(In thousands, except percentages) |
|
|||||||||||||||||
|
Cost of Revenue |
|
$ |
67,184 |
|
|
$ |
46,047 |
|
|
$ |
24,531 |
|
|
|
46 |
% |
|
|
88 |
% |
|
Gross Margin |
|
|
67.8 |
% |
|
|
63.8 |
% |
|
|
66.0 |
% |
|
|
|
|
|
|
|
|
Cost of revenue increased $21.1 million, or 46%, in 2015 compared to 2014. The overall increase was primarily due to increased employee compensation-related costs of $7.4 million driven by our headcount growth, as well as increased depreciation expense and other costs of $4.4 million. The increase in depreciation expense and other costs was due to building out and increasing capacity within our self-managed colocation data centers. The increase was also driven by increased amortization expense associated with capitalized internal-use software of $2.4 million, as we continue to develop additional features and functionalities of our platform. Further contributing to the increased cost of revenue was an increase in allocated shared costs of $2.3 million primarily due to increased facilities and information technology expenses.
Our gross margin increased by 4.0 percentage points in 2015 compared to 2014. The improvement was primarily driven by a decrease of 2.0 percentage points in employee-related compensation costs, and a decrease of 1.5 percentage points in hosting fees as a percentage of revenue. The decreased employee-related compensation costs as a percentage of revenue were due to our ability to increase revenue with a more moderate increase in headcount. The decreased hosting fees as a percentage of revenue reflect increased cost efficiency as we expanded operations in our self-managed colocation data centers.
Cost of revenue increased $21.5 million, or 88%, in 2014 compared to 2013. The overall increase was primarily due to increased employee compensation-related costs of $9.5 million associated with our substantial increase in headcount, share-based compensation expense related to the Performance Awards described above, increased depreciation expense and other costs associated with our self-managed colocation data centers of $2.9 million driven by our investments in building out and increasing capacity within our self-managed colocation data centers, and increased amortization expense associated with capitalized internal-use software of $1.5 million as we continue to develop additional features and functionalities of our platform. Further contributing to the increase was $1.2 million in hosting fees as we increased data center capacity to support our growth, an increase of $1.2 million in amortization expense of acquired intangibles in connection with our acquisition of Zopim, and an increase of $3.4 million in allocated shared costs primarily due to increased facilities expenses.
Our gross margin decreased by 2.2 percentage points in 2014 compared to 2013. The decrease was primarily due to a 2.6 percentage point increase in employee-related compensation costs, driven by increased share-based compensation expense, and a 1.1 percentage point increase in allocated shared costs as a percentage of revenue, offset by a 1.7 percentage point decrease in hosting fees as a percentage of revenue driven by efficiency realized from our investments in building out our self-managed colocation data centers.
48
Research and Development Expenses
|
|
|
Year Ended December 31, |
|
|
2014 to 2015 |
|
|
2013 to 2014 |
|
|||||||||||
|
|
|
2015 |
|
|
2014 |
|
|
2013 |
|
|
% Change |
|
|
% Change |
|
|||||
|
|
|
(In thousands, except percentages) |
|
|||||||||||||||||
|
Research and Development |
|
$ |
62,615 |
|
|
$ |
36,403 |
|
|
$ |
15,288 |
|
|
|
72 |
% |
|
|
138 |
% |
Research and development expenses increased $26.2 million, or 72% in 2015 compared to 2014. The increase was primarily due to an increase of $25.3 million in employee compensation-related costs, driven by our headcount growth, and an increase of $3.0 million in allocated shared costs. These increases were partially offset by a reduction of $3.5 million in share-based compensation expense associated with the Performance Awards described above.
Research and development expenses increased $21.1 million, or 138% in 2014 compared to 2013. The increase was primarily due to an increase of $17.4 million in employee compensation-related costs, driven by our headcount growth and share-based compensation expense related to the Performance Awards described above, and an increase of $2.9 million in allocated shared costs.
Sales and Marketing Expenses
|
|
|
Year Ended December 31, |
|
|
2014 to 2015 |
|
|
2013 to 2014 |
|
|||||||||||
|
|
|
2015 |
|
|
2014 |
|
|
2013 |
|
|
% Change |
|
|
% Change |
|
|||||
|
|
|
(In thousands, except percentages) |
|
|||||||||||||||||
|
Sales and Marketing |
|
$ |
114,052 |
|
|
$ |
77,875 |
|
|
$ |
37,622 |
|
|
|
46 |
% |
|
|
107 |
% |
Sales and marketing expenses increased $36.2 million, or 46%, in 2015 compared to 2014. The overall increase was primarily due to increased employee compensation-related costs of $27.0 million, driven by headcount growth. This increase was partially offset by a decline of $4.1 million in share-based compensation expense related to the accelerated vesting of certain stock options in 2014 and a reduction of $1.4 million in share-based compensation associated with the Performance Awards described above. The overall increase was also driven by increased marketing program costs of $6.9 million, and increased travel expenses of $2.3 million. The increase in marketing program costs was primarily related to internet-based advertising to drive the adoption of our platform and tradeshow events that we sponsor. Additionally, allocated shared costs increased $3.3 million.
Sales and marketing expenses increased $40.3 million, or 107%, in 2014 compared to 2013. The overall increase was primarily due to increased employee compensation-related costs of $24.4 million, increased marketing program costs of $6.8 million, and increased travel expenses of $1.8 million. The 2014 increase in employee compensation-related costs, mainly consisting of salaries, sales commissions, and share-based compensation expense, was driven by the substantial increase in our sales force, share-based compensation expense related to the Performance Awards described above, and $4.1 million in additional share-based compensation expense related to the accelerated vesting of certain stock options. The 2014 increase in marketing program costs was primarily driven by increases in online lead generation marketing programs to drive the adoption of our platform. Additionally, allocated shared costs increased $5.3 million.
General and Administrative Expenses
|
|
|
Year Ended December 31, |
|
|
2014 to 2015 |
|
|
2013 to 2014 |
|
|||||||||||
|
|
|
2015 |
|
|
2014 |
|
|
2013 |
|
|
% Change |
|
|
% Change |
|
|||||
|
|
|
(In thousands, except percentages) |
|
|||||||||||||||||
|
General and Administrative |
|
$ |
47,902 |
|
|
$ |
32,869 |
|
|
$ |
16,437 |
|
|
|
46 |
% |
|
|
100 |
% |
General and administrative expenses increased $15.0 million, or 46%, in 2015 compared to 2014. The overall increase was primarily due to increased employee compensation-related costs of $9.8 million, and an increase in professional and outside services costs of $2.1 million. The increase in employee compensation-related costs was driven by our headcount growth. The increase in professional and outside services costs was driven by increased level of business activities and increased costs of being a public company.
49
General and administrative expenses increased $16.4 million, or 100%, in 2014 compared to 2013. The overall increase was primarily due to increased employee compensation-related costs of $10.4 million and an increase in professional and outside services costs of $2.8 million. The increase in employee compensation-related costs was due to a substantial increase in headcount and share-based compensation expense related to the Performance Awards described above, partially offset by $1.7 million in share-based compensation expense recorded in 2013 related to the accelerated vesting of certain stock options. The increase in professional and outside services costs was driven by increased level of business activities and increased costs of being a public company. Additionally, allocated shared costs increased $2.0 million.
Quarterly Results of Operations
The following unaudited quarterly results of operations data for each of the eight quarters in the two-year period ended December 31, 2015 have been prepared on a basis consistent with our audited consolidated annual financial statements and include, in management’s opinion, all normal recurring adjustments necessary for the fair presentation of the results of operations data for these periods, in accordance with generally accepted accounting principles in the United States. The following quarterly financial data should be read in conjunction with our consolidated financial statements and the related notes included elsewhere in this Annual Report on Form 10-K. The results of historical periods are not necessarily indicative of the results of operations for any future period.
|
|
Three Months Ended |
|
|||||||||||||||||||||||||||||
|
|
Dec 31, |
|
|
Sept 30, |
|
|
June 30, |
|
|
Mar 31, |
|
|
Dec 31, |
|
|
Sep 30, |
|
|
Jun 30, |
|
|
Mar 31, |
|
||||||||
|
|
2015 |
|
|
2015 |
|
|
2015 |
|
|
2015 |
|
|
2014 |
|
|
2014 |
|
|
2014 |
|
|
2014 |
|
||||||||
|
Consolidated Statement of Operations Data: |
|
|
|||||||||||||||||||||||||||||
|
Revenue |
$ |
62,646 |
|
|
$ |
55,661 |
|
|
$ |
48,227 |
|
|
$ |
42,234 |
|
|
$ |
38,541 |
|
|
$ |
33,910 |
|
|
$ |
29,506 |
|
|
$ |
25,092 |
|
|
Cost of revenue (1) |
|
19,693 |
|
|
|
17,039 |
|
|
|
16,162 |
|
|
|
14,290 |
|
|
|
13,637 |
|
|
|
11,684 |
|
|
|
11,731 |
|
|
|
8,995 |
|
|
Gross profit |
|
42,954 |
|
|
|
38,622 |
|
|
|
32,064 |
|
|
|
27,944 |
|
|
|
24,904 |
|
|
|
22,226 |
|
|
|
17,775 |
|
|
|
16,097 |
|
|
Operating expenses (1): |
|
|
|
|
|
|
|
|
|
|
|
|
|
|
|
|
|
|
|
|
|
|
|
|
|
|
|
|
|
|
|
|
Research and development |
|
19,098 |
|
|
|
16,031 |
|
|
|
14,227 |
|
|
|
13,259 |
|
|
|
11,176 |
|
|
|
9,550 |
|
|
|
10,499 |
|
|
|
5,178 |
|
|
Sales and marketing |
|
34,328 |
|
|
|
29,079 |
|
|
|
27,242 |
|
|
|
23,403 |
|
|
|
21,701 |
|
|
|
21,548 |
|
|
|
20,339 |
|
|
|
14,287 |
|
|
General and administrative |
|
13,920 |
|
|
|
12,319 |
|
|
|
11,536 |
|
|
|
10,127 |
|
|
|
9,230 |
|
|
|
8,940 |
|
|
|
8,315 |
|
|
|
6,384 |
|
|
Total operating expenses |
|
67,346 |
|
|
|
57,429 |
|
|
|
53,005 |
|
|
|
46,789 |
|
|
|
42,107 |
|
|
|
40,038 |
|
|
|
39,153 |
|
|
|
25,849 |
|
|
Operating loss |
|
(24,393 |
) |
|
|
(18,807 |
) |
|
|
(20,940 |
) |
|
|
(18,845 |
) |
|
|
(17,203 |
) |
|
|
(17,812 |
) |
|
|
(21,378 |
) |
|
|
(9,752 |
) |
|
Other expense, net |
|
(302 |
) |
|
|
145 |
|
|
|
(342 |
) |
|
|
(230 |
) |
|
|
(282 |
) |
|
|
(343 |
) |
|
|
(450 |
) |
|
|
(458 |
) |
|
Loss before provision for (benefit from) income taxes |
|
(24,694 |
) |
|
|
(18,662 |
) |
|
|
(21,283 |
) |
|
|
(19,075 |
) |
|
|
(17,485 |
) |
|
|
(18,155 |
) |
|
|
(21,828 |
) |
|
|
(10,210 |
) |
|
Provision for (benefit from) income taxes |
|
(216 |
) |
|
|
262 |
|
|
|
199 |
|
|
|
93 |
|
|
|
9 |
|
|
|
(236 |
) |
|
|
(85 |
) |
|
|
49 |
|
|
Net loss |
$ |
(24,478 |
) |
|
$ |
(18,924 |
) |
|
$ |
(21,482 |
) |
|
$ |
(19,168 |
) |
|
$ |
(17,494 |
) |
|
$ |
(17,919 |
) |
|
$ |
(21,743 |
) |
|
$ |
(10,259 |
) |
|
|
(1) |
Share-based compensation expense was allocated as follows: |
|
|
Three Months Ended |
|
|||||||||||||||||||||||||||||
|
|
Dec 31, |
|
|
Sept 30, |
|
|
June 30, |
|
|
Mar 31, |
|
|
Dec 31, |
|
|
Sep 30, |
|
|
Jun 30, |
|
|
Mar 31, |
|
||||||||
|
|
2015 |
|
|
2015 |
|
|
2015 |
|
|
2015 |
|
|
2014 |
|
|
2014 |
|
|
2014 |
|
|
2014 |
|
||||||||
|
|
|
|
|||||||||||||||||||||||||||||
|
Cost of revenue |
$ |
1,405 |
|
|
$ |
1,131 |
|
|
$ |
1,114 |
|
|
$ |
891 |
|
|
$ |
773 |
|
|
$ |
591 |
|
|
$ |
1,010 |
|
|
$ |
90 |
|
|
Research and development |
|
5,930 |
|
|
|
4,974 |
|
|
|
4,446 |
|
|
|
4,064 |
|
|
|
3,388 |
|
|
|
3,052 |
|
|
|
4,168 |
|
|
|
310 |
|
|
Sales and marketing |
|
4,604 |
|
|
|
3,786 |
|
|
|
3,937 |
|
|
|
2,432 |
|
|
|
2,045 |
|
|
|
4,877 |
|
|
|
3,268 |
|
|
|
490 |
|
|
General and administrative |
|
3,559 |
|
|
|
3,551 |
|
|
|
3,890 |
|
|
|
2,842 |
|
|
|
2,308 |
|
|
|
2,298 |
|
|
|
2,537 |
|
|
|
934 |
|
50
|
|
Three Months Ended |
|
|||||||||||||||||||||||||||||
|
|
Dec 31, |
|
|
Sept 30, |
|
|
June 30, |
|
|
Mar 31, |
|
|
Dec 31, |
|
|
Sep 30, |
|
|
Jun 30, |
|
|
Mar 31, |
|
||||||||
|
|
2015 |
|
|
2015 |
|
|
2015 |
|
|
2015 |
|
|
2014 |
|
|
2014 |
|
|
2014 |
|
|
2014 |
|
||||||||
|
Consolidated Statement of Operations Data: |
|
|
|||||||||||||||||||||||||||||
|
Revenue |
|
100.0 |
% |
|
|
100.0 |
% |
|
|
100.0 |
% |
|
|
100.0 |
% |
|
|
100.0 |
% |
|
|
100.0 |
% |
|
|
100.0 |
% |
|
|
100.0 |
% |
|
Cost of revenue (1) |
|
31.4 |
|
|
|
30.6 |
|
|
|
33.5 |
|
|
|
33.8 |
|
|
|
35.4 |
|
|
|
34.5 |
|
|
|
39.8 |
|
|
|
35.8 |
|
|
Gross profit |
|
68.6 |
|
|
|
69.4 |
|
|
|
66.5 |
|
|
|
66.2 |
|
|
|
64.6 |
|
|
|
65.5 |
|
|
|
60.2 |
|
|
|
64.2 |
|
|
Operating expenses (1): |
|
|
|
|
|
|
|
|
|
|
|
|
|
|
|
|
|
|
|
|
|
|
|
|
|
|
|
|
|
|
|
|
Research and development |
|
30.5 |
|
|
|
28.8 |
|
|
|
29.5 |
|
|
|
31.4 |
|
|
|
29.0 |
|
|
|
28.2 |
|
|
|
35.6 |
|
|
|
20.6 |
|
|
Sales and marketing |
|
54.8 |
|
|
|
52.2 |
|
|
|
56.5 |
|
|
|
55.4 |
|
|
|
56.3 |
|
|
|
63.5 |
|
|
|
68.9 |
|
|
|
56.9 |
|
|
General and administrative |
|
22.2 |
|
|
|
22.1 |
|
|
|
23.9 |
|
|
|
24.0 |
|
|
|
23.9 |
|
|
|
26.4 |
|
|
|
28.2 |
|
|
|
25.4 |
|
|
Total operating expenses |
|
107.5 |
|
|
|
103.2 |
|
|
|
109.9 |
|
|
|
110.8 |
|
|
|
109.3 |
|
|
|
118.1 |
|
|
|
132.7 |
|
|
|
103.0 |
|
|
Operating loss |
|
(38.9 |
) |
|
|
(33.8 |
) |
|
|
(43.4 |
) |
|
|
(44.6 |
) |
|
|
(44.6 |
) |
|
|
(52.5 |
) |
|
|
(72.5 |
) |
|
|
(38.9 |
) |
|
Other expense, net |
|
(0.5 |
) |
|
|
0.3 |
|
|
|
(0.7 |
) |
|
|
(0.5 |
) |
|
|
(0.7 |
) |
|
|
(1.0 |
) |
|
|
(1.5 |
) |
|
|
(1.8 |
) |
|
Loss before provision for (benefit from) income taxes |
|
(39.4 |
) |
|
|
(33.5 |
) |
|
|
(44.1 |
) |
|
|
(45.2 |
) |
|
|
(45.4 |
) |
|
|
(53.5 |
) |
|
|
(74.0 |
) |
|
|
(40.7 |
) |
|
Provision for (benefit from) income taxes |
|
(0.3 |
) |
|
|
0.5 |
|
|
|
0.4 |
|
|
|
0.2 |
|
|
|
0.0 |
|
|
|
(0.7 |
) |
|
|
(0.3 |
) |
|
|
0.2 |
|
|
Net loss |
|
(39.1 |
%) |
|
|
(34.0 |
%) |
|
|
(44.5 |
%) |
|
|
(45.4 |
%) |
|
|
(45.4 |
%) |
|
|
(52.8 |
%) |
|
|
(73.7 |
%) |
|
|
(40.9 |
%) |
|
|
(1) |
Includes share-based compensation expense as follows: |
|
|
Three Months Ended |
|
|||||||||||||||||||||||||||||
|
|
Dec 31, |
|
|
Sept 30, |
|
|
June 30, |
|
|
Mar 31, |
|
|
Dec 31, |
|
|
Sep 30, |
|
|
Jun 30, |
|
|
Mar 31, |
|
||||||||
|
|
2015 |
|
|
2015 |
|
|
2015 |
|
|
2015 |
|
|
2014 |
|
|
2014 |
|
|
2014 |
|
|
2014 |
|
||||||||
|
|
|
|
|||||||||||||||||||||||||||||
|
Cost of revenue |
|
2.2 |
% |
|
|
2.0 |
% |
|
|
2.3 |
% |
|
|
2.1 |
% |
|
|
2.0 |
% |
|
|
1.7 |
% |
|
|
3.4 |
% |
|
|
0.4 |
% |
|
Research and development |
|
9.5 |
|
|
|
8.9 |
|
|
|
9.2 |
|
|
|
9.6 |
|
|
|
8.8 |
|
|
|
9.0 |
|
|
|
14.1 |
|
|
|
1.2 |
|
|
Sales and marketing |
|
7.3 |
|
|
|
6.8 |
|
|
|
8.2 |
|
|
|
5.8 |
|
|
|
5.3 |
|
|
|
14.4 |
|
|
|
11.1 |
|
|
|
2.0 |
|
|
General and administrative |
|
5.7 |
|
|
|
6.4 |
|
|
|
8.1 |
|
|
|
6.7 |
|
|
|
6.0 |
|
|
|
6.8 |
|
|
|
8.6 |
|
|
|
3.7 |
|
Quarterly Trends in Revenue and Cost of Revenue
Our quarterly revenue increased sequentially for each period presented, primarily due to sales of new subscriptions to our products and net expansion by our existing customers. We cannot assure you that this pattern of sequential growth in revenue will continue. In future periods, as our rate of revenue growth declines, seasonality in our revenue may become more apparent.
Our gross margin in the first quarter of any fiscal year is negatively impacted relative to the preceding fourth quarter due to the fewer number of days in the first quarter over which we record subscription revenue as compared to the preceding fourth quarter and the fact that certain expenses in our cost of revenue are not sensitive to the number of days in the quarter.
Quarterly Trends in Costs and Expenses
Our quarterly costs and expenses increased sequentially for each period presented, primarily due to increased compensation-related costs related to an increase in headcount in connection with the expansion of our business. In the three months ended June 30, 2014, we recorded share-based compensation expense of $6.1 million related to the Performance Awards. Of the total share-based compensation expense, we recorded $0.6 million in cost of revenue, $3.2 million in research and development, $1.3 million in sales and marketing, and $1.0 million in general and administrative expenses, respectively. In addition, in the three months ended September 30, 2014, we recorded $2.8 million in share-based compensation expense as a component of sales and marketing expenses related to the accelerated vesting of certain stock awards.
Credit Facility
Until its termination in June 2015, we had a credit facility with Silicon Valley Bank consisting of a $20.0 million revolving line of credit and a $10.0 million equipment line of credit. The revolving line of credit bore interest at the prime rate plus 2.0% per annum prior to our IPO and was reduced to the prime rate upon the consummation of our IPO. Borrowings on the equipment line of credit bore interest of 2.5% per annum. In June 2014, we repaid all outstanding principal and accrued interest under the revolving line of credit. In June 2015, we repaid all outstanding principal and interest under the equipment line of credit and terminated the Silicon Valley Bank credit facility.
51
Liquidity and Capital Resources
As of December 31, 2015, our principal sources of liquidity were cash, cash equivalents and marketable securities totaling $268.0 million. Our cash equivalents and marketable securities are comprised of corporate bonds, money market funds, asset backed securities, commercial paper and agency securities.
The following table summarizes our cash flows for the periods indicated:
|
|
|
Year Ended December 31, |
|
|||||||||
|
|
|
2015 |
|
|
2014 |
|
|
2013 |
|
|||
|
Cash provided by operating activities |
|
$ |
5,333 |
|
|
$ |
2,090 |
|
|
$ |
4,005 |
|
|
Cash used in investing activities |
|
|
(72,721 |
) |
|
|
(71,297 |
) |
|
|
(24,186 |
) |
|
Cash provided by financing activities |
|
|
203,107 |
|
|
|
95,768 |
|
|
|
25,216 |
|
To date, we have financed our operations primarily through sales of equity securities. From our inception through December 31, 2015, we have received cash proceeds of $364.7 million from the sale of equity securities, net of issuance costs paid. We have also financed our operations through customer payments for subscription to our customer service platform, live-chat software and analytics software, as well as borrowings under our credit facility. We believe that our existing cash, cash equivalents, and marketable securities balances together with cash generated from operations will be sufficient to meet our working capital and capital expenditure requirements for at least the next 12 months.
Our future capital requirements will depend on many factors including growth in our customer accounts and continued customer expansion, the timing and extent of spending to support product development efforts, the expansion of sales and marketing activities, ongoing investments in our platform infrastructure, and the introduction of new and enhanced products, features and functionality. We may in the future enter into arrangements to acquire or invest in complementary businesses, services and technologies and intellectual property rights. We may be required to seek additional equity or debt financing in order to meet these future capital requirements. In the event that additional financing is required from outside sources, we may not be able to raise it on terms acceptable to us, or at all. If we are unable to raise additional capital when desired, our business, results of operations and financial condition would be adversely affected.
In October 2015, we completed the acquisition of WAC. We acquired 100 percent of the outstanding shares of WAC in exchange for purchase consideration of $46.3 million in cash, including working capital adjustments. As partial security for standard indemnification obligations, $7.0 million of the consideration is held in escrow for a period of up to 18 months, with a portion to be released 12 months following the closing of the acquisition. In connection with the acquisition of WAC, we have also entered into retention arrangements pursuant to which we have issued restricted stock unit awards for an aggregate of approximately 0.5 million shares of our common stock, subject to vesting based on continued employment.
In March 2014, we completed the acquisition of Zopim. The purchase price of approximately $15.8 million ($4.9 million of cash and $10.9 million of our common stock) includes $1.1 million of cash and $2.4 million of common stock consideration held back between 12 and 18 months as partial security for standard indemnification obligations and which are payable in the future under terms specified in the stock purchase agreement. In connection with the acquisition of Zopim, we established a retention plan pursuant to which we will pay up to $13.9 million in cash and equity consideration over two and three years, respectively, to Zopim employees in connection with their continued employment.
Prior to the expiration of the lock-up agreements in connection with our IPO, we had elected to net share settle our RSUs by withholding shares and remitting income tax on behalf of the applicable employees. Upon the expiration of the lock-up agreements in November 2014, we generally began requiring that employees sell a portion of the shares that they receive upon the vesting of RSUs in order to cover any required withholding taxes (sell-to-cover). This sell-to-cover approach reduced our cash outflows.
Operating Activities
Our largest source of operating cash inflows is cash collections from our customers for subscription services. Our primary uses of cash from operating activities are for employee-related expenditures, leased facilities, and hosting fees.
52
Net cash provided by operating activities in 2015 was $5.3 million, reflecting our net loss of $84.1 million, adjusted by non-cash charges including share-based compensation expense of $52.6 million, depreciation and amortization of $19.7 million, and changes in our working capital. The changes in our working capital were primarily attributable to an increase in deferred revenue of $33.9 million due to the growth of our subscription services, an increase in accounts payable and accrued liabilities of $4.2 million due to timing of payments and a higher level of expenses consistent with the overall growth of our business, and an increase in accrued compensation liabilities of $1.7 million primarily due to an increase in headcount and timing of payments. These sources of cash flow were partially offset by an increase in accounts receivable of $15.0 million due to higher customer billings related to the increase in subscription services during the period and an increase in prepaid expenses and other current assets of $8.7 million, primarily due to increases in restricted cash pledged for charitable donation, prepaid subscriptions for software used in our operations, and prepaid rent.
Net cash provided by operating activities in 2014 was $2.1 million, reflecting our net loss of $67.4 million, adjusted by non-cash charges including share-based compensation expense of $32.1 million, depreciation and amortization of $11.5 million, and changes in our working capital. The changes in our working capital were primarily attributable to an increase in deferred revenue of $22.4 million due to the growth of our subscription services, an increase in accrued compensation liabilities of $5.8 million primarily due to a significant increase in headcount and timing of payments, an increase in other assets and liabilities of $1.7 million due to increased deferred rent, and an increase in accounts payable and accrued liabilities of $1.3 million due to timing of payments and a higher level of expenses consistent with the overall growth of our business. These sources of cash flow were partially offset by an increase in accounts receivable of $3.8 million due to higher customer billings related to the increase in subscription services during the period and an increase in prepaid expenses and other current assets of $1.4 million primarily due to increases in prepaid subscriptions of business software.
Net cash provided by operating activities in 2013 was $4.0 million, reflecting our net loss of $22.6 million, adjusted by non-cash charges including depreciation and amortization of $5.2 million, share-based compensation expense of $4.9 million, and changes in our working capital. The changes in our working capital were primarily attributable to an increase in deferred revenue of $13.9 million due to the growth of our subscription services, an increase in accounts payable and accrued liabilities of $4.1 million due to timing of payments and a higher level of expenses consistent with the overall growth of our business, and an increase in accrued compensation liabilities of $2.0 million primarily due to a significant increase in headcount. These sources of cash flow were partially offset by an increase in accounts receivable of $3.6 million due to higher customer billings related to the increase in subscription services during the period and an increase in prepaid expenses and other current assets of $0.3 million primarily due to increases in prepaid rent.
Investing Activities
Net cash used in investing activities in 2015 of $72.7 million was primarily attributable to cash paid for the acquisition of WAC, net of cash acquired of $42.8 million, purchases of property and equipment of $23.0 million primarily associated with hosting equipment to build out our self-managed colocation data centers, capitalized internal-use software costs of $4.7 million associated with the development of additional features and functionality of our platform, purchases of marketable securities of $1.2 million, net of sales and maturities, and payments of $1.1 million in purchase consideration previously held back in connection with the acquisition of Zopim.
Net cash used in investing activities in 2014 of $71.3 million was primarily attributable to purchases of marketable securities of $39.9 million, net of sales and maturities, purchases of property and equipment of $21.7 million primarily associated with leasehold improvements related to our new offices and hosting equipment, capitalized internal-use software costs of $8.0 million associated with the development of additional features and functionality of our platform, and payments of $1.9 million for the acquisition of Zopim, net of cash acquired.
Net cash used in investing activities in 2013 of $24.2 million was primarily attributable to purchases of marketable securities of $12.4 million, purchases of property and equipment of $7.1 million primarily associated with hosting equipment to build out our self-managed colocation data centers, and capitalized internal-use software costs of $4.7 million associated with the development of additional features and functionality of our platform.
Financing Activities
Net cash provided by financing activities in 2015 of $203.1 million was primarily attributable to net proceeds from the follow-on public offering of common stock, net of issuance costs, of $190.1 million, proceeds from exercise of stock options of $10.6 million, and proceeds from our employee stock purchase plan of $9.5 million. Cash provided by financing activities was partially offset by repayment of the outstanding balance under our credit facility of $7.0 million in connection with the termination of our credit facility with Silicon Valley Bank.
53
Net cash provided by financing activities in 2014 of $95.8 million was primarily attributable to net proceeds from our initial public offering of $103.1 million, proceeds from the issuance of common stock associated with our employee equity plans of $11.6 million, and borrowings under our credit facility of $3.9 million. Cash provided by financing activities was partially offset by principal payments on our credit facility of $20.7 million and payments for withholding taxes related to the net share settlement of RSUs of $2.1 million.
Net cash provided by financing activities in 2013 of $25.2 million was primarily attributable to proceeds from borrowings under our credit facility of $23.8 million and proceeds from exercise of stock options of $1.8 million, partially offset by principal payments on capital lease obligations of $0.3 million.
Contractual Obligations and Other Commitments
Our principal commitments consist of obligations under our operating leases for office space, and contractual commitments for hosting and other support services. The following table summarizes our contractual obligations as of December 31, 2015 (in thousands):
|
|
|
Total |
|
|
Less than 1 Year |
|
|
1 to 3 Years |
|
|
3 to 5 Years |
|
|
More than 5 Years |
|
|||||
|
Contractual Obligations: |
|
|
|
|
|
|
|
|
|
|
|
|
|
|
|
|
|
|
|
|
|
Operating lease obligations |
|
$ |
45,280 |
|
|
$ |
8,367 |
|
|
$ |
17,660 |
|
|
$ |
12,653 |
|
|
$ |
6,600 |
|
|
Purchase obligations |
|
|
4,232 |
|
|
|
2,385 |
|
|
|
1,847 |
|
|
|
— |
|
|
|
— |
|
|
Total contractual obligations |
|
$ |
49,512 |
|
|
$ |
10,752 |
|
|
$ |
19,507 |
|
|
$ |
12,653 |
|
|
$ |
6,600 |
|
Off-Balance Sheet Arrangements
Through December 31, 2015, we did not have any relationships with unconsolidated organizations or financial partnerships, such as structured finance or special purpose entities that would have been established for the purpose of facilitating off-balance sheet arrangements or other contractually narrow or limited purposes.
Quantitative and Qualitative Disclosures about Market Risk
Foreign Currency Exchange Risk
We conduct transactions, particularly intercompany transactions, in foreign currencies, primarily the British Pound Sterling, Euro, Australian Dollar, Danish Krone, Singapore Dollar, Japanese Yen, Philippine peso, and Brazilian Real. While we have primarily transacted with customers in the U.S. dollar, we have also historically transacted in foreign currencies for subscriptions to our customer service platform and expect to significantly expand the number of transactions with customers that are denominated in foreign currencies in the near future. Except for our Singapore subsidiary, our international subsidiaries maintain certain monetary assets and current liability balances that are denominated in currencies other than the functional currencies of these entities, which is the U.S. dollar. Our Singapore subsidiary’s functional currency is the Singapore Dollar. Changes in the value of foreign currencies relative to the U.S. dollar can result in fluctuations in our total assets, liabilities, revenue, operating expenses, and cash flows.
Foreign currency gains and losses were not significant for the years ended December 31, 2015, 2014 and 2013. In September 2015, we implemented a hedging program to mitigate the impact of foreign currency fluctuations on our cash flows and earnings. For additional information, see Note 2 of the notes to our consolidated financial statements included elsewhere in this Annual Report on Form 10-K.
Interest Rate Sensitivity
We had cash, cash equivalents and marketable securities totaling $268.0 million at December 31, 2015, of which $73.1 million was invested in corporate bonds, money market funds, asset-backed securities, commercial paper, U.S. treasury securities and agency securities. The cash and cash equivalents are held for working capital purposes. Our investments in marketable securities are made for capital preservation purposes. We do not enter into investments for trading or speculative purposes.
54
Our cash equivalents and our portfolio of marketable securities are subject to market risk due to changes in interest rates. Fixed rate securities may have their market value adversely affected due to a rise in interest rates, while floating rate securities may produce less income than expected if interest rates fall. Due in part to these factors, our future investment income may fluctuate due to changes in interest rates or we may suffer losses in principal if we are forced to sell securities that decline in market value due to changes in interest rates. However because we classify our debt securities as “available for sale,” no gains or losses are recognized due to changes in interest rates unless such securities are sold prior to maturity or declines in fair value are determined to be other-than-temporary.
As of December 31, 2015, an immediate increase of 100-basis points in interest rates would have resulted in a decline in the fair value of our cash equivalents and portfolio of marketable securities of approximately $0.4 million. Fluctuations in the value of our cash equivalents and portfolio of marketable securities caused by a change in interest rates (gains or losses on the carrying value) are recorded in other comprehensive income, and are realized only if we sell the underlying securities prior to maturity or declines in fair value are determined to be other-than-temporary.
Critical Accounting Polices and Estimates
We prepare our consolidated financial statements in accordance with United States generally accepted accounting principles, or GAAP. In the preparation of these consolidated financial statements, we are required to make estimates and assumptions that affect the reported amounts of assets, liabilities, revenue, costs and expenses, and related disclosures. To the extent that there are material differences between these estimates and actual results, our financial condition or results of operations would be affected. We base our estimates on past experience and other assumptions that we believe are reasonable under the circumstances, and we evaluate these estimates on an ongoing basis. We refer to accounting estimates of this type as critical accounting policies and estimates, which we discuss below.
Revenue Recognition
We generate substantially all of our revenue from subscription services, which are comprised of subscription fees from customer accounts on our customer service platform and, to a lesser extent, live chat software and analytics software. In addition, we generate revenue by providing additional features to certain of our subscription plans for a fee that is incremental to the base subscription rate for such plan. Arrangements with customers do not provide the customer with the right to take possession of the software supporting our customer service platform or live chat software at any time, and are therefore accounted for as service contracts. Subscription service arrangements are generally non-cancelable and do not provide for refunds to customers in the event of cancellations or any other right of return. We record revenue net of sales or excise taxes.
We commence revenue recognition when all of the following conditions are met:
|
|
· |
There is persuasive evidence of an arrangement; |
|
|
· |
The service has been or is being provided to the customer; |
|
|
· |
The collection of the fees is reasonably assured; and |
|
|
· |
The amount of fees to be paid by the customer is fixed or determinable. |
Subscription revenue is recognized on a straight-line basis over the contractual term of the arrangement beginning on the date that our service is made available to the customer. Payments received in advance of services being rendered are recorded as deferred revenue and recognized on a straight-line basis over the requisite service period.
Certain customers have arrangements that provide for a maximum number of users over the contract term, with usage measured monthly. Revenue for these arrangements is recognized ratably over the contract terms. Incremental fees are incurred when the maximum number of users is exceeded, and any incremental fees are recognized as revenue ratably over the remaining contractual term.
We derive an immaterial amount of revenue from implementation, voice usage, and training services, for which we recognize revenue upon completion.
55
Capitalized Internal-Use Software Costs
We capitalize certain development costs incurred in connection with software development for our platform and software used in operations. Costs incurred in the preliminary stages of development are expensed as incurred. Once software has reached the development stage, internal and external costs, if direct and incremental, are capitalized until the software is substantially complete and ready for its intended use. Capitalization ceases upon completion of all substantial testing. We also capitalize costs related to specific upgrades and enhancements when it is probable the expenditures will result in additional functionality. Capitalized costs are recorded as part of property and equipment. Maintenance and training costs are expensed as incurred.
Capitalized internal-use software is amortized on a straight-line basis over its estimated useful life and recorded in cost of revenue within the accompanying consolidated statements of operations. The weighted-average useful life of our capitalized internal-use software was 3.0 years as of December 31, 2015. We evaluate the useful lives of these assets and test for impairment whenever events or changes in circumstances occur that could impact the recoverability of these assets. There were no material impairments to internal-use software during the years ended December 31, 2015, 2014 and 2013.
Business Combinations and Valuation of Goodwill and Acquired Intangible Assets
When we acquire a business, we allocate the purchase price to the net tangible and identifiable intangible assets acquired. Any residual purchase price is recorded as goodwill. The allocation of the purchase price requires management to make significant estimates in determining the fair values of assets acquired and liabilities assumed, especially with respect to intangible assets. These estimates can include, but are not limited to, the cash flows that an asset is expected to generate in the future, the appropriate weighted-average cost of capital, and the cost savings expected to be derived from acquiring an asset. These estimates are inherently uncertain and unpredictable.
Goodwill is evaluated for impairment annually in the third quarter, and whenever events or changes in circumstances indicate the carrying value of goodwill may not be recoverable. Triggering events that may indicate impairment include, but are not limited to, a significant adverse change in customer demand or business climate or a significant decrease in expected cash flows. Goodwill is evaluated for impairment at the consolidated level, as we operate as a single reporting unit.
Acquired intangible assets consist of identifiable intangible assets, primarily developed technology and customer relationships, resulting from our acquisitions. Acquired intangible assets are recorded at fair value on the date of acquisition and amortized over their estimated useful lives following the pattern in which the economic benefits of the assets will be consumed, generally straight-line. The carrying amounts of our acquired intangible assets are periodically reviewed for impairment whenever events or changes in circumstances indicate that the carrying value of these assets may not be recoverable or that the useful life is shorter than originally estimated.
Share-Based Compensation
Share-based compensation expense to employees is measured based on the fair value of the awards on the grant date and recognized in our consolidated statements of operations over the period during which the employee is required to perform services in exchange for the award (generally the vesting period of the award). We estimate the fair value of stock options granted using the Black-Scholes option valuation model. We measure the fair value of restricted stock units, or RSUs, based on the fair value of the underlying shares on the date of grant. Compensation expense for awards with only service conditions is recognized over the vesting period of the applicable award using the straight-line method.
Prior to our IPO, we granted Performance Awards to our employees that vested upon the satisfaction of both a service condition, generally over four years, and a performance condition. The performance condition, defined as a qualifying liquidation event, was satisfied upon the effectiveness of the registration statement related to our IPO. No share-based compensation expense had been recognized for the Performance Awards prior to the IPO as such qualifying liquidation event was not deemed probable until that time. Upon the satisfaction of the performance condition, we recognized a cumulative share-based compensation expense for the portion of the Performance Awards that had met the service condition, with the remaining unrecognized share-based compensation expense recorded over the remaining requisite service period using the accelerated attribution method, net of estimated forfeitures. Share-based compensation expense related to the Performance Awards was $6.1 million and $12.7 million, for the years ended December 31, 2015 and 2014, respectively.
We estimate the fair value of stock options granted using the Black-Scholes option valuation model, which requires assumptions, including the fair value of our underlying common stock, expected term, expected volatility, risk-free interest rate and dividend yield of our common stock. These estimates involve inherent uncertainties and the application of management’s judgment. If factors change and different assumptions are used, our share-based compensation expense could be materially different in the future.
56
These assumptions are estimated as follows:
|
|
· |
Expected Term. We determine the expected term based on the average period the stock options are expected to remain outstanding generally calculated as the midpoint of the stock options vesting term and contractual expiration period, as we do not have sufficient historical information to develop reasonable expectations about future exercise patterns and post-vesting employment termination behavior. |
|
|
· |
Expected Volatility. We determine the price volatility factor based on the historical volatility of publicly traded industry peers. To determine our peer group of companies, we consider public companies in the technology industry and select those that are similar to us in size, stage of life cycle, and financial leverage. We do not rely on implied volatilities of traded options in our industry peers’ common stock because the volume of activity is relatively low. We intend to continue to consistently apply this methodology using the same or similar public companies until sufficient historical information regarding the volatility of our own common stock price becomes available, or unless circumstances change such that the identified companies are no longer similar to us, in which case, more suitable companies whose share prices are publicly available would be utilized in the calculation. |
|
|
· |
Risk-Free Interest Rate. We base the risk-free interest rate used in the Black-Scholes valuation model on the yield available on U.S. Treasury zero-coupon issues with an equivalent remaining term of the stock options for each stock option group |
|
|
· |
Dividend Yield. We have not paid and do not anticipate paying any cash dividends in the foreseeable future and, therefore, use an expected dividend yield of zero. |
The following table summarizes the assumptions, other than fair value of our common stock, relating to our stock options granted in the year ended December 31, 2015, 2014, and 2013:
|
|
|
Year Ended December 31, |
|
|||||||||
|
|
|
2015 |
|
|
2014 |
|
|
2013 |
|
|||
|
Expected volatility |
|
49% - 54% |
|
|
54% - 56% |
|
|
50% - 63% |
|
|||
|
Dividend rate |
|
|
0% |
|
|
|
0% |
|
|
|
0% |
|
|
Risk-free interest rate |
|
1.4% - 2.0% |
|
|
1.75% - 2.02% |
|
|
0.63% - 2.02% |
|
|||
|
Expected term (in years) |
|
6.02 - 6.08 |
|
|
6.02 - 6.50 |
|
|
4.47 - 6.27 |
|
|||
In addition to the assumptions used in the Black-Scholes option valuation model, we must also estimate a forfeiture rate to calculate the share-based compensation expense for our awards. Our forfeiture rate is based on an analysis of our actual forfeitures. We will continue to evaluate the appropriateness of the forfeiture rate based on actual forfeiture experience, analysis of employee turnover, and other factors. Changes in the estimated forfeiture rate can have a significant impact on our share-based compensation expense as the cumulative effect of adjusting the rate is recognized in the period the forfeiture estimate is changed. If a revised forfeiture rate is higher than the previously estimated forfeiture rate, an adjustment is made that will result in a decrease to the share-based compensation expense recognized in our financial statements. If a revised forfeiture rate is lower than the previously estimated forfeiture rate, an adjustment is made that will result in an increase to the share-based compensation expense recognized in our financial statements.
We will continue to use judgment in evaluating the expected volatility, expected term, and forfeiture rate utilized in our share-based compensation expense calculations on a prospective basis. As we continue to accumulate additional data related to our common stock, we may refine our estimates of expected volatility, expected term, and forfeiture rates, which could materially impact our future share-based compensation expense.
Recently Issued and Adopted Accounting Pronouncements
Refer to Note 2 of the notes to our consolidated financial statements included elsewhere in this Annual Report on Form 10-K for a summary of recently issued and adopted accounting pronouncements.
57
Item 8. Financial Statements and Supplementary Data.
ZENDESK, INC.
INDEX TO CONSOLIDATED FINANCIAL STATEMENTS
58
Report of Ernst & Young, LLP, Independent Registered Public Accounting Firm
The Board of Directors and Stockholders of Zendesk, Inc.
We have audited the accompanying consolidated balance sheets of Zendesk, Inc. as of December 31, 2015 and 2014, and the related consolidated statements of operations, comprehensive loss, redeemable convertible preferred stock and stockholders’ equity (deficit) and cash flows for each of the three years in the period ended December 31, 2015. These financial statements are the responsibility of the Company's management. Our responsibility is to express an opinion on these financial statements based on our audits.
We conducted our audits in accordance with the standards of the Public Company Accounting Oversight Board (United States). Those standards require that we plan and perform the audit to obtain reasonable assurance about whether the financial statements are free of material misstatement. An audit includes examining, on a test basis, evidence supporting the amounts and disclosures in the financial statements. An audit also includes assessing the accounting principles used and significant estimates made by management, as well as evaluating the overall financial statement presentation. We believe that our audits provide a reasonable basis for our opinion.
In our opinion, the financial statements referred to above present fairly, in all material respects, the consolidated financial position of Zendesk, Inc. at December 31, 2015 and 2014, and the consolidated results of its operations and its cash flows for each of the three years in the period ended December 31, 2015, in conformity with U.S. generally accepted accounting principles.
We also have audited, in accordance with the standards of the Public Company Accounting Oversight Board (United States), Zendesk Inc.'s internal control over financial reporting as of December 31, 2015, based on criteria established in Internal Control – Integrated Framework issued by the Committee of Sponsoring Organizations of the Treadway Commission (2013 framework) and our report dated February 26, 2016 expressed an unqualified opinion thereon.
/s/ Ernst & Young LLP
Redwood City, CA
February 26, 2016
59
Report of Ernst & Young, LLP, Independent Registered Public Accounting Firm
The Board of Directors and Stockholders of Zendesk, Inc.
We have audited Zendesk, Inc.’s internal control over financial reporting as of December 31, 2015, based on criteria established in Internal Control—Integrated Framework issued by the Committee of Sponsoring Organizations of the Treadway Commission (2013 framework), (“the COSO criteria”). Zendesk Inc.’s management is responsible for maintaining effective internal control over financial reporting, and for its assessment of the effectiveness of internal control over financial reporting included in the accompanying Management’s Report on Internal Control over Financial Reporting. Our responsibility is to express an opinion on the company’s internal control over financial reporting based on our audit.
We conducted our audit in accordance with the standards of the Public Company Accounting Oversight Board (United States). Those standards require that we plan and perform the audit to obtain reasonable assurance about whether effective internal control over financial reporting was maintained in all material respects. Our audit included obtaining an understanding of internal control over financial reporting, assessing the risk that a material weakness exists, testing and evaluating the design and operating effectiveness of internal control based on the assessed risk, and performing such other procedures as we considered necessary in the circumstances. We believe that our audit provides a reasonable basis for our opinion.
A company’s internal control over financial reporting is a process designed to provide reasonable assurance regarding the reliability of financial reporting and the preparation of financial statements for external purposes in accordance with generally accepted accounting principles. A company’s internal control over financial reporting includes those policies and procedures that (1) pertain to the maintenance of records that, in reasonable detail, accurately and fairly reflect the transactions and dispositions of the assets of the company; (2) provide reasonable assurance that transactions are recorded as necessary to permit preparation of financial statements in accordance with generally accepted accounting principles, and that receipts and expenditures of the company are being made only in accordance with authorizations of management and directors of the company; and (3) provide reasonable assurance regarding prevention or timely detection of unauthorized acquisition, use, or disposition of the company’s assets that could have a material effect on the financial statements.
Because of its inherent limitations, internal control over financial reporting may not prevent or detect misstatements. Also, projections of any evaluation of effectiveness to future periods are subject to the risk that controls may become inadequate because of changes in conditions, or that the degree of compliance with the policies or procedures may deteriorate.
In our opinion, Zendesk, Inc. maintained, in all material respects, effective internal control over financial reporting as of December 31, 2015, based on the COSO criteria.
We also have audited, in accordance with the standards of the Public Company Accounting Oversight Board (United States), the 2015 consolidated financial statements of Zendesk Inc. and our report dated February 26, 2016 expressed an unqualified opinion thereon.
/s/ Ernst & Young LLP
Redwood City, California
February 26, 2016
60
(In thousands, except par value and shares)
|
|
|
December 31, |
|
|
December 31, |
|
||
|
|
|
2015 |
|
|
2014 |
|
||
|
Assets |
|
|
|
|
|
|
|
|
|
Current assets: |
|
|
|
|
|
|
|
|
|
Cash and cash equivalents |
|
$ |
216,226 |
|
|
$ |
80,265 |
|
|
Marketable securities |
|
|
29,414 |
|
|
|
42,204 |
|
|
Accounts receivable, net of allowance for doubtful accounts of $763 and $264 as of December 31, 2015 and 2014, respectively |
|
|
26,168 |
|
|
|
11,523 |
|
|
Prepaid expenses and other current assets |
|
|
11,423 |
|
|
|
5,013 |
|
|
Total current assets |
|
|
283,231 |
|
|
|
139,005 |
|
|
Marketable securities, noncurrent |
|
|
22,336 |
|
|
|
9,205 |
|
|
Property and equipment, net |
|
|
56,540 |
|
|
|
41,895 |
|
|
Goodwill and intangible assets, net |
|
|
57,050 |
|
|
|
14,152 |
|
|
Other assets |
|
|
3,529 |
|
|
|
1,531 |
|
|
Total assets |
|
$ |
422,686 |
|
|
$ |
205,788 |
|
|
|
|
|
|
|
|
|
|
|
|
Liabilities and stockholders’ equity |
|
|
|
|
|
|
|
|
|
Current liabilities: |
|
|
|
|
|
|
|
|
|
Accounts payable |
|
$ |
9,332 |
|
|
$ |
4,763 |
|
|
Accrued liabilities |
|
|
9,742 |
|
|
|
7,689 |
|
|
Accrued compensation and related benefits |
|
|
14,115 |
|
|
|
11,738 |
|
|
Deferred revenue |
|
|
84,210 |
|
|
|
50,908 |
|
|
Current portion of credit facility |
|
|
— |
|
|
|
3,041 |
|
|
Current portion of capital leases |
|
|
— |
|
|
|
10 |
|
|
Total current liabilities |
|
|
117,399 |
|
|
|
78,149 |
|
|
Deferred revenue, noncurrent |
|
|
1,405 |
|
|
|
823 |
|
|
Credit facility, noncurrent |
|
|
— |
|
|
|
3,911 |
|
|
Other liabilities |
|
|
10,592 |
|
|
|
9,199 |
|
|
Total liabilities |
|
|
129,396 |
|
|
|
92,082 |
|
|
Commitments and contingencies (Note 8) |
|
|
|
|
|
|
|
|
|
Stockholders’ equity: |
|
|
|
|
|
|
|
|
|
Preferred stock, par value $0.01 per share: no shares issued or outstanding; 10.0 million shares authorized as of December 31, 2015 and 2014 |
|
|
— |
|
|
|
— |
|
|
Common stock, par value $0.01 per share: 400.0 million shares authorized; 90.9 million and 76.1 million shares issued; 90.3 million and 75.5 million shares outstanding as of December 31, 2015 and 2014, respectively (including 0.3 million and 0.6 million shares subject to repurchase, legally issued and outstanding as of December 31, 2015 and 2014, respectively) |
|
|
905 |
|
|
|
755 |
|
|
Additional paid-in capital |
|
|
511,183 |
|
|
|
246,000 |
|
|
Accumulated other comprehensive loss |
|
|
(2,225 |
) |
|
|
(528 |
) |
|
Accumulated deficit |
|
|
(215,921 |
) |
|
|
(131,869 |
) |
|
Treasury stock at cost; 0.5 million shares as of December 31, 2015 and 2014 |
|
|
(652 |
) |
|
|
(652 |
) |
|
Total stockholders’ equity |
|
|
293,290 |
|
|
|
113,706 |
|
|
Total liabilities and stockholders’ equity |
|
$ |
422,686 |
|
|
$ |
205,788 |
|
See Notes to Consolidated Financial Statements.
61
CONSOLIDATED STATEMENTS OF OPERATIONS
(In thousands, except per share data)
|
|
|
Year Ended December 31, |
|
|||||||||
|
|
|
2015 |
|
|
2014 |
|
|
2013 |
|
|||
|
|
|
|
|
|
|
|
|
|
|
|
|
|
|
Revenue |
|
$ |
208,768 |
|
|
$ |
127,049 |
|
|
$ |
72,045 |
|
|
Cost of revenue (1) |
|
|
67,184 |
|
|
|
46,047 |
|
|
|
24,531 |
|
|
Gross profit |
|
|
141,584 |
|
|
|
81,002 |
|
|
|
47,514 |
|
|
Operating expenses (1): |
|
|
|
|
|
|
|
|
|
|
|
|
|
Research and development |
|
|
62,615 |
|
|
|
36,403 |
|
|
|
15,288 |
|
|
Sales and marketing |
|
|
114,052 |
|
|
|
77,875 |
|
|
|
37,622 |
|
|
General and administrative |
|
|
47,902 |
|
|
|
32,869 |
|
|
|
16,437 |
|
|
Total operating expenses |
|
|
224,569 |
|
|
|
147,147 |
|
|
|
69,347 |
|
|
Operating loss |
|
|
(82,985 |
) |
|
|
(66,145 |
) |
|
|
(21,833 |
) |
|
Other expense, net |
|
|
(729 |
) |
|
|
(1,533 |
) |
|
|
(517 |
) |
|
Loss before provision for (benefit from) income taxes |
|
|
(83,714 |
) |
|
|
(67,678 |
) |
|
|
(22,350 |
) |
|
Provision for (benefit from) income taxes |
|
|
338 |
|
|
|
(263 |
) |
|
|
221 |
|
|
Net loss |
|
|
(84,052 |
) |
|
|
(67,415 |
) |
|
|
(22,571 |
) |
|
Accretion of redeemable convertible preferred stock |
|
|
— |
|
|
|
(18 |
) |
|
|
(49 |
) |
|
Net loss attributable to common stockholders |
|
$ |
(84,052 |
) |
|
$ |
(67,433 |
) |
|
$ |
(22,620 |
) |
|
|
|
|
|
|
|
|
|
|
|
|
|
|
|
Net loss per share attributable to common stockholders, basic and diluted |
|
$ |
(0.99 |
) |
|
$ |
(1.26 |
) |
|
$ |
(1.04 |
) |
|
Weighted-average shares used to compute net loss per share attributable to common stockholders, basic and diluted |
|
|
84,926 |
|
|
|
53,571 |
|
|
|
21,674 |
|
|
__________ |
|
|
|
|
|
|
|
|
|
|
|
|
|
(1) Includes share-based compensation expense as follows: |
|
|
|
|
|
|
|
|
|
|
|
|
|
|
|
Year Ended December 31, |
|
|||||||||
|
|
|
2015 |
|
|
2014 |
|
|
2013 |
|
|||
|
Cost of revenue |
|
$ |
4,541 |
|
|
$ |
2,464 |
|
|
$ |
254 |
|
|
Research and development |
|
|
19,414 |
|
|
|
10,918 |
|
|
|
635 |
|
|
Sales and marketing |
|
|
14,759 |
|
|
|
10,680 |
|
|
|
1,210 |
|
|
General and administrative |
|
|
13,842 |
|
|
|
8,077 |
|
|
|
2,755 |
|
See Notes to Consolidated Financial Statements.
62
CONSOLIDATED STATEMENTS OF COMPREHENSIVE LOSS
(In thousands)
|
|
|
Year Ended December 31, |
|
|||||||||
|
|
|
2015 |
|
|
2014 |
|
|
2013 |
|
|||
|
|
|
|
|
|
|
|
|
|
|
|
|
|
|
Net loss |
|
$ |
(84,052 |
) |
|
$ |
(67,415 |
) |
|
$ |
(22,571 |
) |
|
Other comprehensive loss, net of tax: |
|
|
|
|
|
|
|
|
|
|
|
|
|
Net change in unrealized gain (loss) on available-for-sale investments |
|
|
(44 |
) |
|
|
(71 |
) |
|
|
10 |
|
|
Foreign currency translation loss |
|
|
(942 |
) |
|
|
(467 |
) |
|
|
— |
|
|
Net change in unrealized loss on derivative instruments |
|
|
(711 |
) |
|
|
— |
|
|
|
— |
|
|
Comprehensive loss |
|
$ |
(85,749 |
) |
|
$ |
(67,953 |
) |
|
$ |
(22,561 |
) |
See Notes to Consolidated Financial Statements.
63
CONSOLIDATED STATEMENTS OF REDEEMABLE CONVERTIBLE
PREFERRED STOCK AND STOCKHOLDERS’ EQUITY (DEFICIT)
(In thousands)
|
|
|
|
|
|
|
|
|
|
|
Stockholders’ Equity (Deficit) |
|
|||||||||||||||||||||||||||||
|
|
|
|
|
|
|
|
|
|
|
|
|
|
|
|
|
|
|
|
|
|
|
|
|
|
|
|
|
|
|
Accumulated |
|
|
|
|
|
|
|
|
|
|
|
|
|
Redeemable Convertible |
|
|
|
|
|
|
|
|
|
|
Additional |
|
|
|
|
|
|
|
|
|
|
Other |
|
|
|
|
|
|
Total |
|
||||||||
|
|
|
Preferred Stock |
|
|
Common Stock |
|
|
Paid-In |
|
|
Treasury Stock |
|
|
Comprehensive |
|
|
Accumulated |
|
|
Stockholders’ |
|
|||||||||||||||||||
|
|
|
Shares |
|
|
Amount |
|
|
Shares |
|
|
Amount |
|
|
Capital |
|
|
Shares |
|
|
Amount |
|
|
Income (loss) |
|
|
Deficit |
|
|
Equity (Deficit) |
|
||||||||||
|
Balances as of December 31, 2012 |
|
|
23,598 |
|
|
|
71,320 |
|
|
|
23,238 |
|
|
|
212 |
|
|
|
12,118 |
|
|
|
(535 |
) |
|
|
(652 |
) |
|
|
— |
|
|
|
(41,883 |
) |
|
|
(30,205 |
) |
|
Issuance of common stock upon exercise of stock options |
|
|
— |
|
|
|
— |
|
|
|
765 |
|
|
|
8 |
|
|
|
673 |
|
|
|
— |
|
|
|
— |
|
|
|
— |
|
|
|
— |
|
|
|
681 |
|
|
Issuance of common stock upon early exercise of stock options |
|
|
— |
|
|
|
— |
|
|
|
164 |
|
|
|
— |
|
|
|
— |
|
|
|
— |
|
|
|
— |
|
|
|
— |
|
|
|
— |
|
|
|
— |
|
|
Vesting of early exercised stock options |
|
|
— |
|
|
|
— |
|
|
|
— |
|
|
|
9 |
|
|
|
852 |
|
|
|
— |
|
|
|
— |
|
|
|
— |
|
|
|
— |
|
|
|
861 |
|
|
Repurchase of common stock |
|
|
— |
|
|
|
— |
|
|
|
(457 |
) |
|
|
— |
|
|
|
— |
|
|
|
— |
|
|
|
— |
|
|
|
— |
|
|
|
— |
|
|
|
— |
|
|
Share-based compensation |
|
|
— |
|
|
|
— |
|
|
|
— |
|
|
|
— |
|
|
|
4,997 |
|
|
|
— |
|
|
|
— |
|
|
|
— |
|
|
|
— |
|
|
|
4,997 |
|
|
Accretion of redeemable convertible preferred stock |
|
|
— |
|
|
|
49 |
|
|
|
— |
|
|
|
— |
|
|
|
(49 |
) |
|
|
— |
|
|
|
— |
|
|
|
— |
|
|
|
— |
|
|
|
(49 |
) |
|
Unrealized gain on investment |
|
|
— |
|
|
|
— |
|
|
|
— |
|
|
|
— |
|
|
|
— |
|
|
|
— |
|
|
|
— |
|
|
|
10 |
|
|
|
— |
|
|
|
10 |
|
|
Net loss |
|
|
— |
|
|
|
— |
|
|
|
— |
|
|
|
— |
|
|
|
— |
|
|
|
— |
|
|
|
— |
|
|
|
— |
|
|
|
(22,571 |
) |
|
|
(22,571 |
) |
|
Balances as of December 31, 2013 |
|
|
23,598 |
|
|
|
71,369 |
|
|
|
23,710 |
|
|
|
229 |
|
|
|
18,591 |
|
|
|
(535 |
) |
|
|
(652 |
) |
|
|
10 |
|
|
|
(64,454 |
) |
|
|
(46,276 |
) |
|
Issuance of common stock upon initial public offering, net of issuance costs |
|
|
— |
|
|
|
— |
|
|
|
12,778 |
|
|
|
128 |
|
|
|
102,962 |
|
|
|
— |
|
|
|
— |
|
|
|
— |
|
|
|
— |
|
|
|
103,090 |
|
|
Accretion of redeemable convertible preferred stock |
|
|
— |
|
|
|
18 |
|
|
|
— |
|
|
|
— |
|
|
|
(18 |
) |
|
|
— |
|
|
|
— |
|
|
|
— |
|
|
|
— |
|
|
|
(18 |
) |
|
Conversion of preferred stock to common stock upon initial public offering |
|
|
(23,598 |
) |
|
|
(71,387 |
) |
|
|
34,323 |
|
|
|
343 |
|
|
|
71,044 |
|
|
|
— |
|
|
|
— |
|
|
|
— |
|
|
|
— |
|
|
|
71,387 |
|
|
Issuance of common stock for acquisition of Zopim |
|
|
— |
|
|
|
— |
|
|
|
902 |
|
|
|
9 |
|
|
|
10,883 |
|
|
|
— |
|
|
|
— |
|
|
|
— |
|
|
|
— |
|
|
|
10,892 |
|
|
Issuance of common stock upon exercise of stock options |
|
|
— |
|
|
|
— |
|
|
|
3,207 |
|
|
|
32 |
|
|
|
4,938 |
|
|
|
— |
|
|
|
— |
|
|
|
— |
|
|
|
— |
|
|
|
4,970 |
|
|
Issuance of common stock for settlement of restricted stock units (RSUs) |
|
|
— |
|
|
|
— |
|
|
|
517 |
|
|
|
5 |
|
|
|
(5 |
) |
|
|
— |
|
|
|
— |
|
|
|
— |
|
|
|
— |
|
|
|
— |
|
|
Shares withheld related to net share settlement of RSUs |
|
|
— |
|
|
|
— |
|
|
|
(147 |
) |
|
|
(1 |
) |
|
|
(2,117 |
) |
|
|
— |
|
|
|
— |
|
|
|
— |
|
|
|
— |
|
|
|
(2,118 |
) |
|
Issuance of common stock upon early exercise of stock options |
|
|
— |
|
|
|
— |
|
|
|
309 |
|
|
|
— |
|
|
|
— |
|
|
|
— |
|
|
|
— |
|
|
|
— |
|
|
|
— |
|
|
|
— |
|
|
Vesting of early exercised stock options |
|
|
— |
|
|
|
— |
|
|
|
— |
|
|
|
5 |
|
|
|
1,507 |
|
|
|
— |
|
|
|
— |
|
|
|
— |
|
|
|
— |
|
|
|
1,512 |
|
|
Issuance of common stock in connection with employee stock purchase plans |
|
|
— |
|
|
|
— |
|
|
|
428 |
|
|
|
4 |
|
|
|
3,267 |
|
|
|
— |
|
|
|
— |
|
|
|
— |
|
|
|
— |
|
|
|
3,271 |
|
|
Issuance of common stock upon exercise of warrants |
|
|
— |
|
|
|
— |
|
|
|
111 |
|
|
|
1 |
|
|
|
(1 |
) |
|
|
— |
|
|
|
— |
|
|
|
— |
|
|
|
— |
|
|
|
— |
|
|
Repurchase of common stock |
|
|
— |
|
|
|
— |
|
|
|
(4 |
) |
|
|
— |
|
|
|
— |
|
|
|
— |
|
|
|
— |
|
|
|
— |
|
|
|
— |
|
|
|
— |
|
|
Share-based compensation |
|
|
— |
|
|
|
— |
|
|
|
— |
|
|
|
— |
|
|
|
34,615 |
|
|
|
— |
|
|
|
— |
|
|
|
— |
|
|
|
— |
|
|
|
34,615 |
|
|
Tax benefit from share-based award activity |
|
|
— |
|
|
|
— |
|
|
|
— |
|
|
|
— |
|
|
|
334 |
|
|
|
— |
|
|
|
— |
|
|
|
— |
|
|
|
— |
|
|
|
334 |
|
|
Other comprehensive loss, net of income taxes |
|
|
— |
|
|
|
— |
|
|
|
— |
|
|
|
— |
|
|
|
— |
|
|
|
— |
|
|
|
— |
|
|
|
(538 |
) |
|
|
— |
|
|
|
(538 |
) |
|
Net loss |
|
|
— |
|
|
|
— |
|
|
|
— |
|
|
|
— |
|
|
|
— |
|
|
|
— |
|
|
|
— |
|
|
|
— |
|
|
|
(67,415 |
) |
|
|
(67,415 |
) |
|
Balances as of December 31, 2014 |
|
|
— |
|
|
|
— |
|
|
|
76,134 |
|
|
|
755 |
|
|
|
246,000 |
|
|
|
(535 |
) |
|
|
(652 |
) |
|
|
(528 |
) |
|
|
(131,869 |
) |
|
|
113,706 |
|
|
Issuance of common stock from follow-on public offering, net of issuance costs |
|
|
— |
|
|
|
— |
|
|
|
8,780 |
|
|
|
88 |
|
|
|
190,008 |
|
|
|
— |
|
|
|
— |
|
|
|
— |
|
|
|
— |
|
|
|
190,096 |
|
|
Issuance of common stock upon exercise of stock options |
|
|
— |
|
|
|
— |
|
|
|
3,275 |
|
|
|
33 |
|
|
|
10,580 |
|
|
|
— |
|
|
|
— |
|
|
|
— |
|
|
|
— |
|
|
|
10,613 |
|
|
Issuance of common stock for settlement of RSUs |
|
|
— |
|
|
|
— |
|
|
|
1,655 |
|
|
|
17 |
|
|
|
(626 |
) |
|
|
— |
|
|
|
— |
|
|
|
— |
|
|
|
— |
|
|
|
(609 |
) |
|
Vesting of early exercised stock options |
|
|
— |
|
|
|
— |
|
|
|
|
|
|
|
|
|
|
|
1,046 |
|
|
|
|
|
|
|
|
|
|
|
|
|
|
|
|
|
|
|
1,046 |
|
|
Issuance of common stock in connection with employee stock purchase plans |
|
|
— |
|
|
|
— |
|
|
|
1,019 |
|
|
|
12 |
|
|
|
9,363 |
|
|
|
— |
|
|
|
— |
|
|
|
— |
|
|
|
— |
|
|
|
9,375 |
|
|
Repurchase of common stock |
|
|
— |
|
|
|
— |
|
|
|
(2 |
) |
|
|
|
|
|
|
|
|
|
|
— |
|
|
|
— |
|
|
|
— |
|
|
|
— |
|
|
|
- |
|
|
Share-based compensation |
|
|
— |
|
|
|
— |
|
|
|
— |
|
|
|
— |
|
|
|
54,363 |
|
|
|
— |
|
|
|
— |
|
|
|
— |
|
|
|
— |
|
|
|
54,363 |
|
|
Tax benefit from share-based award activity |
|
|
— |
|
|
|
— |
|
|
|
— |
|
|
|
— |
|
|
|
449 |
|
|
|
— |
|
|
|
— |
|
|
|
— |
|
|
|
— |
|
|
|
449 |
|
|
Other comprehensive loss, net of income taxes |
|
|
— |
|
|
|
— |
|
|
|
— |
|
|
|
— |
|
|
|
— |
|
|
|
— |
|
|
|
— |
|
|
|
(1,697 |
) |
|
|
— |
|
|
|
(1,697 |
) |
|
Net loss |
|
|
— |
|
|
|
— |
|
|
|
— |
|
|
|
— |
|
|
|
— |
|
|
|
— |
|
|
|
— |
|
|
|
— |
|
|
|
(84,052 |
) |
|
|
(84,052 |
) |
|
Balances as of December 31, 2015 |
|
|
— |
|
|
|
— |
|
|
|
90,861 |
|
|
|
905 |
|
|
|
511,183 |
|
|
|
(535 |
) |
|
|
(652 |
) |
|
|
(2,225 |
) |
|
|
(215,921 |
) |
|
|
293,290 |
|
See Notes to Consolidated Financial Statements.
64
CONSOLIDATED STATEMENTS OF CASH FLOWS
(In thousands)
|
|
|
Year Ended December 31, |
|
|||||||||
|
|
|
2015 |
|
|
2014 |
|
|
2013 |
|
|||
|
Cash flows from operating activities |
|
|
|
|
|
|
|
|
|
|
|
|
|
Net loss |
|
$ |
(84,052 |
) |
|
$ |
(67,415 |
) |
|
$ |
(22,571 |
) |
|
Adjustments to reconcile net loss to net cash provided by operating activities |
|
|
|
|
|
|
|
|
|
|
|
|
|
Depreciation and amortization |
|
|
19,744 |
|
|
|
11,456 |
|
|
|
5,222 |
|
|
Share-based compensation |
|
|
52,556 |
|
|
|
32,139 |
|
|
|
4,854 |
|
|
Excess tax benefit from share-based award activity |
|
|
(449 |
) |
|
|
(334 |
) |
|
|
— |
|
|
Other |
|
|
1,457 |
|
|
|
337 |
|
|
|
179 |
|
|
Changes in operating assets and liabilities: |
|
|
|
|
|
|
|
|
|
|
|
|
|
Accounts receivable |
|
|
(14,989 |
) |
|
|
(3,846 |
) |
|
|
(3,594 |
) |
|
Prepaid expenses and other current assets |
|
|
(5,510 |
) |
|
|
(1,444 |
) |
|
|
(482 |
) |
|
Other assets and liabilities |
|
|
(3,204 |
) |
|
|
1,742 |
|
|
|
303 |
|
|
Accounts payable |
|
|
2,017 |
|
|
|
947 |
|
|
|
2,409 |
|
|
Accrued liabilities |
|
|
2,204 |
|
|
|
351 |
|
|
|
1,724 |
|
|
Accrued compensation and related benefits |
|
|
1,706 |
|
|
|
5,767 |
|
|
|
2,043 |
|
|
Deferred revenue |
|
|
33,853 |
|
|
|
22,390 |
|
|
|
13,918 |
|
|
Net cash provided by operating activities |
|
|
5,333 |
|
|
|
2,090 |
|
|
|
4,005 |
|
|
Cash flows from investing activities |
|
|
|
|
|
|
|
|
|
|
|
|
|
Purchases of property and equipment |
|
|
(22,989 |
) |
|
|
(21,665 |
) |
|
|
(7,116 |
) |
|
Internal-use software costs |
|
|
(4,705 |
) |
|
|
(8,013 |
) |
|
|
(4,661 |
) |
|
Purchases of marketable securities |
|
|
(70,303 |
) |
|
|
(54,330 |
) |
|
|
(12,409 |
) |
|
Proceeds from maturities of marketable securities |
|
|
36,982 |
|
|
|
10,450 |
|
|
|
— |
|
|
Proceeds from sale of marketable securities |
|
|
32,152 |
|
|
|
4,004 |
|
|
|
— |
|
|
Cash paid for the acquisition of WAC, net of cash acquired |
|
|
(42,758 |
) |
|
|
— |
|
|
|
— |
|
|
Cash paid for the acquisition of Zopim, net of cash acquired |
|
|
(1,100 |
) |
|
|
(1,896 |
) |
|
|
— |
|
|
Decrease in restricted cash |
|
|
— |
|
|
|
153 |
|
|
|
— |
|
|
Net cash used in investing activities |
|
|
(72,721 |
) |
|
|
(71,297 |
) |
|
|
(24,186 |
) |
|
Cash flows from financing activities |
|
|
|
|
|
|
|
|
|
|
|
|
|
Proceeds from initial public offering, net of issuance costs |
|
|
— |
|
|
|
103,090 |
|
|
|
— |
|
|
Proceeds from follow-on public offering, net of issuance costs |
|
|
190,094 |
|
|
|
— |
|
|
|
— |
|
|
Proceeds from exercise of employee stock options |
|
|
10,609 |
|
|
|
7,229 |
|
|
|
1,793 |
|
|
Proceeds from employee stock purchase plan |
|
|
9,526 |
|
|
|
4,404 |
|
|
|
— |
|
|
Taxes paid related to net share settlement of equity awards |
|
|
(609 |
) |
|
|
(2,117 |
) |
|
|
— |
|
|
Excess tax benefit from share-based award activity |
|
|
449 |
|
|
|
334 |
|
|
|
— |
|
|
Principal payments on debt |
|
|
(6,952 |
) |
|
|
(20,748 |
) |
|
|
— |
|
|
Proceeds from issuance of debt |
|
|
— |
|
|
|
3,940 |
|
|
|
23,760 |
|
|
Principal payments on capital lease obligations |
|
|
(10 |
) |
|
|
(364 |
) |
|
|
(337 |
) |
|
Net cash provided by financing activities |
|
|
203,107 |
|
|
|
95,768 |
|
|
|
25,216 |
|
|
Effect of exchange rates changes on cash and cash equivalents |
|
|
242 |
|
|
|
(21 |
) |
|
|
2 |
|
|
Net increase in cash and cash equivalents |
|
|
135,961 |
|
|
|
26,540 |
|
|
|
5,037 |
|
|
Cash and cash equivalents at the beginning of period |
|
|
80,265 |
|
|
|
53,725 |
|
|
|
48,688 |
|
|
Cash and cash equivalents at the end of period |
|
$ |
216,226 |
|
|
$ |
80,265 |
|
|
$ |
53,725 |
|
|
|
|
|
|
|
|
|
|
|
|
|
|
|
|
Supplemental cash flow data: |
|
|
|
|
|
|
|
|
|
|
|
|
|
Cash paid for interest and income taxes |
|
$ |
793 |
|
|
$ |
1,056 |
|
|
$ |
171 |
|
|
|
|
|
|
|
|
|
|
|
|
|
|
|
|
Non-cash investing and financing activities: |
|
|
|
|
|
|
|
|
|
|
|
|
|
Issuance of common stock for the acquisition of Zopim |
|
$ |
— |
|
|
$ |
10,892 |
|
|
$ |
— |
|
|
Vesting of early exercised stock options |
|
$ |
1,048 |
|
|
$ |
1,512 |
|
|
$ |
860 |
|
|
Purchases of property and equipment in accrued expenses |
|
$ |
2,695 |
|
|
$ |
374 |
|
|
$ |
251 |
|
|
Property and equipment acquired through tenant improvement allowances |
|
$ |
174 |
|
|
$ |
3,932 |
|
|
$ |
— |
|
|
Share-based compensation capitalized in internal-use software costs |
|
$ |
2,085 |
|
|
$ |
2,476 |
|
|
$ |
143 |
|
See Notes to Consolidated Financial Statements.
65
NOTES TO CONSOLIDATED FINANCIAL STATEMENTS
Note 1. Organization
Zendesk was founded in Denmark in 2007 and reincorporated in Delaware in April 2009.
Our mission is to help organizations and their customers build better relationships. We are a software development company that provides a SaaS customer service platform that enables our customers to provide tailored support through multiple channels, establish effective self-service support resources, proactively serve customers through customer engagement capabilities, integrate with other applications, and consolidate and analyze data from customer interactions. We also provide SaaS live chat software that can be utilized independently to facilitate proactive communications between organizations and their customers or integrated easily into our platform.
In October 2015, we completed the acquisition of We Are Cloud SAS, or WAC, the maker of BIME Analytics software. With the acquisition, we added technology that we anticipate will allow our customers to understand the ever-increasing diversity of data about their end customers. Over time, we expect this analytics software to become a core technology within our customer service platform, enabling us to further integrate data analytics capabilities across our products. We also expect to continue to sell our analytics software on a standalone basis.
References to Zendesk, the “Company”, “our”, or “we” in these notes refer to Zendesk, Inc. and its subsidiaries on a consolidated basis.
Note 2. Summary of Significant Accounting Policies
Basis of Presentation
The consolidated financial statements have been prepared in accordance with United States generally accepted accounting principles, or GAAP. The consolidated financial statements include the accounts of Zendesk, Inc. and its subsidiaries. All intercompany balances and transactions have been eliminated upon consolidation.
Initial Public Offering
In May 2014, we completed our initial public offering, or IPO, in which we issued and sold 12.8 million shares of common stock at a public offering price of $9.00 per share. We received net proceeds of $103.1 million after deducting underwriting discounts and commissions of $8.1 million and other offering expenses of $3.8 million. Upon the closing of the IPO, all shares of our then-outstanding redeemable convertible preferred stock automatically converted into an aggregate of 34.3 million shares of common stock.
Follow-On Public Offering
In March 2015, we completed a follow-on public offering, in which we issued and sold 8.8 million shares of our common stock at a public offering price of $22.75 per share. We received net proceeds of $190.1 million after deducting underwriting discounts and commissions of $8.7 million and other offering expenses of $0.9 million.
Reclassification
Certain prior year amounts have been reclassified for consistency with the current year presentation. These reclassifications had no effect on the reported results of operations.
Use of Estimates
The preparation of consolidated financial statements in conformity with GAAP requires management to make certain estimates, judgments and assumptions that affect the reported amounts of assets and liabilities and disclosure of contingent assets and liabilities at the date of the financial statements, as well as the reported amounts of revenue and expenses during the reported periods.
Significant items subject to such estimates and assumptions include the fair value of our common stock (through the date of our IPO) and share-based awards, fair value of acquired intangible assets, goodwill, unrecognized tax benefits, useful lives of acquired intangible assets and property and equipment, and the capitalization and estimated useful life of our capitalized internal-use software.
66
These estimates are based on information available as of the date of the financial statements; therefore, actual results could differ from those estimates.
Segment Information
Our chief operating decision maker reviews the financial information presented on a consolidated basis for purposes of allocating resources and evaluating our financial performance. Accordingly, we have determined that we operate in a single operating segment.
Revenue Recognition
We generate substantially all of our revenue from subscription services, which are comprised of subscription fees from customer accounts on our customer service platform and, to a lesser extent, live chat software, and analytics software. In addition, we generate revenue by providing additional features to certain of our subscription plans for a fee that is incremental to the base subscription rate for such plan. Arrangements with customers do not provide the customer with the right to take possession of the software supporting our customer service platform or live chat software at any time, and are therefore accounted for as service contracts. Subscription service arrangements are generally non-cancelable and do not provide for refunds to customers in the event of cancellations or any other right of return. We record revenue net of sales or excise taxes.
We commence revenue recognition when all of the following conditions are met:
|
|
· |
There is persuasive evidence of an arrangement; |
|
|
· |
The service has been or is being provided to the customer; |
|
|
· |
The collection of the fees is reasonably assured; and |
|
|
· |
The amount of fees to be paid by the customer is fixed or determinable. |
Subscription revenue is recognized on a straight-line basis over the contractual term of the arrangement beginning on the date that our service is made available to the customer. Payments received in advance of services being rendered are recorded as deferred revenue and recognized on a straight-line basis over the requisite service period.
Certain customers have arrangements that provide for a maximum number of users over the contract term, with usage measured monthly. Revenue for these arrangements is recognized ratably over the contract terms. Incremental fees are incurred when the maximum number of users is exceeded, and any incremental fees are recognized as revenue ratably over the remaining contractual term.
We derive an immaterial amount of revenue from implementation, voice usage, and training services, for which we recognize revenue upon completion.
Deferred Revenue
Deferred revenue consists primarily of customer billings in advance of revenue being recognized. We invoice customers for subscriptions to our customer service platform, live chat software, and analytics software in monthly, quarterly, or annual installments. Deferred revenue that is anticipated to be recognized during the succeeding 12-month period is recorded as current deferred revenue and the remaining portion is recorded as noncurrent deferred revenue. Deferred revenue associated with implementation, voice usage, and training services was immaterial as of December 31, 2015 and 2014.
Cost of Revenue
Cost of revenue consists primarily of personnel costs (including salaries, share-based compensation, and benefits) for employees associated with our platform infrastructure and our product support organizations, depreciation, hosting, and other expenses associated with our data centers, amortization expense associated with capitalized internal-use software, payment processing fees, third party license fees, amortization expense associated with acquired intangible assets, and allocated shared costs, including facilities, shared information technology and security costs.
Cash, Cash Equivalents, and Restricted Cash
We consider all highly liquid investments purchased with a remaining maturity of three months or less to be cash equivalents. Cash and cash equivalents are recorded at fair value and consist primarily of bank deposits and money market funds.
67
As of December 31, 2015, our restricted cash balance was $1.3 million, consisting of $0.9 million pledged for charitable donation and $0.4 million related to a deposit for a leased building. There was no restricted cash as of December 31, 2014. Restricted cash is included within other assets on our consolidated balance sheet.
Marketable Securities
Marketable securities consist of corporate bonds, asset backed securities, commercial paper, U.S. Treasury securities and agency securities. We classify marketable securities as available-for-sale at the time of purchase and reevaluate such classification as of each balance sheet date. All marketable securities are recorded at their estimated fair value. Unrealized gains and losses for available-for-sale securities are recorded in other comprehensive loss. We evaluate our investments to assess whether those with unrealized loss positions are other than temporarily impaired. Impairments are considered other than temporary if they are related to deterioration in credit risk or if it is likely we will sell the securities before the recovery of their cost basis. Realized gains and losses and declines in value determined to be other than temporary are determined based on the specific identification method and are reported in other expense, net in the consolidated statements of operations.
Accounts Receivable and Allowance for Doubtful Accounts
Accounts receivable are recorded at the invoiced amount, net of allowance for doubtful accounts. The allowance is based upon historical loss patterns, the age of each past due invoice, and an evaluation of the potential risk of loss associated with delinquent accounts. Accounts receivable deemed uncollectable are charged against the allowance for doubtful accounts when identified.
The allowance for doubtful accounts consists of the following activity (in thousands):
|
|
|
Year Ended December 31, |
|
|||||
|
|
|
2015 |
|
|
2014 |
|
||
|
Allowance for doubtful accounts, beginning balance |
|
$ |
264 |
|
|
$ |
282 |
|
|
Additions |
|
|
1,281 |
|
|
|
843 |
|
|
Write-offs |
|
|
(782 |
) |
|
|
(861 |
) |
|
Allowance for doubtful accounts, ending balance |
|
$ |
763 |
|
|
$ |
264 |
|
Property and Equipment
Property and equipment are stated at cost less accumulated depreciation. Depreciation is calculated using the straight-line method over the estimated useful lives of assets. Maintenance and repair costs are charged to expense as incurred. The estimated useful lives of our property and equipment are as follows:
|
Furniture and fixtures |
|
|
5 years |
|
Hosting equipment |
|
|
3 years |
|
Computer equipment and software |
|
|
3 years |
|
Leasehold improvements |
|
|
Shorter of the lease term or estimated useful life |
Depreciation expense of assets acquired through capital leases is included in depreciation and amortization expense in the accompanying consolidated statements of operations.
Derivative Instruments and Hedging
We enter into foreign currency forward contracts with certain financial institutions to mitigate the impact of foreign currency fluctuations on our future cash flows and earnings. All of our foreign currency forward contracts are designated as cash flow hedges. Our foreign currency forward contracts generally have maturities of fifteen months or less.
We recognize all forward contracts on our balance sheet at fair value as either assets or liabilities. The effective portion of the gain or loss on each forward contract is reported as a component of accumulated other comprehensive income (loss) and reclassified into earnings to revenue, cost of revenue or operating expense in the same period, or periods, during which the hedged transaction affects earnings. The ineffective portion of the gains or losses, if any, is recorded immediately in other income (expense), net. The change in time value related to our cash flow hedges is excluded from the assessment of hedge effectiveness and is recorded immediately in other income (expense), net. We evaluate the effectiveness of our cash flow hedges on a quarterly basis.
We have a master netting agreement with each of our counterparties, which permits net settlement of multiple, separate derivative contracts with a single payment. We may also be required to exchange cash collateral with certain of our counterparties on a
68
regular basis. As of December 31, 2015, we have not exchanged cash collateral with any counterparties. ASC 815 permits companies to present the fair value of derivative instruments on a net basis according to master netting arrangements. We have elected to present our derivative instruments on a gross basis in our consolidated financial statements. We do not enter into any hedging contracts for trading or speculative purposes.
Fair Value Measurements
We measure certain financial instruments at fair value using a fair value hierarchy. A financial instrument’s classification within the fair value hierarchy is based upon the lowest level of input that is significant to the fair value measurement. Three levels of inputs may be used to measure fair value:
Level 1—Observable inputs that reflect quoted prices (unadjusted) for identical assets or liabilities in active markets.
Level 2—Other inputs that are directly or indirectly observable in the marketplace.
Level 3—Unobservable inputs that are supported by little or no market activity.
Our marketable securities are classified within either Level 1 or Level 2 and our foreign currency forward contracts are classified within Level 2. We have no financial assets or liabilities measured using Level 3 inputs. The fair value of our Level 1 marketable securities is based on quoted market prices of identical underlying securities. The fair value of our Level 2 marketable securities is based on indirect or directly observable market data, including readily available pricing sources for identical underlying securities that may not be actively traded. The fair value of our foreign currency forward contracts is based on quoted prices and market observable data of similar instruments in active markets, such as currency spot rates, forward rates, and LIBOR.
For certain other financial instruments, including accounts receivable, accounts payable and other current liabilities, the carrying amounts approximate their fair value due to the relatively short maturity of these balances. Based on borrowing rates available to us for loans with similar terms and maturities, the carrying value of borrowings approximates fair value within Level 2 of the fair value hierarchy.
Capitalized Internal-Use Software Costs
We capitalize certain development costs incurred in connection with software development for our platform and software used in operations. Costs incurred in the preliminary stages of development are expensed as incurred. Once software has reached the development stage, internal and external costs, if direct and incremental, are capitalized until the software is substantially complete and ready for its intended use. Capitalization ceases upon completion of all substantial testing. We also capitalize costs related to specific upgrades and enhancements when it is probable the expenditures will result in additional functionality. Capitalized costs are recorded as part of property and equipment. Maintenance and training costs are expensed as incurred.
Capitalized internal-use software is amortized on a straight-line basis over its estimated useful life and recorded in cost of revenue within the accompanying consolidated statements of operations. The weighted-average useful life of our capitalized internal-use software was 3.0 years as of December 31, 2015.
Business Combinations
When we acquire businesses, we allocate the purchase price to the net tangible and identifiable intangible assets. Any residual purchase price is recorded as goodwill. The allocation of the purchase price requires management to make significant estimates in determining the fair values of assets acquired and liabilities assumed, especially with respect to intangible assets. These estimates can include, but are not limited to, the cash flows that an asset is expected to generate in the future, the appropriate weighted-average cost of capital, and the cost savings expected to be derived from acquiring an asset. These estimates are inherently uncertain and unpredictable.
Goodwill, Acquired Intangible Assets, and Impairment Assessment of Long-Lived Assets
Goodwill. Goodwill represents the excess purchase consideration of an acquired business over the fair value of the net tangible and identifiable intangible assets. Goodwill is evaluated for impairment annually in the third quarter, and whenever events or changes in circumstances indicate the carrying value of goodwill may not be recoverable. Triggering events that may indicate impairment include, but are not limited to, a significant adverse change in customer demand or business climate or a significant decrease in expected cash flows. No impairment charges were recorded during the years ended December 31, 2015 and 2014.
69
Acquired Intangible Assets. Acquired intangible assets consist of identifiable intangible assets, primarily developed technology and customer relationships, resulting from our acquisitions. Intangible assets are recorded at fair value on the date of acquisition and amortized over their estimated useful lives following the pattern in which the economic benefits of the assets will be consumed, generally straight-line.
Impairment of Long-Lived Assets. The carrying amounts of our long-lived assets, including property and equipment, capitalized internal-use software, and acquired intangible assets, are reviewed for impairment whenever events or changes in circumstances indicate that the carrying value of these assets may not be recoverable or that the useful life is shorter than originally estimated. Recoverability of assets to be held and used is measured by comparing the carrying amount of an asset to future undiscounted net cash flows the asset is expected to generate over its remaining life. If the asset is considered to be impaired, the amount of any impairment is measured as the difference between the carrying value and the fair value of the impaired asset. If the useful life is shorter than originally estimated, we amortize the remaining carrying value over the new shorter useful life. There were no material impairments for the years ended December 31, 2015 and 2014.
Share Based Compensation
Share-based compensation expense to employees is measured based on the fair value of the awards on the grant date and recognized in our consolidated statements of operations over the period during which the employee is required to perform services in exchange for the award (generally the vesting period of the award). We estimate the fair value of stock options granted using the Black-Scholes option valuation model. We measure the fair value of restricted stock units, or RSUs, based on the fair value of the underlying shares on the date of grant. Compensation expense for awards with only service conditions is recognized over the vesting period of the applicable award using the straight-line method.
All RSUs and certain options granted to employees prior to the IPO vest upon the satisfaction of both a service condition and a performance condition. These RSUs and stock options with both a service condition and performance condition are collectively referred to as “Performance Awards” in the following discussion. The service condition for substantially all of these awards is satisfied over four years. The performance condition was satisfied upon the occurrence of a qualifying liquidity event which occurred upon the effectiveness of the registration statement related to our IPO. No share-based compensation expense was recognized for the Performance Awards prior to the IPO as the performance condition had not been deemed probable to have been met. Upon the satisfaction of the performance condition in May 2014, we recognized a cumulative share-based compensation expense for the portion of the Performance Awards that had met the service condition. The remaining unrecognized share-based compensation expense recorded over the remaining requisite service period using the accelerated attribution method, net of estimated forfeitures. For the years ended December 31, 2015 and 2014, share-based compensation expense related to the Performance Awards was $6.1 million and $12.7 million, respectively.
As of December 31 2015, we had a total of $168.5 million in future period share-based compensation expense related to all equity awards, net of estimated forfeitures, to be recognized over a weighted average period of 3.0 years.
Advertising Expense
Advertising is expensed as incurred. For the years ended December 31, 2015, 2014, and 2013, advertising expense was $16.5 million, $12.7 million, and $6.5 million, respectively.
Income Taxes
We record income taxes using the asset and liability method, which requires the recognition of deferred tax assets and liabilities for the expected future tax consequences of events that have been recognized in our consolidated financial statements or tax returns. Deferred tax assets and liabilities are measured using the tax rates that are expected to apply to taxable income for the years in which those tax assets and liabilities are expected to be realized or settled. Valuation allowances are provided when necessary to reduce deferred tax assets to the amount expected to be realized.
We recognize tax benefits from uncertain tax positions if it is more likely than not that the tax position will be sustained on examination by the taxing authorities based on the technical merits of the position. Although we believe that we have adequately reserved for our uncertain tax positions, we can provide no assurance that the final tax outcome of these matters will not be materially different. We make adjustments to these reserves when facts and circumstances change, such as the closing of a tax audit or the refinement of an estimate. To the extent that the final tax outcome of these matters is different than the amounts recorded, such differences will affect the provision for income taxes in the period in which such determination is made and could have a material impact on our financial condition and results of operations.
We have elected to record interest accrued and penalties related to unrecognized tax benefits in our consolidated financial statements as a component of provision for income taxes.
70
Foreign Currency
The functional currency of our foreign subsidiaries, with the exception of our Singapore subsidiary, is the U.S. dollar. Accordingly, monetary balance sheet accounts are remeasured using exchange rates in effect at the balance sheet dates and non-monetary items are remeasured at historical exchange rates. Expenses are generally remeasured at the average exchange rates for the period. Foreign currency remeasurement and transaction gains and losses are included in other expense, net on the statements of operations and were not material for the periods presented.
The functional currency of our Singapore subsidiary is the Singapore dollar. Assets and liabilities are translated into U.S. dollars at exchange rates in effect at the balance sheet dates. Revenue and expenses are translated at the average exchange rates for the period. Amounts classified in stockholders’ equity are translated at historical exchange rates. Translation gains and losses are recorded in accumulated other comprehensive loss income as a component of stockholders' equity.
Concentrations of Risk
Financial instruments potentially exposing us to concentrations of credit risk consist primarily of cash and cash equivalents, restricted cash, marketable securities, accounts receivable and derivative instruments. We place our cash and cash equivalents with high-credit-quality financial institutions. However, we maintain balances in excess of the FDIC insurance limits. We do not require our customers to provide collateral to support accounts receivable and maintain an allowance for doubtful accounts receivable balances. We seek to mitigate counterparty credit risk related to our derivative instruments by transacting with major financial institutions with high credit ratings.
At December 31, 2015 and 2014, there were no customers that represented more than 10% of our accounts receivable balance. There were no customers that individually exceeded 10% of our revenue in any of the periods presented.
Recently Issued and Adopted Accounting Pronouncements
In November 2015, the FASB issued ASU 2015-17 “Balance Sheet Classification of Deferred Taxes,” requiring all deferred tax assets and liabilities, and any related valuation allowance, to be classified as noncurrent on the balance sheet. The purpose of this standard is to simplify the presentation of deferred liabilities and assets. We elected to prospectively adopt this standard in the beginning of our fourth quarter of fiscal 2015. The impact to our consolidated financial statements was not material and prior periods were not retrospectively adjusted.
In September 2015, the FASB issued ASU 2015-16 “Simplifying the Accounting for Measurement-Period Adjustments”, which requires that an acquirer in a business combination recognize adjustments to provisional amounts that are identified during the measurement period in the reporting period in which the adjustment amounts are determined. The new standard is required to be applied prospectively. We plan to adopt this guidance in our first quarter of 2016. The adoption of this new standard is not expected to have a material impact on our consolidated financial statements.
In April 2015, the FASB issued ASU 2015-05“Customer’s Accounting for Fees Paid in a Cloud Computing Arrangement”, which amended the existing accounting standards for intangible assets. The amendments provide explicit guidance to customers in determining the accounting for fees paid in a cloud computing arrangement, wherein the arrangements that do not convey a software license to the customer are accounted for as service contracts. We plan to adopt this guidance in our first quarter of 2016. The adoption of this new standard is not expected to have a material impact on our financial statements.
In May 2014, the FASB issued ASU 2014-09 regarding ASC Topic 606 “Revenue from Contracts with Customers.” This standard provides principles for recognizing revenue to which an entity expects to be entitled for the transfer of promised goods or services to customers. In August 2015, the FASB issued ASU 2015-14, which deferred the effective date of ASU 2014-09 by one year. As currently issued and amended, ASU 2014-09 is effective for annual reporting periods beginning after December 15, 2017, including interim periods within that reporting period, though early adoption is permitted for annual reporting periods beginning after December 15, 2016. The amendment may be applied retrospectively to each prior period presented, or with the cumulative effect recognized as of the date of initial adoption. We have not yet selected a transition method and continue to evaluate the effect of the standard on our consolidated financial statements, including revenue and commissions.
71
We Are Cloud SAS
On October 13, 2015, we completed the acquisition of WAC, the maker of BIME Analytics software. We acquired 100 percent of the outstanding shares of WAC in exchange for purchase consideration of $46.3 million in cash, including working capital adjustments. As partial security for standard indemnification obligations, $7.0 million of the consideration will be held in escrow for a period of up to 18 months, with a portion to be released 12 months following the closing of the acquisition. We incurred transaction costs of $1.0 million in connection with the acquisition. The transaction costs were expensed as incurred and recognized within general and administrative expenses.
The fair value of assets acquired and liabilities assumed was based on a preliminary valuation and purchase price, and our estimates and assumptions are subject to change within the measurement period. The primary areas that remain preliminary relate to working capital adjustments, the fair values of certain tangible assets and liabilities acquired, and residual goodwill. The total purchase price was allocated to assets acquired and liabilities assumed as set forth below (in thousands). The excess of the purchase price over the net assets acquired was recorded as goodwill. Goodwill generated from the acquisition is primarily attributable to expected synergies, including cost savings from integrating the analytics technology with our customer service platform and the opportunity to sell the analytics software alongside our existing products. Goodwill is not expected to be deductible for income tax purposes. Goodwill will not be amortized but instead will be tested for impairment at least annually and more frequently if certain indicators of impairment are present.
|
Net tangible assets acquired |
|
$ |
2,285 |
|
|
Net deferred tax liability recognized |
|
|
(1,979 |
) |
|
Identifiable intangible assets: |
|
|
|
|
|
Developed technology |
|
|
8,800 |
|
|
Customer relationships |
|
|
500 |
|
|
Goodwill |
|
|
36,730 |
|
|
Total purchase price |
|
$ |
46,336 |
|
The developed technology and customer relationship intangible assets were each assigned useful lives of 4.5 years.
In connection with the acquisition, we entered into retention arrangements with certain employees of WAC, pursuant to which we issued RSUs for approximately 0.5 million shares of our common stock, most of which vest in three annual installments from the date of acquisition. The expense related to the RSUs will be accounted for as share-based compensation expense over the required service periods and was not included in the purchase consideration.
The results of operations of WAC have been included in our consolidated financial statements from the date of the acquisition.
The following unaudited pro forma information presents the combined results of operations as if the acquisition had been completed on January 1, 2014, the beginning of the comparable prior annual reporting period. The unaudited pro forma results include: (i) recognition of the post-acquisition share-based compensation and other compensation expense; (ii) amortization associated with the acquired intangible assets, based on preliminary estimates of fair value; (iii) acquisition-related costs incurred by Zendesk and WAC; (iv) the impact of fair value adjustments to deferred revenue and capitalized software; (v) the income tax benefit associated with WAC’s historical loss before income taxes, and the pro forma adjustments.
The unaudited pro forma results do not reflect any cost saving synergies from operating efficiencies or the effect of the incremental costs incurred in integrating the two companies. Accordingly, the unaudited pro forma results are presented for informational purposes only and are not necessarily indicative of what the actual results of operations of the combined company would have been if the acquisition had occurred at the beginning of the period presented, nor are they indicative of future results of operations (in thousands):
|
|
|
Year Ended December 31, |
|
|||||
|
|
|
2015 |
|
|
2014 |
|
||
|
Revenue |
|
$ |
210,647 |
|
|
$ |
127,932 |
|
|
Net loss attributable to common stockholders |
|
|
(87,348 |
) |
|
|
(74,670 |
) |
72
On March 21, 2014, we completed the acquisition of Zopim Technologies Pte Ltd., or Zopim, a software development company that provides a SaaS live chat service. As of December 31, 2014, we finalized our purchase accounting after adjustments were made to the preliminary purchase price allocation. The total adjusted acquisition date fair value of consideration transferred was $15.8 million, including $4.9 million of cash and $10.9 million of our common stock, all of which was issued on the acquisition date. Of the total consideration transferred, $1.1 million of cash and $2.4 million of common stock consideration was held back between 12 and 18 months as partial security for standard indemnification obligations. These hold back amounts were released in equal installments in March and September 2015. The total adjusted purchase price was allocated to assets acquired and liabilities assumed as set forth below (in thousands). The excess of the purchase price over the net assets acquired was recorded as goodwill. Goodwill generated from the acquisition is attributable to expected synergies from future growth and potential future monetization opportunities, and is not deductible for tax purposes.
|
Net tangible liabilities assumed |
|
$ |
(385 |
) |
|
Intangible assets |
|
|
6,560 |
|
|
Goodwill |
|
|
9,594 |
|
|
Total purchase price |
|
$ |
15,769 |
|
In connection with the acquisition, we also established a retention plan pursuant to which we issued RSUs for 0.9 million shares of our common stock, which vest in three annual installments from the date of acquisition. In addition, we agreed to pay cash in an aggregate amount of $3.0 million in two annual installments from the date of acquisition to Zopim employees in connection with their continued employment, which is recorded as compensation expense over the associated service periods of such employees. For the year ended December 31, 2015, RSUs for 0.3 million shares of our common stock became vested pursuant to the terms of the retention plan, and we paid the first installment of the cash retention bonus in the amount of $1.5 million.
Pro forma revenue and results of operations have not been presented because the historical results of Zopim were not material to our consolidated financial statements in any period presented.
Note 4. Financial Instruments
Investments
The following tables present information about our financial assets measured at fair value on a recurring basis as of December 31, 2015 and 2014 based on the three-tier fair value hierarchy (in thousands):
|
|
|
Fair Value Measurement at |
|
|||||||||
|
|
|
December 31, 2015 |
|
|||||||||
|
|
|
Level 1 |
|
|
Level 2 |
|
|
Total |
|
|||
|
Description |
|
|
|
|
|
|
|
|
|
|
|
|
|
Corporate bonds |
|
$ |
— |
|
|
|
31,761 |
|
|
$ |
31,761 |
|
|
Money market funds |
|
|
21,338 |
|
|
|
— |
|
|
|
21,338 |
|
|
Asset-backed securities |
|
|
— |
|
|
|
7,998 |
|
|
|
7,998 |
|
|
Commercial paper |
|
|
— |
|
|
|
5,992 |
|
|
|
5,992 |
|
|
U.S. treasury securities |
|
|
— |
|
|
|
4,001 |
|
|
|
4,001 |
|
|
Agency securities |
|
|
— |
|
|
|
1,998 |
|
|
|
1,998 |
|
|
Total |
|
$ |
21,338 |
|
|
$ |
51,750 |
|
|
$ |
73,088 |
|
|
Included in cash and cash equivalents |
|
|
|
|
|
|
|
|
|
$ |
21,338 |
|
|
Included in marketable securities |
|
|
|
|
|
|
|
|
|
$ |
51,750 |
|
73
|
|
Fair Value Measurement at |
|
||||||||||
|
|
|
December 31, 2014 |
|
|||||||||
|
|
|
Level 1 |
|
|
Level 2 |
|
|
Total |
|
|||
|
Description |
|
|
|
|
|
|
|
|
|
|
|
|
|
Corporate bonds |
|
$ |
— |
|
|
$ |
40,345 |
|
|
$ |
40,345 |
|
|
Money market funds |
|
|
21,382 |
|
|
|
— |
|
|
|
21,382 |
|
|
Asset-backed securities |
|
|
— |
|
|
|
5,080 |
|
|
|
5,080 |
|
|
Commercial paper |
|
|
— |
|
|
|
3,993 |
|
|
|
3,993 |
|
|
U.S. treasury securities |
|
|
— |
|
|
|
1,991 |
|
|
|
1,991 |
|
|
Total |
|
$ |
21,382 |
|
|
$ |
51,409 |
|
|
$ |
72,791 |
|
|
Included in cash and cash equivalents |
|
|
|
|
|
|
|
|
|
$ |
21,382 |
|
|
Included in marketable securities |
|
|
|
|
|
|
|
|
|
$ |
51,409 |
|
There were no transfers between fair value measurement levels during the years ended December 31, 2015 or 2014.
Gross unrealized gains or losses for cash equivalents and marketable securities as of December 31, 2015 and 2014 were not material. As of December 31, 2015 and 2014, there were no securities that were in an unrealized loss position for more than twelve months.
The following table classifies our marketable securities by contractual maturities as of December 31, 2015 and 2014 (in thousands):
|
|
|
December 31, 2015 |
|
|
December 31, 2014 |
|
||
|
Due in one year or less |
|
$ |
29,414 |
|
|
$ |
42,204 |
|
|
Due after one year |
|
|
22,336 |
|
|
|
9,205 |
|
|
Total |
|
$ |
51,750 |
|
|
$ |
51,409 |
|
Derivative Instruments and Hedging
In September 2015, we implemented a hedging program to mitigate the impact of foreign currency fluctuations on our future cash flows and earnings. We entered into foreign currency forward contracts with certain financial institutions and designated those hedges as cash flow hedges. As of December 31, 2015, $0.7 million of unrealized losses related to the effective portion of changes in the fair value of foreign currency forward contracts designated as cash flow hedges were included in the balance of other accumulated comprehensive loss. We expect to reclassify $0.7 million from accumulated other comprehensive loss into earnings over the next twelve months associated with our cash flow hedges.
The following table presents information about our derivative instruments on the consolidated balance sheet as of December 31, 2015 (in thousands):
|
|
December 31, 2015 |
|
|||||||||
|
|
Asset Derivatives |
|
|
Liability Derivatives |
|
||||||
|
Derivative Instrument |
Balance Sheet Location |
|
Fair Value (Level 2) |
|
|
Balance Sheet Location |
|
Fair Value (Level 2) |
|
||
|
Foreign currency forward contracts |
Other current assets |
|
|
408 |
|
|
Accrued liabilities |
|
|
1,081 |
|
|
Total |
|
|
$ |
408 |
|
|
|
|
$ |
1,081 |
|
74
Our foreign currency forward contracts had a total notional value of $60.8 million as of December 31, 2015. There were no derivative assets or liabilities on our consolidated balance sheet as of December 31, 2014.
The following table presents information about our derivative instruments on the statement of operations for the year ended December 31, 2015 (in thousands):
|
|
|
|
Year Ended December 31, 2015 |
|
|||||
|
Derivative Instrument |
Location of Loss Reclassified into Earnings |
|
Loss Recognized in AOCI |
|
|
Loss Reclassified from AOCI into Earnings |
|
||
|
Foreign currency forward contracts |
Revenue, cost of revenue, operating expenses |
|
|
(794 |
) |
|
|
(84 |
) |
|
Total |
|
|
$ |
(794 |
) |
|
$ |
(84 |
) |
All derivatives have been designated as hedging instruments. Amounts recognized in earnings related to excluded time value and hedge ineffectiveness were not material for the year ended December 31, 2015. There were no gains or losses on derivative instruments for the years ended December 31, 2014 or 2013.
Note 5. Property and Equipment
Property and equipment consists of the following (in thousands):
|
|
|
December 31, 2015 |
|
|
December 31, 2014 |
|
||
|
Capitalized internal-use software |
|
$ |
22,418 |
|
|
$ |
18,541 |
|
|
Hosting equipment |
|
|
26,920 |
|
|
|
14,085 |
|
|
Leasehold improvements |
|
|
19,577 |
|
|
|
15,144 |
|
|
Computer equipment and software |
|
|
7,682 |
|
|
|
4,310 |
|
|
Furniture and fixtures |
|
|
5,739 |
|
|
|
4,524 |
|
|
Construction in progress |
|
|
4,157 |
|
|
|
3,546 |
|
|
Total |
|
|
86,492 |
|
|
|
60,150 |
|
|
Less accumulated depreciation and amortization |
|
|
(29,952 |
) |
|
|
(18,255 |
) |
|
Property and equipment, net |
|
$ |
56,540 |
|
|
$ |
41,895 |
|
Depreciation expense was $11.2 million, $6.1 million, and $2.9 million for the years ended December 31, 2015, 2014, and 2013, respectively.
Amortization expense of capitalized internal-use software totaled $6.2 million, $3.8 million, and $2.3 million during the years ended December 31, 2015, 2014, and 2013, respectively. The carrying value of capitalized internal-use software at December 31, 2015 and 2014 was $14.1 million and $13.6 million, respectively, including $1.5 million and $3.5 million in construction in progress, respectively.
Note 6. Goodwill and Acquired Intangible Assets
The changes in the carrying amount of goodwill for the year ended December 31, 2015 are as follows (in thousands):
|
Balance as of December 31, 2013 |
|
$ |
— |
|
|
Goodwill acquired |
|
|
9,373 |
|
|
Goodwill adjustments |
|
|
221 |
|
|
Foreign currency translation adjustments |
|
|
(354 |
) |
|
Balance as of December 31, 2014 |
|
|
9,240 |
|
|
Goodwill acquired |
|
|
36,730 |
|
|
Goodwill adjustments |
|
|
— |
|
|
Foreign currency translation adjustments |
|
|
(624 |
) |
|
Balance as of December 31, 2015 |
|
$ |
45,346 |
|
75
The following tables present information about our acquired intangible assets subject to amortization as of December 31, 2015 and 2014 (in thousands):
|
|
|
As of December 31, 2015 |
|
|||||||||||||||||
|
|
|
Cost |
|
|
Accumulated Amortization |
|
|
Foreign Currency Translation Adjustments |
|
|
Net |
|
|
Remaining Useful Life |
|
|||||
|
|
|
|
|
|
|
|
|
|
|
|
|
|
|
|
|
|
|
(In years) |
|
|
|
Developed technology |
|
$ |
14,000 |
|
|
$ |
(3,133 |
) |
|
$ |
(279 |
) |
|
$ |
10,587 |
|
|
|
3.6 |
|
|
Customer relationships |
|
|
1,800 |
|
|
|
(606 |
) |
|
|
(78 |
) |
|
|
1,117 |
|
|
|
3.8 |
|
|
|
|
$ |
15,800 |
|
|
$ |
(3,740 |
) |
|
$ |
(356 |
) |
|
$ |
11,704 |
|
|
|
|
|
|
|
|
As of December 31, 2014 |
|
|||||||||||||||||
|
|
|
Cost |
|
|
Accumulated Amortization |
|
|
Foreign Currency Translation Adjustments |
|
|
Net |
|
|
Remaining Useful Life |
|
|||||
|
|
|
|
|
|
|
|
|
|
|
|
|
|
|
|
|
|
|
(In years) |
|
|
|
Developed technology |
|
$ |
5,200 |
|
|
$ |
(1,118 |
) |
|
$ |
(191 |
) |
|
$ |
3,891 |
|
|
|
2.7 |
|
|
Customer relationships |
|
|
1,300 |
|
|
|
(244 |
) |
|
|
(48 |
) |
|
|
1,008 |
|
|
|
3.2 |
|
|
Trade name |
|
|
60 |
|
|
|
(45 |
) |
|
|
(2 |
) |
|
|
13 |
|
|
|
0.2 |
|
|
|
|
$ |
6,560 |
|
|
$ |
(1,407 |
) |
|
$ |
(241 |
) |
|
$ |
4,912 |
|
|
|
|
|
During 2015, the trade name associated with our acquisition of Zopim became fully amortized and was removed from our consolidated balance sheet. Amortization expense of acquired intangible assets for the year ended December 31, 2015 and 2014 was $2.3 million and $1.4 million, respectively.
Estimated future amortization expense as of December 31, 2015 is as follows (in thousands):
|
2016 |
|
$ |
3,692 |
|
|
2017 |
|
|
3,305 |
|
|
2018 |
|
|
2,129 |
|
|
2019 |
|
|
2,066 |
|
|
2020 |
|
|
512 |
|
|
|
|
$ |
11,704 |
|
Note 7. Credit Facility
Until its termination in June 2015, we had a credit facility with Silicon Valley Bank consisting of a $20.0 million revolving line of credit and a $10.0 million equipment line of credit. The revolving line of credit bore interest at the prime rate plus 2.0% per annum prior to our IPO and was reduced to the prime rate upon the consummation of our IPO. Borrowings on the equipment line of credit bore interest of 2.5% per annum. In June 2014, we repaid all outstanding principal and accrued interest under the revolving line of credit. In June 2015, we repaid all outstanding principal and interest under the equipment line of credit and terminated the Silicon Valley Bank credit facility.
Note 8. Commitments and Contingencies
Leases
We lease office space under noncancelable operating leases with various expiration dates. Certain of the office space lease agreements contain rent holidays or rent escalation provisions. Rent holiday and rent escalation provisions are considered in determining the straight-line expense to be recorded over the lease term. The lease term begins on the date of initial possession of the leased property for purposes of recognizing lease expense on a straight-line basis over the term of the lease. For the years ended December 31, 2015, 2014, and 2013, rent expense was $7.5 million, $6.8 million, and $2.3 million, respectively. Deferred rent of $6.9 million and $7.2 million as of December 31, 2015 and 2014, respectively, is included in other liabilities.
76
We leased computer equipment from various parties under capital lease agreements that expired in March 2015.
As of December 31, 2015, the future minimum lease payments by year under noncancelable operating leases are as follows for the years ending December 31 (in thousands):
|
|
|
|
|
|
|
2016 |
|
$ |
8,367 |
|
|
2017 |
|
|
8,870 |
|
|
2018 |
|
|
8,790 |
|
|
2019 |
|
|
8,019 |
|
|
2020 |
|
|
4,634 |
|
|
Thereafter |
|
|
6,600 |
|
|
Total minimum lease payments |
|
$ |
45,280 |
|
Letters of Credit
As of December 31, 2015 and 2014, we had a total of $3.7 million in unsecured letters of credit outstanding primarily related to our leased office space in San Francisco. These letters of credit renew annually and mature at various dates through October 31, 2022.
Litigation and Loss Contingencies
We accrue estimates for resolution of legal and other contingencies when losses are probable and estimable. From time to time, we may become a party to litigation and subject to claims incident to the ordinary course of business, including intellectual property claims, labor and employment claims, and threatened claims, breach of contract claims, tax, and other matters. We currently have no material pending litigation.
We are not currently aware of any litigation matters or loss contingencies that would be expected to have a material adverse effect on our business, consolidated balance sheets, results of operations, comprehensive loss, or cash flows.
Indemnifications
In the ordinary course of business, we enter into contractual arrangements under which we agree to provide indemnification of varying scope and terms to customers, business partners and other parties with respect to certain matters, including, but not limited to, losses arising out of the breach of such agreements, intellectual property infringement claims made by third parties, and other liabilities relating to or arising from our customer service platform, live chat software, analytics software, or our acts or omissions. In these circumstances, payment may be conditional on the other party making a claim pursuant to the procedures specified in the particular contract. Further, our obligations under these agreements may be limited in terms of time and/or amount, and in some instances, we may have recourse against third parties for certain payments. In addition, we have indemnification agreements with our directors and executive officers that require us, among other things, to indemnify them against certain liabilities that may arise by reason of their status or service as directors or officers. The terms of such obligations may vary. To date, we have not incurred any material costs, and we have not accrued any liabilities in the accompanying consolidated financial statements, as a result of these obligations.
Certain of our product offerings include service-level agreements warranting defined levels of uptime reliability and performance and permitting those customers to receive credits for future services in the event that we fail to meet those levels. To date, we have not accrued for any significant liabilities in the accompanying consolidated financial statements as a result of these service-level agreements.
Note 9. Common Stock and Stockholders’ Equity (Deficit)
Common Stock
Upon the completion of our IPO, we increased the number of shares authorized for issuance from 125 million to 400 million with a par value of $0.01 per share.
77
Convertible Preferred Stock
Upon the completion of the IPO, all outstanding convertible preferred stock was converted into 34.3 million shares of common stock.
Preferred Stock
As of December 31, 2015 and 2014, 10 million shares of preferred stock were authorized for issuance with a par value of $0.01 per share and no shares of preferred stock were issued or outstanding.
Employee Equity Plans
Employee Stock Purchase Plan
Our board of directors adopted the Employee Stock Purchase Plan, or ESPP, in February 2014, which became effective in May 2014 upon the effectiveness of the registration statement related to our IPO. Under the ESPP, eligible employees are granted options to purchase shares of our common stock through payroll deductions. The ESPP provides for eighteen-month offering periods, which include three six-month purchase periods. At the end of each purchase period, employees are able to purchase shares at 85% of the lower of the fair market value of our common stock at the beginning of an offering period or the fair market value of our common stock at the end of the purchase period.
For the year ended December 31, 2015 and 2014, 1.0 million and 0.4 million shares of common stock were purchased under the ESPP. Pursuant to the terms of the ESPP, the number of shares reserved under the ESPP increased by 0.9 million shares and 0.8 shares on January 1, 2016 and 2015, respectively. As of December 31, 2015, 2.9 million shares of common stock were available for issuance under the ESPP.
Stock Option and Grant Plans
Our board of directors adopted the 2009 Stock Option and Grant Plan, or the 2009 Plan, in July 2009. The 2009 Plan was terminated in connection with our IPO, and accordingly, no shares are available for issuance under this plan. The 2009 Plan continues to govern outstanding awards granted thereunder.
Our 2014 Stock Option and Incentive Plan, or the 2014 Plan, serves as the successor to our 2009 Plan. Pursuant to the terms of the 2014 Plan, the number of shares reserved for issuance under the 2014 Plan increased by 4.5 million and 3.8 million shares on January 1, 2016 and 2015, respectively. As of December 31, 2015, we had 4.3 million shares of common stock available for future grants under the 2014 Plan.
78
A summary of our stock option and RSU activity for the year ended December 31, 2015 is as follows (in thousands, except per share information):
|
|
|
|
|
|
|
Options Outstanding |
|
|
RSUs Outstanding |
|
||||||||||||||||||
|
|
|
|
|
|
|
|
|
|
|
|
|
|
|
Weighted |
|
|
|
|
|
|
|
|
|
|
|
|
|
|
|
|
|
|
|
|
|
|
|
|
|
|
|
|
|
Average |
|
|
|
|
|
|
|
|
|
|
Weighted |
|
||
|
|
|
Shares |
|
|
|
|
|
|
Weighted |
|
|
Remaining |
|
|
Aggregate |
|
|
|
|
|
|
Average |
|
|||||
|
|
|
Available |
|
|
Number of |
|
|
Average |
|
|
Contractual |
|
|
Intrinsic |
|
|
Outstanding |
|
|
Grant Date |
|
|||||||
|
|
|
for Grant |
|
|
Shares |
|
|
Exercise Price |
|
|
Term |
|
|
Value |
|
|
RSUs |
|
|
Fair Value |
|
|||||||
|
|
|
|
|
|
|
|
|
|
|
|
|
|
|
(In years) |
|
|
|
|
|
|
|
|
|
|
|
|
|
|
|
Outstanding — January 1, 2015 |
|
|
7,559 |
|
|
|
12,043 |
|
|
$ |
7.39 |
|
|
|
8.29 |
|
|
$ |
204,467 |
|
|
|
3,064 |
|
|
$ |
13.69 |
|
|
Increase in authorized shares |
|
|
3,779 |
|
|
|
|
|
|
|
|
|
|
|
|
|
|
|
|
|
|
|
|
|
|
|
|
|
|
Stock options granted |
|
|
(2,079 |
) |
|
|
2,079 |
|
|
|
24.34 |
|
|
|
|
|
|
|
|
|
|
|
|
|
|
|
|
|
|
RSUs granted |
|
|
(5,451 |
) |
|
|
|
|
|
|
|
|
|
|
|
|
|
|
|
|
|
|
5,451 |
|
|
|
21.71 |
|
|
Stock options exercised |
|
|
|
|
|
|
(3,275 |
) |
|
|
3.24 |
|
|
|
|
|
|
|
|
|
|
|
|
|
|
|
|
|
|
RSUs vested |
|
|
|
|
|
|
|
|
|
|
|
|
|
|
|
|
|
|
|
|
|
|
(1,655 |
) |
|
|
16.93 |
|
|
Unvested shares repurchased |
|
|
2 |
|
|
|
|
|
|
|
|
|
|
|
|
|
|
|
|
|
|
|
|
|
|
|
|
|
|
Stock options forfeited or canceled |
|
|
70 |
|
|
|
(70 |
) |
|
|
4.31 |
|
|
|
|
|
|
|
|
|
|
|
|
|
|
|
|
|
|
RSUs forfeited or cancelled |
|
|
443 |
|
|
|
|
|
|
|
|
|
|
|
|
|
|
|
|
|
|
|
(443 |
) |
|
|
18.91 |
|
|
Outstanding — December 31, 2015 |
|
|
4,323 |
|
|
|
10,778 |
|
|
$ |
11.94 |
|
|
|
7.96 |
|
|
$ |
156,262 |
|
|
|
6,417 |
|
|
$ |
19.54 |
|
|
Options vested and expected to vest as of December 31, 2015 |
|
|
|
|
|
|
9,888 |
|
|
$ |
11.65 |
|
|
|
7.91 |
|
|
$ |
146,296 |
|
|
|
|
|
|
|
|
|
|
Options vested and exercisable as of December 31, 2015 |
|
|
|
|
|
|
3,983 |
|
|
$ |
8.48 |
|
|
|
7.35 |
|
|
$ |
71,521 |
|
|
|
|
|
|
|
|
|
The total intrinsic value of stock options exercised during each of the years ended December 31, 2015 and 2014 was $66.2 million and during the year ended December 31, 2013 was $4.6 million. Aggregate intrinsic value for options exercised represents the difference between the exercise price and the market value on the date of exercise. The weighted-average grant date fair value of stock options granted during the years ended December 31, 2015, 2014, and 2013 was $12.44, $7.22, and $1.62, respectively.
Aggregate intrinsic value for options outstanding represents the difference between the closing stock price of our common stock and the exercise price of outstanding, in-the-money options. Zendesk’s closing stock price as reported on the New York Stock Exchange as of December 31, 2015 was $26.44.
Share-Based Compensation Expense
All share-based awards to employees and members of our board of directors are measured based on the grant date fair value of the awards and recognized in the consolidated statements of operations over the period during which the employee is required to perform services in exchange for the award (generally the vesting period of the award). We record share-based compensation expense for service-based equity awards using the straight-line attribution method. We record share-based compensation expense for performance-based equity awards using the accelerated attribution method.
We estimate the fair value of stock options granted using the Black-Scholes option valuation model, which requires assumptions, including the fair value of our underlying common stock, expected term, expected volatility, risk-free interest rate and dividend yield of our common stock. These estimates involve inherent uncertainties and the application of management’s judgment. If factors change and different assumptions are used, our share-based compensation expense could be materially different in the future.
These assumptions are estimated as follows:
|
|
· |
Expected Term. We determine the expected term based on the average period the stock options are expected to remain outstanding generally calculated as the midpoint of the stock options vesting term and contractual expiration period, as we do not have sufficient historical information to develop reasonable expectations about future exercise patterns and post-vesting employment termination behavior. |
79
|
|
· |
Risk-Free Interest Rate. We base the risk-free interest rate used in the Black-Scholes valuation model on the yield available on U.S. Treasury zero-coupon issues with an equivalent remaining term of the stock options for each stock option group. |
|
|
· |
Dividend Yield. We have not paid and do not anticipate paying any cash dividends in the foreseeable future and, therefore, use an expected dividend yield of zero. |
The assumptions used to estimate the fair value of stock options granted to employees are as follows:
|
|
|
Year Ended December 31, |
|
|||||||||
|
|
|
2015 |
|
|
2014 |
|
|
2013 |
|
|||
|
Expected volatility |
|
49% - 54% |
|
|
54% - 56% |
|
|
50% - 63% |
|
|||
|
Dividend rate |
|
|
0% |
|
|
|
0% |
|
|
|
0% |
|
|
Risk-free interest rate |
|
1.4% - 2.0% |
|
|
1.75% - 2.02% |
|
|
0.63% - 2.02% |
|
|||
|
Expected term (in years) |
|
6.02 - 6.08 |
|
|
6.02 - 6.50 |
|
|
4.47 - 6.27 |
|
|||
The assumptions used to estimate the fair value of ESPP awards are as follows:
|
|
|
Year Ended December 31, 2015 |
|
|
Year Ended December 31, 2014 |
|
||
|
Expected volatility |
|
37% - 43% |
|
|
45% - 49% |
|
||
|
Dividend rate |
|
|
0% |
|
|
|
0% |
|
|
Risk-free interest rate |
|
0.09% - 0.69% |
|
|
0.05% - 0.35% |
|
||
|
Expected term (in years) |
|
0.50 - 1.50 |
|
|
0.50 - 1.50 |
|
||
·In addition to the assumptions used in the Black-Scholes option valuation model, we must also estimate a forfeiture rate to calculate the share-based compensation expense for our awards. Our forfeiture rate is based on an analysis of our actual forfeitures. We will continue to evaluate the appropriateness of the forfeiture rate based on actual forfeiture experience, analysis of employee turnover, and other factors. Changes in the estimated forfeiture rate can have a significant impact on our share-based compensation expense as the cumulative effect of adjusting the rate is recognized in the period the forfeiture estimate is changed. If a revised forfeiture rate is higher than the previously estimated forfeiture rate, an adjustment is made that will result in a decrease to the share-based compensation expense recognized in our financial statements. If a revised forfeiture rate is lower than the previously estimated forfeiture rate, an adjustment is made that will result in an increase to the share-based compensation expense recognized in our financial statements.
·We will continue to use judgment in evaluating the expected volatility, expected term, and forfeiture rate utilized in our share-based compensation expense calculations on a prospective basis. As we continue to accumulate additional data related to our common stock, we may refine our estimates of expected volatility, expected term, and forfeiture rates, which could materially impact our future share-based compensation expense.
In the year ended December 31, 2015 and 2014, we recorded none and $4.3 million of share-based compensation expense related to accelerated vesting of stock options for terminated employees, respectively.
80
Early Exercise of Stock Options and Purchase of Unvested Stock Awards
Certain of our stock options permit early exercise. Common stock purchased pursuant to an early exercise of stock options or unvested stock awards is not deemed to be outstanding for financial reporting purposes until those shares vest. Therefore, cash received in exchange for unvested shares is recorded as a liability and is transferred into common stock and additional paid-in capital as the shares vest. Upon termination of service, we may, at our discretion, repurchase unvested shares acquired through early exercise of stock options or purchase of unvested stock awards at a price equal to the price per share paid upon the exercise of such options or the purchase of such unvested stock awards. As of December 31, 2015 and 2014 there were 0.3 million and 0.6 million shares outstanding as a result of early exercise of stock options and purchase of unvested stock awards by our employees and directors that were classified as accrued liabilities for an aggregated amount of $1.0 million and $2.1 million, respectively.
Treasury Stock
We repurchased 0.5 million shares of common stock in the year ended December 31, 2011 and recorded the repurchased shares as treasury shares in the stockholders’ equity section of the balance sheet at cost.
Note 10. Net Loss Per Share
We compute net loss per share of common stock in conformity with the two-class method required for participating securities. We considered all series of the redeemable convertible preferred stock to be participating securities as the holders of the preferred stock were entitled to receive a non-cumulative dividend on a pari passu basis in the event that a dividend is paid on common stock. We also consider shares of common stock issued upon the early exercise of stock options subject to repurchase to be participating securities, because holders of such shares have non-forfeitable dividend rights in the event a dividend is paid on common stock. The holders of all series of the redeemable convertible preferred stock and the holders of shares of common stock acquired upon early exercise of stock options do not have a contractual obligation to share in our losses. As such, our net losses for the years ended December 31, 2015, 2014 and 2013 were not allocated to these participating securities. Upon the closing of the IPO in May 2014, all shares of our then-outstanding redeemable convertible preferred stock automatically converted into our common stock.
Basic net loss per share attributable to common stockholders is computed by dividing the net loss attributable to common stockholders by the weighted-average number of shares of common stock outstanding during the period, less the weighted-average unvested common stock subject to repurchase. Diluted net loss per share is computed by giving effect to all potential shares of common stock, including common stock issuable upon conversion of the redeemable convertible preferred stock, outstanding share-based awards, and outstanding warrants, to the extent dilutive. Basic and diluted net loss per share was the same for each period presented as the inclusion of all potential common stock outstanding would have been anti-dilutive.
The following table presents the calculation of basic and diluted net loss per share for the periods presented (in thousands, except per share data):
|
|
|
Year Ended December 31, |
|||||||||||||||
|
|
|
2015 |
|
|
2014 |
|
|
2013 |
|
|
|||||||
|
|
|
|
|
|
|
|
|
|
|
Class A |
|
|
Class B |
|
|
||
|
Net loss |
|
$ |
(84,052 |
) |
|
$ |
(67,415 |
) |
|
$ |
(10,290 |
) |
|
$ |
(12,281 |
) |
|
|
Less: Accretion of redeemable convertible preferred stock |
|
|
— |
|
|
|
(18 |
) |
|
|
(22 |
) |
|
|
(27 |
) |
|
|
Net loss attributable to common stockholders |
|
$ |
(84,052 |
) |
|
$ |
(67,433 |
) |
|
$ |
(10,312 |
) |
|
$ |
(12,308 |
) |
|
|
Basic shares: |
|
|
|
|
|
|
|
|
|
|
|
|
|
|
|
|
|
|
Weighted-average common shares outstanding |
|
|
85,238 |
|
|
|
54,383 |
|
|
|
9,881 |
|
|
|
12,964 |
|
|
|
Less: Weighted-average common shares subject to repurchase |
|
|
(312 |
) |
|
|
(812 |
) |
|
|
— |
|
|
|
(1,171 |
) |
|
|
Weighted-average common shares used to compute basic net loss per share |
|
|
84,926 |
|
|
|
53,571 |
|
|
|
9,881 |
|
|
|
11,793 |
|
|
|
Diluted shares: |
|
|
|
|
|
|
|
|
|
|
|
|
|
|
|
|
|
|
Weighted-average common shares used to compute diluted net loss per share |
|
|
84,926 |
|
|
|
53,571 |
|
|
|
9,881 |
|
|
|
11,793 |
|
|
|
Net loss per share attributable to common stockholders: |
|
|
|
|
|
|
|
|
|
|
|
|
|
|
|
|
|
|
Basic and diluted |
|
$ |
(0.99 |
) |
|
$ |
(1.26 |
) |
|
$ |
(1.04 |
) |
|
$ |
(1.04 |
) |
|
81
The anti-dilutive securities excluded from the shares used to calculate the diluted net loss per share are as follows (in thousands):
|
|
|
As of December 31, |
|
|||||||||
|
|
|
2015 |
|
|
2014 |
|
|
2013 |
|
|||
|
Redeemable convertible preferred stock |
|
|
— |
|
|
|
— |
|
|
|
34,323 |
|
|
Shares subject to outstanding common stock options and employee stock purchase plan |
|
|
10,844 |
|
|
|
12,178 |
|
|
|
10,134 |
|
|
Shares subject to common stock warrants |
|
|
— |
|
|
|
— |
|
|
|
125 |
|
|
Restricted stock units |
|
|
6,417 |
|
|
|
3,064 |
|
|
|
811 |
|
|
|
|
|
17,260 |
|
|
|
15,242 |
|
|
|
45,393 |
|
Note 11. Income Taxes
The components of loss before provision for income taxes are as follows (in thousands):
|
|
|
Year Ended December 31, |
|
|||||||||
|
|
|
2015 |
|
|
2014 |
|
|
2013 |
|
|||
|
U.S. |
|
$ |
(85,928 |
) |
|
$ |
(66,755 |
) |
|
$ |
(23,117 |
) |
|
Foreign |
|
|
2,214 |
|
|
|
(923 |
) |
|
|
767 |
|
|
Total |
|
$ |
(83,714 |
) |
|
$ |
(67,678 |
) |
|
$ |
(22,350 |
) |
The income tax provision is composed of the following (in thousands):
|
|
|
Year Ended December 31, |
|
|||||||||
|
|
|
2015 |
|
|
2014 |
|
|
2013 |
|
|||
|
Current tax provision: |
|
|
|
|
|
|
|
|
|
|
|
|
|
Federal |
|
$ |
1 |
|
|
$ |
2 |
|
|
$ |
— |
|
|
State |
|
|
(3 |
) |
|
|
1 |
|
|
|
37 |
|
|
Foreign |
|
|
1,693 |
|
|
|
567 |
|
|
|
189 |
|
|
|
|
|
1,691 |
|
|
|
570 |
|
|
|
226 |
|
|
|
|
|
|
|
|
|
|
|
|
|
|
|
|
Deferred tax provision: |
|
|
|
|
|
|
|
|
|
|
|
|
|
Federal |
|
|
(16 |
) |
|
|
— |
|
|
|
— |
|
|
State |
|
|
— |
|
|
|
— |
|
|
|
— |
|
|
Foreign |
|
|
(1,337 |
) |
|
|
(833 |
) |
|
|
(5 |
) |
|
Total provision for (benefit from) income taxes |
|
$ |
338 |
|
|
$ |
(263 |
) |
|
$ |
221 |
|
Significant components of deferred tax assets are as follows (in thousands):
|
|
|
As of December 31, |
|
|||||
|
|
|
2015 |
|
|
2014 |
|
||
|
Deferred tax assets: |
|
|
|
|
|
|
|
|
|
Tax credit carryforward |
|
$ |
266 |
|
|
$ |
197 |
|
|
Net operating loss carryforward |
|
|
53,237 |
|
|
|
33,878 |
|
|
Share-based compensation |
|
|
10,733 |
|
|
|
5,311 |
|
|
Accrued liabilities and reserves |
|
|
3,840 |
|
|
|
3,710 |
|
|
Other |
|
|
2,609 |
|
|
|
600 |
|
|
Total deferred tax assets |
|
|
70,685 |
|
|
|
43,696 |
|
|
Less: valuation allowance |
|
|
(65,371 |
) |
|
|
(39,496 |
) |
|
Deferred tax assets, net of valuation allowance |
|
|
5,314 |
|
|
|
4,200 |
|
|
Deferred tax liabilities: |
|
|
|
|
|
|
|
|
|
Depreciation and amortization |
|
|
(6,335 |
) |
|
|
(4,597 |
) |
|
Net deferred tax assets (liabilities) |
|
$ |
(1,021 |
) |
|
$ |
(397 |
) |
82
The following is a reconciliation of the statutory federal income tax rate and the effective tax rates:
|
|
|
Year Ended December 31, |
|
|||||||||
|
|
|
2015 |
|
|
2014 |
|
|
2013 |
|
|||
|
Tax at federal statutory rate |
|
|
34.0 |
% |
|
|
34.0 |
% |
|
|
34.0 |
% |
|
State tax provision, net of federal benefit |
|
|
— |
|
|
|
— |
|
|
|
(0.2 |
) |
|
Share-based compensation |
|
|
(5.5 |
) |
|
|
(5.5 |
) |
|
|
(4.4 |
) |
|
Valuation allowance |
|
|
(29.2 |
) |
|
|
(27.9 |
) |
|
|
(30.4 |
) |
|
Other |
|
|
0.3 |
|
|
|
(0.2 |
) |
|
|
— |
|
|
Effective tax rate |
|
|
(0.4 |
%) |
|
|
0.4 |
% |
|
|
(1.0 |
%) |
We have not provided U.S. income taxes and foreign withholding taxes on the undistributed earnings of foreign subsidiaries as of December 31, 2015 because we intend to permanently reinvest such earnings outside of the U.S. If these foreign earnings were to be repatriated in the future, the related U.S. tax liability may be reduced by any foreign income taxes previously paid on these earnings. As of December 31, 2015, the cumulative amount of earnings upon which U.S. income taxes have not been provided is approximately $3.5 million. Determination of the amount of unrecognized deferred tax liability related to these earnings is not practicable.
As of December 31, 2015, we had net operating loss carryforwards of approximately $243.0 million for federal income taxes and $67.2 million for state income taxes. If not utilized, these carryforwards will begin to expire in 2029 for federal purposes and 2031 for state purposes. Internal Revenue Code Section 382 limits the use of net operating loss and tax credit carryforwards in certain situations where changes occur in the stock ownership of a company. In the event that we had a change of ownership, utilization of the net operating loss and tax credit carryforwards may be restricted. In addition, we have $3.3 million of net operating loss carryforwards in France resulting from our acquisition of WAC. These carryforward losses do not expire, however, utilization of these carryforwards may be subject to annual limitations. In addition, the right to the carryforward losses could be challenged if the French tax authorities determined that a significant change in the company’s actual business has occurred.
We account for income taxes under an asset and liability approach. Deferred income taxes reflect the impact of temporary differences between assets and liabilities recognized for financial reporting purposes and such amounts recognized for income tax reporting purposes, net operating loss carryforwards, and other tax credits measured by applying currently enacted tax laws. Realization of deferred tax assets is dependent on future earnings, if any, the timing and amount of which are uncertain. We regularly assess the need for a valuation allowance against our deferred tax assets by considering both positive and negative evidence to determine whether it is more-likely-than-not that some or all of the deferred tax assets will not be realized. We recorded a valuation allowance to fully offset our U.S. deferred tax assets, as we consider our cumulative loss in recent years to be strong negative evidence for retaining the valuation allowance. The valuation allowance increased by $25.9 million during the twelve months ended December 31, 2015. We will continue to assess the future realization of our deferred tax assets in each applicable jurisdiction and adjust the valuation allowance accordingly.
As of December 31, 2015, we had research and development credit carryforwards of approximately, $3.8 million and $4.1 million for federal and state income taxes, respectively. If not utilized, the federal carryforwards will begin to expire in 2029. The state tax credit can be carried forward indefinitely.
A share option exercise may result in a tax deduction prior to the actual recognition of the related excess tax benefit because we have a net operating loss carryforward. Our net operating losses include $97.4 million of excess stock option benefits that will be creditable to additional paid in capital when realized.
83
A reconciliation of the beginning and ending amount of unrecognized tax benefits (excluding interest and penalties) is as follows (in thousands):
|
Balance at December 31, 2013 |
|
$ |
3,917 |
|
|
Additions for tax positions related to the prior year |
|
|
(32 |
) |
|
Additions for tax positions related to the current year |
|
|
2,070 |
|
|
Lapse of statutes of limitations |
|
|
— |
|
|
Balance at December 31, 2014 |
|
|
5,955 |
|
|
Additions for tax positions related to the prior year |
|
|
(57 |
) |
|
Additions for tax positions related to the current year |
|
|
2,605 |
|
|
Lapse of statutes of limitations |
|
|
— |
|
|
Balance at December 31, 2015 |
|
$ |
8,503 |
|
As of December 31, 2015, we had $0.3 million of interest and penalties related to the uncertain tax positions. We have elected to record interest and penalties in the financial statements as a component of income taxes. Included in the balance of unrecognized tax benefits at December 31, 2015 and 2014 are potential benefits of $1.0 million and $0.9 million, respectively, which if recognized, would affect the effective tax rate.
We are currently unaware of any uncertain tax positions that could result in significant additional payments, accruals, or other material deviation in this estimate over the next 12 months.
Our 2009-2014 tax years remain subject to examination by the taxing authorities for U.S. federal, state, and foreign tax purposes.
Note 12. Geographic Information
Revenue
The following table presents our revenue by geographic areas, as determined based on the billing address of our customers (in thousands):
|
|
|
Year Ended December 31, |
|
|||||||||
|
|
|
2015 |
|
|
2014 |
|
|
2013 |
|
|||
|
United States |
|
$ |
116,220 |
|
|
$ |
72,217 |
|
|
$ |
42,415 |
|
|
EMEA |
|
|
59,047 |
|
|
|
35,856 |
|
|
|
19,125 |
|
|
Other |
|
|
33,501 |
|
|
|
18,976 |
|
|
|
10,505 |
|
|
Total |
|
$ |
208,768 |
|
|
$ |
127,049 |
|
|
$ |
72,045 |
|
Long-Lived Assets
The following table presents our long-lived assets by geographic areas (in thousands):
|
|
|
As of |
|
|
As of |
|
||
|
|
|
December 31, 2015 |
|
|
December 31, 2014 |
|
||
|
United States |
|
$ |
26,696 |
|
|
$ |
22,817 |
|
|
EMEA |
|
|
10,351 |
|
|
|
4,373 |
|
|
Other |
|
|
5,332 |
|
|
|
1,096 |
|
|
Total |
|
$ |
42,379 |
|
|
$ |
28,286 |
|
The carrying values of capitalized internal-use software and intangible assets are excluded from the balance of long-lived assets presented in the table above.
Note 13. Retirement Plans
We have a 401(k) retirement and savings plan made available to all United States employees. The 401(k) plan allows each participant to contribute up to an amount not to exceed an annual statutory maximum. We may, at our discretion, make matching contributions to the 401(k) plan. We are responsible for the administrative costs of the 401(k) plan. We have not made any contributions to the 401(k) plan since inception.
84
Item 9. Changes in and Disagreements With Accountants on Accounting and Financial Disclosure.
None.
Item 9A. Controls and Procedures.
Evaluation of Disclosure Controls and Procedures
Our management, with the participation of our Chief Executive Officer and Chief Financial Officer, has evaluated the effectiveness of our disclosure controls and procedures (as defined in Rules 13a- 15(e) and 15d- 15(e) under the Securities Exchange Act of 1934, as amended (the Exchange Act), as of the end of the period covered by this Annual Report on Form 10-K.
Based on this evaluation, our management concluded that, as of December 31, 2015, our disclosure controls and procedures are effective to provide reasonable assurance that information we are required to disclose in reports that we file or submit under the Exchange Act is recorded, processed, summarized, and reported within the time periods specified in the Securities and Exchange Commission's rules and forms, and that such information is accumulated and communicated to our management, including our Chief Executive Officer and Chief Financial Officer, as appropriate, to allow timely decisions regarding required disclosure.
Management's Report on Internal Control over Financial Reporting
Our management is responsible for establishing and maintaining adequate internal control over financial reporting, as defined in Rule 13a-15(f) of the Exchange Act. Our management conducted an evaluation of the effectiveness of our internal control over financial reporting based on the framework in Internal Control—Integrated Framework issued by the Committee of Sponsoring Organizations of the Treadway Commission (2013 framework). Our internal over control over financial reporting includes policies and procedures that provide reasonable assurance regarding the reliability of financial reporting and the preparation of financial statements for external reporting purposes in accordance with U.S. generally accepted accounting principles. Based on this evaluation, management concluded that our internal control over financial reporting was effective as of December 31, 2015. Our independent registered public accounting firm, Ernst & Young LLP, has issued an audit report with respect to our internal control over financial reporting, which appears in Part II, Item 8 of this Annual Report on Form 10-K, and is incorporated herein by reference.
Changes in Internal Control over Financial Reporting
There was no change in our internal control over financial reporting identified in connection with the evaluation required by Rule 13a-15(d) and 15d-15(d) of the Exchange Act that occurred during the quarter ended December 31, 2015 that has materially affected, or is reasonably likely to materially affect, our internal control over financial reporting.
Limitations on Effectiveness of Controls and Procedures
In designing and evaluating the disclosure controls and procedures and internal control over financial reporting, management recognizes that any controls and procedures, no matter how well designed and operated, can provide only reasonable assurance of achieving the desired control objectives. In addition, the design of disclosure controls and procedures and internal control over financial reporting must reflect the fact that there are resource constraints and that management is required to apply its judgment in evaluating the benefits of possible controls and procedures relative to their costs.
None.
85
Item 10. Directors, Executive Officers and Corporate Governance.
The information required by this item will be set forth in our Proxy Statement for the 2016 Annual Meeting of Stockholders, or the 2016 Proxy Statement, to be filed with the SEC within 120 days of the fiscal year ended December 31, 2015 and is incorporated herein by reference.
We have a code of business ethics and conduct that applies to all of our employees, including our Principal Executive Officer, Principal Financial Officer and our Board of Directors. A copy of this code, "Code of Business Conduct and Ethics", is available on our website at http://investor.zendesk.com. We intend to satisfy the disclosure requirement under Item 5.05 of Form 8-K regarding amendment to, or waiver from, a provision of our Code of Business Conduct and Ethics by posting such information on our investor relations website under the heading "Corporate Governance" at http://investor.zendesk.com.
Item 11. Executive Compensation.
The information required by this item will be included in the 2016 Proxy Statement and is incorporated herein by reference.
Item 12. Security Ownership of Certain Beneficial Owners and Management and Related Stockholder Matters.
The information required by this item will be included in the 2016 Proxy Statement and is incorporated herein by reference.
Item 13. Certain Relationships and Related Transactions, and Director Independence.
The information required by this item will be included in the 2016 Proxy Statement and is incorporated herein by reference.
Item 14. Principal Accounting Fees and Services.
The information required by this item will be included in the 2016 Proxy Statement and is incorporated herein by reference.
86
Item 15. Exhibits, Financial Statement Schedules.
|
|
(a) |
The following documents are filed as part of this report: |
|
|
(1) |
Financial statements. |
The financial statements filed as part of this report are listed on the Index to Consolidated Financial Statements in Item 8.
|
|
(2) |
Financial Statement Schedules. |
Schedules not listed above have been omitted because the information required to be set forth therein is not applicable or is shown in the financial statements or notes herein.
|
|
(3) |
Exhibits. |
The documents listed in the Exhibit Index of this report are incorporated by reference or are filed with this report, in each case as indicated therein.
87
Pursuant to the requirements of Section 13 or 15(d) of the Securities Exchange Act of 1934, as amended, the Registrant has duly caused this Report to be signed on its behalf by the undersigned, thereunto duly authorized.
|
|
|
Zendesk, Inc. |
||
|
|
|
|
||
|
Date: February 26, 2016 |
|
By: |
|
/s/ Alan Black |
|
|
|
|
|
Alan Black |
|
|
|
|
|
Senior Vice President and Chief Financial Officer (Principal Financial and Accounting Officer) |
POWER OF ATTORNEY
Each person whose signature appears below constitutes and appoints Mikkel Svane and Alan Black, and each of them, as his or her true and lawful attorney-in-fact and agent, with full power of substitution and resubstitution, for him or her and in his or her name, place and stead, in any and all capacities, to sign any and all amendments to this Annual Report on Form 10-K, and to file the same, with all exhibits thereto, and other documents in connection therewith, with the Securities and Exchange Commission, granting unto said attorneys-in-fact and agents, and each of them, full power and authority to do and perform each and every act and thing requisite and necessary to be done in connection therewith, as fully to all intents and purposes as he or she might or could do in person, hereby ratifying and confirming all that said attorneys-in-fact and agents, or any of them, or their or his substitutes, may lawfully do or cause to be done by virtue thereof.
Pursuant to the requirements of the Securities Exchange Act of 1934, as amended, this report has been signed below by the following persons on behalf of the registrant and in the capacities and on the dates indicated:
|
Signature |
|
Title |
|
Date |
|
|
|
|
||
|
/s/ Mikkel Svane Mikkel Svane |
|
Chief Executive Officer and Chair of the Board of Directors (Principal Executive Officer) |
|
2/26/16 |
|
|
|
|
||
|
/s/ Alan Black Alan Black |
|
Senior Vice President and Chief Financial Officer (Principal Financial and Accounting Officer) |
|
2/26/16 |
|
|
|
|
||
|
/s/ Carl Bass |
|
Director |
|
2/26/16 |
|
Carl Bass
|
|
|
|
|
|
/s/ Peter Fenton Peter Fenton |
|
Director |
|
2/26/16 |
|
|
|
|
||
|
/s/ Caryn Marooney Caryn Marooney |
|
Director |
|
2/26/16 |
|
|
|
|
||
|
/s/ Elizabeth Nelson Elizabeth Nelson |
|
Director |
|
2/26/16 |
|
|
|
|
||
|
/s/ Dana Stalder Dana Stalder |
|
Director |
|
2/26/16 |
|
|
|
|
||
|
/s/ Michelle Wilson Michelle Wilson |
|
Director |
|
2/26/16 |
|
|
|
|
||
88
|
Exhibit |
|
Exhibit Description |
|
Incorporated by Reference |
||||||
|
|
|
Form |
|
File No. |
|
Exhibit |
|
Filing Date |
||
|
|
|
|
|
|
|
|
|
|
|
|
|
2.1 |
|
Share Purchase and Sale Agreement by and among the Registrant, the sellers listed therein, the option holders listed therein, Zopim Technologies Pte Ltd., and the representative of the sellers and option holders listed therein, dated as of March 14, 2014. |
|
S-1 |
|
333-195176 |
|
2.1 |
|
April 10, 2014 |
|
|
|
|
|
|
|
|
|
|
|
|
|
2.2 |
|
Stock Purchase Agreement by and among Zendesk, Inc., We Are Cloud SAS, the Sellers set forth therein, and Rachel Delacour and Alven Capital Partners, represented by Mr. Jérémy Uzan, as the Sellers’ Representatives, dated October 13, 2015. |
|
8-K |
|
001-36456 |
|
2.1 |
|
October 13, 2015 |
|
|
|
|
|
|
|
|
|
|
|
|
|
2.3 |
|
Stock Purchase Agreement by and among Zendesk, Inc., We Are Cloud SAS, and the Sellers set forth therein, dated October 13, 2015. |
|
8-K |
|
001-36456 |
|
2.2 |
|
October 13, 2015 |
|
|
|
|
|
|
|
|
|
|
|
|
|
3.1 |
|
Amended and Restated Certificate of Incorporation of the Registrant. |
|
10-Q |
|
001-36456 |
|
3.1 |
|
August 7, 2014 |
|
|
|
|
|
|
|
|
|
|
|
|
|
3.2 |
|
Amended and Restated By-laws of the Registrant. |
|
10-Q |
|
001-36456 |
|
3.2 |
|
April 10, 2014 |
|
|
|
|
|
|
|
|
|
|
|
|
|
4.1 |
|
Form of Common Stock Certificate of the Registrant. |
|
S-1 |
|
333-195176 |
|
4.1 |
|
May 5, 2014 |
|
|
|
|
|
|
|
|
|
|
|
|
|
10.1# |
|
2009 Stock Option and Grant Plan, as amended, and related form agreements. |
|
S-1 |
|
333-195176 |
|
10.2 |
|
April 10, 2014 |
|
|
|
|
|
|
|
|
|
|
|
|
|
10.2# |
|
2014 Stock Option and Incentive Plan, and related form agreements. |
|
|
|
|
|
|
|
|
|
|
|
|
|
|
|
|
|
|
|
|
|
10.3# |
|
2014 Employee Stock Purchase Plan, as amended. |
|
10-Q |
|
001-36456 |
|
10.2 |
|
November 6, 2014 |
|
|
|
|
|
|
|
|
|
|
|
|
|
10.4# |
|
Offer Letter between the Registrant and Alan Black, dated as of October 28, 2011. |
|
S-1 |
|
333-195176 |
|
10.5 |
|
April 10, 2014 |
|
|
|
|
|
|
|
|
|
|
|
|
|
10.5# |
|
Offer Letter between the Registrant and Marcus Bragg, dated as of July 25, 2013. |
|
S-1 |
|
333-195176 |
|
10.6 |
|
April 10, 2014 |
|
|
|
|
|
|
|
|
|
|
|
|
|
10.6# |
|
Offer Letter between the Registrant and Adrian McDermott, dated as of June 16, 2010. |
|
S-1 |
|
333-195176 |
|
10.7 |
|
April 10, 2014 |
|
|
|
|
|
|
|
|
|
|
|
|
|
10.7# |
|
Offer Letter between the Registrant and Anne Raimondi, dated as of July 1, 2013. |
|
S-1 |
|
333-202621 |
|
10.8 |
|
March 9, 2015 |
|
|
|
|
|
|
|
|
|
|
|
|
|
10.8# |
|
Offer Letter and Employment Agreement between the Registrant and Matt Price, dated as of May 9, 2011 and July 15, 2011, respectively. |
|
S-1 |
|
333-202621 |
|
10.9 |
|
March 9, 2015 |
|
|
|
|
|
|
|
|
|
|
|
|
|
10.9# |
|
Offer Letter between the Registrant and John Geschke, dated as of May 30, 2012. |
|
|
|
|
|
|
|
|
|
|
|
|
|
|
|
|
|
|
|
|
|
10.10# |
|
Offer Letter between the Registrant and Amanda Kleha, dated as of September 21, 2009. |
|
|
|
|
|
|
|
|
|
|
|
|
|
|
|
|
|
|
|
|
|
10.11 |
|
Office Lease between the Registrant and 989 Market Street, LLC, dated as of April 29, 2011. |
|
S-1 |
|
333-195176 |
|
10.8 |
|
April 10, 2014 |
|
|
|
|
|
|
|
|
|
|
|
|
|
10.12 |
|
First Amendment to Lease between the Registrant and 989 Market Street, LLC, dated as of June 28, 2011. |
|
S-1 |
|
333-195176 |
|
10.9 |
|
April 10, 2014 |
|
|
|
|
|
|
|
|
|
|
|
|
|
10.13 |
|
Second Amendment to Lease between the Registrant and 989 Market Street, LLC, dated as of August 11, 2011. |
|
S-1 |
|
333-195176 |
|
10.10 |
|
April 10, 2014 |
|
|
|
|
|
|
|
|
|
|
|
|
89
90
|
# |
Indicates management contract or compensatory plan, contract, or agreement. |
|
† |
The certifications attached as Exhibit 32.1 that accompany this Annual Report on Form 10-K, are not deemed filed with the Securities and Exchange Commission and are not to be incorporated by reference into any filing of Zendesk, Inc. under the Securities Act of 1933, as amended, or the Securities Exchange Act of 1934, as amended, whether made before or after the date of this Annual Report on Form 10-K, irrespective of any general incorporation language contained in such filing. |
91