Attached files
| file | filename |
|---|---|
| EX-99.1 - EXHIBIT 99.1 - AMERIGAS PARTNERS LP | ex991mar16.htm |
| 8-K - 8-K - AMERIGAS PARTNERS LP | apumar2016er.htm |
1 Fiscal 2016 Second Quarter Results Jerry Sheridan President & CEO, AmeriGas
2 This presentation contains certain forward-looking statements that management believes to be reasonable as of today’s date only. Actual results may differ significantly because of risks and uncertainties that are difficult to predict and many of which are beyond management’s control. You should read AmeriGas’s Annual Report on Form 10-K for a more extensive list of factors that could affect results. Among them are adverse weather conditions, cost volatility and availability of propane, increased customer conservation measures, the impact of pending and future legal proceedings, political, regulatory and economic conditions in the United States and in foreign countries, the timing and success of our acquisitions, commercial initiatives and investments to grow our business, and our ability to successfully integrate acquired businesses and achieve anticipated synergies. AmeriGas undertakes no obligation to release revisions to its forward-looking statements to reflect events or circumstances occurring after today. About This Presentation
3 Second Quarter Recap Jerry Sheridan President & CEO, AmeriGas
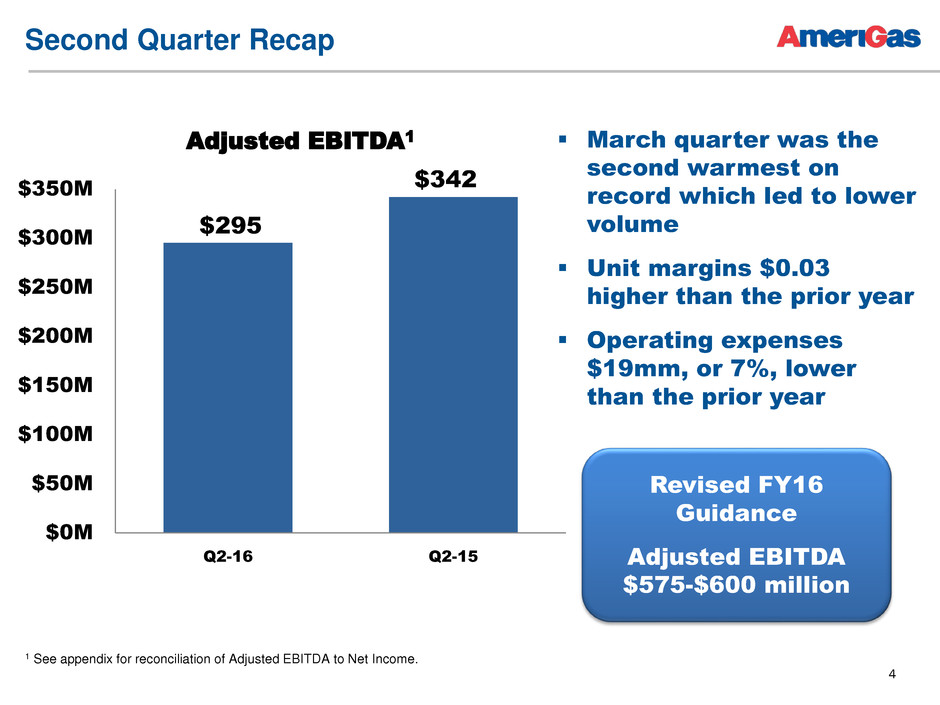
4 Second Quarter Recap March quarter was the second warmest on record which led to lower volume Unit margins $0.03 higher than the prior year Operating expenses $19mm, or 7%, lower than the prior year Adjusted EBITDA1 1 See appendix for reconciliation of Adjusted EBITDA to Net Income. $295 $342 $0M $50M $100M $150M $200M $250M $300M $350M Q2-16 Q2-15 Revised FY16 Guidance Adjusted EBITDA $575-$600 million
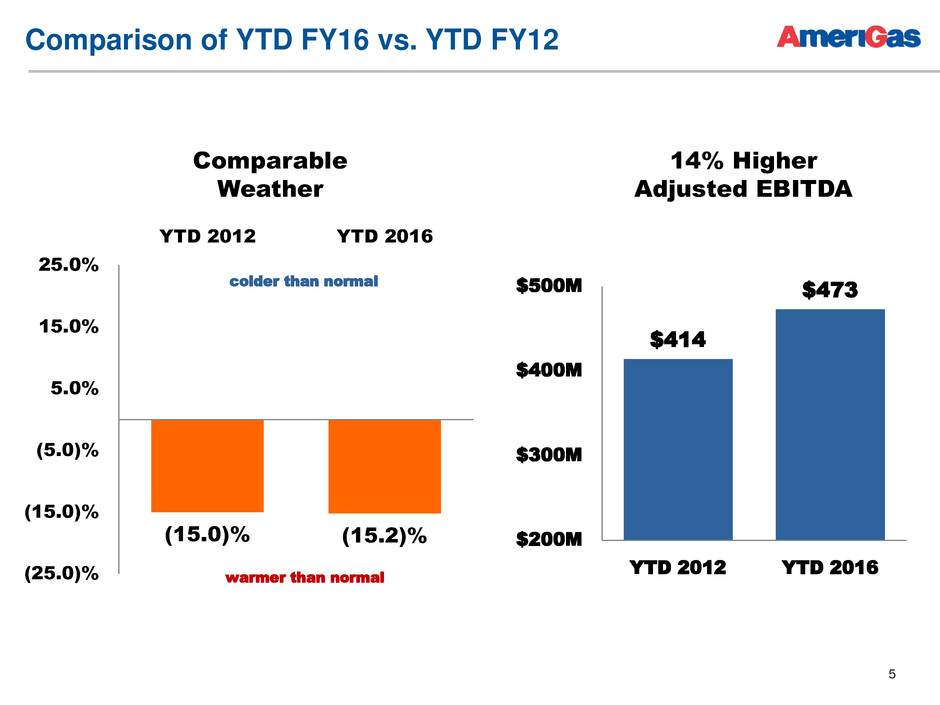
5 $414 $473 $200M $300M $400M $500M YTD 2012 YTD 2016 (15.0)% (15.2)% (25.0)% (15.0)% (5.0)% 5.0% 15.0% 25.0% YTD 2012 YTD 2016 warmer than normal colder than normal 14% Higher Adjusted EBITDA Comparison of YTD FY16 vs. YTD FY12 Comparable Weather
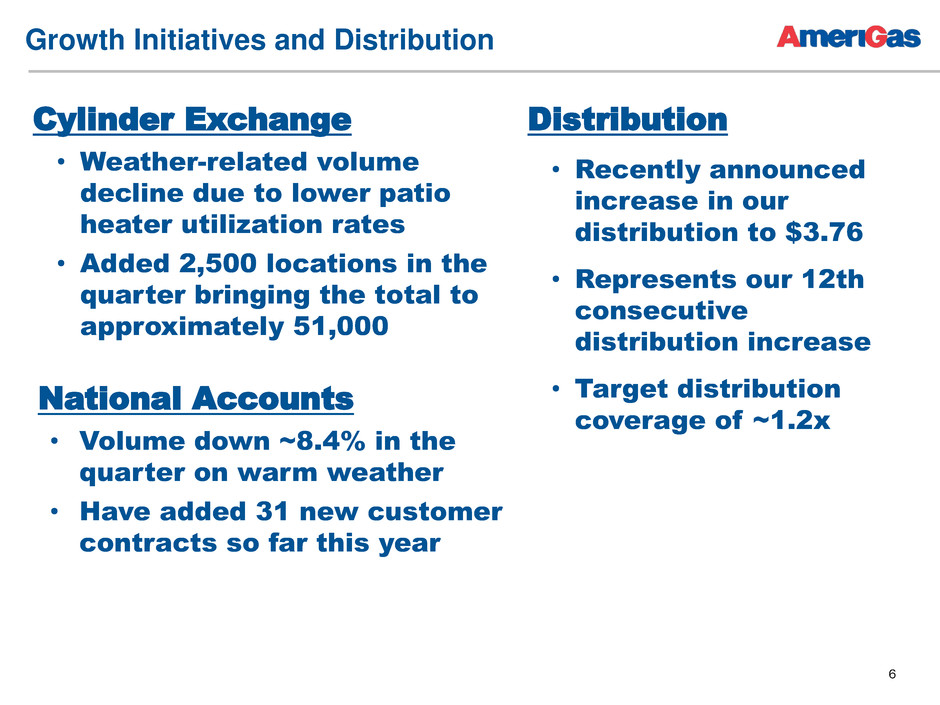
6 Growth Initiatives and Distribution Cylinder Exchange • Weather-related volume decline due to lower patio heater utilization rates • Added 2,500 locations in the quarter bringing the total to approximately 51,000 National Accounts • Volume down ~8.4% in the quarter on warm weather • Have added 31 new customer contracts so far this year Distribution • Recently announced increase in our distribution to $3.76 • Represents our 12th consecutive distribution increase • Target distribution coverage of ~1.2x
7 Appendix
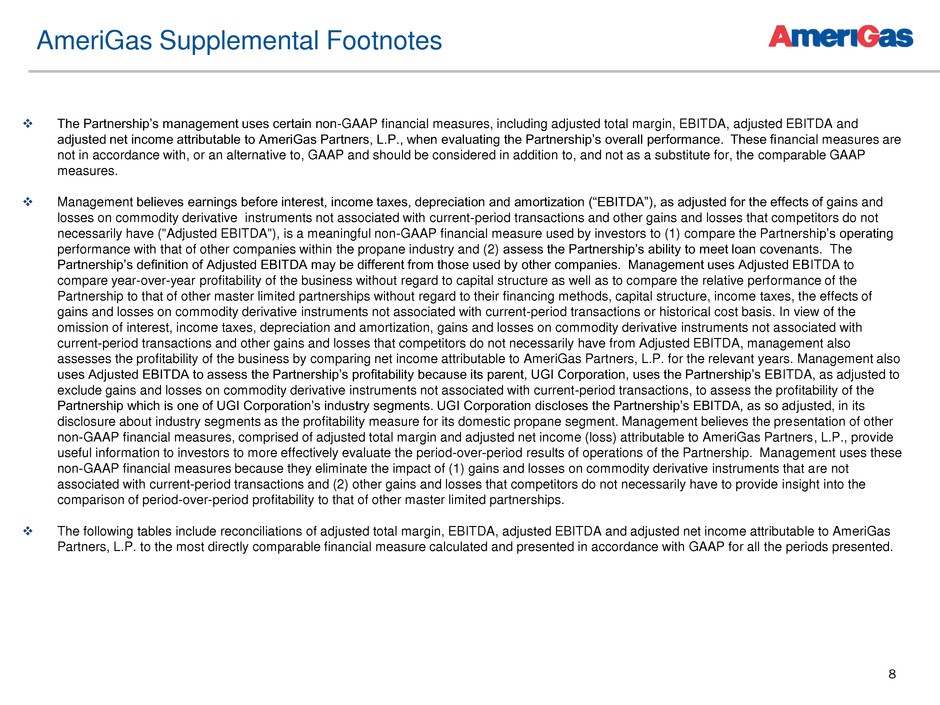
8 The Partnership’s management uses certain non-GAAP financial measures, including adjusted total margin, EBITDA, adjusted EBITDA and adjusted net income attributable to AmeriGas Partners, L.P., when evaluating the Partnership’s overall performance. These financial measures are not in accordance with, or an alternative to, GAAP and should be considered in addition to, and not as a substitute for, the comparable GAAP measures. Management believes earnings before interest, income taxes, depreciation and amortization (“EBITDA”), as adjusted for the effects of gains and losses on commodity derivative instruments not associated with current-period transactions and other gains and losses that competitors do not necessarily have ("Adjusted EBITDA"), is a meaningful non-GAAP financial measure used by investors to (1) compare the Partnership’s operating performance with that of other companies within the propane industry and (2) assess the Partnership’s ability to meet loan covenants. The Partnership’s definition of Adjusted EBITDA may be different from those used by other companies. Management uses Adjusted EBITDA to compare year-over-year profitability of the business without regard to capital structure as well as to compare the relative performance of the Partnership to that of other master limited partnerships without regard to their financing methods, capital structure, income taxes, the effects of gains and losses on commodity derivative instruments not associated with current-period transactions or historical cost basis. In view of the omission of interest, income taxes, depreciation and amortization, gains and losses on commodity derivative instruments not associated with current-period transactions and other gains and losses that competitors do not necessarily have from Adjusted EBITDA, management also assesses the profitability of the business by comparing net income attributable to AmeriGas Partners, L.P. for the relevant years. Management also uses Adjusted EBITDA to assess the Partnership’s profitability because its parent, UGI Corporation, uses the Partnership’s EBITDA, as adjusted to exclude gains and losses on commodity derivative instruments not associated with current-period transactions, to assess the profitability of the Partnership which is one of UGI Corporation’s industry segments. UGI Corporation discloses the Partnership’s EBITDA, as so adjusted, in its disclosure about industry segments as the profitability measure for its domestic propane segment. Management believes the presentation of other non-GAAP financial measures, comprised of adjusted total margin and adjusted net income (loss) attributable to AmeriGas Partners, L.P., provide useful information to investors to more effectively evaluate the period-over-period results of operations of the Partnership. Management uses these non-GAAP financial measures because they eliminate the impact of (1) gains and losses on commodity derivative instruments that are not associated with current-period transactions and (2) other gains and losses that competitors do not necessarily have to provide insight into the comparison of period-over-period profitability to that of other master limited partnerships. The following tables include reconciliations of adjusted total margin, EBITDA, adjusted EBITDA and adjusted net income attributable to AmeriGas Partners, L.P. to the most directly comparable financial measure calculated and presented in accordance with GAAP for all the periods presented. AmeriGas Supplemental Footnotes
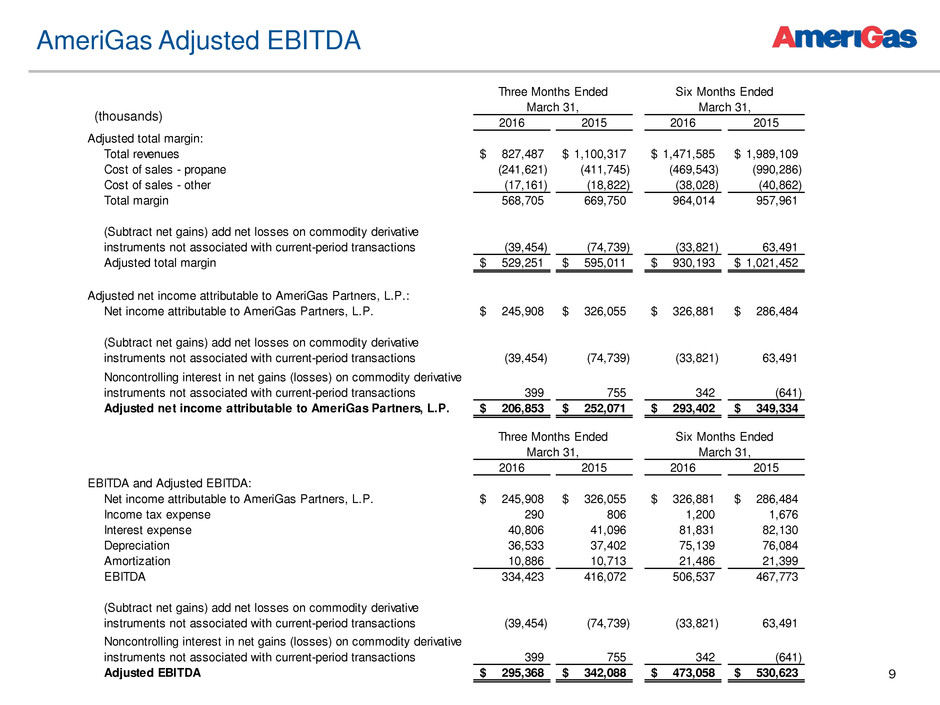
9 AmeriGas Adjusted EBITDA 2016 2015 2016 2015 Adjusted total margin: Total revenues 827,487$ 1,100,317$ 1,471,585$ 1,989,109$ Cost of sales - propane (241,621) (411,745) (469,543) (990,286) Cost of sales - other (17,161) (18,822) (38,028) (40,862) Total margin 568,705 669,750 964,014 957,961 (Subtract net gains) add net losses on commodity derivative instruments not associated with current-period transactions (39,454) (74,739) (33,821) 63,491 Adjusted total margin 529,251$ 595,011$ 930,193$ 1,021,452$ Adjusted net income attributable to AmeriGas Partners, L.P.: Net income attributable to AmeriGas Partners, L.P. 245,908$ 326,055$ 326,881$ 286,484$ (Subtract net gains) add net losses on commodity derivative instruments not associated with current-period transactions (39,454) (74,739) (33,821) 63,491 Noncontrolling interest in net gains (losses) on commodity derivative instruments not associated with current-period transactions 399 755 342 (641) Adjusted net income attributable to AmeriGas Partners, L.P. 206,853$ 252,071$ 293,402$ 349,334$ March 31, March 31, Three Months Ended Six Months Ended 2016 2015 2016 2015 EBITDA and Adjusted EBITDA: Net income attributable to AmeriGas Partners, L.P. 245,908$ 326,055$ 326,881$ 286,484$ I come tax expen e 290 806 1 200 1 676 Interest expense 40,806 41,096 81,831 82,130 Depreciation 36,533 37,402 75,139 76,084 Amortization 10,886 10, 13 21,486 21,399 EBITDA 334,42 416, 2 506,537 467,773 (Subtract net gains) add net losses on commodity derivative instruments not associated with current-period transactions (39,454) (74,739) (33,821) 63,491 Noncontrolling interest in net gains (losses) on commodity derivative instruments not associated with current-period transactions 399 755 342 (641) Adjusted EBITDA 295,368$ 342,088$ 473,058$ 530,623$ March 31, March 31, Three Months Ended Six Months Ended (thousands)
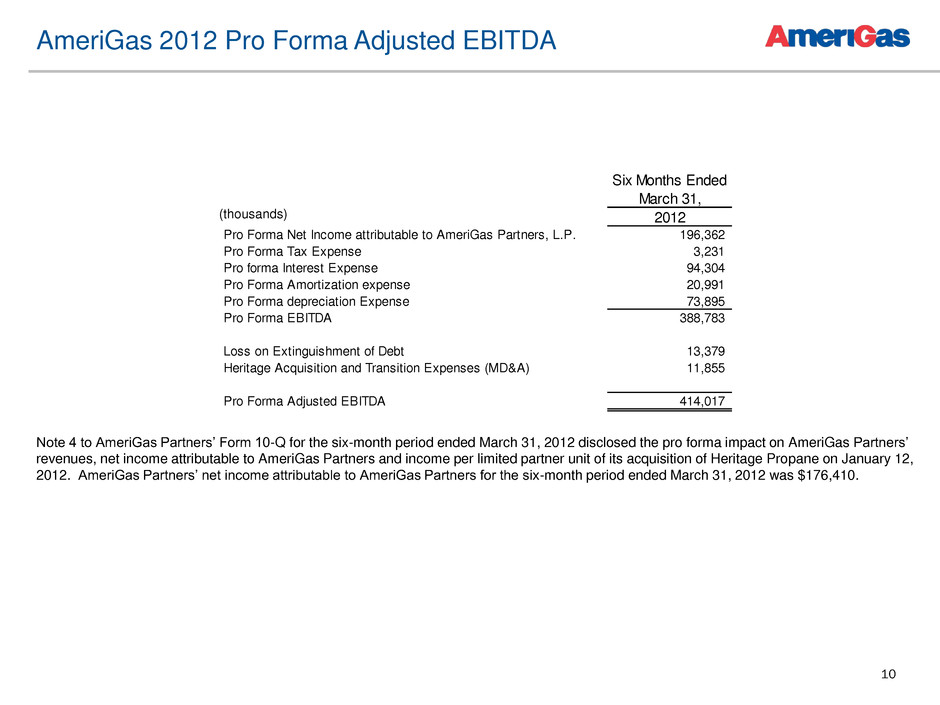
10 AmeriGas 2012 Pro Forma Adjusted EBITDA Six Months Ended March 31, 2012 Pro Forma Net Income attributable to AmeriGas Partners, L.P. 196,362 Pro Forma Tax Expense 3,231 Pro forma Interest Expense 94,304 Pro Forma Amortization expense 20,991 Pro Forma depreciation Expense 73,895 Pro Forma EBITDA 388,783 Loss on Extinguishment of Debt 13,379 Heritage Acquisition and Transition Expenses (MD&A) 11,855 Pro Forma Adjusted EBITDA 414,017 (thousands) Note 4 to AmeriGas Partners’ Form 10-Q for the six-month period ended March 31, 2012 disclosed the pro forma impact on AmeriGas Partners’ revenues, net income attributable to AmeriGas Partners and income per limited partner unit of its acquisition of Heritage Propane on January 12, 2012. AmeriGas Partners’ net income attributable to AmeriGas Partners for the six-month period ended March 31, 2012 was $176,410.

11 Investor Relations: Will Ruthrauff 610-456-6571 ruthrauffw@ugicorp.com
