Attached files
| file | filename |
|---|---|
| 8-K - SHENANDOAH TELECOMMUNICATIONS COMPANY 8-K 4-29-2016 - SHENANDOAH TELECOMMUNICATIONS CO/VA/ | form8k.htm |

April 29, 2016 1Q 2016Earnings Conference Call Exhibit 99.1
Safe Harbor Statement This presentation includes “forward-looking statements” within the meaning of Section 27A of the Securities Act and Section 21E of the Securities Exchange Act of 1934, as amended, regarding, among other things, our business strategy, our prospects and our financial position. These statements can be identified by the use of forward-looking terminology such as “believes,” “estimates,” “expects,” “intends,” “may,” “will,” “should,” “could,” or “anticipates” or the negative or other variation of these similar words, or by discussions of strategy or risks and uncertainties. These statements are based on current expectations of future events. If underlying assumptions prove inaccurate or unknown risks or uncertainties materialize, actual results could vary materially from the Company’s expectations and projections. Important factors that could cause actual results to differ materially from such forward-looking statements include, without limitation, risks related to the following: Increasing competition in the communications industry; andA complex and uncertain regulatory environment.A further list and description of these risks, uncertainties and other factors can be found in the Company’s SEC filings which are available online at www.sec.gov, www.shentel.com or on request from the Company. The Company does not undertake to update any forward-looking statements as a result of new information or future events or developments.

Use of Non-GAAP Financial Measures Included in this presentation are certain non-GAAP financial measures that are not determined in accordance with US generally accepted accounting principles. These financial performance measures are not indicative of cash provided or used by operating activities and exclude the effects of certain operating, capital and financing costs and may differ from comparable information provided by other companies, and they should not be considered in isolation, as an alternative to, or more meaningful than measures of financial performance determined in accordance with US generally accepted accounting principles. These financial performance measures are commonly used in the industry and are presented because Shentel believes they provide relevant and useful information to investors. Shentel utilizes these financial performance measures to assess its ability to meet future capital expenditure and working capital requirements, to incur indebtedness if necessary, return investment to shareholders and to fund continued growth. Shentel also uses these financial performance measures to evaluate the performance of its businesses and for budget planning purposes.

Chris FrenchPresident and CEO

First Quarter 2016 Highlights (Q1’16 v. Q1’15) Net Income GrowthIncreased 35.0% to $13.9 million Adjusted OIBDA Growth Increased 12.8% to $40.4 millionRevenue Growth Increased 9.8% to $92.6 millionCustomer Growth 3/31/15 3/31/16 ChangeWireless 438,861 457,770 +18,909Cable (RGUs) 123,328 131,527 +8,199

Wireless Highlights PCS Customers (000s) Postpaid Growth Postpaid customers up 8.3% over last 12 monthsPrepaid DeclinePrepaid customers down 3.5% over last 12 monthsOperating IncomeAn increase of $0.5 million, or 2.5%
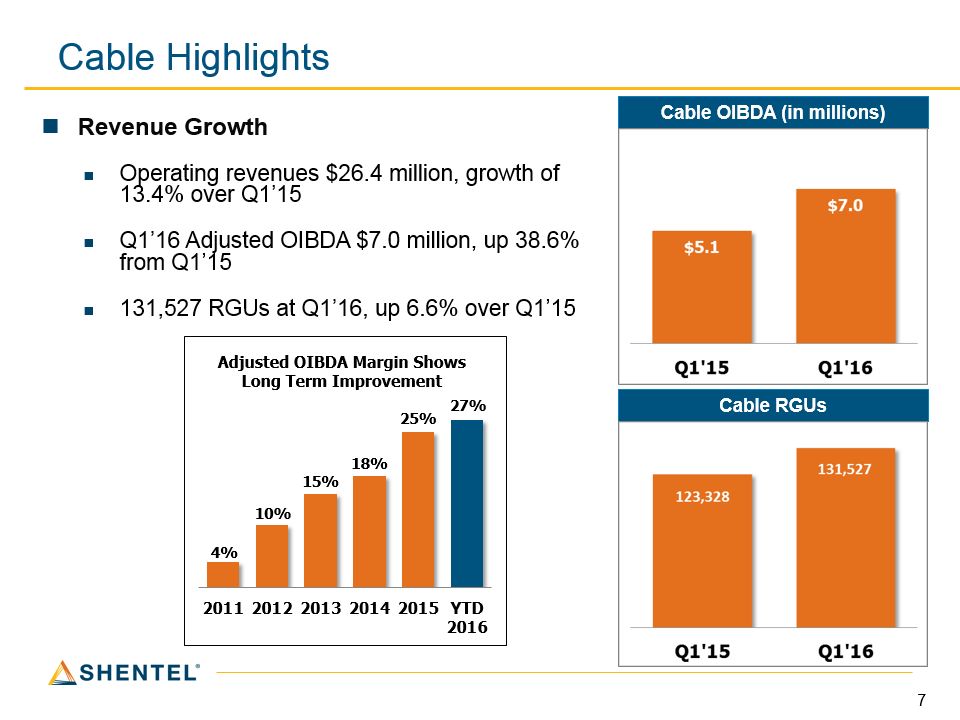
Cable Highlights Revenue GrowthOperating revenues $26.4 million, growth of 13.4% over Q1’15Q1’16 Adjusted OIBDA $7.0 million, up 38.6% from Q1’15131,527 RGUs at Q1’16, up 6.6% over Q1’15 Cable OIBDA (in millions) Cable RGUs

Other Highlights Wireline and Cable -Fiber lease revenues of $10.0 million, up 25.4% from Q1’15157 towers generated $1.9 million of OIBDA *Fiber Lease Revenue (in millions) Mobile Tower OIBDA ($ thousands) *Includes both Affiliate and Non-affiliate revenues

Adele SkolitsVP of Finance and CFO

Profitability Consolidated Results($ in thousands, except per share amounts) 3/31/15 3/31/16 Change Operating Income $ 18,526 $ 21,312 15% Net Income $ 10,286 $ 13,881 35% Earnings Per Share: Basic Diluted $ 0.21$ 0.21 $ 0.29 $ 0.28 38% 33% For the Quarter Ended:___

Profitability Adjusted OIBDA ($ thousands)

Adjusted OIBDA by Segment ($ millions)

Wireless Segment – Change in Adjusted OIBDA Q1’16 vs. Q1’15 ($ millions)

Cable Segment – Change in Adjusted OIBDA Q1’16 vs. Q1’15 ($ millions)
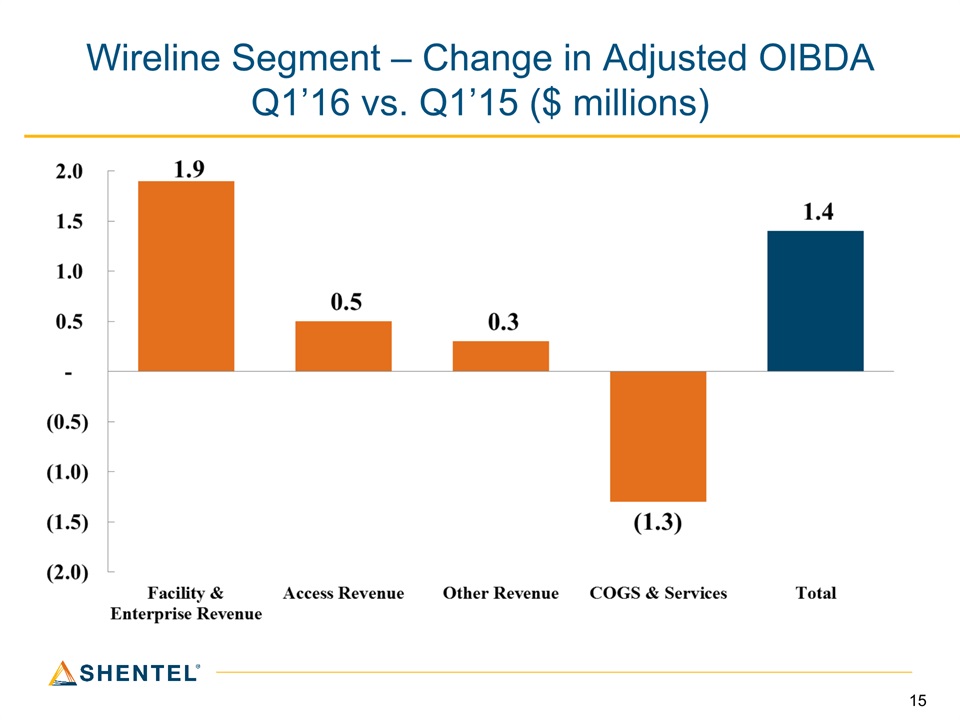
Wireline Segment – Change in Adjusted OIBDA Q1’16 vs. Q1’15 ($ millions)

Earle MacKenzieEVP and COO

Postpaid Customer Growth PCS Postpaid Customers (000s)

Postpaid Customer Additions Net Additions - Postpaid Gross Additions - Postpaid Net adds of 2,719 in Q1 2016 versus 3,211 in Q1 2015Shentel-controlled channels produced 33% of gross adds in Q1 2016 and 39% in Q1 2015Q1 2016 churn of 1.56%, down from 1.60% in Q1 2015 Postpaid Churn
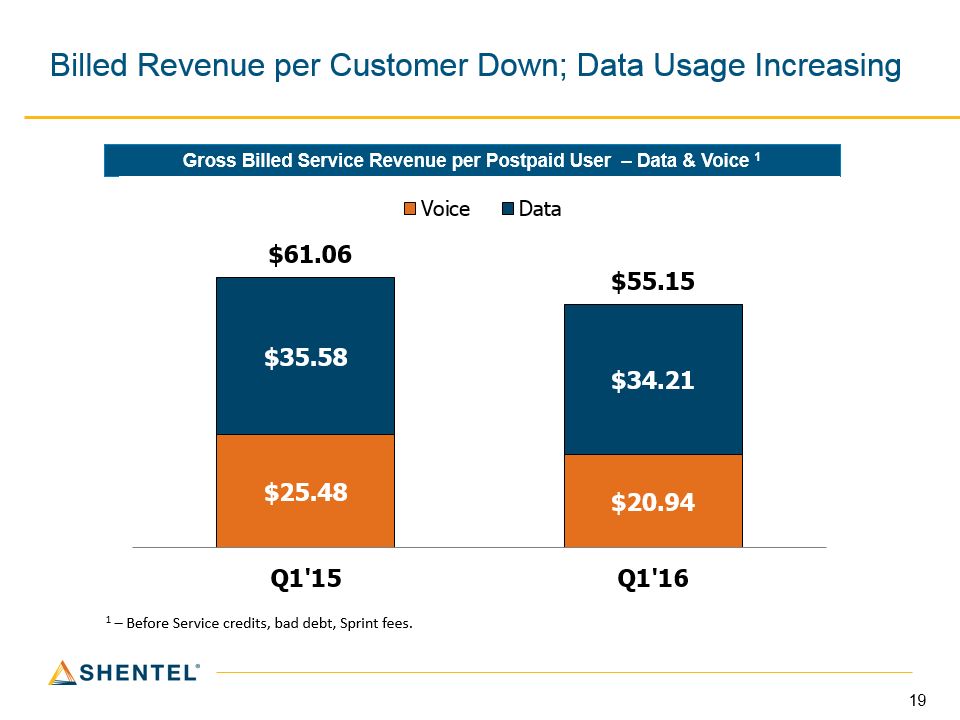
Billed Revenue per Customer Down; Data Usage Increasing Gross Billed Service Revenue per Postpaid User – Data & Voice 1 1 – Before Service credits, bad debt, Sprint fees.
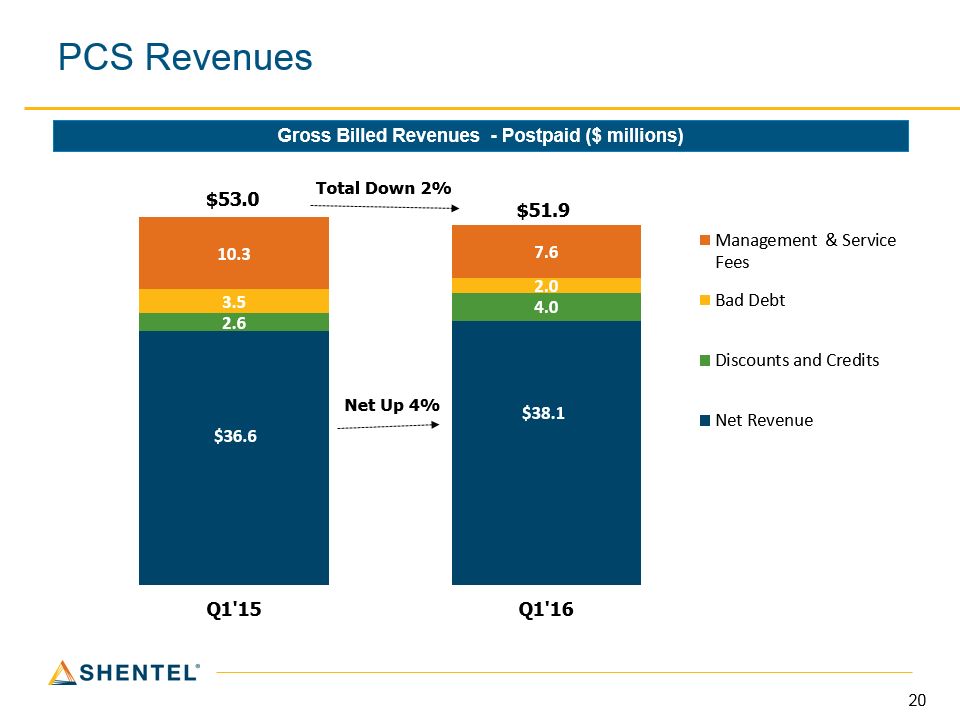
PCS Revenues Gross Billed Revenues - Postpaid ($ millions)

PCS Prepaid Statistics Gross Additions (000s) Cumulative Customers (000s)
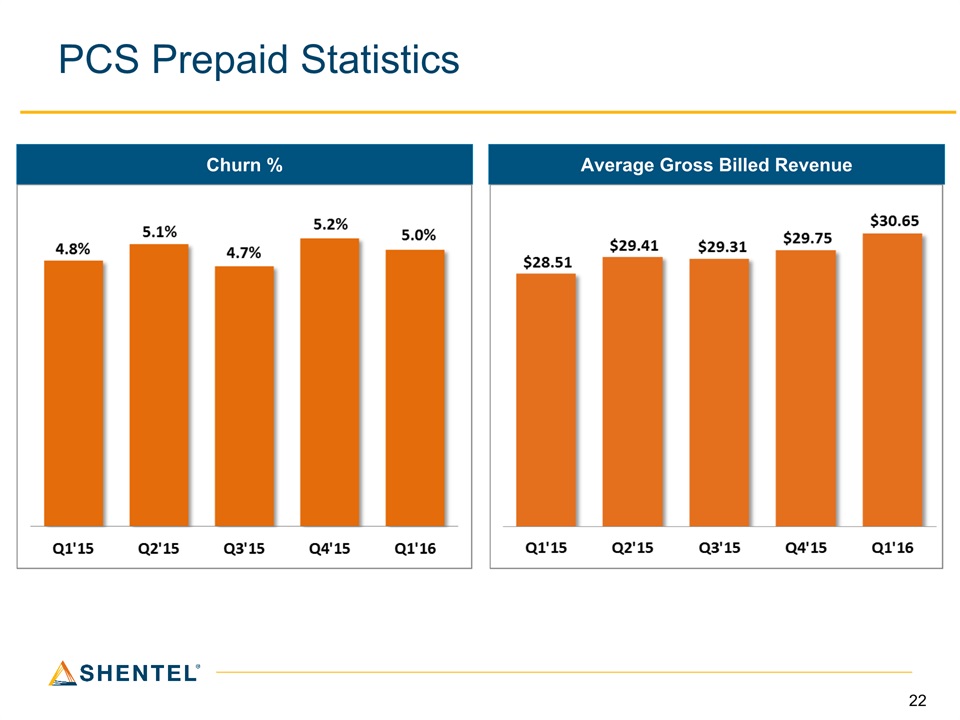
PCS Prepaid Statistics Churn % Average Gross Billed Revenue

Network Statistics at 3/31/16 556 Cell Sites95% have a second LTE carrier at 800 MHz 193 sites have three carriers, including a second carrier at 1900 MHz61 2.5 GHz sitesTraffic 92% of data traffic is on LTE, with 30% on 800 MHz, 5% on 2.5GHzData usage grew 19% in Q1’16Average speeds of approximately 5 MbpsAverage customer uses approximately 5 GB per monthDropped calls - 0.4%Blocked calls - 0.3%
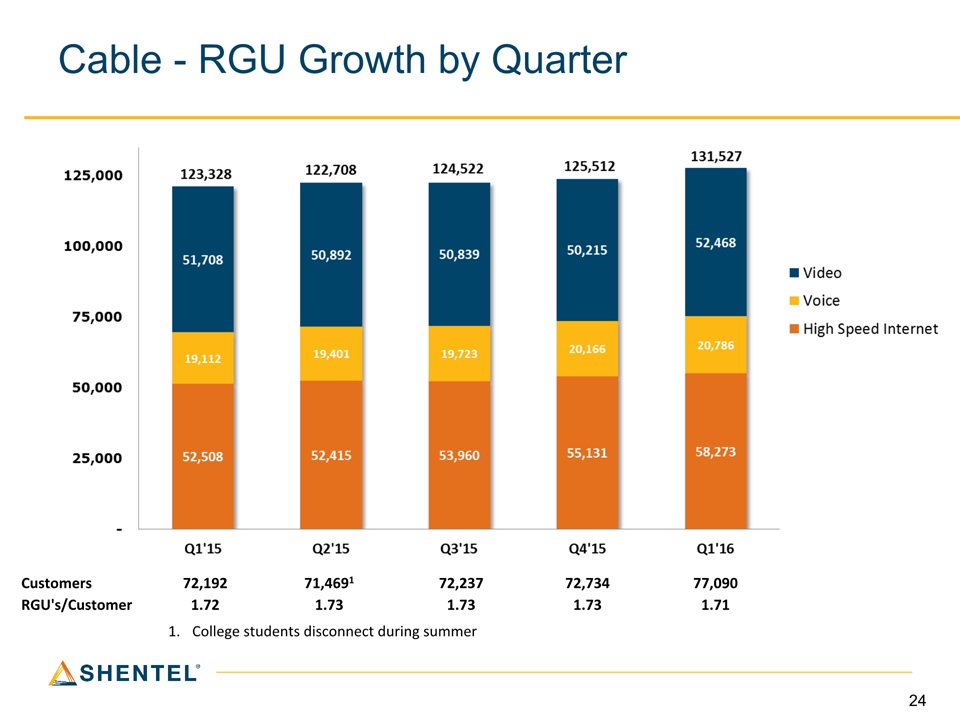
Cable - RGU Growth by Quarter Customers 72,192 71,4691 72,237 72,734 77,090 RGU's/Customer 1.72 1.73 1.73 1.73 1.71 College students disconnect during summer

Increasing Average Monthly Cable Revenue Average Monthly Revenue per RGU Average Monthly Revenue per Customer* *Average monthly revenue per video subscriber was $141.46 and $159.60 for Q1 2015 and Q1 2016, respectively.

Key Operational Results – Cable* *Excludes cable operations in Shenandoah County, VA which are included in the Wireline segment.

Key Operational Results - Wireline Access line loss of 9.2% in past 12 months as a result of no longer requiring access line to purchase internet serviceEffective Q4’15, subscribers were offered a cable modem internet option up to 101 Mbps5,232 video subscribers at 3/31/16 Access lines (000s) DSL & Cable Modem Customers (000s)

Wireline and Cable Fiber Sales ($ millions) Fiber Lease Revenue New External Fiber Lease Contracts* * Amounts shown represent the total contract value. Contract Terms range from 36 to 120 months.
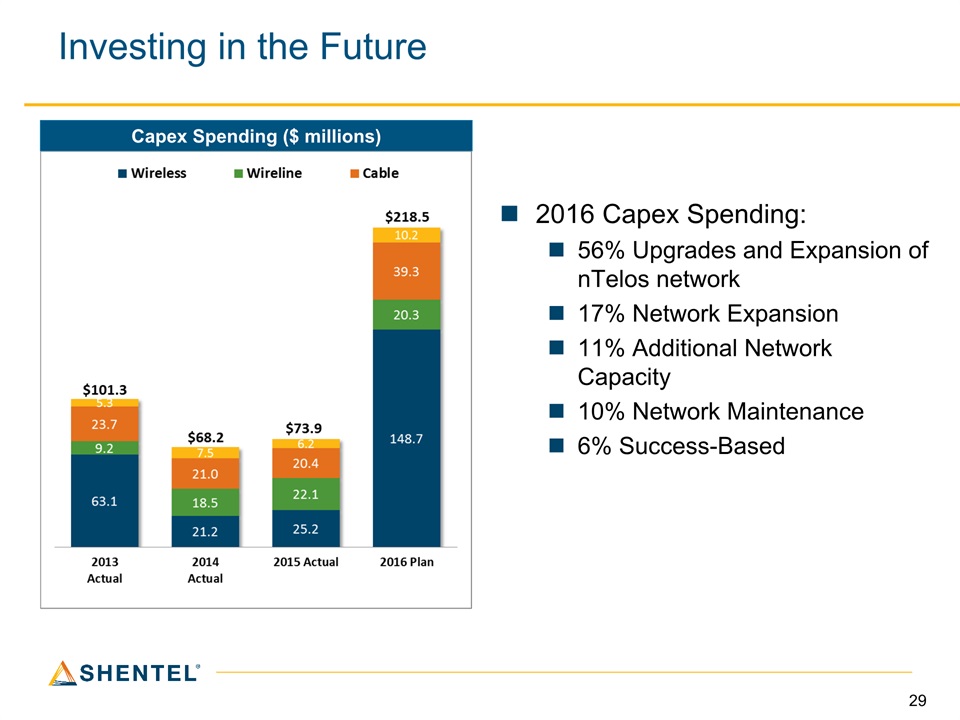
Investing in the Future Capex Spending ($ millions) 2016 Capex Spending:56% Upgrades and Expansion of nTelos network17% Network Expansion11% Additional Network Capacity10% Network Maintenance6% Success-Based

Q&A

Appendix

Non-GAAP Financial Measures – Billed Revenue per Prepaid & Postpaid Subscriber Calculation of Billed revenue per subscriber = Gross billed revenue / Average subscribers / 3 months

Postpaid PCS Customers Top Picks Q1 2016 Top Service Plans – 57% of Gross Adds Top Devices – New Activations – All Channels $75 Unlimited Plan 15% High Speed Data Share 15% ATT Mobile Choice 50% OFF 11% Unlimited Plan 8% Tablet Plan 8% iPhone 43% Samsung Galaxy S 21% Samsung Note 5 6% Alcatel One Touch Pixi 3 5% Samsung Grand Prime 3% Smartphones made up 83% of the Postpaid base in Q1’16, up from 82% in Q4’15, and 80% in Q1’15.
iPhone Statistics – Q1’16 59% of Q4 Gross Adds26% of iPhones were sold or upgraded in Shentel-controlled channels50.1% of 3/31/16 Postpaid customers had the iPhone, up from 39.9% at 12/31/15 and 40.8% at 3/31/15.iPhone Base – 3/31/1669% iPhone 6, 6S, 6 Plus, 6S Plus24% iPhone 5, 5C & 5S7% iPhone 4 & 4S

Non-GAAP Financial Measure – Average Monthly Cable Revenue

Key Operational Results – Mobile Company Mobile Tower Revenue ($ millions) Towers and Leases