Attached files
| file | filename |
|---|---|
| EX-31.2 - EXHIBIT 31.2 - HARVARD BIOSCIENCE INC | exh_312.htm |
| EX-10.44 - EXHIBIT 10.44 - HARVARD BIOSCIENCE INC | exh_1044.htm |
| EX-10.20 - EXHIBIT 10.20 - HARVARD BIOSCIENCE INC | exh_1020.htm |
| EX-32.1 - EXHIBIT 32.1 - HARVARD BIOSCIENCE INC | exh_321.htm |
| EX-31.1 - EXHIBIT 31.1 - HARVARD BIOSCIENCE INC | exh_311.htm |
| EX-23.1 - EXHIBIT 23.1 - HARVARD BIOSCIENCE INC | exh_231.htm |
| EX-21.1 - EXHIBIT 21.1 - HARVARD BIOSCIENCE INC | exh_211.htm |
| EX-32.2 - EXHIBIT 32.2 - HARVARD BIOSCIENCE INC | exh_322.htm |
UNITED STATES
SECURITIES AND EXCHANGE COMMISSION
Washington, D.C. 20549
FORM 10-K
| x | Annual report pursuant to Section 13 or 15(d) of the Securities Exchange Act of 1934 |
For the fiscal year ended December 31, 2015
or
| ¨ | Transition report pursuant to Section 13 or 15(d) of the Securities Exchange Act of 1934 |
For the transition period from to
Commission File Number 001-33957
HARVARD BIOSCIENCE, INC.
(Exact Name of Registrant as Specified in Its Charter)
| Delaware | 04-3306140 |
|
(State or other jurisdiction of Incorporation or organization)
|
(I.R.S. Employer Identification No.)
|
84 October Hill Road, Holliston, Massachusetts 01746
(Address of Principal Executive Offices, including zip code)
(508) 893-8999
(Registrant’s telephone number, including area code)
Securities registered pursuant to Section 12(b) of the Act:
|
Title of each class |
Name of each exchange on which registered |
| Common Stock, $0.01 par value | The NASDAQ Global Market |
| Preferred Stock Purchase Rights |
Securities registered pursuant to Section 12(g) of the Act:
None
Indicate by check mark if the registrant is a well-known seasoned issuer, as defined in Rule 405 of the Securities Act. YES ¨ NO x
Indicate by check mark if the registrant is not required to file reports pursuant to Section 13 or Section 15(d) of the Act. YES ¨ NO x
Indicate by check mark whether the
registrant (1) has filed all reports required to be filed by Section 13 or 15(d) of the Securities Exchange Act
of 1934 during the preceding 12 months (or for such shorter period that the registrant was required to file such reports),
and (2) has been subject to such filing requirements for the past 90 days.
YES x NO ¨
Indicate by check mark whether the registrant has submitted electronically and posted on its corporate web site, if any, every Interactive Data File required to be submitted and posted pursuant to Rule 405 of Regulation S-T during the preceding 12 months (or for such shorter period that the registrant was required to submit and post such files). x YES ¨ NO
Indicate by check mark if disclosure of delinquent filers pursuant to Item 405 of Regulation S-K is not contained herein, and will not be contained, to the best of registrant’s knowledge, in definitive proxy or information statements incorporated by reference in Part III of this Form 10-K or any amendment to this Form 10-K. ¨
Indicate by check mark whether the registrant is a large accelerated filer, an accelerated filer, a non-accelerated filer, or a smaller reporting company. See the definitions of “large accelerated filer,” “accelerated filer” and “smaller reporting company” in Rule 12b-2 of the Exchange Act. (Check one):
| Large accelerated filer ¨ | Accelerated filer x | |
| Non-accelerated filer ¨ | (Do not check if a smaller reporting company) | Smaller reporting company ¨ |
Indicate by check mark whether the registrant is a shell company (as defined in Rule 12b-2 of the Exchange Act. YES ¨ NO x
The aggregate market value of 32,200,727 shares of voting common equity held by non-affiliates of the registrant as of June 30, 2015 was approximately $183,544,144 based on the closing sales price of the registrant’s common stock, par value $0.01 per share on that date. Shares of the registrant’s common stock held by each officer and director and each person known to the registrant to own 10% or more of the outstanding voting power of the registrant have been excluded in that such persons may be deemed affiliates. This determination of affiliate status is not a determination for other purposes. The registrant has no shares of non-voting common stock authorized or outstanding.
At March 21, 2016, there were 34,041,949 shares of the registrant’s common stock issued and outstanding.
DOCUMENTS INCORPORATED BY REFERENCE
Portions of the Company’s definitive Proxy Statement in connection with the 2016 Annual Meeting of Stockholders (the “Proxy Statement”), to be filed within 120 days after the end of the Registrant’s fiscal year, are incorporated by reference into Part III of this Form 10-K. Except with respect to information specifically incorporated by reference in this Form 10-K, the Proxy Statement is not deemed to be filed as part hereof.
This Annual Report on Form 10-K contains statements that are not statements of historical fact and are forward-looking statements within the meaning of Section 27A of the Securities Act of 1933 and Section 21E of the Securities Exchange Act of 1934 (the “Exchange Act”), each as amended. The forward-looking statements are principally, but not exclusively, contained in “Item 1: Business” and “Item 7: Management’s Discussion and Analysis of Financial Condition and Results of Operations.” These statements involve known and unknown risks, uncertainties and other factors that may cause our actual results, performance or achievements to be materially different from any future results, performance or achievements expressed or implied by the forward-looking statements. Forward-looking statements include, but are not limited to, statements about management’s confidence or expectations, our business strategy, our ability to raise capital or borrow funds to consummate acquisitions and the availability of attractive acquisition candidates, our expectations regarding future costs of product revenues, our anticipated compliance with the covenants contained in our credit facility, the adequacy of our financial resources and our plans, objectives, expectations and intentions that are not historical facts. In some cases, you can identify forward-looking statements by terms such as “may,” “will,” “should,” “could,” “would,” “seek,” “expects,” “plans,” “aim,” “anticipates,” “believes,” “estimates,” “projects,” “predicts,” “intends,” “think,” “strategy,” “potential,” “objectives,” “optimistic,” “new,” “goal” and similar expressions intended to identify forward-looking statements. These statements reflect our current views with respect to future events and are based on assumptions and subject to risks and uncertainties. Given these uncertainties, you should not place undue reliance on these forward-looking statements. We discuss many of these risks in detail under the heading “Item 1A. Risk Factors” beginning on page 11 of this Annual Report on Form 10-K. You should carefully review all of these factors, as well as other risks described in our public filings, and you should be aware that there may be other factors, including factors of which we are not currently aware, that could cause these differences. Also, these forward-looking statements represent our estimates and assumptions only as of the date of this report. We may not update these forward-looking statements, even though our situation may change in the future, unless we have obligations under the federal securities laws to update and disclose material developments related to previously disclosed information. Harvard Bioscience, Inc. is referred to herein as “we,” “our,” “us,” and “the Company.”
PART I
Overview
Harvard Bioscience, Inc., a Delaware corporation, is a global developer, manufacturer and marketer of a broad range of scientific instruments, systems and lab consumables used to advance life science for basic research, drug discovery, clinical and environmental testing. Our products are sold to thousands of researchers in over 100 countries through our global sales organization, websites, catalogs, and through distributors including Thermo Fisher Scientific Inc., VWR, GE Healthcare, and other specialized distributors. We have sales and manufacturing operations in the United States, the United Kingdom, Germany, Sweden, Spain, France, Canada, and China.
Our History
Our business began in 1901 under the name Harvard Apparatus. It was founded by Dr. William T. Porter, a Professor of Physiology at Harvard Medical School and a pioneer of physiology education. We have grown over the years with the development and evolution of modern life science research and education. Our early inventions included ventilators based on Dr. Porter’s design, the mechanical syringe pump for drug infusion in the 1950s, and the microprocessor controlled syringe pump in the 1980s.
In March of 1996, a group of investors acquired a majority of the then existing business of our predecessor, Harvard Apparatus, Inc. Following this acquisition, our focus was redirected to acquiring complimentary companies with innovative technologies while continuing to grow the existing business through internal product development. Since 1996, we have completed more than 25 business or product line acquisitions related to our continuing operations, including three acquisitions beginning in the fourth quarter of 2014. We have also developed many new product lines including: new generation Harvard Apparatus syringe pumps, PHD Ultra series of syringe pumps, advanced Inspira ventilators, GeneQuant DNA/RNA/protein calculators, UVM plate readers, BTX Gemini X2 multi-waveform electroporation system, BioDrop micro-volume spectrophotometer and cuvette, OxyletPro metabolic monitoring system, Multi Channel Systems’ automated four channel PatchServer, DP-304A amplifiers, Allegro Peristaltic pump systems, Centrifan small-volume evaporators and advanced VentElite ventilators.
From 2009 through November 1, 2013, our operations included two main businesses, the Life Science Research Tools business and the Regenerative Medicine Device (“RMD”) business. In 2013, we consummated the spin-off of Harvard Apparatus Regenerative Technology, Inc., the entity which operated our RMD business, to our existing shareholders by means of a distribution of stock we owned in Harvard Apparatus Regenerative Technology, Inc. Harvard Apparatus Regenerative Technology, Inc. changed its name to Biostage, Inc. in April 2016 and is referred to herein as Biostage.
| 4 |
In August 2013, Jeffrey A. Duchemin was hired by the Board of Directors to become the President and CEO of our Company. Other key hires thereafter included Robert E. Gagnon, our Chief Financial Officer; Yong Sun, our Vice President, Commercial Operations, and Ron Aplin, our Vice President, Global Operations and Quality. In February 2015, we appointed Ryan Atienza to Vice President of Sales at our Denville Scientific subsidiary.
At the end of 2013 we began a multiple year restructuring program to reduce costs, align global functions, consolidate facilities, and reinvest in key areas such as sales and IT. As part of the reinvestment, we initiated a multiple year plan in 2014 to invest in and implement a new global enterprise resource planning platform. Additionally, during 2014, as part of the restructuring program, we initiated plans to relocate and consolidate the distribution, finance and marketing operations of our Denville Scientific, Inc. subsidiary (“Denville Scientific”) to Charlotte, North Carolina and our Holliston, MA headquarters, and relocate the manufacturing operations of our Biochrom Ltd. subsidiary (“Biochrom”) to our Holliston, MA headquarters. During the first quarter of 2015, we initiated plans to relocate the operations of our subsidiary, Coulbourn Instruments, LLC (“Coulbourn”), to our Holliston, MA headquarters. During the second quarter of 2015, we initiated plans to relocate the operations of HEKA Electronics Incorporated, our HEKA Canada subsidiary (“HEKA Canada”), to HEKA Electronik Dr. Schulze GmbH, our HEKA Germany subsidiary (“HEKA Germany”). Also during the second quarter of 2015, and simultaneously with the HEKA Canada move, we initiated plans to relocate the operations of HEKA Instruments Incorporated, our United States HEKA subsidiary (“HEKA U.S.”, and together with HEKA Canada and HEKA Germany, “HEKA”), to our Holliston, MA headquarters. Additionally, we committed to a restructuring plan on October 27, 2015, which included eliminating certain redundancies as a result of our site consolidations, as well as a realignment of our commercial sales team. We believe the overall restructuring program positions Harvard Bioscience to stabilize, focus on, and grow the life science business going forward.
During the fourth quarter of 2014, we acquired two businesses with advanced electrophysiology technologies, Multi Channel Systems MCS GmbH (“MCS”), and Triangle BioSystems, Inc. (“TBSI”). MCS is a developer, manufacturer and marketer of in vitro and in vivo electrophysiology instrumentation for extracellular recording and stimulation. This acquisition is complementary to the in vitro electrophysiology line currently offered by our wholly-owned Warner Instruments subsidiary. TBSI is a developer, manufacturer and marketer of wireless neural interface equipment to aid in vivo neuroscience research, especially in the fields of electrophysiology, psychology, neurology and pharmacology. This acquisition is complementary to the behavioral neuroscience lines currently offered by our wholly-owned Panlab and Coulbourn subsidiaries. Additionally, in January 2015, we acquired HEKA. HEKA is a developer, manufacturer and marketer of sophisticated electrophysiology instrumentation and software for biomedical and industrial research applications. This acquisition is complimentary to the electrophysiology line currently offered by our Warner Instruments and MCS subsidiaries.
Our Strategy
Our vision is to be a world leading life science company that excels in meeting the needs of our customers by providing a wide breath of innovative products and solutions, while providing exemplary customer service. Our business strategy is to grow our top-line and bottom-line, and build shareholder value through a commitment to:
| • | commercial excellence and organic growth; | |
| • | new product development; |
| • | strategic acquisitions; and |
| • | operational efficiencies. |
Our Products
Today, our broad core product range is organized into three commercial product families: Cell and Animal Physiology (“CAP”), Lab Products and Services (“LPS”), and Molecular Separation and Analysis (“MSA”). We primarily sell these products under brand names, including Harvard Apparatus, KD Scientific, Denville Scientific, AHN, Hoefer, Biochrom, BTX, Warner Instruments, MCS, HEKA, Hugo Sachs Elektronik, Panlab, Coulbourn Instruments, TBSI, and CMA Microdialysis.
Our products consist of instruments, consumables, and systems that are made up of several individual products. Sales prices of these products are mostly under $5,000 but range from under $100 to over $100,000. We manufacture our products at our locations in the United States, Germany, Sweden and Spain.
| 5 |
In addition to our proprietary manufactured products, we sell many products that are made by other manufacturers. These distributed products accounted for approximately 37% of our revenues for the year ended December 31, 2015. Distributed products enable us to provide our customers with a single source for their research needs, and consist of a large variety of devices, instruments and consumable items used in experiments involving fluid handling, molecular and cell biology, tissue, organ and animal research. Many of our proprietary manufactured products are leaders in their fields; however, researchers often need complementary products in order to conduct particular experiments. Following is a description of each product family.
Cell and Animal Physiology Product Family
Our CAP product family includes our traditional syringe pump and peristaltic pump product lines, as well as a broad range of instruments and accessories for tissue, organ and animal based lab research, including surgical products, infusion systems, microdialysis instruments, behavior research systems, isolated organ and tissue bath systems, and in vivo and in vitro electrophysiology recording, stimulation and analysis systems. Our product offerings are marketed through our Harvard Apparatus, CMA Microdialysis, Panlab, Coulbourn, Hugo-Sachs, InBreath Bioreactor, MCS, TBSI and HEKA brands and entities. We sell these products through our global sales force, technical service team and our global distribution channel. Our CAP product family made up approximately 50% of our global revenues for the year ended December 31, 2015.
Lab Products and Services Product Family
Our LPS product family includes a range of products for molecular biology labs with a liquid handling focus. It consists primarily of pipettes and pipette tips, gloves, gel electrophoresis equipment and reagents, autoradiography films, thermal cycler accessories and reagents, sample preparation columns, tissue culture products, and general lab equipment and consumables. Our brands include Denville Scientific, AHN, and others. We sell these products through our global sales force and global distribution channel. LPS product family made up approximately 27% of our global revenues for the year ended December 31, 2015.
Molecular Separation and Analysis Product Family
The MSA product family includes spectrophotometers, microplate readers, amino acid analyzers, gel electrophoresis equipment, and electroporation instruments. A spectrophotometer is an instrument widely used in molecular biology and cell biology to quantify the amount of DNA and protein in a sample. We sell a wide range of spectrophotometers under the names Libra, WPA and BioDrop. We sell them primarily through our distribution arrangements with various distributors. Multi-well plate readers are widely used for high throughput screening assays in the drug discovery process. Our product line includes absorbance readers and luminescence readers. We sell them primarily through our global distribution channel. An amino acid analysis system uses chromatography to separate the amino acids in a sample and then uses a chemical reaction to detect each one as they flow out of the chromatography column. We sell these systems under the Biochrom brand through our United States direct sales force and global distribution channel. Gel electrophoresis is widely used in labs to separate and analyze DNA, RNA and proteins samples and their fragments, based on their size and charge. We sell our electrophoresis equipment under Hoefer and Scie-Plas brands through our global distribution channel. Electroporation is a technique for transfection, a process to introduce nucleic acid into cells. Our electroporation and electrofusion products include systems and generators, electrodes and accessories for research applications including in vivo, and in vitro gene delivery, cell fusion and nuclear transfer cloning. We sell these products under the Harvard Apparatus BTX brand through our global distribution channel. Our MSA product family made up approximately 23% of our global revenues for the year ended December 31, 2015.
Our Customers
Our end-user customers are primarily research scientists at universities, hospitals, government laboratories, including the United States National Institute of Health (“NIH”), and pharmaceutical and biotechnology companies. Our academic customers, which account for approximately 70% of our revenues, include major colleges and universities such as Harvard University, Cambridge University, Johns Hopkins University, Massachusetts Institute of Technology, Yale University, the University of California system, Baylor College of Medicine, and the University of Texas - MD Anderson Center. Our pharmaceutical and biotechnology customers have included pharmaceutical companies and research laboratories such as Amgen, Inc., AstraZeneca plc, Genentech, Inc. and Johnson & Johnson. We have tens of thousands of customers worldwide and no customer accounted for more than 10% of our revenues in 2015.
| 6 |
Sales and Marketing
We conduct direct sales in the United States, the United Kingdom, Germany, France, Spain, Sweden, Canada and China. We sell primarily through distributors in other countries. For the year ended December 31, 2015, revenues from direct sales to end-users represented approximately 63% of our revenues; and revenues from sales of our products through distributors represented approximately 37% of our revenues.
Direct Sales
We have a global sales organization managing both direct sales and distributors. Our websites and catalogs serve as the primary sales tool for our Harvard Apparatus, Denville and other product lines, which includes both proprietary manufactured products and complementary products from various suppliers. Our reputation as a leading producer of many of our manufactured products creates traffic to our websites, enables cross-selling and facilitates the introduction of new products.
Distributors
We engage distributors for the sales of our own branded and private label products in certain areas of the world and for certain product lines. During the third quarter of 2015, GE Healthcare, one of our largest distributors, informed us of its decision to discontinue the sale of its spectrophotometer products by the end of 2015. This line of products includes the GE brands NanoVue and SimpliNano, which are products that we have already been manufacturing. As of January 1, 2016, we are selling the NanoVue and SimpliNano spectrophotometers through our own direct sales force and through distribution partners, as well as servicing previously sold products in the field.
Research and Development
Our principal research and development mission is to develop products that address growth opportunities within the life science research process, as well as to maintain and optimize our existing product portfolios. We maintain development staff in many of our manufacturing facilities to design and develop new products and to re-engineer existing products to bring them to the next generation. Our research and development expenses from continuing operations were approximately $6.4 million, $4.9 million and $4.2 million for the years ended December 31, 2015, 2014 and 2013, respectively. In addition, we funded the research and development expenses of our RMD business which were approximately $3.1 million for the year ended December 31, 2013. The RMD research and development expenses were classified as part of discontinued operations for the year ended December 31, 2013. We anticipate that we will continue to make investments in research and development activities as we deem appropriate. We plan to continue to pursue a balanced development portfolio strategy of originating new products from internal research and acquiring products through business and technology acquisitions.
Manufacturing
We manufacture and test the majority of our products in our principal manufacturing facilities located in the United States, Sweden, Spain and Germany. We have considerable manufacturing flexibility at our various facilities, and each facility can manufacture multiple products at the same time. We maintain in-house manufacturing expertise, technologies and resources. We seek to maintain multiple suppliers for key components that are not manufactured in-house, and while some of our products are dependent on sole-source suppliers, we do not believe our dependence upon these suppliers creates any significant risks.
Our manufacturing operations primarily involve assembly and testing activities along with some machine based processes.
| Manufacturing Activity | Manufacturing Facility |
| syringe pumps, ventilators, cell injectors, molecular sample preparation products, electroporation products, electrophysiology products, spectrophotometers, amino acid analysis systems, low-volume, high-throughput liquid dispensers, plate readers, behavioral research products, and microdialysis products | Holliston, Massachusetts |
| electrophysiology products | Hamden, Connecticut |
| electrophysiology products | Reutlingen, Germany |
| electrophysiology products | Lambrecht, Germany |
| complete organ testing systems | March-Hugstetten, Germany |
| electrophoresis products | Richmond, California |
| behavioral research products | Barcelona, Spain |
| behavioral research products | Durham, North Carolina |
| microdialysis products | Kista, Sweden |
| fluid handling products | Nordhausen, Germany |
| 7 |
Going forward we will continue to evaluate our manufacturing facilities and operations in order to maintain an optimal manufacturing footprint.
Competition
The markets into which we sell our products are highly competitive, and we expect the intensity of competition to continue or increase. We compete with many companies engaged in developing and selling tools for life science research. Many of our competitors have greater financial, operational, sales and marketing resources, and more experience in research and development and commercialization than we have. Moreover, our competitors may have greater name recognition than we do, and many offer discounts as a competitive tactic. These competitors and other companies may have developed or could in the future develop new technologies that compete with our products, which could render our products obsolete. We cannot assure you that we will be able to make the enhancements to our technologies necessary to compete successfully with newly emerging technologies. We believe that we offer one of the broadest selections of products to organizations engaged in life science research. We have numerous competitors on a product line basis. We believe that we compete favorably with our competitors on the basis of product performance, including quality, reliability and speed, technical support, price and delivery time.
We compete with several companies that provide instruments for life science research including, Lonza Group Ltd., Becton Dickinson, Eppendorf AG, Kent Scientific Corporation, Razel Scientific Instruments, Inc., Ugo Basile, Danaher Corporation, Bio-Rad Laboratories, Inc., PerkinElmer, Inc. and Thermo Fisher Scientific, Inc.
We cannot forecast if or when these or other companies may develop competitive products. We expect that other products will compete with our products and potential products based on efficacy, safety, cost and intellectual property positions. While we believe that these will be the primary competitive factors, other factors include, in certain instances, availability of supply, manufacturing, marketing and sales expertise and capability.
Seasonality
Sales and earnings in our third quarter are usually flat or down from the second quarter primarily because there are a large number of holidays and vacations during such quarter, especially in Europe. Our fourth quarter revenues and earnings are often the highest in any fiscal year compared to the other three quarters, primarily because many of our customers tend to spend budgeted money before their own fiscal year ends.
Intellectual Property
To establish and protect our proprietary technologies and products, we rely on a combination of patent, copyright, trademark and trade-secret laws, as well as confidentiality provisions in our contracts. Patents or patent applications cover certain of our new technologies. Most of our more mature product lines are protected by trade names and trade secrets only.
We have implemented a patent strategy designed to provide us with freedom to operate and facilitate commercialization of our current and future products. Our success depends, to a significant degree, upon our ability to develop proprietary products and technologies. We intend to continue to file patent applications as we develop new products and technologies.
Patents provide some degree of protection for our intellectual property. However, the assertion of patent protection involves complex legal and factual determinations and is therefore uncertain. The scope of any of our issued patents may not be sufficiently broad to offer meaningful protection. In addition, our issued patents or patents licensed to us may be successfully challenged, invalidated, circumvented or unenforceable so that our patent rights would not create an effective competitive barrier. Moreover, the laws of some foreign countries may protect our proprietary rights to a greater or lesser extent than the laws of the United States. In addition, the laws governing patentability and the scope of patent coverage continue to evolve, particularly in areas of interest to us. As a result, there can be no assurance that patents will be issued from any of our patent applications or from applications licensed to us. As a result of these factors, our intellectual property positions bear some degree of uncertainty.
| 8 |
We also rely in part on trade-secret protection of our intellectual property. We attempt to protect our trade secrets by entering into confidentiality agreements with third parties, employees and consultants. Our employees and consultants also sign agreements requiring that they assign to us their interests in patents and copyrights arising from their work for us. Although many of our United States employees have signed agreements not to compete unfairly with us during their employment and after termination of their employment, through the misuse of confidential information, soliciting employees, soliciting customers and the like, the enforceability of these provisions varies from jurisdiction to jurisdiction and, in some circumstances, they may not be enforceable. In addition, it is possible that these agreements may be breached or invalidated and if so, there may not be an adequate corrective remedy available. Despite the measures we have taken to protect our intellectual property, we cannot assure you that third parties will not independently discover or invent competing technologies, or reverse engineer our trade secrets or other technologies. Therefore, the measures we are taking to protect our proprietary rights may not be adequate.
We do not believe that our products infringe on the intellectual property rights of any third party. We cannot assure you, however, that third parties will not claim such infringement by us or our licensors with respect to current or future products. We expect that product developers in our market will increasingly be subject to such claims as the number of products and competitors in our market segment grows and the product functionality in different market segments overlaps. In addition, patents on production and business methods are becoming more common and we expect that more patents will be issued in our technical field. Any such claims, with or without merit, could be time-consuming, result in costly litigation and diversion of management’s attention and resources, cause product shipment delays or require us to enter into royalty or licensing agreements. Moreover, such royalty or licensing agreements, if required, may not be on terms advantageous to us, or acceptable at all, which could seriously harm our business or financial condition.
“Harvard” is a registered trademark of Harvard University. The marks “Harvard Apparatus” and “Harvard Bioscience” are being used pursuant to a license agreement entered into in December 2002 between us and Harvard University.
Government Regulation
We are not subject to direct governmental regulation other than the laws and regulations generally applicable to businesses in the domestic and foreign jurisdictions in which we operate. In particular, our current products are not subject to pre-market approval by the United States Food and Drug Administration (“FDA”) for use on human clinical patients. In addition, we believe we are currently in compliance with all relevant environmental laws.
Employees
As of December 31, 2015, we employed 437 employees, of which 412 are full-time and 25 are part-time. As of December 31, 2014, we employed 447 employees, of which 417 were full-time and 30 were part-time. The decrease in the number of employees was primarily due to our facility consolidations in 2015, partially offset by the acquisition of HEKA during 2015.
Geographical residence information for these employees is summarized in the table below:
| As of December 31, 2015 | ||||
| United States | 221 | |||
| Germany | 130 | |||
| United Kingdom | 36 | |||
| Spain | 27 | |||
| Canada | 9 | |||
| Sweden | 7 | |||
| China | 5 | |||
| France | 2 | |||
| Total | 437 | |||
| 9 |
Discontinued Operations
In September 2008, we completed the sale of assets of our Union Biometrica Division (“UBI”) to UBIO Acquisition Company. During 2013, we received earn-out payments, including interest, from UBIO Acquisition Company, of $1.8 million related to the 2008 acquisition. UBIO Acquisition Company’s final payment under the earn-out obligation was received in October 2013.
On November 1, 2013, the previously announced spin-off of Biostage from our Company was completed. Through the spin-off date the historical operations of Biostage were reported as continuing operations in our consolidated statements of operations. Following the spin-off, and reported herein, the historical operations of Biostage were broken out and reported as discontinued operations for all periods presented. Biostage became an independent company that operates the regenerative medicine business previously owned by us. The spin-off was completed through the distribution to Harvard Bioscience’s stockholders of record all the shares of common stock of Biostage (the “Distribution”). In the Distribution, we distributed to our stockholders one share of Biostage common stock for every four shares of Harvard Bioscience common stock outstanding as of the close of business on October 21, 2013, the record date for the Distribution.
Effective with the spin-off, we contributed $15.0 million in cash to Biostage to fund its operations. In addition, we transferred approximately $0.9 million in net assets to Biostage as part of the spin-off.
We intend for the Biostage contribution and Distribution, taken together, to qualify as a reorganization pursuant to which no gain or loss is recognized by us or our stockholders for federal income tax purposes under Sections 355, 368(a)(1)(D) and related provisions of the Internal Revenue Code. On June 28, 2013, we received a Supplemental Ruling to the Private Letter Ruling dated March 22, 2013 from the IRS to the effect that, among other things, the spin-off will qualify as a transaction that is tax-free for United States federal income tax purposes under Section 355 and 368(a)(1)(D) of the Internal Revenue Code continuing in effect. We also have received an opinion from our outside tax advisor to such effect. In connection with the ruling and the opinion, we made certain representations regarding ourselves and our business. We and Biostage have each agreed that we will not take or fail to take any action which prevents or could reasonably be expected to prevent the tax-free status of the spin-off. Biostage also agreed to certain specific restrictions that expired two years following the Distribution, and which were intended to preserve the tax-free status of the contribution and the Distribution.
In addition, current United States federal income tax law creates a presumption that our spin-off of Biostage would be taxable to us, but not our stockholders, if such spin-off is part of a “plan or series of related transactions” pursuant to which one or more persons acquire directly or indirectly stock representing a 50% or greater interest (by vote or value) in us or Biostage. Acquisitions that occur during the four-year period that begins two years before the date of the spin-off are presumed to occur pursuant to a plan or series of related transactions, unless it is established that the acquisition is not pursuant to a plan or series of transactions that includes the spin-off. United States Treasury regulations currently in effect generally provide that whether an acquisition and a spin-off are part of a plan is determined based on all of the facts and circumstances, including, but not limited to, specific factors described in the United States Treasury regulations. In addition, the United States Treasury regulations provide several “safe harbors” for acquisitions that are not considered to be part of a plan. These rules limited our ability during the two-year period following the spin-off to enter into certain transactions that may be advantageous to us and our stockholders, particularly issuing equity securities to satisfy financing needs, repurchasing equity securities, disposing of certain assets, engaging in mergers and acquisitions, and, under certain circumstances, acquiring businesses or assets with equity securities or agreeing to be acquired.
Geographic Area
Financial information regarding geographic areas in which we operate is provided in Note 21 of the “Notes to Consolidated Financial Statements,” which are included elsewhere in this report.
Executive Officers of the Registrant
The following table shows information about our executive officers as of December 31, 2015.
| Name | Age | Position | ||||||
| Jeffrey Duchemin | 50 | Chief Executive Officer, President and Director | ||||||
| Robert Gagnon | 41 | Chief Financial Officer | ||||||
| Yong Sun | 52 | Vice President, Commercial Operations | ||||||
Jeffrey A. Duchemin was appointed Chief Executive Officer on August 26, 2013. He assumed the additional roles of President on November 1, 2013 and Director on October 29, 2013. Prior to joining Harvard Bioscience, Mr. Duchemin spent 16 years with Becton Dickinson (“BD”) in progressive sales, marketing and executive leadership positions across BD’s three business segments; BD Medical Systems, BD Diagnostic Systems, and BD Biosciences. In October 2012, BD Biosciences Discovery Labware was acquired by Corning Life Sciences. Mr. Duchemin was a Global Business Director for Corning Life Sciences until his departure to Harvard Bioscience. Mr. Duchemin is a transformational leader with demonstrated business results. The depth of his experience spans across a broad range of life science research and medical device products resulting in growth on a global basis. Mr. Duchemin earned an M.B.A. from Southern New Hampshire University and a B.S. in accounting from the University of Massachusetts Dartmouth.
| 10 |
Robert E. Gagnon was appointed Chief Financial Officer on November 1, 2013. Prior to joining the company he was recently Executive Vice President, Chief Financial Officer and Treasurer at Clean Harbors, Inc. (NYSE:CLH), a leading provider of environmental, energy and industrial services throughout North America. Prior to this, he served in progressive executive positions at Biogen Idec, Inc., a Fortune 500 company developing treatments in the areas of immunology and neurology. Earlier, he worked in a variety of senior positions at Deloitte & Touche, LLP, and PricewaterhouseCoopers, LLP. Mr. Gagnon holds an M.B.A. from the MIT Sloan School of Management and a B.A. in accounting from Bentley College.
Yong Sun assumed the role of Vice President, Commercial Operations on October 28, 2015. Previously Mr. Sun held the position of Vice President, Strategic Marketing and Business Development and Vice President, R&D since October 28, 2013 and March 10, 2014, respectively. Prior to joining Harvard Bioscience, he served as Vice President of Global Marketing and Americas Sales at Beaver-Visitec International, a company combining former ophthalmic business units from BD and Medtronic; in this role he led global marketing to develop and implement strategic marketing plans in target surgical markets. Prior to this, he served in progressive positions at BD, including Director of Global Marketing & United States Sales. Earlier, he served as Marketing Manager, Global Life Sciences Market & Greater China Region at Eli Lilly & Company’s eLilly Unit (now InnoCentive, Inc.). Mr. Sun, holds an M.B.A. from the MIT Sloan School of Management, a M.S. in environmental science & engineering from Northeastern University and a B.S. in biochemistry from Peking University.
Available Information and Website
Our website address is www.harvardbioscience.com. Our Annual Report on Form 10-K, Quarterly Reports on Form 10-Q, Current Reports on Form 8-K, and exhibits and amendments to those reports filed or furnished with the Securities and Exchange Commission pursuant to Section 13(a) of the Exchange Act are available for review on our website and the Securities and Exchange Commission’s website at www.sec.gov. Any such materials that we file with, or furnish to, the SEC in the future will be available on our website as soon as reasonably practicable after they are electronically filed with, or furnished to, the SEC. The information on our website is not incorporated by reference into this Annual Report on Form 10-K.
The following factors should be reviewed carefully, in conjunction with the other information contained in this Annual Report on Form 10-K. As previously discussed, our actual results could differ materially from our forward-looking statements. Our business faces a variety of risks. These risks include those described below and may include additional risks and uncertainties not presently known to us or that we currently deem immaterial. If any of the events or circumstances described in the following risk factors occur, our business operations, performance and financial condition could be adversely affected and the trading price of our common stock could decline.
Reductions in customers’ research budgets or government funding may adversely affect our business.
Many of our customers representing a significant portion of our revenues are universities, government research laboratories, private foundations and other institutions who are dependent for their funding upon grants from U.S. government agencies, such as the United States National Institutes of Health (“NIH”), and agencies in other countries. Research and development spending of our customers can fluctuate based on spending priorities and general economic conditions. The level of government funding of research and development is unpredictable. There have been instances where NIH grants have been frozen or otherwise unavailable for extended periods. Any reduction or delay in governmental spending could cause our customers to delay or forego purchases of our products. If government funding necessary to purchase our products were to decrease, our business and results of operations could be materially adversely affected. Spending by some of these customers fluctuates based on budget allocations and the timely passage of the annual federal budget. An impasse in federal government budget decisions could lead to substantial delays or reductions in federal spending.
Domestic and global economic conditions could adversely affect our operations.
As our business has grown, we have become increasingly subject to the risks arising from adverse changes in domestic and global economic conditions. If global economic and market conditions, or economic conditions in the United States, deteriorate, we may experience an adverse effect on our business, operating results and financial condition. Concerns about credit markets, consumer confidence, economic conditions, government spending to sponsor life science research, volatile corporate profits and reduced capital spending could negatively impact demand for our products. If economic growth in the United States and other countries slows or deteriorates, customers may delay or forego purchases of our products. Unstable economic, political and social conditions make it difficult for our customers, our suppliers and us to accurately forecast and plan future business activities. If such conditions exist, our business, financial condition and results of operations could suffer. We cannot project the extent of the impact of the economic environment on our industry or us.
| 11 |
Our business is subject to economic, political and other risks associated with international revenues and operations.
We manufacture and sell our products worldwide and as a result, our business is subject to risks associated with doing business internationally. A substantial amount of our revenues are derived from international operations, and we anticipate that a significant portion of our sales will continue to come from outside the United States in the future. We anticipate that revenues from international operations will continue to represent a substantial portion of our revenues in the foreseeable future and is likely to increase as a result of our efforts to expand our business in markets abroad. In addition, a number of our manufacturing facilities and suppliers are located outside the United States. Our foreign operations subject us to certain risks, including: effects of fluctuations in foreign currency exchange rates (discussed below); the impact of local economic conditions; local product preferences and seasonality (discussed below) and product requirements; local difficulty to effectively establish and expand our business and operations in international markets; disruptions of capital and trading markets; restrictions and potentially negative tax implications of transfer of capital across borders; differing labor regulations; other factors beyond our control, including potential political instability, terrorism, acts of war, natural disasters and diseases; unexpected changes and increased enforcement of regulatory requirements and various state, federal and international, intellectual property, environmental, antitrust, anti-corruption, fraud and abuse (including anti-kickback and false claims laws) and employment laws; and interruption to transportation flows for delivery of parts to us and finished goods to our customers.
Specifically with respect to the expansion of our business into China, our financial performance may be subject to the following risks, among others affecting companies that operate in China: the impact of declining economic growth in China; regulation of foreign investment and business activities by the Chinese government, including recent scrutiny of foreign companies, may limit our ability to expand our business in China; uncertainties with respect to the legal system in China may limit the legal protections available to us in China; government restrictions on the remittance of currency out of China and the ability of any subsidiary we may establish in China to pay dividends and make other distributions to us; and potential unfavorable tax consequences as a result of our operations in China.
Under the United States tax code, we may also be subject to additional taxation to the extent we repatriate earnings from our foreign operations to the United States. In the event we require more capital in the United States than is generated by our United States operations to fund acquisitions or other activities and elect to repatriate earnings from foreign jurisdictions, our effective tax rate may be higher as a result.
Foreign currency exchange rate fluctuations may have a negative impact on our reported earnings.
We are also subject to the risks of fluctuating foreign currency exchange rates, which could have an adverse effect on the sales price of our products in foreign markets, as well as the costs and expenses of our foreign subsidiaries. A substantial amount of our revenues are derived from international operations, and we anticipate that a significant portion of revenues will continue to come from outside the United States in the future. As a result, currency fluctuations among the United States dollar, euro and the other currencies in which we do business have caused and will continue to cause foreign currency translation and transaction gains and losses. We have not used forward exchange contracts to hedge our foreign currency exposures. We attempt to manage foreign currency risk through the matching of assets and liabilities. In the future, we may undertake to manage foreign currency risk through hedging methods, including foreign currency contracts. We recognize foreign currency gains or losses arising from our operations in the period incurred. We cannot guarantee that we will be successful in managing foreign currency risk or in predicting the effects of exchange rate fluctuations upon our future operating results because of the number of currencies involved, the variability of currency exposure and the potential volatility of currency exchange rates. We cannot predict with any certainty changes in foreign currency exchange rates or the degree to which we can address these risks.
A portion of our revenues are derived from customers from the pharmaceutical and biotechnology industries and are subject to risks faced by those industries. Such risks may adversely affect our financial results.
We derive a portion of our revenues from pharmaceutical and biotechnology companies. We expect that pharmaceutical and biotechnology companies will continue to be a significant source of our revenues for the foreseeable future. As a result, we are subject to risks and uncertainties that affect the pharmaceutical and biotechnology industries, such as government regulation, ongoing consolidation, uncertainty of technological change, and reductions and delays in research and development expenditures by companies in these industries.
| 12 |
In particular, the biotechnology industry is largely dependent on raising capital to fund its operations. If biotechnology companies that are our customers are unable to obtain the financing necessary to purchase our products, our business and results of operations could be adversely affected. In addition, we are dependent, both directly and indirectly, upon general health care spending patterns, particularly in the research and development budgets of the pharmaceutical and biotechnology industries, as well as upon the financial condition and purchasing patterns of various governments and government agencies. As it relates to both the biotechnology and pharmaceutical industries, many companies have significant patents that have expired or are about to expire, which could result in reduced revenues for those companies. If pharmaceutical or biotechnology companies that are our customers suffer reduced revenues as a result of these patent expirations, they may be unable to purchase our products, and our business and results of operations could be adversely affected.
Our revenues will likely be affected by various factors, including the timing of purchases by customers and the seasonal nature of purchasing in Europe.
Our revenues will likely be affected by various factors, including the seasonal nature of purchasing in Europe. Our revenues may vary from quarter to quarter due to a number of factors, including new product introductions, the release of grant and budget funding, future acquisitions and our substantial sales to European customers, who in summer months often defer purchases. In particular, delays or reduction in purchase orders from the pharmaceutical and biotechnology industries could have an adverse effect on us and could adversely affect our stock price.
We continue to expand our business into foreign countries and international markets. If our products are not accepted in these new markets our financial performance may suffer.
We continue to aggressively expand our sales and marketing efforts in foreign countries and international markets. The cost and diversion of resources to these efforts may not result in an increase in revenues in our business. Expansion of our business into new markets may be more costly and require the devotion of more of our management’s time than we anticipate, which may hurt our business performance in other markets. Our operating results may suffer to the extent that our efforts to expand our product sales in these new markets are delayed or prove to be unsuccessful.
We may not realize the expected benefits of our facility consolidations.
We have invested significant resources in facility consolidations. The goal is to increase profit margins by improving manufacturing efficiency, simplifying administrative and regulatory functions, and reducing tax liabilities. We cannot assure that we will achieve the expected benefits of these initiatives. Among other things, costs could exceed current estimates, product manufacturing could be affected by fluctuating customer demands and delays or supply interruptions, changes in tax laws could reduce or eliminate expected benefits of some of our tax strategies, tax authorities may challenge our tax strategy, or future profit margins could be affected by a variety of factors unrelated to our level of manufacturing efficiency.
If we are not able to manage our growth, our operating profits or losses may be adversely impacted.
Our success will depend on the expansion of our operations through both organic growth and acquisitions. Effective growth management will place increased demands on our management team, operational and financial resources and expertise. To manage growth, we must expand our facilities, optimize our operational, financial and management systems, and hire and train additional qualified personnel. Failure to manage this growth effectively could impair our ability to generate revenues or could cause our expenses to increase more rapidly than revenues, resulting in operating losses or reduced profitability.
The life sciences industry is very competitive.
We expect to encounter increased competition from both established and development-stage companies that continually enter the market. These include companies developing and marketing life science instruments, systems and lab consumables, health care companies that manufacture laboratory-based tests and analyzers, diagnostic and pharmaceutical companies, analytical instrument companies, and companies developing life science or drug discovery technologies. Currently, our principal competition comes from established companies that provide products that perform many of the same functions for which we market our products. Many of our competitors have substantially greater financial, operational, marketing and technical resources than we do. Moreover, these competitors may offer broader product lines and tactical discounts, and may have greater name recognition. In addition, we may face competition from new entrants into the field. We may not have the financial resources, technical expertise or marketing, distribution or support capabilities to compete successfully in the future. In addition, we face changing customer preferences and requirements, including increased customer demand for more environmentally-friendly products.
| 13 |
The life sciences industry is also subject to rapid technological change and discovery. The development of new or improved products, processes or technologies by other companies may render our products or proposed products obsolete or less competitive. In some instances, our competitors may develop or market products that are more effective or commercially attractive than our current or future products. To meet the evolving needs of customers, we must continually enhance our current and planned products and develop and introduce new products. However, we may experience difficulties that may delay or prevent the successful development, introduction and marketing of new products or product enhancements. In addition, our product lines are based on complex technologies that are subject to change as new technologies are developed and introduced in the marketplace. We may have difficulty in keeping abreast of the changes affecting each of the different markets we serve or intend to serve. Our failure to develop and introduce products in a timely manner in response to changing technology, market demands or the requirements of our customers could cause our product sales to decline, and we could experience significant losses.
We offer and plan to offer a broad range of products and have incurred and expect to continue to incur substantial expenses for development of new products and enhanced versions of our existing products. The speed of technological change in our market may prevent us from being able to successfully market some or all of our products for the length of time required to recover development costs. Failure to recover the development costs of one or more products or product lines could decrease our profitability or cause us to experience significant losses.
We have identified material weaknesses in our internal control over financial reporting and such weaknesses have led to a conclusion that our disclosure controls and procedures were not effective as of December 31, 2015. Our ability to remediate these material weaknesses, our discovery of additional weaknesses, and our inability to achieve and maintain effective disclosure controls and procedures and internal control over financial reporting, have and could continue to adversely affect our results of operations, our stock price and investor confidence in our company.
Section 404 of the Sarbanes-Oxley Act of 2002 requires that companies evaluate and report on their systems of internal control over financial reporting. In addition, our independent registered public accounting firm must report on its evaluation of those controls. As disclosed in more detail under "Controls and Procedures" in Part II, Item 9A of this Report, we have identified material weaknesses as of December 31, 2015 in our internal control over financial reporting resulting from our failure to maintain an effective control environment, risk assessment processes and monitoring activities. Due to these material weaknesses in our internal control over financial reporting, we have also concluded our disclosure controls and procedures were not effective as of December 31, 2015.
Failure to have effective internal control over financial reporting and ineffectiveness of disclosure controls and procedures could impair our ability to produce accurate financial statements on a timely basis and could lead to a restatement of our financial statements. If, as a result of deficiencies in our internal control over financial reporting and ineffectiveness of our disclosure controls and procedures, we cannot provide reliable financial statements, our business decision processes may be adversely affected, our business and results of operations could be harmed, investors could lose confidence in our reported financial information and our ability to obtain additional financing, or additional financing on favorable terms, could be adversely affected. In addition, failure to maintain effective internal control over financial reporting could result in investigations or sanctions by regulatory authorities.
Our management has taken immediate action to begin remediating these material weaknesses, however, certain other remedial actions have not started or have only recently been undertaken, and while we expect to continue to implement our remediation plan through 2016, we cannot be certain as to when remediation will be fully completed. Additional details regarding the initial remediation efforts are disclosed in more detail under "Controls and Procedures" in Part II, Item 9A of this Report. In addition, we may in the future identify additional internal control deficiencies that could rise to the level of a material weakness or uncover errors in financial reporting. During the course of our evaluation, we may identify areas requiring improvement and may be required to design additional enhanced processes and controls to address issues identified through this review. In addition, there can be no assurance that such remediation efforts will be successful, that our internal control over financial reporting will be effective as a result of these efforts or that any such future deficiencies identified may not be material weaknesses that would be required to be reported in future periods. In addition, we cannot assure you that our independent registered public accounting firm will be able to attest that such internal controls are effective when they are required to do so.
If we fail to remediate this material weakness and maintain an effective system of disclosure controls or internal control over financial reporting, we may not be able to rely on the integrity of our financial results, which could result in inaccurate or late reporting of our financial results, as well as delays or the inability to meet our reporting obligations or to comply with SEC rules and regulations. Any of these could result in delisting actions by the NASDAQ Stock Market, investigation and sanctions by regulatory authorities, and adversely affect our business and the trading price of our common stock.
| 14 |
We experienced additional risks and costs as a result of the delayed filing of this Form 10-K.
As a result of the circumstances giving rise to this delayed filing of this Form 10-K we experienced additional risks and costs. The related investigation and audit was time-consuming, required us to incur significant incremental expenses and affected management’s attention and resources. Further, the measures to strengthen internal controls being implemented continued to require and will likely require in the future greater management time and company resources to implement and monitor. As a result of our delayed filing of this Form 10-K, we will be ineligible to register our securities on Form S-3 for sale by us or resale by others until we have timely filed all periodic reports under the Securities Exchange Act of 1934 for one year. The inability to use Form S-3 could adversely affect our ability to raise capital or complete acquisitions of other companies during this period. In addition, although we have now filed this Form 10-K, our failure to file it in a timely manner is a violation of the Securities Exchange Act of 1934 and may lead to further investigation and scrutiny by the SEC, which such investigation, and any results thereof, would require management time and company resources and could adversely affect our business and the trading price of our common stock.
Failure or inadequacy of our information technology infrastructure or software could adversely affect our day-to-day operations and decision-making processes and have an adverse effect on our performance.
We depend on accurate and timely information and numerical data from key software applications to aid our day-to-day business, financial reporting and decision-making and, in many cases, proprietary and custom-designed software is necessary to operate our business. We are upgrading our disaster recovery procedures for our critical systems. However, any disruption caused by the failure of these systems, the underlying equipment, or communication networks could delay or otherwise adversely impact our day-to-day business and decision making, could make it impossible for us to operate critical equipment, and could have an adverse effect on our performance, if our disaster recovery plans do not mitigate the disruption. Disruptions could be caused by a variety of factors, such as catastrophic events or weather, power outages, or cyber-attacks on our systems by outside parties.
We may experience difficulties fully implementing our enterprise resource planning systems.
We have been engaged in a project to upgrade our enterprise resource planning (“ERP”) systems. Our ERP systems are critical to our ability to accurately maintain books and records, record transactions, provide important information to our management and prepare our financial statements. The implementation of the new ERP systems has required, and will continue to require, the investment of significant financial and human resources. In addition, we may not be able to successfully complete the full implementation of the ERP systems without experiencing difficulties. Any disruptions, delays or deficiencies in the design and implementation of the new ERP systems could adversely affect our ability to process orders, ship products, provide services and customer support, send invoices and track payments, fulfill contractual obligations or otherwise operate our business.
Attractive acquisition opportunities may not be available to us in the future.
We will consider the acquisition of other businesses. However, we may not have the opportunity to make suitable acquisitions on favorable terms in the future, which could negatively impact the growth of our business. In order to pursue such opportunities, we may require significant additional financing, which may not be available to us on favorable terms, if at all. We expect that our competitors, many of which have significantly greater resources than we do, will compete with us to acquire compatible businesses. This competition could increase prices for acquisitions that we would likely pursue.
With respect to acquisitions we have completed or may seek to consummate in the future, we have and will incur a variety of costs, and may never realize the anticipated benefits of the acquisitions due in part to difficulties integrating the businesses, operations and product lines.
Our business strategy includes the acquisition of businesses, technologies, services or products that we believe are a strategic fit with our business. In October 2014, we completed the acquisition of two privately held life science companies: Multi Channel Systems MCS GmbH, a German company with limited liability headquartered in Reutlingen, Germany (“MCS”) and Triangle BioSystems, Inc., a Delaware corporation based in Durham, North Carolina (“TBSI”). In January 2015, we completed the acquisition of all of the operations of HEKA Electronik, a privately held biomedical instrumentation and software business with headquarters in Lambrecht, Germany (“HEKA”). With respect to these recent acquisitions or if we undertake any future acquisition, the process of integrating the acquired business, technology, service or product may result in unforeseen operating difficulties and expenditures and may absorb significant management attention that would otherwise be available for ongoing development of our business. Moreover, we may fail to realize the anticipated benefits of any acquisition as rapidly as expected or at all. Such transactions are inherently risky, and any such recent or future acquisitions could reduce stockholders’ ownership, cause us to incur debt, expose us to future liabilities and result in amortization expenses related to intangible assets with definite lives, which may adversely impact our ability to undertake future acquisitions on substantially similar terms. We may also incur significant expenditures in anticipation of an acquisition that is never realized.
| 15 |
Our ability to achieve the benefits of acquisitions depends in part on the integration and leveraging of technology, operations, sales and marketing channels and personnel. The integration process is a complex, time-consuming and expensive process and may disrupt our business if not completed in a timely and efficient manner. We may have difficulty successfully integrating acquired businesses, and their domestic and foreign operations or product lines, and as a result, we may not realize any of the anticipated benefits of the acquisitions we make. We cannot assure that our growth rate will equal the growth rates that have been experienced by us and these and other acquired companies, respectively, operating as separate companies in the past.
Customer, vendor and employee uncertainty about the effects of any of our acquisitions could harm us.
We and the customers of any company we acquire, including MCS, TBSI and HEKA and others in the future, may, in response to the consummation of the acquisition, delay or defer purchasing decisions. Any delay or deferral in purchasing decisions by customers could adversely affect our business. Similarly, employees of acquired companies may experience uncertainty about their future role until or after we execute our post-acquisition strategies. This may adversely affect our ability to attract and retain key management, sales, marketing and technical personnel following an acquisition.
Our inability to effectively sell the NanoVue, SimpliNano and other spectrophotometer products following the transition from GE Healthcare would have an adverse effect on our revenues and performance.
Since the 1970s and prior to January 1, 2016, we, through our Biochrom subsidiary, manufactured spectrophotometers sold under the GE Healthcare brand, including the NanoVue and SimpliNano branded spectrophotometers. Effective as of January 1, 2016, GE Healthcare discontinued its sale of the branded spectrophotometers and certain related products. As of January 1, 2016, we are selling and servicing these spectrophotometer products. Our inability to effectively sell such spectrophotometer products and to otherwise eliminate the impact of the loss of the related revenues attributable to the historical GE Healthcare sales, would decrease our revenues and have an adverse effect on our performance.
We may be the subject of lawsuits from either an acquiring company’s stockholders, an acquired company’s previous stockholders, a divested company’s stockholders or our current stockholders.
We may be the subject of lawsuits from either an acquiring company’s stockholders, an acquired company’s previous stockholders, a divested company’s stockholders or our current stockholders. Such lawsuits could result from the actions of the acquisition or divestiture target prior to the date of the acquisition or divestiture, from the acquisition or divestiture transaction itself or from actions after the acquisition or divestiture. Defending potential lawsuits could cost us significant expense and detract management’s attention from the operation of the business. Additionally, these lawsuits could result in the cancellation of or the inability to renew certain insurance coverage that would be necessary to protect our assets.
We may incur additional restructuring costs or not realize the expected benefits of our initiatives to reduce operating expenses to date and in the future.
In 2015, we initiated certain plans to relocate and consolidate the operations of our Coulbourn facility and our HEKA Canada facility to our headquarters in Holliston, MA and our HEKA Germany facility, respectively. We also initiated a plan in October of 2015 to eliminate certain positions made redundant as a result of our facility consolidations, as well as a realignment of our commercial team. In addition to these actions, we may seek to further eliminate certain inefficiencies in our corporate structure in the future. We may not be able to implement all of the actions that we intend to take in the restructuring of our operations and we may not be able to fully realize the expected benefits from such realignment and restructuring plans or other similar restructurings in the future. In addition, we may incur additional restructuring costs in implementing such realignment and restructuring plans or other similar future plans in excess of our expectations. The implementation of our restructuring efforts, including the reduction of our workforce, may not improve our operational and cost structure or result in greater efficiency of our organization; and we may not be able to support sustainable revenue growth and profitability following such restructurings.
The failure of any banking institution in which we deposit our funds or the failure of such banking institution to provide services could have an adverse effect on our results of operations, financial condition or access to borrowings.
We deposit our cash and cash equivalents with a number of financial institutions around the world. Should any of these financial institutions fail or otherwise be unable to timely perform requested services, we would likely have a limited ability to quickly access our cash deposited with such institutions. If we are unable to quickly access such funds, we may need to increase our use of our existing credit lines or access more expensive credit, if available. If we are unable to access some or all of our cash on deposit, either temporarily or permanently, or if we access existing or additional credit or are unable to access additional credit, it could have a negative impact on our operations, including our reported net income, our financial position, or both.
| 16 |
We have substantial debt and other financial obligations and we may incur even more debt.
We have substantial debt and other financial obligations and significant unused borrowing capacity. On March 29, 2013, we entered into a Second Amended and Restated Revolving Credit Agreement with Bank of America, as agent, and Bank of America and Brown Brothers Harriman & Co as lenders (as amended, the “Credit Agreement”). As of December 31, 2015, we had borrowings of $18.9 million under the Credit Agreement. The Credit Agreement includes covenants relating to income, debt coverage and cash flow and minimum working capital requirements. The Credit Agreement also contains limitations on our ability to incur additional indebtedness and requires lender approval for acquisitions funded with cash, promissory notes and/or other consideration in excess of $6.0 million and for acquisitions funded solely with equity in excess of $10.0 million. If we are not in compliance with certain of these covenants, in addition to other actions the creditor may require, the amounts drawn on the Credit Agreement may become immediately due and payable. This immediate payment may negatively impact our financial condition.
We have pledged substantially all of our assets (including the assets of our restricted subsidiaries) to secure our indebtedness. Our Credit Agreement and related obligations:
| · | Require us to dedicate significant cash flow to the payment of principal and interest on our debt, which reduces the funds we have available for other purposes; |
| · | May limit our flexibility in planning for or reacting to changes in our business and market conditions or funding our strategic growth plan; |
| · | Impose on us additional financial and operational restrictions; |
| · | Expose us to interest rate risk since a portion of our debt obligations is at variable rates (which is mitigated to a certain extent, by interest rate hedging transactions we entered into in connection with our Credit Agreement); and |
| · | Restrict our ability to fund certain acquisitions. |
In addition, investors may be apprehensive about investing in companies such as ours that carry a substantial amount of leverage on their balance sheets, and this apprehension may adversely affect the price of our common stock.
Failure to comply with the financial covenants, or any other non-financial or restrictive covenant, could create a default under our Credit Agreement. Upon a default, our lenders could accelerate the indebtedness under the Credit Agreement, foreclose against their collateral or seek other remedies, which would jeopardize our ability to continue our current operations. We may be required to amend our Credit Agreement, refinance all or part of our existing debt, sell assets, incur additional indebtedness or raise equity. Further, based upon our actual performance levels, our covenants relating to income, debt coverage and cash flow and minimum working capital requirements could limit our ability to incur additional debt, which could hinder our ability to execute our current business strategy.
Our ability to make scheduled payments on our debt and other financial obligations and comply with financial covenants depends on our financial and operating performance. Our financial and operating performance will continue to be subject to prevailing economic conditions and to financial, business and other factors, some of which are beyond our control.
Failure to raise additional capital or generate the significant capital necessary to implement our acquisition strategy, expand our operations and invest in new products could reduce our ability to compete and result in less revenues.
We anticipate that our financial resources, which include available cash, cash generated from operations, and debt and equity capacity, will be sufficient to finance operations and capital expenditures for at least the next twelve months. However, this expectation is premised on the current operating plan, which may change as a result of many factors, including market acceptance of new products and future opportunities with collaborators. Consequently, we may need additional funding sooner than anticipated. In addition, our Credit Agreement may not be sufficient to fund our acquisition strategy. In such case, our inability to raise sufficient capital on favorable terms and in a timely manner (if at all) could seriously harm our business, product development, and acquisition efforts.
If we raise additional funds through the sale of equity or convertible debt or equity-linked securities, existing percentages of ownership in our common stock will be reduced. In addition, these transactions may dilute the value of our outstanding common stock. We may issue securities that have rights, preferences and privileges senior to our common stock. If we raise additional funds through collaborations or licensing arrangements, we may relinquish rights to certain of our technologies or products, or grant licenses to third parties on terms that are unfavorable. In addition, our Credit Agreement contains limitations on our ability to incur additional indebtedness and requires lender approval for acquisitions funded with cash, promissory notes and/or other consideration in excess of $6.0 million and for acquisitions funded solely with equity in excess of $10.0 million. If future financing is not available or is not available on acceptable terms, we may have to alter our operations or change our business strategy. We cannot assure you that the capital required to fund operations or our acquisition strategy will be available in the future.
| 17 |
Our stock price has fluctuated in the past and could experience substantial declines in the future.
The market price of our common stock has experienced significant fluctuations and may become volatile and could decline in the future, perhaps substantially, in response to various factors including, but not limited to:
| · | volatility of the financial markets; |
| · | uncertainty regarding the prospects of the domestic and foreign economies; |
| · | technological innovations by competitors or in competing technologies; |
| · | revenues and operating results fluctuating or failing to meet the expectations of management, securities analysts, or investors in any quarter; |
| · | comments of securities analysts and mistakes by or misinterpretation of comments from analysts, downward revisions in securities analysts’ estimates or management guidance; |
| · | investment banks and securities analysts becoming subject to lawsuits that may adversely affect the perception of the market; |
| · | conditions or trends in the biotechnology and pharmaceutical industries; |
| · | announcements of significant acquisitions or financings or strategic partnerships; |
| · | non-compliance with the internal control standards pursuant to the Sarbanes-Oxley Act of 2002; and |
| · | a decrease in the demand for our common stock. |
In addition, public stock markets have experienced extreme price and trading volatility. The stock market and the NASDAQ Global Market in general, and the biotechnology industry and small cap markets in particular, have experienced significant price and volume fluctuations that at times may have been unrelated or disproportionate to the operating performance of those companies. These broad market and industry factors may further harm the market price of our common stock, regardless of our operating performance. In the past, securities class action litigation has often been instituted following periods of volatility in the market price of a company’s securities. A securities class action suit against us could result in substantial costs, potential liabilities and the diversion of management’s attention and resources.
If our spin-off of Harvard Apparatus Regenerative Technology, Inc., now known as Biostage, together with certain related transactions, does not qualify as a transaction that is generally tax-free for United States federal income tax purposes, we could be subject to significant tax liability.
On June 28, 2013, we received a Supplemental Ruling to the Private Letter Ruling dated March 22, 2013, from the IRS to the effect that, among other things, the spin-off of Biostage will qualify as a transaction that is tax-free for United States federal income tax purposes under Section 355 and 368(a)(1)(D) of the Internal Revenue Code continuing in effect. The private letter and supplemental rulings and the tax opinion that we received from Burns & Levinson LLP, special counsel to Harvard Bioscience, Inc. rely on certain representations, assumptions and undertakings, including those relating to the past and future conduct of our business and Biostage’s business, and neither the private letter and supplemental rulings nor the opinion would be valid if such representations, assumptions and undertakings were incorrect. Moreover, the private letter and supplemental rulings do not address all the issues that are relevant to determining whether the spin-off distribution will qualify for tax-free treatment. Notwithstanding the private letter and supplemental rulings and opinion, the IRS could determine the spin-off distribution should be treated as a taxable transaction for United States federal income tax purposes if, among other reasons, it determines any of the representations, assumptions or undertakings that were included in the request for the private letter and supplemental rulings are false or have been violated or if it disagrees with the conclusions in the opinion that are not covered by the IRS ruling.
If the spin-off distribution fails to qualify for tax-free treatment, in general, we would be subject to tax as if we had sold Biostage’s common stock in a taxable sale for its fair market value, and stockholders who receive shares of Biostage’s common stock in the spin-off distribution would be subject to tax as if they had received a taxable distribution equal to the fair market value of such shares.
| 18 |
To the extent we do not structure certain corporate transactions in compliance with the requirements of certain “safe harbor” provision of the internal revenue code, the tax rules applicable to a tax-free spin-off may limit our ability to engage in certain corporate transactions or raise equity capital beyond certain thresholds for a period of time after the spin-off of Biostage.
Current United States federal income tax law creates a presumption that our spin-off of Biostage would be taxable to us, but not our stockholders, if such spin-off is part of a “plan or series of related transactions” pursuant to which one or more persons acquire directly or indirectly, stock representing a 50% or greater interest (by vote or value) in us or Biostage. Although acquisitions that occur during the four-year period that begins two years before the date of the spin-off are presumed to occur pursuant to a plan or series of related transactions, the United States Treasury regulations provide several “safe harbors” for acquisitions that would not be considered to be part of such a plan. Such regulations generally provide that whether an acquisition and a spin-off are part of a plan is determined based on all of the facts and circumstances, including, but not limited to, specific factors described in the United States Treasury regulations.
With respect to the businesses, acquisitions and certain other corporate transactions we entered into during the two year period following the spin-off, we intend such transactions to comply with the safe harbors provided by the United States Treasury regulations, however, the presumption that acquisitions will be part of a “plan or series of related transactions” may have limited our ability during the two-year period following the spin-off to enter into certain transactions that may have been advantageous to us and our stockholders, particularly, issuing equity securities to satisfy financing needs, repurchasing equity securities, disposing of certain assets, engaging in mergers and acquisitions, and, under certain circumstances, acquiring businesses or assets with equity securities or agreeing to be acquired.
To preserve the tax-free treatment of the spin-off to us and our stockholders, under the tax matters agreement that we entered into with Biostage in connection with the spin-off, we are prohibited from taking or failing to take (or permitting any of our subsidiaries, other than Biostage and its subsidiaries, to take or fail to take) any action where such action or failure to act would prevent the tax-free nature of the spin-off or be inconsistent with any material, information, covenant or representation that relates to facts or matters related to Harvard Bioscience (or any of our subsidiaries, other than Biostage and its subsidiaries) or our business or within our control and is contained in any representation letter related to the private letter ruling, supplemental private letter ruling or tax opinion (or any other supplemental private letter ruling or tax opinion that may be necessary) mentioned above. These restrictions may have limited our ability to pursue strategic transactions of a certain magnitude that involved the issuance or acquisition of our stock or engaged in new businesses or other transactions that might have increased the value of our business. These restrictions may also have limited our ability to raise significant amounts of cash through the issuance of stock, especially if our stock price were to suffer substantial declines, or through the sale of certain of our assets.
Third parties may seek to hold us responsible for Biostage’s liabilities, including liabilities that Biostage has assumed from us.
Third parties may seek to hold us responsible for Biostage’s liabilities, including any of the liabilities that Biostage agreed to retain or assume in connection with the separation of the Biostage business from our businesses, and related spin-off distribution. Pursuant to our agreements with Biostage, Biostage has agreed to indemnify us for claims and losses relating to certain liabilities that it has assumed from us, including liabilities in connection with the sale of Biostage’s products, intellectually property infringement and other liabilities related to the operation of Biostage’s business. However, if those liabilities are significant and we are ultimately held liable for them, we cannot assure you that Biostage will have the ability to satisfy its obligations to us. If Biostage is unable to satisfy its obligations under its indemnity to us, we may have to satisfy these obligations, which could have an adverse impact on our financial condition, results of operations or cash flows.
If our goodwill or intangible assets become impaired, we may be required to record a significant charge to earnings.
Under accounting principles generally accepted in the United States, we review our goodwill and intangible assets for impairment when events or changes in circumstances indicate the carrying value may not be recoverable. Goodwill is also required to be tested for impairment at least annually. Factors that may be considered a change in circumstances indicating that the carrying value of our goodwill or other intangible assets may not be recoverable include a decline in our stock price and market capitalization, future cash flows, and slower growth rates in our industry. We may be required to record a significant charge to earnings in our financial statements during the period in which any impairment of our goodwill or other intangible assets is determined, which could adversely impact our results of operations.
| 19 |
Accounting for goodwill, other intangible assets and long-lived assets may have an adverse effect on us.
We assess the recoverability of identifiable intangibles with finite lives and other long-lived assets, such as property, plant and equipment, for impairment whenever events or changes in circumstances indicate that the carrying value may not be recoverable in accordance with the provisions of Financial Accounting Standards Board (“FASB”) Accounting Standards Codification (“ASU”) 360, “Property, Plant and Equipment”. In accordance with FASB ASU 350, “Intangibles-Goodwill and Other”, goodwill and intangible assets with indefinite lives from acquisitions are evaluated annually, or more frequently, if events or circumstances indicate there may be an impairment, to determine whether any portion of the remaining balance of goodwill and indefinite lived intangibles may not be recoverable. If it is determined in the future that a portion of our goodwill and other intangible assets is impaired, we will be required to write off that portion of the asset according to the methods defined by FASB ASU 360 and FASB ASU 350, which could have an adverse effect on net income for the period in which the write-off occurs. At December 31, 2015, we had goodwill and intangible assets of $62.5 million, or 49%, of our total assets and we concluded that none of our goodwill or other intangible assets was impaired.
If our accounting estimates are not correct, our financial results could be adversely affected.
Management judgment and estimates are required in the application of our Critical Accounting Policies. We discuss these estimates in the subsection entitled critical accounting policies beginning on page 27 in Item 7, Management’s Discussion and Analysis of Financial Condition and Results of Operations in this Annual Report. If our estimates are incorrect, our future financial operating results and financial condition could be adversely affected.
If we fail to retain key personnel and hire, train and retain qualified employees, we may not be able to compete effectively, which could result in reduced revenue or increased costs.
Our success is highly dependent on the continued services of key management, technical and scientific personnel. Our management and other employees may voluntarily terminate their employment at any time upon short notice. The loss of the services of any member of the senior management team, including the Chief Executive Officer, Jeffrey A. Duchemin; the Chief Financial Officer, Robert E. Gagnon; the Vice President, Commercial Operations, Yong Sun; or any of the managerial, technical or scientific staff may significantly delay or prevent the achievement of product development, our growth strategies and other business objectives. Our future success will also depend on our ability to identify, recruit and retain additional qualified scientific, technical and managerial personnel. We operate in several geographic locations where labor markets are particularly competitive, including Boston, Massachusetts, the New York metropolitan area, London and Cambridge, England, and Germany, where demand for personnel with these skills is extremely high and is likely to remain high. As a result, competition for qualified personnel is intense, particularly in the areas of general management, finance, information technology, engineering and science, and the process of hiring suitably qualified personnel is often lengthy and expensive, and may become more expensive in the future. If we are unable to hire and retain a sufficient number of qualified employees, our ability to conduct and expand our business could be seriously reduced.
If we are unable to effectively protect our intellectual property, third parties may use our technology, which would impair our ability to compete in our markets.
Our continued success will depend in significant part on our ability to obtain and maintain meaningful patent protection for certain of our products throughout the world. Patent law relating to the scope of claims in the technology fields in which we operate is still evolving. The degree of future protection for our proprietary rights is uncertain. We also own numerous United States registered trademarks and trade names and have applications for the registration of trademarks and trade names pending. We rely on patents to protect a significant part of our intellectual property and to enhance our competitive position. However, our presently pending or future patent applications may not be accepted and patents might not be issued, and any patent previously issued to us may be challenged, invalidated, held unenforceable or circumvented. Furthermore, the claims in patents which have been issued or which may be issued to us in the future may not be sufficiently broad to prevent third parties from producing competing products similar to our products. In addition, the laws of various foreign countries in which we compete may not protect our intellectual property to the same extent, as do the laws of the United States. If we fail to obtain adequate patent protection for our proprietary technology, our ability to be commercially competitive could be materially impaired.
In addition to patent protection, we also rely on protection of trade secrets, know-how and confidential and proprietary information. To maintain the confidentiality of trade-secrets and proprietary information, we generally seek to enter into confidentiality agreements with our employees, consultants and strategic partners upon the commencement of a relationship. However, we may not be able to obtain these agreements in all circumstances in part due to local regulations. In the event of unauthorized use or disclosure of this information, these agreements, even if obtained, may not provide meaningful protection for our trade-secrets or other confidential information. In addition, adequate remedies may not exist in the event of unauthorized use or disclosure of this information. The loss or exposure of our trade secrets and other proprietary information would impair our competitive advantages and could have an adverse effect on our operating results, financial condition and future growth prospects.
| 20 |
The manufacture, sale and use of products and services may expose us to product liability claims for which we could have substantial liability.
We face an inherent business risk of exposure to product liability claims if our products, services or product candidates, including without limitation, any of our life science research tools are alleged or found to have caused injury, damage or loss. We may in the future be unable to obtain insurance with adequate levels of coverage for potential liability on acceptable terms or claims of this nature may be excluded from coverage under the terms of any insurance policy that we can obtain. If we are unable to obtain such insurance or the amounts of any claims successfully brought against us substantially exceed our coverage, then our business could be adversely impacted.
We may be involved in lawsuits to protect or enforce our patents that would be expensive and time-consuming.
In order to protect or enforce our patent rights, we may initiate patent litigation against third parties. We may also become subject to interference proceedings conducted in the patent and trademark offices of various countries to determine the priority of inventions. Several of our products are based on patents that are closely surrounded by patents held by competitors or potential competitors. As a result, we believe there is a greater likelihood of a patent dispute than would be expected if our patents were not closely surrounded by other patents. The defense and prosecution, if necessary, of intellectual property suits, interference proceedings and related legal and administrative proceedings would be costly and divert our technical and management personnel from their normal responsibilities. We may not prevail in any of these suits should they occur. An adverse determination of any litigation or defense proceedings could put our patents at risk of being invalidated or interpreted narrowly and could put our patent applications at risk of being rejected and no patents being issued.
Furthermore, because of the substantial amount of discovery required in connection with intellectual property litigation, there is a risk that some of our confidential information could be compromised by disclosure during this type of litigation. For example, during the course of this kind of litigation, there could be public announcements of the results of hearings, motions or other interim proceedings or developments in the litigation. Securities analysts or investors may perceive these announcements to be negative, which could cause the market price of our stock to decline.
Our success will depend partly on our ability to operate without infringing on or misappropriating the intellectual property rights of others.
We may be sued for infringing on the intellectual property rights of others, including the patent rights, trademarks and trade names of third parties. Intellectual property litigation is costly and the outcome is uncertain. If we do not prevail in any intellectual property litigation, in addition to any damages we might have to pay, we could be required to stop the infringing activity, or obtain a license to or design around the intellectual property in question. If we are unable to obtain a required license on acceptable terms, or are unable to design around any third party patent, we may be unable to sell some of our products and services, which could result in reduced revenue.
Ethical concerns surrounding the use of our products and misunderstanding of the nature of our business could adversely affect our ability to develop and sell our existing products and new products.
Some of our products may be used in areas of research usage involving animal research and other techniques presently being explored in the life science industry. These techniques have drawn negative attention in the public forum. Government authorities may regulate or prohibit any of these activities. Additionally, the public may disfavor or reject these activities.
Rising commodity and precious metals costs could adversely impact our profitability.
Raw material commodities such as resins, and precious metal commodities such as platinum are subject to wide price variations. Increases in the costs of these commodities and the costs of energy, transportation and other necessary services may adversely affect our profit margins if we are unable to pass along any higher costs in the form of price increases or otherwise achieve cost efficiencies such as in manufacturing and distribution.
New regulations related to conflict minerals may force us to incur additional expenses and otherwise adversely impact our business.
The SEC has promulgated final rules mandated by the Dodd-Frank Act regarding disclosure of the use of tin, tantalum, tungsten and gold, known as conflict minerals, in products manufactured by public companies. These new rules require ongoing due diligence to determine whether such minerals originated from the Democratic Republic of Congo (the DRC) or an adjoining country and whether such minerals helped finance the armed conflict in the DRC. Reporting obligations for the rule began on May 31, 2014 and are required annually thereafter. There will be costs associated with complying with these disclosure requirements, including costs to determine the origin of conflict minerals in our products. The implementation of these rules and their effect on customer, supplier and/or consumer behavior could adversely affect the sourcing, supply and pricing of materials used in our products. As a result, we may also incur costs with respect to potential changes to products, processes or sources of supply. We may face disqualification as a supplier for customers and reputational challenges if the due diligence procedures we implement do not enable us to verify the origins for all conflict minerals used in our products, including that such minerals did not originate from any of the covered conflict countries. Accordingly, the implementation of these rules could have an adverse effect on our business, results of operations and/or financial condition.
| 21 |
Provisions of Delaware law, of our charter and bylaws and our Shareholder Rights Plan may make a takeover more difficult, which could cause our stock price to decline.
Provisions in our certificate of incorporation and bylaws and in the Delaware corporate law may make it difficult and expensive for a third party to pursue a tender offer, change in control or takeover attempt, which is opposed by management and the board of directors. Public stockholders who might desire to participate in such a transaction may not have an opportunity to do so. In February 2008, our Board of Directors adopted a Shareholder Rights Plan that could make it more difficult for a third party to acquire, or could discourage a third party from acquiring, the Company or a large block of our common stock. A third party that acquires 20% or more of our common stock (an “Acquiring Person”) could suffer substantial dilution of its ownership interest under the terms of the Shareholder Rights Plan through the issuance of common stock to all shareholders other than the Acquiring Person. We also have a staggered board of directors that makes it difficult for stockholders to change the composition of the board of directors in any one year. These anti-takeover provisions could substantially impede the ability of public stockholders to change our management and board of directors. Such provisions may also limit the price that investors might be willing to pay for shares of our common stock in the future.
An active trading market for our common stock may not be sustained.
Although our common stock is quoted on the NASDAQ Global Market, an active trading market for the shares may not be sustained. This could negatively affect the price for our common stock, including investors’ ability to buy or sell our common stock and the listing thereof.
Any issuance of preferred stock in the future may dilute the rights of our common stockholders.
Our board of directors has the authority to issue up to 5,000,000 shares of preferred stock and to determine the price, privileges and other terms of these shares. The board of directors may exercise this authority without any further approval of stockholders. The rights of the holders of common stock may be adversely affected by the rights of future holders of preferred stock.
Cash dividends will not likely be paid on our common stock.
Currently, we intend to retain all of our earnings to finance the expansion and development of our business and do not anticipate paying any cash dividends to holders of our common stock in the near future. As a result, capital appreciation, if any, of our common stock will be a stockholder’s sole source of gain for the near future.
Item 1B. Unresolved Staff Comments.
None.
Our twelve principal facilities incorporate manufacturing, research and development, sales and marketing, and administration functions. Our facilities consist of:
• a leased 83,123 square foot facility in Holliston, Massachusetts, which includes our corporate headquarters,
• a leased 36,144 square foot facility in Charlotte, North Carolina,
• a leased 29,020 square foot facility in Richmond, California,
• a leased 22,900 square foot facility in Nordhausen, Germany,
| 22 |
• a leased 22,449 square foot facility in Reutlingen, Germany,
• a leased 20,853 square foot facility in Barcelona, Spain,
• a leased 12,031 square foot facility in March-Hugstetten, Germany,
• a leased 10,820 square foot facility in Cambourne, England,
• a leased 9,419 square foot facility in Lambrecht, Germany,
• a leased 7,500 square foot facility in Hamden, Connecticut,
• a leased 3,780 square foot facility in Durham, North Carolina, and
• a leased 3,229 square foot facility in Kista, Sweden.
We also lease additional facilities for sales and administrative support in Shanghai, China, Les Ulis, France, St. Augustin, Germany, Lunenburg, Canada and Montreal, Canada.
We believe our current facilities are adequate for our needs for the foreseeable future.
From time to time, we may be involved in various claims and legal proceedings arising in the ordinary course of business. We are not currently a party to any such significant claims or proceedings.
Item 4. Mine Safety Disclosures
Not Applicable.
| 23 |
PART II
Item 5. Market for Registrant’s Common Equity, Related Stockholder Matters and Issuer Purchases of Equity Securities.
Price Range of Common Stock
Our common stock has been quoted on the NASDAQ Global Market since our initial public offering on December 7, 2000, and currently trades under the symbol “HBIO.” The following table sets forth the range of the high and low sales prices per share of our common stock as reported on the NASDAQ Global Market for the quarterly periods indicated.
| Fiscal Year Ended December 31, 2015 | High | Low | ||||||
| First Quarter | $ | 5.82 | $ | 5.02 | ||||
| Second Quarter | $ | 6.70 | $ | 5.15 | ||||
| Third Quarter | $ | 5.63 | $ | 3.74 | ||||
| Fourth Quarter | $ | 4.06 | $ | 2.87 | ||||
| Fiscal Year Ended December 31, 2014 | High | Low | ||||||
| First Quarter | $ | 4.88 | $ | 4.10 | ||||
| Second Quarter | $ | 4.74 | $ | 3.73 | ||||
| Third Quarter | $ | 4.90 | $ | 4.09 | ||||
| Fourth Quarter | $ | 5.67 | $ | 4.14 | ||||
On March 21, 2016, the closing sale price of our common stock on the NASDAQ Global Market was $2.77 per share. There were 142 holders of record of our common stock as of March 21, 2016. We believe that the number of beneficial owners of our common stock at that date was substantially greater.
Dividend Policy
We have never declared or paid cash dividends on our common stock in the past and do not intend to pay cash dividends on our common stock in the foreseeable future. Any future determination to pay cash dividends will be at the discretion of our Board of Directors and will depend on our financial condition, results of operations, capital requirements and other factors our Board of Directors deems relevant.
Stockholder Return Performance Graph
This performance graph shall not be deemed “filed” for purposes of Section 18 of the Securities Exchange Act of 1934, as amended (the Exchange Act), or incorporated by reference into any filing of Harvard Bioscience under the Securities Act of 1933, as amended, or the Exchange Act, except as shall be expressly set forth by specific reference in such filing.
The following graph provides a comparison of the cumulative total stockholder return on the Company’s common stock from December 31, 2010 to December 31, 2015 with the cumulative return of the Russell 2000 Index and the Nasdaq Biotechnology Index over the same period. The five-year cumulative return assumes an initial investment of $100 in the Company’s common stock and in each index on December 31, 2010. The total return for the Company’s common stock and the indices used assumes the reinvestment of all dividends. The table below reflects the stock prices as adjusted for the spin-off of HART which was effected on November 1, 2013, for all periods presented.
| 24 |
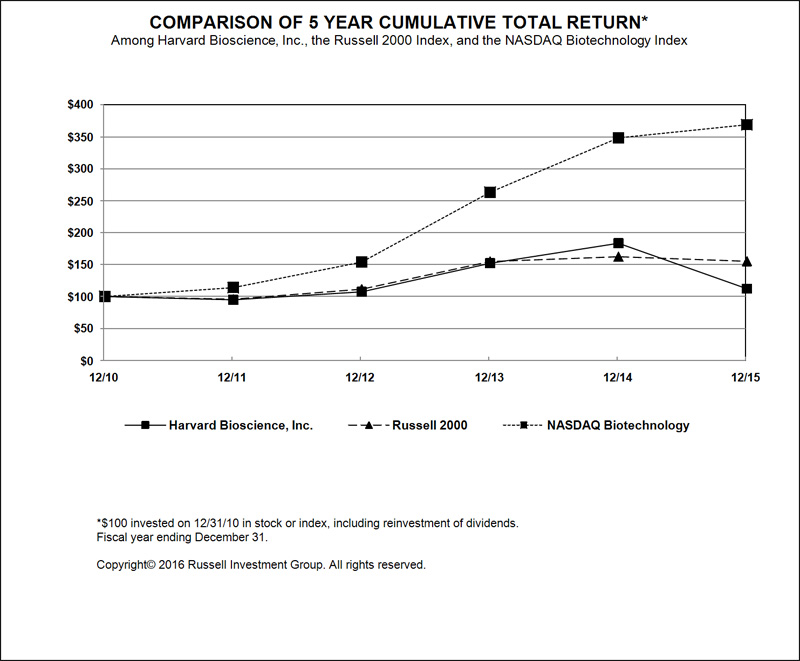
| 12/10 | 12/11 | 12/12 | 12/13 | 12/14 | 12/15 | |||||||||||||||||||
| Harvard Bioscience, Inc. | 100.00 | 94.85 | 107.35 | 152.04 | 183.42 | 112.25 | ||||||||||||||||||
| Russell 2000 | 100.00 | 95.82 | 111.49 | 154.78 | 162.35 | 155.18 | ||||||||||||||||||
| NASDAQ Biotechnology | 100.00 | 113.92 | 153.97 | 263.29 | 348.49 | 369.06 | ||||||||||||||||||
The stock price performance included in this graph is not necessarily indicative of future stock price performance.
Item 6. Selected Financial Data
The financial data presented below have been derived from our audited consolidated financial statements. The selected historical financial data presented below should be read in conjunction with “Item 7. Management’s Discussion and Analysis of Financial Condition and Results of Operations” and “Item 8. Financial Statements and Supplementary Data.” and with our previously filed Annual Reports on Form 10-K. The selected data in this section is not intended to replace the consolidated financial statements. The information presented below is not necessarily indicative of the results of our future operations.
| 25 |
| For The Year Ended December 31, | ||||||||||||||||||||
| 2015 | 2014 | 2013 | 2012 | 2011 | ||||||||||||||||
| (in thousands, except per share data) | ||||||||||||||||||||
| Statement of Operations Data: | ||||||||||||||||||||
| Revenues | $ | 108,664 | $ | 108,663 | $ | 105,171 | $ | 111,171 | $ | 108,864 | ||||||||||
| Cost of revenues | 59,941 | 59,319 | 57,475 | 58,831 | 58,672 | |||||||||||||||
| Gross profit | 48,723 | 49,344 | 47,696 | 52,340 | 50,192 | |||||||||||||||
| Operating expenses | 50,436 | 42,726 | 46,159 | 44,510 | 41,787 | |||||||||||||||
| Operating (loss) income | (1,713 | ) | 6,618 | 1,537 | 7,830 | 8,405 | ||||||||||||||
| Other expense, net | (1,895 | ) | (2,201 | ) | (1,102 | ) | (938 | ) | (1,537 | ) | ||||||||||
| (Loss) income from continuing operations before income taxes | (3,608 | ) | 4,417 | 435 | 6,892 | 6,868 | ||||||||||||||
| Income tax expense (benefit) (1) | 15,431 | 2,062 | (288 | ) | 2,398 | 1,579 | ||||||||||||||
| (Loss) income from continuing operations | (19,039 | ) | 2,355 | 723 | 4,494 | 5,289 | ||||||||||||||
| Discontinued operations (2): | ||||||||||||||||||||
| Loss from discontinued operations, net of tax | - | - | (2,553 | ) | (2,124 | ) | (1,477 | ) | ||||||||||||
| Net (loss) income | $ | (19,039 | ) | $ | 2,355 | $ | (1,830 | ) | $ | 2,370 | $ | 3,812 | ||||||||
| (Loss) earnings per share: | ||||||||||||||||||||
| Basic (loss) earnings per common share from continuing operations | $ | (0.57 | ) | $ | 0.07 | $ | 0.02 | $ | 0.16 | $ | 0.19 | |||||||||
| Discontinued operations | - | - | (0.08 | ) | (0.07 | ) | (0.05 | ) | ||||||||||||
| Basic (loss) earnings per common share | $ | (0.57 | ) | $ | 0.07 | $ | (0.06 | ) | $ | 0.09 | $ | 0.14 | ||||||||
| Diluted (loss) earnings per common share from continuing operations | $ | (0.57 | ) | $ | 0.07 | $ | 0.02 | $ | 0.15 | $ | 0.18 | |||||||||
| Discontinued operations | - | - | (0.08 | ) | (0.07 | ) | (0.05 | ) | ||||||||||||
| Diluted (loss) earnings per common share | $ | (0.57 | ) | $ | 0.07 | $ | (0.06 | ) | $ | 0.08 | $ | 0.13 | ||||||||
| Weighted average common shares: | ||||||||||||||||||||
| Basic | 33,593 | 32,171 | 30,384 | 28,799 | 28,451 | |||||||||||||||
| Diluted | 33,593 | 33,237 | 31,914 | 29,793 | 29,819 | |||||||||||||||
| As of December 31, | ||||||||||||||||||||
| 2015 | 2014 | 2013 | 2012 | 2011 | ||||||||||||||||
| (in thousands) | ||||||||||||||||||||
| Balance Sheet Data: | ||||||||||||||||||||
| Cash and cash equivalents | $ | 6,744 | $ | 14,134 | $ | 25,771 | $ | 20,681 | $ | 17,916 | ||||||||||
| Working capital | 31,140 | 38,964 | 44,665 | 49,071 | 48,004 | |||||||||||||||
| Total assets | 120,217 | 135,916 | 135,460 | 133,484 | 126,634 | |||||||||||||||
| Long-term debt, net of current portion | 16,450 | 16,450 | 19,750 | 12,950 | 16,300 | |||||||||||||||
| Stockholders’ equity | 77,598 | 95,468 | 94,485 | 104,213 | 95,499 | |||||||||||||||
| (1) | Income tax expense for the year ended December 31, 2015 is primarily the result of the recognition of a valuation allowance on U.S. deferred tax assets. |
| (2) | Discontinued operations include: |
| On September 30, 2008, we completed the sale of assets of our Union Biometrica Division to UBIO Acquisition Company. The purchase price paid by UBIO Acquisition Company included an earn-out based on the revenue generated by the acquired business over a five-year post-transaction period. Discontinued operations include a gain on disposal related to the earn-out, net of tax, of $0.3 million in 2013. |
| On November 1, 2013, the spin-off of our RMD business from our Company was completed. Through the spin-off date the historical operations of RMD were reported as continuing operations in our consolidated statements of operations. Following the spin-off, and reported herein, the historical operations of RMD were restated and presented as discontinued operations in our consolidated statements of operations presented. Discontinued operations include the results of the RMD business except for certain corporate overhead costs and other allocations, which remain in continuing operations. The costs incurred to separate and spin-off the RMD business remain in continuing operations and have been classified and reported as transaction costs, within operating expenses, on our consolidated statements of operations. Discontinued operations include losses from operations of the RMD business, net of tax, for 2013 of $2.8 million. |
| 26 |
Item 7. Management’s Discussion and Analysis of Financial Condition and Results of Operations.
Forward-Looking Statements
The following section of this Annual Report on Form 10-K entitled “Management’s Discussion and Analysis of Financial Condition and Results of Operations” contains statements that are not statements of historical fact and are forward-looking statements within the meaning of federal securities laws. These statements involve known and unknown risks, uncertainties and other factors that may cause our actual results, performance or achievements to be materially different from any future results, performance or achievements expressed or implied by the forward-looking statements. These statements reflect our current views with respect to future events and are based on assumptions and subject to risks and uncertainties. Factors that may cause our actual results to differ materially from those in the forward-looking statements include those factors described in “Item 1A. Risk Factors” beginning on page 11 of this Annual Report on Form 10-K. You should carefully review all of these factors, as well as the comprehensive discussion of forward-looking statements on page 1 of this Annual Report on Form 10-K.
Overview
Harvard Bioscience, Inc., a Delaware corporation, is a global developer, manufacturer and marketer of a broad range of scientific instruments, systems and lab consumables used to advance life science for basic research, drug discovery, clinical and environmental testing. Our products are sold to thousands of researchers in over 100 countries through our global sales organization, websites, catalogs, and through distributors including Thermo Fisher Scientific Inc., VWR, GE Healthcare and other specialized distributors. We have sales and manufacturing operations in the United States, the United Kingdom, Germany, Sweden, Spain, France, Canada, and China.
From 2009 through November 1, 2013, our operations included two main businesses, the Life Science Research Tools business and the Regenerative Medicine Device business. In 2013, we formed and consummated the spin-off of Harvard Apparatus Regenerative Technology, Inc. to our existing shareholders by means of a distribution of the shares we owned in Harvard Apparatus Regenerative Technology, Inc. Harvard Apparatus Regenerative Technology, Inc. changed its name to Biostage, Inc. in April 2016 and is referred to herein as Biostage.
At the end of 2013 we began a multiple year restructuring program to reduce costs, align global functions, consolidate facilities, and reinvest in key areas such as sales and IT. As part of the reinvestment, we initiated a multiple year plan in 2014 to invest in and implement a new global enterprise resource planning platform. Additionally, during 2014, as part of the restructuring program, we initiated plans to relocate and consolidate the distribution, finance and marketing operations of our Denville Scientific, Inc. subsidiary (“Denville Scientific”) to Charlotte, North Carolina and our Holliston, MA headquarters, and relocate the manufacturing operations of our Biochrom Ltd. subsidiary (“Biochrom”) to our Holliston, MA headquarters. During the first quarter of 2015, we initiated plans to relocate the operations of our subsidiary, Coulbourn Instruments, LLC (“Coulbourn”), to our Holliston, MA headquarters. During the second quarter of 2015, we initiated plans to relocate the operations of HEKA Electronics Incorporated, our HEKA Canada subsidiary (“HEKA Canada”), to HEKA Electronik Dr. Schulze GmbH, our HEKA Germany subsidiary (“HEKA Germany”). Also during the second quarter of 2015, and simultaneously with the HEKA Canada move, we initiated plans to relocate the operations of HEKA Instruments Incorporated, our United States HEKA subsidiary (“HEKA U.S.”, and together with HEKA Canada and HEKA Germany, “HEKA”), to our Holliston, MA headquarters. As of December 31, 2015, these relocation plans have been completed. Additionally, we committed to a restructuring plan on October 27, 2015, which included eliminating certain redundancies as a result of our site consolidations, as well as a realignment of our commercial sales team. We believe the overall restructuring program positions Harvard Bioscience to stabilize, focus on, and grow the life science business going forward.
During the third quarter of 2015, GE Healthcare informed us of its decision to discontinue the sale of its spectrophotometer products by the end of 2015. This line of products includes the GE brands NanoVue and SimpliNano, which we manufacture and distributed through GE. As of January 1, 2016, we have been selling the NanoVue and SimpliNano spectrophotometers through our own direct sales force and through distribution partners, as well as servicing previously sold products in the field, yielding a new potential source of revenue and higher gross margins. As a result of GE’s decision, there were lower sales of GE branded spectrophotometers of approximately $2.1 million during the year ended December 31, 2015. We expect to resume revenue from the sale of these spectrophotometers beginning in 2016 and to see potential benefits from an expanded customer base for many of our other products.
| 27 |
Our Strategy
Our vision is to be a world leading life science company that excels in meeting the needs of our customers by providing a wide breath of innovative products and solutions, while providing exemplary customer service. Our business strategy is to grow our top-line and bottom-line, and build shareholder value through a commitment to:
| • | commercial excellence and organic growth; | |
| • | new product development; |
| • | strategic acquisitions; and |
| • | operational efficiencies. |
In the table below, we provide an overview of selected operating metrics.
| % of | % of | % of | ||||||||||||||||||||||
| 2015 | Revenues | 2014 | Revenues | 2013 | Revenues | |||||||||||||||||||
| (dollars in thousands) | ||||||||||||||||||||||||
| Revenues | $ | 108,664 | $ | 108,663 | $ | 105,171 | ||||||||||||||||||
| Cost of revenues | 59,941 | 55.2 | % | 59,319 | 54.6 | % | 57,475 | 54.6 | % | |||||||||||||||
| Sales and marketing expenses | 20,577 | 18.9 | % | 18,225 | 16.8 | % | 17,330 | 16.5 | % | |||||||||||||||
| General and administrative expenses | 19,832 | 18.3 | % | 16,826 | 15.5 | % | 17,887 | 17.0 | % | |||||||||||||||
| Research and development expenses | 6,420 | 5.9 | % | 4,880 | 4.5 | % | 4,154 | 3.9 | % | |||||||||||||||
| Restructuring charges | 788 | 0.7 | % | 1,027 | 0.9 | % | 2,150 | 2.0 | % | |||||||||||||||
| Amortization of intangible assets | 2,819 | 2.6 | % | 2,578 | 2.4 | % | 2,590 | 2.5 | % | |||||||||||||||
| Biostage transaction costs | - | 0.0 | % | - | 0.0 | % | 2,048 | 1.9 | % | |||||||||||||||
| Gain on sale of assets | - | 0.0 | % | 810 | 0.7 | % | - | 0.0 | % | |||||||||||||||
Components of Operating Income
Revenues. We generate revenues by selling apparatus, instruments, devices and consumables through our distributors, direct sales force, websites and catalogs. Our websites and catalogs serve as the primary sales tools for our Cell and Animal Physiology product line. This product line includes both proprietary manufactured products and complementary products from various suppliers. Our reputation as a leading producer in many of our manufactured products creates traffic to our website, enables cross-selling and facilitates the introduction of new products. We have field sales teams in the U.S., Canada, the United Kingdom, Germany, France, Spain and China. In those regions where we do not have a direct sales team, we use distributors. Revenues from direct sales to end users represented approximately 63%, 58% and 57% of our revenues for the years ended December 31, 2015, 2014 and 2013, respectively.
Products in our Molecular Separation and Analysis product line are generally sold by distributors, and are typically priced in the range of $5,000-$15,000. They are mainly scientific instruments like spectrophotometers and plate readers that analyze light to detect and quantify a wide range of molecular and cellular processes, or apparatus like gel electrophoresis units. We also use distributors for both our catalog products and our higher priced products, for sales in locations where we do not have subsidiaries or where we have existing distributors in place from acquired businesses. For the years ended December 31, 2015, 2014 and 2013, approximately 37%, 42% and 43% of our revenues, respectively, were derived from sales to distributors.
For the years ended December 31, 2015, 2014 and 2013, approximately 62%, 65% and 64% of our revenues, respectively, were derived from products we manufacture, approximately 13%, 10% and 11%, respectively, were derived from complementary products we distribute in order to provide the researcher with a single source for all equipment needed to conduct a particular experiment, and approximately 25%, for all years presented, were derived from distributed products sold under our brand names.
| 28 |
For the years ended December 31, 2015, 2014 and 2013, approximately 40%, 41% and 39% of our revenues, respectively, were derived from sales made by our non-United States operations.
Changes in the relative proportion of our revenue sources between catalog or website sales, direct sales and distribution sales are primarily the result of a different sales proportion of acquired companies and changes in geographic mix.
Cost of revenues. Cost of revenues includes material, labor and manufacturing overhead costs, obsolescence charges, packaging costs, warranty costs, shipping costs and royalties. Our cost of revenues may vary over time based on the mix of products sold. We sell products that we manufacture and products that we purchase from third parties. The products that we purchase from third parties typically have a higher cost of revenues as a percent of revenues because the profit is effectively shared with the original manufacturer. We anticipate that our manufactured products will continue to have a lower cost of revenues as a percentage of revenues as compared with the cost of non-manufactured products for the foreseeable future. Additionally, our cost of revenues as a percent of revenues will vary based on mix of direct to end user sales and distributor sales, mix by product line and mix by geography.
Sales and marketing expenses. Sales and marketing expense consists primarily of salaries and related expenses for personnel in sales, marketing and customer support functions. We also incur costs for travel, trade shows, demonstration equipment, public relations and marketing materials, consisting primarily of the printing and distribution of our catalogs, supplements and the maintenance of our websites. We may from time to time expand our marketing efforts by employing additional technical marketing specialists in an effort to increase sales of selected categories of products. We may also from time to time expand our direct sales organizations in an effort to concentrate on key accounts or promote certain product lines.
General and administrative expenses. General and administrative expense consists primarily of salaries and other related costs for personnel in executive, finance, accounting, information technology and human resource functions. Other costs include professional fees for legal and accounting services, facility costs, investor relations, insurance and provision for doubtful accounts.
Research and development expenses. Research and development expense consists primarily of salaries and related expenses for personnel and spending to develop and enhance our products. Other research and development expense includes fees for consultants and outside service providers, and material costs for prototype and test units. We expense research and development costs as incurred. We believe that investment in product development is a competitive necessity and plan to continue to make these investments in order to realize the potential of new technologies that we develop, license or acquire for existing markets.
Restructuring charges. Restructuring charges consist of severance, other personnel-related charges and exit costs related to plans to create organizational efficiencies and reduce operating expenses.
Biostage transaction costs. Biostage transaction costs consist of legal, accounting and other professional fees incurred to facilitate the separation and spin-off of Biostage. The costs have been included as a component of operating expenses on our consolidated statements of operations.
Stock-based compensation expenses. Stock-based compensation expense for the years ended December 31, 2015, 2014 and 2013 was $2.8 million, $2.2 million and $2.7 million, respectively. The stock-based compensation expense related to stock options, restricted stock units, restricted stock units with a market condition and the employee stock purchase plan and was recorded as a component of cost of revenues, sales and marketing expenses, general and administrative expenses, research and development expenses and discontinued operations.
Currently, we intend to retain all of our earnings to finance the expansion and development of our business and do not anticipate paying any cash dividends to holders of our common stock in the near future. As a result, capital appreciation, if any, of our common stock will be a stockholder’s sole source of gain for the near future.
Bookings and Backlog
We monitor bookings and backlog as these are indicators of future revenues and business activity levels.
Bookings were $110.9 million and $109.9 million for the years ended December 31, 2015 and 2014, respectively. Excluding the effects of currency translation, our bookings increased $5.2 million, or 4.7% from the year ended December 31, 2014. The increase in bookings was primarily the result of our acquisitions of MCS, TBSI and HEKA. Bookings were $109.9 million and $105.6 million for the years ended December 31, 2014 and 2013, respectively. Excluding the effects of currency translation, our bookings increased $3.3 million, or 3.1% from the year ended December 31, 2013.
| 29 |
Our order backlog was approximately $9.0 million and $7.2 million as of December 31, 2015 and 2014, respectively. Excluding the effects of currency translation, our backlog increased $2.2 million, or 31.0% from December 31, 2014. The increase in backlog was primarily the result of the timing of customer orders and shipments. Our order backlog was approximately $7.2 million and $5.1 million as of December 31, 2014 and 2013, respectively. Excluding the effects of currency translation, our backlog increased $2.4 million, or 46.5% from December 31, 2013. The increase in backlog was primarily the result of our 2014 fourth quarter acquisitions of MCS and TBSI and the timing of customer orders and shipments. We include in backlog only those orders for which we have received valid purchase orders. Purchase orders may be cancelled at any time prior to shipment. Our backlog as of any particular date may not be representative of actual sales for any succeeding period.
Selected Results of Operations
Year Ended December 31, 2015 compared to Year Ended December 31, 2014
Each reporting period, we face currency exposure that arises from translating the results of our worldwide operations to the United States dollar at exchange rates that fluctuate from the beginning of such period. We evaluate our results of operations on both a reported and a foreign currency-neutral basis, which excludes the impact of fluctuations in foreign currency exchange rates. We believe that disclosing this non-GAAP financial information provides investors with an enhanced understanding of the underlying operations of the business. This non-GAAP financial information approximates information used by our management to internally evaluate our operating results. The non-GAAP financial information provided below should be considered in addition to, not as a substitute for, the financial information provided and presented in accordance with accounting principles generally accepted in the United States, or GAAP.
Revenues
Revenues for the year ended December 31, 2015 were $108.7 million, and flat compared to revenues for the year ended December 31, 2014.
Revenues contributed by our MCS, TBSI and HEKA acquisitions were offset by the negative impact of currency translation and GE Healthcare discontinuing the sale of its spectrophotometer products, which amounted to approximately $4.0 million and $2.1 million, respectively, in lower revenues during 2015. Excluding the impact of currency translation, revenues increased approximately 3.7%.
| Reconciliation of Changes In Revenues Compared to the Same Period of the Prior Year | ||||
| For the Year Ended | ||||
| December 31, 2015 | ||||
| Growth | 3.7 | % | ||
| Foreign exchange effect | -3.7 | % | ||
| Net revenue growth | 0.0 | % | ||
Cost of revenues
Cost of revenues were $59.9 million for the year ended December 31, 2015, an increase of $0.6 million, or 1.0%, compared with $59.3 million for the year ended December 31, 2014. Gross profit margin as a percentage of revenues decreased to 44.8% for the year ended December 31, 2015 compared with 45.4% for 2014. The decrease in gross profit margin was due primarily to unfavorable currency translation and costs to relocate and consolidate certain facilities, partially offset by the contributions from MCS, TBSI and HEKA.
| 30 |
Sales and marketing expenses
Sales and marketing expenses increased $2.4 million, or 12.9%, to $20.6 million for the year ended December 31, 2015 compared with $18.2 million for the year ended December 31, 2014. The increase was primarily due to our acquisitions and higher payroll related costs, partially offset by favorable currency translation and the impact of our restructuring activities.
General and administrative expenses
General and administrative expenses were $19.8 million for the year ended December 31, 2015, an increase of $3.0 million, or 17.9%, compared with $16.8 million for the year ended December 31, 2014. The increase was primarily due to our acquisitions, costs to relocate and consolidate certain facilities and higher stock compensation expense, partially offset by favorable currency translation, lower incentive bonus costs, and the impact of our restructuring activities.
Research and development expenses
Research and development expenses were $6.4 million for the year ended December 31, 2015, an increase of $1.5 million, or 31.6%, compared with $4.9 million for the year ended December 31, 2014. The increase was primarily due to our acquisitions, partially offset by favorable currency translation, lower incentive bonus costs, and the impact of our restructuring activities.
Restructuring
Restructuring charges were $0.8 million for year ended December 31, 2015 compared with $1.0 million for the year ended December 31, 2014. Restructuring charges during the year ended December 31, 2014 included additional charges related to the company-wide restructuring plan we implemented during the year ended December 31, 2013, as well as charges related to the restructuring plan we commenced during the year ended December 31, 2014. The 2013 restructuring plan realigned global operations and included a reduction of our workforce of approximately 13%, as well as the elimination of the position of Chief Operating Officer. The 2014 restructuring plan realigned global operations and included actions to move the Biochrom manufacturing and Denville Scientific distribution operations to Holliston, MA and Charlotte, NC, respectively.
Restructuring charges recorded during the year ended December 31, 2015 included additional charges related to the restructuring plan we implemented during the year ended December 31, 2014, as described above, as well as charges related to restructuring plans commenced during the year ended December 31, 2015. The 2015 restructuring plans included actions to move the Coulbourn Instruments’ operations to Holliston, MA and the HEKA Canada operations to HEKA Germany, as well as eliminating certain positions made redundant as a result of our site consolidations and a realignment of our commercial sales team.
Amortization of intangible assets
Amortization of intangible asset expenses was $2.8 million for the year ended December 31, 2015 compared with $2.6 million for the year ended December 31, 2014.
Other expense, net
Other expense, net, was $1.9 million and $2.2 million for the years ended December 31, 2015 and 2014, respectively. Included in other expense, net for the year ended December 31, 2015 was interest expense of $0.9 million and $1.2 million of acquisition related costs, including due diligence and deal investigative activities. For the year ended December 31, 2014 other expense, net included $1.0 million of interest expense and $1.1 million of acquisition related costs, including due diligence and deal investigative activities. The decrease in other expense, net was primarily due to currency exchange rate fluctuations. Currency exchange rate fluctuations included as a component of net (loss) income resulted in approximately $0.2 million in currency gains during the year ended December 31, 2015, compared to $0.2 million in currency losses during the year ended December 31, 2014.
Income taxes
Income tax expense was approximately $15.4 million and $2.1 million for the years ended December 31, 2015 and 2014, respectively. The increase in income tax expense year over year was primarily attributable to the recognition of a valuation allowance on U.S. deferred tax assets in 2015. During the year ended December 31, 2015, we determined that it was more likely than not that our U.S. deferred tax assets would not be realized and therefore recorded a net increase to the valuation allowance of $16.4 million to offset U.S. deferred tax assets net of deferred tax liabilities except for certain indefinite-lived intangible assets. This decision was based on all available evidence.
| 31 |
Year Ended December 31, 2014 compared to Year Ended December 31, 2013
Each reporting period, we face currency exposure that arises from translating the results of our worldwide operations to the United States dollar at exchange rates that fluctuate from the beginning of such period. We evaluate our results of operations on both a reported and a foreign currency-neutral basis, which excludes the impact of fluctuations in foreign currency exchange rates. We believe that disclosing this non-GAAP financial information provides investors with an enhanced understanding of the underlying operations of the business. This non-GAAP financial information approximates information used by our management to internally evaluate our operating results. The non-GAAP financial information provided below should be considered in addition to, not as a substitute for, the financial information provided and presented in accordance with accounting principles generally accepted in the United States, or GAAP.
Revenues
Revenues increased 3.3%, or $3.5 million, to $108.7 million for the year ended December 31, 2014 compared to revenues of $105.2 million for the same period in 2013. Excluding the effects of currency translation, our revenues increased 2.4% from the previous year. The increase was the result of revenues from the newly acquired MCS and TBSI and organic growth.
| Reconciliation of Changes In Revenues Compared to the Same Period of the Prior Year | ||||
| For the Year Ended | ||||
| December 31, 2014 | ||||
| Growth | 2.4 | % | ||
| Foreign exchange effect | 0.9 | % | ||
| Net revenue growth | 3.3 | % | ||
Cost of revenues
Cost of revenues increased $1.8 million, or 3.2%, to $59.3 million for the year ended December 31, 2014 compared with $57.5 million for the year ended December 31, 2013. Gross profit margin as a percentage of revenues was 45.4% for both years ended December 31, 2014 and 2013. Contributing factors in the year over year increase were currency translation, costs from our fourth quarter acquisitions, as well as unpaid incentive bonus costs.
Sales and marketing expenses
Sales and marketing expenses increased $0.9 million, or 5.2%, to $18.2 million for the year ended December 31, 2014 compared with $17.3 million for the year ended December 31, 2014. The increase was primarily due to unpaid incentive bonus costs, our fourth quarter acquisitions and unfavorable currency translation.
General and administrative expenses
General and administrative expenses decreased $1.1 million, or 5.9%, to $16.8 million for the year ended December 31, 2014 compared with $17.9 million for the year ended December 31, 2013. The decrease was primarily due to lower payroll related costs and lower stock compensation expenses, partially offset by unpaid incentive bonus costs, our fourth quarter acquisitions and unfavorable currency translation.
Research and development expenses
Research and development expenses were $4.9 million for the year ended December 31, 2014, an increase of $0.7 million, or 17.5%, compared with $4.2 million for the year ended December 31, 2013. The increase was primarily due to higher payroll related costs, including unpaid incentive bonus costs, our fourth quarter acquisitions and unfavorable currency translation.
| 32 |
Restructuring
Restructuring charges were $1.0 million for the year ended December 31, 2014 compared with $2.2 million for the year ended December 31, 2013. The decrease was primarily due to charges recorded during the year ended December 31, 2013 related to the company-wide restructuring plan we implemented during the year ended December 31, 2013, partially offset by additional charges recorded during the year ended December 31, 2014 related to the 2013 restructuring plan and charges related to the 2014 restructuring plan. The 2013 restructuring plan realigned global operations and included a reduction of our workforce of approximately 13%, as well as the elimination of the position of Chief Operating Officer. The 2014 restructuring plan realigned global operations and included actions to move the Biochrom and Denville Scientific operations to Holliston, MA and Charlotte, NC, respectively.
Amortization of intangible assets
Amortization of intangible asset expenses was $2.6 million for the year ended December 31, 2014, which was unchanged from the year ended December 31, 2013.
Biostage transaction costs
Biostage transaction costs, which consist of corporate transaction costs related to the separation and spin-off of Biostage, were $0 for the year ended December 31, 2014 compared with $2 million for the year ended December 31, 2013.
Gain on sale of assets
As part of the previously discussed 2013 restructuring plan, we decided to close one of our facilities in the United Kingdom. During the fourth quarter of 2014, the facility was sold. The gain of $0.8 million was recorded in a separate line in our statement of operations within operating expenses.
Other expense, net
Other expense, net, was $2.2 million and $1.1 million for the years ended December 31, 2014 and 2013, respectively. Interest expense was $1.0 million for the year ended December 31, 2014, which was flat compared to interest expense for the year ended December 31, 2013. The increase in other expense, net was due to $1.1 million in acquisition related costs incurred during the year ended December 31, 2014 compared to $0 for the year ended December 31, 2013.
Income taxes
Income tax expense (benefit) from continuing operations was approximately $2.1 million expense and $0.3 benefit for the years ended December 31, 2014 and 2013, respectively. The effective income tax rate from continuing operations was 46.7% expense for the year ended December 31, 2014, compared with 66.2% benefit for the same period in 2013. The difference between our effective tax rate year over year was primarily attributable an increase in valuation allowance related to foreign tax credits in 2014 versus certain non-deductible costs related to the Biostage spin-off partially offset by higher research and development tax credits and pension expense in 2013.
Discontinued Operations
In September 2008, we completed the sale of assets of our Union Biometrica Division including our German subsidiary, Union Biometrica GmbH, to UBIO Acquisition Company. During 2013, we received earn-out payments, including interest, from UBIO Acquisition Company, of $1.8 million related to the 2008 acquisition. We received our final payment under the earn-out obligation from UBIO Acquisition Company in October 2013. Included in the loss from discontinued operations, net of taxes, is a gain on disposal related to the Union Biometrica earn-out of $0.3 million for the year ended December 31, 2013.
On November 1, 2013, the spin-off of Biostage and our RMD business was completed. Through the spin-off date the historical operations of RMD were reported as continuing operations in our consolidated statements of operations. Following the spin-off, the historical operations of RMD were restated and presented as discontinued operations in our consolidated statements of operations. Discontinued operations include the results of the RMD business except for certain corporate overhead costs and other allocations, which remain in continuing operations. The costs we incurred to separate and spin-off the RMD business are included in our continuing operations and have been classified and reported as transaction costs, within operating expenses, on our consolidated statements of operations. Loss from discontinued operations, net of taxes, related to RMD was $2.8 million for the year ended December 31, 2013.
| 33 |
Liquidity and Capital Resources
Historically, we have financed our business through cash provided by operating activities, the issuance of common stock, and bank borrowings. Our liquidity requirements arise primarily from investing activities, including funding of acquisitions, and other capital expenditures. As previously discussed, on October 1, 2014, we acquired all of the issued and outstanding shares of two life science companies, MCS and TBSI, for approximately $12.7 million, net of cash acquired. We funded the acquisitions of MCS and TBSI from our existing cash balances and borrowings under our credit facility, respectively. Additionally, on January 8, 2015, we acquired all of the issued and outstanding shares of HEKA for approximately $4.5 million, net of cash acquired. We funded the acquisition from our existing cash balances.
In our consolidated statements of cash flows, we have elected to combine the cash flows from both continuing and discontinued operations within each category, as allowed by FASB ASC 230 “Statement of Cash Flows”. Unless specifically noted otherwise, our discussion of our cash flows below refers to combined cash flows from both continuing and discontinued operations.
As of December 31, 2015, we held cash and cash equivalents of $6.7 million, compared with $14.1 million at December 31, 2014. As of December 31, 2015 and December 31, 2014, we had $18.9 million and $21.5 million, respectively, of borrowings outstanding under our credit facility. Total debt, net of cash and cash equivalents was $12.2 million at December 31, 2015, compared to $7.4 million at December 31, 2014. In addition, we had an underfunded United Kingdom pension liability of approximately $2.8 million and $4.4 million at December 31, 2015 and December 31, 2014, respectively.
As of December 31, 2015 and December 31, 2014, cash and cash equivalents held by our foreign subsidiaries was $5.7 million and $12.7 million, respectively. Funds held by our foreign subsidiaries are not available for domestic operations unless the funds are repatriated. If we planned to or did repatriate these funds, then United States federal and state income taxes would have to be recorded on such amounts. Our reinvestment determination is based on the future operational and capital requirements of our U.S. and non-U.S. operations. As of December 31, 2015, we determined that the assertion of permanent reinvestment at our foreign subsidiaries in Canada and France was no longer appropriate and we intend to repatriate approximately $3.2 million. The total tax liability associated with the intention to repatriate undistributed earnings in Canada and France is estimated to be approximately $1.7 million, however the liability is expected to be entirely offset by the foreign tax credits generated from the repatriation. We currently have no plans and do not intend to repatriate any of our undistributed foreign earnings in any other countries outside of Canada and France. These balances are considered permanently reinvested and will be used for foreign items including foreign acquisitions, capital investments, pension obligations and operations. It is impracticable to estimate the total tax liability, if any, which would be created by the future distribution of these earnings.
In October 2014, we acquired all the issued and outstanding shares of MCS, a German manufacturer, and utilized approximately $11.2 million of our foreign cash on hand. In January 2015, we acquired all the issued and outstanding shares of HEKA, a manufacturer with operations in Germany and Canada, and utilized approximately $5.9 million of our foreign cash on hand. In 2015, the Company also used $0.3 million of foreign cash on hand for capital improvements at AHN, a German manufacturer.
| 34 |
Condensed Cash Flow Statements
(unaudited)
| Year Ended December 31, 2015 | ||||||||||||
| 2015 | 2014 | 2013 | ||||||||||
| (in thousands) | ||||||||||||
| Cash flows from operations: | ||||||||||||
| Net (loss) income | $ | (19,039 | ) | $ | 2,355 | $ | (1,830 | ) | ||||
| Changes in assets and liabilities | (2,719 | ) | (4,514 | ) | 1,940 | |||||||
| Other adjustments to operating cash flows | 22,463 | 6,510 | 3,950 | |||||||||
| Net cash provided by operating activities | 705 | 4,351 | 4,060 | |||||||||
| Investing activities: | ||||||||||||
| Additions to property, plant and equipment | (2,960 | ) | (2,005 | ) | (1,622 | ) | ||||||
| Acquisitions, net of cash acquired | (4,545 | ) | (12,653 | ) | - | |||||||
| Other investing activities | (12 | ) | 1,141 | 1,793 | ||||||||
| Net cash (used in) provided by investing activities | (7,517 | ) | (13,517 | ) | 171 | |||||||
| Financing activities: | ||||||||||||
| Net (repayments of) proceeds from issuance of debt | (2,550 | ) | (3,300 | ) | 11,800 | |||||||
| Transfer of cash and cash equivalents to Biostage | - | - | (15,041 | ) | ||||||||
| Other financing activities | 2,010 | 2,066 | 3,309 | |||||||||
| Net cash (used in) provided by financing activities | (540 | ) | (1,234 | ) | 68 | |||||||
| Effect of exchange rate changes on cash | (38 | ) | (1,237 | ) | 791 | |||||||
| (Decrease) increase in cash and cash equivalents | $ | (7,390 | ) | $ | (11,637 | ) | $ | 5,090 | ||||
Our operating activities provided cash of $0.7 million, $4.4 million and $4.1 million for the years ended December 31, 2015, 2014 and 2013, respectively. The decrease in cash flows from operations in 2015 compared to 2014 was primarily due to lower operating income year over year. Our cash flows from operations for the year ended December 31, 2015 was also impacted by higher temporary inventory requirements necessary to relocate and consolidate certain of our distribution and manufacturing facilities, including, but not limited to, our Denville Scientific distribution business from New Jersey to North Carolina, and the consolidation of our United Kingdom manufacturing operations and Coulbourn’s operations with our Holliston, MA facility. The increase in cash flows from operations in 2014 compared to 2013 was primarily due to higher net income for the year ended December 31, 2014 compared to the same period in 2013, partially offset by an increase in inventory for the year ended December 31, 2014 compared to the same period in 2013. The increase was the result of higher temporary inventory requirements necessary to relocate our Denville Scientific distribution business from New Jersey to North Carolina and the consolidation of our United Kingdom manufacturing operations with our Holliston, MA facility.
Our investing activities used cash of $7.5 million during the year ended December 31, 2015, used $13.5 million for the year ended December 31, 2014, and provided $0.2 million for the year ended December 31, 2013. Investing activities during the 2015, 2014 and 2013 included purchases of property, plant and equipment, proceeds from the sale of property, plant and equipment and expenditures for our catalogs. Unique to 2015 and 2014, investing activities included acquisitions net of cash acquired. Additionally, unique to 2013, investing activities included net cash proceeds from the sale of discontinued operations. In January 2015, we acquired HEKA for approximately $4.5 million, net of cash acquired. In October 2014, we acquired MCS and TBSI for approximately $11.0 million and $1.7 million, net of cash acquired, respectively. All of these payments were included in “Acquisitions, net of cash acquired” under investing activities. These acquisitions were funded from our existing cash balances and borrowings under our credit facility. During 2013, $1.8 million was received from UBI Acquisition Corp. pertaining to the proceeds from the sale of discontinued operations. Proceeds from the sale of property plant and equipment in 2014 were $1.1 million, and includes the proceeds from the sale of one of our United Kingdom facilities which was formerly classified as an asset held-for-sale. During 2015, 2014 and 2013, capital expenditures were $3.0 million, $2.0 million and $1.6 million, respectively. The increase in capital expenditures year over year was due to the investment in implementing a new enterprise resource planning platform, as well as capital expenditures to relocate our Denville Scientific distribution business and United Kingdom manufacturing operations to North Carolina and Holliston, MA, respectively.
Our financing activities have historically consisted of borrowings and repayments under our revolving credit facility and term loans, payments of debt issuance costs, the issuance of common stock and, unique to 2013, the transfer of cash as part of the separation and spin-off of Biostage. During the years ended December 31, 2015 and 2014, financing activities used cash of $0.5 million and $1.2 million, respectively, and provided $0.1 million of cash for the year ended December 31, 2013. During the year ended December 31, 2015, we borrowed $5.8 million under our credit facility, repaid $8.4 million of debt under our credit facility and term loans and ended the year with $18.9 million of borrowings. Net proceeds from the issuance of common stock for the year ended December 31, 2015 were $2.0 million, which related to the exercise of stock options and the employee stock purchase plan. During the year ended December 31, 2014, we borrowed $2.2 million under our credit facility to fund the acquisition of TBSI, repaid $5.5 million of debt under our credit facility and term loans and ended the year with $21.5 million of borrowings. Net proceeds from the issuance of common stock for 2014 were $2.1 million, which related to the exercise of stock options and the employee stock purchase plan. During the year ended December 31, 2013, we transferred approximately $15.0 million to fund Biostage’s operations in connection with the spin-off. Additionally, we borrowed $14.6 million and repaid $2.8 million of debt under our credit facility and term loans. Net proceeds from the issuance of common stock for 2013 were $3.6 million. During the year ended December 31, 2013, we paid debt issuance costs of $0.3 million.
| 35 |
Borrowing Arrangements
On August 7, 2009, we entered into an Amended and Restated Revolving Credit Loan Agreement related to a $20.0 million revolving credit facility with Bank of America, as agent, and Bank of America and Brown Brothers Harriman & Co as lenders (as amended, the “2009 Credit Agreement”). On September 30, 2011, we entered into the First Amendment to the Amended and Restated Revolving Credit Loan Agreement (the “First Amendment”) with Bank of America as agent, and Bank of America and Brown Brothers Harriman & Co as lenders. The First Amendment extended the maturity date of our credit facility to August 7, 2013 and reduced the interest rate to the London Interbank Offered Rate plus 3.0%. On October 4, 2012, we entered into the Second Amendment to the Amended and Restated Revolving Credit Loan Agreement (the “Second Amendment”) with Bank of America as agent, and Bank of America and Brown Brothers Harriman & Co as lenders. The Second Amendment extended the maturity date of our credit facility to August 7, 2014.
On March 29, 2013, we entered into a Second Amended and Restated Revolving Credit Agreement (as amended, the “Credit Agreement”) with Bank of America, as agent, and Bank of America and Brown Brothers Harriman & Co as lenders, that amended and restated the 2009 Credit Agreement. The Credit Agreement converted our existing outstanding revolving advances into a term loan in the principal amount of $15.0 million (the “Term Loan”), provided a revolving credit facility in the maximum principal amount of $25.0 million (“Revolving Line”) and provided a delayed draw term loan of up to $15.0 million (the “DDTL”) to fund our capital contributions to Biostage. The maximum amount available under the Credit Agreement is $50.0 million as borrowings against the DDTL in excess of $10.0 million result in a dollar for dollar reduction in the Revolving Line capacity. The Revolving Line, Term Loan and DDTL each have a maturity date of March 29, 2018 (the maturity date of the Revolving Line was extended from March 29, 2016 in connection with the Third Amendment discussed below).
On October 31, 2013, we amended the Credit Agreement to reduce the DDTL from up to $15.0 million to up to $10.0 million and allow for an additional $5.0 million to be available for drawing as advances under the Revolving Line.
On April 24, 2015, we entered into the Third Amendment to the Second Amended and Restated Credit Agreement (the “Third Amendment”), which extended the maturity date of the Revolving Line to March 29, 2018 and reduced the interest rates on the Revolving Line, Term Loan and DDTL. Borrowings under the Term Loan and the DDTL accrued interest at a rate based on either the effective London Interbank Offered Rate (LIBOR) for certain interest periods selected by us, or a daily floating rate based on the British Bankers’ Association (BBA) LIBOR as published by Reuters (or other commercially available source providing quotations of BBA LIBOR), plus in either case, a margin of 2.75%. Prior to the Third Amendment, the Revolving Line accrued interest at a rate based on either the effective LIBOR for certain interest periods selected by us, or a daily floating rate based on the BBA LIBOR, plus in either case, a margin of 2.25%. We were required to fix the rate of interest on at least 50% of the Term Loan and the DDTL through the purchase of interest rate swaps. The Term Loan and DDTL each have interest payments due at the end of the applicable LIBOR period, or monthly with respect to BBA LIBOR borrowings, and principal payments due quarterly. The Revolving Line has interest payments due at the end of the applicable LIBOR period, or monthly with respect to BBA LIBOR borrowings.
On June 30, 2015, we entered into the Fourth Amendment to the Second Amended and Restated Credit Agreement, which amended our quarterly minimum fixed charge coverage financial covenant.
On November 5, 2015, we entered into the Fifth Amendment to the Second Amended and Restated Credit Agreement, which eliminated our 2015 fourth quarter minimum fixed charge coverage financial covenant requirement. As part of this amendment, the maximum principal amount on the Revolving Line was reduced to $10.0 million until June 30, 2016, at which time, the maximum principal amount will be restored to $25.0 million, as long as we remain in compliance with all covenants.
On March 9, 2016, we entered into the Sixth Amendment to the Second Amended and Restated Credit Agreement, which amended the principal payment amortization of the Term Loan and DDTL to five years, as well as amended our quarterly minimum fixed charge coverage financial covenant.
At December 31, 2015, the weighted effective interest rates on the Term Loan, DDTL and Revolving Line borrowings were 3.96%, 3.55% and 2.67%, respectively. The Credit Agreement includes covenants relating to income, debt coverage and cash flow, as well as minimum working capital requirements. The Credit Agreement also contains limitations on our ability to incur additional indebtedness and requires lender approval for acquisitions funded with cash, promissory notes and/or other consideration in excess of $6.0 million and for acquisitions funded solely with equity in excess of $10.0 million. As of December 31, 2015, we were in compliance with all financial covenants contained in the Credit Agreement; we were subject to covenant and working capital borrowing restrictions, and had available borrowing capacity under the Credit Agreement of $2.3 million.
Our forecast of the period of time through which our financial resources will be adequate to support our operations is a forward-looking statement that involves risks and uncertainties, and actual results could vary as a result of a number of factors. Based on our current operations and current operating plans, we expect that our available cash, cash generated from current operations and debt capacity will be sufficient to finance current operations, any potential future acquisitions and capital expenditures for the next 12 months and beyond. This may involve incurring additional debt or raising equity capital for our business. Additional capital raising activities will dilute the ownership interests of existing stockholders to the extent we raise capital by issuing equity securities and we cannot guarantee that we will be successful in raising additional capital on favorable terms or at all.
| 36 |
Contractual Obligations
The following schedule represents our contractual obligations for our continuing operations, excluding interest, as of December 31, 2015.
| 2021 and | ||||||||||||||||||||||||||||
| Total | 2016 | 2017 | 2018 | 2019 | 2020 | Beyond | ||||||||||||||||||||||
| (in thousands) | ||||||||||||||||||||||||||||
| Bank credit facility and notes payable | $ | 18,900 | $ | 2,450 | $ | 2,450 | $ | 14,000 | $ | - | $ | - | $ | - | ||||||||||||||
| Operating leases | 12,565 | 1,843 | 1,749 | 1,727 | 1,526 | 1,527 | 4,193 | |||||||||||||||||||||
| Total | $ | 31,465 | $ | 4,293 | $ | 4,199 | $ | 15,727 | $ | 1,526 | $ | 1,527 | $ | 4,193 | ||||||||||||||
We have a liability at December 31, 2015 and 2014 of $0.3 million for uncertain tax positions taken in an income tax return. We do not know the ultimate resolution of these uncertain tax positions and as such, do not know the ultimate timing of payments related to this liability. Accordingly, this amount is not included in the above table.
We have an underfunded United Kingdom pension liability of $2.8 million and $4.4 million as of December 31, 2015 and 2014, respectively, which is recognized as part of the "Other long term liabilities" line item in our consolidated balance sheets. Since we do not know the ultimate timing of payments related to this liability, this amount has not been included in the above table.
Critical Accounting Policies
We believe that our critical accounting policies are as follows:
| • | revenue recognition; | |
| • | accounting for income taxes; |
| • | inventory; |
| • | valuation of identifiable intangible assets in business combinations; |
| • | valuation of long-lived and intangible assets and goodwill; and |
| • | stock-based compensation. |
Revenue recognition. We follow the provisions of FASB ASC 605, “Revenue Recognition”. We recognize revenue of products when persuasive evidence of a sales arrangement exists, the price to the buyer is fixed or determinable, delivery has occurred, and collectability of the sales price is reasonably assured. Sales of some of our products include provisions to provide additional services such as installation and training. Revenues on these products are recognized when the additional services have been performed. Service agreements on our equipment are typically sold separately from the sale of the equipment. Revenues on these service agreements are recognized ratably over the life of the agreement, typically one year, in accordance with the provisions of FASB ASC 605-20, “Revenue Recognition—Services”.
We account for shipping and handling fees and costs in accordance with the provisions of FASB ASC 605-45-45, “Revenue Recognition—Principal Agent Considerations”, which requires all amounts charged to customers for shipping and handling to be classified as revenues. Our costs incurred related to shipping and handling are classified as cost of product revenues. Warranties and product returns are estimated and accrued for at the time sales are recorded. We have no obligations to customers after the date products are shipped or installed, if applicable, other than pursuant to warranty obligations and service or maintenance contracts. We provide for the estimated amount of future returns upon shipment of products or installation, if applicable, based on historical experience. Historically, product returns and warranty costs have not been significant, and they have been within our expectations and the provisions established, however, there is no assurance that we will continue to experience the same return rates and warranty repair costs that we have in the past. Any significant increase in product return rates or a significant increase in the cost to repair our products could have a material adverse impact on our operating results for the period or periods in which such returns or increased costs materialize.
We make estimates evaluating our allowance for doubtful accounts. On an ongoing basis, we monitor collections and payments from our customers and maintain a provision for estimated credit losses based upon our historical experience and any specific customer collection issues that we have identified. Historically, such credit losses have not been significant, and they have been within our expectations and the provisions established, however, there is no assurance that we will continue to experience the same credit loss rates that we have in the past. A significant change in the liquidity or financial position of our customers could have a material adverse impact on the collectability of our accounts receivable and our future operating results.
| 37 |
Accounting for income taxes. We determine our annual income tax provision in each of the jurisdictions in which we operate. This involves determining our current and deferred income tax expense that reflects accounting for differences between the financial statement carrying amounts of existing assets and liabilities and their respective tax bases. The future tax consequences attributable to these differences result in deferred tax assets and liabilities, which are included in our consolidated balance sheets. We assess the recoverability of the deferred tax assets by considering whether it is more likely than not that some portion or all of the deferred tax assets will not be realized. To the extent we believe that recovery does not meet this “more likely than not” standard as required in FASB ASC 740, “Income Taxes”, we must establish a valuation allowance. If a valuation allowance is established, increased or decreased in a period, we allocate the related income tax expense or benefit to income from continuing operations in the consolidated statement of operations.
Management’s judgment and estimates are required in determining our income tax provision, deferred tax assets and liabilities and any valuation allowance recorded against deferred tax assets. We review the recoverability of deferred tax assets during each reporting period by reviewing estimates of future taxable income, future reversals of existing taxable temporary differences, and tax planning strategies that would, if necessary, be implemented to realize the benefit of a deferred tax asset before expiration. Due to our three year cumulative loss position, we concluded that a full valuation allowance was required to offset most U.S. deferred tax assets, net of deferred tax liabilities except deferred tax liabilities related to indefinite lived intangible assets. At December 31, 2015, we have a valuation allowance of $18.8 million, of which $18.4 million relates to our U.S. deferred tax assets. The remainder relates to deferred tax assets in certain foreign jurisdictions.
We assess tax positions taken on tax returns, including recognition of potential interest and penalties, in accordance with the recognition thresholds and measurement attributes outlined in FASB ASC 740. Interest and penalties recognized, if any, would be classified as a component of income tax expense.
Inventory. We value our inventory at the lower of the actual cost to purchase (first-in, first-out method) and/or manufacture the inventory or the current estimated market value of the inventory. We regularly review inventory quantities on hand and record a provision to write down excess and obsolete inventory to its estimated net realizable value if less than cost, based primarily on historical inventory usage and estimated forecast of product demand. Since forecasted product demand quite often is a function of previous and current demand, a significant decrease in demand could result in an increase in the charges for excess inventory quantities on hand. In addition, our industry is subject to technological change and new product development, and technological advances could result in an increase in the amount of obsolete inventory quantities on hand. Therefore, any significant unanticipated changes in demand or technological developments could have a significant adverse impact on the value of our inventory and our reported operating results.
Valuation of identifiable intangible assets acquired in business combinations. The determination of the fair value of intangible assets, which represents a significant portion of the purchase price in our acquisitions, requires the use of significant judgment with regard to (i) the fair value; and (ii) whether such intangibles are amortizable or not amortizable and, if the former, the period and the method by which the intangibles asset will be amortized. We estimate the fair value of acquisition-related intangible assets principally based on projections of cash flows that will arise from identifiable assets of acquired businesses. The projected cash flows are discounted to determine the present value of the assets at the dates of acquisitions. At December 31, 2015, amortizable intangible assets include existing technology, trade names, distribution agreements, customer relationships and patents. These amortizable intangible assets are amortized on a straight-line basis over 7 to 15 years, 10 to 15 years, 4 to 5 years, 5 to 15 years and 5 to 15 years, respectively.
Valuation of long-lived and intangible assets. In accordance with the provisions of FASB ASC 360, “Property, Plant and Equipment”, we assess the value of identifiable intangibles with finite lives and long-lived assets for impairment whenever events or changes in circumstances indicate that the carrying value may not be recoverable. Factors we consider important which could trigger an impairment review include the following: significant underperformance relative to expected historical or projected future operating results; significant changes in the manner of our use of the acquired assets or the strategy for our overall business; significant negative industry or economic trends; significant changes in who our competitors are and what they do; significant changes in our relationship with our distributors; significant decline in our stock price for a sustained period; and our market capitalization relative to net book value.
| 38 |
If we were to determine that the value of long-lived assets and identifiable intangible assets with finite lives was not recoverable based on the existence of one or more of the aforementioned factors, then the recoverability of those assets to be held and used would be measured by a comparison of the carrying amount of those assets to undiscounted future net cash flows before tax effects expected to be generated by those assets. If such assets are considered to be impaired, the impairment to be recognized would be measured by the amount by which the carrying value of the assets exceeds the fair value of the assets.
Goodwill and Other Intangible Assets. FASB ASC 350, “Intangibles-Goodwill and Others” addresses financial accounting and reporting for acquired goodwill and other intangible assets. Among other things, FASB ASC 350 requires that goodwill and intangible assets with indefinite useful lives no longer be amortized, but rather tested annually for impairment or more frequently if events or circumstances indicate that there may be impairment. Goodwill is also subject to an annual impairment test, or more frequently, if indicators of potential impairment arise. ASU 2011-08 intends to simplify goodwill impairment testing by permitting an assessment of qualitative factors to determine when events and circumstances lead to the conclusion that it is necessary to perform the two-step goodwill impairment test required under ASC 350. The two-step goodwill impairment test consists of a comparison of the fair value of our reporting units with their carrying amount. If the carrying amount exceeds its fair value, we are required to perform the second step of the impairment test, as this is an indication that goodwill may be impaired. The impairment loss is measured by comparing the implied fair value of the reporting unit’s goodwill with its carrying amount. If the carrying amount exceeds the implied fair value, an impairment loss shall be recognized in an amount equal to the excess. After an impairment loss is recognized, the adjusted carrying amount of the intangible asset shall be its new accounting basis. Subsequent reversal of a previously recognized impairment loss is prohibited. For unamortizable intangible assets, if the carrying amount were to exceed the fair value of the asset we would write down the unamortizable intangible asset to fair value.
For the purpose of our goodwill analysis, and following the spin-off of Biostage, we have one reporting unit. We conducted our annual impairment analysis in the fourth quarter of fiscal year 2015. The determination of the fair value of the reporting unit requires us to make a significant estimate on control premiums appropriate of industries in which we compete. We compared our carrying value to our overall market capitalization.
The results of our test for goodwill impairment showed that the estimated fair value of our business substantially exceeded its carrying value. We concluded that none of our goodwill was impaired. We also concluded that the fair value of the unamortized intangible assets significantly exceeds the carrying amounts.
Stock-based compensation. We account for stock-based payment awards in accordance with the provisions of FASB ASC 718, “Compensation—Stock Compensation”, which requires us to recognize compensation expense for all stock-based payment awards made to employees and directors including stock options, restricted stock units, restricted stock units with a market condition and employee stock purchases related to our Employee Stock Purchase Plan (as amended, “ESPP”). We issue new shares upon stock option exercises, upon the vesting of restricted stock units and restricted stock units with a market condition, and under our ESPP.
FASB ASC 718 requires companies to estimate the fair value of stock-based payment awards on the date of grant using an option-pricing model. The value of the portion of the award that is ultimately expected to vest is recognized as expense over the requisite service periods in our consolidated statement of operations. Stock-based compensation expense has been reduced for estimated forfeitures. FASB ASC 718 requires forfeitures to be estimated at the time of grant and revised, if necessary, in subsequent periods if actual forfeitures differ from those estimates.
We value stock-based payment awards, except restricted stock awards, at the grant date using the Black-Scholes option-pricing model. We value the restricted stock units with a market condition at the grant date using a Monte-Carlo valuation simulation. Our determination of fair value of stock-based payment awards on the date of grant using an option-pricing model or Monte-Carlo valuation simulation is affected by our stock price as well as assumptions regarding a number of highly complex and subjective variables. These variables include, but are not limited to our expected stock price volatility over the term of the awards and actual and projected stock option exercise behaviors.
The fair value of restricted stock units are based on the market price of our common stock on the date of grant and are recorded as compensation expense ratably over the applicable service period, which ranges from one to four years. Unvested restricted stock units are forfeited in the event of termination of employment or engagement with our Company.
We record stock compensation expense on a straight-line basis over the requisite service period for all awards granted.
Impact of Foreign Currencies
Our international operations in some instances operate in a natural hedge as we sell our products in many countries and a substantial portion of our revenues, costs and expenses are denominated in foreign currencies, especially the British pound sterling, the Euro, the Canadian dollar and the Swedish krona.
| 39 |
For the year ended December 31, 2015, the U.S dollar’s strengthening in relation to those currencies resulted in an unfavorable translation effect on our consolidated revenues and on our consolidated net loss. Changes in foreign currency exchange rates resulted in an unfavorable effect on revenues of approximately $4.0 million and a favorable effect on expenses of approximately $3.6 million. Conversely, during 2014, the U.S dollar’s weakening in relation to those currencies resulted in a favorable translation effect on our consolidated revenues and our net income. Changes in foreign currency exchange rates resulted in a favorable effect on revenues of approximately $1.0 million and an unfavorable effect on expenses of approximately $0.8 million. During 2013, the U.S dollar’s weakening in relation to those currencies resulted in a favorable translation effect on our consolidated revenues and a neutral effect our net income. Changes in foreign currency exchange rates resulted in a favorable effect on revenues of $0.2 million and negative effect on expenses of $0.2 million.
The loss associated with the translation of foreign equity into U.S. dollars included as a component of comprehensive (loss) income, was approximately $4.9 million and $5.9 million for the years ended December 31, 2015 and 2014, respectively, compared to a gain of $1.6 million for the year ended December 31, 2013.
In addition, currency exchange rate fluctuations included as a component of net (loss) income resulted in an approximately $0.2 million gain during the year ended December 31, 2015, compared to losses of approximately $0.2 million and $0.1 million during the years ended December 31, 2014 and 2013, respectively.
Recently Issued Accounting Pronouncements
In May 2014, the Financial Accounting Standards Board (FASB) issued Accounting Standards Update (ASU) 2014-09, “Revenue from Contracts with Customers,” a new accounting standard that provides for a comprehensive model to use in the accounting for revenue arising from contracts with customers that will replace most existing revenue recognition guidance within accounting principles generally accepted in the United States. Under this standard, revenue will be recognized to depict the transfer of promised goods or services to customers in an amount that reflects the consideration to which we expect to be entitled in exchange for those goods or services. At its July 2015 meeting, the FASB agreed to defer the mandatory effective date of ASU 2014-09 one year. Under the one year deferral, the standard will take effect in 2018 for calendar year-end public entities. We are assessing the new standard and have not yet determined the impact to our consolidated financial statements.
In April 2015, the FASB issued ASU 2015-03, Interest - Imputation of Interest (Subtopic 835-30): Simplifying the Presentation of Debt Issuance Costs. The update requires debt issuance costs related to a recognized debt liability to be presented in the balance sheet as a direct deduction from the carrying amount of the related debt liability, instead of being presented as an asset. Debt disclosures will include the face amount of the debt liability and the effective interest rate. The update requires retrospective application and represents a change in accounting principle. The update is effective for fiscal years beginning after December 15, 2015. Early adoption is permitted for financial statements that have not been previously issued. We believe the adoption of this new guidance will not have a material impact on our consolidated financial position or results of operations.
In July 2015, the FASB issued ASU 2015-11, Simplifying Measurement of Inventory. The update requires measurement of most inventory “at the lower of cost and net realizable value”, and applies to all entities that recognize inventory within the scope of ASC 330, except for inventory measured under the last-in, first-out (LIFO) method or the retail inventory method (RIM). ASU 2015-11 requires prospective application and represents a change in accounting principle. The update is effective for fiscal years beginning after December 15, 2016. Early adoption is permitted for financial statements that have not been previously issued. We are evaluating the impact of ASU 2015-11 on our consolidated financial statements and the possibility of early adoption thereof.
In September 2015, the FASB issued ASU 2015-16, Simplifying the Accounting for Measurement-Period Adjustments. The update eliminates the requirement to retrospectively adjust financial statements for measurement-period adjustments that occur in periods after a business combination. Under the update, measurement-period adjustments are to be calculated as if they were known at the acquisition date, but are recognized in the reporting period in which they are determined. Additional disclosures are required about the impact on current-period earnings. ASU 2015-16 requires prospective application to adjustments of provisional amounts that occur after the effective date. The update is effective for fiscal years beginning after December 15, 2016. Early adoption is permitted for financial statements that have not been previously issued. We are evaluating the impact of ASU 2015-16 on our consolidated financial statements and the possibility of early adoption thereof.
In November 2015, the FASB issued ASU 2015-17, Balance Sheet Classification of Deferred Taxes. The update requires all deferred income taxes to be presented on the balance sheet as noncurrent. The new guidance is intended to simplify financial reporting by eliminating the requirement to classify deferred taxes between current and noncurrent. The update is effective for fiscal years beginning after December 15, 2016. Early adoption is permitted at the beginning of an interim or annual period. We are evaluating the impact of ASU 2015-17 on our consolidated financial statements and the possibility of early adoption thereof.
| 40 |
In February 2016, the FASB issued ASU 2016-02, Leases, which is intended to improve financial reporting about leasing transactions. The update requires a lessee to record on the balance sheet the assets and liabilities for the rights and obligations created by lease terms of more than 12 months. The update is effective for fiscal years beginning after December 15, 2018. We are evaluating the impact of ASU 2016-02 on our consolidated financial statements.
Item 7A. Quantitative and Qualitative Disclosures about Market Risk.
The majority of our manufacturing and testing of products occurs in our facilities in the United States, Germany, Sweden and Spain. We sell our products globally through our distributors, direct sales force, websites and catalogs. As a result, our financial results are affected by factors such as changes in foreign currency exchange rates and weak economic conditions in foreign markets.
We collect amounts representing a substantial portion of our revenues and pay amounts representing a substantial portion of our operating expenses in foreign currencies. As a result, changes in currency exchange rates from time to time may affect our operating results.
We are exposed to market risk from changes in interest rates primarily through our financing activities. As of December 31, 2015, we had $18.9 million outstanding under our Credit Agreement.
Prior to the Third Amendment, borrowings under the Term Loan and the DDTL accrued interest at a rate based on either the effective London Interbank Offered Rate (LIBOR) for certain interest periods selected by us, or a daily floating rate based on the BBA LIBOR as published by Reuters (or other commercially available source providing quotations of BBA LIBOR), plus in either case, a margin of 3.0%. Prior to the Third Amendment, the Revolving Line accrued interest at a rate based on either the effective LIBOR for certain interest periods selected by us, or a daily floating rate based on the BBA LIBOR, plus in either case, a margin of 2.5%. We were required to fix the rate of interest on at least 50% of the Term Loan and the DDTL through the purchase of an interest rate swap. The Term Loan and DDTL each have interest payments due at the end of the applicable LIBOR period, or monthly with respect to BBA LIBOR borrowings, and principal payments are due quarterly. The Revolving Line has interest payments due at the end of the applicable LIBOR period, or monthly with respect to BBA LIBOR borrowings. Effective June 5, 2013, we entered into an interest rate swap contract with an original notional amount of $15.0 million and a maturity date of March 29, 2018 in order to hedge the risk of changes in the effective benchmark interest rate (LIBOR) associated with our Term Loan. The swap contract converted specific variable-rate debt into fixed-rate debt and fixed LIBOR associated with the Term Loan at 0.96% plus a bank margin of 3.0%. Effective November 29, 2013, we entered into a second interest rate swap contract with an original notional amount of $5.0 million and a maturity date of March 29, 2018 in order to hedge the risk of changes in LIBOR associated with a portion of our DDTL. The swap contract converted specific variable-rate debt into fixed rate debt and fixed LIBOR associated with half of the DDTL amount at 0.93% plus a bank margin of 3.0%. The notional amount of our derivative instruments as of December 31, 2015 was $9.5 million. These swap contracts were associated with reducing or eliminating interest rate risk and were designated as cash flow hedge instruments in accordance with ASC 815. We use interest-rate-related derivative instruments to manage our exposure related to changes in interest rates on our variable-rate debt instruments. We do not enter into derivative instruments for any purpose other than cash flow hedging and we do not speculate using derivative instruments.
On April 24, 2015, we entered the Third Amendment which extended the maturity date of the Revolving Line to March 29, 2018 and reduced the interest rate to the London Interbank Offered Rate plus 2.25%, 2.75% and 2.75% on the Revolving Line, Term Loan and DDTL, respectively.
As of December 31, 2015, the weighted effective interest rates, net of the impact of our interest rate swaps, on our Term Loan , DDTL and Revolving Line borrowings were 3.96%, 3.55% and 2.67%, respectively. Assuming no other changes which would affect the margin of the interest rate under our Term Loan, DDTL and Revolving Line, the effect of interest rate fluctuations on outstanding borrowings under our Credit Agreement as of December 31, 2015 over the next twelve months is quantified and summarized as follows:
| If compared to the rate as of December 31, 2015 | Interest expense increase | |||
| (in thousands) | ||||
| Interest rates increase by 1% | $ | 94 | ||
| Interest rates increase by 2% | $ | 188 | ||
| 41 |
Item 8. Financial Statements and Supplementary Data.
The information required by this item is contained in the consolidated financial statements filed as part of this Annual Report on Form 10-K are listed under Item 15 of Part IV below.
Item 9. Changes in and Disagreements with Accountants on Accounting and Financial Disclosure.
None.
Item 9A. Controls and Procedures.
This Report includes the certifications of our Chief Executive Officer and Chief Financial Officer required by Rule 13a-14 of the Securities Exchange Act of 1934, as amended (the “Exchange Act”). See Exhibits 31.1 and 31.2. This Item 9A includes information concerning the controls and control evaluations referred to in those certifications.
(a) Evaluation of Disclosure Controls and Procedures
Disclosure controls and procedures refer to controls and other procedures designed to ensure that information required to be disclosed in the reports we file or submit under the Exchange Act is recorded, processed, summarized and reported, within the time periods specified in the rules and forms of the U.S. Securities and Exchange Commission. Disclosure controls and procedures include, without limitation, controls and procedures designed to ensure that information required to be disclosed by us in our reports that we file or submit under the Exchange Act is accumulated and communicated to our management, including our Chief Executive Officer and Chief Financial Officer, as appropriate to allow timely decisions regarding our required disclosure. In designing and evaluating our disclosure controls and procedures, our management recognizes that any controls and procedures, no matter how well designed and operated, can provide only reasonable assurance of achieving the desired control objectives, and management was required to apply its judgment in evaluating and implementing possible controls and procedures.
We carried out an evaluation, under the supervision and with the participation our Chief Executive Officer and Chief Financial Officer, of the effectiveness of the design and operation of our disclosure controls and procedures (as defined in Rules 13a-15(e) and 15d-15(e) under the Exchange Act) as of the end of the period covered in this Report. Based upon that evaluation, our Chief Executive Officer and Chief Financial Officer concluded that due to material weaknesses in our internal control over financial reporting described below, our disclosure controls and procedures were not effective as of December 31, 2015.
Notwithstanding the identified material weaknesses, management has concluded that the consolidated financial statements included in this Annual Report on Form 10-K fairly represent in all material respects our financial condition, results of operations and cash flows at and for the periods presented in accordance with U.S. GAAP.
(b) Management’s Report on Internal Control Over Financial Reporting
Our management is responsible for establishing and maintaining adequate internal control over financial reporting (as defined in Rules 13a-15(f) and 15d-15(f) under the Exchange Act). Our internal control over financial reporting is a process designed by and under the supervision of our Chief Executive Officer and Chief Financial Officer and effected by our management and other personnel, to provide reasonable assurance regarding the reliability of financial reporting and the preparation of consolidated financial statements for external purposes in accordance with generally accepted accounting principles. Our internal control over financial reporting includes those policies and procedures that (1) pertain to the maintenance of records that, in reasonable detail, accurately and fairly reflect transactions and dispositions of assets, (2) provide reasonable assurance that transactions are recorded as necessary to permit preparation of consolidated financial statements for external purposes in accordance with generally accepted accounting principles, (3) provide reasonable assurance that receipts and expenditures are being made only in accordance with authorizations of management and directors, and (4) provide reasonable assurance regarding prevention or timely detection of unauthorized acquisition, use or disposition of assets that could have a material effect on the consolidated financial statements.
A material weakness is a deficiency, or a combination of deficiencies, in internal control over financial reporting, such that there is a reasonable possibility that a material misstatement of our annual or interim financial statements will not be prevented or detected on a timely basis.
| 42 |
Because of inherent limitations, internal control over financial reporting may not prevent or detect misstatements. It is a process that involves human diligence and compliance and is therefore subject to human error and misjudgment. In general, evaluations of effectiveness for future periods are subject to risk as controls may become inadequate due to changes in conditions or the degree of compliance with key processes or procedures could deteriorate.
Our management evaluated the effectiveness of our internal control over financial reporting as of December 31, 2015 using the criteria set forth in Internal Control – Integrated Framework (2013) issued by the Committee of Sponsoring Organizations of the Treadway Commission (COSO). Management excluded from its assessment of the effectiveness of the Company's internal control over financial reporting as of December 31, 2015, HEKA Elektronik’s internal control over financial reporting associated with total assets of $6.3 million (of which $4.5 million represents goodwill and intangible assets included within the scope of the assessment) and total revenues of $3.5 million in the consolidated financial statements of the Company as of and for the year ended December 31, 2015.
Based on this evaluation, our management concluded that material weaknesses in internal control over financial reporting existed as of December 31, 2015 as described below:
The Company did not maintain an effective control environment, risk assessment processes, and monitoring activities. Specifically, the Company has:
| · | an ineffective risk assessment process, including fraud risks, which failed to identify and analyze changes in the business and personnel and implement process level controls and monitoring activities that are responsive to those changes and aligned with the Company’s financial reporting objectives. |
| · | failed to adequately assign authorities and responsibilities over financial reporting at Denville Scientific, Inc. (Denville), an operating subsidiary. |
As a result of the ineffective control environment, risk assessment processes, and monitoring activities:
| · | The Company did not maintain effective general information technology controls (GITCs) to restrict or monitor users’ access within the ERP system at Denville and ensure user roles were adequately restricted to authorized personnel commensurate with their job responsibilities. Accordingly, the Company did not have appropriate segregation of duties, and as such, an individual at Denville had the ability to perform multiple conflicting duties that could impact all financial statement accounts. Additionally, the Company did not have effective monitoring controls over those activities. |
The Company failed to design and operate effective process level control activities over:
| · | the completeness and accuracy of data used in the preparation and review of financial statement reconciliations at Denville, potentially impacting all financial statement accounts. |
| · | the completeness, accuracy, existence and authorization of transactions recorded through manual journal entries at Denville, including review of the underlying information used to support them, potentially impacting all financial statement accounts. |
| · | the existence and accuracy of data and assumptions used in the measurement of inventory, specifically, inventory costs associated with the prior year’s business acquisition and recurring purchases at Multi Channel Systems MCS GmbH (MCS), an operating subsidiary. In addition, the Company did not operate effective controls over inventory reserve adjustments at Biochrom Limited (Biochrom), an operating subsidiary. |
| · | the recognition, measurement, and disclosure of current and deferred income taxes. Specifically, the management review controls did not adequately address the criteria for investigation, level of precision, and the completeness and accuracy of data and assumptions used in the performance of the control as it relates to the recording of current and deferred tax balances and any associated valuation allowance. |
The control deficiencies described above resulted in certain material and immaterial misstatements in the preliminary financial statement accounts that were corrected prior to the issuance of the annual consolidated financial statements. The control deficiencies create a reasonable possibility that a material misstatement to our consolidated financial statements will not be prevented or detected on a timely basis, and therefore we concluded that the deficiencies represent material weaknesses in our internal control over financial reporting and our internal control over financial reporting is not effective as of December 31, 2015.
| 43 |
Our independent registered public accounting firm, KPMG LLP, has expressed an adverse report on the operating effectiveness of our internal control over financial reporting. KPMG LLP’s report appears on page 45 below.
(c) Changes in Internal Controls Over Financial Reporting
Other than the identification of the material weaknesses described above which originated in earlier periods, there have been no changes in internal control over financial reporting during the period covered by this Report that have materially affected, or are reasonably likely to materially affect, our internal control over financial reporting.
(d) Remediation Plan
We are committed to remediating the material weaknesses in a timely fashion. We have begun the process of developing a remediation plan that will address the material weaknesses in internal control over financial reporting described above. Specifically, we intend to implement and monitor the following actions:
| · | evaluate and revise the assignment of authorities and responsibilities over financial reporting at Denville; |
| · | evaluate and revise the risk assessment process, including fraud risks, and monitoring activities in order to effectively identify, analyze and determine how the Company will respond to changes affecting the Company’s financial reporting processes and the Company’s internal controls over financial reporting; |
| · | design and implement general information technology controls (GITCs) and other controls to restrict personnel at Denville from performing conflicting duties that could impact financial statement accounts; |
| · | design and implement controls over Denville account reconciliations and manual journal entries so they are properly prepared, supported by adequate documentation, and independently reviewed; |
| · | review the processes to measure inventory at MCS and Biochrom and design and implement controls to ensure existence and accuracy of inventory; and |
| · | design and implement management review controls that adequately address the criteria for investigation, level of precision, and the completeness and accuracy of current and deferred income taxes and associated valuation allowances. |
(e) Inherent Limitations on Effectiveness of Controls
The design of any system of control is based upon certain assumptions about the likelihood of future events, and there can be no assurance that any design will succeed in achieving its stated objectives under all future events, no matter how remote, that controls may become inadequate because of changes in conditions, or that the degree of compliance with the policies or procedures may not deteriorate. Because of their inherent limitations, systems of control may not prevent or detect all misstatements. Accordingly, even effective systems of control can provide only reasonable assurance of achieving their control objectives.
| 44 |
(f) Report of Independent Registered Public Accounting Firm
Report of Independent Registered Public Accounting Firm
The Board of Directors and Stockholders
Harvard Bioscience, Inc.:
We have audited Harvard Bioscience, Inc.’s internal control over financial reporting as of December 31, 2015, based on criteria established in Internal Control – Integrated Framework (2013) issued by the Committee of Sponsoring Organizations of the Treadway Commission (COSO). Harvard Bioscience, Inc.’s management is responsible for maintaining effective internal control over financial reporting and for its assessment of the effectiveness of internal control over financial reporting, included in the accompanying “Management’s Annual Report on Internal Control Over Financial Reporting.” Our responsibility is to express an opinion on the Company’s internal control over financial reporting based on our audit.
We conducted our audit in accordance with the standards of the Public Company Accounting Oversight Board (United States). Those standards require that we plan and perform the audit to obtain reasonable assurance about whether effective internal control over financial reporting was maintained in all material respects. Our audit included obtaining an understanding of internal control over financial reporting, assessing the risk that a material weakness exists, and testing and evaluating the design and operating effectiveness of internal control based on the assessed risk. Our audit also included performing such other procedures as we considered necessary in the circumstances. We believe that our audit provides a reasonable basis for our opinion.
A company’s internal control over financial reporting is a process designed to provide reasonable assurance regarding the reliability of financial reporting and the preparation of financial statements for external purposes in accordance with generally accepted accounting principles. A company’s internal control over financial reporting includes those policies and procedures that (1) pertain to the maintenance of records that, in reasonable detail, accurately and fairly reflect the transactions and dispositions of the assets of the company; (2) provide reasonable assurance that transactions are recorded as necessary to permit preparation of financial statements in accordance with generally accepted accounting principles, and that receipts and expenditures of the company are being made only in accordance with authorizations of management and directors of the company; and (3) provide reasonable assurance regarding prevention or timely detection of unauthorized acquisition, use, or disposition of the company’s assets that could have a material effect on the financial statements.
Because of its inherent limitations, internal control over financial reporting may not prevent or detect misstatements. Also, projections of any evaluation of effectiveness to future periods are subject to the risk that controls may become inadequate because of changes in conditions, or that the degree of compliance with the policies or procedures may deteriorate.
A material weakness is a deficiency, or a combination of deficiencies, in internal control over financial reporting, such that there is a reasonable possibility that a material misstatement of the Company’s annual or interim financial statements will not be prevented or detected on a timely basis. Material weaknesses related to:
| · | Ineffective risk assessment process, including fraud risks, which failed to identify and analyze changes in the business and personnel and implement process level controls and monitoring activities responsive to those changes; |
| · | An ineffective control environment at Denville Scientific, Inc. (Denville), an operating subsidiary, over the assignment of authorities and responsibilities over financial reporting; |
| · | Ineffective general information technology controls (GITCs) to restrict or monitor users’ access within the ERP system at Denville and ensure user roles were adequately restricted, which resulted in inappropriate segregation of duties; |
| · | Ineffective design and operation of process level control activities related to: |
| · | financial statement reconciliations at Denville; |
| · | manual journal entries at Denville; |
| · | the measurement of inventory costs at Multi Channel Systems MCS GmbH, an operating subsidiary, and inventory reserve adjustments at Biochrom Limited, an operating subsidiary; and | |
| · | the recognition, measurement, and disclosure of current and deferred income taxes |
have been identified and included in management’s assessment.
| 45 |
We also have audited, in accordance with the standards of the Public Company Accounting Oversight Board (United States), the consolidated balance sheets of Harvard Bioscience, Inc. and subsidiaries as of December 31, 2015 and 2014, and the related consolidated statements of operations, comprehensive (loss) income, stockholders’ equity and cash flows for each of the years in the three-year period ended December 31, 2015. These material weaknesses were considered in determining the nature, timing, and extent of audit tests applied in our audit of the 2015 consolidated financial statements, and this report does not affect our report dated April 29, 2016, which expressed an unqualified opinion on those consolidated financial statements.
In our opinion, because of the effect of the aforementioned material weaknesses on the achievement of the objectives of the control criteria, Harvard Bioscience, Inc. has not maintained effective internal control over financial reporting as of December 31, 2015, based on criteria established in Internal Control – Integrated Framework (2013) issued by the Committee of Sponsoring Organizations of the Treadway Commission (COSO).
Harvard Bioscience, Inc. acquired HEKA Elektronik (“HEKA”) during 2015, and management excluded from its assessment of the effectiveness of the Company's internal control over financial reporting as of December 31, 2015, HEKA’s internal control over financial reporting associated with total assets of $6.3 million (of which $4.5 million represents goodwill and intangibles included within the scope of the assessment) and total revenues of $3.5 million in the consolidated financial statements of the Company as of and for the year ended December 31, 2015. Our audit of internal control over financial reporting of the Company also excluded an evaluation of the internal control over financial reporting of HEKA.
We do not express an opinion or any other form of assurance on management’s statements referring to corrective actions taken after Dsecember 31, 2015, relative to the aforementioned material weakness in internal control over financial reporting.
| /s/ KPMG LLP |
Boston, Massachusetts
April 29, 2016
| 46 |
None.
PART III
Item 10. Directors, Executive Officers and Corporate Governance.
Incorporated by reference to our definitive Proxy Statement to be filed pursuant to Regulation 14A under the Exchange Act, in connection with our 2016 Annual Meeting of Stockholders. Information concerning executive officers of our Company is included in Part I of this Annual Report on Form 10-K as Item 1. Business- Executive Officers of the Registrant and incorporated herein by reference.
Item 11. Executive Compensation.
Incorporated by reference to our definitive Proxy Statement to be filed pursuant to Regulation 14A under the Exchange Act in connection with our 2016 Annual Meeting of Stockholders.
Item 12. Security Ownership of Certain Beneficial Owners and Management and Related Stockholder Matters.
Incorporated by reference to our definitive Proxy Statement to be filed pursuant to Regulation 14A under the Exchange Act in connection with our 2016 Annual Meeting of Stockholders.
Item 13. Certain Relationships and Related Transactions, and Director Independence.
Incorporated by reference to our definitive Proxy Statement to be filed pursuant to Regulation 14A under the Exchange Act in connection with our 2016 Annual Meeting of Stockholders.
Item 14. Principal Accounting Fees and Services.
Incorporated by reference to our definitive Proxy Statement to be filed pursuant to Regulation 14A under the Exchange Act in connection with our 2016 Annual Meeting of Stockholders.
| 47 |
| 48 |
INDEX TO CONSOLIDATED FINANCIAL STATEMENTS
HARVARD BIOSCIENCE, INC.
| Page | |||||||||
| Report of Independent Registered Public Accounting Firm | F-2 | ||||||||
| Consolidated Balance Sheets as of December 31, 2015 and 2014 | F-3 | ||||||||
| Consolidated Statements of Operations for the years ended December 31, 2015, 2014 and 2013 | F-4 | ||||||||
| Consolidated Statements of Comprehensive (Loss) Income for the years ended December 31, 2015, 2014 and 2013 | F-5 | ||||||||
| Consolidated Statements of Stockholders’ Equity for the years ended December 31, 2015, 2014 and 2013 | F-6 | ||||||||
| Consolidated Statements of Cash Flows for the years ended December 31, 2015, 2014 and 2013 | F-7 | ||||||||
| Notes to Consolidated Financial Statements | F-8 | ||||||||
| F-1 |
Report of Independent Registered Public Accounting Firm
The Board of Directors and Stockholders
Harvard Bioscience, Inc.:
We have audited the accompanying consolidated balance sheets of Harvard Bioscience, Inc. and subsidiaries (the Company) as of December 31, 2015 and 2014, and the related consolidated statements of operations, comprehensive (loss) income, stockholders’ equity and cash flows for each of the years in the three-year period ended December 31, 2015. These consolidated financial statements are the responsibility of the Company’s management. Our responsibility is to express an opinion on these consolidated financial statements based on our audits.
We conducted our audits in accordance with the standards of the Public Company Accounting Oversight Board (United States). Those standards require that we plan and perform the audit to obtain reasonable assurance about whether the financial statements are free of material misstatement. An audit includes examining, on a test basis, evidence supporting the amounts and disclosures in the financial statements. An audit also includes assessing the accounting principles used and significant estimates made by management, as well as evaluating the overall financial statement presentation. We believe that our audits provide a reasonable basis for our opinion.
In our opinion, the consolidated financial statements referred to above present fairly, in all material respects, the financial position of Harvard Bioscience, Inc. as of December 31, 2015 and 2014, and the results of their operations and their cash flows for each of the years in the three-year period ended December 31, 2015, in conformity with U.S. generally accepted accounting principles.
We also have audited, in accordance with the standards of the Public Company Accounting Oversight Board (United States), Harvard Bioscience, Inc.’s internal control over financial reporting as of December 31, 2015, based on criteria established in Internal Control – Integrated Framework (2013) issued by the Committee of Sponsoring Organizations of the Treadway Commission (COSO), and our report dated April 29, 2016 expressed an adverse opinion on the effectiveness of the Company’s internal control over financial reporting.
| /s/ KPMG LLP |
Boston, Massachusetts
April 29, 2016
| F-2 |
HARVARD BIOSCIENCE, INC.
(In thousands, except share and per share data)
| December 31, | December 31, | |||||||
| 2015 | 2014 | |||||||
| Assets | ||||||||
| Current assets: | ||||||||
| Cash and cash equivalents | $ | 6,744 | $ | 14,134 | ||||
| Accounts receivable, net of allowance for doubtful accounts of $310 and $328, | ||||||||
| respectively | 17,547 | 16,141 | ||||||
| Inventories | 22,343 | 20,531 | ||||||
| Deferred income tax assets - current | 42 | 1,515 | ||||||
| Other receivables and other assets | 3,873 | 4,742 | ||||||
| Total current assets | 50,549 | 57,063 | ||||||
| Property, plant and equipment, net | 5,902 | 5,190 | ||||||
| Deferred income tax assets - non-current | 995 | 11,056 | ||||||
| Amortizable intangible assets, net | 20,872 | 21,153 | ||||||
| Goodwill | 40,357 | 39,822 | ||||||
| Indefinite lived intangible assets | 1,223 | 1,252 | ||||||
| Other assets | 319 | 380 | ||||||
| Total assets | $ | 120,217 | $ | 135,916 | ||||
| Liabilities and Stockholders' Equity | ||||||||
| Current liabilities: | ||||||||
| Current portion, long-term debt | $ | 2,450 | $ | 5,000 | ||||
| Accounts payable | 8,782 | 6,294 | ||||||
| Deferred revenue | 752 | 655 | ||||||
| Accrued income taxes | 290 | 554 | ||||||
| Accrued expenses | 4,021 | 4,452 | ||||||
| Deferred income tax liabilities - current | 2,246 | 121 | ||||||
| Other liabilities - current | 868 | 1,023 | ||||||
| Total current liabilities | 19,409 | 18,099 | ||||||
| Long-term debt, less current installments | 16,450 | 16,450 | ||||||
| Deferred income tax liabilities - non-current | 3,775 | 1,325 | ||||||
| Other long term liabilities | 2,985 | 4,574 | ||||||
| Total liabilities | 42,619 | 40,448 | ||||||
| Commitments and contingencies | ||||||||
| Stockholders' equity: | ||||||||
| Preferred stock, par value $0.01 per share, 5,000,000 shares authorized | - | - | ||||||
| Common stock, par value $0.01 per share, 80,000,000 shares authorized; 41,724,772 and | ||||||||
| 40,308,763 shares issued and 33,979,265 and 32,563,256 shares outstanding, respectively | 416 | 397 | ||||||
| Additional paid-in-capital | 211,457 | 206,656 | ||||||
| Accumulated deficit | (111,723 | ) | (92,684 | ) | ||||
| Accumulated other comprehensive loss | (11,884 | ) | (8,233 | ) | ||||
| Treasury stock at cost, 7,745,507 common shares | (10,668 | ) | (10,668 | ) | ||||
| Total stockholders' equity | 77,598 | 95,468 | ||||||
| Total liabilities and stockholders' equity | $ | 120,217 | $ | 135,916 | ||||
See accompanying notes to consolidated financial statements.
| F-3 |
HARVARD BIOSCIENCE, INC.
CONSOLIDATED STATEMENTS OF OPERATIONS
(In thousands, except per share data)
| Year Ended December 31, | ||||||||||||
| 2015 | 2014 | 2013 | ||||||||||
| Revenues | $ | 108,664 | $ | 108,663 | $ | 105,171 | ||||||
| Cost of revenues (exclusive of items shown separately below) | 59,941 | 59,319 | 57,475 | |||||||||
| Gross profit | 48,723 | 49,344 | 47,696 | |||||||||
| Sales and marketing expenses | 20,577 | 18,225 | 17,330 | |||||||||
| General and administrative expenses | 19,832 | 16,826 | 17,887 | |||||||||
| Research and development expenses | 6,420 | 4,880 | 4,154 | |||||||||
| Restructuring charges | 788 | 1,027 | 2,150 | |||||||||
| Amortization of intangible assets | 2,819 | 2,578 | 2,590 | |||||||||
| Biostage transaction costs | - | - | 2,048 | |||||||||
| Gain on sale of assets, net | - | (810 | ) | - | ||||||||
| Total operating expenses, net | 50,436 | 42,726 | 46,159 | |||||||||
| Operating (loss) income | (1,713 | ) | 6,618 | 1,537 | ||||||||
| Other income (expense): | ||||||||||||
| Foreign exchange | 210 | (150 | ) | (139 | ) | |||||||
| Interest expense | (854 | ) | (990 | ) | (955 | ) | ||||||
| Interest income | 8 | 74 | 43 | |||||||||
| Other expense, net | (1,259 | ) | (1,135 | ) | (51 | ) | ||||||
| Other expense, net | (1,895 | ) | (2,201 | ) | (1,102 | ) | ||||||
| (Loss) income from continuing operations before income taxes | (3,608 | ) | 4,417 | 435 | ||||||||
| Income tax expense (benefit) | 15,431 | 2,062 | (288 | ) | ||||||||
| (Loss) income from continuing operations | (19,039 | ) | 2,355 | 723 | ||||||||
| Discontinued operations: | ||||||||||||
| Loss from discontinued operations, net of tax | - | - | (2,553 | ) | ||||||||
| Net (loss) income | $ | (19,039 | ) | $ | 2,355 | $ | (1,830 | ) | ||||
| (Loss) earnings per share: | ||||||||||||
| Basic (loss) earnings per common share from continuing operations | $ | (0.57 | ) | $ | 0.07 | $ | 0.02 | |||||
| Discontinued operations | - | - | (0.08 | ) | ||||||||
| Basic (loss) earnings per common share | $ | (0.57 | ) | $ | 0.07 | $ | (0.06 | ) | ||||
| Diluted (loss) earnings per common share from continuing operations | $ | (0.57 | ) | $ | 0.07 | $ | 0.02 | |||||
| Discontinued operations | - | - | (0.08 | ) | ||||||||
| Diluted (loss) earnings per common share | $ | (0.57 | ) | $ | 0.07 | $ | (0.06 | ) | ||||
| Weighted average common shares: | ||||||||||||
| Basic | 33,593 | 32,171 | 30,384 | |||||||||
| Diluted | 33,593 | 33,237 | 31,914 | |||||||||
See accompanying notes to consolidated financial statements.
| F-4 |
HARVARD BIOSCIENCE, INC.
CONSOLIDATED STATEMENTS OF COMPREHENSIVE (LOSS) INCOME
(In thousands)
| Year Ended December 31, | ||||||||||||
| 2015 | 2014 | 2013 | ||||||||||
| Net (loss) income | $ | (19,039 | ) | $ | 2,355 | $ | (1,830 | ) | ||||
| Other comprehensive (loss) income: | ||||||||||||
| Foreign currency translation adjustments | (4,936 | ) | (5,941 | ) | 1,573 | |||||||
| Derivatives qualifying as hedges, net of tax: | ||||||||||||
| Loss on derivative instruments designated and qualifying as cash flow hedges | (85 | ) | (99 | ) | (116 | ) | ||||||
| Amounts reclassified from accumulated other comprehensive (loss) income to net (loss) income | 93 | 130 | 67 | |||||||||
| Derivatives qualifying as hedges, net of tax | 8 | 31 | (49 | ) | ||||||||
| Defined benefit pension plans, net of tax: | ||||||||||||
| Amortization of net losses included in net periodic pension costs, net of tax expense of $58, $52 and $62 in 2015, 2014 and 2013, respectively | 248 | 207 | 243 | |||||||||
| Net gain, net of tax expense of $241, $29 and $115 in 2015, 2014 and 2013, respectively | 1,029 | 114 | 452 | |||||||||
| Defined benefit pension plans, net of tax | 1,277 | 321 | 695 | |||||||||
| Other comprehensive (loss) income | (3,651 | ) | (5,589 | ) | 2,219 | |||||||
| Comprehensive (loss) income | $ | (22,690 | ) | $ | (3,234 | ) | $ | 389 | ||||
See accompanying notes to consolidated financial statements.
| F-5 |
HARVARD BIOSCIENCE, INC.
CONSOLIDATED STATEMENTS OF STOCKHOLDERS' EQUITY
(In thousands)
| Accumulated | ||||||||||||||||||||||||||||
| Number | Additional | Other | Total | |||||||||||||||||||||||||
| of Shares | Common | Paid-in | Accumulated | Comprehensive | Treasury | Stockholders’ | ||||||||||||||||||||||
| Issued | Stock | Capital | Deficit | Income (Loss) | Stock | Equity | ||||||||||||||||||||||
| Balance at December 31, 2012 | 37,124 | $ | 370 | $ | 196,634 | $ | (77,260 | ) | $ | (4,863 | ) | $ | (10,668 | ) | $ | 104,213 | ||||||||||||
| Stock option exercises | 2,135 | 20 | 4,031 | - | - | - | 4,051 | |||||||||||||||||||||
| Stock purchase plan | 57 | - | 194 | - | - | - | 194 | |||||||||||||||||||||
| Vesting of restricted stock units | 282 | - | - | - | - | - | - | |||||||||||||||||||||
| Shares withheld for taxes | (213 | ) | - | (1,083 | ) | - | - | - | (1,083 | ) | ||||||||||||||||||
| Distribution to Biostage | - | - | - | (15,949 | ) | - | - | (15,949 | ) | |||||||||||||||||||
| Stock compensation expense | - | - | 2,670 | - | - | - | 2,670 | |||||||||||||||||||||
| Net loss | - | - | - | (1,830 | ) | - | - | (1,830 | ) | |||||||||||||||||||
| Other comprehensive income | - | - | - | - | 2,219 | - | 2,219 | |||||||||||||||||||||
| Balance at December 31, 2013 | 39,385 | 390 | 202,446 | (95,039 | ) | (2,644 | ) | (10,668 | ) | 94,485 | ||||||||||||||||||
| Stock option exercises | 695 | 7 | 2,153 | - | - | - | 2,160 | |||||||||||||||||||||
| Stock purchase plan | 58 | - | 228 | - | - | - | 228 | |||||||||||||||||||||
| Vesting of restricted stock units | 233 | - | - | - | - | - | - | |||||||||||||||||||||
| Shares withheld for taxes | (62 | ) | - | (327 | ) | - | - | - | (327 | ) | ||||||||||||||||||
| Stock compensation expense | - | - | 2,156 | - | - | - | 2,156 | |||||||||||||||||||||
| Net income | - | - | - | 2,355 | - | - | 2,355 | |||||||||||||||||||||
| Other comprehensive loss | - | - | - | - | (5,589 | ) | - | (5,589 | ) | |||||||||||||||||||
| Balance at December 31, 2014 | 40,309 | 397 | 206,656 | (92,684 | ) | (8,233 | ) | (10,668 | ) | 95,468 | ||||||||||||||||||
| Stock option exercises | 1,772 | 25 | 2,605 | - | - | - | 2,630 | |||||||||||||||||||||
| Stock purchase plan | 59 | - | 208 | - | - | - | 208 | |||||||||||||||||||||
| Vesting of restricted stock units | 237 | - | - | - | - | - | - | |||||||||||||||||||||
| Shares withheld for taxes | (652 | ) | (6 | ) | (767 | ) | - | - | - | (773 | ) | |||||||||||||||||
| Stock compensation expense | - | - | 2,755 | - | - | - | 2,755 | |||||||||||||||||||||
| Net loss | - | - | - | (19,039 | ) | - | - | (19,039 | ) | |||||||||||||||||||
| Other comprehensive loss | - | - | - | - | (3,651 | ) | - | (3,651 | ) | |||||||||||||||||||
| Balance at December 31, 2015 | 41,725 | $ | 416 | $ | 211,457 | $ | (111,723 | ) | $ | (11,884 | ) | $ | (10,668 | ) | $ | 77,598 | ||||||||||||
See accompanying notes to consolidated financial statements.
| F-6 |
HARVARD BIOSCIENCE, INC.
CONSOLIDATED STATEMENTS OF CASH FLOWS
(In thousands)
| Year Ended December 31, | ||||||||||||
| 2015 | 2014 | 2013 | ||||||||||
| Cash flows from operating activities: | ||||||||||||
| Net (loss) income | $ | (19,039 | ) | $ | 2,355 | $ | (1,830 | ) | ||||
| Adjustments to reconcile net (loss) income to net cash provided by operating activities: | ||||||||||||
| Stock compensation expense | 2,755 | 2,156 | 2,670 | |||||||||
| Depreciation | 1,745 | 1,253 | 1,298 | |||||||||
| Earn-out related to discontinued operations | - | - | (440 | ) | ||||||||
| Loss (gain) on sale of assets, net | 25 | (810 | ) | - | ||||||||
| Non-cash restructuring (credit) | (85 | ) | (120 | ) | (46 | ) | ||||||
| Amortization of catalog costs | 9 | 47 | 101 | |||||||||
| (Recovery) provision for allowance for doubtful accounts | (7 | ) | (67 | ) | 172 | |||||||
| Amortization of intangible assets | 2,819 | 2,578 | 2,590 | |||||||||
| Amortization of deferred financing costs | 86 | 61 | 46 | |||||||||
| Deferred income taxes | 15,116 | 1,412 | (2,441 | ) | ||||||||
| Changes in operating assets and liabilities: | ||||||||||||
| (Increase) decrease in accounts receivable | (1,340 | ) | (735 | ) | 436 | |||||||
| (Increase) decrease in inventories | (1,223 | ) | (3,056 | ) | 1,921 | |||||||
| Decrease (increase) in other receivables and other assets | 755 | (370 | ) | (1,020 | ) | |||||||
| Increase (decrease) in trade accounts payable | 2,577 | 1,069 | (41 | ) | ||||||||
| (Decrease) increase in accrued income taxes | (311 | ) | (269 | ) | 323 | |||||||
| (Decrease) increase in accrued expenses | (1,511 | ) | (345 | ) | 847 | |||||||
| Increase in deferred revenue | 120 | 28 | 146 | |||||||||
| Decrease in other liabilities | (1,786 | ) | (836 | ) | (672 | ) | ||||||
| Net cash provided by operating activities | 705 | 4,351 | 4,060 | |||||||||
| Cash flows (used in) provided by investing activities: | ||||||||||||
| Additions to property, plant and equipment | (2,960 | ) | (2,005 | ) | (1,622 | ) | ||||||
| Additions to catalog costs | (18 | ) | - | (57 | ) | |||||||
| Proceeds from sale of discontinued operations | - | - | 1,784 | |||||||||
| Proceeds from sales of property, plant and equipment | 6 | 1,141 | 66 | |||||||||
| Acquisitions, net of cash acquired | (4,545 | ) | (12,653 | ) | - | |||||||
| Net cash (used in) provided by investing activities | (7,517 | ) | (13,517 | ) | 171 | |||||||
| Cash flows (used in) provided by financing activities: | ||||||||||||
| Proceeds from issuance of debt | 5,800 | 2,200 | 14,550 | |||||||||
| Repayments of debt | (8,350 | ) | (5,500 | ) | (2,750 | ) | ||||||
| Transfer of cash and cash equivalents to Biostage | - | - | (15,041 | ) | ||||||||
| Payments of debt issuance costs | (32 | ) | - | (312 | ) | |||||||
| Net proceeds from issuance of common stock | 2,042 | 2,066 | 3,621 | |||||||||
| Net cash (used in) provided by financing activities | (540 | ) | (1,234 | ) | 68 | |||||||
| Effect of exchange rate changes on cash | (38 | ) | (1,237 | ) | 791 | |||||||
| (Decrease) increase in cash and cash equivalents | (7,390 | ) | (11,637 | ) | 5,090 | |||||||
| Cash and cash equivalents at the beginning of period | 14,134 | 25,771 | 20,681 | |||||||||
| Cash and cash equivalents at the end of period | $ | 6,744 | $ | 14,134 | 25,771 | |||||||
| Supplemental disclosures of cash flow information: | ||||||||||||
| Cash paid for interest | $ | 854 | $ | 997 | 892 | |||||||
| Cash paid for income taxes, net of refunds | $ | 963 | $ | 843 | 1,479 | |||||||
See accompanying notes to consolidated financial statements.
| F-7 |
HARVARD BIOSCIENCE, INC.
NOTES TO CONSOLIDATED FINANCIAL STATEMENTS
| 1. | Organization |
Harvard Bioscience, Inc. ( “Harvard Bioscience” or “the Company”) is a global developer, manufacturer and marketer of a broad range of scientific instruments, systems and lab consumables used to advance life science for basic research, drug discovery, clinical and environmental testing. The Company’s products are sold to thousands of researchers in over 100 countries through its global sales organization, catalogs, websites, and through distributors including GE Healthcare, Thermo Fisher Scientific Inc., VWR and other specialized distributors. The Company has sales and manufacturing operations in the United States, the United Kingdom, Germany, Sweden, Spain, France, Canada and China. .
| 2. | Summary of Significant Accounting Policies |
| (a) | Principles of Consolidation |
The consolidated financial statements include the accounts of Harvard Bioscience, Inc. and its wholly-owned subsidiaries. All intercompany balances and transactions have been eliminated in consolidation.
| (b) | Use of Estimates |
The preparation of financial statements in conformity with accounting principles generally accepted in the United States requires the use of management estimates. Such estimates include the determination and establishment of certain accruals and provisions, including those for inventory excess and obsolescence, income tax and reserves for bad debts. In addition, certain estimates are required in order to determine the value of assets and liabilities associated with acquisitions, as well as the Company’s defined benefit pension obligations. Estimates are also required to evaluate the value and recoverability of existing long-lived and intangible assets, including goodwill. On an ongoing basis, the Company reviews its estimates based upon currently available information. Actual results could differ materially from those estimates.
| (c) | Cash and Cash Equivalents |
For purposes of the consolidated balance sheets and statements of cash flows, the Company considers all highly liquid instruments with original maturities of three months or less to be cash equivalents.
| (d) | Allowance for Doubtful Accounts |
Allowance for doubtful accounts is based on the Company’s assessment of collectability of customer accounts. The Company regularly reviews the allowance by considering factors such as historical experience, credit quality, age of the accounts receivable balances and other factors that may affect a customer’s ability to pay.
| (e) | Inventories |
The Company values its inventories at the lower of the actual cost to purchase (first-in, first-out method) and/or manufacture the inventories or the current estimated market value of the inventories. The Company regularly reviews inventory quantities on hand and records a provision to write down excess and obsolete inventories to its estimated net realizable value if less than cost, based primarily on historical inventory usage and estimated forecast of product demand.
| (f) | Property, Plant and Equipment |
Property, plant and equipment are stated at cost and depreciated using the straight-line method over the estimated useful lives of the assets as follows:
| Buildings | 40 | years | ||||
| Machinery and equipment | 3 | - | 10 | years | ||
| Computer equipment and software | 3 | - | 7 | years | ||
| Furniture and fixtures | 5 | - | 10 | years | ||
| Automobiles | 3 | - | 6 | years |
| F-8 |
Property and equipment held under capital leases and leasehold improvements are amortized using the straight line method over the shorter of the lease term or estimated useful life of the asset.
| (g) | Catalog Costs |
Significant costs of product catalog design, development and production are capitalized and amortized over the expected useful life of the catalog (usually one to three years).
| (h) | Income Taxes |
Income taxes are accounted for under the asset and liability method. Deferred tax assets and liabilities are recognized for the future tax consequences attributable to differences between the financial statement carrying amounts of existing assets and liabilities and their respective tax bases. Deferred tax assets and liabilities are measured using enacted tax rates expected to be applied to taxable income in the years in which those temporary differences are expected to be recovered or settled. The effect on deferred tax assets and liabilities of a change in tax rates is recognized in income in the period that includes the enactment date.
The Company recognizes the effect of income tax positions only if those positions are more likely than not of being sustained. Recognized income tax positions are measured at the largest amount that is more than 50% likely of being realized. Changes in recognition are reflected in the period in which the judgement occurs.
| (i) | Foreign Currency Translation |
The functional currency of the Company’s foreign subsidiaries is generally their local currency. All assets and liabilities of its foreign subsidiaries are translated at exchange rates in effect at period-end. Income and expenses are translated at rates which approximate those in effect on the transaction dates. The resulting translation adjustment is recorded as a separate component of stockholders’ equity in accumulated other comprehensive (loss) income (“AOCI”) in the consolidated balance sheets. Gains and losses resulting from foreign currency transactions are included in net (loss) income.
| (j) | Earnings per Share |
Basic earnings per share is computed by dividing net income by the weighted average number of shares of common stock outstanding during the periods presented. The computation of diluted earnings per share is similar to the computation of basic earnings per share, except that the denominator is increased for the assumed exercise of dilutive options and other potentially dilutive securities using the treasury stock method unless the effect is antidilutive. Since the Company is reporting discontinued operations, it used income from continuing operations as the control number in determining whether those potential dilutive securities are dilutive or antidilutive.
| (k) | Comprehensive (Loss) Income |
The Company follows the provisions of Financial Accounting Standards Board (“FASB”) Accounting Standards Codification (“ASC”) 220, “Comprehensive Income”. FASB ASC 220 requires companies to report all changes in equity during a period, resulting from net (loss) income and transactions from non-owner sources, in a financial statement in the period in which they are recognized. The Company has chosen to disclose comprehensive (loss) income, which encompasses net (loss) income, foreign currency translation adjustments, gains and losses on derivatives, the underfunded status of its pension plans, and pension minimum additional liability adjustments, net of tax, in the consolidated statements of comprehensive (loss) income.
| (l) | Revenue Recognition |
The Company follows the provisions of FASB ASC 605, “Revenue Recognition”. The Company recognizes product revenues when persuasive evidence of a sales arrangement exists, the price to the buyer is fixed or determinable, delivery has occurred, and collectability of the sales price is reasonably assured. Sales of some of its products include provisions to provide additional services such as installation and training. Revenues on these products are recognized when the additional services have been performed. Service agreements on its equipment are typically sold separately from the sale of the equipment. Cash received prior to rendering of the service on these contracts is recorded as deferred revenue and the revenues are recognized ratably over the life of the agreement, typically one year, in accordance with the provisions of FASB ASC 605-20, “Revenue Recognition—Services”.
| F-9 |
The Company accounts for shipping and handling fees and costs in accordance with the provisions of FASB ASC 605-45-45, “Revenue Recognition—Principal Agent Considerations”, which requires all amounts charged to customers for shipping and handling to be classified as revenues. The costs incurred related to shipping and handling is classified as cost of product revenues. Warranties and product returns are estimated and accrued for at the time sales are recorded. The Company has no obligations to customers after the date products are shipped or installed, if applicable, other than pursuant to warranty obligations and service or maintenance contracts. The Company provides for the estimated amount of future returns upon shipment of products or installation, if applicable, based on historical experience.
| (m) | Valuation of Identifiable Intangible Assets Acquired in Business Combinations |
The determination of the fair value of intangible assets, which represents a significant portion of the purchase price in the Company’s acquisitions, requires the use of significant judgment with regard to (i) the fair value; and (ii) whether such intangibles are amortizable or not amortizable and, if the former, the period and the method by which the intangibles asset will be amortized. The Company estimates the fair value of acquisition-related intangible assets principally based on projections of cash flows that will arise from identifiable assets of acquired businesses. The projected cash flows are discounted to determine the present value of the assets at the dates of acquisitions. At December 31, 2015, amortizable intangible assets include existing technology, trade names, distribution agreements, customer relationships and patents. These amortizable intangible assets are amortized on a straight-line basis over 7 to 15 years, 10 to 15 years, 4 to 5 years, 5 to 15 years and 5 to 15 years, respectively.
| (n) | Goodwill and Other Intangible Assets |
Goodwill and unamortizable intangible assets acquired in a business combination and determined to have an indefinite useful life are not amortized, but instead are tested for impairment annually or more frequently if events or changes in circumstances indicate that the asset might be impaired, in accordance with the provisions of FASB ASC 350, “Intangibles—Goodwill and Other”.
For the purpose of its goodwill analysis, the Company has one reporting unit. The Company conducted its annual impairment analysis in the fourth quarter of fiscal year 2015. The goodwill impairment test is a two-step process. The first step of the impairment analysis compares the Company’s fair value to its carrying value to determine if there is any indication of impairment. Step two of the analysis compares the implied fair value of goodwill to its carrying amount in a manner similar to a purchase price allocation for business combination. If the carrying amount of goodwill exceeds its implied fair value, an impairment loss is recognized equal to that excess. For indefinite-lived intangible assets if the carrying amount exceeds the fair value of the asset, the Company would write down the indefinite-lived intangible asset to fair value.
At December 31, 2015, the fair value of the Company significantly exceeded the carrying value. The Company concluded that none of its goodwill was impaired.
The Company evaluates indefinite-lived intangible assets for impairment annually and when events occur or circumstances change that may reduce the fair value of the asset below its carrying amount. Events or circumstances that might require an interim evaluation include unexpected adverse business conditions, economic factors, unanticipated technological changes or competitive activities, loss of key personnel and acts by governments and courts. At December 31, 2015, the Company concluded that none of its indefinite-lived intangible assets were impaired.
| (o) | Impairment of Long-Lived Assets |
The Company assesses recoverability of its long-lived assets that are held for use, such as property, plant and equipment and amortizable intangible assets in accordance with FASB ASC 360, “Property, Plant and Equipment” when events or changes in circumstances indicate that the carrying amount of an asset or asset group may not be recoverable. Recoverability of assets or an asset group to be held and used is measured by a comparison of the carrying amount of an asset or asset group to estimated undiscounted future cash flows expected to be generated by the asset or the asset group. Cash flow projections are based on trends of historical performance and management’s estimate of future performance. If the carrying amount of the asset or asset group exceeds the estimated future cash flows, an impairment charge is recognized by the amount by which the carrying amount of the asset or asset group exceeds its estimated fair value. At December 31, 2015, the Company concluded that none of its long-lived assets were impaired.
| F-10 |
| (p) | Derivatives |
The Company uses interest-rate-related derivative instruments to manage its exposure related to changes in interest rates on its variable-rate debt instruments. The Company does not enter into derivative instruments for any purpose other than cash flow hedging. The Company does not speculate using derivative instruments. The Company recognizes all derivative instruments as either assets or liabilities in the balance sheet at their respective fair values. For derivatives designated in hedging relationships, changes in the fair value are either offset through earnings against the change in fair value of the hedged item attributable to the risk being hedged or recognized in AOCI, to the extent the derivative is effective at offsetting the changes in cash flows being hedged until the hedged item affects earnings.
The Company only enters into derivative contracts that it intends to designate as a hedge of a forecasted transaction or the variability of cash flows to be received or paid related to a recognized asset or liability (cash flow hedge). For all hedging relationships, the Company formally documents the hedging relationship and its risk-management objective and strategy for undertaking the hedge, the hedging instrument, the hedged transaction, the nature of the risk being hedged, how the hedging instrument’s effectiveness in offsetting the hedged risk will be assessed prospectively and retrospectively, and a description of the method used to measure ineffectiveness. The Company also formally assesses, both at the inception of the hedging relationship and on an ongoing basis, whether the derivatives that are used in hedging relationships are highly effective in offsetting changes in cash flows of hedged transactions. For derivative instruments that are designated and qualify as part of a cash flow hedging relationship, the effective portion of the gain or loss on the derivative is reported as a component of other comprehensive income and reclassified into earnings in the same period or periods during which the hedged transaction affects earnings. Gains and losses on the derivative representing either hedge ineffectiveness or hedge components excluded from the assessment of effectiveness are recognized in current earnings.
The Company discontinues hedge accounting prospectively when it determines that the derivative is no longer effective in offsetting cash flows attributable to the hedged risk, the derivative expires or is sold, terminated, or exercised, the cash flow hedge is de-designated because a forecasted transaction is not probable of occurring, or management determines to remove the designation of the cash flow hedge.
In all situations in which hedge accounting is discontinued and the derivative remains outstanding, the Company continues to carry the derivative at its fair value on the balance sheet and recognizes any subsequent changes in its fair value in earnings. When it is probable that a forecasted transaction will not occur, the Company discontinues hedge accounting and recognizes immediately in earnings gains and losses that were accumulated in other comprehensive income related to the hedging relationship.
| (q) | Fair Value of Financial Instruments |
The carrying values of the Company’s cash and cash equivalents, trade accounts receivable and trade accounts payable and short-term debt approximate their fair values because of the short maturities of those instruments. The fair value of the Company’s long-term debt approximates its carrying value and is based on the amount of future cash flows associated with the debt discounted using current borrowing rates for similar debt instruments of comparable maturity.
Financial reporting standards define a fair value hierarchy that consists of three levels:
| § | Level 1 includes instruments for which quoted prices in active markets for identical assets or liabilities accessible to the Company at the measurement date. |
| § | Level 2 includes instruments for which the valuations are based on quoted prices for similar assets or liabilities, quoted prices in markets that are not active, or other inputs that are observable or can be corroborated by observable data for substantially the full term of the assets or liabilities. |
| § | Level 3 includes valuations based on inputs that are unobservable and significant to the overall fair value measurement. |
| (r) | Stock-based Compensation |
The Company accounts for stock-based payment awards in accordance with the provisions of FASB ASC 718, “Compensation—Stock Compensation”, which requires it to recognize compensation expense for all stock-based payment awards made to employees and directors including stock options, restricted stock units, restricted stock units with a market condition and employee stock purchases (“employee stock purchases”) related to its Employee Stock Purchase Plan (as amended, the “ESPP”). The Company issues new shares upon stock option exercises, upon vesting of restricted stock units and restricted stock units with a market condition, and under the Company’s ESPP.
| F-11 |
Stock-based compensation expense recognized is based on the value of the portion of stock-based payment awards that is ultimately expected to vest and has been reduced for estimated forfeitures. The Company values stock-based payment awards, except restricted stock units at grant date using the Black-Scholes option-pricing model (“Black-Scholes model”). The Company values restricted stock units with a market condition using a Monte-Carlo valuation simulation. The determination of fair value of stock-based payment awards on the date of grant using an option-pricing model or Monte-Carlo valuation simulation is affected by its stock price as well as assumptions regarding certain variables. These variables include, but are not limited to its expected stock price volatility over the term of the awards and actual and projected stock option exercise behaviors.
The fair value of restricted stock units are based on the market price of the Company’s stock on the date of grant and are recorded as compensation expense ratably over the applicable service period, which ranges from one to four years. Unvested restricted stock units are forfeited in the event of termination of employment with the Company.
Stock-based compensation expense recognized under FASB ASC 718 for the years ended December 31, 2015, 2014 and 2013 consisted of stock-based compensation expense related to stock options, the employee stock purchase plan, and the restricted stock units and was recorded as a component of cost of product revenues, sales and marketing expenses, general and administrative expenses, research and development expenses and discontinued operations. Refer to footnote 19 for further details.
| (s) | Recently Issued Accounting Pronouncements |
In May 2014, the Financial Accounting Standards Board (FASB) issued Accounting Standards Update (ASU) 2014-09, “Revenue from Contracts with Customers,” a new accounting standard that provides for a comprehensive model to use in the accounting for revenue arising from contracts with customers that will replace most existing revenue recognition guidance within generally accepted accounting principles in the United States. Under this standard, revenue will be recognized to depict the transfer of promised goods or services to customers in an amount that reflects the consideration to which the Company expects to be entitled in exchange for those goods or services. At its July 2015 meeting, the FASB agreed to defer the mandatory effective date of ASU 2014-09 one year. Under the one year deferral, the standard will take effect in 2018 for calendar year-end public entities. The Company is assessing the new standard and has not yet determined the impact to the consolidated financial statements.
In April 2015, the FASB issued ASU 2015-03, Interest - Imputation of Interest (Subtopic 835-30): Simplifying the Presentation of Debt Issuance Costs. The update requires debt issuance costs related to a recognized debt liability to be presented in the balance sheet as a direct deduction from the carrying amount of the related debt liability, instead of being presented as an asset. Debt disclosures will include the face amount of the debt liability and the effective interest rate. The update requires retrospective application and represents a change in accounting principle. The update is effective for fiscal years beginning after December 15, 2015. Early adoption is permitted for financial statements that have not been previously issued. The Company believes the adoption of this new guidance will not have a material impact on its consolidated financial position or results of operations.
In July 2015, the FASB issued ASU 2015-11, Simplifying Measurement of Inventory. The update requires measurement of most inventory “at the lower of cost and net realizable value”, and applies to all entities that recognize inventory within the scope of ASC 330, except for inventory measured under the last-in, first-out (LIFO) method or the retail inventory method (RIM). ASU 2015-11 requires prospective application and represents a change in accounting principle. The update is effective for fiscal years beginning after December 15, 2016. Early adoption is permitted for financial statements that have not been previously issued. The Company is evaluating the impact of ASU 2015-11 on its consolidated financial statements and the possibility of early adoption by the Company.
In September 2015, the FASB issued ASU 2015-16, Simplifying the Accounting for Measurement-Period Adjustments. The update eliminates the requirement to retrospectively adjust financial statements for measurement-period adjustments that occur in periods after a business combination. Under the update, measurement-period adjustments are to be calculated as if they were known at the acquisition date, but are recognized in the reporting period in which they are determined. Additional disclosures are required about the impact on current-period earnings. ASU 2015-16 requires prospective application to adjustments of provisional amounts that occur after the effective date. The update is effective for fiscal years beginning after December 15, 2016. Early adoption is permitted for financial statements that have not been previously issued. The Company is evaluating the impact of ASU 2015-16 on its consolidated financial statements and the possibility of early adoption by the Company.
In November 2015, the FASB issued ASU 2015-17, Balance Sheet Classification of Deferred Taxes. The update requires all deferred income taxes to be presented on the balance sheet as noncurrent. The new guidance is intended to simplify financial reporting by eliminating the requirement to classify deferred taxes between current and noncurrent. The update is effective for fiscal years beginning after December 15, 2016. Early adoption is permitted at the beginning of an interim or annual period. The Company is evaluating the impact of ASU 2015-17 on its consolidated financial statements and the possibility of early adoption by the Company.
| F-12 |
In February 2016, the FASB issued ASU 2016-02, Leases, which is intended to improve financial reporting about leasing transactions. The update requires a lessee to record on the balance sheet the assets and liabilities for the rights and obligations created by lease terms of more than 12 months. The update is effective for fiscal years beginning after December 15, 2018. The Company is evaluating the impact of ASU 2016-02 on its consolidated financial statements.
| 3. | Concentrations |
No customer accounted for more than 10% of the revenues for the years ended December 31, 2015, 2014 and 2013. At December 31, 2015 and 2014, no customer accounted for more than 10% of net accounts receivable.
| 4. | Accumulated Other Comprehensive Loss |
Changes in each component of accumulated other comprehensive loss, net of tax are as follows:
| Foreign currency | Derivatives | |||||||||||||||
| translation | qualifying as | Defined benefit | ||||||||||||||
| (in thousands) | adjustments | hedges | pension plans | Total | ||||||||||||
| Balance at December 31, 2013 | $ | 1,283 | $ | (49 | ) | $ | (3,878 | ) | $ | (2,644 | ) | |||||
| Other comprehensive (loss) income before reclassifications | (5,941 | ) | (99 | ) | 114 | (5,926 | ) | |||||||||
| Amounts reclassified from AOCI | - | 130 | 207 | 337 | ||||||||||||
| Net other comprehensive (loss) income | (5,941 | ) | 31 | 321 | (5,589 | ) | ||||||||||
| Balance at December 31, 2014 | $ | (4,658 | ) | $ | (18 | ) | $ | (3,557 | ) | $ | (8,233 | ) | ||||
| Other comprehensive (loss) income before reclassifications | (4,936 | ) | (85 | ) | 1,029 | (3,992 | ) | |||||||||
| Amounts reclassified from AOCI | - | 93 | 248 | 341 | ||||||||||||
| Other comprehensive (loss) income | (4,936 | ) | 8 | 1,277 | (3,651 | ) | ||||||||||
| Balance at December 31, 2015 | $ | (9,594 | ) | $ | (10 | ) | $ | (2,280 | ) | $ | (11,884 | ) | ||||
The amounts reclassified out of accumulated other comprehensive (loss) income are as follows:
| Affected line item in the | Year Ended December 31, | |||||||||||||||
| (in thousands) | Statements of Operations | 2015 | 2014 | 2013 | ||||||||||||
| Amounts Reclassified From AOCI | ||||||||||||||||
| Derivatives qualifying as hedges | ||||||||||||||||
| Realized loss on derivatives qualifying as hedges | Interest expense | $ | 93 | $ | 130 | $ | 67 | |||||||||
| Income tax | Income tax (benefit) expense | - | - | - | ||||||||||||
| 93 | 130 | 67 | ||||||||||||||
| Defined benefit pension plans | ||||||||||||||||
| Amortization of net losses included in net periodic pension costs | General and administrative expenses | 306 | 259 | 305 | ||||||||||||
| Income tax | Income tax (benefit) expense | (58 | ) | (52 | ) | (62 | ) | |||||||||
| 248 | 207 | 243 | ||||||||||||||
| Total reclassifications | $ | 341 | $ | 337 | $ | 310 | ||||||||||
| F-13 |
| 5. | Inventories |
Inventories consist of the following:
| December 31, | December 31, | |||||||
| 2015 | 2014 | |||||||
| (in thousands) | ||||||||
| Finished goods | $ | 10,957 | $ | 10,138 | ||||
| Work in process | 888 | 946 | ||||||
| Raw materials | 10,498 | 9,447 | ||||||
| Total | $ | 22,343 | $ | 20,531 | ||||
| 6. | Property, Plant and Equipment |
Property, plant and equipment consist of the following:
| December 31, | December 31, | |||||||
| 2015 | 2014 | |||||||
| (in thousands) | ||||||||
| Land, buildings and leasehold improvements | $ | 2,825 | $ | 2,595 | ||||
| Machinery and equipment | 10,131 | 10,102 | ||||||
| Computer equipment and software | 7,503 | 6,322 | ||||||
| Furniture and fixtures | 1,358 | 1,125 | ||||||
| Automobiles | 103 | 56 | ||||||
| 21,920 | 20,200 | |||||||
| Less: accumulated depreciation | (16,018 | ) | (15,010 | ) | ||||
| Property, plant and equipment, net | $ | 5,902 | $ | 5,190 | ||||
7. Acquisitions
The Company completed one acquisition during the year ended December 31, 2015.
HEKA Elektronik
On January 8, 2015, the Company, through its wholly-owned Ealing Scientific Limited and Multi Channel Systems MCS GmbH (“MCS”) subsidiaries, acquired all of the issued and outstanding shares of HEKA Elektronik (“HEKA”) for approximately $5.9 million, or $4.5 million, net of cash acquired. Included in the acquisition of HEKA were: HEKA Electronik Dr. Schulze GmbH, based in Lambrecht, Germany (“HEKA Germany”); HEKA Electronics Incorporated, based in Chester, Nova Scotia, Canada (“HEKA Canada”); and HEKA Instruments Incorporated, based in Bellmore, New York. The Company funded the acquisition from its existing cash balances.
| F-14 |
HEKA is a developer, manufacturer and marketer of sophisticated electrophysiology instrumentation and software for biomedical and industrial research applications. This acquisition is complementary to the electrophysiology line currently offered by the Company’s wholly-owned Warner Instruments and MCS subsidiaries.
The aggregate purchase price for this acquisition was allocated to tangible and intangible assets acquired as follows:
| (in thousands) | ||||
| Tangible assets | $ | 4,165 | ||
| Liabilities assumed | (2,376 | ) | ||
| Net assets | 1,789 | |||
| Goodwill and intangible assets: | ||||
| Goodwill | 1,618 | |||
| Trade name | 774 | |||
| Customer relationships | 1,627 | |||
| Developed technology | 1,338 | |||
| Non-compete agreements | 27 | |||
| Deferred tax liabilities | (1,245 | ) | ||
| Total goodwill and intangible assets, net of tax | 4,139 | |||
| Acquisition purchase price | $ | 5,928 | ||
Goodwill recorded as a result of the acquisition of HEKA is not deductible for tax purposes.
The results of operations for HEKA have been included in the Company’s consolidated financial statements from the date of acquisition.
The following consolidated pro forma information is based on the assumption that the acquisition of HEKA occurred on January 1, 2013. Accordingly, the historical results have been adjusted to reflect amortization expense that would have been recognized on such a pro forma basis. The pro forma information is presented for comparative purposes only and is not necessarily indicative of the financial position or results of operations which would have been reported had we completed the acquisition during these periods or which might be reported in the future.
| Year Ended December 31, | ||||||||||||
| 2015 | 2014 | 2013 | ||||||||||
| (in thousands) | ||||||||||||
| Pro Forma | ||||||||||||
| Revenues | $ | 108,761 | $ | 114,185 | $ | 111,246 | ||||||
| Net (loss) income | (19,027 | ) | 2,646 | (1,327 | ) | |||||||
The Company completed two acquisitions during 2014.
Multi Channel Systems MCS GmbH
On October 1, 2014, the Company, through its wholly-owned Biochrom Limited subsidiary, acquired all of the issued and outstanding shares of MCS, which has its principal offices in Germany, for approximately $11.2 million, including a working capital adjustment, or $10.7 million, net of cash acquired. The Company funded the acquisition from its existing cash balances.
MCS is a developer, manufacturer and marketer of in vitro and in vivo electrophysiology instrumentation for extracellular recording and stimulation. This acquisition is complementary to the in vitro electrophysiology line currently offered by the Company’s wholly-owned Warner Instruments subsidiary.
The aggregate purchase price for this acquisition was allocated to tangible and intangible assets acquired as follows:
| (in thousands) | ||||
| Tangible assets | $ | 5,070 | ||
| Liabilities assumed | (1,207 | ) | ||
| Net assets | 3,863 | |||
| Goodwill and intangible assets: | ||||
| Goodwill | 4,117 | |||
| Trade name | 1,008 | |||
| Customer relationships | 1,204 | |||
| Developed technology | 2,452 | |||
| Non-compete agreements | 148 | |||
| Deferred tax liabilities | (1,603 | ) | ||
| Total goodwill and intangible assets, net of tax | 7,326 | |||
| Acquisition purchase price | $ | 11,189 | ||
| F-15 |
Goodwill recorded as a result of the acquisition of MCS is not deductible for tax purposes.
At December 31, 2015, an immaterial correction was made to the allocation of the aggregate purchase price to the tangible and intangible assets acquired to decrease inventory and increase goodwill by $0.4 million. This correction has been reflected in the table above.
The results of operations for MCS have been included in the Company’s consolidated financial statements from the date of acquisition.
The following consolidated pro forma information is based on the assumption that the acquisition of MCS occurred on January 1, 2013. Accordingly, the historical results have been adjusted to reflect amortization expense that would have been recognized on such a pro forma basis. The pro forma information is presented for comparative purposes only and is not necessarily indicative of the financial position or results of operations which would have been reported had we completed the acquisition during these periods or which might be reported in the future.
| Year Ended December 31, | ||||||||
| 2014 | 2013 | |||||||
| (in thousands) | ||||||||
| Pro Forma | ||||||||
| Revenues | $ | 114,066 | $ | 114,300 | ||||
| Net income (loss) | 2,600 | (672 | ) | |||||
Triangle BioSystems, Inc.
On October 1, 2014, the Company acquired all of the issued and outstanding shares of Triangle BioSystems, Inc. (“TBSI”), which has its principal offices in North Carolina, for approximately $2.2 million, including a working capital adjustment, or $1.7 million, net of cash acquired. The Company funded the acquisition from borrowings under its credit facility.
TBSI is a developer, manufacturer and marketer of wireless neural interface equipment to aid in vivo neuroscience research, especially in the fields of electrophysiology, psychology, neurology and pharmacology. This acquisition is complementary to the behavioral neuroscience lines currently offered by the Company’s wholly-owned Panlab and Coulbourn subsidiaries.
The aggregate purchase price for this acquisition was allocated to tangible and intangible assets acquired as follows:
| (in thousands) | ||||
| Tangible assets | $ | 1,278 | ||
| Liabilities assumed | (530 | ) | ||
| Net assets | 748 | |||
| Goodwill and intangible assets: | ||||
| Goodwill | 946 | |||
| Trade name | 143 | |||
| Customer relationships | 308 | |||
| Developed technology | 363 | |||
| Non-compete agreements | 30 | |||
| Deferred tax liabilities | (325 | ) | ||
| Total goodwill and intangible assets, net of tax | 1,465 | |||
| Acquisition purchase price | $ | 2,213 | ||
| F-16 |
The results of operations for TBSI have been included in the Company’s consolidated financial statements from the date of acquisition. The Company considers this acquisition immaterial for the purposes of proforma financial statement disclosures. Goodwill recorded as a result of the acquisition of TBSI is not deductible for tax purposes.
Direct acquisition costs recorded in other expense, net in the Company’s consolidated statements of operations were $1.2 million, $1.1 million and $0 for the years ended December 31, 2015, 2014 and 2013, respectively.
| 8. | Discontinued Operations |
UBI
In September 2008, the Company completed the sale of assets of its Union Biometrica Division (“UBI”) to UBIO Acquisition Company. During 2013, the Company received earn-out payments, including interest, from UBIO Acquisition Company, of $1.8 million related to the 2008 acquisition. The Company received its final payment under the earn-out obligation from UBIO Acquisition Company in October 2013.
Biostage (f/k/a Harvard Apparatus Regenerative Technology, Inc.)
On November 1, 2013, the spin-off of Harvard Apparatus Regenerative Technology, Inc., now known as Biostage, Inc. (“Biostage”), from the Company was completed. Through the spin-off date, the historical operations of HART were reported as continuing operations in the consolidated statements of operations of the Company. Following the spin-off, the historical operations of Biostage have been reclassified and reported as discontinued operations for all periods presented. As a result of the spin-off and related separation, Biostage became an independent company that operates the regenerative medicine business previously owned by Harvard Bioscience. The spin-off was completed through the distribution to Harvard Bioscience’s stockholders of record all of the shares of common stock of Biostage (the “Distribution”). In the Distribution, the Company distributed to its stockholders one share of Biostage common stock for every four shares of Harvard Bioscience common stock outstanding as of the close of business on October 21, 2013, the record date for the Distribution.
Effective with the spin-off, the Company contributed $15.0 million in cash to Biostage to fund its operations. In addition, the Company transferred approximately $0.9 million in assets, made up primarily of property, plant and equipment, to Biostage as part of the spin-off.
Harvard Bioscience intends for the Distribution and related separation, taken together, to qualify as a reorganization pursuant to which no gain or loss is recognized by Harvard Bioscience or its stockholders for federal income tax purposes under Sections 355, 368(a)(1)(D) and related provisions of the Internal Revenue Code. On June 28, 2013, Harvard Bioscience received a Supplemental Ruling to the Private Letter Ruling dated March 22, 2013 from the IRS to the effect that, among other things, the spin-off will qualify as a transaction that is tax-free for U.S. federal income tax purposes under Section 355 and 368(a)(1)(D) of the Internal Revenue Code continuing in effect. Harvard Bioscience has also received an opinion from its outside tax advisor to such effect. In connection with the ruling and the opinion, Harvard Bioscience made certain representations regarding it and its business. The Company and Biostage have each agreed that it will not take or fail to take any action which prevents or could reasonably be expected to prevent the tax-free status of the spin-off. Biostage also agreed to certain specific restrictions that expired two years following the Distribution, and which were intended to preserve the tax-free status of the contribution and the Distribution.
In addition, current U.S. federal income tax law creates a presumption that the spin-off of Biostage would be taxable to the Company, but not its stockholders, if such spin-off is part of a “plan or series of related transactions” pursuant to which one or more persons acquire directly or indirectly stock representing a 50% or greater interest (by vote or value) in the Company or Biostage. Acquisitions that occur during the four-year period that begins two years before the date of the spin-off are presumed to occur pursuant to a plan or series of related transactions, unless it is established that the acquisition is not pursuant to a plan or series of transactions that includes the spin-off. U.S. Treasury regulations currently in effect generally provide that whether an acquisition and a spin-off are part of a plan is determined based on all of the facts and circumstances, including, but not limited to, specific factors described in the U.S. Treasury regulations. In addition, the U.S. Treasury regulations provide several “safe harbors” for acquisitions that are not considered to be part of a plan. These rules limited the Company’s ability during the two-year period following the spin-off to enter into certain transactions that may be advantageous to the Company and its stockholders, particularly issuing equity securities to satisfy financing needs, repurchasing equity securities, disposing of certain assets, engaging in mergers and acquisitions, and, under certain circumstances, acquiring businesses or assets with equity securities or agreeing to be acquired.
| F-17 |
The following table sets forth the impact of discontinued operations on the Company’s consolidated statements of operations for the year ended December 31, 2013.
| Year Ended | ||||
| December 31, | ||||
| 2013 | ||||
| (in thousands) | ||||
| Gain on disposal of discontinued operations, UBI | $ | 440 | ||
| (Loss) from discontinued operations, Biostage | (4,861 | ) | ||
| Income tax (benefit) | (1,868 | ) | ||
| (Loss) from discontinued operations, net of tax | $ | (2,553 | ) | |
| 9. | Goodwill and Other Intangible Assets |
Intangible assets consist of the following:
| December 31, 2015 | December 31, 2014 | Weighted Average Life | (a) | |||||||||||||||||||||
| (in thousands) | ||||||||||||||||||||||||
| Amortizable intangible assets: | Gross | Accumulated Amortization | Gross | Accumulated Amortization | ||||||||||||||||||||
| Existing technology | $ | 16,022 | $ | (11,686 | ) | $ | 15,538 | $ | (11,198 | ) | 7.3 | Years | ||||||||||||
| Trade names | 7,636 | (3,076 | ) | 7,114 | (2,557 | ) | 9.0 | Years | ||||||||||||||||
| Distribution agreements/customer relationships | 23,676 | (11,849 | ) | 22,730 | (10,681 | ) | 9.9 | Years | ||||||||||||||||
| Patents | 245 | (96 | ) | 256 | (49 | ) | 3.2 | Years | ||||||||||||||||
| Total amortizable intangible assets | 47,579 | $ | (26,707 | ) | 45,638 | $ | (24,485 | ) | ||||||||||||||||
| Indefinite-lived intangible assets: | ||||||||||||||||||||||||
| Goodwill | 40,357 | 39,822 | ||||||||||||||||||||||
| Other indefinite-lived intangible assets | 1,223 | 1,252 | ||||||||||||||||||||||
| Total goodwill and other indefinite-lived intangible assets | 41,580 | 41,074 | ||||||||||||||||||||||
| Total intangible assets | $ | 89,159 | $ | 86,712 | ||||||||||||||||||||
(a) Weighted average life as of December 31, 2015.
| F-18 |
The change in the carrying amount of goodwill for the year ended December 31, 2015 is as follows:
| (in thousands) | ||||
| Balance at December 31, 2013 | $ | 36,605 | ||
| Goodwill arising from business combination | 4,691 | |||
| Effect of change in currency translation | (1,474 | ) | ||
| Balance at December 31, 2014 | 39,822 | |||
| Goodwill arising from business combinations | 1,618 | |||
| Adjustment to purchase price allocation of prior year acquisition | 372 | |||
| Effect of change in currency translation | (1,455 | ) | ||
| Balance at December 31, 2015 | $ | 40,357 | ||
Intangible asset amortization expense was $2.8 million, $2.6 million and $2.6 million for the years ended December 31, 2015, 2014 and 2013, respectively. Amortization expense of existing amortizable intangible assets is currently estimated to be $2.8 million for the year ending December 31, 2016, $2.7 million for the year ending December 31, 2017, $2.5 million for the year ending December 31, 2018, $2.3 million for the year ending December 31, 2019 and $2.2 million for the year ending December 31, 2020.
| 10. | Restructuring and Other Exit Costs |
Q4 2015 Restructuring Plan
The Company committed to a restructuring plan on October 27, 2015, which included eliminating certain positions made redundant as a result of its site consolidations, as well as a realignment of its commercial sales team. During the year ended December 31, 2015, the Company recorded restructuring charges related to this plan of approximately $0.2 million. Payments related to this plan are expected to be made through the second quarter of 2016. Activity and liability balances related to these charges were as follows:
| Severance Costs | ||||
| (in thousands) | ||||
| Restructuring charges | $ | 200 | ||
| Cash payments | (110 | ) | ||
| Restructuring balance at December 31, 2015 | $ | 90 | ||
Q2 2015 Restructuring Plan
During the second quarter of 2015, management of Harvard Bioscience initiated a plan to consolidate the manufacturing operations of HEKA Canada to HEKA Germany in order to create organizational efficiencies. No further charges are expected to be incurred on this matter. At December 31, 2015, the Company has no remaining liability related to this plan on its balance sheet. Activity and liability balances related to these charges were as follows:
| Severance Costs | Other | Total | ||||||||||
| (in thousands) | ||||||||||||
| Restructuring charges | $ | 14 | 34 | $ | 48 | |||||||
| Cash payments | (14 | ) | (34 | ) | (48 | ) | ||||||
| Restructuring balance at December 31, 2015 | $ | - | - | $ | - | |||||||
Q1 2015 Restructuring Plan
During the first quarter of 2015, management of Harvard Bioscience initiated a plan to relocate certain manufacturing operations in order to create organizational efficiencies and reduce operating expenses. The 2015 restructuring plan included plans to consolidate the manufacturing operations of its Coulbourn subsidiary to its headquarters in Holliston, MA. During the year ended December 31, 2015, the Company recorded restructuring charges related to this plan of approximately $0.2 million. Payments related to this plan are expected to be made through the first quarter of 2016. Activity and liability balances related to these charges were as follows:
| Severance Costs | Other | Total | ||||||||||
| (in thousands) | ||||||||||||
| Restructuring charges | $ | 126 | 45 | $ | 171 | |||||||
| Non-cash reversal of restructuring charges | (6 | ) | - | (6 | ) | |||||||
| Cash payments | (109 | ) | (45 | ) | (154 | ) | ||||||
| Restructuring balance at December 31, 2015 | $ | 11 | - | $ | 11 | |||||||
| F-19 |
2014 Restructuring Plan
During the fourth quarter of 2014, management of Harvard Bioscience initiated a plan to relocate certain distribution and manufacturing operations in order to create organizational efficiencies and reduce operating expenses. The 2014 restructuring plan included plans to relocate the distribution operations of the Company’s Denville Scientific subsidiary from New Jersey to North Carolina, as well as consolidating the manufacturing operations of its Biochrom subsidiary to its headquarters in Holliston, MA. Payments related to this plan are expected to be made through the first quarter of 2016. Activity and liability balances related to these charges were as follows:
| Severance Costs | Other | Total | ||||||||||
| (in thousands) | ||||||||||||
| Restructuring charges | $ | 655 | $ | - | $ | 655 | ||||||
| Cash payments | (29 | ) | - | (29 | ) | |||||||
| Restructuring balance at December 31, 2014 | 626 | - | 626 | |||||||||
| Restructuring charges | 94 | 360 | 454 | |||||||||
| Non-cash reversal of restructuring charges | (79 | ) | - | (79 | ) | |||||||
| Cash payments | (600 | ) | (360 | ) | (960 | ) | ||||||
| Effect of change in currency translation | (10 | ) | - | (10 | ) | |||||||
| Restructuring balance at December 31, 2015 | $ | 31 | $ | - | $ | 31 | ||||||
2013 Restructuring Plan
During the fourth quarter of 2013, the management of Harvard Bioscience initiated a plan to realign global operations to improve organizational efficiencies and reduce operating expenses throughout the Company. The plan included an approximately 13% reduction in the workforce, as well as the elimination of the position of Chief Operating Officer. No further charges are expected to be incurred on this matter. At December 31, 2014, the Company had no remaining liability related to this plan on its balance sheet. Activity and liability balances related to these charges were as follows:
| Severance and | Fixed Asset | |||||||||||||||
| Related Costs | Write Offs | Other | Total | |||||||||||||
| (in thousands) | ||||||||||||||||
| Restructuring charges | $ | 2,100 | $ | - | $ | - | $ | 2,100 | ||||||||
| Cash payments | (666 | ) | - | - | (666 | ) | ||||||||||
| Restructuring balance at December 31, 2013 | 1,434 | - | - | 1,434 | ||||||||||||
| Restructuring charges | 199 | 13 | 293 | 505 | ||||||||||||
| Non-cash reversal of restructuring charges | (117 | ) | (13 | ) | - | (130 | ) | |||||||||
| Cash payments | (1,516 | ) | - | (293 | ) | (1,809 | ) | |||||||||
| Restructuring balance at December 31, 2014 | $ | - | $ | - | $ | - | $ | - | ||||||||
As part of the fourth quarter 2013 restructuring plan, the Company decided to close one of its facilities in the United Kingdom. During the fourth quarter of 2014, the facility was sold. The gain of $0.8 million was recorded in a separate line in the Company’s statements of operations within operating expenses.
During the third quarter of 2013, the management of Harvard Bioscience initiated a plan to reduce operating expenses at one of its foreign subsidiaries. No further charges are expected to be incurred on this matter. As of December 31, 2013, the Company had no remaining liability related to this plan on its balance sheet. Activity and liability balances related to these charges were as follows:
| Severance | ||||
| and Related Costs | ||||
| (in thousands) | ||||
| Restructuring charges | $ | 96 | ||
| Cash payments | (96 | ) | ||
| Restructuring balance at December 31, 2013 | $ | - | ||
| F-20 |
2012 Restructuring Plan
During 2012, the management of Harvard Bioscience initiated a plan to reduce operating expenses at one of its foreign subsidiaries. No further charges are expected to be incurred on this matter. At December 31, 2014, the Company had no remaining liability related to this plan on its balance sheet. Activity and liability balances related to these charges were as follows:
| Severance and | ||||||||||||
| Related Costs | Other | Total | ||||||||||
| (in thousands) | ||||||||||||
| Restructuring balance at December 31, 2012 | $ | 133 | $ | 11 | $ | 144 | ||||||
| Cash payments | (84 | ) | (11 | ) | (95 | ) | ||||||
| Non-cash reversal of restructuring charges | (46 | ) | - | (46 | ) | |||||||
| Restructuring balance at December 31, 2013 | 3 | - | 3 | |||||||||
| Non-cash reversal of restructuring charges | (3 | ) | - | (3 | ) | |||||||
| Restructuring balance at December 31, 2014 | $ | - | $ | - | $ | - | ||||||
Aggregate net restructuring charges for the years ended December 31, 2015, 2014 and 2013 were as follows:
| Year Ended December 31, | ||||||||||||
| 2015 | 2014 | 2013 | ||||||||||
| (in thousands) | ||||||||||||
| Restructuring charges | $ | 788 | $ | 1,027 | $ | 2,150 | ||||||
| 11. | Long Term Debt |
On August 7, 2009, the Company entered into an Amended and Restated Revolving Credit Loan Agreement related to a $20.0 million revolving credit facility with Bank of America, as agent, and Bank of America and Brown Brothers Harriman & Co as lenders (as amended, the “2009 Credit Agreement”). On September 30, 2011, the Company entered into the First Amendment to the Amended and Restated Revolving Credit Loan Agreement (the “First Amendment”) with Bank of America as agent, and Bank of America and Brown Brothers Harriman & Co as lenders. The First Amendment extended the maturity date of the credit facility to August 7, 2013 and reduced the interest rate to the London Interbank Offered Rate plus 3.0%. On October 4, 2012, the Company entered into the Second Amendment to the Amended and Restated Revolving Credit Loan Agreement (the “Second Amendment”) with Bank of America as agent, and Bank of America and Brown Brothers Harriman & Co as lenders. The Second Amendment extended the maturity date of the credit facility to August 7, 2014.
On March 29, 2013, the Company entered into a Second Amended and Restated Revolving Credit Agreement (as amended, the “Credit Agreement”) with Bank of America, as agent, and Bank of America and Brown Brothers Harriman & Co as lenders, that amended and restated the 2009 Credit Agreement. The Credit Agreement converted the Company’s existing outstanding revolving advances into a term loan in the principal amount of $15.0 million (the “Term Loan”), provides a revolving credit facility in the maximum principal amount of $25.0 million (“Revolving Line”) and provides a delayed draw term loan of up to $15.0 million (the “DDTL”) to fund capital contributions to the Company’s former subsidiary, Biostage. The maximum amount available under the Credit Agreement is $50.0 million as borrowings against the DDTL in excess of $10.0 million results in a dollar for dollar reduction in the Revolving Line capacity. The Revolving Line, Term Loan and DDTL each have a maturity date of March 29, 2018 (the maturity date of the Revolving Line was extended from March 29, 2016 in connection with the Third Amendment discussed below).
On October 31, 2013, the Company amended the Credit Agreement to reduce the DDTL from up to $15.0 million to up to $10.0 million and allow for an additional $5.0 million to be available for drawing as advances under the Revolving Line.
On April 24, 2015, the Company entered into the Third Amendment to the Second Amended and Restated Credit Agreement (the “Third Amendment”). The Third Amendment extended the maturity date of the Revolving Line to March 29, 2018 and reduced the interest rates on the Revolving Line, Term Loan and DDTL. Borrowings under the Term Loan and the DDTL accrued interest at a rate based on either the effective London Interbank Offered Rate (LIBOR) for certain interest periods selected by the Company, or a daily floating rate based on the British Bankers’ Association (BBA) LIBOR as published by Reuters (or other commercially available source providing quotations of BBA LIBOR), plus in either case, a margin of 2.75%. Additionally, the Revolving Line accrued interest at a rate based on either the effective LIBOR for certain interest periods selected by the Company, or a daily floating rate based on the BBA LIBOR, plus in either case, a margin of 2.25%. The Company was required to fix the rate of interest on at least 50% of the Term Loan and the DDTL through the purchase of interest rate swaps. The Term Loan and DDTL each have interest payments due at the end of the applicable LIBOR period, or monthly with respect to BBA LIBOR borrowings, and principal payments due quarterly. The Revolving Line has interest payments due at the end of the applicable LIBOR period, or monthly with respect to BBA LIBOR borrowings.
| F-21 |
On June 30, 2015, the Company entered into the Fourth Amendment to the Second Amended and Restated Credit Agreement, which amended the Company’s quarterly minimum fixed charge coverage financial covenant.
On November 5, 2015, the Company entered into the Fifth Amendment to the Second Amended and Restated Credit Agreement, which eliminated the Company’s 2015 fourth quarter minimum fixed charge coverage financial covenant requirement. As part of the agreement, the maximum principal amount on the Revolving Line was reduced to $10.0 million until June 30, 2016, at which time, the maximum principal amount will be restored to $25.0 million, as long as the Company remains in compliance with all covenants.
On March 9, 2016, the Company entered into the Sixth Amendment to the Second Amended and Restated Credit Agreement, which amended the principal payment amortization of the Term Loan and DDTL to five years, as well as amended the Company’s quarterly minimum fixed charge coverage financial covenant.
The loans evidenced by the Credit Agreement, or the Loans, are guaranteed by all of the Company’s direct and indirect domestic subsidiaries, and secured by substantially all of the assets of the Company and the guarantors. The Loans are subject to restrictive covenants under the Credit Agreement, and financial covenants that require the Company and its subsidiaries to maintain certain financial ratios on a consolidated basis, including a maximum leverage, minimum fixed charge coverage and minimum working capital. Prepayment of the Loans is allowed by the Credit Agreement at any time during the terms of the Loans. The Loans also contain limitations on the Company’s ability to incur additional indebtedness and requires lender approval for acquisitions funded with cash, promissory notes and/or other consideration in excess of $6.0 million and for acquisitions funded solely with equity in excess of $10.0 million.
As of December 31, 2015 and December 31, 2014, the Company had borrowings of $18.9 million and $21.5 million, respectively, outstanding under its Credit Agreement. As of December 31, 2015, the Company was in compliance with all financial covenants contained in the Credit Agreement, was subject to covenant and working capital borrowing restrictions and had available borrowing capacity under its Credit Agreement of $2.3 million.
As of December 31, 2015, the weighted effective interest rates, net of the impact of the Company’s interest rate swaps, on its Term Loan, DDTL and Revolving Line borrowings were 3.96%, 3.55% and 2.67%, respectively.
As of December 31, 2015 and December 31, 2014, the Company’s borrowings were comprised of:
| December 31, | December 31, | |||||||
| 2015 | 2014 | |||||||
| (in thousands) | ||||||||
| Long-term debt: | ||||||||
| Term loan | $ | 6,750 | $ | 9,750 | ||||
| DDTL | 5,500 | 7,500 | ||||||
| Revolving line | 6,650 | 4,200 | ||||||
| Total debt | 18,900 | 21,450 | ||||||
| Less: current installments | (2,450 | ) | (5,000 | ) | ||||
| Long-term debt | $ | 16,450 | $ | 16,450 | ||||
The aggregate amounts of debt maturing during the next five years are as follows:
| (in thousands) | ||||
| 2016 | $ | 2,450 | ||
| 2017 | 2,450 | |||
| 2018 | 14,000 | |||
| 2019 | - | |||
| 2020 | - | |||
| Total | $ | 18,900 | ||
| F-22 |
| 12. | Derivatives |
The Company uses interest-rate-related derivative instruments to manage its exposure related to changes in interest rates on its variable-rate debt instruments. The Company does not enter into derivative instruments for any purpose other than cash flow hedging. The Company does not speculate using derivative instruments.
By using derivative financial instruments to hedge exposures to changes in interest rates, the Company exposes itself to credit risk and market risk. Credit risk is the failure of the counterparty to perform under the terms of the derivative contract. When the fair value of a derivative contract is positive, the counterparty owes the Company, which creates credit risk for the Company. When the fair value of a derivative contract is negative, the Company owes the counterparty and, therefore, the Company is not exposed to the counterparty’s credit risk in those circumstances. The Company minimizes counterparty credit risk in derivative instruments by entering into transactions with carefully selected major financial institutions based upon their credit profile.
Market risk is the adverse effect on the value of a derivative instrument that results from a change in interest rates. The market risk associated with interest-rate contracts is managed by establishing and monitoring parameters that limit the types and degree of market risk that may be undertaken.
The Company assesses interest rate risk by continually identifying and monitoring changes in interest rate exposures that may adversely impact expected future cash flows and by evaluating hedging opportunities. The Company maintains risk management control systems to monitor interest rate risk attributable to both the Company’s outstanding or forecasted debt obligations as well as the Company’s offsetting hedge positions. The risk management control systems involve the use of analytical techniques, including cash flow sensitivity analysis, to estimate the expected impact of changes in interest rates on the Company’s future cash flows.
The Company uses variable-rate London Interbank Offered Rate (LIBOR) debt to finance its operations. The debt obligations expose the Company to variability in interest payments due to changes in interest rates. Management believes that it is prudent to limit the variability of a portion of its interest payments. To meet this objective, management enters into LIBOR based interest rate swap agreements to manage fluctuations in cash flows resulting from changes in the benchmark interest rate of LIBOR. These swaps change the variable-rate cash flow exposure on the debt obligations to fixed cash flows. Under the terms of the interest rate swaps, the Company receives LIBOR based variable interest rate payments and makes fixed interest rate payments, thereby creating the equivalent of fixed-rate debt for the notional amount of its debt hedged. In accordance with its Credit Agreement, the Company was required to fix the rate of interest on at least 50% of its Term Loan and the DDTL through the purchase of interest rate swaps. On June 5, 2013, the Company entered into an interest rate swap contract with an original notional amount of $15.0 million and a maturity date of March 29, 2018 in order to hedge the risk of changes in the effective benchmark interest rate (LIBOR) associated with the Company’s Term Loan. On November 29, 2013, the Company entered into a second interest rate swap contract with an original notional amount of $5.0 million and a maturity date of March 29, 2018 in order to hedge the risk of changes in the effective benchmark interest rate (LIBOR) associated with the DDTL. The notional amount of the Company’s derivative instruments as of December 31, 2015 was $9.5 million. The Term Loan swap contract effectively converted specific variable-rate debt into fixed-rate debt and fixed the LIBOR rate associated with the Term Loan at 0.96% plus a bank margin of 3.0%. The DDTL swap contract effectively converted specific variable-rate debt into fixed-rate debt and fixed the LIBOR rate associated with the Term Loan at 0.93% plus a bank margin of 3.0%.The interest rate swaps were designated as cash flow hedges in accordance with ASC 815, Derivatives and Hedging.
| F-23 |
The following table presents the notional amount and fair value of the Company’s derivative instruments as of December 31, 2015 and December 31, 2014.
| December 31, 2015 Notional Amount | December 31, 2015 Fair Value (a) | |||||||||||
| Derivatives designated as hedging instruments under ASC 815 | Balance sheet classification | (in thousands) | ||||||||||
| Interest rate swaps | Other liabilities-non current | $ | 9,500 | $ | (10 | ) | ||||||
| December 31, 2014 Notional Amount | December 31, 2014 Fair Value (a) | |||||||||||
| Derivatives designated as hedging instruments under ASC 815 | Balance sheet classification | (in thousands) | ||||||||||
| Interest rate swaps | Other liabilities-non current | $ | 13,500 | $ | (18 | ) | ||||||
(a) See Note 13 for the fair value measurements related to these financial instruments.
All of the Company’s derivative instruments are designated as hedging instruments.
The Company has structured its interest rate swap agreements to be 100% effective and as a result, there was no impact to earnings resulting from hedge ineffectiveness. Changes in the fair value of interest rate swaps designated as hedging instruments that effectively offset the variability of cash flows associated with variable-rate, long-term debt obligations are reported in accumulated other comprehensive income (“AOCI”). These amounts subsequently are reclassified into interest expense as a yield adjustment of the hedged interest payments in the same period in which the related interest affects earnings. The Company’s interest rate swap agreement was deemed to be fully effective in accordance with ASC 815, and, as such, unrealized gains and losses related to these derivatives were recorded as AOCI.
The following table summarizes the effect of derivatives designated as cash flow hedging instruments and their classification within comprehensive loss for the years ended December 31, 2015, 2014 and 2013:
| Derivatives in Hedging Relationships | Amount of gain or (loss) recognized in OCI on derivative (effective portion) | |||||||||||
| Year Ended December 31, | ||||||||||||
| 2015 | 2014 | 2013 | ||||||||||
| (in thousands) | ||||||||||||
| Interest rate swaps | $ | (85 | ) | $ | (99 | ) | $ | (116 | ) | |||
The following table summarizes the reclassifications out of accumulated other comprehensive loss for the years ended December 31, 2015, 2014 and 2013:
| Details about AOCI Components | Amount reclassified from AOCI into income (effective portion) | Location of amount | ||||||||||||||
| Year Ended December 31, | reclassified from AOCI | |||||||||||||||
| 2015 | 2014 | 2013 | into income (effective portion) | |||||||||||||
| (in thousands) | ||||||||||||||||
| Interest rate swaps | $ | 93 | $ | 130 | $ | 67 | Interest expense | |||||||||
As of December 31, 2015, $24,000 of deferred losses on derivative instruments accumulated in AOCI are expected to be reclassified to earnings during the next twelve months. Transactions and events expected to occur over the next twelve months that will necessitate reclassifying these derivatives’ losses to earnings include the repricing of variable-rate debt. There were no cash flow hedges discontinued during 2015 or 2014.
| F-24 |
| 13. | Fair Value Measurements |
Fair value measurement is defined as the price that would be received to sell an asset or paid to transfer a liability in the principal or most advantageous market for the asset or liability in an orderly transaction between market participants at the measurement date. A fair value hierarchy is established, which prioritizes the inputs used in measuring fair value into three broad levels as follows:
Level 1—Quoted prices in active markets for identical assets or liabilities.
Level 2—Inputs, other than the quoted prices in active markets, that are observable either directly or indirectly.
Level 3—Unobservable inputs based on the Company’s own assumptions.
The following tables present the fair value hierarchy for those liabilities measured at fair value on a recurring basis:
| Fair Value as of December 31, 2015 | ||||||||||||||||
| (In thousands) | Level 1 | Level 2 | Level 3 | Total | ||||||||||||
| Liabilities: | ||||||||||||||||
| Interest rate swap agreements | $ | - | $ | 10 | $ | - | $ | 10 | ||||||||
| Fair Value as of December 31, 2014 | ||||||||||||||||
| (In thousands) | Level 1 | Level 2 | Level 3 | Total | ||||||||||||
| Liabilities: | ||||||||||||||||
| Interest rate swap agreements | $ | - | $ | 18 | $ | - | $ | 18 | ||||||||
The Company uses the market approach technique to value its financial liabilities. The Company’s financial liabilities carried at fair value include derivative instruments used to hedge the Company’s interest rate risks. The fair value of the Company’s interest rate swap agreements was based on LIBOR yield curves at the reporting date.
| 14. | Leases |
The Company has noncancelable operating leases for office and warehouse space expiring at various dates through 2020 and thereafter. Rent expense, which is recorded on a straight-line basis, was $2.1 million, $1.7 million and $1.3 million for the years ended December 31, 2015, 2014 and 2013, respectively.
Future minimum lease payments for operating leases, with initial or remaining terms in excess of one year at December 31, 2015, are as follows:
| Operating | ||||
| Leases | ||||
| (in thousands) | ||||
| 2016 | $ | 1,843 | ||
| 2017 | 1,749 | |||
| 2018 | 1,727 | |||
| 2019 | 1,526 | |||
| 2020 | 1,527 | |||
| Thereafter | 4,193 | |||
| Net minimum lease payments | $ | 12,565 | ||
| F-25 |
| 15. | Accrued Expenses |
Accrued expenses consist of:
| December 31, | ||||||||
| 2015 | 2014 | |||||||
| (in thousands) | ||||||||
| Accrued compensation and payroll | $ | 1,264 | $ | 1,824 | ||||
| Accrued professional fees | 1,055 | 761 | ||||||
| Accrued severance | 132 | 626 | ||||||
| Warranty costs | 147 | 240 | ||||||
| Other | 1,423 | 1,001 | ||||||
| Total | $ | 4,021 | $ | 4,452 | ||||
| 16. | Income Tax |
Income tax expense (benefit) attributable to income from continuing operations for the years ended December 31, 2015, 2014 and 2013 consisted of:
| Year Ended December 31, | ||||||||||||
| 2015 | 2014 | 2013 | ||||||||||
| (in thousands) | ||||||||||||
| Current income tax expense (benefit): | ||||||||||||
| Federal and state | $ | (4 | ) | $ | 27 | $ | 47 | |||||
| Foreign | 677 | 424 | 413 | |||||||||
| 673 | 451 | 460 | ||||||||||
| Deferred income tax expense (benefit): | ||||||||||||
| Federal and state | 15,598 | 1,793 | (594 | ) | ||||||||
| Foreign | (840 | ) | (182 | ) | (154 | ) | ||||||
| 14,758 | 1,611 | (748 | ) | |||||||||
| Total income tax expense (benefit) | $ | 15,431 | $ | 2,062 | $ | (288 | ) | |||||
Income tax expense (benefit) for the years ended December 31, 2015, 2014 and 2013 differed from the amount computed by applying the U.S. federal income tax rate of 34% to pre-tax continuing operations income as a result of the following:
| Year Ended December 31, | ||||||||||||
| 2015 | 2014 | 2013 | ||||||||||
| (in thousands) | ||||||||||||
| Computed "expected" income tax (benefit) expense | $ | (1,227 | ) | $ | 1,503 | $ | 147 | |||||
| Increase (decrease) in income taxes resulting from: | ||||||||||||
| Permanent differences, net | 32 | (93 | ) | 482 | ||||||||
| Foreign tax rate differential | (12 | ) | (364 | ) | (64 | ) | ||||||
| State income taxes, net of federal income tax benefit | 82 | 22 | 6 | |||||||||
| Non-deductible stock compensation expense | (161 | ) | 67 | 1 | ||||||||
| Impact of prior year pension deductions | - | - | (294 | ) | ||||||||
| Impact of foreign rate change | 89 | - | - | |||||||||
| Tax credits | (169 | ) | (385 | ) | (615 | ) | ||||||
| Change in reserve for uncertain tax position | 35 | - | - | |||||||||
| Impact of change to prior year tax accruals | 370 | - | - | |||||||||
| Change in valuation allowance allocated to income | ||||||||||||
| tax expense (benefit) | 16,401 | 1,346 | 31 | |||||||||
| Other | (9 | ) | (34 | ) | 18 | |||||||
| Total income tax expense (benefit) | $ | 15,431 | $ | 2,062 | $ | (288 | ) | |||||
Certain prior year amounts in the above table have been reclassified for consistency with the current year presentation. These reclassifications had no effect on the Company’s consolidated financial statements.
| F-26 |
Income tax expense (benefit) is based on the following pre-tax income from continuing operations for the years ended December 31, 2015, 2014 and 2013:
| Year Ended December 31, | ||||||||||||
| 2015 | 2014 | 2013 | ||||||||||
| (in thousands) | ||||||||||||
| Domestic | $ | (3,331 | ) | $ | 1,846 | $ | (2,549 | ) | ||||
| Foreign | (277 | ) | 2,571 | 2,984 | ||||||||
| Total | $ | (3,608 | ) | $ | 4,417 | $ | 435 | |||||
The tax effects of temporary differences that give rise to significant components of the deferred tax assets and deferred tax liabilities from continuing operations at December 31, 2015 and 2014 are as follows:
| December 31, | ||||||||
| 2015 | 2014 | |||||||
| (in thousands) | ||||||||
| Deferred tax assets: | ||||||||
| Accounts receivable | $ | 45 | $ | 45 | ||||
| Inventory | 1,447 | 1,416 | ||||||
| Operating loss and credit carryforwards | 14,456 | 12,803 | ||||||
| Accrued expenses | 125 | 188 | ||||||
| Pension liabilities | 535 | 889 | ||||||
| Contingent consideration | 2,987 | 2,806 | ||||||
| Tax credits on repatriation | 1,728 | - | ||||||
| Other assets | 2,079 | 1,832 | ||||||
| Total gross deferred assets | 23,402 | 19,979 | ||||||
| Less: valuation allowance | (18,823 | ) | (2,423 | ) | ||||
| Deferred tax assets | $ | 4,579 | $ | 17,556 | ||||
| Deferred tax liabilities: | ||||||||
| Indefinite-lived intangible assets | $ | 4,593 | $ | 4,291 | ||||
| Definite-lived intangible assets | 2,587 | 1,730 | ||||||
| Property, plant and equipment | - | 27 | ||||||
| Accrued tax liability on repatriation | 1,728 | - | ||||||
| Other accrued liabilities | 655 | 383 | ||||||
| Total deferred tax liabilities | 9,563 | 6,431 | ||||||
| Net deferred tax (liabilities) assets | $ | (4,984 | ) | $ | 11,125 | |||
The Company’s deferred tax assets in the table above as of December 31, 2015 and December 31, 2014, do not include reductions of $0.9 million and $0.2 million, respectively, related to excess tax benefits from the exercise of employee stock options that are a component of net operating losses as these benefits can only be recognized when the related tax deduction reduces income taxes payable.
The amounts recorded as deferred tax assets as of December 31, 2015 and 2014 represent the amount of tax benefits of existing deductible temporary differences and carryforwards that are more likely than not to be realized through the generation of sufficient future taxable income within the carryforward period. Significant management judgment is required in determining any valuation allowance recorded against deferred tax assets and liabilities. During the year ended December 31, 2015, the Company determined that it was more likely than not that its U.S. deferred tax assets would not be realized and therefore recorded a net increase to the valuation allowance of $16.4 million to offset U.S. deferred tax assets net of deferred tax liabilities except for certain indefinite-lived intangible assets. The Company’s judgment was based on consideration of all available evidence.
At December 31, 2015, the Company had federal and state net operating loss carryforwards available to offset future taxable income of approximately $29.6 million. The operating loss carryforwards will begin to expire in 2016. Furthermore, the Company had foreign operating loss carryforwards to offset future taxable income of approximately $7.2 million, which can be carried forward indefinitely. The Company also had federal and state general business and minimum tax credit carryforwards available to reduce future federal and state regular income taxes of approximately $4.6 million, which begin to expire in 2016. Approximately $5.4 million of net operating losses are subject to an annual limitation of $0.7 million imposed by change in ownership provisions of Section 382 of the Internal Revenue Code. As mentioned above, these net operating loss and credit carryforwards have full valuation allowances set up against them.
| F-27 |
Undistributed earnings of the Company’s foreign subsidiaries amounted to approximately $48.7 million, $51.9 million, and $49.2 million at December 31, 2015, 2014 and 2013, respectively. At December 31, 2015 and 2014, cash and cash equivalents held by the Company’s foreign subsidiaries was $5.7 million and $12.7 million, respectively. Funds held by the Company’s foreign subsidiaries are not available for domestic operations unless the funds are repatriated. If the Company planned to or did repatriate these funds, then U.S. federal and state income taxes would have to be recorded on such amounts. The Company’s reinvestment determination is based on the future operational and capital requirements of its U.S. and non-U.S. operations. As of December 31, 2015, the Company determined that the assertion of permanent reinvestment at its foreign subsidiaries in Canada and France was no longer appropriate and it intends to repatriate approximately $3.2 million. The total tax liability associated with the intention to repatriate undistributed earnings in Canada and France is estimated to be approximately $1.7 million, however the liability is expected to be entirely offset by the foreign tax credits generated from the repatriation. The Company currently has no plans and does not intend to repatriate any of its undistributed foreign earnings in any other countries outside of Canada and France. These balances are considered permanently reinvested and will be used for foreign items including foreign acquisitions, capital investments, pension obligations and operations. It is impracticable to estimate the total tax liability, if any, which would be created by the future distribution of these earnings. In October of 2014, the Company acquired all issued and outstanding shares of MCS, a German manufacturer, and utilized approximately $11.2 million of foreign cash on hand to do so. In January of 2015, the Company acquired all issued and outstanding shares of HEKA, a manufacturer with operations in Germany and Canada, utilizing approximately $5.9 million of foreign cash on hand. In 2015, the Company also used $0.3 million of foreign cash on hand for capital improvements at AHN, a German manufacturer.
During 2010, the Company completed an analysis of its research and development credit carryforwards and determined that due to certain documentation requirements to substantiate the credit, an uncertain tax liability of $0.2 million should be recorded. No penalties or interest have been accrued on this liability because the credits have not yet been utilized. Also, as part of the acquisition of TBSI, the Company acquired approximately $59,000 of uncertain tax liabilities related to certain potentially nondeductible expenses reflected in previously filed pre-acquisition tax returns. In 2015, the Company reviewed prior year transfer pricing on intercompany transactions including services and determined the need for a tax reserve in the amount of $35,000. Tax attribute carryforwards would be adjusted upon settlement of these liabilities, except those relating to pre-acquisition tax returns, which would require cash payments. A reconciliation of uncertain tax liabilities is as follows:
| (in thousands) | ||||
| Balance at December 31, 2013 | $ | 191 | ||
| Additions based on tax positions of acquired entities | 59 | |||
| Balance at December 31, 2014 | 250 | |||
| Additions based on tax positions of prior years | 35 | |||
| Balance at December 31, 2015 | $ | 285 | ||
The Company or one of its subsidiaries files income tax returns in the U.S. federal jurisdiction, and various states and foreign jurisdictions. With few exceptions, the Company is no longer subject to income tax examinations by tax authorities for years before 2011. During 2013, the Company closed its IRS audit for the 2009 and 2010 tax years. There were no material adjustments. During 2014 the Company closed its audit for tax years 2009 and 2010 by the Massachusetts Department of Revenue with no material adjustments. The Company’s Canadian subsidiary audit by the Canadian Revenue Agency for the 2011 tax year was closed in February 2015 with no adjustments. During 2015, one of the Company’s German subsidiaries began an income tax audit. As of December 31, 2015, there were no material adjustments. In June 2015, the Company’s acquired German subsidiary, HEKA, closed an income tax audit for 2008-2012 with no material adjustments. Also, HEKA began an income tax audit for tax years 2013-2014 in November 2015. As of December 31, 2015, no issues have been raised. The Company is not aware of any tax audits in other major jurisdictions.
During 2013, the Company spun off its Biostage subsidiary. All related carryforward tax attributes remained with Harvard Bioscience.
| F-28 |
| 17. | Employee Benefit Plans |
The Company sponsors profit sharing retirement plans for its U.S. employees, which includes employee savings plans established under Section 401(k) of the U.S. Internal Revenue Code (the “401(k) Plans”). The 401(k) Plans cover substantially all full-time employees who meet certain eligibility requirements. Contributions to the profit sharing retirement plans are at the discretion of management. For the years ended December 31, 2015, 2014 and 2013, the Company contributed approximately $0.5 million, $0.5 million and $0.6 million, respectively, to the 401(k) Plans.
Certain of the Company’s subsidiaries in the United Kingdom, Harvard Apparatus Limited and Biochrom, maintain contributory, defined benefit or defined contribution pension plans for substantially all of their employees. As of December 31, 2014, the principal employer of the Harvard Apparatus Limited pension plan was changed from Harvard Apparatus Limited to Biochrom. As of December 31, 2014, these defined benefit pension plans were closed to new employees, as well as closed to the future accrual of benefits for existing employees. The provisions of FASB ASC 715-20 require that the funded status of the Company’s pension plans be recognized in its balance sheet. FASB ASC 715-20 does not change the measurement or income statement recognition of these plans, although it does require that plan assets and benefit obligations be measured as of the balance sheet date. The Company has historically measured the plan assets and benefit obligations as of the balance sheet date.
The components of the Company’s defined benefit pension expense were as follows:
| Year Ended December 31, | ||||||||||||
| 2015 | 2014 | 2013 | ||||||||||
| (in thousands) | ||||||||||||
| Components of net periodic benefit cost: | ||||||||||||
| Service cost | $ | - | $ | - | $ | 288 | ||||||
| Interest cost | 711 | 893 | 797 | |||||||||
| Expected return on plan assets | (668 | ) | (649 | ) | (524 | ) | ||||||
| Net amortization loss | 306 | 259 | 305 | |||||||||
| Curtailment gain | - | - | (197 | ) | ||||||||
| Net periodic benefit cost | $ | 349 | $ | 503 | $ | 669 | ||||||
The measurement date is December 31 for these plans. The funded status of the Company’s defined benefit pension plans and the amount recognized in the consolidated balance sheets at December 31, 2015 and 2014 is as follows:
| December 31, | ||||||||
| 2015 | 2014 | |||||||
| (in thousands) | ||||||||
| Change in benefit obligation: | ||||||||
| Balance at beginning of year | $ | 21,170 | $ | 20,403 | ||||
| Interest cost | 711 | 893 | ||||||
| Participants' contributions | - | 5 | ||||||
| Actuarial (gain) loss | (1,360 | ) | 1,628 | |||||
| Benefits paid | (1,021 | ) | (457 | ) | ||||
| Currency translation adjustment | (918 | ) | (1,302 | ) | ||||
| Balance at end of year | $ | 18,582 | $ | 21,170 | ||||
| December 31, | ||||||||
| 2015 | 2014 | |||||||
| (in thousands) | ||||||||
| Change in fair value of plan assets: | ||||||||
| Balance at beginning of year | $ | 16,724 | $ | 15,540 | ||||
| Actual return on plan assets | 70 | 1,119 | ||||||
| Participants' contributions | - | 5 | ||||||
| Employer contributions | 752 | 1,546 | ||||||
| Benefits paid | (1,021 | ) | (457 | ) | ||||
| Currency translation adjustment | (758 | ) | (1,029 | ) | ||||
| Balance at end of year | $ | 15,767 | $ | 16,724 | ||||
| F-29 |
| December 31, | ||||||||
| 2015 | 2014 | |||||||
| (in thousands) | ||||||||
| Change in benefit obligation: | ||||||||
| Funded status | $ | (2,815 | ) | $ | (4,446 | ) | ||
| Unrecognized net loss | N/A | N/A | ||||||
| Net amount recognized | $ | (2,815 | ) | $ | (4,446 | ) | ||
The accumulated benefit obligation for all defined benefit pension plans was $18.6 million and $21.2 million at December 31, 2015 and 2014, respectively.
The amounts recognized in the consolidated balance sheets consist of:
| December 31, | ||||||||
| 2015 | 2014 | |||||||
| (in thousands) | ||||||||
| Deferred income tax assets | $ | 535 | $ | 889 | ||||
| Other long term liabilities | (2,815 | ) | (4,446 | ) | ||||
| Net amount recognized | $ | (2,280 | ) | $ | (3,557 | ) | ||
The amounts recognized in accumulated other comprehensive loss, net of tax consist of:
| December 31, | ||||||||
| 2015 | 2014 | |||||||
| (in thousands) | ||||||||
| Underfunded status of pension plans | $ | (2,280 | ) | $ | (3,557 | ) | ||
| Net amount recognized | $ | (2,280 | ) | $ | (3,557 | ) | ||
The weighted average assumptions used in determining the net pension cost for these plans follows:
| Year Ended December 31, | ||||||||||||
| 2015 | 2014 | 2013 | ||||||||||
| Discount rate | 3.57 | % | 4.43 | % | 4.43 | % | ||||||
| Expected return on assets | 4.43 | % | 4.15 | % | 3.79 | % | ||||||
| Rate of compensation increase | 0.00 | % | 0.00 | % | 2.99 | % | ||||||
The discount rate assumptions used for pension accounting reflect the prevailing rates available on high-quality, fixed-income debt instruments with terms that match the average expected duration of the Company’s defined benefit pension plan obligations. The Company uses the iBoxx AA 15yr+ index, which matches the average duration of its pension plan liability of approximately 15 years. With the current base of assets in the pension plans, a 0.1% increase/decrease in the discount rate assumption would decrease/increase annual pension expense by approximately $56,000.
The Company’s mix of pension plan investments among asset classes also affects the long-term expected rate of return on plan assets. As of December 31, 2015, the Company’s actual asset mix approximated its target mix. Differences between actual and expected returns are recognized in the calculation of net periodic pension (income)/cost over the average remaining expected future working lifetime, which is approximately 15 years, of active plan participants. With the current base of assets, a 0.1% increase/decrease in the asset return assumption would decrease/increase annual pension expense by approximately $16,000.
| F-30 |
The fair value and asset allocations of the Company’s pension benefits as of December 31, 2015 and 2014 measurement dates were as follows:
| December 31, | ||||||||||||||||
| 2015 | 2014 | |||||||||||||||
| (in thousands) | ||||||||||||||||
| Asset category: | ||||||||||||||||
| Equity securities | $ | 8,506 | 54 | % | $ | 8,145 | 49 | % | ||||||||
| Debt securities | 7,103 | 45 | % | 7,260 | 43 | % | ||||||||||
| Cash and cash equivalents | 158 | 1 | % | 1,319 | 8 | % | ||||||||||
| Total | $ | 15,767 | 100 | % | $ | 16,724 | 100 | % | ||||||||
Financial reporting standards define a fair value hierarchy that consists of three levels. The fair values of the plan assets by fair value hierarchy level as of December 31, 2015 and 2014 is as follows:
| December 31, | ||||||||
| 2015 | 2014 | |||||||
| (in thousands) | ||||||||
| Quoted Prices in Active Markets for Identical Assets (Level 1) | $ | 158 | $ | 1,319 | ||||
| Significant Other Observable Inputs (Level 2) | 15,609 | 15,405 | ||||||
| Significant Other Unobservable Inputs (Level 3) | - | - | ||||||
| Total | $ | 15,767 | $ | 16,724 | ||||
Level 1 assets consist of cash and cash equivalents held in the pension plans at December 31, 2015. The Level 2 assets primarily consist of investments in private investment funds that are valued using the net asset values provided by the trust or fund, including an insurance contract. Although these funds are not traded in an active market with quoted prices, the investments underlying the net asset value are based on quoted prices. Level 3 assets consist of an investment in a longevity fund which invests in a portfolio of physical life insurance settlements that are valued using the net asset values provided by the fund. Since June 2011, the fund has been closed to all activity. Due to the illiquidity and inactivity of the fund, during the year ended December 31, 2014, the Company wrote down its Level 3 investment by an additional $0.6 million, which reduced its value to $0.
The following table presents a summary of changes in the Company’s Level 3 investments measured at fair value on a recurring basis:
| December 31, | ||||||||
| 2015 | 2014 | |||||||
| (in thousands) | ||||||||
| Balance at beginning of year | $ | - | $ | 587 | ||||
| Purchases during the year | - | - | ||||||
| Unrealized loss | - | (587 | ) | |||||
| Balance at end of year | $ | - | $ | - | ||||
The Company expects to contribute approximately $0.8 million to its pension plans during 2016.
The benefits expected to be paid from the pension plans are $0.6 million in 2016, $0.6 million in 2017, $0.5 million in 2018, $0.7 million in 2019 and $0.6 million in 2020. The expected benefits to be paid in the five years from 2021—2025 are $4 million. The expected benefits are based on the same assumptions used to measure the Company’s benefit obligation at December 31, 2015.
| 18. | Commitments and Contingent Liabilities |
From time to time, the Company may be involved in various claims and legal proceedings arising in the ordinary course of business. The Company is not currently a party to any such material claims or proceedings.
| F-31 |
| 19. | Capital Stock |
Common Stock
On February 5, 2008, the Company’s Board of Directors adopted a Shareholder Rights Plan and declared a dividend distribution of one preferred stock purchase right for each outstanding share of the Company’s common stock to shareholders of record as of the close of business on February 6, 2008. Initially, these rights will not be exercisable and will trade with the shares of the Company’s common stock. Under the Shareholder Rights Plan, the rights generally will become exercisable if a person becomes an “acquiring person” by acquiring 20% or more of the common stock of the Company or if a person commences a tender offer that could result in that person owning 20% or more of the common stock of the Company. If a person becomes an acquiring person, each holder of a right (other than the acquiring person) would be entitled to purchase, at the then-current exercise price, such number of shares of preferred stock which are equivalent to shares of the Company’s common stock having a value of twice the exercise price of the right. If the Company is acquired in a merger or other business combination transaction after any such event, each holder of a right would then be entitled to purchase, at the then-current exercise price, shares of the acquiring company’s common stock having a value of twice the exercise price of the right.
Preferred Stock
The Company’s Board of Directors has the authority to issue up to 5.0 million shares of preferred stock and to determine the price privileges and other terms of the shares. The Board of Directors may exercise this authority without any further approval of stockholders. As of December 31, 2015, the Company had no preferred stock issued or outstanding.
Employee Stock Purchase Plan (as amended, the “ESPP”)
In 2000, the Company approved the ESPP. Under this ESPP, participating employees can authorize the Company to withhold a portion of their base pay during consecutive six-month payment periods for the purchase of shares of the Company’s common stock. At the conclusion of the period, participating employees can purchase shares of the Company’s common stock at 85% of the lower of the fair market value of the Company’s common stock at the beginning or end of the period. Shares are issued under the ESPP for the six-month periods ending June 30 and December 31. Under this plan, 750,000 shares of common stock are authorized for issuance of which 644,011 shares were issued as of December 31, 2015. During the years ended December 31, 2015, 2014 and 2013, the Company issued 58,823 shares, 57,848 shares and 56,938, respectively, of the Company’s common stock under the ESPP.
Stock Option Plans
Third Amended and Restated 2000 Stock Option and Incentive Plan (as amended, the “Third A&R Plan”)
The Second Amendment to the Third A&R Plan (the “Amendment”) was adopted by the Board of Directors on April 3, 2015. Such Amendment was approved by the stockholders at the Company’s 2015 Annual Meeting of Stockholders. Pursuant to the Amendment, the aggregate number of shares authorized for issuance under the Third A&R Plan was increased by 2,500,000 shares to 17,508,929.
Through December 31, 2015, 2014 and 2013, incentive stock options to purchase 10,218,057 shares and non-qualified stock options to purchase 13,088,374, 12,143,374 and 11,028,074 shares, respectively, had been granted to employees and directors under the Stock Plans. Generally, both the incentive stock options and non-qualified stock options become fully vested over a range of one to four-year periods.
Restricted Stock Units with a Market Condition (the “Market Condition RSU’s”)
On August 3, 2015, the Compensation Committee of the Board of Directors of the Company approved and granted deferred stock awards of Market Condition RSU’s to members of the Company’s management team under the Third A&R Plan. The vesting of these Market Condition RSU’s is cliff-based and linked to the achievement of a relative total shareholder return of the Company’s common stock from August 3, 2015 to the earlier of (i) August 3, 2018 or (ii) upon a change of control (measured relative to the Russell 3000 index and based on the 20-day trading average price before each such date). As of December 31, 2015, the target number of these restricted stock units that may be earned is 196,785 shares; the maximum amount is 150% of the target number.
Stock-Based Payment Awards
The Company accounts for stock-based payment awards in accordance with the provisions of FASB ASC 718, which requires it to recognize compensation expense for all stock-based payment awards made to employees and directors including stock options, restricted stock units, Market Condition RSU’s and employee stock purchases related to the ESPP.
| F-32 |
FASB ASC 718 requires companies to estimate the fair value of stock-based payment awards, except restricted stock units, on the date of grant using an option-pricing model. The value of the portion of the award that is ultimately expected to vest is recognized as expense over the requisite service periods in its consolidated statements of operations.
The Company values stock-based payment awards, except restricted stock units, using the Black-Scholes option-pricing model. The Company values the Market Condition RSU’s using a Monte-Carlo valuation simulation. The determination of fair value of stock-based payment awards on the date of grant using an option-pricing model or Monte-Carlo valuation simulation is affected by its stock price as well as assumptions regarding certain variables. These variables include, but are not limited to its expected stock price volatility over the term of the awards and actual and projected stock option exercise behaviors. The Company records stock compensation expense on a straight-line basis over the requisite service period for all awards granted since the adoption of FASB ASC 718.
Earnings per share
Basic earnings per share is based upon net income divided by the number of weighted average common shares outstanding during the period. The calculation of diluted earnings per share assumes conversion of stock options, restricted stock units and Market Condition RSU’s into common stock using the treasury method. The weighted average number of shares used to compute basic and diluted earnings per share consists of the following:
| Year Ended December 31, | ||||||||||||
| 2015 | 2014 | 2013 | ||||||||||
| Basic | 33,592,775 | 32,170,683 | 30,384,010 | |||||||||
| Effect of assumed conversion of employee and director stock options, restricted stock units and Market Condition RSU's | - | 1,065,886 | 1,529,789 | |||||||||
| Diluted | 33,592,775 | 33,236,569 | 31,913,799 | |||||||||
Excluded from the shares used in calculating the diluted earnings per common share in the above table are options, restricted stock units and Market Condition RSU’s of approximately 5,521,283, 2,526,441 and 2,547,580 shares of common stock for the years ended December 31, 2015, 2014 and 2013, respectively, as the impact of these shares would be anti-dilutive.
General Option Information
The following is a summary of stock option and the restricted stock unit activity:
| Stock Options | Restricted Stock Units | Market Condition RSU's | ||||||||||||||||||||||
| Stock Options Outstanding | Weighted Average Exercise Price | Restricted Stock Units Outstanding | Grant Date Fair Value | Market Condition RSU's Outstanding | Grant Date Fair Value | |||||||||||||||||||
| Balance at December 31, 2012 | 8,078,509 | $ | 4.25 | 677,193 | $ | 3.97 | - | $ | - | |||||||||||||||
| Granted | 3,349,052 | 4.44 | 259,931 | 4.62 | - | - | ||||||||||||||||||
| Exercised | (3,410,483 | ) | 3.20 | - | - | - | - | |||||||||||||||||
| Vested (RSUs) | - | - | (281,650 | ) | - | - | - | |||||||||||||||||
| Cancelled / forfeited | (1,326,233 | ) | 5.26 | (191,501 | ) | 4.07 | - | - | ||||||||||||||||
| Balance at December 31, 2013 | 6,690,845 | 3.42 | 463,973 | 4.32 | - | - | ||||||||||||||||||
| Granted | 1,115,300 | 4.18 | 116,400 | 4.12 | - | - | ||||||||||||||||||
| Exercised | (695,173 | ) | 3.08 | - | - | - | - | |||||||||||||||||
| Vested (RSUs) | - | - | (233,098 | ) | - | - | - | |||||||||||||||||
| Cancelled / forfeited | (847,860 | ) | 4.67 | (40,878 | ) | 4.36 | - | - | ||||||||||||||||
| Balance at December 31, 2014 | 6,263,112 | 3.42 | 306,397 | 4.30 | - | - | ||||||||||||||||||
| Granted | 945,000 | 5.31 | 254,685 | 5.56 | 196,785 | 4.81 | ||||||||||||||||||
| Exercised | (1,772,062 | ) | 3.04 | - | - | - | - | |||||||||||||||||
| Vested (RSUs) | - | - | (237,188 | ) | - | - | - | |||||||||||||||||
| Cancelled / forfeited | (413,864 | ) | 4.15 | (10,335 | ) | 5.56 | (11,247 | ) | 4.81 | |||||||||||||||
| Balance at December 31, 2015 | 5,022,186 | $ | 3.85 | 313,559 | $ | 5.29 | 185,538 | $ | 4.81 | |||||||||||||||
| F-33 |
For 2013 and included in the table above are grants of 1,715,164 options and 135,650 restricted stock units related to the spin-off of Biostage. Pursuant to the spin-off, share amounts and exercise prices of Harvard Bioscience options, as well as share amounts of Harvard Bioscience restricted stock units were adjusted so that the intrinsic value held by the holder pertaining to the existing option or award was maintained immediately following the spin-off.
The Company’s policy is to issue stock available from its registered but unissued stock pool through its transfer agent to satisfy stock option exercises and vesting of the restricted stock units.
The following table summarizes information concerning currently outstanding and exercisable options as of December 31, 2015 (Aggregate Intrinsic Value, in thousands):
| Options Outstanding | Options Exercisable | |||||||||||||||||||||||||||||||
| Weighted | Weighted | |||||||||||||||||||||||||||||||
| Average | Weighted | Average | Weighted | |||||||||||||||||||||||||||||
| Range of | Shares | Remaining | Average | Aggregate | Shares | Remaining | Average | Aggregate | ||||||||||||||||||||||||
| Exercise | Outstanding at | Contractual Life | Exercise | Intrinsic | Exercisable at | Contractual Life | Exercise | Intrinsic | ||||||||||||||||||||||||
| Price | Dec. 31, 2015 | in Years | Price | Value | Dec. 31, 2015 | in Years | Price | Value | ||||||||||||||||||||||||
| $2.02-2.42 | 505,949 | 3.25 | $ | 2.21 | $ | 637 | 505,949 | 3.25 | $ | 2.21 | $ | 637 | ||||||||||||||||||||
| 2.43-2.58 | 621,136 | 6.42 | 2.56 | 565 | 472,617 | 6.42 | 2.56 | 430 | ||||||||||||||||||||||||
| 2.59-3.59 | 369,758 | 4.27 | 3.04 | 159 | 292,758 | 2.80 | 3.04 | 126 | ||||||||||||||||||||||||
| 3.60-3.68 | 529,191 | 7.41 | 3.64 | - | 271,884 | 7.41 | 3.64 | - | ||||||||||||||||||||||||
| 3.69-4.07 | 592,477 | 4.85 | 3.98 | - | 581,227 | 4.78 | 3.98 | - | ||||||||||||||||||||||||
| 4.08-4.17 | 700,375 | 8.41 | 4.12 | - | 165,625 | 8.41 | 4.12 | - | ||||||||||||||||||||||||
| 4.18-4.26 | 71,500 | 8.66 | 4.21 | - | 19,750 | 8.58 | 4.21 | - | ||||||||||||||||||||||||
| 4.27-4.41 | 750,000 | 7.88 | 4.31 | - | 125,000 | 7.88 | 4.31 | - | ||||||||||||||||||||||||
| 4.42-5.51 | 596,800 | 9.11 | 5.36 | - | 29,309 | 8.68 | 4.79 | - | ||||||||||||||||||||||||
| 5.52-5.63 | 285,000 | 9.42 | 5.56 | - | - | - | - | - | ||||||||||||||||||||||||
| $2.02-5.63 | 5,022,186 | 6.88 | $ | 3.85 | $ | 1,361 | 2,464,119 | 5.32 | $ | 3.23 | $ | 1,193 | ||||||||||||||||||||
The aggregate intrinsic value in the preceding table represents the total pre-tax intrinsic value, based on the Company’s closing stock price of $3.47 as of December 31, 2015, which would have been received by the option holders had all option holders exercised their options as of that date. The aggregate intrinsic value of options exercised for the years ended December 31, 2015, 2014 and 2013 was approximately $0.8 million, $1.8 million and $5.1 million, respectively. The total number of in-the-money options that were exercisable as of December 31, 2015 was 1,196,226.
For the year ended December 31, 2015, the total compensation costs related to unvested awards not yet recognized is $4.2 million and the weighted average period over which it is expected to be recognized is 2.3 years.
Valuation and Expense Information under Stock-Based-Payment Accounting
| F-34 |
Stock-based compensation expense related to stock options, restricted stock units, Market Condition RSU’s and the employee stock purchase plan for the years ended December 31, 2015, 2014 and 2013 was allocated as follows:
| Year Ended December 31, | ||||||||||||
| 2015 | 2014 | 2013 | ||||||||||
| (in thousands) | ||||||||||||
| Cost of revenues | $ | 70 | $ | 132 | $ | 131 | ||||||
| Sales and marketing | 418 | 343 | 223 | |||||||||
| General and administrative | 2,170 | 1,620 | 2,200 | |||||||||
| Research and development | 97 | 61 | 45 | |||||||||
| Discontinued operations | - | - | 71 | |||||||||
| Total stock-based compensation | $ | 2,755 | $ | 2,156 | $ | 2,670 | ||||||
On April 28, 2015, the Company announced the appointment of James Green to its Board of Directors and the retirement of Robert Dishman from its Board of Directors. As part of Dr. Dishman’s retirement, the Company (i) awarded an unrestricted stock award to Dr. Dishman on April 28, 2015, having an aggregate cash value of $80,000, (ii) accelerated the vesting of all outstanding stock options and restricted stock units that were unvested as of April 28, 2015, and (iii) extended the post-retirement option exercise period for each option to the earlier to occur of the respective scheduled expiration date or April 28, 2016. Total compensation expense recognized as part of general and administrative expenses for the year ended December 31, 2015, as part of these modifications, was approximately $0.1 million.
The Company did not capitalize any stock-based compensation.
The weighted-average estimated fair value per share of stock options granted during 2015, 2014 and 2013 was $2.12, $2.18 and $2.41, respectively, using the Black Scholes option-pricing model with the following weighted-average assumptions:
| Year Ended December 31, | ||||||||||||
| 2015 | 2014 | 2013 | ||||||||||
| Volatility | 40.97 | % | 55.78 | % | 57.18 | % | ||||||
| Risk-free interest rate | 1.72 | % | 1.80 | % | 1.42 | % | ||||||
| Expected holding period (in years) | 5.50 | years | 5.76 | years | 5.67 | years | ||||||
| Dividend yield | - | % | - | % | - | % | ||||||
The weighted average fair value of the Market Condition RSU’s granted under the Third A&R Plan during the year ended December 31, 2015 was $4.81. The following assumptions were used to estimate the fair value, using a Monte-Carlo valuation simulation, of the Market Condition RSU’s granted during the year ended December 31, 2015:
| Year Ended | ||||
| December 31, | ||||
| 2015 | ||||
| Volatility | 35.88 | % | ||
| Risk-free interest rate | 0.99 | % | ||
| Correlation coefficient | 0.25 | % | ||
| Dividend yield | - | % | ||
The Company used historical volatility to calculate the expected volatility as of December 31, 2015. Historical volatility was determined by calculating the mean reversion of the daily adjusted closing stock price. The risk-free interest rate assumption is based upon observed U.S. Treasury bill interest rates (risk-free) appropriate for the term of the Company’s stock options. The expected holding period of stock options represents the period of time options are expected to be outstanding and were based on historical experience. The vesting period ranges from one to four years and the contractual life is ten years.
Stock-based compensation expense recognized in the consolidated statements of operations for the years ended December 31, 2015, 2014 and 2013 is based on awards ultimately expected to vest and has been reduced for annualized estimated forfeitures of 8.06%, 7.05% and 6.54%, respectively. Stock-based-payment accounting requires forfeitures to be estimated at the time of grant and revised, if necessary, in subsequent periods if actual forfeitures differ from those estimates. Forfeitures were estimated based on historical experience.
| F-35 |
| 20. | Related Party Transactions |
As part of the acquisitions of MCS and TBSI, the Company signed lease agreements with the former owners of the acquired companies. The principals of such former owners were employees of the Company as of December 31, 2015. Pursuant to a lease agreement, the Company incurred rent expense of approximately $0.2 million and $62,000 to the former owners of MCS for the years ended December 31, 2015 and 2014, respectively. Pursuant to a lease agreement, the Company incurred rent expense of approximately $42,000 and $11,000 to the former owner of TBSI for the years ended December 31, 2015 and 2014, respectively.
21. Segment and Related Information
Operating segments are determined by products and services provided by each segment, internal organization structure, the manner in which operations are managed, criteria used by the Chief Operating Decision Maker, or CODM, to assess the segment performance, as well as resource allocation and the availability of discrete financial information. Following the spin-off of Biostage, the Company’s former Regenerative Medicine Device segment, the Company has one operating segment. As such, segment results and consolidated results are the same.
The following tables summarize selected financial information of the Company’s continuing operations by geographic location:
| Revenues originating from the following geographic areas consist of: | ||||||||||||
| Year Ended December 31, | ||||||||||||
| 2015 | 2014 | 2013 | ||||||||||
| (in thousands) | ||||||||||||
| United States | $ | 64,766 | $ | 63,727 | $ | 63,810 | ||||||
| Germany | 15,755 | 8,240 | 5,751 | |||||||||
| United Kingdom | 18,051 | 24,754 | 23,123 | |||||||||
| Rest of the world | 10,092 | 11,942 | 12,487 | |||||||||
| Total revenues | $ | 108,664 | $ | 108,663 | $ | 105,171 | ||||||
Long-lived assets by geographic area consist of the following:
| December 31, | ||||||||
| 2015 | 2014 | |||||||
| (in thousands) | ||||||||
| United States | $ | 13,610 | $ | 14,335 | ||||
| Germany | 7,817 | 6,981 | ||||||
| United Kingdom | 1,440 | 1,698 | ||||||
| Rest of the world | 3,907 | 3,329 | ||||||
| Total long-lived assets (1) | $ | 26,774 | $ | 26,343 | ||||
(1) Total long-lived assets includes property, plant and equipment, net and amortizable intangible assets, net.
Net assets by geographic area consist of the following:
| December 31, | ||||||||
| 2015 | 2014 | |||||||
| (in thousands) | ||||||||
| United States | $ | 22,312 | $ | 43,556 | ||||
| Germany | 18,512 | 18,516 | ||||||
| United Kingdom | 17,908 | 15,607 | ||||||
| Rest of the world | 18,866 | 17,789 | ||||||
| Total net assets | $ | 77,598 | $ | 95,468 | ||||
| F-36 |
| 22. | Allowance for Doubtful Accounts |
Allowance for doubtful accounts is based on the Company’s assessment of the collectability of customer accounts. A rollforward of allowance for doubtful accounts is as follows:
| Charged (credited) to | ||||||||||||||||||||
| Beginning | Bad Debt | Charged to | Ending | |||||||||||||||||
| Balance | Expense (Recoveries) | Allowance (1) | Other (2) | Balance | ||||||||||||||||
| (in thousands) | ||||||||||||||||||||
| Year ended December 31, 2013 | $ | 194 | 172 | (8 | ) | - | $ | 358 | ||||||||||||
| Year ended December 31, 2014 | $ | 358 | (67 | ) | 56 | (19 | ) | $ | 328 | |||||||||||
| Year ended December 31, 2015 | $ | 328 | (4 | ) | 4 | (18 | ) | $ | 310 | |||||||||||
(1) Consists of accounts written off, net of recoveries.
(2) Consists of the effect of currency translation.
| 23. | Warranties |
Warranties are estimated and accrued at the time revenues are recorded. A rollforward of the Company’s product warranty accrual is as follows:
| Beginning | Additions/ | Ending | ||||||||||||||
| Balance | Payments | (Credits) | Balance | |||||||||||||
| (in thousands) | ||||||||||||||||
| Year ended December 31, 2013 | $ | 222 | (179 | ) | 262 | $ | 305 | |||||||||
| Year ended December 31, 2014 | $ | 305 | (102 | ) | 49 | $ | 252 | |||||||||
| Year ended December 31, 2015 | $ | 252 | (81 | ) | (24 | ) | $ | 147 | ||||||||
| F-37 |
| 24. | Quarterly Financial Information (unaudited) |
Statement of Operations Data:
| First | Second | Third | Fourth | Fiscal | ||||||||||||||||
| 2015 | Quarter | Quarter | Quarter | Quarter | Year | |||||||||||||||
| (in thousands, except per share data) | ||||||||||||||||||||
| Revenues | $ | 25,763 | $ | 28,800 | $ | 25,731 | $ | 28,370 | $ | 108,664 | ||||||||||
| Cost of revenues | 14,285 | 16,205 | 14,005 | 15,446 | 59,941 | |||||||||||||||
| Gross profit | 11,478 | 12,595 | 11,726 | 12,924 | 48,723 | |||||||||||||||
| Total operating expenses | 12,628 | 12,496 | 12,501 | 12,811 | 50,436 | |||||||||||||||
| Operating (loss) income | (1,150 | ) | 99 | (775 | ) | 113 | (1,713 | ) | ||||||||||||
| Other expense, net | (614 | ) | (526 | ) | (321 | ) | (434 | ) | (1,895 | ) | ||||||||||
| (Loss) income before income taxes | (1,764 | ) | (427 | ) | (1,096 | ) | (321 | ) | (3,608 | ) | ||||||||||
| Income tax (benefit) expense | (363 | ) | (776 | ) | (249 | ) | 16,819 | 15,431 | ||||||||||||
| Net (loss) income | $ | (1,401 | ) | $ | 349 | $ | (847 | ) | $ | (17,140 | ) | $ | (19,039 | ) | ||||||
| (Loss) earnings per share: | ||||||||||||||||||||
| Basic (loss) earnings per common share | $ | (0.04 | ) | $ | 0.01 | $ | (0.02 | ) | $ | (0.51 | ) | $ | (0.57 | ) | ||||||
| Diluted (loss) earnings per common share | $ | (0.04 | ) | $ | 0.01 | $ | (0.02 | ) | $ | (0.51 | ) | $ | (0.57 | ) | ||||||
| F-38 |
Statement of Operations Data:
| First | Second | Third | Fourth | Fiscal | ||||||||||||||||
| 2014 | Quarter | Quarter | Quarter | Quarter | Year | |||||||||||||||
| (in thousands, except per share data) | ||||||||||||||||||||
| Revenues | $ | 25,893 | $ | 26,958 | $ | 25,448 | $ | 30,364 | $ | 108,663 | ||||||||||
| Cost of revenues | 14,132 | 14,680 | 14,006 | 16,501 | 59,319 | |||||||||||||||
| Gross profit | 11,761 | 12,278 | 11,442 | 13,863 | 49,344 | |||||||||||||||
| Total operating expenses | 10,427 | 10,540 | 10,017 | 11,742 | 42,726 | |||||||||||||||
| Operating income | 1,334 | 1,738 | 1,425 | 2,121 | 6,618 | |||||||||||||||
| Other expense, net | (315 | ) | (468 | ) | (469 | ) | (949 | ) | (2,201 | ) | ||||||||||
| Income before income taxes | 1,019 | 1,270 | 956 | 1,172 | 4,417 | |||||||||||||||
| Income tax expense | 300 | 248 | 323 | 1,191 | 2,062 | |||||||||||||||
| Net income (loss) | $ | 719 | $ | 1,022 | $ | 633 | $ | (19 | ) | $ | 2,355 | |||||||||
| Earnings per share: | ||||||||||||||||||||
| Basic earnings per common share | $ | 0.02 | $ | 0.03 | $ | 0.02 | $ | - | $ | 0.07 | ||||||||||
| Diluted earnings per common share | $ | 0.02 | $ | 0.03 | $ | 0.02 | $ | - | $ | 0.07 | ||||||||||
25. Subsequent Events
On March 9, 2016, the Company entered into an agreement with its lenders which amended the principal payment amortization of the Term Loan and DDTL to five years, as well as amended the Company’s quarterly minimum fixed charge coverage financial covenant. Refer to footnote 11 for additional details.
| F-39 |
Pursuant to the requirements of Section 13 or 15(d) of the Securities Exchange Act of 1934, the registrant has duly caused this report to be signed on its behalf by undersigned thereunto duly authorized.
| HARVARD BIOSCIENCE, INC. | |||
| Date: April 29, 2016 | By: | /s/ JEFFREY A. DUCHEMIN | |
| Jeffrey A. Duchemin | |||
| Chief Executive Officer | |||
Pursuant to the requirements of Section 13 or 15(d) of the Securities Exchange Act of 1934, this report has been signed below by the following persons on behalf of the registrant and in the capacities and on the dates indicated:
|
Signature |
Title |
Date | ||
|
/s/ JEFFREY A. DUCHEMIN Jeffrey A. Duchemin
|
Chief Executive Officer and Director (Principal Executive Officer) | April 29, 2016 | ||
|
/s/ ROBERT E. GAGNON Robert E. Gagnon
|
Chief Financial Officer (Principal Financial Officer and Principal Accounting Officer) |
April 29, 2016 | ||
|
/s/ DAVID GREEN David Green
|
Director | April 29, 2016 | ||
|
/s/ JAMES GREEN James Green
|
Director | April 29, 2016 | ||
|
/s/ NEAL J. HARTE Neal J. Harte
|
Director | April 29, 2016 | ||
|
/s/ JOHN F. KENNEDY John F. Kennedy
|
Director | April 29, 2016 | ||
|
/s/ EARL R. LEWIS Earl R. Lewis
|
Director | April 29, 2016 | ||
|
/s/ BERTRAND LOY Bertrand Loy
|
Director | April 29, 2016 | ||
|
/s/ GEORGE UVEGES George Uveges
|
Director | April 29, 2016 |
EXHIBIT INDEX
The following exhibits are filed as part of this Annual Report on Form 10-K. Where such filing is made by incorporation by reference to a previously filed document, such document is identified.
| Exhibit Number | Description | Method of Filing |
| 2.1 |
Asset Purchase Agreement, dated September 30, 2008, by and among Harvard Bioscience, Inc., as Parent, Union Biometrica, Inc., as Seller, and UBIO Acquisition Company, as Buyer
|
Previously filed as an exhibit to the Company’s Current Report on Form 8-K (filed on October 6, 2008) and incorporated by reference thereto |
| 2.2 |
Asset Purchase Agreement, dated September 2, 2009, by and among Harvard Bioscience, Inc., as Parent, and DAC Acquisition Holding, Inc., as Purchaser, Denville Scientific, Inc., as Seller, and Walter Demsia and Ryan Sharp, as Shareholders
|
Previously filed as an exhibit to the Company’s Current Report on Form 8-K (filed September 9, 2009) and incorporated by reference thereto |
| 2.3 |
Separation and Distribution Agreement between Harvard Bioscience, Inc. and Biostage, Inc. (f/k/a Harvard Apparatus Regenerative Technology, Inc.) dated as of October 31, 2013
|
Previously filed as an exhibit to the Company’s Current Report on Form 8-K (filed November 6, 2013) and incorporated by reference thereto § |
| 2.4 |
Share Purchase Agreement between Biochrom Limited, as Buyer, and Multi Channel Systems Holding GmbH, as Seller, dated as of October 1, 2014
|
Previously filed as an exhibit to the Company’s Annual Report on Form 10-K (filed March 27, 2015) and incorporated by reference thereto |
| 2.5 |
Stock Purchase Agreement by and among Harvard Bioscience, Inc., as Buyer, Triangle BioSystems, Inc., and the sellers party thereto dated as of October 1, 2014
|
Previously filed as an exhibit to the Company’s Current Report on Form 8-K (filed October 1, 2014) and incorporated by reference thereto |
| 2.6 |
Agreement for the Sale and Purchase of All Shares in HEKA GmbH by and among Multi Channel Systems MCS GmbH, as Purchaser, Dr. Peter Schulze GmbH & Co. KG, as Seller, and Dr. Peter Schulze, as Guarantor, dated as of January 8, 2015
|
Previously filed as an exhibit to the Company’s Current Report on Form 8-K (filed January 9, 2015) and incorporated by reference thereto |
| 2.7 |
Agreement for the Sale and Purchase of All Shares in HEKA Canada between Ealing Scientific Limited, as Purchaser, and Dr. Peter Schulze, as Seller, dated as of January 8, 2015
|
Previously filed as an exhibit to the Company’s Current Report on Form 8-K (filed January 9, 2015) and incorporated by reference thereto |
| 3(i) |
Second Amended and Restated Certificate of Incorporation of Harvard Bioscience, Inc.
|
Previously filed as an exhibit to the Company’s Registration Statement on Form S-1/A (File No. 333-45996) (filed on November 9, 2000) and incorporated by reference thereto
|
| 3(ii) |
Amended and Restated By-laws of Harvard Bioscience, Inc.
|
Previously filed as an exhibit to the Company’s Registration Statement on Form S-1/A (File No. 333-45996) (filed on November 9, 2000) and incorporated by reference thereto
|
| 3.3 |
Amendment No. 1 to Amended and Restated Bylaws of Harvard Bioscience, Inc. (as adopted October 30, 2007)
|
Previously filed as an exhibit to the Company’s Current Report on Form 8-K (filed on November 1, 2007) and incorporated by reference thereto |
| 3.4 |
Certificate of Designations, Preferences and Rights of a Series of Preferred Stock of Harvard Bioscience, Inc. classifying and designating the Series A Junior Participating Cumulative Preferred Stock
|
Previously filed as an exhibit to the Company’s Registration Statement on Form 8-A (filed February 8, 2008) and incorporated by reference thereto |
| 4.1 |
Specimen certificate for shares of Common Stock, $0.01 par value, of Harvard Bioscience, Inc.
|
Previously filed as an exhibit to the Company’s Registration Statement on Form S-1/A (File No. 333-45996) (filed on November 9, 2000) and incorporated by reference thereto
|
| 4.2 |
Amended and Restated Securityholders’ Agreement dated as of March 2, 1999 by and among Harvard Apparatus, Inc., Pioneer Partnership II, Pioneer Capital Corp., First New England Capital, L.P. and Citizens Capital, Inc. and Chane Graziano and David Green
|
Previously filed as an exhibit to the Company’s Registration Statement on Form S-1/A (File No. 333-45996) (filed on October 25, 2000) and incorporated by reference thereto |
| 4.3 |
Shareholders Rights Agreement, dated as of February 5, 2008 between Harvard Bioscience, Inc., and Registrar and Transfer Company, as Rights Agent
|
Previously filed as an exhibit to the Company’s Registration Statement on Form 8-A (filed February 8, 2008) and incorporated by reference thereto |
| 10.1 |
Harvard Apparatus, Inc. 1996 Stock Option and Grant Plan
|
Previously filed as an exhibit to the Company’s Registration Statement on Form S-1/A (File No. 333-45996) (filed on October 25, 2000) and incorporated by reference thereto
|
| 10.2 |
Harvard Bioscience, Inc. Third Amended and Restated 2000 Stock Option and Incentive Plan
|
Previously disclosed in the Company’s Proxy Statement on Schedule 14A (filed April 15, 2011) and incorporated by reference thereto
|
| 10.3 |
Harvard Bioscience, Inc. Employee Stock Purchase Plan
|
Previously filed as an exhibit to the Company’s Registration Statement on Form S-1/A (File No. 333-45996) (filed on November 9, 2000) and incorporated by reference thereto
|
| 10.4 # |
Amended and Restated Employment Agreement between Harvard Bioscience, Inc. and Chane Graziano, dated December 18, 2008
|
Previously filed as an exhibit to the Company’s Annual Report on Form 10-K (filed March 11, 2009) and incorporated by reference thereto |
| 10.5 # |
Amended and Restated Employment Agreement between Harvard Bioscience, Inc. and David Green, dated December 18, 2008
|
Previously filed as an exhibit to the Company’s Annual Report on Form 10-K (filed March 11, 2009) and incorporated by reference thereto |
| 10.6 |
Form of Director Indemnification Agreement
|
Previously filed as an exhibit to the Company’s Registration Statement on Form S-1/A (File No. 333-45996) (filed on October 25, 2000) and incorporated by reference thereto
|
| 10.7 |
Lease of Unit 22 Phase I Cambridge Science Park, Milton Road, Cambridge dated May 8, 2008 between The Master Fellows and Scholars of Trinity College Cambridge and Biochrom Limited.
|
Previously filed as an exhibit to the Company’s Annual Report on Form 10-K (filed March 11, 2009) and incorporated by reference thereto |
| 10.8 # |
Amended and Restated Employment Agreement between Harvard Bioscience, Inc. and Susan Luscinski dated December 18, 2008.
|
Previously filed as an exhibit to the Company’s Annual Report on Form 10-K (filed March 11, 2009) and incorporated by reference thereto |
| 10.9 + |
Strategic Supplier Alliance Agreement, dated April 10, 2008, by and between Biochrom Limited and GE Healthcare Biosciences, Corp.
|
Previously filed as an exhibit to the Company’s Quarterly Report on Form 10-Q/A, as amended (filed February 19, 2009) and incorporated by reference thereto |
| 10.10 |
Lease, dated February 23, 2004, by and between William Cash Forman and Hoefer, Inc.
|
Previously filed as an exhibit to the Company’s Annual Report on Form 10-K (filed March 15, 2004) and incorporated by reference thereto
|
| 10.11 + |
Trademark License Agreement, dated December 9, 2002, by and between Harvard Bioscience, Inc. and President and Fellows of Harvard College.
|
Previously filed as an exhibit to the Company’s Quarterly Report on Form 10-Q (filed May 15, 2003) and incorporated by reference thereto |
| 10.12 |
Lease Agreement Between Seven October Hill, LLC and Harvard Bioscience, Inc. dated December 30, 2005.
|
Previously filed as an exhibit to the Company’s Current Report on Form 8-K (filed January 4, 2006) and incorporated by reference thereto |
| 10.13 |
Form of Incentive Stock Option Agreement (Executive Officers).
|
Previously filed as an exhibit to the Company’s Annual Report on Form 10-K (filed March 16, 2006) and incorporated by reference thereto
|
| 10.14 |
Form of Non-Qualified Stock Option Agreement (Executive Officers).
|
Previously filed as an exhibit to the Company’s Annual Report on Form 10-K (filed March 16, 2006) and incorporated by reference thereto
|
| 10.15 |
Form of Non-Qualified Stock Option Agreement (Non-Employee Directors).
|
Previously filed as an exhibit to the Company’s Annual Report on Form 10-K (filed March 16, 2006) and incorporated by reference thereto
|
| 10.16 # |
Employment Agreement Between Harvard Bioscience, Inc. and Thomas McNaughton, dated November 14, 2008.
|
Previously filed as an exhibit to the Company’s Current Report on Form 8-K (filed November 18, 2008) and incorporated by reference thereto |
| 10.17 |
Amended and Restated Revolving Credit Loan Agreement, dated as of August 7, 2009, by and among Harvard Bioscience, Inc. and the Lenders from time to time party thereto, including Bank of America, N.A. (both in its capacity as “Lender” and in its capacity as “Agent”), and Brown Brothers Harriman & Co.
|
Previously filed as an exhibit to the Company’s Current Report on Form 8-K (filed August 13, 2009) and incorporated by reference thereto |
| 10.18 |
Amendment No. 2, dated as of May 22, 2010, to Lease Agreement, as subsequently amended, between Seven October Hill LLC and Harvard Bioscience, Inc.
|
Previously filed as an exhibit to the Company’s Current Report on Form 8-K (filed June 3, 2010) and incorporated by reference thereto |
| 10.19 |
Form of Deferred Stock Award Agreement under the Harvard Bioscience, Inc. Second Amended and Restated 2000 Stock Option And Incentive Plan, as amended
|
Previously filed as an exhibit to the Company’s Annual Report on Form 10-K (filed March 16, 2011) and incorporated by reference thereto |
| 10.20 |
Director Compensation Arrangements
|
Filed with this report |
| 10.21 |
Amendment No. 1 to the Harvard Bioscience, Inc. Employee Stock Purchase Plan, effective as of January 1, 2012
|
Previously filed as an exhibit to the Company’s Annual Report on Form 10-K (filed March 14, 2014) and incorporated by reference thereto |
| 10.22 |
First Amendment to Harvard Bioscience, Inc. Third Amended and Restated 2000 Stock Option and Incentive Plan, effective as of March 9, 2013
|
Previously filed as an exhibit to the Company’s Annual Report on Form 10-K (filed March 14, 2014) and incorporated by reference thereto |
| 10.23 |
Second Amended and Restated Revolving Credit Agreement, dated as of March 29, 2013, by and among Harvard Bioscience, Inc. and the Lenders from time to time party thereto, including Bank of America, N.A. and Brown Brothers Harriman & Co.
|
Previously filed as an exhibit to the Company’s Current Report on Form 8-K (filed April 3, 2013) and incorporated by reference thereto |
| 10.24 |
Amendment No. 2 to the Harvard Bioscience, Inc. Employee Stock Purchase Plan, effective as of May 23, 2013
|
Previously filed as an exhibit to the Company’s Annual Report on Form 10-K (filed March 14, 2014) and incorporated by reference thereto |
| 10.25 |
First Amendment to Second Amended and Restated Credit Agreement dated as of May 30, 2013, with an effective date as of April 30, 2013, by and among Harvard Bioscience, Inc. Bank of America, N.A. and Brown Brothers Harriman & Co.
|
Previously filed as an exhibit to the Company’s Annual Report on Form 10-K (filed March 14, 2014) and incorporated by reference thereto |
| 10.26 # |
Employment Agreement, dated August 26, 2013, between Harvard Bioscience, Inc. and Jeffrey A. Duchemin
|
Previously filed as an exhibit to the Company’s Current Report on Form 8-K (filed August 29, 2013) and incorporated by reference thereto |
| 10.27 # |
Offer letter dated September 30, 2013 between Harvard Bioscience, Inc. and Yoav Sibony
|
Previously filed as an exhibit to the Company’s Current Report on Form 8-K (filed February 19, 2014) and incorporated by reference thereto. |
| 10.28 # |
Offer letter dated September 30, 2013 between Harvard Bioscience, Inc. and Yong Sun
|
Previously filed as an exhibit to the Company’s Current Report on Form 8-K (filed February 19, 2014) and incorporated by reference thereto
|
| 10.29 # |
Employment Agreement, dated October 2, 2013, between Harvard Bioscience, Inc. and Robert E. Gagnon
|
Previously filed as an exhibit to the Company’s Current Report on Form 8-K (filed October 16, 2013) and incorporated by reference thereto |
| 10.30 |
Second Amendment to Second Amended and Restated Credit Agreement and Waiver dated as of October 31, 2013, by and among Harvard Bioscience, Inc. Bank of America, N.A. and Brown Brothers Harriman & Co.
|
Previously filed as an exhibit to the Company’s Annual Report on Form 10-K (filed March 14, 2014) and incorporated by reference thereto |
| 10.31 |
Intellectual Property Matters Agreement between Harvard Bioscience, Inc. and Biostage, Inc. (f/k/a Harvard Apparatus Regenerative Technology, Inc.) dated as of October 31, 2013.
|
Previously filed as an exhibit to the Company’s Current Report on Form 8-K (filed November 6, 2013) and incorporated by reference thereto |
| 10.32 |
Product Distribution Agreement between Harvard Bioscience, Inc. and Biostage, Inc. (f/k/a Harvard Apparatus Regenerative Technology, Inc.) dated as of October 31, 2013.
|
Previously filed as an exhibit to the Company’s Current Report on Form 8-K (filed November 6, 2013) and incorporated by reference thereto |
| 10.33 |
Tax Sharing Agreement between Harvard Bioscience, Inc. and Biostage, Inc. (f/k/a Harvard Apparatus Regenerative Technology, Inc.) dated as of October 31, 2013.
|
Previously filed as an exhibit to the Company’s Current Report on Form 8-K (filed November 6, 2013) and incorporated by reference thereto |
| 10.34 |
Transition Services Agreement between Harvard Bioscience, Inc. and Biostage, Inc. (f/k/a Harvard Apparatus Regenerative Technology, Inc.) dated as of October 31, 2013.
|
Previously filed as an exhibit to the Company’s Current Report on Form 8-K (filed November 6, 2013) and incorporated by reference thereto |
| 10.35 |
Waiver Relating to the Employment Agreement between Harvard Bioscience, Inc. and David Green dated as of October, 31, 2013 between Harvard Bioscience, Inc. and David Green.
|
Previously filed as an exhibit to the Company’s Current Report on Form 8-K (filed November 6, 2013) and incorporated by reference thereto |
| 10.36 |
Waiver Relating to the Employment Agreement between Harvard Bioscience, Inc. and Thomas McNaughton dated as of October, 31, 2013 between Harvard Bioscience, Inc. and Thomas McNaughton.
|
Previously filed as an exhibit to the Company’s Current Report on Form 8-K (filed November 6, 2013) and incorporated by reference thereto |
| 10.37 # |
Amendment to Employment Agreement between Harvard Bioscience, Inc. and Jeffrey A. Duchemin, effective July 30, 2014.
|
Previously filed as an exhibit to the Company’s Current Report on Form 8-K (filed July 31, 2014) and incorporated by reference thereto |
| 10.38 # |
Amendment to Employment Agreement between Harvard Bioscience, Inc. and Robert E. Gagnon, effective July 30, 2014.
|
Previously filed as an exhibit to the Company’s Current Report on Form 8-K (filed July 31, 2014) and incorporated by reference thereto |
| 10.39 |
Amendment No. 3, dated as of May 30, 2014, to Lease Agreement, as subsequently amended, between Seven October Hill LLC and Harvard Bioscience, Inc.
|
Previously filed as an exhibit to the Company’s Quarterly Report on Form 10-Q (filed August 7, 2014) and incorporated by reference thereto |
| 10.40 # |
Amendment to Employment Agreement, dated as of March 1, 2015, between Harvard Bioscience, Inc. and Jeffrey A. Duchemin
|
Previously filed as an exhibit to the Company’s Quarterly Report on Form 10-Q (filed May 7, 2015) and incorporated by reference thereto |
| 10.41 |
Third Amendment to Second Amended and Restated Credit Agreement and Waiver dated as of April 24, 2015, by and among Harvard Bioscience, Inc. Bank of America, N.A. and Brown Brothers Harriman & Co.
|
Previously filed as an exhibit to the Company’s Quarterly Report on Form 10-Q (filed August 6, 2015) and incorporated by reference thereto |
| 10.42 |
Fourth Amendment to Second Amended and Restated Credit Agreement and Waiver dated as of June, 30, 2015, by and among Harvard Bioscience, Inc. Bank of America, N.A. and Brown Brothers Harriman & Co.
|
Previously filed as an exhibit to the Company’s Quarterly Report on Form 10-Q (filed August 6, 2015) and incorporated by reference thereto |
| 10.43 |
Form of Deferred Stock Award Agreement under the Harvard Bioscience, Inc. Third Amended and Restated 2000 Stock Option And Incentive Plan, as amended
|
Previously filed as an exhibit to the Company’s Quarterly Report on Form 10-Q (filed November 5, 2015) and incorporated by reference thereto |
| 10.44 |
Fifth Amendment to Second Amended and Restated Credit Agreement and Waiver dated as of November 5, 2015, by and among Harvard Bioscience, Inc. Bank of America, N.A. and Brown Brothers Harriman & Co.
|
Filed with this report |
| 21.1 |
Subsidiaries of the Registrant
|
Filed with this report |
| 23.1 |
Consent of KPMG LLP
|
Filed with this report |
| 31.1 |
Certification of Chief Financial Officer of Harvard Bioscience, Inc., pursuant to Rules 13a-15(e) and 15d-15(e), as adopted pursuant to Section 302 of the Sarbanes-Oxley Act of 2002
|
Filed with this report |
| 31.2 |
Certification of Chief Executive Officer of Harvard Bioscience, Inc., pursuant to Rules 13a-15(e) and 15d-15(e), as adopted pursuant to Section 302 of the Sarbanes-Oxley Act of 2002
|
Filed with this report |
| 32.1 |
Certification of Chief Financial Officer of Harvard Bioscience, Inc., pursuant to 18 U.S.C. Section 1350, as adopted pursuant to Section 906 of the Sarbanes-Oxley Act of 2002
|
*
|
| 32.2 |
Certification of Chief Executive Officer of Harvard Bioscience, Inc., pursuant to 18 U.S.C. Section 1350, as adopted pursuant to Section 906 of the Sarbanes-Oxley Act of 2002
|
* |
| 101.INS |
XBRL Instance Document
|
Filed with this report
|
| 101.SCH |
XBRL Taxonomy Extension Schema Document
|
Filed with this report |
| 101.CAL |
XBRL Taxonomy Extension Calculation Linkbase Document
|
Filed with this report |
| 101.DEF |
XBRL Taxonomy Extension Definition Linkbase Document
|
Filed with this report |
| 101.LAB |
XBRL Taxonomy Extension Label Linkbase Document
|
Filed with this report |
| 101.PRE |
XBRL Taxonomy Extension Presentation Linkbase Document
|
Filed with this report |
| + | Certain portions of this document have been granted confidential treatment by the Securities and Exchange Commission (the “Commission”). |
| * | This certification shall not be deemed “filed” for purposes of Section 18 of the Securities Exchange Act of 1934, or otherwise subject to the liability of that section, nor shall it be deemed to be incorporated by reference into any filing under the Securities Act of 1933 or the Securities Exchange Act of 1934 |
| # | Management contract or compensatory plan or arrangement. |
| § |
The schedules and exhibits to the Separation and Distribution Agreement have been omitted. A copy of any omitted schedule or exhibit will be furnished to the SEC supplementally upon request.
The Company will furnish to stockholders a copy of any exhibit without charge upon written request. |