Attached files
| file | filename |
|---|---|
| EX-32.2 - DIEGO PELLICER WORLDWIDE, INC | ex32-2.htm |
| EX-32.1 - DIEGO PELLICER WORLDWIDE, INC | ex32-1.htm |
| EX-10.3 - DIEGO PELLICER WORLDWIDE, INC | ex10-3.htm |
| EX-31.2 - DIEGO PELLICER WORLDWIDE, INC | ex31-2.htm |
| EX-31.1 - DIEGO PELLICER WORLDWIDE, INC | ex31-1.htm |
UNITED STATES
SECURITIES AND EXCHANGE COMMISSION
Washington, D.C. 20549
FORM 10-K
| [X] | ANNUAL REPORT UNDER TO SECTION 13 OR 15(d) OF THE SECURITIES EXCHANGE ACT OF 1934 |
For the fiscal year ended December 31, 2015
or
| [ ] | TRANSITIONAL REPORT PURSUANT TO SECTION 13 OR 15(d) OF THE SECURITIES EXCHANGE ACT OF 1934 |
For the transitional period from _____________ to ______________
Commission file number 333-189731
| DIEGO PELLICER WORLDWIDE, INC. |
| (Exact name of registrant as specified in its charter) |
| Delaware | 33-1223037 | |
| (State
or other jurisdiction of incorporation or organization) |
(I.R.S.
Employer Identification No.) |
3435 Ocean Park Blvd., #107-610, Santa Monica, CA 90405
(Address of principal executive offices) including zip code)
Registrant’s telephone number, including area code: (516) 900-3799
Securities registered pursuant to Section 12(b) of the Act:
| Title of each class registered: | Name of each exchange on which registered: | |
| None | None |
Securities registered pursuant to section 12(g) of the Act: None
Indicate by check mark if the registrant is a well-known seasoned issuer, as defined in Rule 405 of the Securities Act. Yes [ ] No [X]
Indicate by check mark if the registrant is not required to file reports pursuant to Section 13 or 15(d) of the Act: Yes [ ] No [X]
Indicate by check mark whether the registrant (1) has filed all reports required by Section 13 or 15(d) of the Securities Exchange Act of 1934 during the preceding 12 months (or for such shorter period that the registrant was required to file such reports), and (2) has been subject to such filing requirements for the past 90 day. Yes [ ] No [X]
Indicate by check mark whether the registrant has submitted electronically and posted on its corporate Web site, if any, every Interactive Data File required to be submitted and posted pursuant to Rule 405 of Regulation S-T (Section 232.405 of this chapter) during the preceding 12 months (or for such shorter period that the registrant was required to submit and post such files). Yes [X] No [ ]
Indicate by check mark if disclosure of delinquent filers pursuant to Item 405 of Regulations S-K is not contained herein, and will not be contained, to the best of registrant’s knowledge, in definitive proxy information statements incorporated by reference in Part III of this Form 10-K or any amendment to this Form 10-K. [ ]
Indicate by check mark whether the registrant is a large accelerated filer, an accelerated filer, a non-accelerated filer, or a smaller reporting company. See the definitions of “large accelerated filer,” “accelerated filer” and “smaller reporting company” in Rule 12b-2 if the Exchange Act.
| Large Accelerated filer | [ ] | Accelerated filer | [ ] | ||
| Non-accelerated filer | [ ] | Smaller reporting company | [X] |
Indicate by check mark whether the registrant is a shell company (as defined in Rule 12b-2 of the Act). Yes [ ] No [X]
There was no active public trading market as of the last business day of the Company’s second fiscal quarter, so there was no aggregate market value of common stock held by non-affiliates.
As of April 18, 2016, the registrant had 41,572,082 shares issued and outstanding.
DOCUMENTS INCORPORATED BY REFERENCE
None.
TABLE OF CONTENTS
| 2 |
CAUTIONARY NOTE REGARDING FORWARD LOOKING STATEMENTS
This Annual Report on Form 10-K (the “Annual Report”) contains “forward-looking statements” within the meaning of the Private Securities Litigation Reform Act of 1995, Section 27A of the Securities Act of 1933, as amended, or the Securities Act, and Section 21E of the Securities Exchange Act of 1934, as amended (the “Exchange Act”). Forward-looking statements discuss matters that are not historical facts. Because they discuss future events or conditions, forward-looking statements may include words such as “anticipate,” “believe,” “estimate,” “intend,” “could,” “should,” “would,” “may,” “seek,” “plan,” “might,” “will,” “expect,” “anticipate,” “predict,” “project,” “forecast,” “potential,” “continue” negatives thereof or similar expressions. Forward-looking statements speak only as of the date they are made, are based on various underlying assumptions and current expectations about the future and are not guarantees. Such statements involve known and unknown risks, uncertainties and other factors that may cause our actual results, level of activity, performance or achievement to be materially different from the results of operations or plans expressed or implied by such forward-looking statements.
We cannot predict all of the risks and uncertainties. Accordingly, such information should not be regarded as representations that the results or conditions described in such statements or that our objectives and plans will be achieved and we do not assume any responsibility for the accuracy or completeness of any of these forward-looking statements. These forward-looking statements are found at various places throughout this Annual Report on Form 10-K and include information concerning possible or assumed future results of our operations, including statements about potential acquisition or merger targets; business strategies; future cash flows; financing plans; plans and objectives of management; any other statements regarding future acquisitions, future cash needs, future operations, business plans and future financial results, and any other statements that are not historical facts.
These forward-looking statements represent our intentions, plans, expectations, assumptions and beliefs about future events and are subject to risks, uncertainties and other factors. Many of those factors are outside of our control and could cause actual results to differ materially from the results expressed or implied by those forward-looking statements. In light of these risks, uncertainties and assumptions, the events described in the forward-looking statements might not occur or might occur to a different extent or at a different time than we have described. You are cautioned not to place undue reliance on these forward-looking statements, which speak only as of the date of the Annual Report on Form 10-K. All subsequent written and oral forward-looking statements concerning other matters addressed in this Annual Report on Form 10-K and attributable to us or any person acting on our behalf are expressly qualified in their entirety by the cautionary statements contained or referred to in this Annual Report on Form 10-K.
Unless otherwise provided in this Annual Report, references to the “Company,” “Diego,” “we,” “us” and “our” refer to Diego Pellicer Worldwide, Inc.
| 3 |
Business Overview
Diego is a real estate and a consumer retail development company that is focused on developing “Diego Pellicer” as the world’s first “premium” marijuana brand by adhering to the highest quality and standards for its facilities along with both cannabis and non-cannabis products. The Company’s initial focus is to acquire and develop legally compliant real estate locations for the purposes of leasing them to state licensed companies in the cannabis industry. Diego does not grow or sell marijuana or marijuana infused products in the early stages of this plan.
Diego’s initial revenues derive from leasing real estate and selling non-cannabis related products; however, when it is federally legal to do so, Diego will be properly positioned to take advantage of pre-negotiated acquisition contracts with selected Diego tenants in marijuana retail and production facilities throughout the country. Diego’s business model will allow it to become a nationally branded marijuana retailer and producer, instantaneously, with the change of federal law. The Company will not implement this business model until it becomes legal under federal law to sell and produce marijuana.
To operate within the constraints set forth by the US government, the purpose of this business plan is to describe Diego; however, to better describe the future growth plan for the Company, we will also describe the grow and retail operations of other entities with which Diego has pre-negotiated acquisition contracts or plans to have pre-negotiated acquisition contracts in the future. At this time, we only have one pre-negotiated acquisition contract in place with Diego Pellicer, Inc. a Washington Corporation. These external operations are presented as DP Grow and DP Retail, and the results of these operations as presented will not directly benefit Diego until after Federal legalization.
Merger and Share Exchange Agreement
On March 13, 2015 (the “Closing Date”), Diego Pellicer Worldwide, Inc. (f/k/a Type 1 Media, Inc.) (the “Company” or “PubCo”) closed on a merger and share exchange agreement (the “Merger Agreement”) by and among (i) the Company, and (ii) Diego Pellicer World-wide 1, Inc., a Delaware corporation, (“Diego”), and (iii) Jonathan White, the majority shareholder of the Company (the “Majority Shareholder”). Pursuant to the terms of the Merger Agreement, Diego shall be merged with and into the Company, with the Company to continue as the surviving corporation (the “Surviving Corporation”) in the Merger, and the Company succeeding to and assuming all the rights, assets, liabilities, debts, and obligations of Diego (the “Merger”).
In connection with the closing of the Merger, on the Closing Date, Jonathan White and Thomas Baxter submitted to the Company a resignation letter pursuant to which they resigned from their positions as officers and members of the Board of Directors of the Company. Messrs. White and Baxter’s resignations were not a result of any disagreements relating to the Company’s operations, policies or practices. On the Closing Date, the board of directors of the Company (the “Board”) and the majority stockholders of the Company (the “Shareholders”) accepted the resignations of Messrs. White and Baxter and, contemporaneously appointed: (i) Philip Gay to serve as the Chief Executive Officer and member of the Board of Directors, (ii) Ron Throgmartin to act as Chief Operating Officer, (iii) Nick Roberts to act as Chief Financial Officer; and (iv) Alan Valdes, Douglas Anderson, and Stephen Norris to serve as members of the Board of Directors.
Subsequent to the Merger and Share Exchange Agreement, on May 22, 2015, Philip Gay resigned as the Chief Executive Officer and as a member of the board of directors, and Nick Roberts resigned as Chief Financial Officer. Mr. Gay and Mr. Roberts resignations were not the result of any disagreement with the Company on any matter relating to its operation, policies (including accounting or financial policies), or practices. The board of directors of the Company appointed Ron Throgmartin, the Company’s Chief Operating Officer as the Chief Executive Officer and David R. Wells as the Company’s Interim Chief Financial Officer.
On January 29, 2016, the Board of Directors accepted the resignation of David R. Wells as Chief Financial Officer of the Company. On January 29, 2016, the Board appointed Christopher Strachan, as the Company’s new Chief Financial Officer.
Our Corporate History and Background
Diego Pellicer Inc. was formed in the state of Washington of December 5, 2012, with the intent to produce and sell cannabis in the state of Washington. The Company determined that in order to be successful and avoid any potential violation of federal law, it would form a new corporation that would not produce or sell cannabis directly. Therefore, Diego Pellicer Worldwide, Inc. was formed as a Delaware corporation, on August 26, 2013. The Company was developed to position itself in such a way that if the cannabis industry were to federally legalize, then it would be in an advantageous position to quickly become one of the first luxury integrated brands in the industry. Currently, the Company’s focus is to acquire and develop legally compliant real estate locations for the purposes of leasing them to state licensed companies in the cannabis industry. Diego does not grow or sell marijuana or marijuana infused products at this time.
| 4 |
Mission
At this time, Diego Pellicer is a development stage company and is only in the early stages of implementing its business plan. In states where recreational and/or medical marijuana sales and cultivation is legal under State law, the Company plans to lease property to tenants who will grow and/or sell the highest quality of marijuana. As a tenant of Diego, these operators will have access to Diego’s world class management team with expertise in real estate, retail management, agriculture and USDA experts, legal, marketing and branding, product development and creative teams.
When the US and countries around the world legalize commerce of marijuana on a national and international platform, Diego hopes to be in a position to dominate the marijuana marketplace. Diego will accomplish this by positioning the Company, through its business model, to be the first fully integrated marijuana retail operation and premium brand, known for its beautifully designed user friendly retail stores offering the finest quality products at competitive prices, when the US and other countries legalize the sale of marijuana.
Philosophy
We believe that legalizing marijuana, regulating it and taxing it, will cause less harm and do more good than the prohibition environment. We believe marijuana should be elevated to its proper place among other legal recreational intoxicants such as fine wines, liquors, beers, cigars, etc. There is an overwhelming amount of scientific evidence that supports our philosophy, as well as a growing number of supporters ranging from high-ranking US and foreign politicians to prominent figures in the entertainment industry. In addition, we believe that legalization will help unlock the phenomenal power of cannabis as a medicinal treatment for numerous ailments from headaches to cancer.
Brand History
Diego Pellicer was a Spanish colonial vice governor of Cebu, a major island in the Philippine archipelago. He grew to become the largest grower of hemp in the world and is our name sake. He serves as an inspiration to our executive team, as well as distinctive brand befitting the quality of Diego Pellicer Worldwide.
Vision
Our vision is to continue to develop Diego Pellicer as a premium brand that is valued and positioned to appeal to a broad customer base.
In addition, Diego believes that in the very near future, the US and other countries will embrace the will of the people, and legalize the responsible adult use of marijuana. Legalizing national and international commerce of marijuana, will allow Diego to take its brand and unmatched quality standards to markets all around the globe.
Value Proposition
The initial value proposition of Diego consists of a standardized approach to the build-outs of real estate holdings, customized for premium marijuana grow and retail operations. The build-out model is optimized to maximize resources while minimizing costs and overhead. With each build-out, Diego pre-negotiates with select tenants, acquisition contracts with licensed DP Grow and DP Retail tenants, which, upon changes to federal law, introduces our second value proposition—ownership of operations from seed to sale in an industry that is projected to exceed $8 billion by 2018 and we hope will soon rival that of traditional markets such as tobacco and alcohol.
Market Size
The US state-sanctioned medical and recreational marijuana market generated a total revenue of $5.4 billion in 2015, boosted by an incredible growth in the recreational sector of sales, from $351M to $998M, an estimated increase of 184% over 2014. By comparison, the marijuana market is less than 3% of the US tobacco market, a $144 billion market that has no medicinal value, and less than 3% of the alcohol market, which valued at $113.5 billion in 2014 (Marijuana Business Daily 2016; 2016 Statistic Brain Research Institute). As states legalize marijuana, and international markets develop, the emerging legalized marijuana industry will begin to rival that of tobacco and alcohol and could see $45B in revenues by 2020.
Target Geographies
Diego has entered a rapid growth and expansion stage in its evolution toward becoming an internationally recognized brand. The target geographies for Diego are all US states in which recreational or medicinal marijuana is legalized. This is a phased implementation that carefully pre-stages funding and materials to be first to market, as each state rules on legalization. In certain scenarios, Diego may choose to allow weak competitors to fail, making available prime real estate that otherwise would be inaccessible.
Target Consumers
There are an estimated 1.5 million medical marijuana patients in the US and more than 4,500 retailers. California and Washington have the largest number of marijuana patients at more than 775,000 for each state, followed by Michigan at 344,000 and Colorado with 107,534. (Marijuana Business Daily 2016).
The demographics for consumers that have tried marijuana at least once, range between ages 18 to 49, with the greatest numbers between the ages 26 and 34. These consumers are predominantly male and college educated.
| 5 |
Alaska has the fastest growing population of potential consumers, followed by Washington DC, Colorado, New Mexico and Hawaii, with Washington just a few points below. In 2012, Montana, Colorado, California, and Washington had the greatest increase in disposable income, thus increasing the breadth of target consumers.
Material Agreements
On April 19, 2014, the Company entered into a commercial agreement and merger agreement with Diego Pellicer, Inc., a Washington corporation (“Diego Washington”). Diego Washington agreed to making a capital contribution from its current investors of not less than $350,000 in the Company and that the Company agreed to offer to the holders of Series A Preferred Stock of Diego Washington and to current holders of convertible promissory notes convertible for shares of Diego Washington, the right to exchange that same number of shares to shares the Company.
On September 19, 2013, the Company entered into a Lease Agreement with M-P Properties whereby the Company agreed to lease the property located at 2215 4th Avenue, Seattle, Washington, for a term of five years with an option to renew. The Company agreed to pay $78,000 per year.
On March 1, 2014, the Company entered into a Sublease Agreement with Diego Pellicer, Inc., a Washington entity whereby the Company agreed to sublease the property located at 2215 4th Avenue, Seattle, Washington, for a term of four years.
On June 12, 2014, the Company entered into a Lease Agreement with Shamira, LLC whereby the Company agreed to lease the property located at 4242 Elizabeth Street, Denver, Colorado, for five years with an option to renew. The Company agreed to pay $360,000 per year for the first year of the agreement, with an increase of 3% for year subsequent year.
On August 14, 2014, the Company entered into a Commercial Sublease Agreement with DPCO, Inc., a Colorado corporation, whereby the Company subleased the property located at 4242 Elizabeth Street, Denver, Colorado for a term of five years.
On July 14, 2014, the Company entered into a Lease Agreement with 2949 W. Alameda Ave LLC whereby the Company agreed to lease the property located at 2949 W. Alameda Avenue, Denver, Colorado, for five years with an option to renew. The Company agreed to pay $20,000 per month in rent.
On August 14, 2014, the Company entered into a Sublease Agreement with DPCO, Inc., a Colorado corporation, whereby the Company agreed to sublease the property located at 2949 W. Alameda Avenue, Denver Colorado for a year of five years.
On August 13, 2014, the Company entered into a Sublease Agreement with M and S LLC whereby the Company agreed to lease the property located at 755 South Jason Street, Denver, Colorado, for four years. The Company agreed to pay $25,000 per month in rent.
On August 14, 2014, the Company entered into a Sublease Agreement with DPCO, Inc. a Colorado corporation, whereby the Company subleased the property located at 755 South Jason Street, Denver, Colorado for a term of four years.
Our Industry
We are in a burgeoning industry, centered on the production and sales of medical and recreational marijuana. Diego Pellicer is focused on providing legally compliant retail and production facilities to State licensed operators. In addition, Diego Pellicer offers branding opportunities to state licensed producers and retailers that meet our stringent qualifications.
In addition to providing fully branded and built real estate to qualified tenants, Diego Pellicer offers non-cannabis infused products, apparel, and other tangible products at a wholesale rate. To become a qualified tenant, Diego requires its tenants to strictly adhere to testing and labeling requirements along with all state laws and federal guidelines to assure quality and consistency of marijuana products, ensuring safe sale and consumption. Table 7 provides a list of our current property portfolio.
Our Business Strategy
Market Definition and Roles
The marijuana market consists of medical and recreational regulators, producers, testers, processors, wholesalers, retailers, collectives, consumers and real estate holders. Since data pertaining to specific aspects of marijuana sales, such as processor revenues, is virtually non-existent for the marijuana market, the market is valued according to retail sales data provided by state and federal governing bodies. Below is a brief summary of each role:
| ● | Regulators: State and federal lawmakers. | |
| ● | Producer or Grower: Cash crop farmers and grow shops. | |
| ● | Tester: Testers of marijuana for quality and other required measures. | |
| ● | Processor or Infuser: Processers of marijuana into a commercial product (flower, concentrates, and edibles). | |
| ● | Wholesaler: Buyers from producers or processors that sell in bulk to other processers and retailers. | |
| ● | Retailer: For profit (proprietorship, partnerships, or for-profit business) sellers to consumers and patients. | |
| ● | Collective or Cooperative: Non-profit organizations selling mostly to patients. | |
| ● | Recreational Consumers or Patients (local and marijuana tourist): Consumers of marijuana products, recreationally or by medical prescription. | |
| ● | Real Estate Holdings: Companies that specialize in building-out and managing real estate for all aspects of operations (e.g., grow, retail, processing and packaging, etc.) |
| 6 |
Market Strategy
Our short-term strategy is to profit only from the lease payments of our real estate holdings and from the sale of branded, non-cannabis products. Diego will have pre-negotiated acquisition contracts with selected tenants that trigger only when it is legal, or not illegal, to conduct interstate commerce in marijuana. We intend to enter into branding agreements with our tenants going forward that will require our tenants to have certain quality controls and procedures to ensure our they comply with the law, safety and quality. In addition, part of the vetting process in finding the proper tenant is selecting a tenant that shares the Company’s values and strictly complies with state laws, safety and testing requirements and provides consistent, high-quality products. If the tenants do not comply, they will not be allowed to use the brand. At this time, we have one pre-negotiated acquisition contract in place with Diego Pellicer Worldwide Washington and are in the process of negotiating additional pre-negotiated acquisition contracts with other tenants.
The three pillars of our strategy are:
| 1. | Acquire compliant properties legally, and build-out high-quality marijuana grow and retail locations, and lease these locations to tenants that are stand-alone, independent corporations with the ability to meet Diego Pellicer quality and branding standards | |
| 2. | While initially Diego does not have an ownership stake in grow or retail companies, our strategy is to execute pre-negotiated acquisition contracts with its select tenants whereby Diego has the exclusive option to acquire these independent operator lessees. These options shall only be executed when and if the company deems it sufficiently legal to do so and there is no guarantee these options will be exercised. | |
| 3. | Develop and sell quality non-cannabis ancillary products including apparel, luxury merchandise products, non-cannabis chocolates and pastries, just to name a few. These products will be sold in DP retail outlets where allowed or in proximate independent stores. |
A very important aspect of our marketing plan is to build Diego Pellicer as a luxury brand. This not only enables us to establish further and exploit Diego Pellicer as a premium brand, but also to generate significant revenues off of non-cannabis products.
Market Size
The US marijuana market has experienced rapid, chaotic growth in recent years, which is set to continue beyond the forecast target of 2019 due primarily to regulatory misalignment between state and federal governments.
The marijuana secondary and tertiary markets have not yet been analyzed as sources of revenue; however, emerging secondary markets such as marijuana tourism could become a significant source of income for recreational legal states. As a point of comparison, Holland earns $48.55 billion per year in tourist dollars. Of the 10 million tourists, 5.5 million or 55% of tourists visit bars and cafes, generating a total of nearly $27 billion and 220,000 jobs (NBTC, 2009). This equals roughly 30% of all business revenue generated in Washington state in 2012 (Washington State Department of Revenue, 2014).
The US state-sanctioned medical and recreational marijuana market generated a total revenue of $5.4 billion in 2015, boosted by an incredible growth in the recreational sector of sales, from $351M to $998M.=, an estimated increase of 184% over 2014. By comparison, the marijuana market is less than 3% of the US tobacco market, a $144 billion market that has no medicinal value, and less than 3% of the alcohol market, which valued at $113.5 billion in 2014 (2016 Statistic Brain Research Institute). As states legalize marijuana, and international markets develop, the emerging legalized marijuana industry will begin to rival that of tobacco and alcohol and could see $45B in revenues by 2020.
Marijuana has become a major issue in state elections as voters are seeking politicians that support legalization (Gutwillig, 2014). As states legalize marijuana, and international markets develop, the emerging legalized marijuana industry will begin to rival that of tobacco and alcohol. Table 1 summarizes 2016 estimated revenues generated by marijuana retail sales based on a number of sources, including state marijuana program reports.
| 7 |
Table 1: Projected US Marijuana Retail Sales, 2016
| State | 2016 | |||
| Alaska | $ | 40,000,000 | ||
| Arizona | $ | 300,000,000 | ||
| California | $ | 1,000,000,000 | ||
| Colorado | $ | 1,100,000,000 | ||
| Connecticut | $ | 18,000,000 | ||
| DC | $ | 8,000,000 | ||
| Delaware | $ | 2,000,000 | ||
| Hawaii | $ | 22,000,000 | ||
| Illinois | $ | 25,000,000 | ||
| Maine | $ | 35,000,000 | ||
| Maryland | $ | 35,000,000 | ||
| Massachusetts | $ | 32,000,000 | ||
| Michigan | $ | 170,000,000 | ||
| Minnesota | $ | 8,000,000 | ||
| Montana | $ | 4,000,000 | ||
| Nevada | $ | 32,000,000 | ||
| New Hampshire | $ | 4,000,000 | ||
| New Jersey | $ | 16,000,000 | ||
| New Mexico | $ | 47,000,000 | ||
| New York | $ | 13,000,000 | ||
| Oregon | $ | 340,000,000 | ||
| Rhode Island | $ | 24,000,009 | ||
| Vermont | $ | 5,000,000 | ||
| Washington | $ | 775,000,000 | ||
Source: (Marijuana Business Daily 2016; Illinois Cannabis Patients Association, 2010; Leal, 2014; Marijuana Business Daily, 2013)
Figure 2 illustrates the market structure by state and estimated retail sales revenues for 2016. Of the 24 states in which marijuana is legal, Colorado is expected to generated the most revenue at $51,100M, followed by California at $1,000M and Washington at $775M. Most States operating in 2014 experienced double and triple digit growth into 2015, with the exception to California, which has leveled out.
Figure 1 Estimated US Marijuana Retail Sales, 2016

Various industry reports estimate that marijuana sales could generate as much as $8.7 billion in state and federal taxes; however, data to support that estimate is not yet available. (Marijuana Business Daily 2016)
Market Growth
The performance of the market is forecast to accelerate, with an anticipated growth of an average of 27% over the next four years to an expected market value greater than $45 billion by the end of 2020. Table 2 and Figure 3 provide estimated market growth from 2011 to 2018. This growth assumes that no additional states legalize. If additional states legalize, growth estimates will likely increase significantly.
| 8 |
Table 2: US Industry Estimates, 2013 to 2018
| 2011 | 2012 | 2013 | 2014 | 2015 | 2016 | 2017 | 2018 | |||||||||||||||||||||||||
| Medicinal | 1.5 | 1.2 | 1.6 | 1.9 | 2.3 | 2.9 | 3.5 | 4 | ||||||||||||||||||||||||
| Recreational | 0.07 | 1.4 | 2 | 2.5 | 4.2 | |||||||||||||||||||||||||||
| Total | 1.5 | 1.2 | 1.6 | 1.97 | 3.7 | 4.9 | 6 | 8.2 | ||||||||||||||||||||||||
Billions of Dollars, US
Source: (Brown and Resnick, 2013; California Department of Public Health, 2014b; CannaBusiness Media, 2014; Colorado Office of Research and Analysis, 2013a, 2013b, 2013d, 2013e, 2014; Fairchild, 2013a, 2013b; Galvin, 2013; Illinois Cannabis Patients Association, 2010; Leal, 2014; Marijuana Business Daily, 2013; Office of Financial Management, 2012)
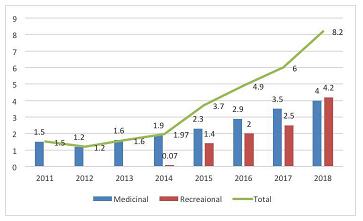
Figure 3: US Industry Estimates, 2011 to 2018
Market Distribution
Market distribution must be measured indirectly with registered medical consumers and dispensaries. As expected, California has the largest number of marijuana patients at more than 775,000, followed by Michigan at 179,000 and Colorado with 107,000. Washington is at 125,000 registered patients as listed in Table 3 and illustrated in Figure 4. There are currently an estimated 1.5 million medical marijuana patients in the US.
Table 3: Registered Medical Marijuana Patients 2015
| State | Registered Patients | |||
| Alaska | 1,127 | |||
| Arizona | 87,733 | |||
| California | 775,000 | |||
| Colorado | 107,534 | |||
| Connecticut | 8,201 | |||
| DC | 3,577 | |||
| Delaware | 776 | |||
| Hawaii | 13,150 | |||
| Illinois | 4,400 | |||
| Maine | 20,000 | |||
| Massachusetts | 19,000 | |||
| Michigan | 344,000 | |||
| Montana | 30,000 | |||
| New Hampshire | 1,600 | |||
| New Jersey | 6,354 | |||
| New Mexico | 19,629 | |||
| Nevada | 13,561 | |||
| Oregon | 77,620 | |||
| Rhode Island | 12,815 | |||
| Vermont | 2,477 | |||
| Washington | 125,000 | |||
| Estimated Total Patients | 1,508,594 | |||
Source: (Marijuana Business Daily 2016; Illinois Cannabis Patients Association, 2010; Leal, 2014; Marijuana Business Daily, 2013)
| 9 |
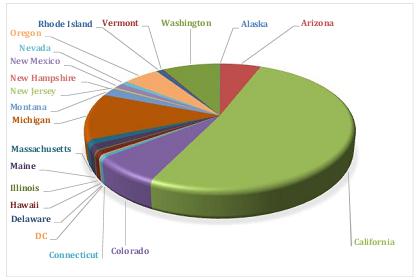
Figure 4: Registered Medical Marijuana Patients
Another indirect measure of market distribution is the number of medical marijuana dispensaries. Table 4 and Figure 5 provide the distribution of dispensaries across the US. The number of patients and dispensaries are mostly aligned; however, certain states such as Michigan have much higher ratio of patients to dispensaries than other states. This could be the result of inaccurate data.
Table 4: Registered Medical Marijuana Dispensaries
| State | Registered Dispensaries | |||
| Alaska | 0 | |||
| Arizona | 98 | |||
| California | 2,000 | |||
| Colorado | 516 | |||
| Connecticut | 6 | |||
| DC | 5 | |||
| Delaware | 1 | |||
| Hawaii | 0 | |||
| Illinois | 28 | |||
| Maine | 8 | |||
| Massachusetts | 4 | |||
| Michigan | 325 | |||
| Montana | 60 | |||
| New Hampshire | 4 | |||
| New Jersey | 5 | |||
| New Mexico | 29 | |||
| Nevada | 12 | |||
| Oregon | 400 | |||
| Rhode Island | 3 | |||
| Vermont | 4 | |||
| Washington | 800 | |||
| Estimated Total Dispensaries | 4,308 | |||
Source: (Marijuana Business Daily 2016; Illinois Cannabis Patients Association, 2010; Leal, 2014; Marijuana Business Daily, 2013)
| 10 |
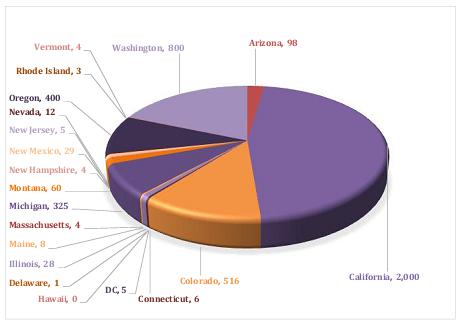
Figure 5: Registered Medical Marijuana Dispensaries
Competitive Analysis and Benchmarking
Diego was one of the first to the market with a real estate holding and branding business model; however, other companies have since adopted similar strategies. Key differentiators between Diego and its competitors are superior branding, optimized build-out and turnkey grow and retail development, and, most importantly, pre-negotiated acquisition contracts. As with other marijuana-related financial data, collecting benchmark data on Diego competitors was especially challenging in that many of these companies fail to report or are unable to report the fundamentals of financial information. Table 5 provides a financial benchmark of Diego’s nearest competitors.
Table 5: 2013 Real Estate Holding and Branding Financial Benchmark-$000
| Market Cap | Rev | Cost of Rev | Gross
Margin % | EBITDA
Margin % | Net Profit | |||||||||||||||||||
| Medbox, Inc. (MDBX) | $ | 258,700 | $ | 5,203 | $ | 2,657 | 51.1 | % | -14.8 | % | $ | (660 | ) | |||||||||||
| Advanced Cannabis Solutions, Inc. (CANN) Grey Market (3 Qtrs) | $ | 59,600 | $ | 129 | $ | 23 | 82.2 | % | (542 | %) | $ | (1,277 | ) | |||||||||||
| Mountain High Acquisitions Corp. (MYHI) OTCQB | $ | 14,300 | - | - | - | $ | (1,336 | ) | ||||||||||||||||
| Agritek Holdings, Inc. (AGTK) | $ | 8,410 | $ | 79 | $ | 86 | 7.6 | % | (1189 | %) | $ | (1,453 | ) | |||||||||||
| Home Treasure Finders, Inc. (HMTF)(MJ real estate lessor) | $ | 4,160 | $ | 203 | $ | 0 | INF | (44 | %) | $ | (92 | ) | ||||||||||||
Source: Finance.yahoo.com and CNBC.com
Tourism Effect
The secondary and tertiary effects of the marijuana market have received little attention by market analyst; however, markets such as marijuana tourism could become a significant source of revenue for recreationally legal states. For example, The Netherlands earns $48.55 billion per year in tourist dollars. Of the 10M tourists, 5.5 million or 55% visit marijuana bars and cafes, generating a total of nearly $27 billion and 220,000 jobs. Likewise, Colorado reported note that marijuana tourism is responsible for 90% of all retail sales in resort towns (Weissmann, 2014).
Peak Sales and Product Segmentation
Peak marijuana sales occur during two calendar periods: December/January and July/August. Smokable Marijuana sales exceed other product categories representing 87% of the market, which is followed by concentrates at 7% and edibles at 4% while drinks, topicals, accessories and clones generate the least amount of revenue at less than 1% each. The top marijuana product according to an analysis of a market leading dispensary is Bruce Banner followed by 303 Kush.
| 11 |
Legalization by State
Support for medical and recreational marijuana use has increased significantly over the past 20 years. According to a recent CNN poll, greater than 50% of the US population supports marijuana legalization. Figure 6 illustrates a select set of CNN poll results.
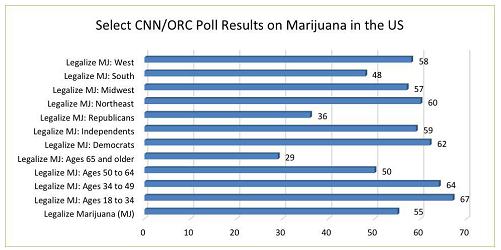
Figure 6: CNN/ORC Poll Results on Marijuana Use in the US
Two states, Colorado and Washington, have passed legislation for recreational marijuana. As the popularity of recreational marijuana becomes more accepted by Americans, it is the Company’s belief that several of the States in which medical marijuana is currently legal will likely follow suit and legalize recreational marijuana. States are learning from one another, refining legislation and establishing realistic tax strategies. The Obama administration has pledged to end Federal raids on state-sanctioned dispensaries (Furlow, 2012). Similar movements are occurring in other democratic countries such as Australia in which several states have decriminalized possession (Thies, 2012). Table 6 lists recreational and medicinal marijuana legalization status by state.
Table 6: State Recreational Marijuana Laws
| State | Status/Year | Type of Legalization | ||||
| Alaska | Passed (2014) | Medical and Recreational | ||||
| Arizona | Passed (2010) | Medical | ||||
| California | Passed (2015) | Medical | ||||
| Colorado | Passed (2012) | Medical and Recreational | ||||
| Connecticut | Decriminalized | Medical | ||||
| Delaware | Decriminalized | Medical | ||||
| Florida | Pending | Medical | ||||
| Hawaii | Passed (2000) | Medical | ||||
| Illinois | Passed (2013) | Medical | ||||
| Maine (Portland only) | Decriminalized (2013) | Medical | ||||
| Maryland | Decriminalized (2014) | Medical | ||||
| Massachusetts | Decriminalized (2012) | Medical | ||||
| Michigan | Passed | Medical | ||||
| Minnesota | Passed (2014) | Medical | ||||
| Mississippi | Pending | Pending | ||||
| Montana | Decriminalized | Medical | ||||
| Nebraska | Pending | Pending | ||||
| Nevada | Passed (2000) | Medical | ||||
| New Hampshire | Passed (2013) | Medical | ||||
| New Jersey | Passed (2010) | Medical | ||||
| New Mexico | Passed (2007) | Medical | ||||
| New York | Passed (2014) | Medical | ||||
| North Carolina | Pending | Medical | ||||
| Ohio | Decriminalized | Medical | ||||
| Oregon | Passed (2015) | Medical and Recreational | ||||
| Pennsylvania | Pending | Medical | ||||
| Rhode Island | Decriminalized | Medical | ||||
| Vermont | Decriminalized (2013) | Medical | ||||
| Washington | Passed (2012) | Medical and Recreational | ||||
| Washington DC | Decriminalized | Medical |
Source: (Marijuana Business Daily 2016; California State Board of Equalization, 2009; Gacek, 2014; ProCon.org, 2014; U.S. Office of National Drug Control Policy, 2014)
| 12 |
Target Geographies
Diego has entered a rapid growth and expansion stage in its evolution toward becoming an internationally recognized brand. The target geographies for Diego are all US states in which recreational or medicinal marijuana is legalized. This is a phased implementation that carefully pre-stages funding and materials to be first to market, as each state rules on legalization. In certain scenarios, Diego may choose to allow weak competitors to fail, making available prime real estate that otherwise would be inaccessible.
Target Consumers
There are an estimated 1.5M medical marijuana patients in the US and over 5,000 retailers. California has the largest number of marijuana patients at more than 775,000, followed by Colorado with 625,000 and Michigan at 179,000. Washington is a close 4th at 125,000 registered patients.
The demographics for consumers that have tried marijuana at least once, range between ages 18 to 49, with the greatest numbers between the ages 26 and 34. These consumers are predominantly male, and college educated.
Alaska has the fastest growing population of potential consumers, followed by Washington DC, Colorado, New Mexico and Hawaii, with Washington just a few points below. In 2012, Montana, Colorado, California, and Washington had the greatest increase in disposable income, thus increasing the breadth of target consumers.
Future Markets
Studies on marijuana use in The Netherlands have demonstrated that the availability of marijuana in café’s has had very little effect on increasing or decreasing marijuana use (MacCoun, 2011). As such, the next progression in the US market, following Federal legalization, is the establishment of café’s or other types of service centers for marijuana consumption. The number of café’s in The Netherlands has ranged between 700 and 800 over the past 15 years, and currently operates about 700 or 1 per 29,000 citizens, employing 4,000 workers and generating $832.2M annually (Monshouwer, Van Laar, and Vollebergh, 2011). Extrapolating this to the US market would indicate approximately 10,000 café’s and service centers where actual consumption of cannabis can take place.
Primary Service
Our primary service is fully branded and built real estate to qualified tenants. Our branding includes non-cannabis infused products, apparel, and other tangible products at a wholesale rate. To become a qualified tenant, Diego requires its tenants to strictly adhere to testing and labeling requirements along with all state laws and federal guidelines to assure quality and consistency of marijuana products, ensuring safe sale and consumption. Table 7 provides a list of our current property portfolio.
Table 7: Property Portfolio
| Purpose | Size | City | State | |||||||||
| Retail (recreational and medical) | 3,300 sq.ft. | Denver | CO | |||||||||
| Grow Warehouse | 18,600 sq.ft. | Denver | CO | |||||||||
| Grow Warehouse | 14,800 sq.ft. | Denver | CO | |||||||||
| Flagship recreational MJ store w/café and apparel | 4,500 sq.ft. | Seattle | WA |
Diego Pellicer creates a user friendly customer experience regardless of venue or form of media making it easy and safe for them to purchase. A major aspect of our marketing plan is to inform and educate consumers in a way that allows them to rely on DP as a trusted and valued brand. DP information and products will be available in all forms of media with a variety of different forms of content including videos, social media, online newsletters and blogs and TV.
| ● | Consumers will find Diego on websites and via online syndication at web portals, mobile and video destinations (Yahoo!, MSN, Google/YouTube, Hulu, Verizon, etc.) as a dedicated selling platform that will serve Diego created video as information and entertainment. The Company will not develop a website that sells marijuana or marijuana-infused products. | |
| ● | Consumers will find our custom content via a cooperative syndication platform in which product partners leverage each other’s audiences for the distribution of their content and products. | |
| ● | Through events in Diego stores and outlets | |
| ● | Mass audiences could find Diego on network or cable television as the setting for a reality show or documentary series. | |
| ● | Mobile marketing and Mobile apps |
This will give our brand, products and content the flexibility and portability that consumers demand. This digital syndication strategy will be executed through a series of revenue sharing deals with partners through viral seeding strategies and via paid media through specific targeted websites and venues.
| 13 |
Revenue Generation and Growth
Diego generates current revenue and stages future revenue streams through the following processes:
| ● | Acquire via lease or purchase, target properties to be improved for the growing, processing, distribution, and sale of medical and recreational marijuana, extracts and ancillary products. | |
| ● | Sub-leases or leases these properties to state licensed operators. | |
| ● | Capitalizes, where possible, on the build-out and leases near turnkey Retail, Processing and/or Growing facilities. | |
| ● | Creates future merger agreements with those operators deem capable of carrying the Diego brand. | |
| ● | Hold Merger Agreements with Diego and other favored partners that will trigger when marijuana commerce becomes legal (or not illegal) federally. | |
| ● | Own DP Brands and other Intellectual Property (IP) in all places filed. | |
| ● | Charge reasonable Market Net-Rents to the store owners/Operators to recover all build-out and start-up investment plus profit margin over the first lease term (generally five years.) | |
| ● | Sell non-cannabis branded products lines such as apparel and edibles at wholesale to leased stores. | |
| ● | Create an e-commerce platform selling non-cannabis branded merchandise | |
| ● | Continue to build and market the brand utilizing all forms of media including traditional and digital media, social media, e-commerce, and strategic partners. |
U.S. Federal Law
While marijuana is legal under the laws of several U.S. States (with vastly differing restrictions), at the present time, the concept of “medical marijuana” and “retail marijuana” do not exist under U.S. federal law. The United States Federal Controlled Substances Act classifies “marijuana” as a Schedule I drug. Under U.S. federal law, a Schedule I drug or substance has a high potential for abuse, no accepted medical use in the United States, and a lack of safety for the use of the drug under medical supervision.
The United States Supreme Court has ruled in a number of cases that the federal government does not violate the federal constitution by regulating and criminalizing cannabis, even for medical purposes. Therefore, federal law criminalizing the use of marijuana pre-empts state laws that legalizes its use for medicinal purposes.
In a memorandum dated August 29, 2013 addressed to “All United States Attorneys” from James M. Cole, Deputy Attorney General (“Cole Memo”), the U.S. Department of Justice acknowledged that certain U.S. States had enacted laws relating to the use of marijuana and outlined the U.S. federal government’s enforcement priorities with respect to marijuana notwithstanding the fact that certain U.S. States have legalized or decriminalized the use, sale and manufacture of marijuana:
| ● | Preventing the distribution of marijuana to minors; | |
| ● | Preventing revenue from the sale of marijuana from going to criminal enterprises, gangs, and cartels; | |
| ● | Preventing the diversion of marijuana from U.S. states where it is legal under state law in some form to other U.S. states; | |
| ● | Preventing U.S. state-authorized marijuana activity from being used as a cover or pretext for the trafficking of other illegal drugs or other illegal activity; | |
| ● | Preventing violence and the use of firearms in the cultivation and distribution of marijuana; | |
| ● | Preventing drugged driving and the exacerbation of other adverse public health consequences associated with marijuana use; | |
| ● | Preventing the growing of marijuana on public lands and the attendant public safety and environmental dangers posed by marijuana production on public lands; and | |
| ● | Preventing marijuana possession or use on U.S. federal property. |
There is no guarantee that the current presidential administration will not change its stated policy regarding the low-priority enforcement of U.S. federal laws that conflict with state laws. Additionally, any new U.S. federal government administration that follows could change this policy and decide to enforce the U.S. federal laws vigorously. Any such change in the U.S. federal government’s enforcement of current U.S. federal laws could cause adverse financial impact to the Company’s business. See “Risk Factors.”
In February 2014, FinCEN issued guidelines allowing banks to legally provide financial services to Licensed Operators that hold a valid License (“FinCEN Memo”). The rules re-iterated the guidance provided by the Cole Memo, stating that banks can do business with Licensed Operators and “may not” be prosecuted. The guidelines provide that “it is possible [for the banks] to provide financial services” to Licensed Operators and while remaining in compliance with federal anti-money laundering laws. The guidance falls short of the explicit legal authorization that banking industry officials anticipated and the outcome of the banks relying on this guidance in transacting with Licensed Operators is currently unclear. See “Risk Factors.”
| 14 |
Employees
We presently have 5 full-time employees and 0 part-time employees. We consider our relationship with our employees to be excellent. We also had independent consultants under contract to provide financial management services, business development services, and sales management services. In addition to the diverse technical, intellectual property, legal, financial, marketing and business expertise of our professional team, from time to time we rely on advice from outside specialists to fulfill unique technology and other needs.
We are a smaller reporting company as defined by Rule 12b-2 of the Exchange Act and are not required to provide the information under this item.
Item 1B. Unresolved Staff Comments
None.
Our principal executive office is located at 3435 Ocean Park Blvd., #107-610, Santa Monica, CA 90405, and our telephone number is (516) 900-3799.
From time to time, we may become involved in various lawsuits and legal proceedings which arise in the ordinary course of business. However, litigation is subject to inherent uncertainties and an adverse result in these or other matters may arise from time to time that may harm our business. We are currently not aware of any such legal proceedings or claims that we believe will have a material adverse effect on our business, financial condition or operating results.
Item 4. Mine Safety Disclosures
Not applicable.
| 15 |
Item 5. Market for Registrant’s Common Equity, Related Stockholder Matters and Issuer Purchases of Equity Securities
There is no established public trading market for our Common Stock. As of the date of this Report, there are outstanding options and warrants to purchase 3,425,798 shares of Common Stock of the Registrant.
Record Holders
As of April 19, 2016, there were approximately 143 shareholders of record holding a total of 41,572,082 shares of Common Stock. The holders of the Common Stock are entitled to one vote for each share held of record on all matters submitted to a vote of shareholders. Holders of the Common Stock have no preemptive rights and no right to convert their Common Stock into any other securities. There are no redemption or sinking fund provisions applicable to the Common Stock.
Dividends
The Registrant has not declared any cash dividends since inception and does not anticipate paying any dividends in the foreseeable future. The payment of dividends is within the discretion of the Board of Directors and will depend on the Company’s earnings, capital requirements, financial condition and other relevant factors. There are no restrictions that currently limit the Registrant’s ability to pay dividends on its Common Stock other than those generally imposed by applicable state law.
Unregistered Sale of Equity Securities
In November 2015, the Company issued 1,100,000 shares of common stock to a third party for service rendered and 3,381,251 shares of common stock for cash received in amount of 1,014,374.
| 16 |
Item 6. Selected Financial Data
We are a smaller reporting company as defined by Rule 12b-2 of the Exchange Act and are not required to provide the information under this item.
Diego Pellicer Worldwide, Inc.
December 31, 2015 and 2014
Index to the Consolidated Financial Statements
| 17 |
REPORT OF INDEPENDENT REGISTERED PUBLIC ACCOUNTING FIRM
The Board of Directors and Stockholders
Diego Pellicer Worldwide, Inc.
| F-1 |
Diego Pellicer Worldwide, Inc.
| December 31, 2015 | December 31, 2014 | |||||||
| ASSETS | ||||||||
| Current Assets: | ||||||||
| Cash and equivalents | $ | 36,001 | $ | 33,101 | ||||
| Accounts receivable | 1,110 | - | ||||||
| Prepaid expenses | - | 8,946 | ||||||
| Inventory | 80,971 | - | ||||||
| Other receivable | 17,817 | - | ||||||
| Total current assets | 439,667 | 42,047 | ||||||
| Property and Equipment, net | 838,754 | 253,990 | ||||||
| Other Assets: | ||||||||
| Investments, at cost, net of impairment of $408,900 and $0 | 116,667 | 525,567 | ||||||
| Security deposits | 173,000 | 173,000 | ||||||
| Deposits - end of lease | 150,000 | 150,000 | ||||||
| Total other assets | 439,667 | 848,567 | ||||||
| Total assets | $ | 1,414,320 | $ | 1,144,604 | ||||
| Liabilities and Stockholder’s Deficiency | ||||||||
| Current liabilities: | ||||||||
| Accounts payable and accrued expense | $ | 585,997 | $ | 298,939 | ||||
| Accrued expenses - related party | 511,454 | 124,333 | ||||||
| Accrued compensation | 6,250 | 1,176,563 | ||||||
| Deferred rent | 120,234 | - | ||||||
| Deferred revenue | 53,000 | 53,000 | ||||||
| Note Payable | 846,628 | - | ||||||
| Convertible debt | 300,000 | - | ||||||
| Derivative Liabilities | 208,795 | - | ||||||
| Total current liabilities | 2,632,358 | 1,652,835 | ||||||
| Deferred Revenue | 370,000 | 424,000 | ||||||
| Total liabilities | 3,002,358 | 2,076,835 | ||||||
| Stockholder’s Deficiency | ||||||||
| Series A and B Preferred Stock, $0.0001 par value, 5,000,000 shares authorized, 0 and 5,036,769 shares issued and outstanding as of December 31, 2015 and 2014, respectively | - | 5 | ||||||
| Common Stock, $0.000001 par value, 95,000,000 shares authorized, 37,805,416 shares were issued and outstanding as of December 31, 2015, and 13,520,000 shares issued and outstanding as of December 31, 2014 | 38 | 14 | ||||||
| Treasury stock at cost, 0 and 58,200 shares as of December 31, 2015 and 2014, respectively | - | (87,300 | ) | |||||
| Additional paid-in capital | 20,111,077 | 4,335,816 | ||||||
| Accumulated deficit | (21,699,153 | ) | (5,180,766 | ) | ||||
| Total stockholder’s deficiency | (1,588,038 | ) | (932,231 | ) | ||||
| Total liabilities and stockholder’s equity | $ | 1,414,320 | $ | 1,144,604 | ||||
See accompanying notes to the consolidated financial statements
| F-2 |
Diego Pellicer Worldwide, Inc.
Consolidated Statements of Comprehensive Loss
| For
The Year Ended | For
The Year Ended | |||||||
| December 31, 2015 | December 31, 2014 | |||||||
| REVENUES | ||||||||
| Rental income | $ | 1,059,631 | $ | 497,638 | ||||
| Licensing revenue | 54,000 | 48,567 | ||||||
| Provision for uncollectible rents | (809,101 | ) | (497,638 | ) | ||||
| Total Revenues | 304,530 | 48,567 | ||||||
| Cost of Good Sold | - | - | ||||||
| COSTS AND EXPENSES (other income) | ||||||||
| General and administrative expenses | 14,268,072 | 3,624,507 | ||||||
| Impairment of investment | 408,900 | - | ||||||
| Rent expense | 1,228,028 | 487,533 | ||||||
| Write-off credit line receivable (net of interest income) | 240,000 | 777,846 | ||||||
Change in fair value of derivative liabilities | (133,809 | ) | ||||||
Interest expense (income), net | 811,726 | (73,198 | ) | |||||
| Total Costs and Expenses | 16,822,917 | 4,816,688 | ||||||
| Loss before provision for taxes | (16,518,387 | ) | (4,768,121 | ) | ||||
| Provision for taxes | - | - | ||||||
| NET LOSS | $ | (16,518,387 | ) | $ | (4,768,121 | ) | ||
| Loss per share - basic and fully diluted | $ | (0.65 | ) | $ | (0.35 | ) | ||
| Weighted average common shares outstanding - basic and fully diluted | 25,485,231 | 13,520,000 | ||||||
See accompanying notes to the consolidated financial statements
| F-3 |
Diego Pellicer Worldwide, Inc.
Consolidated Statement of Stockholders’ Deficit
For the Year Ended December 31, 2015 and 2014
| SHARES | $ | |||||||||||||||||||||||||||||||||||||||||||
| Common | Treasury | Preferred | Common | Treasury | Preferred | Additional | Accumulated | Common Stock | Subscription | |||||||||||||||||||||||||||||||||||
| Shares | Shares | Shares | Shares | Shares | Shares | Paid-in Capital | Deficit | to be issued | Receivable | Total | ||||||||||||||||||||||||||||||||||
| Balance - December 31, 2013 | 13,520,000 | - | 561,676 | 14 | - | 1 | 528,357 | (412,646 | ) | - | (1,352 | ) | 114,374 | |||||||||||||||||||||||||||||||
| Sale of Preferred stock and warrants | - | - | 4,475,093 | - | - | 4 | 3,807,460 | - | - | - | 3,807,464 | |||||||||||||||||||||||||||||||||
| Treasury shares acquired | - | (58,200 | ) | - | - | (87,300 | ) | - | - | - | - | - | (87,300 | ) | ||||||||||||||||||||||||||||||
| Subscription received | - | - | - | - | - | - | - | - | 1,352 | 1,352 | ||||||||||||||||||||||||||||||||||
| Net Loss | - | - | - | - | - | - | - | (4,768,120 | ) | - | - | (4,768,120 | ) | |||||||||||||||||||||||||||||||
| Balance - December 31, 2014 | 13,520,000 | (58,200 | ) | 5,036,769 | 14 | (87,300 | ) | 5 | 4,335,817 | (5,180,766 | ) | - | - | (932,230 | ) | |||||||||||||||||||||||||||||
| Sale of Preferred stock | - | - | 753,332 | - | - | 75 | 1,129,916 | - | - | - | 1,129,991 | |||||||||||||||||||||||||||||||||
| Sale of Common stock | 3,881,251 | - | - | 4 | 1,164,371 | 1,164,375 | ||||||||||||||||||||||||||||||||||||||
| Effect of reverse merger | 7,743,333 | - | 50,996 | 8 | - | - | - | - | - | - | 8 | |||||||||||||||||||||||||||||||||
| Cancellation of Treasury Shares | (58,200 | ) | 58,200 | - | - | 87,300 | - | (87,300 | ) | - | - | - | - | |||||||||||||||||||||||||||||||
| Conversion of Preferred shares to common | 5,841,097 | - | (5,841,097 | ) | 6 | - | (80 | ) | 74 | - | - | - | - | |||||||||||||||||||||||||||||||
| Issuance of common shares for consulting services | 4,699,355 | - | - | 3 | - | - | 9,523,905 | - | - | - | 9,523,908 | |||||||||||||||||||||||||||||||||
| Common stock issued for note payable | 126,000 | - | - | - | - | - | 84,000 | - | - | - | 84,000 | |||||||||||||||||||||||||||||||||
| Non-employee stock compensation | 2,052,580 | - | - | 3 | - | - | 3,069,561 | - | - | - | 3,069,564 | |||||||||||||||||||||||||||||||||
| Warrants issued for services | - | - | - | - | - | - | 574,250 | - | - | - | 574,250 | |||||||||||||||||||||||||||||||||
| Warrants issued for note | - | - | - | - | - | - | 316,483 | - | - | - | 316,483 | |||||||||||||||||||||||||||||||||
| Net Loss | - | - | - | - | - | - | - | (16,518,387 | ) | - | - | (16,745,350 | ) | |||||||||||||||||||||||||||||||
| Balance - December 31, 2015 | 37,805,416 | - | - | 38 | - | - | 20,111,077 | (21,699,153 | ) | - | - | (1,588,038 | ) | |||||||||||||||||||||||||||||||
See accompanying notes to the consolidated financial statements
| F-4 |
Diego Pellicer Worldwide, Inc.
Consolidated Statements of Cash Flows
| For the Year Ended | For the Year Ended | |||||||
| December 31, 2015 | December 31, 2014 | |||||||
| Operating Activities | ||||||||
| Net Loss | $ | (16,518,387 | ) | $ | (4,768,121 | ) | ||
| Adjustments to reconcile Net Loss to net cash provided by Operations: | ||||||||
| Amortization of deferred revenue | (54,000 | ) | (48,567 | ) | ||||
| Amortization of debt discount | 400,483 | - | ||||||
| Interest Income | - | (70,596 | ) | |||||
| Accrued expenses - related party | 387,121 | 48,603 | ||||||
| Interest on convertible note | 342,604 | - | ||||||
| Change in derivative | (133,809 | ) | - | |||||
| Impairment of investment | 408,900 | - | ||||||
| Non-cash stock compensation | 13,167,772 | 1,176,563 | ||||||
| Write-off credit line receivable (includes interest income) | 200,000 | 777,846 | ||||||
| Changes in operating assets and liabilities: | ||||||||
| Prepaid Expenses | 8,946 | (1,140 | ) | |||||
| Deferred rent | 120,234 | - | ||||||
| Inventory | (80,971 | ) | - | |||||
| Other receivable | (17,817 | ) | - | |||||
| Accounts Receivable | (1,110 | ) | - | |||||
| Accrued compensation | (1,170,313 | ) | - | |||||
| Accounts Payable | 287,059 | 283,368 | ||||||
| Net cash used in operating activities | (2,653,338 | ) | (2,602,044 | ) | ||||
| Investing Activities | ||||||||
| (Advances to) repayment from related party | - | 54,341 | ||||||
| Acquisition of property and equipment | (584,764 | ) | (253,990 | ) | ||||
| Security deposits | - | (153,000 | ) | |||||
| Deposits - end of lease | - | (150,000 | ) | |||||
| Advances under line of credit | (200,000 | ) | (707,250 | ) | ||||
| Net cash used in investing activities | (784,764 | ) | (1,209,899 | ) | ||||
| Financing Activities | ||||||||
| Proceeds from sale of Preferred stock and warrants | 1,129,999 | 3,807,908 | ||||||
| Collection of subscriptions receivable | - | 1,352 | ||||||
| Proceeds from (repayment) of loan - related party | - | (17,000 | ) | |||||
| Acquisition of treasury stock | - | (87,300 | ) | |||||
| Proceed from note payable | 846,628 | - | ||||||
| Proceed from convertible note payable | 300,000 | - | ||||||
| Proceed from sale of common stock | 1,164,375 | - | ||||||
| Net cash provided by financing activities | 3,441,002 | 3,704,960 | ||||||
| Net Increase (Decrease) in Cash | 2,900 | (106,983 | ) | |||||
| Cash - beginning of period | 33,101 | 140,084 | ||||||
| Cash - end of the period | $ | 36,001 | $ | 33,101 | ||||
See accompanying notes to the consolidated financial statements
| F-5 |
Diego Pellicer Worldwide, Inc.
December 31, 2015 and 2014
Notes to the Consolidated Financial Statements
Note 1 – Organization and Operations
History
On March 13, 2015 (“closing date”), Diego Pellicer Worldwide, Inc. (f/k/a Type 1 Media, Inc.) (the “Company”) closed on a merger and share exchange agreement (the “Merger Agreement”) by and among (i) the Company, and (ii) Diego Pellicer World-wide 1, Inc., a Delaware corporation, (“Diego”), and (iii) Jonathan White, the majority shareholder of the Company (the “Majority Shareholder”). Pursuant to the terms of the Merger Agreement, Diego was merged with and into the Company, with the Company to continue as the surviving corporation (the “Surviving Corporation”) in the Merger, and the Company succeeding to and assuming all the rights, assets, liabilities, debts, and obligations of Diego (the “Merger”).
Prior to the merger, Type 1 had 62,700,000 shares issued and outstanding. The principal owners of the company have agreed to transfer their 55,000,000 issued and outstanding shares to a third party in consideration for $169,000 and cancellation of their 55,000,000 shares. The remaining issued and outstanding shares are still available for trading in the marketplace. At the time of the merger, Type 1 had no assets or liabilities. Accordingly, the business conducted by Type 1 prior to the Merger is not being operated by the combined entity post-Merger.
At the closing of the Merger, Diego common stock issued and outstanding immediately prior to the closing of the Merger was exchanged for the right to receive 1 share of the surviving legal entity. An aggregate of 21,632,252 common shares of the surviving entity were issued to the holders of Diego in exchange for their common shares, representing approximately 74% of the combined entity.
The Merger has been accounted for as a reverse merger and recapitalization in which Diego is treated as the accounting acquirer and Diego Pellicer Worldwide, Inc. (f/k/a Type 1 Media, Inc.) is the surviving legal entity.
Business Operations
The Company leases real estate to licensed marijuana operators, including but not limited to, providing complete turnkey growing space, processing space, recreational and medical retail sales space and related facilities to licensed marijuana growers, processors, dispensary and recreational store operators. Additionally, the Company plans to explore ancillary opportunities in the regulated marijuana industry as well as offering for wholesale distribution branded non-marijuana clothing and accessories.
The Company does not and will not, until such time as Federal law allows, grow, harvest, process, distribute or sell marijuana or any other substances that violate the laws of the United States of America, or any other country.
Note 2 – Significant and Critical Accounting Policies and Practices
The Management of the Company is responsible for the selection and use of appropriate accounting policies and the appropriateness of accounting policies and their application. Critical accounting policies and practices are those that are both most important to the portrayal of the Company’s financial condition and results and require management’s most difficult, subjective, or complex judgments, often as a result of the need to make estimates about the effects of matters that are inherently uncertain. The Company’s significant and critical accounting policies and practices are disclosed below as required by generally accepted accounting principles.
Basis of Presentation
The Company’s consolidated financial statements have been prepared in accordance with accounting principles generally accepted in the United States of America (“U.S. GAAP”).
New accounting pronouncements
From time to time, new accounting pronouncements are issued by the Financial Accounting Standards Board or other standard setting bodies that may have an impact on the Company’s accounting and reporting. The Company believes that such recently issued accounting pronouncements and other authoritative guidance for which the effective date is in the future either will not have an impact on its accounting or reporting or that such impact will not be material to its financial position, results of operations and cash flows when implemented.
| F-6 |
Use of Estimates
The preparation of the financial statements in conformity with GAAP requires management to make estimates and assumptions that affect the reported amounts of assets and liabilities and disclosure of contingent assets and liabilities at the dates of the financial statements and the reported amounts of revenue and expenses during the reporting periods. Actual results could differ from those estimates. These estimates and assumptions include valuing equity securities and derivative financial instruments issued in financing transactions and share based payment arrangements, determining the fair value of the warrants received for the licensing agreement, the collectability of accounts receivable and deferred taxes and related valuation allowances.
Certain of our estimates, including evaluating the collectability of accounts receivable, could be affected by external conditions, including those unique to our industry, and general economic conditions. It is possible that these external factors could have an effect on our estimates that could cause actual results to differ from our estimates. We re-evaluate all of our accounting estimates at least quarterly based on these conditions and record adjustments when necessary.
Derivative Financial Instruments
The Company evaluates its financial instruments to determine if such instruments are derivatives or contain features that qualify as embedded derivatives. For derivative financial instruments that are accounted for as liabilities, the derivative instrument is initially recorded at its fair value and is then re-valued at each reporting date, with changes in the fair value reported in the condensed consolidated statements of operations. The classification of derivative instruments, including whether such instruments should be recorded as liabilities or as equity, is evaluated at the end of each reporting period. Derivative instrument liabilities are classified in the balance sheet as current or non-current based on whether or not net-cash settlement of the derivative instrument could be required within 12 months of the balance sheet date.
Fair value of financial instruments
As required by the Fair Value Measurements and Disclosures Topic of the FASB ASC, fair value is measured based on a three-tier fair value hierarchy, which prioritizes the inputs used in measuring fair value as follows:
Level 1: Unadjusted quoted prices in active markets that are accessible at the measurement date for identical, unrestricted assets or liabilities;
Level 2: Quoted prices in markets that are not active, or inputs that are observable, either directly or indirectly, for substantially the full term of the asset or liability; and
Level 3: Prices or valuation techniques that require inputs that are both significant to the fair value measurement and unobservable (supported by little or no market activity).
Fair value estimates discussed herein are based upon certain market assumptions and pertinent information available to management as of and December 31, 2015 and December 31, 2014. The respective carrying value of certain on-balance-sheet financial instruments approximated their fair values. These financial instruments include cash, prepaid expenses and accounts payable. Fair values were assumed to approximate carrying values for cash and payables because they are short term in nature and their carrying amounts approximate fair values or they are payable on demand.
Cash
The Company maintains cash balances at various financial institutions. Accounts at each institution are insured by the Federal Deposit Insurance Corporation up to $250,000. The Company’s accounts at these institutions may, at times, exceed the federal insured limits. The Company has not experienced any losses in such accounts.
Property and equipment and depreciation policy
Property and equipment are stated at cost less accumulated depreciation. Depreciation is provided for on a straight-line basis over the useful lives of the assets. Expenditures for additions and improvements are capitalized; repairs and maintenance are expensed as incurred.
The Company intends to take depreciation or amortization on a straight-line basis for all properties, beginning when they are put into service, using the following life expectancy:
Equipment – 5 years
Leasehold Improvements – 10 years, or the term of the lease, whichever is shorter
Buildings – 20 years
| F-7 |
Accounts Receivable and Allowance for Doubtful Accounts
Accounts receivable are presented at their face amount, less an allowance for doubtful accounts, on the balance sheets. Accounts receivable consist of revenue earned and currently due from sub lessee. We evaluate the collectability of accounts receivable based on a combination of factors. We recognize reserves for bad debts based on estimates developed using standard quantitative measures that incorporate historical write-offs and current economic conditions. As of December 31, 2015, the outstanding balance allowance for doubtful accounts is zero.
The policy for determining past due status is based on the contractual payment terms of each customer. Once collection efforts by the Company and its collection agency are exhausted, the determination for charging off uncollectible receivables is made.
Revenue recognition
The Company recognizes revenue from rent, tenant reimbursements, and other revenue sources once all of the following criteria are met in accordance with SEC Staff Accounting Bulletin 104, Revenue Recognition , (“SAB 104”): (a) the agreement has been fully executed and delivered; (b) services have been rendered; (c) the amount is fixed or determinable; and (d) the collectability of the amount is reasonably assured.
In accordance with ASC 840 (“Leases”), as amended and interpreted, minimum annual rental revenue is recognized in rental revenues on a straight-line basis over the term of the related lease. Rental revenue recognition commences when the tenant takes possession or controls the physical use of the leased space. In order for the tenant to take possession, the leased space must be substantially ready for its intended use. To determine whether the leased space is substantially ready for its intended use, management evaluates whether the Company or the tenant is the owner of tenant improvements for accounting purposes. When management concludes that the Company is the owner of tenant improvements, rental revenue recognition begins when the tenant takes possession of the finished space, which is when such tenant improvements are substantially complete. In certain instances, when management concludes that the Company is not the owner (the tenant is the owner) of tenant improvements, rental revenue recognition begins when the tenant takes possession of or controls the space.
When management concludes that the Company is the owner of tenant improvements, for accounting purposes, management records the cost to construct the tenant improvements as a capital asset. In addition, management records the cost of certain tenant improvements paid for or reimbursed by tenants as capital assets when management concludes that the Company is the owner of such tenant improvements. For these tenant improvements, management records the amount funded or reimbursed by tenants as deferred revenue, which is amortized as additional rental income over the term of the related lease. When management concludes that the tenant is the owner of tenant improvements for accounting purposes, management records the Company’s contribution towards those improvements as a lease incentive, which is amortized as a reduction to rental revenue on a straight-line basis over the term of the lease.
In January 2014, the Company entered into an agreement to license certain intellectual property to a third party. In consideration, the Company received warrants to purchase shares of common stock, which were valued based on an appraisal of the warrants by an independent third party appraiser. The revenue from the licensing agreement, which is initially recorded as deferred revenue, is being amortized over the ten year term of the licensing agreement.
The Company records rents due from the tenants on a current basis. However, as part of the Line of Credit Agreement, the Company has deferred collection of such rents until the tenants receive the proper governmental licenses to begin operation. It is anticipated that such licenses should be obtained prior to 3rd quarter 2016. Management has decided to take the approach and reserve these amounts due to the contingency factor and experience with typical delays in governmental action.
Leases as lessor
The Company currently leases properties in locations that would be acceptable for regulatory purposes and acceptable to sub-lessees for the manufacturing and development of their products. The Company evaluates the lease to determine its appropriate classification as an operating or capital lease for financial reporting purposes. The Company currently has a number of leases, which are all classified as operating leases.
Minimum base rent for the Company’s operating leases, which generally have escalating rentals over the term of the lease, is recorded on a straight-line basis over the lease term. The initial rent term includes the build-out, or may include a short rent holiday period, for the Company’s leases, where no rent payments are typically due under the terms of the lease.
Leases
For lease agreements that provide for escalating rent payments or free-rent occupancy periods, the Company recognizes rent expense on a straight-line basis over the non-cancelable lease term and option renewal periods where failure to exercise such options would result in an economic penalty in such amount that renewal appears, at the inception of the lease, to be reasonably assured. The lease term commences on the date that the Company takes possession of or controls the physical use of the property. Deferred rent is presented on current liabilities section on the consolidated balance sheets.
Income Taxes
Income taxes are provided for using the liability method of accounting in accordance with the Income Taxes Topic of the FASB ASC. Deferred tax assets and liabilities are determined based on differences between the financial reporting and tax basis of assets and liabilities and are measured using the enacted tax rates and laws that will be in effect when the differences are expected to reverse. A valuation allowance is established when necessary to reduce deferred tax assets to the amount expected to be realized and when, in the opinion of management, it is more likely than not that some portion or all of the deferred tax assets will not be realized. The computation of limitations relating to the amount of such tax assets, and the determination of appropriate valuation allowances relating to the realizing of such assets, are inherently complex and require the exercise of judgment. As additional information becomes available, the Company continually assesses the carrying value of their net deferred tax assets.
| F-8 |
Research and development costs
Research and development costs are charged to the statement of operations as incurred.
Preferred Stock
We apply the guidance enumerated in ASC 480 “Distinguishing Liabilities from Equity” when determining the classification and measurement of preferred stock. Preferred shares subject to mandatory redemption (if any) are classified as liability instruments and are measured at fair value. We classify conditionally redeemable preferred shares (if any), which includes preferred shares that feature redemption rights that are either within the control of the holder or subject to redemption upon the occurrence of uncertain events not solely within our control, as temporary equity. At all other times, we classified our preferred shares in stockholders’ equity. Our preferred shares do not feature any redemption rights within the holders’ control or conditional redemption features not within our control. Accordingly all issuances of preferred stock are presented as a component of consolidated stockholders’ equity (deficit).
Common Stock Purchase Warrants and Other Derivative Financial Instruments
We classify as equity any contracts that require physical settlement or net-share settlement or provide us a choice of net-cash settlement or settlement in our own shares (physical settlement or net-share settlement) provided that such contracts are indexed to our own stock as defined in ASC 815-40 (“Contracts in Entity’s Own Equity”). We classify as assets or liabilities any contracts that require net-cash settlement (including a requirement to net cash settle the contract if an event occurs and if that event is outside our control) or give the counterparty a choice of net-cash settlement or settlement in shares (physical settlement or net-share settlement). We assess classification of our common stock purchase warrants and other free standing derivatives at each reporting date to determine whether a change in classification between assets and liabilities is required.
Stock-Based Compensation
We recognize compensation expense for stock-based compensation in accordance with ASC Topic 718. For employee stock-based awards, we calculate the fair value of the award on the date of grant using the Black-Scholes method for stock options and the quoted price of our common stock for unrestricted shares; the expense is recognized over the service period for awards expected to vest. For non-employee stock-based awards, we calculate the fair value of the award on the date of grant in the same manner as employee awards, however, the awards are revalued at the end of each reporting period and the pro rata compensation expense is adjusted accordingly until such time the nonemployee award is fully vested, at which time the total compensation recognized to date equals the fair value of the stock-based award as calculated on the measurement date, which is the date at which the award recipient’s performance is complete. The estimation of stock-based awards that will ultimately vest requires judgment, and to the extent actual results or updated estimates differ from original estimates, such amounts are recorded as a cumulative adjustment in the period estimates are revised. We consider many factors when estimating expected forfeitures, including types of awards, employee class, and historical experience.
Loss per common share
Net loss per share is provided in accordance with ASC Subtopic 260-10. We present basic loss per share (“EPS”) and diluted EPS on the face of statements of operations. Basic EPS is computed by dividing reported losses by the weighted average shares outstanding. Loss per common share has been computed using the weighted average number of common shares outstanding during the year.
Note 3 – Going Concern
The accompanying financial statements have been prepared in conformity with generally accepted accounting principles, which contemplate continuation of the Company as a going concern. The Company has incurred losses since inception and its current liabilities exceed its current assets by $2,496,459, and has an accumulated deficit of $21,699,153 and a total deficit of $1,414,320 as of December 31, 2015.
Management believes that the Company’s future success is dependent upon its ability to achieve profitable operations, generate cash from operating activities and obtain additional financing. There is no assurance that the Company will be able to generate sufficient cash from operations, sell additional shares of stock or borrow additional funds from its stockholders. The Company’s inability to obtain additional cash could have a material adverse effect on its financial position, results of operations, and its ability to continue in existence. These financial statements do not include any adjustments that might result from the outcome of this uncertainty.
The Company intends to continue to raise additional capital and assist the leaseholder in obtaining the proper licenses in order to conduct their business in growing, processing and retailing cannabis products. Once the licenses are granted, we believe that a steady stream of income will be achieved and the repayment of our advances would begin.
Note 4 – Revolving Credit Line
A certain tenant who intends to operate out of three separate properties leased to him by the Company, is required to obtain a state operating license to grow, process and sell cannabis products. Until the tenant receives such license, the Company has agreed and entered into a $2,500,000 revolving line of credit with the tenant. This line of credit was established to provide funding to the tenant, consisting of two separate elements: (a) to fund operating costs until the development is completed, and (b) to underwrite the rent due on the sublease agreements. Interest is accruing at the annual rate of 20% on the average monthly amount due on this line of credit.
| F-9 |
On September 7, 2015, the Company entered into an agreement, and settled total amount owed for $200,000 cash. As of December 31, 2015 and December 31, 2014, the Company has advanced an aggregate of $907,250 and $707,250 respectively towards this line of credit, and has accrued interest of $206,523 and $70,596, respectively. The Company has recorded a reserve for the total advance and accrued interest.
Note 5 – Investment
In January 2014, the Company entered into an Agreement with Plandai Biotechnology, Inc. (a publicly traded company) to license to them certain intellectual property rights in exchange for warrants to purchase 3,333,334 shares of Plandai Biotechnology, Inc. (“Plandai”) common stock. This license agreement carries a 10-year term with an exercise price of $0.01 per share. The Company is to obtain certain Trademark rights certified by the government (expected by 2nd quarter 2016). On October 10, 2014 the Company filed its Notice of Exercise to execute the warrants to acquire the shares of Plandai, in which the shares have not yet been issued. The sale of such shares has a “leak out” restriction on them requiring that the sale of such shares must reach a certain traded price of $0.50 per share. The Company used a third party appraisal firm to ascertain the fair value of warrants held by the company, which was determined to be $525,567. With the Plandai shares currently trading at $.07 per share, the Company impaired $408,900 during the year ended December 31, 2015. The Company accounts for its investment under the cost method of accounting.
Note 6 – Property And Equipment
The Company has incurred expenses in the build out of one of its leased properties and acquired a large POD equipment for use in growing operations by lessee. Since the facility and equipment have not yet been put into service, no amortization on the leasehold improvement nor depreciation on the equipment has been provided.
As of December 31, 2015 and 2014, Fixed Assets and the estimated lives used in the computation of depreciation are as follows:
| Estimated | December 31, | December 31, | ||||||||
| Useful Lives | 2015 | 2014 | ||||||||
| Machinery and equipment | 5 years | $ | 174,145 | $ | 39,145 | |||||
| Leasehold Improvements | 10 years | 664,609 | 214,845 | |||||||
| 838,754 | 253,990 | |||||||||
| Less: Accumulated depreciation and amortization | - | - | ||||||||
| Property and Equipment, net | $ | 838,754 | $ | 253,990 | ||||||
Note 7 – Other Assets
Security deposits
These deposits reflect the deposits on various property leases, most of which call for two months of rental.
Deposits – end of lease
These deposits represent an additional two months of rent on various property leases that apply to the “end-of-lease” period.
Note 8 – Related Party
As of December 31, 2015 and December 31, 2014, the Company has unpaid consulting fees to related parties in the amount of $511,454 and $124,333, respectively. For the year ended December 31, 2015 and 2014, the consulting fees expensed were $870,000 and $605,989, respectively to related parties. These amounts are included in general and administrative expenses in the accompanying financial statements.
Note 9 – Note Payable
On May 20, 2015, the Company entered into notes in total amount of $450,000 with third parties for use as operating capital. The notes payable agreements require the Company to repay the principal, together with 10% annual interest by the maturity date of November 17, 2015 or the date the Company raises capital whether through the issuance of debt, equity or any other securities. The Company will not effect a Financing unless either (a) the proceeds of such Financing are being directed at the closing of such Financing to irrevocably repay this Note in full, or (b) Investor consents to an alternative use of proceeds from such Financing. The Company received a waiver from investor for the convertible note entered into May 29, 2015 (see Note 10). As of December 31, 2015, the outstanding principle balance of the note is $450,000.
On July 8, 2015, the Company entered into notes in total amount of $135,628 with third parties for use as operating capital. The notes payable agreements require the Company to repay the principal, together with 10% annual interest by the maturity date of October 6, 2015 or the date the Company raises capital whether through the issuance of debt, equity or any other securities, the Company will not effect a Financing unless either (a) the proceeds of such Financing are being directed at the closing of such Financing to irrevocably repay this Note in full, or (b) Investor consents to an alternative use of proceeds from such Financing. As of December 31, 2015, the outstanding principal balance of the note is $135,628. In connection with the issuance of these notes, the Company issued warrants to purchase its common stock. The Company allocated the proceeds of the notes and warrants based on the relative fair value at inception. The Company allocated $90,563 to the warrants and 45,065 to the debt. The difference between the face value of the notes and the allocated value will be accreted to interest expense over the life of the loan. As of December 31, 2015, the outstanding principle balance of the note is $135,628 and $90,563 has been accreted to interest expense for the year ended December 31, 2015.
On August 31, 2015, the Company entered into notes in total amount of $126,000 with third parties for use as operating capital. The notes payable agreements require the Company to repay the principal, together with 5% annual interest by the maturity date of October 31, 2015 or the closing of a financing whereby the company receives a minimum of $126,000. As of December 31, 2015, the outstanding principal balance of the note is $126,000. In connection with the issuance of these notes, the Company issued 126,000 shares of common stock. The Company allocated the proceeds of the notes and warrants based on the relative fair value at inception. The Company allocated $84,000 to the common stock and $42,000 to the debt. The difference between the face value of the notes and the allocated value will be accreted to interest expense over the life of the loan. As of December 31, 2015, the outstanding principal balance of the note is $126,000 and $84,000 has been accreted to interest expense for the year ended December 31, 2015.
| F-10 |
On November 27, 2015, the Company entered into notes in total amount of $135,000 with third parties for purchasing a fixed asset. The notes payable agreements require the Company to repay the principal, together with $15,000 interest by the maturity date of January 26, 2016. As of December 31, 2015, the outstanding principle balance of the note is $135,000.
Note 10 – Convertible Note Payable
On May 29, 2015, the Company entered into convertible notes in total amount of $300,000 with third parties for use as operating capital. The convertible notes require the Company to repay the principal, together with 10% annual interest by the maturity date of November 26, 2015. In the event that the Note is not paid on the maturity date and the common stock price has a set price below $1.50, then the note holder shall have the right to convert the amount outstanding into shares of common stock at a price of ninety percent of the lowest trade VWAP (Volume Weighted Average Price) of twenty days prior to conversion. The Company evaluated the conversion feature embedded in the notes in amount of $342,604 on default. In connection with the issuance of these notes, the Company issued warrants to purchase its common stock. The Company allocated the proceeds of the notes and warrants based on the relative fair value at inception. The Company allocated $225,920 to the warrants and 74,080 to the convertible debt. The difference between the face value of the notes and the allocated value will be accreted to interest expense over the life of the loan. On November 26, 2015, pursuant to the original terms of the note, the holder received the rights to convert the principal balance into common shares of the Company. The conversion feature was recognized as an embedded derivative and was valued using a Black Scholes model that resulted in a derivative liability of $342,604 as of the measurement date. The gain on change in the value of the derivative liability upon subsequent re-measurement as of December 31, 2015 was $133,809. As of December 31, 2015, the outstanding principle balance of the note is $300,000 and $225,920 has been accreted to interest expense for the year ended December 31, 2015.
The table below provides a reconciliation of the beginning and ending balances for the liabilities measured using fair significant unobservable inputs (Level 3):
| Balance at January 1, 2015 | $ | - | ||
| Issuance of embedded conversion features on convertible note | 342,604 | |||
| Change in fair value during period | (133,809 | ) | ||
| Balance at December 31, 2015 | $ | 208,795 |
The fair value of embedded conversion feature of convertible note determined using a Black Scholes Simulation. This model requires the input of highly subjective assumptions, including the expected price volatility, which is based on the historical volatility of a peer group of publicly traded companies. Changes in the subjective input assumptions can materially affect the estimate of fair value of the warrants and the Company’s results of operations could be impacted.
The following assumptions were used in calculations of the Black Scholes model for the year ended December 31, 2015 and 2014
| Year ended December 31, | ||||||||
| 2015 | 2014 | |||||||
| Risk-free interest rates | 0.52-0.65 | % | - | |||||
| Expected life | 1 year | - | ||||||
| Expected dividends | 0 | % | - | |||||
| Expected volatility | 345-348 | % | - | |||||
| Diego Pellicer Worldwide, Inc. Common Stock fair value | $0.75 -$1.24 | - | ||||||
NOTE 11 – Stockholders’ Equity
The Company has authority to issue up to 100,000,000 shares, of which 5,000,000 shares reserved as Preferred shares and 95,000,000 are designated as Common shares. As of December 31, 2015, there were 29,498,165 common shares exchanged for the common shares held by the former shareholders of Diego Pellicer Worldwide 1 Inc. (“Diego”), 4,304,317 shares of common stock issued for services provided, 3,881,251 share issued for $1,164,375 and 126,000 shares of common stock issued in connection with $126,000 promissory note (see Note 9). For the year ended December 31, 2015, 753,333 Preferred shares were issued and subsequently converted to common shares in the reverse merger. As of December 31, 2015, there were no Preferred shares outstanding. The common shares and the preferred shares, have a par value of $0.000001.
At the completion of the merger, 21,754,832 restricted common shares of the new Company were issued to the former Diego shareholders as follows:
| (a) | The original Founders of the Company converted their 13,520,000 shares into restricted common shares on a 1:1 basis. | |
| (b) | The Series A and B Preferred shareholders converted 5,841,097 shares into restricted common shares on a 1:1 basis. | |
| (c) | Non-employees, which consisted of founding members and others were awarded a total of 2,451,935 shares, at a value of $0.9375 per share. | |
| (d) | 58,200 shares of common stock were returned as treasury stock. |
For the years ended December 31, 2014 the Company sold 4,275,093 Series A Preferred shares for $3,507,907, and 200,000 Series B Preferred shares for proceeds received in the amount of $300,000.
There are currently 1,901,426 warrants outstanding relating to the former Diego shareholders in varying amounts:
| (a) | In March 2014, a single large investor was granted 640,000 warrants attached to his initial common stock purchase at an exercise price of $1.24 share, and expire in 5 years from grant date. | |
| (b) | During 2014, several preferred stockholders were granted a total of 150,798 warrants attached to their initial common stock purchase at an exercise price of $1.40 per share, and expire in 5 years from grant date. | |
| (c) | In April and May 2015, various investors in the Equity Incentive group were granted 200,000 warrants for the purchase of common shares at an exercise price at $0.000001, and expire in 10 years from grant date valued at $574,250. | |
| (d) | In February 2015, certain preferred stockholders were granted 475,000 warrants for the purchase of common shares at an exercise price of $1.50 per share, and expire in 5 years from grant date. | |
| (e) | On May 2015, the Company granted 300,000 warrants to a convertible note holder at an exercise price of $1.50 per share, and expire in 5 years from grant date. The warrant was valued at $914,902 using the Black-Scholes fair value option-pricing model and $225,920 proceed was allocated to warrant, amortized over 180 days.
| |
| (f) | On July 2015, the Company granted 135,628 warrants to a promissory note holder at an exercise price of $1.00 per share, and expire in 5 years from grant date. The warrant was valued at $272,557 using the Black-Scholes fair value option-pricing model and $90,563 proceed was allocated to warrant, amortized over 90 days. |
| F-11 |
The following table presents our warrants and embedded conversion features which have no observable market data and are derived using Black-Scholes measured at fair value on a recurring basis, using Level 3 inputs, as of December 31, 2015 and 2014:
For
the Year Ended | ||||
| Annual dividend yield | 0 | % | ||
| Expected life (years) | 1-10 | |||
| Risk-free interest rate | 0.52% – 2.14 | % | ||
| Expected volatility | 323%-354 | % | ||
The following represents a summary of all common stock warrant activity:
| Number of Warrants | Weighted
Average Exercise Price | Weighted Average Remaining Contractual Term | ||||||||||
| Balance outstanding, December 31, 2014 | 790,798 | $ | 0.26 | 4.03 | ||||||||
| Granted | 1,110,628 | 1.17 | 5.18 | |||||||||
| Exercised | - | - | - | |||||||||
| Forfeited | - | - | - | |||||||||
| Expired | - | - | - | |||||||||
| Balance outstanding, December 31, 2015 | 1,901,426 | $ | 1.21 | 4.40 | ||||||||
| Exercisable, December 31, 2015 | 1,901,426 | $ | 1.21 | 4.40 | ||||||||
The Company maintains an Equity Incentive Plan pursuant to which 2,480,000 shares of Common Stock are reserved for issuance thereunder. This Plan was established to award certain founding members, who were instrumental in the development of the Company, as well as key employees, directors and consultants, and to promote the success of the Company’s business. The terms allow for each option to vest immediately, with a term no greater than 10 years from the date of grant, at an exercise price equal to par value at date of the grant. As of December 31, 2015, 1,775,000 shares had been granted, with 200,000 of those shares granted with warrants attached. There remains 705,000 shares available for future grants.
NOTE 12 – COMMITMENTS AND CONTINGENCIES
The Company’s business is to lease property in appropriate and desirable locations, and to make available such property for sub-lease to specifically assigned businesses that grow, process and sell certain products to the general public. Currently the Company has five (4) separate properties under lease in the states of Colorado and Washington.
In Colorado, there are three properties leased in 2014 and 2015. Properties were leased for a three (3) to five (5) year period with an option for an additional five (5) years, and carry terms requiring triple net (NNN) conditions. Each of the properties, except for one, have fixed monthly rentals (exclusive of the triple net terms). As of December 31, 2015, the aggregate remaining minimal annual lease payments under these operating leases were as follows:
| 2016 | $ | 1,101,716 | ||
| 2017 | 1,020,000 | |||
| 2018 | 888,128 | |||
| 2019 | 346,566 | |||
| Total | $ | 3,356,410 |
In Washington, there is only one (1) property leased in 2014. The property was leased for a five (5) year period with an option for an additional five (5) years, and carry terms requiring triple net (NNN) conditions. The property has an escalating annual rental (exclusive of the triple net terms). As of December 31, 2015, the aggregate remaining minimal annual lease payments due under these operating leases were as follows:
| 2016 | $ | 84,999 | ||
| 2017 | 87,723 | |||
| 2018 | 67,365 | |||
| Total | $ | 240,087 |
Rent expense for the Company’s operating leases for the year ended December 31, 2015 and 2014 was $1,228,028 and $487,533, respectively.
| F-12 |
Note 13 – Deferred Tax Assets and Income Tax Provision
The reconciliation of income tax benefit at the U.S. statutory rate of 34% for the year ended December 31, 2015 and 2014 to the Company’s effective tax rate is as follows:
The reconciliation of income tax benefit at the U.S. statutory rate of 34% for the year ended December 31, 2015 and for the year ended December 31, 2014 respectively to the Company’s effective tax rate is as follows:
| For the Year Ended | For the Year Ended | |||||||
| December 31, 2015 | December 31, 2014 | |||||||
| Statutory federal income tax rate | -34 | % | -34 | % | ||||
| State income tax, net of federal benefits | -6 | % | -6 | % | ||||
| Valuation Allowance | -40 | % | -40 | % | ||||
| Income tax provision (benefit) | -80 | % | -80 | % | ||||
The benefit for income tax is summarized as follows:
| Year
Ended December 31, 2015 | Year
Ended December 31, 2014 | |||||||
| Federal | ||||||||
| Current | $ | - | $ | - | ||||
| Deferred | (5,720,000 | ) | (141,000 | ) | ||||
| State | ||||||||
| Current | - | - | ||||||
| Deferred | (1,009,000 | ) | (25,000 | ) | ||||
| Change in valuation allowance | 6,729,000 | 166,000 | ||||||
| Income tax provision (benefit) | $ | - | $ | - | ||||
As of December 31, 2015, the Company had accumulated Federal net operating loss carryovers (“NOLs”) of $6,895,000. These NOLs begin to expire in 2033, and the utilization of NOLs may be subject to limitation under the Internal Revenue Code Section 382 should there be a greater than 50% ownership change as determined under the regulations.
In assessing the realization of deferred tax assets, management considers whether it is more likely than not that some portion or all of the deferred tax assets will be realized. The ultimate realization of deferred tax assets is dependent upon the generation of future taxable income during the periods in which those temporary differences become deductible. Management considers the scheduled reversal of deferred tax liabilities, projected future taxable income and tax planning strategies in making this assessment. Based on the assessment, management has established a full valuation allowance against the entire deferred tax asset relating to NOLs for every period because it is more likely than not that all of the deferred tax asset will not be realized.
The Company files U.S. Federal and various State tax returns that are subject to audit by tax authorities beginning with the year ended December 31, 2013. The Company’s policy is to classify assessments, if any, for tax and related interest and penalties as tax expense.
Note 14 – Subsequent Events
In April 2016, the Company issued CEO 1,900,000 shares of common stock for services rendered valued at $1,577,000 and issued an investor additional 1,866,666 shares of common stock for repricing original stock purchase agreement in amount of $700,000 from $1.50 per share to $0.30 per share.
| F-13 |
Item 7. Management’s Discussion and Analysis of Financial Condition and Results of Operations
The following provides information which management believes is relevant to an assessment and understanding of our results of operations and financial condition. The discussion should be read along with our financial statements and notes thereto. The following discussion and analysis contains forward-looking statements, which involve risks and uncertainties. Our actual results may differ significantly from the results, expectations and plans discussed in these forward-looking statements. See “Cautionary Note Regarding Forward Looking Statements.”
Diego Pellicer Worldwide, Inc. was established on August 26, 2013 to take advantage of legislation allowing for the legalization of cannabis operations in several states, currently including Colorado, Washington and Oregon, and with a number of other states giving consideration to this market as well. It is expected that the industry will operate under stringent regulations within the various state jurisdictions.
Our primary business plan is to lease various properties and develop them in a manner that would allow others to grow, process and retail cannabis and related products. These leases were designed to provide a substantial stream of income. We believe that as laws evolve, it is possible that we will have the opportunity to participate directly in these operations as well.
Results of Operations
Year ended December 31, 2015 compared to year ended December 31, 2014
| Year Ended | Year Ended | Increase (Decrease) | ||||||||||||||
| December 31, 2015 | December 31, 2014 | $ | % | |||||||||||||
| REVENUES | ||||||||||||||||
| Rental income | $ | 1,059,631 | $ | 497,638 | $ | 561,993 | 113 | % | ||||||||
| Licensing revenue | 54,000 | 48,567 | 5,433 | 11 | % | |||||||||||
| Provision for uncollectible rents | (809,101 | ) | (497,638 | ) | (311,463 | ) | 63 | % | ||||||||
| Total Revenues | $ | 304,530 | $ | 48,567 | $ | 255,963 | 527 | % | ||||||||
* Not divisible by zero
For the year ended December 31, 2014 and 2015, the Company had already leased five facilities in Colorado (3), in Washington (1) and in Oregon (1). Only the Colorado facilities have been sublet to date.
Total revenue for the year ended December 31, 2015 was $304,530, as compared to $48,567 for the year ended December 31, 2014, an increase of $255,963, and represents recognition of income on the Plandai Biotechnology license, rental income of 54,000 and a settlement income of $200,000. In January 2014, the Company entered into a Licensing Agreement with Plandai Biotechnology, a publicly traded company, to license their Diego Pellicer brand in exchange for 3,333,334 warrants with a 10-year term, to purchase Plandai’s common stock. At the time of the Agreement, the publicly traded shares in Plandai were valued at $525,567. In October 2014, the Company filed a Notice of Exercise to obtain the shares, and have recorded their value as deferred income. For the year ended December 31, 2015 and 2014, $54,000 and $48,567 was recognized as licensing revenue.
For the year ended December 31, 2015 and 2014, rental income of $1,059,631 and $497,638 an derived from the Colorado sub-leases, $809,101 and $497,638 of which has been reserved as uncollectible from the tenant, pending the latter receiving final approval of licenses from the government to allow them to continue to progress on its growing, processing and retailing facilities.
| Year Ended | Year Ended | Increase (Decrease) | ||||||||||||||
| December 31, 2015 | December 31, 2014 | $ | % | |||||||||||||
| COSTS AND EXPENSES (other income) | ||||||||||||||||
| General and administrative expenses | $ | 14,268,072 | $ | 3,624,507 | $ | 10,643,565 | 294 | % | ||||||||
| Impairment of Investment | 408,900 | - | 408,900 | * | ||||||||||||
| Rent expense | 1,228,028 | 487,533 | 740,495 | 152 | % | |||||||||||
| Change in Derivative | (133,809 | ) | - | (133,809 | ) | * | ||||||||||
| Write-off of line of credit receivable | 240,000 | 777,846 | (537,846 | ) | -69 | % | ||||||||||
| Other income (interest) | 811,726 | (73,198 | ) | 884,924 | -1209 | % | ||||||||||
| Total costs and expenses | $ | 16,822,917 | $ | 4,816,688 | $ | 12,006,229 | 249.3 | % | ||||||||
* Not divisible by zero / being largely a development company in early 2014, the comparisons may not be meaningful.
| 18 |
General and administrative. Our general and administrative expenses for the year ended December 31, 2015 were $14,268,072, compared to $3,624,507 for the year ended December 31, 2014. The increase of $10,643,565, which was mostly attributable to non-employee stock compensation and unusual high costs for professional fees (legal and accounting) related to the reverse merger transaction.
Rent expense. We incurred rent expense from five separate facilities leased during 2014 and 2015. The rent incurred from these properties during the year ended December 31, 2015 and 2014 was $1,228,028 and $487,533, because the leases started on the third quarter of 2014.
Bad debt expense. Bad debt expense for the year ended December 31, 2015 and 2014 was $240,000 and 777,846, respectively. In 2015, we settled all amount owed against 2.5M line of credit for $200,000. We advanced funds for their operational costs to develop these specific properties, as the tenant awaits final licensing from the state in order to begin full operations.
Impairment of Investment. With the Plandai shares currently trading at $.07 per share, the Company impaired $408,900 during the year ended December 31, 2015.
LIQUIDITY AND CAPITAL RESOURCES
| Year Ended | Year Ended | Increase (Decrease) | ||||||||||||||
| December 31, 2015 | December 31, 2014 | $ | % | |||||||||||||
| Net cash used in operating activities | $ | (2,653,338 | ) | $ | (2,602,044 | ) | $ | (328,794 | ) | 12.6 | % | |||||
| Net cash used in investing activities | (784,764 | ) | (1,209,899 | ) | 702,635 | 58.1 | % | |||||||||
| Net cash provided by financing activities | 3,441,002 | 3,704,960 | (263,958 | ) | -7.1 | % | ||||||||||
| Net (Decrease) Increase in Cash | 2,900 | (106,983 | ) | 109,883 | 102.7 | % | ||||||||||
| Cash - beginning of period | 33,101 | 140,084 | (106,983 | ) | ||||||||||||
| Cash - end of year | $ | 36,001 | $ | 33,101 | $ | 2,900 | 8.8 | % | ||||||||
Operating Activities. The net cash used for the year ended in December 31, 2015 was $2,653,338, which is primarily attributable to the net loss of $16,518,387. For the year ended December 31, 2014, the net cash used of $2,602,044 was also due to a net loss of $4,768,121 and partially offset by an increase in the amount of payables.
Investing Activities. The cash used for investing activities for the year ended December 31, 2015 of $784,764, includes $584,764 on acquisition of property and equipment, $200,000 advanced under line of credit. For the year ended December 31, 2014, cash used for investing activities amounted to $1,209,899, which includes $54,341 repayment from related party, $253,990 on acquisition of property and equipment, $15,300 on security deposit, $150,000 on Deposits on end of lease and $707,250 advanced under line of credit.
Financing Activities. Funds provided from financing activities for the year ended December 31, 2015, and December 31, 2014 of $3,441,002 and $3,704,960 respectively. During the year ended December 31, 2015, net cash proceed from sales of preferred stock and warrants is $1,129,999, proceeds form note payable is $846,628, $300,000 from convertible note payable and 1,164,375 from sale of common stock. During the year ended December 31, 2015, we received $3,807,908 from sales of preferred stock and warrants, $1,352 from collection of subscriptions receivable, spent $17,000 on repayment of related party loan, and $87,300 on acquisition of treasury stock.
Off-Balance Sheet Arrangements
We have no off-balance sheet arrangements.
Item 7A. Quantitative and Qualitative Disclosures About Market Risk.
We are a smaller reporting company as defined by Rule 12b-2 of the Exchange Act and are not required to provide the information under this item.
Item 8. Financial Statements and Supplementary Data.
The information required by this item appears beginning on page F-1 following the signature pages of this report and is incorporated herein by reference.
Item 9. Changes in and Disagreement with Accountants on Accounting and Financial Disclosure.
None.
| 19 |
Item 9A. Controls and Procedures.
We carried out an evaluation required by Rule 13a-15 of the Securities Exchange Act of 1934, as amended (the “Exchange Act”) under the supervision and with the participation of our management, including our principal executive officer and principal financial officer, of the effectiveness of the design and operation of the Company’s “disclosure controls and procedures” and “internal control over financial reporting” as of the end of the period covered by this Annual Report.
Evaluation of Disclosure Controls and Procedures
We maintain disclosure controls and procedures as defined in Rules 13a-15(e) and 15d-15(e) of the Exchange Act that are designed to ensure that information required to be disclosed in our reports filed or submitted to the SEC under the Exchange Act is recorded, processed, summarized and reported within the time periods specified by the SEC’s rules and forms, and that information is accumulated and communicated to management, including the principal executive and financial officer as appropriate, to allow timely decisions regarding required disclosures. Our principal executive officer and principal financial officer evaluated the effectiveness of disclosure controls and procedures as of the end of the period covered by this Annual Report (the “Evaluation Date”), pursuant to Rule 13a-15(b) under the Exchange Act. Based on that evaluation, our principal executive officer and principal financial officer concluded that, as of the Evaluation Date, our disclosure controls and procedures were not effective to ensure that information required to be disclosed in our reports under the Exchange Act is recorded, processed, summarized, and reported within the time periods specified in the SEC’s rules and forms, and that such information is accumulated and communicated to management, including our principal executive officer and principal financial officer, as appropriate to allow timely decisions regarding required disclosure, due to material weaknesses in our control environment and financial reporting process.
Limitations on the Effectiveness of Controls
Our management, including our principal executive officer and principal financial officer, does not expect that our Disclosure Controls and internal controls will prevent all errors and all fraud. A control system, no matter how well conceived and operated, can provide only reasonable, not absolute, assurance that the objectives of the control system are met. Further, the design of a control system must reflect the fact that there are resource constraints, and the benefits of controls must be considered relative to their costs. Because of the inherent limitations in all control systems, no evaluation of controls can provide absolute assurance that all control issues and instances of fraud, if any, within the Company have been detected. These inherent limitations include the realities that judgments in decision-making can be faulty, and that breakdowns can occur because of a simple error or mistake. Additionally, controls can be circumvented by the individual acts of some persons, by collusion of two or more people, or by management or board override of the control.
The design of any system of controls also is based in part upon certain assumptions about the likelihood of future events, and there can be no assurance that any design will succeed in achieving its stated goals under all potential future conditions; over time, controls may become inadequate because of changes in conditions, or the degree of compliance with the policies or procedures may deteriorate.
Because of the inherent limitations in a cost-effective control system, misstatements due to error or fraud may occur and not be detected.
Management’s Annual Report on Internal Control over Financial Reporting
Our management is responsible for establishing and maintaining adequate internal control over financial reporting, as such term is defined in Exchange Act Rule 13a-15(f). Under the supervision and with the participation of our management, including our principal executive officer and principal financial officer, we conducted an evaluation of the effectiveness of our internal control over financial reporting based on the framework Company to confirm what framework was used in connection with its evaluation of internal controls over financial reporting. Internal control over financial reporting is a process designed to provide reasonable assurance regarding the reliability of financial reporting and the preparation of financial statements for external purposes in accordance with generally accepted accounting principles and includes those policies and procedures that (a) pertain to the maintenance of records that, in reasonable detail, accurately and fairly reflect the transactions and dispositions of the assets of the Company; (b) provide reasonable assurance that transactions are recorded as necessary to permit the preparation of financial statements in accordance with generally accepted accounting principles and that receipts and expenditures of the Company are being made only in accordance with authorizations of the our management and directors; and (c) provide reasonable assurance regarding prevention or timely detection of unauthorized acquisition, use or disposition of the Company’s assets that could have a material effect on the financial statements.
Based on our evaluation under the framework described above, our management concluded that we had “material weaknesses” (as such term is defined below) in our control environment and financial reporting process consisting of the following as of the Evaluation Date:
| 1) | lack of a functioning audit committee due to a lack of a majority of independent members and a lack of a majority of outside directors on our Board of Directors, resulting in ineffective oversight in the establishment and monitoring of required internal control and procedures; | |
| 2) | inadequate segregation of duties consistent with control objectives; | |
| 3) | ineffective controls over period end financial disclosure and reporting processes; and | |
| 4) | lack of accounting personnel with adequate experience and training. |
| 20 |
A “material weakness” is defined under SEC rules as a deficiency, or a combination of deficiencies, in internal control over financial reporting such that there is a reasonable possibility that a material misstatement of a company’s annual or interim financial statements will not be prevented or detected on a timely basis by the company’s internal controls.
As of the date of this Annual Report, the Company does not intend to remedy the foregoing and therefore such material weaknesses in our control environment and financial reporting process will continue. A system of controls, no matter how well designed and operated, cannot provide absolute assurance that the objectives of the system of controls are met, and no evaluation of controls can provide absolute assurance that all control issues and instances of fraud, if any, within a company have been detected.
Attestation report of the registered public accounting firm
This Annual Report does not include an attestation report of the Company’s independent registered public accounting firm regarding internal control over financial reporting. Management’s report was not subject to attestation by the Company’s independent registered public accounting firm pursuant to temporary rules of the SEC that permit the Company to provide only management’s report on internal control in this Annual Report.
Changes in Internal Controls
There were no changes in our internal control over financial reporting during the fiscal year ended December 31, 2015 that have affected, or are reasonably likely to affect, our internal control over financial reporting.
None.
| 21 |
Item 10. Directors, Executive Officers and Corporate Governance
The following table sets forth the names and ages of all of our directors, executive officers and key employees; and all positions and offices held as of the date of this Report. The directors will hold such office until the next annual meeting of shareholders and until his or her successor has been elected and qualified.
| Name | Age | Position | ||
| Ron Throgmartin | 51 | Chief Executive Officer, Director | ||
| Christopher Strachan | 51 | Chief Financial Officer | ||
| Alan Valdes | 56 | Chairman of the Board | ||
| Steve Norris | 64 | Director |
Business Experience
The following summarizes the occupation and business experience during the past five years for our officers, directors and key employees as of the date of this Report:
Officers and Directors
Ron Throgmartin joined as CEO of Diego Pellicer Worldwide Inc. in August 2013. In May 2010 Mr. Throgmartin began serving as an independent consultant for a medical marijuana company in Colorado where he managed State licensing, compliance, retail operations and production. From 2003-2008 Mr. Throgmartin was involved with the largest privately owned cattle producers in the United States with operations that encompassed 11 states. In 1989, Mr. Throgmartin started his own commercial development company, where over a span of 20 years he developed over 3 million square feet of commercial projects, working with some of the top rated retailers in the country, including Lowes, Home Depot, HH Gregg, Staples, McDonalds, Steak-n-Shake. From 1981-1989 Mr. Throgmartin worked for his family business HH Gregg, where he served in many roles including Operations and new and store development. Today HH Gregg (HHG) is a publicly owned and operated appliance and electronics retailer covering 16 states, and over $2.4 billion in annual sales. Mr. Throgmartin is a graduate of Ball State University with a Bachelor of Science degree. We believe that Mr. Throgmartin should serve as a member of the board of directors due to the perspective and experience he brings as our COO and his experience in the medical marijuana industry.
Christopher Strachan joined as CFO of Diego Pellicer Worldwide Inc. in January 2016. Mr. Strachan is an accomplished CFO, CEO, and manager with 30 years in corporate operations, marketing, securities, finance and 20 years of executive management experience. He has worked largely with developing and startup corporations, where he has honed his skills. For the past five years, Mr. Strachan has served as the President of Helisports LLC, a business development consulting company. In addition, he served as the CEO of Rhodes Architectural Stone from 2011 to 2012, the Director of Marketing and Sales of Glasair Aviation from 2012 to 2014 and the Director of Flight Operations and R&D at RotorWay Helicopters from 2009 to 2011.
Alan Valdes has operated as Chairman of the Company since inception Mr. Valdes has over 35 years’ experience on Wall Street. He appears regularly on television giving market comments on such networks as CNN, CNBC, CCTV and many other domestic and foreign media outlets. Since 2013, Mr. Valdes has worked as a senior partner at SilverBear Capital Inc., where he is in charge investment and development projects in the United States and Canada. Additionally, Mr. Valdes is currently a partner at Wall Street Capital Partners, a boutique Wall Street consultant that assists clients in accomplishing what the best and largest firms do within a fraction of the cost and time. He is also a co-founder and partner of the Louisiana International Gulf Terminal project, a $1.5 billion port project, the largest in the United States. He is also currently a board member of the World Air League and the Strang Cancer Prevention Center. Mr. Valdes is a graduate on Seton Hall University, New York University and Harvard University. We believe that Mr. Valdes should serve as a member of the board of directors due to his experience working for the Company since inception and the with early stage corporations, like the Company.
Steve Norris was elected a director of the Company in October 2015. Currently serving as Chairman of Stephen Norris Capital Partners, LLC, Mr. Norris has substantial expertise in structuring, negotiating and implementing leveraged buy-outs, cash-flow-based investments and financing strategies in the public and private capital markets. Mr. Norris is one of five co-founders of the Carlyle Group, a major merchant bank based in Washington, D.C. From 1988-1997, Mr. Norris served as Carlyle’s President. He was a principal participant and key advisor in Carlyle’s numerous investments in various public and private companies. While at Carlyle, Mr. Norris, along with other senior members of the Carlyle team, participated in the acquisition, disposition, strategic focusing and financing (in public and private markets) of numerous companies involving several billion dollars of equity capital. Carlyle invested in leveraged buyouts (LBOs), venture capital (particularly telecommunications and wireless companies in the pre-Internet days), and real estate. Today, Carlyle is one of the largest and most successful private equity firms in the world. Prior to co-founding Carlyle, Mr. Norris was a Corporate Vice President of Marriott Corporation in Washington, D.C. He was a principal strategist and advisor for Marriott’s substantial public and private financings, limited partnerships, acquisitions and divestitures from 1981 to mid-1987. In 1992, Mr. Norris was appointed by President George Bush, and confirmed by the U.S. Senate, as one of the five board members of the approximately (at the time) $68 billion Federal Retirement Thrift Investment Board. During his tenure (1992-1995), Mr. Norris successfully advocated for the right of Federal employees to allocate a greater portion of their savings into public equities. Until late 1996, Mr. Norris served on the Advisory Committee of SEAG, Inc. which advises the Saudi Government on economic development and diversification within the Kingdom of Saudi Arabia. Mr. Norris was a Fellow at Yale Law School (1977) and received a B.S. and J.D. (1972, 1975) with honors from the University of Alabama, and an L.L.M. from New York University (1976). Management believes that Mr. Norris’ past experience qualifies him for his position with the Company.
| 22 |
Family Relationships
No family relationship has ever existed between any director, executive officer of the Company, and any person contemplated to become such.
Committees
The board of directors has no standing committees. However, the Company intends to implement a comprehensive corporate governance program, including establishing various board committees and adopting a Code of Ethics in the future.
Section 16(a) of the Securities Exchange Act of 1934
As of the date of this report, we are not subject to Section 16(a) of the Securities Exchange Act of 1934.
Item 11. Executive Compensation
The following table shows for the period ended December 31, 2015, the compensation awarded (earned) or paid by the Company to its named executive officers or acting in a similar capacity as that term is defined in Item 402(a)(2) of Regulation S-K. There are no understandings or agreements regarding compensation that our management will receive after a business combination that is required to be included in this table, or otherwise.
| Name and Principal Position | Fiscal Year | Salary ($) | Bonus | Option Awards | All Other Compensation | Total ($) | ||||||||||||||||||
| Ron Throgmartin - CEO | 2015 | Accrued | $ | 250,000 | - | - | - | 250,000 | ||||||||||||||||
| Paid | $ | 129,414 | - | - | - | 129,414 | ||||||||||||||||||
| 2014 | Accrued | $ | 213,250 | - | - | - | 213,250 | |||||||||||||||||
| Paid | $ | 181,250 | - | - | - | 181,250 | ||||||||||||||||||
| Christopher Strachan - CFO | 2015 | Accrued | $ | - | - | - | - | - | ||||||||||||||||
| Paid | $ | - | - | - | - | - | ||||||||||||||||||
| 2014 | Accrued | $ | - | - | - | - | - | |||||||||||||||||
| Paid | $ | - | - | - | - | - | ||||||||||||||||||
Employment and Director Agreements
The Company entered into a consulting agreement with Triple Enterprises and affiliates on August 26, 2014. In exchange for 200,000 warrants and a monthly fee of $35,000, Triple Enterprises agreed to act as a financial advisor, provide supervisory and advisory services and assist in the preparation of the Company’s public filings. Mr. Philip Gay is the Managing Director of Triple Enterprises and Mr. Nick Roberts is the Financial Manager of Triple Enterprises.
On September 17, 2014, the Company entered into a five year employment agreement with Doug C. Anderson as Vice Chairman and Vice President of Strategy and Vision. Beginning in 2014, Mr. Anderson began earning an annual salary of two hundred fifty thousand dollars ($250,000) per annum. Following the completion of an offering of the Company’s Series A Preferred stock, the Executive’s Base Salary shall automatically be increased to Two Hundred Eighty Thousand ($280,000) per annum. For each year thereafter, the Company’s Board (or compensation committee of the Company’s Board, or, at the discretion of the Company’s Board, by a committee composed of two or more members of the Company’s Board (for purposes of this Agreement, the “Committee”) shall review the Executive’s Base Salary and may provide for such increases therein as it may, in its discretion, deem appropriate. The employment agreement also allows for a performance bonus, to be determined by the Company’s Board at the discretion of the Company’s Board, and participation of any equity compensation plan of the Company.
If Mr. Anderson’s employment is terminated prior to the expiration of the term of his employment agreement, certain significant payments become due. The amount of such payments depends on the nature of the termination. In addition, the employment agreement contains a change of control provision that provides for the payment of three times the then current base salary and five times the average bonus paid to Mr. Anderson for the three full calendar years immediately prior to the change of control. The employment agreement also contains both a confidentiality and noninterference provision which are effective from the date of employment through one year from the date the employment agreement is terminated.
Mr. Ron Throgmartin and Mr. Alan Valdes entered into agreements with identical terms to that of Mr. Anderson, for the position of Chief Executive Officer and Chairman of the Board respectively. Following the Merger, Mr. Throgmartin’s position was changed to Chief Operating Officer. The other terms of his agreement remained in place.
| 23 |
In exchange for Mr. Norris’ service on the Board, he received 50,000 warrants with an exercise price of $0.0001. In addition, Mr. Norris currently receives $10,000 per month in exchange for his services on the Board.
Option Plan
The Company established an Equity Incentive Plan to provide additional incentive to key employees, directors and consultants, and to promote the success of the Company’s business. The terms of each option shall be no more than 10 years from the date of grant at an exercise price equal to the Fair Market Value on the date of the grant.
Director Compensation
The board has not implemented a plan to award options to any directors. There are no contractual arrangements with any member of the board of directors and our directors do not receive any compensation.
Item 12. Security Ownership of Certain Beneficial Owners and Management and Related Stockholder Matters
The following table sets forth certain information as of April 15, 2016, with respect to the holdings of: (1) each person known to us to be the beneficial owner of more than 5% of our Common Stock; (2) each of our directors, nominees for director and named executive officers; and (3) all directors and executive officers as a group. To the best of our knowledge, each of the persons named in the table below as beneficially owning the shares set forth therein has sole voting power and sole investment power with respect to such shares, unless otherwise indicated.
| Name of Beneficial Owner and Address (1) | Amount
and Nature of Beneficial Ownership of Common Stock | Percent
of Common Stock (2) | ||||||
| Douglas Anderson | 5,882,800 | 21.04 | % | |||||
| Alan Valdes (4) | 3,900,000 | 13.95 | % | |||||
| Stephen Norris | 59,000 | * | ||||||
| Ron Throgmartin (4) | 1,820,000 | 6.51 | % | |||||
| All directors and officers as a group (4 people) | 41.87 | % | ||||||
| 5% Shareholders | ||||||||
| TMK Holdings LLC (3) | 3,840,000 | 13.43 | % | |||||
| Wall Street Capital Partners LLC (4) | 7,020,000 | 25.12 | % | |||||
| (1) | Unless otherwise noted, the address of each beneficial owner is c/o 3435 Ocean Park Blvd., #107-610, Santa Monica, CA 90405. |
| (2) | Based on 37,653,972 shares of Common Stock issued and outstanding as of March 20, 2016. |
| (3) | TMK Holdings holds 3,200,000 shares of common stock and 640,000 warrants. |
| (4) | 7,020,000 shares of Wall Street Capital Partners LLC are beneficially owned as follows: (a) 3,900,000 by Alan Valdes; (b) 1,160,000 Ron Throgmartin, (c) 910,000 Julie Throgmartin, the wife of Ron Throgmartin, and (d) 1,300,000 by Steve Hubbard. |
| * | Less than 1 percent |
| 24 |
Item 13. Certain Relationships and Related Transactions, and Director Independence
Except as disclosed below, none of the following persons has any direct or indirect material interest in any transaction to which we are a party since our incorporation or in any proposed transaction to which we are proposed to be a party:
| (A) | Any of our directors or officers; | |
| (B) | Any proposed nominee for election as our director; | |
| (C) | Any person who beneficially owns, directly or indirectly, shares carrying more than 10% of the voting rights attached to our Common Stock; or | |
| (D) | Any relative or spouse of any of the foregoing persons, or any relative of such spouse, who has the same house as such person or who is a director or officer of any parent or subsidiary of our company. |
Director Independence
Because our common stock is not currently listed on a national securities exchange, we have used the definition of “independence” of The NASDAQ Stock Market to make this determination. NASDAQ Listing Rule 5605(a)(2) provides that an “independent director” is a person other than an officer or employee of the Company or any other individual having a relationship which, in the opinion of the Company’s board of directors, would interfere with the exercise of independent judgment in carrying out the responsibilities of a director. The NASDAQ listing rules provide that a director cannot be considered independent if:
| ● | the director is, or at any time during the past three years was, an employee of the company; | |
| ● | the director or a family member of the director accepted any compensation from the company in excess of $120,000 during any period of 12 consecutive months within the three years preceding the independence determination (subject to certain exclusions, including, among other things, compensation for board or board committee service); | |
| ● | a family member of the director is, or at any time during the past three years was, an executive officer of the company; | |
| ● | the director or a family member of the director is a partner in, controlling stockholder of, or an executive officer of an entity to which the company made, or from which the company received, payments in the current or any of the past three fiscal years that exceed 5% of the recipient’s consolidated gross revenue for that year or $200,000, whichever is greater (subject to certain exclusions); | |
| ● | the director or a family member of the director is employed as an executive officer of an entity where, at any time during the past three years, any of the executive officers of the company served on the compensation committee of such other entity; or the director or a family member of the director is a current partner of the company’s outside auditor, or at any time during the past three years was a partner or employee of the company’s outside auditor, and who worked on the company’s audit. |
We do not have any independent directors. We do not have an audit committee, compensation committee or nominating committee. We currently do not have a code of ethics that applies to our officers, employees and director.
Item 14. Principal Accounting Fees and Services
Audit Fees
For the Company’s fiscal years ended December 31, 2015 and 2014, we were billed approximately $15,000 and $9,500 for professional services rendered for the audit and quarterly reviews of our financial statements.
Audit Related Fees
None.
Tax Fees
None.
All Other Fees
None.
| 25 |
Item 15. Exhibits and Financial Statement Schedules
| (a) | The following documents are filed as part of this report: |
| (1) | Financial Statements |
Reference is made to the Index to Consolidated Financial Statements of the Company under Item 8 of Part II.
| (2) | Financial Statement Schedule |
All consolidated financial statement schedules are omitted because they are not applicable or the amounts are immaterial, not required, or the required information is presented in the financial statements and notes thereto in Item 8 of Part II above.
| (3) | Exhibits |
| EXHIBIT NUMBER | DESCRIPTION | |
| 3.1 | Articles of Incorporation (1) | |
| 3.2 | By-Laws (1) | |
| 10.1 | Form of Sponsor Agreement (1) | |
| 10.2 | Animas Canada Sponsorship Agreement dated April 9, 2012 (2) | |
| 10.3 | Company Announcements | |
| 31.1 | Certification of Principal Executive Officer and Principal Financial Officer, pursuant to 18 U.S.C. Section 1350 as adopted pursuant to Section 302 of the Sarbanes-Oxley Act of 2002. | |
| 32.1 | Certification of Principal Executive Officer and Principal Financial Officer, pursuant to 18 U.S.C. Section 1350 as adopted pursuant to Section 302 of the Sarbanes-Oxley Act of 2002. | |
| 101.INS | XBRL Instance Document. | |
| 101.SCH | XBRL Taxonomy Extension Schema Document. | |
| 101.CAL | XBRL Taxonomy Extension Calculation Linkbase Document. | |
| 101.DEF | XBRL Taxonomy Extension Definition Linkbase Document. | |
| 101.LAB | XBRL Taxonomy Extension Label Linkbase Document. | |
| 101.PRE | XBRL Taxonomy Extension Presentation Linkbase Document. |
(1) Incorporated by reference to the Company’s Registration Statement on Form S-1 filed on July 1, 2013.
(2) Incorporated by reference to the Company’s Registration Statement on Form S-1 filed on August 12, 2013.
| 26 |
SIGNATURES
Pursuant to the requirements of Section 13 or 15(d) of the Securities Exchange Act of 1934, the registrant has duly caused this report to be signed on its behalf by the undersigned, thereunto duly authorized.
| DIEGO PELLICER WORLDWIDE, INC. | ||
| Date: April 29, 2016 | By: | /s/ Ron Throgmartin |
| Ron Throgmartin | ||
| Chief Executive Officer | ||
Pursuant to the requirements of the Securities Exchange Act of 1934, this report has been signed below by the following person on behalf of the Registrant and in the capacities and on the dates indicated.
| Signature | Title | Date | ||
| /s/ Ron Throgmartin | Chief Executive Officer | April 29, 2016 | ||
| Ron Throgmartin | ||||
| /s/ Christopher Strachan | Chief Financial Officer | April 29, 2016 | ||
Christopher Strachan |
| 27 |