Attached files
| file | filename |
|---|---|
| EX-31.1 - EXHIBIT 31.1 - INSPERITY, INC. | a12312015-10kaxex311.htm |
| EX-31.2 - EXHIBIT 31.2 - INSPERITY, INC. | a12312015-10kaxex312.htm |
UNITED STATES
SECURITIES AND EXCHANGE COMMISSION
Washington, D.C. 20549
FORM 10-K/A
(Amendment No. 1)
(Mark One)
ý | Annual Report Pursuant to Section 13 or 15(d) of the Securities Exchange Act of 1934 |
For the fiscal year ended December 31, 2015. | |
or
o | Transition Report Pursuant to Section 13 or 15(d) of the Securities Exchange Act of 1934 |
For the transition period from _____________________to _____________________ | |
Commission File No. 1-13998
Insperity, Inc.
(Exact name of registrant as specified in its charter)
Delaware | 76-0479645 | |
(State or other jurisdiction of incorporation or organization) | (I.R.S. Employer Identification No.) | |
19001 Crescent Springs Drive | ||
Kingwood, Texas | 77339 | |
(Address of principal executive offices) | (Zip Code) | |
Registrant’s Telephone Number, Including Area Code: (281) 358-8986
Securities Registered Pursuant to Section 12(b) of the Act:
Common Stock, par value $0.01 per share | New York Stock Exchange | |
Rights to Purchase Series A Junior Participating Preferred Stock | New York Stock Exchange | |
(Title of class) | (Name of Exchange on Which Registered) | |
Securities Registered Pursuant to Section 12(g) of the Act: NONE
Indicate by check mark if the registrant is a well-known seasoned issuer, as defined in Rule 405 of the Securities Act.
Yes ý No o
Indicate by check mark if the registrant is not required to file reports pursuant to Section 13 or Section 15(d) of the Act.
Yes o No ý
Indicate by check mark whether the registrant (1) has filed all reports required to be filed by Section 13 or 15(d) of the Securities Exchange Act of 1934 during the preceding 12 months (or for such shorter period that the registrant was required to file such reports) and (2) has been subject to such filing requirements for the past 90 days. Yes ý No o
Indicate by check mark whether the registrant has submitted electronically and posted on its corporate website, if any, every Interactive Data File required to be submitted and posted pursuant to Rule 405 of Regulation S-T during the preceding 12 months (or for such shorter period that the registrant was required to submit and post such files). Yes ý No o
Indicate by check mark if disclosure of delinquent filers pursuant to Item 405 of Regulation S-K is not contained herein, and will not be contained, to the best of registrant’s knowledge, in definitive proxy or information statements incorporated by reference in Part III of this Form 10-K or any amendment to this Form 10-K. ý
Indicate by check mark whether the registrant is a large accelerated filer, an accelerated filer, a non-accelerated filer, or a smaller reporting company. See the definition of “large accelerated filer,” “accelerated filer,” and “smaller reporting company” in Rule 12b-2 of the Exchange Act.
Large accelerated filer x | Accelerated filer o |
Non-accelerated filer o (Do not check if a smaller reporting company) | Smaller reporting company o |
Indicate by check mark whether the registrant is a shell company (as defined in Rule 12b-2 of the Exchange Act).
Yes o No ý
As of April 15, 2016, 21,386,048 shares of the registrant’s common stock, par value $0.01 per share, were outstanding. As of the last business day of the registrant’s most recently completed second quarter, the aggregate market value of the common stock held by non-affiliates (based upon the June 30, 2015 closing price of the common stock as reported by the New York Stock Exchange) was approximately $966 million.
DOCUMENTS INCORPORATED BY REFERENCE
None.
TABLE OF CONTENTS
Page | ||
PART III | ||
PART IV | ||
EXPLANATORY NOTE
Insperity, Inc. (together with its direct and indirect subsidiaries, “Insperity,” “we,” “us,” “our” or the “Company”) is filing this Amendment No. 1 (this “Amendment”) to its Annual Report on Form 10-K for the year ended December 31, 2015, originally filed with the Securities and Exchange Commission (the “SEC”) on February 12, 2016 (the “Original Filing”).
This Amendment amends Part III of the Original Filing to include information previously omitted from the Original Filing in reliance on General Instruction G(3) to Form 10-K, which permits the information in the above referenced items to be incorporated into the Form 10-K by reference from our definitive proxy statement if such statement is filed no later than 120 days after our fiscal year-end. We no longer intend to file our definitive proxy statement containing such information within 120 days after the end of the fiscal year covered by the Original Filing. The reference on the cover of the Original Filing to the incorporation by reference of our definitive proxy statement into Part III of the Annual Report has been deleted.
As required by Rule 12b-15 promulgated under the Securities Exchange Act of 1934, as amended (the “Exchange Act”), new certifications by the Company’s principal executive officer and principal financial officer are filed as exhibits to this Amendment.
Except as set forth herein, this Amendment does not amend or otherwise update any other information in the Original Filing and does not reflect events occurring after the filing of the Original Filing.
PART III
ITEM 10. DIRECTORS, OFFICERS AND CORPORATE GOVERNANCE.
General
The Company’s Certificate of Incorporation and Bylaws provide that the number of directors on the Board of Directors (the “Board”) shall be fixed from time to time by the Board but shall not be less than three nor more than 15 persons. The number of members constituting the Board is currently fixed at nine.
In accordance with the Certificate of Incorporation of the Company, the members of the Board are divided into three classes. The Certificate of Incorporation also provides that such classes shall be as nearly equal in number as possible. The terms of office of the Class I, Class II and Class III directors expire at the Annual Meeting of Stockholders in 2017, 2018 and 2016, respectively.
Agreement with Starboard
On March 21, 2015, the Company entered into an Agreement (the “Agreement”) with Starboard Value LP and certain of its affiliates named therein (collectively, “Starboard”). The following is a summary of the material terms of the Agreement. The summary does not purport to be complete and is qualified in its entirety by reference to the Agreement, a copy of which is attached as Exhibit 10.1 to the Company’s Current Report on Form 8-K filed with the SEC on March 23, 2015 and is incorporated herein by reference.
Pursuant to the Agreement, the Company appointed (a) Peter A. Feld and Michelle McKenna-Doyle as Class I directors; and (b) Norman R. Sorensen as a Class II director. In addition, pursuant to the Agreement, the Company nominated for election at the 2015 Annual Meeting of Stockholders (a) Carol Kaufman, Paul Sarvadi and Norman R. Sorensen for election to the Board as Class II directors with terms expiring at the 2018 Annual Meeting of Stockholders; and (b) Austin Young as a Class I director with a term expiring at the 2017 Annual Meeting of Stockholders. In addition, Starboard voted its shares of the Company’s common stock (“Common Stock”) for the election of each of Ms. Kaufman and Messrs. Sarvadi, Sorensen and Young at the 2015 Annual Meeting of Stockholders. Substantially concurrently with the adjournment of the 2015 Annual Meeting, Eli Jones and Michael Brown resigned as Class I directors with terms expiring at the 2017 Annual Meeting of Stockholders and were immediately reappointed by the Board as Class III directors with terms expiring at the 2016 Annual Meeting of Stockholders.
If Mr. Feld or Ms. McKenna-Doyle (or any replacement director) is unable or unwilling to serve, resigns or is removed as a director prior to the 2017 Annual Meeting of Stockholders, or if Mr. Sorensen (or any replacement director) is unable or unwilling to serve, resigns or is removed as a director prior to the 2018 Annual Meeting of Stockholders, and at such time Starboard beneficially owns in the aggregate at least the lesser of (a) 3% of the Company’s then outstanding shares of Common Stock; and (b) 764,983 shares of Common Stock (the “Minimum Ownership Threshold”), Starboard has the ability to recommend a replacement director in accordance with the terms of the Agreement.
Pursuant to the Agreement, Starboard obtained from Mr. Feld an irrevocable resignation letter pursuant to which he shall resign from the Board and all applicable committees and subcommittees of the Board if, at any time, Starboard’s aggregate beneficial ownership
4
of Common Stock decreases to less than the Minimum Ownership Threshold. Mr. Feld has also entered into a confidentiality agreement with the Company and Starboard.
Directors
Class III Directors (Terms Expiring at the 2016 Annual Meeting)
Michael W. Brown. Mr. Brown, age 70, joined the Company as a director in November 1997. He is a member of the Company’s Compensation Committee and the Nominating and Corporate Governance Committee and was a member of the Independent Advisory Committee. Mr. Brown is the past chairman of the NASDAQ Stock Market Board of Directors and a past governor of the National Association of Securities Dealers. Mr. Brown joined Microsoft Corporation in 1989 as its treasurer and became its chief financial officer in 1993, in which capacity he served until his retirement in July 1997. Prior to joining Microsoft, Mr. Brown spent 18 years with Deloitte & Touche LLP. Mr. Brown is also a director of EMC Corporation (NYSE: EMC), Stifel Financial Corporation (NYSE: SF) and VMware, Inc. (NYSE: VMW). He serves on the audit and finance committees of EMC Corporation; audit and compensation committees of VMware, Inc.; and risk management/corporate governance committee of Stifel Financial Corporation. Mr. Brown also serves or has served as a director, trustee or advisor of several private businesses, civic and charitable organizations. Mr. Brown holds a Bachelor of Science degree in Economics from the University of Washington in Seattle.
Mr. Brown brings to the Board substantial expertise that includes an extensive knowledge of the complex financial and operational issues affecting large companies, and a deep understanding of accounting principles and financial reporting rules and regulations. His prior experience in public accounting and as a chief financial officer of a global technology company brings an important perspective to the Board. Mr. Brown also serves on the boards, as well as the audit committees and compensation committees, of multiple publicly traded companies in both the technology and financial services sectors, which provides us with valuable insight on technological and strategic issues affecting the Company. Mr. Brown’s prior service as chairman of the Nasdaq Stock Market Board of Directors and as a past governor of the National Association of Securities Dealers provides experience with issues affecting a publicly traded company as well as demonstrating Mr. Brown’s leadership and business acumen.
Eli Jones. Dr. Jones, age 54, joined the Company as a director in April 2004. Dr. Jones has announced that he will not stand for re-election to the Board and will retire from the Board when his term expires at the 2016 Annual Meeting of Stockholders. He is chairperson of the Company’s Compensation Committee and a member of the Nominating and Corporate Governance Committee. Since July 2015, Dr. Jones has served as the Dean of the Mays Business School at Texas A&M University. Prior to his current position, from 2012, he was the Dean of the Sam M. Walton College of Business at the University of Arkansas and holder of the Sam M. Walton Leadership Chair in Business. Prior to joining the faculty at the University of Arkansas, he was Dean of the E. J. Ourso College of Business and Ourso Distinguished Professor of Business at Louisiana State University (“LSU”) from 2008 to 2012; Professor of Marketing and Associate Dean at the C.T. Bauer College of Business at the University of Houston from 2007 to 2008; an Associate Professor of Marketing from 2002 to 2007; and an assistant professor from 1997 until 2002. He taught at Texas A&M University for several years before joining the faculty of the University of Houston. Dr. Jones served as the executive director of the Program for Excellence in Selling and the founding director of the Sales Excellence Institute at the University of Houston from 1997 to 2007. Before becoming a professor, he worked in sales and sales management for three Fortune 100 companies: Quaker Oats, Nabisco and Frito-Lay. He received his Bachelor of Science degree in Journalism in 1982, his MBA in 1986, and his Ph.D. in 1997, all from Texas A&M University.
Dr. Jones brings to the Board significant experience and cutting-edge knowledge and expertise. He is considered a “sales scientist” in that he conducts and publishes cutting-edge research in sales, sales management, marketing strategy, leadership and customer relationship management based on data from organizations world-wide, which are areas critical to the Company. Dr. Jones is able to draw upon his research to provide the Board knowledge with respect to the Insperity sales force. Dr. Jones’ prior service as Dean of the E. J. Ourso College of Business and Ourso Distinguished Professor of Business at LSU and as Dean of the Sam M. Walton College of Business at the University of Arkansas and holder of the Sam M. Walton Leadership Chair in Business, as well as his new role as Dean of the Mays Business School at Texas A&M University, demonstrate his leadership and broad-based business acumen.
Richard G. Rawson. Mr. Rawson, age 67, President of the Company and the majority of its subsidiaries, has been a director of the Company since 1989. He has been President of the Company since August 2003. Before being elected president, he served as executive vice president of administration, chief financial officer and treasurer of the Company from February 1997 until August 2003. Prior to that, he served as senior vice president, chief financial officer and treasurer of the Company since 1989. Prior to joining the Company in 1989, Mr. Rawson served as a senior financial officer and controller for several companies in the manufacturing and seismic data processing industries. He has served NAPEO as president, first vice president, second vice president and treasurer, as well as chairman of the Accounting Practices Committee. Mr. Rawson has a Bachelor of Business Administration degree in Finance from the University of Houston and currently serves as a member of the board for the C.T. Bauer College of Business.
5
Mr. Rawson brings financial and operational experience to the Board. His lengthy service as president of the Company, as well as his prior service as chief financial officer and treasurer of the Company, provide in-depth knowledge and insight of Company operations and financial matters to the Board.
Class I Directors (Terms Expiring at the 2017 Annual Meeting)
Peter A. Feld. Mr. Feld, age 37, joined the Company as a director in March 2015 following his nomination by Starboard pursuant to the Agreement. He is a member of the Company’s Compensation Committee and the Nominating and Corporate Governance Committee, and served as chair of the Independent Advisory Committee. Mr. Feld is a Managing Member and Head of Research of Starboard Value LP, a New York-based investment adviser with a focused and fundamental approach to investing in publicly traded U.S. companies, a position he has held since April 2011. From November 2008 to April 2011, Mr. Feld served as a Managing Director of Ramius LLC and a Portfolio Manager of Ramius Value and Opportunity Master Fund Ltd. From February 2007 to November 2008, Mr. Feld served as a Director at Ramius LLC. Since January 2016, he has served as a member of the board of directors of The Brink’s Company, a global leader in security-related services. Mr. Feld previously served as a member of the boards of directors of Darden Restaurants, Inc. (NYSE: DRI), a full service restaurant company from October 2014 to September 2015; Tessera Technologies, Inc. (Nasdaq: TSRA), which develops, invests in, licenses and delivers innovative miniaturization technologies and products for next-generation electronic devices, from June 2013 to April 2014; Integrated Device Technology, Inc. (Nasdaq: IDTI), a company which designs, develops, manufactures and markets a range of semiconductor solutions for the advanced communications, computing and consumer industries, from June 2012 to February 2014; Unwired Planet, Inc. (Nasdaq: UPIP) f/k/a Openwave Systems, Inc., a company with a portfolio of patents many of which are considered foundational to mobile communications, and span smart devices, cloud technologies and unified messaging, from July 2011 to March 2014 and as chairman from September 2011 to July 2013; and SeaChange International, Inc. (Nasdaq: SEAC), a leading global multi-screen video software company, from December 2010 to January 2013. Mr. Feld has also served as a member of the audit, compensation and nominating and corporate governance committees of several of the boards of directors on which he has served. Mr. Feld received a BA in economics from Tufts University.
Mr. Feld’s extensive knowledge of the capital markets and corporate governance practices as a result of his investment and private equity background makes him a valuable asset to the Board.
Michelle McKenna-Doyle. Ms. McKenna-Doyle, age 50, joined the Company as a director in April 2015 following her nomination by Starboard pursuant to the Agreement. She is a member of the Company’s Finance, Risk Management and Audit Committee. Since October 2012, Ms. McKenna-Doyle has served as the Senior Vice President (“SVP”) and Chief Information Officer (“CIO”) of the NFL, a professional American football league. Prior to joining the NFL, from May 2011 to October 2012, she served as CIO at Constellation Energy Group, Inc., an energy supplier, where she implemented major technology strategic initiatives and led the company’s integration with Exelon in connection with the merger of the two companies. Ms. McKenna-Doyle served as the President of Vision Interactive Media Group, a global digital interactive media solutions nonprofit company, from September 2010 to June 2011. From May 2007 to May 2010, she served as SVP and CIO at Universal Orlando Resort, a theme park resort owned by NBCUniversal, and from April 2006 to May 2007, she served as CIO of Centex Destination Properties, a division of Centex Corporation, a home builder. She previously spent more than 13 years at the Walt Disney World Company, an American diversified multinational mass media corporation, where she held senior leadership positions in finance, marketing and information technology. In March 2015, Ms. McKenna-Doyle was appointed to the board of directors of RingCentral, Inc. (NYSE: RNG), where she serves on the audit and compensation committees. Ms. McKenna-Doyle received a Bachelor of Science degree in Accounting from Auburn University and an MBA from the Crummer Graduate School of Business, Rollins College. She was formerly licensed as a certified public accountant in the State of Georgia. She has extensive experience in the media and entertainment industry.
Ms. McKenna-Doyle brings to the Board extensive experience with technology management and senior leadership, including at service-related businesses, as well as financial and accounting acumen. Her background with information technology and data security further provides the Board with a key perspective on such matters that are increasingly important to the Company.
Austin P. Young. Mr. Young, age 75, joined the Company as a director in January 2003. He is the Company’s Lead Independent Director, chair of the Company’s Finance, Risk Management and Audit Committee and a member of the Company’s Nominating and Corporate Governance Committee. He was also a member of the Company’s Independent Advisory Committee. Mr. Young served as senior vice president, chief financial officer and treasurer of CellStar Corporation from 1999 to December 2001, when he retired. From 1996 to 1999, he served as executive vice president - finance and administration of Metamor Worldwide, Inc. Mr. Young also held the position of senior vice president and chief financial officer of American General Corporation for over eight years and was a partner in the Houston and New York offices of KPMG before joining American General. Mr. Young has served as a director of Amerisafe, Inc. (Nasdaq: AMSF) since November 2005, where he is also chairman of the audit committee. He served as a director and chairman of the audit committees of Tower Group International, Ltd. (former Nasdaq-listed company) and its predecessor company from 2004 until September 2014. He is a member of the Houston and State Chapters of the Texas Society of CPAs, the American Institute of CPAs, and the Financial Executives International. He holds an accounting degree from The University of Texas.
6
Mr. Young brings extensive financial and accounting experience to the Board. His prior experience as a partner in an international accounting firm, as a senior financial officer of large companies, and his service on the audit committees of publicly traded companies provide Mr. Young with a thorough understanding of generally accepted accounting principles and financial statements. Additionally, Mr. Young’s prior experience provides a solid background for him to advise and consult with the Board on financial and audit-related matters as chairperson of the Finance, Risk Management and Audit Committee, and to serve as the designated audit committee financial expert of the Finance, Risk Management and Audit Committee. Mr. Young’s service on other boards and his extensive knowledge of the Company and its business provide us with additional valuable perspective on issues affecting the Company.
Class II Directors (Terms Expiring at the 2018 Annual Meeting)
Carol R. Kaufman. Ms. Kaufman, age 66, joined the Company as a director in November 2013. She is chair of the Company’s Nominating and Corporate Governance Committee and a member of the Company’s Finance, Risk Management and Audit Committee. Ms. Kaufman is the executive vice president, secretary, chief administrative officer and chief governance officer of The Cooper Companies, Inc., a global medical device company, where she has served since October 1995, including as vice president of legal affairs beginning in March 1996, senior vice president beginning in October 2004 and her current position beginning in July 2011. From January 1989 through September 1995, she served as vice president, secretary and chief administrative officer of Cooper Development Company, a former affiliate of The Cooper Companies, Inc. Beginning in 1971, Ms. Kaufman held several financial positions, including deputy corporate controller, with Cooper Laboratories, Inc., the former parent of The Cooper Companies, Inc. Ms. Kaufman served as a director of Chindex, Inc. (former Nasdaq-listed company) from November 2000 until September 2014, serving on its audit and compensation committees and as chair of its governance and nominating committee. Ms. Kaufman earned a Bachelor of Science degree in Mathematics in 1971 from Boston University.
Ms. Kaufman brings extensive financial, accounting and business experience, including in corporate governance, to the Board. Her varied roles within The Cooper Companies, Inc. provide the Board with additional expertise on accounting and controls, and on evaluating and executing strategic initiatives.
Paul J. Sarvadi. Mr. Sarvadi, age 59, Chairman of the Board and Chief Executive Officer and co-founder of the Company and its subsidiaries, has been a director since the Company’s inception in 1986. He has also served as the Chairman of the Board and Chief Executive Officer of the Company since 1989 and as president of the Company from 1989 to August 2003. He attended Rice University and the University of Houston prior to starting and operating several small companies. Mr. Sarvadi has served as president of the National Association of Professional Employer Organizations (“NAPEO”) and was a member of its Board of Directors for five years. In 2001, Mr. Sarvadi was selected as the 2001 National Ernst & Young Entrepreneur of the Year ® for service industries. In 2004, he received the Conn Family Distinguished New Venture Leader Award from Mays Business School at Texas A&M University. In 2007, he was inducted into the Texas Business Hall of Fame.
Mr. Sarvadi brings substantial business and operational experience to the Board, including an extensive knowledge of sales, customer relationships, and issues affecting small to medium-sized businesses. Mr. Sarvadi’s role as a co-founder of the Company and lengthy service as chief executive officer of the Company provide to the Board extensive knowledge and insight of our operations and issues affecting the Company as well as the broader professional employer organization (“PEO”) industry. Mr. Sarvadi’s previous experience starting and operating several small businesses, as well as his frequent interaction with the Company’s clients, provide valuable insight to the challenges facing small to medium-sized businesses, which is a principal focus of the Company.
Norman R. Sorensen. Mr. Sorensen, age 70, joined the Company as a director in March 2015 following his nomination by Starboard pursuant to the Agreement. Mr. Sorensen is a member of the Company’s Finance, Risk Management and Audit Committee and was a member of the Independent Advisory Committee. Mr. Sorensen formerly served as Chairman of the International Insurance Society, Inc., a professional organization for the insurance industry, from January 2010 to June 2013. Mr. Sorensen has served as a director of the International Insurance Society, Inc. since January 2005. Previously, from November 2011 until December 2012, he was Chairman of the International Advisory Council of Principal Financial Group, Inc., a global financial investment management company. He was Chairman of Principal International, Inc., from June 2011 to October 2012, and President and CEO of International Asset Management and Accumulation of Principal International, Inc., from January 2001 to June 2011. Mr. Sorensen has served as a director of Encore Capital Group, Inc. (Nasdaq: ECPG), a consumer banking company, since November 2011. Mr. Sorensen also served as a director of Sara Lee Corporation (former NYSE-listed company), an American consumer-goods company, from January 2007 to November 2011. He has served as Executive Vice President of both Principal Financial Group, Inc. and Principal Life Insurance Company, a life insurance company, since January 2007, and held a number of other senior management positions since 1998. Mr. Sorensen also served as Chairman of the U.S. Coalition of Service Industries, a leading forum for the services sector, from January 2003 to March 2005. Mr. Sorensen served as a senior executive of American International Group, Inc., an insurance services company, from 1989 to December 1998. He also formerly served as Chairman and director of DE Master Blenders 1753, a Dutch NYSE/Euronext-listed consumer goods company, from December 2011 until September 2013.
7
Mr. Sorensen’s qualifications include his experience as an executive officer of an international financial services and asset management company, with responsibility over international operations and oversight over asset management and financial services functions and multiple divisional chief financial officers. He has also served as an executive officer of several publicly traded companies.
Committees of the Board of Directors
The Board has appointed three standing committees: the Finance, Risk Management and Audit Committee; the Compensation Committee; and the Nominating and Corporate Governance Committee. The charters for each of the three standing committees, which have been adopted by the Board, contain a detailed description of the respective standing committee’s duties and responsibilities and are available on the Company’s website at www.insperity.com in the Corporate Governance section under the Investor Relations tab. The Board also created a new, temporary Independent Advisory Committee pursuant to the Agreement. The Board has reviewed the applicable legal and NYSE standards for independence for members of each of Finance, Risk Management and Audit Committee; the Compensation Committee; and the Nominating and Corporate Governance Committee as well as the Company's independence standards for such Committees and has determined that the members of each of those Committees of the Board is “independent” under such requirements.
Nominating and Corporate Governance Committee
The members of the Nominating and Corporate Governance Committee currently are: Ms. Kaufman, who serves as chairperson, Messrs. Brown, Feld and Young, and Dr. Jones. The Nominating and Corporate Governance Committee: (i) identifies individuals qualified to become Board members, consistent with the criteria for selection approved by the Board; (ii) recommends to the Board a slate of director nominees to be elected by the stockholders at the next annual meeting of stockholders and, when appropriate, director appointees to take office between annual meetings; (iii) develops and recommends to the Board a set of corporate governance guidelines for the Company; and (iv) oversees the evaluation of the Board.
Finance, Risk Management and Audit Committee
The members of this Committee currently are Mr. Young, who serves as chairperson, Ms. Kaufman, Ms. McKenna-Doyle and Mr. Sorensen. The Board has determined that Mr. Young is an “audit committee financial expert” as such term is defined in Item 401(h) of Regulation S-K promulgated by the SEC. The Finance, Risk Management and Audit Committee assists the Board in fulfilling its responsibility to oversee the financial affairs, risk management, accounting and financial reporting processes, and audits of financial statements of the Company by reviewing and monitoring: (i) the financial affairs of the Company; (ii) the integrity of the Company’s financial statements and internal controls; (iii) the Company’s compliance with legal and regulatory requirements; (iv) the independent auditor’s qualifications, independence and performance; (v) the performance of the personnel responsible for the Company’s internal audit function and the independent auditors; and (vi) the Company’s policies and procedures with respect to risk management, as well as other matters that may come before it as directed by the Board.
Compensation Committee
The members of the Compensation Committee currently are Dr. Jones, who serves as chairperson, and Messrs. Brown and Feld. The Compensation Committee: (i) oversees and administers the Company’s compensation policies, plans and practices; (ii) reviews and discusses with management the Compensation Discussion and Analysis required by SEC Regulation S-K, Item 402; and (iii) prepares the annual report required by the rules of the SEC on executive compensation for inclusion in the Company’s annual report on Form 10-K or proxy statement for the annual meeting of stockholders. To carry out these purposes, the Compensation Committee: (i) evaluates the performance of and determines the compensation for senior management, taking into consideration recommendations made by the CEO; (ii) administers the Company’s compensation programs; and (iii) performs such other duties as may from time to time be directed by the Board.
Pursuant to the terms of the Insperity, Inc. 2001 Incentive Plan, as amended (the “2001 Incentive Plan”), and the Insperity, Inc. 2012 Incentive Plan (the “2012 Incentive Plan” and, together with the 2001 Incentive Plan, the “Incentive Plans”), the Board or the Compensation Committee may delegate authority under the Incentive Plans to the Chairman of the Board or a committee of one or more Board members, respectively, pursuant to such conditions and limitations as each may establish, except that neither may delegate to any person the authority to make awards, or take other action, under the Incentive Plans with respect to participants who may be subject to Section 16 of the Exchange Act .
8
Independent Advisory Committee
The Independent Advisory Committee, which was formed in 2015 pursuant to the Agreement, reviewed the Company’s business and made recommendations to the Board regarding capital allocation, expenses and targeted ranges for Adjusted EBITDA margins, while taking into consideration the Company’s risk profile and the potential impact of any recommendations on the Company’s business model and strategic plan. Pursuant to the terms of its charter, the Independent Advisory Committee was dissolved in February 2016. The members of the Independent Advisory Committee were Mr. Feld, who served as chairperson, and Messrs. Brown, Sorensen and Young.
Executive Officers
Please see “Item S-K 401(b) - Executive Officers of the Registrant” in the Original Filing.
Section 16(a) Beneficial Ownership Reporting Compliance
Section 16(a) of the Exchange Act requires the Company’s directors and officers and persons who own more than 10% of the Common Stock to file initial reports of ownership and reports of changes in ownership (Forms 3, 4, and 5) of Common Stock with the SEC. Officers, directors and greater than 10% stockholders are required by SEC regulations to furnish the Company with copies of all such forms that they file.
Based solely on review of the copies of such reports furnished to the Company and written representations that no other reports were required, the Company believes that all Section 16(a) reports with respect to the year ended December 31, 2015, applicable to its officers, directors and greater than 10% beneficial owners were timely filed.
Code of Business Conduct and Ethics
The Board has adopted a Code of Business Conduct and Ethics (the “Code”) governing the conduct of the Company’s directors, officers and employees. The Code, which meets the requirements of Rule 303A.10 of the NYSE Listed Company Manual and Item 406 of Regulation S-K, is intended to promote honest and ethical conduct, full, fair, accurate, timely and understandable disclosure in the Company’s public filings, compliance with laws and the prompt internal reporting of violations of the Code. You can access the Code on the Company’s website at www.insperity.com in the Corporate Governance section under the Investor Relations tab. Changes in and waivers to the Code for the Company’s directors, executive officers and certain senior financial officers will be posted on the Company’s Internet website within four business days of being approved and maintained for at least 12 months. If you wish to raise a question or concern or report a violation to the Finance, Risk Management and Audit Committee, you should visit www.ethicspoint.com or call the Ethicspoint toll-free hotline at 1-866-384-4277.
ITEM 11. EXECUTIVE COMPENSATION.
Compensation Discussion and Analysis
This Compensation Discussion and Analysis (“CD&A”) explains our compensation philosophy, objectives and strategies and the underlying elements of our compensation programs for the Company’s named executive officers (“NEOs”). This CD&A also summarizes decisions the Compensation Committee of our Board of Directors (“Compensation Committee”) made regarding these programs and the factors considered in making those decisions. The following individuals comprised our NEOs for 2015:
Name | Title | |
Paul J. Sarvadi | Chief Executive Officer and Chairman of the Board | |
Douglas S. Sharp | Chief Financial Officer, SVP of Finance and Treasurer | |
Richard G. Rawson | President | |
A. Steve Arizpe | Chief Operating Officer and EVP of Client Services | |
Jay E. Mincks | EVP of Sales and Marketing | |
Performance Highlights
The Company’s financial performance in 2015 was strong and continued to reflect our commitment to unit growth in the number of paid worksite employees (“WSEE”), effectively managing our pricing and direct costs, controlling operating expenses and enhancing total return for our stockholders.
9

For 2015, we continued to execute on our strategy to accelerate unit growth in WSEE, achieving double-digit growth of 11.6% on a year-over-year basis. We believe that WSEE is a key metric for measuring our sales success and client retention efforts.
10
______________________________
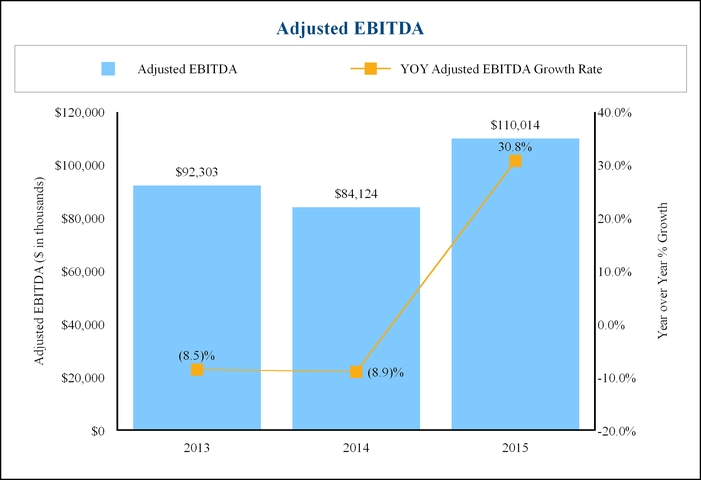
Note: Adjusted EBITDA is a non-GAAP financial measure used by management to analyze the Company’s performance. Please read Item 7. “Management’s Discussion and Analysis of Financial Condition and Results of Operations - Non-GAAP Financial Measures” in our Original Filing for a reconciliation of this non-GAAP financial measure to the most directly comparable financial measure calculated and presented in accordance with GAAP.
For 2015, our adjusted EBITDA was $110.0 million, representing a 30.8% increase compared to 2014. Adjusted EBITDA represents EBITDA (earnings before interest, taxes, depreciation and amortization) plus non-cash impairments, stockholder advisory expenses and stock-based compensation. We believe that this overall increase in adjusted EBITDA demonstrates our ability to execute on our plan to grow sales, retain existing clients, effectively manage our pricing and direct costs and control operating costs.
11

______________________________
* Excludes a special dividend of $2.00 per share paid in the fourth quarter of 2014.
On May 29, 2015, the Company announced a 16% increase to its quarterly cash dividend from $0.19 per share ($0.76 annualized) to $0.22 per share ($0.88 annualized), reflecting our continued confidence in our strategy and the significant free cash flow generated by our business. This is the second increase to our quarterly dividend since 2013, in addition to the $2.00 per share special dividend that we paid in December 2014.
Our Pay-for-Performance Compensation Philosophy
Insperity’s overall compensation philosophy is one of pay-for-performance. The objectives of our compensation plans are to attract, retain and motivate high performing individuals to achieve the Company’s annual and long-term business and strategic goals. A substantial portion of each executive officer’s total compensation package consists of long-term incentive components and a variable annual compensation component. The goal of these compensation components is to align the interests of the executive officers with those of the stockholders by tying a meaningful portion of executive compensation to our financial performance and stock price. In order to remain competitive for talent within the market, total compensation includes a fixed base salary, as well as an element of supplemental benefits and perquisites. We also design our compensation plans to motivate executives to maximize stockholder value over time, without encouraging excessive risk-taking that could adversely impact stockholder value.
The Compensation Committee has historically established a variety of annual performance goals designed to create a strong alignment between executive and stockholder interests. The Compensation Committee selects corporate performance goals that they believe have a direct influence on achieving the Company’s business objectives, contribute to the overall success of the Company and favorably impact stockholder value. Each corporate performance goal is intended to have a challenging achievement level that must be reached before triggering a payout for employees.
Based upon stockholder feedback and following input from our outside compensation consultants on corporate compensation trends and institutional investor preferences for performance-based long-term compensation, the Compensation Committee implemented a performance-based long-term equity incentive program beginning in 2015, as further described under “Elements of
12
Compensation - Long-Term Equity Incentive Compensation.” The Compensation Committee believes that the corporate performance goals that must be achieved for the performance-based awards to vest will align the value that executives could receive from these awards with the value that is created for stockholders. The implementation of a performance-based long-term equity incentive program, in combination with our other compensation elements, supports our pay-for-performance philosophy.
Compensation Objectives
We are committed to attracting, motivating, retaining and encouraging long-term employment of individuals with a demonstrated commitment to integrity and exemplary personal standards of performance. Our culture is based upon the value of and respect for each individual, encouraging personal and professional growth, rewarding outstanding individual and corporate performance and achieving excellence through a high-energy, collegial work environment. We are convinced these elements contribute to our vision of being an “employer of choice,” which increases our value to clients, employees, stockholders, and the communities where we live and work.
Our compensation objectives for our NEOs are based on the same principles that we employ in establishing all of our compensation programs. For our executive officers, our compensation programs are designed to:
• | attract and retain key executive officers responsible for our success; and | ||
• | motivate management both to achieve short-term business goals and to enhance long-term stockholder value. | ||
Compensation Strategies
To accomplish our compensation objectives, we adhere to the following strategies:
• | Promote a performance-driven culture that encourages growth by recognizing and rewarding employees who meet and exceed the Company’s business objectives. | ||
• | Maintain competitive base salaries that compensate employees based upon job responsibilities, level of experience, individual performance, comparisons to the market, internal comparisons and other relevant factors. | ||
• | Motivate and reward individual, departmental and corporate performance through variable pay programs. These programs directly support our business objectives, encourages leadership of departmental units and encourages collaboration and teamwork across the Company. As employees progress to higher levels in the Company, an increasing proportion of their compensation is linked to Company-wide and departmental performance. | ||
• | Alignment of interests among executive officers, employees and stockholders through the use of long-term equity and performance-based incentive compensation opportunities. | ||
• | Provide a competitive benefits package that recognizes and encourages work-life balance and fosters a long-term commitment to the Company. | ||
Insperity’s Best Practice Features
We have embedded in our overall compensation programs features aligned with the objectives of our business and designed to strengthen the link between the interests of our executive officers and those of our stockholders. Following is a summary of practices related to compensation that we have adopted and pay practices that we avoid:
13
What Insperity Has
ü | Stock ownership guidelines, for the CEO, three times base salary and for non-employee directors, three times the annual cash retainer | |
ü | Clawback policy for incentive compensation paid to any employee, including NEOs and other executive officers | |
ü | Minimum vesting period of three years for grants of restricted stock, stock options and phantom shares | |
ü | Double trigger requirement for early vesting of NEO equity awards in the event of a change in control | |
ü | Hedging policy prohibits employees and directors from engaging in hedging transactions involving shares of Common Stock | |
ü | Pledging policy prohibits employees and directors from engaging in pledging transactions involving shares of Common Stock that would be considered significant by the Board | |
ü | Established a lead independent director position | |
ü | Compensation Committee composed entirely of outside, independent directors | |
ü | Independent compensation consultant hired by and reporting directly to the Compensation Committee | |
What Insperity Does Not Have
û | Employment agreements with NEOs or other executive officers | |
û | Executive pension or other similar retirement or supplemental benefits | |
û | Single trigger change in control agreements for NEOs | |
û | Tax gross-ups in the event of a change in control | |
û | Medical coverage for retirees | |
û | Excessive benefits and perquisites | |
Summary of Compensation Elements
As previously described, one of the important values and objectives of our compensation programs is to provide our executive officers with a mixture of pay linked to Company and individual performance. The major elements of our 2015 annual compensation package for executive officers are summarized in the following chart.
Compensation Element | Form of Compensation | Purpose | |||
Fixed | Base Salary | Cash | Provides fixed level of compensation to attract and retain talent | ||
Variable and at Risk | Variable Cash Compensation (Insperity Annual Incentive Program) | Cash | Rewards executive officers for achieving annual Company, departmental and individual performance goals | ||
Long-Term Equity Incentives | Restricted Stock and Performance Shares | Supports long-term focus on creating stockholder value and provides strong retention incentive with multi-year vesting | |||
Benefits | Retirement Benefits | 401(k) Plan | Provides competitive retirement benefits as part of comprehensive pay package | ||
Health & Welfare Benefits | Medical, Dental, Life and Disability Benefits | Provides competitive health and welfare benefits as part of comprehensive pay package | |||
14
Elements of Compensation
Base Salary
Base salary is intended to provide fixed annual compensation to attract and retain talented executive officers. Annual adjustments to base salary are based upon the annual performance evaluation, market data and other relevant considerations. Annual performance appraisals are completed through our talent management system, which evaluates the executive officer’s annual performance based on pre-established competencies and the achievement of specific individual performance goals. Competencies for executive officers include business ethics, continuous learning, integrity, managing customer focus, strategic thinking and visionary leadership.
Variable Cash Compensation
Variable cash compensation places a significant portion of executive compensation at risk and tied to corporate, departmental and individual performance. Variable compensation for all executive officers is paid through the Insperity Annual Incentive Program (“IAIP”), a non-equity incentive program under the stockholder-approved 2012 Incentive Plan. The IAIP embodies our pay-for-performance philosophy and helps align executive officers’ compensation to the Company’s overall performance, as well as to their respective individual performance and the performance of the departments under their respective supervision.
Long-Term Equity Incentive Compensation
Long-term equity incentives align the interests of the executive officers with those of the stockholders. We believe that long-term incentives enhance retention while rewarding executive officers for their service. Long-term equity incentive awards are made under the stockholder-approved 2012 Incentive Plan. The objectives of the 2012 Incentive Plan are to:
• | provide incentives to attract and retain persons with training, experience and ability to serve as our employees; | ||
• | promote the interests of the Company by encouraging employees to acquire or increase their equity interest in the Company; | ||
• | provide a means by which employees may develop a sense of proprietorship and personal involvement in the development and financial success of the Company; and | ||
• | encourage employees to remain with, and devote their best efforts to the business of, the Company, thereby advancing the interests of the Company and its stockholders. | ||
Awards granted under the 2012 Incentive Plan may be in the form of restricted stock, restricted stock units, stock options, phantom shares, performance shares or units, bonus stock or other incentive awards. In recent years, including 2015, incentive awards have been made in the form of restricted stock or performance shares rather than stock options, as we believe the current accounting treatment of these award types more closely reflects the economic value of the award to the employees.
Following an executive compensation study by the Compensation Committee’s independent compensation consultant and based upon stockholder feedback and market compensation trends, including institutional investor preferences for performance-based long-term compensation, the Compensation Committee in March 2015 implemented a performance-based long-term equity incentive program, or LTIP, under the 2012 Incentive Plan. In deciding to add a performance-based long-term component to our compensation elements, the Compensation Committee determined that the LTIP further aligns the Company’s compensation structure with stockholder interests, provides an opportunity to subject a greater percentage of a recipient’s compensation to the achievement of long-term Company growth, creation of shareholder value and aids retention efforts. LTIP awards are tied to achieving increased levels of adjusted EBITDA and, in 2016, a portion is also tied to relative total shareholder return. Awards granted under the LTIP have a three-year performance period with any payout occurring after the conclusion of the performance period in the form of Common Stock. Under terms of the LTIP, the Compensation Committee determines each calendar year whether to make LTIP awards, which executives will participate, the performance goals and the payout opportunities.
Except in the case of a qualifying termination in connection with a change in control, or a termination due to death or disability, a participant in the LTIP must be continuously employed by the Company or its subsidiaries throughout the performance period and on the date such award is paid after the conclusion of the performance period to receive a payout of an award. Awards are granted in the form of phantom shares and will be paid in shares of Common Stock, and may include the right to dividend equivalents.
The 2012 Incentive Plan provides that awards granted to NEOs include a “double trigger” requirement in the case of a “change in control” of the Company as defined under the 2012 Incentive Plan. The imposition of a double trigger means that awards granted to NEOs do not immediately vest following a change in control. Under the double trigger, the conditions and/or restrictions that must be met with respect to vesting or exercisability of future awards granted to NEOs will lapse only after a “qualifying
15
termination” within a prescribed number of months following a change in control. All outstanding equity awards held by NEOs include the double trigger requirement.
In February 2015, the Company amended the 2012 Incentive Plan to require a minimum vesting period of three years for all grants of restricted stock and stock options that are time-vested awards. The Compensation Committee may grant awards with a shorter vesting schedule as an inducement to recruit a new employee, for an award granted in lieu of salary or bonus, or by reason of death, disability or change in control. Under the three year minimum vesting schedule, pro rata vesting is permissible. We anticipate continuing to utilize restricted stock awards with a three-year vesting schedule with no additional holding period required beyond the vesting date.
All equity grants to executive officers are approved solely by the Compensation Committee or the independent directors at regularly scheduled meetings, or in limited cases involving key recruits or promotions, by a special committee, special meeting, or unanimous written consent. If an award is made at a meeting, the grant date is the meeting date or a fixed, future date specified at the time of the grant, such as the first business day of a subsequent calendar month or the date that the grant recipient commences employment. If an award is approved by unanimous written consent, the grant date is a fixed, future date on or after the date the consent is effective under applicable corporate law (or, if later, the date the grant recipient starts employment). Restricted stock and performance awards are valued in accordance with Accounting Standards Codification Topic 718, Compensation-Stock Compensation. For stock options, the exercise price cannot be less than the closing price of Common Stock on the grant date and stock options may not be re-priced or exchanged for a cash buy-out or settlement with a lower exercise price, without prior stockholder approval.
Retirement Benefits
We do not provide pension arrangements or nonqualified defined contribution or other deferred compensation plans for our executive officers. Our executive officers are eligible to participate in the Company’s corporate 401(k) plan. Each payroll period, we contribute on behalf of each participant a matching contribution equal to 50% of the first 6% of compensation contributed to the 401(k) plan by the participant (subject to applicable limitations under the Internal Revenue Code). Effective January 1, 2016, the matching contribution increased to 100% of the first 6% of compensation contributed for all participating employees.
Supplemental Benefits, Including Management Perquisites
Executive compensation also includes supplemental benefits and a limited number of perquisites that enhance our ability to attract and retain talented executive officers. We believe that perquisites assist in the operation of business, allowing executive officers more time to focus on business objectives. Supplemental benefits and perquisites include the following:
Automobile
We provide automobiles to executive officers for both business and personal use. The executive officers are taxed for their personal use of the automobiles.
Supplemental Executive Disability Income Program
We maintain a supplemental executive disability income program for executive officers. The supplemental executive disability income program targets replacement of 75% of total cash compensation up to $20,000 per month. The program recognizes the significant variable pay at the senior levels in the Company and the benefit limitations of our basic long-term disability plan, which provides replacement of 60% of base salary only up to $10,000 per month.
Executive Wellness Program
We offer an Executive Wellness Program to the executive officers to assist them in maintaining their health. The program pays for wellness services, which allow the executive officers an opportunity to have a clear understanding of their current physical condition, risk factors, and ways to improve their health.
Chairman’s Trip
An annual Chairman’s Trip is held for employees recognized during the year for their outstanding service, and for sales representatives meeting a certain sales target and the spouses of those employees and representatives. We believe that executive officers should be part of the trip to recognize these outstanding employees of the Company. We strongly encourage executive officers to bring their spouses to further our vision of being an employer of choice and to build relationships that contribute to retention. We pay the associated income taxes related to the trip on behalf of the employees and the executive officers.
16
Club Membership
During 2015, the Company determined to discontinue paying country club memberships for executive officers, effective January 1, 2016. For 2015, the executive officers are taxed on membership dues.
Aircraft
During the first quarter of 2015, we entered into a plan to sell our aircraft and completed the sale in July 2015. In connection with the sale, perquisites relating to personal use of the aircraft and commuting on the aircraft were discontinued. Prior to the sale, the aircraft were used primarily for business purposes and for third party chartering, which helped to offset costs, and we provided access to the CEO, the president, the chief operating officer, and the executive vice president of sales and marketing for personal use. These individuals were required to reimburse the Company for the incremental cost associated with their personal use. The incremental cost was calculated by multiplying the number of hours of personal use by the average incremental cost per hour. Additionally, the CEO was not required to reimburse the Company for commuting between his primary residence in the greater Dallas area and a second residence in Arkansas and the Company’s headquarters in Houston, Texas and travel to Georgia where the Company has conference facilities. The cost of the CEO’s use of the aircraft for commuting has been included in his total compensation and was considered by the Compensation Committee when determining his compensation. Further, the CEO and other executives have responsibility for paying any income taxes associated with their personal use of the formerly owned aircraft.
Stockholder Advisory Votes
At our 2011 Annual Meeting, the stockholders, on an advisory basis, voted in favor of an annual advisory vote on the frequency of holding future votes to approve the compensation of the Company’s NEOs. In accordance with the stockholders’ preference, the Board has determined that the Company will hold an advisory vote on executive compensation every year.
At our 2015 Annual Meeting, the stockholders approved, in a non-binding advisory vote, the compensation of the Company’s NEOs, with over 88% of the votes cast in favor of such compensation. The Compensation Committee values the opinions expressed by our stockholders and considered input from stockholders, including the vote outcome, when it made compensation decisions for the executive officers for fiscal year 2016.
Role of Management in Setting Compensation
The recommendations of the CEO play a significant role in the Compensation Committee’s determination of compensation matters related to the executive officers reporting directly to the CEO. On an annual basis, the CEO makes recommendations to the Compensation Committee regarding such components as salary adjustments, target annual incentive opportunities and the value of long-term incentive awards. In making his recommendations, the CEO reviews the performance of each of our other executive officers based upon the core competencies of business ethics, continuous learning, integrity, managing customer focus, strategic thinking and visionary leadership, market data for similar positions and other factors deemed relevant in reviewing each executive officer’s performance. The Compensation Committee takes the CEO’s recommendation under advisement, but makes all final decisions regarding such individual’s compensation. The CEO does not make a recommendation with respect to his own compensation. Our CEO typically attends Compensation Committee meetings, but he is excused from any meeting when the Compensation Committee deems it advisable to meet in executive session or when the Compensation Committee meets to discuss items that would impact the CEO’s compensation. Our CEO’s compensation is reviewed and discussed by the Compensation Committee and his performance is evaluated at least annually. The Compensation Committee makes all final compensation decisions for each of our executive officers, including the CEO.
Role of the Compensation Committee in Setting Compensation
The Compensation Committee is responsible for designing, implementing and administering our executive compensation programs and, in doing so, the Compensation Committee is guided by the compensation philosophy stated above. The Compensation Committee reviews and approves total compensation for our executive officers through a comprehensive process that includes:
• | selecting and engaging an external, independent consultant; | |
• | reviewing and selecting companies to be included in our peer group; | |
• | reviewing market data on all major elements of executive compensation; | |
• | reviewing alignment of executive compensation and incentive goals with stockholder value; and | |
• | reviewing performance results against corporate, departmental and individual goals. | |
17
When reviewing and setting compensation for executive officers, the Compensation Committee also reviewed tally sheets setting forth all components of compensation for each executive officer for the previous three years. Tally sheets included dollar values for the three previous years’ salary, cash incentive awards, perquisites (cash and in-kind), long-term stock-based awards, benefits and dividends paid on unvested long-term stock-based awards. Tally sheets were used to assist the Compensation Committee in determining current compensation decisions in view of executive officers’ historical and cumulative pay.
A complete listing of our Compensation Committee’s responsibilities is included in the Compensation Committee’s charter, which is available for review on our corporate website at www.insperity.com in the Corporate Governance section under the Investor Relations tab.
Role of the Compensation Consultants in the Compensation Process
The Compensation Committee’s charter provides that it has the sole authority to retain and terminate any compensation consultant to assist in maintaining compensation practices in alignment with our compensation goals. The Compensation Committee believes that outside consultants are an efficient way to keep current on executive compensation trends and stay abreast of competitive compensation practices. The Compensation Committee has periodically engaged Pearl Meyer & Partners (“PM&P”) to conduct executive compensation studies and engaged Meridian Compensation Partners LLC (“Meridian”) for the first time in August 2015 for similar purposes. Neither PM&P nor Meridian received any remuneration from the Company, directly or indirectly, other than for advisory services rendered to, or at the direction of, the Compensation Committee or the Board. The Compensation Committee has reviewed PM&P’s independence and determined that PM&P is an independent advisor with no conflicts of interest with us (as determined under Rule 10C-1(b)(4)(i) of the Exchange Act). The Compensation Committee has also reviewed Meridian’s independence and determined that Meridian is an independent advisor with no conflicts of interest with us (as determined under Rule 10C-1(b)(4)(i) of the Exchange Act).
Assessing External Market Compensation Practices
At the direction of the Compensation Committee, we periodically conduct an executive compensation study that compares each executive officer’s compensation to market data for similar positions. The Compensation Committee determines whether the study is to be performed internally by Insperity or by an outside consulting firm that is directly engaged by the Compensation Committee. While the Compensation Committee does not target our executives’ pay to any particular level (such as a target percentile) of comparative market data contained in executive compensation studies, such data help to inform and influence pay decisions and are considered by the Compensation Committee in meeting our compensation program objectives as described above.
Compensation Peer Group
Selecting a peer group to benchmark compensation for our executives presents certain challenges, including the limited number of publicly-traded PEOs and the Company’s unique business model. As one of the largest PEO service providers in the United States, our direct PEO service competitors include TriNet Group, Inc., a national PEO, and the PEO divisions of Automatic Data Processing, Inc. and Paychex, Inc., which are significantly larger business service companies. The delivery of our PEO services and strategic business unit services requires a variety of professional services, information technology services and software. These areas represent important components of our overall service offerings, and we compete for talent with many companies offering similar services or products. Our peer group includes a number of these companies. Consistent with our historical position, the Company does not view traditional staffing companies as competitors for business or talent and has not included such companies in our compensation peer group. We do not provide leased employees or staffing employees to clients, and in 2010 incurred significant expense and undertook significant re-branding efforts to change our name to Insperity in part to avoid any confusion with traditional staffing companies.
In 2014, PM&P was engaged by the Compensation Committee to conduct an executive compensation study (the “ Study”) as part of the process of determining 2015 compensation. In connection with the Study, PM&P identified a peer group consisting of publicly traded companies that provide human resources and other business products and services and whose average trailing 12 months of sales revenue equated to approximately $2.3 billion (the “Compensation Peer Group”). The selection process for the Compensation Peer Group took into account multiple factors, including: industry (with an emphasis on outsourced human resources services, including the PEO competitors of the Company), comparable revenue range, comparability in terms of complexity and business risk, and the extent to which each company may compete with Insperity for executive talent. The Compensation Peer Group is periodically reviewed and may be modified based on these and other relevant criteria. For 2015, the Compensation Peer Group included the following companies:
18
Company Name | Company Ticker | ||
Providers of PEO Services | Automatic Data Processing, Inc. | ADP | |
Paychex, Inc. | PAYX | ||
TriNet Group, Inc. | TNET | ||
IT Services and Software | Concur Technologies, Inc.* | CNQR* | |
Cognizant Technology Solutions Corporation | CTSH | ||
Convergys Corporation | CVG | ||
Gartner, Inc. | IT | ||
Genpact Limited | G | ||
Intuit, Inc. | INTU | ||
Paycom Software, Inc. | PAYC | ||
The Ultimate Software Group, Inc. | ULTI | ||
Web.com Group, Inc. | WWWW | ||
Professional Services | CBIZ, Inc. | CBZ | |
Korn/Ferry International | KFY | ||
Resources Connection, Inc. | RECN | ||
Towers Watson & Company | TW | ||
______________________________
* Concur Technologies, Inc. was subsequently acquired by SAP SE in December 2014.
The Study examined market compensation data for executive positions based on a combination of proxy data of the Compensation Peer Group and benchmark position compensation survey data. Survey sources included PM&P’s proprietary general executive compensation databases and other independent surveys. In addition to the Study conducted by PM&P, internal factors are also an important consideration when determining each executive officer’s compensation. These factors include:
• | the executive officer’s performance review conducted by either the Compensation Committee (for the CEO) or the CEO (for all other executive officers); | ||
• | the CEO’s recommendations regarding the other executive officers; | ||
• | the executive officer’s tenure with the Company, industry experience and ability to influence stockholder value; and | ||
• | the importance of the executive officer’s position to the Company in relation to the other executive officer positions within the Company. | ||
2015 Executive Compensation Decisions
Base Salary Changes
The Company awarded merit salary increases during the first quarter of 2015 to the NEOs as follows:
2014 | 2015 | 2015 | |||
Base Salary | Base Salary | Increase | |||
Chief Executive Officer and Chairman of the Board | $850,000 | $850,000 | — | ||
Chief Financial Officer, SVP of Finance and Treasurer | $396,000 | $408,000 | 3.0% | ||
President | $482,000 | $494,000 | 2.5% | ||
Chief Operating Officer and EVP of Client Services | $482,000 | $494,000 | 2.5% | ||
EVP of Sales & Marketing | $460,000 | $472,000 | 2.6% | ||
19
The average salary increase for the NEOs in 2015 was 2.1%. The increases in base salary were based on the annual performance reviews, the findings of the Study and other factors deemed relevant by the Compensation Committee, such as Company performance and general economic conditions.
IAIP Target Bonus Percentage
The Compensation Committee approved the target bonus percentage for each executive officer (other than the CEO) based on the CEO’s recommendations. His recommendations took into account the executive officer’s level of responsibility, market conditions and internal equity considerations. The Compensation Committee also evaluated the foregoing factors in determining the CEO’s target bonus percentage. Because executive officers are in a position to directly influence the overall performance of the Company, and in alignment with our pay-for-performance philosophy, we believe that a significant portion of their total cash compensation should be at risk. The CEO, the individual with the greatest overall responsibility for Company performance, was granted a larger incentive opportunity in comparison to his base salary in order to weight his overall pay mix more heavily towards performance-based compensation than the overall pay mix of the other executive officers. The CFO, who had less responsibility for overall Company operating performance relative to other NEOs, was granted a smaller incentive opportunity in comparison to his base salary in order to weight his overall pay mix less heavily towards performance-based compensation than the overall pay mix of the other NEOs. For 2015, the Compensation Committee set the annual incentive targets as a percentage of each NEO’s base salary as follows:
Target Bonus Percentage under IAIP | ||
Chief Executive Officer and Chairman of the Board | 130% | |
Chief Financial Officer, SVP of Finance and Treasurer | 85% | |
President | 100% | |
Chief Operating Officer and EVP of Client Services | 100% | |
EVP of Sales & Marketing | 100% | |
Calculation and Weighting of Performance Components
For 2015, the targeted variable compensation under the IAIP for the CEO was based on corporate and individual performance components and for all other executive officers was based on corporate, departmental and individual performance components. As described in further detail below, corporate performance goals for 2015 were based on operating income (“OI”), year-over-year growth in the number of paid worksite employees (“PWEE Growth”) and operating expense management (“OEM”). For the CEO, variable compensation was heavily weighted toward corporate performance to align his IAIP bonus with Company-wide performance. For all executive officers, 20% was weighted toward individual performance to reflect their individual performance during the year, as determined through the annual performance appraisal process as discussed above. A departmental component was included in the IAIP bonus of each executive officer (other than the CEO) to encourage him to provide effective leadership to the departments under his supervision, as well as to align the interests of the executive with those of the employees that he supervises. Each performance component is determined separately and is not dependent on the other components, except that if an executive officer’s individual performance rating is below the threshold, then he receives no IAIP bonus, regardless of corporate and departmental performance. Each executive officer’s IAIP bonus is the sum of the result of each performance component.
Each performance component was weighted for each NEO as follows:
Corporate Performance | ||||||||||||||||||||||||||
OI | PWEE Growth | OEM | Departmental | Individual | ||||||||||||||||||||||
Chief Executive Officer and Chairman of the Board | 32 | % | 32 | % | 16 | % | 0 | % | 20 | % | ||||||||||||||||
Chief Financial Officer, SVP of Finance and Treasurer | 20 | % | 20 | % | 10 | % | 30 | % | 20 | % | ||||||||||||||||
President | 24 | % | 24 | % | 12 | % | 20 | % | 20 | % | ||||||||||||||||
Chief Operating Officer and EVP of Client Services | 24 | % | 24 | % | 12 | % | 20 | % | 20 | % | ||||||||||||||||
EVP of Sales & Marketing | 24 | % | 24 | % | 12 | % | 20 | % | 20 | % | ||||||||||||||||
20
2015 Corporate Performance Goals
OI Corporate Component
We have consistently included a measure of operating income as one of our corporate performance goals because we believe it is a key indicator of our overall productivity; effective management of pricing, direct costs and operating expenses; and ability to grow the business while favorably balancing profitability. We also believe that this metric reflects the combined contribution of all departments and encourages collaboration across the organization because each department within the Company can have a direct impact on corporate performance as measured according to this metric. The formula for measuring the OI corporate performance component of the IAIP bonus for each NEO was determined as follows:
Annual Salary ($) | X | Target Bonus (%) | X | Individual Weighting of OI Corporate Component (%) | X | OI Corporate Performance Modifier (0%-150%) | = | OI Corporate Component Payout ($) | |||||||||
The OI Corporate Performance Modifier was determined as follows:
Performance Level | 2015 OI | OI Corporate Performance Modifier | ||
Below Threshold | Less than $80.1 million | 0% | ||
Threshold | $80.1 million | 50% | ||
Target | $85.9 million | 100% | ||
Stretch | $91.0 million | 125% | ||
Maximum | $97.2 million | 150% | ||
If 2015 OI (excluding total incentive compensation expense, operating expenses related to acquisition activity in 2015 and extraordinary, unusual or infrequent items, if applicable) was below the threshold, then the OI Corporate Performance Modifier would be 0%, resulting in an OI corporate component payout of $0. The OI Corporate Performance Modifier would be interpolated if actual performance fell in between the threshold, target, stretch or maximum performance level.
The Company’s 2015 OI, plus (i) incentive compensation expense; and (ii) non-cash impairment charges of $10.5 million, was $99.7 million. Based on this performance, the Compensation Committee determined the OI Corporate Performance Modifier to be 150% for each NEO.
PWEE Growth Corporate Component
We also chose the year-over-year growth percentage in the number of paid worksite employees, as a 2015 corporate performance goal. We included this as a component in order to focus all of our employees on growing our business. Increasing the number of paid worksite employees is a key metric for measuring the success of our sales operations and client retention efforts and is a significant driver in our overall growth and performance. This performance goal also encouraged collaboration among all Company employees to increase the number of paid worksite employees.
The formula for measuring the PWEE Growth corporate performance component of the IAIP bonus for each NEO was determined as follows:
Annual Salary ($) | X | Target Bonus (%) | X | Individual Weighting of PWEE Growth Corporate Component (%) | X | PWEE Growth Corporate Performance Modifier (0%-150%) | = | PWEE Growth Corporate Component Payout ($) | |||||||||
The PWEE Growth corporate component of IAIP bonuses consisted of three different metrics with the final payout amount being based upon the metric that produced the greatest percentage payout of the target bonus.
21
PWEE Growth Metric 1 | ||||||||||
Performance Level | Q1 Year-over-Year Growth Percentage | Q2 Year-over-Year Growth Percentage | Q3 Year-over-Year Growth Percentage | Q4 Year-over-Year Growth Percentage | PWEE Growth Corporate Performance Modifier | |||||
Threshold | 8.7% | 9.3% | 9.5% | 9.5% | 50% | |||||
Target | 9.7% | 10.3% | 10.6% | 10.6% | 100% | |||||
Stretch | 10.7% | 11.3% | 11.7% | 11.7% | 125% | |||||
Maximum | 11.6% | 12.4% | 12.7% | 12.7% | 150% | |||||
The calculation of PWEE Growth for purposes of Metric 1 was determined each calendar year quarter, by taking the three (3) month average of the number of paid worksite employees for each calendar year quarter, and calculating the year-over-year growth in the number of paid worksite employees, expressed as a percentage. Each calendar year quarter for 2015 had a 25% weighting towards the Metric 1 percentage payout of target bonus.
PWEE Growth Metric 2 | ||||
Performance Level | Calendar Year Year-over-Year Growth Percentage | PWEE Growth Corporate Performance Modifier | ||
Threshold | 9.0% | 50% | ||
Target | 10.0% | 100% | ||
Stretch | 12.0% | 125% | ||
Maximum | 14.0% | 150% | ||
The calculation of PWEE Growth for purposes of Metric 2 was determined by calculating the year-over-year growth in the number of paid worksite employees for calendar year 2015, expressed as a percentage.
PWEE Growth Metric 3 | ||||
Performance Level | January 31, 2016 Year-over-Year Growth Percentage | PWEE Growth Corporate Performance Modifier | ||
Threshold | 9.0% | 50% | ||
Target | 10.0% | 100% | ||
Stretch | 12.0% | 125% | ||
Maximum | 14.0% | 150% | ||
The calculation of PWEE Growth for purposes of Metric 3 was determined by calculating the year-over-year growth in the number of paid worksite employees in January 2016, expressed as a percentage. For PWEE Growth Metric 3, we include the number of paid worksite employees for January 2016 in the performance period to reflect the results of our annual Fall Sales Campaign and significant year-end client renewal period.
If the number of worksite employees calculated as described above was below the threshold for all three metrics, then the PWEE Growth Corporate Performance Modifier would be 0%, resulting in a PWEE Growth corporate component payout of $0. The PWEE Growth Corporate Performance Modifier would be interpolated if actual performance for one of the metrics fell in between the threshold, target, stretch or maximum performance level.
During the performance period, the year-over-year growth percentage in the number of worksite employees was highest for PWEE Growth Metric 3 and was 14%. Based on this performance, the Compensation Committee determined the PWEE Growth Corporate Performance Modifier to be 150% for each NEO.
22
OEM Corporate Component
We also included OEM as a 2015 corporate performance goal. While OEM is a factor in the calculation of operating income (OI Corporate Component), we believed that a heightened focus on financial stewardship throughout the entire Company was warranted, and that successful achievement of this goal would require the combined focus and effort of employees across all departments and help create value for our stockholders.
The formula for measuring the OEM corporate performance component of the IAIP bonus for each NEO was determined as follows:
Annual Salary ($) | X | Target Bonus (%) | X | Individual Weighting of OEM Corporate Component (%) | X | OEM Corporate Performance Modifier (0%-150%) | = | OEM Corporate Component Payout ($) | |||||||||
The OEM Corporate Performance Modifier was determined as follows:
Performance Level | Operating Expenses | OEM Corporate Performance Modifier | ||
Above Threshold | In excess of $353.6 million | 0% | ||
Threshold | $353.6 million | 50% | ||
Target | $352.6 million | 100% | ||
Stretch | $351.6 million | 125% | ||
Maximum | $351.1 million | 150% | ||
If 2015 operating expenses (excluding total incentive compensation expense, operating expenses related to acquisition activity in 2015, and extraordinary, unusual or infrequent items, if applicable, including non-cash impairment charges, stock-based compensation expense, professional advisory fees for stockholder matters, litigation settlements and the associated legal fees, and changes in statutory tax rates and assessments) were above the threshold, the OEM Corporate Performance Modifier would be 0%, resulting in an OEM Corporate Component payout of $0. The OEM Corporate Performance Modifier would be interpolated if actual performance fell in between the threshold, target, stretch or maximum performance levels.
The Company’s 2015 operating expenses, excluding (i) incentive compensation expense; (ii) non-cash impairment charges of $10.5 million; and (iii) stockholder advisory expenses of $1.5 million, were $338.2 million. Because operating expenses were less than the maximum performance threshold of $351.1 million, the Compensation Committee approved an OEM Corporate Performance Modifier of 150% for each NEO.
Departmental Component
The formula for measuring the departmental performance component of the IAIP bonus for each executive officer (other than the CEO who has no departmental component included in his IAIP bonus) was as follows:
Annual Salary ($) | X | Target Bonus (%) | X | Individual Weighting of Departmental Component (%) | X | Departmental Performance Modifier (0%-100%) | = | Departmental Component Payout ($) | |||||||||
The goals were developed by each department and were designed to encourage employees to work together to continue making business improvements and to increase efficiency, productivity and collaboration across the organization. All departmental goals were approved by the CEO. As part of our continued focus on managing operating expenses, we did not include a stretch goal or maximum performance level for 2015; therefore, the target level also constituted the maximum level achievable for IAIP bonus purposes. The Departmental Performance Modifier for all executive officers can range from 0% to 100% based on the achievement of departmental goals. If departmental performance was below the threshold, the Departmental Performance Modifier would be 0%, resulting in a departmental component payout of $0. The nature of the departmental goals and objectives for each NEO was as follows:
23
Nature of Goals and Objectives | |||
Chief Financial Officer, SVP of Finance and Treasurer | Effective management of operating expenses; implementation of Company real estate strategy including effective and efficient management of Company occupancy; timely due diligence and integration of acquisitions; successful completion of internal audit projects; quality of internal controls; and successful credit management efforts. | ||
President | Effective client pricing and renewal activities; effective operating expense management; successful negotiation of certain insurance policies and third party contracts; development and implementation of health care reform initiatives; achievement of strategic business unit financial metrics; effective process and technology enhancements; and successful implementation of certain pricing initiatives. | ||
Chief Operating Officer and EVP of Client Services | Effective client satisfaction and retention; achievement of strategic business unit financial metrics; development of Company training and leadership programs; effective operating expense management; successful implementation of information technology initiatives; and development, implementation and rollout of certain data management and strategic business unit initiatives. | ||
EVP of Sales & Marketing | Effective marketing initiatives; successful new sales results; effective operating expense management; expansion of sales force; successful implementation of training and sales programs; and effective Company community involvement. | ||
In light of the CEO’s assessment of the other NEOs’ performance against the achievement of their departmental goals, the average Departmental Performance Modifier for the other NEOs in 2015 was 95.5%.
Individual Component
The formula for measuring the individual performance component of the IAIP bonus for each executive officer was as follows:
Annual Salary ($) | X | Target Bonus (%) | X | Weighting of Individual Component (%) | X | Individual Performance Modifier (0%-150%) | = | Individual Component Payout ($) | |||||||||
The Individual Performance Modifier for all executive officers can range from 0% to 150% based on the executive officer’s individual performance rating resulting from the annual performance appraisal process, as described under “- Base Salary.” Based on the NEOs’ individual performance ratings, the average Individual Performance Modifier for the NEOs was 136%.
The Compensation Committee reserves the right to pay discretionary bonuses to executive officers outside of the IAIP. While the Compensation Committee may exercise such discretion in appropriate circumstances, no discretionary bonuses have been awarded to NEOs in recent years.
2015 Equity Grants
The award size and recipients of awards were determined by the degree to which a particular position in the Company has the ability to influence stockholder value, as well as competitive information provided in benchmarking studies. In February 2015, the CEO presented to the Compensation Committee his recommendations for awards of restricted stock for the other executive officers. His recommendations as to the amount of awards to be granted were based on a number of factors, including, the importance of each executive officer’s role in the Company’s future business operations, equity pay practices of competitor companies, annual expense to the Company of equity awards and the Company’s own past practices in granting equity awards. The Compensation Committee then determined and approved the awards for the executive officers, including the CEO, based upon the above noted factors. For 2015, NEOs were granted the following restricted stock awards:
24
Name | Shares of Restricted Stock | Grant Date Value of Restricted Stock* | |
Paul J. Sarvadi | 20,400 | $1,051,416 | |
Douglas S. Sharp | 8,000 | $412,320 | |
Richard G. Rawson | 14,000 | $721,560 | |
A. Steve Arizpe | 14,000 | $721,560 | |
Jay E. Mincks | 14,000 | $721,560 | |
______________________________
* The fair market value of one share of the Common Stock on the grant date was $51.54.
The restricted stock awards are all subject to a three-year ratable annual vesting schedule and all NEO grants include a “double trigger” requirement in the case of a “change in control” of the Company.
In March 2015, the Compensation Committee decided to grant awards under the LTIP (“2015 LTIP Awards”) to the NEOs and certain other officers. In granting the 2015 LTIP Awards, the Compensation Committee determined that long-term incentive compensation awards would be allocated between performance awards and time-vested restricted stock on approximately a 60% and 40% basis for the CEO, a 35% and 65% basis for the CFO, and a 45% and 55% basis for the remaining NEOs. The performance period for the 2015 LTIP Awards includes calendar years 2015-2017, with each year being equally weighted for one-third of the target opportunity. The 2015 LTIP Awards are payable in shares of Common Stock and include dividend equivalents, payable in additional shares of Common Stock, with respect to the number of phantom shares actually earned pursuant to the 2015 LTIP Awards if and to the extent dividends are paid on Common Stock during the performance period.
The aggregate number of 2015 LTIP Awards granted by the Compensation Committee to each NEO if all of the annual target performance metrics are achieved was as follows:
Aggregate Number of Performance Shares (at Target) | Grant Date Value of Performance Shares1 (at Target) | ||||
Chief Executive Officer and Chairman of the Board | 30,350 | $1,602,480 | |||
Chief Financial Officer, SVP of Finance and Treasurer | 5,300 | $279,840 | |||
President | 11,350 | $599,280 | |||
Chief Operating Officer and EVP of Client Services | 11,350 | $599,280 | |||
EVP of Sales & Marketing | 11,350 | $599,280 | |||
______________________________
1 The 2015 LTIP Awards do not have an exercise price. The fair market value of one share of the Common Stock on the grant date was $52.80. The grant date fair value of the 2015 LTIP Awards assuming achievement of the maximum level of performance are: Mr. Sarvadi - $3,204,960; Mr . Sharp - $559,680; Mr. Rawson - $1,198,560; Mr. Arizpe - $1,198,560; and Mr. Mincks - $1,198,560.
The performance metric for the 2015 LTIP Awards is tied to achieving increased levels of EBITDA, taking into account certain pre-defined adjustments during the performance period, with vesting occurring at the end of the three-year performance period. The Company’s EBITDA performance metric will be measured annually against performance levels established at the time of grant. Recipients can earn 50% of the target number of phantom shares if the threshold performance level is achieved and can earn up to 200% of the target number of phantom shares if the maximum performance level is achieved. The first year of the 2015 LTIP Awards is subject to achievement of the EBITDA performance metrics and corresponding performance level payout percentages as follows:
Performance Level | 2015 EBITDA Performance Objective (in millions) | Payout Percentage | ||
Below Threshold | Less Than $101 | 0% | ||
Threshold | $101 | 50% | ||
Target | $103 | 100% | ||
Maximum | $118 | 200% | ||
If the EBITDA performance metric for a performance period falls below the threshold level, no performance shares will be credited for the performance period. If actual performance results fall between the threshold, target and maximum performance levels, the number of performance shares earned will be determined by interpolation between the applicable performance levels. For purposes
25
of the 2015 LTIP performance metric, EBITDA was adjusted for non-cash impairment charges, stock-based compensation expense, professional advisory fees for stockholder matters, litigation settlements and the associated legal fees, and changes in statutory tax rates and assessments. EBITDA was also adjusted to exclude the impact of any divestitures, acquisitions or change in accounting pronouncement that occurs during the performance period.
For purposes of the 2015 LTIP Awards, the Compensation Committee certified adjusted EBITDA of $110.0 million for the 2015 performance period. After interpolation, the Compensation Committee determined the LTIP performance modifier to be 145% for the first one-third tranche of the 2015 LTIP Award. To receive the awards, the recipients must remain continuously employed throughout the entire three-year performance period and as of the date the Compensation Committee certifies the final results, with limited exceptions for death, disability or change in control.
2016 Equity Grants
In March 2016, the Compensation Committee granted awards under the LTIP (“2016 LTIP Awards”) to the NEOs and certain other officers. In granting the 2016 LTIP Awards, the Compensation Committee further decreased the long-term incentive weighting of the time vested restricted stock and increased the weighting assigned to performance awards for the recipients of those awards. For 2016, the long-term incentive compensation awards were allocated between performance awards and time-vested restricted stock on approximately a 70% and 30% basis for the CEO, a 50% and 50% basis for the CFO, and a 60% and 40% basis for the remaining NEOs. In establishing the performance metrics for the 2016 LTIP Awards, the Compensation Committee retained a metric tied to achieving increased levels of EBITDA with certain pre-defined adjustments, but also added a relative total shareholder return metric (“RTSR”) to further align the long-term financial interests of the executive officers and the Company’s shareholders. RTSR will be measured over the entire 2016-2018 performance period against the performance of 21 peer companies that the Compensation Committee designated as the Company’s 2016 compensation peer group. The 2016 LTIP Awards are weighted at 60% for the EBITDA performance metric and 40% for the RTSR performance metric. The performance period for the EBITDA portion of the 2016 LTIP Awards includes calendar years 2016-2018, with each year being equally weighted for one-third of the target opportunity. The 2016 LTIP Awards are payable in shares of Common Stock and include dividend equivalents, payable in additional shares of Common Stock, with respect to the number of phantom shares actually earned pursuant to the 2016 LTIP Awards if and to the extent dividends are paid on Common Stock during the performance period.
The aggregate number of 2016 LTIP Awards granted by the Compensation Committee to each NEO if all of the target performance metrics are achieved was as follows:
Aggregate Number of Performance Shares 1 (at Target) | |||||
Chief Executive Officer and Chairman of the Board | 36,345 | ||||
Chief Financial Officer, SVP of Finance and Treasurer | 6,580 | ||||
President | 11,880 | ||||
Chief Operating Officer and EVP of Client Services | 11,880 | ||||
EVP of Sales & Marketing | 11,880 | ||||
______________________________
1 The 2016 LTIP Awards do not have an exercise price.
Recipients can earn 50% of the target number of phantom shares if the threshold performance level is achieved and can earn up to 200% of the target number of phantom shares if the maximum performance level is achieved. If the performance metric for a performance period falls below the threshold level, no performance shares will be credited for the performance period. If actual performance results fall between the threshold, target and maximum performance levels, the number of performance shares earned will be determined by interpolation between the applicable performance levels.
26
Other Policies
Stock Ownership Guidelines
To further align the interests of the CEO and non-employee directors with those of our stockholders, the Board has adopted stock ownership guidelines for the Company. The stock ownership guidelines provide that the CEO is required to own three times his annual base salary in Common Stock and all non-employee directors are required to own three times their annual cash retainer in Common Stock. Stock ownership includes direct stock ownership but does not include unvested stock awards or unexercised stock options. The Company annually monitors and calculates the stock ownership level of each individual, and each individual has five years to meet the applicable ownership requirements. The CEO is in compliance and each non-employee director is in compliance or is expected to be in compliance within the applicable time period.
Employment Agreements, Post-Employment and Change in Control Compensation
Our executive officers are employed at will and none have an employment agreement. In 2015, no NEOs departed from the Company. We do not provide the executive officers with any kind of contractual severance. Equity awards granted to executive officers do not automatically accelerate upon a change in control. Rather such awards contain a “double trigger” requiring a qualifying termination within a prescribed number of months following the change in control in order to accelerate vesting. All outstanding equity awards held by NEOs are subject to the double trigger requirement.
Incentive Compensation Recoupment Policy (“Clawback Policy”)
In February 2014, the Board adopted a recoupment policy for incentive compensation paid to executive officers and other employees. The Clawback Policy authorizes the Company to recover excess incentive compensation paid to an executive officer who engaged in, or was aware of and failed to report, fraud or misconduct which results in a restatement of the Company’s financial statements. Incentive compensation paid under the IAIP and LTIP is subject to the Clawback Policy.
Risk Assessment
The Company conducted an assessment of our compensation programs and practices for its employees and determined that there are no risks arising from such compensation programs and practices that are reasonably likely to have a material adverse effect on the Company.
Deductibility of Compensation
Section 162(m) of the Internal Revenue Code imposes a $1 million limit on the amount that a public company may deduct for compensation paid to the Company’s principal executive officer or any of the Company’s three other most highly compensated executive officers employed as of the end of the year (other than the principal executive officer or the principal financial officer). This limitation does not apply to compensation that is paid only if the executive officer’s performance meets pre-established objective goals based on performance criteria approved by stockholders. We strive to take action, where possible and considered appropriate, to preserve the deductibility of compensation paid to the Company’s executive officers. We have also awarded compensation that might not be fully tax deductible when such grants were nonetheless in the best interest of the Company and its stockholders. Subject to the requirements of Section 162(m), the Company generally will be entitled to take tax deductions relating to compensation that is performance-based, which may include cash incentives, stock options and other performance-based awards.
Compensation Committee Report
We have reviewed and discussed the Compensation Discussion and Analysis contained in this Amendment with management. Based on such review, we recommended to the Board that the Compensation Discussion and Analysis be included in this Amendment for filing with the SEC.
The foregoing report is provided by the following directors, who are members of the Compensation Committee:
COMPENSATION COMMITTEE
Eli Jones, Chairperson
Michael W. Brown
Peter Feld
27
Compensation Committee Interlocks and Insider Participation
During 2015, Dr. Jones and Messrs. Brown and Feld served on the Compensation Committee. None of the members of the Compensation Committee is currently or has been at any time one of our officers or employees. None of our executive officers currently serves, or has served during the last year, as a member of the board of directors or compensation committee of any entity that has one or more executive officers serving as a member of the Board or the Compensation Committee.
Summary Compensation Table
The table below summarizes the total compensation paid or earned by the Company’s CEO, chief financial officer and each of the three other most highly compensated executive officers of the Company for services rendered in all capacities to the Company during 2015, 2014 and 2013. The Company has not entered into any employment agreements with any of the NEOs.
The compensation plans under which the grants in the following tables were made are generally described in the Compensation Discussion and Analysis section, and include the IAIP, a non-equity incentive plan, the 2001 Incentive Plan and the 2012 Incentive Plan, which provide for, among other things, restricted stock grants and LTIP performance awards.
Name and Principal Position | Year | Salary ($) | Stock Awards ($) 1 | Non-Equity Incentive Plan Compensation ($) 2 | All Other Compensation ($) 3 | Total ($) | |||||||||||
Paul J. Sarvadi, | 2015 | 850,000 | 2,653,896 | 1,657,500 | 240,522 | 5,401,918 | |||||||||||
CEO and Chairman of the Board | 2014 | 850,000 | 1,096,000 | 988,637 | 497,445 | 3,432,082 | |||||||||||
2013 | 816,300 | 1,167,600 | 283,815 | 570,406 | 2,838,121 | ||||||||||||
Douglas S. Sharp, | 2015 | 408,000 | 692,160 | 455,705 | 78,204 | 1,634,069 | |||||||||||
CFO, SVP of Finance and Treasurer | 2014 | 396,000 | 383,600 | 331,572 | 124,805 | 1,235,977 | |||||||||||
2013 | 378,000 | 408,660 | 181,352 | 79,018 | 1,047,030 | ||||||||||||
Richard G. Rawson, | 2015 | 494,000 | 1,320,840 | 678,188 | 109,064 | 2,602,092 | |||||||||||
President | 2014 | 482,000 | 657,600 | 464,087 | 237,696 | 1,841,383 | |||||||||||
2013 | 464,000 | 700,560 | 220,948 | 159,464 | 1,544,972 | ||||||||||||
A. Steve Arizpe, | 2015 | 494,000 | 1,320,840 | 672,282 | 113,514 | 2,600,636 | |||||||||||
COO and EVP of Client Services | 2014 | 482,000 | 657,600 | 467,921 | 224,498 | 1,832,019 | |||||||||||
2013 | 464,000 | 700,560 | 208,059 | 126,649 | 1,499,268 | ||||||||||||
Jay E. Mincks, | 2015 | 472,000 | 1,320,840 | 615,902 | 81,965 | 2,490,707 | |||||||||||
EVP of Sales & Marketing | 2014 | 460,000 | 657,600 | 437,296 | 211,367 | 1,766,263 | |||||||||||
2013 | 442,000 | 700,560 | 173,570 | 107,908 | 1,424,038 | ||||||||||||
______________________________
1 | The amounts in this column represent the aggregate grant date fair value of awards granted in the year indicated and includes time-vested restricted stock and the 2015 LTIP Awards. The grant value of the 2015 LTIP Awards is shown at target. Actual awards may range from 0% to 200% of the target number of phantom shares if the maximum performance level is achieved. The grant date fair value of the 2015 LTIP Awards assuming achievement of the maximum level of performance are: Mr. Sarvadi - $3,204,960; Mr. Sharp - $559,680; Mr. Rawson - $1,198,560; Mr. Arizpe - $1,198,560; and Mr. Mincks - $1,198,560. For additional information, refer to Note 10, “Incentive Plans,” in the Notes to Consolidated Financial Statements included in the Original Filing. See the Grants of Plan-Based Awards Table for information on awards made in 2015. These amounts do not correspond to the actual value that will be realized by the NEO. |
2 | Represents variable cash compensation earned and awarded by the Compensation Committee under the IAIP. A description of the IAIP is included in “Elements of Compensation - Variable Cash Compensation” in the Compensation Discussion and Analysis, and the determination of performance-based bonuses for fiscal year 2015 is contained in “2015 Executive Compensation Decisions - IAIP Target Bonus Percentage” of the Compensation Discussion and Analysis. |
3 | All other compensation in 2015 includes the following: Company-provided automobiles; country club memberships; 401(k) matching contributions; premiums for executive disability insurance; costs associated with the Chairman’s Trip and other travel and associated federal income taxes. The federal income taxes associated with the Chairman’s Trip and other travel paid by the Company on behalf of the executives during 2015 totaled $10,681 each. The 401(k) matching contributions made by |
28
the Company during 2015 for the NEOs totaled $7,950 each. The incremental cost of Messrs. Arizpe, Mincks and Sharp’s use of a Company-leased vehicle was $38,085, $30,431 and $30,702, respectively. The incremental cost of Messrs. Sarvadi and Rawson’s country club memberships was $25,230 and $26,500, respectively. The Company owned aircraft that were used by its executives for business and, on occasion, personal travel. In addition, Mr. Sarvadi used the Company’s aircraft to commute to his residences and certain other business related entertainment travel for which he was not required to reimburse the Company. The total incremental cost of such travel for Mr. Sarvadi, including lost income tax deductions, was $156,947. In the instances where the aircraft are used for personal travel, the executive was required to reimburse the Company for the associated incremental costs. The incremental cost for personal use of Company aircraft is calculated at an hourly rate that takes into account variable costs incurred as a result of the personal flight activity, including fuel, communications and travel expenses for the flight crew. It excludes non-variable costs, such as regularly scheduled inspections and maintenance that would have been incurred regardless of whether there was any personal use of the aircraft. During 2015, Messrs. Sarvadi and Rawson reimbursed the Company $45,882 and $33,230, respectively, for personal travel costs.
Grants of Plan-Based Awards Table
The following table provides information about equity and non-equity awards granted to the NEOs in 2015:
Name | Grant Date | Estimated Possible Payouts Under Non-Equity Incentive Plan Awards 1 | Estimated Possible Payouts Under Equity Incentive Plan Awards 2 | All Other Stock Awards: Number of Shares of Stock or Units (#) 3 | Grant Date Fair Value of Stock and Option Awards ($) 4 | |||||||||||||||||||||
Threshold ($) | Target ($) | Maximum ($) | Threshold (#) | Target (#) | Maximum (#) | |||||||||||||||||||||
Paul J. Sarvadi | N/A | 552,500 | 1,105,000 | 1,657,500 | — | — | — | — | — | |||||||||||||||||
2/19/2015 | — | — | — | — | — | — | 20,400 | 1,051,416 | ||||||||||||||||||
3/30/2015 | — | — | — | 15,175 | 30,350 | 60,700 | — | 1,602,480 | ||||||||||||||||||
Douglas S. Sharp | N/A | 173,400 | 346,800 | 468,180 | — | — | — | — | — | |||||||||||||||||
2/19/2015 | — | — | — | — | — | — | 8,000 | 412,320 | ||||||||||||||||||
3/30/2015 | — | — | — | 2,650 | 5,300 | 10,600 | — | 279,840 | ||||||||||||||||||
Richard G. Rawson | N/A | 247,000 | 494,000 | 691,600 | — | — | — | — | — | |||||||||||||||||
2/19/2015 | — | — | — | — | — | — | 14,000 | 721,560 | ||||||||||||||||||
3/30/2015 | — | — | — | 5,675 | 11,350 | 22,700 | — | 599,280 | ||||||||||||||||||
A. Steve Arizpe | N/A | 247,000 | 494,000 | 691,600 | — | — | — | — | — | |||||||||||||||||
2/19/2015 | — | — | — | — | — | — | 14,000 | 721,560 | ||||||||||||||||||
3/30/2015 | 5,675 | 11,350 | 22,700 | — | 599,280 | |||||||||||||||||||||
Jay E. Mincks | N/A | 236,000 | 472,000 | 660,800 | — | — | — | — | — | |||||||||||||||||
2/19/2015 | — | — | — | — | — | — | 14,000 | 721,560 | ||||||||||||||||||
3/30/2015 | — | — | — | 5,675 | 11,350 | 22,700 | — | 599,280 | ||||||||||||||||||
__________________________________
1 | These amounts represent the threshold, target and maximum amounts payable to each executive under the IAIP for 2015. If the threshold is not achieved, the payout is zero. The amounts earned by our NEOs under the IAIP in 2015 are reflected in the Summary Compensation Table. |
2 | These amounts represent the threshold, target and maximum amount of shares payable to each executive under the LTIP. |
3 | These amounts represent the number of shares of restricted stock and phantom stock granted to each executive under the 2012 Incentive Plan during 2015. |
4 | These amounts represent the aggregrate grant date fair value of restricted stock and phantom stock granted to each executive during 2015. For restricted stock, fair value is calculated using the closing price of the Company’s Common Stock on the NYSE on the date of grant. The grant value of the 2015 LTIP Awards is shown at target. Actual awards may range from 0% to 200% of the target number of phantom shares if below threshold level is not achieved or the maximum performance level is achieved. The grant date fair value of the 2015 LTIP Awards assuming achievement of the maximum level of performance are: Mr. Sarvadi - $3,204,960; Mr. Sharp - $559,680; Mr. Rawson - $1,198,560; Mr. Arizpe - $1,198,560; and Mr. Mincks - $1,198,560. For the relevant assumptions used to determine the valuation of our stock awards, refer to Note 10, “Incentive Plans,” in the Notes to Consolidated Financial Statements included in our Original Filing. The terms of the restricted stock awards provide for three-year vesting and the payment of dividends on all unvested shares. The 2015 LTIP Awards are payable in shares of Common Stock and include dividend equivalents, payable in additional shares of Common Stock, with respect to the number of phantom shares actually earned pursuant to the 2015 LTIP Awards if and to the extent dividends are paid on Common Stock during the performance period. |
29
NEO’S Outstanding Equity Awards Table At 2015 Fiscal Year End
Option Awards | Stock Awards | |||||||||||||
Name | Number of Securities Underlying Unexercised Options (#) Exercisable | Option Exercise Price ($) | Option Expiration Date | Number of Shares or Units of Stock That Have Not Vested (#) | Market Value of Shares or Units of Stock That Have Not Vested ($) 1 | Equity Incentive Plan Awards: Number of Unearned Shares, Units or Other Rights That Have Not Vested (#) 5 | Equity Incentive Plan Awards: Market or Payout Value of Unearned Shares, Unites or Other Rights That Have Not Vested ($) 1 | |||||||
Paul J. Sarvadi | — | — | — | 60,401 | 2 | 2,908,308 | 35,413 | 1,705,136 | ||||||
Douglas S. Sharp | — | — | — | 22,001 | 3 | 1,059,348 | 6,185 | 297,808 | ||||||
Richard G. Rawson | — | — | — | 38,000 | 4 | 1,829,700 | 13,246 | 637,795 | ||||||
A. Steve Arizpe | — | — | — | 38,000 | 4 | 1,829,700 | 13,246 | 637,795 | ||||||
Jay E. Mincks | — | — | — | 38,000 | 4 | 1,829,700 | 13,246 | 637,795 | ||||||
____________________________________________
1 | Based on the closing price of $48.15 of the Company’s Common Stock on the NYSE on December 31, 2015. |
2 | Includes time-vested restricted stock. Stock awards are scheduled to vest as follows provided the officer continues to be employed by Insperity on the applicable vesting date: 13,333 on February 18, 2016; 20,134 on February 19, 2016; 13,334 on February 18, 2017; 6,800 on February 19, 2017 and 6,800 on February 19, 2018. |
3 | Includes time-vested restricted stock. Stock awards are scheduled to vest as follows provided the officer continues to be employed by Insperity on the applicable vesting date: 4,667 on February 18, 2016; 4,667 on February 19, 2016; 7,333 on February 18, 2017; 2,667 on February 19, 2017 and 2,667 on February 19, 2018. |
4 | Includes time-vested restricted stock. Stock awards are scheduled to vest as follows provided the officer continues to be employed by Insperity on the applicable vesting date: 8,000 on February 18, 2016; 12,666 on February 19, 2016; 8,000 on February 18, 2017; 4,667 on February 19, 2017 and 4,667 on February 19, 2018. |
5 | Includes LTIP awards scheduled to vest (assuming target results for performance periods not yet complete and actual results for performance periods completed) and includes an estimate of dividend equivalents for the dividends declared since the date of grant. These awards will vest provided the officer continues to be employed by Insperity on the applicable vesting date. |
30
NEO Option Exercises and Stock Vested Table for Fiscal Year 2015
Option Awards | Stock Awards | |||||||||||
Name | Number of Shares Acquired on Exercise (#) | Value Realized on Exercise ($) | Number of Shares Acquired on Vesting (#) | Value Realized on Vesting ($) 1 | ||||||||
Paul J. Sarvadi | — | — | 38,400 | 1,942,225 | ||||||||
Douglas S. Sharp | — | — | 13,333 | 674,283 | ||||||||
Richard G. Rawson | — | — | 23,500 | 1,188,960 | ||||||||
A. Steve Arizpe | — | — | 23,500 | 1,188,960 | ||||||||
Jay E. Mincks | — | — | 23,500 | 1,188,960 | ||||||||
______________________________________
1 | Represents the value of the shares on the vesting date based on the last reported closing price of the Company’s Common Stock on the NYSE immediately preceding the vesting date. |
31
Director Compensation
The Company uses a combination of cash and stock-based compensation to attract and retain qualified candidates to serve on the Board. Non-employee directors of the Company were compensated for 2015 as shown in the table below and are also reimbursed for reasonable expenses incurred in serving as a director. All compensation, except for reimbursement of actual expenses, can be taken in cash or Common Stock, at the director’s option. Directors who are employees of the Company receive no additional compensation for serving on the Board.
Board | Compensation Committee | Finance, Risk Management and Audit Committee | Nominating and Corporate Governance Committee | Lead Independent Director | |||||||||
Annual Retainers | $61,000 | $10,000 | $15,000 | None | $ | 9,000 | 1 | ||||||
Annual Committee Chair Fees | N/A | $12,000 | $21,000 | $10,000 | 1 | None | |||||||
_________________________ | |
1 | Effective October 1, 2015, the Board established a $9,000 annual retainer for the Lead Independent Director and reduced the annual fee for the chair of the Nominating and Corporate Governance Committee from $15,000 to $10,000. Previously, the Lead Independent Director also served as chair of the Nominating and Corporate Governance Committee. |
Each person who is initially appointed or elected as a director of the Company receives an initial director award comprised of a grant of shares of restricted Common Stock on the date of election or appointment with an aggregate fair market value, determined based on the closing price of the Common Stock on the date prior to the date of grant, of $75,000, rounded up to the next higher whole share amount in the case of a fractional share amount, and such restricted Common Stock vests as to one-third of the shares on each anniversary of its grant date. If a director terminates his or her service as a member of the Board, his or her unvested portion of such restricted stock award, if any, shall terminate immediately on such termination date, unless such termination of service is due to death or disability, in which event the unvested portion of such restricted stock award shall become 100% vested on such termination date. Pursuant to the Agreement, each of Mr. Feld, Ms. McKenna-Doyle and Mr. Sorensen received an initial director award effective as of the date of the 2015 Annual Meeting of Stockholders.
In addition, on the date of each annual meeting of stockholders, each non-employee director receives an annual director award comprised of either a grant of unrestricted shares of Common Stock with an aggregate fair market value determined based on the closing price of the Common Stock on the date prior to the date of grant, of $90,000, or an immediately vested and exercisable option to purchase a number of shares of Common Stock that had an aggregate value, determined on the date prior to the date of grant, of $90,000, calculated using the valuation methodology most recently utilized by the Company for purposes of financial statement reporting. In 2015, all non-employee directors elected to receive unrestricted shares of Common Stock. The awards were rounded up to the next higher whole share amount in the case of a fractional share amount. Pursuant to the Agreement, neither Mr. Feld, Ms. McKenna-Doyle nor Mr. Sorensen received an annual director award on the date of the 2015 Annual Meeting of Stockholders.
After consulting with PM&P and after considering market trends, the Compensation Committee recommended, and in February 2015, the Board approved, an amendment to the Company’s Directors Compensation Plan that eliminated meeting fees and stock options as an optional form of payment for the annual director award, and that adjusted the annual Board and committee retainers accordingly based on the average of the meeting fees paid over the prior three years. These adjustments were intended to be cost neutral. For further information, please see the Company’s Current Report on Form 8-K filed with the SEC on February 25, 2015. Pursuant to the Agreement and the amended directors compensation plan, each of Mr. Feld, Ms. McKenna-Doyle and Mr. Sorensen received prorated retainer fees for 2015 from the date of their respective appointment.
32
Director Compensation Table
The table below summarizes the compensation paid by the Company to non-employee directors during the fiscal year ended December 31, 2015.
Fees Earned or Paid in Cash | Stock Awards | Option Awards | All Other Compensation | Total | |||
Name | ($) | ($) 2 | ($) | ($) 3 | ($) | ||
Michael W. Brown | |||||||
66,500 | 89,578 | — | 1,146 | 157,223 | |||
Peter Feld | |||||||
37,640 | 74,665 | — | 955 | 4 | 113,260 | ||
Jack M. Fields, Jr.1 | |||||||
44,849 | — | — | — | 44,849 | |||
Eli Jones | |||||||
78,500 | 89,578 | — | 1,146 | 169,223 | |||
Carol Kaufman | |||||||
85,750 | 89,578 | — | 2,103 | 4 | 177,430 | ||
Paul S. Lattanzio1 | |||||||
47,574 | — | — | — | 47,574 | |||
Michelle McKenna-Doyle | |||||||
32,013 | 74,665 | — | 955 | 4 | 107,634 | ||
Norman Sorensen | |||||||
40,290 | 74,665 | — | 955 | 4 | 115,910 | ||
Austin P. Young | |||||||
90,250 | 89,578 | — | 1,146 | 180,973 | |||
_________________________
1 | Mr. Fields and Mr. Lattanzio resigned from the Board on June 10, 2015. |
2 | Represents the dollar amount recognized for financial statement reporting purposes with respect to 2015 for the fair value of stock awards made to directors during 2015, based on the closing price of the Company’s Common Stock on the date of grant. In the case of annual director equity awards that do not contain vesting or other restrictions, Insperity recognizes the entire fair value for financial statement reporting purposes in the year that the grant is made. In the case of initial director equity awards that contain vesting restrictions, Insperity recognizes the fair value for financial statement reporting purposes over the vesting period. |
3 | All Other Compensation represents dividends paid on stock awards granted in 2015. |
4 Also includes dividends paid on unvested restricted stock awards of: Mr. Feld - $955; Ms. Kaufman - $957; Ms. McKenna-Doyle - $955; and Mr. Sorensen - $955.
Potential Payments upon Termination or Change in Control
We have no employment agreements or severance policies in place for our executive officers. There are no unvested outstanding stock options and none have been granted to executive officers since 2004. All awards granted to named executive officers include a “double trigger” requirement in the case of a change in control of the Company as defined under the 2012 Incentive Plan. Effective with awards granted in 2016, the Company amended the terms of award agreements to provide that future awards granted to any recipient under the 2012 Incentive Plan will include a double trigger requirement in the case of a change in control of the Company as defined under the 2012 Incentive Plan. The directors first appointed to the Board pursuant to the Agreement are not considered members of the “Incumbent Board” for the purposes of determining whether a change in control has occurred with respect to outstanding awards granted prior to 2016 under the 2012 Incentive Plan. Under the terms of an amendment to the 2012 Incentive Plan that was adopted by the Company in March 2016, however, each of those directors first appointed pursuant to the Agreement are considered members of the Incumbent Board for all awards granted after that amendment, which includes all awards granted in 2016. The imposition of the double trigger means that awards subject to the double trigger requirement will no longer immediately vest following a change in control (please read “Item 11. Executive Compensation” for additional information). All outstanding awards to NEOs are subject to a double trigger and all awards under the LTIP are also subject to a double trigger requirement.
Our Incentive Plans provide for immediate vesting (at least in part) of restricted stock upon termination due to disability or death, provided the holder has been in continuous employment since the award date, or for awards granted prior to March 2016, upon a change in control, for employees who are not NEOs. Unvested shares of restricted stock are forfeited upon termination for any reason other than disability or death. The number of shares and market value of the restricted stock that would automatically vest for each NEO upon termination due to death or disability, or for a qualifying termination following a change in control, based on the closing price of
33
the Company’s Common Stock on December 31, 2015, is set forth in “Item 11. Executive Compensation - NEO’s Outstanding Equity Awards Table at 2015 Fiscal Year End”, under the captions “Number of Shares or Units of Stock That Have Not Vested” and “Market Value of Shares or Units of Stock That Have Not Vested.”
ITEM 12. SECURITY OWNERSHIP OF CERTAIN BENEFICIAL OWNERS AND MANAGEMENT AND RELATED STOCKHOLDER MATTERS.
Security Ownership
The table below sets forth, as of April 15, 2016, certain information with respect to the shares of Common Stock beneficially owned by: (i) each person known by the Company to beneficially own 5% or more of the Company’s Common Stock; (ii) each director of the Company; (iii) each of the executive officers of the Company identified in the Summary Compensation Table; and (iv) all directors and executive officers of the Company as a group.
Name of Beneficial Owner | Amount and Nature of Beneficial Ownership1 | Percent of Class | ||||||
Michael W. Brown | 36,846 | * | ||||||
Peter A. Feld | 3,338,886 | 2 | 15.61 | % | ||||
Eli Jones | 7,026 | * | ||||||
Carol R. Kaufman | 10,627 | * | ||||||
Michelle McKenna-Doyle | 1,447 | * | ||||||
Richard G. Rawson | 681,977 | 3 | 3.19 | % | ||||
Paul J. Sarvadi | 1,611,797 | 4 | 7.54 | % | ||||
Norman R. Sorensen | 2,646 | * | ||||||
Austin P. Young | 41,042 | * | ||||||
A. Steve Arizpe | 110,408 | 5 | * | |||||
Jay E. Mincks | 52,213 | * | ||||||
Douglas S. Sharp | 34,875 | * | ||||||
Starboard Value LP | 3,335,976 | 6 | 15.60 | % | ||||
BlackRock Fund Advisors | 2,008,678 | 7 | 9.39 | % | ||||
The Vanguard Group, Inc. | 1,564,844 | 8 | 7.32 | % | ||||
Executive Officers and Directors as a Group (13 Persons) | 5,976,649 | 27.95 | % | |||||
_________________________
* Represents less than 1%.
1 | Except as otherwise indicated, each of the stockholders has sole voting and investment power with respect to the securities shown to be owned by such stockholder. The address for each officer and director is in care of Insperity, Inc., 19001 Crescent Springs Drive, Kingwood, Texas 77339-3802. |
The number of shares of Common Stock beneficially owned by each person includes options exercisable on April 15, 2016, or within 60 days after April 15, 2016, and excludes options not exercisable within 60 days after April 15, 2016 (currently there are no unvested stock options). The number of shares of Common Stock beneficially owned by each person also includes unvested shares of restricted stock as of April 15, 2016 and excludes LTIP shares that are not available within 60 days after April 15, 2016. Each owner of restricted stock has the right to vote his or her shares but may not transfer them until they have vested.
34
Options | ||||||||||
Name of Beneficial Owner | Exercisable | Not Exercisable | Unvested Restricted Stock | |||||||
Michael W. Brown | 20,513 | — | — | |||||||
Peter A. Feld | — | — | 1,447 | |||||||
Eli Jones | — | — | — | |||||||
Carol R. Kaufman | — | — | 647 | |||||||
Michelle McKenna-Doyle | — | — | 1,447 | |||||||
Norman R. Sorensen | — | — | 1,447 | |||||||
Austin P. Young | 7,813 | — | — | |||||||
A. Steve Arizpe | — | — | 25,254 | |||||||
Jay E. Mincks | — | — | 25,254 | |||||||
Richard G. Rawson | — | — | 25,254 | |||||||
Paul J. Sarvadi | — | — | 42,509 | |||||||
Douglas S. Sharp | — | — | 16,581 | |||||||
2 | Based on a Schedule 13D/A filed with the SEC on March 15, 2016. Mr. Feld reported shared voting and dispositive power with respect to 3,335,976 shares and 2,910 shares held directly. See footnote 8 below for further information. |
3 | Includes 283,676 shares owned by the RDKB Rawson LP, 249,512 shares owned by the R&D Rawson LP, and 350 shares owned by Dawn M. Rawson (spouse). Mr. Rawson shares voting and investment power over all such shares with his wife, except for 350 shares owned by his wife. |
4 | Includes 917,396 shares owned by Our Ship Limited Partnership, Ltd., 453,069 shares owned by the Sarvadi Children’s Limited Partnership, 16,651 shares owned by Paul J. Sarvadi and Vicki D. Sarvadi (spouse), JT WROS and 19,644 shares owned by six education trusts established for the benefit of the children of Paul J. Sarvadi. Mr. Sarvadi shares voting and investment power over all such shares with his spouse. Also includes 220,000 shares pledged to banks as collateral for loans. The Board determined the amount of shares pledged by Mr. Sarvadi was insignificant under the Company’s pledging policy. |
5 | Includes 3,139 shares owned by A. Steve Arizpe and Charissa Arizpe (spouse). Mr. Arizpe shares voting and investment power over all such shares with his wife. |
6 | Based on a Schedule 13D/A filed with the SEC on March 15, 2016, pursuant to which (a) each of Starboard Value LP, Starboard Value GP LLC, Starboard Principal Co LP and Starboard Principal Co GP LLC reported sole voting and dispositive power with respect to 3,335,976 shares; (b) Starboard Value and Opportunity Master Fund LTD reported sole voting and dispositive power with respect to 1,986,958 shares; (c) Starboard Value and Opportunity S LLC reported sole voting and dispositive power with respect to 444,820 shares; (d) each of Starboard Value and Opportunity C LP, Starboard Value R LP and Starboard Value R GP LLC reported sole voting and dispositive power with respect to 241,324 shares; (e) each of Jeffrey C. Smith and Mark R. Mitchell reported shared voting and dispositive power with respect to 3,335,976 shares and (f) Peter A. Feld reported sole voting and dispositive power with respect to 1,120 shares and shared voting and dispositive power with respect to 3,335,976 shares. The address of the reporting persons is 777 Third Avenue, 18th Floor, New York, NY 10017. |
7 | Based on a Schedule 13G/A filed with the SEC on January 26, 2016. BlackRock, Inc. reported sole voting power with respect to 1,944,675 shares and sole dispositive power with respect to 2,008,678 shares. The address of BlackRock, Inc. is 40 East 52nd Street, New York, NY 10022. |
8 | Based on a Schedule 13G/A filed with the SEC on February 10, 2016. The Vanguard Group reported sole voting power with respect to 43,000 shares; sole dispositive power with respect to 1,522,844 shares and shared dispositive power with respect to 42,000 shares with Vanguard Fiduciary Trust Company. The address of the Vanguard Group is 100 Vanguard Blvd., Malvern, PA 19355. |
35
Securities Reserved for Issuance Under Equity Compensation Plans Table
The following table sets forth information about the Company’s Common Stock that was available for issuance under all of the Company’s existing equity compensation plans as of December 31, 2015:
Number of Securities to be Issued upon Exercise of Outstanding Options, Warrants and Rights | Weighted Average Exercise Price of Outstanding Options, Warrants and Rights | Number of Securities Remaining Available for Future Issuance | |||||||||
Plan Category | (# in thousands) | ($) | (# in thousands) | ||||||||
Equity compensation plans approved by security holders 1 | 214 | 2 | 29.56 | 3 | 2,172 | 4 | |||||
Equity compensation plan not approved by security holders | — | — | — | ||||||||
Total | 214 | 29.56 | 2,172 | ||||||||
______________________________________
1 | The 2001 Incentive Plan, the 2012 Incentive Plan and the Insperity, Inc. 2008 Employee Stock Purchase Plan (the “ESPP”) have been approved by the Company’s stockholders. The ESPP is intended to qualify for favorable tax treatment under Section 423 of the Internal Revenue Code. |
2 | Includes 185,947 shares subject to issuance under the LTIP as of December 31, 2015 assuming maximum results for performance periods not yet complete and actual results for completed performance periods and associated dividends equivalents. |
3 | Weighted average exercise price does not take into account shares to be issued under the LTIP. |
4 | This includes 1,260,069 shares available under the ESPP and 912,045 shares available under the 2012 Incentive Plan. As of April 15, 2016, 1,252,205 shares and 559,616 shares (assuming maximum results for performance periods not yet complete and actual results for performance periods completed) were available for issuance under the ESPP and the 2012 Incentive Plan, respectively. The securities remaining available for issuance under the 2012 Incentive Plan may be issued in the form of stock options, performance awards, stock awards (including restricted stock), phantom stock awards, stock appreciation rights, and other stock-based awards. |
ITEM 13. CERTAIN RELATIONSHIPS AND RELATED TRANSACTIONS AND DIRECTOR INDEPENDENCE.
Certain Relationships and Related Transactions
The Finance, Risk Management and Audit Committee has adopted a statement of policy and procedures with respect to related party transactions covering the review, approval or ratification of transactions involving the Company and “Related Parties” (generally, directors and executive officers and their immediate family members and 5% stockholders). The policy currently covers transactions in which the Company and any Related Party are participants and in which the Related Party has a material interest, other than transactions involving an amount equal to or less than $50,000 (individually or when aggregated with all similar transactions) and not involving non-employee directors. The policy generally requires that such transactions be approved by the Finance, Risk Management and Audit Committee in advance of the consummation or material amendment of the transaction. Under the policy, prior to entering into a related party transaction, full disclosure of all of the facts and circumstances relating to the transaction must be made to the Finance, Risk Management and Audit Committee, which will approve such transaction only if it is in, or is not inconsistent with, the best interests of the Company and its stockholders. In the event a transaction is not identified as a related party transaction in advance, it will be submitted promptly to the Finance, Risk Management and Audit Committee or the chairperson thereof, and such committee or chairperson, as the case may be, will evaluate the transaction and evaluate all options, including but not limited to ratification, amendment or termination of the transaction.
A significant component of our marketing strategy is the title sponsorship of the Insperity InvitationalTM golf tournament, a Champions PGA tour event held annually in The Woodlands, Texas, a suburb of Houston. Consistent with other PGA golf tournaments, the Insperity Invitational golf tournament benefits and is managed by a non-profit organization, Greater Houston Golf Charities (“GHGC”). In connection with the Company’s sponsorship, Mr. Jay E. Mincks, Executive Vice President of Sales and Marketing, serves as chairman of GHGC, a non-compensatory position. During 2015, the Company paid GHGC $3.5 million in sponsorship and tournament related expenses, as well as an additional $0.9 million in other event sponsorships and charitable contributions.
We provide PEO-related services to certain entities that are owned by, or have board members that are, Related Parties. These Related Parties include Mr. Richard G. Rawson, Mr. Paul J. Sarvadi and Mr. Jack M. Fields, Jr. or members of their families. The PEO service fees paid by such entities are within the pricing range of other unrelated clients of ours. During 2015, such client companies paid the Company the following service fees, which are presented net of the associated payroll costs:
36
Related Party | Net Service Fees / (Payroll Costs) | |||||||
Mr. Rawson (three client companies) | $ | 491,238 | $ | (1,636,797 | ) | |||
Mr. Sarvadi (four client companies) | $ | 334,367 | $ | (572,818 | ) | |||
Mr. Fields1 (two client companies) | $ | 183,907 | $ | (650,932 | ) | |||
_________________________
1 | Mr. Fields resigned from the Board on June 10, 2015. |
We made charitable contributions to non-profit organizations for which certain Related Parties serve as members of their board of directors. These Related Parties include Messrs. Sarvadi, Rawson and Mincks. During 2015, certain corporate employees were family members of certain Related Parties. Total salaries, commissions and incentive compensation paid during 2015 to family members of Messrs. Sarvadi, Rawson and and Arizpe were $243,849 (two corporate employees), $163,180 (one corporate employee) and $370,050 (five corporate employees), respectively.
Pursuant to the Agreement with Starboard, the Company reimbursed Starboard’s legal fees of $276,765.
Director Independence
Under rules of the New York Stock Exchange (the “NYSE”), the Company must have a majority of independent directors. No director qualifies as independent unless the Board affirmatively determines that the director has no material relationship with the Company (either directly or as a partner, stockholder or officer of an organization that has a relationship with the Company). In evaluating each director’s independence, the Board considered all relevant facts and circumstances, and relationships and transactions between each director, her or his family members or any business, charity or other entity in which the director has an interest on the one hand, and the Company, its affiliates, or the Company’s senior management on the other. As a result of this review, at its meeting held on February 19, 2016, the Board affirmatively determined that all of the Company’s directors are independent from the Company and its management, with the exception of Messrs. Sarvadi and Rawson, both of whom are members of the senior management of the Company.
The Board has considered what types of disclosure should be made relating to the process of determining director independence. To assist the Board in making disclosures regarding its determinations of independence, in 2004, the Board adopted categorical standards as contemplated under the listing standards of the NYSE then in effect. Under the rules then in effect, relationships that were within the categorical standards were not required to be disclosed and their impact on independence was not required to be separately discussed, although the categorical standards, by themselves, did not determine the independence of a particular director. The Board considers all relevant facts and circumstances in determining whether a director is independent. A relationship satisfies the categorical standards adopted by the Board if it:
• | is not a relationship that would preclude a determination of independence under Section 303A.02(b) of the NYSE Listed Company Manual; | ||
• | consists of charitable contributions made by Insperity to an organization where a director is an executive officer and does not exceed the greater of $1 million or 2% of the organization’s gross revenue in any of the last three years; and | ||
• | is not required to be, and it is not otherwise, disclosed herein. | ||
In the course of the Board’s determination regarding the independence of directors other than Messrs. Sarvadi and Rawson, it considered all transactions, relationships and arrangements in which such directors and Insperity were participants. The Board also considered any transactions amongst the directors, even if they did not involve Insperity. In particular, with respect to each of the most recent three fiscal years, the Board evaluated, with respect to Dr. Jones, its long-time employment of an individual who became Dr. Jones’ son-in-law. The Board has determined that this relationship is not material. In making this determination with respect to Dr. Jones, the Board considered that Dr. Jones’ son-in-law was employed as a manager of lead generation, held such position for several years prior to becoming a member of Dr. Jones’ family, and his salary was between the 25th and 75th percentile for the position.
37
ITEM 14. PRINCIPAL ACCOUNTING FEES AND SERVICES.
Fees of Ernst & Young LLP
Ernst & Young’s fees for professional services totaled $1,154,300 in 2015 and $1,096,610 in 2014. During 2015 and 2014, Ernst & Young’s fees for professional services included the following:
• | Audit Fees — fees for audit services, which relate to the consolidated audit, internal control audit in compliance with Sarbanes-Oxley Section 404, quarterly reviews, subsidiary audits and related matters, were $930,880 in 2015 and $875,850 in 2014. |
• | Audit-Related Fees — fees for audit-related services, which consisted primarily of the SOC 1 Report, the retirement plan audits, and quarterly agreed-upon procedures, were $220,920 in 2015 and $218,360 in 2014. |
•Tax Fees — there were no fees for tax services in 2015 or in 2014.
• | All Other Fees — there were fees of $2,500 in 2015 and $2,400 in 2014, which were annual subscription fees for Insperity’s use of Ernst and Young’s online research databases and other research tools. |
The Finance, Risk Management and Audit Committee reviewed the non-audit services provided to the Company and considered whether Ernst & Young’s provision of such services was compatible with maintaining its independence.
Finance, Risk Management and Audit Committee Pre-Approval Policy for Audit and Non-Audit Services
The Finance, Risk Management and Audit Committee has established a policy that requires pre-approval of the audit and non-audit services performed by the independent auditor. Unless a service proposed to be provided by the independent auditors has been pre-approved by the Finance, Risk Management and Audit Committee under its pre-approval policies and procedures, it will require specific pre-approval of the engagement terms by the Finance, Risk Management and Audit Committee. Under the policy, pre-approved service categories are generally provided for up to 12 months and must be detailed as to the particular services provided and sufficiently specific and objective so that no judgments by management are required to determine whether a specific service falls within the scope of what has been pre-approved. In connection with any pre-approval of services, the independent auditor is required to provide detailed back-up documentation concerning the specific services to be provided.
The Finance, Risk Management and Audit Committee may delegate pre-approval authority to one or more of its members, including a subcommittee of the Finance, Risk Management and Audit Committee. The member or members to whom such authority is delegated shall report any pre-approval actions taken by them to the Finance, Risk Management and Audit Committee at its next scheduled meeting. The Finance, Risk Management and Audit Committee does not delegate to management any of its responsibilities to pre-approve services performed by the independent auditor.
None of the services related to the Audit-Related Fees or Other Fees described above was approved by the Finance, Risk Management and Audit Committee pursuant to the waiver of pre-approval provisions set forth in applicable rules of the SEC.
38
PART IV
ITEM 15. EXHIBITS, FINANCIAL STATEMENT SCHEDULES.
(a) 1. Financial Statements of the Company
The Consolidated Financial Statements listed by the Registrant on the Index to Consolidated Financial Statements accompanying the Original Filing are filed as part of the Original Filing.
(a) 2. Financial Statement Schedules
The required information is included in the Consolidated Financial Statements or Notes thereto in the Original Filing.
(a) 3. List of Exhibits
Exhibit No. | Description | ||
3.1 | Certificate of Incorporation (incorporated by reference to Exhibit 3.1 to the Registrant’s Registration Statement on Form S-1 (No. 33-96952)). | ||
3.2 | Certificate of Ownership and Merger dated March 3, 2011 (incorporated by reference to Exhibit 3.1 to the Registrant’s Form 10-Q for the quarter ended March 31, 2011). | ||
3.3 | Amended and Restated Bylaws of Insperity, Inc. dated February 17, 2014 (incorporated by reference to Exhibit 3.1 to the Registrant’s Current Report on Form 8-K filed on February 18, 2014). | ||
3.4 | Certificate of Designation of Series A Junior Participating Preferred Stock setting forth the terms of the Preferred Stock (included as Exhibit A to the Rights Agreement). | ||
4.1 | Specimen Common Stock Certificate (incorporated by reference to Exhibit 4.1 to the Registrant’s Registration Statement on Form S-1 (No. 33-96952)). | ||
4.2 | Rights Agreement dated as of November 13, 2007 between Insperity, Inc. and Mellon Investor Services, LLC, as Rights Agent (the “Rights Agreement”) (incorporated by reference to Exhibit 4.1 to the Registrant’s Current Report on Form 8-K filed on November 16, 2007). | ||
4.3 | Form of Rights Certificate (included as Exhibit B to the Rights Agreement). | ||
10.1† | Insperity, Inc. 2001 Incentive Plan, as amended and restated (incorporated by reference to Appendix A to the Registrant’s definitive proxy statement on Schedule 14A filed on March 18, 2009 (No. 1-13998)). | ||
10.2† | Form of Director Stock Option Agreement (Annual Grant) (incorporated by reference to Exhibit 10.11 to the Registrant’s Form 10-K for the year ended December 31, 2004). | ||
10.3† | Form of Restricted Stock Agreement (incorporated by reference to Exhibit 10.12 to the Registrant’s Form 10-K for the year ended December 31, 2004). | ||
10.4† | Form of Restricted Stock Agreement (incorporated by reference to Exhibit 10.1 to the Registrant’s Form 10-Q for the quarter ended September 30, 2012). | ||
10.5† | Form of Director Stock Option Agreement (incorporated by reference to Exhibit 10.2 to the Registrant’s Form 10-Q for the quarter ended September 30, 2012). | ||
10.6† | Form of Director Restricted Stock Award Agreement (incorporated by reference to Exhibit 10.3 to the Registrant’s Form 10-Q for the quarter ended September 30, 2012). | ||
10.7† | Form of Employee Restricted Stock Award Agreement (incorporated by reference to Exhibit 10.2 to the Registrant’s Current Report on Form 8-K filed on February 22, 2013). | ||
10.8† | Form of New Hire Employee Restricted Stock Award Agreement (incorporated by reference to Exhibit 10.3 to the Registrant’s Current Report on Form 8-K filed on February 22, 2013). | ||
10.9† | Form of Named Executive Officer Restricted Stock Award Agreement (incorporated by reference to Exhibit 10.4 to the Registrant’s Current Report on Form 8-K filed on February 22, 2013). | ||
10.10† | Form of Director Restricted Stock Award Agreement (incorporated by reference to Exhibit 10.5 to the Registrant’s Current Report on Form 8-K filed on February 22, 2013). | ||
10.11† | Form of Employee Award Notice and Agreement (incorporated by reference to Exhibit 10.2 to the Registrant’s Current Report on Form 8-K filed on April 2, 2015). | ||
10.12† | Directors Compensation Plan (incorporated by reference to Exhibit 10.4 to the Registrant’s Form 10-Q for the quarter ended September 30, 2012). | ||
10.13† | Amendment to the Directors Compensation Plan (incorporated by reference to Exhibit 10.6 to the Registrant’s Current Report on Form 8-K filed on February 22, 2013). | ||
39
10.14† | First Amendment and Appendix A to Directors Compensation Plan (incorporated by reference to Exhibit 10.2 to the Registrant’s Current Report on Form 8-K filed on February 25, 2015). | ||
10.15† | Board of Directors Compensation Arrangements (incorporated by reference to the Registrant’s Current Report on Form 8-K dated February 7, 2005). | ||
10.16 | Insperity, Inc. 2008 Employee Stock Purchase Plan (incorporated by reference to Exhibit 10.1 to the Registrant’s Registration Statement on Form S-8 (No. 333-151275)). | ||
10.17 | Insperity, Inc. 2012 Incentive Plan (incorporated by reference to the Registrant’s definitive proxy statement on Schedule 14A filed on March 29, 2012 (No. 1-13998)). | ||
10.18 | First Amendment to the Insperity, Inc. 2012 Incentive Plan (incorporated by reference to Exhibit 10.1 to the Registrant’s Current Report on Form 8-K filed on February 22, 2013). | ||
10.19 | Second Amendment to Insperity, Inc. 2012 Incentive Plan (incorporated by reference to Exhibit 10.1 to the Registrant’s Current Report on Form 8-K filed on February 25, 2015). | ||
10.20 | Insperity, Inc. Long-Term Incentive Program (incorporated by reference to Exhibit 10.1 to the Registrant’s Current Report on Form 8-K filed on April 2, 2015). | ||
10.21(+) | Amendment to Various Agreements between United Healthcare Insurance Company and Insperity Holdings, Inc. (incorporated by reference to Exhibit 10.1 to the Registrant’s Form 10-Q for the quarter ended June 30, 2005). | ||
10.22 | Houston Service Center Operating Lease Amendment (incorporated by reference to Exhibit 10.27 to the Registrant’s Form 10-K for the year ended December 31, 2004). | ||
10.23(+) | Amendment to Minimum Premium Financial Agreement, as amended and restated effective January 1, 2005, by and between Insperity Holdings, Inc., and UnitedHealthcare Insurance Company (incorporated by reference to Exhibit 10.2 to the Registrant’s Form 10-Q for the quarter ended June 30, 2007). | ||
10.24(+) | Amendment to Minimum Premium Administrative Services Agreement, as amended and restated effective January 1, 2005, by and between Insperity Holdings, Inc., and UnitedHealthcare Insurance Company (incorporated by reference to Exhibit 10.3 to the Registrant’s Form 10-Q for the quarter ended June 30, 2007). | ||
10.25(+) | Amendment to Minimum Premium Financial Agreement, as amended effective January 1, 2009, by and between Insperity Holdings, Inc. (fka Administaff of Texas, Inc.) and United Healthcare Insurance Company (incorporated by reference to Exhibit 10.1 to the Registrant’s Form 10-Q for the quarter ended March 31, 2013). | ||
10.26(+) | Amendment to Minimum Premium Financial Agreement, as amended effective January 1, 2013, by and between Insperity Holdings, Inc. and United Healthcare Insurance Company (incorporated by reference to Exhibit 10.2 to the Registrant’s Form 10-Q for the quarter ended September 30, 2015). | ||
10.27(+) | Amendment to Minimum Premium Administrative Services Agreement, as amended effective January 1, 2008, by and between Insperity Holdings, Inc. (fka Administaff of Texas, Inc.) and United Healthcare Insurance Company (incorporated by reference to Exhibit 10.2 to the Registrant’s Form 10-Q for the quarter ended March 31, 2013). | ||
10.28(+) | Amendment to Minimum Premium Administrative Services Agreement, as amended effective January 1, 2013, by and between Insperity Holdings, Inc. and United Healthcare Insurance Company, effective as of January 1, 2015 (incorporated by reference to Exhibit 10.3 to the Registrant’s Form 10-Q for the quarter ended September 30, 2015). | ||
10.29(+) | Letter Agreement, dated September 2, 2014, by and between Insperity Holdings, Inc. and UnitedHealthcare Insurance Company (incorporated by reference to Exhibit 10.1 to the Registrant's Form 10-Q for the quarter ended September 30, 2014). | ||
10.30(+) | Letter Agreement, dated August 28, 2015, by and between Insperity Holdings, Inc. and UnitedHealthcare Insurance Company (incorporated by reference to Exhibit 10.1 to the Registrant's Form 10-Q for the quarter ended September 30, 2015). | ||
10.31(+) | Amendment to Minimum Premium Financial Agreement, as amended effective January 1, 2011, by and between Insperity Holdings, Inc. (fka Administaff of Texas, Inc.) and UnitedHealthcare Insurance Company, effective as of January 1, 2013 (incorporated by reference to Exhibit 10.2 to the Registrant's Form 10-Q for the quarter ended September 30, 2014). | ||
10.32(+) | Amendment to Minimum Premium Administrative Services Agreement, as amended effective January 1, 2011, by and between Insperity Holdings, Inc. (fka Administaff of Texas, Inc.) and UnitedHealthcare Insurance Company, effective as of January 1, 2013 (incorporated by reference to Exhibit 10.3 to the Registrant's Form 10-Q for the quarter ended September 30, 2014). | ||
10.33 | Exchange Agreement for Corporate Aircraft, dated August 30, 2011 (incorporated by reference to Exhibit 10.1 to the Registrant’s Form 10-Q for the quarter ended September 30, 2011). | ||
10.34 | Credit Agreement dated September 15, 2011 (incorporated by reference to Exhibit 10.1 to the Registrant’s Current Report on Form 8-K filed on September 21, 2011). | ||
10.35 | Amendment No. 1 to the Credit Agreement dated December 7, 2012 (incorporated by reference to Exhibit 10.32 to the Registrant’s Form 10-K for the year ended December 31, 2012). | ||
10.36 | Amendment No. 2 to the Credit Agreement dated December 1, 2014. | ||
40
10.37 | Amendment No. 3 to the Credit Agreement dated February 6, 2015. | ||
10.38 | Agreement, dated as of March 21, 2015, by and among Insperity, Inc. and Starboard Value LP and certain of its affiliates (incorporated by reference to Exhibit 10.1 to the Registrant’s Form 8-K filed on on March 31, 2015). | ||
21.1* | Subsidiaries of Insperity, Inc. | ||
23.1* | Consent of Independent Registered Public Accounting Firm. | ||
24.1* | Powers of Attorney. | ||
31.1** | Certification of Chief Executive Officer pursuant to Section 302 of the Sarbanes-Oxley Act of 2002. | ||
31.2** | Certification of Chief Financial Officer pursuant to Section 302 of the Sarbanes-Oxley Act of 2002. | ||
32.1*** | Certification of Chief Executive Officer pursuant to Section 906 of the Sarbanes-Oxley Act of 2002. | ||
32.2*** | Certification of Chief Financial Officer pursuant to Section 906 of the Sarbanes-Oxley Act of 2002. | ||
101.INS* | XBRL Instance Document. | ||
101.SCH* | XBRL Taxonomy Schema Document. | ||
101.CAL* | XBRL Taxonomy Extension Calculation Linkbase Document. | ||
101.DEF* | XBRL Extension Definition Linkbase Document. | ||
101.LAB* | XBRL Taxonomy Extension Label Linkbase Document. | ||
101.PRE* | XBRL Taxonomy Extension Presentation Linkbase Document. | ||
____________________________________
* | Previously filed as an exhibit to the Original Filing. |
** | Filed herewith. |
*** | Previously furnished as an exhibit to the Original Filing. |
† | Management contract or compensatory plan or arrangement. |
(+) | Confidential treatment has been requested for this exhibit and confidential portions have been filed with the Securities and Exchange Commission. |
SIGNATURES
Pursuant to the requirements of Section 13 or 15(d) of the Securities Exchange Act of 1934, Insperity, Inc. has duly caused this report to be signed in its behalf by the undersigned, thereunto duly authorized, on April 28, 2016.
INSPERITY, INC. | ||
By: | /s/ Douglas S. Sharp | |
Douglas S. Sharp | ||
Senior Vice President of Finance | ||
Chief Financial Officer and Treasurer | ||
41