Attached files
| file | filename |
|---|---|
| EX-99.1 - EXHIBIT 99.1 - QUAKER CHEMICAL CORP | v438088_ex99-1.htm |
| 8-K - FORM 8-K - QUAKER CHEMICAL CORP | v438088_8k.htm |
Exhibit 99.2

1 First Quarter 2016 Results Investor Conference Call April 28, 2016 Quaker Chemical Corporation

Regulation G The attached charts include C ompany information that does not conform to generally accepted accounting principles ( “GAAP”). Management believes that an analysis of this data is meaningful to investors because it provides insight with respect to ongoing operating results of the Company and allows investors to better evaluate the financial results of the Company. These measures should not be viewed as an alternative to GAAP measures of performance. Furthermore, these measures may not be consis tent with simi lar measures provided by other companies. This data should b e read in conjunction with the C ompany’s first quarter earnings news release dated April 27, 2016, which has been furnished to the SEC on Form 8-K and the Company’ s Form 10-Q for the quarterly period ended March 31, 2016, which has been filed with the SEC. Forward-Looking Statements This presentation may contain forward -looking statements that are subject to certain risks and uncertainties that could cause actual results to differ materially from those projected in such statements. A major risk is that demand for the Company’s products and services is largely derived from the demand for its customers’ produ cts, which subjects the Company to uncertainties related to downtu rns in a customer’s business and unanticipated customer production shutdowns. Other major risks and uncertainties include, but are not limited to, significant increases in raw material costs, customer financial stability, worldwide economic and political c onditions, for eign currency fluctuations, future terrorist attacks and other acts of violence. Other factors could also adversely affect us. Therefore, we caution you not to place undue reliance on our forward -looking statements. This discussion is prov ided as permitted by the Private Securities Litigation Reform Act of 1995. Risks and Uncertainties Statement

Speakers Michael F. Barry Chairman of the Board, Chief Executive Officer & President Mary Dean Hall Vice President, Chief Financial Officer & Treasurer Robert T. Traub Vice President, General Counsel & Corporate Secretary Chart #1

First Quarter 2016 Headlines ▪ Strong operating income of $19.2 million drives 8% increase in adjusted EBITDA ▪ Volume growth in all major regions despite continued end - market weakness ▪ Solid operating cash flow of $10.9 million up 34% from the prior year Chart #2
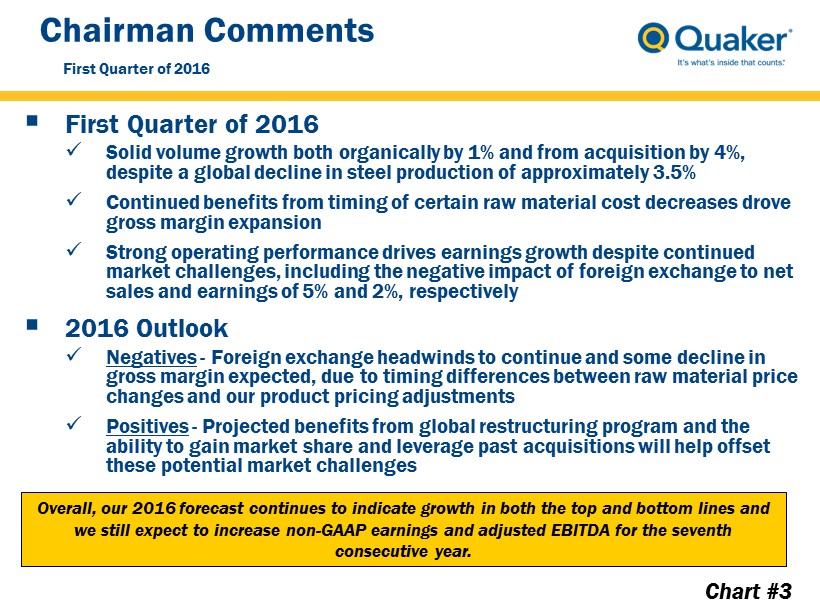
Chairman Comments ▪ First Quarter of 2016 x Solid volume growth both organically by 1% and from acquisition by 4%, despite a global decline in steel production of approximately 3.5% x Continued benefits from timing of certain raw material cost decreases drove gross margin expansion x Strong operating performance drives earnings growth despite continued market challenges, including the negative impact of foreign exchange to net sales and earnings of 5% and 2%, respectively ▪ 2016 Outlook x Negatives - Foreign exchange headwinds to continue and some decline in gross margin expected, due to timing differences between raw material price changes and our product pricing adjustments x Positives - Projected benefits from global restructuring program and the ability to gain market share and leverage past acquisitions will help offset these potential market challenges First Quarter of 2016 Overall, our 2016 forecast continues to indicate growth in both the top and bottom lines and we still expect to increase non - GAAP earnings and adjusted EBITDA for the seventh consecutive year. Chart #3

Financial Highlights 1) Solid operating results drive 4% increase in non - GAAP earnings per diluted share of $0.98 in the first quarter of 2016, despite an inflated tax rate ▪ Timing issue drives quarterly tax rate of 32.3% up from 30.8% in Q1 2015 ▪ Negative foreign exchange impact of approximately $0.02 per diluted share vs. Q1 2015 2) Volume growth in each of the Company’s largest regions more than offset by negative foreign currency translation and declines in selling price due to lower raw material costs 3) Expansion of gross margin and controlled SG&A drive operating income and adjusted EBITDA growth of 8% compared to the first quarter of 2015 4) 2015 Global Restructuring Program being executed as planned; continue to estimate $3 million in savings this year, primarily in second half of 2016 5) Strong operating cash flow of $10.9 million up 34% from the first quarter of 2015 on improved operating performance and lower cash invested in working capital Chart #4 First Quarter of 2016

Financial Snapshot ($ Millions unless otherwise noted) Q1 2016 Q1 2015 Net Sales 178.1 181.3 Gross Margin 38.1 % 36.6 % Operating Income 19.2 17.9 Operating Margin 10.8 % 9.9 % Net Income Attributable to Quaker Chemical Corporation 12.9 10.4 Earnings Per Diluted Share 0.98 0.78 Non - GAAP Earnings Per Diluted Share 0.98 0.94 Adjusted EBITDA 25.0 23.2 Adjusted EBITDA Margin 14.0 % 12.8 % Net Debt 3.9 8.8 Net Operating Cash Flow 10.9 8.1 Effective Tax Rate 32.3 % 30.8 % Chart #5

Product Volume by Quarter and Year Thousand Kilograms Chart #6 Acquisition and base - volume related growth in each of the Company’s largest regions 115,000 135,000 155,000 175,000 195,000 215,000 235,000 25,000 31,000 37,000 43,000 49,000 55,000 61,000 Full Year Volume Quarter Volume Quarter Volume Full Year Volume

Gross Margin Percentage 28.0% 34.7% 35.4% 32.6% 33.7% 35.8% 35.7% 37.6% 20.0% 25.0% 30.0% 35.0% 40.0% 2008 2009 2010 2011 2012 2013 2014 2015 Gross Margin Percentage 36.6% 38.4% 37.7% 37.5% 38.1% 20.0% 25.0% 30.0% 35.0% 40.0% Q1 2015 Q2 2015 Q3 2015 Q4 2015 Q1 2016 Gross Margin Percentage Chart #7 Further expansion in gross margin driven by continued timing of raw material cost decreases

Adjusted EBITDA Baseline Historical Performance $40.1 $66.8 $73.0 $80.9 $89.6 $99.8 $101.6 $99.3 $103.3 $44.2 13.0% 14.1% 13.0% 12.3% 9.8% 10.7% 12.3% 6.9% 13.8% 11.4% 2008 2009 2010 2011 2012 2013 2014 2015 Trailing Twelve Months Q1 2015 Trailing Twelve Months Q1 2016 Adjusted EBITDA ($ Mils.) Adjusted EBITDA Margin (%) FY 2008 – Q1 2016 CAGR: 14.0% +720 Margin bps Chart #8

Balance Sheet Cash and Debt -$120 -$80 -$40 $0 $40 $80 $120 2008 2009 2010 2011 2012 2013 2014 2015 Q1 2016 $ Millions Cash ST/LT Debt Net Debt Chart #9 Strong cash flow generation and balance sheet continue to support future growth

APPENDIX
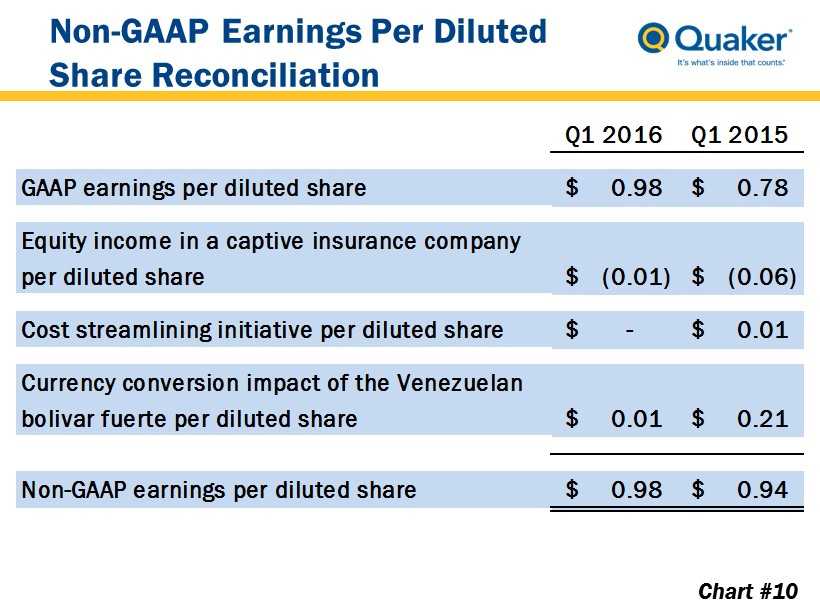
Non - GAAP Earnings Per Diluted Share Reconciliation Chart #10 Q1 2016 Q1 2015 GAAP earnings per diluted share 0.98$ 0.78$ Equity income in a captive insurance company per diluted share (0.01)$ (0.06)$ Cost streamlining initiative per diluted share -$ 0.01$ Currency conversion impact of the Venezuelan bolivar fuerte per diluted share 0.01$ 0.21$ Non-GAAP earnings per diluted share 0.98$ 0.94$

Adjusted EBITDA Reconciliation Chart #11 2008 2009 2010 2011 2012 2013 2014 2015 Net income 9,833 16,058 32,120 45,892 47,405 56,339 56,492 51,180 Depreciation 10,879 9,525 9,867 11,455 12,252 12,339 12,306 12,395 Amortization 1,177 1,078 988 2,338 3,106 3,445 4,325 6,811 Interest expense 5,509 5,533 5,225 4,666 4,283 2,922 2,371 2,585 Taxes on income 4,977 7,065 12,616 14,256 15,575 20,489 23,539 17,785 Equity loss (income) from a captive insurance company 1,299 162 (313) (2,323) (1,812) (5,451) (2,412) (2,078) Non-cash gain from the purchase of an equity affiliate - - - (2,718) - - - - Equity affiliate out of period charge - - 564 - - - - - Restructuring expenses 2,916 2,289 - - - - - 6,790 Transition costs related to key employees 3,505 2,443 1,317 - 609 - - - Verkol transaction-related expenses - - - - - - - 2,813 U.K. pension plan amendment - - - - - - 902 - Customer bankruptcy costs - - - - 1,254 - 825 328 Cost streamlining initiatives - - - - - 1,419 1,166 173 Non-income tax contingency charges - - 4,132 - - 796 - - Change in acquisition-related earnout liability - - - (595) (1,737) (497) - - Mineral oil excise tax refund - - - - - (2,540) - - Currency conversion impacts of the Venezuelan bolivar fuerte - - 322 - - 357 321 2,806 Adjusted EBITDA 40,095 44,153 66,838 72,971 80,935 89,618 99,835 101,588 Adjusted EBITDA Margin 6.9% 9.8% 12.3% 10.7% 11.4% 12.3% 13.0% 13.8%
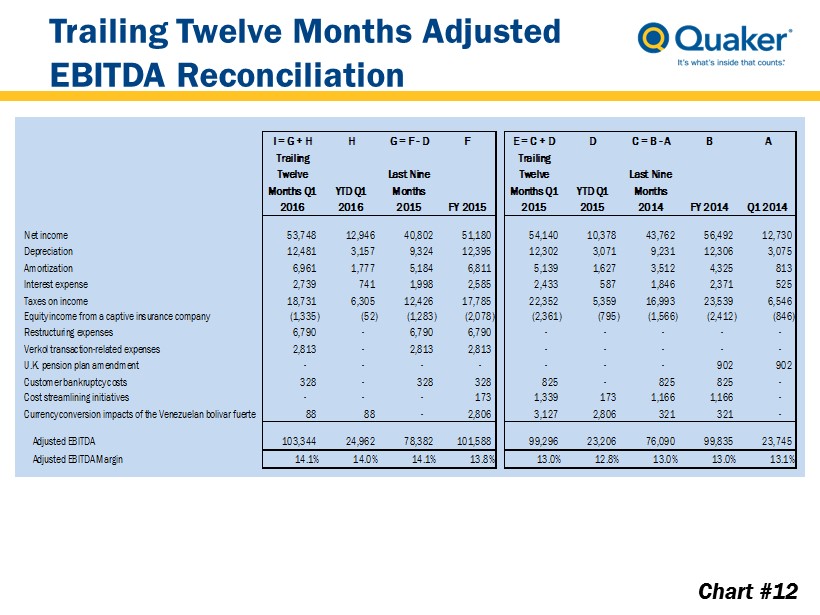
Trailing Twelve Months Adjusted EBITDA Reconciliation Chart #12 I = G + H H G = F - D F E = C + D D C = B - A B A Trailing Twelve Months Q1 2016 YTD Q1 2016 Last Nine Months 2015 FY 2015 Trailing Twelve Months Q1 2015 YTD Q1 2015 Last Nine Months 2014 FY 2014 Q1 2014 Net income 53,748 12,946 40,802 51,180 54,140 10,378 43,762 56,492 12,730 Depreciation 12,481 3,157 9,324 12,395 12,302 3,071 9,231 12,306 3,075 Amortization 6,961 1,777 5,184 6,811 5,139 1,627 3,512 4,325 813 Interest expense 2,739 741 1,998 2,585 2,433 587 1,846 2,371 525 Taxes on income 18,731 6,305 12,426 17,785 22,352 5,359 16,993 23,539 6,546 Equity income from a captive insurance company (1,335) (52) (1,283) (2,078) (2,361) (795) (1,566) (2,412) (846) Restructuring expenses 6,790 - 6,790 6,790 - - - - - Verkol transaction-related expenses 2,813 - 2,813 2,813 - - - - - U.K. pension plan amendment - - - - - - - 902 902 Customer bankruptcy costs 328 - 328 328 825 - 825 825 - Cost streamlining initiatives - - - 173 1,339 173 1,166 1,166 - Currency conversion impacts of the Venezuelan bolivar fuerte 88 88 - 2,806 3,127 2,806 321 321 - Adjusted EBITDA 103,344 24,962 78,382 101,588 99,296 23,206 76,090 99,835 23,745 Adjusted EBITDA Margin 14.1% 14.0% 14.1% 13.8% 13.0% 12.8% 13.0% 13.0% 13.1%