Attached files
| file | filename |
|---|---|
| 8-K - FORM 8-K - Franklin Financial Network Inc. | v438010_8k.htm |
Exhibit 99.1

Franklin Financial Network, Inc. (NYSE:FSB) First Quarter 2016 Investor Call April 27, 2016
2 Forward - Looking Statements Except for the historical information contained herein, this presentation contains forward - looking statements within the meaning of Section 27A of the Securities Act of 1933, as amended, and Section 21E of the Securities Exchange Act of 1934, as amended. The forward - looking statements include, among other things, statements regarding intent, belief or expectations of the Company and can be identified by the use of words such as "may," "will," "should," "would," "assume," "outlook," "seek," "plan," "believe," "expect," "anticipate," "intend," "estimate," "forecast," and other comparable terms. The Company intends that all such statements be subject to the “safe harbor” provisions of those Acts. Because forward - looking statements involve risks and uncertainties, actual results may differ materially from those expressed or implied. Investors are cautioned not to place undue reliance on these forward - looking statements and are advised to carefully review the discussion of forward - looking statements and risk factors in documents the Company files with the Securities and Exchange Commission. The Company undertakes no obligation to publicly update or revise any forward - looking statements, whether as a result of new information, future events or otherwise.
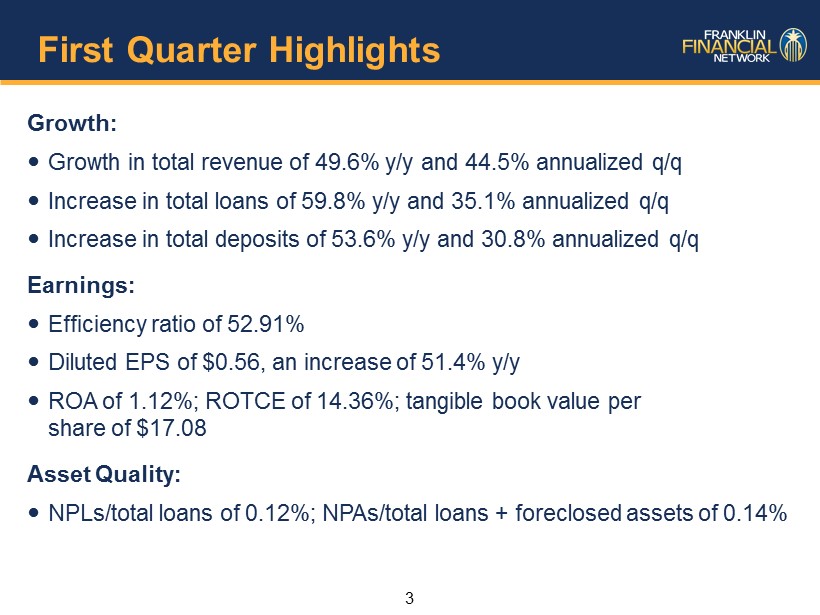
3 First Quarter Highlights Growth: Growth in total revenue of 49.6% y/y and 44.5% annualized q/q Increase in total loans of 59.8% y/y and 35.1% annualized q/q Increase in total deposits of 53.6% y/y and 30.8% annualized q/q Earnings: Efficiency ratio of 52.91% Diluted EPS of $0.56, an increase of 51.4% y/y ROA of 1.12%; ROTCE of 14.36%; tangible book value per share of $17.08 Asset Quality: NPLs/total loans of 0.12%; NPAs/total loans + foreclosed assets of 0.14%
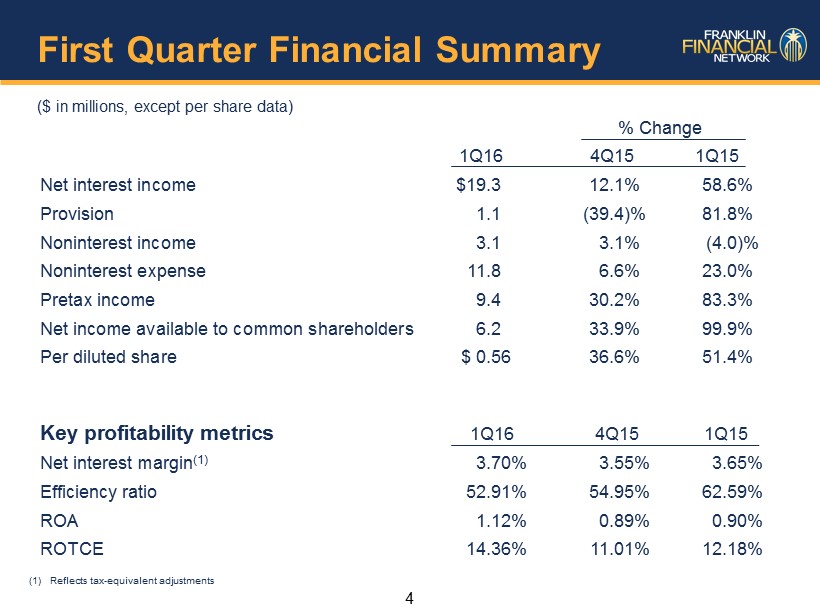
4 First Quarter Financial Summary ($ in millions, except per share data) % Change 1Q16 4Q15 1Q15 Net interest income $19.3 12.1% 58.6% Provision 1.1 (39.4)% 81.8% Noninterest income 3.1 3.1% (4.0)% Noninterest expense 11.8 6.6% 23.0% Pretax income 9.4 30.2% 83.3% Net income available to common shareholders 6.2 33.9% 99.9% Per diluted share $ 0.56 36.6% 51.4% Key profitability metrics 1Q16 4Q15 1Q15 Net interest margin (1) 3.70% 3.55% 3.65% Efficiency ratio 52.91% 54.95% 62.59% ROA 1.12% 0.89% 0.90% ROTCE 14.36% 11.01% 12.18% (1) Reflects tax - equivalent adjustments
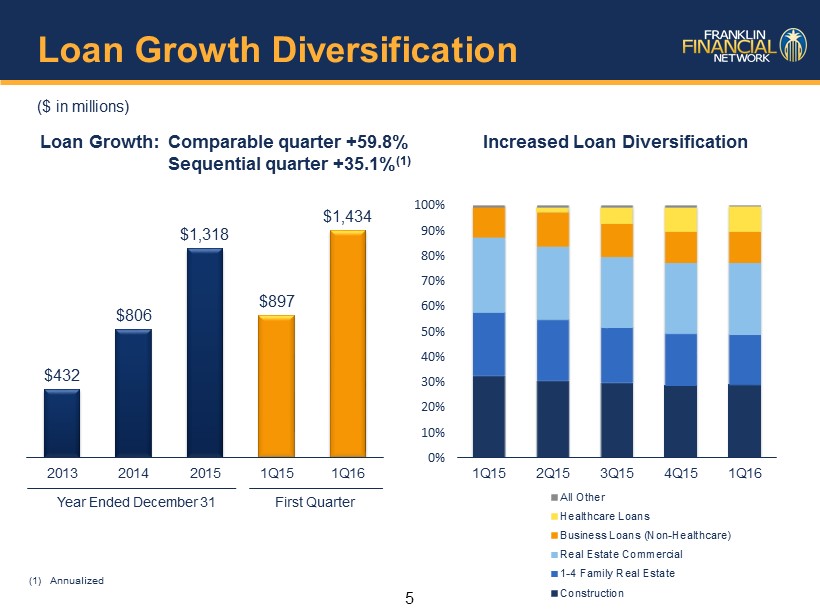
5 Loan Growth Diversification ($ in millions) Loan Growth: Comparable quarter +59.8% Sequential quarter +35.1% (1) Increased Loan Diversification $432 $806 $1,318 $897 $1,434 2013 2014 2015 1Q15 1Q16 Year Ended December 31 First Quarter 0% 10% 20% 30% 40% 50% 60% 70% 80% 90% 100% 1Q15 2Q15 3Q15 4Q15 1Q16 All Other Healthcare Loans Business Loans (Non-Healthcare) Real Estate Commercial 1-4 Family Real Estate Construction (1) Annualized
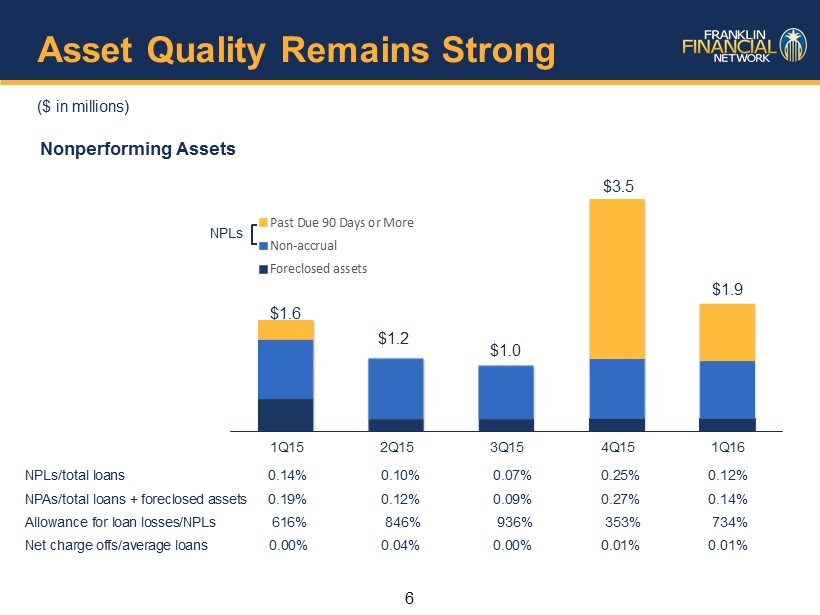
6 Asset Quality Remains Strong ($ in millions) Nonperforming Assets NPLs/total loans 0.14% 0.10% 0.07% 0.25% 0.12% NPAs/total loans + foreclosed assets 0.19% 0.12% 0.09% 0.27% 0.14% Allowance for loan losses/NPLs 616% 846% 936% 353% 734% Net charge offs/average loans 0.00% 0.04% 0.00% 0.01% 0.01% 1Q15 2Q15 3Q15 4Q15 1Q16 Past Due 90 Days or More Non-accrual Foreclosed assets $1.6 $1.2 $1.0 $3.5 NPLs $1.9
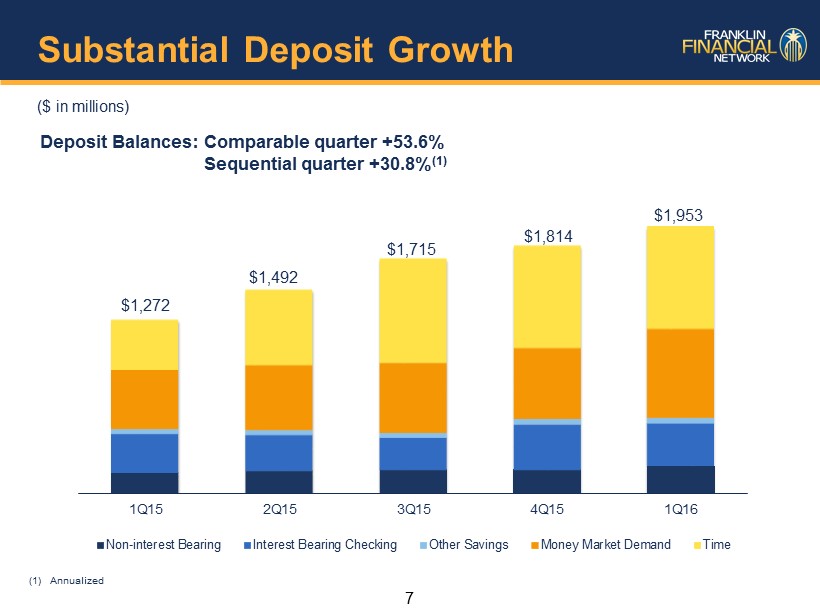
7 Substantial Deposit Growth ($ in millions) Deposit Balances: Comparable quarter +53.6% Sequential quarter +30.8% (1) 1Q15 2Q15 3Q15 4Q15 1Q16 Non-interest Bearing Interest Bearing Checking Other Savings Money Market Demand Time $1,272 $1,492 $1,715 $1,814 $1,953 (1) Annualized
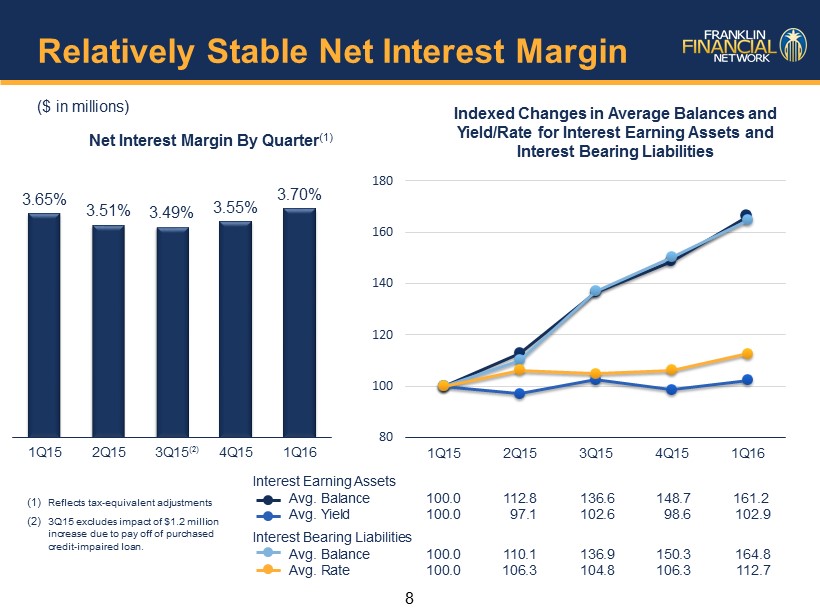
8 Relatively Stable Net Interest Margin ($ in millions) Net Interest Margin By Quarter (1) Indexed Changes in Average Balances and Yield/Rate for Interest Earning Assets and Interest Bearing Liabilities 3.65% 3.51% 3.49% 3.55% 3.70% 1Q15 2Q15 3Q15 4Q15 1Q16 80 100 120 140 160 180 1Q15 2Q15 3Q15 4Q15 1Q16 Interest Earning Assets Avg. Balance 100.0 112.8 136.6 148.7 161.2 Avg. Yield 100.0 97.1 102.6 98.6 102.9 Interest Bearing Liabilities Avg. Balance 100.0 110.1 136.9 150.3 164.8 Avg. Rate 100.0 106.3 104.8 106.3 112.7 (1) Reflects tax - equivalent adjustments (2) 3Q15 excludes impact of $1.2 million increase due to pay off of purchased credit - impaired loan. (2)
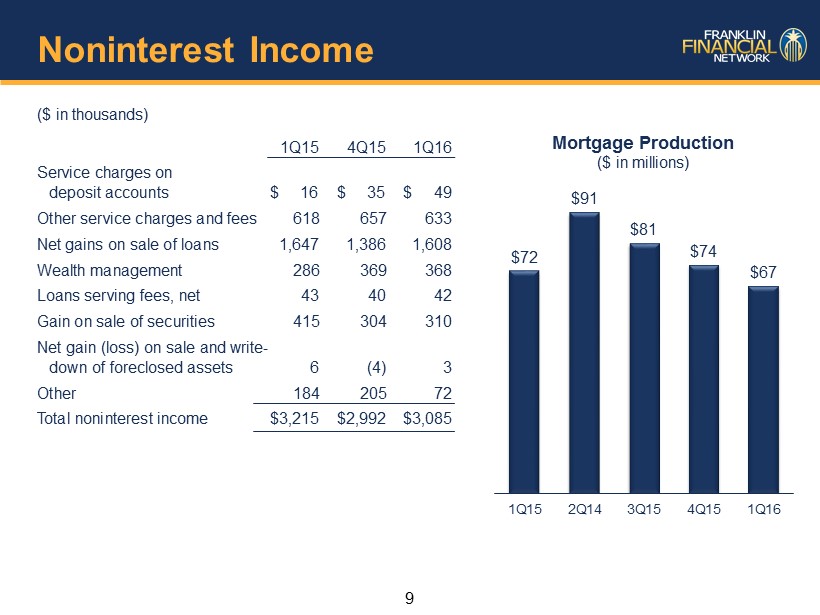
9 Noninterest Income ($ in thousands) 1Q15 4Q15 1Q16 Service charges on deposit accounts $ 16 $ 35 $ 49 Other service charges and fees 618 657 633 Net gains on sale of loans 1,647 1,386 1,608 Wealth management 286 369 368 Loans serving fees, net 43 40 42 Gain on sale of securities 415 304 310 Net gain (loss) on sale and write - down of foreclosed assets 6 ( 4) 3 Other 184 205 72 Total noninterest income $3,215 $2,992 $3,085 $72 $91 $81 $74 $67 1Q15 2Q14 3Q15 4Q15 1Q16 Mortgage Production ($ in millions)
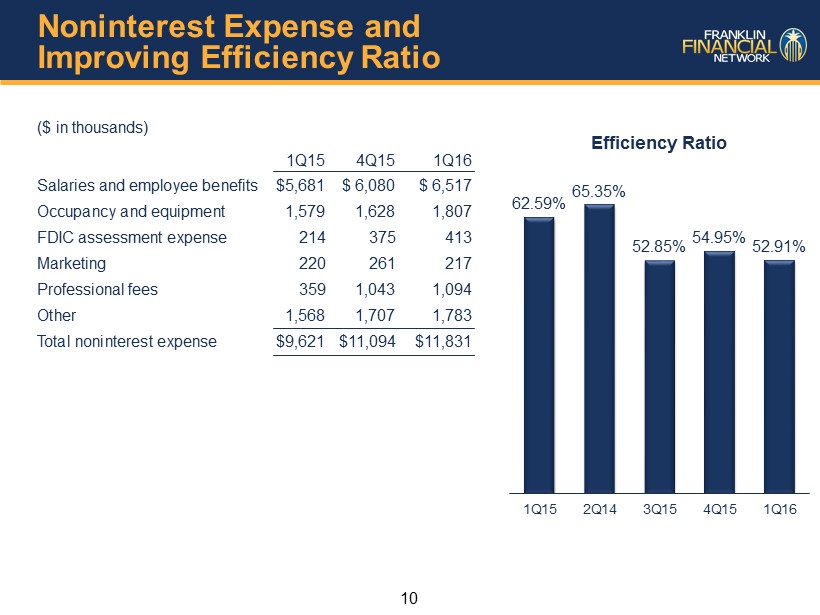
10 Noninterest Expense and Improving Efficiency Ratio ($ in thousands) 1Q15 4Q15 1Q16 Salaries and employee benefits $5,681 $ 6,080 $ 6,517 Occupancy and equipment 1,579 1,628 1,807 FDIC assessment expense 214 375 413 Marketing 220 261 217 Professional fees 359 1,043 1,094 Other 1,568 1,707 1,783 Total noninterest expense $9,621 $11,094 $11,831 62.59% 65.35% 52.85% 54.95% 52.91% 1Q15 2Q14 3Q15 4Q15 1Q16 Efficiency Ratio
11 Key Elements of FSB Performance Growth Real Estate Lending Asset Quality Proven, Successful Banking Model