Attached files
| file | filename |
|---|---|
| 8-K - 8-K - KEYCORP /NEW/ | d177286d8k.htm |
| EX-99.3 - EX-99.3 - KEYCORP /NEW/ | d177286dex993.htm |
| EX-99.1 - EX-99.1 - KEYCORP /NEW/ | d177286dex991.htm |
| KeyCorp First Quarter 2016 Earnings Review April 21, 2016 Beth E. Mooney Chairman and Chief Executive Officer Don Kimble Chief Financial Officer Exhibit 99.2 |
 FORWARD-LOOKING STATEMENTS AND ADDITIONAL
INFORMATION DISCLOSURE This communication contains forward-looking statements within the meaning of the Private Securities Litigation Reform Act of 1995 including, but not limited to, KeyCorp’s and First Niagara’s expectations or predictions of future financial or business performance or conditions. Forward-looking statements are typically identified by words such as “believe,” “expect,” “anticipate,” “intend,” “target,” “estimate,” “continue,” “positions,” “plan,” “predict,” “project,” “forecast,” “guidance,” “goal,” “objective,” “prospects,” “possible” or “potential,” by future conditional verbs such as “assume,” “will,” “would,” “should,” “could” or “may”, or by variations of such words or by similar expressions. These forward-looking statements are subject to numerous assumptions, risks and uncertainties, which change over time. Forward-looking statements speak only as of the date they are made and we assume no duty to update forward-looking statements. Actual results may differ materially from current projections. In addition to factors previously disclosed in KeyCorp’s and First Niagara’s reports filed with the SEC and those identified elsewhere in this communication, the following factors, among others, could cause actual results to differ materially from forward-looking statements or historical performance: ability to obtain regulatory approvals and meet other closing conditions to the merger, including the risk that regulatory approvals required for the merger are not obtained or are obtained subject to conditions that are not anticipated; delay in closing the merger; difficulties and delays in integrating the First Niagara business or fully realizing cost savings and other benefits; business disruption following the merger; changes in asset quality and credit risk; the inability to sustain revenue and earnings growth; changes in interest rates and capital markets; inflation; customer acceptance of KeyCorp’s products and services; customer borrowing, repayment, investment and deposit practices; customer disintermediation; the introduction, withdrawal, success and timing of business initiatives; competitive conditions; the inability to realize cost savings or revenues or to implement integration plans and other consequences associated with mergers, acquisitions and divestitures; economic conditions; and the impact, extent and timing of technological changes, capital management activities, and other actions of the Federal Reserve Board and legislative and regulatory actions and reforms. Annualized, pro forma, projected and estimated numbers are used for illustrative purpose only, are not forecasts and may not reflect actual results. This presentation also includes certain non-GAAP financial measures related to “tangible common equity,” “Common Equity Tier 1,” “pre-provision net revenue,” “cash efficiency ratio,” and certain financial measures excluding merger-related expenses. Management believes these measures may assist investors, analysts and regulators in analyzing Key’s financials. Although Key has procedures in place to ensure that these measures are calculated using the appropriate GAAP or regulatory components, they have limitations as analytical tools and should not be considered in isolation, or as a substitute for analysis of results under GAAP. For more information on these calculations and to view the reconciliations to the most comparable GAAP measures, please refer to the appendix of this presentation or page 43 of our Form 10-K dated December 31, 2015. 2 |
 (a) Non-GAAP measure: see Appendix for reconciliations (b) Merger-related expense detail provided in Appendix, on slide 17 (c) 3-31-16 ratio is estimated 3 Disciplined Capital Management Disciplined Capital Management Generated positive operating leverage and grew pre-provision net revenue 6% (a)
from 1Q15, excluding merger-related expense of $24 MM
(b) Revenue up 3% from 1Q15, driven by 6% growth in net interest income Total average loans up 5% from prior year; CF&A loans up 12% Positive trends in several fee-based businesses reflecting ongoing investments
– Market sensitive businesses impacted by slowdown in market activity Cash efficiency ratio of 64% (a) excluding merger-related expense, (b) down from prior year and prior quarter Strong Risk Management Strong Risk Management Investor Highlights – 1Q16 Positive Operating Leverage Positive Operating Leverage Maintained credit discipline Credit quality measures impacted by migration in the oil and gas portfolio, reflecting
market conditions NCOs represented 31 bps of average loans, below targeted range Maintained strong capital position Common Equity Tier 1 ratio of 11.1% at 3/31/16 (a), (c) Planned common share dividend increase of 13% in 2Q16 (subject to Board approval) |
 4 First Niagara: Significant Progress Being Made Acquisition Drives Value Acquisition Drives Value 1Q16 Updates 1Q16 Updates Executing against comprehensive pre-merger integration plan Shareholder approval at both KEY and FNFG – Over 90% of the votes cast at each company’s special meeting were in favor of the merger Focused on continued assessment, detailed planning and the regulatory approval process – Target environment design – Talent assessment and selection – Change management planning and execution Community Benefits Plan announced Expected 3Q16 close Attractive Financial Returns Significant Revenue Opportunities Complementary Business Model More Balanced Franchise Cost savings of $400 MM ROTCE ~200 bps higher Cash efficiency improves ~300 bps EPS accretion of ~5% IRR of ~15%; ROIC >10% Continued confidence in value attainment, financial targets and cultural compatibility Value attainment and financial metrics based upon full realization of cost savings (FY 2018); no revenue synergies assumed |
 5 Financial Review |
 6 Financial Highlights TE = Taxable equivalent; EOP = End of Period (a) From continuing operations (b) Year-over-year average balance growth (c) From consolidated operations (d) 3-31-16 ratios are estimated (e) Non-GAAP measure: see Appendix for reconciliation (f) Merger-related expense detail available in Appendix, on slide 17 EPS – assuming dilution $ .22 $ .27 $ .26 $ .27 $ .26 EPS –excl. merger-related expense (e), (f) .24 .27 Cash efficiency ratio (e) 66.6 % 66.4 % 66.9 % 65.1 % 65.1 % Cash efficiency –excl. merger-related expense (e), (f) 64.3 65.8 Return on average total assets .80 .97 .95 1.03 1.03 ROAA –excl. merger-related expense (e), (f) .86 .99 Total loans and leases 5 % 5 % 6 % 4 % 5 % CF&A loans 12 14 15 10 12 Deposits (excl. foreign deposits) 4 3 3 6 5 Common Equity Tier 1 (d), (e) 11.1 % 11.0 % 10.5 % 10.7 % 10.6 % Tier 1 risk-based capital (d) 11.4 11.4 10.9 11.1 11.0 Tangible common equity to tangible assets (e) 10.0 10.0 9.9 9.9 9.9 NCOs to average loans .31 % .25 % .27 % .25 % .20 % NPLs to EOP portfolio loans 1.12 .65 .67 .72 .75 Allowance for loan losses to EOP loans 1.37 1.33 1.31 1.37 1.37 Balance Sheet Growth (a), (b) Balance Sheet Growth (a), (b) Capital (c) Capital (c) Asset Quality (a) Asset Quality (a) Financial Performance (a) Metrics 1Q16 4Q15 3Q15 2Q15 1Q15 |
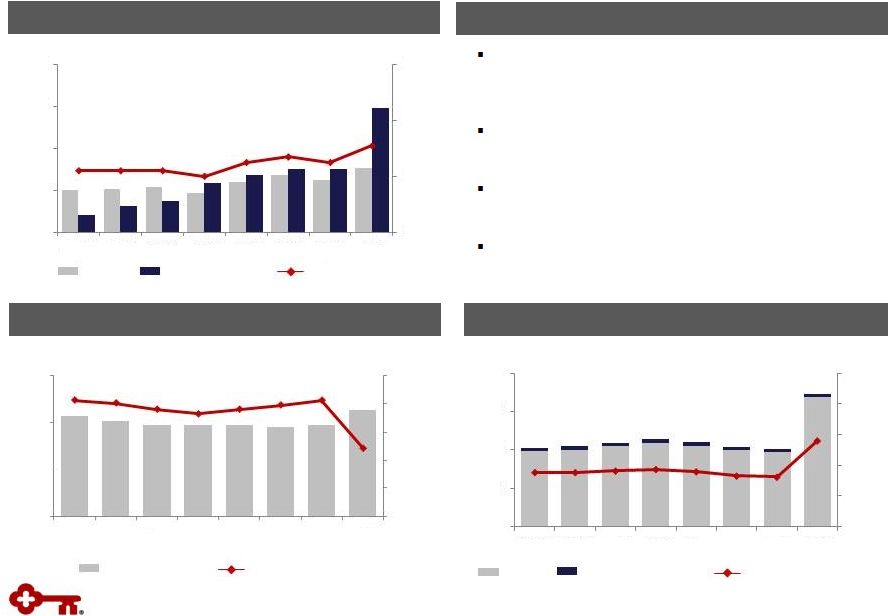
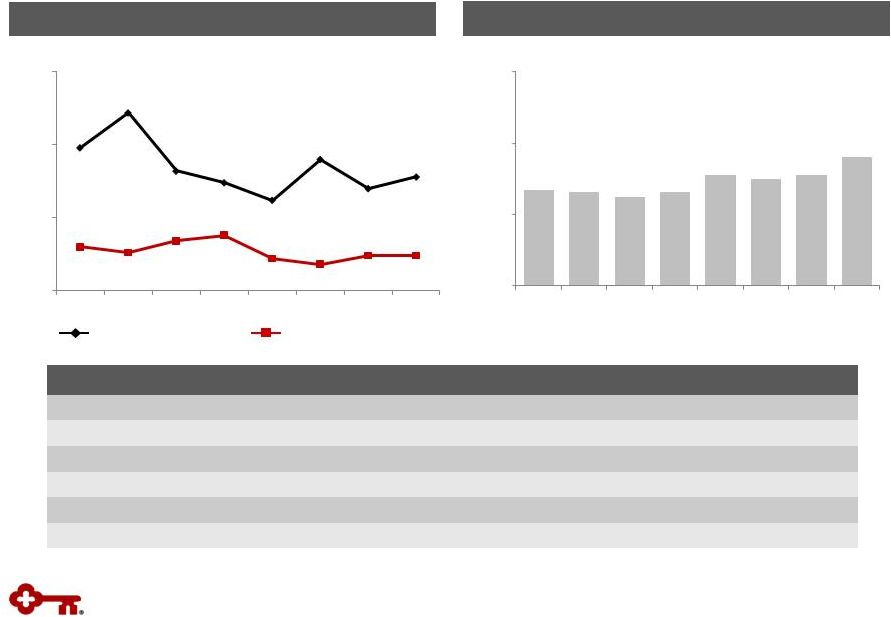
 $0 $20 $40 $60 2Q14 3Q14 4Q14 1Q15 2Q15 3Q15 4Q15 1Q16 $20 $24 $28 $32 2Q14 3Q14 4Q14 1Q15 2Q15 3Q15 4Q15 1Q16 7 Loans $ in billions Average Commercial, Financial & Agricultural Loans Average Commercial, Financial & Agricultural Loans Total Average Loans Total Average Loans Exit Portfolios Home Equity & Other Commercial $ in billions Period-end total loans up 4% in 1Q16 from 1Q15, driven by CF&A loans up 11% Utilization remains relatively stable Average Loans CF&A loans up 12% Highlights Highlights Total average loans up 5% Average total loans up 5% in 1Q16 from 1Q15, driven by CF&A loans up 12% – Broad-based growth across Key’s commercial lines of business – Consumer loan decline related to paydowns in the home equity portfolio and continued run-off in consumer exit portfolios Average balance growth in both Community Bank and Corporate Bank, compared to 1Q15 Period-End Loans |
 Deposit
balances relatively stable from 4Q15, reflecting:
– Growth in certificates of deposit and other time deposits – A decline in seasonal and short-term deposit inflows from commercial clients $25.6 $37.7 $2.3 $6.0 .15% .17% .00% .10% .20% .30% .40% .50% $25 $35 $45 $55 $65 $75 2Q14 3Q14 4Q14 1Q15 2Q15 3Q15 4Q15 1Q16 8 1Q16 Average Deposit Mix 1Q16 Average Deposit Mix Deposit growth of 4% from 1Q15 related to: – Growth in commercial mortgage servicing – Inflows from both commercial and consumer clients – Growth in certificates of deposit and other time deposits Average Deposits (a) Average Deposits (a) (a) Excludes deposits in foreign office Cost of total deposits (a) CDs and other time deposits Savings Noninterest-bearing NOW and MMDA Total average deposits (a) Highlights Highlights Deposits Total average deposits up 4% $ in billions $ in billions Deposit cost remains relatively stable, up 2 bps from both 4Q15 and 1Q15 vs. Prior Year vs. Prior Quarter |
 Net
interest income up $2 MM from 4Q15,
primarily due to higher earning asset balances
and yields $577 $612 2.91% 2.89% 2.00% 2.50% 3.00% 3.50% 4.00% $500 $540 $580 $620 2Q14 3Q14 4Q14 1Q15 2Q15 3Q15 4Q15 1Q16 9 TE = Taxable equivalent Net interest income (TE) NIM (TE) NIM Change (bps): vs. 4Q15 Higher earning asset yields 0.06 Loan fees (0.01) Other (0.03) Total change 0.02 Maintained moderate asset sensitivity – Naturally asset sensitive balance sheet flows: 71% of loans variable rate – High quality investment portfolio with average life of 3.7 years – Flexibility to quickly adjust interest rate risk position Net interest income up $35 MM, or 6%, from 1Q15, reflecting higher earning asset balances and yields Net Interest Income and Margin Net Interest Income & Net Interest Margin Trend (TE) Net Interest Income & Net Interest Margin Trend (TE) Highlights Highlights $ in millions; continuing operations vs. Prior Year vs. Prior Quarter |
 10 Noninterest Income Noninterest Income Noninterest Income $ in millions Up / (Down)
1Q16 vs. 4Q15 vs. 1Q15 Trust and investment services income $ 109 $ 4 $ - Investment banking and debt placement fees 71 (56) 3 Service charges on deposit accounts 65 1 4 Operating lease income and other leasing gains 17 2 (2) Corporate services income 50 (5) 7 Cards and payments income 46 (1) 4 Corporate-owned life insurance 28 (8) (3) Consumer mortgage income 2 - (1) Mortgage servicing fees 12 (3) (1) Net gains (losses) from principal investing - - (29) Other income 31 12 12 Total noninterest income $ 431 $ (54) $ (6) Highlights Highlights Noninterest income down 1% from 1Q15 – Principal investing down $29 MM – Continued momentum in core fee-based businesses: Corporate services income +$7 MM Service charges on deposits +$4 MM Cards and payments income +$4 MM – $12 MM increase in other income related to gains on certain real estate investments Noninterest income down 11% from 4Q15 – Investment banking and debt placement fees down $56 MM, reflecting weaker capital markets activity – Corporate-owned life insurance income down $8 MM (seasonally high in the fourth quarter) – $12 MM increase in other income related to gains on certain real estate investments (a) (a) Other includes corporate-owned life insurance, principal investing, etc. vs. Prior Year vs. Prior Quarter 25% 16% 15% 11% 12% 3% 4% 14% Trust & Investment Services Investment Banking & Debt Placement Deposit Service Charges Cards & Payments Corporate Services Mortgage Servicing Fees Operating Lease Income Other |
 Noninterest expense, excl. merger-related expense
(b) $ in millions Up / (Down) 1Q16 vs. 4Q15 vs. 1Q15 Personnel $ 404 $ (25) $ 15 Net occupancy 61 (3) (4) Computer processing 43 - 5 Business services, professional fees 41 (3) 8 Equipment 21 (1) (1) Operating lease expense 13 - 2 Marketing 12 (5) 4 FDIC assessment 9 1 1 Intangible asset amortization 8 (1) (1) OREO expense, net 1 - (1) Other expense 90 4 6 Total noninterest expense $ 703 $ (33) $ 34 Merger-related expense (a) 24 18 24 Total noninterest expense, excluding merger-related expense (b) $ 679 $ (51) $ 10 11 Noninterest Expense Noninterest Expense Noninterest Expense (a) Merger-related expense detail provided in Appendix, on slide 17 (b) Non-GAAP measure: see Appendix for reconciliation Highlights Highlights Cash efficiency ratio, excluding merger-related expense (b) 1Q16 noninterest expense up 5% from 1Q15 – Increase primarily driven by merger-related expense – Excl. merger-related expense, slight increases across various other line items Expenses down 4% from 4Q15 – Lower personnel expense, including performance-based compensation – Marketing and professional fees lower – Higher merger-related expense partially offset declines $ in millions Merger-related expense (a) 4Q15 1Q16 $703 $736 $24 $679 $6 $730 1Q15 $669 vs. Prior Year vs. Prior Quarter 65% 66% 64% |
 12 Nonperforming Assets Nonperforming Assets Net Charge-offs & Provision for Credit Losses Net Charge-offs & Provision for Credit Losses $ in millions Credit Quality Highlights Highlights Credit quality measures impacted by migration in the oil and gas portfolio, reflecting market conditions Net loan charge-offs remain below targeted range, at 31 basis points of average loans Nonperforming loans increased $289 MM from 4Q15, with 90% of the increase related to oil & gas Allowance for loan and lease losses represented 1.37% of period-end loans; 122% coverage of nonperforming loans Allowance for Loan and Lease Losses Allowance for Loan and Lease Losses $ in millions $ in millions $0 $30 $60 $90 $120 2Q14 3Q14 4Q14 1Q15 2Q15 3Q15 4Q15 1Q16 .00% .20% .40% .60% $28 $46 $35 .20% .31% $600 $700 $800 $900 2Q14 3Q14 4Q14 1Q15 2Q15 3Q15 4Q15 1Q16 0% 50% 100% 150% 200% 250% $794 $826 182% 122% $0 $200 $400 $600 $800 2Q14 3Q14 4Q14 1Q15 2Q15 3Q15 4Q15 1Q16 .00% .40% .80% 1.20% 1.60% 2.00% .75% 1.12% $457 Allowance for loan and lease losses to NPLs Allowance for loan and lease losses NPLs NPLs to period-end loans NPLs held for sale, OREO & other NPAs NCOs Provision for credit losses NCOs to average loans $89 $692 |
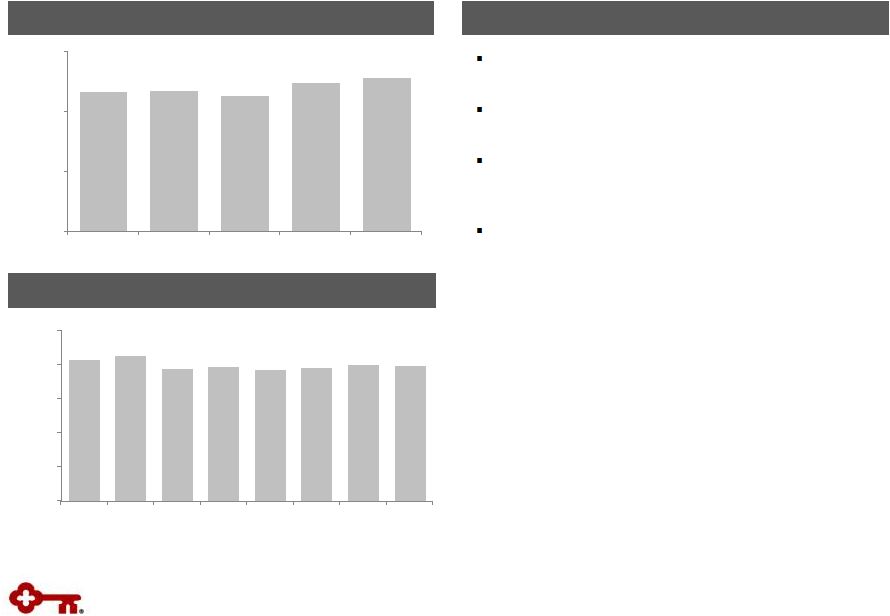 13 Maintained strong capital position Common Equity Tier 1 ratio of 11.11% at 3/31/16 Planned common share dividend increase of 13% in 2Q16 (subject to Board approval) Common share repurchases and an increased dividend included in 2016 CCAR submission Tangible Common Equity to Tangible Assets (a) Tangible Common Equity to Tangible Assets (a) Highlights Highlights (a) Non-GAAP measure: see Appendix for reconciliation (b) 3-31-16 ratio is estimated 10.64% 11.11% 6.00% 8.00% 10.00% 12.00% 1Q15 2Q15 3Q15 4Q15 1Q16 6.00% 7.00% 8.00% 9.00% 10.00% 11.00% 2Q14 3Q14 4Q14 1Q15 2Q15 3Q15 4Q15 1Q16 Common Equity Tier 1 (a), (b) Common Equity Tier 1 (a), (b) Capital 9.92% 9.97% |
 Outlook
and Expectations Average Loans
• Mid-single digit growth vs. FY 2015 Net Interest Income • Up low to mid-single digit percentage without the benefit from higher interest rates • Mid-single digit growth with the benefit of higher interest rates Noninterest Income • Low to mid-single digit growth compared to 2015 Expense • Relatively stable with 2015 Efficiency / Productivity • Positive operating leverage Asset Quality • Net charge-offs to average loans below targeted range of 40 – 60 bps • Allowance, as a percentage of period-end loans, to remain relatively stable with 1Q16
level Capital • Dividend expected to increase to $.085 per common share in 2Q16 (subject to Board approval) • 2016 CCAR submission included common share repurchases and an increased dividend
14 Guidance ranges: relatively stable: +/- 2%; low single-digit: <5%; mid-single digit: 4% - 6% Note: Guidance provided does not include merger-related expense FY 2016: Key Stand-alone FY 2016: Key Stand-alone |
 15 Appendix |
 Progress
on Targets for Success: Key Stand-alone (a)
Continuing operations, unless otherwise noted
(b) Represents period-end consolidated total loans and loans held for sale divided by period-end consolidated total deposits (excluding
deposits in foreign office)
(c) Non-GAAP measure: see slides 25-26 for reconciliation (d) Excludes $24 million and $6 million in merger-related expense for 1Q16 and 4Q15, respectively; detail provided in Appendix, on slide
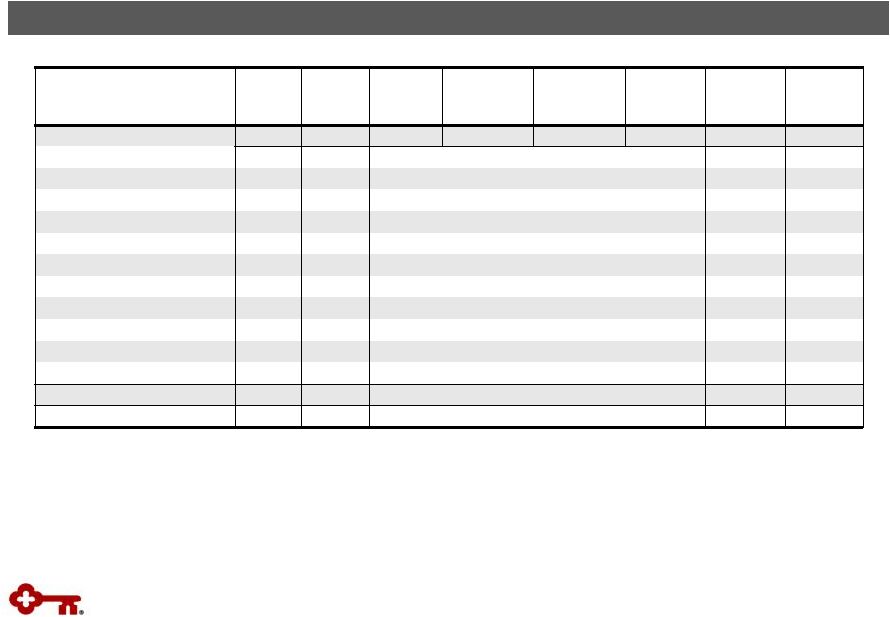
17 16 Balance Sheet Efficiency Balance Sheet Efficiency Moderate Risk Profile Moderate Risk Profile High Quality, Diverse Revenue Streams High Quality, Diverse Revenue Streams Positive Operating Leverage Positive Operating Leverage Financial Returns Financial Returns Metrics (a) Metrics (a) 4Q15 4Q15 1Q16 1Q16 Targets Targets Loan to deposit ratio (b) Loan to deposit ratio (b) NCOs to average loans NCOs to average loans Provision for credit losses
to average loans Provision for credit losses
to average loans Net interest margin Net interest margin Noninterest income to total revenue Noninterest income to total revenue Cash efficiency ratio (c), (d) Cash efficiency ratio (c), (d) 88% 86% .25% .31% 65.8% 64.3% .30% .60% 2.87% 2.89% 44% 41% 90% -100% 40 - 60 bps 3.00% -3.25% <60% >40% .99% .86% 1.00% - 1.25% Return on average assets (c), (d) Return on average assets (c), (d) |
 1Q16 4Q15 Personnel expense (a) $ 16 - Business services and professional fees $ 7 $ 5 Marketing 1 - Other - 1 Total nonpersonnel expense $ 8 $ 6 Total noninterest expense $ 24 $ 6 EPS impact $ (.02) - 17 FNFG Merger-related Expense Expenses related to the acquisition and integration of First Niagara Financial Group
Expenses related to the acquisition and integration of First Niagara Financial
Group Total merger-related expense expected to be approximately $550 MM
Majority of expense anticipated to occur in 2016 and the first half of
2017 $ in millions
Increase / (Decrease)
(a) Personnel expense includes technology development related to systems conversions, as well as fully-dedicated personnel for merger and
integration efforts |
 18 Average Total Investment Securities Average Total Investment Securities Highlights Highlights Average AFS securities Investment Portfolio Portfolio composed primarily of GNMA and GSE- backed MBS and CMOs Continue to position portfolio for regulatory liquidity requirements: – Reinvesting cash flows into High Quality Liquid Assets, including GNMA securities – Average GNMA balances for the quarter were 53% of the total portfolio Securities cash flows of $1.0 billion in both 1Q16 and 4Q15 Average portfolio life at 3/31/16 of 3.7 years, compared to 3.9 years at 12/31/15 Securities to Total Assets (b) Securities to Total Assets (b) (a) Yield is calculated on the basis of amortized cost (b) Includes end-of-period held-to-maturity and available-for-sale securities
Average yield (a) Average HTM securities .00% 1.00% 2.00% 3.00% 4.00% 5.00% $0.0 $5.0 $10.0 $15.0 $20.0 2Q14 3Q14 4Q14 1Q15 2Q15 3Q15 4Q15 1Q16 19% 20% 10% 14% 18% 22% 2Q14 3Q14 4Q14 1Q15 2Q15 3Q15 4Q15 1Q16 2.10% $18.0 $19.0 $ in billions 2.09% |
 Interest
Rate Risk Management Naturally Asset Sensitive Balance Sheet
Naturally Asset Sensitive Balance Sheet
Actively Managing Rate Risk
Actively Managing Rate Risk
• High quality • Fixed rate agency MBS and CMOs • Average maturity: 3.7 years • GNMAs total 53% of total portfolio • Reinvesting cash flows into HQLAs, including GNMAs $13.5 $18 $7.5 $7.5 Size of swap portfolio Modeled asset sensitivity ~2-3% 0% 8% $7.5 Flexibility to Adjust Rate Sensitivity with Swaps Loan Portfolio Variable: 71% Fixed: 29% Deposits (a) Flexibility to adjust rate sensitivity for changes in balance sheet growth/mix as well as interest rate outlook Debt hedges A/LM hedges Investment Portfolio Noninterest- bearing: 36% Interest- bearing, non- time: 56% CDs: 8% • Maintained moderate asset sensitive position of ~2-3% (b) - Assumes 200 basis point increase in short and intermediate- term rates over a 12-month period • Utilize swaps for debt hedging and asset liability management - Fairly even pace of A/LM swap maturities - $2.0B A/LM swaps scheduled to mature by year end 2016 3/31/16 Swaps ($ in B) 3/31/16 Notional Amt. Wtd. Avg. Maturity (Yrs.) Receive Rate Pay Rate A/L Management $ 13.5 2.3 1.0% .4% Debt 7.5 3.5 1.7 .4 $ 21.0 1.3% .4% 1Q16 $19.0 B AFS: $14.2 B HTM: $4.8 B Balance sheet has relatively short duration and is impacted by the short-end of the curve $21.0 B 19 1Q16 1Q16 Note: Loan, deposit and investment portfolio balances reflect quarterly average balances
(a) Excludes deposits in foreign office (b) Preliminary estimate |
 20 Credit Quality Trends Criticized Outstandings (a) to Period-end Total Loans Criticized Outstandings (a) to Period-end Total Loans Delinquencies to Period-end Total Loans Delinquencies to Period-end Total Loans (a) Loan and lease outstandings (b) From continuing operations 30 – 89 days delinquent 90+ days delinquent Metric (b) 1Q16 4Q15 3Q15 2Q15 1Q15 Delinquencies to EOP total loans: 30-89 days .39 % .35 % .45 % .31 % .37 % Delinquencies to EOP total loans: 90+ days .12 .12 .09 .11 .19 NPLs to EOP portfolio loans 1.12 .65 .67 .72 .75 NPAs to EOP portfolio loans + OREO + Other NPAs 1.14 .67 .69 .75 .79 Allowance for loan losses to period-end loans 1.37 1.33 1.31 1.37 1.37 Allowance for loan losses to NPLs 122.2 205.7 197.5 190.0 181.7 Continuing operations Continuing operations .37% .39% .19% .12% .00% .25% .50% .75% 2Q14 3Q14 4Q14 1Q15 2Q15 3Q15 4Q15 1Q16 2.6% 3.6% .0% 2.0% 4.0% 6.0% 2Q14 3Q14 4Q14 1Q15 2Q15 3Q15 4Q15 1Q16 |
 Period- end loans Average loans Net loan charge- offs Net loan charge-offs (b) / average loans (%) Nonperforming loans (c) Ending allowance (d) Allowance / period-end loans (d) (%) Allowance / NPLs (%) 3/31/16 1Q16 1Q16 1Q16 3/31/16 3/31/16 3/31/16 3/31/16 Commercial, financial and agricultural (a) $ 31,976 $ 31,590 $ 23 .29% $ 380
$
477 1.49%
125.53% Commercial real estate: Commercial Mortgage 8,364 8,138 (1) (.05) 16 134 1.60 837.50 Construction 841 1,016 (1) (.40) 12 23 2.73 191.67 Commercial lease financing 3,934 3,957 3 .30 11 43 1.09 390.91 Real estate – residential mortgage 2,234 2,236 - - 59 20 .90 33.90 Home equity 10,149 10,240 7 .27 191 64 .63 33.51 Credit cards 782 784 7 3.59 2 32 4.09 N/M Consumer direct loans 1,579 1,593 5 1.26 1 20 1.27 N/M Consumer indirect loans 579 602 3 2.00 4 13 2.25 325.00 Continuing total (e) $ 60,438 $ 60,156 $ 46 .31% $ 676
$
826 1.37 122.19% Discontinued operations 1,760 1,787 6 1.35 6 24 1.36 400.00 Consolidated total $ 62,198 $ 61,943 $ 52 .34% $ 682
$
850 1.37 124.63% Credit Quality by Portfolio Credit Quality by Portfolio Credit Quality $ in millions 21 (a) 3-31-16 ending loan balance includes $85 million of commercial credit card balances; 3-31-16 average loan balance includes $85
million of assets from commercial credit cards
(b) Net loan charge-off amounts are annualized in calculation (c) 3-31-16 NPL amount excludes $11 million of purchased credit impaired loans
(d) 3-31-16 allowance by portfolio is estimated (e) 3-31-16 ending loan balance includes purchased loans of $109 million, of which $11 million were purchased credit impaired
N/M = Not meaningful |
 Oil &
Gas 22 Longstanding history, expertise and relationships Longstanding history, expertise and relationships Total commitments of $3.1 B, including upstream commitments of $1.6 B Upstream portfolio is primarily secured by proven, developed and producing reserves Spring borrowing base redetermination in process Total Loans Outstanding, 3/31/16 Credit migration reflects recent regulatory guidance, which was applied to the entire portfolio Reserve coverage: 8% of outstanding oil and gas loans at period-end Oil & Gas: 2% Other: 98% Oil & Gas Outstanding Balances, 3/31/16 Oilfield Services Upstream: 57%, $0.7 B Midstream: 33%, $0.4 B Downstream: 10%, $0.1 B $0.1 B Oil & Gas $1.2 B |
 Vintage
(% of Loans) Loan
Balances Average Loan Size ($) Average FICO Average LTV (a) % of Loans LTV>90% 2012 and later 2011 2010 2009 2008 and prior Loans and lines First lien $ 6,042 $ 70,422 771 67 % .6 % 60 % 4 % 2 % 2 % 32 % Second lien 3,912 45,896 768 77 3.5 42 4 3 3 48 Community Bank $ 9,954 58,200 770 71 1.7 53 4 2 3 38 Exit portfolio 195 18,941 728 80 29.1 - - - - 100 Total home equity portfolio $ 10,149 Nonaccrual loans and lines First lien $ 111
$ 63,744
717 73 % 2.7 % 15 % 3 % 3 % 4 % 75 % Second lien 73 47,584 710 80 2.2 7 2 2 4 85 Community Bank $ 184
56,191 714 77 2.5 12 3 2 4 79 Exit portfolio 7 22,005 706 83 20.5 - - - - 100 Total home equity nonaccruals $ 191
First quarter net charge-offs (NCOs)
Total home equity portfolio
$
7 % of average loans
.27 % (a) Average LTVs are at origination; current average LTVs for Community Bank total home equity loans and lines is approximately 66%, which
compares to 67% at the end of the fourth quarter of 2015
Home Equity Portfolio –
3/31/16 Home Equity Portfolio – 3/31/16 $ in millions, except average loan size Home Equity Portfolio Highlights Highlights High quality portfolio Community bank loans and lines: 98% of total portfolio; branch- originated – 61% first lien position – Average FICO score of 770 – Average LTV at origination: 71% $4.0 billion of the total portfolio are fixed rate loans that require principal and interest payments; $6.1 billion are lines $1.0 billion in lines outstanding (10% of the total portfolio) come to end of draw period in the next three years – Proactive communication and client outreach initiated near end of draw period 23 |
 Balance
Outstanding Change
Net Loan Charge-offs
Balance on Nonperforming Status 3-31-16 12-31-15 3-31-16 vs. 12-31-15 1Q16 4Q15 3-31-16 12-31-15 Residential properties – homebuilder - $ 6 $ (6) - - $ 3 $ 8 Marine and RV floor plan - 1 (1) - - - - Commercial lease financing (a) $ 743 765 (22) $ 1 - - 1 Total commercial loans 743 772 (29) 1 - 3 9 Home equity – Other 195 208 (13) 1 $ 2 7 8 Marine 544 583 (39) 2 1 4 6 RV and other consumer 39 41 (2) - - - - Total consumer loans 778 832 (54) 3 3 11 14 Total exit loans in loan portfolio $ 1,521 $ 1,604 $ (83) $ 4 $ 3 $ 14 $ 23 Discontinued operations – education lending business (not included in exit loans above) $ 1,760 $ 1,828 $ (68) $ 6 $ 7 $ 6 $ 7 $1,999 $1,567 $0 $1,000 $2,000 $3,000 $4,000 2Q14 3Q14 4Q14 1Q15 2Q15 3Q15 4Q15 1Q16 $ in millions; average balances (a) Includes (1) the business aviation, commercial vehicle, office products, construction and industrial leases; (2) Canadian lease
financing portfolios;
(3) European lease financing portfolios; and (4) all remaining balances related to
lease in, lease out; sale in, lease out; service contract leases; and
qualified technological equipment leases.
$ in millions Exit Loan Portfolio Exit Loan Portfolio Exit Loan Portfolio 24 |
 Three
months ended 3-31-16
12-31-15 9-30-15 6-30-15 3-31-15 Tangible common equity to tangible assets at period end Key shareholders' equity (GAAP) 11,066 $ 10,746 $ 10,705 $ 10,590 $ 10,603 $ Less: Intangible assets (a) 1,077 1,080 1,084 1,085 1,088 Preferred Stock, Series A (b) 281 281 281 281 281 Tangible common equity (non-GAAP) 9,708 $ 9,385 $ 9,340 $ 9,224 $ 9,234 $ Total assets (GAAP) 98,402 $ 95,133 $ 95,422 $ 94,606 $ 94,206 $ Less: Intangible assets (a) 1,077 1,080 1,084 1,085 1,088 Tangible common equity to tangible assets ratio (non-GAAP) 97,325 $ 94,053 $ 94,338 $ 93,521 $ 93,118 $ Tangible common equity to tangible assets ratio (non-GAAP) 9.97% 9.98% 9.90% 9.86% 9.92% Common Equity Tier 1 at period end Key shareholders' equity (GAAP) 11,066 $ 10,746 $ 10,705 $ 10,590 $ 10,603 $ Less: Preferred Stock, Series A (b) 281 281 281 281 281 Common Equity Tier 1 capital before adjustments and deductions 10,785 10,465 10,424 10,309 10,322 Less: Goodwill, net of deferred taxes 1,034 1,034 1,036 1,034 1,036 Intangible assets, net of deferred taxes 35 26 29 33 36 Deferred tax assets 1 1 1 1 1 Net unrealized gains (losses) on available-for-sale securities, net of deferred taxes 70 (58) 54 - - Accumulated gains (losses) on cash flow hedges, net of deferred taxes 47 (20) 21 (20) 8 Amounts in accumulated other comprehensive income (loss) attributed to pension and postretirement benefit costs, net of deferred taxes (365) (365) (385) (361) (364) Total Common Equity Tier 1 capital (c) 9,963 $ 9,847 $ 9,668 $ 9,622 $ 9,569 $ Net risk-weighted assets (regulatory) (c) 89,712 $ 89,980 $ 92,307 $ 89,851 $ 89,967 $ Common Equity Tier 1 ratio (non-GAAP) (c) 11.11% 10.94% 10.47% 10.71% 10.64% Noninterest expense excluding merger-related expense Noninterest expense (GAAP) 703 $ 736 $ 724 $ 711 $ 669 $ Less: Merger-related expense 24 6 - - - Noninterest expense excluding merger-related expense (non-GAAP) 679 $ 730 $ 724 $ 711 $ 669 $ Earnings per common share (EPS) excluding merger-related expense EPS from continuing operations attributable to Key common shareholders – assuming dilution .22 $ .27 $ .26 $ .27 $ .26 $ Add: EPS impact of merger-related expense .02 - - - - EPS from continuing operations attributable to Key common shareholders excluding merger-related expense (non-GAAP) .24 $ .27 $ .26 $ .27 $ .26 $ GAAP to Non-GAAP Reconciliation 25 $ in millions (a) Three months ended 3/31/16, 12/31/15, 9/30/15, 6/30/15, and 3/31/15, exclude $40 million, $45 million, $50 million, $55 million, and $61
million, respectively, of period-end purchased credit card
receivables (b)
Net of capital surplus
(c) 3-31-16 amount is estimated |
 GAAP to
Non-GAAP Reconciliation (continued)
(a) Three months ended 3/31/16, 12/31/15, 9/30/15, 6/30/15, and 3/31/15, exclude $42 million, $47 million, $52 million, $58 million, and $64 million, respectively, of
average purchased credit card receivables
26 Three months ended 3-31-16 12-31-15 9-30-15 6-30-15 3-31-15 Pre-provision net revenue excluding merger-related expense Net interest income (GAAP) 604 $ 602 $ 591 $ 584 $ 571 $ Plus: Taxable-equivalent adjustment 8 8 7 6 6 Noninterest income 431 485 470 488 437 Less: Noninterest expense excluding merger-related expense (non-GAAP)
679 730 724 711 669 Pre-provision net revenue from continuing operations excluding merger-related expense (non-GAAP) 364 $ 365 $ 344 $ 368 $ 345 $ Return on average assets excluding merger-related expense Net income (loss) from continuing operations attributable to Key (GAAP) 187 $ 230 $ 222 $ 235 $ 228 $ Less: Merger-related expense, after tax (15) (4) - - - Net income (loss) from continuing operations attributable to Key excluding merger-related expense, after tax (non-GAAP) 202 $ 234 $ 222 $ 235 $ 228 $ Average total assets from continuing operations 94,477 $ 94,117 $ 92,649 $ 91,658 $ 89,627 $ Return on average assets excluding merger-related expense (non-GAAP) .86% .99% .95% 1.03% 1.03% Cash efficiency ratio Noninterest expense (GAAP) 703 $ 736 $ 724 $ 711 $ 669 $ Less: Intangible asset amortization 8 9 9 9 9 Adjusted noninterest expense (non-GAAP) 695 $ 727 $ 715 $ 702 $ 660 $ Less: Merger-related expense 24 6 - - - Adjusted noninterest expense excluding merger-related expense (non-GAAP)
671 $ 721 $ 715 $ 702 $ 660 $ Net interest income (GAAP) 604 602 591 584 571 Plus: Taxable-equivalent adjustment 8 8 7 7 6 Noninterest income 431 485 470 488 437 Total taxable-equivalent revenue (non-GAAP) 1,043 $ 1,095 $ 1,068 $ 1,079 $ 1,014 $ Cash efficiency ratio (non-GAAP) 66.6% 66.4% 66.9% 65.1% 65.1% Cash efficiency ratio excluding merger-related expense (non-GAAP) 64.3% 65.8% 66.9% 65.1% 65.1% $ in millions |
 KeyCorp & Subsidiaries $ in billions Quarter ended March 31, 2016 Common Equity Tier 1 under current RCR $ 10.0
Adjustments from current RCR to the fully phased-in RCR: Deferred tax assets and other intangible assets (b) - Common Equity Tier 1 anticipated under the fully phased-in RCR (c) $ 9.9
Net risk-weighted assets under current RCR
$
89.7 Adjustments from
current RCR to the fully phased-in RCR:
Mortgage servicing assets (d) .5 Volcker Funds (.3) All other assets - Total risk-weighted assets anticipated under the fully phased-in RCR (c) $ 89.9
Common Equity Tier 1 under the fully phased-in RCR
11.05 % (a) Common Equity Tier 1 capital is a non-generally accepted accounting principle (GAAP) financial measure that is used by investors, analysts
and bank regulatory agencies to assess the capital position of financial
services companies. Management reviews Common Equity Tier 1 along with
other measures of capital as part of its financial analyses
(b) Includes the deferred tax asset subject to future taxable income for realization, primarily tax credit carryforwards, as well
as intangible assets (other than goodwill and mortgage servicing assets) subject to the transition provisions of the final rule
(c) The anticipated amount of regulatory capital and risk-weighted assets is based upon the federal banking agencies’ Regulatory
Capital Rules (as
fully phased-in on January 1, 2019); Key is subject to the Regulatory Capital
Rules under the “standardized approach” (d)
Item is included in the 10%/15% exceptions bucket calculation and is risk-weighted
at 250% Table may not foot due to rounding
27 Common Equity Tier 1 Under the Regulatory Capital Rules (RCR) (estimated) (a) |