Attached files
| file | filename |
|---|---|
| EX-21.1 - EX-21.1 - TAILORED BRANDS INC | a2227942zex-21_1.htm |
| EX-32.1 - EX-32.1 - TAILORED BRANDS INC | a2227942zex-32_1.htm |
| EX-31.1 - EX-31.1 - TAILORED BRANDS INC | a2227942zex-31_1.htm |
| EX-23.1 - EX-23.1 - TAILORED BRANDS INC | a2227942zex-23_1.htm |
| EX-32.2 - EX-32.2 - TAILORED BRANDS INC | a2227942zex-32_2.htm |
| EX-31.2 - EX-31.2 - TAILORED BRANDS INC | a2227942zex-31_2.htm |
Use these links to rapidly review the document
TABLE OF CONTENTS
UNITED STATES
SECURITIES AND EXCHANGE COMMISSION
Washington, D.C. 20549
FORM 10-K
| (Mark One) | ||
ý |
ANNUAL REPORT PURSUANT TO SECTION 13 OR 15(d) OF THE SECURITIES EXCHANGE ACT OF 1934 |
|
For the fiscal year ended January 30, 2016 |
||
or |
||
o |
TRANSITION REPORT PURSUANT TO SECTION 13 OR 15(d) OF THE SECURITIES EXCHANGE ACT OF 1934 |
|
For the transition period from to |
||
Commission file number 1-16097
TAILORED BRANDS, INC.
(Exact Name of Registrant as Specified in its Charter)
| Texas (State or Other Jurisdiction of Incorporation or Organization) |
47-4908760 (IRS Employer Identification Number) |
|
6380 Rogerdale Road Houston, Texas (Address of Principal Executive Offices) |
77072-1624 (Zip Code) |
(281) 776-7000
(Registrant's telephone number, including area code)
Securities registered pursuant to Section 12(b) of the Act:
| Title of each class | Name of each exchange on which registered | |
|---|---|---|
| Common Stock, par value $.01 per share | New York Stock Exchange |
Securities
registered pursuant to Section 12(g) of the Act:
None
Indicate by check mark if the registrant is a well-known seasoned issuer, as defined in Rule 405 of the Securities Act. Yes ý. No o.
Indicate by check mark if the registrant is not required to file reports pursuant to Section 13 or Section 15(d) of the Act. Yes o. No ý.
Indicate by check mark whether the registrant (1) has filed all reports required to be filed by Section 13 or 15(d) of the Securities Exchange Act of 1934 during the preceding 12 months (or for such shorter period that the Registrant was required to file such reports), and (2) has been subject to such filing requirements for the past 90 days. Yes ý. No o.
Indicate by check mark whether the registrant has submitted electronically and posted on its corporate Website, if any, every Interactive Data File required to be submitted and posted pursuant to Rule 405 of Regulation S-T during the preceding 12 months (or for such shorter period that the registrant was required to submit and post such files). Yes ý. No o.
Indicate by check mark if disclosure of delinquent filers pursuant to Item 405 of Regulation S-K is not contained herein, and will not be contained, to the best of the registrant's knowledge, in definitive proxy or information statements incorporated by reference in Part III of this Form 10-K or any amendment to this Form 10-K. o
Indicate by check mark whether the registrant is a large accelerated filer, an accelerated filer, a non-accelerated filer or a smaller reporting company. See the definitions of "large accelerated filer", "accelerated filer" and "smaller reporting company" in Rule 12b-2 of the Exchange Act. (Check one):
| Large accelerated filer ý | Accelerated filer o | Non-accelerated filer o (Do not check if a smaller reporting company) |
Smaller reporting company o |
Indicate by check mark whether the registrant is a shell company (as defined in Rule 12b-2 of the Exchange Act). Yes o. No ý.
The aggregate market value of the voting stock held by non-affiliates of the registrant, based on the closing price of shares of common stock on the New York Stock Exchange on August 1, 2015, was approximately $2,874.2 million.
The number of shares of common stock of the registrant outstanding on March 18, 2016 was 48,449,454.
DOCUMENTS INCORPORATED BY REFERENCE
| Document | Incorporated as to | |
|---|---|---|
| Notice and Proxy Statement for the Annual Meeting of Shareholders scheduled to be held June 16, 2016 |
Part III: Items 10, 11, 12, 13 and 14 |
Forward-Looking and Cautionary Statements
Certain statements made in this Annual Report on Form 10-K and in other public filings and press releases by the Company (as defined below) contain "forward-looking" information (as defined in the Private Securities Litigation Reform Act of 1995) that involves risk and uncertainty. Forward-looking statements reflect our current views regarding certain events that could affect our financial condition or results of operations and may include, but are not limited to, references to, future sales, comparable sales, margins, costs, number and costs of store openings, closings and expansions, earnings, profitability, capital expenditures, potential acquisitions, synergies from acquisitions, demand for clothing, market trends in the retail and corporate apparel clothing business, currency fluctuations, inflation and various economic and business trends. Forward-looking statements may be made by management orally or in writing, including, but not limited to; in Management's Discussion and Analysis of Financial Condition and Results of Operations included in this Annual Report on Form 10-K and other sections of our filings with the Securities and Exchange Commission under the Securities Exchange Act of 1934, as amended and the Securities Act of 1933, as amended.
Forward-looking statements are not guarantees of future performance and a variety of factors could cause actual results to differ materially from the anticipated or expected results expressed in or suggested by these forward-looking statements. Factors that might cause or contribute to such differences include, but are not limited to: actions by governmental entities; domestic and international macro-economic conditions; inflation or deflation; success, or lack thereof, in executing our internal strategic and operating plans including new store and new market expansion plans and cost reduction initiatives; store rationalization plans; profit improvement plans; revenue enhancement strategies; the impact of opening tuxedo shops within Macy's stores; changes in demand for clothing; market trends in the retail business; customer confidence and spending patterns; changes in traffic trends in our stores; customer acceptance of our merchandise strategies; performance issues with key suppliers; disruptions in our supply chain; severe weather; foreign currency fluctuations; government export and import policies; advertising or marketing activities of competitors; and legal proceedings.
Forward-looking statements are based upon management's current beliefs or expectations and are inherently subject to significant business, economic and competitive uncertainties and contingencies and third party approvals, many of which are beyond our control. Please refer to "Risk Factors" contained in Part I of this Annual Report on Form 10-K for a more complete discussion of these and other factors that might affect our performance and financial results. Forward-looking statements are intended to convey the Company's expectations about the future, and speak only as of the date they are made. We undertake no obligation to publicly update or revise forward-looking statements that may be made from time to time, whether as a result of new information, future developments or otherwise, unless required to do so by law.
All written or oral forward-looking statements that are made by or attributable to us are expressly qualified in their entirety by this cautionary notice.
2
General
Effective January 31, 2016, Tailored Brands, Inc., a Texas corporation ("Tailored Brands" or the "Company"), became the successor reporting company to The Men's Wearhouse, Inc. ("Men's Wearhouse") pursuant to a holding company reorganization (the "Reorganization"). Upon completion of the Reorganization, each issued and outstanding share of common stock of Men's Wearhouse was automatically converted into one share of common stock of Tailored Brands, having the same designations, preferences, limitations, and relative rights and corresponding obligations as the shares of common stock of Men's Wearhouse. Furthermore, Tailored Brands replaced Men's Wearhouse as the publicly held corporation and its common stock trades on the New York Stock Exchange ("NYSE") under the trading symbol "TLRD". We believe that the holding company structure will allow us to support, nurture and augment our family of brands as we further leverage our shared services platform.
Unless the context otherwise requires, references in this report to "Company", "we", "us" and "our" for periods prior to January 31, 2016, refer to Men's Wearhouse which was the parent company and the registrant prior to the Reorganization, and, for periods after the Reorganization, to Tailored Brands which is the new parent holding company, in each case including its consolidated subsidiaries. References herein to years are to the Company's 52-week or 53-week fiscal year, which ends on the Saturday nearest January 31 in the following calendar year. The periods presented in these financial statements are the fiscal years ended January 30, 2016 ("fiscal 2015"), January 31, 2015 ("fiscal 2014"), and February 1, 2014 ("fiscal 2013"). Each of these periods had 52 weeks.
Our Brands and Products
We are the largest specialty retailer of men's suits and the largest provider of tuxedo and suit rental product (collectively, "rental product") in the United States ("U.S.") and Canada. At January 30, 2016, we operated a total of 1,724 retail stores including tuxedo shops within Macy's department stores, with 1,600 stores in the U.S. and Puerto Rico as well as 124 stores in Canada. Our U.S. retail stores are operated under Men's Wearhouse, Men's Wearhouse and Tux, Jos. A. Bank, Joseph Abboud and K&G brand names and are operated in 50 states, the District of Columbia and Puerto Rico. Our Canadian stores are operated under the Moores brand name and operate in ten Canadian provinces. In addition, at January 30, 2016, we operated 35 retail dry cleaning, laundry and heirlooming facilities through MW Cleaners in Texas. These operations comprise our retail segment.
On June 18, 2014, the Company acquired Jos. A. Bank Clothiers, Inc. ("Jos. A. Bank"), a men's specialty apparel retailer with 624 retail stores (excluding 15 franchise stores) across the U.S., for total consideration of approximately $1.8 billion. On August 6, 2013, we acquired JA Holding, Inc. ("JA Holding"), the parent company of the American clothing brand Joseph Abboud and a U.S. tailored clothing factory, for $94.9 million in cash consideration. For additional information, refer to Note 2, "Acquisitions", to our consolidated financial statements included in this Annual Report on Form 10-K.
Additionally, we operate two corporate apparel providers. Our UK-based holding company operates the largest provider of corporate apparel in the United Kingdom ("UK") under the Dimensions, Alexandra and Yaffy brands. In the U.S. we provide corporate apparel under the Twin Hill brand name. These operations provide corporate clothing uniforms and workwear to workforces through multiple channels including managed corporate accounts, catalogs and the internet. We initially acquired 86% of the UK-based holding company in 2010. In 2014, we purchased the remaining 14% non-controlling interest from previous shareholders of Dimensions for total consideration of approximately $6.7 million. These operations comprise our corporate apparel segment.
3
For information on store closings and openings, see "Item 6. Selected Financial Data" in this Annual Report on Form 10-K. Financial information concerning business segments and geographic area is contained in "Item 7. Management's Discussion and Analysis of Financial Condition and Results of Operations" and under Note 17 to our consolidated financial statements both included in this Annual Report on Form 10-K.
Retail Segment
Overview
In our retail segment, we offer our products and services primarily through our four retail brands—Men's Wearhouse/Men's Wearhouse and Tux, Jos. A. Bank, Moores and K&G—and the internet at www.menswearhouse.com, www.josbank.com, and www.josephabboud.com. Our stores are located throughout the U.S., Puerto Rico, and Canada. Men's Wearhouse, Moores and K&G each operate as a house of brands carrying a wide selection of exclusive and non-exclusive merchandise brands. Jos. A. Bank is a branded house whose merchandise is sold substantially under the exclusive Jos. A. Bank label. MW Cleaners is also included in the retail segment as these operations have not had a significant effect on our revenues or expenses. Also, as a result of our acquisition of JA Holding, we operate a factory located in New Bedford, Massachusetts that manufactures quality U.S. made tailored clothing under the Joseph Abboud label including designer suits, tuxedos, sport coats and slacks which we sell in our Men's Wearhouse stores as well as our Joseph Abboud flagship store.
Men's Wearhouse/Men's Wearhouse and Tux
The Men's Wearhouse targets the male consumer (25 to 55 years old) by providing a superior level of customer service and offering a broad selection of exclusive and non-exclusive merchandise brands at regular and sale prices we believe are competitive with specialty and traditional department stores. Our merchandise includes suits, suit separates, sport coats, slacks, formalwear, business casual, sportswear, outerwear, dress shirts, shoes and accessories in classic, modern and slim fits and in a wide range of sizes including a selection of "Big and Tall" product.
Although basic styles are emphasized, each season's merchandise reflects current fit, fabric and color trends. The inventory mix at our Men's Wearhouse stores includes business, business casual, casual and formal merchandise designed to meet the demand of our customers. The broad merchandise selection creates increased sales opportunities by permitting a customer to purchase substantially all of his wardrobe and accessory requirements, including shoes, at our retail apparel stores. Also, at Men's Wearhouse stores, we offer our customers the ability to purchase a custom-made Joseph Abboud suit which can be produced in approximately three weeks and is unique to each customer's specifications. Based on our experience, we believe that the depth of selection offered provides us with an advantage over most of our competitors.
We also offer a full selection of rental product. We believe our rental product broadens our customer base by drawing first-time and younger customers into our stores and accordingly, our offering includes an expanded merchandise assortment including dress and casual apparel targeted toward the younger customer.
On June 10, 2015, we entered into a 10-year agreement with Macy's, Inc. to operate men's tuxedo rental shops inside 300 Macy's department stores. As of January 30, 2016, we operated 12 tuxedo shops within Macy's stores under the name "The Tuxedo Shop @ Macy's." We have refined our Tuxedo Shop @ Macy's rollout schedule and now plan to open 166 stores in 2016 with the balance of 122 stores to be opened in 2017. In addition, we will collaborate with Macy's to develop an online tuxedo rental shop. Throughout this Annual Report on Form 10-K, the term "shops within Macy's stores" is used to describe our business operations with Macy's.
4
At January 30, 2016, we operated 713 Men's Wearhouse retail apparel stores in 50 states, the District of Columbia and Puerto Rico. These stores are referred to as "Men's Wearhouse stores" or "full line stores" that offer a full selection of retail merchandise and rental product. Men's Wearhouse stores are primarily located in regional strip and specialty retail shopping centers or in freestanding buildings as we believe that men prefer direct and easy store access that enables our customers to park near the entrance of the store.
At January 30, 2016, we also operated another 160 stores in 32 states branded as Men's Wearhouse and Tux. These stores are referred to as "rental stores" and offer a full selection of rental product and a limited selection of retail merchandise and are located primarily in regional malls and lifestyle centers. During fiscal 2015, we closed 50 Men's Wearhouse and Tux stores as we continued to experience a consumer driven shifting of rental revenues to our full line stores located in close proximity to the rental stores. Also, many of our Men's Wearhouse and Tux stores are in the same retail centers in which we plan to operate our shops within Macy's stores. Therefore, as a result of both the shifting of rental revenues to our full line stores and our agreement with Macy's, we expect to close between 100 and 110 Men's Wearhouse and Tux stores in fiscal 2016.
Jos. A. Bank
Jos. A. Bank targets the male consumer (25 to 55 years old) emphasizing high quality tailored and business casual clothing and accessories, substantially all of which is sold under our exclusive Jos. A. Bank label. Jos. A. Bank merchandise consists of suits, suit separates, sport coats, slacks, formalwear, business casual, sportswear, outerwear, dress shirts, shoes and accessories in primarily traditional styles and in a wide range of sizes including a selection of "Big and Tall" product. Our merchandising strategy is focused on classic styling with attention to detail in quality materials and workmanship. We also offer rental product at all of our Jos. A. Bank stores. We believe our rental product provides the opportunity to broaden our customer base by drawing first-time and younger customers into our stores.
At January 30, 2016, we operated 625 Jos. A. Bank retail apparel stores (including 49 factory stores) in 43 states and the District of Columbia. Jos. A. Bank stores are primarily located in fashion-oriented, specialty retail centers. In addition, as of January 30, 2016, there are 14 franchise stores. In March 2016, we announced a store rationalization program, which identified approximately 80 to 90 Jos. A. Bank full line and 49 Jos. A. Bank factory stores to be closed in fiscal 2016. See "Business Strategy" for additional information on the performance of our Jos. A. Bank brand in 2015 and strategic initiatives for 2016 and beyond.
Moores
Moores targets the male consumer (25 to 55 years old) by providing a superior level of customer service and offering a broad selection of exclusive and non-exclusive merchandise brands at regular and sale prices that we believe are competitive with traditional Canadian specialty and department stores. Moores' merchandise consists of suits, suit separates, sport coats, slacks, formalwear, business casual, sportswear, outerwear, dress shirts, shoes and accessories in classic, modern and slim fits and in a wide range of sizes including a selection of "Big and Tall" product. Similar to our Men's Wearhouse stores, we offer our customers the ability to purchase a custom-made Joseph Abboud suit which can be produced in approximately three weeks and is unique to each customer's specifications.
We also offer rental product at all of our Moores stores which we believe broadens our customer base by drawing first-time and younger customers into our stores. To further accommodate these younger rental customers, we also offer an expanded merchandise assortment including dress and casual apparel targeted toward a younger customer.
At January 30, 2016, we operated 124 retail apparel stores in ten Canadian provinces. Moores stores are primarily located in regional strip and specialty retail shopping centers.
5
K&G
K&G stores offer a more value-oriented superstore approach that we believe appeals to the more price-sensitive customer in the apparel market. K&G offers first-quality, current-season apparel and accessories comparable in quality to that of traditional department stores, at prices we believe are typically up to 60% below the regular prices charged by such stores. K&G's merchandising strategy emphasizes broad assortments across all major categories of both men's and women's career apparel in a wide range of sizes including "Big and Tall" and "Women's plus sizes" as well as tailored clothing, dress furnishings, sportswear, accessories and shoes and children's apparel. This merchandise selection, which includes exclusive and non-exclusive merchandise brands, positions K&G to attract a wide range of customers in each of its markets.
At January 30, 2016, we operated 89 K&G stores in 27 states, 82 of which offer women's career apparel, sportswear, accessories and shoes and children's apparel. K&G stores are "destination" stores located primarily in second generation strip shopping centers that are easily accessible from major highways and thoroughfares.
Business Strategy
Our near-term business strategy includes:
- •
- reengineering the Jos. A. Bank brand to a long-term, sustainable profit model;
- •
- enhancing our omni-channel capabilities;
- •
- rationalizing our corporate expense structure;
- •
- rationalizing our store fleet;
- •
- expanding our portfolio of exclusive brands; and
- •
- broadening the reach of our rental product business.
Reengineering the Jos. A. Bank Brand to a Long-Term, Sustainable Profit Model
The underlying rationale of our acquisition of Jos. A. Bank on June 18, 2014 was our desire to increase our market share and capture operational efficiencies. The overlap between the Jos. A. Bank customer base and the Men's Wearhouse customer base is minimal and as a result, we believed and still believe that Jos. A. Bank would be complementary and incremental to our existing portfolio of brands.
Upon closing the acquisition, we focused on (a) integrating the people, processes and systems, including point-of-sale, merchandising, and back office, (b) realizing significant cost synergies, (c) introducing new, updated and expanded assortments in the Jos. A. Bank stores, (d) making changes to the Jos. A. Bank promotional and brand building strategies, and (e) identifying and implementing new revenue growth initiatives, including the expansion of rental product into all Jos. A. Bank stores.
While we have had success in many of these initiatives, we have been challenged in retaining and growing revenue at Jos. A. Bank. After we completed the integration, we were able to develop a better understanding of the Jos. A. Bank business and promotional model. As our understanding of the Jos. A. Bank business grew, we concluded that the historical promotional pricing model at Jos. A. Bank had been delivering diminishing returns over time, and we realized that attaining satisfactory profitable revenue synergies was going to require eliminating the most excessive promotional offers.
During the latter half of 2015, the effectiveness of the existing Jos. A. Bank promotional model began to deteriorate quicker than we anticipated. As a result, we made the decision to accelerate the transition away from the harmful promotional cadence by removing the most excessive offers (the Buy-One-Get-Three or more Free events), and began seeking sustainable volume and margin growth.
6
While we expected some top-line volatility as we changed the promotional model, we did not anticipate that the impact on top-line sales from the traffic decline would occur to the degree it did. As a result of the steep decline in Jos. A. Bank's sales and the significant decline in our market capitalization, we recorded $1.24 billion of goodwill and intangible asset impairment charges related to Jos. A. Bank in fiscal 2015. We remain confident that Jos. A. Bank offers a longer-term opportunity to profitably grow market share in the menswear business and the Jos. A. Bank brand is a key part of our overall business strategy.
Despite these results, we continue to believe that transitioning away from the unsustainable promotional strategy we inherited from Jos. A. Bank and the introduction of our new promotional strategy will provide a foundation for long-term profitability at the Jos. A. Bank brand. We have introduced new promotional offers that do not require excessive quantity purchases and are better aligned with how our customers have told us they prefer to shop. Our customer research indicates that while our existing customers appreciate our quality and value, many dislike being forced to buy in quantity and many of our prospective Jos. A. Bank customers found our promotional offers confusing and caused them to question the quality of our products. We launched new branding messaging that speaks to a quality promise and introduced a new 1905 collection targeting a younger customer. In addition, we introduced a loyalty program that rewards our customers and encourages more frequent purchases. Along with the changes to our marketing strategies, we introduced new selling techniques and a new store compensation program that aligned incentives with the improved selling behaviors.
As we focus on reengineering the Jos. A. Bank brand to a long-term sustainable profit model, we announced additional changes in 2016 as described below:
- •
- we are realigning our organization to support a greater focus on brand management;
- •
- we are enhancing our data sciences team and continuing to invest in customer research to identify additional opportunities to
strengthen and grow the Jos. A. Bank brand;
- •
- we are redesigning our website and refining our marketing strategy to attract new customers and provide existing customers with more
reasons to shop at Jos. A. Bank; and
- •
- we are launching a new Jos. A. Bank premium collection brand, called Reserve, designed by Joseph Abboud.
Enhancing Our Omni-channel Capabilities
Our future growth plans also include the integration of digital technologies to provide a sales experience that combines the advantages of our physical store with an information rich online shopping experience through our website and mobile applications. For example, at Men's Wearhouse and Jos. A. Bank stores, if a customer wants to purchase an item that is not available at the store our clothing consultants can order it through our websites to fulfill the customer's purchasing needs. In addition, during 2015, we launched our ship from store initiative which further enhanced our customer's online shopping experience. Also, through our websites we are able to offer international shipping to over 100 countries. We plan to continue to make investments in technologies, business processes and personnel intended to deepen our customer relationships and increase our share of their closet.
Rationalizing Our Corporate Expense Structure
In March 2016, we announced an extensive profit improvement program that we believe will reduce our expenses by approximately $50 million in fiscal 2016. This program includes reduced distribution costs, cost reductions in our organizational structure, payroll and employee benefit reductions and savings in occupancy and goods-not-for-resale. We estimate the cash costs to complete the profit improvement program and store rationalization program, described below, to be between $45 and $60 million for 2016.
7
Rationalizing Our Store Fleet
In March 2016, we announced a store rationalization program in which we plan to close around approximately 250 stores during fiscal 2016. The store closures fall into three categories. First, we expect to close around 80 to 90 full line Jos. A. Bank stores, which we believe have limited potential for meaningful profit improvement. Second, we will close all Jos. A. Bank (49) and Men's Wearhouse (9) outlet stores. We have determined that outlet stores, which collectively were not profitable, are not sufficiently differentiated enough from our core offerings and have not resonated with our customers. Lastly, we plan to close between 100 and 110 MW Tux stores. These closings are a continuation of our strategy of migrating rental revenue to full line stores and reflective of our rollout of shops within Macy's stores. We believe that this store rationalization program is important to our long-term profitability as it will eliminate underperforming stores and re-balance the store fleet and cost structure.
Expanding Our Portfolio of Exclusive Brands
We believe that expanding the number of exclusive brands that we carry will increase our margins and profitability. We continue to evaluate the acquisition of brands and trademarks, as well as the development of brands in-house. During fiscal 2013, we acquired JA Holding, the parent company of the American clothing brand Joseph Abboud and a U.S. tailored clothing factory. We believe this transaction accelerated our strategy of offering exclusive brands with broad appeal at attractive prices. In addition, we have a consulting agreement with Joseph Abboud pursuant to which he was named our Chief Creative Director and engaged to create exclusive brands and products for our customers. We launched a Joseph Abboud website in late 2014 and opened a Joseph Abboud flagship store in New York City in 2015. In 2015, we launched an exclusive designer men's clothing line through a partnership with Kenneth Cole, under the "Awearness Kenneth Cole" label. The collection includes ties, dress shirts, suits, sport coats and dress pants in slim fits.
Broadening the Reach of Our Rental Product Business
We plan to broaden the reach of our rental product business primarily through the opening of the shops within Macy's stores, growing the rental product business at Jos. A. Bank stores and through the use of our website for rentals. We believe that our tuxedo marketing initiatives, including our shops within Macy's stores and our David's Bridal and TheKnot.com relationships, rental offerings, online website enhancements and continued emphasis on customer service are key aspects of our rental product business strategy.
Customer Service and Marketing
Men's Wearhouse, Jos. A. Bank and Moores sales personnel are trained as consultants to provide customers with assistance and advice on their apparel needs, including product style, color coordination, fabric choice and garment fit. Wardrobe consultants are encouraged to offer guidance to the customer at each stage of the decision-making process, making every effort to earn the customer's confidence and to create a professional relationship that will continue beyond the initial visit.
K&G stores are designed to allow customers to select and purchase apparel by themselves. For example, each merchandise category is clearly marked and organized by size, and suits are specifically tagged as a means of further assisting customers to easily select their styles and sizes. K&G employees are also available to assist customers with merchandise selection, including correct sizing.
Substantially all of our retail apparel stores offer tailoring services to facilitate timely alterations at a reasonable cost to customers. Tailored clothing purchased at a Men's Wearhouse store will be pressed and re-altered (if the alterations were performed at a Men's Wearhouse store) free of charge for the life of the garment. In addition, Jos. A. Bank utilizes Company-owned regional tailor shops, which receive
8
merchandise from stores to perform tailoring services and return the merchandise to the selling store for customer pickup.
We offer our "Perfect Fit" loyalty program to our Men's Wearhouse, Men's Wearhouse and Tux and Moores customers. In October 2015, we launched the "Bank Account" loyalty program for Jos. A. Bank customers, which offers the same benefits and operates in the same manner as the "Perfect Fit" loyalty program. Under the loyalty programs, customers receive points for purchases. Points are equivalent to dollars spent on a one-for-one basis, excluding any sales tax dollars. Upon reaching 500 points, customers are issued a $50 rewards certificate which they may use to make purchases at our stores or online. All customers who register for our loyalty programs are eligible to participate and earn points for purchases. A majority of the sales transactions at our Men's Wearhouse, Men's Wearhouse and Tux and Moores stores were to customers who participated in the loyalty program for fiscal 2015. We believe that the loyalty programs facilitate our ability to cultivate long-term relationships with our customers.
Our advertising strategy primarily consists of television, email, online (including social networking), mobile, direct mail, telemarketing and bridal shows. We consider our integrated efforts across these channels to be the most effective means of both attracting and reaching potential new customers, as well as reinforcing the positive attributes of our various brands with our existing customer base. In addition, for Jos. A. Bank, we occasionally distribute a catalog to communicate the Jos. A. Bank image, to provide customers with fashion guidance in coordinating outfits and to generate traffic in all of Jos. A. Bank's sales channels.
Purchasing and Distribution
For the Men's Wearhouse, Jos. A. Bank and Moores brands, our vertical direct sourcing model with third-party vendors covers design, product development, manufacturing, testing, quality control, and all necessary logistics required to get merchandise from the factory to the sales floor. We purchase merchandise and rental product from a broad vendor base and do not believe that the loss of any vendor would cause a significant negative impact to us. We have no long-term merchandise supply contracts and typically transact business on a purchase order-by-purchase order basis either directly with manufacturers and fabric mills or with trading companies. We have developed long-term and reliable relationships with most of our direct manufacturers and fabric mills, which we believe provides stability, quality and price leverage. We also work with trading companies that support our relationships with vendors for our direct sourced merchandise and contract agent offices that provide administrative functions on our behalf. In addition, the agent offices provide all quality control inspections and ensure that our operating procedures manuals are adhered to by our suppliers.
Jos. A. Bank uses buying agents to source a significant portion of Jos. A. Bank products from various companies located in or near Asia. In fiscal 2015, two buying agents sourced, respectively, approximately 45% and 6% of Jos. A. Bank total product purchases.
In fiscal 2015, our retail brands sourced approximately 60% of direct sourced merchandise from Asia (36% from China) while 13% was sourced in the U.S., 12% in Mexico, and 15% was sourced in other regions. Substantially all of our foreign purchases are negotiated and paid for in U.S. dollars. All direct sourcing vendors are expected to adhere to our Supplier Code of Conduct. To oversee compliance, we have a direct sourcing compliance department and we also use the services of an outside audit company to conduct regular vendor audits.
In addition, we operate a factory located in New Bedford, Massachusetts that manufactures quality U.S. made tailored clothing under the Joseph Abboud label, including designer suits, tuxedos, sport coats and slacks which we sell in our Men's Wearhouse stores as well as our Joseph Abboud flagship store. We also sell Joseph Abboud branded product in our Moores stores, which is produced by a third party in Canada.
9
All retail apparel merchandise for Men's Wearhouse/Men's Wearhouse and Tux stores is received into our distribution centers located in Houston, Texas, where it is either placed in back-stock or allocated to a store for shipping. In the majority of our larger markets, we also have separate hub distribution facilities or space within certain Men's Wearhouse stores used as redistribution facilities for their respective areas. Merchandise for Jos. A. Bank is received and distributed to stores from our distribution centers in Hampstead and Eldersburg, Maryland, while most purchased merchandise for Moores is distributed to the stores from our distribution center in Montreal, Quebec. The majority of merchandise for our K&G stores is direct shipped by vendors to the stores with the remainder of K&G merchandise being transported to our K&G stores via a third-party logistics firm. In 2016, we expect to transition to a regional distribution center approach for the Men's Wearhouse/Men's Wearhouse and Tux and Jos. A. Bank brands to optimize our shipping and freight costs that leverages the geographic locations of our main distribution centers in Texas and Maryland as well as the hub facilities described above.
Our rental product is located in our Houston distribution center and in six additional distribution facilities located in the U.S. (five) and Canada (one). The six additional distribution facilities also receive limited quantities of retail product, primarily formalwear accessories, that is sold in our Men's Wearhouse/Men's Wearhouse and Tux, Moores and Jos. A. Bank stores.
All retail merchandise and new rental product transported from vendors to our distribution facilities is done so via common carrier or on a dedicated fleet of long-haul vehicles. This dedicated fleet is also used to transport product from our distribution centers to the hub facilities and a fleet of leased or owned smaller vehicles is used to transport product from the hub facilities to our stores within a given geographic region.
Competition
We compete against a broad spectrum of other men's clothing stores. Our primary competitors include traditional department stores, other specialty men's clothing stores, online retailers, online tuxedo rental providers, off-price retailers, manufacturer-owned and independently-owned outlet stores and their e-commerce channels, and independently owned tuxedo rental stores. We believe that the principal competitive factors in the menswear market are merchandise assortment, quality, value, garment fit, merchandise presentation, store location and customer service, including on-site tailoring.
We believe that our merchandise offerings, including exclusive brands, and emphasis on customer service distinguish us from other retailers. Certain of our competitors (principally department stores) may be larger and may have substantially greater financial, marketing and other resources than we have and therefore may have certain competitive advantages.
Corporate Apparel Segment
Overview
Our corporate apparel segment, conducted by Twin Hill in the U.S. and by our UK holding company operating under the Dimensions, Alexandra and Yaffy brands primarily in the UK and Europe, provides corporate clothing uniforms and workwear to workforces. We offer our corporate apparel clothing products through multiple channels including managed corporate accounts, catalogs and the internet at www.twinhill.com, www.dimensions.co.uk and www.alexandra.co.uk. We offer a wide variety of customer branded apparel such as shirts, blouses, trousers, skirts and suits as well as a wide range of other products from aprons to safety vests to high visibility police outerwear. With respect to our managed contracts, we generally provide complete management of our customers' corporate clothing programs from design, fabric buying, manufacturing, product roll-outs and ongoing stock replacement and replenishment.
10
Customer Service and Marketing
Our customer base includes companies and organizations in the airline, retail grocery, retail, banking, distribution, travel and leisure, postal, security, healthcare and public sectors. Sector characteristics and economics tend to impact the corporate wear requirements of our individual customers. For example, retail customers typically have high staff turnover levels resulting in large replenishment volumes and significant seasonal demand, while banking customers generally have lower turnover and replenishment requirements but refresh or rebrand uniforms more frequently. The public service sector has historically consisted of fragmented regional authorities although there seems to be a move in the UK toward more consolidated sourcing units.
Our managed contract customers are generally organizations with larger numbers of uniform wearing employees or those that use uniforms as a form of brand identity. We have long established relationships with many of the UK's top employers and we currently maintain approximately 30 managed accounts with an average account size greater than 15,000 wearers. In addition, in fiscal 2015, we were awarded the uniform business for American Airlines, the largest managed contract we have obtained. The rollout of the American Airlines uniform program will occur in fiscal 2016. Our typical catalog customers are small to medium sized organizations with a relatively smaller number of employees or organizations where brand differentiation is not imperative.
Under our managed contracts, we take responsibility for dressing our customers' employees and are the exclusive supplier of corporate wear to many of our customers. Because of the nature of the managed contract model, we ensure that we are fully involved in all of our customers' uniform requirements, from daily replenishment requirements to longer term rebranding plans and wider corporate wear strategy. As a result, our relationship and level of interaction with our customers is generally far deeper and more embedded than conventional customer-supplier relationships.
Managed contracts are generally awarded through a request for proposal or tender process for multi-year contracts. Our teams continually monitor market opportunities to obtain access to such contracts. Regular contact with corporate wear buyers is supplemented with mail campaigns, attendance at trade fairs and trade magazine advertisements. Generally, we provide each managed contract customer with a specific account manager who often works two or three days a week on-site at our larger customers' offices. In addition to maintaining customer requirements, the account manager is also responsible for suggesting and implementing ways of improving the customer's corporate wear process.
During fiscal 2015, no one customer accounted for 10% or more of our total corporate apparel net sales and we do not believe that the loss of any customer would significantly impact us.
Our catalogs are distributed electronically, via mail and by sales representatives to current and potential customers. The catalogs offer a full range of our products and offer further branding or embellishment of most products ordered. Catalog orders can be placed via phone, mail, fax or direct contact with our sales representatives and, in the U.S., via client-specific websites. Our UK e-commerce platforms also allow online ordering via our websites and provide 24-hour functionality, with a full list of our products and their details. In addition, we regularly develop dedicated websites for our corporate clients for use by their employees in ordering their company specific corporate wear.
Merchandising
In our corporate apparel operations, we work with our customers to create custom apparel programs designed to support and enhance their respective brands. Our comprehensive apparel collections, including basic apparel categories such as shirts, blouses, trousers, skirts and suits as well as a wide range of other products from aprons to safety vests to high visibility police outerwear, feature designs with sizes and fits that meet the performance needs of our customers' employees and utilize the latest technology in long-
11
wearing fabrications. Career wear, casual wear and workwear make up an increasingly significant portion of the product mix as service industry customers continue to grow.
Under our managed contracts, our customers receive a full range of services including design, fabric buying and manufacturing, measuring and sizing, employee database management and replenishment forecasting, supply chain management and distribution and logistics of finished products. Customers work with our in-house design and technical teams to design and develop uniforms or other corporate wear that creates strong brand identity. We utilize our management information and garment tracking system which highlights trends, identifies issues and provides benchmark data for the customer at all levels from individual wearer to enterprise-wide. This system also allows us to identify potential cost savings and develop solutions on behalf of our customers and to respond quickly to trends or other changing needs.
With respect to our UK catalog and internet operations, customers can design an off-the-rack program that provides custom alterations and embroidery on any of our standard, ready-to-wear clothing. We work with such customers to create a distinctive, branded program that may include the addition of a company logo or other custom trim.
Purchasing and Distribution
Most corporate apparel garment production is outsourced to third-party manufacturers and fabric mills through our direct sourcing programs. We have developed long-term relationships with most of our direct manufacturers and fabric mills, which we believe provides stability, quality and reliability. We do not have any material long-term contracts with our vendors and we do not believe that the loss of any vendor would significantly impact us. We also work with trading companies that support our relationships with our direct source vendors and with contract agent offices that provide administrative functions on our behalf. In addition, the agent offices assist with quality control inspections and ensure that our operating procedures manuals are adhered to by our suppliers.
During 2015, approximately 60% of our corporate wear product purchases was sourced in Asia (primarily China, Bangladesh, Indonesia, Pakistan, and Sri Lanka) while approximately 40% was sourced from Europe and other regions. Our foreign purchases from Asia are negotiated and paid for in U.S. dollars, while our purchases from Europe and other regions are negotiated and paid for in pounds Sterling or Euros.
To oversee compliance with our Supplier Code of Conduct, we use internal resources as well as third party companies to audit the factories producing our garments. We strive to work collaboratively with our suppliers to positively influence them to embed compliance into their daily operations.
Corporate apparel merchandise is received into our distribution facilities located in Long Eaton and Glasgow for the UK operations and Houston, Texas and Bakersfield, California for U.S. operations. Customer orders are dispatched to the customer or individual wearers employed by the customer via common carrier or pursuant to other arrangements specified by the customer.
Competition
Our UK corporate apparel group provides workwear and uniforms to more UK employees than any of our corporate apparel competitors, which consist mostly of companies that focus more on catalog business. The U.S. corporate wear market is more fragmented with several U.S. competitors being larger and having more resources than Twin Hill. We believe that the competitive factors in the corporate wear market are merchandise assortment, quality, price, customer service and delivery capabilities. We believe that our proven capability in the provision of corporate apparel programs to businesses and organizations of all sizes alongside our catalog and internet operations position us well with our existing customers and should enable us to continue to gain new catalog accounts and managed contracts.
12
Seasonality
Our sales and net earnings are subject to seasonal fluctuations. Our rental revenues are heavily concentrated in the second and third quarters (prom and wedding season) while the fourth quarter is considered the seasonal low point. In addition, Jos. A. Bank has historically experienced increased customer traffic during the holiday season and its increased marketing efforts during the holiday season have historically resulted in sales and net earnings generated in the fourth quarter, which are significantly larger as compared to the other three quarters. This trend did not occur in the fourth quarter of 2015 as a result of our decision to change the brand's promotional cadence. We currently expect this trend to resume in the future. With respect to corporate apparel sales and operating results, seasonal fluctuations are not significant but the acquisition of new customers or existing customer decisions to rebrand or revise their corporate wear programs can cause significant variations in period results. Because of these fluctuations, results for any quarter are not necessarily indicative of the results that may be achieved for the full year.
Trademarks and Service Marks
We are the owner in the U.S. and selected other countries of the trademarks and service marks MEN'S WEARHOUSE, MW MEN'S WEARHOUSE (and design), JOS. A. BANK, and JOSEPH ABBOUD and of U.S. federal and foreign registrations thereof. Our rights in the MEN'S WEARHOUSE and JOS. A. BANK marks and their respective variations are a significant part of our business, as the marks have become well known through our use of the marks in connection with our retail and formalwear rental services and products (both in store and online) and our advertising campaigns. We are also the owner of various marks and trademark registrations in the U.S., Canada and abroad under which our stores and corporate apparel business operate or which are used to label the products we sell or rent. We intend to maintain and protect our marks and the related registrations.
We also license the JOSEPH ABBOUD brand to certain third parties for limited products in the U.S. and Canada, and for a broader range of products abroad.
We are the licensee for certain designer labels on products of a specific nature (such as men's suits, men's formalwear or men's shirts). We generally pay a royalty for the use of the label, based on cost for the relevant product or a percentage of related sales. The labels licensed under these agreements will continue to be used in connection with a portion of the purchases under the direct sourcing program described above, as well as purchases from other vendors. We monitor the performance of these licensed labels compared to their cost and may elect to selectively terminate any license, as provided in the particular agreement.
Employees
At January 30, 2016, we had approximately 24,500 employees, consisting of approximately 21,900 in the U.S. and 2,600 in foreign countries, of which approximately 18,000 were full-time employees. Seasonality affects the number of part-time employees as well as the number of hours worked by full-time and part-time personnel.
At January 30, 2016, approximately 700 of our employees at the factory located in New Bedford, Massachusetts that manufactures our Joseph Abboud clothing are members of Unite Here, a New England based labor union. The current union contract expires in April 2016 and we are currently engaged in negotiations to enter into a new union contract. Also, approximately 290 employees working in the Jos. A. Bank Hampstead, Maryland tailoring overflow shop and distribution centers are represented by the Mid-Atlantic Regional Joint Board, Local 806. Our contract with the Mid-Atlantic Regional Joint Board, Local 806 expires in February 2017. Lastly, approximately 120 Jos. A. Bank sales associates in New York City and four surrounding New York counties are represented by Local 340, New York New Jersey Regional Joint Board, Workers United. Our most recent collective bargaining agreement covering these
13
employees is scheduled to expire in April 2016 and we are currently engaged in negotiations to enter into a new collective bargaining agreement.
We believe our relationship with our union and nonunion employees is good and we have no reason to believe that we will experience any interruption in our business upon the expiration of these collective bargaining agreements.
Available Information
Our website address is www.tailoredbrands.com. No information contained on any of our websites is intended to be included as part of, or incorporated by reference into, this Annual Report on Form 10-K. Through the investor relations section of our website, we provide free access to our annual reports on Form 10-K, quarterly reports on Form 10-Q, current reports on Form 8-K and all amendments to those reports as soon as reasonably practicable after such material is electronically filed with or furnished to the Securities and Exchange Commission (the "SEC"). In addition, copies of the Company's annual reports will be made available, free of charge, upon written request. The SEC maintains a website that contains the Company's filings and other information regarding issuers who file electronically with the SEC at www.sec.gov.
Effective January 31, 2016, Tailored Brands became the successor reporting company to Men's Wearhouse, pursuant to the Reorganization. Men's Wearhouse began operations in 1973 as a partnership and was incorporated as Men's Wearhouse under the laws of Texas in May 1974. Our principal corporate and executive offices are located at 6380 Rogerdale Road, Houston, Texas 77072-1624 (telephone number 281-776-7000) and at 6100 Stevenson Blvd., Fremont, California 94538-2490 (telephone number 510-657-9821), respectively.
14
We wish to caution you that there are many risks and uncertainties that could adversely affect our business. These risks and uncertainties include, but are not limited to, the risks described below and elsewhere in this report, particularly found in "Forward-Looking and Cautionary Statements." The following is not intended to be a complete discussion of all potential risks or uncertainties, as it is not possible to predict or identify all risk factors. Unknown or unidentified additional risks and uncertainties could also adversely affect our business. In addition, the risks described below are not listed in order of the likelihood that the risk might occur or the severity of the impact if the risk should occur.
Risks Associated with our Business Strategy
As noted on page 6, our overall business strategy is focused on several initiatives. If we cannot successfully execute our business strategy, our consolidated financial condition, results of operations and cash flows could be materially adversely impacted. There are numerous risks associated with this strategy including, but not limited to, the following:
Our strategy related to the Jos. A. Bank brand may negatively impact our short-term and long-term profitability.
Reengineering the Jos. A. Bank brand to a long-term, sustainable profit model is a key part of our business strategy. There can be no assurance that strategic initiatives being implemented at Jos. A. Bank will favorably impact the Jos. A. Bank's operations or will be successfully executed or executed in the time period projected. Any failure to successfully and timely implement these initiatives can be expected to negatively impact Jos. A. Bank's sales and profitability.
We may not realize the anticipated benefits of the acquisition of Jos A. Bank, which could adversely impact our sales and profitability.
We have devoted and will continue to devote significant managerial attention and resources into the operations of Jos. A. Bank. While we believe that we have sufficient resources to realize the benefits of the acquisition, there are a number of significant risks involved. There can be no assurance that:
- •
- the anticipated benefits of the acquisition, including cost savings and synergies, will be fully realized;
- •
- unanticipated costs, charges and expenses will not result from the acquisition;
- •
- litigation relating to the acquisition will not be filed;
- •
- we will be able to retain key personnel or that labor issues will not arise; and
- •
- the acquisition will not cause disruption to our business, operations and relationships with our customers, employees, suppliers and other important third parties.
If we are unable to achieve a substantial portion of the anticipated benefits of the acquisition, it could have a material adverse effect on our sales and profitability.
We may not realize the benefits of our profit improvement and store rationalization programs.
In March 2016, we announced profit improvement and store rationalization programs. The estimated costs and benefits associated with these programs are preliminary and may vary materially based on various factors including: the timing in execution of the programs, outcome of negotiations with landlords and other third parties, inventory levels, and changes in management's assumptions and projections. As a result of these events and circumstances, delays and unexpected costs may occur, which could result in our not realizing all, or any, of the anticipated benefits of these programs.
15
Our success depends, in part, on our ability to meet the changing preferences of our customers and manage merchandise lead times.
We believe that men's attire is characterized by infrequent and more predictable fashion changes. Our success, however, is dependent in part upon our ability to gauge the tastes of our customers and to provide merchandise that satisfies customer demand in a timely manner. As our business is seasonal, we must purchase and carry a significant amount of inventory prior to peak selling seasons.
We issue purchase orders for the purchase and manufacture of merchandise well in advance of the applicable selling season. As a result, we are vulnerable to demand and pricing shifts. In addition, lead times for many of our purchases are lengthy, which may make it more difficult for us to respond quickly to new or changing merchandise trends or consumer acceptance of our products. As a result, there could be a material adverse effect on our business, financial condition and results of operations.
We believe our overall product mix makes our business less vulnerable to changes in merchandise trends than many fashion-forward and specialty apparel retailers; however, our sales and profitability depend upon our continued ability to effectively manage a variety of competitive challenges, including:
- •
- anticipating and quickly responding to changing trends and consumer demands;
- •
- maintaining favorable brand recognition and effectively marketing our products to consumers in several diverse market segments;
- •
- developing innovative, high-quality new products and/or product and brand extensions in sizes, colors and styles that appeal to
consumers of varying age groups and tastes;
- •
- competitively pricing our products and providing superior service and value to our customers;
- •
- countering the promotional or other pricing activities of our competitors; and
- •
- providing strong and effective marketing support.
Increased competition or our failure to meet these competitive challenges could result in price reductions, increased marketing expenditures and loss of market share, any of which could have a material adverse effect on our business, financial condition and results of operations.
Our investments in omni-channel initiatives may not deliver the results we anticipate.
One of our strategic priorities is to further develop an omni-channel shopping experience for our customers through the integration of our store and digital shopping channels. We continue to explore additional ways to develop an omni-channel shopping experience, including further digital integration and customer personalization. These initiatives involve significant investments in information technology systems. If the implementation of our omni-channel initiatives is not successful, or we do not realize the return on our omni-channel investments that we anticipate, our operating results would be adversely affected.
Our ability to continue to expand our stores may be limited.
A large part of our growth has resulted from the addition of new Men's Wearhouse stores and the increased sales volume and profitability provided by these stores. In addition, the acquisition of Jos. A. Bank significantly increased the total number of retail stores we operate. As of January 30, 2016, we operate 713 Men's Wearhouse stores, 625 Jos. A. Bank stores, 124 Moores stores, and 89 K&G stores. We will continue to depend on adding new stores to increase our sales volume and profitability; however, we believe that our ability to increase the number of new stores in the U.S. and Canada may be limited. Therefore, we may not be able to achieve the same rate of growth as we have historically.
16
In addition, our ability to open new stores will depend on our ability to obtain suitable locations, negotiate acceptable lease terms, hire qualified personnel and open and operate new stores on a timely and profitable basis. Continued expansion will place increasing demands on our operational, managerial and administrative resources. These increased demands could cause us to operate our business less effectively and in turn, could adversely affect our financial performance and results of operations. Further, the results achieved by our existing stores may not be indicative of the performance or market acceptance of stores in other locations and the opening of new stores in existing markets may adversely affect sales and profits of established stores in those same markets.
Our strategy related to shops within Macy's stores may negatively impact our short-term and long-term profitability.
On June 10, 2015, we entered into a 10-year agreement with Macy's, Inc. to operate men's tuxedo rental shops inside 300 Macy's department stores. As of January 30, 2016, we operated 12 tuxedo shops within Macy's stores under the name "The Tuxedo Shop @ Macy's." Our shops within Macy's stores use selling space within Macy's and are dependent on the Macy's point-of-sale platform. There can be no assurance that our shops within Macy's stores will be successful. In addition, the Macy's management team, including their strategic and marketing decisions, may have an effect on the success of our shops within Macy's stores. We have limited influence over these factors, and a strategic shift by the Macy's management team or a significant disruption in Macy's operations could adversely affect the results of our shops within Macy's stores.
Certain of our expansion strategies may present greater risks.
We are continuously assessing opportunities to expand store concepts and complementary products and services related to our core business, such as corporate apparel and uniform sales. We may expend both capital and personnel resources on such business opportunities which may or may not be successful. Additionally, any new concept is subject to certain risks, including customer acceptance, competition, product differentiation and the ability to obtain suitable sites. There can be no assurance that we will be able to develop and grow new concepts to a point where they will become profitable or generate positive cash flow.
Any future acquisitions that we may undertake could be difficult to integrate, disrupt our business, dilute shareholder value and harm our operating results.
In the event we complete one or more new acquisitions, we may be subject to a variety of risks, including risks associated with an ability to integrate acquired assets, systems or operations into our existing operations, diversion of management's attention from core operational matters, higher costs, or unexpected difficulties or problems with acquired assets or entities, outdated or incompatible technologies, labor difficulties or an inability to realize anticipated synergies and efficiencies, whether within anticipated time frames or at all. If one or more of these risks are realized, it could have an adverse impact on our financial condition and operating results.
Risks Associated with General Economic Conditions
Numerous economic conditions, all of which are outside of our control, could negatively affect the level of consumer spending on the merchandise that we offer. If these economic conditions persist for a sustained period, our consolidated financial condition and results of operations could be materially adversely impacted. These economic conditions include, but are not limited to, the following:
Our business is particularly sensitive to economic conditions and consumer confidence.
Changes in U.S., Canadian, UK and global economic and political conditions could negatively impact consumer confidence and the level of consumer discretionary spending. The continuation and/or
17
recurrence of these market, political and economic conditions could intensify the adverse effect of such conditions on our revenues and operating results. Consumer confidence may also be adversely affected by national and international security concerns such as war, terrorism, public health events or natural disasters (or the threat of any of these).
Our business may be adversely affected by a worsening of economic conditions, increases in consumer debt levels and applicable interest rates, uncertainties regarding future economic prospects or a decline in consumer confidence or credit availability. During an actual or perceived economic downturn, fewer customers may shop with us and those who do shop may limit the amounts of their purchases. As a result, we could be required to take significant markdowns and/or increase our marketing and promotional expenses in response to the lower than anticipated levels of demand for our products. In addition, promotional and/or prolonged periods of deep discount pricing by our competitors could have a material adverse effect on our business. Also, as a result of adverse market, political or economic conditions, customers may delay or postpone indefinitely roll-outs of new corporate wear programs, which could have a material adverse effect on our corporate apparel segment.
We have experienced fluctuations in our sales and expect our sales to fluctuate in the future.
We believe that a variety of factors affect comparable sales results including, but not limited to, consumer confidence and the level of consumer discretionary spending, changes in economic conditions and consumer disposable income, spending patterns and debt levels, consumer credit availability, weather conditions, the timing of certain holiday seasons, the number and timing of new store openings, changes in the popularity of a retail center, the timing and level of promotional pricing or markdowns, store closings, relocations and remodels, changes in fashion trends and our merchandise mix or other competitive factors. Comparable sales fluctuations may impact our ability to leverage our fixed direct expenses, including store rent and store asset depreciation, which may adversely affect our financial condition or results of operations.
Our business is seasonal.
Our sales and net earnings are subject to seasonal fluctuations. Our rental revenues are heavily concentrated in the second and third quarters (prom and wedding season) while the fourth quarter is considered the seasonal low point. In addition, Jos. A. Bank has historically experienced increased customer traffic during the holiday season and its increased marketing efforts during the holiday season have historically resulted in sales and net earnings generated in the fourth quarter, which are significantly larger as compared to the other three quarters. This trend did not occur in the fourth quarter of 2015 as a result of our decision to change the brand's promotional cadence. We currently expect this trend to resume in the future. With respect to our corporate apparel sales and operating results, seasonal fluctuations are not significant but the acquisition of new customers or existing customer decisions to rebrand or revise their corporate wear programs can cause significant variations in period results. Because of these fluctuations in our sales, results for any quarter are not necessarily indicative of the results that may be achieved for the full year.
18
Risks Associated With Our Sourcing and Distribution Strategies
Our sourcing and distribution strategies are subject to numerous risks that could materially adversely impact our consolidated financial condition and results of operations. These risks include, but are not limited to, the following:
The loss of, or disruption in, our distribution centers could result in delays in the delivery of merchandise to our stores.
All retail apparel merchandise for Men's Wearhouse stores is received into our Houston distribution centers, where the inventory is then processed, sorted and either placed in back-stock or shipped to our stores. In the majority of our larger markets, we also have separate hub facilities or space within certain Men's Wearhouse stores used as redistribution facilities for their respective geographical areas. Our rental product is also stored in our Houston distribution center and, to a lesser extent, in five additional distribution facilities located in the U.S. and one in Canada. Merchandise for Jos. A. Bank is received and distributed from our distribution centers in Hampstead and Eldersburg, Maryland, while most merchandise for Moores is distributed from our distribution center in Montreal, Quebec. The majority of merchandise for our K&G stores is direct shipped by vendors to the stores while the remainder is transported to our K&G stores via a third-party logistics firm. All corporate apparel merchandise is received into our distribution facilities located in Houston or California for our U.S. operations and Long Eaton or Glasgow for our UK operations.
We depend in large part on the orderly operation of this receiving and distribution process, which depends, in turn, on adherence to shipping schedules, proper functioning of our information technology and inventory control systems and overall effective management of the distribution centers. Events, such as disruptions in operations due to fire or other catastrophic events, software malfunctions, employee matters or shipping problems, may result in delays in the delivery of merchandise to our stores. For example, given our proximity to the Texas gulf coast, it is possible that a hurricane or tropical storm could damage the Houston distribution centers, result in extended power outages or flood roadways into and around the distribution centers, any of which would disrupt or delay deliveries to the Houston distribution centers and to our stores.
Although we maintain business interruption and property insurance, there can be no assurance that our insurance will be sufficient, or that insurance proceeds will be paid timely to us, in the event any of our distribution centers are damaged or shut down for any reason, or if we incur higher costs and longer lead times in connection with a disruption at one or more of our distribution centers.
Our business is global in scope and can be impacted by factors beyond our control.
As a result of our international operations and our sourcing of merchandise and rental product from vendors located outside of the U. S., we face the possibility of greater losses from a number of risks inherent in doing business in international markets and from a number of factors which are beyond our control. Such factors that could harm our results of operations and financial condition include, among other things:
- •
- political instability, civil strife or insurrection, or acts of terrorism, which disrupt trade with the countries where we operate or
in which our contractors, suppliers or customers are located;
- •
- recessions in foreign economies;
- •
- logistic and other challenges in managing our foreign operations;
- •
- imposition of new legislation or rules relating to imports that may limit the quantity of goods which may be imported into the U. S. from certain countries or regions;
19
- •
- obligations associated with being an importer of record, including monitoring and complying with all corresponding legal requirements;
- •
- imposition of duties, taxes and other charges on imports;
- •
- delays in shipping due to port security considerations or labor disputes;
- •
- issues relating to compliance with domestic or international labor standards which may result in adverse publicity;
- •
- migration of our manufacturers, which can affect where our raw materials and/or products are or will be produced;
- •
- volatile global economic, market or political environments;
- •
- volatile shipping availability, fuel supplies and related costs;
- •
- the fluctuation in the value of the U.S. dollar relative to the local currencies used by our suppliers;
- •
- increased difficulty in protecting our intellectual property rights in foreign jurisdictions; and
- •
- restrictions on the transfer of funds between the U.S. and foreign jurisdictions.
We are subject to import risks, including potential disruptions in supply, changes in duties, tariffs, quotas and export restrictions on imported merchandise, and economic, political or other problems in countries from or through which merchandise is sourced or imported.
Many of the products sold in our stores and our corporate apparel operations are sourced from various foreign countries. Political or financial instability, war, civil strife, terrorism, trade restrictions, tariffs, currency exchange rates, transport capacity limitations, labor disruptions, and other factors relating to international trade are beyond our control and could affect the availability and the price of our inventory.
We require our vendors to operate in compliance with applicable laws and regulations and our internal policy requirements. Our business could be adversely affected if our vendors do not comply with applicable legal requirements, our vendor policies and practices generally acceptable in the U. S. regarding social and ethical matters and acceptable labor and sourcing practices (collectively, "Vendor Requirements").
The violation of our Vendor Requirements by any of our vendors could disrupt our supply chain. In addition, any such violation could damage our reputation, which may result in decreased customer traffic to our stores, websites and call center. In the event of any violations, we may decide that it is necessary or desirable to seek alternative vendors, which could adversely affect our business, financial condition and results of operations.
Our business could be adversely affected by increased costs of the raw materials and other resources that are important to our business.
The raw materials used to manufacture our products are subject to availability constraints and price volatility caused by high demand for fabrics, weather conditions, supply conditions, government regulations, economic climate and other unpredictable factors. In addition, our transportation and labor costs are subject to price volatility caused by the price of oil, supply of labor, governmental regulations, economic climate and other unpredictable factors. Increases in demand for, or the price of, raw materials, distribution services and labor, including federal and state minimum wage rates, could have a material adverse effect on our business, financial condition and results of operations.
The increase in the costs of wool and other raw materials significant to the manufacturer of apparel and the costs of manufacturing could materially affect our results of operations to the extent they cannot be mitigated through price increases and relocation to lower cost sources of supply or other cost reductions.
20
These increased costs could particularly impact our managed contract corporate wear business which tends to have more long term contractually committed customer sales arrangements with limited price flexibility.
Any significant interruption in raw materials could cause interruptions at our U.S. tailored clothing factory.
The principal raw material used by our U.S. tailored clothing factory is fabric. Most of the factory's supply arrangements are seasonal. The factory does not have any long-term agreements in place with its fabric suppliers; therefore, there can be no assurance that any of such suppliers will continue to do business with us in the future. If a particular mill were to experience a delay due to fire or natural disaster and become unable to meet the factory's supply needs, it could take a period of up to several months for us to arrange for and receive an alternate supply of such fabric. In addition, import and export delays caused, for example, by an extended strike at the port of entry, could prevent the factory from receiving fabric or other raw materials shipped by its suppliers. Therefore, there could be a negative effect on the ability of the factory to meet its production goals if there is an unexpected loss of a supplier of fabric or other raw materials or a long interruption in shipments from any fabric or other raw material supplier.
Labor union disputes could impact our business.
Approximately 700 of our employees at the factory located in New Bedford, Massachusetts that manufactures our Joseph Abboud clothing are members of Unite Here, a New England based labor union. Also, approximately 290 employees working in the Jos. A. Bank Hampstead, Maryland tailoring overflow shop and distribution centers are represented by the Mid-Atlantic Regional Joint Board, Local 806 and, approximately 120 Jos. A. Bank sales associates in New York City and four surrounding New York counties are represented by Local 340, New York New Jersey Regional Joint Board, Workers United. Should a labor dispute arise, we could experience shortages in product to sell in our stores or disruptions in services provided at our Jos. A. Bank stores.
Risks Associated with Our Information Technology Systems
We rely on various information technology systems to manage our operations. Information technology systems are subject to numerous risks including unanticipated operating problems, system failures, rapid technological change, failure of the systems that operate as anticipated, reliance on third-party computer hardware, network and software providers, computer viruses, telecommunication failures, data breaches, denial of service attacks, spamming, phishing attacks, computer hackers and other similar disruptions, any of which could materially adversely impact our consolidated financial condition and results of operations. Additional risks include, but are not limited to, the following:
If we are unable to operate information systems and implement new technologies effectively, our business could be disrupted or our sales or profitability could be reduced.
The efficient operation of our business is dependent on our information systems, including our ability to operate them effectively and successfully implement new technologies, systems, controls and adequate disaster recovery systems. We also maintain multiple internet websites in the U.S. and a number of other countries. In addition, we must protect the confidentiality of our and our customers' data. The failure of our information systems to perform as designed or our failure to implement and operate them effectively could disrupt our business or subject us to liability and thereby harm our profitability.
We are subject to data security risks, which could have an adverse effect on our results of operations and consumer confidence in our security measures.
We are subject to cybersecurity risks. Cybersecurity refers to the combination of technologies, processes, and procedures established to protect information technology systems and data from unauthorized access, attack, exfiltration, or damage. As part of our normal operations, we maintain and transmit confidential
21
information about our customers as well as proprietary information relating to our business operations. While we have implemented measures reasonably designed to prevent security breaches and cyber incidents, our systems or our third-party service providers' systems may still be vulnerable to privacy and security incidents including attacks by unauthorized users, corruption by computer viruses or other malicious software code, emerging cybersecurity risks, inadvertent or intentional release of confidential or proprietary information, or other similar events. The occurrence of any security breach involving the misappropriation, loss or other unauthorized disclosure of information about us or our customers, whether by us or by one of our third-party service providers, could, among other things:
- •
- cause damage to our reputation;
- •
- allow competitors access to our proprietary business information;
- •
- subject us to liability for a failure to safeguard customer data;
- •
- subject us to financial and legal risks, including regulatory action or litigation;
- •
- impact our ability to process credit card transactions; and
- •
- require significant capital and operating expenditures to investigate and remediate the breach.
In this respect, credit card companies required businesses that accept their credit cards to implement chip card recognition systems by October 2015. Because of delays caused by vendor software and the certification process of chip technology, we expect to complete the implementation of the chip technology during 2016. As a result, in the event of a data breach before we have the technology in place, we may face liabilities that could have a material adverse effect on our business, financial condition and results of operations.
Furthermore, the storage and transmission of such data is regulated at the international, federal, state and local levels. Privacy and information security laws and regulation changes, and compliance with those changes, may result in cost increases due to system changes and the development of new administrative processes. If we or our employees fail to comply with these laws and regulations or experience a data security breach, our reputation could be damaged, possibly resulting in lost future business, and we could be subjected to fines, penalties, administrative orders and other legal risks as a result of a breach or non-compliance.
Other Risks Affecting Our Business
Our business is subject to numerous other risks that could materially adversely impact our consolidated financial condition and results of operations. These risks include, but are not limited to, the following:
We may be negatively impacted by competition.
Both the men's retail and the corporate apparel industries are highly competitive with numerous participants. We compete with traditional department stores, other specialty men's clothing stores, online retailers, online tuxedo rental providers, off-price retailers, manufacturer-owned and independently-owned outlet stores and their e-commerce channels, independently owned tuxedo rental stores and other corporate apparel providers. In addition, some of our primary competitors sell their products in stores that are located in the same shopping malls or retail centers as our stores, which results in competition for favorable site locations and lease terms in these shopping malls and retail centers. Increased competition or our failure to meet these competitive challenges could result in price reductions, increased marketing expenditures and loss of market share, any of which could have a material adverse effect on our business, financial condition and results of operations.
22
Our success significantly depends on our key personnel and our ability to attract and retain key personnel.
Our success depends upon the personal efforts and abilities of our senior management team and other key personnel. Although we believe we have a strong management team with significant industry expertise, we face intense competition in hiring and retaining these personnel and the extended loss of the services of key personnel could have a material adverse effect on our business, financial condition and results of operations.
Also, our continued success and the achievement of our expansion goals are dependent upon our ability to attract and retain additional qualified employees. If we are unable to retain and motivate our current personnel and attract talented new personnel, our business, financial condition and results of operations could be adversely affected.
The occurrence of an event that impacts our reputation could have a material adverse effect on our brands.
Our ability to maintain our reputation is critical to our brands. Our reputation could be jeopardized if we fail to maintain high standards for merchandise quality and integrity and customer service. Any negative publicity about these types of concerns may reduce demand for our merchandise. Failure to comply with ethical, social, product, labor, health and safety or environmental standards could also jeopardize our reputation and potentially lead to various adverse consumer actions, including boycotts. Public perception about our company as a whole, our products or our stores, whether justified or not, could impair our reputation, involve us in litigation, damage our brand and have a material adverse effect on our business. Failure to comply with local laws and regulations, to maintain an effective system of internal controls and provide accurate and timely financial statement information, or to prevent security breaches could also hurt our reputation. Damage to our reputation or loss of consumer confidence for any of these or other reasons could have a material adverse effect on our results of operations and financial condition, as well as require additional time and resources to rebuild our reputation.
War, acts of terrorism, public health crises, or weather catastrophes could have a material adverse effect on our business.
In the event of war, acts of terrorism or the threat of terrorist attacks, public health crises, or weather catastrophes, consumer spending could significantly decrease for a sustained period. In addition, local authorities or shopping center management could close in response to any immediate security concern, public health concern or weather catastrophe such as hurricanes, earthquakes, or tornadoes. Similarly, war, acts of terrorism, threats of terrorist attacks, or a weather catastrophe could severely and adversely affect our offices, distribution centers, or our entire supply chain.
Fluctuations in exchange rates may cause us to experience currency exchange losses.
Moores, our Canadian subsidiary, conducts most of its business in Canadian dollars ("CAD") but purchases a significant portion of its merchandise in U.S. dollars. The exchange rate between CAD and U.S. dollars has fluctuated historically. Recently, the value of the CAD against the U.S. dollar has weakened. If this valuation does not improve, then the revenues and earnings of our Canadian operations will be reduced when they are translated to U.S. dollars. Also, the value of our Canadian net assets as expressed in U.S. dollars may decline. Moores utilizes foreign currency hedging contracts related to its merchandise purchases to limit exposure to changes in U.S. dollar/CAD exchange rates; however, these hedging activities may not adequately protect our Canadian operations from exchange rate risk.
Dimensions and Alexandra, our UK-based operations, sell their products and conduct their business primarily in pounds Sterling ("GBP") but purchase most of their merchandise in U.S. dollars or Euros. The exchange rate between the GBP, Euro and U.S. dollar has fluctuated historically. A decline in the value of the GBP as compared to the Euro or U.S. dollar may adversely impact our UK operating results as the cost of merchandise purchases will increase, particularly in relation to longer term customer
23
contracts that have little or no pricing adjustment provisions, and the revenues and earnings of our UK operations will be reduced when they are translated to U.S. dollars. Also, the value of our UK net assets as expressed in U.S. dollars may decline. Dimensions and Alexandra may, from time to time, utilize foreign currency hedging contracts as well as price renegotiations to limit exposure to some of this risk; however, these activities may not adequately protect our UK operations from exchange rate risk.
Compliance with changing regulations and standards for accounting, corporate governance, tax and employment laws could result in increased administrative expenses or litigation and could adversely impact our business, results of operations and reported financial results.
Our policies, procedures and internal controls are designed to help us comply with all applicable laws, accounting and reporting requirements, regulations and tax requirements, including those imposed by the Sarbanes-Oxley Act of 2002, the Dodd-Frank Wall Street Reform and Consumer Protection Act, the SEC and the NYSE, as well as applicable employment laws and the health care reform legislation, such as the Affordable Care Act. In addition, our business is subject to rules issued by the payment card industry (PCI), and laws, rules and regulations promulgated by international, national, state and local authorities, including laws, rules and regulations relating to privacy, use of consumer information, credit cards and advertising. All of these laws, rules and regulations and the interpretation thereof are subject to change and often application thereof may be unclear. As a result, from time to time, we are subject to inquiries, investigations, and/or litigation, including class action lawsuits, and administrative actions related to compliance with these laws, rules and regulations.
Shareholder activism, the current political environment, financial reform legislation and the current high level of government intervention and regulatory reform has led, and may continue to lead, to substantial new regulations and compliance obligations. Any changes in regulations, the imposition of additional regulations or the enactment of any new legislation that affects employment and labor, trade, product safety, transportation and logistics, health care, tax, privacy, or environmental issues, among other things, may increase the complexity of the regulatory environment in which we operate and the related cost of compliance.
Failure to comply with the various laws and regulations, as well as changes in laws and regulations, could have an adverse impact on our reputation, financial condition or results of operations.
Changes to accounting standards and estimates could materially impact our results of operations, financial position, and cash flows.
Generally accepted accounting principles and the related authoritative guidance for many aspects of our business, including revenue recognition, inventories, goodwill and intangible assets, leases and income taxes, are complex, continually evolving and involve subjective judgments. For example, recently issued authoritative guidance for lease accounting may have a material adverse effect on our results of operations and financial position or cause the perception that we are more highly leveraged. In addition, as discussed in Note 1 to our consolidated financial statements, we are evaluating the impact of the recently issued revenue standard on our business. These and other future changes in accounting rules or changes in the underlying estimates, assumptions or judgments by our management could have a material impact on our results of operations, financial position and cash flows.
We could incur losses due to impairment on long-lived assets, goodwill and intangible assets.
Under generally accepted accounting principles, we review our long-lived assets for impairment whenever economic events or changes in circumstances indicate that the carrying value of an asset may not be recoverable. Identifiable intangible assets with an indefinite useful life, including goodwill, are not amortized but are evaluated annually for impairment. A more frequent evaluation is performed if events or circumstances indicate that impairment could have occurred. In fiscal 2015, we recorded $1.24 billion of goodwill and intangible asset impairment charges related to Jos. A. Bank. In the future, significant
24
negative industry or general economic trends, disruptions to our business and unexpected significant changes or planned changes in our use of the assets may result in additional impairments to our goodwill, intangible assets and other long-lived assets. Any reduction in or impairment of the value of goodwill or intangible assets will result in a charge against earnings, which could have a material adverse impact on our reported results of operations and financial condition.
Our advertising, marketing and promotional activities have been the subject of review by state regulators and subject to lawsuits, specifically at Jos. A. Bank.
Jos. A. Bank has in the past been, and may from time to time in the future be, required to respond to inquiries from State Attorneys General related to its advertising practices. In addition, it is possible that the advertising, marketing and promotional activities of our other brands may be reviewed by state or other regulators. Although we endeavor to monitor and comply with all applicable laws and regulations to ensure that all advertising, marketing and promotional activities comply with all applicable legal requirements, many of the applicable legal requirements involve subjective judgments. It is possible that any resolution we may reach with any governmental authority may materially impact our current or future planned marketing program and could have an adverse impact on our business.
Rights of our shareholders may be negatively affected if we issue any of the shares of preferred stock which our Board of Directors has authorized for issuance.
We have available for issuance 2,000,000 shares of preferred stock, par value $.01 per share. Our Board of Directors is authorized to issue any or all of this preferred stock, in one or more series, without any further action on the part of shareholders. The rights of our shareholders may be negatively affected if we issue a series of preferred stock in the future that has preference over our common stock with respect to the payment of dividends or distribution upon our liquidation, dissolution or winding up. See Note 13 of Notes to Consolidated Financial Statements for more information.
Risks Associated with Our Indebtedness
There are numerous risks associated with our indebtedness including, but not limited to, the following:
Our current level of indebtedness could adversely affect our ability to raise additional capital to fund our operations, limit our ability to react to changes in the economy or our industry, expose us to interest rate risk to the extent of our variable rate debt and prevent us from meeting our obligations under the Credit Facilities or the indenture governing the Senior Notes.
In connection with the acquisition of Jos A. Bank, we entered into a $1.1 billion aggregate principal amount senior secured facility (the "Term Loan Facility") and a $500.0 million asset-based revolving facility (the "ABL Facility" together with the Term Loan Facility, the "Credit Facilities"). In addition, we issued $600.0 million in aggregate principal amount of our 7.0% Senior Notes due 2022 (the "Senior Notes"). After entering into the Credit Facilities and completing the offering of the Senior Notes, our indebtedness has increased substantially. As of January 30, 2016, our total indebtedness is approximately $1,655.9 million. In addition, we have up to $420.9 million of additional borrowing availability under the ABL Facility, excluding letters of credit totaling approximately $25.5 million issued and outstanding.
Our indebtedness could have important consequences, including:
- •
- increasing our vulnerability to adverse economic, industry or competitive developments;
- •
- requiring a substantial portion of cash flow from operations to be dedicated to the payment of principal and interest on our indebtedness, therefore reducing our ability to use our cash flow to fund our operations, capital expenditures and future business opportunities;
25
- •
- making it more difficult for us to satisfy our obligations with respect to our indebtedness and any failure to comply with the
obligations of any of our debt instruments, including restrictive covenants and borrowing conditions, could result in an event of default under the Credit Facilities and the indenture governing the
Senior Notes;
- •
- restricting us from making strategic acquisitions or causing us to make non-strategic divestitures;
- •
- limiting our ability to obtain additional financing for working capital, capital expenditures, product development, debt service
requirements, acquisitions and general corporate or other purposes; and
- •
- limiting our flexibility in planning for, or reacting to, changes in our business or market conditions and placing us at a competitive disadvantage compared to our competitors who have less debt than we do and who therefore may be able to take advantage of opportunities that our indebtedness prevents us from exploiting.
Despite our high indebtedness level, we will still be able to incur significant additional amounts of debt, which could exacerbate the risks associated with our substantial indebtedness.
We and our subsidiaries may be able to incur substantial additional indebtedness in the future. Although the Credit Facilities and the indenture governing the Senior Notes contain restrictions on the incurrence of additional indebtedness, these restrictions are subject to a number of significant qualifications and exceptions, and, under certain circumstances, the amount of indebtedness that could be incurred in compliance with these restrictions could be substantial. If new debt is added to our and our subsidiaries' existing debt levels, the related risks that we now face would increase. In addition, the Credit Facilities and the indenture governing the Senior Notes will not prevent us from incurring obligations that do not constitute indebtedness under those agreements. As of January 30, 2016, we have up to $420.9 million of additional borrowing availability under the ABL Facility, excluding letters of credit totaling approximately $25.5 million issued and outstanding.
We may not be able to generate sufficient cash to service all of our indebtedness and fund our working capital and capital expenditures, and we may be forced to take other actions to satisfy our obligations under our indebtedness, which may not be successful.
Our ability to make scheduled payments on our indebtedness will depend upon our future operating performance and on our ability to generate cash flow in the future, which is subject to general economic, financial, business, competitive, legislative, regulatory and other factors that are beyond our control. There can be no assurance that our business will generate sufficient cash flow from operations, or that future borrowings, including borrowings under the ABL Facility, will be available to us in an amount sufficient to enable us to pay our indebtedness or to fund our other liquidity needs. See "Management's Discussion and Analysis of Financial Condition and Results of Operations—Liquidity and Capital Resources."
If our cash flows and capital resources are insufficient to fund our debt service obligations, we could face substantial liquidity problems and could be forced to reduce or delay investment and capital expenditures or to dispose of material assets or operations, seek additional equity capital or restructure or refinance our indebtedness. We may not be able to affect any such alternative measures, if necessary, on commercially reasonable terms or at all and, even if successful, such alternative actions may not allow us to meet our scheduled debt service obligations. The Credit Facilities and the indenture that governs the Senior Notes contain restrictions on our ability to dispose of assets and use the proceeds from any such disposition.
In addition, we rely, to a certain extent, on our subsidiaries to generate cash. Accordingly, repayment of our indebtedness, is dependent, to a certain extent, on the generation of cash flow by our subsidiaries and their ability to make such cash available to us, by dividend, debt repayment or otherwise. Each of our subsidiaries are distinct legal entities and they do not have any obligation to pay amounts due on the notes or to make funds available for that purpose (other than the subsidiary guarantors in connection with their
26
guarantees) or other obligations in the form of loans, distributions or otherwise. Our subsidiaries may not generate sufficient cash from operations to enable us to make principal and interest payments on our indebtedness or to fund our and our subsidiaries' other cash obligations.
For example, at January 30, 2016, cash and cash equivalents held by foreign subsidiaries totaled $27.0 million. Under current tax laws and regulations, if cash and cash equivalents held outside the U.S. are repatriated to the U.S., in certain circumstances we may be subject to additional U.S. income taxes and foreign withholding taxes. We currently do not intend to repatriate amounts held by foreign subsidiaries. As such, amounts held by our foreign subsidiaries are not expected to be available to repay our indebtedness.
If we cannot make scheduled payments on our debt, we will be in default and, as a result, the holders of the Senior Notes could declare all outstanding principal and interest to be due and payable, the lenders under the Credit Facilities could declare all outstanding amounts under such facilities due and payable and, with respect to the ABL Facility, terminate their commitments to loan money, and, in each case, foreclose against the assets securing the borrowings under the Credit Facilities, and we could be forced into bankruptcy or liquidation.
If our indebtedness is accelerated, we may need to refinance all or a portion of our indebtedness before maturity. There can be no assurance that we will be able to refinance any of our indebtedness, including the Credit Facilities, on commercially reasonable terms or at all. There can be no assurance that we will be able to obtain sufficient funds to enable us to repay or refinance our debt obligations on commercially reasonable terms, or at all.
The agreements and instruments governing our debt impose restrictions that may limit our operating and financial flexibility.
The Credit Facilities and the indenture governing the Senior Notes contain a number of significant restrictions and covenants that may limit our ability to:
- •
- incur additional indebtedness;
- •
- sell assets or consolidate or merge with or into other companies;
- •
- pay dividends or repurchase or redeem capital stock;
- •
- make certain investments;
- •
- issue capital stock of our subsidiaries;
- •
- incur liens;
- •
- prepay, redeem or repurchase subordinated debt; and
- •
- enter into certain types of transactions with our affiliates.
These covenants could have the effect of limiting our flexibility in planning for or reacting to changes in our business and the markets in which we compete. In addition, the ABL Facility requires us to comply with a financial maintenance covenant under certain circumstances. Operating results below current levels or other adverse factors, including a significant increase in interest rates, could result in our being unable to comply with the financial covenants contained in the ABL Facility, if applicable. If we violate this covenant and are unable to obtain a waiver from our lenders, our debt under the ABL Facility would be in default and could be accelerated by our lenders. Because of cross-default provisions in the agreements and instruments governing our indebtedness, a default under one agreement or instrument could result in a default under, and the acceleration of, our other indebtedness. In addition, the lenders under the Credit Facilities could proceed against the collateral securing that indebtedness.
27
If our indebtedness is accelerated, we may not be able to repay our debt or borrow sufficient funds to refinance it. Even if we are able to obtain new financing, it may not be on commercially reasonable terms, on terms that are acceptable to us, or at all. If our debt is in default for any reason, our business, financial condition and results of operations could be materially and adversely affected. In addition, complying with these covenants may also cause us to take actions that make it more difficult for us to successfully execute our business strategy and compete against companies that are not subject to such restrictions.
Our variable rate indebtedness subjects us to interest rate risk, which could cause our debt service obligations to increase significantly.
We are exposed to interest rate risk through our variable rate borrowings under the Credit Facilities. Borrowings under such facilities bear interest at a variable rate, based on an adjusted LIBOR rate, plus an applicable margin. Interest rates are currently at relatively low levels. If interest rates increase, our debt service obligations on the variable rate indebtedness will increase even though the amount borrowed remained the same, and our net income and cash flows, including cash available for servicing our indebtedness, will correspondingly decrease. Assuming all capacity under the ABL Facility is fully drawn, each one percentage point change in interest rates would result in approximately a $5.0 million change in annual interest expense. Assuming LIBOR surpassed the 1% LIBOR floor provision on our Term Loan, we would be exposed to interest rate risk on such Term Loan. To partially mitigate such interest rate risk, we entered into an interest rate swap to exchange variable interest rate payments for fixed interest rate payments for a portion of the outstanding Term Loan balance. In addition, we entered into the Incremental Facility Agreement No. 1 to the credit agreement governing the Term Loan to refinance $400.0 million principal amount of term loans that bore interest at a variable rate with $400.0 million principal amount of new term loans, which bear interest at a fixed rate of 5.0% per annum. After consideration of the swap and the refinancing, each one percentage point change in interest rates would result in an approximate $2.4 million change in annual interest expense on our Term Loan.
ITEM 1B. UNRESOLVED STAFF COMMENTS
None.
28
As of January 30, 2016, we operated 1,600 retail apparel and tuxedo rental stores in 50 states, the District of Columbia and Puerto Rico and 124 retail apparel stores in ten Canadian provinces. As of January 30, 2016, our stores aggregated approximately 10.0 million square feet. Almost all of these stores are leased, generally for five to ten year initial terms with one or more renewal options after our initial term. The following tables set forth the location, by state, territory or province, of these stores:
United States
|
Men's Wearhouse(1) |
Men's Wearhouse and Tux |
Tuxedo Shops @ Macy's |
Jos. A. Bank |
K&G | Total | |||||||||||||
|---|---|---|---|---|---|---|---|---|---|---|---|---|---|---|---|---|---|---|---|
Texas |
62 | 1 | 5 | 57 | 11 | 136 | |||||||||||||
California |
81 | 9 | 3 | 38 | 1 | 132 | |||||||||||||
Florida |
49 | 17 | 47 | 5 | 118 | ||||||||||||||
Illinois |
32 | 13 | 30 | 6 | 81 | ||||||||||||||
New York |
43 | 4 | 29 | 4 | 80 | ||||||||||||||
Pennsylvania |
29 | 9 | 32 | 3 | 73 | ||||||||||||||
New Jersey |
18 | 5 | 4 | 33 | 5 | 65 | |||||||||||||
Maryland |
18 | 9 | 27 | 6 | 60 | ||||||||||||||
Massachusetts |
23 | 10 | 24 | 3 | 60 | ||||||||||||||
Ohio |
24 | 6 | 24 | 5 | 59 | ||||||||||||||
Virginia |
20 | 8 | 28 | 3 | 59 | ||||||||||||||
Georgia |
20 | 4 | 26 | 5 | 55 | ||||||||||||||
Michigan |
23 | 10 | 15 | 7 | 55 | ||||||||||||||
North Carolina |
18 | 8 | 26 | 3 | 55 | ||||||||||||||
Connecticut |
12 | 3 | 15 | 2 | 32 | ||||||||||||||
Tennessee |
14 | 4 | 12 | 2 | 32 | ||||||||||||||
Alabama |
10 | 3 | 15 | 1 | 29 | ||||||||||||||
Colorado |
14 | 1 | 11 | 3 | 29 | ||||||||||||||
Indiana |
12 | 3 | 12 | 2 | 29 | ||||||||||||||
Minnesota |
13 | 4 | 9 | 2 | 28 | ||||||||||||||
Missouri |
12 | 3 | 12 | 1 | 28 | ||||||||||||||
South Carolina |
10 | 5 | 11 | 1 | 27 | ||||||||||||||
Arizona |
15 | 1 | 9 | 25 | |||||||||||||||
Washington |
15 | 1 | 7 | 2 | 25 | ||||||||||||||
Wisconsin |
13 | 4 | 7 | 1 | 25 | ||||||||||||||
Louisiana |
11 | 5 | 4 | 3 | 23 | ||||||||||||||
Kentucky |
7 | 3 | 8 | 18 | |||||||||||||||
Kansas |
6 | 2 | 5 | 1 | 14 | ||||||||||||||
Oregon |
11 | 2 | 13 | ||||||||||||||||
Utah |
9 | 4 | 13 | ||||||||||||||||
Iowa |
9 | 3 | 12 | ||||||||||||||||
Oklahoma |
5 | 6 | 1 | 12 | |||||||||||||||
Nevada |
6 | 1 | 3 | 10 | |||||||||||||||
New Hampshire |
5 | 1 | 4 | 10 | |||||||||||||||
Arkansas |
5 | 4 | 9 | ||||||||||||||||
Mississippi |
5 | 4 | 9 | ||||||||||||||||
District of Columbia |
2 | 5 | 7 | ||||||||||||||||
Nebraska |
4 | 3 | 7 | ||||||||||||||||
Rhode Island |
1 | 2 | 4 | 7 | |||||||||||||||
Delaware |
3 | 3 | 6 | ||||||||||||||||
New Mexico |
4 | 2 | 6 | ||||||||||||||||
West Virginia |
2 | 3 | 5 | ||||||||||||||||
Idaho |
3 | 1 | 4 | ||||||||||||||||
Maine |
2 | 1 | 3 | ||||||||||||||||
North Dakota |
3 | 3 | |||||||||||||||||
South Dakota |
2 | 1 | 3 | ||||||||||||||||
Alaska |
2 | 2 | |||||||||||||||||
Montana |
2 | 2 | |||||||||||||||||
Puerto Rico |
2 | 2 | |||||||||||||||||
Hawaii |
1 | 1 | |||||||||||||||||
Vermont |
1 | 1 | |||||||||||||||||
Wyoming |
1 | 1 | |||||||||||||||||
| | | | | | | | | | | | | | | | | | | | |
Total |
714 | 160 | 12 | 625 | 89 | 1,600 | |||||||||||||
| | | | | | | | | | | | | | | | | | | | |
| | | | | | | | | | | | | | | | | | | | |
| | | | | | | | | | | | | | | | | | | | |
- (1)
- Includes one Joseph Abboud store in New York.
29
Canada
|
Moores | |||
|---|---|---|---|---|
Ontario |
54 | |||
Quebec |
23 | |||
British Columbia |
16 | |||
Alberta |
15 | |||
Manitoba |
5 | |||
Nova Scotia |
4 | |||
New Brunswick |
3 | |||
Saskatchewan |
2 | |||
Newfoundland |
1 | |||
Prince Edward Island |
1 | |||
| | | | | |
Total |
124 | |||
| | | | | |
| | | | | |
| | | | | |
We own or lease properties in various parts of the U.S. and Canada to facilitate the distribution of retail and rental product to our stores. We own or lease properties in Houston, Texas, Hampstead and Eldersburg, Maryland and, to facilitate the distribution of our corporate apparel product, various parts of the UK. Total leased and owned space for distribution is approximately 2.2 million square feet and 2.8 million square feet, respectively.
In addition, we have primary office locations in Houston, Texas, Fremont, California, New York, New York and Hampstead, Maryland with additional satellite offices in other parts of the U.S., Canada and Europe. We lease approximately 0.5 million square feet and own approximately 0.3 million square feet of office space.
We are involved in various routine legal proceedings, including ongoing litigation. Management believes that none of these matters will have a material adverse effect on our financial position, results of operations or cash flows. See Note 18 of Notes to Consolidated Financial Statements for a discussion of our legal proceedings.
ITEM 4. MINE SAFETY DISCLOSURES
Not applicable.
30
ITEM 5. MARKET FOR REGISTRANT'S COMMON EQUITY, RELATED STOCKHOLDER MATTERS AND ISSUER PURCHASES OF EQUITY SECURITIES
Through January 30, 2016, our common stock traded on the NYSE under the symbol "MW". Beginning on February 1, 2016, Tailored Brands replaced Men's Wearhouse as the publicly held corporation and its common stock trades on the NYSE under the trading symbol "TLRD".
The following table sets forth, on a per share basis for the periods indicated, the high and low sale prices per share for our common stock as reported by the NYSE and the quarterly dividends declared on each share of common stock:
| |
High | Low | Dividend | |||||||
|---|---|---|---|---|---|---|---|---|---|---|
Fiscal Year 2015 |
||||||||||
First quarter |
$ | 57.83 | $ | 45.89 | $ | 0.18 | ||||
Second quarter |
66.18 | 56.88 | 0.18 | |||||||
Third quarter |
60.02 | 37.46 | 0.18 | |||||||
Fourth quarter |
41.94 | 9.95 | 0.18 | |||||||
Fiscal Year 2014 |
||||||||||
First quarter |
$ | 58.80 | $ | 41.89 | $ | 0.18 | ||||
Second quarter |
59.07 | 47.08 | 0.18 | |||||||
Third quarter |
55.45 | 43.13 | 0.18 | |||||||
Fourth quarter |
48.86 | 39.77 | 0.18 | |||||||
On March 18, 2016, there were approximately 880 shareholders of record and approximately 13,000 beneficial shareholders of our common stock.
The cash dividend of $0.18 per share declared by our Board of Directors (the "Board") in January 2016 is payable on March 25, 2016 to shareholders of record on March 15, 2016.
The Credit Facilities and the indenture governing the Senior Notes contain covenants that, among other things, limit the Company's ability to pay dividends on the Company's common stock in excess of $10.0 million per quarter. See Note 6 of Notes to Consolidated Financial Statements for additional information on our financing arrangements.
The information required by this item regarding securities authorized for issuance under equity compensation plans is incorporated by reference from Item 12 of this Form 10-K.
Issuer Purchases of Equity Securities
We did not purchase any of our equity securities during the fourth quarter of fiscal 2015. In March 2013, the Board approved a $200.0 million share repurchase program for our common stock, which amended and replaced the Company's then existing share repurchase program authorized in January 2011. At January 30, 2016, the remaining balance available under the Board's March 2013 authorization was $48.0 million.
Sales of Unregistered Securities
During fiscal 2015 and 2014, we issued 8,804 and 8,805 shares of common stock, respectively, to Joseph Abboud pursuant to the terms of the consulting agreement between the Company and Mr. Abboud. The shares of common stock were not registered under the Securities Act of 1933, as amended (the "Securities Act") pursuant to the exemption from registration requirements provided by Section 4(a)(2) of the Securities Act, as a transaction by an issuer not involving a public offering. The offering was not a "public offering" as defined in Section 4(a)(2) due to the insubstantial number of persons involved in the transaction, size of the offering, manner of the offering and number of securities offered.
31
Performance Graph
The following Performance Graph and related information shall not be deemed "soliciting material" or to be "filed" with the Securities and Exchange Commission, nor shall such information be incorporated by reference into any future filing under the Securities Act of 1933 or Securities Exchange Act of 1934, each as amended, except to the extent that the Company specifically incorporates it by reference into such filing.
The following graph compares, as of each of the dates indicated, the percentage change in the Company's cumulative total shareholder return on the Common Stock with the cumulative total return of the S&P 500 Index and a subset of companies in the S&P Retail Select Index ("Select Group").
The graph assumes that the value of the investment in our Common Stock and each index was $100 at January 29, 2011 and that all dividends paid by those companies included in the indices were reinvested.
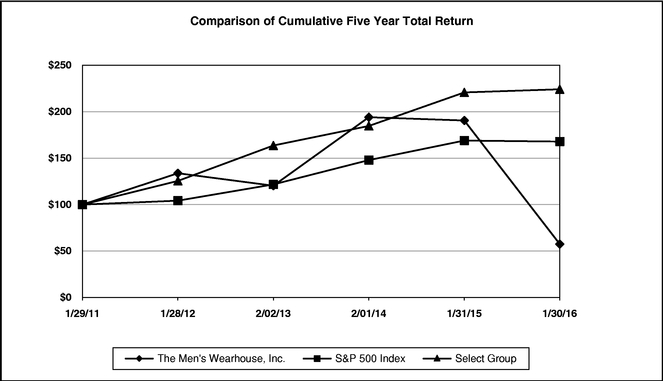
| |
January 29, 2011 |
January 28, 2012 |
February 2, 2013 |
February 1, 2014 |
January 31, 2015 |
January 30, 2016 |
|||||||||||||
|---|---|---|---|---|---|---|---|---|---|---|---|---|---|---|---|---|---|---|---|
Measurement Period (Fiscal Year Covered) |
|||||||||||||||||||
The Men's Wearhouse, Inc. |
$ | 100.00 | $ | 133.75 | $ | 120.31 | $ | 194.07 | $ | 190.52 | $ | 57.50 | |||||||
S&P 500 Index |
100.00 | 104.22 | 121.71 | 147.89 | 168.93 | 167.81 | |||||||||||||
Select Group(1) |
100.00 | 125.50 | 163.61 | 184.65 | 220.75 | 224.14 | |||||||||||||
- (1)
- For purposes of this graph, the select group currently consists of the following companies: Abercrombie & Fitch Co., American Eagle Outfitters, Inc., Ascena Retail Group, Inc., Caleres, Inc., Chico's FAS, Inc., Citi Trends, Inc., DSW, Inc., Express, Inc., Finish Line, Inc., Foot Locker, Inc., Francesca's Holdings Corporation, Genesco, Inc., Guess?, Inc., L Brands, Inc., Ross Stores, Inc., The Buckle, Inc., The Cato Corporation, The Children's Place, Inc., The Gap, Inc., The TJX Companies, Inc., Urban Outfitters, Inc. and Zumiez, Inc.
The foregoing graph is based on historical data and is not necessarily indicative of future performance.
32
ITEM 6. SELECTED FINANCIAL DATA
The following selected statement of (loss) earnings, balance sheet and cash flow information for the fiscal years indicated has been derived from our audited consolidated financial statements. The Selected Financial Data should be read in conjunction with "Management's Discussion and Analysis of Financial Condition and Results of Operations" and the Consolidated Financial Statements and notes thereto. References herein to years are to the Company's 52-week or 53-week fiscal year, which ends on the Saturday nearest January 31 in the following calendar year. For example, references to "2015" mean the fiscal year ended January 30, 2016. All fiscal years for which financial information is included herein had 52 weeks with the exception of fiscal 2012, which ended on February 2, 2013 and had 53 weeks.
As a result of the acquisitions of Jos. A. Bank on June 18, 2014 and JA Holding on August 6, 2013, the statements of (loss) earnings data and cash flow information below for the years ended January 30, 2016, January 31, 2015, and February 1, 2014, include the results of operations and cash flows, since each respective acquisition date. In addition, the balance sheet information below as of January 30, 2016, January 31, 2015, and February 1, 2014 includes the fair values of the assets acquired and liabilities assumed as of the acquisition date for Jos. A. Bank and JA Holding, respectively.
| |
2015 | 2014 | 2013 | 2012 | 2011 | |||||||||||
|---|---|---|---|---|---|---|---|---|---|---|---|---|---|---|---|---|
| |
(Dollars and shares in thousands, except per share and per square foot data) |
|||||||||||||||
Statement of (Loss) Earnings Data: |
||||||||||||||||
Total net sales |
$ | 3,496,271 | $ | 3,252,548 | $ | 2,473,233 | $ | 2,488,278 | $ | 2,382,684 | ||||||
Total gross margin |
1,484,423 | 1,358,614 | 1,089,010 | 1,108,148 | 1,048,927 | |||||||||||
Goodwill and intangible asset impairment charges(1) |
1,243,354 | — | 11,349 | — | — | |||||||||||
Operating (loss) income |
(1,077,296 | ) | 73,210 | 129,628 | 198,568 | 185,432 | ||||||||||
Net (loss) earnings attributable to common shareholders |
(1,026,719 | ) | (387 | ) | 83,791 | 131,716 | 120,601 | |||||||||
Per Common Share Data: |
||||||||||||||||
Diluted net (loss) earnings per common share attributable to common shareholders |
$ | (21.26 | ) | $ | (0.01 | ) | $ | 1.70 | $ | 2.55 | $ | 2.30 | ||||
Cash dividends declared |
$ | 0.72 | $ | 0.72 | $ | 0.72 | $ | 0.72 | $ | 0.54 | ||||||
Weighted-average common shares outstanding—diluted |
48,288 | 47,899 | 49,162 | 51,026 | 51,692 | |||||||||||
Operating Information: |
||||||||||||||||
Percentage increase/(decrease) in comparable sales(2): |
||||||||||||||||
Men's Wearhouse |
4.9 | % | 3.9 | % | 0.7 | % | 4.8 | % | 9.1 | % | ||||||
Jos. A. Bank |
(16.4 | )% | — | — | — | — | ||||||||||
Moores |
(1.7 | )% | 8.6 | % | (4.1 | )% | 1.5 | % | 4.5 | % | ||||||
K&G |
5.0 | % | 3.7 | % | (5.5 | )% | (4.3 | )% | 3.6 | % | ||||||
Average net sales per square foot(3): |
||||||||||||||||
Men's Wearhouse |
$ | 411 | $ | 399 | $ | 386 | $ | 389 | $ | 376 | ||||||
Jos. A. Bank |
$ | 255 | — | — | — | — | ||||||||||
Moores |
$ | 370 | $ | 372 | $ | 345 | $ | 361 | $ | 358 | ||||||
K&G |
$ | 160 | $ | 152 | $ | 145 | $ | 153 | $ | 157 | ||||||
Average square footage(4): |
||||||||||||||||
Men's Wearhouse |
5,642 | 5,667 | 5,710 | 5,721 | 5,705 | |||||||||||
Men's Wearhouse and Tux |
1,397 | 1,387 | 1,387 | 1,372 | 1,384 | |||||||||||
Jos. A. Bank |
4,609 | 4,595 | — | — | — | |||||||||||
Moores |
6,289 | 6,334 | 6,358 | 6,362 | 6,339 | |||||||||||
K&G |
23,619 | 23,784 | 23,710 | 23,704 | 23,750 | |||||||||||
33
| |
2015 | 2014 | 2013 | 2012 | 2011 | |||||||||||
|---|---|---|---|---|---|---|---|---|---|---|---|---|---|---|---|---|
| |
(Dollars in thousands) |
|||||||||||||||
Number of retail stores: |
||||||||||||||||
Open at beginning of the period |
1,758 | 1,124 | 1,143 | 1,166 | 1,192 | |||||||||||
Acquired from Jos. A. Bank(5) |
— | 624 | — | — | — | |||||||||||
Opened |
42 | 60 | 25 | 37 | 25 | |||||||||||
Closed |
(76 | ) | (50 | ) | (44 | ) | (60 | ) | (51 | ) | ||||||
| | | | | | | | | | | | | | | | | |
Open at end of the period |
1,724 | 1,758 | 1,124 | 1,143 | 1,166 | |||||||||||
| | | | | | | | | | | | | | | | | |
| | | | | | | | | | | | | | | | | |
| | | | | | | | | | | | | | | | | |
Men's Wearhouse(6) |
714 | 698 | 661 | 638 | 607 | |||||||||||
Men's Wearhouse and Tux |
160 | 210 | 248 | 288 | 343 | |||||||||||
Tuxedo Shops @ Macy's |
12 | — | — | — | — | |||||||||||
Jos. A. Bank(5) |
625 | 636 | — | — | — | |||||||||||
Moores |
124 | 123 | 121 | 120 | 117 | |||||||||||
K&G |
89 | 91 | 94 | 97 | 99 | |||||||||||
| | | | | | | | | | | | | | | | | |
Total |
1,724 | 1,758 | 1,124 | 1,143 | 1,166 | |||||||||||
| | | | | | | | | | | | | | | | | |
| | | | | | | | | | | | | | | | | |
| | | | | | | | | | | | | | | | | |
Cash Flow Information: |
||||||||||||||||
Capital expenditures |
$ | 115,498 | $ | 96,420 | $ | 108,200 | $ | 121,433 | $ | 91,820 | ||||||
Depreciation and amortization |
132,329 | 112,659 | 88,749 | 84,979 | 75,968 | |||||||||||
Repurchases of common stock |
277 | 251 | 152,129 | 41,296 | 63,988 | |||||||||||
| |
January 30, 2016 |
January 31, 2015 |
February 1, 2014 |
February 2, 2013 |
January 28, 2012 |
|||||||||||
|---|---|---|---|---|---|---|---|---|---|---|---|---|---|---|---|---|
Balance Sheet Information: |
||||||||||||||||
Cash and cash equivalents |
$ | 29,980 | $ | 62,261 | $ | 59,252 | $ | 156,063 | $ | 125,306 | ||||||
Inventories |
1,022,504 | 938,336 | 599,486 | 556,531 | 572,502 | |||||||||||
Working capital |
723,593 | 752,261 | 479,808 | 560,970 | 544,108 | |||||||||||
Total assets |
2,244,319 | 3,508,212 | 1,555,230 | 1,496,347 | 1,405,952 | |||||||||||
Long-term debt, including current portion |
1,655,924 | 1,648,686 | 97,500 | — | — | |||||||||||
Total (deficit) equity |
(100,086 | ) | 969,789 | 1,023,149 | 1,109,235 | 1,031,819 | ||||||||||
- (1)
- See
Note 3 to the consolidated financial statements for additional information.
- (2)
- Comparable
sales data is calculated by excluding the net sales of a store for any month of one period if the store was not owned or open
throughout the same month of the prior period and, beginning in 2013, include e-commerce net sales. We operate our business using an omni-channel approach and do not differentiate e-commerce sales
from our other channels. Comparable sales percentages for Moores are calculated using Canadian dollars. Comparable sales for Jos. A. Bank are calculated in the same manner as our other brands
except that it is based on Jos. A. Bank's entire fiscal 2014, a portion of which was prior to our acquisition on June 18, 2014.
- (3)
- Average
net sales per square foot is calculated by dividing total square footage for all stores owned or open the entire year into net sales
for those stores. The calculation for Men's Wearhouse includes Men's Wearhouse and Tux stores. The calculation for Moores is based upon the Canadian dollar. For fiscal 2012, the calculation excludes
total sales for the 53rd week.
- (4)
- Average
square footage is calculated by dividing the total square footage for all stores open at the end of the period by the number of stores
open at the end of such period.
- (5)
- For
2015 and 2014 excludes 14 and 15 franchise stores, respectively.
- (6)
- For 2015, includes one Joseph Abboud store.
34
ITEM 7. MANAGEMENT'S DISCUSSION AND ANALYSIS OF FINANCIAL CONDITION AND RESULTS OF OPERATIONS
Executive Overview
Background
Effective January 31, 2016, Tailored Brands, Inc., a Texas corporation ("Tailored Brands"), became the successor reporting company to The Men's Wearhouse, Inc., pursuant to a holding company reorganization. We believe that the holding company structure will allow us to support, nurture and augment our family of brands as we further leverage our shared services platform. As a result, beginning in the first quarter of 2016, we implemented legal and operational changes in how we manage our business, including resource allocation and performance assessment. In future periods, we expect to report three operating segments: retail, corporate apparel and shared services.
We are the largest specialty retailer of men's suits and the largest provider of rental product in the U.S. and Canada with 1,724 stores including tuxedo shops within Macy's stores. Our operations are conducted in two reportable segments, retail and corporate apparel, based on the way we manage, evaluate and internally report our business activities. Refer to Item 1, "Business" of this Annual Report on Form 10-K as well as Note 17 of Notes to Consolidated Financial Statements and the discussion included in "Results of Operations" below for additional information and disclosures regarding our reporting segments.
On June 10, 2015, we entered into a 10-year agreement with Macy's, Inc. to operate men's tuxedo rental shops inside 300 Macy's stores. As of January 30, 2016, we operated 12 tuxedo shops within Macy's stores under the name "The Tuxedo Shop @ Macy's." We have refined our Tuxedo Shop @ Macy's rollout schedule and now plan to open 166 stores in 2016 with the balance of 122 stores to be opened in 2017. In addition, we will collaborate with Macy's to develop an online tuxedo rental shop.
On June 18, 2014, we acquired 100% of the outstanding common stock of Jos. A. Bank, a men's specialty apparel retailer, for $65.00 net per share in cash, or total consideration of approximately $1.8 billion. As a result, the comparability of our results is affected by the inclusion of Jos. A. Bank's results for the entire fiscal year ended January 30, 2016, while last year's operations include Jos. A. Bank's results beginning on June 18, 2014.
Summary of Financial Performance
Our fiscal 2015 operating performance was negatively impacted by (i) goodwill and intangible asset impairment charges related to our Jos. A. Bank brand, (ii) restructuring and other charges resulting primarily from our store rationalization program which identified approximately 250 stores to be closed in fiscal 2016, and (iii) a decrease in revenues and profitability at our Jos. A. Bank brand primarily driven by our decision to remove the most excessive promotional offers (the Buy-One-Get-Three Free or more events). In order to mitigate the impact of our decision to remove the most excessive promotional offers at Jos. A. Bank, we introduced new promotional offers that do not require excessive quantity purchases and are better aligned with how our customers have told us they prefer to shop. Our customer research indicates while our existing customers appreciate our quality and value, many dislike being forced to buy in quantity and many of our prospective Jos. A. Bank customers found our promotional offers confusing and caused them to question the quality of our products. By contrast, in fiscal 2015, our Men's Wearhouse/Men's Wearhouse and Tux ("Men's Wearhouse") brand performed well, generating a comparable sales increase of 4.9%, with clothing comparable sales of 6.8%, partially offset by a rental service comparable sales decrease of 0.7%.
35
Key operating metrics for the year ended January 30, 2016 include:
- •
- Net sales increase of 7.5%
- •
- Comparable sales increase at Men's Wearhouse and K&G of 4.9% and 5.0%, respectively, while comparable sales at Jos. A. Bank and
Moores decreased 16.4% and 1.7%, respectively.
- •
- Operating loss of $1,077.3 million, which includes goodwill and intangible asset impairment charges of $1,243.4 million,
compared to operating income of $73.2 million in fiscal 2014.
- •
- Diluted loss per share of $21.26 compared to diluted loss of $0.01 per share in fiscal 2014
Key liquidity metrics for the year ended January 30, 2016 include:
- •
- Cash provided by operating activities was $131.7 million in fiscal 2015 compared to $94.8 million in fiscal 2014
- •
- Capital expenditures were $115.5 million in fiscal 2015 compared to $96.4 million in fiscal 2014
- •
- We repaid $8.0 million on our term loan and had no borrowings outstanding on our credit facility as of January 30, 2016
- •
- Dividends paid totaled $35.0 million in fiscal 2015
Items Affecting Comparability of Results
The comparability of our results has been impacted by certain items, primarily related to impairment of Jos. A. Bank's goodwill and other intangible assets, restructuring and other costs primarily reflecting costs related to our store rationalization program and acquisition and integration costs for Jos. A. Bank. A summary of the effect of these items on pretax income for each applicable fiscal year is presented below (dollars in millions):
| |
Fiscal Year | |||||||||
|---|---|---|---|---|---|---|---|---|---|---|
| |
2015 | 2014 | 2013 | |||||||
Impairment of Jos. A. Bank goodwill and intangible assets |
$ | 1,243.4 | $ | — | $ | — | ||||
Restructuring and other charges, primarily related to our store rationalization program |
35.9 | — | — | |||||||
Acquisition and integration costs related to Jos. A. Bank |
18.7 | 95.0 | — | |||||||
Purchase accounting adjustment for the step up of Jos. A. Bank inventory |
0.9 | 33.5 | — | |||||||
Other purchase accounting related charges |
9.8 | 5.4 | — | |||||||
Costs related to a JA Holding licensee arbitration award |
— | 42.6 | — | |||||||
Acquisition and integration costs related to JA Holding |
— | 3.7 | 6.7 | |||||||
Loss on extinguishment of debt related to Jos. A. Bank financing arrangements |
12.7 | 2.2 | — | |||||||
Impairment of K&G goodwill |
— | — | 9.5 | |||||||
Other costs including various strategic projects, separation costs with former executives, cost reduction initiatives and asset impairment charges(1) |
7.1 | 4.2 | 22.6 | |||||||
| | | | | | | | | | | |
Total |
$ | 1,328.5 | $ | 186.6 | $ | 38.8 | ||||
| | | | | | | | | | | |
| | | | | | | | | | | |
| | | | | | | | | | | |
- (1)
- Includes $1.8 million gain on the sale of property in 2015, $3.4 million gain on settlement of litigation in 2014 and $2.2 million gain on the sale of an office building in 2013.
36
2016 Initiatives
During the fourth quarter of fiscal 2015, we began implementing multiple initiatives intended to reduce costs and improve operating performance. These initiatives include a store rationalization program which identified approximately 250 stores to be closed as well as a profit improvement program to drive operating efficiencies and improve our expense structure. The store rationalization program includes the closure of approximately 80 to 90 Jos. A. Bank full line stores, the closure of all outlet stores at Jos. A. Bank and Men's Wearhouse (58 stores) and the closure of between 100 and 110 Men's Wearhouse and Tux stores primarily as the result of the rollout of our shops within Macy's stores. We expect the store rationalization and profit improvement programs to be completed in fiscal 2016.
We expect the profit improvement program to reduce our expenses by approximately $50.0 million in fiscal 2016. This program includes reduced distribution costs, cost reductions in our organizational structure, payroll and employee benefit reductions and savings in occupancy and goods-not-for-resale.
We estimate the cash costs to complete the store rationalization and profit improvement programs to be between $45.0 and $60.0 million in fiscal 2016, primarily consisting of lease termination costs and consulting and severance costs.
Store Information
During fiscal 2015, we opened 42 stores/tuxedo shops (18 Men's Wearhouse stores, 12 shops within Macy's stores, eight Jos. A. Bank stores, two Moores stores, one Joseph Abboud store and one K&G store) and closed 76 stores (50 Men's Wearhouse and Tux stores, 19 Jos. A. Bank stores, three Men's Wearhouse stores, three K&G stores and one Moores store).
In fiscal 2016, we plan to open 166 shops within Macy's stores, 15 to 20 Men's Wearhouse stores, three Moores stores, two Jos. A. Bank stores and two K&G stores and to expand and/or relocate approximately 8 to 12 existing Men's Wearhouse stores, four to eight existing Jos. A. Bank stores and one existing K&G store. We also plan to close 130 to 140 Jos. A. Bank stores, 100 to 110 Men's Wearhouse and Tux stores and 10 Men's Wearhouse stores.
37
Results of Operations
The following table sets forth our results of operations expressed as a percentage of net sales for the periods indicated:
| |
Fiscal Year(1) | |||||||||
|---|---|---|---|---|---|---|---|---|---|---|
| |
2015 | 2014 | 2013 | |||||||
Net sales: |
||||||||||
Retail clothing product |
74.4 | % | 72.7 | % | 67.4 | % | ||||
Rental services |
12.7 | 13.6 | 16.7 | |||||||
Alteration and other services |
6.0 | 5.7 | 5.9 | |||||||
| | | | | | | | | | | |
Total retail sales |
93.0 | 92.1 | 90.0 | |||||||
Corporate apparel clothing product |
7.0 | 7.9 | 10.0 | |||||||
| | | | | | | | | | | |
Total net sales |
100.0 | % | 100.0 | % | 100.0 | % | ||||
Cost of sales(2): |
||||||||||
Retail clothing product |
44.6 | 46.4 | 44.5 | |||||||
Rental services |
17.3 | 19.2 | 15.6 | |||||||
Alteration and other services |
69.7 | 71.8 | 77.4 | |||||||
Occupancy costs |
14.0 | 13.2 | 13.1 | |||||||
| | | | | | | | | | | |
Total retail cost of sales |
56.5 | 57.2 | 54.4 | |||||||
Corporate apparel clothing product |
71.1 | 70.2 | 70.2 | |||||||
| | | | | | | | | | | |
Total cost of sales |
57.5 | 58.2 | 56.0 | |||||||
Gross margin(2): |
||||||||||
Retail clothing product |
55.4 | 53.6 | 55.5 | |||||||
Rental services |
82.7 | 80.8 | 84.4 | |||||||
Alteration and other services |
30.3 | 28.2 | 22.6 | |||||||
Occupancy costs |
(14.0 | ) | (13.2 | ) | (13.1 | ) | ||||
| | | | | | | | | | | |
Total retail gross margin |
43.5 | 42.8 | 45.6 | |||||||
Corporate apparel clothing product |
28.9 | 29.8 | 29.8 | |||||||
| | | | | | | | | | | |
Total gross margin |
42.5 | 41.8 | 44.0 | |||||||
Advertising expense |
5.9 | 5.2 | 4.1 | |||||||
Selling, general and administrative expenses |
31.1 | 34.3 | 34.2 | |||||||
Goodwill and intangible asset impairment charges |
35.6 | — | 0.5 | |||||||
Asset impairment charges |
0.8 | 0.0 | 0.0 | |||||||
| | | | | | | | | | | |
Operating (loss) income |
(30.8 | ) | 2.3 | 5.2 | ||||||
Interest income |
0.0 | 0.0 | 0.0 | |||||||
Interest expense |
(3.0 | ) | (2.0 | ) | (0.1 | ) | ||||
Loss on extinguishment of debt |
(0.4 | ) | (0.1 | ) | — | |||||
| | | | | | | | | | | |
(Loss) earnings before income taxes |
(34.2 | ) | 0.2 | 5.1 | ||||||
(Benefit) provision for income taxes |
(4.8 | ) | 0.2 | 1.7 | ||||||
| | | | | | | | | | | |
Net (loss) earnings including non-controlling interest |
(29.4 | ) | (0.0 | ) | 3.4 | |||||
Net earnings attributable to non-controlling interest |
— | 0.0 | 0.0 | |||||||
| | | | | | | | | | | |
Net (loss) earnings attributable to common shareholders |
(29.4 | )% | (0.0 | )% | 3.4 | % | ||||
| | | | | | | | | | | |
| | | | | | | | | | | |
| | | | | | | | | | | |
- (1)
- Percentage
line items may not sum to totals due to the effect of rounding.
- (2)
- Calculated as a percentage of related sales.
38
2015 Compared with 2014
Net Sales
Total net sales increased $243.7 million, or 7.5%, to $3,496.3 million for fiscal 2015 as compared to fiscal 2014.
Total retail sales increased $257.3 million, or 8.6%, to $3,252.5 million for fiscal 2015 as compared to fiscal 2014 due mainly to $182.9 million of incremental net sales from Jos. A. Bank, as fiscal 2015 includes full year results from Jos. A. Bank while fiscal 2014 represented results only from the date of acquisition. Total retail sales also increased due to retail clothing product and alteration revenues from our other brands of $81.2 million partially offset by a decrease in rental services revenue from our other brands of $8.3 million. The net increase is attributable to the following:
(in millions)
|
Amount attributed to | ||
|---|---|---|---|
| $ | 182.9 | Increase in net sales from Jos. A. Bank. | |
| 76.4 | 4.9% increase in comparable sales at Men's Wearhouse. | ||
| (3.6 | ) | 1.7% decrease in comparable sales at Moores.(1) | |
| 15.5 | 5.0% increase in comparable sales at K&G. | ||
| 28.9 | Increase from net sales of stores opened in 2014, relocated stores and expanded stores not included in comparable sales.(2) | ||
| 13.0 | Increase in net sales from new stores opened in 2015.(2) | ||
| (30.8 | ) | Decrease in net sales resulting from closed stores. | |
| (35.9 | ) | Decrease in net sales resulting from change in U.S./Canadian dollar exchange rate. | |
| 10.9 | Other.(2) | ||
| | | | |
| $ | 257.3 | Increase in total retail sales. | |
| | | | |
| | | | |
| | | | |
- (1)
- Comparable
sales percentages for Moores are calculated using Canadian dollars.
- (2)
- Excludes Jos. A. Bank.
Comparable sales for Men's Wearhouse, Jos. A. Bank, Moores and K&G exclude the net sales of a store for any month of one period if the store was not open throughout the same month of the prior period and include e-commerce net sales. We operate our business using an omni-channel approach and do not differentiate e-commerce sales from our other channels.
The increase at Men's Wearhouse resulted primarily from increased average unit retails (net selling prices) and average transactions per store that more than offset decreased units sold per transaction. The decrease at Moores was driven by decreased average transactions per store and units sold per transaction that more than offset increased average unit retails. The increase at K&G was driven by increased average transactions per store and units sold per transaction while average unit retails were flat. At Men's Wearhouse, rental service comparable sales decreased 0.7% primarily due to a decrease in unit rentals partially offset by an increase in rental rates.
Comparable sales for Jos. A. Bank decreased by 16.4% and are calculated in the same manner as our other brands except that it is based on Jos. A. Bank's entire fiscal 2014, a portion of which was prior to our acquisition on June 18, 2014.
Total corporate apparel clothing product sales decreased $13.6 million to $243.8 million for fiscal 2015 as compared to fiscal 2014. UK corporate apparel sales decreased $11.7 million due to unfavorable currency fluctuations this year compared to last year. U.S. corporate apparel sales decreased $1.9 million due primarily to decreased sales from existing customer programs.
39
Gross Margin
Buying and distribution costs are included in determining our retail and corporate apparel clothing product gross margins. Our gross margin may not be comparable to other specialty retailers, as some companies exclude costs related to their distribution network from cost of goods sold while others, like us, include all or a portion of such costs in cost of goods sold and exclude them from SG&A expenses. Distribution costs are not included in determining our rental services gross margin as these costs are included in SG&A expenses.
Our total gross margin increased $125.8 million, or 9.3%, to $1,484.4 million for fiscal 2015 as compared to fiscal 2014. During fiscal 2015, as a result of our store rationalization program, we incurred $11.0 million of inventory write-offs as well as a $4.8 million charge related to discontinued rental product, both of which negatively impacted our gross margin results. During fiscal 2014, $33.5 million of inventory valuation step up related to Jos. A. Bank and a $10.6 million charge to rationalize our rental product to allow for more productive rental styles were incurred and negatively impacted our gross margin results.
Total retail segment gross margin increased $132.2 million or 10.3% from fiscal 2014 to $1,414.1 million in fiscal 2015. The dollar increase in gross margin was primarily driven by $98.0 million of incremental gross margin generated by Jos. A. Bank as well as by higher sales from our Men's Wearhouse brand.
For the retail segment, total gross margin as a percentage of related sales increased from 42.8% in fiscal 2014 to 43.5% in fiscal 2015 driven primarily by an increase in the rental services margin as well as a higher retail clothing product gross margin rate, which was negatively impacted last year by the inventory step up at Jos. A. Bank.
Occupancy costs increased $60.0 million primarily due to incremental Jos. A. Bank occupancy costs. Occupancy costs as a percentage of retail sales, which is relatively constant on a per store basis and includes store related rent, common area maintenance, utilities, repairs and maintenance, security, property taxes and depreciation, increased from 13.2% in fiscal 2014 to 14.0% in fiscal 2015, primarily due to deleveraging of occupancy costs at Jos. A. Bank as well as Jos A. Bank's occupancy costs being higher as a percentage of sales than our other brands.
Corporate apparel gross margin decreased $6.4 million or 8.3% from fiscal 2014 to $70.3 million in fiscal 2015. For the corporate apparel segment, total gross margin as a percentage of related sales decreased from 29.8% in fiscal 2014 to 28.9% in fiscal 2015 primarily due to unfavorable currency impacts at our UK operations.
Advertising Expense
Advertising expense increased to $205.0 million in fiscal 2015 from $168.3 million in fiscal 2014, an increase of $36.7 million or 21.8%. The increase was primarily due to incremental Jos. A. Bank advertising costs as well as increased advertising expense to support branding initiatives. As a percentage of total net sales, these expenses increased from 5.2% in fiscal 2014 to 5.9% in fiscal 2015.
40
Selling, General and Administrative Expenses
SG&A expenses decreased to $1,085.9 million in fiscal 2015 from $1,116.8 million in fiscal 2014, a decrease of $30.9 million or 2.8%. As a percentage of total net sales, these expenses decreased from 34.3% in fiscal 2014 to 31.1% in fiscal 2015. The components of this 3.2% net decrease in SG&A expenses as a percentage of total net sales and the related dollar changes were as follows:
| |
% | in millions | Attributed to | |||||
|---|---|---|---|---|---|---|---|---|
| (2.2 | ) | $ | (69.4 | ) | Decrease in acquisition, integration and other costs as a percentage of sales from 2.8% in fiscal 2014 to 0.6% in fiscal 2015. For fiscal 2015, these costs totaled $22.7 million, related primarily to Jos. A. Bank acquisition and integration costs, separation costs with former executives and costs associated with our profit improvement plan, partially offset by a $1.8 million gain on the sale of property. For fiscal 2014, such costs totaled $92.1 million related primarily to Jos. A. Bank acquisition and integration costs and other cost reduction initiatives, partially offset by a $3.4 million favorable litigation settlement. | |||
| (1.3 | ) | (42.6 | ) | Decrease in expense of $42.6 million related to an arbitration award last year. | ||||
| 0.1 | 4.5 | Increase in amortization of intangible assets as a percentage of sales from 0.3% in fiscal 2014 to 0.4% in fiscal 2015. Amortization of intangible assets in dollars increased primarily due to intangible asset amortization recorded in connection with the Jos. A. Bank acquisition. | ||||||
| 0.5 | 46.4 | Increase in store salaries as a percentage of sales from 12.2% in fiscal 2014 to 12.7% in fiscal 2015. Store salaries in dollars increased primarily due to the impact of Jos. A. Bank store salaries and higher commissions at Men's Wearhouse resulting from higher sales. | ||||||
| (0.3 | ) | 30.2 | Decrease in other SG&A expenses as a percentage of sales from 17.7% in fiscal 2014 to 17.4% in fiscal 2015. Other SG&A expenses in dollars increased primarily due to incremental other SG&A expenses for Jos. A. Bank as well as increased employee related and non-store payroll costs. | |||||
| | | | | | | | | |
| (3.2 | ) | $ | (30.9 | ) | Total | |||
| | | | | | | | | |
| | | | | | | | | |
| | | | | | | | | |
In the retail segment, SG&A expenses as a percentage of related net sales decreased from 35.1% in fiscal 2014 to 31.5% in fiscal 2015. Retail segment SG&A expenses decreased $26.9 million primarily due to a decrease in acquisition, integration and other costs and litigation costs related to an arbitration award partially offset by a full year of operating expenses for Jos. A. Bank.
In the corporate apparel segment, SG&A expenses as a percentage of related net sales decreased from 25.2% in fiscal 2014 to 25.0% in fiscal 2015. Corporate apparel segment SG&A expenses decreased $4.0 million.
Goodwill and Intangible Asset Impairment Charges
Below is a table that summarizes the goodwill and other intangible asset impairment charges related to Jos. A. Bank recorded in fiscal 2015 (amounts in thousands):
Goodwill impairment charge |
$ | 769,021 | ||
Tradename impairment charge |
425,900 | |||
Customer relationship impairment charge |
41,474 | |||
Favorable lease impairment charge |
6,959 | |||
| | | | | |
Total goodwill and intangible asset impairment charges |
$ | 1,243,354 | ||
| | | | | |
| | | | | |
| | | | | |
41
Refer to Goodwill and Other Indefinite-Lived Intangible Assets as discussed in "Critical Accounting Polices and Estimates" and Note 3 of Notes to Consolidated Financial Statements for further details.
Asset Impairment Charges
Non-cash asset impairment charges increased to $27.5 million in fiscal 2015 as compared to $0.3 million in fiscal 2014. The asset impairment charges in fiscal 2015 resulted primarily from our store rationalization program which identified approximately 250 stores, which are expected to close in fiscal 2016. Refer to Impairment of Long-Lived Assets as discussed in "Critical Accounting Polices and Estimates" and Note 1 of Notes to Consolidated Financial Statements for further details.
Interest Expense
Interest expense increased to $106.0 million in fiscal 2015 from $66.0 million in fiscal 2014, an increase of $40.0 million or 60.5%, due to incremental interest incurred on borrowings entered into in connection with the Jos. A. Bank acquisition.
Provision for Income Tax
In fiscal 2015, our effective income tax rate was (14.1%) and is lower than the U.S. statutory rate due to our overall net loss partially offset by the non-deductibility of the goodwill impairment charge, as discussed above. Our foreign jurisdictions in which we operate had taxable income, which requires us to provide for income tax, specifically, our operations in Canada and the United Kingdom. For fiscal 2015, the statutory tax rates in Canada and the United Kingdom were approximately 27% and 20%, respectively, which negatively impacted our effective tax rate due to the loss in the U.S. For fiscal 2015, tax expense for our operations in foreign jurisdictions totaled $8.9 million.
Our income tax expense and effective income tax rate in future periods may be impacted by many factors, including our geographic mix of earnings and changes in tax laws. Currently, we expect our effective tax rate in future periods to be lower than the statutory United States combined federal and state tax rate based on the expected geographic mix of earnings.
In addition, if our financial results in fiscal 2016 generate a loss or certain deferred tax liabilities decrease, we may need to establish a valuation allowance on our U.S. deferred tax assets, which could have a material impact on our financial condition and results of operations.
Net Loss Attributable to Common Shareholders
These factors resulted in a net loss attributable to common shareholders of $1,026.7 million for fiscal 2015, a decrease of $1,026.3 million from a net loss of $0.4 million for fiscal 2014.
42
2014 Compared with 2013
Net Sales
Total net sales increased $779.3 million, or 31.5%, to $3,252.5 million for fiscal 2014 as compared to fiscal 2013.
Total retail sales increased $768.8 million, or 34.5%, to $2,995.2 million for fiscal 2014 as compared to fiscal 2013 due mainly to $684.0 million of net sales from Jos. A. Bank since the date of acquisition as well as increases in retail clothing product revenues of $59.9 million and rental services revenue of $21.8 million from our other brands. The net increase is attributable to the following:
(in millions)
|
Amount attributed to | ||
|---|---|---|---|
| $ | 684.0 | Increase in net sales from Jos. A. Bank. | |
| 58.2 | 3.9% increase in comparable sales at Men's Wearhouse. | ||
| 19.4 | 8.6% increase in comparable sales at Moores(1). | ||
| 11.4 | 3.7% increase in comparable sales at K&G. | ||
| 16.4 | Increase from net sales of stores opened in 2013, relocated stores and expanded stores not yet included in comparable sales(2). | ||
| 26.1 | Increase in net sales from new stores opened in 2014(2). | ||
| (27.1 | ) | Decrease in net sales resulting from closed stores. | |
| (16.4 | ) | Decrease in net sales resulting from change in U.S./Canadian dollar exchange rate. | |
| (3.2 | ) | Other(2). | |
| | | | |
| $ | 768.8 | Increase in total retail sales. | |
| | | | |
| | | | |
| | | | |
- (1)
- Comparable
sales percentages for Moores are calculated using Canadian dollars.
- (2)
- Excludes Jos. A. Bank.
Comparable sales for Men's Wearhouse, Moores and K&G exclude the net sales of a store for any month of one period if the store was not open throughout the same month of the prior period and include e-commerce net sales. The inclusion of e-commerce net sales did not have a significant effect on comparable sales.
The increase at Men's Wearhouse resulted primarily from increased average unit retails and average transactions per store that more than offset decreased units sold per transaction. The increase at Moores was driven by increased average unit retails, units sold per transaction and average transactions per store. The increase at K&G was due to increased units sold per transaction and average transactions per store which more than offset a decrease in average unit retails. At Men's Wearhouse, rental service comparable sales increased 6.4% primarily due to an increase in rental rates and a slight increase in unit rentals.
Total corporate apparel clothing product sales increased $10.6 million to $257.4 million for fiscal 2014 as compared to fiscal 2013. UK corporate apparel sales increased $7.7 million due mainly to the impact of a stronger pound Sterling this year compared to last year. U.S. corporate apparel sales increased $2.9 million due primarily to increased sales from existing customer programs.
Gross Margin
Buying and distribution costs are included in determining our retail and corporate apparel clothing product gross margins. Our gross margin may not be comparable to other specialty retailers, as some companies exclude costs related to their distribution network from cost of goods sold while others, like us, include all or a portion of such costs in cost of goods sold and exclude them from SG&A expenses. Distribution costs are not included in determining our rental services gross margin as these costs are included in SG&A expenses.
43
Our total gross margin increased $269.6 million, or 24.8%, to $1,358.6 million for fiscal 2014 as compared to fiscal 2013. Total retail segment gross margin increased $266.4 million or 26.2% from fiscal 2013 to $1,281.9 million in fiscal 2014. The dollar increase in gross margin was primarily driven by $227.1 million of gross margin generated by Jos. A. Bank as well as by higher sales from our other brands. As a result of the purchase price allocation for the Jos. A. Bank acquisition, a preliminary purchase accounting adjustment of $34.4 million was recorded for the step up of inventory to its fair value. During fiscal 2014, $33.5 million of the inventory valuation step up was recognized and negatively impacted gross margin results. We expect the remaining $0.9 million of step up in inventory to be charged to cost of sales in the first half of fiscal 2015.
For the retail segment, total gross margin as a percentage of related sales decreased from 45.6% in fiscal 2013 to 42.8% in fiscal 2014 driven primarily by a lower gross margin as a percentage of sales for Jos. A. Bank, which includes the recognition of the inventory step up at Jos. A. Bank, partially offset by a higher retail clothing product gross margin rate at our other brands. In addition, retail segment gross margin was impacted by a decrease in the rental services gross margin rate primarily due to a $10.6 million charge to rationalize our rental product to allow for more productive rental styles, as well as increased royalty expenses.
Occupancy costs increased $104.6 million primarily due to Jos. A. Bank occupancy costs. Occupancy costs as a percentage of retail sales, which is relatively constant on a per store basis and includes store related rent, common area maintenance, utilities, repairs and maintenance, security, property taxes and depreciation, increased slightly from 13.1% in fiscal 2013 to 13.2% in fiscal 2014, primarily due to the impact of Jos. A. Bank's occupancy costs, which are higher as a percentage of sales than our other brands.
Corporate apparel gross margin increased $3.2 million or 4.4% from fiscal 2013 to $76.7 million in fiscal 2014. For the corporate apparel segment, total gross margin as a percentage of related sales was flat at 29.8% for both fiscal 2013 and 2014.
Advertising Expense
Advertising expense increased to $168.3 million in fiscal 2014 from $101.1 million in fiscal 2013, an increase of $67.2 million or 66.5%. The increase was primarily driven by Jos. A. Bank advertising costs as well as advertising expense related to the rollout of Joseph Abboud merchandise. As a percentage of total net sales, these expenses increased from 4.1% in fiscal 2013 to 5.2% in fiscal 2014.
44
Selling, General and Administrative Expenses
SG&A expenses increased to $1,116.8 million in fiscal 2014 from $846.6 million in fiscal 2013, an increase of $270.2 million or 31.9%. The dollar increase in SG&A expenses was driven by an increase in expenses related to acquisition, integration and other costs primarily related to Jos. A. Bank, a licensee arbitration award related to JA Holding, other cost reduction initiatives, as well as Jos. A. Bank operating expenses, which includes amortization of intangible assets recorded in connection with the Jos. A. Bank acquisition. As a percentage of total net sales, these expenses increased from 34.2% in fiscal 2013 to 34.3% in fiscal 2014. The components of the changes in SG&A expenses as a percentage of total net sales and the related dollar changes were as follows:
| |
% | in millions | Attributed to | |||||
|---|---|---|---|---|---|---|---|---|
| 1.7 | $ | 64.9 | Increase in acquisition, integration and other costs as a percentage of sales from 1.1% in fiscal 2013 to 2.8% in fiscal 2014. For fiscal 2014, these costs totaled $92.1 million, related primarily to Jos. A. Bank acquisition and integration costs and other cost reduction initiatives, partially offset by a $3.4 million favorable litigation settlement. For fiscal 2013, such costs totaled $27.2 million due to acquisition and integration costs related to JA Holding, costs related to strategic projects, separation costs associated with former executives, K&G e-commerce closure costs and a New York store related closure costs, partially offset by a gain of $2.2 million on the sale of an office building. | |||||
| 1.3 | 42.6 | $42.6 million of costs for a JA Holding license arbitration award in fiscal 2014 with no corresponding amount in the prior year. | ||||||
| 0.2 | 6.1 | Increase in amortization of intangible assets as a percentage of sales from 0.1% in fiscal 2013 to 0.3% in fiscal 2014. Amortization of intangible assets in dollars increased primarily due to intangible assets recorded in connection with the Jos. A. Bank acquisition. | ||||||
| (0.7 | ) | 78.4 | Decrease in store salaries as a percentage of sales from 12.9% in fiscal 2013 to 12.2% in fiscal 2014. Store salaries in dollars increased primarily due to the impact of Jos. A. Bank store salaries and higher commissions at our other brands. | |||||
| (2.4 | ) | 78.2 | Decrease in other SG&A expenses as a percentage of sales from 20.1% in fiscal 2013 to 17.7% in fiscal 2014. Other SG&A expenses in dollars increased primarily due to the inclusion of Jos. A. Bank's other SG&A expenses. | |||||
| | | | | | | | | |
| 0.1 | % | $ | 270.2 | Total | ||||
| | | | | | | | | |
| | | | | | | | | |
| | | | | | | | | |
In the retail segment, SG&A expenses as a percentage of related net sales decreased from 35.2% in fiscal 2013 to 35.1% in fiscal 2014. Retail segment SG&A expenses increased $267.5 million primarily due to acquisition, integration and other costs, costs related to the JA Holding licensee arbitration award and operating expenses for Jos. A. Bank, which includes amortization of intangible assets recorded in connection with the Jos. A. Bank acquisition and other cost reduction initiatives.
In the corporate apparel segment, SG&A expenses as a percentage of related net sales remained flat at 25.2% in both fiscal 2013 and 2014. Corporate apparel segment SG&A expenses increased $2.7 million primarily due to higher UK operating expenses driven by the impact of a stronger pound Sterling this year compared to last year.
Interest Expense
Interest expense increased to $66.0 million in fiscal 2014 from $3.2 million in fiscal 2013 primarily due to interest expense on borrowings entered into in connection with the Jos. A. Bank acquisition.
45
Provision for Income Tax
Our effective income tax rate increased from 33.6% for fiscal 2013 to 101.8% for fiscal 2014 primarily due to an increase in permanent items as a percent of pre-tax earnings, mainly consisting of non-deductible transaction costs related to the Jos. A. Bank acquisition, resulting in our effective tax rate being higher than the statutory United States combined federal and state tax rate. Furthermore, the foreign jurisdictions in which we operate had profitability which require us to provide for income tax, specifically, our operations in Canada and the United Kingdom. For fiscal 2014, the statutory tax rates in Canada and the United Kingdom were approximately 26% and 20%, respectively, which favorably impacted our effective tax rate. For fiscal 2014, tax expense for our operations in foreign jurisdictions totaled $11.5 million. Lastly, our effective income tax rate was also favorably impacted by amortizable goodwill related to a prior acquisition.
Thus, the combination of tax expense being recorded on U.S. activity (due mainly to the non-deductible transaction costs), and for tax expense from our foreign operations, coupled with low book income results in a high effective tax rate for fiscal 2014 compared to fiscal 2013.
Our income tax expense and effective income tax rate in future periods may be impacted by many factors, including our geographic mix of earnings and changes in tax laws. Currently, we expect our effective tax rate in future periods to be lower than the statutory United States combined federal and state tax rate based on the expected geographic mix of earnings.
Net (Loss) Earnings Attributable to Common Shareholders
These factors resulted in a net loss attributable to common shareholders of $0.4 million for fiscal 2014, a decrease of $84.2 million from net earnings of $83.8 million for fiscal 2013.
Liquidity and Capital Resources
At January 30, 2016 and January 31, 2015, cash and cash equivalents totaled $30.0 million and $62.3 million, respectively. At January 30, 2016, cash and cash equivalents held by foreign subsidiaries totaled $27.0 million. Under current tax laws and regulations, if cash and cash equivalents held outside the U.S. are repatriated to the U.S., in certain circumstances we may be subject to additional U.S. income taxes and foreign withholding taxes. We currently do not intend to repatriate amounts held by foreign subsidiaries.
We had working capital of $723.6 million and $752.3 million at January 30, 2016 and January 31, 2015, respectively. Our primary sources of working capital are cash flows from operations and available borrowings under our financing arrangements, as described below.
On June 18, 2014, we entered into a term loan credit agreement, that provides for a senior secured term loan in the aggregate principal amount of $1.1 billion (the "Term Loan"), and a $500.0 million asset-based revolving credit agreement (the "ABL Facility", and together with the Term Loan, the "Credit Facilities") with certain of our U.S. subsidiaries and Moores the Suit People Inc., one of our Canadian subsidiaries, as co-borrowers. In addition, on June 18, 2014, we issued $600.0 million in aggregate principal amount of 7.00% Senior Notes due 2022 (the "Senior Notes").
The Credit Facilities and the Senior Notes contain customary non-financial and financial covenants, including fixed charge coverage ratios, total leverage ratios and secured leverage ratios, as well as a restriction on our ability to pay dividends on our common stock in excess of $10.0 million per quarter. Since entering into these financing arrangements and as of January 30, 2016, our total leverage ratio and secured leverage ratio were above the maximums specified in the agreements, which was anticipated when we entered into these arrangements. As a result, we are currently subject to certain additional restrictions, including limitations on our ability to make acquisitions and incur additional indebtedness. As of January 30, 2016, we believe we will be in compliance with all of the non-financial and financial covenants
46
by the end of fiscal 2017 which will result in the elimination of these additional restrictions. In addition, in accordance with the terms of the Credit Facilities, we have an obligation to make a mandatory excess cash flow prepayment offer of $35.5 million to the Term Loan lenders by April 29, 2016. Our lenders have the option to decline their respective portions of the prepayment.
We used the net proceeds from the Term Loan, the offering of the Senior Notes and the net proceeds from $340.0 million drawn on the ABL Facility to pay the approximately $1.8 billion purchase price for the acquisition of Jos. A. Bank and to repay all of our obligations under our Third Amended and Restated Credit Agreement, dated as of April 12, 2013 (as amended the "Previous Credit Agreement"), including $95.0 million outstanding under the Previous Credit Agreement as well as settlement of the then existing interest rate swap. The loans under the ABL Facility were subsequently repaid in full promptly following the closing of the Jos. A. Bank acquisition using the cash acquired from Jos. A. Bank.
Credit Facilities
The Term Loan is guaranteed, jointly and severally, by certain of our U.S. subsidiaries and will mature on June 18, 2021. The interest rate on the Term Loan is based on the 3-month LIBOR rate, which was approximately 0.61% at January 30, 2016. However, the Term Loan interest rate is subject to a LIBOR floor of 1% per annum, plus the applicable margin which is currently 3.50%, resulting in a total interest rate of 4.50% at January 30, 2016. To minimize the impact of changes in interest rates on our interest payments under the Term Loan, in January 2015, we entered into an interest rate swap agreement to swap variable-rate interest payments for fixed-rate interest payments on a notional amount of $520.0 million, effective in February 2015. The interest rate swap agreement matures in August 2018 and has periodic interest settlements. Under this interest rate swap agreement, we receive a floating rate based on the 3-month LIBOR rate and pay a fixed rate of 5.03% (including the applicable margin of 3.50%) on the outstanding notional amount.
On April 7, 2015, we entered into Incremental Facility Agreement No. 1 (the "Incremental Agreement") resulting in a refinancing of $400.0 million aggregate principal amount of our Term Loan from a variable rate to a fixed rate of 5.0% per annum. The Incremental Agreement did not impact the total amount borrowed under the Term Loan, the maturity date of the Term Loan of June 18, 2021, or collateral and guarantees under the existing Term Loan.
As a result of the interest rate swap and the Incremental Agreement, we have converted a majority of the variable interest rate under the Term Loan to a fixed rate and, as of January 30, 2016, the Term Loan had a weighted average interest rate of 4.90%.
The ABL Facility provides for a senior secured revolving credit facility of $500.0 million, with possible future increases to $650.0 million under an expansion feature that matures on June 18, 2019 and is guaranteed, jointly and severally, by certain of our U.S. subsidiaries. The ABL Facility has several borrowing and interest rate options including the following indices: (i) adjusted LIBOR, (ii) Canadian Dollar Offered Rate, (iii) Canadian prime rate or (iv) an alternate base rate (equal to the greater of the prime rate, the federal funds effective rate plus 0.5% or adjusted LIBOR for a one-month period plus 1.0%). Advances under the ABL Facility bear interest at a rate per annum using the applicable indices plus a varying interest rate margin of up to 2.00%. The ABL Facility also provides for fees applicable to amounts available to be drawn under outstanding letters of credit which range from 1.50% to 2.00%, and a fee on unused commitments which ranges from 0.25% to 0.375%. As of January 30, 2016, there were no borrowings outstanding under the ABL Facility.
The obligations under the Credit Facilities are secured on a senior basis by a first priority lien on substantially all of the assets of the Company, certain of its U.S. subsidiaries and, in the case of the ABL Facility, Moores The Suit People Inc. The Credit Facilities and the related guarantees and security interests granted thereunder are senior secured obligations of, and will rank equally with all present and future senior indebtedness of, the Company, the co-borrowers and the respective guarantors.
47
We utilize letters of credit primarily to secure inventory purchases and as collateral for workers compensation claims. At January 30, 2016, letters of credit totaling approximately $25.5 million were issued and outstanding. Borrowings available under the ABL Facility as of January 30, 2016 were $420.9 million.
Senior Notes
The Senior Notes are guaranteed, jointly and severally, on an unsecured basis by certain of our U.S. subsidiaries. The Senior Notes and the related guarantees are senior unsecured obligations of the Company and the guarantors, respectively, and will rank equally with all of the Company's and each guarantor's present and future senior indebtedness. The Senior Notes will mature on July 1, 2022. Interest on the Senior Notes are payable on January 1 and July 1 of each year. Payments began January 1, 2015.
We may redeem some or all of the Senior Notes at any time on or after July 1, 2017 at the redemption prices set forth in the indenture governing the Senior Notes. At any time prior to July 1, 2017, we will have the option to redeem some or all of the Senior Notes at a redemption price of 100% of the principal amount of the Senior Notes to be redeemed, plus a "make-whole" premium and accrued and unpaid interest, if any, to the date of redemption. We may also redeem up to a maximum of 35% of the original aggregate principal amount of the Senior Notes with the proceeds of certain equity offerings prior to July 1, 2017 at a redemption price of 107% of the principal amount of the Senior Notes plus accrued and unpaid interest, if any. Upon the occurrence of certain specific changes of control, we may be required to offer to purchase the Senior Notes at 101% of their aggregate principal amount plus accrued and unpaid interest thereon to the date of purchase.
We had entered into a registration rights agreement regarding the Senior Notes pursuant to which we agreed, among other things, to use our commercially reasonable efforts to consummate an exchange offer of the Senior Notes for substantially identical notes registered under the Securities Act of 1933, as amended, on or before July 13, 2015. On June 24, 2015, the exchange offer was completed.
Cash Provided by Operating Activities
Net cash provided by operating activities was $131.7 million and $94.8 million for 2015 and 2014, respectively. The $36.9 million increase was driven by higher net earnings, after adjusting for non-cash items including goodwill, intangible and other asset impairment charges, partially offset by the impact of working capital items. Unfavorable changes in working capital include an increase in inventories, primarily due to higher inventory levels from lower sales and increased purchases of rental product partially offset by favorable fluctuations in accounts payable, accrued expenses and other current liabilities.
Net cash provided by operating activities was $94.8 million and $188.9 million for 2014 and 2013, respectively. The $94.1 million decrease is primarily the result of a decrease in net earnings driven by acquisition and integration costs related to Jos. A. Bank, interest expense on our indebtedness, and an arbitration award related to JA Holding, as well as changes in working capital, primarily related to fluctuations in accounts payable, accrued expenses and other current liabilities.
Cash Used in Investing Activities
Net cash used in investing activities was $112.9 million and $1,587.7 million for 2015 and 2014, respectively. The $1,474.8 million decrease was primarily driven by last year's acquisition of Jos. A. Bank. The increase in capital expenditures in 2015 compared to 2014 was primarily due to integration projects for Jos. A. Bank as well as store remodels, openings and/or relocations.
Net cash used in investing activities was $1,587.7 million and $199.0 million for 2014 and 2013, respectively. The $1,388.7 million increase in cash used in investing activities was primarily driven by the acquisition of Jos. A. Bank. Our capital expenditures in 2014 and 2013 relate to costs incurred for stores opened,
48
remodeled or relocated during the year or under construction at the end of the year and infrastructure technology, office and distribution facility investments.
Cash (Used in) Provided by Financing Activities
Net cash used in financing activities was $46.8 million for 2015 compared to net cash provided by financing activities of $1,500.9 million for 2014. The net change of $1,547.7 million was primarily driven by last year's proceeds on our Term Loan and issuance of Senior Notes for the acquisition of Jos. A. Bank.
Net cash provided by financing activities was $1,500.9 million for 2014 compared to net cash used in financing activities of $82.9 million for 2013. The net change of $1,583.8 million was primarily driven by borrowings on our Term Loan and issuance of the Senior Notes for the acquisition of Jos. A. Bank. Cash outflows from financing activities consist primarily of repayment of borrowings under our ABL Facility and previous term loan, payment of deferred financing costs related to our Credit Facilities and cash dividend payments.
Share repurchase program—In March 2013, the Board of Directors (the "Board") approved a $200.0 million share repurchase program for our common stock, which amended and replaced our then existing share repurchase program authorized by the Board in January 2011. At January 30, 2016, the remaining balance available under the Board's March 2013 authorization was $48.0 million. During fiscal 2015, no shares were repurchased in open market transactions under the Board's March 2013 authorization.
In July 2013, we entered into an accelerated share repurchase agreement ("ASR Agreement") with J.P. Morgan Securities LLC ("JPMorgan"), as agent for JPMorgan Chase Bank, National Association, London Branch, to purchase $100.0 million of our common stock. A total of 2,653,287 shares were repurchased under the ASR Agreement and immediately retired. In addition to the ASR Agreement, during fiscal 2013, 1,489,318 shares at a cost of $52.0 million were repurchased in open market transactions under the Board's March 2013 authorization.
The following table summarizes our common stock repurchases during fiscal 2015, 2014 and 2013 (in thousands, except share data and average price per share):
| |
Fiscal Year | |||||||||
|---|---|---|---|---|---|---|---|---|---|---|
| |
2015 | 2014 | 2013 | |||||||
Shares repurchased(1) |
5,799 | 5,349 | 4,147,983 | |||||||
Total costs |
$ | 277 | $ | 251 | $ | 152,129 | ||||
Average price per share |
$ | 47.82 | $ | 46.93 | $ | 36.68 | ||||
- (1)
- Includes 5,799, 5,349 and 5,378 shares, respectively, repurchased in private transactions to satisfy minimum tax withholding obligations arising upon the vesting of certain restricted stock.
Dividends—Cash dividends paid were approximately $35.0 million, $34.8 million and $35.5 million during fiscal 2015, 2014 and 2013, respectively. In fiscal 2015, 2014 and 2013, a dividend of $0.18 per share was declared in each quarter, for an annual dividend of $0.72 per share, respectively. The cash dividend of $0.18 per share declared by the Board in January 2016 is payable on March 25, 2016 to shareholders of record on March 15, 2016.
Future sources and uses of cash
Our primary uses of cash are to finance working capital requirements of our operations and to repay our indebtedness. In addition, we will use cash to fund capital expenditures, income taxes, integration costs associated with Jos. A. Bank, costs related to our store rationalization and profit improvement programs
49
including lease termination payments, dividend payments, operating leases and various other commitments and obligations, as they arise.
Capital expenditures are anticipated to be in the range of $110.0 to $120.0 million for 2016. This amount includes the anticipated costs to open 166 shops within Macy's stores, 15 to 20 Men's Wearhouse stores, three Moores stores, two Jos. A. Bank stores and two K&G stores and to expand and/or relocate approximately 8 to 12 existing Men's Wearhouse stores, four to eight existing Jos. A. Bank stores and one existing K&G store. The average cost (excluding telecommunications and point-of-sale equipment and inventory) of opening a new store, which does not include shops within Macy's stores, is expected to be approximately $0.5 million in 2016. The balance of the capital expenditures for 2016 will be used for integration projects related to Jos. A. Bank, distribution facilities, point-of-sale and other computer equipment and systems, store remodeling, and investment in other corporate assets. The actual amount of future capital expenditures will depend in part on the number of new stores opened and the terms on which new stores are leased and the timing of our Jos. A. Bank integration projects, as well as on industry trends consistent with our anticipated operating plans.
Additionally, market conditions may produce attractive opportunities for us to make acquisitions. Any such acquisitions may be undertaken as an alternative to opening new stores. We may use cash on hand, together with cash flow from operations, borrowings under our Credit Facilities and issuances of debt or equity securities, to take advantage of any acquisition opportunities.
Current and future domestic and global economic conditions could negatively affect our future operating results as well as our existing cash and cash equivalents balances. In addition, conditions in the financial markets could limit our access to further capital resources, if needed, and could increase associated costs. We believe based on our current business plan that our existing cash and cash flows from operations and availability under our ABL Facility will be sufficient to fund our operating cash requirements, repayment of current indebtedness, planned store openings, relocations and remodels, other capital expenditures, and integration costs associated with Jos. A. Bank.
Contractual Obligations
As of January 30, 2016, we are obligated to make cash payments in connection with our long-term debt, non-cancelable operating leases and other contractual obligations in the amounts listed below. In addition, we utilize letters of credit primarily for inventory purchases and as collateral for workers compensation claims. At January 30, 2016, letters of credit totaling approximately $25.5 million were issued and outstanding.
| |
Payments Due by Period | |||||||||||||||
|---|---|---|---|---|---|---|---|---|---|---|---|---|---|---|---|---|
(In millions) Contractual obligations |
Total | <1 Year | 1 - 3 Years | 4 - 5 Years | > 5 Years | |||||||||||
Long-term debt(1) |
$ | 2,242.8 | $ | 137.3 | $ | 212.3 | $ | 181.4 | $ | 1,711.8 | ||||||
Operating lease base rentals(2) |
1,279.5 | 261.1 | 416.7 | 291.9 | 309.8 | |||||||||||
Other contractual obligations(3) |
158.0 | 25.7 | 33.5 | 27.9 | 70.9 | |||||||||||
| | | | | | | | | | | | | | | | | |
Total contractual obligations(4) |
$ | 3,680.3 | $ | 424.1 | $ | 662.5 | $ | 501.2 | $ | 2,092.5 | ||||||
| | | | | | | | | | | | | | | | | |
| | | | | | | | | | | | | | | | | |
| | | | | | | | | | | | | | | | | |
- (1)
- Includes interest payments of $94.8 million within one year, $196.5 million between one and three years, $169.1 million between four and five years and $93.1 million beyond five years, at current interest rates including the impact of active interest rate swaps. The payments due by period do not consider amounts which may become payable under the excess cash flow provision of our Term Loan. See Notes 6 and 16 of Notes to Consolidated Financial Statements for additional information.
50
- (2)
- We
lease retail business locations, office and warehouse facilities and equipment under various non-cancelable operating leases. See
Note 18 of Notes to Consolidated Financial Statements for additional information.
- (3)
- Other
contractual obligations consist primarily of minimum payments under our agreement with Macy's to operate shops within Macy's stores, our
agreement with Vera Wang that gives us the exclusive right to "Black by Vera Wang" tuxedo products, our partnership with Kenneth Cole and our marketing agreement with David's Bridal, Inc. Pursuant to
our marketing agreement with David's Bridal, Inc., there are performance conditions that may impact future payments. These potential future payments are not included in the table above as such amounts
are not readily determinable.
- (4)
- Excluded from the table above is $22.0 million related to uncertain tax positions. These amounts are not included due to our inability to predict the timing of the settlement of these amounts. Refer to Note 7 of Notes to Consolidated Financial Statements for additional information.
In the normal course of business, we issue purchase orders to vendors/suppliers for merchandise. The purchase orders represent executory contracts requiring performance by the vendors/suppliers, including the delivery of the merchandise prior to a specified cancellation date and compliance with product specifications, quality standards and other requirements. In the event of the vendor's failure to meet the agreed upon terms and conditions, we may cancel the order.
Off-Balance Sheet Arrangements
Other than the non-cancelable operating leases, other contractual obligations and letters of credit discussed above, we do not have any off-balance sheet arrangements that are material to our financial position or results of operations.
Inflation
We believe the impact of inflation on the results of operations during the periods presented has been minimal. However, there can be no assurance that our business will not be affected by inflation in the future.
Critical Accounting Policies and Estimates
The preparation of our consolidated financial statements requires the appropriate application of accounting policies in accordance with generally accepted accounting principles. In many instances, this also requires management to make estimates and assumptions about future events that affect the amounts and disclosures included in our financial statements. We base our estimates on historical experience and various assumptions that we believe are reasonable under our current business model. However, because future events and conditions and their effects cannot be determined with certainty, actual results will differ from our estimates and such differences could be material to our financial statements.
Our accounting policies are described in Note 1 of Notes to Consolidated Financial Statements. We consistently apply these policies and periodically evaluate the reasonableness of our estimates in light of actual events. Historically, we have found our accounting policies to be appropriate and our estimates and assumptions reasonable. Our critical accounting policies, which are those most significant to the presentation of our financial position and results of operations and those that require significant judgment or complex estimates by management, are discussed below.
Revenue Recognition—Clothing product revenue is recognized at the time of sale and delivery of merchandise, net of actual sales returns and a provision for estimated sales returns. For e-commerce sales, revenue is recognized at the time we estimate the customer receives the product, which incorporates shipping terms and estimated delivery times. Revenues from rental, alteration and other services are recognized upon completion of the services. Amounts related to shipping and handling revenues billed to customers are recorded in net sales, and the related shipping and handling costs are recorded in cost of sales.
51
We present all non-income government-assessed taxes (sales, use and value added taxes) collected from our customers and remitted to governmental agencies on a net basis (excluded from net sales) in our consolidated financial statements. The government-assessed taxes are recorded in accrued expenses and other current liabilities until they are remitted to the government agency.
Inventories—Our inventory is carried at the lower of cost or market. Cost is determined based on the average cost method. Our inventory cost also includes estimated buying and distribution costs (warehousing, freight, hangers and merchandising costs) associated with the inventory, with the balance of such costs included in cost of sales. Buying and distribution costs are allocated to inventory based on the ratio of annual product purchases to inventory cost. If this ratio were to change significantly, it could materially affect the amount of buying and distribution costs included in cost of sales. We make assumptions, based primarily on historical experience, as to items in our inventory that may be damaged, obsolete or salable only at marked down prices to reflect the market value of these items. If actual damages, obsolescence or market demand is significantly different from our estimates, additional inventory write-downs could be required.
Impairment of Long-Lived Assets—Long-lived assets, such as property and equipment and identifiable intangibles with finite useful lives, are periodically evaluated for impairment whenever events or changes in circumstances indicate that the carrying amount of an asset may not be recoverable. Assets are grouped and evaluated for impairment at the lowest level of which there are identifiable cash flows, which is generally at a store level. Assets are reviewed using factors including, but not limited to, our future operating plans and projected cash flows. The determination of whether impairment has occurred is based on an estimate of undiscounted future cash flows directly related to the assets, compared to the carrying value of the assets. If the sum of the undiscounted future cash flows of the assets does not exceed the carrying value of the assets, full or partial impairment may exist. If the asset carrying amount exceeds its fair value, an impairment charge is recognized in the amount by which the carrying amount exceeds the fair value of the asset. Fair value is determined using an income approach, which requires discounting the estimated future cash flows associated with the asset. Estimating future cash flows requires management to make assumptions and to apply judgment, including forecasting future sales, costs and useful lives of assets. Significant judgment is also involved in selecting the appropriate discount rate to be applied in determining the estimated fair value of an asset. Changes to our key assumptions related to future performance, market conditions and other economic factors can significantly affect our impairment evaluation and result in future impairment charges. For example, unanticipated long-term adverse market conditions can cause individual stores to become unprofitable and can result in an impairment charge for the property and equipment assets in those stores. See Notes 1 and 3 to the consolidated financial statements for additional information.
Business Combinations-Purchase Price Allocation—For the Jos. A. Bank acquisition, we allocated the purchase price to the various tangible and intangible assets acquired and liabilities assumed, based on their estimated fair values, which were finalized as of August 1, 2015. Determining the fair value of certain assets and liabilities acquired is subjective in nature and often involves the use of significant estimates and assumptions, which are inherently uncertain. Many of the estimates and assumptions used to determine fair values, such as those used for intangible assets are made based on forecasted information and discount rates. In addition, the judgments made in determining the estimated fair value assigned to each class of assets acquired and liabilities assumed, as well as asset lives, can materially impact our results of operations.
Goodwill and Other Indefinite-Lived Intangible Assets—Goodwill and other indefinite-lived intangible assets are initially recorded at their fair values. Identifiable intangible assets with an indefinite useful life, including goodwill, are not amortized but are evaluated annually as for impairment. A more frequent evaluation is performed if events or circumstances indicate that impairment could have occurred. Such events or circumstances could include, but are not limited to, significant negative industry or economic
52
trends, unanticipated changes in the competitive environment, decisions to significantly modify or dispose of operations and a significant sustained decline in the market price of our stock.
During fiscal 2015, we changed the date of our annual impairment assessment from the last day of our fiscal year to the last day of the second month of our fiscal fourth quarter. The change in date had no impact on our fiscal 2015 annual impairment test as both the new and old testing dates are within the same fiscal quarter. We changed the assessment date to allow for more time to complete the impairment assessment process before our fiscal year end.
For purposes of our goodwill impairment evaluation, the reporting units are our operating brands identified in Note 17 of Notes to Consolidated Financial Statements. Goodwill has been assigned to the reporting units based on prior business combinations related to the brands. The goodwill impairment evaluation is performed in two steps.
In our step one process, we estimate the fair value of our reporting units using a combined income and market comparable approach. Our income approach uses projected future cash flows that are discounted using a weighted-average cost of capital analysis that reflects current market conditions. The market comparable approach primarily considers market price multiples of comparable companies and applies those price multiples to certain key drivers of the reporting unit.
Management judgment is a significant factor in the goodwill impairment evaluation process. The computations require management to make estimates and assumptions. Actual values may differ significantly from these judgments, particularly if there are significant adverse changes in the operating environment for our reporting units. Critical assumptions that are used as part of these evaluations include:
- •
- The potential future cash flows of the reporting
unit. The income approach relies on the timing and estimates of future cash flows. The projections use management's estimates of
economic and market conditions over the projected period, including growth rates in revenue, gross margin and expense. The cash flows are based on our most recent business operating plans and various
growth rates have been assumed for years beyond the current business plan period.
- •
- Selection of an appropriate discount rate. The income
approach requires the selection of an appropriate discount rate, which is based on a weighted-average cost of capital analysis. The discount rate is affected by changes in short-term interest rates
and long-term yield as well as variances in the typical capital structure of marketplace participants. Given current economic conditions, it is possible that the discount rate will fluctuate in the
near term. The weighted-average cost of capital used to discount the cash flows for our reporting units ranged from 10.5% to 13.5% for the 2015 analysis.
- •
- Selection of comparable companies within the industry. For purposes of the market comparable approach, valuations were determined by calculating average price multiples of relevant key drivers from a group of companies that are comparable to the reporting units being analyzed and applying those price multiples to the key drivers of the reporting unit. While the market price multiple is not an assumption, a presumption that it provides an indicator of the value of the reporting unit is inherent in the valuation. The determination of the market comparable also involves a degree of judgment. Earnings multiples used in the market comparable approach ranged from 4.3 to 11.0 for the 2015 analysis.
As discussed above, the fair values of reporting units in 2015 were determined using a combined income and market comparable approach. We believe these two approaches are appropriate valuation techniques and we generally weight the two values equally as an estimate of reporting unit fair value for the purposes of our impairment testing. However, we may weigh one value more heavily than the other when conditions merit doing so. The fair value derived from the weighting of these two methods provided appropriate
53
valuations that, in aggregate, reasonably reconciled to our market capitalization, taking into account observable control premiums.
The goodwill impairment evaluation process requires management to make estimates and assumptions with regard to the fair value of reporting units. Actual values may differ significantly from these judgments, particularly if there are significant adverse changes in the operating environment for our reporting units. Sustained declines in our market capitalization could also increase the risk of goodwill impairment. Such occurrences could result in future goodwill impairment charges that would, in turn, negatively impact our results of operations. However, any such goodwill impairments would be non-cash charges that would not affect our cash flows or compliance with our debt covenants.
Indefinite-lived intangible assets are not subject to amortization but are reviewed at least annually for impairment. The indefinite-lived intangible asset impairment evaluation is performed by comparing the fair value of the indefinite-lived intangible assets to their carrying values. We estimate the fair value of these intangible assets based on an income approach using the relief-from-royalty method. This approach is dependent upon a number of factors, including estimates of future growth and trends, royalty rates, discount rates and other variables. We base our fair value estimates on assumptions we believe to be reasonable, but which are unpredictable and inherently uncertain.
Fiscal 2015 Impairment Assessment Results
As a result of our annual impairment evaluation, it was determined that the entire carrying amount of Jos. A. Bank's goodwill was impaired, resulting in a non-cash pre-tax goodwill impairment charge of $769.0 million. Although the goodwill impairment charge negatively impacted our results of operations, as the impairment charge is non-cash, it does not affect our cash flows or compliance with our debt covenants. As of January 30, 2016, we believe that all of our other reporting units have fair values that significantly exceed their carrying values and, therefore, no other reporting units are currently deemed "at risk" for goodwill impairment.
During 2015, we recognized non-cash pre-tax impairment losses of $425.9 million related to the Jos. A. Bank tradename. After giving effect to these impairment charges, the carrying value of the Jos. A. Bank tradename was $113.2 million as of January 30, 2016.
Rental Product—The cost of our rental product is amortized to cost of sales based on the cost of each unit rented, which is estimated based on the number of times the unit is expected to be rented and the average cost of the rental product. Lost, damaged and retired rental product is also charged to cost of sales. Rental product is amortized to expense generally over a four year period. We make assumptions, based primarily on historical experience, as to the number of times each unit can be rented. If the actual number of times a unit can be rented were to vary significantly from our estimates, it could materially affect the amount of rental product amortization included in cost of sales.
Income Taxes—Income taxes are accounted for using the asset and liability method. Deferred tax liabilities or assets are established for temporary differences between financial and tax reporting bases and are subsequently adjusted to reflect changes in enacted tax rates expected to be in effect when the temporary differences reverse. The deferred tax assets are reduced, if necessary, by a valuation allowance if the future realization of those tax benefits is not more likely than not.
Significant judgment is required in determining the provision for income taxes, related taxes payable and deferred tax assets and liabilities since, in the ordinary course of business, there are transactions and calculations where the ultimate tax outcome is uncertain. Additionally, our tax returns are subject to audit by various domestic and foreign tax authorities that could result in material adjustments or differing interpretations of the tax laws. Although we believe that our estimates are reasonable and are based on the best available information at the time we prepare the provision, actual results could differ from these
54
estimates resulting in a final tax outcome that may be materially different from that which is reflected in our consolidated financial statements.
The tax benefit from an uncertain tax position is recognized only if it is more likely than not that the tax position will be sustained on examination by the taxing authorities, based on the technical merits of the position. The tax benefits recognized in the consolidated financial statements from such positions are then measured based on the largest benefit that has a greater than 50% likelihood of being realized upon settlement. Additionally, interest and/or penalties related to uncertain tax positions are recognized in income tax expense. Significant judgment is required in determining our uncertain tax positions. We have established reserves for uncertain tax positions using our best judgment and adjust these reserves, as warranted, due to changing facts and circumstances. A change in our uncertain tax positions, in any given period, could have a significant impact on our financial position, results of operations and cash flows for that period.
Recent Accounting Pronouncements
Except as discussed in Note 1 of Notes to Consolidated Financial Statements, we have considered all new accounting pronouncements and have concluded that there are no new pronouncements that may have a material impact on our results of operations, financial condition, or cash flows, based on current information.
ITEM 7A. QUANTITATIVE AND QUALITATIVE DISCLOSURES ABOUT MARKET RISK
Foreign Currency Risk
We are subject to exposure from fluctuations in U.S. dollar/Euro exchange rates, U.S. dollar/pound Sterling ("GBP") exchange rates and U.S. dollar/Canadian dollar ("CAD") exchange rates as a result of our direct sourcing programs and our operations in foreign countries. Our UK-based operations in particular are subject to exposure from fluctuations in U.S. dollar/GBP exchange rates as Dimensions and Alexandra sell their products and conduct their business primarily in GBP but purchase most of their merchandise in transactions paid in U.S. dollars or Euros.
As further described in Note 16 of Notes to Consolidated Financial Statements, our risk management policy is to hedge a portion of forecasted merchandise purchases for our direct sourcing programs that bear foreign exchange risk using foreign exchange forward contracts. We have not elected to apply hedge accounting to these transactions denominated in a foreign currency. A hypothetical 10% increase or decrease in applicable January 30, 2016 forward rates could impact the fair value of the derivative financial instruments by $1.1 million. However, it should be noted that any change in the value of these contracts, whether real or hypothetical, would be significantly offset by an inverse change in the value of the underlying hedged item.
Dimensions and Alexandra, our UK-based operations, sell their products and conduct their business primarily in GBP but purchase most of their merchandise in transactions paid in U.S. dollars or Euros. The exchange rate between the GBP, Euro and U.S. dollar has fluctuated historically. A decline in the value of the GBP as compared to the Euro or U.S. dollar will adversely impact our UK operating results as the cost of merchandise purchases will increase, particularly in relation to longer term customer contracts that have little or no pricing adjustment provisions, and the revenues and earnings of our UK operations will be reduced when they are translated to U.S. dollars. Also, the value of our UK net assets in U.S. dollars may decline. Dimensions and Alexandra may, from time to time, utilize foreign currency hedging contracts as well as price renegotiations to limit exposure to some of this risk; however these activities may not adequately protect our UK operations from exchange rate risk.
Moores, our Canadian subsidiary, conducts most of its business in CAD but purchases a significant portion of its merchandise in U.S. dollars. The exchange rate between CAD and U.S. dollars has fluctuated
55
historically. Recently, the the value of the CAD against the U.S. dollar has weakened. If this valuation does not improve, then the revenues and earnings of our Canadian operations will be reduced when they are translated to U.S. dollars. Also, the value of our Canadian net assets in U.S. dollars may decline. Moores utilizes foreign currency hedging contracts related to its merchandise purchases to limit exposure to changes in U.S. dollar/CAD exchange rates; however, these hedging activities may not adequately protect our Canadian operations from exchange rate risk.
Interest Rate Risk
In conjunction with the Jos. A. Bank acquisition, we entered into new financing arrangements and repaid amounts existing under our Previous Credit Agreement. For further information, refer to Note 6 of Notes to Consolidated Financial Statements. Borrowings under our Credit Facilities generally bear interest at a rate based on LIBOR plus an applicable margin. As such, our Credit Facilities expose us to market risk for changes in interest rates.
Certain terms of our Term Loan limit our exposure to short-term interest rate fluctuations, specifically the existence of a LIBOR floor of 1% per annum. Assuming LIBOR rates surpassed the 1% LIBOR floor provision on our Term Loan, we would be exposed to interest rate risk on such Term Loan. At January 30, 2016, the 3-month LIBOR rate was approximately 0.61%, which is significantly below the LIBOR floor. However, to partially mitigate future interest rate risk, in January 2015, we entered into an interest rate swap agreement to exchange variable interest rate payments for fixed interest rate payments for a portion of the outstanding Term Loan balance, effective in February 2015. In addition in April 2015 we refinanced $400.0 million aggregate principal of our Senior Notes from a variable rate to a fixed rate of 5.0%. After consideration of the swap and refinancing, each one percentage point change in interest rates would result in an approximate $2.4 million change in annual interest expense on our Term Loan.
We also have exposure to market rate risk for changes in interest rates as those rates relate to our investment portfolio. The primary objective of our investment activities is to preserve principal while at the same time maximizing yields without significantly increasing risk. As of January 30, 2016, we have highly liquid investments classified as cash equivalents in our consolidated balance sheet. Future investment income earned on our cash equivalents will fluctuate in line with short-term interest rates.
As the foreign exchange forward contracts and interest rate swap agreement are with financial institutions, we are exposed to credit risk in the event of nonperformance by these parties. However, due to the creditworthiness of these major financial institutions, full performance is anticipated.
56
ITEM 8. FINANCIAL STATEMENTS AND SUPPLEMENTARY DATA
REPORT OF INDEPENDENT REGISTERED PUBLIC ACCOUNTING FIRM
To
the Board of Directors and Shareholders of
Tailored Brands, Inc. (successor reporting company to The Men's Wearhouse, Inc.)
Houston, Texas
We have audited the accompanying consolidated balance sheets of Tailored Brands, Inc. (successor reporting company to The Men's Wearhouse, Inc.) and subsidiaries (the "Company") as of January 30, 2016 and January 31, 2015, and the related consolidated statements of (loss) earnings, comprehensive (loss) income, shareholders' (deficit) equity, and cash flows for each of the three years in the period ended January 30, 2016. These financial statements are the responsibility of the Company's management. Our responsibility is to express an opinion on the financial statements based on our audits.
We conducted our audits in accordance with the standards of the Public Company Accounting Oversight Board (United States). Those standards require that we plan and perform the audit to obtain reasonable assurance about whether the financial statements are free of material misstatement. An audit includes examining, on a test basis, evidence supporting the amounts and disclosures in the financial statements. An audit also includes assessing the accounting principles used and significant estimates made by management, as well as evaluating the overall financial statement presentation. We believe that our audits provide a reasonable basis for our opinion.
In our opinion, such consolidated financial statements present fairly, in all material respects, the financial position of Tailored Brands, Inc. (successor reporting company to The Men's Wearhouse, Inc.) and subsidiaries as of January 30, 2016 and January 31, 2015, and the results of their operations and their cash flows for each of the three years in the period ended January 30, 2016, in conformity with accounting principles generally accepted in the United States of America.
We have also audited, in accordance with the standards of the Public Company Accounting Oversight Board (United States), the Company's internal control over financial reporting as of January 30, 2016, based on the criteria established in Internal Control—Integrated Framework (2013) issued by the Committee of Sponsoring Organizations of the Treadway Commission and our report dated March 25, 2016 expressed an unqualified opinion on the Company's internal control over financial reporting.
| /s/ DELOITTE & TOUCHE LLP |
Houston,
Texas
March 25, 2016
57
TAILORED BRANDS, INC. AND SUBSIDIARIES
CONSOLIDATED BALANCE SHEETS
(In thousands, except shares)
| |
January 30, 2016 |
January 31, 2015 |
|||||
|---|---|---|---|---|---|---|---|
ASSETS |
|||||||
CURRENT ASSETS: |
|||||||
Cash and cash equivalents |
$ | 29,980 | $ | 62,261 | |||
Accounts receivable, net |
63,890 | 73,266 | |||||
Inventories |
1,022,504 | 938,336 | |||||
Other current assets |
143,546 | 169,809 | |||||
| | | | | | | | |
Total current assets |
1,259,920 | 1,243,672 | |||||
| | | | | | | | |
PROPERTY AND EQUIPMENT, AT COST: |
|||||||
Land |
20,710 | 20,921 | |||||
Buildings |
130,719 | 123,762 | |||||
Leasehold improvements |
590,562 | 589,105 | |||||
Furniture, fixtures and equipment |
603,047 | 575,983 | |||||
| | | | | | | | |
|
1,345,038 | 1,309,771 | |||||
Less accumulated depreciation and amortization |
(823,214 | ) | (743,697 | ) | |||
| | | | | | | | |
Net property and equipment |
521,824 | 566,074 | |||||
| | | | | | | | |
RENTAL PRODUCT, net |
157,460 | 132,672 | |||||
GOODWILL |
118,586 | 887,936 | |||||
INTANGIBLE ASSETS, net |
178,510 | 668,259 | |||||
OTHER ASSETS |
8,019 | 9,599 | |||||
| | | | | | | | |
TOTAL ASSETS |
$ | 2,244,319 | $ | 3,508,212 | |||
| | | | | | | | |
| | | | | | | | |
| | | | | | | | |
LIABILITIES AND SHAREHOLDERS' (DEFICIT) EQUITY |
|||||||
CURRENT LIABILITIES: |
|||||||
Accounts payable |
$ | 237,114 | $ | 209,867 | |||
Accrued expenses and other current liabilities |
255,589 | 268,935 | |||||
Income taxes payable |
1,173 | 1,609 | |||||
Current portion of long-term debt |
42,451 | 11,000 | |||||
| | | | | | | | |
Total current liabilities |
536,327 | 491,411 | |||||
LONG-TERM DEBT, net |
1,613,473 |
1,637,686 |
|||||
DEFERRED TAXES AND OTHER LIABILITIES |
194,605 | 409,326 | |||||
| | | | | | | | |
Total liabilities |
2,344,405 | 2,538,423 | |||||
| | | | | | | | |
COMMITMENTS AND CONTINGENCIES |
|||||||
SHAREHOLDERS' (DEFICIT) EQUITY: |
|||||||
Preferred stock, $.01 par value, 2,000,000 shares authorized, no shares issued |
— | — | |||||
Common stock, $.01 par value, 100,000,000 shares authorized, 48,567,245 and 48,265,902 shares issued |
485 | 482 | |||||
Capital in excess of par |
455,765 | 440,907 | |||||
(Accumulated deficit) retained earnings |
(524,876 | ) | 537,263 | ||||
Accumulated other comprehensive loss |
(28,486 | ) | (5,671 | ) | |||
Treasury stock, 120,291 and 129,095 shares at cost |
(2,974 | ) | (3,192 | ) | |||
| | | | | | | | |
Total (deficit) equity |
(100,086 | ) | 969,789 | ||||
| | | | | | | | |
TOTAL LIABILITIES AND SHAREHOLDERS' (DEFICIT) EQUITY |
$ | 2,244,319 | $ | 3,508,212 | |||
| | | | | | | | |
| | | | | | | | |
| | | | | | | | |
The accompanying notes are an integral part of these consolidated financial statements.
58
TAILORED BRANDS, INC. AND SUBSIDIARIES
CONSOLIDATED STATEMENTS OF (LOSS) EARNINGS
For the Years Ended
January 30, 2016, January 31,
2015, and February 1, 2014
(In thousands, except per share amounts)
| |
Fiscal Year | |||||||||
|---|---|---|---|---|---|---|---|---|---|---|
| |
2015 | 2014 | 2013 | |||||||
Net sales: |
||||||||||
Retail clothing product |
$ | 2,599,934 | $ | 2,365,463 | $ | 1,667,535 | ||||
Rental services |
443,290 | 442,866 | 411,864 | |||||||
Alteration and other services |
209,250 | 186,843 | 147,023 | |||||||
| | | | | | | | | | | |
Total retail sales |
3,252,474 | 2,995,172 | 2,226,422 | |||||||
Corporate apparel clothing product |
243,797 | 257,376 | 246,811 | |||||||
| | | | | | | | | | | |
Total net sales |
3,496,271 | 3,252,548 | 2,473,233 | |||||||
Cost of sales: |
||||||||||
Retail clothing product |
1,160,323 | 1,098,550 | 741,957 | |||||||
Rental services |
76,726 | 84,978 | 64,308 | |||||||
Alteration and other services |
145,852 | 134,227 | 113,729 | |||||||
Occupancy costs |
455,486 | 395,521 | 290,896 | |||||||
| | | | | | | | | | | |
Total retail cost of sales |
1,838,387 | 1,713,276 | 1,210,890 | |||||||
Corporate apparel clothing product |
173,461 | 180,658 | 173,333 | |||||||
| | | | | | | | | | | |
Total cost of sales |
2,011,848 | 1,893,934 | 1,384,223 | |||||||
Gross margin: |
||||||||||
Retail clothing product |
1,439,611 | 1,266,913 | 925,578 | |||||||
Rental services |
366,564 | 357,888 | 347,556 | |||||||
Alteration and other services |
63,398 | 52,616 | 33,294 | |||||||
Occupancy costs |
(455,486 | ) | (395,521 | ) | (290,896 | ) | ||||
| | | | | | | | | | | |
Total retail gross margin |
1,414,087 | 1,281,896 | 1,015,532 | |||||||
Corporate apparel clothing product |
70,336 | 76,718 | 73,478 | |||||||
| | | | | | | | | | | |
Total gross margin |
1,484,423 | 1,358,614 | 1,089,010 | |||||||
Advertising expense |
204,985 |
168,266 |
101,083 |
|||||||
Selling, general and administrative expenses |
1,085,900 | 1,116,836 | 846,582 | |||||||
Goodwill and intangible asset impairment charges |
1,243,354 | — | 11,349 | |||||||
Asset impairment charges |
27,480 | 302 | 368 | |||||||
| | | | | | | | | | | |
Operating (loss) income |
(1,077,296 | ) | 73,210 | 129,628 | ||||||
Interest income |
187 |
356 |
385 |
|||||||
Interest expense |
(105,977 | ) | (66,032 | ) | (3,205 | ) | ||||
Loss on extinguishment of debt |
(12,675 | ) | (2,158 | ) | — | |||||
| | | | | | | | | | | |
(Loss) earnings before income taxes |
(1,195,761 | ) | 5,376 | 126,808 | ||||||
(Benefit) provision for income taxes |
(169,042 | ) | 5,471 | 42,591 | ||||||
| | | | | | | | | | | |
Net (loss) earnings including non-controlling interest |
(1,026,719 | ) | (95 | ) | 84,217 | |||||
Net earnings attributable to non-controlling interest |
— | (292 | ) | (426 | ) | |||||
| | | | | | | | | | | |
Net (loss) earnings attributable to common shareholders |
$ | (1,026,719 | ) | $ | (387 | ) | $ | 83,791 | ||
| | | | | | | | | | | |
| | | | | | | | | | | |
| | | | | | | | | | | |
Net (loss) earnings per common share attributable to common shareholders: |
||||||||||
Basic |
$ | (21.26 | ) | $ | (0.01 | ) | $ | 1.71 | ||
| | | | | | | | | | | |
| | | | | | | | | | | |
| | | | | | | | | | | |
Diluted |
$ | (21.26 | ) | $ | (0.01 | ) | $ | 1.70 | ||
| | | | | | | | | | | |
| | | | | | | | | | | |
| | | | | | | | | | | |
Weighted-average common shares outstanding: |
||||||||||
Basic |
48,288 | 47,899 | 48,849 | |||||||
| | | | | | | | | | | |
| | | | | | | | | | | |
| | | | | | | | | | | |
Diluted |
48,288 | 47,899 | 49,162 | |||||||
| | | | | | | | | | | |
| | | | | | | | | | | |
| | | | | | | | | | | |
The accompanying notes are an integral part of these consolidated financial statements.
59
TAILORED BRANDS, INC. AND SUBSIDIARIES
CONSOLIDATED STATEMENTS OF COMPREHENSIVE (LOSS) INCOME
For the Years Ended
January 30,
2016, January 31, 2015 and February 1, 2014
(In thousands)
| |
For the Fiscal Year Ended | |||||||||
|---|---|---|---|---|---|---|---|---|---|---|
| |
2015 | 2014 | 2013 | |||||||
Net (loss) earnings including non-controlling interest |
$ | (1,026,719 | ) | $ | (95 | ) | $ | 84,217 | ||
Currency translation adjustments |
(22,427 | ) | (31,942 | ) | (8,606 | ) | ||||
Unrealized loss on cash flow hedge, net of tax |
(342 | ) | (1,266 | ) | (399 | ) | ||||
Adjustment to minimum pension liability, net of tax |
(46 | ) | 226 | — | ||||||
| | | | | | | | | | | |
Comprehensive (loss) income including non-controlling interest |
(1,049,534 | ) | (33,077 | ) | 75,212 | |||||
| | | | | | | | | | | |
Comprehensive income attributable to non-controlling interest: |
||||||||||
Net earnings |
— | (292 | ) | (426 | ) | |||||
Currency translation adjustments |
— | — | (608 | ) | ||||||
| | | | | | | | | | | |
Amounts attributable to non-controlling interest |
— | (292 | ) | (1,034 | ) | |||||
| | | | | | | | | | | |
Comprehensive (loss) income attributable to common shareholders |
$ | (1,049,534 | ) | $ | (33,369 | ) | $ | 74,178 | ||
| | | | | | | | | | | |
| | | | | | | | | | | |
| | | | | | | | | | | |
The accompanying notes are an integral part of these consolidated financial statements.
60
TAILORED BRANDS, INC. AND SUBSIDIARIES
CONSOLIDATED STATEMENTS OF SHAREHOLDERS' (DEFICIT) EQUITY
(In thousands, except shares)
| |
Common Stock |
Capital in Excess of Par |
(Accumulated Deficit) Retained Earnings |
Accumulated Other Comprehensive (Loss) Income |
Treasury Stock, at Cost |
Total (Deficit) Equity Attributable to Common Shareholders |
Non- controlling Interest |
Total (Deficit) Equity |
|||||||||||||||||
|---|---|---|---|---|---|---|---|---|---|---|---|---|---|---|---|---|---|---|---|---|---|---|---|---|---|
BALANCES—February 2, 2013 |
$ | 725 | $ | 386,254 | $ | 1,190,246 | $ | 36,924 | $ | (517,894 | ) | $ | 1,096,255 | $ | 12,980 | $ | 1,109,235 | ||||||||
Net earnings |
— | — | 83,791 | — | — | 83,791 | 426 | 84,217 | |||||||||||||||||
Other comprehensive (loss) income |
— | — | — | (9,613 | ) | — | (9,613 | ) | 608 | (9,005 | ) | ||||||||||||||
Cash dividends—$0.72 per share |
— | — | (35,252 | ) | — | — | (35,252 | ) | — | (35,252 | ) | ||||||||||||||
Share-based compensation |
— | 17,120 | — | — | — | 17,120 | — | 17,120 | |||||||||||||||||
Common stock issued under share-based award plans and to stock discount plan—719,551 shares |
7 | 10,732 | — | — | — | 10,739 | — | 10,739 | |||||||||||||||||
Tax payments related to vested deferred stock units |
— | (3,865 | ) | — | — | — | (3,865 | ) | — | (3,865 | ) | ||||||||||||||
Tax benefit related to share-based plans |
— | 1,664 | — | — | — | 1,664 | — | 1,664 | |||||||||||||||||
Treasury stock reissued—11,761 shares |
— | 138 | — | — | 287 | 425 | — | 425 | |||||||||||||||||
Repurchases of common stock—4,147,983 shares |
(27 | ) | — | (99,973 | ) | — | (52,129 | ) | (152,129 | ) | — | (152,129 | ) | ||||||||||||
Retirement of treasury stock—22,915,087 shares |
(229 | ) | — | (566,100 | ) | — | 566,329 | — | — | — | |||||||||||||||
| | | | | | | | | | | | | | | | | | | | | | | | | | |
BALANCES—February 1, 2014 |
476 | 412,043 | 572,712 | 27,311 | (3,407 | ) | 1,009,135 | 14,014 | 1,023,149 | ||||||||||||||||
Net (loss) earnings |
— | — | (387 | ) | — | — | (387 | ) | 292 | (95 | ) | ||||||||||||||
Other comprehensive loss |
— | — | — | (32,982 | ) | — | (32,982 | ) | — | (32,982 | ) | ||||||||||||||
Purchase of non-controlling interest |
— | 7,249 | — | — | — | 7,249 | (14,306 | ) | (7,057 | ) | |||||||||||||||
Cash dividends—$0.72 per share |
— | — | (34,809 | ) | — | — | (34,809 | ) | — | (34,809 | ) | ||||||||||||||
Share-based compensation |
— | 16,513 | — | — | — | 16,513 | — | 16,513 | |||||||||||||||||
Common stock issued under share-based award plans and to stock discount plan—569,522 shares |
6 | 8,076 | — | — | — | 8,082 | — | 8,082 | |||||||||||||||||
Tax payments related to vested deferred stock units |
— | (6,940 | ) | — | — | — | (6,940 | ) | — | (6,940 | ) | ||||||||||||||
Tax benefit related to share-based plans |
— | 3,736 | — | — | — | 3,736 | — | 3,736 | |||||||||||||||||
Treasury stock reissued—8,805 shares |
— | 230 | — | — | 213 | 443 | — | 443 | |||||||||||||||||
Repurchases of common stock—5,349 shares |
— | — | (251 | ) | — | — | (251 | ) | — | (251 | ) | ||||||||||||||
Retirement of treasury stock—100 shares |
— | — | (2 | ) | — | 2 | — | — | — | ||||||||||||||||
| | | | | | | | | | | | | | | | | | | | | | | | | | |
BALANCES—January 31, 2015 |
482 | 440,907 | 537,263 | (5,671 | ) | (3,192 | ) | 969,789 | $ | — | 969,789 | ||||||||||||||
Net loss |
— | — | (1,026,719 | ) | — | — | (1,026,719 | ) | — | (1,026,719 | ) | ||||||||||||||
Other comprehensive loss |
— | — | — | (22,815 | ) | — | (22,815 | ) | — | (22,815 | ) | ||||||||||||||
Cash dividends—$0.72 per share |
— | — | (35,143 | ) | — | — | (35,143 | ) | — | (35,143 | ) | ||||||||||||||
Share-based compensation |
— | 14,839 | — | — | — | 14,839 | — | 14,839 | |||||||||||||||||
Common stock issued under share-based award plans and to stock discount plan—307,142 shares |
3 | 2,971 | — | — | — | 2,974 | — | 2,974 | |||||||||||||||||
Tax payments related to vested deferred stock units |
— | (4,538 | ) | — | — | — | (4,538 | ) | — | (4,538 | ) | ||||||||||||||
Tax benefit related to share-based plans |
— | 1,456 | — | — | — | 1,456 | — | 1,456 | |||||||||||||||||
Repurchases of common stock—5,799 shares |
— | — | (277 | ) | — | — | (277 | ) | — | (277 | ) | ||||||||||||||
Treasury stock reissued—8,804 shares |
— | 130 | — | — | 218 | 348 | — | 348 | |||||||||||||||||
| | | | | | | | | | | | | | | | | | | | | | | | | | |
BALANCES—January 30, 2016 |
$ | 485 | $ | 455,765 | $ | (524,876 | ) | $ | (28,486 | ) | $ | (2,974 | ) | $ | (100,086 | ) | $ | — | $ | (100,086 | ) | ||||
| | | | | | | | | | | | | | | | | | | | | | | | | | |
| | | | | | | | | | | | | | | | | | | | | | | | | | |
| | | | | | | | | | | | | | | | | | | | | | | | | | |
The accompanying notes are an integral part of these consolidated financial statements.
61
TAILORED BRANDS, INC. AND SUBSIDIARIES
CONSOLIDATED STATEMENTS OF CASH FLOWS
For the Years Ended
January 30, 2016, January 31, 2015
and February 1, 2014
(In thousands)
| |
Fiscal Year | |||||||||
|---|---|---|---|---|---|---|---|---|---|---|
| |
2015 | 2014 | 2013 | |||||||
CASH FLOWS FROM OPERATING ACTIVITIES: |
||||||||||
Net (loss) earnings including non-controlling interest |
$ | (1,026,719 | ) | $ | (95 | ) | $ | 84,217 | ||
Adjustments to reconcile net (loss) earnings to net cash provided by operating activities: |
||||||||||
Depreciation and amortization |
132,329 | 112,659 | 88,749 | |||||||
Rental product amortization |
34,592 | 34,424 | 32,266 | |||||||
Amortization of deferred financing costs |
6,817 | 4,903 | 523 | |||||||
Amortization of discount on long-term debt |
1,098 | 982 | — | |||||||
Loss on extinguishment of debt |
12,675 | 2,158 | — | |||||||
Loss on disposition of assets |
3,548 | 12,328 | 158 | |||||||
Goodwill and intangible asset impairment charges |
1,243,354 | — | 11,349 | |||||||
Asset impairment charges |
27,480 | 302 | 368 | |||||||
Share-based compensation |
14,839 | 16,513 | 17,120 | |||||||
Excess tax benefits from share-based plans |
(1,584 | ) | (3,766 | ) | (2,145 | ) | ||||
Deferred tax (benefit) provision |
(184,841 | ) | (13,107 | ) | 2,272 | |||||
Deferred rent expense and other |
4,066 | 4,233 | 2,884 | |||||||
Changes in operating assets and liabilities: |
||||||||||
Accounts receivable |
8,165 | (6,151 | ) | 14,517 | ||||||
Inventories |
(94,889 | ) | (26,586 | ) | (39,342 | ) | ||||
Rental product |
(65,866 | ) | (37,185 | ) | (50,577 | ) | ||||
Other assets |
(8,815 | ) | (19,250 | ) | (6,339 | ) | ||||
Accounts payable, accrued expenses and other current liabilities |
22,953 | 3,831 | 34,514 | |||||||
Income taxes payable |
289 | 6,135 | (2,713 | ) | ||||||
Other liabilities |
2,206 | 2,436 | 1,109 | |||||||
| | | | | | | | | | | |
Net cash provided by operating activities |
131,697 | 94,764 | 188,930 | |||||||
| | | | | | | | | | | |
CASH FLOWS FROM INVESTING ACTIVITIES: |
||||||||||
Capital expenditures |
(115,498 | ) | (96,420 | ) | (108,200 | ) | ||||
Acquisition of businesses, net of cash |
— | (1,491,393 | ) | (94,906 | ) | |||||
Proceeds from sales of property and equipment |
2,617 | 160 | 4,127 | |||||||
| | | | | | | | | | | |
Net cash used in investing activities |
(112,881 | ) | (1,587,653 | ) | (198,979 | ) | ||||
| | | | | | | | | | | |
CASH FLOWS FROM FINANCING ACTIVITIES: |
||||||||||
Proceeds from new term loan |
— | 1,089,000 | — | |||||||
Payments on new term loan |
(8,000 | ) | (2,750 | ) | — | |||||
Proceeds from asset-based revolving credit facility |
180,500 | 348,000 | — | |||||||
Payments on asset-based revolving credit facility |
(180,500 | ) | (348,000 | ) | — | |||||
Proceeds from issuance of senior notes |
— | 600,000 | — | |||||||
Deferred financing costs |
(3,566 | ) | (51,080 | ) | (1,776 | ) | ||||
Proceeds from previous term loan |
— | — | 100,000 | |||||||
Payments on previous term loan |
— | (97,500 | ) | (2,500 | ) | |||||
Cash dividends paid |
(34,980 | ) | (34,785 | ) | (35,549 | ) | ||||
Purchase of non-controlling interest |
— | (6,651 | ) | — | ||||||
Proceeds from issuance of common stock |
2,974 | 8,082 | 10,739 | |||||||
Tax payments related to vested deferred stock units |
(4,538 | ) | (6,940 | ) | (3,865 | ) | ||||
Excess tax benefits from share-based plans |
1,584 | 3,766 | 2,145 | |||||||
Repurchases of common stock |
(277 | ) | (251 | ) | (152,129 | ) | ||||
| | | | | | | | | | | |
Net cash (used in) provided by financing activities |
(46,803 | ) | 1,500,891 | (82,935 | ) | |||||
| | | | | | | | | | | |
Effect of exchange rate changes |
(4,294 | ) | (4,993 | ) | (3,827 | ) | ||||
| | | | | | | | | | | |
(DECREASE) INCREASE IN CASH AND CASH EQUIVALENTS |
(32,281 | ) | 3,009 | (96,811 | ) | |||||
Balance at beginning of period |
62,261 | 59,252 | 156,063 | |||||||
| | | | | | | | | | | |
Balance at end of period |
$ | 29,980 | $ | 62,261 | $ | 59,252 | ||||
| | | | | | | | | | | |
| | | | | | | | | | | |
| | | | | | | | | | | |
62
TAILORED BRANDS, INC. AND SUBSIDIARIES
CONSOLIDATED STATEMENTS OF CASH FLOWS (Continued)
For the Years Ended
January 30, 2016, January 31, 2015 and February 1, 2014
(In thousands)
| |
Fiscal Year | |||||||||
|---|---|---|---|---|---|---|---|---|---|---|
| |
2015 | 2014 | 2013 | |||||||
SUPPLEMENTAL DISCLOSURES OF CASH FLOW INFORMATION: |
||||||||||
Cash paid for: |
||||||||||
Interest |
$ | 96,994 | $ | 44,765 | $ | 2,338 | ||||
| | | | | | | | | | | |
| | | | | | | | | | | |
| | | | | | | | | | | |
Income taxes, net |
$ | 21,857 | $ | 33,815 | $ | 52,591 | ||||
| | | | | | | | | | | |
| | | | | | | | | | | |
| | | | | | | | | | | |
SUPPLEMENTAL SCHEDULE OF NONCASH INVESTING AND FINANCING ACTIVITIES: |
||||||||||
Increase in capital in excess of par due to purchase of non-controlling interest |
$ | — | $ | 7,249 | $ | — | ||||
| | | | | | | | | | | |
| | | | | | | | | | | |
| | | | | | | | | | | |
Cash dividends declared |
$ | 9,150 | $ | 8,987 | $ | 8,963 | ||||
| | | | | | | | | | | |
| | | | | | | | | | | |
| | | | | | | | | | | |
We had unpaid capital expenditure purchases included in accounts payable and accrued expenses and other current liabilities of approximately $12.8 million, $15.0 million and $10.0 million in fiscal 2015, 2014 and 2013, respectively. Capital expenditure purchases are recorded as cash outflows from investing activities in the consolidated statement of cash flows in the period in which they are paid.
The accompanying notes are an integral part of these consolidated financial statements.
63
TAILORED BRANDS, INC. AND SUBSIDIARIES
NOTES TO CONSOLIDATED FINANCIAL STATEMENTS
1. SUMMARY OF SIGNIFICANT ACCOUNTING POLICIES
Organization and Business—Effective January 31, 2016, Tailored Brands, Inc., a Texas corporation ("Tailored Brands"), became the successor reporting company to The Men's Wearhouse, Inc. ("Men's Wearhouse"), pursuant to a holding company reorganization (the "Reorganization"). Tailored Brands and its subsidiaries (the "Company") is a specialty apparel retailer offering suits, suit separates, sport coats, slacks, business casual, sportswear, outerwear, dress shirts, shoes and accessories for men and tuxedo and suit rental product (collectively "rental product"). We offer our products and services through multiple channels including The Men's Wearhouse, Men's Wearhouse and Tux, Jos. A. Bank Clothiers ("Jos. A. Bank"), Moores Clothing for Men ("Moores"), Joseph Abboud, K&G and the internet at www.menswearhouse.com, www.josbank.com and www.josephabboud.com. Our stores are located throughout the United States ("U.S."), Puerto Rico and Canada and carry a wide selection of exclusive and non-exclusive merchandise brands. In addition, we offer our customers alteration services and most of our K&G stores also offer women's career apparel, sportswear and accessories, including shoes, and children's apparel.
We also conduct corporate apparel and uniform operations through Twin Hill in the U.S. and through our Dimensions, Alexandra and Yaffy brands in the United Kingdom ("UK"). We offer our corporate apparel clothing products through multiple channels including managed corporate accounts, catalogs and the internet at www.dimensions.co.uk and www.alexandra.co.uk. In addition, we conduct retail dry cleaning, laundry and heirlooming operations through MW Cleaners in Texas. We operate two reportable segments as determined by the way we manage, evaluate and internally report our business activities: Retail and Corporate Apparel. Refer to Note 17 for further segment information.
On June 18, 2014, we acquired Jos. A. Bank, a men's specialty apparel retailer, for total cash consideration of approximately $1.8 billion. Based on the manner in which we manage, evaluate and internally report our operations, we determined that Jos. A. Bank is an operating segment that meets the criteria for aggregation into our retail reportable segment. On August 6, 2013, we acquired JA Holding, Inc. ("JA Holding"), the parent company of the American clothing brand Joseph Abboud and a U.S. tailored clothing factory. Based on the manner in which we manage, evaluate and internally report our operations, we determined that JA Holding is a component of our Men's Wearhouse brand and therefore has been included in our retail reportable segment. See Notes 2 and 17 for additional details on these acquisitions and our segments.
We follow the standard fiscal year of the retail industry, which is a 52-week or 53-week period ending on the Saturday closest to January 31. The periods presented in these financial statements are the fiscal years ended January 30, 2016 ("fiscal 2015"), January 31, 2015 ("fiscal 2014"), and February 1, 2014 ("fiscal 2013"). Each of these periods had 52 weeks.
Upon completion of the Reorganization, each issued and outstanding share of common stock of the Company was automatically converted into one share of common stock of Tailored Brands, having the same designations, preferences, limitations, and relative rights and corresponding obligations as the shares of common stock of the Company. In addition, as part of the Reorganization, the Company's treasury shares were canceled. We believe that the holding company structure will allow us to support, nurture and augment our family of brands as we further leverage our shared services platform. Beginning in the first quarter of 2016, we implemented legal and operational changes in how we manage our business, including resource allocation and performance assessment. Accordingly, in future periods, we will report our results under our new holding company structure and we expect to report three operating segments: retail, corporate apparel and shared services.
64
TAILORED BRANDS, INC. AND SUBSIDIARIES
NOTES TO CONSOLIDATED FINANCIAL STATEMENTS (Continued)
Principles of Consolidation—The consolidated financial statements include the accounts of Tailored Brands, Inc. and its subsidiaries. Intercompany accounts and transactions have been eliminated in the consolidated financial statements.
Reclassifications—Certain prior period amounts have been reclassified to conform to the current period presentation.
Use of Estimates—The preparation of financial statements in conformity with accounting principles generally accepted in the United States of America requires management to make estimates and assumptions that affect the reported amounts of assets and liabilities and disclosures of contingent assets and liabilities at the date of the financial statements and the reported amounts of revenues and expenses during the reporting period. Actual results could differ from those estimates.
Cash and Cash Equivalents—Cash and cash equivalents includes all cash in banks, cash on hand and all highly liquid investments with an original maturity of three months or less.
Accounts Receivable—Accounts receivable consists of our receivables from third-party credit card providers and other trade receivables, which consist primarily of receivables from our corporate apparel segment customers. Collectability is reviewed regularly and recorded net of an allowance for uncollectible accounts, which is adjusted as necessary.
Inventories—Inventories are valued at the lower of cost or market. Cost is determined based on the average cost method. Our inventory cost also includes estimated buying and distribution costs (warehousing, freight, hangers and merchandising costs) associated with the inventory, with the balance of such costs included in cost of sales. Buying and distribution costs are allocated to inventory based on the ratio of annual product purchases to inventory cost. We make assumptions, based primarily on historical experience, as to items in our inventory that may be damaged, obsolete or salable only at marked down prices to reflect the market value of these items.
Property and Equipment—Property and equipment are stated at cost. Normal repairs and maintenance costs are charged to earnings as incurred and additions and major improvements are capitalized. The cost of assets retired or otherwise disposed of and the related allowances for depreciation are eliminated from the accounts in the period of disposal and the resulting gain or loss is credited or charged to earnings.
Buildings are depreciated using the straight-line method over their estimated useful lives of 10 to 25 years. Depreciation of leasehold improvements is computed on the straight-line method over the term of the lease, which is generally five to ten years based on the initial lease term plus first renewal option periods that are reasonably assured, or the useful life of the assets, whichever is shorter. Furniture, fixtures and equipment are depreciated using primarily the straight-line method over their estimated useful lives of two to 25 years.
Depreciation expense was $117.9 million, $102.8 million and $84.9 million for fiscal 2015, 2014 and 2013, respectively.
Rental Product—Rental product is amortized to cost of sales based on the cost of each unit rented. The cost of each unit rented is estimated based on the number of times the unit is expected to be rented and the average cost of the rental product. Lost, damaged and retired rental product is also charged to cost of sales. Rental product is amortized to expense generally over a four year period. We make assumptions, based primarily on historical experience, as to the number of times each unit can be rented. Amortization expense was $34.6 million, $34.4 million and $32.3 for fiscal 2015, 2014 and 2013, respectively.
65
TAILORED BRANDS, INC. AND SUBSIDIARIES
NOTES TO CONSOLIDATED FINANCIAL STATEMENTS (Continued)
Impairment of Long-Lived Assets—Long-lived assets, such as property and equipment and identifiable intangibles with finite useful lives, are periodically evaluated for impairment whenever events or changes in circumstances indicate that the carrying amount of an asset may not be recoverable. Assets are grouped and evaluated for impairment at the lowest level of which there are identifiable cash flows, which is generally at a store level. Assets are reviewed using factors including, but not limited to, our future operating plans and projected cash flows. The determination of whether impairment has occurred is based on an estimate of undiscounted future cash flows directly related to the assets, compared to the carrying value of the assets. If the sum of the undiscounted future cash flows of the assets does not exceed the carrying value of the assets, full or partial impairment may exist. If the asset carrying amount exceeds its fair value, an impairment charge is recognized in the amount by which the carrying amount exceeds the fair value of the asset. Fair value is determined using an income approach, which requires discounting the estimated future cash flows associated with the asset.
Asset impairment charges related to our retail segment totaled $27.5 million, $0.3 million and $0.4 million for fiscal 2015, 2014 and 2013, respectively. Of the $27.5 million recorded in fiscal 2015, $23.1 million relates to stores to be closed in fiscal 2016 as a result of our store rationalization program (see Note 4 for additional information). As a result, we have also adjusted the depreciable lives of the assets to reflect their shortened useful life. The remaining $4.3 million of asset impairment charges recorded in fiscal 2015 relate to underperforming stores, primarily at our Jos. A. Bank brand.
See Note 3 for additional discussion of impairment charges recorded in fiscal 2015 related to certain finite-lived intangible assets for Jos. A. Bank.
Goodwill and Other Indefinite-Lived Intangible Assets—Goodwill and other indefinite-lived intangible assets are initially recorded at their fair values. Identifiable intangible assets with an indefinite useful life, including goodwill, are not amortized but are evaluated annually for impairment. A more frequent evaluation is performed if events or circumstances indicate that impairment could have occurred. Such events or circumstances could include, but are not limited to, significant negative industry or economic trends, unanticipated changes in the competitive environment, decisions to significantly modify or dispose of operations and a significant sustained decline in the market price of our stock.
During fiscal 2015, we changed the date of our annual impairment assessment from the last day of our fiscal year to the last day of the second month of our fiscal fourth quarter. The change in date had no impact on our fiscal 2015 annual impairment test as both the new and old testing dates are within the same fiscal quarter. We changed the assessment date to allow for more time to complete the process before our fiscal year end.
For purposes of our goodwill impairment evaluation, the reporting units are our operating brands identified in Note 17. Goodwill has been assigned to the reporting units based on prior business combinations related to the brands. The goodwill impairment evaluation is performed in two steps. The first step is intended to determine if potential impairment exists and is performed by comparing each reporting unit's estimated fair value to its carrying value, including goodwill. If the carrying value of a reporting unit exceeds its estimated fair value, goodwill is considered potentially impaired, and we must complete the second step of the testing to determine the amount of any impairment. The second step requires an allocation of the reporting unit's first step estimated fair value to the individual assets and liabilities of the reporting unit in the same manner as if the reporting unit was being acquired in a business combination. Any excess of the estimated fair value over the amounts allocated to the individual assets and liabilities represents the implied fair value of goodwill for the reporting unit. If the implied fair value of goodwill is less than the recorded goodwill, we would recognize an impairment charge for the difference.
66
TAILORED BRANDS, INC. AND SUBSIDIARIES
NOTES TO CONSOLIDATED FINANCIAL STATEMENTS (Continued)
Indefinite-lived intangible assets are not subject to amortization but are reviewed at least annually for impairment. The indefinite-lived intangible asset impairment evaluation is performed by comparing the fair value of the indefinite-lived intangible assets to their carrying values. We estimate the fair values of these intangible assets based on an income approach using the relief-from-royalty method. This approach is dependent upon a number of factors, including estimates of future growth and trends, royalty rates, discount rates and other variables. We base our fair value estimates on assumptions we believe to be reasonable, but which are unpredictable and inherently uncertain. If the carrying value exceeds its estimated fair value, an impairment loss is recognized in the amount by which the carrying amount exceeds the estimated fair value of the asset.
See Note 3 for additional discussion of our goodwill and indefinite-lived intangible assets including the results of our annual assessment and related impairment charges.
Derivative Financial Instruments—Derivative financial instruments are recorded in the consolidated balance sheet at fair value as other current assets or accrued expenses and other current liabilities. We elected not to apply hedge accounting to our derivative financial instruments used for foreign currency hedging purposes. The gain or loss on our foreign currency derivative financial instruments is recorded in cost of sales in the consolidated statements of (loss) earnings. However, we have elected to apply hedge accounting treatment to our interest rate swap derivative instrument as a cash flow hedge with any gains or losses being recognized as a component of other comprehensive (loss) income. Refer to Note 16 for further information regarding our derivative instruments.
Self-Insurance—We self-insure significant portions of our workers' compensation and employee medical costs. We estimate our liability for future payments under these programs based on historical experience and various assumptions as to participating employees, health care costs, number of claims and other factors, including industry trends and information provided to us by our insurance broker. We also use actuarial estimates. If the number of claims or the costs associated with those claims were to increase significantly over our estimates, additional charges to earnings could be necessary to cover required payments.
Sabbatical Leave—We recognize compensation expense associated with a sabbatical leave or other similar benefit arrangement over the requisite service period during which an employee earns the benefit. The accrued liability for sabbatical leave, which is included in accrued expenses and other current liabilities in the consolidated balance sheets, was $11.8 million and $11.2 million as of fiscal 2015 and 2014, respectively.
Income Taxes—Income taxes are accounted for using the asset and liability method. Deferred tax liabilities or assets are established for temporary differences between financial and tax reporting bases and subsequently adjusted to reflect changes in enacted tax rates expected to be in effect when the temporary differences reverse. The deferred tax assets are reduced, if necessary, by a valuation allowance if the future realization of those tax benefits is not more likely than not.
The tax benefit from an uncertain tax position is recognized only if it is more likely than not that the tax position will be sustained on examination by the taxing authorities, based on the technical merits of the position. The tax benefits recognized in the financial statements from such positions are then measured based on the largest benefit that has a greater than 50% likelihood of being realized upon settlement. Interest and/or penalties related to uncertain tax positions are recognized in income tax expense. See Note 7 for further information regarding income taxes.
67
TAILORED BRANDS, INC. AND SUBSIDIARIES
NOTES TO CONSOLIDATED FINANCIAL STATEMENTS (Continued)
Revenue Recognition—Clothing product revenue is recognized at the time of sale and delivery of merchandise, net of actual sales returns and a provision for estimated sales returns. For e-commerce sales, revenue is recognized at the time we estimate the customer receives the product, which incorporates shipping terms and estimated delivery times. Revenues from rental, alteration and other services are recognized upon completion of the services. Amounts related to shipping and handling revenues billed to customers are recorded in net sales, and the related shipping and handling costs are recorded in cost of sales.
We present all non-income government-assessed taxes (sales, use and value added taxes) collected from our customers and remitted to governmental agencies on a net basis (excluded from net sales) in our consolidated financial statements. The government-assessed taxes are recorded in accrued expenses and other current liabilities until they are remitted to the government agency.
Gift Cards and Gift Card Breakage—Proceeds from the sale of gift cards are recorded as a liability and are recognized as net sales from products and services when the cards are redeemed. Our gift cards do not have expiration dates. We recognize income from breakage of gift cards when the likelihood of redemption of the gift card is remote. We determine our gift card breakage rate based upon historical redemption patterns. Breakage income is recognized for those cards for which the likelihood of redemption is deemed to be remote and for which there is no legal obligation for us to remit the value of such unredeemed gift cards to any relevant jurisdictions. Gift card breakage estimates are reviewed on a quarterly basis. Gift card breakage income is recorded as other operating income and is classified as a reduction of selling, general and administrative expenses ("SG&A") expenses in our consolidated statement of (loss) earnings. Pre-tax breakage income of $2.7 million, $2.3 million and $1.3 million was recognized during fiscal 2015, 2014 and 2013, respectively.
Loyalty Program—We maintain a customer loyalty program for our Men's Wearhouse, Men's Wearhouse and Tux, Jos. A. Bank and Moores brands in which customers receive points for purchases. Points are equivalent to dollars spent on a one-to-one basis, excluding any sales tax dollars. Upon reaching 500 points, customers are issued a $50 rewards certificate which they may redeem for purchases at our stores or online. Generally, reward certificates earned must be redeemed no later than six months from the date of issuance. We accrue the estimated costs of the anticipated certificate redemptions when the certificates are issued and charge such costs to cost of sales. Redeemed certificates are recorded as markdowns when redeemed and no revenue is recognized for the redeemed certificate amounts. The estimate of costs associated with the loyalty program requires us to make assumptions related to the cost of product or services to be provided to customers when the certificates are redeemed as well as redemption rates. The accrued liability for loyalty program reward certificates, which is included in accrued expenses and other current liabilities in the consolidated balance sheets, was $9.2 million and $6.9 million as of fiscal 2015 and 2014, respectively.
Operating Leases—Operating leases relate primarily to stores and generally contain rent escalation clauses, rent holidays, contingent rent provisions and occasionally leasehold incentives. Rent expense for operating leases is recognized on a straight-line basis over the term of the lease, which is generally five to ten years based on the initial lease term plus first renewal option periods that are reasonably assured. Rent expense for stores is included in cost of sales as a part of occupancy cost and other rent is included in SG&A expenses. The lease terms commence when we take possession with the right to control use of the leased premises, which normally includes a construction period and, for stores, is approximately 60 days prior to the date rent payments begin.
Deferred rent that results from recognition of rent expense on a straight-line basis is included in other liabilities. Landlord incentives received for reimbursement of leasehold improvements are recorded as
68
TAILORED BRANDS, INC. AND SUBSIDIARIES
NOTES TO CONSOLIDATED FINANCIAL STATEMENTS (Continued)
deferred rent and amortized as a reduction to rent expense over the term of the lease. Contingent rentals are generally based on percentages of sales and are recognized as store rent expense as they accrue.
Advertising—Advertising costs are expensed as incurred or, in the case of media production costs, when the advertisement first appears.
New Store Costs—Promotion and other costs associated with the opening of new stores are expensed as incurred.
Store Closures and Relocations—Costs associated with store closures or relocations are charged to expense when the liability is incurred. When we close or relocate a store, we record a liability for the present value of estimated unrecoverable cost, which is substantially made up of the remaining net lease obligation.
Share-Based Compensation—In recognizing share-based compensation, we follow the provisions of the authoritative guidance regarding share-based awards. This guidance establishes fair value as the measurement objective in accounting for stock awards and requires the application of a fair value based measurement method in accounting for compensation cost, which is recognized over the requisite service period.
We use the Black-Scholes option pricing model to estimate the fair value of stock options on the date of grant. The fair value of deferred stock units or performance units, (collectively, "DSUs") and restricted stock is determined based on the number of shares granted and the quoted closing price of our common stock on the date of grant. The fair value of awards that contain a market condition is measured using a Monte Carlo simulation method. The value of the portion of the award that is ultimately expected to vest is recognized as expense over the requisite service period. Compensation expense for performance-based awards is recorded based on the amount of the award ultimately expected to vest and the level and likelihood of the performance condition to be met. For grants with a service condition only that are subject to graded vesting, we recognize expense on a straight-line basis over the requisite service period for the entire award.
Share-based compensation expense recognized for fiscal 2015, 2014 and 2013 was $14.8 million, $16.5 million and $17.1 million, respectively. Total income tax benefit recognized in net (loss) earnings for share-based compensation arrangements was $5.8 million, $6.4 million and $6.6 million for fiscal 2015, 2014 and 2013, respectively. Refer to Note 13 for additional disclosures regarding share-based compensation.
Foreign Currency Translation—Assets and liabilities of foreign subsidiaries are translated into U.S. dollars at the exchange rates in effect at each balance sheet date. Equity is translated at applicable historical exchange rates. Income, expense and cash flow items are translated at average exchange rates during the year. Resulting translation adjustments are reported as a separate component of comprehensive (loss) income.
Comprehensive (Loss) Income—Comprehensive (loss) income includes all changes in equity during the periods presented that result from transactions and other economic events other than transactions with shareholders. We present comprehensive (loss) income in a separate statement in the accompanying consolidated financial statements.
Non-controlling Interest—Historically, non-controlling interest in our consolidated balance sheets represented the proportionate share of equity attributable to the minority shareholders of our consolidated UK subsidiaries and was adjusted each period to reflect the allocation of comprehensive income to or the
69
TAILORED BRANDS, INC. AND SUBSIDIARIES
NOTES TO CONSOLIDATED FINANCIAL STATEMENTS (Continued)
absorption of comprehensive losses by the non-controlling interest. In fiscal 2014, we purchased the remaining 14% interest in our UK operations. Refer to Note 12 for additional information.
Earnings per share—We calculate (loss) earnings per common share attributable to common shareholders using the two-class method in accordance with the guidance for determining whether instruments granted in share-based payment transactions are participating securities, which provides that unvested share-based payment awards that contain non-forfeitable rights to dividends or dividend equivalents (whether paid or unpaid) are participating securities and shall be included in the computation of earnings per common share attributable to common shareholders pursuant to the two-class method. Refer to Note 5 for disclosures regarding (loss) earnings per common share attributable to common shareholders.
Treasury stock—Treasury stock purchases are accounted for under the cost method whereby the entire cost of the acquired stock is recorded as treasury stock. Gains and losses on the subsequent reissuance of shares are credited or charged to capital in excess of par value using the average-cost method. Upon retirement of treasury stock, the amounts in excess of par value are charged entirely to retained earnings. Refer to Note 12 for disclosures regarding our stock repurchases and retirement of treasury stock.
Recent Accounting Pronouncements—We have considered all new accounting pronouncements and have concluded that the following new pronouncements may have a material impact on our results of operations, financial condition, or cash flows.
In February 2016, the Financial Accounting Standards Board ("FASB") issued Accounting Standards Update ("ASU") No. 2016-02, Leases. ASU 2016-02 increases transparency and comparability among organizations by recognizing lease assets and lease liabilities on the balance sheet and disclosing key information about leasing arrangements. ASU 2016-02 is effective for public companies for annual reporting periods beginning after December 15, 2018, and interim periods within those fiscal years. Early adoption of ASU 2016-02 is permitted. The guidance is required to be adopted using the modified retrospective approach. We are currently evaluating the impact this guidance will have on our financial position, results of operations and cash flows but expect that it will result in a significant increase in our long-term assets and liabilities.
In July 2015, the FASB issued ASU No. 2015-11, Simplifying the Measurement of Inventory. ASU 2015-11 simplifies the subsequent measurement of inventory by requiring inventory to be measured at the lower of cost and net realizable value. ASU 2015-11 applies only to inventories for which cost is determined by methods other than last-in first-out and the retail inventory method. ASU 2015-11 is effective for public companies for annual reporting periods beginning after December 15, 2016, and interim periods within those fiscal years. Early adoption of ASU 2015-11 is permitted. We adopted ASU 2015-11 in the fourth quarter of fiscal 2015 and it did not have a material impact on our financial position, results of operations or cash flows.
In May 2014, the FASB issued ASU No. 2014-09, Revenue from Contracts with Customers, to clarify the principles used to recognize revenue for all entities. In August 2015, the FASB issued ASU No. 2015-14 which deferred the effective date of ASU 2014-09 by one year. As a result of this deferral, ASU 2014-09 is effective for annual and interim periods beginning after December 15, 2017 and early adoption is permitted for annual reporting periods beginning after December 15, 2016. The guidance allows for either a full retrospective or a modified retrospective transition method. We are continuing to evaluate our method of adoption and the impact of this guidance, including amendments and interpretations, may have on our financial position, results of operations and cash flows.
70
TAILORED BRANDS, INC. AND SUBSIDIARIES
NOTES TO CONSOLIDATED FINANCIAL STATEMENTS (Continued)
2. ACQUISITIONS
Jos. A. Bank
On June 18, 2014, we acquired 100% of the outstanding common stock of Jos. A. Bank, a men's specialty apparel retailer, for $65.00 per share in cash, or total consideration of approximately $1.8 billion. The acquisition was funded primarily by a $1.1 billion term loan facility, the issuance of $600.0 million in senior unsecured notes and borrowings under an asset-based credit facility (see Note 6).
We incurred integration and other costs related to Jos. A. Bank totaling $18.7 million and $40.4 million for fiscal years 2015 and 2014, respectively. Integration and other costs for fiscal 2015 include $0.9 million recorded in cost of sales with the remainder recorded in SG&A. Integration and other costs for fiscal 2014 include $10.6 million recorded in cost of sales with the remainder recorded in SG&A. For fiscal 2015, we did not incur any acquisition-related costs. For fiscal 2014, we incurred acquisition-related costs for Jos. A. Bank totaling $54.6 million. In addition, we recorded losses on extinguishment of debt totaling $12.7 million and $2.2 million for 2015 and 2014, respectively, which is included as a separate line in the consolidated statements of (loss) earnings. Lastly, we incurred deferred financing costs of $51.1 million, which is amortized over the contractual term of each financing arrangement, as discussed in Note 6.
The following table summarizes the final allocation of fair values of the identifiable assets acquired and liabilities assumed in the Jos. A. Bank acquisition (amounts in millions):
Cash |
$ | 328.9 | ||
Accounts receivable |
8.3 | |||
Inventories |
328.0 | |||
Other current assets |
56.4 | |||
Property and equipment |
165.3 | |||
Goodwill |
769.0 | |||
Intangible assets |
622.2 | |||
Accounts payable, accrued expenses and other current liabilities |
(155.0 | ) | ||
Other liabilities (mainly deferred income taxes) |
(302.8 | ) | ||
| | | | | |
Total purchase price |
1,820.3 | |||
Less: Cash acquired |
(328.9 | ) | ||
| | | | | |
Total purchase price, net of cash acquired |
$ | 1,491.4 | ||
| | | | | |
| | | | | |
| | | | | |
Within the measurement period which closed during the second quarter of 2015, we made purchase accounting adjustments primarily related to deferred income taxes. None of these measurement period adjustments had a material impact on the purchase price allocation. Goodwill is calculated as the excess of the purchase price over the net assets acquired. The goodwill recognized was attributable to growth opportunities and expected synergies. All of the goodwill has been assigned to our retail reporting segment and is non-deductible for tax purposes.
Intangible assets consist of four separately identified assets. First, we identified the Jos. A. Bank tradename as an indefinite-lived intangible asset with a fair value of $539.1 million. The Jos. A. Bank tradename is not subject to amortization but is evaluated at least annually for impairment. Second, we identified a customer relationship intangible asset with a fair value of $54.0 million which was to be amortized on a straight line basis over a useful life of seven years. Third, we recognized an intangible asset of $24.4 million for favorable Jos. A. Bank leases (as compared to prevailing market rates) which was to be amortized over the remaining lease terms, including assumed renewals, resulting in a weighted-average
71
TAILORED BRANDS, INC. AND SUBSIDIARIES
NOTES TO CONSOLIDATED FINANCIAL STATEMENTS (Continued)
amortization period of 11.5 years. Lastly, we recognized an intangible asset related to the Jos. A. Bank franchise store agreements of $4.7 million which we expect to amortize over 25 years. See Notes 3 and 4 for information concerning impairment of Jos. A. Bank's goodwill and intangible assets incurred in fiscal 2015.
The results of operations of Jos. A. Bank are included in our results of operations from the acquisition date. From June 18, 2014 through January 31, 2015, Jos. A. Bank generated net sales of $684.0 million and net earnings of $3.5 million, including $14.6 million of pre-tax integration costs, primarily contract termination and severance related, and $38.9 million of pre-tax purchase accounting adjustments, primarily consisting of the step up of inventory recognized as additional cost of sales and amortization of intangible assets.
The following table presents unaudited pro forma consolidated financial information as if the closing of our acquisition of Jos. A. Bank had occurred on February 3, 2013 (in thousands, except per share data):
| |
Fiscal Year | ||||||
|---|---|---|---|---|---|---|---|
| |
2014 | 2013 | |||||
Total net sales |
$ | 3,596,820 | $ | 3,505,399 | |||
| | | | | | | | |
| | | | | | | | |
| | | | | | | | |
Net earnings attributable to common shareholders |
$ | 50,439 | $ | 66,978 | |||
| | | | | | | | |
| | | | | | | | |
| | | | | | | | |
Net earnings per common share attributable to common shareholders: |
|||||||
Basic |
$ | 1.05 | $ | 1.36 | |||
| | | | | | | | |
| | | | | | | | |
| | | | | | | | |
Diluted |
$ | 1.04 | $ | 1.36 | |||
| | | | | | | | |
| | | | | | | | |
| | | | | | | | |
The pro forma financial information presented above has been prepared by combining our historical results and the historical results of Jos. A. Bank and further reflects the effect of purchase accounting adjustments and the elimination of transaction costs, among other items. This pro forma information is not necessarily indicative of the results of operations that actually would have resulted had the Jos. A. Bank acquisition occurred on the date indicated above or that may result in the future and does not reflect potential synergies.
Material non-recurring adjustments included in the pro forma financial information above consists of the step up of Jos. A. Bank inventory to its fair value and integration costs. For fiscal 2014 and 2013, $34.5 million and $33.9 million of these adjustments are included in the calculation of net earnings, respectively.
JA Holding
On August 6, 2013, we acquired all of the outstanding common stock of JA Holding, the parent company of the American clothing brand Joseph Abboud and a U.S. tailored clothing factory, for $94.9 million in cash consideration. The cash paid at closing was funded by $100.0 million borrowed under the term loan provision of our previous credit agreement (see Note 6). Acquisition and integration costs of $3.7 million and $6.7 million during fiscal 2014 and 2013, respectively, are included in the consolidated statements of (loss) earnings within SG&A expenses. There were no acquisition or integration costs during fiscal 2015.
72
TAILORED BRANDS, INC. AND SUBSIDIARIES
NOTES TO CONSOLIDATED FINANCIAL STATEMENTS (Continued)
The following table summarizes the fair values of the identifiable assets acquired and liabilities assumed in the JA Holding acquisition (amounts in millions):
Accounts receivable |
$ | 12.8 | ||
Inventories |
6.5 | |||
Other assets |
3.1 | |||
Property and equipment |
7.3 | |||
Goodwill |
53.9 | |||
Tradename |
30.0 | |||
Accounts payable, accrued expenses and other current liabilities |
(7.2 | ) | ||
Other liabilites |
(11.5 | ) | ||
| | | | | |
Total purchase price |
$ | 94.9 | ||
| | | | | |
| | | | | |
| | | | | |
Goodwill is calculated as the excess of the purchase price over the net assets acquired. The acquisition resulted in goodwill primarily related to growth opportunities as we believe this transaction will accelerate our strategy of offering exclusive brands with broad appeal at attractive prices. All of the goodwill has been assigned to our retail reportable segment and is non-deductible for tax purposes. Acquired intangible assets consist of the Joseph Abboud tradename which is not subject to amortization but is evaluated at least annually for impairment.
The results of operations for JA Holding were included in the consolidated statements of (loss) earnings beginning on August 6, 2013 and were not significant to our consolidated results. The impact of the acquisition on our results of operations, as if the acquisition had been completed as of the beginning of the periods presented, is not significant.
3. GOODWILL AND INTANGIBLE ASSETS
Goodwill and Indefinite-Lived Intangible Asset Impairment Assessment
During the second and third quarters of 2015, the effectiveness of the existing Jos. A. Bank promotional model began to deteriorate quicker than we anticipated. As a result, we made the decision to accelerate the transition away from the historical promotional cadence by removing, at the end of the third quarter, the most excessive offers (the Buy-One-Get-Three or more Free events), and began seeking sustainable volume and margin growth. While we expected some top-line volatility as we changed the promotional model, we did not anticipate that the impact on sales from the traffic decline would occur to the degree it did. During the fourth quarter of 2015, the performance of the Jos. A. Bank brand was far below our expectations.
As a result, the projections used in this year's annual goodwill impairment assessment were significantly lower than the projections used in last year's annual assessment. In particular, the sales growth assumptions were lowered to reflect the current sales trend at Jos. A. Bank and the impact of our store rationalization and profit improvement programs (see Note 4). Conversely, gross margin rates were increased compared to last year's annual assessment to reflect our expectation that the transition away from the historical promotional model will accelerate the realization of higher gross margins. In addition, our market capitalization decreased further during the fourth quarter of 2015. Our consideration of all of these factors resulted in a significant reduction in the estimated fair value of the Jos. A. Bank reporting unit with the estimated fair value decreasing significantly below its carrying value, which required us to proceed to the second step of the goodwill impairment test for Jos. A. Bank.
73
TAILORED BRANDS, INC. AND SUBSIDIARIES
NOTES TO CONSOLIDATED FINANCIAL STATEMENTS (Continued)
In the second step of the goodwill impairment test, we compared the implied fair value of the Jos. A. Bank goodwill with its carrying amount. The estimated fair value of the Jos. A. Bank reporting unit was allocated to its individual assets and liabilities in the same manner as if Jos. A. Bank was being acquired in a business combination and the fair value was the purchase price paid to acquire Jos. A. Bank. As a result of this valuation, it was determined that the entire carrying amount of Jos. A. Bank's goodwill was impaired, resulting in a non-cash pre-tax goodwill impairment charge of $769.0 million, which is included within "Goodwill and intangible asset impairment charges" in our statements of (loss) earnings.
In addition, in connection with the second step of the goodwill impairment test, because of the lower revenue assumptions discussed above, it was determined that the estimated fair value of the Jos. A. Bank tradename had decreased below its carrying value. The fair value of the Jos. A. Bank tradename was estimated using a relief from royalty method, which calculates the present value of savings resulting from the right to sell products without having to pay a royalty fee. Critical assumptions that are used in this method include future sales projections, an estimated royalty rate and a discount rate. Based on the estimated fair value of the Jos. A. Bank tradename, we recognized an impairment loss of $335.8 million during the fourth quarter on the Jos. A. Bank tradename, in addition to the $90.1 million impairment charge recognized in the third quarter of 2015, resulting in total impairment charges of $425.9 million related to the Jos. A. Bank tradename during 2015, which is included within "Goodwill and intangible asset impairment charges" in our statements of (loss) earnings. After giving effect to these impairment charges, the carrying value of the Jos. A. Bank tradename was $113.2 million as of January 30, 2016.
Other Intangible Asset Impairments
In addition to our annual assessment of goodwill and indefinite-lived intangible assets, we determined that certain finite-lived intangible assets related to Jos. A. Bank were impaired. Specifically, it was determined that the Jos. A. Bank customer relationship was impaired. The fair value of the Jos. A. Bank customer relationship was estimated using a return on assets model. Critical assumptions that are used in this method include estimated revenues and cash flows attributable to the Jos. A. Bank existing customer base and the expected attrition of such customers over time. Based on the estimated fair value of the Jos. A. Bank customer relationship, it was determined that the entire carrying value of the Jos. A. Bank customer relationship was impaired, resulting in a non-cash pre-tax impairment charge of $41.5 million, which is included within "Goodwill and intangible asset impairment charges" in our statements of (loss) earnings.
Lastly, we determined that certain favorable lease intangible assets related to Jos. A. Bank were impaired. The fair value of the Jos. A. Bank favorable leases was evaluated in conjunction with our long-lived asset impairment process, whereby we group and evaluate assets at the lowest level of which there are identifiable cash flows, which is generally at a store level. As a result of this process, we recognized an impairment charge of $7.0 million, which is included within "Goodwill and intangible asset impairment charges" in our statements of (loss) earnings. After giving effect to this impairment charge, the carrying value of the Jos. A. Bank favorable leases was $11.9 million as of January 30, 2016.
The following table summarizes the goodwill and other intangible asset impairment charges related to Jos. A. Bank recorded in fiscal 2015 (amounts in thousands):
Goodwill impairment charge |
$ | 769,021 | ||
Tradename impairment charge |
425,900 | |||
Customer relationship impairment charge |
41,474 | |||
Favorable lease impairment charge |
6,959 | |||
| | | | | |
Total goodwill and intangible asset impairment charges |
$ | 1,243,354 | ||
| | | | | |
| | | | | |
| | | | | |
74
TAILORED BRANDS, INC. AND SUBSIDIARIES
NOTES TO CONSOLIDATED FINANCIAL STATEMENTS (Continued)
Fiscal 2013 K&G Goodwill Impairment
During fiscal 2013, based on estimates provided to us by market participants during our review of strategic alternatives for the K&G brand, we concluded that the carrying value of the K&G brand exceeded its fair value. Based on further analysis, it was determined that the entire carrying value of K&G's goodwill was impaired, resulting in a non-cash pre-tax goodwill impairment charge of $9.5 million.
Goodwill
Goodwill allocated to our reportable segments and changes in the net carrying amount of goodwill for the years ended January 30, 2016 and January 31, 2015 are as follows (in thousands):
| |
Retail | Corporate Apparel |
Total | |||||||
|---|---|---|---|---|---|---|---|---|---|---|
Balance, February 1, 2014 |
$ | 96,919 | $ | 29,084 | $ | 126,003 | ||||
Goodwill of acquired business |
767,346 | — | 767,346 | |||||||
Translation adjustment |
(3,085 | ) | (2,328 | ) | (5,413 | ) | ||||
| | | | | | | | | | | |
Balance, January 31, 2015 |
$ | 861,180 | $ | 26,756 | $ | 887,936 | ||||
| | | | | | | | | | | |
Adjustments to purchase price allocation of acquired businesses |
3,062 | — | 3,062 | |||||||
Goodwill impairment charge |
(769,021 | ) | — | (769,021 | ) | |||||
Translation adjustment |
(2,020 | ) | (1,371 | ) | (3,391 | ) | ||||
| | | | | | | | | | | |
Balance, January 30, 2016 |
$ | 93,201 | $ | 25,385 | $ | 118,586 | ||||
| | | | | | | | | | | |
| | | | | | | | | | | |
| | | | | | | | | | | |
The goodwill of acquired businesses, during fiscal 2014, resulted primarily from our acquisition of Jos. A. Bank. Refer to Note 2 for additional discussion of the Jos. A. Bank acquisition. As of January 30, 2016 and January 31, 2015, accumulated goodwill impairment totaled $778.5 million and $9.5 million, respectively, all within our retail segment.
75
TAILORED BRANDS, INC. AND SUBSIDIARIES
NOTES TO CONSOLIDATED FINANCIAL STATEMENTS (Continued)
Intangible Assets
The gross carrying amount and accumulated amortization of our identifiable intangible assets are as follows (in thousands):
| |
January 30, 2016 |
January 31, 2015 |
|||||
|---|---|---|---|---|---|---|---|
Amortizable intangible assets: |
|||||||
Carrying amount: |
|||||||
Trademarks and tradenames |
$ | 16,292 | $ | 16,448 | |||
Favorable leases |
14,675 | 24,400 | |||||
Customer relationships |
29,129 | 84,788 | |||||
| | | | | | | | |
Total carrying amount |
60,096 | 125,636 | |||||
| | | | | | | | |
Accumulated amortization: |
|||||||
Trademarks and tradenames |
(9,728 | ) | (9,331 | ) | |||
Favorable leases |
(2,739 | ) | (1,883 | ) | |||
Customer relationships |
(13,459 | ) | (16,468 | ) | |||
| | | | | | | | |
Total accumulated amortization |
(25,926 | ) | (27,682 | ) | |||
| | | | | | | | |
Total amortizable intangible assets, net |
34,170 | 97,954 | |||||
| | | | | | | | |
Indefinite-lived intangible assets: |
|||||||
Trademarks and tradename, net |
144,340 | 570,305 | |||||
| | | | | | | | |
Total intangible assets, net |
$ | 178,510 | $ | 668,259 | |||
| | | | | | | | |
| | | | | | | | |
| | | | | | | | |
The pre-tax amortization expense associated with intangible assets subject to amortization totaled approximately $14.4 million, $9.9 million and $3.8 million for fiscal 2015, 2014 and 2013, respectively. Pre-tax amortization expense associated with intangible assets subject to amortization at January 30, 2016 is estimated to be approximately $4.7 million for fiscal year 2016, $4.6 million for fiscal year 2017, $4.3 million for fiscal year 2018, $4.1 million for fiscal year 2019 and $3.9 million for fiscal year 2020.
4. RESTRUCTURING AND OTHER CHARGES
During the fourth quarter of fiscal 2015, we began implementing initiatives intended to reduce costs and improve operating performance. These initiatives include a store rationalization program which identified approximately 250 stores to be closed as well as a profit improvement program to drive operating efficiencies and improve our expense structure. The store rationalization program includes the closure of approximately 80 to 90 Jos. A. Bank full line stores, the closure of all outlet stores at Jos. A. Bank and Men's Wearhouse (58 stores) and the closure of between 100 and 110 Men's Wearhouse and Tux stores primarily as the result of the rollout of our shops within Macy's stores. We expect the store rationalization and profit improvement programs to be completed in fiscal 2016.
We estimate that we will incur pre-tax restructuring and other charges related to these actions totaling approximately $85.0 million to $100.0 million, of which approximately $45.0 million to $60.0 million are estimated to be cash expenses. Included in the estimate of total pre-tax charges are approximately:
- •
- $40.0 million to $50.0 million of lease termination costs;
- •
- $39.7 million of inventory and long-lived and intangible asset impairment charges relating to store closures, which was
recorded in the fourth quarter of fiscal 2015; and
- •
- $5.0 to $10.0 million of consulting and severance costs.
76
TAILORED BRANDS, INC. AND SUBSIDIARIES
NOTES TO CONSOLIDATED FINANCIAL STATEMENTS (Continued)
A summary of the charges incurred in the fourth quarter of fiscal 2015, which relate to our retail segment, is presented in the table below (amounts in thousands):
Type of Charge
|
Location in Statements of (Loss) Earnings | Amount | ||||
|---|---|---|---|---|---|---|
Store asset impairment charges |
Asset impairment charges | $ | 23,146 | |||
Inventory reserve charges |
Cost of goods sold—retail clothing product | 11,008 | ||||
Favorable lease impairment charges |
Goodwill and intangible asset impairment charges | 5,533 | ||||
Other costs (primarily consulting) |
Selling, general and administrative expenses | 1,776 | ||||
| | | | | | | |
Total pre-tax restructuring and other charges |
$ | 41,463 | ||||
| | | | | | | |
| | | | | | | |
| | | | | | | |
At January 30, 2016, restructuring and other charges totaling $1.8 million are included in accrued expenses and other current liabilities in the consolidated balance sheet.
5. (LOSS) EARNINGS PER SHARE
Basic (loss) earnings per common share attributable to common shareholders is determined using the two-class method and is computed by dividing net (loss) earnings attributable to common shareholders by the weighted-average common shares outstanding during the period. Diluted (loss) earnings per common share attributable to common shareholders reflects the more dilutive earnings per common share amount calculated using the treasury stock method or the two-class method.
The following table sets forth the computation of basic and diluted (loss) earnings per common share attributable to common shareholders (in thousands, except per share amounts). Basic and diluted (loss) earnings per common share attributable to common shareholders are computed using the actual net (loss) earnings available to common shareholders and the actual weighted-average common shares outstanding rather than the rounded numbers presented within our consolidated statement of (loss) earnings and the accompanying notes. As a result, it may not be possible to recalculate (loss) earnings per common share
77
TAILORED BRANDS, INC. AND SUBSIDIARIES
NOTES TO CONSOLIDATED FINANCIAL STATEMENTS (Continued)
attributable to common shareholders in our consolidated (loss) statement of earnings and the accompanying notes.
| |
Fiscal Year | |||||||||
|---|---|---|---|---|---|---|---|---|---|---|
| |
2015 | 2014 | 2013 | |||||||
Numerator |
||||||||||
Total net (loss) earnings attributable to common shareholders |
$ | (1,026,719 | ) | $ | (387 | ) | $ | 83,791 | ||
Net earnings allocated to participating securities (restricted stock and deferred stock units) |
— | — | (442 | ) | ||||||
| | | | | | | | | | | |
Net (loss) earnings attributable to common shareholders |
$ | (1,026,719 | ) | $ | (387 | ) | $ | 83,349 | ||
| | | | | | | | | | | |
| | | | | | | | | | | |
| | | | | | | | | | | |
Denominator |
||||||||||
Basic weighted-average common shares outstanding |
48,288 | 47,899 | 48,849 | |||||||
Dilutive effect of share-based awards |
— | — | 313 | |||||||
| | | | | | | | | | | |
Diluted weighted-average common shares outstanding |
48,288 | 47,899 | 49,162 | |||||||
| | | | | | | | | | | |
| | | | | | | | | | | |
| | | | | | | | | | | |
Net (loss) earnings per common share attributable to common shareholders: |
||||||||||
Basic |
$ | (21.26 | ) | $ | (0.01 | ) | $ | 1.71 | ||
| | | | | | | | | | | |
| | | | | | | | | | | |
| | | | | | | | | | | |
Diluted |
$ | (21.26 | ) | $ | (0.01 | ) | $ | 1.70 | ||
| | | | | | | | | | | |
| | | | | | | | | | | |
| | | | | | | | | | | |
For fiscal 2015, 2014 and 2013, 0.4, 0.2, and 0.2 million anti-dilutive shares of common stock were excluded from the calculation of diluted (loss) earnings per common share attributable to common shareholders, respectively.
6. DEBT
On June 18, 2014, we entered into a term loan credit agreement that provides for a senior secured term loan in the aggregate principal amount of $1.1 billion (the "Term Loan") and a $500.0 million asset-based revolving credit agreement (the "ABL Facility", and together with the Term Loan, the "Credit Facilities") with certain of our U.S. subsidiaries and Moores the Suit People Inc., one of our Canadian subsidiaries, as co-borrowers. Proceeds from the Term Loan were reduced by an $11.0 million original issue discount ("OID"), which is presented as a reduction of the outstanding balance on the Term Loan on the balance sheet and is amortized to interest expense over the contractual life of the Term Loan. In addition, on June 18, 2014, we issued $600.0 million in aggregate principal amount of 7.00% Senior Notes due 2022 (the "Senior Notes").
The Credit Facilities and the Senior Notes contain customary non-financial and financial covenants, including fixed charge coverage ratios, total leverage ratios and secured leverage ratios, as well as a restriction on our ability to pay dividends on our common stock in excess of $10.0 million per quarter. Since entering into these financing arrangements and as of January 30, 2016, our total leverage ratio and secured leverage ratio were above the maximums specified in the agreements, which was anticipated when we entered into these arrangements. As a result, we are currently subject to certain additional restrictions, including limitations on our ability to make acquisitions and incur additional indebtedness. In addition, in accordance with the terms of the Credit Facilities, we have an obligation to make a mandatory excess cash
78
TAILORED BRANDS, INC. AND SUBSIDIARIES
NOTES TO CONSOLIDATED FINANCIAL STATEMENTS (Continued)
flow prepayment offer of $35.5 million to the Term Loan lenders by April 29, 2016. Our lenders have the option to decline their respective portions of the prepayment. We have classified the entire amount of the expected prepayment within current portion of long-term debt on our consolidated balance sheet.
We used the net proceeds from the Term Loan, the offering of the Senior Notes and the net proceeds from $340.0 million drawn on the ABL Facility to pay the approximately $1.8 billion purchase price for the acquisition of Jos. A. Bank and to repay all of our obligations under our Third Amended and Restated Credit Agreement, dated as of April 12, 2013 (as amended, the "Previous Credit Agreement"), including $95.0 million outstanding under the Previous Credit Agreement as well as settlement of the then existing interest rate swap. The loans under the ABL Facility were subsequently repaid in full promptly following the closing of the Jos. A. Bank acquisition using the cash acquired from Jos. A. Bank.
In addition, as a result of the termination of the Previous Credit Agreement, we recorded a loss on extinguishment of debt totaling $2.2 million in fiscal 2014 consisting of the elimination of unamortized deferred financing costs.
Credit Facilities
The Term Loan is guaranteed, jointly and severally, by certain of our U.S. subsidiaries and will mature on June 18, 2021. The interest rate on the Term Loan is based on the 3-month LIBOR rate, which was approximately 0.61% at January 30, 2016. However, the Term Loan interest rate is subject to a LIBOR floor of 1% per annum, plus the applicable margin which is currently 3.50%, resulting in a total interest rate of 4.50%. In January 2015, we entered into an interest rate swap agreement, in which the variable rate payments due under a portion of the Term Loan were exchanged for a fixed rate. See Note 16 for additional information.
On April 7, 2015, we entered into Incremental Facility Agreement No. 1 (the "Incremental Agreement") resulting in a refinancing of $400.0 million aggregate principal amount of the Term Loan from a variable rate to a fixed rate of 5.0% per annum. The Incremental Agreement did not impact the total amount borrowed under the Term Loan, the maturity date of the Term Loan of June 18, 2021, or collateral and guarantees under the Term Loan. In connection with the Incremental Agreement, we incurred deferred financing costs of $3.6 million, which will be amortized over the life of the remaining term using the interest method. In addition, as a result of entering into the Incremental Agreement, we recorded a loss on extinguishment of debt totaling $12.7 million consisting of the elimination of unamortized deferred financing costs and OID related to the Term Loan, which is included as a separate line in the consolidated statements of (loss) earnings.
As a result of the interest rate swap and the Incremental Agreement, we have converted a majority of the variable interest rate under the Term Loan to a fixed rate and, as of January 30, 2016, the Term Loan had a weighted average interest rate of 4.90%.
The ABL Facility provides for a senior secured revolving credit facility of $500.0 million, with possible future increases to $650.0 million under an expansion feature that matures on June 18, 2019, and is guaranteed, jointly and severally, by certain of our U.S. subsidiaries. The ABL Facility has several borrowing and interest rate options including the following indices: (i) adjusted LIBOR, (ii) Canadian Dollar Offered Rate ("CDOR") rate, (iii) Canadian prime rate or (iv) an alternate base rate (equal to the greater of the prime rate, the federal funds effective rate plus 0.5% or adjusted LIBOR for a one-month period plus 1.0%). Advances under the ABL Facility bear interest at a rate per annum using the applicable indices plus a varying interest rate margin of up to 2.00%. The ABL Facility also provides for fees applicable to amounts available to be drawn under outstanding letters of credit which range from 1.50% to 2.00%, and a fee on unused commitments which ranges from 0.25% to 0.375%. As of January 30, 2016, there were no borrowings outstanding under the ABL Facility.
79
TAILORED BRANDS, INC. AND SUBSIDIARIES
NOTES TO CONSOLIDATED FINANCIAL STATEMENTS (Continued)
The obligations under the Credit Facilities are secured on a senior basis by a first priority lien on substantially all of the assets of the Company, certain of its U.S. subsidiaries and, in the case of the ABL Facility, Moores The Suit People Inc. The Credit Facilities and the related guarantees and security interests granted thereunder are senior secured obligations of, and will rank equally with all present and future senior indebtedness of the Company, the co-borrowers and the respective guarantors.
We utilize letters of credit primarily to secure inventory purchases and as collateral for workers compensation claims. At January 30, 2016, letters of credit totaling approximately $25.5 million were issued and outstanding. Borrowings available under the ABL Facility as of January 30, 2016 were $420.9 million.
Senior Notes
The Senior Notes are guaranteed, jointly and severally, on an unsecured basis by certain of our U.S. subsidiaries. The Senior Notes and the related guarantees are senior unsecured obligations of the Company and the guarantors, respectively, and will rank equally with all of the Company's and each guarantor's present and future senior indebtedness. The Senior Notes will mature on July 1, 2022. Interest on the Senior Notes is payable on January 1 and July 1 of each year.
We may redeem some or all of the Senior Notes at any time on or after July 1, 2017 at the redemption prices set forth in the indenture governing the Senior Notes. At any time prior to July 1, 2017, we will have the option to redeem some or all of the Senior Notes at a redemption price of 100% of the principal amount of the Senior Notes to be redeemed, plus a "make-whole" premium and accrued and unpaid interest, if any, to the date of redemption. We may also redeem up to a maximum of 35% of the original aggregate principal amount of the Senior Notes with the proceeds of certain equity offerings prior to July 1, 2017 at a redemption price of 107% of the principal amount of the Senior Notes plus accrued and unpaid interest, if any. Upon the occurrence of certain specific changes of control, we may be required to offer to purchase the Senior Notes at 101% of their aggregate principal amount plus accrued and unpaid interest thereon to the date of purchase.
We had entered into a registration rights agreement regarding the Senior Notes pursuant to which we agreed, among other things, to use our commercially reasonable efforts to consummate an exchange offer of the Senior Notes for substantially identical notes registered under the Securities Act of 1933, as amended, on or before July 13, 2015. On June 24, 2015, the exchange offer was completed.
Long-Term Debt
In April 2015, the FASB issued ASU No. 2015-03, Simplifying the Presentation of Debt Issuance Costs. The guidance requires debt issuance costs related to a recognized debt liability be reported on the balance sheet as a direct deduction from the carrying amount of that debt liability. The guidance is effective for fiscal years and interim periods beginning after December 15, 2015, and is required to be applied retrospectively. Early adoption is permitted and we adopted ASU 2015-03 in the second quarter of 2015. Subsequently, in August 2015, the FASB issued No. 2015-15, Presentation and Subsequent Measurement of Debt Issuance Costs Associated with Line-of-Credit Arrangements. ASU 2015-15 codifies the SEC's position that it would be allowable for an entity to defer and present debt issuance costs relating to line-of-credit arrangements as an asset and subsequently amortize the deferred debt issuance costs ratably over the term of the line-of-credit arrangement, regardless of whether there are any outstanding borrowings on the line-of-credit arrangement.
Upon adoption, we adjusted our January 31, 2015 balance sheet by decreasing current assets by $5.7 million, other assets by $32.8 million and long-term debt by $38.5 million. In accordance with
80
TAILORED BRANDS, INC. AND SUBSIDIARIES
NOTES TO CONSOLIDATED FINANCIAL STATEMENTS (Continued)
ASU 2015-15, we will continue presenting debt issuance costs for our asset-based revolving credit facility as an asset because of the potential volatility of borrowings and repayments under the facility. The adoption of this guidance had no impact on our results of operations or cash flows.
The following table provides details on our long-term debt as of January 30, 2016 and January 31, 2015 (in thousands):
| |
January 30, 2016 |
January 31, 2015 |
|||||
|---|---|---|---|---|---|---|---|
Term Loan (net of unamortized OID of $5.4 million at January 30, 2016 and $10.0 million at January 31, 2015) |
$ | 1,083,891 | $ | 1,087,232 | |||
Senior Notes |
600,000 | 600,000 | |||||
Less: Deferred financing costs related to the Term Loan and Senior Notes |
(27,967 | ) | (38,546 | ) | |||
| | | | | | | | |
Total long-term debt, net |
1,655,924 | 1,648,686 | |||||
| | | | | | | | |
Current portion of long-term debt |
(42,451 | ) | (11,000 | ) | |||
| | | | | | | | |
Total long-term debt, net of current portion |
$ | 1,613,473 | $ | 1,637,686 | |||
| | | | | | | | |
| | | | | | | | |
| | | | | | | | |
The following table provides principal payments due on long-term debt in the next five fiscal years and the remaining years thereafter (in thousands):
Fiscal Year
|
|
|||
|---|---|---|---|---|
2016 |
$ | 42,451 | ||
2017 |
8,750 | |||
2018 |
7,000 | |||
2019 |
5,250 | |||
2020 |
7,000 | |||
Thereafter |
1,618,799 | |||
| | | | | |
Total long-term debt |
1,689,250 | |||
Deferred financing costs and unamortized OID |
(33,326 | ) | ||
| | | | | |
Total long-term debt, net |
$ | 1,655,924 | ||
| | | | | |
| | | | | |
| | | | | |
7. INCOME TAXES
Earnings (loss) before income taxes (in thousands):
| |
Fiscal Year | |||||||||
|---|---|---|---|---|---|---|---|---|---|---|
| |
2015 | 2014 | 2013 | |||||||
United States |
$ | (1,242,022 | ) | $ | (44,346 | ) | $ | 82,061 | ||
Foreign |
46,261 | 49,722 | 44,747 | |||||||
| | | | | | | | | | | |
Total |
$ | (1,195,761 | ) | $ | 5,376 | $ | 126,808 | |||
| | | | | | | | | | | |
| | | | | | | | | | | |
| | | | | | | | | | | |
81
TAILORED BRANDS, INC. AND SUBSIDIARIES
NOTES TO CONSOLIDATED FINANCIAL STATEMENTS (Continued)
The (benefit) provision for income taxes consists of the following (in thousands):
| |
Fiscal Year | |||||||||
|---|---|---|---|---|---|---|---|---|---|---|
| |
2015 | 2014 | 2013 | |||||||
Current tax expense (benefit): |
||||||||||
Federal |
$ | 5,615 | $ | 7,328 | $ | 27,438 | ||||
State |
1,877 | (975 | ) | 3,434 | ||||||
Foreign |
8,307 | 12,225 | 9,447 | |||||||
Deferred tax (benefit) expense: |
||||||||||
Federal and state |
(185,440 | ) | (12,450 | ) | 961 | |||||
Foreign |
599 | (657 | ) | 1,311 | ||||||
| | | | | | | | | | | |
Total |
$ | (169,042 | ) | $ | 5,471 | $ | 42,591 | |||
| | | | | | | | | | | |
| | | | | | | | | | | |
| | | | | | | | | | | |
No provision for U.S. income taxes or Canadian withholding taxes has been made on the cumulative undistributed earnings of foreign companies (approximately $263.7 million at January 30, 2016) because we intend to permanently reinvest all the foreign earnings outside of the U.S. The potential deferred tax liability associated with these earnings, net of related foreign tax credits, is estimated to be approximately $37.0 million.
A reconciliation of the statutory federal income tax rate to our effective tax rate is as follows:
| |
Fiscal Year | |||||||||
|---|---|---|---|---|---|---|---|---|---|---|
| |
2015 | 2014 | 2013 | |||||||
Federal statutory rate |
(35.0 | )% | 35.0 | % | 35.0 | % | ||||
State income taxes, net of federal benefit |
(2.0 | ) | 2.2 | 2.7 | ||||||
Net change in tax accruals |
0.1 | (0.6 | ) | 0.1 | ||||||
Foreign tax rate differential |
(0.5 | ) | (85.0 | ) | (3.2 | ) | ||||
Amortizable tax goodwill |
(0.1 | ) | (32.5 | ) | (1.4 | ) | ||||
Goodwill impairment |
22.5 | — | — | |||||||
Non-deductible transaction cost |
— | 187.8 | — | |||||||
Valuation allowance |
0.5 | (10.7 | ) | 0.4 | ||||||
Other |
0.4 | 5.6 | — | |||||||
| | | | | | | | | | | |
|
(14.1 | )% | 101.8 | % | 33.6 | % | ||||
| | | | | | | | | | | |
| | | | | | | | | | | |
| | | | | | | | | | | |
In fiscal 2015, our effective income tax rate was (14.1%) and is lower than the U.S. statutory rate due to our overall net loss, partially offset by the non-deductibility of the goodwill impairment charge as discussed in Note 3. In fiscal 2014, our effective tax rate is higher than the U.S. statutory rate primarily as a result of transaction costs related to Jos. A. Bank which are non-deductible for tax purposes. Our effective tax rate is affected by recurring items, such as tax rates in foreign jurisdictions, which are lower than the federal rate, and the amounts we earn in those jurisdictions.
In assessing the realizability of deferred tax assets, management considers whether it is more likely than not that a portion or all of the deferred tax assets will be realized. The ultimate realization of deferred tax assets is dependent upon the generation of future taxable income during the periods in which those temporary differences become deductible. Management considers the scheduled reversal of deferred tax liabilities, projected future taxable income, and tax planning strategies in making this assessment. As of January 30, 2016, it is more likely than not that we will realize the benefits of the deferred tax assets, except as discussed below.
82
TAILORED BRANDS, INC. AND SUBSIDIARIES
NOTES TO CONSOLIDATED FINANCIAL STATEMENTS (Continued)
At January 30, 2016, we had net non-current deferred tax liabilities of $91.1 million. At January 31, 2015, we had net deferred tax liabilities of $284.9 million. The decrease in the net deferred tax liabilities is primarily due to the impairment of Jos. A. Bank intangible assets. A valuation allowance of $6.2 million was recorded against certain state deferred tax assets and foreign tax credits which we have concluded is not more likely than not that we will recognize.
In November 2015, the FASB issued ASU No. 2015-17, Balance Sheet Classification of Deferred Taxes. ASU 2015-17 simplifies the presentation of deferred taxes by requiring deferred tax assets and liabilities be classified as noncurrent on the balance sheet. ASU 2015-17 is effective for public companies for annual reporting periods beginning after December 15, 2016, and interim periods within those fiscal years. The guidance may be adopted prospectively or retrospectively and early adoption is permitted. We elected to early adopt this guidance prospectively beginning in the fourth quarter of fiscal 2015.
Total deferred tax assets and liabilities and the related temporary differences as of January 30, 2016 and January 31, 2015 were as follows (in thousands):
| |
January 30, 2016 |
January 31, 2015 |
|||||
|---|---|---|---|---|---|---|---|
Deferred tax assets: |
|||||||
Accrued rent and other expenses |
$ | 55,623 | $ | 54,509 | |||
Accrued compensation |
28,822 | 29,533 | |||||
Accrued inventory markdowns |
11,778 | 3,776 | |||||
Other |
2,255 | 1,149 | |||||
Tax loss and other carryforwards |
24,955 | 11,460 | |||||
| | | | | | | | |
Total deferred tax assets |
123,433 | 100,427 | |||||
Valuation allowance |
(6,185 | ) | (602 | ) | |||
| | | | | | | | |
Net deferred tax assets |
117,248 | 99,825 | |||||
| | | | | | | | |
Deferred tax liabilities: |
|||||||
Property and equipment |
(99,846 | ) | (98,752 | ) | |||
Capitalized inventory costs |
(40,621 | ) | (28,644 | ) | |||
Intangibles |
(65,329 | ) | (257,297 | ) | |||
Other |
(2,579 | ) | — | ||||
| | | | | | | | |
Total deferred tax liabilities |
(208,375 | ) | (384,693 | ) | |||
| | | | | | | | |
Net deferred tax liabilities |
$ | (91,127 | ) | $ | (284,868 | ) | |
| | | | | | | | |
| | | | | | | | |
| | | | | | | | |
In accordance with the guidance regarding accounting for uncertainty in income taxes, we classify uncertain tax positions as non-current income tax liabilities unless expected to be paid within one year and recognize interest and/or penalties related to income tax matters in income tax expense. As of January 30, 2016 and January 31, 2015, the total amount of accrued interest related to uncertain tax positions was $1.1 million and $0.8 million, respectively.
83
TAILORED BRANDS, INC. AND SUBSIDIARIES
NOTES TO CONSOLIDATED FINANCIAL STATEMENTS (Continued)
The following table summarizes the activity related to our unrecognized tax benefits (in thousands):
| |
January 30, 2016 |
January 31, 2015 |
|||||
|---|---|---|---|---|---|---|---|
Gross unrecognized tax benefits, beginning balance |
$ | 19,776 | $ | 2,930 | |||
Increase in tax positions for prior years |
24 | — | |||||
Decrease in tax positions for prior years |
— | (1 | ) | ||||
Increase in tax positions due to business combinations |
1,193 | 16,982 | |||||
Increase in tax positions for current year |
— | 124 | |||||
Decrease in tax positions for current year |
— | — | |||||
Settlements |
— | (7 | ) | ||||
Lapse from statute of limitations |
(125 | ) | (252 | ) | |||
| | | | | | | | |
Gross unrecognized tax benefits, ending balance |
$ | 20,868 | $ | 19,776 | |||
| | | | | | | | |
| | | | | | | | |
| | | | | | | | |
Of the $20.9 million in unrecognized tax benefits as of January 30, 2016, $19.8 million, if recognized, would reduce our income tax expense and effective tax rate. We do not expect material changes in the total amount of unrecognized tax benefits within the next 12 months as the outcome of tax matters is uncertain and unforeseen results can occur.
We are subject to routine compliance examinations on tax matters by various tax jurisdictions in the ordinary course of business. Tax return years which are open to examinations range from fiscal 2011 through fiscal 2015. Our tax jurisdictions include the United States, Canada, the United Kingdom, The Netherlands and France as well as their states, territories, provinces and other political subdivisions. A number of U.S. state examinations are ongoing.
At January 30, 2016, we had federal, state and foreign net operating loss ("NOL") carryforwards of approximately $21.9 million, $148.1 million and $3.9 million, respectively. The federal and state NOL carryforwards will expire between fiscal 2016 and 2035; the $3.9 million of foreign NOLs can be carried forward indefinitely. We also had $0.6 million of foreign tax credit carryforwards at January 30, 2016 which will expire in fiscal 2019.
8. INVENTORIES
The following table provides details on our inventories as of January 30, 2016 and January 31, 2015 (in thousands):
| |
January 30, 2016 |
January 31, 2015 |
|||||
|---|---|---|---|---|---|---|---|
Finished goods |
$ | 919,623 | $ | 883,323 | |||
Raw materials and merchandise components |
102,881 | 55,013 | |||||
| | | | | | | | |
Total inventories |
$ | 1,022,504 | $ | 938,336 | |||
| | | | | | | | |
| | | | | | | | |
| | | | | | | | |
84
TAILORED BRANDS, INC. AND SUBSIDIARIES
NOTES TO CONSOLIDATED FINANCIAL STATEMENTS (Continued)
9. OTHER CURRENT ASSETS, ACCRUED EXPENSES AND OTHER CURRENT LIABILITIES AND DEFERRED TAXES AND OTHER LIABILITIES
Other current assets consist of the following (in thousands):
| |
January 30, 2016 |
January 31, 2015 |
|||||
|---|---|---|---|---|---|---|---|
Tax receivable |
$ | 85,153 | $ | 87,916 | |||
Prepaid expenses |
42,166 | 39,375 | |||||
Current deferred tax assets |
— | 23,777 | |||||
Other |
16,227 | 18,741 | |||||
| | | | | | | | |
Total other current assets |
$ | 143,546 | $ | 169,809 | |||
| | | | | | | | |
| | | | | | | | |
| | | | | | | | |
Accrued expenses and other current liabilities consist of the following (in thousands):
| |
January 30, 2016 |
January 31, 2015 |
|||||
|---|---|---|---|---|---|---|---|
Accrued salary, bonus, sabbatical, vacation and other benefits |
$ | 75,373 | $ | 83,515 | |||
Unredeemed gift certificates |
40,884 | 39,563 | |||||
Accrued workers compensation and medical costs |
30,877 | 28,814 | |||||
Sales, value added, payroll, property and other taxes payable |
26,332 | 28,765 | |||||
Customer deposits, prepayments and refunds payable |
25,218 | 24,540 | |||||
Accrued interest |
16,282 | 15,715 | |||||
Loyalty program reward certificates |
9,215 | 6,889 | |||||
Cash dividends declared |
9,150 | 8,987 | |||||
Accrued royalties |
3,727 | 2,825 | |||||
Accrued strategic professional fees |
737 | 7,566 | |||||
Other |
17,794 | 21,756 | |||||
| | | | | | | | |
Total accrued expenses and other current liabilities |
$ | 255,589 | $ | 268,935 | |||
| | | | | | | | |
| | | | | | | | |
| | | | | | | | |
Deferred taxes and other liabilities consist of the following (in thousands):
| |
January 30, 2016 |
January 31, 2015 |
|||||
|---|---|---|---|---|---|---|---|
Deferred and other income tax liabilities |
$ | 112,469 | $ | 328,271 | |||
Deferred rent and landlord incentives |
66,075 | 61,475 | |||||
Unfavorable lease liabilities |
8,279 | 12,040 | |||||
Other |
7,782 | 7,540 | |||||
| | | | | | | | |
Total deferred taxes and other liabilities |
$ | 194,605 | $ | 409,326 | |||
| | | | | | | | |
| | | | | | | | |
| | | | | | | | |
85
TAILORED BRANDS, INC. AND SUBSIDIARIES
NOTES TO CONSOLIDATED FINANCIAL STATEMENTS (Continued)
10. ACCUMULATED OTHER COMPREHENSIVE (LOSS) INCOME
The following table summarizes the components of accumulated other comprehensive (loss) income during fiscal 2015, 2014 and 2013 (in thousands and net of tax):
| |
Foreign Currency Translation |
Interest Rate Swap |
Pension Plan |
Total | |||||||||
|---|---|---|---|---|---|---|---|---|---|---|---|---|---|
BALANCE—February 2, 2013 |
$ | 36,924 | $ | — | $ | — | $ | 36,924 | |||||
Other comprehensive loss before reclassifications |
(8,606 |
) |
(728 |
) |
— |
(9,334 |
) |
||||||
Other comprehensive income attributable to non-controlling interest |
(608 | ) | — | — | (608 | ) | |||||||
Amounts reclassified from accumulated other comprehensive income |
— | 329 | — | 329 | |||||||||
| | | | | | | | | | | | | | |
Net other comprehensive loss |
(9,214 | ) | (399 | ) | — | (9,613 | ) | ||||||
| | | | | | | | | | | | | | |
BALANCE—February 1, 2014 |
27,710 | (399 | ) | — | 27,311 | ||||||||
Other comprehensive (loss) income before reclassifications |
(31,942 |
) |
(1,665 |
) |
226 |
(33,381 |
) |
||||||
Amounts reclassified from accumulated other comprehensive income |
— | 399 | — | 399 | |||||||||
| | | | | | | | | | | | | | |
Net other comprehensive (loss) income |
(31,942 | ) | (1,266 | ) | 226 | (32,982 | ) | ||||||
| | | | | | | | | | | | | | |
BALANCE—January 31, 2015 |
(4,232 | ) | (1,665 | ) | 226 | (5,671 | ) | ||||||
Other comprehensive loss before reclassifications |
(22,427 |
) |
(1,566 |
) |
(46 |
) |
(24,039 |
) |
|||||
Amounts reclassified from accumulated other comprehensive loss |
— | 1,224 | — | 1,224 | |||||||||
| | | | | | | | | | | | | | |
Net other comprehensive loss |
(22,427 | ) | (342 | ) | (46 | ) | (22,815 | ) | |||||
| | | | | | | | | | | | | | |
BALANCE—January 30, 2016 |
$ | (26,659 | ) | $ | (2,007 | ) | $ | 180 | $ | (28,486 | ) | ||
| | | | | | | | | | | | | | |
| | | | | | | | | | | | | | |
| | | | | | | | | | | | | | |
Amounts reclassified from other comprehensive loss in fiscal 2015 related to the interest payments on our interest rate swap and are recorded in interest expense in the consolidated statements of (loss) earnings. Amounts reclassified from other comprehensive income in fiscal 2014 related to the settlement of our interest rate swap associated with our Previous Credit Agreement and are recorded within interest expense in the consolidated statements of (loss) earnings.
11. DIVIDENDS
Cash dividends paid were approximately $35.0 million, $34.8 million and $35.5 million during fiscal 2015, 2014 and 2013, respectively. In fiscal 2015, 2014 and 2013, a dividend of $0.18 per share was declared in each quarter, for an annual dividend of $0.72 per share, respectively.
The cash dividend of $0.18 per share declared by our Board of Directors (the "Board") in January 2016 is payable on March 25, 2016 to shareholders of record on March 15, 2016 and is included in accrued expenses and other current liabilities on the consolidated balance sheet as of January 30, 2016.
86
TAILORED BRANDS, INC. AND SUBSIDIARIES
NOTES TO CONSOLIDATED FINANCIAL STATEMENTS (Continued)
12. SHARE REPURCHASES, TREASURY STOCK AND NON-CONTROLLING INTEREST
Share Repurchases
In March 2013, the Board approved a $200.0 million share repurchase program for our common stock, which amended and replaced the Company's then existing share repurchase program authorized in January 2011. At January 30, 2016, the remaining balance available under the authorization was $48.0 million.
During fiscal 2015 and 2014, no shares were repurchased in open market transactions under the Board's March 2013 authorization.
In July 2013, we entered into an accelerated share repurchase agreement ("ASR Agreement") with J.P. Morgan Securities LLC ("JPMorgan"), as agent for JPMorgan Chase Bank, National Association, London Branch, to purchase $100.0 million of our common stock. In July 2013, we paid $100.0 million to JPMorgan and received an initial delivery of 2,197,518 shares. The value of the initial shares received was approximately $85.0 million, reflecting a $38.68 price per share. In September 2013, JPMorgan delivered an additional 455,769 shares valued at approximately $15.0 million, reflecting a $32.91 price per share. All repurchased shares under the ASR Agreement were immediately retired. In addition to the ASR Agreement, during fiscal 2013, 1,489,318 shares at a cost of $52.0 million were repurchased in open market transactions under the Board's March 2013 authorization.
The following table summarizes our common stock repurchases during fiscal 2015, 2014 and 2013 (in thousands, except share data and average price per share):
| |
Fiscal Year | |||||||||
|---|---|---|---|---|---|---|---|---|---|---|
| |
2015 | 2014 | 2013 | |||||||
Shares repurchased(1) |
5,799 | 5,349 | 4,147,983 | |||||||
Total costs |
$ | 277 | $ | 251 | $ | 152,129 | ||||
Average price per share |
$ | 47.82 | $ | 46.93 | $ | 36.68 | ||||
- (1)
- Includes 5,799, 5,349 and 5,378 shares, respectively, repurchased in private transactions to satisfy minimum tax withholding obligations arising upon the vesting of certain restricted stock.
Treasury Stock
The following table shows the change in our treasury shares during fiscal 2015 and 2014:
| |
Treasury Shares |
|||
|---|---|---|---|---|
Balance, February 1, 2014 |
137,900 | |||
Purchases of common stock |
100 | |||
Retirement of common stock |
(100 | ) | ||
Reissuance of common stock |
(8,805 | ) | ||
| | | | | |
Balance, January 31, 2015 |
129,095 | |||
| | | | | |
Reissuance of common stock |
(8,804 | ) | ||
| | | | | |
Balance, January 30, 2016 |
120,291 | |||
| | | | | |
| | | | | |
| | | | | |
87
TAILORED BRANDS, INC. AND SUBSIDIARIES
NOTES TO CONSOLIDATED FINANCIAL STATEMENTS (Continued)
The total cost of the 120,291 shares of treasury stock held at January 30, 2016 was $3.0 million or an average price of $24.73 per share and the 129,095 shares of treasury stock held at January 31, 2015 was $3.2 million or an average price of $24.73 per share.
Non-Controlling Interest
In September 2014, we exercised our option and completed the purchase of the remaining 14% interest in our UK operations from the minority interest holders. As a result, we eliminated the non-controlling interest balance and recorded an increase in capital in excess of par of $7.2 million less the $6.7 million in cash consideration paid to the former minority interest holders.
13. EQUITY AND SHARE-BASED COMPENSATION PLANS
Preferred Stock
Our Board is authorized to issue up to 2,000,000 shares of preferred stock and to determine the dividend rights and terms, redemption rights and terms, liquidation preferences, conversion rights, voting rights and sinking fund provisions of those shares without any further vote or act by Company shareholders. There was no issued preferred stock as of January 30, 2016 and January 31, 2015, respectively.
Stock Plans
We have adopted the 2004 Long-Term Incentive Plan ("2004 Plan") which, as amended, provides for an aggregate of up to 6,910,059 shares of our common stock (or the fair market value thereof) with respect to which stock options, stock appreciation rights, restricted stock, DSUs and performance based awards may be granted to full-time key employees and to non-employee directors of the Company. During fiscal 2015, our shareholders approved amendments to the 2004 Plan including an increase in the number of shares authorized for issuance under the plan by 2,300,000 shares. During fiscal 2013, our shareholders approved an amendment to the 2004 Plan extending its termination date to March 29, 2024. Under the 2004 Plan, the vesting, transferability restrictions and other applicable provisions of any stock options, stock appreciation rights, restricted stock, DSUs or performance based awards are determined by the Compensation Committee of the Board of Directors or, in the case of awards to non-employee directors, the Board of Directors of the Company.
In addition, we continue to administer the 1996 Long-Term Incentive Plan ("1996 Plan") and the Non-Employee Director Stock Option Plan ("Director Plan") as a result of awards which remain outstanding pursuant to such plans. Awards are no longer available for grant under the 1996 Plan and the Director Plan.
Options granted under these plans vest annually in varying increments over a period from one to ten years and must be exercised within ten years of the date of grant. Grants of DSUs or restricted stock generally vest over a period from one to three years; however, certain grants vest annually at varying increments over a period up to ten years.
As of January 30, 2016, 2,653,359 shares were available for grant under the 2004 Plan and 3,680,935 shares of common stock were reserved for future issuance under the existing plans.
88
TAILORED BRANDS, INC. AND SUBSIDIARIES
NOTES TO CONSOLIDATED FINANCIAL STATEMENTS (Continued)
Non-Vested Deferred Stock Units, Performance Units and Restricted Stock Shares
The following table summarizes the activity of time-based and performance-based awards during fiscal 2015:
| |
Units | Weighted-Average Grant-Date Fair Value |
|||||||||||
|---|---|---|---|---|---|---|---|---|---|---|---|---|---|
| |
Time- Based |
Performance- Based |
Time- Based |
Performance- Based |
|||||||||
Non-Vested at January 31, 2015 |
378,518 | 170,789 | $ | 42.67 | $ | 43.94 | |||||||
Granted |
360,967 | 36,844 | (2) | 52.60 | 57.32 | ||||||||
Vested(1) |
(233,889 | ) | (18,977 | ) | 43.72 | 46.41 | |||||||
Forfeited |
(27,490 | ) | (20,000 | ) | 43.58 | 33.09 | |||||||
| | | | | | | | | | | | | | |
Non-Vested at January 30, 2016 |
478,106 | 168,656 | $ | 49.60 | $ | 47.87 | |||||||
| | | | | | | | | | | | | | |
| | | | | | | | | | | | | | |
| | | | | | | | | | | | | | |
- (1)
- Includes
86,035 shares relinquished for tax payments related to vested DSUs in fiscal 2015.
- (2)
- Includes 22,645 of performance-based DSU's and 14,199 of performance units, respectively, which are further described below.
The following table summarizes additional information about DSUs:
| |
Fiscal Year | |||||||||
|---|---|---|---|---|---|---|---|---|---|---|
| |
2015 | 2014 | 2013 | |||||||
DSUs issued |
360,967 | 352,636 | 559,489 | |||||||
Weighted average grant date fair value |
$ | 52.60 | $ | 49.21 | $ | 33.26 | ||||
The fair value of shares vested was $10.2 million, $13.8 million and $12.4 million in fiscal 2015, 2014 and 2013, respectively. As of January 30, 2016, the intrinsic value of non-vested DSUs was $6.6 million.
On April 3, 2013, our Board approved a change in the form of award agreements to be issued for grants of DSUs to participants under our 2004 Plan. As revised, the award agreements provide that dividend equivalents, if any, will be accrued during the vesting period for such DSU awards and paid out only upon vesting of the underlying DSUs. As such, grants of DSU awards on or after April 3, 2013 earn dividends throughout the vesting period which are subject to the same vesting terms as the underlying share award. Grants of DSUs generally vest over a period of from one to three years. DSU awards granted prior to April 3, 2013 are entitled to receive non-forfeitable dividend equivalents, if any, when and if paid to shareholders of record at the payment date. Included in the non-vested time-based awards as of January 30, 2016 are 17,576 DSUs granted prior to April 3, 2013.
Of the 36,844 performance units granted in 2015, 22,645 units represent a contingent right to receive one share of common stock and vest after our 2017 fiscal year, subject to our achievement of a cumulative performance target for fiscal years 2015-2017.
The remaining 14,199 performance units granted in 2015 represent a contingent right to receive up to 2.25 shares of common stock and vest after our 2017 fiscal year, subject to our achievement of a performance target for fiscal 2017. Assuming the performance target is achieved, the number of performance units earned will be adjusted based on multipliers related to (1) the Company's adjusted earnings per share for fiscal 2017 and (2) the Company's relative total shareholder return ("TSR") compared to the TSR of certain peer companies over a pre-defined period. At the end of fiscal 2015, the performance condition for
89
TAILORED BRANDS, INC. AND SUBSIDIARIES
NOTES TO CONSOLIDATED FINANCIAL STATEMENTS (Continued)
these performance units was deemed not probable of achievement and expense recorded for these awards was reversed in the fourth quarter of fiscal 2015.
Performance units that are unvested at the end of the performance period will lapse and be forfeited. The performance units earn dividends throughout the vesting period and are subject to the same vesting terms as the underlying performance-based awards.
Performance-based DSUs granted in April 2014 ("April 2014 performance-based DSUs") represented a contingent right to receive one share of common stock and vested over a one year period, subject to our achievement of a performance target for 2014. Having met the performance target for 2014, the April 2014 performance-based DSUs vested in accordance with their terms in April 2015.
The following table summarizes activity of restricted stock during fiscal 2015:
| |
Shares | Weighted- Average Grant-Date Fair Value |
|||||
|---|---|---|---|---|---|---|---|
Non-Vested at January 31, 2015 |
67,790 | $ | 37.05 | ||||
Granted |
33,157 | 27.93 | |||||
Vested |
(48,430 | ) | 40.76 | ||||
Forfeited |
(19,360 | ) | 27.77 | ||||
| | | | | | | | |
Non-Vested at January 30, 2016 |
33,157 | $ | 27.93 | ||||
| | | | | | | | |
| | | | | | | | |
| | | | | | | | |
Restricted stock awards receive non-forfeitable dividends, if any, when and if paid to shareholders of record at the payment date.
The following table summarizes additional information about restricted stock:
| |
Fiscal Year | |||||||||
|---|---|---|---|---|---|---|---|---|---|---|
| |
2015 | 2014 | 2013 | |||||||
Stock issued |
33,157 | 30,166 | 23,577 | |||||||
Weighted average grant date fair value |
$ | 27.93 | $ | 49.36 | $ | 40.29 | ||||
Fair value of shares vested (in millions) |
$ | 2.0 | $ | 1.6 | $ | 1.3 | ||||
As of January 30, 2016, the intrinsic value of non-vested restricted stock shares was $0.5 million.
As of January 30, 2016, we have unrecognized compensation expense related to non-vested DSUs and shares of restricted stock of approximately $16.2 million which is expected to be recognized over a weighted-average period of 1.4 years.
90
TAILORED BRANDS, INC. AND SUBSIDIARIES
NOTES TO CONSOLIDATED FINANCIAL STATEMENTS (Continued)
Stock Options
The following table summarizes the activity of stock options during fiscal 2015:
| |
Number of Shares |
Weighted- Average Exercise Price |
Weighted- Average Remaining Contractual Term |
Aggregate Intrinsic Value (in thousands) |
||||||||
|---|---|---|---|---|---|---|---|---|---|---|---|---|
Outstanding at January 31, 2015 |
660,283 | $ | 38.28 | |||||||||
Granted |
41,951 | 57.91 | ||||||||||
Exercised |
(19,617 | ) | 33.02 | |||||||||
Forfeited |
— | — | ||||||||||
Expired |
(1,500 | ) | 34.64 | |||||||||
| | | | | | | | | | | | | |
Outstanding at January 30, 2016 |
681,117 | $ | 39.65 | 5.6 Years | $ | — | ||||||
| | | | | | | | | | | | | |
| | | | | | | | | | | | | |
| | | | | | | | | | | | | |
Vested or expected to vest at January 30, 2016 |
676,163 | $ | 39.57 | 5.6 Years | $ | — | ||||||
| | | | | | | | | | | | | |
| | | | | | | | | | | | | |
| | | | | | | | | | | | | |
Exercisable at January 30, 2016 |
309,570 | $ | 32.12 | 3.6 Years | $ | — | ||||||
| | | | | | | | | | | | | |
| | | | | | | | | | | | | |
| | | | | | | | | | | | | |
The weighted-average grant date fair value of stock options granted during fiscal 2015, 2014 and 2013 was $18.63, $16.82 and $13.10, respectively. The fair value of options is estimated on the date of grant using the Black-Scholes option pricing model using the following weighted-average assumptions:
| |
Fiscal Year | |||||||||
|---|---|---|---|---|---|---|---|---|---|---|
| |
2015 | 2014 | 2013 | |||||||
Risk-free interest rates |
1.51 | % | 1.79 | % | 0.76 | % | ||||
Expected lives |
5.0 years | 5.0 years | 5.0 years | |||||||
Dividend yield |
1.38 | % | 1.58 | % | 2.20 | % | ||||
Expected volatility |
39.74 | % | 42.77 | % | 55.00 | % | ||||
The risk-free interest rate is based on the U.S. Treasury yield curve in effect at the time of grant. The expected lives represents the period of time the options are expected to be outstanding after their grant date. The dividend yield is based on the average of the annual dividend divided by the market price of our common stock at the time of declaration. The expected volatility is based on historical volatility of our common stock. The total intrinsic value of options exercised during fiscal 2015, 2014 and 2013 was $0.5 million, $4.4 million and $7.8 million, respectively. As of January 30, 2016, we have unrecognized compensation expense related to non-vested stock options of approximately $3.5 million which is expected to be recognized over a weighted-average period of 1.4 years.
14. RETIREMENT AND STOCK PURCHASE PLANS
We have 401(k) savings plans which allow eligible employees to save for retirement on a tax deferred basis. Employer matching contributions under the 401(k) savings plans are made based on a formula set by the Board from time to time. During fiscal 2015, 2014 and 2013, our matching contributions for the plan charged to operations were $1.2 million, $1.2 million and $1.0 million, respectively.
We also maintain a noncontributory defined benefit pension plan and a post-retirement benefit plan which cover certain union and nonunion employees at Jos. A. Bank. The plans provide for eligible employees to receive benefits based principally on years of service. Amounts related to the defined benefit pension and post-retirement benefit plans were immaterial to our consolidated financial statements.
91
TAILORED BRANDS, INC. AND SUBSIDIARIES
NOTES TO CONSOLIDATED FINANCIAL STATEMENTS (Continued)
In addition, we have an Employee Stock Discount Plan ("ESDP") which allows employees to authorize after-tax payroll deductions to be used for the purchase of up to 2,137,500 shares of our common stock at 85% of the lesser of the fair market value of our common stock on the first day of the offering period or the fair market value of our common stock on the last day of the offering period. We make no contributions to this plan but pay all brokerage, service and other costs incurred. A participant may not purchase more than 125 shares during any calendar quarter.
During fiscal 2015, 2014 and 2013, employees purchased 87,537 shares, 86,935 shares and 108,110 shares, respectively, under the ESDP, the weighted-average fair value of which was $26.23, $40.63 and $28.06 per share, respectively. We recognized approximately $0.7 million, $0.9 million and $0.8 million of share-based compensation expense related to the ESDP for fiscal 2015, 2014 and 2013, respectively. As of January 30, 2016, 565,866 shares were reserved for future issuance under the ESDP.
15. FAIR VALUE MEASUREMENTS
Fair value is defined as the price that would be received to sell an asset or paid to transfer a liability in an orderly transaction between market participants at the measurement date. The authoritative guidance for fair value measurements establishes a three-tier fair value hierarchy, categorizing the inputs used to measure fair value. The hierarchy can be described as follows: Level 1-observable inputs such as quoted prices in active markets; Level 2-inputs other than the quoted prices in active markets that are observable either directly or indirectly; and Level 3-unobservable inputs in which there is little or no market data, which require the reporting entity to develop its own assumptions. The fair value hierarchy also requires an entity to maximize the use of observable inputs and minimize the use of unobservable inputs when measuring fair value.
Assets and Liabilities that are Measured at Fair Value on a Recurring Basis
| |
Fair Value Measurements at Reporting Date Using |
|
|||||||||||
|---|---|---|---|---|---|---|---|---|---|---|---|---|---|
(in thousands)
|
Quoted Prices in Active Markets for Identical Instruments (Level 1) |
Significant Other Observable Inputs (Level 2) |
Significant Unobservable Inputs (Level 3) |
Total | |||||||||
At January 30, 2016— |
|||||||||||||
Assets: |
|||||||||||||
Derivative financial instruments |
$ | — | $ | 442 | $ | — | $ | 442 | |||||
| | | | | | | | | | | | | | |
| | | | | | | | | | | | | | |
| | | | | | | | | | | | | | |
Liabilities: |
|||||||||||||
Derivative financial instruments |
$ | — | $ | 3,296 | $ | — | $ | 3,296 | |||||
| | | | | | | | | | | | | | |
| | | | | | | | | | | | | | |
| | | | | | | | | | | | | | |
At January 31, 2015— |
|||||||||||||
Assets: |
|||||||||||||
Derivative financial instruments |
$ | — | $ | 878 | $ | — | $ | 878 | |||||
| | | | | | | | | | | | | | |
| | | | | | | | | | | | | | |
| | | | | | | | | | | | | | |
Liabilities: |
|||||||||||||
Derivative financial instruments |
$ | — | $ | 2,729 | $ | — | $ | 2,729 | |||||
| | | | | | | | | | | | | | |
| | | | | | | | | | | | | | |
| | | | | | | | | | | | | | |
Derivative financial instruments are comprised of (1) foreign currency forward exchange contracts primarily entered into to minimize our foreign currency exposure related to forecasted purchases of certain inventories denominated in a currency different from the operating entity's functional currency and (2) an
92
TAILORED BRANDS, INC. AND SUBSIDIARIES
NOTES TO CONSOLIDATED FINANCIAL STATEMENTS (Continued)
interest rate swap agreement to minimize our exposure to interest rate changes on our outstanding indebtedness. These derivative financial instruments are recorded in the consolidated balance sheets at fair value based upon observable market inputs. Derivative financial instruments in an asset position are included within other current assets in the consolidated balance sheets. Derivative financial instruments in a liability position are included within accrued expenses and other current liabilities or noncurrent liabilities in the consolidated balance sheets. Refer to Note 16 for further information regarding our derivative instruments.
Assets and Liabilities that are Measured at Fair Value on a Non-Recurring Basis
Long-lived assets, such as property and equipment, goodwill and identifiable intangibles, are periodically evaluated for impairment whenever events or changes in circumstances indicate that the carrying amount of an asset may not be recoverable. If the asset carrying amount exceeds its fair value, an impairment charge is recognized in the amount by which the carrying amount exceeds the fair value of the asset. The fair values of long-lived assets held-for-use are based on our own judgments about the assumptions that market participants would use in pricing the asset and on observable market data, when available. We classify these measurements as Level 3 within the fair value hierarchy.
As discussed in Note 1, during fiscal 2015, we incurred $27.5 million of asset impairment charges, primarily related to store locations to be closed and underperforming stores. The estimated fair value of the impaired long-lived assets related to these stores was $1.6 million as of January 30, 2016. We estimated the fair value of the long-lived assets based on an income approach using projected future cash flows discounted using a weighted-average cost of capital analysis that reflects current market conditions.
During fiscal 2013, we recorded a goodwill impairment charge related to our K&G brand totaling $9.5 million, which reduced the K&G goodwill balance to zero. We estimated the fair value of the K&G brand based on estimates provided to us by market participants, which we classified as Level 2 within the fair value hierarchy.
Fair Value of Financial Instruments
Our financial instruments consist of cash, accounts receivable, accounts payable, accrued expenses and other current liabilities and long-term debt. Management estimates that, as of January 30, 2016 and January 31, 2015, the carrying value of cash, accounts receivable, accounts payable and accrued expenses and other current liabilities approximated their fair value due to the highly liquid or short-term nature of these instruments.
The fair values of our Term Loan and the term loan under the Previous Credit Agreement were valued based upon observable market data provided by a third party for similar types of debt, which we classify as a Level 2 input within the fair value hierarchy. At January 30, 2016, the fair value of our Senior Notes is based on quoted prices in active markets, which we classify as Level 1 input within the fair value hierarchy. At January 31, 2015, the fair value of our Senior Notes was based on trading data in active markets, which we classify as a Level 2 input within the fair value hierarchy. The table below shows the fair value and carrying value of our long-term debt (in thousands):
| |
January 30, 2016 | January 31, 2015 | |||||||||||
|---|---|---|---|---|---|---|---|---|---|---|---|---|---|
| |
Carrying Amount |
Estimated Fair Value |
Carrying Amount |
Estimated Fair Value |
|||||||||
Long-term debt, including current portion |
$ | 1,655,924 | $ | 1,410,651 | $ | 1,648,686 | $ | 1,706,546 | |||||
| | | | | | | | | | | | | | |
| | | | | | | | | | | | | | |
| | | | | | | | | | | | | | |
93
TAILORED BRANDS, INC. AND SUBSIDIARIES
NOTES TO CONSOLIDATED FINANCIAL STATEMENTS (Continued)
16. DERIVATIVE FINANCIAL INSTRUMENTS
We are exposed to market risk associated with foreign currency exchange rate fluctuations as a result of our direct sourcing programs and our operations in foreign countries. In connection with our direct sourcing programs, we may enter into merchandise purchase commitments that are denominated in a currency different from the functional currency of the operating entity. Our risk management policy is to hedge a portion of forecasted merchandise purchases for our direct sourcing programs that bear foreign exchange risk using foreign exchange forward contracts. We have not elected to apply hedge accounting to these transactions denominated in a foreign currency. These foreign currency derivative financial instruments are recorded in the consolidated balance sheet at fair value determined by comparing the cost of the foreign currency to be purchased under the contracts using the exchange rates obtained under the contracts (adjusted for forward points) to the hypothetical cost using the spot rate at period end. At January 30, 2016, we had $0.4 million of such derivative financial instruments recorded in other current assets and at January 31, 2015, we had $0.9 million of such derivative financial instruments recorded in other current assets. A pre-tax loss associated with such derivative financial instruments totaled $0.6 million for fiscal 2015, a pre-tax gain associated with such derivative financial instruments totaled $1.4 million for fiscal 2014, and a pre-tax loss associated with such derivative financial instruments totaled $0.3 million for fiscal 2013.
In June 2014, we entered into a Term Loan with variable-rate interest payments (see Note 6). To minimize the impact of changes in interest rates on our interest payments under the Term Loan, in January 2015, we entered into an interest rate swap agreement to swap variable-rate interest payments for fixed-rate interest payments on a notional amount of $520.0 million, effective in February 2015. The interest rate swap agreement matures in August 2018 and has periodic interest settlements. We have designated the interest rate swap as a cash flow hedge of the variability of interest payments under the Term Loan due to changes in the LIBOR benchmark interest rate.
Under this interest rate swap agreement, we receive a floating rate based on the 3-month LIBOR rate and pay a fixed rate of 5.03% (including the applicable margin of 3.50%) on the outstanding notional amount. The swap fixed rate was structured to mirror the payment terms of the Term Loan. At January 30, 2016, the fair value of the interest rate swap was a liability of $3.3 million with $2.3 million recorded in accrued expenses and other current liabilities and $1.0 million in other liabilities in our consolidated balance sheet. The effective portion of the loss is reported as a component of accumulated other comprehensive (loss) income. There was no hedge ineffectiveness at January 30, 2016. Changes in fair value are reclassified from accumulated other comprehensive (loss) income into earnings in the same period that the hedged item affects earnings. Over the next 12 months, approximately $2.3 million of the effective portion of the loss is expected to be reclassified from accumulated other comprehensive (loss) income into earnings.
If, at any time, the swap is determined to be ineffective, in whole or in part, due to changes in the interest rate swap or underlying debt agreements, the fair value of the portion of the swap determined to be ineffective will be recognized as a gain or loss in the statement of earnings for the applicable period.
We had no derivative financial instruments with credit-risk-related contingent features underlying the agreements as of January 30, 2016 or January 31, 2015, respectively.
94
TAILORED BRANDS, INC. AND SUBSIDIARIES
NOTES TO CONSOLIDATED FINANCIAL STATEMENTS (Continued)
17. SEGMENT REPORTING
Our operations are conducted in two reportable segments, retail and corporate apparel, based on the way we manage, evaluate and internally report our business activities.
The retail segment includes the results from our four retail merchandising brands: Men's Wearhouse/Men's Wearhouse and Tux, Jos. A. Bank, Moores and K&G. These four brands are operating segments that have been aggregated into the retail reportable segment. MW Cleaners is also aggregated in the retail segment as these operations have not had a significant effect on our revenues or expenses. Specialty apparel merchandise offered by our four retail merchandising concepts include suits, suit separates, sport coats, slacks, business casual, sportswear, outerwear, dress shirts, shoes and accessories for men. Women's career apparel, sportswear and accessories, including shoes, and children's apparel is offered at most of our K&G stores. Rental product is offered at our Men's Wearhouse/Men's Wearhouse and Tux, Jos. A Bank and Moores retail stores.
The corporate apparel segment includes the results from our corporate apparel and uniform operations conducted by Twin Hill in the U.S. and Dimensions, Alexandra and Yaffy in the UK. The two corporate apparel and uniform concepts are operating segments that have been aggregated into the reportable corporate apparel segment. The corporate apparel segment provides corporate clothing uniforms and workwear to workforces.
We measure segment profitability based on operating income, defined as income before interest expense, interest income, income taxes and non-controlling interest. Corporate expenses and assets are allocated to the retail segment.
| |
Fiscal Year | |||||||||
|---|---|---|---|---|---|---|---|---|---|---|
| |
2015 | 2014 | 2013 | |||||||
Net sales: |
||||||||||
MW(1) |
$ | 1,791,249 | $ | 1,686,850 | $ | 1,606,218 | ||||
Jos. A. Bank |
866,882 | 684,023 | — | |||||||
K&G |
338,359 | 334,043 | 336,222 | |||||||
Moores |
222,574 | 258,347 | 254,371 | |||||||
MW Cleaners |
33,410 | 31,909 | 29,611 | |||||||
| | | | | | | | | | | |
Total retail segment |
3,252,474 | 2,995,172 | 2,226,422 | |||||||
| | | | | | | | | | | |
Dimensions and Alexandra (UK) |
205,196 | 216,840 | 209,133 | |||||||
Twin Hill |
38,601 | 40,536 | 37,678 | |||||||
| | | | | | | | | | | |
Total corporate apparel segment |
243,797 | 257,376 | 246,811 | |||||||
| | | | | | | | | | | |
Total net sales |
$ | 3,496,271 | $ | 3,252,548 | $ | 2,473,233 | ||||
| | | | | | | | | | | |
| | | | | | | | | | | |
| | | | | | | | | | | |
- (1)
- MW includes Men's Wearhouse and Men's Wearhouse and Tux stores, tuxedo shops within Macy's and JA Holding.
95
TAILORED BRANDS, INC. AND SUBSIDIARIES
NOTES TO CONSOLIDATED FINANCIAL STATEMENTS (Continued)
The following table sets forth supplemental products and services sales information for the Company (in thousands):
| |
Fiscal Year | |||||||||
|---|---|---|---|---|---|---|---|---|---|---|
| |
2015 | 2014 | 2013 | |||||||
Net sales: |
||||||||||
Men's tailored clothing product |
$ | 1,436,742 | $ | 1,255,349 | $ | 904,223 | ||||
Men's non-tailored clothing product |
1,077,176 | 1,024,368 | 686,514 | |||||||
Women's clothing product |
74,985 | 74,425 | 73,542 | |||||||
Other |
11,031 | 11,321 | 3,256 | |||||||
| | | | | | | | | | | |
Total retail clothing product |
2,599,934 | 2,365,463 | 1,667,535 | |||||||
| | | | | | | | | | | |
Rental services |
443,290 | 442,866 | 411,864 | |||||||
Alteration services |
175,840 | 154,934 | 117,412 | |||||||
Retail dry cleaning services |
33,410 | 31,909 | 29,611 | |||||||
| | | | | | | | | | | |
Total alteration and other services |
209,250 | 186,843 | 147,023 | |||||||
| | | | | | | | | | | |
Corporate apparel clothing product |
243,797 | 257,376 | 246,811 | |||||||
| | | | | | | | | | | |
Total net sales |
$ | 3,496,271 | $ | 3,252,548 | $ | 2,473,233 | ||||
| | | | | | | | | | | |
| | | | | | | | | | | |
| | | | | | | | | | | |
Operating (loss) income by reportable segment and the reconciliation to earnings before income taxes is as follows (in thousands):
| |
Fiscal Year | |||||||||
|---|---|---|---|---|---|---|---|---|---|---|
| |
2015 | 2014 | 2013 | |||||||
Operating (loss) income: |
||||||||||
Retail |
$ | (1,084,846 | ) | $ | 63,281 | $ | 120,247 | |||
Corporate apparel |
7,550 | 9,929 | 9,381 | |||||||
| | | | | | | | | | | |
Operating (loss) income |
(1,077,296 | ) | 73,210 | 129,628 | ||||||
Interest income |
187 | 356 | 385 | |||||||
Interest expense |
(105,977 | ) | (66,032 | ) | (3,205 | ) | ||||
Loss on extinguishment of debt |
(12,675 | ) | (2,158 | ) | — | |||||
| | | | | | | | | | | |
(Loss) earnings before income taxes |
$ | (1,195,761 | ) | $ | 5,376 | $ | 126,808 | |||
| | | | | | | | | | | |
| | | | | | | | | | | |
| | | | | | | | | | | |
Capital expenditures by reportable segment are as follows (in thousands):
| |
Fiscal Year | |||||||||
|---|---|---|---|---|---|---|---|---|---|---|
| |
2015 | 2014 | 2013 | |||||||
Capital expenditures: |
||||||||||
Retail |
$ | 111,419 | $ | 92,602 | $ | 105,781 | ||||
Corporate apparel |
4,079 | 3,818 | 2,419 | |||||||
| | | | | | | | | | | |
Total capital expenditures |
$ | 115,498 | $ | 96,420 | $ | 108,200 | ||||
| | | | | | | | | | | |
| | | | | | | | | | | |
| | | | | | | | | | | |
96
TAILORED BRANDS, INC. AND SUBSIDIARIES
NOTES TO CONSOLIDATED FINANCIAL STATEMENTS (Continued)
Depreciation and amortization expense by reportable segment is as follows (in thousands):
| |
Fiscal Year | |||||||||
|---|---|---|---|---|---|---|---|---|---|---|
| |
2015 | 2014 | 2013 | |||||||
Depreciation and amortization expense: |
||||||||||
Retail |
$ | 126,216 | $ | 106,140 | $ | 82,084 | ||||
Corporate apparel |
6,113 | 6,519 | 6,665 | |||||||
| | | | | | | | | | | |
Total depreciation and amortization expense |
$ | 132,329 | $ | 112,659 | $ | 88,749 | ||||
| | | | | | | | | | | |
| | | | | | | | | | | |
| | | | | | | | | | | |
Total assets by reportable segment are as follows (in thousands):
| |
January 30, 2016 |
January 31, 2015 |
|||||
|---|---|---|---|---|---|---|---|
Segment assets: |
|||||||
Retail |
$ | 2,009,659 | $ | 3,270,480 | |||
Corporate apparel |
234,660 | 237,732 | |||||
| | | | | | | | |
Total assets |
$ | 2,244,319 | $ | 3,508,212 | |||
| | | | | | | | |
| | | | | | | | |
| | | | | | | | |
The tables below present information related to geographic areas in which we operate, with net sales classified based primarily on the country where our customer is located (in thousands):
| |
Fiscal Year | |||||||||
|---|---|---|---|---|---|---|---|---|---|---|
| |
2015 | 2014 | 2013 | |||||||
Net sales: |
||||||||||
U.S. |
$ | 3,068,501 | $ | 2,777,361 | $ | 2,009,729 | ||||
Canada |
222,574 | 258,347 | 254,371 | |||||||
UK |
205,196 | 216,840 | 209,133 | |||||||
| | | | | | | | | | | |
Total net sales |
$ | 3,496,271 | $ | 3,252,548 | $ | 2,473,233 | ||||
| | | | | | | | | | | |
| | | | | | | | | | | |
| | | | | | | | | | | |
| |
January 30, 2016 |
January 31, 2015 |
|||||
|---|---|---|---|---|---|---|---|
Long-lived assets, net (including rental product): |
|||||||
U.S. |
$ | 625,236 | $ | 644,277 | |||
Canada |
41,155 | 41,682 | |||||
UK |
12,893 | 12,787 | |||||
| | | | | | | | |
Total long-lived assets |
$ | 679,284 | $ | 698,746 | |||
| | | | | | | | |
| | | | | | | | |
| | | | | | | | |
18. COMMITMENTS AND CONTINGENCIES
Lease commitments
We lease retail business locations, office and warehouse facilities, and equipment under various non-cancelable operating leases expiring in various years through 2029. Rent expense for operating leases for fiscal 2015, 2014 and 2013 was $268.9 million, $235.1 million and $175.9 million, respectively, and includes contingent rentals of $2.6 million, $2.0 million and $0.2 million, respectively. Sublease rentals of $1.2 million, $1.8 million, and $1.2 million were received in fiscal 2015, 2014 and 2013, respectively.
97
TAILORED BRANDS, INC. AND SUBSIDIARIES
NOTES TO CONSOLIDATED FINANCIAL STATEMENTS (Continued)
Minimum future rental payments under non-cancelable operating leases as of January 30, 2016 for each of the next five years and in the aggregate are as follows (in thousands):
Fiscal Year
|
Operating Leases |
|||
|---|---|---|---|---|
2016 |
$ | 261,118 | ||
2017 |
226,759 | |||
2018 |
189,952 | |||
2019 |
159,840 | |||
2020 |
132,075 | |||
Thereafter |
309,807 | |||
| | | | | |
Total |
$ | 1,279,551 | ||
| | | | | |
| | | | | |
| | | | | |
The total minimum lease commitments above does not include minimum sublease rent income of $5.0 million receivable in the future under non-cancelable sublease agreements.
Leases on retail business locations specify minimum rentals plus common area maintenance charges and possible additional rentals based upon percentages of sales. Most of the retail business location leases provide for renewal options at rates specified in the leases. In the normal course of business, these leases are generally renewed or replaced by other leases.
Legal matters
On July 9, 2014, David Lucas and Eric Salerno, on behalf of themselves and all California residents similarly situated, filed a putative class action Complaint against Jos. A. Bank in the U.S. District Court for Southern California (Case No. '14CV1631LAB JLB). The Complaint alleges, among other things, that Jos. A. Bank violated the California Unfair Competition Law and the California Consumers Legal Remedies Act with its comparative price advertising, price discounts and free apparel promotions. The Complaint seeks, among other relief, certification of the case as a class action, permanent injunction, actual and compensatory damages, restitution including disgorgement of profits and unjust enrichment, costs and attorney fees. We intend to vigorously defend the case. The range of loss, if any, is not reasonably estimable at this time. We do not currently believe, however, that it will have a material adverse effect on our financial position, results of operations or cash flows.
In addition, we are involved in various routine legal proceedings, including ongoing litigation, incidental to the conduct of our business. Management does not believe that any of these matters will have a material adverse effect on our financial position, results of operations or cash flows.
19. CONDENSED CONSOLIDATING FINANCIAL INFORMATION
As discussed in Note 6, The Men's Wearhouse, Inc. (the "Issuer") issued $600.0 million in aggregate principal amount of 7.00% Senior Notes. The Senior Notes are guaranteed by certain of our U.S. subsidiaries (collectively, the "Guarantors"). Our Canadian and U.K. subsidiaries (collectively, the "Non-Guarantors") are not guarantors of the Senior Notes. Each of the Guarantors is 100% owned and all guarantees are joint and several. In addition, the guarantees are full and unconditional except for certain automatic release provisions related to the Guarantors.
These automatic release provisions are considered customary and include the sale or other disposition of all or substantially all of the assets or all of the capital stock of any subsidiary guarantor, the release or discharge of a guarantor's guarantee of the obligations under the Term Loan other than a release or
98
TAILORED BRANDS, INC. AND SUBSIDIARIES
NOTES TO CONSOLIDATED FINANCIAL STATEMENTS (Continued)
discharge through payment thereon, the designation in accordance with the Indenture of a guarantor as an unrestricted subsidiary or the satisfaction of the requirements for defeasance or discharge of the Senior Notes as provided for in the Indenture.
The tables in the following pages present the condensed consolidating financial information for the Issuer, the Guarantors and the Non-Guarantors, together with eliminations, as of and for the periods indicated. The consolidating financial information may not necessarily be indicative of the financial positions, results of operations or cash flows had the Issuer, Guarantors and Non-Guarantors operated as independent entities.
Tailored Brands, Inc.
Condensed Consolidating Balance Sheet
January 30, 2016
(in thousands)
| |
The Men's Wearhouse, Inc. |
Guarantor Subsidiaries |
Non-Guarantor Subsidiaries |
Eliminations | Consolidated | |||||||||||
|---|---|---|---|---|---|---|---|---|---|---|---|---|---|---|---|---|
ASSETS |
||||||||||||||||
CURRENT ASSETS: |
||||||||||||||||
Cash and cash equivalents |
$ | 724 | $ | 2,243 | $ | 27,013 | $ | — | $ | 29,980 | ||||||
Accounts receivable, net |
73,909 | 342,102 | 29,845 | (381,966 | ) | 63,890 | ||||||||||
Inventories |
253,472 | 630,407 | 138,625 | — | 1,022,504 | |||||||||||
Other current assets |
77,088 | 58,221 | 8,237 | — | 143,546 | |||||||||||
| | | | | | | | | | | | | | | | | |
Total current assets |
405,193 | 1,032,973 | 203,720 | (381,966 | ) | 1,259,920 | ||||||||||
Property, plant and equipment, net |
313,660 | 170,884 | 37,280 | — | 521,824 | |||||||||||
Rental product, net |
124,468 | 16,224 | 16,768 | — | 157,460 | |||||||||||
Goodwill |
6,160 | 68,510 | 43,916 | — | 118,586 | |||||||||||
Intangible assets, net |
186 | 159,530 | 18,794 | — | 178,510 | |||||||||||
Investments in subsidiaries |
1,372,215 | — | — | (1,372,215 | ) | — | ||||||||||
Other assets |
7,024 | 882 | 8,513 | (8,400 | ) | 8,019 | ||||||||||
| | | | | | | | | | | | | | | | | |
Total assets |
$ | 2,228,906 | $ | 1,449,003 | $ | 328,991 | $ | (1,762,581 | ) | $ | 2,244,319 | |||||
| | | | | | | | | | | | | | | | | |
| | | | | | | | | | | | | | | | | |
| | | | | | | | | | | | | | | | | |
LIABILITIES AND |
||||||||||||||||
CURRENT LIABILITIES: |
||||||||||||||||
Accounts payable |
$ | 438,018 | $ | 134,886 | $ | 46,176 | $ | (381,966 | ) | $ | 237,114 | |||||
Accrued expenses and other current liabilities |
163,917 | 73,375 | 19,470 | — | 256,762 | |||||||||||
Current portion of long-term debt |
42,451 | — | — | — | 42,451 | |||||||||||
| | | | | | | | | | | | | | | | | |
Total current liabilities |
644,386 | 208,261 | 65,646 | (381,966 | ) | 536,327 | ||||||||||
Long-term debt, net |
1,613,473 | — | — | — | 1,613,473 | |||||||||||
Deferred taxes and other liabilities |
71,133 | 121,271 | 10,601 | (8,400 | ) | 194,605 | ||||||||||
Shareholders' (deficit) equity |
(100,086 | ) | 1,119,471 | 252,744 | (1,372,215 | ) | (100,086 | ) | ||||||||
| | | | | | | | | | | | | | | | | |
Total liabilities and shareholders' (deficit) equity |
$ | 2,228,906 | $ | 1,449,003 | $ | 328,991 | $ | (1,762,581 | ) | $ | 2,244,319 | |||||
| | | | | | | | | | | | | | | | | |
| | | | | | | | | | | | | | | | | |
| | | | | | | | | | | | | | | | | |
99
TAILORED BRANDS, INC. AND SUBSIDIARIES
NOTES TO CONSOLIDATED FINANCIAL STATEMENTS (Continued)
Tailored Brands, Inc.
Condensed Consolidating Balance Sheet
January 31, 2015
(in thousands)
| |
The Men's Wearhouse, Inc. |
Guarantor Subsidiaries |
Non-Guarantor Subsidiaries |
Eliminations | Consolidated | |||||||||||
|---|---|---|---|---|---|---|---|---|---|---|---|---|---|---|---|---|
ASSETS |
||||||||||||||||
CURRENT ASSETS: |
||||||||||||||||
Cash and cash equivalents |
$ | 18,262 | $ | 4,857 | $ | 39,142 | $ | — | $ | 62,261 | ||||||
Accounts receivable, net |
20,304 | 422,930 | 35,303 | (405,271 | ) | 73,266 | ||||||||||
Inventories |
285,309 | 510,651 | 142,376 | — | 938,336 | |||||||||||
Other current assets |
105,507 | 58,792 | 5,510 | — | 169,809 | |||||||||||
| | | | | | | | | | | | | | | | | |
Total current assets |
429,382 | 997,230 | 222,331 | (405,271 | ) | 1,243,672 | ||||||||||
Property, plant and equipment, net |
306,597 | 221,454 | 38,023 | — | 566,074 | |||||||||||
Rental product, net |
107,908 | 8,318 | 16,446 | — | 132,672 | |||||||||||
Goodwill |
6,159 | 834,470 | 47,307 | — | 887,936 | |||||||||||
Intangible assets, net |
293 | 645,388 | 22,578 | — | 668,259 | |||||||||||
Investments in subsidiaries |
2,405,680 | — | — | (2,405,680 | ) | — | ||||||||||
Other assets |
42,279 | 681 | 9,671 | (43,032 | ) | 9,599 | ||||||||||
| | | | | | | | | | | | | | | | | |
Total assets |
$ | 3,298,298 | $ | 2,707,541 | $ | 356,356 | $ | (2,853,983 | ) | $ | 3,508,212 | |||||
| | | | | | | | | | | | | | | | | |
| | | | | | | | | | | | | | | | | |
| | | | | | | | | | | | | | | | | |
LIABILITIES AND |
||||||||||||||||
CURRENT LIABILITIES: |
||||||||||||||||
Accounts payable |
$ | 449,102 | $ | 120,499 | $ | 45,537 | $ | (405,271 | ) | $ | 209,867 | |||||
Accrued expenses and other current liabilities |
145,943 | 101,363 | 23,238 | — | 270,544 | |||||||||||
Current portion of long-term debt |
11,000 | — | — | — | 11,000 | |||||||||||
| | | | | | | | | | | | | | | | | |
Total current liabilities |
606,045 | 221,862 | 68,775 | (405,271 | ) | 491,411 | ||||||||||
Long-term debt, net |
1,637,686 | — | 33,432 | (33,432 | ) | 1,637,686 | ||||||||||
Deferred taxes and other liabilities |
84,778 | 323,376 | 10,772 | (9,600 | ) | 409,326 | ||||||||||
Shareholders' equity |
969,789 | 2,162,303 | 243,377 | (2,405,680 | ) | 969,789 | ||||||||||
| | | | | | | | | | | | | | | | | |
Total liabilities and shareholders' equity |
$ | 3,298,298 | $ | 2,707,541 | $ | 356,356 | $ | (2,853,983 | ) | $ | 3,508,212 | |||||
| | | | | | | | | | | | | | | | | |
| | | | | | | | | | | | | | | | | |
| | | | | | | | | | | | | | | | | |
100
TAILORED BRANDS, INC. AND SUBSIDIARIES
NOTES TO CONSOLIDATED FINANCIAL STATEMENTS (Continued)
Tailored Brands, Inc.
Condensed Consolidating Statement of (Loss) Earnings
Year Ended January 30, 2016
(in thousands)
| |
The Men's Wearhouse, Inc. |
Guarantor Subsidiaries |
Non-Guarantor Subsidiaries |
Eliminations | Consolidated | |||||||||||
|---|---|---|---|---|---|---|---|---|---|---|---|---|---|---|---|---|
Net sales |
$ | 1,787,295 | $ | 1,852,876 | $ | 427,770 | $ | (571,670 | ) | $ | 3,496,271 | |||||
Cost of sales |
943,897 | 1,374,272 | 265,349 | (571,670 | ) | 2,011,848 | ||||||||||
| | | | | | | | | | | | | | | | | |
Gross margin |
843,398 | 478,604 | 162,421 | — | 1,484,423 | |||||||||||
Operating expenses |
754,195 | 1,705,266 | 120,667 | (18,409 | ) | 2,561,719 | ||||||||||
| | | | | | | | | | | | | | | | | |
Operating income (loss) |
89,203 | (1,226,662 | ) | 41,754 | 18,409 | (1,077,296 | ) | |||||||||
Other income and expenses, net |
16,450 | 1,959 | — | (18,409 | ) | — | ||||||||||
Interest income |
2,779 | 4,119 | 141 | (6,852 | ) | 187 | ||||||||||
Interest expense |
(109,392 | ) | (2,343 | ) | (1,094 | ) | 6,852 | (105,977 | ) | |||||||
Loss on extinguishment of debt |
(12,675 | ) | — | — | — | (12,675 | ) | |||||||||
| | | | | | | | | | | | | | | | | |
(Loss) earnings before income taxes |
(13,635 | ) | (1,222,927 | ) | 40,801 | — | (1,195,761 | ) | ||||||||
(Benefit) provision for income taxes |
(6,041 | ) | (171,906 | ) | 8,905 | — | (169,042 | ) | ||||||||
| | | | | | | | | | | | | | | | | |
(Loss) earnings before equity in net loss of subsidiaries |
(7,594 | ) | (1,051,021 | ) | 31,896 | — | (1,026,719 | ) | ||||||||
Equity in earnings of subsidiaries |
(1,019,125 | ) | — | — | 1,019,125 | — | ||||||||||
| | | | | | | | | | | | | | | | | |
Net (loss) earnings attributable to common shareholders |
$ | (1,026,719 | ) | $ | (1,051,021 | ) | $ | 31,896 | $ | 1,019,125 | $ | (1,026,719 | ) | |||
| | | | | | | | | | | | | | | | | |
Comprehensive (loss) income |
$ | (1,049,534 | ) | $ | (1,051,067 | ) | $ | 9,469 | $ | 1,041,598 | $ | (1,049,534 | ) | |||
| | | | | | | | | | | | | | | | | |
| | | | | | | | | | | | | | | | | |
| | | | | | | | | | | | | | | | | |
101
TAILORED BRANDS, INC. AND SUBSIDIARIES
NOTES TO CONSOLIDATED FINANCIAL STATEMENTS (Continued)
Tailored Brands, Inc.
Condensed Consolidating Statement of (Loss) Earnings
Year Ended January 31, 2015
(in thousands)
| |
The Men's Wearhouse, Inc. |
Guarantor Subsidiaries |
Non-Guarantor Subsidiaries |
Eliminations | Consolidated | |||||||||||
|---|---|---|---|---|---|---|---|---|---|---|---|---|---|---|---|---|
Net sales |
$ | 1,682,183 | $ | 1,648,649 | $ | 475,187 | $ | (553,471 | ) | $ | 3,252,548 | |||||
Cost of sales |
883,295 | 1,273,684 | 290,426 | (553,471 | ) | 1,893,934 | ||||||||||
| | | | | | | | | | | | | | | | | |
Gross margin |
798,888 | 374,965 | 184,761 | — | 1,358,614 | |||||||||||
Operating expenses |
824,673 | 342,771 | 133,956 | (15,996 | ) | 1,285,404 | ||||||||||
| | | | | | | | | | | | | | | | | |
Operating (loss) income |
(25,785 | ) | 32,194 | 50,805 | 15,996 | 73,210 | ||||||||||
Other income and expenses, net |
14,438 | 1,558 | — | (15,996 | ) | — | ||||||||||
Interest income |
1,998 | 1,605 | 306 | (3,553 | ) | 356 | ||||||||||
Interest expense |
(67,264 | ) | (931 | ) | (1,390 | ) | 3,553 | (66,032 | ) | |||||||
Loss on extinguishment of debt |
(2,158 | ) | — | — | — | (2,158 | ) | |||||||||
| | | | | | | | | | | | | | | | | |
Earnings (loss) before income taxes |
(78,771 | ) | 34,426 | 49,721 | — | 5,376 | ||||||||||
Provision (benefit) for income taxes |
(21,462 | ) | 15,363 | 11,570 | — | 5,471 | ||||||||||
| | | | | | | | | | | | | | | | | |
Earnings before equity in net income of subsidiaries |
(57,309 | ) | 19,063 | 38,151 | — | (95 | ) | |||||||||
Equity in earnings of subsidiaries |
57,214 | — | — | (57,214 | ) | — | ||||||||||
| | | | | | | | | | | | | | | | | |
Net (loss) earnings including non-controlling interest |
(95 | ) | 19,063 | 38,151 | (57,214 | ) | (95 | ) | ||||||||
Net earnings attributable to non-controlling interest |
(292 | ) | — | (292 | ) | 292 | (292 | ) | ||||||||
| | | | | | | | | | | | | | | | | |
Net (loss) earnings attributable to common shareholders |
$ | (387 | ) | $ | 19,063 | $ | 37,859 | $ | (56,922 | ) | $ | (387 | ) | |||
| | | | | | | | | | | | | | | | | |
| | | | | | | | | | | | | | | | | |
| | | | | | | | | | | | | | | | | |
Comprehensive income (loss) |
$ | (33,369 | ) | $ | 19,289 | $ | 5,917 | $ | (25,206 | ) | $ | (33,369 | ) | |||
| | | | | | | | | | | | | | | | | |
| | | | | | | | | | | | | | | | | |
| | | | | | | | | | | | | | | | | |
102
TAILORED BRANDS, INC. AND SUBSIDIARIES
NOTES TO CONSOLIDATED FINANCIAL STATEMENTS (Continued)
Tailored Brands, Inc.
Condensed Consolidating Statement of Earnings
Year Ended February 1, 2014
(in thousands)
| |
The Men's Wearhouse, Inc. |
Guarantor Subsidiaries |
Non-Guarantor Subsidiaries |
Eliminations | Consolidated | |||||||||||
|---|---|---|---|---|---|---|---|---|---|---|---|---|---|---|---|---|
Net sales |
$ | 1,596,991 | $ | 942,138 | $ | 463,504 | $ | (529,400 | ) | $ | 2,473,233 | |||||
Cost of sales |
830,473 | 796,764 | 286,386 | (529,400 | ) | 1,384,223 | ||||||||||
| | | | | | | | | | | | | | | | | |
Gross margin |
766,518 | 145,374 | 177,118 | — | 1,089,010 | |||||||||||
Operating expenses |
708,099 | 135,098 | 130,621 | (14,436 | ) | 959,382 | ||||||||||
| | | | | | | | | | | | | | | | | |
Operating income |
58,419 | 10,276 | 46,497 | 14,436 | 129,628 | |||||||||||
Other income and expenses, net |
13,708 | 728 | — | (14,436 | ) | — | ||||||||||
Interest income |
2,484 | 411 | 361 | (2,871 | ) | 385 | ||||||||||
Interest expense |
(3,504 | ) | (462 | ) | (2,110 | ) | 2,871 | (3,205 | ) | |||||||
| | | | | | | | | | | | | | | | | |
Earnings before income taxes |
71,107 | 10,953 | 44,748 | — | 126,808 | |||||||||||
Provision for income taxes |
26,240 | 5,592 | 10,759 | — | 42,591 | |||||||||||
| | | | | | | | | | | | | | | | | |
Earnings before equity in net income of subsidiaries |
44,867 | 5,361 | 33,989 | — | 84,217 | |||||||||||
Equity in earnings of subsidiaries |
39,350 | — | — | (39,350 | ) | — | ||||||||||
| | | | | | | | | | | | | | | | | |
Net earnings including non-controlling interest |
84,217 | 5,361 | 33,989 | (39,350 | ) | 84,217 | ||||||||||
Net earnings attributable to non-controlling interest |
(426 | ) | — | (426 | ) | 426 | (426 | ) | ||||||||
| | | | | | | | | | | | | | | | | |
Net earnings attributable to common shareholders |
$ | 83,791 | $ | 5,361 | $ | 33,563 | $ | (38,924 | ) | $ | 83,791 | |||||
| | | | | | | | | | | | | | | | | |
| | | | | | | | | | | | | | | | | |
| | | | | | | | | | | | | | | | | |
Comprehensive income |
$ | 74,178 | $ | 5,361 | $ | 24,349 | $ | (29,710 | ) | $ | 74,178 | |||||
| | | | | | | | | | | | | | | | | |
| | | | | | | | | | | | | | | | | |
| | | | | | | | | | | | | | | | | |
103
TAILORED BRANDS, INC. AND SUBSIDIARIES
NOTES TO CONSOLIDATED FINANCIAL STATEMENTS (Continued)
Tailored Brands, Inc.
Condensed Consolidating Statement of Cash Flows
Year Ended January 30, 2016
(in thousands)
| |
The Men's Wearhouse, Inc. |
Guarantor Subsidiaries |
Non-Guarantor Subsidiaries |
Eliminations | Consolidated | |||||||||||
|---|---|---|---|---|---|---|---|---|---|---|---|---|---|---|---|---|
Net cash provided by operating activities |
$ | 70,224 | $ | 25,595 | $ | 35,878 | $ | — | $ | 131,697 | ||||||
| | | | | | | | | | | | | | | | | |
CASH FLOWS FROM INVESTING ACTIVITIES: |
||||||||||||||||
Capital expenditures |
(76,810 | ) | (28,407 | ) | (10,281 | ) | — | (115,498 | ) | |||||||
Receipts on intercompany long-term receivable |
33,432 | — | — | (33,432 | ) | — | ||||||||||
Proceeds from sale of property and equipment |
2,586 | 31 | — | — | 2,617 | |||||||||||
| | | | | | | | | | | | | | | | | |
Net cash used in investing activities |
(40,792 | ) | (28,376 | ) | (10,281 | ) | (33,432 | ) | (112,881 | ) | ||||||
| | | | | | | | | | | | | | | | | |
CASH FLOWS FROM FINANCING ACTIVITIES: |
||||||||||||||||
Payments on new term loan |
(8,000 | ) | — | — | — | (8,000 | ) | |||||||||
Proceeds from asset-based revolving credit facility |
180,500 | — | — | — | 180,500 | |||||||||||
Payments on asset-based revolving credit facility |
(180,500 | ) | — | — | — | (180,500 | ) | |||||||||
Deferred financing costs |
(3,566 | ) | — | — | — | (3,566 | ) | |||||||||
Payments on intercompany long-term liabilities |
— | — | (33,432 | ) | 33,432 | — | ||||||||||
Cash dividends paid |
(34,980 | ) | — | — | — | (34,980 | ) | |||||||||
Proceeds from issuance of common stock |
2,974 | — | — | — | 2,974 | |||||||||||
Tax payments related to vested deferred stock units |
(4,538 | ) | — | — | — | (4,538 | ) | |||||||||
Excess tax benefits from share-based plans |
1,417 | 167 | — | — | 1,584 | |||||||||||
Repurchases of common stock |
(277 | ) | — | — | — | (277 | ) | |||||||||
| | | | | | | | | | | | | | | | | |
Net cash (used in) provided by financing activities |
(46,970 | ) | 167 | (33,432 | ) | 33,432 | (46,803 | ) | ||||||||
| | | | | | | | | | | | | | | | | |
Effect of exchange rate changes |
— | — | (4,294 | ) | — | (4,294 | ) | |||||||||
| | | | | | | | | | | | | | | | | |
Decrease in cash and cash equivalents |
(17,538 | ) | (2,614 | ) | (12,129 | ) | — | (32,281 | ) | |||||||
Cash and cash equivalents at beginning of period |
18,262 | $ | 4,857 | $ | 39,142 | $ | — | $ | 62,261 | |||||||
| | | | | | | | | | | | | | | | | |
Cash and cash equivalents at end of period |
$ | 724 | $ | 2,243 | $ | 27,013 | $ | — | $ | 29,980 | ||||||
| | | | | | | | | | | | | | | | | |
| | | | | | | | | | | | | | | | | |
| | | | | | | | | | | | | | | | | |
104
TAILORED BRANDS, INC. AND SUBSIDIARIES
NOTES TO CONSOLIDATED FINANCIAL STATEMENTS (Continued)
Tailored Brands, Inc.
Condensed Consolidating Statement of Cash Flows
Year Ended January 31, 2015
(in thousands)
| |
The Men's Wearhouse, Inc. |
Guarantor Subsidiaries |
Non-Guarantor Subsidiaries |
Eliminations | Consolidated | |||||||||||
|---|---|---|---|---|---|---|---|---|---|---|---|---|---|---|---|---|
Net cash provided by (used in) operating activities |
$ | 378,293 | $ | (323,585 | ) | $ | 40,056 | $ | — | $ | 94,764 | |||||
| | | | | | | | | | | | | | | | | |
CASH FLOWS FROM INVESTING ACTIVITIES: |
||||||||||||||||
Capital expenditures |
(68,125 | ) | (17,965 | ) | (10,330 | ) | — | (96,420 | ) | |||||||
Acquisition of business, net of cash |
(1,820,308 | ) | 328,915 | — | — | (1,491,393 | ) | |||||||||
Receipts on intercompany long-term receivable |
26,474 | — | — | (26,474 | ) | — | ||||||||||
Proceeds from sale of property and equipment |
160 | — | — | — | 160 | |||||||||||
| | | | | | | | | | | | | | | | | |
Net cash (used in) provided by investing activities |
(1,861,799 | ) | 310,950 | (10,330 | ) | (26,474 | ) | (1,587,653 | ) | |||||||
| | | | | | | | | | | | | | | | | |
CASH FLOWS FROM FINANCING ACTIVITIES: |
||||||||||||||||
Proceeds from new term loan |
1,089,000 | — | — | — | 1,089,000 | |||||||||||
Payments on new term loan |
(2,750 | ) | — | — | — | (2,750 | ) | |||||||||
Proceeds from asset-based revolving credit facility |
348,000 | — | — | — | 348,000 | |||||||||||
Payments on asset-based revolving credit facility |
(348,000 | ) | — | — | — | (348,000 | ) | |||||||||
Proceeds from issuance of senior notes |
600,000 | — | — | — | 600,000 | |||||||||||
Deferred financing costs |
(51,080 | ) | — | — | — | (51,080 | ) | |||||||||
Payments on previous term loan |
(97,500 | ) | — | — | — | (97,500 | ) | |||||||||
Payments on intercompany long-term liabilities |
— | — | (26,474 | ) | 26,474 | — | ||||||||||
Cash dividends paid |
(34,785 | ) | — | — | — | (34,785 | ) | |||||||||
Purchase of non-controlling interest |
(6,651 | ) | — | — | — | (6,651 | ) | |||||||||
Proceeds from issuance of common stock |
8,082 | — | — | — | 8,082 | |||||||||||
Tax payments related to vested deferred stock units |
(6,940 | ) | — | — | — | (6,940 | ) | |||||||||
Excess tax benefits from share-based plans |
3,229 | 537 | — | — | 3,766 | |||||||||||
Repurchases of common stock |
(251 | ) | — | — | — | (251 | ) | |||||||||
| | | | | | | | | | | | | | | | | |
Net cash (used in) provided by financing activities |
1,500,354 | 537 | (26,474 | ) | 26,474 | 1,500,891 | ||||||||||
| | | | | | | | | | | | | | | | | |
Effect of exchange rate changes |
— | — | (4,993 | ) | — | (4,993 | ) | |||||||||
| | | | | | | | | | | | | | | | | |
Increase (decrease) in cash and cash equivalents |
16,848 | (12,098 | ) | (1,741 | ) | — | 3,009 | |||||||||
Cash and cash equivalents at beginning of period |
1,414 | 16,955 | 40,883 | — | 59,252 | |||||||||||
| | | | | | | | | | | | | | | | | |
Cash and cash equivalents at end of period |
$ | 18,262 | $ | 4,857 | $ | 39,142 | $ | — | $ | 62,261 | ||||||
| | | | | | | | | | | | | | | | | |
| | | | | | | | | | | | | | | | | |
| | | | | | | | | | | | | | | | | |
105
TAILORED BRANDS, INC. AND SUBSIDIARIES
NOTES TO CONSOLIDATED FINANCIAL STATEMENTS (Continued)
Tailored Brands, Inc.
Condensed Consolidating Statement of Cash Flows
Year Ended February 1, 2014
| |
The Men's Wearhouse, Inc. |
Guarantor Subsidiaries |
Non-Guarantor Subsidiaries |
Eliminations | Consolidated | |||||||||||
|---|---|---|---|---|---|---|---|---|---|---|---|---|---|---|---|---|
Net cash provided by operating activities |
$ | 121,115 | $ | 21,941 | $ | 45,874 | $ | — | $ | 188,930 | ||||||
| | | | | | | | | | | | | | | | | |
CASH FLOWS FROM INVESTING ACTIVITIES: |
||||||||||||||||
Capital expenditures |
(95,516 | ) | (6,859 | ) | (5,825 | ) | — | (108,200 | ) | |||||||
Acquisition of business, net of cash |
(94,906 | ) | — | — | — | (94,906 | ) | |||||||||
Receipts on intercompany long-term receivable |
70,094 | — | — | (70,094 | ) | — | ||||||||||
Proceeds from sale of property and equipment |
4,127 | — | — | — | 4,127 | |||||||||||
| | | | | | | | | | | | | | | | | |
Net cash used in investing activities |
(116,201 | ) | (6,859 | ) | (5,825 | ) | (70,094 | ) | (198,979 | ) | ||||||
| | | | | | | | | | | | | | | | | |
CASH FLOWS FROM FINANCING ACTIVITIES: |
||||||||||||||||
Proceeds from issuance of common stock |
10,739 | — | — | — | 10,739 | |||||||||||
Payments on intercompany long-term liabilities |
— | — | (70,094 | ) | 70,094 | — | ||||||||||
Proceeds from previous term loan |
100,000 | — | — | — | 100,000 | |||||||||||
Payments on previous term loan |
(2,500 | ) | — | — | — | (2,500 | ) | |||||||||
Deferred financing costs |
(1,776 | ) | — | — | — | (1,776 | ) | |||||||||
Cash dividends paid |
(35,549 | ) | — | — | — | (35,549 | ) | |||||||||
Tax payments related to vested deferred stock units |
(3,865 | ) | — | — | — | (3,865 | ) | |||||||||
Excess tax benefits from share-based plans |
1,404 | 741 | — | — | 2,145 | |||||||||||
Repurchases of common stock |
(152,129 | ) | — | — | — | (152,129 | ) | |||||||||
| | | | | | | | | | | | | | | | | |
Net cash (used in) provided by financing activities |
(83,676 | ) | 741 | (70,094 | ) | 70,094 | (82,935 | ) | ||||||||
| | | | | | | | | | | | | | | | | |
Effect of exchange rate changes |
— | — | (3,827 | ) | — | (3,827 | ) | |||||||||
| | | | | | | | | | | | | | | | | |
Increase (decrease) in cash and cash equivalents |
(78,762 | ) | 15,823 | (33,872 | ) | — | (96,811 | ) | ||||||||
Cash and cash equivalents at beginning of period |
80,176 | 1,132 | 74,755 | — | 156,063 | |||||||||||
| | | | | | | | | | | | | | | | | |
Cash and cash equivalents at end of period |
$ | 1,414 | $ | 16,955 | $ | 40,883 | $ | — | $ | 59,252 | ||||||
| | | | | | | | | | | | | | | | | |
| | | | | | | | | | | | | | | | | |
| | | | | | | | | | | | | | | | | |
106
TAILORED BRANDS, INC. AND SUBSIDIARIES
NOTES TO CONSOLIDATED FINANCIAL STATEMENTS (Continued)
20. QUARTERLY RESULTS OF OPERATIONS (Unaudited)
Our quarterly results of operations reflect all adjustments, which are, in the opinion of management, necessary for a fair statement of the results for the interim periods presented. The consolidated results of operations by quarter for fiscal 2015 and 2014 are presented below (in thousands, except per share amounts):
| |
Fiscal 2015 Quarters Ended | ||||||||||||
|---|---|---|---|---|---|---|---|---|---|---|---|---|---|
| |
May 2, 2015(1) |
August 1, 2015(2) |
October 31, 2015(3) |
January 30, 2016(4) |
|||||||||
Net sales |
$ | 885,089 | $ | 920,074 | $ | 865,446 | $ | 825,662 | |||||
Gross margin |
381,552 | 418,681 | 372,991 | 311,199 | |||||||||
Net earnings (loss) attributable to common shareholders |
$ | 10,369 | $ | 47,779 | $ | (27,154 | ) | $ | (1,057,713 | ) | |||
Net earnings (loss) per common share attributable to common shareholders: |
|||||||||||||
Basic(5) |
$ | 0.22 | $ | 0.99 | $ | (0.56 | ) | $ | (21.86 | ) | |||
Diluted(5) |
$ | 0.21 | $ | 0.98 | $ | (0.56 | ) | $ | (21.86 | ) | |||
| |
Fiscal 2014 Quarters Ended | ||||||||||||
|---|---|---|---|---|---|---|---|---|---|---|---|---|---|
| |
May 3, 2014(6) |
August 2, 2014(7) |
November 1, 2014(8) |
January 31, 2015(9) | |||||||||
Net sales |
$ | 630,474 | $ | 803,078 | $ | 890,637 | $ | 928,359 | |||||
Gross margin |
283,364 | 358,542 | 369,205 | 347,503 | |||||||||
Net earnings (loss) attributable to common shareholders |
$ | 16,486 | $ | 12,256 | $ | 6,793 | $ | (35,922 | ) | ||||
Net earnings (loss) per common share attributable to common shareholders: |
|||||||||||||
Basic(5) |
$ | 0.34 | $ | 0.26 | $ | 0.14 | $ | (0.75 | ) | ||||
Diluted(5) |
$ | 0.34 | $ | 0.25 | $ | 0.14 | $ | (0.75 | ) | ||||
- (1)
- Includes
pre-tax expenses of $3.6 million consisting primarily of separation costs with former executives and $5.9 million of
integration costs related to Jos. A. Bank. Also, includes a loss on extinguishment of debt of $12.7 million.
- (2)
- Includes
pre-tax expenses of $5.1 million primarily related to integration costs for Jos. A. Bank.
- (3)
- Includes
pre-tax, non-cash tradename and other asset impairment charges of $91.5 million and $5.4 million of integration costs,
primarily related to Jos. A. Bank partially offset by a $1.8 million pre-tax gain related to the sale of property. See Note 3 for additional information.
- (4)
- Includes
pre-tax, non-cash goodwill, intangible and other asset impairment charges of $1,179.0 million related to Jos. A. Bank,
$12.8 million related primarily to our store rationalization and profit improvement programs and $3.4 million of integration and other costs primarily related to Jos. A. Bank. See
Notes 3 and 4 for additional information.
- (5)
- Due to the method of calculating weighted-average common shares outstanding, the sum of the quarterly per share amounts may not equal net (loss) earnings per common share attributable to common shareholders for the respective years.
107
TAILORED BRANDS, INC. AND SUBSIDIARIES
NOTES TO CONSOLIDATED FINANCIAL STATEMENTS (Continued)
- (6)
- Includes
pre-tax expenses of $26.5 million in costs related to various strategic projects, primarily Jos. A. Bank and cost
reduction initiatives.
- (7)
- Includes
pre-tax expenses totaling $42.9 million in acquisition and integration costs primarily related to Jos. A. Bank and a loss on
extinguishment of debt of $2.2 million.
- (8)
- Includes
pre-tax expenses totaling $27.6 million in acquisition and integration costs primarily related to Jos. A. Bank of which
$10.6 million is included in cost of sales and the remainder is included in SG&A.
- (9)
- Includes pre-tax expenses totaling $52.0 million in costs related to the arbitration award for JA Holding and acquisition and integration costs primarily related to Jos. A. Bank offset by a pre-tax gain of $3.4 million related to a favorable litigation settlement.
108
ITEM 9. CHANGES IN AND DISAGREEMENTS WITH ACCOUNTANTS ON ACCOUNTING AND FINANCIAL DISCLOSURE
None.
ITEM 9A. CONTROLS AND PROCEDURES
Evaluation of Disclosure Controls and Procedures
The Company's management, with the participation of the Company's principal executive officer ("CEO") and principal financial officer ("CFO"), evaluated the effectiveness of the Company's disclosure controls and procedures (as defined in Rules 13a-15(e) and 15d-15(e) promulgated under the Securities Exchange Act of 1934, as amended (the "Exchange Act")) as of the end of the period covered by this report. Based on this evaluation, the CEO and CFO have concluded that, as of the end of such period, the Company's disclosure controls and procedures were effective to ensure that information that is required to be disclosed by the Company in the reports it files or submits under the Exchange Act is (i) recorded, processed, summarized and reported, within the time periods specified in the SEC's rules and forms and (ii) accumulated and communicated to the Company's management, including the CEO and CFO, as appropriate, to allow timely decisions regarding required disclosure.
Changes in Internal Control over Financial Reporting
There were no changes in the Company's internal control over financial reporting that occurred during the fiscal quarter ended January 30, 2016 that has materially affected, or is reasonably likely to materially affect, the Company's internal control over financial reporting.
Management's Annual Report on Internal Control Over Financial Reporting
Our management is responsible for establishing and maintaining adequate internal control over financial reporting as defined in Rule 13a-15(f) under the Exchange Act. Our internal control over financial reporting is a process designed under the supervision of our principal executive and principal financial officers, and effected by our Board of Directors, management and other personnel, to provide reasonable assurance regarding the reliability of financial reporting and the preparation of financial statements for external purposes in accordance with generally accepted accounting principles.
Because of its inherent limitations, internal control over financial reporting may not prevent or detect misstatements. Projections of any evaluation of effectiveness to future periods are subject to the risk that controls may become inadequate because of changes in conditions, or that the degree of compliance with policies or procedures may deteriorate.
Our management assessed the effectiveness of our internal control over financial reporting as of the end of our most recent fiscal year. In making this assessment, our management used the criteria set forth by the Committee of Sponsoring Organizations of the Treadway Commission in Internal Control—Integrated Framework (2013). Based on such assessment, management concluded that, as of January 30, 2016, our internal control over financial reporting is effective based on those criteria.
Deloitte & Touche LLP has audited our internal control over financial reporting as of January 30, 2016; their report is included in Item 9A, which follows.
109
REPORT OF INDEPENDENT REGISTERED PUBLIC ACCOUNTING FIRM
To
the Board of Directors and Shareholders of
Tailored Brands, Inc. (successor reporting company to The Men's Wearhouse, Inc.)
Houston, Texas
We have audited the internal control over financial reporting of Tailored Brands, Inc. (successor reporting company to The Men's Wearhouse, Inc.) and subsidiaries (the "Company") as of January 30, 2016, based on the criteria established in Internal Control—Integrated Framework (2013) issued by the Committee of Sponsoring Organizations of the Treadway Commission. The Company's management is responsible for maintaining effective internal control over financial reporting and for its assessment of the effectiveness of internal control over financial reporting, included in the accompanying Management's Annual Report on Internal Control Over Financial Reporting. Our responsibility is to express an opinion on the Company's internal control over financial reporting based on our audit.
We conducted our audit in accordance with the standards of the Public Company Accounting Oversight Board (United States). Those standards require that we plan and perform the audit to obtain reasonable assurance about whether effective internal control over financial reporting was maintained in all material respects. Our audit included obtaining an understanding of internal control over financial reporting, assessing the risk that a material weakness exists, testing and evaluating the design and operating effectiveness of internal control based on the assessed risk, and performing such other procedures as we considered necessary in the circumstances. We believe that our audit provides a reasonable basis for our opinion.
A company's internal control over financial reporting is a process designed by, or under the supervision of, the company's principal executive and principal financial officers, or persons performing similar functions, and effected by the company's board of directors, management, and other personnel to provide reasonable assurance regarding the reliability of financial reporting and the preparation of financial statements for external purposes in accordance with generally accepted accounting principles. A company's internal control over financial reporting includes those policies and procedures that (1) pertain to the maintenance of records that, in reasonable detail, accurately and fairly reflect the transactions and dispositions of the assets of the company; (2) provide reasonable assurance that transactions are recorded as necessary to permit preparation of financial statements in accordance with generally accepted accounting principles, and that receipts and expenditures of the company are being made only in accordance with authorizations of management and directors of the company; and (3) provide reasonable assurance regarding prevention or timely detection of unauthorized acquisition, use, or disposition of the company's assets that could have a material effect on the financial statements.
Because of the inherent limitations of internal control over financial reporting, including the possibility of collusion or improper management override of controls, material misstatements due to error or fraud may not be prevented or detected on a timely basis. Also, projections of any evaluation of the effectiveness of the internal control over financial reporting to future periods are subject to the risk that the controls may become inadequate because of changes in conditions, or that the degree of compliance with the policies or procedures may deteriorate.
In our opinion, the Company maintained, in all material respects, effective internal control over financial reporting as of January 30, 2016, based on the criteria established in Internal Control—Integrated Framework (2013) issued by the Committee of Sponsoring Organizations of the Treadway Commission.
We have also audited, in accordance with the standards of the Public Company Accounting Oversight Board (United States), the consolidated financial statements as of and for the year ended January 30, 2016 of the Company and our report dated March 25, 2016 expressed an unqualified opinion on those financial statements.
| /s/ DELOITTE & TOUCHE LLP |
Houston,
Texas
March 25, 2016
110
None.
ITEM 10. DIRECTORS, EXECUTIVE OFFICERS AND CORPORATE GOVERNANCE
Except as set forth below, the information required by this Item is incorporated herein by reference from our Proxy Statement for the Annual Meeting of Shareholders to be held June 16, 2016.
The Company has adopted a Code of Ethics and Business Conduct for Senior Management which applies to all employees including the Company's Chief Executive Officer and all Presidents, Chief Financial Officers, Principal Accounting Officers, Executive Vice Presidents and other designated financial and operations officers. A copy of such policy is posted on the Company's website, www.tailoredbrands.com, under the heading "Corporate Governance".
ITEM 11. EXECUTIVE COMPENSATION
The information required by this Item is incorporated herein by reference from our Proxy Statement for the Annual Meeting of Shareholders to be held June 16, 2016.
ITEM 12. SECURITY OWNERSHIP OF CERTAIN BENEFICIAL OWNERS AND MANAGEMENT AND RELATED STOCKHOLDER MATTERS
The following table sets forth certain equity compensation plan information for the Company as of January 30, 2016:
Plan Category
|
Number of Securities to be Issued Upon Exercise of Outstanding Options (a) |
Weighted- Average Exercise Price of Outstanding Options (b)(2) |
Number of Securities Remaining Available for Future Issuance Under Equity Compensation Plans (excluding securities in column (a)) (c) |
|||||||
|---|---|---|---|---|---|---|---|---|---|---|
Equity Compensation Plans Approved by Security Holders |
1,327,879 | $ | 39.65 | 3,219,225 | (3) | |||||
Equity Compensation Plans Not Approved by Security Holders |
— | — | — | |||||||
| | | | | | | | | | | |
Total |
1,327,879 | (1) | $ | 39.65 | 3,219,225 | |||||
| | | | | | | | | | | |
| | | | | | | | | | | |
| | | | | | | | | | | |
- (1)
- Consists
of 681,117 shares issuable upon exercise of outstanding stock options and 646,762 shares issuable upon conversion of
outstanding deferred stock and performance units.
- (2)
- Calculated
based upon outstanding stock options to purchase shares of our common stock.
- (3)
- Securities available for future issuance include 2,653,359 shares under the 2004 Plan and 565,866 shares under the Employee Stock Discount Plan. Refer to Note 13 and Note 14 of Notes to Consolidated Financial Statements.
Except as set forth above, the information required by this Item is incorporated herein by reference from our Proxy Statement for the Annual Meeting of Shareholders to be held June 16, 2016.
111
ITEM 13. CERTAIN RELATIONSHIPS AND RELATED TRANSACTIONS, AND DIRECTOR INDEPENDENCE
The information required by this Item is incorporated herein by reference from our Proxy Statement for the Annual Meeting of Shareholders to be held June 16, 2016.
ITEM 14. PRINCIPAL ACCOUNTING FEES AND SERVICES
The information required by this Item is incorporated herein by reference from our Proxy Statement for the Annual Meeting of Shareholders to be held June 16, 2016.
ITEM 15. EXHIBITS, FINANCIAL STATEMENT SCHEDULES
(a) Financial Statements and Schedules
The following consolidated financial statements of the Company are included in Part II, Item 8:
Report of Independent Registered Public Accounting Firm |
||
Consolidated Balance Sheets as of January 30, 2016 and January 31, 2015 |
||
Consolidated Statements of (Loss) Earnings for the years ended January 30, 2016, January 31, 2015 and February 1, 2014 |
||
Consolidated Statements of Comprehensive (Loss) Income for the years ended January 30, 2016, January 31, 2015 and February 1, 2014 |
||
Consolidated Statements of Shareholders' (Deficit) Equity for the years ended January 30, 2016, January 31, 2015 and February 1, 2014 |
||
Consolidated Statements of Cash Flows for the years ended January 30, 2016, January 31, 2015 and February 1, 2014 |
||
Notes to Consolidated Financial Statements |
(b) Exhibits
Exhibits filed with this annual report on Form 10-K are incorporated herein by reference as set forth in the Index to Exhibits on page 114.
112
SIGNATURES
Pursuant to the requirements of Section 13 or 15(d) of the Securities Exchange Act of 1934, the registrant has duly caused this report to be signed on its behalf by the undersigned, thereunto duly authorized.
| TAILORED BRANDS, INC. | ||||
By |
/s/ DOUGLAS S. EWERT Douglas S. Ewert President and Chief Executive Officer |
|||
Dated: March 25, 2016 |
||||
Pursuant to the requirements of the Securities Exchange Act of 1934, this report has been signed below by the following persons on behalf of the registrant and in the capacities and on the dates indicated.
Signature
|
Title
|
Date
|
||
|---|---|---|---|---|
| /s/ DOUGLAS S. EWERT Douglas S. Ewert |
President and Chief Executive Officer and Director | March 25, 2016 | ||
/s/ JON W. KIMMINS Jon W. Kimmins |
Executive Vice President, Chief Financial Officer, Treasurer and Principal Financial Officer |
March 25, 2016 |
||
/s/ BRIAN T. VACLAVIK Brian T. Vaclavik |
Senior Vice President, Chief Accounting Officer and Principal Accounting Officer |
March 25, 2016 |
||
/s/ WILLIAM B. SECHREST William B. Sechrest |
Chairman of the Board and Director |
March 25, 2016 |
||
/s/ DAVID H. EDWAB David H. Edwab |
Vice Chairman of the Board and Director |
March 25, 2016 |
||
/s/ B. MICHAEL BECKER B. Michael Becker |
Director |
March 25, 2016 |
||
/s/ IRENE CHANG BRITT Irene Chang Britt |
Director |
March 25, 2016 |
||
/s/ RINALDO S. BRUTOCO Rinaldo S. Brutoco |
Director |
March 25, 2016 |
||
/s/ DINESH LATHI Dinesh Lathi |
Director |
March 25, 2016 |
||
/s/ GRACE NICHOLS Grace Nichols |
Director |
March 25, 2016 |
||
/s/ ALLEN I. QUESTROM Allen I. Questrom |
Director |
March 25, 2016 |
||
/s/ SHELDON I. STEIN Sheldon I. Stein |
Director |
March 25, 2016 |
113
Exhibit Index
| 2.1 | — | Agreement and Plan of Merger, dated July 17, 2013, by and among The Men's Wearhouse, Inc., Blazer Merger Sub Inc., JA Holding, Inc. and JA Holding, LLC. (incorporated by reference from Exhibit 2.1 to the Company's Current Report on Form 8-K filed with the Commission on July 18, 2013). | ||||
2.2 |
— |
Agreement and Plan of Merger, dated March 11, 2014, by and among The Men's Wearhouse, Inc., Java Corp., and Jos. A. Bank Clothiers, Inc. (incorporated by reference from Exhibit (d)(1) to the Company's Amendment No. 9 to Schedule TO filed on March 11, 2014). |
||||
2.3 |
— |
Agreement and Plan of Merger, dated January 26, 2016, among The Men's Wearhouse, Inc., Tailored Brands, Inc., and HoldCo Merger Sub, Inc. (incorporated by reference from Exhibit 2.1 to the Company's Current Report on Form 8-K filed with the Commission on February 1, 2016). |
||||
3.1 |
— |
Certificate of Formation for Tailored Brands, Inc. (incorporated by reference from Exhibit 3.1 to the Company's Current Report on Form 8-K filed with the Commission on February 1, 2016). |
||||
3.2 |
— |
Bylaws of Tailored Brands, Inc. (incorporated by reference from Exhibit 3.2 to the Company's Current Report on Form 8-K filed with the Commission on February 1, 2016). |
||||
4.1 |
— |
Certificate of Formation for Tailored Brands, Inc. (included as Exhibit 3.1). |
||||
4.2 |
— |
Bylaws of Tailored Brands, Inc. (included as Exhibit 3.2). |
||||
4.3 |
— |
Indenture, dated as of June 18, 2014, by an among the Company, the MW Guarantors and the Trustee, relating to the Senior Notes (incorporated by reference from Exhibit 4.1 to the Company's Current Report on Form 8-K filed with the Commission on June 20, 2014). |
||||
4.4 |
— |
Supplemental Indenture, dated as of June 18, 2014, by and among the Company, the JOSB Guarantors and the Trustee, relating to the Senior Notes (incorporated by reference from Exhibit 4.2 to the Company's Current Report on Form 8-K filed with the Commission on June 20, 2014). |
||||
4.5 |
— |
Second Supplemental Indenture relating to the Notes, dated as of January 29, 2016, among The Men's Wearhouse, Inc., Tailored Brands, Inc., Tailored Shared Services, LLC and The Bank of New York Mellon Trust Company, N.A., as trustee (incorporated by reference from Exhibit 4.3 to the Company's Current Report on Form 8-K filed with the Commission on February 1, 2016). |
||||
4.6 |
— |
Registration Agreement, dated as of June 18, 2014, by and among the Company, the MW Guarantors and Merrill Lynch, Pierce, Fenner & Smith Incorporated and J.P. Morgan Securities LLC, relating to the Senior Notes (incorporated by reference from Exhibit 4.3 to the Company's Current Report on Form 8-K filed with the Commission on June 20, 2014). |
||||
10.1 |
— |
Credit Agreement, dated as June 18, 2014, by and among the Company and the other Co-Borrowers, the U.S. ABL Administrative Agent, the Canadian ABL Administrative Agent and the ABL Lenders (incorporated by reference from Exhibit 10.1 to the Company's Current Report on Form 8-K filed with the Commission on June 18, 2014). |
||||
10.2 |
— |
Term Loan Credit Agreement, dated as of June 18, 2014, by and among the Company, the Term Administrative Agent and the Term Lenders (incorporated by reference from Exhibit 10.2 to the Company's Current Report on Form 8-K filed with the Commission on June 20, 2014). |
114
| 10.3 | — | Amendment No. 1 to Term Loan, dated as of June 26, 2014, by and among the Company, the Administrative Agent and the Term Lenders (incorporated by reference from Exhibit 10.1 to the Company's Current Report on Form 8-K filed with the Commission on July 1, 2014). | ||||
10.4 |
— |
Amendment No. 1 to ABL Facility, dated as of July 28, 2014, by and among the Company, and the other Co-Borrowers, the U.S. ABL Administrative Agent, the Canadian ABL Administrative Agent and the ABL Lenders (incorporated by reference from Exhibit 10.4 to the Company's Quarterly Report on Form 10-Q for the fiscal quarter ended August 2, 2014). |
||||
10.5 |
— |
Incremental Facility Agreement No. 1, dated as of April 7, 2015, among The Men's Wearhouse, Inc., the guarantors party thereto, the lenders party thereto and JPMorgan Chase Bank, N.A. (incorporated by reference from Exhibit 10.1 to the Company's Current Report on Form 8-K filed with the Commission on April 8, 2015). |
||||
*10.6 |
— |
1992 Non-Employee Director Stock Option Plan (As Amended and Restated Effective January 1, 2004), including forms of stock option agreement and restricted stock award agreement (incorporated by reference from Exhibit 10.1 to the Company's Current Report on Form 8-K filed with the Commission on March 18, 2005). |
||||
*10.7 |
— |
1996 Long-Term Incentive Plan (As Amended and Restated Effective April 1, 2008) (incorporated by reference from Exhibit 10.1 to the Company's Quarterly Report on Form 10-Q for the fiscal quarter ended May 3, 2008), and the forms of stock option agreement, restricted stock award agreement and deferred stock unit award agreement (incorporated by reference from Exhibit 10.20 to the Company's Current Report on Form 8-K filed with the Commission on March 18, 2005). |
||||
*10.8 |
— |
Forms of Deferred Stock Unit Award Agreement, Restricted Stock Award Agreement and Nonqualified Stock Option Award Agreement under The Men's Wearhouse, Inc. 1996 Long-Term Incentive Plan (as amended and restated effective as of April 1, 2008) (incorporated by reference from Exhibit 10.1 to the Company's Quarterly Report on Form 10-Q for the fiscal quarter ended May 1, 2010). |
||||
*10.9 |
— |
2004 Long-Term Incentive Plan (As Amended and Restated Effective April 1, 2008) (incorporated by reference from Exhibit 10.1 to the Company's Current Report on Form 8-K filed with the Commission on June 27, 2008). |
||||
*10.10 |
— |
First Amendment to The Men's Wearhouse, Inc. 2004 Long-Term Incentive Plan (incorporated by reference from Exhibit 10.1 to the Company's Current Report on Form 8-K filed with the Commission on June 17, 2011). |
||||
*10.11 |
— |
Second Amendment to The Men's Wearhouse, Inc. 2004 Long-Term Incentive Plan (incorporated by reference from Exhibit 10.1 to the Company's Current Report on Form 8-K filed with the Commission on April 20, 2012). |
||||
*10.12 |
— |
Third Amendment to The Men's Wearhouse, Inc. 2004 Long-Term Incentive Plan (incorporated by reference from Exhibit 10.1 to the Company's Current Report on Form 8-K filed with the Commission on September 10, 2013). |
||||
*10.13 |
— |
Fourth Amendment to The Men's Wearhouse, Inc. 2004 Long-Term Incentive Plan (incorporated by reference from Exhibit 10.1 to the Company's Current Report on Form 8-K filed with the Commission on July 2, 2015). |
115
| *10.14 | — | Agreement for Adoption and Assumption of The Men's Wearhouse, Inc. Equity Incentive Plans, between The Men's Wearhouse, Inc. and Tailored Brands, Inc., effective as of January 31, 2016 (incorporated by reference from Exhibit 10.1 to the Company's Current Report on Form 8-K filed with the Commission on February 1, 2016). | ||||
*10.15 |
— |
Forms of Deferred Stock Unit Award Agreement and Restricted Stock Award Agreement (each for non-employee directors) under The Men's Wearhouse, Inc. 2004 Long-Term Incentive Plan (as amended and restated effective April 3, 2013) (incorporated by reference from Exhibit 10.12 to the Company's Annual Report on Form 10-K filed with the Commission on March 27, 2015). |
||||
*10.16 |
— |
Forms of Deferred Stock Unit Award Agreement, Performance-Based Deferred Stock Unit Award Agreement, Restricted Stock Award Agreement and Nonqualified Stock Option Award Agreement (each for named executive officers) under The Men's Wearhouse, Inc. 2004 Long-Term Incentive Plan (incorporated by reference from Exhibit 10.2 to the Company's Current Report on Form 8-K filed with the Commission on April 9, 2013). |
||||
*10.17 |
— |
Forms of Deferred Stock Unit Award Agreement, Performance-Based Deferred Stock Unit Award Agreement, Restricted Stock Award Agreement and Nonqualified Stock Option Award Agreement (each for executive officers) under The Men's Wearhouse, Inc. 2004 Long-Term Incentive Plan (incorporated by reference from Exhibit 10.3 to the Company's Current Report on Form 8-K filed with the Commission on April 9, 2013). |
||||
*10.18 |
— |
Form of Performance-Based Deferred Stock Unit Award Agreement, for named executive officers, under The Men's Wearhouse, Inc. 2004 Long-Term Incentive Plan (incorporated by reference from Exhibit 10.1 to the Company's Current Report on Form 8-K filed with the Commission on April 23, 2014). |
||||
*10.19 |
— |
Form of Performance-Based Deferred Stock Unit Award Agreement, for executive officers, under The Men's Wearhouse, Inc. 2004 Long-Term Incentive Plan (incorporated by reference from Exhibit 10.2 to the Company's Current Report on Form 8-K filed with the Commission on April 23, 2014). |
||||
*10.20 |
— |
Form of Deferred Stock Unit Award Agreement (for senior executive officers, including named executive officers) under The Men's Wearhouse, Inc. 2004 Long-Term Incentive Plan (incorporated by reference from Exhibit 10.1 to the Company's Current Report on Form 8-K filed with the Commission on September 16, 2014). |
||||
*10.21 |
— |
Form of Performance Unit Award Agreement (for senior executive officers, including named executive officers) under The Men's Wearhouse, Inc. 2004 Long-Term Incentive Plan [corrected] (incorporated by reference from Exhibit 10.2 to the Company's Quarterly Report on Form 10-Q for the fiscal quarter ended November 1, 2014). |
||||
*10.22 |
— |
Form of Nonqualified Stock Option Award Agreement (for senior executive officers, including named executive officers) under The Men's Wearhouse, Inc. 2004 Long-Term Incentive Plan (incorporated by reference from Exhibit 10.3 to the Company's Current Report on Form 8-K filed with the Commission on September 16, 2014). |
||||
*10.23 |
— |
The Men's Wearhouse, Inc. 2004 Long-Term Incentive Plan Subplan for UK Employees (incorporated by reference from Exhibit 10.1 to the Company's Current Report on Form 8-K filed with the Commission on March 29, 2012). |
||||
*10.24 |
— |
First Amendment to The Men's Wearhouse, Inc. Employee Stock Discount Plan (incorporated by reference from Exhibit 10.21 to the Company's Annual Report on Form 10-K filed with the Commission on March 27, 2015). |
116
| *10.25 | — | Agreement for Adoption and Assumption of The Men's Wearhouse, Inc. Employee Stock Discount Plan, between The Men's Wearhouse, Inc. and Tailored Brands, Inc., effective as of January 31, 2016 (incorporated by reference from Exhibit 10.2 to the Company's Current Report on Form 8-K filed with the Commission on February 1, 2016). | ||||
*10.26 |
— |
Form of Change in Control Agreement entered into by and between The Men's Wearhouse, Inc. and each of Benjamin C. Baum, Jon W. Kimmins, Hyon C. Park, A. Alexander Rhodes, Matt Stringer, Bruce K. Thorn and Brian T. Vaclavik (incorporated by reference from Exhibit 10.1 to the Company's Current Report on Form 8-K filed with the Commission on May 20, 2009). |
||||
*10.27 |
— |
Amended and Restated Change in Control Agreement dated April 22, 2015, by and between The Men's Wearhouse, Inc. and Douglas S. Ewert (incorporated by reference from Exhibit 10.2 to the Company's Current Report on Form 8-K filed with the Commission on April 28, 2015). |
||||
*10.28 |
— |
The Men's Wearhouse, Inc. Change in Control Severance Plan (As Amended and Restated Effective October 1, 2009) (incorporated by reference from Exhibit 10.1 to the Company's Current Report on Form 8-K filed with the Commission on October 27, 2009). |
||||
*10.29 |
— |
Sixth Amended and Restated Employment Agreement dated effective as of February 25, 2014, by and between The Men's Wearhouse, Inc. and David H. Edwab (incorporated by reference from Exhibit 10.16 to the Company's Annual Report on Form 10-K filed with the Commission on April 1, 2014). |
||||
*10.30 |
— |
Amended and Restated Employment Agreement dated April 22, 2015, by and between The Men's Wearhouse, Inc. and Douglas S. Ewert (incorporated by reference from Exhibit 10.1 to the Company's Current Report on Form 8-K filed with the Commission on April 28, 2015). |
||||
*10.31 |
— |
Assignment and Amendment of Employment Agreement for Douglas S. Ewert, between The Men's Wearhouse, Inc. and Tailored Brands, Inc., effective as of January 31, 2016 (incorporated by reference from Exhibit 10.3 to the Company's Current Report on Form 8-K filed with the Commission on February 1, 2016). |
||||
*10.32 |
— |
Employment Agreement dated effective as of April 1, 2013, by and between The Men's Wearhouse, Inc. and Jon W. Kimmins (incorporated by reference from Exhibit 10.1 to the Company's Current Report on Form 8-K filed with the Commission on April 1, 2013). |
||||
*10.33 |
— |
Assignment and Amendment of Employment Agreement for Jon W. Kimmins, between The Men's Wearhouse, Inc. and Tailored Brands, Inc., effective as of January 31, 2016 (incorporated by reference from Exhibit 10.4 to the Company's Current Report on Form 8-K filed with the Commission on February 1, 2016). |
||||
*10.34 |
— |
Employment Agreement dated effective June 29, 2015, by and between The Men's Wearhouse, Inc. and Bruce K. Thorn (incorporated by reference from Exhibit 10.2 to the Company's Current Report on Form 8-K filed with the Commission on July 2, 2015). |
||||
*10.35 |
— |
Assignment and Amendment of Employment Agreement for Bruce K. Thorn, between The Men's Wearhouse, Inc. and Tailored Brands, Inc., effective as of January 31, 2016 (incorporated by reference from Exhibit 10.5 to the Company's Current Report on Form 8-K filed with the Commission on February 1, 2016). |
||||
21.1 |
— |
Subsidiaries of the Company (filed herewith). |
||||
23.1 |
— |
Consent of Deloitte & Touche LLP, independent auditors (filed herewith). |
117
| 31.1 | — | Certification of Annual Report Pursuant to Section 302 of the Sarbanes-Oxley Act of 2002 by the Chief Executive Officer (filed herewith). | ||||
31.2 |
— |
Certification of Annual Report Pursuant to Section 302 of the Sarbanes-Oxley Act of 2002 by the Chief Financial Officer (filed herewith). |
||||
32.1 |
— |
Certification of Annual Report Pursuant to Section 906 of the Sarbanes-Oxley Act of 2002 by the Chief Executive Officer (furnished herewith)†. |
||||
32.2 |
— |
Certification of Annual Report Pursuant to Section 906 of the Sarbanes-Oxley Act of 2002 by the Chief Financial Officer (furnished herewith)†. |
||||
101.1 |
— |
The following financial information from The Men's Wearhouse, Inc.'s Annual Report on Form 10-K for the year ended January 30, 2016, formatted in XBRL (Extensible Business Reporting Language) and filed electronically herewith: (i) the Consolidated Balance Sheets; (ii) the Consolidated Statements of (Loss) Earnings; (iii) the Consolidated Statements of Comprehensive (Loss) Income; (iv) the Consolidated Statement of Shareholders' (Deficit) Equity; (v) the Consolidated Statements of Cash Flows; and (vi) the Notes to Consolidated Financial Statements. |
- *
- Management
Compensation or Incentive Plan.
- †
- This exhibit will not be deemed "filed" for purposes of Section 18 of the Securities Exchange Act of 1934, as amended, or otherwise subject to the liability of that section. Such exhibit shall not be deemed incorporated into any filing under the Securities Act of 1933, as amended or the Securities Exchange Act of 1934, as amended.
118