Attached files
| file | filename |
|---|---|
| EX-31.2 - EX-31.2 - Lake Sunapee Bank Group | d85243dex312.htm |
| EX-32.2 - EX-32.2 - Lake Sunapee Bank Group | d85243dex322.htm |
| EX-32.1 - EX-32.1 - Lake Sunapee Bank Group | d85243dex321.htm |
| EX-31.1 - EX-31.1 - Lake Sunapee Bank Group | d85243dex311.htm |
| EX-23.1 - EX-23.1 - Lake Sunapee Bank Group | d85243dex231.htm |
| EX-23.2 - EX-23.2 - Lake Sunapee Bank Group | d85243dex232.htm |
Table of Contents
UNITED STATES
SECURITIES AND EXCHANGE COMMISSION
WASHINGTON, D.C. 20549
FORM 10-K
| x | Annual Report Pursuant to Section 13 or 15(d) of the Securities Exchange Act of 1934 |
For the fiscal year ended December 31, 2015
or
| ¨ | Transition Report Pursuant to Section 13 or 15(d) of the Securities Exchange Act of 1934 |
Commission File Number 000-17859
LAKE SUNAPEE BANK GROUP
(Exact name of Registrant as Specified in Its Charter)
| Delaware | 02-0430695 | |
| (State or Other Jurisdiction of Incorporation or Organization) |
(I.R.S. Employer Identification No.) |
9 Main Street, PO Box 9
Newport, New Hampshire 03773-0009
(Address of principal executive offices)
Registrant’s telephone number, including area code: (603) 863-0886
Securities registered pursuant to Section 12(b) of the Act:
| Common Stock, $.01 par value |
The Nasdaq Stock Market, LLC | |
| Title of class | Name of exchange on which registered |
Securities registered pursuant to Section 12(g) of the Act:
None
Indicate by check mark if the registrant is a well-known seasoned issuer, as defined in Rule 405 of the Securities Act. Yes ¨ No x
Indicate by check mark is the registrant is not required to file reports pursuant to Section 13 or Section 15(d) of the Act. Yes ¨ No x
Indicate by check mark whether the registrant: (1) has filed all reports required to be filed by Section 13 or 15(d) of the Securities Exchange Act of 1934 during the preceding 12 months (or for such shorter period that the registrant was required to file such reports), and (2) has been subject to such filing requirements for the past 90 days. Yes x No ¨
Indicate by check mark whether the registrant has submitted electronically and posted on its corporate Web site, if any, every Interactive Data File required to be submitted and posted pursuant to Rule 405 of Regulation S-T (§ 232.405 of this chapter) during the preceding 12 months (or for such shorter period that the registrant was required to submit and post such files). Yes x No ¨
Indicate by check mark if disclosure of delinquent filers pursuant to Item 405 of Regulation S-K is not contained herein, and will not be contained, to the best of the registrant’s knowledge, in definitive proxy or information statements incorporated by reference in Part III of this Form 10-K or any amendment to this Form 10-K. ¨
Indicate by check mark whether the registrant is a large accelerated filer, an accelerated filer, a non-accelerated filer, or a smaller reporting company. See the definitions of “large accelerated filer,” “accelerated filer” and “smaller reporting company” in Rule 12b-2 of the Exchange Act. (Check one):
| Large accelerated filer | ¨ | Accelerated filer | x | |||
| Non-accelerated filer | ¨ (Do not check is a smaller reporting company) | Smaller reporting company | ¨ | |||
Indicate by check mark whether the registrant is a shell company (as defined in Rule 12b-2 of the Act). Yes ¨ No x
As of March 6, 2016, there were 8,381,419 shares of the registrant’s common stock issued and outstanding.
As of June 30, 2015, the aggregate market value of the voting and non-voting common equity held by non-affiliates of the registrant was $111.2 million based on the closing sale price as reported on The NASDAQ Global Market on June 30, 2015 of $14.43.
Documents Incorporated By Reference:
Portions of the proxy statement for the 2016 Annual Meeting of Stockholders (the “Proxy Statement”) are incorporated by reference into Part III of this report. The Proxy Statement will be filed with the Securities and Exchange Commission within 120 days of the registrant’s fiscal year ended December 31, 2015.
Table of Contents
Lake Sunapee Bank Group
i
Table of Contents
Cautionary Note Regarding Forward-Looking Statements
Certain statements contained in this Annual Report on Form 10-K that are not statements of historical fact constitute forward-looking statements within the meaning of the Private Securities Litigation Reform Act of 1995, notwithstanding that such statements are not specifically identified as such. In addition, certain statements may be contained in the Company’s future filings with the Securities and Exchange Commission (the “SEC”), in press releases, and in oral and written statements made by or with the approval of the Company that are not statements of historical fact and constitute forward-looking statements. Examples of forward-looking statements include, but are not limited to: (i) projections of revenues, expenses, income or loss, earnings or loss per share, the payment or nonpayment of dividends, capital structure and other financial items; (ii) statements of plans, objectives and expectations of the Company or its management or Board of Directors, including those relating to products or services or the impact or expected outcome of any legal proceedings; (iii) statements of future economic performance; and (iv) statements of assumptions underlying such statements. Words such as “believes,” “anticipates,” “expects,” “intends,” “targeted,” “continues,” “remains,” “will,” “should,” “may” and other similar expressions are intended to identify forward-looking statements but are not the exclusive means of identifying such statements.
Forward-looking statements involve risks and uncertainties that may cause actual results to differ materially from those in such statements. Factors that could cause actual results to differ from those discussed in the forward-looking statements include, but are not limited to:
| • | local, regional, national and international economic conditions and the impact they may have on us and our customers and our assessment of that impact; |
| • | continued volatility and disruption in national and international financial markets; |
| • | changes in the level of non-performing assets and charge-offs; |
| • | changes in estimates of future reserve requirements based upon the periodic review thereof under relevant regulatory and accounting requirements; |
| • | adverse conditions in the securities markets that lead to impairment in the value of securities in our investment portfolio; |
| • | inflation, interest rate, securities market and monetary fluctuations; |
| • | the timely development and acceptance of new products and services and perceived overall value of these products and services by users; |
| • | changes in consumer spending, borrowings and savings habits; |
| • | technological changes; |
| • | acquisitions and integration of acquired businesses; |
| • | the ability to increase market share and control expenses; |
| • | changes in the competitive environment among banks, financial holding companies and other financial service providers; |
| • | the effect of changes in laws and regulations (including laws and regulations concerning taxes, banking, securities and insurance) with which we must comply; |
| • | the effect of changes in accounting policies and practices, as may be adopted by the regulatory agencies, as well as the Public Company Accounting Oversight Board, the Financial Accounting Standards Board and other accounting standard setters; |
| • | the costs and effects of legal and regulatory developments including the resolution of legal proceedings or regulatory or other governmental inquiries and the results of regulatory examinations or reviews; and |
ii
Table of Contents
| • | our success at managing the risks involved in the foregoing items. |
Forward-looking statements speak only as of the date on which such statements are made. We undertake no obligation to update any forward-looking statement to reflect events or circumstances after the date on which such statement is made, or to reflect the occurrence of unanticipated events.
Throughout this report, the terms “Company,” “we,” “our” and “us” refer to the consolidated entity of Lake Sunapee Bank Group, its wholly owned subsidiary, Lake Sunapee Bank, fsb (the “Bank”), and the Bank’s subsidiaries, Charter Holding Corp., McCrillis & Eldredge Insurance, Inc., Lake Sunapee Group, Inc. and Lake Sunapee Financial Services Corporation.
iii
Table of Contents
| Item 1. | Business |
GENERAL
Organization
Lake Sunapee Bank Group (the “Company”), formerly New Hampshire Thrift Bancshares, Inc., is a Delaware holding company organized on July 5, 1989 and is the parent company of Lake Sunapee Bank, fsb (the “Bank”), a federally chartered savings association. The Bank was originally chartered by the State of New Hampshire in 1868 as the Newport Savings Bank. The Bank became a member of the Federal Deposit Insurance Corporation (“FDIC”) in 1959 and a member of the Federal Home Loan Bank of Boston (“FHLBB”) in 1978. On December 1, 1980, the Bank was the first bank in the United States to convert from a state-chartered mutual savings bank to a federally chartered mutual savings bank. In 1981, the Bank changed its name to “Lake Sunapee Savings Bank, fsb” and in 1994, changed its name to “Lake Sunapee Bank, fsb.” The Bank’s deposits are insured by the Deposit Insurance Fund of the FDIC.
The Bank is a thrift institution established for the purposes of providing the public with a convenient and safe place to invest funds, for the financing of housing, consumer-oriented products and commercial loans, and for providing a variety of other consumer-oriented financial services. The Bank is a full-service community institution promoting the ideals of thrift, security, home ownership and financial independence for its customers. The Bank’s operations are conducted from its home office located in Newport, New Hampshire and its branch offices located in Andover, Bradford, Claremont, Enfield, Grantham, Guild, Hillsboro, Lebanon, Milford, Nashua, Newbury, New London, Peterborough, Sunapee and West Lebanon, New Hampshire, and Brandon, Pittsford, Quechee, Randolph, Rochester, Royalton, Rutland, South Royalton, West Rutland, Williamstown and Woodstock, Vermont.
The Bank has four wholly owned subsidiaries: Charter Holding Corp. (“Charter Holding”); McCrillis & Eldredge Insurance, Inc. (“McCrillis & Eldredge”); Lake Sunapee Group, Inc.; and Lake Sunapee Financial Services Corporation.
Recent Acquisitions
In September 2013, the Bank completed its purchase of all shares of common stock of Charter Holding held by Meredith Village Savings Bank (“MVSB”) for a total purchase price of $6.2 million in cash. Following completion of the transaction, the Bank now owns 100% of the outstanding shares of Charter Holding and its subsidiary, Charter Trust Company (“Charter Trust”). In October 2013, we completed our acquisition of Central Financial Corporation (“CFC”). Under the terms of the agreement, CFC merged with and into us, with us being the surviving corporation of the merger. Additionally, The Randolph National Bank (“RNB”), a wholly owned subsidiary of CFC, merged with and into the Bank with the Bank continuing as the surviving entity. The total consideration payable to CFC shareholders was valued at approximately $15.9 million.
Operating Segments
Our operations are managed along two reportable segments that represent our core businesses: Banking and Wealth Management. The Banking segment provides a wide array of lending and depository-related products and services to individuals, businesses and municipal enterprises. The Banking segment also provides commercial insurance and consumer products, including life, health, auto and homeowner insurance, through McCrillis & Eldredge and brokerage services through Lake Sunapee Financial Services Corporation. The Wealth Management segment provides trust and investment services through Charter Holding and Charter Trust. A summary of the financial results for each of our segments is included in Note 24—Operating Segments in the Notes to our Consolidated Financial Statements included elsewhere within this report.
1
Table of Contents
Employees
At December 31, 2015, we had a total of 288 full-time employees, 59 part-time employees, and 17 per-diem employees. These employees are not represented by collective bargaining agents. We believe that our relationship with our employees is good.
Market Area
Our market area extends from the southern New Hampshire/Massachusetts border-city of Nashua to the north through central and western New Hampshire and central Vermont. It is concentrated in the counties of Hillsborough, Grafton, Merrimack, Sullivan and Cheshire in south, central and western New Hampshire, and the counties of Rutland, Windsor and Orange in central Vermont.
There are several distinct regions within our market area. The first region is centered in Nashua, New Hampshire, the second largest city in the three northern New England states of New Hampshire, Maine and Vermont. Nashua’s downtown is a regional commercial, entertainment and dining destination. The city, bordering Massachusetts to the south, enjoys a vibrant high-tech industry and a robust retail industry due in part to New Hampshire’s absence of a sales tax. The Upper Valley region is located in the west-central area of New Hampshire, and includes the towns of Lebanon, a commerce and manufacturing center, home to Dartmouth-Hitchcock Medical Center, New Hampshire’s only academic medical center, and Hanover, home of Dartmouth College. The Lake Sunapee region is a popular year-round recreation and resort area that includes both Lake Sunapee and Mount Sunapee.
The Monadnock region, in southwestern New Hampshire, is named after Mount Monadnock, the major geographic landmark in the region, and consists of Cheshire, southern Sullivan and western Hillsborough counties. Rutland, Windsor and Orange counties are located in central Vermont. This region is home to many attractions, including Killington Mountain, Okemo Resort, and the city of Rutland. Popular vacation destinations in this region include Woodstock, Brandon, Ludlow and Quechee.
COMPETITION
We face strong competition in the attraction of deposits. Our most direct competition for deposits comes from thrifts, credit unions and commercial banks located in our primary market areas. We face additional significant competition for investors’ funds from mutual funds and other corporate and government securities.
We compete for deposits principally by offering depositors a wide variety of savings programs, a market rate of return, tax-deferred retirement programs and other related services. We do not rely upon any individual, group or entity for a material portion of our deposits.
Our competition for real estate loans comes from mortgage banking companies, thrift institutions and commercial banks. We compete for loan originations primarily through the interest rates and loan fees we charge and the efficiency and quality of services we provide borrowers, real estate brokers and builders. Our competition for loans varies from time to time depending upon the general availability of lendable funds and credit, general and local economic conditions, current interest rate levels, volatility in the mortgage markets and other factors which are not readily predictable. We have six loan originators on staff who call on real estate agents, follow leads, and are available seven days a week to service the mortgage loan market.
LENDING ACTIVITIES
Our net loan portfolio was $1.2 billion at December 31, 2015, representing approximately 80% of total assets. As of December 31, 2015, approximately 60% of the mortgage loan portfolio had adjustable rates. As of December 31, 2015, we had sold $445.9 million in fixed-rate mortgage loans in an effort to meet customer demands for fixed-rate loans, minimize our interest rate risk, provide liquidity and build a servicing portfolio.
2
Table of Contents
The following table sets forth the composition of our loan portfolio in dollar amounts and as a percentage of the portfolio at December 31:
| 2015 | 2014 | 2013 | ||||||||||||||||||||||
| Amount | % of Total | Amount | % of Total | Amount | % of Total | |||||||||||||||||||
| ($ in thousands) | ||||||||||||||||||||||||
| Real estate loans |
||||||||||||||||||||||||
| Conventional |
$ | 642,658 | 52.59 | % | $ | 645,690 | 53.27 | % | $ | 602,270 | 52.82 | % | ||||||||||||
| Home equity |
72,255 | 5.91 | 69,203 | 5.71 | 70,564 | 6.19 | ||||||||||||||||||
| Commercial |
323,268 | 26.45 | 313,017 | 25.83 | 287,813 | 25.24 | ||||||||||||||||||
| Construction |
34,918 | 2.86 | 36,445 | 3.01 | 29,722 | 2.61 | ||||||||||||||||||
| Commercial and municipal loans |
142,521 | 11.66 | 138,575 | 11.43 | 140,071 | 12.28 | ||||||||||||||||||
| Consumer loans |
6,488 | 0.53 | 9,150 | 0.75 | 9,817 | 0.86 | ||||||||||||||||||
|
|
|
|
|
|
|
|
|
|
|
|
|
|||||||||||||
| Total loans |
1,222,108 | 100.00 | % | 1,212,080 | 100.00 | % | 1,140,257 | 100.00 | % | |||||||||||||||
| Unamortized adjustments to fair value |
— | — | — | |||||||||||||||||||||
| Allowance for loan losses |
(8,905 | ) | (9,269 | ) | (9,757 | ) | ||||||||||||||||||
| Deferred loan origination costs, net |
4,258 | 4,034 | 3,610 | |||||||||||||||||||||
|
|
|
|
|
|
|
|||||||||||||||||||
| Loans receivable, net |
$ | 1,217,461 | $ | 1,206,845 | $ | 1,134,110 | ||||||||||||||||||
|
|
|
|
|
|
|
|||||||||||||||||||
| 2012 | 2011 | |||||||||||||||
| Amount | % of Total | Amount | % of Total | |||||||||||||
| ($ in thousands) | ||||||||||||||||
| Real estate loans |
||||||||||||||||
| Conventional |
$ | 471,449 | 51.84 | % | $ | 397,010 | 55.04 | % | ||||||||
| Home equity |
69,291 | 7.62 | 71,990 | 9.98 | ||||||||||||
| Commercial |
234,264 | 25.76 | 148,424 | 20.58 | ||||||||||||
| Construction |
19,412 | 2.13 | 12,731 | 1.76 | ||||||||||||
| Commercial and municipal loans |
107,750 | 11.85 | 83,835 | 11.62 | ||||||||||||
| Consumer loans |
7,304 | 0.80 | 7,343 | 1.02 | ||||||||||||
|
|
|
|
|
|
|
|
|
|||||||||
| Total loans |
909,470 | 100.00 | % | 721,333 | 100.00 | % | ||||||||||
| Unamortized adjustment to fair value |
— | 1,101 | ||||||||||||||
| Allowance for loan losses |
(9,923 | ) | (9,131 | ) | ||||||||||||
| Deferred loan origination costs, net |
2,689 | 1,649 | ||||||||||||||
|
|
|
|
|
|||||||||||||
| Loans receivable, net |
$ | 902,236 | $ | 714,952 | ||||||||||||
|
|
|
|
|
|||||||||||||
Real Estate Loans
Our loan origination team solicits conventional residential mortgage loans in the local real estate marketplace. Residential borrowers are frequently referred to us by our existing customers or real estate agents. Generally, we make conventional mortgage loans (loans of 80% of value or less that are neither insured nor partially guaranteed by government agencies) on one- to four-family owner occupied dwellings. We also make residential loans up to 97% of the appraised value if the top 20% of the loan is covered by private mortgage insurance. Residential mortgage loans typically have terms up to 30 years and are amortized on a monthly basis with principal and interest due each month. Currently, we offer three-year, five-year, seven-year and ten-year adjustable-rate mortgage loans and long-term fixed-rate loans. Borrowers may prepay loans at their option or refinance their loans on terms agreeable to us. Management believes that, due to prepayments in connection with refinancing and sales of property, the average length of our long-term residential loans is approximately seven years.
3
Table of Contents
The terms of conventional residential mortgage loans originated by us contain a “due-on-sale” clause, which permits us to accelerate the indebtedness of a loan upon the sale or other disposition of the mortgaged property. Due-on-sale clauses are an important means of increasing the turnover of mortgage loans in our portfolio.
Commercial real estate loans are solicited by our commercial banking team in our local real estate market. In addition, commercial borrowers are frequently referred to us by our existing customers, local accountants and attorneys. Generally, we make commercial real estate loans up to 75% of value with terms up to 20 years, amortizing the loans on a monthly basis with principal and interest due each month. Debt service coverage (the amount of cash left over after expenses have been paid) required to cover our interest and principal payments generally must equal or exceed 125% of the loan payments.
Real Estate Construction Loans
We offer construction loan financing on one- to four-family owner occupied dwellings in our local real estate market. Generally, we make construction loans up to 80% of value with terms of up to nine months. During the construction phase, inspections are made to assess construction progress and monitor the disbursement of loan proceeds. We also offer a “one-step” construction loan, which provides construction and permanent financing with one loan closing. The “one-step” is provided under the similar terms and conditions of our conventional residential program.
Consumer Loans
We make various types of secured and unsecured consumer loans, including home improvement loans. We offer loans secured by automobiles, boats and other recreational vehicles. We believe that the shorter terms and the normally higher interest rates available on various types of consumer loans are helpful in maintaining a more profitable spread between our average loan yield and our cost of funds.
We provide home equity loans secured by liens on residential real estate located within our market area. These include loans with regularly scheduled principal and interest payments as well as revolving credit agreements. The interest rate on these loans is adjusted monthly and tied to the movement of the prime rate.
Commercial Loans
We offer commercial loans in accordance with regulatory requirements. Under current regulation, our commercial loan portfolio is limited to 20% of total assets.
Municipal Loans
Our activity in the municipal lending market is limited to those towns and school districts located within our primary lending area and such loans are extended for the purposes of either tax anticipation, building improvements or other capital spending requirements. Municipal lending is considered to be an area of accommodation and part of our continuing involvement with the communities we serve.
Allowance for Loan Loan Losses
Each loan type represents different levels of general and inherent risk within the loan portfolio. We prepare an analysis of this risk by applying loss factors to outstanding loans by type and by credit risk rating if the loan is classified or criticized. This analysis stratifies the loan portfolio by loan type and assigns a loss factor to each type based on an assessment of the risk associated with each type. The factors assessed include delinquency trends, charge-off experience, economic conditions and portfolio change trends. Loss factors may be adjusted for qualitative factors that, in management’s judgment, affect the collectability of the portfolio. These factors are calculated and assessed independently within each identified loan category. Based on these loss factors, $2.9 million, or 33.51% of the total allowance, was allocated to the originated commercial real estate portfolio at December 31, 2015. The originated commercial real estate portfolio represents 23.62% of total originated loans.
4
Table of Contents
In particular, the commercial real estate portfolio has a higher delinquency trend and concentration assessment than the other categories resulting in an overall higher comparative loss factor. For the same period, $4.2 million, or 48.76% of the total allowance, is allocated to the originated residential real estate and originated home equity loan portfolio. The originated residential real estate and home equity loan portfolios represent 60.68% of total originated loans. Due to the volume of this category and the underlying collateral, the overall loss factor results in an allocation percentage that is below the percentage of the category to total loans. For the same period, $1.2 million, or 13.93% of the total allowance, is allocated to the originated commercial and municipal loan portfolio. The originated commercial and municipal loan portfolio represents 12.15% of total originated loans. The originated commercial and municipal loan portfolio has a moderate delinquency trend compared to other loan types within the loan portfolio.
Maturities
The following table sets forth the maturities of the loan portfolio at December 31, 2015 and indicates whether such loans have fixed or adjustable interest rates:
| (Dollars in thousands) | One year or less |
Over one through five years |
Over five years |
Total | ||||||||||||
| Real Estate Loans with: |
||||||||||||||||
| Predetermined interest rates |
$ | 23,118 | $ | 39,478 | $ | 359,425 | $ | 422,021 | ||||||||
| Adjustable interest rates |
802 | 9,915 | 640,361 | 651,078 | ||||||||||||
|
|
|
|
|
|
|
|
|
|||||||||
| 23,920 | 49,393 | 999,786 | 1,073,099 | |||||||||||||
|
|
|
|
|
|
|
|
|
|||||||||
| Commercial/Municipal Loans with |
||||||||||||||||
| Predetermined interest rates |
24,866 | 30,350 | 62,707 | 117,923 | ||||||||||||
| Adjustable interest rates |
196 | 1,768 | 22,634 | 24,598 | ||||||||||||
|
|
|
|
|
|
|
|
|
|||||||||
| 25,062 | 32,118 | 85,341 | 142,521 | |||||||||||||
|
|
|
|
|
|
|
|
|
|||||||||
| Collateral/Consumer Loans with |
||||||||||||||||
| Predetermined interest rates |
1,256 | 2,400 | 661 | 4,317 | ||||||||||||
| Adjustable interest rates |
1,106 | 435 | 630 | 2,171 | ||||||||||||
|
|
|
|
|
|
|
|
|
|||||||||
| 2,362 | 2,835 | 1,291 | 6,488 | |||||||||||||
|
|
|
|
|
|
|
|
|
|||||||||
| Totals (1) |
$ | 51,344 | $ | 84,346 | $ | 1,086,418 | $ | 1,222,108 | ||||||||
|
|
|
|
|
|
|
|
|
|||||||||
| (1) | This table includes $6.0 million of non-performing loans, which are categorized within the respective loan types. |
Origination, Purchase and Sale of Loans
Our primary lending activity is the origination of conventional loans (i.e., loans of 80% of value or less that are neither insured nor partially guaranteed by government agencies) secured by first mortgage liens on residential properties, principally single-family residences, substantially all of which are located in the southern and west-central areas of New Hampshire along with Addison, Orange, Rutland and Windsor counties in Vermont.
We evaluate the security for each new loan made. Appraisals, when required, are done by qualified sub-contracted appraisers. The appraisal of the real property, upon which we make a mortgage loan, is of particular significance to us in the event that the loan is foreclosed, since an improper appraisal may contribute to a loss by, or other financial detriment to, us in the disposition of the loan.
Detailed applications for mortgage loans are verified through the use of credit reports, financial statements and confirmations. Depending upon the size of the loan involved, a varying number of senior officers must approve the application before the loan can be granted. The Loan Review Committee of the Board of Directors reviews all loans and loan relationships in excess of $1 million.
5
Table of Contents
We require title certification on all first mortgage loans and the borrower is required to maintain hazard insurance on the security property.
Delinquent Loans, Classified Assets and Other Real Estate Owned
Reports listing delinquent accounts are generated and reviewed by management and the Board of Directors on a monthly basis. The procedures taken by us when a loan becomes delinquent vary depending on the nature of the loan. When a borrower fails to make a required loan payment, we take a number of steps to ensure that the borrower will cure the delinquency. We generally send the borrower a notice of non-payment and then follow up with telephone and/or written correspondence. When contact is made, we attempt to obtain full payment, work out a repayment schedule, or in certain instances obtain a deed in lieu of foreclosure. If foreclosure action is instituted and the loan is not brought current, paid in full, or refinanced before the foreclosure sale, the property securing the loan generally is sold at foreclosure. If we purchase the property, it becomes other real estate owned (“OREO”).
Federal regulations and our Assets Classification Policy require that we utilize an internal asset classification system as a means of reporting problem assets and potential problem assets. We have incorporated the internal asset classifications of the Office of the Comptroller of the Currency (the “OCC”) as part of our credit monitoring system. We currently classify problem and potential problem assets as substandard, doubtful or loss assets. An asset is considered substandard if it is inadequately protected by the current net worth and paying capacity of the obligor or the collateral pledged, if any. Substandard assets include those characterized by the distinct possibility that the insured institution will sustain “some loss” if the deficiency is not corrected. Assets classified as doubtful have all the weaknesses inherent in those classified substandard with the additional characteristics that the weaknesses present make collection and liquidation in full, on the basis of currently existing facts, conditions and values, highly questionable and improbable. Assets classified as loss are those considered uncollectible and of such little value that their continuance as assets without the establishment of a specific loss reserve is not warranted. Assets which do not currently expose the insured institution to sufficient risk to warrant classification in one of the aforementioned categories but possess weaknesses are required to be designated special mention.
When an insured institution classifies one or more assets or portions thereof as substandard or doubtful, it is required to establish a general valuation allowance for loan losses in an amount deemed prudent by management. General valuation allowances represent loss allowances, which have been established to recognize the inherent risk associated with activities, but which, unlike specific allowances, have not been allocated to particular problem assets. When an insured institution classifies one or more assets or portions thereof as loss, it is required to charge off such amount.
A savings institution’s determination as to the classification of its assets and the amount of its valuation allowances is subject to review by the OCC, which can order the classification of additional assets and establishment of additional general or specific loss allowances. The OCC, in conjunction with the other federal banking agencies, has adopted an interagency policy statement on the allowance for loan and lease losses. The policy statement provides guidance for financial institutions on both the responsibilities of management for the assessment and establishment of adequate allowances and guidance for banking agency examiners to use in determining the adequacy of general valuation guidelines. Generally, the policy statement recommends that institutions have effective systems and controls to identify, monitor and address asset quality problems; that management has analyzed all significant factors that affect the collectability of the portfolio in a reasonable manner; and that management has established acceptable allowance evaluation processes that meet the objectives set forth in the policy statement.
Although management believes that, based on information currently available to it at this time, our allowance for loan losses is adequate, actual losses are dependent upon future events and, as such, further additions to the allowance for loan losses may become necessary.
6
Table of Contents
We classify assets in accordance with the guidelines described above. The total carrying value of classified loans, excluding special mention, as of December 31, 2015 and 2014 was $19.7 million and $28.2 million, respectively. For further discussion regarding non-performing assets, impaired loans and the allowance for loan losses, please see the section entitled “Management’s Discussion and Analysis of Financial Condition and Results of Operations” herein.
INVESTMENT ACTIVITIES
Federally chartered savings institutions have the authority to invest in various types of liquid assets including United States Treasury obligations, securities of various federal agencies, certificates of deposit of insured banks and savings institutions, bankers’ acceptances, repurchase agreements and federal funds. Subject to various restrictions, federally chartered savings institutions may also invest their assets in commercial paper, investment-grade corporate debt securities and mutual funds whose assets conform to the investments that a federally chartered savings institution is otherwise authorized to make directly.
We categorize our securities as held-to-maturity, available-for-sale or held-for-trading according to management intent. Please refer to Note 3 of our Consolidated Financial Statements located elsewhere in this report for certain information regarding amortized costs, fair values and maturities of securities.
The following table sets forth as of December 31, 2015 the maturities and the weighted-average yields of our debt securities, excluding mortgage-backed securities, which have been calculated on the basis of the amortized cost, weighted for scheduled maturity of each security, and adjusted to a tax-equivalent basis (in thousands):
| (Dollars in thousands) | Amortized Cost Basis |
Fair Value | Weighted Average Yield |
|||||||||
| Available-for-sale securities |
||||||||||||
| Municipal bonds |
$ | 1,863 | $ | 1,869 | 3.04 | % | ||||||
| Other bonds and debentures |
86 | 90 | 7.95 | |||||||||
|
|
|
|
|
|||||||||
| Total due in less than one year |
$ | 1,949 | $ | 1,959 | 3.26 | |||||||
|
|
|
|
|
|||||||||
| U.S. Treasury notes |
35,282 | 34,939 | 0.65 | |||||||||
| U.S. Government-sponsored enterprise bonds |
6,998 | 6,909 | 1.05 | |||||||||
| Municipal bonds |
4,625 | 4,541 | 4.21 | |||||||||
|
|
|
|
|
|||||||||
| Total due after one year through five years |
$ | 46,905 | $ | 46,389 | 1.06 | |||||||
|
|
|
|
|
|||||||||
| U.S. Government-sponsored enterprise bonds |
142 | 143 | 1.79 | |||||||||
| Municipal bonds |
720 | 728 | 1.85 | |||||||||
|
|
|
|
|
|||||||||
| Total due after five years through ten years |
$ | 862 | $ | 871 | 1.84 | |||||||
|
|
|
|
|
|||||||||
| U.S. Government-sponsored enterprise bonds |
165 | 159 | 1.44 | |||||||||
| Municipal bonds |
1,210 | 1,166 | 3.79 | |||||||||
| Other bonds and debentures |
22 | 22 | 5.13 | |||||||||
|
|
|
|
|
|||||||||
| Total due after ten years |
$ | 1,397 | $ | 1,347 | 3.54 | |||||||
|
|
|
|
|
|||||||||
| $ | 51,113 | $ | 50,566 | 1.22 | % | |||||||
|
|
|
|
|
|||||||||
7
Table of Contents
The amortized cost and approximate fair value for our available-for-sale securities portfolio are summarized as follows (dollars in thousands):
| December 31, 2015 | Amortized Cost Basis |
Gross Unrealized Gains |
Gross Unrealized Losses |
Fair Value |
||||||||||||
| Available-for-sale: |
||||||||||||||||
| Bonds and notes- |
||||||||||||||||
| U.S. Treasury notes |
$ | 35,282 | $ | — | $ | 343 | $ | 34,939 | ||||||||
| U.S. Government-sponsored enterprise bonds |
7,305 | 1 | 95 | 7,211 | ||||||||||||
| Mortgage-backed securities |
70,169 | 14 | 849 | 69,334 | ||||||||||||
| Municipal bonds |
8,418 | 34 | 148 | 8,304 | ||||||||||||
| Other bonds and debentures |
108 | 4 | — | 112 | ||||||||||||
| Equity securities |
258 | 49 | 9 | 298 | ||||||||||||
|
|
|
|
|
|
|
|
|
|||||||||
| Total available-for-sale securities |
$ | 121,540 | $ | 102 | $ | 1,444 | $ | 120,198 | ||||||||
|
|
|
|
|
|
|
|
|
|||||||||
| December 31, 2014 | Amortized Cost Basis |
Gross Unrealized Gains |
Gross Unrealized Losses |
Fair Value |
||||||||||||
| Available-for-sale: |
||||||||||||||||
| Bonds and notes- |
||||||||||||||||
| U.S. Treasury notes |
$ | 40,512 | $ | — | $ | 389 | $ | 40,123 | ||||||||
| U.S. Government-sponsored enterprise bonds |
7,361 | 2 | 98 | 7,265 | ||||||||||||
| Mortgage-backed securities |
58,439 | 112 | 271 | 58,280 | ||||||||||||
| Municipal bonds |
9,579 | 103 | 86 | 9,596 | ||||||||||||
| Other bonds and debentures |
114 | 12 | — | 126 | ||||||||||||
| Equity securities |
258 | 51 | 1 | 308 | ||||||||||||
|
|
|
|
|
|
|
|
|
|||||||||
| Total available-for-sale securities |
$ | 116,263 | $ | 280 | $ | 845 | $ | 115,698 | ||||||||
|
|
|
|
|
|
|
|
|
|||||||||
| December 31, 2013 | Amortized Cost Basis |
Gross Unrealized Gains |
Gross Unrealized Losses |
Fair Value |
||||||||||||
| Available-for-sale: |
||||||||||||||||
| Bonds and notes- |
||||||||||||||||
| U.S. Treasury notes |
$ | 50,683 | $ | — | $ | 667 | $ | 50,016 | ||||||||
| U.S. Government-sponsored enterprise bonds |
7,388 | 4 | 232 | 7,160 | ||||||||||||
| Mortgage-backed securities |
47,612 | 27 | 992 | 46,647 | ||||||||||||
| Municipal bonds |
20,532 | 63 | 489 | 20,106 | ||||||||||||
| Other bonds and debentures |
263 | 12 | — | 275 | ||||||||||||
| Equity securities |
742 | 292 | — | 1,034 | ||||||||||||
|
|
|
|
|
|
|
|
|
|||||||||
| Total available-for-sale securities |
$ | 127,220 | $ | 398 | $ | 2,380 | $ | 125,238 | ||||||||
|
|
|
|
|
|
|
|
|
|||||||||
DEPOSIT ACTIVITIES AND OTHER SOURCES OF FUNDS
We offer a variety of deposit accounts with a range of interest rates and terms. Our deposits consist of business checking, money market accounts, savings, NOW and certificate accounts. The flow of deposits is influenced by general economic conditions, changes in money market rates, prevailing interest rates and competition. Our deposits are obtained predominantly from within our primary market areas. We use traditional
8
Table of Contents
means to advertise our deposit products, including print media. We generally do not solicit deposits from outside our primary market areas, although we may obtain these deposits from time to time as part of liquidity contingency plan testing or wholesale funding strategy. We offer negotiated rates on some of our certificate accounts. At December 31, 2015, time deposits represented approximately 27.0% of total deposits. Time deposits included $113.4 million of certificates of deposit in excess of $100,000.
The following table presents our deposit activity for the years ended December 31:
| 2015 | 2014 | 2013 | ||||||||||
| (Dollars in thousands) | ||||||||||||
| Net deposits (withdrawals) |
$ | 612 | $ | 60,158 | $ | (14,992 | ) | |||||
| Deposits assumed through acquisition |
— | — | 149,684 | |||||||||
| Interest credited on deposit accounts |
4,026 | 4,464 | 4,059 | |||||||||
|
|
|
|
|
|
|
|||||||
| Total increase in deposit accounts |
$ | 4,638 | $ | 64,622 | $ | 138,751 | ||||||
|
|
|
|
|
|
|
|||||||
At December 31, 2015, we had approximately $27.6 million in certificate of deposit accounts in amounts of $250,000 or more maturing as follows:
| Maturity Period |
Amount | Weighted Average Rate |
||||||
| (Dollars in thousands) | ||||||||
| 3 months or less |
$ | 14,550 | 0.35 | % | ||||
| Over 3 through 6 months |
3,068 | 0.49 | % | |||||
| Over 6 through 12 months |
6,032 | 0.74 | % | |||||
| Over 12 months |
3,909 | 1.30 | % | |||||
|
|
|
|||||||
| Total |
$ | 27,559 | 0.58 | % | ||||
|
|
|
|||||||
The following table sets forth the distribution of our deposit accounts as of December 31 of the years indicated and the percentage to total deposits:
| 2015 | 2014 | 2013 | ||||||||||||||||||||||
| Amount | % of Total | Amount | % of Total | Amount | % of Total | |||||||||||||||||||
| (Dollars in thousands) | ||||||||||||||||||||||||
| Checking accounts |
$ | 127,428 | 11.0 | % | $ | 117,889 | 10.2 | % | $ | 101,446 | 9.3 | % | ||||||||||||
| NOW accounts |
359,376 | 31.0 | 333,984 | 29.0 | 303,054 | 27.9 | ||||||||||||||||||
| Money market accounts |
105,286 | 9.1 | 103,817 | 9.0 | 104,755 | 9.6 | ||||||||||||||||||
| Regular savings accounts |
16,504 | 1.4 | 20,198 | 1.8 | 22,020 | 2.0 | ||||||||||||||||||
| Treasury savings accounts |
236,699 | 20.5 | 213,348 | 18.5 | 195,887 | 18.0 | ||||||||||||||||||
| Club deposits |
146 | — | 151 | — | 193 | — | ||||||||||||||||||
|
|
|
|
|
|
|
|
|
|
|
|
|
|||||||||||||
| Total |
845,439 | 73.0 | 789,387 | 68.5 | 727,355 | 66.8 | ||||||||||||||||||
|
|
|
|
|
|
|
|
|
|
|
|
|
|||||||||||||
| Time deposits |
||||||||||||||||||||||||
| Less than 12 months |
211,352 | 18.3 | 235,195 | 20.4 | 238,004 | 21.9 | ||||||||||||||||||
| Over 12 through 36 months |
76,595 | 6.6 | 91,551 | 7.9 | 100,394 | 9.2 | ||||||||||||||||||
| Over 36 months |
23,966 | 2.1 | 36,581 | 3.2 | 22,339 | 2.1 | ||||||||||||||||||
|
|
|
|
|
|
|
|
|
|
|
|
|
|||||||||||||
| Total time deposits |
311,913 | 27.0 | 363,327 | 31.5 | 360,737 | 33.2 | ||||||||||||||||||
|
|
|
|
|
|
|
|
|
|
|
|
|
|||||||||||||
| Total Deposits |
$ | 1,157,352 | 100.0 | % | $ | 1,152,714 | 100.0 | % | $ | 1,088,092 | 100.0 | % | ||||||||||||
|
|
|
|
|
|
|
|
|
|
|
|
|
|||||||||||||
9
Table of Contents
The following table presents the average balance of each type of deposit and the average rate paid on each type of deposit for the year indicated.
| For the Years Ended December 31, | ||||||||||||||||||||||||
| 2015 | 2014 | 2013 | ||||||||||||||||||||||
| Average Balance |
Average Rate Paid |
Average Balance |
Average Rate Paid |
Average Balance |
Average Rate Paid |
|||||||||||||||||||
| (Dollars in thousands) | ||||||||||||||||||||||||
| NOW |
$ | 359,063 | 0.08 | % | $ | 362,474 | 0.01 | % | $ | 306,737 | 0.05 | % | ||||||||||||
| Savings deposits |
234,882 | 0.14 | 227,152 | 0.11 | 190,707 | 0.05 | ||||||||||||||||||
| Money market deposits |
104,094 | 0.32 | 101,094 | 0.31 | 81,682 | 0.21 | ||||||||||||||||||
| Time deposits |
362,142 | 0.81 | 366,200 | 0.99 | 338,920 | 1.08 | ||||||||||||||||||
| Demand deposits |
52,979 | — | 49,228 | — | 26,647 | — | ||||||||||||||||||
|
|
|
|
|
|
|
|||||||||||||||||||
| Total Deposits |
$ | 1,113,160 | $ | 1,106,148 | $ | 944,693 | ||||||||||||||||||
|
|
|
|
|
|
|
|||||||||||||||||||
The following table presents, by various rate categories, the amount of time deposits as of December 31:
| Time Deposits |
2015 | 2014 | 2013 | |||||||||
| (Dollars in thousands) | ||||||||||||
| 0.00% – 0.99% |
$ | 212,954 | $ | 238,696 | $ | 219,507 | ||||||
| 1.00% – 1.99% |
77,458 | 73,378 | 85,688 | |||||||||
| 2.00% – 2.99% |
21,501 | 25,137 | 27,656 | |||||||||
| 3.00% – 3.99% |
— | 26,116 | 27,886 | |||||||||
|
|
|
|
|
|
|
|||||||
| Total |
$ | 311,913 | $ | 363,327 | $ | 360,737 | ||||||
|
|
|
|
|
|
|
|||||||
Borrowings
We utilize advances from the FHLBB as a funding source alternative to retail deposits. By utilizing FHLBB advances, we can meet our liquidity needs without otherwise being dependent upon retail deposits. These advances are collateralized primarily by mortgage loans and mortgage-backed securities held by us and secondarily by our investment in capital stock of the FHLBB. The maximum amount that the FHLBB will advance to member institutions fluctuates from time-to-time in accordance with the policies of the FHLBB. At December 31, 2015, we had outstanding advances of $150.0 million from the FHLBB compared to advances outstanding of $141.0 million from the FHLBB at December 31, 2014.
The following table represents the balances, average amount outstanding, maximum outstanding, and average interest rates for short-term borrowings reported in Note 8 of our Consolidated Financial Statements included elsewhere in this report for the years indicated:
| 2015 | 2014 | 2013 | ||||||||||
| (Dollars in thousands) | ||||||||||||
| Balance at year end |
$ | 75,000 | $ | 70,000 | $ | 15,000 | ||||||
| Average amount outstanding |
52,833 | 81,000 | 20,573 | |||||||||
| Maximum amount outstanding at any month-end |
70,000 | 120,000 | 65,000 | |||||||||
| Average interest rate for the year |
0.35 | % | 0.23 | % | 0.29 | % | ||||||
| Weighted average interest rate on year-end balance |
0.46 | % | 0.33 | % | 0.28 | % | ||||||
10
Table of Contents
SUBSIDIARY ACTIVITIES
Service Corporations
The Bank has expanded service corporation authority because of its conversion from a state-chartered mutual savings bank to a federal institution in 1980. This authority, grandfathered in that conversion, permits the Bank to invest 15% of its deposits, plus an amount of approximately $825,000, in service corporation activities permitted by New Hampshire law. However, the first 3% of these activities is subject to federal regulation and the remainder is subject to state law. This permits a 3% investment in activities not permitted by state law.
As of December 31, 2015, the Bank owned two service corporations: the Lake Sunapee Group, Inc. and the Lake Sunapee Financial Services Corporation. The Lake Sunapee Group owns and maintains the Bank’s buildings and investment properties. The Lake Sunapee Financial Services Corporation sells brokerage, securities, and insurance products to its customers.
Additionally, the Bank owns McCrillis & Eldredge, a full-line independent insurance agency offering a complete range of commercial insurance services and consumer products, including life, health, auto and homeowner insurances, and Charter Holding, which provides wealth management and trust services through its subsidiary, Charter Trust Company.
Capital Securities
NHTB Capital Trust II (“Trust II”) and NHTB Capital Trust III (“Trust III”) are statutory business trusts formed under the laws of the State of Connecticut and are wholly owned subsidiaries of the Company. On March 30, 2004, Trust III issued $10.0 million of 6.06%, 5-year Fixed-Floating Capital Securities. On March 30, 2004, Trust II issued $10.0 million of Floating Capital Securities, adjustable every three months at LIBOR plus 2.79%. On May 1, 2008, we entered into an interest rate swap agreement with PNC Bank to convert the floating-rate payments on Trust II to fixed-rate payments which expired on June 17, 2013. For more information, see Note 2 of our Consolidated Financial Statements located elsewhere in this report.
SUPERVISION AND REGULATION
The Company and the Bank are subject to extensive regulation under federal and state laws. The regulatory framework applicable to savings and loan holding companies and their insured savings association subsidiaries is intended to protect depositors, the federal deposit insurance fund, consumers and the U.S. banking system. This framework is not designed to protect investors in savings and loan holding companies, such as the Company.
General
The Company is a separate and distinct legal entity from the Bank. The Company is a savings and loan holding company under the Home Owners’ Loan Act (the “HOLA”), as amended, and is subject to the supervision of, and regular examination by, the Board of Governors of the Federal Reserve System (the “FRB,” the “Federal Reserve Board” or the “Federal Reserve”) as its primary federal regulator. In addition, the Federal Reserve Board has enforcement authority over the Company and its non-savings association subsidiaries. The Company is also subject to the jurisdiction of the SEC and is subject to the disclosure and other regulatory requirements of the Securities Act of 1933, as amended, and the Securities Exchange Act of 1934, as amended, as administered by the SEC. The Company is traded on the NASDAQ under the ticker symbol, “LSBG,” and is subject to the NASDAQ stock market rules.
The Bank is organized as a federal savings association under the HOLA. The Bank is subject to the supervision of, and to regular examination by, the OCC as its chartering authority and primary federal regulator. The Bank is also subject to the supervision and regulation of the Federal Deposit Insurance Corporation (the
11
Table of Contents
“FDIC”) as its deposit insurer. Financial products and services offered by the Company and the Bank are subject to federal consumer protection laws and implementing regulations promulgated by the Consumer Financial Protection Bureau (the “CFPB”). The Company and the Bank are also subject to oversight by state attorneys general for compliance with state consumer protection laws. The Bank’s deposits are insured by the FDIC up to the applicable deposit insurance limits in accordance with FDIC laws and regulations. The Bank is a member of the Federal Home Loan Bank of Boston (the “FHLBB”), and is subject to the FHLBB’s rules and requirements. The subsidiaries of the Company and the Bank are subject to federal and state laws and regulations, including regulations of the FRB and the OCC, respectively.
The Dodd-Frank Wall Street Reform and Consumer Protection Act of 2010 (the “Dodd-Frank Act”) has significantly changed the financial regulatory landscape in the U.S. Several provisions of the Dodd-Frank Act are subject to further rulemaking, guidance and interpretation by the federal banking agencies. As a result, management cannot predict the ultimate impact of the Dodd-Frank Act or the extent to which it could affect operations of the Company and the Bank. Management will allocate resources to ensure compliance with all applicable laws and regulations, including the Dodd-Frank Act and its implementing rules, which may increase our costs of operations and adversely impact our earnings.
Set forth below is a description of the significant elements of the laws and regulations applicable to the Company and its subsidiaries. Statutes, regulations and policies are subject to ongoing review by Congress, state legislatures and federal and state agencies. A change in any statute, regulation or policy applicable to the Company may have a material effect on the results of the Company and its subsidiaries.
Federal Regulation of Savings and Loan Holding Companies
The Company is a savings and loan holding company as defined under by the HOLA. As a savings and loan holding company, the Company is registered with and subject to Federal Reserve examination and supervision, as well as certain reporting requirements. In addition, the Federal Reserve has enforcement authority over the Company and any of its non-savings association subsidiaries. This authority, among other things, permits the Federal Reserve to restrict or prohibit activities that are determined to be a serious risk to the financial safety, soundness or stability of a subsidiary federal savings association.
Capital Adequacy and Prompt Corrective Action. In July 2013, the FRB, the OCC and the FDIC approved final rules (the “Capital Rules”) that established a new capital framework for U.S. banking organizations. The Capital Rules generally implement the Basel Committee on Banking Supervision’s (the “Basel Committee”) December 2010 final capital framework referred to as “Basel III” for strengthening international capital standards. In addition, the Capital Rules implement certain provisions of the Dodd-Frank Act, including the requirements of Section 939A to remove references to credit ratings from the federal banking agencies’ rules.
While not previously subject to regulatory capital requirements, the Dodd-Frank Act imposed such requirements on savings and loan holding companies. As a savings and loan holding company, is subject to the Capital Rules. The Capital Rules substantially revised the risk-based capital requirements applicable to holding companies and their depository institution subsidiaries as compared to prior U.S. general risk-based capital rules. The Capital Rules revised the definitions and the components of regulatory capital and impacted the calculation of the numerator in banking institutions’ regulatory capital ratios.
The Capital Rules became effective on January 1, 2015, subject to phase-in periods for certain components and other provisions. The Capital Rules: (i) require a capital measure called “Common Equity Tier 1” (“CET1”) and related regulatory capital ratio of CET1 to risk-weighted assets; (ii) specify that Tier 1 capital consists of CET1 and “Additional Tier 1 capital” instruments meeting certain revised requirements; (iii) mandate that most deductions/adjustments to regulatory capital measures be made to CET1 and not to the other components of capital; and (iv) expand the scope of the deductions from and adjustments to capital as compared to existing
12
Table of Contents
regulations. Under the Capital Rules, for most banking organizations, including the Company, the most common form of Additional Tier 1 capital is non-cumulative perpetual preferred stock and the most common forms of Tier 2 capital are subordinated notes and a portion of the allocation for loan and lease losses, in each case, subject to the Capital Rules’ specific requirements.
Pursuant to the Capital Rules, the minimum capital ratios as of January 1, 2015 are:
| • | 8.0% Total capital (Tier 1 capital plus Tier 2 capital) to risk-weighted assets; |
| • | 6.0% Tier 1 capital (CET1 plus Additional Tier 1 capital) to risk-weighted assets; |
| • | 4.5% CET1 to risk-weighted assets; and |
| • | 4.0% Tier 1 capital to average consolidated assets as reported on consolidated financial statements (known as the “leverage ratio”). |
The Capital Rules also require a “capital conservation buffer,” composed entirely of CET1, on top of these minimum risk-weighted asset ratios. The capital conservation buffer is designed to absorb losses during periods of economic stress. Banking institutions with a ratio of CET1 to risk-weighted assets above the minimum but below the capital conservation buffer will face constraints on dividends, equity and other capital instrument repurchases and compensation based on the amount of the shortfall. Thus, when fully phased-in on January 1, 2019, the capital standards applicable to the Company will include an additional capital conservation buffer of 2.5% of CET1, effectively resulting in minimum ratios inclusive of the capital conservation buffer of: (i) CET1 to risk-weighted assets of at least 7%; (ii) Tier 1 capital to risk-weighted assets of at least 8.5%; and (iii) Total capital to risk-weighted assets of at least 10.5%.
The Capital Rules provide for a number of deductions from and adjustments to CET1. These include, for example, the requirement that mortgage servicing rights, deferred tax assets arising from temporary differences that could not be realized through net operating loss carrybacks and significant investments in non-consolidated financial entities be deducted from CET1 to the extent that any one such category exceeds 10% of CET1 or all such items, in the aggregate, exceed 15% of CET1.
In addition, under the current general risk-based capital rules, the effects of accumulated other comprehensive income or loss (“AOCI”) items included in shareholders’ equity (for example, marks-to-market of securities held in the available-for-sale portfolio) under U.S. GAAP are reversed for the purposes of determining regulatory capital ratios. Under the Capital Rules, the effects of certain AOCI items are not excluded; however, banking organizations not using advanced approaches, such as the Company, were able to make a one-time permanent election to continue to exclude these items in January 2015.
Implementation of the deductions and other adjustments to CET1 began on January 1, 2015, are phased-in over a 4-year period (beginning at 40% on January 1, 2015 and an additional 20% per year thereafter). The implementation of the capital conservation buffer will begin on January 1, 2016 at the 0.625% level and increase by 0.625% on each subsequent January 1, until it reaches 2.5% on January 1, 2019.
The Bank is subject to the Capital Rules on the same phase-in schedule as the Company. We believe that the Company is in compliance and will remain in compliance with the targeted capital ratios under the Capital Rules.
With respect to the Bank, the Capital Rules revised the PCA regulations adopted pursuant to Section 38 of the Federal Deposit Insurance Act (“FDIA”), by: (i) introducing a CET1 ratio requirement at each PCA category (other than critically undercapitalized), with the required CET1 ratio being 6.5% for well-capitalized status; (ii) increasing the minimum Tier 1 capital ratio requirement for each category, with the minimum Tier 1 capital ratio for well-capitalized status being 8% (as compared to the current 6%); and (iii) eliminating the provision that allowed a bank with a composite supervisory rating of 1 to have a 3% leverage ratio and still be considered adequately capitalized. The Capital Rules did not change the total risk-based capital requirement for any PCA category.
13
Table of Contents
The federal banking agencies have established by regulation, for each capital measure, the levels at which an insured institution is “well-capitalized,” “adequately capitalized,” “undercapitalized,” “significantly undercapitalized” or “critically undercapitalized.” The federal banking agencies are required to take prompt corrective action (“PCA”) with respect to insured depository institutions that fall below the “adequately capitalized” level. Any insured depository institution that falls below the “adequately capitalized” level must submit a capital restoration plan, and, if its capital levels further decline or do not increase, will face increased scrutiny and more stringent supervisory action. As of December 31, 2015, the most recent notification from the OCC categorized the Bank as “well capitalized” under the PCA framework.
The Volcker Rule. Section 619 of the Dodd-Frank Act, commonly known as the Volcker Rule, prohibits banking entities, such as the Company, from: (i) engaging in “proprietary trading” and (ii) investing in or sponsoring certain types of funds (“Covered Funds”), subject to certain limited exceptions. The implementing regulation defines a Covered Fund to include certain investments such as collateralized loan obligation (“CLO”) and collateralized debt obligation securities. The regulation provides, among other exemptions, an exemption for CLOs meeting certain requirements. Compliance with the Volcker Rule is generally required by July 21, 2017. Given the size and the scope of the Company’s activities, it does not believe that the implementation of the Volcker Rule will have a significant effect on its financial statements.
Source of Strength. Federal Reserve policy requires savings and loan holding companies to act as a source of financial and managerial strength to their subsidiary savings associations. The Dodd-Frank Act codified the requirement that holding companies act as a source of financial strength. As a result, the Company is expected to commit resources to support the Bank, including at times when the Company may not be in a financial position to provide such resources. Any capital loans by a savings and loan holding company to any of its subsidiary savings associations are subordinate in right of payment to deposits and to certain other indebtedness of such subsidiary savings associations. In the event of a savings and loan holding company’s bankruptcy, any commitment by the savings and loan holding company to a federal banking agency to maintain the capital of a subsidiary insured depository institution will be assumed by the bankruptcy trustee and entitled to priority of payment.
Control. The HOLA and the Federal Reserve’s implementing regulations prohibit a savings and loan holding company, directly or indirectly, or through one or more subsidiaries, from acquiring control of another savings institution without prior Federal Reserve approval. In addition, a savings and loan holding company is prohibited from directly or indirectly acquiring, through mergers, consolidation or purchase of assets, another insured depository institution or a holding company thereof, or acquiring all or substantially all of the assets of such institution or company without prior Federal Reserve approval.
Activity Restrictions. Laws governing savings and loan holding companies historically have classified such entities based upon the number of thrift institutions which they control. The Company is classified as a unitary savings and loan holding company because it controls only one thrift, the Bank. Under the Gramm-Leach-Bliley Act of 1999 (the “GLB Act”), any company which became a unitary savings and loan holding company pursuant to a charter application filed with the Office of Thrift Supervision after May 4, 1999, is prohibited from engaging in non-financial activities or affiliating with non-financial companies. All unitary savings and loan holding companies in existence prior to May 4, 1999, such as the Company, are “grandfathered” under the GLB Act and may continue to operate as unitary savings and loan holding companies without any limitations in the types of businesses with which they may engage at the holding company level, provided that the thrift subsidiary of the holding company continues to satisfy the qualified thrift lender (“QTL”) test.
Incentive Compensation. The Dodd-Frank Act requires publicly traded companies to give stockholders a non-binding vote on executive compensation at their first annual meeting taking place six months after the date of enactment and at least every three years thereafter and on so-called “golden parachute” payments in connection with approvals of mergers and acquisitions. The legislation also authorizes the SEC to promulgate rules that would allow stockholders to nominate their own candidates using a company’s proxy materials.
14
Table of Contents
Additionally, the Dodd-Frank Act directs the federal banking regulators to promulgate rules requiring the reporting of incentive-based compensation and prohibiting excessive incentive-based compensation paid to executives of depository institutions and their holding companies with assets in excess of $1 billion, regardless of whether the company is publicly traded or not. In April 2011, the Federal Reserve, along with other federal banking agencies, issued a joint notice of proposed rulemaking implementing those requirements. The Dodd-Frank Act gives the SEC authority to prohibit broker discretionary voting on elections of directors, executive compensation matters and any other significant matter. At the 2012 Annual Meeting of Stockholders, the Company’s stockholders voted on a non-binding, advisory basis to hold a non-binding, advisory vote on the compensation of the named executive officers of the Company annually. In light of the results, the Board of Directors determined to hold the vote annually.
Regulation of Federal Savings Associations
Business Activities. The Bank derives its lending and investment powers from the HOLA and the regulations of the OCC. Under these laws and regulations, the Bank may invest in mortgage loans secured by residential and commercial real estate, commercial and consumer loans, certain types of debt securities, and certain other assets. The Bank may also establish service corporations that may engage in activities not otherwise permissible for the Bank, including certain real estate equity investments. The Bank’s authority to invest in certain types of loans or other investments is limited by federal law and regulation.
Loans to One Borrower. The Bank is generally subject to the same limits on loans to one borrower as a national bank. With specified exceptions, the Bank’s total loans or extensions of credit to a single borrower cannot exceed 15% of the Bank’s unimpaired capital and surplus, which does not include accumulated other comprehensive income. The Bank may lend additional amounts up to 10% of its unimpaired capital and surplus, which does not include accumulated other comprehensive income, if the loans or extensions of credit are fully-secured by readily-marketable collateral. The Bank currently complies with applicable loans-to-one borrower limitations.
QTL Test. Under federal law, the Bank must comply with the QTL test. Under the QTL test, the Bank is required to maintain at least 65% of its “portfolio assets” in certain “qualified thrift investments” in at least nine months of the most recent 12-month period. “Portfolio assets” means, in general, the Bank’s total assets less the sum of:
| • | specified liquid assets up to 20% of total assets; |
| • | goodwill and other intangible assets; and |
| • | the value of property used to conduct the Bank’s business. |
“Qualified thrift investments” include certain assets that are includable without limit, such as residential and manufactured housing loans, home equity loans, education loans, small business loans, credit card loans, mortgage backed securities, Federal Home Loan Bank stock and certain U.S. government obligations. In addition, certain assets are includable as “qualified thrift investments” in an amount up to 20% of portfolio assets, including, certain consumer loans and loans in “credit-needy” areas.
The Bank may also satisfy the QTL test by qualifying as a “domestic building and loan association” as defined in the Internal Revenue Code of 1986, as amended. The Bank met the QTL test at December 31, 2015, and in each of the prior 12 months, and, therefore, is a “qualified thrift lender.” Failure by the Bank to maintain its status as a QTL would result in restrictions on activities, including restrictions on branching and the payment of dividends. If the Bank were unable to correct that failure for a specified period of time, it must either continue to operate under those restrictions on its activities or convert to a bank charter.
Community Reinvestment Act of 1977. Under the Community Reinvestment Act (“CRA”), as implemented by OCC regulations, the Bank has a continuing and affirmative obligation consistent with safe and
15
Table of Contents
sound banking practices, to help meet the credit needs of its entire community, including low and moderate income neighborhoods. The CRA does not establish specific lending requirements or programs for the Bank nor does it limit the Bank’s discretion to develop the types of products and services that it believes are best suited to its particular community, consistent with the CRA. The CRA requires the OCC, in connection with its examination of a federal savings association, to assess the association’s record of meeting the credit needs of its community and to take such record into account in its evaluation of certain applications by such association. The CRA also requires all institutions to make public disclosure of their CRA ratings. The Bank received an “Outstanding” rating in its most recent CRA examination, dated June 2015.
The CRA regulations establish an assessment system that bases an association’s rating on its actual performance in meeting community needs. The assessment system for institutions of the Bank’s size focuses on two tests:
| • | a lending test, to evaluate the institution’s record of making loans in its assessment areas; and |
| • | a community development test, to evaluate the institution’s record of investing in community development projects, affordable housing, and programs benefiting low or moderate income individuals and businesses in its assessment area or a broader area that includes its assessment area; and to evaluate the institution’s delivery of services through its retail banking channels and the extent and innovativeness of its community development services. |
Transactions with Affiliates. The Bank’s authority to engage in transactions with its “affiliates” is limited by the Federal Reserve Board’s Regulation W and Sections 23A and 23B of the Federal Reserve Act (“FRA”). In general, these transactions must be on terms which are at least as favorable to the Bank as comparable transactions with non-affiliates. In addition, certain types of these transactions referred to as “covered transactions” are subject to qualitative limits and certain quantitative limits based on a percentage of the Bank’s capital, thereby restricting the total dollar amount of transactions the Bank may engage in with each individual affiliate and with all affiliates in the aggregate. Affiliates must pledge qualifying collateral in amounts between 100% and 130% of the covered transaction in order to receive loans from the Bank. In addition, a savings association is prohibited from making a loan or other extension of credit to any of its affiliates that engage in activities that are not permissible for bank holding companies under section 4(c) of the BHC Company Act and from purchasing or investing in the securities issued by any affiliate, other than with respect to shares of a subsidiary.
Loans to Insiders. The Bank’s authority to extend credit to its directors, executive officers and principal stockholders, as well as to entities controlled by such persons, is governed by the requirements of Sections 22(g) and 22(h) of the FRA and Regulation O of the Federal Reserve Board. Among other things, these provisions require that extensions of credit to insiders:
| • | be made on terms that are substantially the same as, and follow credit underwriting procedures that are not less stringent than, those prevailing for comparable transactions with non-insiders and that do not involve more than the normal risk of repayment or present other features that are unfavorable to the Bank; and |
| • | not exceed certain limitations on the amount of credit extended to such persons, individually and in the aggregate, which limits are based, in part, on the amount of the Bank’s capital. |
The regulations allow small discounts on fees on residential mortgages for directors, officers and employees, but, generally, specialized terms must be made widely available to all employees rather than to a select subset of insiders, such as executive officers. In addition, extensions for credit to insiders in excess of certain limits must be approved by the Bank’s Board of Directors.
Consumer Protection and CFPB Supervision. The Company and the Bank are subject to a number of federal and state laws designed to protect borrowers and promote lending to various sectors of the economy.
16
Table of Contents
These laws include, among others, the Equal Credit Opportunity Act, the Fair Credit Reporting Act, the Truth in Lending Act, the Home Mortgage Disclosure Act, the Real Estate Settlement Procedures Act, various state law counterparts, and the Consumer Financial Protection Act of 2010, which is part of the Dodd-Frank Act. The Dodd-Frank Act established and centralized responsibility for federal consumer financial protection in the CFPB, which is an independent agency charged with responsibility for implementing, enforcing, and examining compliance with the federal consumer financial laws and regulations.
On January 10, 2013, the CFPB issued a final rule implementing the ability-to-repay and qualified mortgage (QM) provisions of the Truth in Lending Act, as amended by the Dodd-Frank Act (the “QM Rule”). The ability-to-repay provision requires creditors to make reasonable, good faith determinations that borrowers are able to repay their mortgages before extending the credit based on a number of factors and consideration of financial information about the borrower from reasonably reliable third-party documents. Under the Dodd-Frank Act and the QM Rule, loans meeting the definition of “qualified mortgage” are entitled to a presumption that the lender satisfied the ability-to-repay requirements. The presumption is a conclusive presumption/safe harbor for prime loans meeting the QM requirements, and a rebuttable presumption for higher-priced/subprime loans meeting the QM requirements. The definition of a “qualified mortgage” incorporates the statutory requirements, such as not allowing negative amortization or terms longer than 30 years. The QM Rule also adds an explicit maximum 43% debt-to-income ratio for borrowers if the loan is to meet the QM definition, though some mortgages that meet GSE, FHA and VA underwriting guidelines may, for a period not to exceed seven years, meet the QM definition without being subject to the 43% debt-to-income limits. The QM Rule became effective January 10, 2014.
Enforcement. The OCC has primary enforcement responsibility over savings associations, including the Bank. This enforcement authority includes, among other things, the ability to assess civil money penalties, to issue cease and desist orders and to remove directors and officers. In general, these enforcement actions may be initiated in response to violations of laws and regulations and to unsafe or unsound practices.
Safety and Soundness Standards. Pursuant to the FDIA, the OCC has adopted a set of guidelines prescribing safety and soundness standards. These guidelines establish general standards relating to areas including internal controls, information systems, internal audit systems, loan documentation, credit underwriting, interest rate risk exposure, asset growth, asset quality, earnings standards, compensation, fees and benefits. In general, the guidelines require appropriate systems and practices to identify and manage the risks and exposures specified in the guidelines.
In addition, the OCC adopted regulations that authorize, but do not require, the OCC to order an institution that has been given notice that it is not satisfying these safety and soundness standards to submit a compliance plan. If, after being notified, an institution fails to submit an acceptable plan or fails in any material respect to implement an accepted plan, the OCC must issue an order directing action to correct the deficiency. Further, the OCC may issue an order directing corrective actions and may issue an order directing other actions of the types to which an undercapitalized association is subject under the “prompt corrective action” provisions of federal law. If an institution fails to comply with such an order, the OCC may seek to enforce such order in judicial proceedings and to impose civil money penalties. The Bank is also required to maintain a sufficient amount of liquid assets to ensure its safe and sound operation.
Limitations on Capital Distributions. The OCC imposes various restrictions or requirements on the Bank’s ability to make capital distributions, including cash dividends. The Bank must file an application for prior approval with the OCC if the total amount of its capital distributions, including the proposed distribution, for the applicable calendar year would exceed an amount equal to the Bank’s net income for the year-to-date plus the Bank’s retained net income for the previous two years, or that would cause the Bank to be less than adequately capitalized.
The OCC may disapprove a notice or application if:
| • | the Bank would be undercapitalized following the distribution; |
17
Table of Contents
| • | the proposed capital distribution raises safety and soundness concerns; or |
| • | the capital distribution would violate a prohibition contained in any statute, regulation or agreement. |
In addition, Section 10(f) of the HOLA requires a subsidiary savings association of a savings and loan holding company, such as Bank, to file a notice with and receive the non-objection of the Federal Reserve prior to declaring certain types of dividends. The Company’s ability to pay dividends, service debt obligations and repurchase common stock is dependent upon receipt of dividend payments from the Bank.
Insurance of Deposit Accounts. The deposits of the Bank are insured by the FDIC up to the applicable limits established by law and are subject to the deposit insurance premium assessments of the FDIC’s Deposit Insurance Fund (“DIF”). The FDIC currently maintains a risk-based assessment system under which assessment rates vary based on the level of risk posed by the institution to the DIF. The assessment rate may, therefore, change when that level of risk changes.
In February 2011, the FDIC adopted a final rule making certain changes to the deposit insurance assessment system, many of which were made as a result of provisions of the Dodd-Frank Act. The final rule also revised the assessment rate schedule effective April 1, 2011, and adopted additional rate schedules that will go into effect when the DIF reserve ratio reaches certain milestones. The final rule changed the deposit insurance assessment system from one that is based on domestic deposits to one that is based on average consolidated total assets minus average tangible equity. In addition, the rule suspends FDIC dividend payments if the DIF reserve ratio exceeds 1.5 percent at the end of any year but provides for decreasing assessment rates when the DIF reserve ratio reaches certain thresholds.
In calculating assessment rates, the rule adopts a new “scorecard” assessment scheme for insured depository institutions with $10 billion or more in assets. It retains the risk category system for insured depository institutions with less than $10 billion in assets, assigning each institution to one of four risk categories based upon the institution’s capital evaluation and supervisory evaluation, as defined by the rule. It is possible that our deposit insurance premiums may increase in the future.
In addition, all FDIC-insured institutions are required to pay assessments to fund interest payments on bonds issued by the Financing Corporation (“FICO”), a mixed-ownership government corporation established as a funding vehicle for the now defunct Federal Savings & Loan Insurance Corporation. The FICO assessment rate for the third quarter of 2015, due December 30, 2015, was 0.0060% of insured deposits. The Financing Corporation rate is adjusted quarterly to reflect changes in assessment bases of the DIF.
Depositor Preference. The FDIA provides that, in the event of the “liquidation or other resolution” of an insured depository institution, the claims of depositors of the institution, including the claims of the FDIC as subrogee of insured depositors, and certain claims for administrative expenses of the FDIC as a receiver, will have priority over other general unsecured claims against the institution. If an insured depository institution fails, insured and uninsured depositors, along with the FDIC, will have priority in payment ahead of unsecured, non-deposit creditors, including the parent bank holding company, with respect to any extensions of credit they have made to such insured depository institution.
Federal Home Loan Bank System. The Bank is a member of the FHLBB, which is one of the regional Federal Home Loan Banks (“FHLB”) comprising the FHLB System. Each FHLB provides a central credit facility primarily for its member institutions. The Bank, as a member of the FHLB, is required to acquire and hold shares of capital stock in the FHLBB. While the required percentages of stock ownership are subject to change by the FHLB, the Bank was in compliance with this requirement with an investment in FHLBB stock at December 31, 2015 of $10.0 million. Any advances from a FHLB must be secured by specified types of collateral, and all long-term advances may be obtained only for the purpose of providing funds for residential housing finance.
18
Table of Contents
The FHLBs are required to provide funds for the resolution of insolvent thrifts and to contribute funds for affordable housing programs. These requirements could reduce the amount of earnings that the FHLBs can pay as dividends to their members and could also result in the FHLBs imposing a higher rate of interest on advances to their members. If dividends were reduced, or interest on future FHLB advances increased, or if any developments caused the Bank’s investment in FHLB stock to become impaired, thereby requiring the Bank to write down the value of that investment, the Bank’s net interest income would be affected.
Federal Reserve System. Under FRB regulations, the Bank is required to maintain non-interest-earning reserves against its transaction accounts (primarily NOW and regular checking accounts). Federal Reserve regulations required for 2015 that reserves be maintained against aggregate transaction accounts except for transaction accounts up to $14.5 million, which are exempt. Transaction accounts greater than $14.5 million up to $103.6 million have a reserve requirement of 3%, and those greater than $103.6 million have a reserve requirement of $2.673 million plus 10% of the amount over $103.6 million. These tiered reserve requirements are subject to adjustment annually by the Federal Reserve. As required reserves must be maintained in the form of vault cash or in the form of a deposit with a Federal Reserve Bank, the effect of this reserve requirement is to reduce the Bank’s interest-earning assets. The Bank is in compliance with the foregoing reserve requirements. The balances maintained to meet the reserve requirements imposed by the FRB may be used to satisfy liquidity requirements imposed by the OCC. FHLB system members are also authorized to borrow from the Federal Reserve Discount Window, subject to applicable restrictions.
Prohibitions Against Tying Arrangements. The Bank is subject to prohibitions on certain tying arrangements. A depository institution is generally prohibited, subject to certain exceptions, from extending credit to or offering any other service, or fixing or varying the consideration for such extension of credit or service, on the condition that the customer obtain some additional product or service from the institution or its affiliates or not obtain services of a competitor of the institution.
Regulations Applicable to the Company and the Bank
Financial Privacy Laws. Federal law and certain state laws currently contain client privacy protection provisions. These provisions limit the ability of insured depository institutions and other financial institutions to disclose non-public information about consumers to affiliated companies and non-affiliated third parties. These rules require disclosure of privacy policies to clients and, in some circumstances, allow consumers to prevent disclosure of certain personal information to affiliates or non-affiliated third parties by means of “opt out” or “opt in” authorizations. Pursuant to the Gramm-Leach-Bliley Act and certain state laws companies are required to notify clients of security breaches resulting in unauthorized access to their personal information.
The Bank Secrecy Act. The Bank and the Company are subject to the Bank Secrecy Act, as amended by the Uniting and Strengthening America by Providing Appropriate Tools Required to Intercept and Obstruct Terrorism Act of 2001 (“USA PATRIOT Act”), which gives the federal government powers to address money laundering and terrorist threats through enhanced domestic security measures, expanded surveillance powers, and mandatory transaction reporting obligations. By way of example, the Bank Secrecy Act imposes an affirmative obligation on the Bank to report currency transactions that exceed certain thresholds and to report other transactions determined to be suspicious.
Title III of the USA PATRIOT Act takes measures intended to encourage information sharing among financial institutions, bank regulatory agencies and law enforcement bodies. Further, certain provisions of Title III impose affirmative obligations on a broad range of financial institutions, including banks, thrifts, brokers, dealers, credit unions, money transfer agents and parties registered under the Commodity Exchange Act. Among other requirements, the USA PATRIOT Act imposes the following obligations on financial institutions:
| • | financial institutions must establish anti-money laundering programs that include, at minimum: (i) internal policies, procedures, and controls, (ii) specific designation of an anti-money laundering |
19
Table of Contents
| compliance officer, (iii) ongoing employee training programs, and (iv) an independent audit function to test the anti-money laundering program; |
| • | financial institutions must establish and meet minimum standards for customer due diligence, identification and verification; |
| • | financial institutions that establish, maintain, administer, or manage private banking accounts or correspondent accounts in the United States for non-United States persons or their representatives (including foreign individuals visiting the United States) must establish appropriate, specific, and, where necessary, enhanced due diligence policies, procedures, and controls designed to detect and report money laundering through those accounts; |
| • | financial institutions are prohibited from establishing, maintaining, administering or managing correspondent accounts for foreign shell banks (foreign banks that do not have a physical presence in any country), and are subject to certain recordkeeping obligations with respect to correspondent accounts of foreign banks; and |
| • | bank regulators are directed to consider a bank’s or holding company’s effectiveness in combating money laundering when ruling on Federal Reserve Act and Bank Merger Act applications. |
Office of Foreign Assets Control. The Bank and the Company, like all United States companies and individuals, are prohibited from transacting business with certain individuals and entities named on the Office of Foreign Assets Control’s list of Specially Designated Nationals and Blocked Persons. Failure to comply may result in fines and other penalties. The Office of Foreign Asset Control has issued guidance directed at financial institutions in which it asserted that it may, in its discretion, examine institutions determined to be high-risk or to be lacking in their efforts to comply with these prohibitions.
Transactions with Affiliates. Transactions between the Bank and the Company and its other subsidiaries are subject to various conditions and limitations. See “Regulation of Federal Savings Associations—Transactions with Affiliates” and “Regulation of Federal Savings Associations—Limitation on Capital Distributions.”
Future Legislative and Regulatory Initiatives. Various legislative and regulatory initiatives are introduced by Congress, state legislatures and different financial regulatory agencies. Such initiatives may include proposals to expand or contract the powers of savings and loan holding companies and/or depository institutions. Proposed legislation and regulatory initiatives could change banking statutes and the operating environment of the Company in substantial and unpredictable ways. If enacted, such legislation could increase or decrease the cost of doing business, limit or expand permissible activities or affect the competitive balance among banks, savings associations, credit unions, and other financial institutions. The Company cannot predict whether any such legislation will be enacted, and, if enacted, the effect that it or any implementing regulations would have on the financial condition or results of operations of the Company. A change in statutes, regulations or regulatory policies applicable to the Company or any of its subsidiaries could have a material effect on the business of the Company.
AVAILABLE INFORMATION
We maintain a website at www.lakesunapeebankgroup.com. The website contains information about us and our operations. Through a link to the SEC Filings section of our website, copies of each of our filings with the SEC, including our Annual Report on Form 10-K, Quarterly Reports Form 10-Q and Current Reports on Form 8-K and all amendments to those reports, can be viewed and downloaded free of charge as soon as reasonably practicable after the reports and amendments are electronically filed with or furnished to the SEC. In addition, copies of any document we file with or furnish to the SEC may be obtained from the SEC at its public reference room at 100 F Street, N.E., Washington, D.C. 20549. You may obtain information on the operation of the SEC’s public reference room by calling the SEC at 1-800-SEC-0330. You can request copies of these
20
Table of Contents
documents, upon payment of a duplicating fee, by writing to the SEC at its principal office at 100 F Street, N.E., Washington, D.C. 20549. The SEC maintains a website at www.sec.gov that contains reports, proxy and information statements, and other information regarding issuers that file or furnish such information electronically with the SEC. The information found on our website or the website of the SEC is not incorporated by reference into this Annual Report on Form 10-K or any other report we file with or furnish to the SEC.
| Item 1A. | Risk Factors |
There are risks inherent to our business. The material risks and uncertainties that management believes affect us are described below. The risks and uncertainties described below are not the only ones facing us. Additional risks and uncertainties that management is not aware of or focused on or that management currently deems immaterial may also impair our business operations. This report is qualified in its entirety by these risk factors. If any of the following risks actually occur, our financial condition and results of operations could be materially and adversely affected.
Changes in interest rates and spreads could have an impact on earnings and results of operations.
Our consolidated earnings and financial condition are dependent to a large degree upon net interest income, which is the difference between interest earned from loans and investments and interest paid on deposits and borrowings. The narrowing of interest rate spreads could adversely affect our earnings and financial condition. We cannot predict with certainty or control changes in interest rates. Regional and local economic conditions and the policies of regulatory authorities, including monetary policies of the Federal Reserve, affect interest income and interest expense. While we have ongoing policies and procedures designed to manage the risks associated with changes in market interest rates, changes in interest rates still may have an adverse effect on our profitability. For example, high interest rates could affect the amount of loans that we can originate, because higher rates could cause customers to apply for fewer mortgages, or cause depositors to shift funds from accounts that have a comparatively lower cost to accounts with a higher cost, or experience customer attrition due to competitor pricing. If the cost of interest-bearing deposits increases at a rate greater than the yields on interest-earning assets increase, net interest income will be negatively affected. Changes in the asset and liability mix may also affect net interest income. Similarly, lower interest rates cause higher yielding assets to prepay and floating or adjustable rate assets to reset to lower rates. If we are not able to reduce our funding costs sufficiently, due to either competitive factors or the maturity schedule of existing liabilities, then our net interest margin will decline.
We operate in a highly-regulated environment that is subject to extensive government supervision and regulation, which may interfere with our ability to conduct business and may adversely impact the results of our operations. We are subject to extensive federal and state supervision and regulation that govern nearly all aspects of our operations and can have a material impact on our business. Financial regulatory authorities have significant discretion regarding the supervision, regulation and enforcement of banking laws and regulations.
Financial laws, regulations and policies are subject to amendment by Congress, state legislatures and federal and state regulatory agencies. Changes to statutes, regulations or policies, including changes in the interpretation of regulations or policies, could materially impact our business. These changes could also impose additional costs on us and limit the types of products and services that we may offer our customers. Compliance with laws and regulations can be difficult and costly, and the failure to comply with any law, regulation or policy could result in sanctions by financial regulatory agencies, including civil monetary penalties, private lawsuits, or reputational damage, any of which could adversely affect our business, financial condition, or results of operations. While we have policies and procedures designed to prevent such violations, there can be no assurance that violations will not occur. See the Section titled, “Supervision and Regulation” in ITEM 1. Business.
21
Table of Contents
Since the 2008 global financial crisis, financial institutions have been subject to increased scrutiny from Congress, state legislatures and federal and state financial regulatory agencies. Recent changes to the legal and regulatory framework have significantly altered the laws and regulations under which we operate. These changes may reduce our ability to effectively compete in attracting and retaining customers. The passage and continued implementation of the Dodd-Frank Act, among other laws and regulations, has increased our costs of doing business and resulted in decreased revenues and net income. The Dodd-Frank Act and implementing regulations could also have adverse implications on the financial industry, the competitive environment and our ability to conduct business. Several provisions of the Dodd-Frank Act are subject to further rulemaking, guidance and interpretation by the federal financial regulatory agencies. As a result, we cannot provide assurance that future changes in laws, regulations and policies will not adversely affect our business.
State and federal regulatory agencies periodically conduct examinations of our business, including for compliance with laws and regulations, and our failure to comply with any supervisory actions to which we are or become subject as a result of such examinations may adversely affect our business.
Federal and state regulatory agencies periodically conduct examinations of our business, including our compliance with laws and regulations. If, as a result of an examination, an agency were to determine that the financial, capital resources, asset quality, earnings prospects, management, liquidity, or other aspects of any of our operations had become unsatisfactory, or violates any law or regulation, such agency may take certain remedial or enforcement actions it deems appropriate to correct any deficiency. Remedial or enforcement actions include the power to enjoin “unsafe or unsound” practices, to require affirmative actions to correct any conditions resulting from any violation or practice, to issue an administrative order that can be judicially enforced against a bank, to direct an increase in the bank’s capital, to restrict the bank’s growth, to assess civil monetary penalties against a bank’s officers or directors, and to remove a bank’s officers and directors. In the event that the FDIC concludes that, among other things, our financial conditions cannot be corrected or that there is an imminent risk of loss to our depositors, it may terminate our deposit insurance. The OCC, as the supervisory and regulatory authority for federal savings associations, has similar enforcement powers with respect to our business. The CFPB also has authority to take enforcement actions, including cease-and-desist orders or civil monetary penalties, if it finds that we offer consumer financial products and services in violation of federal consumer financial protection laws.
If we were unable to comply with future regulatory directives, or if we were unable to comply with the terms of any future supervisory requirements to which we may become subject, then we could become subject to a variety of supervisory actions and orders, including cease and desist orders, prompt corrective actions, MOUs, and other regulatory enforcement actions. Such supervisory actions could, among other things, impose greater restrictions on our business, as well as our ability to develop any new business. We could also be required to raise additional capital, or dispose of certain assets and liabilities within a prescribed time period, or both. Failure to implement remedial measures as required by financial regulatory agencies could result in additional orders or penalties from federal and state regulators, which could trigger one or more of the remedial actions described above. The terms of any supervisory action and associated consequences with any failure to comply with any supervisory action could have a material negative effect on our business, operating flexibility and overall financial condition.
A breach of information security, including as a result of cyber-attacks, could disrupt our business and impact our earnings.
We depend upon data processing, communication and information exchange on a variety of computing platforms and networks, and over the internet. In addition, we rely on the services of a variety of vendors to meet our data processing and communication needs. Despite existing safeguards, we cannot be certain that all of our systems are free from vulnerability to attack or other technological difficulties or failures. If information security is breached or difficulties or failures occur, despite the controls we and our third-party vendors have instituted, information can be lost or misappropriated, resulting in financial loss or costs to us, reputational harm or damages to others. Such costs or losses could exceed the amount of insurance coverage, if any, which would adversely affect our earnings.
22
Table of Contents
Changes in local economic conditions may affect our business.
Our current market area is principally located in Cheshire, Grafton, Hillsborough, Merrimack and Sullivan counties in central and western New Hampshire and in Rutland, Windsor and Orange counties in central Vermont. Future growth opportunities depend on the growth and stability of the regional economy and our ability to expand our market area. A downturn in the local economy may limit funds available for deposit and may negatively affect borrowers’ ability to repay their loans on a timely basis, both of which could have an impact on our profitability and business.
Increases to the allowance for loan losses may cause our earnings to decrease.
Our business is subject to periodic fluctuations based on national and local economic conditions. These fluctuations are not predictable, cannot be controlled and may have a material adverse impact on our operations and financial condition. The current economic uncertainty will more than likely affect employment levels and could impact the ability of our borrowers to service their debt. Bank regulatory agencies also periodically review our allowance for loan losses and may require an increase in the provision for loan losses or the recognition of further loan charge-offs, based on judgments different than those of management. In addition, if charge-offs in future periods exceed the allowance for loan losses, we may need, depending on an analysis of the adequacy of the allowance for loan losses, additional provisions to increase the allowance for loan losses. Any increases in the allowance for loan losses will result in a decrease in net income and, possibly, capital, and may have a material adverse effect on our financial condition and results of operations. We may suffer higher loan losses as a result of these factors and the resulting impact on our borrowers.
Strong competition within our industry and market area could limit our growth and profitability.
We face substantial competition in all phases of our operations from a variety of different competitors. Future growth and success will depend on the ability to compete effectively in this highly competitive environment. We compete for deposits, loans and other financial services with a variety of banks, thrifts, credit unions and other financial institutions as well as other entities which provide financial services. Some of the financial institutions and financial services organizations with which we compete are not subject to the same degree of regulation. Many competitors have been in business for many years, have established customer bases, are larger, and have substantially higher lending limits. The financial services industry is also likely to become more competitive as further technological advances enable more companies to provide financial services. These technological advances may diminish the importance of depository institutions and other financial intermediaries in the transfer of funds between parties.
We rely on dividends from the Bank for most of our revenue.
We receive substantially all of our revenue from dividends from the Bank. These dividends are the principal source of funds to pay dividends on our common stock and interest and principal on our debt. Federal laws and regulations limit the amount of dividends that the Bank may pay to us. Also, our right to participate in a distribution of assets upon a subsidiary’s liquidation or reorganization is subject to the prior claims of the subsidiary’s creditors. In the event the Bank is unable to pay dividends to us, we may not be able to service debt, pay obligations or pay dividends on our preferred or common stock. The inability to receive dividends from the Bank could have a material adverse effect on our business, financial condition and results of operations.
Our controls and procedures may fail or be circumvented, which may result in a material adverse effect on our business.
Management regularly reviews and updates our internal controls, disclosure controls and procedures, and corporate governance policies and procedures. Any system of controls, however well designed and operated, is based in part on certain assumptions and can provide only reasonable, not absolute, assurances that the objectives
23
Table of Contents
of the system are met. Any failure or circumvention of the controls and procedures or failure to comply with regulations related to controls and procedures could have a material adverse effect on our business, results of operations and financial condition.
We depend on our executive officers and key personnel to continue the implementation of our long-term business strategy and could be harmed by the loss of their services.
Management believes that our continued growth and future success will depend in large part upon the skills of the management team. The competition for qualified personnel in the financial services industry is intense, and the loss of key personnel or an inability to continue to attract, retain and motivate key personnel could adversely affect the business. We cannot assure you that we will be able to retain existing key personnel or attract additional qualified personnel. The loss of the services of one or more of our executive officers and key personnel could impair our ability to continue to develop our business strategy.
The risks presented by acquisitions could adversely affect our financial condition and result of operations.
Our business strategy has included and may continue to include growth through acquisition from time to time. Any future acquisitions will be accompanied by the risks commonly encountered in acquisitions. These risks may include, among other things: our ability to realize anticipated cost savings; the difficulty of integrating operations and personnel; the loss of key employees; the potential disruption of our or the acquired company’s ongoing business in such a way that could result in decreased revenues; the inability of our management to maximize our financial and strategic position; the inability to maintain uniform standards, controls, procedures and policies; and the impairment of relationships with the acquired company’s employees and customers as a result of changes in ownership and management.
New lines of business or new products and services may subject us to additional risks. A failure to successfully manage these risks may have a material adverse effect on our business.
From time to time, we may implement new lines of business, offer new products and services within existing lines of business or shift focus on our asset mix. There are substantial risks and uncertainties associated with these efforts, particularly in instances where the markets are not fully developed. In developing and marketing new lines of business and/or new products and services and/or shifting focus of asset mix, we may invest significant time and resources. Initial timetables for the introduction and development of new lines of business and/or new products or services may not be achieved and price and profitability targets may not prove feasible. External factors, such as compliance with regulations, competitive alternatives, and shifting market preferences, may also impact the successful implementation of a new line of business or a new product or service. Furthermore, any new line of business and/or new product or service could have a significant impact on the effectiveness of our system of internal controls. Failure to successfully manage these risks in the development and implementation of new lines of business or new products or services could have a material adverse effect on our business, results of operations and financial condition.
Provisions of our certificate of incorporation and bylaws, as well as Delaware law and certain banking laws, could delay or prevent a takeover of us by a third party.
Provisions of our amended and restated certificate of incorporation and amended and restated bylaws, the corporate law of the State of Delaware and state and federal banking laws, including regulatory approval requirements, could delay, defer or prevent a third party from acquiring us, despite the possible benefit to our stockholders, or otherwise adversely affect the market price of our common stock. These provisions include: supermajority voting requirements for certain business combinations; the election of directors to staggered terms of three years; and advance notice requirements for nominations for election to our Board of Directors and for proposing matters that stockholders may act on at stockholder meetings. In addition, we are subject to Delaware law, which among other things prohibits us from engaging in a business combination with any interested
24
Table of Contents
stockholder for a period of three years from the date the person became an interested stockholder unless certain conditions are met. These provisions may discourage potential takeover attempts, discouraging bids for our common stock at a premium over market price or adversely affect the market price of, and the voting and other rights of the holders of our common stock. These provisions could also discourage proxy contests and make it more difficult for you and other stockholders to elect directors other than candidates nominated by our Board of Directors.
| Item 1B. | Unresolved Staff Comments |
None.
| Item 2. | Properties |
At December 31, 2015, we had 40 offices, including 25 located in New Hampshire where the Company’s headquarters are in Newport, New Hampshire, and 15 located in Vermont. Of the 40 offices, 14 are leased facilities and 26 are bank-owned facilities. Offices include those used for banking and wealth management segments or a combination of both. There are 24 offices used for bank operations only, 3 offices used for wealth management operations only and 3 offices used for both. Lease expiration dates range from 1 to 10 years with renewal options of 1 to 10 years. We believe that our existing facilities are sufficient for our current needs.
| Item 3. | Legal Proceedings |
There is no material litigation pending in which we or any of our subsidiaries is a party or of which any of their property is subject, other than ordinary routine litigation incidental to our business.
| Item 4. | Mine Safety Disclosures |
Not applicable.
25
Table of Contents
| Item 5. | Market for the Registrant’s Common Stock, Related Stockholder Matters and Issuer Purchases of Equity Securities |
Market Information
Our common stock is listed on The NASDAQ Global Market under the symbol “LSBG.” The following table shows the high and low sales prices as reported on The NASDAQ Global Market during the periods indicated, as well as any dividends declared on our common stock. As of March 4, 2016, we had approximately 1,060 stockholders of record. The number of stockholders does not reflect the number of persons or entities who held their stock in nominee or street name through various brokerage firms.
| Period |
High | Low | Dividend Declared |
|||||||||||
| 2015 |
First Quarter |
$ | 15.70 | $ | 14.93 | $ | 0.13 | |||||||
| Second Quarter |
$ | 16.35 | $ | 14.10 | $ | 0.13 | ||||||||
| Third Quarter |
$ | 15.26 | $ | 14.25 | $ | 0.14 | ||||||||
| Fourth Quarter |
$ | 14.86 | $ | 13.50 | $ | 0.14 | ||||||||
| 2014 |
First Quarter |
$ | 15.39 | $ | 14.15 | $ | 0.13 | |||||||
| Second Quarter |
$ | 15.41 | $ | 14.05 | $ | 0.13 | ||||||||
| Third Quarter |
$ | 15.58 | $ | 14.50 | $ | 0.13 | ||||||||
| Fourth Quarter |
$ | 16.12 | $ | 14.24 | $ | 0.13 | ||||||||
Dividends
We have historically paid regular quarterly cash dividends on our common stock, and the Board of Directors presently intends to continue the payment of regular quarterly cash dividends, subject to the need for those funds for debt service and other purposes. However, because substantially all of the funds available for the payment of dividends are derived from the Bank, future dividends will depend upon the earnings of the Bank, its financial condition and its need for funds. Furthermore, there are a number of federal banking policies and regulations that restrict our ability to pay dividends. In particular, because the Bank is a depository institution whose deposits are insured by the FDIC, it may not pay dividends or distribute capital assets if it is in default on any assessment due the FDIC. Also, the Bank, as a federal savings bank, is subject to OCC regulations which impose certain minimum capital requirements that would affect the amount of cash available for distribution to us. In addition, under Federal Reserve policy, we are required to maintain adequate regulatory capital, are expected to serve as a source of financial strength to the Bank and to commit resources to support the Bank. These policies and regulations may have the effect of reducing the amount of dividends that we can declare to our stockholders.
Recent Sales of Unregistered Securities
There were no sales by us of unregistered securities during the year ended December 31, 2015.
Purchases of Equity Securities by the Issuer and Affiliated Purchasers
On June 12, 2007, the Board of Directors reactivated a previously adopted but incomplete stock repurchase program to repurchase up to 253,776 shares of common stock. At December 31, 2015, 148,088 shares remained to be repurchased under the plan. During 2015, no shares were repurchased pursuant to the program.
26
Table of Contents
Performance Graph
The following graph compares our total cumulative stockholder return by an investor who invested $100.00 on December 31, 2010 to December 31, 2015 to the total return by an investor who invested $100.00 in each of the S&P 500 index and the SNL U.S. Thrift NASDAQ index for the same period.
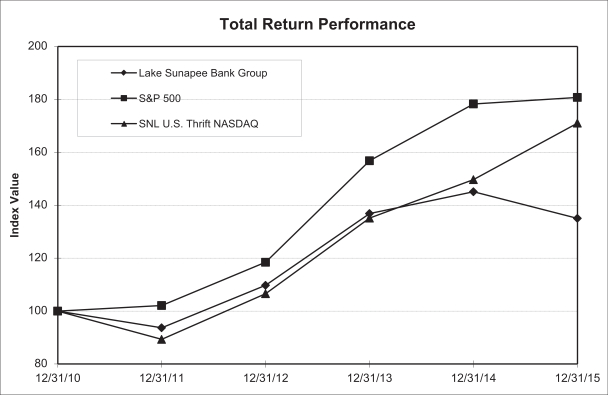
| Period Ending December 31, | ||||||||||||||||||||||||
| Index |
2010 | 2011 | 2012 | 2013 | 2014 | 2015 | ||||||||||||||||||
| Lake Sunapee Bank Group |
100.00 | 93.69 | 109.73 | 136.86 | 145.10 | 135.05 | ||||||||||||||||||
| S&P 500 |
100.00 | 102.11 | 118.45 | 156.82 | 178.28 | 180.75 | ||||||||||||||||||
| SNL U.S. Thrift NASDAQ |
100.00 | 89.30 | 106.57 | 135.13 | 149.66 | 171.02 | ||||||||||||||||||
27
Table of Contents
| Item 6. | Selected Financial Data |
The summary information presented below at or for each of the years presented is derived in part from our Consolidated Financial Statements. The following information is only a summary, and you should read it in conjunction with our Consolidated Financial Statements and notes beginning on page F-1.
| At December 31, | ||||||||||||||||||||
| 2015 | 2014 | 2013 | 2012 | 2011 | ||||||||||||||||
| (in thousands) | ||||||||||||||||||||
| Selected Financial Condition Data: |
||||||||||||||||||||
| Total assets |
$ | 1,518,521 | $ | 1,503,786 | $ | 1,423,870 | $ | 1,270,477 | $ | 1,041,819 | ||||||||||
| Loans receivable, net |
1,217,461 | 1,206,845 | 1,134,110 | 902,236 | 714,952 | |||||||||||||||
| Originated loans |
1,099,975 | 1,058,789 | 953,212 | 820,463 | 722,434 | |||||||||||||||
| Deposits |
1,157,352 | 1,152,714 | 1,088,092 | 949,341 | 803,023 | |||||||||||||||
| Federal Home Loan Bank advances |
150,000 | 140,992 | 121,734 | 142,730 | 80,967 | |||||||||||||||
| Subordinated debentures |
37,620 | 37,620 | 20,620 | 20,620 | 20,620 | |||||||||||||||
| Total stockholders’ equity |
136,708 | 139,836 | 149,257 | 129,494 | 108,660 | |||||||||||||||
| Allowance for loan losses (excluding overdraft protection) |
8,889 | 9,249 | 9,733 | 9,909 | 9,113 | |||||||||||||||
| Allowance for loan losses for originated loans |
8,591 | 9,249 | 9,733 | 9,909 | 9,113 | |||||||||||||||
| Non-performing loans |
6,026 | 7,327 | 9,303 | 17,001 | 16,616 | |||||||||||||||
| For the years ended December 31, | ||||||||||||||||||||
| 2015 | 2014 | 2013 | 2012 | 2011 | ||||||||||||||||
| (in thousands, except per share data) | ||||||||||||||||||||
| Selected Operating Data: |
||||||||||||||||||||
| Total interest and dividend income |
$ | 48,133 | $ | 48,728 | $ | 40,276 | $ | 36,421 | $ | 37,188 | ||||||||||
| Total interest expense |
6,869 | 6,799 | 6,497 | 7,399 | 8,689 | |||||||||||||||
|
|
|
|
|
|
|
|
|
|
|
|||||||||||
| Net interest and dividend income |
41,264 | 41,929 | 33,779 | 29,022 | 28,499 | |||||||||||||||
| Provision for loan losses |
1,056 | 905 | 962 | 2,705 | 1,351 | |||||||||||||||
| Net interest and dividend income after provision for loan losses |
40,208 | 41,024 | 32,817 | 26,317 | 27,148 | |||||||||||||||
| Total noninterest income |
18,624 | 19,226 | 15,728 | 14,551 | 10,458 | |||||||||||||||
| Total noninterest expense |
46,205 | 46,646 | 37,004 | 29,425 | 27,126 | |||||||||||||||
|
|
|
|
|
|
|
|
|
|
|
|||||||||||
| Income before provision for income taxes |
12,627 | 13,604 | 11,541 | 11,443 | 10,480 | |||||||||||||||
| Provision for income taxes |
3,598 | 3,564 | 3,127 | 3,684 | 2,811 | |||||||||||||||
|
|
|
|
|
|
|
|
|
|
|
|||||||||||
| Net income |
$ | 9,029 | $ | 10,040 | $ | 8,414 | $ | 7,759 | $ | 7,669 | ||||||||||
|
|
|
|
|
|
|
|
|
|
|
|||||||||||
| Earnings per common share |
$ | 1.08 | $ | 1.19 | $ | 1.11 | $ | 1.20 | $ | 1.20 | ||||||||||
| Earnings per common share, assuming dilution |
$ | 1.08 | $ | 1.19 | $ | 1.11 | $ | 1.20 | $ | 1.20 | ||||||||||
| Dividends declared per common share |
$ | 0.54 | $ | 0.52 | $ | 0.52 | $ | 0.52 | $ | 0.52 | ||||||||||
28
Table of Contents
| For the years ended December 31, | ||||||||||||||||||||
| 2015 | 2014 | 2013 | 2012 | 2011 | ||||||||||||||||
| Selected financial ratios and other data (1): |
||||||||||||||||||||
| Return on average assets |
0.61 | % | 0.68 | % | 0.66 | % | 0.69 | % | 0.74 | % | ||||||||||
| Return on average common stockholders’ equity |
6.67 | 8.07 | 6.98 | 6.99 | 7.96 | |||||||||||||||
| Average common stockholders’ equity to average assets |
9.14 | 8.44 | 9.51 | 8.13 | 7.27 | |||||||||||||||
| Interest rate spread |
2.94 | 3.03 | 2.94 | 2.81 | 3.01 | |||||||||||||||
| Net interest margin |
2.99 | 3.08 | 2.97 | 2.85 | 3.05 | |||||||||||||||
| Average interest-bearing assets to average interest-earning liabilities |
110.12 | 108.75 | 105.01 | 105.74 | 104.57 | |||||||||||||||
| Total noninterest expense to average assets |
3.12 | 3.17 | 2.90 | 2.63 | 2.61 | |||||||||||||||
| Efficiency ratio (2) |
74.63 | 73.51 | 72.72 | 66.55 | 68.54 | |||||||||||||||
| Dividend payout ratio |
50.00 | 43.70 | 46.85 | 43.33 | 43.33 | |||||||||||||||
| Bank Regulatory Capital Ratios: |
||||||||||||||||||||
| Total risk-based capital |
13.62 | 13.28 | 12.89 | 14.66 | 15.01 | |||||||||||||||
| Tier 1 risk-based capital |
12.74 | 12.33 | 11.83 | 13.47 | 14.35 | |||||||||||||||
| Tier 1 leverage capital |
9.02 | 8.43 | 8.29 | 8.82 | 9.58 | |||||||||||||||
| Common equity Tier 1 |
12.74 | n/a | n/a | n/a | n/a | |||||||||||||||
| Asset Quality Ratios: |
||||||||||||||||||||
| Non-performing loans to total loans |
0.49 | 0.60 | 0.82 | 1.86 | 2.29 | |||||||||||||||
| Non-performing assets to total assets |
0.46 | 0.50 | 0.75 | 1.35 | 1.72 | |||||||||||||||
| Allowance for loan losses for originated loans to total originated loans |
0.78 | 0.87 | 1.02 | 1.22 | 1.26 | |||||||||||||||
| Non-performing loans to total allowance |
67.79 | 79.22 | 95.58 | 171.57 | 182.33 | |||||||||||||||
| Number of: |
||||||||||||||||||||
| Banking offices |
40 | 42 | 44 | 30 | 30 | |||||||||||||||
| Full-time equivalent employees |
346 | 351 | 360 | 278 | 234 | |||||||||||||||
| (1) | Asset Quality Ratios and Regulatory Capital Ratios are end of period ratios |
| (2) | The efficiency ratio represents the ratio of operating expenses less intangible amortization divided by the sum of net interest and dividend income and non-interest income. |
| Item 7. | Management’s Discussion and Analysis of Financial Condition and Results of Operations |
Highlights and Overview
Our profitability is derived from the Bank. The Bank’s earnings are primarily generated from the difference between the yield on its loans and investments and the cost of its deposit accounts and borrowings. Loan origination fees, retail-banking service fees, and gains on security and loan transactions supplement these core earnings. The following information should be considered in connection with our results for the fiscal year ended December 31, 2015:
| • | Net income was $9.0 million, or $1.08 per diluted common share. |
| • | Common Equity Tier I capital remained strong at 9.41%. |
| • | Return on average common stockholders’ equity of 6.67% and return on average assets of 0.61%. |
| • | Book value per common share increased 2.19% to $16.32 as of December 31, 2015. |
| • | Loans increased $10.0 million, or 0.83%, to $1.2 billion as of December 31, 2015. |
| • | Loans totaling $354.2 million were originated. |
| • | Our loan servicing portfolio increased $34.3 million to $445.9 million. |
29
Table of Contents
| • | Net loan charge-offs were $1.4 million, or 0.11% of average loans, for the twelve months ended December 31, 2015. |
| • | As a percentage of total loans, nonperforming loans were 0.49%. |
| • | Net interest margin was 2.99%. |
| • | Noninterest expense was $46.2 million, a decrease of $441 thousand compared to the same period in 2014. |
The following discussion is intended to assist in understanding our financial condition and results of operations. This discussion should be read in conjunction with our Consolidated Financial Statements and accompanying notes located elsewhere in this report.
Critical Accounting Policies
Our consolidated financial statements are prepared in accordance with generally accepted accounting principles (“GAAP”) and practices within the banking industry. Application of these principles requires management to make estimates, assumptions, and judgments that affect the amounts reported in the financial statements and accompanying notes. These estimates, assumptions, and judgments are based on information available as of the date of the financial statements; accordingly, as this information changes, the financial statements could reflect different estimates, assumptions, and judgments. Actual results could differ from those estimates.
Critical accounting estimates are necessary in the application of certain accounting policies and procedures, and are particularly susceptible to significant change. Critical accounting policies are defined as those that are reflective of significant judgments and uncertainties, and could potentially result in materially different results under different assumptions and conditions. For additional information on our critical accounting policies, please refer to the information contained in Note 1 of our Consolidated Financial Statements located elsewhere in this report.
Operating Segments
Our operations are managed along two reportable segments that represent our core businesses: Banking and Wealth Management. The Banking segment provides a wide array of lending and depository-related products and services to individuals, businesses and municipal enterprises. The Banking segment also provides commercial insurance and consumer products, including life, health, auto and homeowner insurance, through McCrillis & Eldredge and brokerage services through Lake Sunapee Financial Services Corporation. The Wealth Management segment provides trust and investment services through Charter Holding and Charter Trust. A summary of the financial results for each of our segments is included in Note 24—Operating Segments in the Notes to our Consolidated Financial Statements located elsewhere within this report.
30
Table of Contents
Average Balance Sheet and Analysis of Net Interest and Dividend Income
The following table presents, for the years indicated, the total dollar amount of interest income from interest-earning assets and the resultant yields as well as the interest paid on interest-bearing liabilities and the resultant costs:
| Years ended December 31, | 2015 | 2014 | 2013 | |||||||||||||||||||||||||||||||||
| Average Balance (1) |
Interest | Yield/ Cost |
Average Balance (1) |
Interest | Yield/ Cost |
Average Balance (1) |
Interest | Yield/ Cost |
||||||||||||||||||||||||||||
| (Dollars in thousands) | ||||||||||||||||||||||||||||||||||||
| Assets: |
||||||||||||||||||||||||||||||||||||
| Interest-earning assets: |
||||||||||||||||||||||||||||||||||||
| Loans (2) |
$ | 1,220,865 | $ | 46,227 | 3.79 | % | $ | 1,201,839 | $ | 46,647 | 3.88 | % | $ | 956,796 | $ | 38,034 | 3.98 | % | ||||||||||||||||||
| Investment securities and other |
158,173 | 1,906 | 1.21 | % | 161,233 | 2,081 | 1.29 | % | 182,358 | 2,242 | 1.23 | % | ||||||||||||||||||||||||
|
|
|
|
|
|
|
|
|
|
|
|
|
|||||||||||||||||||||||||
| Total interest-earning assets |
1,379,038 | 48,133 | 3.49 | % | 1,363,072 | 48,728 | 3.57 | % | 1,139,154 | 40,276 | 3.54 | % | ||||||||||||||||||||||||
|
|
|
|
|
|
|
|
|
|
|
|
|
|||||||||||||||||||||||||
| Noninterest-earning assets: |
||||||||||||||||||||||||||||||||||||
| Cash |
13,385 | 11,928 | 21,350 | |||||||||||||||||||||||||||||||||
| Other noninterest-earning assets (3) |
88,229 | 98,434 | 106,722 | |||||||||||||||||||||||||||||||||
|
|
|
|
|
|
|
|||||||||||||||||||||||||||||||
| Total noninterest-earning assets |
101,614 | 110,362 | 128,072 | |||||||||||||||||||||||||||||||||
|
|
|
|
|
|
|
|||||||||||||||||||||||||||||||
| Total |
$ | 1,480,652 | $ | 1,473,434 | $ | 1,267,226 | ||||||||||||||||||||||||||||||
|
|
|
|
|
|
|
|||||||||||||||||||||||||||||||
| Liabilities and Stockholders’ Equity: |
||||||||||||||||||||||||||||||||||||
| Interest-bearing liabilities: |
||||||||||||||||||||||||||||||||||||
| Savings, NOW and MMAs |
$ | 698,039 | $ | 970 | 0.14 | % | $ | 690,720 | $ | 829 | 0.12 | % | $ | 579,126 | $ | 386 | 0.07 | % | ||||||||||||||||||
| Time deposits |
362,142 | 2,943 | 0.81 | % | 366,200 | 3,635 | 0.99 | % | 338,920 | 3,669 | 1.08 | % | ||||||||||||||||||||||||
| Repurchase agreements |
15,871 | 71 | 0.45 | % | 20,005 | 63 | 0.31 | % | 20,050 | 52 | 0.25 | % | ||||||||||||||||||||||||
| Capital securities and other borrowed funds |
176,218 | 2,885 | 1.64 | % | 176,506 | 2,272 | 1.29 | % | 146,663 | 2,390 | 1.63 | % | ||||||||||||||||||||||||
|
|
|
|
|
|
|
|
|
|
|
|
|
|||||||||||||||||||||||||
| Total interest-bearing liabilities |
1,252,270 | 6,869 | 0.55 | % | 1,253,431 | 6,799 | 0.54 | % | 1,084,759 | 6,497 | 0.60 | % | ||||||||||||||||||||||||
|
|
|
|
|
|
|
|
|
|
|
|
|
|||||||||||||||||||||||||
| Noninterest-bearing liabilities: |
||||||||||||||||||||||||||||||||||||
| Demand deposits |
52,979 | 49,228 | 26,647 | |||||||||||||||||||||||||||||||||
| Other |
32,734 | 23,436 | 12,313 | |||||||||||||||||||||||||||||||||
|
|
|
|
|
|
|
|||||||||||||||||||||||||||||||
| Total noninterest-bearing liabilities |
85,713 | 72,664 | 38,960 | |||||||||||||||||||||||||||||||||
|
|
|
|
|
|
|
|||||||||||||||||||||||||||||||
| Stockholders’ equity |
142,669 | 147,339 | 143,507 | |||||||||||||||||||||||||||||||||
|
|
|
|
|
|
|
|||||||||||||||||||||||||||||||
| Total |
$ | 1,480,652 | $ | 1,473,434 | $ | 1,267,226 | ||||||||||||||||||||||||||||||
|
|
|
|
|
|
|
|||||||||||||||||||||||||||||||
| Net interest income/Net interest rate spread |
$ | 41,264 | 2.94 | % | $ | 41,929 | 3.03 | % | $ | 33,779 | 2.94 | % | ||||||||||||||||||||||||
|
|
|
|
|
|
|
|
|
|
|
|
|
|||||||||||||||||||||||||
| Net interest margin |
2.99 | % | 3.08 | % | 2.97 | % | ||||||||||||||||||||||||||||||
|
|
|
|
|
|
|
|||||||||||||||||||||||||||||||
| Percentage of interest-earning assets to interest-bearing liabilities |
110.12 | % | 108.75 | % | 105.01 | % | ||||||||||||||||||||||||||||||
|
|
|
|
|
|
|
|||||||||||||||||||||||||||||||
| (1) | Monthly average balances have been used for all periods. |
| (2) | Loans include 90-day delinquent loans which have been placed on a non-accruing status. Management does not believe that including the 90-day delinquent loans in loans caused any material difference in the information presented. |
| (3) | Other noninterest-earning assets include non-earning assets and OREO. |
31
Table of Contents
The following table sets forth, for the years indicated, a summary of the changes in interest earned and interest paid resulting from changes in volume and rates. The net change attributable to changes in both volume and rate, which cannot be segregated, has been allocated proportionately to the change due to volume and the change due to rate.
| Year ended December 31, 2015 vs. 2014 due to |
||||||||||||
| Volume | Rate | Total | ||||||||||
| (Dollars in thousands) | ||||||||||||
| Interest income on loans |
$ | 731 | $ | (1,151 | ) | $ | (420 | ) | ||||
| Interest income on investments |
(39 | ) | (136 | ) | (175 | ) | ||||||
|
|
|
|
|
|
|
|||||||
| Total interest income |
692 | (1,287 | ) | (595 | ) | |||||||
|
|
|
|
|
|
|
|||||||
| Interest expense on savings, NOW and MMAs |
94 | 47 | 141 | |||||||||
| Interest expense on time deposits |
(17 | ) | (675 | ) | (692 | ) | ||||||
| Interest expense on repurchase agreements |
(30 | ) | 38 | 8 | ||||||||
| Interest expense on capital securities and other borrowings |
(2 | ) | 615 | 613 | ||||||||
|
|
|
|
|
|
|
|||||||
| Total interest expense |
45 | 25 | 70 | |||||||||
|
|
|
|
|
|
|
|||||||
| Net interest income |
$ | 647 | $ | (1,312 | ) | $ | (665 | ) | ||||
|
|
|
|
|
|
|
|||||||
| Year ended December 31, 2014 vs. 2013 due to |
||||||||||||
| Volume | Rate | Total | ||||||||||
| (Dollars in thousands) | ||||||||||||
| Interest income on loans |
$ | 9,575 | $ | (962 | ) | $ | 8,613 | |||||
| Interest income on investments |
(268 | ) | 107 | (161 | ) | |||||||
|
|
|
|
|
|
|
|||||||
| Total interest income |
9,307 | (855 | ) | 8,452 | ||||||||
|
|
|
|
|
|
|
|||||||
| Interest expense on savings, NOW and MMAs |
413 | 30 | 443 | |||||||||
| Interest expense on time deposits |
— | (34 | ) | (34 | ) | |||||||
| Interest expense on repurchase agreements |
(1 | ) | 13 | 12 | ||||||||
| Interest expense on capital securities and other borrowings |
233 | (352 | ) | (119 | ) | |||||||
|
|
|
|
|
|
|
|||||||
| Total interest expense |
645 | (343 | ) | 302 | ||||||||
|
|
|
|
|
|
|
|||||||
| Net interest income |
$ | 8,662 | $ | (512 | ) | $ | 8,150 | |||||
|
|
|
|
|
|
|
|||||||
The following table sets forth the average yield on loans and investments, the average interest rate paid on deposits and borrowings, the interest rate spread and the net interest rate margin:
| For the Years Ended December 31, | ||||||||||||||||||||
| 2015 | 2014 | 2013 | 2012 | 2011 | ||||||||||||||||
| Yield on loans |
3.79 | % | 3.88 | % | 3.98 | % | 4.07 | % | 4.42 | % | ||||||||||
| Yield on investment securities |
1.21 | % | 1.29 | % | 1.23 | % | 1.78 | % | 2.54 | % | ||||||||||
| Combined yield on loans and investments |
3.49 | % | 3.57 | % | 3.54 | % | 3.58 | % | 3.98 | % | ||||||||||
| Cost of deposits, including repurchase agreements |
0.37 | % | 0.42 | % | 0.44 | % | 0.55 | % | 0.75 | % | ||||||||||
| Cost of capital securities and other borrowed funds |
1.64 | % | 1.29 | % | 1.63 | % | 1.97 | % | 2.40 | % | ||||||||||
| Combined cost of deposits and borrowings |
0.55 | % | 0.54 | % | 0.60 | % | 0.77 | % | 0.97 | % | ||||||||||
| Interest rate spread |
2.94 | % | 3.03 | % | 2.94 | % | 2.81 | % | 3.01 | % | ||||||||||
| Net interest margin |
2.99 | % | 3.08 | % | 2.97 | % | 2.85 | % | 3.05 | % | ||||||||||
32
Table of Contents
Comparison of Financial Condition at December 31, 2015 and December 31, 2014
Total assets increased $14.7 million, or 0.98%, to $1.5 billion at December 31, 2015 from $1.5 billion at December 31, 2014. Cash and cash equivalents decreased $8.6 million to $42.6 million at December 31, 2015 from $51.1 million at December 31, 2014.
Total net loans receivable excluding loans held-for-sale increased $10.6 million, or 0.88%, to $1.2 billion at December 31, 2015, compared to $1.2 billion at December 31, 2014. Our conventional real estate loan portfolio decreased $3.0 million, or 0.47%, to $642.7 million at December 31, 2015 from $645.7 million at December 31, 2014. The outstanding balances on home equity loans and lines of credit increased $3.1 million to $72.3 million over the same period. Construction loans decreased $1.5 million, or 4.19%, to $34.9 million. Commercial real estate loans increased $10.3 million, or 3.27%, over the same period to $323.3 million. Consumer loans decreased $2.7 million, or 29.09%, to $6.5 million, and commercial and municipal loans increased $3.9 million, or 2.85%, to $142.5 million. Sold loans serviced by us, not including participations, totaled $445.9 million at December 31, 2015, an increase of $34.3 million, or 8.33%, compared to $411.6 million at December 31, 2014. Sold loans are loans originated by us and sold to the secondary market with the Company retaining the majority of servicing of these loans. We expect to continue to sell conventional real estate loans into the secondary market, retaining the servicing, in order to manage interest rate risk and control growth. Typically, we hold adjustable-rate loans in portfolio. At December 31, 2015, adjustable-rate mortgages comprised approximately 60.67% of our real estate mortgage loan portfolio, which is consistent with prior years. Impaired loans and non-performing assets were 0.91% of total assets and 1.26% of total loans originated at December 31, 2015, compared to 1.09% and 1.54%, respectively, at December 31, 2014.
The fair value of investment securities available-for-sale increased $4.5 million, or 3.89%, to $120.2 million at December 31, 2015, from $115.7 million at December 31, 2014. We realized $347 thousand in the gains on the sales and calls of securities during 2015, compared to $950 thousand in gains on the sales and calls of securities recorded during 2014. At December 31, 2015, our investment portfolio had a net unrealized holding loss of $1.3 million, compared to a net unrealized holding loss of $565 thousand at December 31, 2014. The investments in our investment portfolio that are temporarily impaired as of December 31, 2015, consist primarily of bonds issued by the Treasury, U.S. government sponsored enterprises and agencies, mortgage-backed securities, municipal bonds and equity securities. The unrealized losses on debt securities are primarily attributable to changes in market interest rates and current market inefficiencies. The Company has the ability and intent to hold debt securities until maturity, and therefore, no declines are deemed to be other-than-temporary. The unrealized losses on equity securities have occurred for less than 12 months and the Company does not believe the losses relate to credit quality of the issuers. The Company has the ability and intent to hold these investments until a recovery of cost basis.
OREO and property acquired in settlement of loans was $904 thousand at December 31, 2015, representing four properties located in New Hampshire and one property located in Vermont, compared to $251 thousand at December 31, 2014 representing one property located in New Hampshire and one property located in Vermont. During 2015, we acquired eight properties and sold five properties recognizing net losses on sales of OREO of $25 thousand on proceeds of $457 thousand.
Goodwill remained consistent at $44.6 million at December 31, 2015 and December 31, 2014. An independent third-party analysis of goodwill indicated no impairment at December 31, 2015.
Intangible assets decreased $1.5 million to $7.8 million at December 31, 2015, compared to $9.3 million at December 31, 2014. Intangible assets include core deposit intangibles of $4.6 million and customer list intangibles of $3.3 million. We amortized $989 thousand of core deposit intangibles during 2015 utilizing the sum-of-the-years-digits method over 12 years, on average. We amortized $521 thousand of customer list intangibles during 2015 utilizing the sum-of-the-years-digits method over 15 years. An independent third-party analysis of core deposit intangibles indicated no impairment at December 31, 2015.
33
Table of Contents
Total deposits increased $4.6 million, or 0.40%, to $1.2 billion at December 31, 2015 from $1.2 billion at December 31, 2014. Total brokered deposits of $50.8 million represent 4.39% of total deposits.
Advances from the FHLBB increased $9.0 million, or 6.39%, to $150.0 million from $141.0 million at December 31, 2014. The weighted average interest rate for the outstanding FHLBB advances was 0.84% at December 31, 2015 compared to 0.90% at December 31, 2014. At December 31, 2015, the Company had $48.8 million of stand-by letters of credit issued by FHLB to secure customer deposits compared to $44.2 million at December 31, 2014.
Securities sold under agreements to repurchase increased $1.2 million, or 7.17%, to $18.0 million at December 31, 2015, from $16.8 million at December 31, 2014.
Comparison of Operating Results for Years Ended December 31, 2015 and 2014
General
We earned $9.0 million, or $1.08 per common share, assuming dilution, for the year ended December 31, 2015, compared to $10.0 million, or $1.19 per common share, assuming dilution, for the year ended December 31, 2014.
Net Interest and Dividend Income
Net interest and dividend income for the year ended December 31, 2015 decreased $665 thousand, or 1.59%, to $41.3 million. The decrease was a combination of an increase of $648 thousand due to volume and a decrease of $1.3 million related to rate adjustments. Total interest and dividend income decreased $595 thousand, or 1.22%, to $48.1 million, and the yield on interest-earning assets decreased to 3.49% for the year ended December 31, 2015 from 3.57% for the same period in 2014. Interest and fees on loans decreased $420 thousand, or 0.90%, to $46.2 million in 2015, due to an increase in average balances of $19.0 million offset by a decrease in the average yield on loans to 3.79% from 3.88%.
Interest on taxable investments decreased $130 thousand, or 9.54%, to $1.2 million in 2015 compared to $1.4 million in 2014. Interest on tax-exempt investments decreased $157 thousand, or 32.11%, to $332 thousand in 2015 compared to $489 thousand in 2014. Dividends increased $110 thousand, or 66.67% to $275 thousand in 2015 compared to $165 thousand in 2014. Interest on other investments increased $2 thousand to $67 thousand, or 3.08% compared to $65 thousand in 2014. The yield on our investment portfolio decreased to 1.21% for the year ended December 31, 2015 compared to 1.29% for the same period in 2014.
Total interest expense increased $70 thousand, or 1.03%, to $6.9 million for the year ended December 31, 2015. The increase was primarily driven by a decrease of $1.2 million in average interest-bearing liabilities offset in part by an increase in the combined cost of funds on deposits and borrowings to 0.55% for the year ended December 31, 2015 from 0.54% for the year ended December 31, 2014. For the year ended December 31, 2015, interest on deposits decreased $551 thousand, or 12.34%, to $3.9 million as average interest-bearing deposits decreased $3.3 million and the cost of deposits decreased to 0.37% from 0.42% compared to the same period in 2014. Interest on FHLBB advances and other borrowed money decreased $399 thousand, or 28.16%, for the year ended December 31, 2015, to $1.0 million compared to the same period in 2014 as the average FHLBB advances outstanding rate decreased in 2015 compared to 2014 and average balances outstanding decreased. Interest on debentures increased $1.0 million, or 118.36%, for the year ended December 31, 2015 representing the addition of $947 thousand of interest expense on the subordinated debenture issued in October 2014.
For the year ended December 31, 2015, our combined cost of funds increased to 0.55% as compared to 0.54% for 2014, due primarily to the downward repricing of maturing advances combined with increases higher pricing of subordinated debentures issued in October 2014.
34
Table of Contents
Our interest rate spread, which represents the difference between the weighted average yield on interest-earning assets and the weighted average cost of interest-bearing liabilities, decreased to 2.94% in 2015 from 3.03% in 2014. Our net interest margin, representing net interest income as a percentage of average interest-earning assets, decreased to 2.99% during 2015, from 3.08% during 2014.
For additional information relating to our net interest and dividend income, please review the section entitled “Average Balance Sheet and Analysis of Net Interest and Dividend Income” above.
Allowance and Provision for Loan Losses
We maintain an allowance for loan losses to absorb losses inherent in the loan portfolio. Adjustments to the allowance for loan losses are charged to income through the provision for loan losses. We test the adequacy of the allowance for loan losses at least quarterly by preparing an analysis applying loss factors to outstanding loans by type. This analysis stratifies the loan portfolio by loan type and assigns a loss factor to each type based on an assessment of the risk associated with each type. In determining the loss factors, we consider historical losses and market conditions. Loss factors may be adjusted for qualitative factors that, in management’s judgment, affect the collectibility of the portfolio.
The allowance for loan losses incorporates the results of measuring impairment for specifically identified non-homogeneous problem loans in accordance with the Financial Accounting Standards Board (“FASB”) Accounting Standards Codification (“ASC”) 310-10-35, “Receivables-Overall Subsequent-Measurement.” In accordance with ASC 310-10-35, the specific allowance reduces the carrying amount of the impaired loans to their estimated fair value. A loan is recognized as impaired when it is probable that principal and/or interest are not collectible in accordance with the contractual terms of the loan. Measurement of impairment can be based on the present value of expected cash flows discounted at the loan’s effective interest rate, the market price of the loan, or the fair value of the collateral if the loan is collateral dependent. Measurement of impairment does not apply to large groups of smaller balance homogeneous loans such as most residential mortgage, home equity, or installment loans that are collectively evaluated for impairment. Please refer to Note 4 to our Consolidated Financial Statements located elsewhere in this report for information regarding impaired loans.
Our commercial loan officers review the financial condition of commercial loan customers on a regular basis and perform visual inspections of facilities and inventories. We also have loan review, internal audit, and compliance programs with results reported directly to the Audit Committee of the Board of Directors.
The allowance for loan losses (not including allowance for losses from the overdraft program described below) at December 31, 2015, was $8.9 million compared to $9.2 million at December 31, 2014. At $8.9 million, the allowance for loan losses represents 0.73% of total gross loans held, down from 0.76% at December 31, 2014. Total impaired loans and non-performing assets at December 31, 2015, were $13.9 million, representing 155.68% of the allowance for loan losses. Modestly improving economic and market conditions coupled with internal risk rating changes offset by portfolio growth resulted in us adding $1.0 million to the allowance for loan and lease losses during 2015 compared to $850 million in 2014. The provisions during the year ended December 31, 2015, have been offset by loan charge-offs of $2.1 million and recoveries of $706 thousand during the same period. The provisions made in 2015 reflect loan loss experience in 2015 and changes in economic conditions that decreased the risk of loss inherent in the loan portfolio. Management anticipates making additional provisions in 2016 as needed to maintain the allowance at an adequate level.
In addition to the allowance for loan losses, there is an allowance for losses from the fee for service overdraft program. We seek to maintain an allowance equal to 100% of the aggregate balance of negative balance accounts that have remained negative for 30 days or more. Negative balance accounts are charged off when the balance has remained negative for 60 consecutive days. At December 31, 2015, the overdraft allowance was $16 thousand compared to $20 thousand at year-end 2014. Provisions for overdraft losses were $56 thousand during the 12-month period ended December 31, 2015, compared to $55 thousand for the same period during
35
Table of Contents
2014. Ongoing provisions are anticipated as overdraft charge-offs continue and we adhere to our policy to maintain an allowance for overdraft losses equal to 100% of the aggregate negative balance of accounts remaining negative for 30 days or more.
Loan charge-offs (excluding the overdraft program) were $2.1 million during the year ended December 31, 2015 compared to $1.7 million for the same period in 2014. Recoveries (excluding the overdraft program) were $706 thousand during the year ended December 31, 2015, compared to $389 thousand for the same period in 2014. This activity resulted in net charge-offs of $1.4 million for the year ended December 31, 2015, compared to $1.3 million for the same period in 2014. One-to-four family residential mortgages, commercial real estate mortgages, commercial loans, and consumer loans accounted for 37%, 58%, 3%, and 2%, respectively, of the amounts charged off during the year ended December 31, 2015.
The following is a summary of activity in the allowance for loan losses account (excluding the overdraft program) for the years ended December 31:
| (Dollars in thousands) | 2015 | 2014 | 2013 | 2012 | 2011 | |||||||||||||||
| Balance, beginning of year |
$ | 9,249 | $ | 9,733 | $ | 9,909 | $ | 9,113 | $ | 9,841 | ||||||||||
|
|
|
|
|
|
|
|
|
|
|
|||||||||||
| Charge-offs: |
||||||||||||||||||||
| Residential real estate |
766 | 681 | 851 | 1,239 | 1,187 | |||||||||||||||
| Commercial real estate |
1,189 | 533 | 593 | 474 | 548 | |||||||||||||||
| Construction |
— | — | — | 138 | 303 | |||||||||||||||
| Consumer loans |
51 | 64 | 30 | 20 | 38 | |||||||||||||||
| Commercial loans |
60 | 445 | 302 | 438 | 147 | |||||||||||||||
|
|
|
|
|
|
|
|
|
|
|
|||||||||||
| Total charged-off loans |
2,066 | 1,723 | 1,776 | 2,309 | 2,223 | |||||||||||||||
|
|
|
|
|
|
|
|
|
|
|
|||||||||||
| Recoveries: |
||||||||||||||||||||
| Residential real estate |
117 | 314 | 268 | 167 | 132 | |||||||||||||||
| Commercial real estate |
476 | 1 | 284 | 56 | — | |||||||||||||||
| Construction |
— | — | — | 68 | — | |||||||||||||||
| Consumer loans |
17 | 17 | 6 | 22 | 2 | |||||||||||||||
| Commercial loans |
96 | 57 | 154 | 142 | 61 | |||||||||||||||
|
|
|
|
|
|
|
|
|
|
|
|||||||||||
| Total recoveries |
706 | 389 | 712 | 455 | 195 | |||||||||||||||
|
|
|
|
|
|
|
|
|
|
|
|||||||||||
| Net charge-offs |
1,360 | 1,334 | 1,064 | 1,854 | 2,028 | |||||||||||||||
| Provision for loan loss charged to income |
1,000 | 850 | 888 | 2,650 | 1,300 | |||||||||||||||
|
|
|
|
|
|
|
|
|
|
|
|||||||||||
| Balance, end of year |
$ | 8,889 | $ | 9,249 | $ | 9,733 | $ | 9,909 | $ | 9,113 | ||||||||||
|
|
|
|
|
|
|
|
|
|
|
|||||||||||
| Ratio of net charge-offs to average loans |
0.11 | % | 0.11 | % | 0.11 | % | 0.23 | % | 0.28 | % | ||||||||||
|
|
|
|
|
|
|
|
|
|
|
|||||||||||
The following is a summary of activity in the allowance for overdraft privilege account for the years ended December 31:
| (Dollars in thousands) | 2015 | 2014 | 2013 | 2012 | 2011 | |||||||||||||||
| Beginning balance |
$ | 20 | $ | 24 | $ | 14 | $ | 18 | $ | 23 | ||||||||||
|
|
|
|
|
|
|
|
|
|
|
|||||||||||
| Overdraft charge-offs |
172 | 155 | 200 | 200 | 226 | |||||||||||||||
| Overdraft recoveries |
112 | 96 | 136 | 141 | 170 | |||||||||||||||
|
|
|
|
|
|
|
|
|
|
|
|||||||||||
| Net overdraft losses |
60 | 59 | 64 | 59 | 56 | |||||||||||||||
|
|
|
|
|
|
|
|
|
|
|
|||||||||||
| Provisions for overdrafts |
56 | 55 | 74 | 55 | 51 | |||||||||||||||
|
|
|
|
|
|
|
|
|
|
|
|||||||||||
| Ending balance |
$ | 16 | $ | 20 | $ | 24 | $ | 14 | $ | 18 | ||||||||||
|
|
|
|
|
|
|
|
|
|
|
|||||||||||
36
Table of Contents
The following table sets forth the allocation of the loan loss allowance (excluding overdraft allowances), the percentage of allowance to the total allowance and the percentage of loans in each category to total loans at December 31:
| (Dollars in thousands) | 2015 | 2014 | 2013 | |||||||||||||||||||||||||||||||||
| Real estate loans - |
||||||||||||||||||||||||||||||||||||
| Residential, 1-4 family and home equity loans |
$ | 3,997 | 45 | % | 59 | % | $ | 4,713 | 51 | % | 58 | % | $ | 5,314 | 55 | % | 59 | % | ||||||||||||||||||
| Commercial |
2,751 | 31 | % | 26 | % | 2,707 | 29 | % | 26 | % | 2,027 | 21 | % | 25 | % | |||||||||||||||||||||
| Construction |
182 | 2 | % | 3 | % | 991 | 11 | % | 3 | % | 353 | 3 | % | 3 | % | |||||||||||||||||||||
| Collateral and consumer loans |
52 | 1 | % | — | 66 | — | 1 | % | 51 | 1 | % | 1 | % | |||||||||||||||||||||||
| Commercial and municipal loans |
1,192 | 13 | % | 12 | % | 635 | 7 | % | 12 | % | 1,551 | 16 | % | 12 | % | |||||||||||||||||||||
| Impaired loans |
355 | 4 | % | — | 67 | 1 | % | — | 197 | 2 | % | — | ||||||||||||||||||||||||
| Acquired loans (discounts to related credit quality) |
298 | 3 | % | — | — | — | — | — | — | — | ||||||||||||||||||||||||||
| Unallocated |
62 | 1 | % | — | 70 | 1 | % | — | 240 | 2 | % | — | ||||||||||||||||||||||||
|
|
|
|
|
|
|
|
|
|
|
|
|
|
|
|
|
|
|
|||||||||||||||||||
| Allowance |
$ | 8,889 | 100 | % | 100 | % | $ | 9,249 | 100 | % | 100 | % | $ | 9,733 | 100 | % | 100 | % | ||||||||||||||||||
|
|
|
|
|
|
|
|
|
|
|
|
|
|
|
|
|
|
|
|||||||||||||||||||
| Allowance for originated loans as a percentage of total originated loans |
0.78 | % | 0.87 | % | 1.02 | % | ||||||||||||||||||||||||||||||
|
|
|
|
|
|
|
|||||||||||||||||||||||||||||||
| Non-performing as a percentage of allowance |
67.79 | % | 79.22 | % | 95.58 | % | ||||||||||||||||||||||||||||||
|
|
|
|
|
|
|
|||||||||||||||||||||||||||||||
| 2012 | 2011 | |||||||||||||||||||||||
| Real estate loans - |
||||||||||||||||||||||||
| Residential, 1-4 family and home equity loans |
$ | 4,774 | 48 | % | 66 | % | $ | 4,870 | 53 | % | 66 | % | ||||||||||||
| Commercial |
3,378 | 34 | % | 20 | % | 2,813 | 31 | % | 19 | % | ||||||||||||||
| Construction |
208 | 2 | % | 2 | % | 222 | 2 | % | 2 | % | ||||||||||||||
| Collateral and consumer loans |
44 | 1 | % | 1 | % | 40 | 1 | % | 1 | % | ||||||||||||||
| Commercial and municipal loans |
918 | 9 | % | 11 | % | 721 | 8 | % | 12 | % | ||||||||||||||
| Impaired loans |
361 | 4 | % | — | 308 | 3 | % | — | ||||||||||||||||
| Unallocated |
— | — | — | 139 | 2 | % | — | |||||||||||||||||
| 226 | 2 | % | — | |||||||||||||||||||||
|
|
|
|
|
|
|
|
|
|
|
|
|
|||||||||||||
| Allowance |
$ | 9,909 | 100 | % | 100 | % | $ | 9,113 | 100 | % | 100 | % | ||||||||||||
|
|
|
|
|
|
|
|
|
|
|
|
|
|||||||||||||
| Allowance for originated loans as a percentage of total originated loans |
1.22 | % | 1.26 | % | ||||||||||||||||||||
|
|
|
|
|
|||||||||||||||||||||
| Non-performing as a percentage of allowance |
171.57 | % | 182.33 | % | ||||||||||||||||||||
|
|
|
|
|
|||||||||||||||||||||
Classified loans include non-performing loans and performing loans that have been adversely classified, net of specific reserves. Total classified loans at carrying value were $19.7 million at December 31, 2015, compared to $28.2 million at December 31, 2014. The decrease comes primarily from a decrease of $3.2 million of the net carrying value of loans identified as impaired at December 31, 2015. Additional information on troubled debt restructurings can be found in Note 4 of our Consolidated Financial Statements. In addition, we had $904 thousand of OREO at December 31, 2015, representing three residential properties and two commercial properties acquired during the year ended December 31, 2015, compared to $251 thousand at December 31, 2014, representing two residential properties. During the year ended December 31, 2015, we sold five properties, one of which was classified as OREO at December 31, 2014, while the other three were acquired during 2015. Losses were incurred in the acquisition and liquidation process and our loss experience suggests it is prudent for us to continue funding provisions to build the allowance for loan losses. While, for the most part, quantifiable loss amounts have not been identified with individual credits, we anticipate more charge-offs as loan issues are resolved due to the inherent risks in providing credit. The impaired loans meet the criteria established under ASC 310-10-35. Twenty-nine loans considered impaired at December 31, 2015 had specific reserves identified and assigned. The twenty-nine loans are secured by real estate, business assets or a combination of both. At December 31, 2015, the allowance included $386 thousand allocated to impaired loans compared to $67 thousand at December 31, 2014.
37
Table of Contents
Loans over 90 days past due were $3.9 million at December 31, 2015, compared to $3.3 million at December 31, 2014. Loans 30 to 89 days past due were $6.0 million at December 31, 2015, compared to $9.6 million at December 31, 2014. The level of loan losses and loan delinquencies, combined with moderately improving economic and commercial and residential real estate market conditions are factors considered in determining the adequacy of the loan loss allowance and assessing the need for additional provisions. We anticipate more charge-offs as loan issues are resolved due to the normal course of credit risk. As a percentage of assets, non-performing loans decreased from 0.49% at December 31, 2014 to 0.40% at December 31, 2015, and as a percentage of total loans, decreased from 0.60% at the end of 2014 to 0.49% at the end of 2015.
Loans classified for regulatory purposes as loss, doubtful, substandard or special mention do not reflect trends or uncertainties which we reasonably expect will materially impact future operating results, liquidity, or capital resources. For the period ended December 31, 2015, all loans about which management possesses information regarding possible borrower credit problems and doubts as to borrowers’ ability to comply with present loan repayment terms or to repay a loan through liquidation of collateral are included in the tables below or discussed herein.
At December 31, 2015, we had 56 loans with net carrying values of $8.4 million considered to be “troubled debt restructurings” as defined in ASC 310-40, “Receivables-Troubled Debt Restructurings by Creditors.” At December 31, 2015, the majority of troubled debt restructurings was performing under contractual terms and are included in impaired loans. Of the 56 loans classified as troubled debt restructured, 13 were 30 days or more past due at December 31, 2015. The balances of these loans were $1.4 million, and the loans have $30 thousand of assigned specific allowance. At December 31, 2014, we had 59 loans with net carrying values of $11.0 million considered to be troubled debt restructurings.
Non-performing loans include loans which are on nonaccrual. Troubled debt restructured loans of $6.9 million are performing within their restructured terms and are accruing interest at December 31, 2015. These accruing troubled debt restructured loans account for the difference of $6.9 million between impaired loans of $13.0 million and non-accrual loans of $6.0 million December 31, 2015.
At December 31, 2015, there were no other loans excluded in the tables below or discussed above where known information about possible credit problems of the borrowers caused management to have doubts as to the ability of the borrowers to comply with present loan repayment terms and which may result in disclosure of such loans in the future.
The following table shows the breakdown of the carrying value of non-performing assets and non-performing assets as a percentage of the total allowance (excluding overdraft allowances) and total assets for the periods indicated:
| (Dollars in thousands) | December 31, 2015 | December 31, 2014 | ||||||||||||||||||||||
| Carrying Value |
Percentage to Total Allowance |
Percentage to Total Assets |
Carrying Value |
Percentage to Total Allowance |
Percentage to Total Assets |
|||||||||||||||||||
| Impaired loans (excluding TDRs) |
$ | 4,581 | 51.54 | % | 0.30 | % | $ | 5,072 | 54.84 | % | 0.34 | % | ||||||||||||
| Trouble debt restructured loans |
8,378 | 94.25 | % | 0.55 | % | 11,046 | 119.43 | % | 0.73 | % | ||||||||||||||
| OREO and chattel |
904 | 10.17 | % | 0.06 | % | 251 | 2.71 | % | 0.02 | % | ||||||||||||||
|
|
|
|
|
|||||||||||||||||||||
| Total impaired loans and non-performing assets |
$ | 13,863 | 155.96 | % | 0.91 | % | $ | 16,369 | 176.98 | % | 1.09 | % | ||||||||||||
|
|
|
|
|
|||||||||||||||||||||
38
Table of Contents
The following table sets forth the breakdown of non-performing assets at December 31:
| (Dollars in thousands) | 2015 | 2014 | 2013 | 2012 | 2011 | |||||||||||||||
| Nonaccrual loans (1) |
$ | 6,026 | $ | 7,327 | $ | 9,303 | $ | 17,001 | $ | 16,616 | ||||||||||
| Real estate and chattel property owned |
904 | 251 | 1,343 | 102 | 1,344 | |||||||||||||||
|
|
|
|
|
|
|
|
|
|
|
|||||||||||
| Total non-performing assets (2) |
$ | 6,930 | $ | 7,578 | $ | 10,646 | $ | 17,103 | $ | 17,960 | ||||||||||
|
|
|
|
|
|
|
|
|
|
|
|||||||||||
| (1) | All loans 90 days or more delinquent are placed on a nonaccrual status. |
| (2) | Amount reflected for December 31, 2012 excludes acquired loans. |
The following table sets forth nonaccrual (1) loans by category at December 31:
| (Dollars in thousands) | 2015 | 2014 | 2013 | 2012 | 2011 | |||||||||||||||
| Real estate loans |
||||||||||||||||||||
| Conventional |
$ | 3,017 | $ | 2,426 | $ | 3,821 | $ | 6,250 | $ | 5,578 | ||||||||||
| Commercial |
2,242 | 3,926 | 4,512 | 9,304 | 8,484 | |||||||||||||||
| Home equity |
183 | 181 | 104 | 158 | — | |||||||||||||||
| Construction |
— | 15 | 230 | 887 | 1,006 | |||||||||||||||
| Consumer loans |
— | — | 15 | — | 8 | |||||||||||||||
| Commercial and municipal loans |
584 | 779 | 621 | 402 | 1,540 | |||||||||||||||
|
|
|
|
|
|
|
|
|
|
|
|||||||||||
| Total (2) |
$ | 6,026 | $ | 7,327 | $ | 9,303 | $ | 17,001 | $ | 16,616 | ||||||||||
|
|
|
|
|
|
|
|
|
|
|
|||||||||||
| (1) | All loans 90 days or more delinquent are placed on a nonaccrual status. |
| (2) | Amount reflected for December 31, 2012 excludes acquired loans. |
We believe the allowance for loan losses is at a level sufficient to cover inherent losses, given the current level of risk in the loan portfolio. At the same time, we recognize that the determination of future loss potential is intrinsically uncertain. Future adjustments to the allowance may be necessary if economic, real estate, deterioration in the credit quality of acquired loans, and other conditions differ substantially from the current operating environment and result in increased levels of non-performing loans and substantial differences between estimated and actual losses. Adjustments to the allowance are charged to income through the provision for loan losses.
Noninterest Income and Expense
Total noninterest income decreased $602 thousand, or 3.13%, to $18.6 million for the year ended December 31, 2015, compared to the same period in 2014 due, in part, to decreases in realized gains on sales of securities for the year end ended December 31, 2015 compared to the same period in 2014 and realized losses on other real estate property owned and disposal of premises and equipment compared to net gains during the same period in 2014. Customer service fees decreased $204 thousand, or 3.39%, compared to the same period in 2014.
Net gain on sales and calls of securities decreased $603 thousand, or 63.47%, compared to 2014. Income from mortgage banking activities increased $428 thousand, or 49.20%, as we sold $92.7 million of 1-4 family conventional mortgage loans into the secondary market during 2015, up $48.3 million from $44.4 million of loans sold during 2014. Net losses on sales of OREO and fixed assets increased $323 thousand during 2015 as we recognized net losses of $142 thousand compared to net gains of $181 thousand for the same period in 2014.
Rental income decreased $24 thousand, or 3.35%, as revenue within this category remained relatively unchanged compared to the same period in 2014. Bank-owned life insurance income decreased $37 thousand or 5.83%, to $598 thousand for the year ended December 31, 2015. Insurance and brokerage service income decreased $24 thousand to $1.5 million for the year ended December 31, 2015, compared to $1.5 million in 2014
39
Table of Contents
representing a decrease in contingent commissions of $37 thousand, or 21.3%, offset in part by an increase of $13 thousand in premium commissions. Income from trust and investment management fees increased $149 thousand, or 1.79%, to $8.5 million compared to $8.3 million in 2014.
Total noninterest expenses decreased $441 thousand, or 0.95%, to $46.2 million for the year ended December 31, 2015, from $46.6 million for the same period in 2014. Salaries and employee benefits decreased $868 thousand, or 3.46%, to $24.2 million for the year ended December 31, 2015, from $25.1 million for the same period in 2014. Gross salaries and benefits paid, which exclude the deferral of expenses associated with the origination of loans, decreased $335 thousand, or 1.25%, to $26.4 million for the year ended December 31, 2015, from $26.7 million for the same period in 2014. Gross salaries decreased $301 thousand, or 1.48%, to $20.1 million for the year ended December 31, 2015, compared $20.4 million for the same period in 2014. While realizing ordinary changes in staffing levels, promotions, and routine salary increases, the Bank experienced a decrease in average full-time equivalents throughout the year as a result of attrition and higher vacancy rates resulting in gross salary savings. Full time equivalents decreased to 346 at December 31, 2015, compared to 351 at December 31, 2014. The decrease in overall benefits costs of $34 thousand related to a $17 thousand decrease in recruitment related expenses, $15 thousand of unemployment expenses and $54 thousand in director related expenses offset by an increase of $67 thousand for health insurance expense. The deferral of expenses associated with the origination of loans increased $533 thousand, or 32.42%, to $2.2 million for the year ended December 31, 2015, from $1.6 million for the same period in 2014. This deferral represents salary and employee benefits expenses associated with origination costs which are recognized over the life of the loan. The decrease is a direct result of the change in the volume of loan originations year over year.
Occupancy and equipment expenses increased $126 thousand, or 2.07%, to $6.2 million for the year ended December 31, 2015, from $6.1 million for the same period in 2014. Advertising and promotion increased $57 thousand, or 6.58%, to $923 thousand for the year ended December 31, 2015, from $866 thousand for the same period in 2014. Depositors’ insurance decreased $68 thousand, or 6.84% to $926 thousand at December 31, 2015, compared to $994 thousand at December 31, 2014, due primarily to a decrease in assessed deposits.
Professional fees increased $111 thousand, or 8.85%, to $1.4 million for the year ended December 31, 2015 from $1.3 million for the same period in 2014. Data processing and outside services fees increased $105 thousand, or 4.28%, to $2.6 million for the year ended December 31, 2015 compared to $2.5 million for the same period in 2014. ATM processing fees decreased $55 thousand, or 6.52%, to $788 thousand for the year ended December 31, 2015, from $843 thousand for the same period in 2014, which is consistent with the impact decreased volume had within customer service fees.
Amortization of intangible assets decreased $178 thousand which is directly related to the amortization methods used which expense additional amortization in the earlier years following an acquisition and decrease over time.
Other expenses increased $360 thousand, or 6.30%, to $6.1 million for the year ended December 31, 2015 from $5.7 million compared to the same period in 2014. Increases included $117 thousand in contributions, including an increase of $67 thousand in state tax-qualified contributions; $133 thousand in ATM and debit card charge-offs related to the increased volume of fraudulent transactions demonstrated throughout the industry; $54 thousand in expenses related to non-earning assets; $64 thousand in additional losses on tax partnerships; and $86 thousand of additional expenses related to the issuance and vesting of additional stock awards, offset in part by a decrease of $74 thousand of insurance related expenses.
Income Taxes
The provision for income taxes for the year ended December 31, 2015, includes a net deferred income tax benefit of $78 thousand, compared to a net deferred income tax expense of $1.2 million for December 31, 2014. These amounts were determined by the asset and liability method in accordance with generally accepted accounting principles for each year.
40
Table of Contents
We have provided deferred income taxes on the difference between the provision for loan losses permitted for income tax purposes and the provision recorded for financial reporting purposes.
Comparison of Financial Condition at December 31, 2014 and December 31, 2013
Total assets increased $79.9 million, or 5.61%, to $1.5 billion at December 31, 2014 from $1.4 billion at December 31, 2013. Cash and cash equivalents increased $17.5 million to $51.1 million at December 31, 2014 from $33.6 million at December 31, 2013.
Total net loans receivable excluding loans held-for-sale increased $72.7 million, or 6.41%, to $1.2 billion at December 31, 2014, compared to $1.1 billion at December 31, 2013. Our conventional real estate loan portfolio increased $43.4 million, or 7.21%, to $645.7 million at December 31, 2014 from $602.3 million at December 31, 2013. The outstanding balances on home equity loans and lines of credit decreased $1.4 million to $69.2 million over the same period. Construction loans increased $6.7 million, or 22.62%, to $36.4 million. Commercial real estate loans increased $25.2 million, or 8.76%, over the same period to $313.0 million. Consumer loans decreased $667 thousand, or 6.79%, to $9.2 million, and commercial and municipal loans decreased $1.5 million, or 1.07%, to $138.6 million. Sold loans serviced by us, not including participations, totaled $411.6 million at December 31, 2014, a decrease of $5.7 million, or 1.36%, compared to $417.3 million at December 31, 2013. Sold loans are loans originated by us and sold to the secondary market with the Company retaining the majority of servicing of these loans. We expect to continue to sell conventional real estate loans into the secondary market, retaining the servicing, in order to manage interest rate risk and control growth. Typically, we hold adjustable-rate loans in portfolio. At December 31, 2014, adjustable-rate mortgages comprised approximately 59.96% of our real estate mortgage loan portfolio, which is consistent with prior years. Impaired loans and non-performing assets were 1.09% of total assets and 1.54% of total loans originated at December 31, 2014, compared to 1.58% and 2.36%, respectively, at December 31, 2013.
The fair value of investment securities available-for-sale decreased $9.6 million, or 7.62%, to $115.7 million at December 31, 2014, from $125.2 million at December 31, 2013. We realized $950 thousand in the gains on the sales and calls of securities during 2014, compared to $964 thousand in gains on the sales and calls of securities recorded during 2013. At December 31, 2014, our investment portfolio had a net unrealized holding loss of $565 thousand, compared to a net unrealized holding loss of $2.0 million at December 31, 2013. The investments in our investment portfolio that are temporarily impaired as of December 31, 2014, consist primarily of bonds issued by the Treasury, U.S. government sponsored enterprises and agencies, mortgage-backed securities, and municipal bonds. The unrealized losses on debt securities are primarily attributable to changes in market interest rates and current market inefficiencies. As management has the ability and intent to hold debt securities until maturity and equity securities for the foreseeable future, no declines are deemed to be other than temporary.
OREO and property acquired in settlement of loans was $251 thousand at December 31, 2014, representing one property located in New Hampshire and one property located in Vermont, compared to $1.3 million at December 31, 2013 representing two properties located in New Hampshire and seven properties located in Vermont. During 2014, we acquired six properties and sold eleven properties recognizing net gains on sales of OREO of $185 thousand on proceeds of $2.1 million.
Goodwill decreased $56 thousand, or 0.13%, to $44.6 million at December 31, 2014, compared to $44.6 million at December 31, 2013. The change in goodwill represents net post-closing adjustments of $56 thousand related to the 2013 acquisitions of CFC and Charter Holding. An independent third-party analysis of goodwill indicated no impairment at December 31, 2014.
Intangible assets decreased $1.7 million to $9.3 million at December 31, 2014, compared to $11.0 million at December 31, 2013. Intangible assets include core deposit intangibles of $5.6 million and customer list intangibles of $3.7 million. We amortized $1.1 million of core deposit intangibles during 2014 utilizing the sum-
41
Table of Contents
of-the-years-digits method over 12 years, on average. We amortized $560 thousand of customer list intangibles during 2014 utilizing the sum-of-the-years-digits method over 15 years. An independent third-party analysis of core deposit intangibles indicated no impairment at December 31, 2014.
Total deposits increased $64.6 million, or 5.94%, to $1.2 billion at December 31, 2014 from $1.1 billion at December 31, 2013. Total brokered deposits of $51.1 million represent 4.43% of total deposits.
Advances from the FHLBB increased $19.3 million, or 15.82%, to $141.0 million from $121.7 million at December 31, 2013. The weighted average interest rate for the outstanding FHLBB advances was 0.90% at December 31, 2014 compared to 1.15% at December 31, 2013. At December 31, 2014, the Company had $44.2 million of stand-by letters of credit issued by FHLB to secure customer deposits.
Securities sold under agreements to repurchase decreased $11.1 million, or 39.91%, to $16.8 million at December 31, 2014, from $27.9 million at December 31, 2013.
Comparison of Operating Results for Years Ended December 31, 2014 and 2013
General
We earned $10.0 million, or $1.19 per common share, assuming dilution, for the year ended December 31, 2014, compared to $8.4 million, or $1.11 per common share, assuming dilution, for the year ended December 31, 2013.
Net Interest and Dividend Income
Net interest and dividend income for the year ended December 31, 2014 increased $8.2 million, or 24.13%, to $41.9 million. The increase was a combination of an increase of $8.0 million due to volume and an increase of $202 thousand related to rate adjustments. Total interest and dividend income increased $8.5 million, or 20.98%, to $48.7 million, and the yield on interest-earning assets increased to 3.57% for the year ended December 31, 2014 from 3.54% for the same period in 2013. Interest and fees on loans increased $8.6 million, or 22.65%, to $46.6 million in 2014, due to an increase in average balances of $245.0 million offset by a decrease in the average yield on loans to 3.88% from 3.98%.
Interest on taxable investments increased $29 thousand, or 2.18%, to $1.4 million in 2014 compared to $1.3 million in 2013. Dividends increased $113 thousand to $165 thousand. Interest on other investments decreased $303 thousand to $554 thousand. The yield on our investment portfolio increased to 1.29% for the year ended December 31, 2014 compared to 1.23% for the same period in 2013.
Total interest expense increased $302 thousand, or 4.65%, to $6.8 million for the year ended December 31, 2014. The increase was primarily driven by an increase of $168.7 million in average interest-bearing liabilities offset in part by a decrease in the combined cost of funds on deposits and borrowings to 0.54% for the year ended December 31, 2014 from 0.60% for the year ended December 31, 2014. For the year ended December 31, 2014, interest on deposits increased $409 thousand, or 10.09%, to $4.5 million as average interest-bearing deposits increased $138.9 million and the cost of deposits decreased to 0.42% from 0.44% compared to the same period in 2013. Interest on FHLBB advances and other borrowed money decreased $168 thousand, or 10.60%, for the year ended December 31, 2014, to $1.4 million compared to the same period in 2013 as the average FHLBB advances outstanding rate decreased in 2014 compared to 2013 while average balances outstanding increased. Interest on debentures increased $49 thousand, or 6.08%, for the year ended December 31, 2014 representing a decrease of $162 thousand of Trust II & Trust III interest expense offset by the addition of $211 thousand of interest expense on the Subordinated Debenture issued in October 2014.
For the year ended December 31, 2014, our combined cost of funds decreased to 0.54% as compared to 0.60% for 2013, due primarily to the downward repricing of maturing advances combined with increases in lower-costing checking accounts.
42
Table of Contents
Our interest rate spread, which represents the difference between the weighted average yield on interest-earning assets and the weighted average cost of interest-bearing liabilities, increased to 3.03% in 2014 from 2.94% in 2013. Our net interest margin, representing net interest income as a percentage of average interest-earning assets, increased to 3.08% during 2014, from 2.97% during 2013.
For additional information relating to our net interest and dividend income, please review the section entitled “Average Balance Sheet and Analysis of Net Interest and Dividend Income” above.
Allowance and Provision for Loan Losses
The allowance for loan losses (not including allowance for losses from the overdraft program described below) at December 31, 2014, was $9.2 million compared to $9.7 million at December 31, 2013. At $9.2 million, the allowance for loan losses represents 0.76% of total loans held, down from 0.85% at December 31, 2013. Total impaired loans and non-performing assets at December 31, 2014, were $16.4 million, representing 176.98% of the allowance for loan losses. Modestly improving economic and market conditions coupled with internal risk rating changes offset by portfolio growth resulted in us adding $850 thousand to the allowance for loan and lease losses during 2014 compared to $888 million in 2013. The provisions during the year ended December 31, 2014, have been offset by loan charge-offs of $1.7 million and recoveries of $389 thousand during the same period. Modestly improving economic conditions and decreases in delinquencies and charge-offs, resulted in our decision to decrease the provision for loan losses during 2014 compared to 2013. The provisions made in 2014 reflect loan loss experience in 2014 and changes in economic conditions that decreased the risk of loss inherent in the loan portfolio.
In addition to the allowance for loan losses, there is an allowance for losses from the fee for service overdraft program. We seek to maintain an allowance equal to 100% of the aggregate balance of negative balance accounts that have remained negative for 30 days or more. Negative balance accounts are charged off when the balance has remained negative for 60 consecutive days. At December 31, 2014, the overdraft allowance was $20 thousand compared to $24 thousand at year-end 2013. Provisions for overdraft losses were $55 thousand during the 12-month period ended December 31, 2014, compared to $74 thousand for the same period during 2013. Ongoing provisions are anticipated as overdraft charge-offs continue and we adhere to our policy to maintain an allowance for overdraft losses equal to 100% of the aggregate negative balance of accounts remaining negative for 30 days or more.
Loan charge-offs (excluding the overdraft program) were $1.7 million during the year ended December 31, 2014 compared to $1.8 million for the same period in 2013. Recoveries (excluding the overdraft program) were $389 thousand during the year ended December 31, 2014, compared to $712 thousand for the same period in 2013. This activity resulted in net charge-offs of $1.3 million for the year ended December 31, 2014, compared to $1.1 million for the same period in 2013. One-to-four family residential mortgages, commercial real estate mortgages, commercial loans, and consumer loans accounted for 40%, 31%, 25%, and 4%, respectively, of the amounts charged off during the year ended December 31, 2014.
Classified loans include non-performing loans and performing loans that have been adversely classified, net of specific reserves. Total classified loans at carrying value were $28.2 million at December 31, 2014, compared to $30.3 million at December 31, 2013. The decrease comes primarily from a decrease of $5.0 million of the net carrying value of loans identified as impaired at December 31, 2014. Additional information on troubled debt restructurings can be found in Note 4 of our Consolidated Financial Statements. In addition, we had $251 thousand of OREO at December 31, 2014, representing one residential property and one commercial property acquired during the year ended December 31, 2014, compared to $1.3 million at December 31, 2013, representing six residential properties and one commercial property acquired during the year ended December 31, 2013. During the year ended December 31, 2014, we sold eleven properties, seven of which were classified as OREO at December 31, 2013, while the other four were acquired during 2014. Losses were incurred in the acquisition and liquidation process and our loss experience suggests it is prudent for us to continue funding
43
Table of Contents
provisions to build the allowance for loan losses. While, for the most part, quantifiable loss amounts have not been identified with individual credits, we anticipate more charge-offs as loan issues are resolved due to the inherent risks in providing credit. The impaired loans meet the criteria established under ASC 310-10-35. Six loans considered impaired at December 31, 2014 had specific reserves identified and assigned. The six loans are secured by real estate, business assets or a combination of both. At December 31, 2014, the allowance included $67 thousand allocated to impaired loans compared to $197 thousand at December 31, 2013.
Loans over 90 days past due were $3.3 million at December 31, 2014, compared to $3.9 million at December 31, 2013. Loans 30 to 89 days past due were $9.6 million at December 31, 2014, compared to $5.7 million at December 31, 2013. The level of loan losses and loan delinquencies, combined with moderately improving economic and commercial and residential real estate market conditions are factors considered in determining the adequacy of the loan loss allowance and assessing the need for additional provisions. We anticipate more charge-offs as loan issues are resolved due to the normal course of credit risk. As a percentage of assets, non-performing loans decreased from 0.65% at December 31, 2013 to 0.49% at December 31, 2014, and as a percentage of total originated loans, decreased from 0.98% at the end of 2013 to 0.69% at the end of 2014.
Loans classified for regulatory purposes as loss, doubtful, substandard or special mention do not reflect trends or uncertainties which we reasonably expect will materially impact future operating results, liquidity, or capital resources. For the period ended December 31, 2014, all loans about which management possesses information regarding possible borrower credit problems and doubts as to borrowers’ ability to comply with present loan repayment terms or to repay a loan through liquidation of collateral are included in the tables below or discussed herein.
At December 31, 2014, we had 59 loans with net carrying values of $11.0 million considered to be “troubled debt restructurings” as defined in ASC 310-40, “Receivables-Troubled Debt Restructurings by Creditors.” At December 31, 2014, the majority of troubled debt restructurings were performing under contractual terms and are included in impaired loans. Of the 59 loans classified as troubled debt restructured, 15 were 30 days or more past due at December 31, 2014. The balances of these loans were $2.3 million, and the loans have no assigned specific allowance. Forty-three loans were considered troubled debt restructured at both December 31, 2014 and 2013. These 43 loans include 10 commercial real estate loans totaling $4.6 million, 25 residential loans totaling $3.4 million, 3 construction loans totaling $1.1 million and 5 commercial loans for $430 thousand. These loans, independently measured for impairment, carry a combined specific allowance of $53 thousand. At December 31, 2013, we had 57 loans with net carrying values of $12.5 million considered to be troubled debt restructurings.
Non-performing loans include loans which are on nonaccrual. Troubled debt restructured loans of $8.8 million are performing within their restructured terms and are accruing interest at December 31, 2014. These accruing troubled debt restructured loans account for the difference of $8.8 million between impaired loans of $16.1 million and non-accrual loans of $7.3 million December 31, 2014.
At December 31, 2014, there were no other loans excluded in the tables below or discussed above where known information about possible credit problems of the borrowers caused management to have doubts as to the ability of the borrowers to comply with present loan repayment terms and which may result in disclosure of such loans in the future.
44
Table of Contents
The following table shows the breakdown of the carrying value of non-performing assets and non-performing assets (dollars in thousands) as a percentage of the total allowance and total assets for the periods indicated:
| (Dollars in thousands) | December 31, 2014 | December 31, 2013 | ||||||||||||||||||||||
| Carrying Value |
Percentage to Total Allowance |
Percentage to Total Assets |
Carrying Value |
Percentage to Total Allowance |
Percentage to Total Assets |
|||||||||||||||||||
| Impaired loans (excluding TDRs) |
$ | 5,072 | 54.72 | % | 0.34 | % | $ | 8,701 | 89.40 | % | 0.61 | % | ||||||||||||
| Trouble debt restructured loans |
11,046 | 119.17 | % | 0.73 | % | 12,454 | 127.96 | % | 0.88 | % | ||||||||||||||
| OREO and chattel |
251 | 2.71 | % | 0.02 | % | 1,343 | 13.80 | % | 0.09 | % | ||||||||||||||
|
|
|
|
|
|||||||||||||||||||||
| Total impaired loans and non-performing assets |
$ | 16,369 | 176.60 | % | 1.09 | % | $ | 22,498 | 231.16 | % | 1.58 | % | ||||||||||||
|
|
|
|
|
|||||||||||||||||||||
Noninterest Income and Expense
Total noninterest income increased $3.5 million, or 22.34%, to $19.2 million for the year ended December 31, 2014, compared to the same period in 2013 due, in part, to twelve months of revenue in 2014 from the Charter Trust Company and Central Financial Corp. compared to partial year inclusion in 2013. Customer service fees increased $818 thousand, or 15.61%, primarily driven by the acquired operations.
Net gain on sales and calls of securities decreased $14 thousand, or 14.52%, compared to 2013. Income from mortgage banking activities decreased $1.4 million, or 61.57%, as we sold $44.4 million of 1-4 family conventional mortgage loans into the secondary market during 2014, down $61.2 million from $105.6 million of loans sold during 2013. In addition to decreased volume, the rate valuation, and subsequent gains added to the reduction in overall revenue for the category. We also retained a higher portion of originated mortgage loans within our portfolio during 2014, resulting in balance sheet increases related to net originated loans of $43.4 million and $25.2 million of conventional real estate loans and commercial real estate loans, respectively. Net gains on sales of OREO and fixed assets increased $176 thousand during 2014 as we recognized net gains of $181 thousand compared to $5 thousand for the same period in 2013.
The remeasurement gain recorded for the year ended December 31, 2013, was a gain of $1.4 million related to the write-up of the Bank’s investment in Charter Holding at acquisition date from $4.8 million to the market value of $6.2 million. The market value was based on the purchase price paid to MVSB to assume its 50% ownership of Charter Holding on September 4, 2013. Income from equity interest in Charter Holding decreased $294 thousand to no recognition for the year ended December 31, 2014, from $294 thousand for the same period in 2013. As 100% owner of Charter Holding, effective September 4, 2013, the Bank no longer records income from equity interest in Charter Holding as all activity is now included in consolidated earnings as trust income and related expense categories. Trust income was $8.3 million for the year ended December 31, 2014, an increase of $5.6 million compared to $2.7 million reported for the period of September 4, 2013 through December 31, 2013, representing the period of the Bank’s 100% ownership of Charter Holding.
Rental income decreased $29 thousand as revenue within this category remained relatively unchanged. Bank-owned life insurance income increased $9 thousand to $635 thousand. Insurance and brokerage service income increased $9 thousand to $1.5 million for the year ended December 31, 2014, compared to $1.5 million in 2013 representing an increase in premium commissions of $74 thousand, or 6.04%, offset in part by a decrease of $65 thousand in contingency commission.
Total noninterest expenses increased $9.7 million, or 26.10%, to $46.6 million for the year ended December 31, 2014, from $37.0 million for the same period in 2013. This increase includes an increase of $4.8 million of noninterest expenses from the wealth management operating segment. Please see Note 24 to the Consolidated Financial Statements for more information on operating segments. Salaries and employee benefits
45
Table of Contents
increased $5.8 million, or 30.36%, to $25.0 million for the year ended December 31, 2014, from $19.2 million for the same period in 2013. Gross salaries and benefits paid, which exclude the deferral of expenses associated with the origination of loans, increased $5.5 million, or 25.99%, to $26.7 million for the year ended December 31, 2014, from $21.2 million for the same period in 2013. Gross salaries increased $4.3 million, or 26.71%, to $20.4 million for the year ended December 31, 2014, compared $16.1 million for the same period in 2013. In addition to ordinary staffing additions, promotions, and salary increases, salary expenses related to Charter Trust operations accounted for approximately $2.4 million, or 57.56% of the increase, while staffing related to a full year of RNB salaries amounted to approximately $659 thousand. Average full time equivalents decreased to 351 at December 31, 2014, compared to 360 at December 31, 2013; this change reflects the impact of additional staff from CFC and Charter Holding. Benefits costs increased $1.2 million including $616 thousand of increases related to Charter Trust. The increase in overall benefits costs includes increases of $243 thousand related to retirement costs and $433 thousand in health insurance costs. The deferral of expenses associated with the origination of loans decreased $327 thousand, or 16.60%, to $1.6 million for the year ended December 31, 2014, from $2.0 million for the same period in 2013. This deferral represents salary and employee benefits expenses associated with origination costs which are recognized over the life of the loan. The decrease is a direct result of the change in the volume of loan originations year over year.
Occupancy and equipment expenses increased $1.3 million, or 27.70%, to $6.1 million for the year ended December 31, 2014, from $4.8 million for the same period in 2013, due primarily to a higher number of locations during 2014 including increases of $1.0 million for former RNB locations and $196 thousand for Charter Holding locations. Advertising and promotion increased $207 thousand, or 31.41%, to $866 thousand for the year ended December 31, 2014, from $659 thousand for the same period in 2013, due primarily to increases in promotions related to the eight additional banking locations and Charter Holding increases of $85 thousand. Depositors’ insurance increased $218 thousand to $994 thousand at December 31, 2014, compared to $776 thousand at December 31, 2013, due primarily to an increase in assessed deposits.
Professional fees decreased $11 thousand, or 0.87%, to $1.3 million for the year ended December 31, 2014 from $1.3 million for the same period in 2013. Data processing and outside services fees increased $863 thousand, or 54.21%, to $2.5 million for the year ended December 31, 2014 compared to $1.6 million for the same period in 2013 due to increases in correspondent services, core processing, online banking, and collection expenses. ATM processing fees increased $213 thousand, or 33.81%, to $843 thousand for the year ended December 31, 2014, from $630 thousand for the same period in 2013, which is consistent with the impact increased volume had within customer service fees.
Merger related expenses decreased $1.6 million with no expenses recorded for the year ended December 31, 2014, compared to $1.6 million for the same period in 2013. These expenses reflect the non-deductible legal and investment banking expenses recorded by us related to the acquisition of CFC that are not qualified tax deductions.
Amortization of intangible assets increased $688 thousand with the additions of the customer list intangible from Charter Holding and the core deposit intangible from CFC.
Other expenses increased $1.4 million, or 32.83%, to $5.7 million for the year ended December 31, 2014 from $4.3 million compared to the same period in 2013. This includes an increase of $961 thousand of other expenses related to the operations of Charter Holding. Other increases included $156 thousand in contributions, including an increase of $95 thousand in state tax-qualified contributions; $142 thousand in postage driven in part by the additional deposit accounts acquired in 2013 and the regulatory requirement to now provide monthly mortgage statements; $104 thousand in expenses related to non-earning assets; $140 thousand in debit card charge-offs related to the increased volume of fraudulent transactions demonstrated throughout the industry; and $111 thousand in Vermont state franchise tax which is based on Vermont-based deposit levels.
46
Table of Contents
Income Taxes
The provision for income taxes for the years ended December 31, 2014 and 2013 includes net deferred income tax expense of $1.2 million and $592 thousand, respectively. These amounts were determined by the asset and liability method in accordance with generally accepted accounting principles for each year.
We have provided deferred income taxes on the difference between the provision for loan losses permitted for income tax purposes and the provision recorded for financial reporting purposes.
Capital Securities
On March 30, 2004, NHTB Capital Trust II (“Trust II”), a Connecticut statutory trust formed by us, completed the sale of $10.0 million of Floating Capital Securities, adjustable every three months at LIBOR plus 2.79% (“Capital Securities II”). Trust II also issued common securities to us and used the net proceeds from the offering to purchase a like amount of our Junior Subordinated Deferrable Interest Debentures (“Debentures II”). Debentures II are the sole assets of Trust II. Total expenses associated with the offering of $99 thousand and $104 thousand are included in other assets as of December 31, 2015 and 2014, respectively, and are being amortized on a straight-line basis over the life of Debentures II.
Capital Securities II accrue and pay distributions quarterly based on the stated liquidation amount of $10 per capital security. We have fully and unconditionally guaranteed all of the obligations of Trust II. The guaranty covers the quarterly distributions and payments on liquidation or redemption of Capital Securities II, but only to the extent that Trust II has funds necessary to make these payments.
Capital Securities II are mandatorily redeemable upon the maturing of Debentures II on March 30, 2034, or upon earlier redemption as provided in the Indenture. We have the right to redeem Debentures II, in whole or in part, at the liquidation amount plus any accrued but unpaid interest to the redemption date.
On March 30, 2004, NHTB Capital Trust III (“Trust III”), a Connecticut statutory trust formed by us, completed the sale of $10.0 million of 6.06% 5 Year Fixed-Floating Capital Securities (“Capital Securities III”). Trust III also issued common securities to us and used the net proceeds from the offering to purchase a like amount of our 6.06% Junior Subordinated Deferrable Interest Debentures (“Debentures III”). Debentures III are the sole assets of Trust III. Total expenses associated with the offering of $99 thousand and $104 thousand are included in other assets as of December 31, 2015 and 2014, respectively, and are being amortized on a straight-line basis over the life of Debentures III.
Capital Securities III accrue and pay distributions quarterly at an annual rate of 6.06% for the first 5 years of the stated liquidation amount of $10 per capital security. We have fully and unconditionally guaranteed all of the obligations of Trust III. The guaranty covers the quarterly distributions and payments on liquidation or redemption of Capital Securities III, but only to the extent that Trust III has funds necessary to make these payments.
Capital Securities III are mandatorily redeemable upon the maturing of Debentures III on March 30, 2034, or upon earlier redemption as provided in the Indenture. We have the right to redeem Debentures III, in whole or in part, at the liquidation amount plus any accrued but unpaid interest to the redemption date.
47
Table of Contents
Contractual Obligations
A summary of lease obligations, borrowings and credit commitments at December 31, 2015 is as follows:
| (Dollars in thousands) | Within 1 Year |
After 1 year but within 3 years |
After 3 years but within 5 years |
After 5 years |
Total | |||||||||||||||
| Lease obligations |
||||||||||||||||||||
| Operating leases |
$ | 612 | $ | 960 | $ | 579 | $ | 657 | $ | 2,808 | ||||||||||
|
|
|
|
|
|
|
|
|
|
|
|||||||||||
| Borrowings and other debt |
||||||||||||||||||||
| Federal Home Loan Bank advances |
$ | 90,000 | $ | 30,000 | $ | 30,000 | $ | — | $ | 150,000 | ||||||||||
| Securities sold under agreements to repurchase |
17,957 | — | — | — | 17,957 | |||||||||||||||
| Subordinated debentures |
— | — | — | 37,620 | 37,620 | |||||||||||||||
|
|
|
|
|
|
|
|
|
|
|
|||||||||||
| Total borrowings and other debt |
107,957 | 30,000 | 30,000 | 37,620 | 205,577 | |||||||||||||||
| Credit commitments |
||||||||||||||||||||
| Available lines of credit and unadvanced construction loans |
$ | 22,454 | $ | 18,848 | $ | 13,273 | $ | 60,910 | $ | 115,485 | ||||||||||
| Commitments to extend credit |
27,421 | — | — | — | 27,421 | |||||||||||||||
| Letters of credit |
764 | 310 | — | — | 1,074 | |||||||||||||||
|
|
|
|
|
|
|
|
|
|
|
|||||||||||
| Total credit commitments |
50,639 | 19,158 | 13,273 | 60,910 | 143,980 | |||||||||||||||
|
|
|
|
|
|
|
|
|
|
|
|||||||||||
| Total |
$ | 159,208 | $ | 50,118 | $ | 43,852 | $ | 99,187 | $ | 352,365 | ||||||||||
|
|
|
|
|
|
|
|
|
|
|
|||||||||||
Liquidity and Capital Resources
Liquidity
The term “liquidity” refers to our ability to generate adequate amounts of cash to fund loan originations, loan purchases, deposit withdrawals and operating expenses. At year-end 2015, our liquidity was sufficient to cover our anticipated needs for funding new loan commitments of approximately $27.4 million. Our source of funds is derived primarily from net deposit inflows, loan amortizations, principal pay downs from loans, sold loan proceeds, and advances from the FHLBB. At December 31, 2015, we had approximately $219.8 million in additional borrowing capacity from the FHLBB.
At December 31, 2015, stockholders’ equity totaled $136.7 million compared to $139.8 million at December 31, 2014. The decrease of $3.1 million primarily reflects the redemption of $8.0 million of preferred stock, net income of $9.0 million, the payout of $4.5 million in common stock dividends, $74 thousand in preferred stock dividends declared, other comprehensive loss in the amount of $511 thousand, $157 thousand for vesting of restricted stock awards, $218 thousand for stock issued under the dividend reinvestment plan, and $530 thousand from the exercise of stock options.
At December 31, 2015, we had unrestricted funds in the amount of $1.7 million. Our total cash needs during 2016 are estimated to be approximately $7.2 million with $4.7 million projected to be used to pay cash dividends on our common stock, $624 thousand to pay interest on our capital securities, $1.1 million to pay interest on our subordinated debenture, and approximately $798 thousand for ordinary operating expenses. The Bank pays dividends to the Company as its sole stockholder, within guidelines set forth by the OCC and the FRB. Since the Bank is well capitalized and has capital in excess of regulatory requirements, it is anticipated that funds will be available to cover additional cash requirements for 2016 as long as earnings at the Bank are sufficient to maintain adequate Tier I capital.
Net cash provided by operating activities was $17.0 million for 2015 compared to net cash provided by operating activities of $11.2 million in 2014, a change of $5.8 million, or 51.01%. The change includes an
48
Table of Contents
increase in the amount of $151 thousand in provision for loan losses, a decrease in gains on sales and calls of securities of $603 thousand, an increase in depreciation and amortization of $134 thousand, a change in deferred loan origination costs of $200 thousand, a change in the activity of loans held-for sale of $1.5 million, a decrease in the change in accrued interest receivable and other assets of $366 thousand and an increase in accrued expenses and other liabilities of $6.5 million.
Net cash flows used in investing activities totaled $28.6 million in 2015, compared to net cash flows used in investing activities of $63.7 million in 2014, a change of $35.1 million, or 55.10%, as we utilized investment cash flows and sales to fund loan originations. During 2015, net cash used by loan originations and net principal collections decreased by $51.0 million while our loans held in portfolio increased, and cash provided by sales of securities available-for-sale decreased by $40.5 million.
Net cash flows provided by financing activities totaled $3.1 million in 2015, compared to net cash flows provided by financing activities of $70.0 million in 2014, a change of $66.9 million, or 95.60%. Net cash provided by deposits decreased $60.0 million. Net cash used in repayment of advances from FHLBB decreased $35.8 million and net cash provided by principal advances from the FHLBB decreased $10.0 million, as we increased our advances outstanding. Net cash provided by the repurchase agreements increased $12.3 million during 2015.
We expect to be able to fund loan demand and other investing activities during 2015 by continuing to utilize the FHLBB’s advance program and cash flows from securities and loans. On December 31, 2015, approximately $27.4 million in commitments to fund loans had been made. Management is not aware of any trends, events, or uncertainties that will have, or that are reasonably likely to have, a material effect on our liquidity, capital resources or results of operations.
U.S. Treasury’s SBLF Program
On August 25, 2011, as part of the SBLF program, we entered into a Purchase Agreement with Treasury pursuant to which we issued and sold to the U.S. Department of Treasury (“Treasury”) 20,000 shares of our Series B Preferred Stock. We used $10.0 million of the SBLF proceeds to repurchase the Series A Preferred Stock previously issued under Treasury’s Capital Purchase Program. With the acquisition of TNB in 2013, we assumed $3.0 million of preferred stock issued to Treasury. On December 3, 2015, we redeemed all of our outstanding shares of Series B Preferred Stock. At December 31, 2015 and 2014, we had no shares and 8,000 shares, respectively, of Non-Cumulative Perpetual Preferred Stock, Series B, par value $0.01 per preferred share, issued and outstanding.
Subordinated Notes
On October 29, 2014, we entered into a Subordinated Note Purchase Agreement with certain accredited investors under which we issued an aggregate of $17.0 million of subordinated notes to the accredited investors. The Notes have a maturity date of November 1, 2024, and bear interest at a fixed rate of 6.75% per annum. We may, at our option, beginning with the interest payment date of November 1, 2019, and on any interest payment date thereafter, redeem the notes, in whole or in part, at par plus accrued and unpaid interest to the date of redemption. Any partial redemption will be made pro rata among all of the noteholders. The notes are not subject to repayment at the option of the noteholders. The notes are unsecured, subordinated obligations of the Company and rank junior in right of payment to our senior indebtedness and to our obligations to our general creditors.
The notes are intended to qualify as Tier 2 capital for regulatory purposes. We used a portion of the net proceeds from the sale of the notes to redeem a portion of our Series B Preferred Stock and the remainder of the net proceeds for general corporate purposes. The notes were offered and sold in reliance on the exemptions from registration provided by Section 4(a)(2) of the Securities Act of 1933, as amended, and Rule 506 of Regulation D thereunder.
49
Table of Contents
Capital Ratios
Consistent with its goal to operate a sound and profitable financial institution, we actively seek to maintain a “well-capitalized” institution in accordance with regulatory standards. The OCC requires that the Bank maintain tangible, core, and total risk-based capital ratios of 1.50%, 4.00% (or 3.00% under certain conditions), and 8.00%, respectively. At December 31, 2015, the Bank’s ratios were 9.02%, 9.02%, and 13.62%, respectively, well in excess of the OCC requirements for well capitalized banks. Additional information on these requirements can be found under the section entitled “Regulation” located elsewhere in this report.
Tangible Book Value
Book value per common share was $16.32 at December 31, 2015, compared to $15.97 per common share at December 31, 2014. Tangible book value per common share was $10.76 at December 31, 2015 compared to $9.44 at December 31, 2014. Tangible book value per common share is a non-GAAP financial measure. Tangible book value per common share is calculated by dividing tangible common equity by the total number of shares outstanding at a point in time. Tangible common equity is calculated by excluding the balance of goodwill, other intangible assets and preferred stock from the calculation of stockholders’ equity. We believe that tangible book value per common share provides information that is useful to investors in understanding our financial condition. Because not all companies use the same calculation of tangible common equity and tangible book value per common share, this presentation may not be comparable to other similarly titled measures calculated by other companies.
A reconciliation of these non-GAAP financial measures is provided below:
| (Dollars in thousands) | December 31, 2015 |
December 31, 2014 |
||||||
| Stockholders’ equity |
$ | 136,708 | $ | 139,836 | ||||
| Less goodwill (1) |
40,847 | 44,576 | ||||||
| Less other intangible assets (1) |
5,726 | 9,332 | ||||||
| Less preferred stock |
— | 8,000 | ||||||
|
|
|
|
|
|||||
| Tangible common equity |
$ | 90,135 | $ | 77,928 | ||||
|
|
|
|
|
|||||
| Ending common shares outstanding |
8,376,841 | 8,258,031 | ||||||
| Tangible book value per common share |
$ | 10.76 | $ | 9.44 | ||||
| (1) | Net of related deferred tax liability for periods beginning after January 1, 2015. |
Stock Repurchase Plan
The Board of Directors has determined that a share buyback is appropriate to enhance stockholder value because such repurchases generally increase earnings per common share, return on average assets and on average common stockholders’ equity; three performing benchmarks against which bank and thrift holding companies are measured. On June 12, 2007, the Board of Directors reactivated a previously adopted but incomplete stock repurchase program to repurchase up to 253,776 shares of common stock. We buy stock in the open market whenever the price of the stock is deemed reasonable and we have funds available for the purchase. At December 31, 2015, 148,088 shares remained to be repurchased under the plan. During 2015, no shares were repurchased.
Off-Balance Sheet Arrangements
We are a party to financial instruments with off-balance sheet risk in the normal course of business to meet the financing needs of our customers. These financial instruments include commitments to originate loans, standby letters of credit and unadvanced funds on loans. The instruments involve, to varying degrees, elements of
50
Table of Contents
credit risk in excess of the amount recognized in the balance sheets. The contract amounts of those instruments reflect the extent of involvement we have in particular classes of financial instruments. Further detail on the financial instruments with off-balance sheet risk to which we are a party is contained in Note 22 to our Consolidated Financial Statements located elsewhere in this report.
Impact of Inflation
The financial statements and related data presented elsewhere herein are prepared in accordance with GAAP, which require the measurement of our financial position and operating results generally in terms of historical dollars and current market value, for certain loans and investments, without considering changes in the relative purchasing power of money over time due to inflation. The impact of inflation is reflected in the increased cost of operations.
Unlike other companies, nearly all of the assets and liabilities of a bank are monetary in nature. As a result, interest rates have a far greater impact on a bank’s performance than the effects of the general level of inflation. Interest rates do not necessarily move in the same direction or to the same extent as the price of goods and services, since such prices are affected by inflation. Liquidity and the maturity structure of our assets and liabilities are important to the maintenance of acceptable performance levels.
| Item 7A. | Quantitative and Qualitative Disclosures about Market Risk |
Asset-Liability Management
Market risk and interest rate risk management is governed by the Asset/Liability Committee (“ALCO”). The ALCO establishes exposure limits that define our tolerance for interest rate risk. The ALCO manages the composition of the balance sheet over a range of potential fluctuations in interest rates while responding, as appropriate, to market demand for loan and deposit products. Current exposures versus limits are reported to the Board of Directors at least quarterly. The policy limits and guidelines serve as benchmarks for measuring interest rate risk and for providing a framework for evaluation and interest rate risk-management decision-making.
Market Risk
Market risk is the risk that the market value or estimated fair value of our assets, liabilities, and derivative financial instruments will decline as a result of changes in interest rates or financial market volatility, or that our net income will be significantly reduced by interest rate changes.
Interest Rate Risk
The principal market risk facing us is interest rate risk, which may include repricing risk, yield-curve risk, basis risk, and prepayment risk. Repricing risk exists when the change in the average yield of either interest-earning assets or interest-bearing liabilities is more sensitive than the other to changes in market interest rates. A change in sensitivity could reflect an imbalance in the repricing opportunities of our assets and liabilities. Yield curve risk reflects the possibility that the changes in the shape of the yield curve could have different effects on our assets and liabilities. Basis risk exists when different parts of the balance sheet are subject to varying base rates reflecting the possibility that the spread from those base rates will deviate. Prepayment risk is associated with financial instruments with an option to prepay before the stated maturity often at a time of disadvantage to the person selling the option; this risk is most often associated with the prepayment of loans, callable investments, and callable borrowings.
Interest rate risk can be measured by analyzing the extent to which the repricing of assets and liabilities is mismatched to create an interest rate sensitivity gap. An asset or liability is said to be interest rate sensitive within a specific period if it will mature or reprice within that period. The interest rate sensitivity gap is defined as the difference between the amount of interest-earning assets maturing or repricing within a specific time
51
Table of Contents
period and the amount of interest-bearing liabilities maturing or repricing within that same time period. A gap is considered positive when the amount of interest rate-sensitive assets exceeds the amount of interest rate-sensitive liabilities. A gap is considered negative when the amount of interest rate-sensitive liabilities exceeds the amount of interest rate-sensitive assets. During a period of falling interest rates, therefore, a positive gap would tend to adversely affect net interest income. Conversely, during a period of rising interest rates, a positive gap position would tend to result in an increase in net interest income.
Income simulation is the primary tool for measuring the interest rate risk inherent in our balance sheet at a given point in time by showing the effect on net interest income, over a 12-month period, of a variety of interest rate shocks. These simulations take into account repricing, maturity and prepayment characteristics of individual products. The ALCO reviews simulation results to determine whether the exposure resulting from changes in market interest rates remains within established tolerance levels over a 12-month horizon, and develops appropriate strategies to manage this exposure.
Our one-year cumulative interest-rate gap at December 31, 2015 was positive 1.56% compared to the December 31, 2014 gap of negative 2.34%. At December 31, 2015, repricing assets over the next 12 months were $16.0 million more than repricing liabilities for the same period compared to $31.5 million less repricing assets than repricing liabilities at December 31, 2014. With an asset sensitive negative gap, if rates were to rise, net interest margin would likely increase and if rates were to fall, the net interest margin would likely decrease.
As another part of interest rate risk analysis, we use an interest rate sensitivity model, which generates estimates of the change in our economic value of equity (“EVE”) over a range of interest rate scenarios. EVE is the present value of expected cash flows from assets, liabilities and off-balance sheet contracts. The EVE ratio, under any rate scenario, is defined as the EVE in that scenario divided by the market value of assets in the same scenario. Modeling changes require making certain assumptions, which may or may not reflect the manner in which actual yields and costs respond to the changes in market interest rates. In this regard, the EVE model assumes that the composition of our interest sensitive assets and liabilities existing at the beginning of a period remain constant over the period being measured and that a particular change in interest rates is reflected uniformly across the yield curve. Accordingly, although the EVE measurements and net interest income models provide an indication of our interest rate risk exposure at a particular point in time, such measurements are not intended to and do not provide a precise forecast of the effect of changes in market rates on our net interest income and will likely differ from actual results.
The following table sets forth our EVE at December 31, 2015, as calculated by an independent third party agent:
| Change in Rates |
Net Portfolio Value | EVE as % of PV Assets | ||||||||||||||||||
| $ Amount | $ Change | % Change | EVE Ratio | Change | ||||||||||||||||
| (Dollars in thousands) | ||||||||||||||||||||
| +400 bp |
$ | 105,072 | $ | (35,775 | ) | -25.40 | % | 7.95 | % | -169bp | ||||||||||
| +300 bp |
114,339 | (26,508 | ) | -18.82 | % | 8.45 | % | -119bp | ||||||||||||
| +200 bp |
123,768 | (17,079 | ) | -12.13 | % | 8.92 | % | -72bp | ||||||||||||
| +100 bp |
133,165 | (7,682 | ) | -5.45 | % | 9.35 | % | -29bp | ||||||||||||
| 0 bp |
140,847 | — | — | 9.64 | % | — | ||||||||||||||
| -100 bp |
134,064 | (6,783 | ) | -4.82 | % | 8.98 | % | -66bp | ||||||||||||
52
Table of Contents
The following table shows our interest rate sensitivity (gap) table at December 31, 2015:
| 0-3 Months |
3-6 Months |
6 Months- 1 Year |
1-3 Years |
Beyond 3 Years |
Total | |||||||||||||||||||
| (Dollars in thousands) | ||||||||||||||||||||||||
| Interest-earning assets: |
||||||||||||||||||||||||
| Loans |
$ | 196,656 | $ | 96,471 | $ | 152,609 | $ | 322,471 | $ | 453,901 | $ | 1,222,108 | ||||||||||||
| Investments and overnight deposit |
40,250 | 3,319 | 6,099 | 60,771 | 46,025 | 156,464 | ||||||||||||||||||
|
|
|
|
|
|
|
|
|
|
|
|
|
|||||||||||||
| Total |
236,906 | 99,790 | 158,708 | 383,242 | 499,926 | 1,378,572 | ||||||||||||||||||
|
|
|
|
|
|
|
|
|
|
|
|
|
|||||||||||||
| Interest-bearing liabilities: |
||||||||||||||||||||||||
| Deposits |
193,310 | 56,054 | 65,946 | 76,559 | 765,483 | 1,157,352 | ||||||||||||||||||
| Repurchase agreements |
17,957 | — | — | — | — | 17,957 | ||||||||||||||||||
| Borrowings |
95,000 | 15,000 | 10,000 | 30,000 | — | 150,000 | ||||||||||||||||||
| Subordinated debt |
20,620 | — | — | — | 17,000 | 37,620 | ||||||||||||||||||
|
|
|
|
|
|
|
|
|
|
|
|
|
|||||||||||||
| Total |
326,887 | 71,054 | 75,946 | 106,559 | 782,483 | 1,362,929 | ||||||||||||||||||
|
|
|
|
|
|
|
|
|
|
|
|
|
|||||||||||||
| Period sensitivity gap |
(89,981 | ) | 28,736 | 82,762 | 276,683 | (282,557 | ) | $ | 15,643 | |||||||||||||||
| Cumulative sensitivity gap |
$ | (89,981 | ) | $ | (61,245 | ) | $ | 21,517 | $ | 298,200 | $ | 15,643 | ||||||||||||
| Cumulative sensitivity gap as a percentage of interest-earning assets |
-6.53 | % | -4.44 | % | 1.56 | % | 21.63 | % | 1.13 | % | 1.13 | % | ||||||||||||
| Item 8. | Financial Statements |
Our Consolidated Financial Statements and accompanying notes may be found beginning on page F-1 of this report.
| Item 9. | Changes in and Disagreements with Accountants on Accounting and Financial Disclosure |
None.
| Item 9A. | Controls and Procedures |
Evaluation of Disclosure Controls and Procedures
Management, including our President and Chief Executive Officer and Chief Financial Officer, has evaluated the effectiveness of our disclosure controls and procedures (as defined in Exchange Act Rules 13a-15(e) and 15d-15(e)) as of the end of the period covered by this report. Based upon that evaluation, our President and Chief Executive Officer and Chief Financial Officer concluded that the disclosure controls and procedures were effective to ensure that information required to be disclosed in the reports we file and submit under the Exchange Act is (i) recorded, processed, summarized and reported as and when required, and (ii) accumulated and communicated to our management, including our President and Chief Executive Officer and Chief Financial Officer, as appropriate to allow timely decisions regarding required disclosure.
Management’s Annual Report on Internal Control Over Financial Reporting
Our management is responsible for establishing and maintaining adequate internal control over financial reporting, as such term is defined in Rules 13a-15(f) and 15d-15(f) of the Securities Exchange Act of 1934, as amended. Our management, including our principal executive officer and principal financial officer, conducted an evaluation of the effectiveness of our internal control over financial reporting based on the framework set forth by the Committee of Sponsoring Organizations of the Treadway Commission in Internal Control—Integrated Framework (2013). Based on this evaluation, management concluded that our internal control over financial reporting was effective as of December 31, 2015.
53
Table of Contents
Attestation Report of the Registered Public Accounting Firm
The attestation report of Baker Newman and Noyes, LLC, our independent registered public accounting firm, regarding our internal control over financial reporting as of December 31, 2015 is included on pages 55 of this report.
Changes in Internal Control Over Financial Reporting
We regularly assess the adequacy of our internal control over financial reporting and enhance our controls in response to internal control assessments and internal and external audit and regulatory recommendations. There have been no changes in our internal control over financial reporting identified in connection with the evaluation that occurred during our last fiscal quarter that has materially affected, or that is reasonably likely to materially affect, our internal control over financial reporting.
| Item 9B. | Other Information |
None.
54
Table of Contents

REPORT OF INDEPENDENT REGISTERED PUBLIC ACCOUNTING FIRM
To the Board of Directors and Stockholders
Lake Sunapee Bank Group
We have audited Lake Sunapee Bank Group and Subsidiaries’ (the Company) internal control over financial reporting as of December 31, 2015, based on criteria established in Internal Control—Integrated Framework issued by the Committee of Sponsoring Organizations of the Treadway Commission in 2013 (the COSO criteria). The Company’s management is responsible for maintaining effective internal control over financial reporting and for its assessment of the effectiveness of internal control over financial reporting, included in the accompanying Management’s Annual Report on Internal Control over Financial Reporting. Our responsibility is to express an opinion on the Company’s internal control over financial reporting based on our audit.
We conducted our audit in accordance with the standards of the Public Company Accounting Oversight Board (United States). Those standards require that we plan and perform the audit to obtain reasonable assurance about whether effective internal control over financial reporting was maintained in all material respects. Our audit included obtaining an understanding of internal control over financial reporting, assessing the risk that a material weakness exists, testing and evaluating the design and operating effectiveness of internal control based on the assessed risk. Our audit also included performing such other procedures as we consider necessary in the circumstances. We believe that our audit provides a reasonable basis for our opinion.
A company’s internal control over financial reporting is a process designed to provide reasonable assurance regarding the reliability of financial reporting and the preparation of financial statements for external purposes in accordance with generally accepted accounting principles. A company’s internal control over financial reporting includes those policies and procedures that (1) pertain to the maintenance of records that, in reasonable detail, accurately and fairly reflect the transactions and dispositions of the assets of the company; (2) provide reasonable assurance that transactions are recorded as necessary to permit preparation of financial statements in accordance with generally accepted accounting principles, and that receipts and expenditures of the Company are being made only in accordance with authorizations of management and directors of the Company; and (3) provide reasonable assurance regarding prevention or timely detection of unauthorized acquisition, use or disposition of the Company’s assets that could have a material effect on the financial statements.
Because of its inherent limitations, internal control over financial reporting may not prevent or detect misstatements. Also, projections of any evaluation of effectiveness to future periods are subject to the risk that controls may become inadequate because of changes in conditions, or that the degree of compliance with the policies or procedures may deteriorate.
In our opinion, Lake Sunapee Bank Group and Subsidiaries maintained, in all material respects, effective internal control over financial reporting as of December 31, 2015, based on the COSO criteria.
We also have audited, in accordance with the standards of the Public Company Accounting Oversight Board (United States), the consolidated balance sheet of Lake Sunapee Bank Group and Subsidiaries as of December 31, 2015, and the related consolidated statements of income, comprehensive income, changes in stockholders’ equity and cash flows for year ended December 31, 2015 and our report dated March 15, 2016 expressed an unqualified opinion.
Limited Liability Company
Peabody, Massachusetts
March 15, 2016
55
Table of Contents
| Item 10. | Directors, Executive Officers and Corporate Governance |
The information required by this Item 10 is incorporated by reference to the sections entitled “Information About Our Board of Directors,” “Information About Our Executive Officers Who Are Not Directors,” “Corporate Governance,” “Section 16(a) Beneficial Ownership Reporting Compliance,” “Corporate Governance—Code of Ethics,” “Corporate Governance—Committees of the Board—Nominating Committee” and “Corporate Governance—Committees of the Board—Audit Committee” in our Proxy Statement.
| Item 11. | Executive Compensation |
The information required by this Item 11 is incorporated by reference to the sections entitled “Executive Compensation,” “Director Compensation,” “Compensation Committee Interlocks and Insider Participation” and “Compensation Committee Report” in our Proxy Statement.
| Item 12. | Security Ownership of Certain Beneficial Owners and Management and Related Stockholders Matters |
The information required by this Item 12 is incorporated by reference to the sections entitled “Security Ownership of Certain Beneficial Owners and Management” and “Securities Authorized for Issuance Under Equity Compensation Plans” in our Proxy Statement.
| Item 13. | Certain Relationships and Related Transactions, and Director Independence |
The information required by this Item 13 is incorporated by reference to the sections entitled “Transactions with Related Persons” and “Corporate Governance—Board of Directors Independence” in our Proxy Statement.
| Item 14. | Principal Accountant Fees and Services |
The information required by this Item 14 is incorporated by reference to the section entitled “Principal Accounting Fees and Services” in our Proxy Statement.
| Item 15. | Exhibits and Financial Statement Schedules |
The financial statement schedules and exhibits filed as part of this form 10-K are as follows:
(a)(1) Financial Statements
Reference is made to the Consolidated Financial Statements included in Item 8 of Part II hereof.
(a)(2) Financial Statement Schedules
Consolidated financial statement schedules have been omitted because the required information is not present, or not present in amounts sufficient to require submission of the schedules, or because the required information is provided in the consolidated financial statements or notes thereto.
(a)(3) Exhibits
The exhibits required to be filed as part of the Annual Report on Form 10-K are listed in the Exhibit Index attached hereto and are incorporated herein by reference.
56
Table of Contents
REPORT OF INDEPENDENT REGISTERED PUBLIC ACCOUNTING FIRM
To the Board of Directors and Stockholders
Lake Sunapee Bank Group
We have audited the accompanying consolidated balance sheet of Lake Sunapee Bank Group and Subsidiaries (the Company) as of December 31, 2015, and the related consolidated statements of income, comprehensive income, changes in stockholders’ equity, and cash flows for the year then ended. These financial statements are the responsibility of the Company’s management. Our responsibility is to express an opinion on these financial statements based on our audit.
We conducted our audit in accordance with the standards of the Public Company Accounting Oversight Board (United States). Those standards require that we plan and perform the audit to obtain reasonable assurance about whether the financial statements are free of material misstatement. An audit includes examining, on a test basis, evidence supporting the amounts and disclosures in the financial statements, assessing the accounting principles used and significant estimates made by management, as well as evaluating the overall financial statement presentation. We believe that our audit provides a reasonable basis for our opinion.
In our opinion, the consolidated financial statements referred to above present fairly, in all material respects, the financial position of Lake Sunapee Bank Group and Subsidiaries as of December 31, 2015, and the results of their operations and their cash flows for the year then ended, in conformity with accounting principles generally accepted in the United States of America.
We have also audited, in accordance with the standards of the Public Company Accounting Oversight Board (United States), Lake Sunapee Bank Group and Subsidiaries’ internal control over financial reporting as of December 31, 2015, based on criteria established in Internal Control—Integrated Framework issued by the Committee of Sponsoring Organizations of the Treadway Commission in 2013, and our report dated March 15, 2016 expressed an unqualified opinion on the effectiveness of the Company’s internal control over financial reporting.
Limited Liability Company
Peabody, Massachusetts
March 15, 2016
F-1
Table of Contents

REPORT OF INDEPENDENT REGISTERED PUBLIC ACCOUNTING FIRM
To the Board of Directors and Stockholders
Lake Sunapee Bank Group
We have audited the accompanying consolidated balance sheet of Lake Sunapee Bank Group (formerly New Hampshire Thrift Bancshares, Inc.) and Subsidiaries (the Company) as of December 31, 2014, and the related consolidated statements of income, comprehensive income, changes in stockholders’ equity, and cash flows for the years ended December 31, 2014 and 2013. These financial statements are the responsibility of the Company’s management. Our responsibility is to express an opinion on these financial statements based on our audits.
We conducted our audit in accordance with the standards of the Public Company Accounting Oversight Board (United States). Those standards require that we plan and perform the audit to obtain reasonable assurance about whether the financial statements are free of material misstatement. An audit includes examining, on a test basis, evidence supporting the amounts and disclosures in the financial statements, assessing the accounting principles used and significant estimates made by management, as well as evaluating the overall financial statement presentation. We believe that our audit provides a reasonable basis for our opinion.
In our opinion, the consolidated financial statements referred to above present fairly, in all material respects, the financial position of Lake Sunapee Bank Group and Subsidiaries as of December 31, 2014, and the results of their operations and their cash flows for the years ended December 31, 2014 and 2013, in conformity with accounting principles generally accepted in the United States of America.

Shatswell MacLeod & Company, P.C.
Peabody, Massachusetts
March 16, 2015

F-2
Table of Contents
Lake Sunapee Bank Group and Subsidiaries
Consolidated Balance Sheets
(Dollars in thousands, except share data)
| As of December 31, |
2015 | 2014 | ||||||
| ASSETS |
||||||||
| Cash and due from banks |
$ | 16,426 | $ | 24,957 | ||||
| Interest-bearing deposit with the Federal Reserve Bank |
26,140 | 26,163 | ||||||
|
|
|
|
|
|||||
| Cash and cash equivalents |
42,566 | 51,120 | ||||||
| Interest-bearing time deposits with other banks |
— | 747 | ||||||
| Securities available-for-sale |
120,198 | 115,698 | ||||||
| Federal Home Loan Bank stock |
9,963 | 10,762 | ||||||
| Loans held-for-sale |
2,188 | 2,000 | ||||||
| Loans receivable, net of the allowance for loan losses of $8.9 million as of December 31, 2015 and $9.3 million as of December 31, 2014 |
1,217,461 | 1,206,845 | ||||||
| Accrued interest receivable |
2,431 | 2,576 | ||||||
| Bank premises and equipment, net |
24,421 | 24,391 | ||||||
| Investment in real estate |
3,392 | 3,533 | ||||||
| Other real estate owned |
904 | 251 | ||||||
| Goodwill |
44,576 | 44,576 | ||||||
| Intangible assets |
7,822 | 9,332 | ||||||
| Bank-owned life insurance |
30,833 | 20,187 | ||||||
| Other assets |
11,766 | 11,768 | ||||||
|
|
|
|
|
|||||
| Total assets |
$ | 1,518,521 | $ | 1,503,786 | ||||
|
|
|
|
|
|||||
| LIABILITIES |
||||||||
| Deposits: |
||||||||
| Noninterest-bearing |
$ | 127,428 | $ | 117,889 | ||||
| Interest-bearing |
1,029,924 | 1,034,825 | ||||||
|
|
|
|
|
|||||
| Total deposits |
1,157,352 | 1,152,714 | ||||||
| Federal Home Loan Bank advances |
150,000 | 140,992 | ||||||
| Securities sold under agreements to repurchase |
17,957 | 16,756 | ||||||
| Subordinated debentures |
37,620 | 37,620 | ||||||
| Accrued expenses and other liabilities |
18,884 | 15,868 | ||||||
|
|
|
|
|
|||||
| Total liabilities |
1,381,813 | 1,363,950 | ||||||
|
|
|
|
|
|||||
| STOCKHOLDERS’ EQUITY |
||||||||
| Preferred stock, $.01 par value per share: 2,500,000 shares authorized, non-cumulative perpetual Series B; no shares issued and outstanding at December 31, 2015 and 8,000 shares issued and outstanding at December 31, 2014; liquidation value $1,000 per share |
— | — | ||||||
| Common stock, $.01 par value per share: 30,000,000 shares authorized, 8,811,170 shares issued, and 8,376,841 shares outstanding at December 31, 2015 and 10,000,000 shares authorized, 8,692,360 shares issued, and 8,258,031 shares outstanding at December 31, 2014 |
88 | 87 | ||||||
| Paid-in capital |
80,252 | 86,561 | ||||||
| Retained earnings |
68,344 | 63,876 | ||||||
| Unearned restricted stock awards |
(1,375 | ) | (598 | ) | ||||
| Accumulated other comprehensive loss |
(3,850 | ) | (3,339 | ) | ||||
| Treasury stock, at cost, 434,329 shares as of December 31, 2015 and December 31, 2014 |
(6,751 | ) | (6,751 | ) | ||||
|
|
|
|
|
|||||
| Total stockholders’ equity |
136,708 | 139,836 | ||||||
|
|
|
|
|
|||||
| Total liabilities and stockholders’ equity |
$ | 1,518,521 | $ | 1,503,786 | ||||
|
|
|
|
|
|||||
The accompanying notes are an integral part of these consolidated financial statements.
F-3
Table of Contents
Lake Sunapee Bank Group and Subsidiaries
Consolidated Statements of Income
(Dollars in thousands, except for per share data)
| For the years ended December 31, |
2015 | 2014 | 2013 | |||||||||
| INTEREST AND DIVIDEND INCOME |
||||||||||||
| Interest and fees on loans |
$ | 46,227 | $ | 46,647 | $ | 38,034 | ||||||
| Interest on debt securities: |
||||||||||||
| Taxable |
1,232 | 1,362 | 1,333 | |||||||||
| Tax-exempt |
332 | 489 | 799 | |||||||||
| Dividends |
275 | 165 | 52 | |||||||||
| Other |
67 | 65 | 58 | |||||||||
|
|
|
|
|
|
|
|||||||
| Total interest and dividend income |
48,133 | 48,728 | 40,276 | |||||||||
|
|
|
|
|
|
|
|||||||
| INTEREST EXPENSE |
||||||||||||
| Interest on deposits |
3,913 | 4,464 | 4,055 | |||||||||
| Interest on advances and other borrowed money |
1,018 | 1,417 | 1,585 | |||||||||
| Interest on debentures |
1,867 | 855 | 806 | |||||||||
| Interest on securities sold under agreements to repurchase |
71 | 63 | 51 | |||||||||
|
|
|
|
|
|
|
|||||||
| Total interest expense |
6,869 | 6,799 | 6,497 | |||||||||
|
|
|
|
|
|
|
|||||||
| Net interest and dividend income |
41,264 | 41,929 | 33,779 | |||||||||
| PROVISION FOR LOAN LOSSES |
1,056 | 905 | 962 | |||||||||
|
|
|
|
|
|
|
|||||||
| Net interest and dividend income after provision for loan losses |
40,208 | 41,024 | 32,817 | |||||||||
|
|
|
|
|
|
|
|||||||
| NONINTEREST INCOME |
||||||||||||
| Customer service fees |
5,818 | 6,022 | 5,215 | |||||||||
| Net gain on sales and calls of securities |
347 | 950 | 964 | |||||||||
| Mortgage banking activities |
1,298 | 870 | 2,264 | |||||||||
| Net (loss) gain on sales of other real estate owned, other assets and fixed assets |
(142 | ) | 181 | 5 | ||||||||
| Remeasurement gain of equity interest in Charter Holding Corp. |
— | — | 1,369 | |||||||||
| Rental income |
693 | 717 | 746 | |||||||||
| Realized gain in Charter Holding Corp. |
— | — | 294 | |||||||||
| Bank-owned life insurance income |
598 | 635 | 639 | |||||||||
| Trust and investment management fee income |
8,468 | 8,319 | 2,736 | |||||||||
| Insurance and brokerage service income |
1,452 | 1,476 | 1,467 | |||||||||
| Other income |
92 | 56 | 29 | |||||||||
|
|
|
|
|
|
|
|||||||
| Total noninterest income |
18,624 | 19,226 | 15,728 | |||||||||
|
|
|
|
|
|
|
|||||||
| NONINTEREST EXPENSES |
||||||||||||
| Salaries and employee benefits |
24,208 | 25,076 | 19,223 | |||||||||
| Occupancy and equipment expenses |
6,225 | 6,099 | 4,776 | |||||||||
| Depositors’ insurance |
926 | 994 | 776 | |||||||||
| Professional services |
1,365 | 1,254 | 1,265 | |||||||||
| Data processing and outside services fees |
2,560 | 2,455 | 1,592 | |||||||||
| ATM processing fees |
788 | 843 | 630 | |||||||||
| Telephone expense |
1,077 | 1,087 | 706 | |||||||||
| Supplies |
547 | 568 | 454 | |||||||||
| Advertising and promotion |
923 | 866 | 659 | |||||||||
| Merger related expense |
— | — | 1,620 | |||||||||
| Amortization of intangible assets |
1,510 | 1,688 | 1,000 | |||||||||
| Other expenses |
6,076 | 5,716 | 4,303 | |||||||||
|
|
|
|
|
|
|
|||||||
| Total noninterest expenses |
46,205 | 46,646 | 37,004 | |||||||||
|
|
|
|
|
|
|
|||||||
| INCOME BEFORE PROVISION FOR INCOME TAXES |
12,627 | 13,604 | 11,541 | |||||||||
| PROVISION FOR INCOME TAXES |
3,598 | 3,564 | 3,127 | |||||||||
|
|
|
|
|
|
|
|||||||
| NET INCOME |
$ | 9,029 | $ | 10,040 | $ | 8,414 | ||||||
|
|
|
|
|
|
|
|||||||
| NET INCOME AVAILABLE TO COMMON STOCKHOLDERS |
$ | 8,878 | $ | 9,810 | $ | 8,098 | ||||||
|
|
|
|
|
|
|
|||||||
| Earnings per common share |
$ | 1.08 | $ | 1.19 | $ | 1.11 | ||||||
|
|
|
|
|
|
|
|||||||
| Earnings per common share, assuming dilution |
$ | 1.08 | $ | 1.19 | $ | 1.11 | ||||||
|
|
|
|
|
|
|
|||||||
| Dividends declared per common share |
$ | 0.54 | $ | 0.52 | $ | 0.52 | ||||||
|
|
|
|
|
|
|
|||||||
The accompanying notes are an integral part of these consolidated financial statements.
F-4
Table of Contents
Lake Sunapee Bank Group and Subsidiaries
Consolidated Statements of Comprehensive Income
(Dollars in thousands)
| For the years ended December 31, |
2015 | 2014 | 2013 | |||||||||
| Net income |
$ | 9,029 | $ | 10,040 | $ | 8,414 | ||||||
| Net change in unrealized (loss) gain on available-for-sale securities, net of tax effect |
(469 | ) | 857 | (2,382 | ) | |||||||
| Net change in unrecognized pension plan costs, net of tax effect |
(42 | ) | (1,299 | ) | 860 | |||||||
| Net change in derivatives, net of tax effect |
— | — | 101 | |||||||||
| Net change in unrealized loss on equity investment, net of tax effect |
— | — | (32 | ) | ||||||||
|
|
|
|
|
|
|
|||||||
| Comprehensive income |
$ | 8,518 | $ | 9,598 | $ | 6,961 | ||||||
|
|
|
|
|
|
|
|||||||
The accompanying notes are an integral part of these consolidated financial statements.
F-5
Table of Contents
Lake Sunapee Bank Group and Subsidiaries
Consolidated Statements of Changes in Stockholders’ Equity
| Preferred Stock | Common Stock | Paid-in Capital |
Retained Earnings |
Unearned Restricted Stock Awards |
Accumulated Other Comprehensive Loss |
Treasury Stock |
Total | |||||||||||||||||||||||||||||||||
| (Dollars in thousands, except share data) |
Shares | Amount | Shares | Amount | ||||||||||||||||||||||||||||||||||||
| Balance at December 31, 2012 |
23,000 | $ | — | 7,486,225 | $ | 75 | $ | 83,977 | $ | 53,933 | $ | (377 | ) | $ | (1,444 | ) | $ | (6,670 | ) | $ | 129,494 | |||||||||||||||||||
| Net income |
8,414 | 8,414 | ||||||||||||||||||||||||||||||||||||||
| Other comprehensive loss |
(1,453 | ) | (1,453 | ) | ||||||||||||||||||||||||||||||||||||
| Acquisition of Central Financial Corporation |
1,087,416 | 11 | 15,974 | 15,985 | ||||||||||||||||||||||||||||||||||||
| Exercise of stock options (cashless exchanges shown net) |
45,679 | 1 | 513 | 514 | ||||||||||||||||||||||||||||||||||||
| Tax benefit for stock options and awards |
30 | 30 | ||||||||||||||||||||||||||||||||||||||
| Dividend reinvestment plan |
12,902 | 202 | 202 | |||||||||||||||||||||||||||||||||||||
| Shares surrendered to treasury stock |
18,854 | 265 | (270 | ) | (5 | ) | ||||||||||||||||||||||||||||||||||
| Dividends declared—preferred stock |
(316 | ) | (316 | ) | ||||||||||||||||||||||||||||||||||||
| Dividends paid—common stock ($0.52 per share) |
(3,684 | ) | (3,684 | ) | ||||||||||||||||||||||||||||||||||||
| Issuance of restricted stock awards |
(189 | ) | 189 | — | ||||||||||||||||||||||||||||||||||||
| Vesting of restricted stock awards |
76 | 76 | ||||||||||||||||||||||||||||||||||||||
|
|
|
|
|
|
|
|
|
|
|
|
|
|
|
|
|
|
|
|
|
|||||||||||||||||||||
| Balance at December 31, 2013 |
23,000 | $ | — | 8,651,076 | $ | 87 | $ | 100,961 | $ | 58,347 | $ | (490 | ) | $ | (2,897 | ) | $ | (6,751 | ) | $ | 149,257 | |||||||||||||||||||
|
|
|
|
|
|
|
|
|
|
|
|
|
|
|
|
|
|
|
|
|
|||||||||||||||||||||
| Net income |
10,040 | 10,040 | ||||||||||||||||||||||||||||||||||||||
| Other comprehensive loss |
(442 | ) | (442 | ) | ||||||||||||||||||||||||||||||||||||
| Exercise of stock options (cashless exchanges shown net) |
7,000 | 92 | 92 | |||||||||||||||||||||||||||||||||||||
| Tax benefit for stock options and awards |
2 | 2 | ||||||||||||||||||||||||||||||||||||||
| Dividend reinvestment plan |
17,784 | 263 | 263 | |||||||||||||||||||||||||||||||||||||
| Dividends declared—preferred stock |
(230 | ) | (230 | ) | ||||||||||||||||||||||||||||||||||||
| Dividends paid—common stock ($0.52 per share) |
(4,281 | ) | (4,281 | ) | ||||||||||||||||||||||||||||||||||||
| Issuance of restricted stock awards |
16,500 | 243 | (243 | ) | — | |||||||||||||||||||||||||||||||||||
| Vesting of restricted stock awards |
135 | 135 | ||||||||||||||||||||||||||||||||||||||
| Redemption of preferred stock |
(15,000 | ) | (15,000 | ) | (15,000 | ) | ||||||||||||||||||||||||||||||||||
|
|
|
|
|
|
|
|
|
|
|
|
|
|
|
|
|
|
|
|
|
|||||||||||||||||||||
| Balance at December 31, 2014 |
8,000 | $ | — | 8,692,360 | $ | 87 | $ | 86,561 | $ | 63,876 | $ | (598 | ) | $ | (3,339 | ) | $ | (6,751 | ) | $ | 139,836 | |||||||||||||||||||
|
|
|
|
|
|
|
|
|
|
|
|
|
|
|
|
|
|
|
|
|
|||||||||||||||||||||
| Net income |
9,029 | 9,029 | ||||||||||||||||||||||||||||||||||||||
| Other comprehensive loss |
(511 | ) | (511 | ) | ||||||||||||||||||||||||||||||||||||
| Exercise of stock options (cashless exchanges shown net) |
42,349 | 530 | 530 | |||||||||||||||||||||||||||||||||||||
| Forfeiture of stock options |
(28 | ) | (28 | ) | ||||||||||||||||||||||||||||||||||||
| Tax benefit for stock options and awards |
38 | 38 | ||||||||||||||||||||||||||||||||||||||
| Dividend reinvestment plan |
15,211 | 218 | 218 | |||||||||||||||||||||||||||||||||||||
| Dividends declared—preferred stock |
(74 | ) | (74 | ) | ||||||||||||||||||||||||||||||||||||
| Dividends paid—common stock ($0.54 per share) |
(4,487 | ) | (4,487 | ) | ||||||||||||||||||||||||||||||||||||
| Issuance of restricted stock awards |
64,250 | 1 | 979 | (980 | ) | — | ||||||||||||||||||||||||||||||||||
| Vesting of restricted stock awards |
157 | 157 | ||||||||||||||||||||||||||||||||||||||
| Forfeiture of restricted stock awards |
(3,000 | ) | (46 | ) | 46 | — | ||||||||||||||||||||||||||||||||||
| Redemption of preferred stock |
(8,000 | ) | (8,000 | ) | (8,000 | ) | ||||||||||||||||||||||||||||||||||
|
|
|
|
|
|
|
|
|
|
|
|
|
|
|
|
|
|
|
|
|
|||||||||||||||||||||
| Balance at December 31, 2015 |
— | $ | — | 8,811,170 | $ | 88 | $ | 80,252 | $ | 68,344 | $ | (1,375 | ) | $ | (3,850 | ) | $ | (6,751 | ) | $ | 136,708 | |||||||||||||||||||
|
|
|
|
|
|
|
|
|
|
|
|
|
|
|
|
|
|
|
|
|
|||||||||||||||||||||
The accompanying notes are an integral part of these consolidated financial statements.
F-6
Table of Contents
Lake Sunapee Bank Group and Subsidiaries
Consolidated Statements of Cash Flows
(Dollars in thousands)
| For the years ended December 31, |
2015 | 2014 | 2013 | |||||||||
| Cash flows from operating activities: |
||||||||||||
| Net income |
$ | 9,029 | $ | 10,040 | $ | 8,414 | ||||||
| Adjustments to reconcile net income to net cash provided by operating activities: |
||||||||||||
| Depreciation and amortization |
2,530 | 2,396 | 1,806 | |||||||||
| Net (increase) decrease in mortgage servicing rights |
(64 | ) | 303 | (532 | ) | |||||||
| Amortization of securities, net |
286 | 430 | 781 | |||||||||
| Amortization of deferred expenses relating to issuance of capital securities and subordinated debentures |
73 | 20 | 11 | |||||||||
| Amortization (accretion) of fair value adjustments, net (loans, deposits and borrowings) |
307 | 304 | (761 | ) | ||||||||
| Amortization of intangible assets |
1,510 | 1,688 | 1,000 | |||||||||
| Loans originated for sale |
(92,141 | ) | (45,266 | ) | (93,039 | ) | ||||||
| Proceeds from loans sold |
92,708 | 44,352 | 105,576 | |||||||||
| Net gain on sales and disposals of premises, equipment, investment in real estate, other real estate owned and other assets |
70 | (197 | ) | (6 | ) | |||||||
| Impairment losses on other real estate owned |
84 | 16 | — | |||||||||
| Net gain on sales and calls of securities |
(347 | ) | (950 | ) | (964 | ) | ||||||
| Remeasurement gain in equity interest of Charter Holding Corp. |
— | — | (1,369 | ) | ||||||||
| Equity in gain of partially owned Charter Holding Corp. |
— | — | (294 | ) | ||||||||
| Provision for loan losses |
1,056 | 905 | 962 | |||||||||
| Deferred tax (benefit) expense |
(78 | ) | 1,154 | 592 | ||||||||
| Tax benefit for stock options and awards |
(38 | ) | (2 | ) | (30 | ) | ||||||
| Increase in cash surrender value of life insurance |
(636 | ) | (635 | ) | (626 | ) | ||||||
| Decrease in accrued interest receivable and other assets |
48 | 414 | 26 | |||||||||
| Net gain on sale of loans |
(755 | ) | (406 | ) | (1,234 | ) | ||||||
| Change in deferred loan origination costs, net |
(224 | ) | (424 | ) | (921 | ) | ||||||
| Increase (decrease) in accrued expenses and other liabilities |
3,555 | (2,902 | ) | 1,091 | ||||||||
|
|
|
|
|
|
|
|||||||
| Net cash provided by operating activities |
16,973 | 11,240 | 20,483 | |||||||||
|
|
|
|
|
|
|
|||||||
| Cash flows from investing activities: |
||||||||||||
| Capital expenditures—investment in real estate |
(7 | ) | — | (5 | ) | |||||||
| Capital expenditures—software |
(115 | ) | (141 | ) | (286 | ) | ||||||
| Capital expenditures—premises and equipment |
(2,352 | ) | (2,670 | ) | (4,312 | ) | ||||||
| Purchases of interest-bearing time deposits with other banks |
— | (747 | ) | — | ||||||||
| Maturities of interest-bearing time deposits with other banks |
747 | 1,743 | 499 | |||||||||
| Proceeds from sales of securities available-for-sale |
85,259 | 125,802 | 125,773 | |||||||||
| Purchases of securities available-for-sale |
(362,543 | ) | (204,318 | ) | (124,587 | ) | ||||||
| Proceeds from maturities of securities available-for-sale |
272,068 | 89,993 | 89,312 | |||||||||
| Redemption of Federal Home Loan Bank stock |
799 | 1,373 | 213 | |||||||||
| Purchases of Federal Home Loan Bank stock |
— | (2,375 | ) | — | ||||||||
| Capital distribution—Charter Holding Corp., at equity |
— | — | 340 | |||||||||
| Loan originations and principal collections, net |
(13,780 | ) | (64,821 | ) | (94,515 | ) | ||||||
| Purchases of loans |
— | (9,702 | ) | (10,479 | ) | |||||||
| Recoveries of loans previously charged off |
818 | 485 | 848 | |||||||||
| Proceeds from sales of premises, equipment, investment in real estate, other real estate and other assets |
507 | 1,673 | 874 | |||||||||
| Investment in bank owned life insurance |
(10,000 | ) | — | — | ||||||||
| Cash paid to acquire Charter Holding Corporation, net |
— | — | (3,105 | ) | ||||||||
| Cash and cash equivalents acquired from Central Financial Corporation, net of expenses and cash paid |
— | — | 17,512 | |||||||||
| Premiums paid on life insurance policies |
(10 | ) | (8 | ) | (13 | ) | ||||||
|
|
|
|
|
|
|
|||||||
| Net cash used in investing activities |
(28,609 | ) | (63,713 | ) | (1,931 | ) | ||||||
|
|
|
|
|
|
|
|||||||
F-7
Table of Contents
| For the years ended December 31, |
2015 | 2014 | 2013 | |||||||||
| Cash flows from financing activities: |
||||||||||||
| Net increase in demand deposits, savings and NOW accounts |
56,051 | 62,032 | 19,985 | |||||||||
| Net (decrease) increase in time deposits |
(51,367 | ) | 2,636 | (30,531 | ) | |||||||
| (Decrease) increase in short-term advances from Federal Home Loan Bank |
(1,000 | ) | 35,000 | (15,000 | ) | |||||||
| Principal advances from Federal Home Loan Bank |
30,000 | 40,000 | 45,000 | |||||||||
| Repayment of advances from Federal Home Loan Bank |
(20,000 | ) | (55,750 | ) | (51,000 | ) | ||||||
| Net increase (decrease) in repurchase agreements |
1,201 | (11,129 | ) | 10,664 | ||||||||
| Issuance of common stock from dividend reinvestment plan |
61 | 109 | 202 | |||||||||
| Proceeds from issuance of subordinated debentures, net of issuance costs |
— | 16,380 | — | |||||||||
| Redemption of preferred stock |
(8,000 | ) | (15,000 | ) | — | |||||||
| Dividends paid on preferred stock |
(74 | ) | (230 | ) | (316 | ) | ||||||
| Dividends paid on common stock |
(4,330 | ) | (4,127 | ) | (3,684 | ) | ||||||
| Proceeds from exercise of stock options |
530 | 92 | 514 | |||||||||
| Forfeiture of stock options |
(28 | ) | — | — | ||||||||
| Tax benefit for stock options and awards |
38 | 2 | 30 | |||||||||
|
|
|
|
|
|
|
|||||||
| Net cash provided by (used in) financing activities |
3,082 | 70,015 | (24,136 | ) | ||||||||
|
|
|
|
|
|
|
|||||||
| NET (DECREASE) INCREASE IN CASH AND CASH EQUIVALENTS |
(8,554 | ) | 17,542 | (5,584 | ) | |||||||
| CASH AND CASH EQUIVALENTS, beginning of year |
51,120 | 33,578 | 39,162 | |||||||||
|
|
|
|
|
|
|
|||||||
| CASH AND CASH EQUIVALENTS, end of year |
$ | 42,566 | $ | 51,120 | $ | 33,578 | ||||||
|
|
|
|
|
|
|
|||||||
| SUPPLEMENTAL DISCLOSURES OF CASH FLOW INFORMATION |
||||||||||||
| Interest paid |
$ | 6,931 | $ | 6,610 | $ | 6,588 | ||||||
|
|
|
|
|
|
|
|||||||
| Income taxes paid |
$ | 2,196 | $ | 3,963 | $ | 2,902 | ||||||
|
|
|
|
|
|
|
|||||||
| Loans transferred to other real estate owned |
$ | 1,169 | $ | 838 | $ | 330 | ||||||
|
|
|
|
|
|
|
|||||||
| Loans originated from sales of other real estate owned |
$ | — | $ | 496 | $ | — | ||||||
|
|
|
|
|
|
|
|||||||
| Goodwill adjustments, net |
$ | — | $ | 56 | $ | 41 | ||||||
|
|
|
|
|
|
|
|||||||
| 2013 | ||||||||
| Central Financial Corporation |
Charter Holding Corporation |
|||||||
| Acquisitions: |
||||||||
| Cash and cash equivalents acquired |
$ | 17,512 | $ | 3,095 | ||||
| Interest-bearing time deposits with other banks |
1,992 | — | ||||||
| Available-for-sale securities |
6,494 | 633 | ||||||
| Federal Home Loan Bank stock |
467 | — | ||||||
| Net loans acquired |
127,721 | — | ||||||
| Premises and equipment acquired |
2,532 | 1,365 | ||||||
| Investment in real estate |
— | — | ||||||
| Other real estate owned |
1,477 | — | ||||||
| Accrued interest receivable |
23 | — | ||||||
| Other assets acquired |
1,646 | 1,411 | ||||||
| Customer list intangible |
— | 4,036 | ||||||
| Core deposit intangible |
4,568 | — | ||||||
|
|
|
|
|
|||||
| 164,432 | 10,540 | |||||||
|
|
|
|
|
|||||
| Deposits assumed |
149,684 | — | ||||||
| Federal Home Loan Bank borrowings assumed |
2,602 | — | ||||||
| Other liabilities assumed |
791 | 1,107 | ||||||
|
|
|
|
|
|||||
| 153,077 | 1,107 | |||||||
|
|
|
|
|
|||||
| Net assets acquired |
11,355 | 9,433 | ||||||
| Merger costs |
15,985 | 12,400 | ||||||
|
|
|
|
|
|||||
| Goodwill |
$ | 4,630 | $ | 2,967 | ||||
|
|
|
|
|
|||||
The accompanying notes are an integral part of these consolidated financial statements.
F-8
Table of Contents
NOTE 1. Summary of significant accounting policies:
Nature of operations—Lake Sunapee Bank Group (the “Company”), headquartered in Newport, New Hampshire, is a Delaware corporation and is duly registered as a savings and loan holding company. The Company’s subsidiary, Lake Sunapee Bank, fsb (the “Bank”), a federal chartered savings association, operates 34 branches in Chester, Grafton, Hillsborough, Merrimack and Sullivan counties in central and western New Hampshire and Rutland, Windsor and Orange counties in central Vermont. Although the Company has a diversified portfolio, a substantial portion of its debtors’ abilities to honor their contracts is dependent on the economic health of the regions. The Company’s primary source of revenue is derived from the Bank providing loans to customers who are predominately small and middle-market businesses and individuals.
Use of estimates in the preparation of financial statements—The preparation of financial statements in conformity with accounting principles generally accepted in the United States of America (“U.S. GAAP”) requires management to make estimates and assumptions that affect the reported amounts of assets and liabilities and disclosure of contingent assets and liabilities at the date of the financial statements and the reported amounts of revenues and expenses during the reporting period. Actual results could differ from those estimates. Material estimates that are particularly susceptible to significant change are the determination of the allowance for loan losses, fair values of investment securities, goodwill and intangibles and income taxes.
Principles of consolidation—The consolidated financial statements include the accounts of the Company, the Bank, Lake Sunapee Group, Inc. (“LSGI”), which owns and maintains all buildings and investment properties; Lake Sunapee Financial Services Corp. (“LSFSC”), which sells brokerage securities and insurance products to customers; McCrillis & Eldredge Insurance, Inc. (“MEI”), a full-line independent insurance agency acquired in 2011, which offers a complete range of commercial insurance services and consumer products; and Charter Holding Corp. (“CHC”), which wholly owns Charter Trust Company (“CTC”), a trust services and wealth management company. LSGI, LSFSC, MEI, and CHC are wholly owned subsidiaries of the Bank. All significant intercompany accounts and transactions have been eliminated in consolidation.
NHTB Capital Trust II and NHTB Capital Trust III, affiliates of the Company, were formed to sell capital securities to the public through a third party trust pool. In accordance with the Financial Accounting Standards Board’s (“FASB”) Accounting Standards Codification (“ASC”) 810-10, “Consolidation—Overall,” these subsidiaries have not been included in the consolidated financial statements.
Cash and cash equivalents—For purposes of reporting cash flows, the Company considers cash and due from banks and Federal Reserve Bank interest-bearing deposit to be cash equivalents. Cash and due from banks as of December 31, 2015 and 2014 includes $10.0 million and $11.4 million, respectively, which is subject to withdrawal and usage restrictions to satisfy the reserve requirements of the Federal Reserve Bank.
Securities available-for-sale—Available-for-sale securities consist of bonds, notes, debentures, and certain equity securities. Unrealized holding gains and losses, net of tax, on available-for-sale securities are reported as a net amount in a separate component of stockholders’ equity until realized. Gains and losses on the sale of available-for-sale securities are determined using the specific-identification method.
Declines in marketable equity securities below their cost that are deemed other than temporary are reflected in earnings as realized losses. For any debt security with a fair value less than its amortized cost basis, the Company will determine whether it has the intent to sell the debt security or whether it is more likely than not it will be required to sell the debt security before the recovery of its amortized cost basis. If either condition is met, the Company will recognize a full impairment charge to earnings. For all other debt securities that are considered other-than-temporarily impaired and do not meet either condition, the credit loss portion of impairment will be recognized in earnings as realized losses. The other-than-temporary impairment related to all other factors will be recorded in other comprehensive income.
F-9
Table of Contents
Federal Home Loan Bank stock—As a member of the Federal Home Loan Bank (“FHLB”), the Company is required to invest in $100 par value stock of the FHLB. The FHLB capital structure mandates that members must own stock as determined by their Total Stock Investment Requirement which is the sum of a member’s Membership Stock Investment Requirement and Activity-Based Stock Investment Requirement. The Membership Stock Investment Requirement is calculated as 0.35% of a member’s Stock Investment Base, subject to a minimum investment of $10,000 and a maximum investment of $25,000,000. The Stock Investment Base is an amount calculated based on certain assets held by a member that are reflected on call reports submitted to applicable regulatory authorities. The Activity-Based Stock Investment Requirement is calculated as 3.0% for overnight advances, 4.0% for FHLB advances with original terms to maturity of two days to three months and 4.5% for other advances plus a percentage of advance commitments, 0.5% of standby letters of credit issued by the FHLB and 4.5% of the value of intermediated derivative contracts. Management evaluates the Company’s investment in FHLB stock for other-than-temporary impairment at least on a quarterly basis and more frequently when economic or market conditions warrant such evaluation. Based on its most recent analysis of the FHLB as of December 31, 2015, management deems its investment in FHLB stock to not be other-than-temporarily impaired.
Investment in CHC—Through September 3, 2013, the Company owned a 50% interest in CHC with one other New Hampshire bank. On September 4, 2013, the Company purchased the other bank’s ownership interest. As a result, the Bank wholly owned CHC at December 31, 2015 and December 31, 2014, and the accounts of CHC are included in the consolidated financial statements at said dates. Headquartered in Concord, New Hampshire, CHC provides trust and investment services from six offices across New Hampshire. Charter New England Agency, a subsidiary of CHC, provides life insurance, fixed and variable annuities and mutual fund products, in addition to full brokerage services.
The Bank used the equity method of accounting to account for its 50% ownership investment in CHC through September 3, 2013. An investor using the equity method initially records an investment at cost. Subsequently, the carrying amount of the investment is increased to reflect the investor’s share of income of the investee and is reduced to reflect the investor’s share of losses of the investee or dividends received from the investee. The investor’s share of the income or losses of the investee is included in the investor’s net income as the investee reports them. Adjustments similar to those made in preparing consolidated financial statements, such as elimination of intercompany gains and losses, also are applicable to the equity method.
Loans held-for-sale—Mortgage loans originated and intended for sale in the secondary market are carried at the lower of cost or estimated market value in the aggregate. Net unrealized losses are recognized through a valuation allowance by charges to income. No losses have been recorded.
Nonaccrual loans—Residential real estate loans and consumer loans are placed on nonaccrual status when they become 90 days past due. Commercial loans are placed on nonaccrual status when they become 90 days past due or when it becomes probable that the Company will be unable to collect all amounts due pursuant to the terms of the loan agreement. When a loan has been placed on nonaccrual status, previously accrued interest is reversed with a charge against interest income on loans. Interest received on nonaccrual loans is generally booked to interest income on a cash basis. Residential real estate loans and consumer loans generally are returned to accrual status when they are no longer over 90 days past due. Commercial loans are generally returned to accrual status when the collectability of principal and interest is reasonably assured.
Acquired loans—Acquired loans that have evidence of deterioration in credit quality since origination and for which it is probable, at acquisition, that all contractually required payments will not be collected are initially recorded at fair value without recording an allowance for loan losses. Fair value of the loans is determined using market participant assumptions in estimating the amount and timing of both principal and interest cash flows expected to be collected, as adjusted for an estimate of future credit losses and prepayments, and then applying a market-based discount rate to those cash flows.
F-10
Table of Contents
Under the accounting model for acquired loans, the excess of cash flows expected to be collected over the carrying amount of the loans, referred to as the “accretable yield,” is accreted into interest income over the lives of the loans using the effective yield method. The difference between contractually required principal and interest payments and the cash flows expected to be collected, referred to as the “nonaccretable difference,” includes estimates of both the impact of prepayments and future credit losses expected to be incurred over the life of the loan. As such, charge-offs on acquired loans are first applied to the nonaccretable difference and then to any allowance for loan losses recognized subsequent to acquisition.
Actual cash collections are monitored relative to management’s expectations and revised cash flow forecasts are prepared, as warranted. These revised forecasts involve updates, as necessary, of the key assumptions and estimates used in the initial estimate of fair value. Generally speaking, expected cash flows are affected by:
| • | Changes in the expected principal and interest payments over the estimated life—Updates to changes in expected cash flows are driven by the credit outlook and actions taken with borrowers. Changes in expected future cash flows resulting from loan modifications are included in the assessment of expected cash flows; |
| • | Changes in prepayment assumptions—Prepayments affect the estimated lives of the loans which may change the amount of interest income, and possibly principal, expected to be collected; and |
| • | Changes in interest rate indices for variable rate loans—Expected future cash flows are based, as applicable, on the variable rates in effect at the time of the assessment of expected cash flows. |
Allowance for loan losses—The allowance for loan losses is established as losses are estimated to have occurred through a provision for loan losses charged to earnings. Loan losses are charged against the allowance when management believes the uncollectibility of a loan balance is confirmed. Subsequent recoveries, if any, are credited to the allowance.
The allowance for loan losses is evaluated on a regular basis by management and is based upon management’s periodic review of the collectability of the loans in light of historical experience, the nature and volume of the loan portfolio, adverse situations that may affect the borrower’s ability to repay, estimated value of any underlying collateral and prevailing economic conditions. This evaluation is inherently subjective as it requires estimates that are susceptible to significant revision as more information becomes available.
General component—The general component of the allowance for loan losses is based on historical loss experience adjusted for qualitative factors stratified by the following loan segments: residential real estate and home equity, commercial real estate (owner occupied and non-owner occupied), construction, commercial and municipal and consumer (including credit card loans). Management uses a rolling average of historical losses based on a time frame appropriate to capture relevant loss data for each loan segment. This historical loss factor is adjusted for the following qualitative factors: levels/trends in delinquencies; trends in volume and terms of loans; effects of changes in risk selection and underwriting standards and other changes in lending policies, procedures and practices; experience/ability/depth of lending management and staff; concentration of credit risk and national and local economic trends and conditions. During 2015, the Company stratified the portfolio into additional segments within the existing loan types in order to identify potential risks within certain portfolio segments including home equity loans, credit card loans and by classifying commercial real estate by owner occupancy.
The qualitative factors are determined based on the various risk characteristics of each loan segment. Risk characteristics relevant to each portfolio segment are as follows:
Residential real estate: The Bank generally does not originate loans with a loan-to-value ratio greater than 80 percent and does not grant subprime loans. All loans in this segment are collateralized by owner-occupied residential real estate and repayment is dependent on the credit quality of the individual borrower. The overall health of the economy, including unemployment rates and housing prices, will have an effect on the credit quality in this segment.
F-11
Table of Contents
Home equity loans: Loans in this segment are primarily second to residential real estate loans held by the Bank and the same loan-to-value ratio is generally required as with residential real estate loans. The overall health of the economy, including unemployment rates and housing prices, will have an effect on the credit quality in this segment.
Commercial real estate – owner occupied: Loans in this segment are primarily income-producing properties that are owner occupied and are located throughout New Hampshire and Vermont. The underlying cash flows generated by the properties are adversely impacted by a downturn in the economy as evidenced by increased vacancy rates which, in turn, will have an effect on the credit quality in this segment. Management periodically obtains rent rolls and continually monitors the cash flows of these loans.
Commercial real estate – non-owner occupied: Loans in this segment are primarily income-producing properties that are non-owner occupied and located throughout New Hampshire and Vermont. The underlying cash flows generated by the properties are adversely impacted by a downturn in the economy as evidenced by increased vacancy rates which, in turn, will have an effect on the credit quality in this segment. Management periodically obtains rent rolls and continually monitors the cash flows of these loans.
Construction loans: The Bank offers construction loan financing on one-to-four family owner occupied dwellings in the Bank’s local real estate market. Generally, the Bank makes construction loans up to 80% of value with terms of up to nine months. During the construction phase, inspections are made to assess construction progress and monitor the disbursement of loan proceeds. The Bank also offers a “one-step” construction loan, which provides construction and permanent financing with one loan closing. The “one-step” is provided under the same terms and conditions of the Bank’s conventional residential program.
Commercial and municipal loans: Loans in this segment are made to businesses and are generally secured by assets of the business. Repayment is expected from the cash flows of the business. A weakened economy, and resultant decreased consumer spending, will have an effect on the credit quality in this segment.
Consumer loans: Loans in this segment are unsecured or secured by collateral such as automobiles, boats and other recreational vehicles. Repayment is dependent on the credit quality of the individual borrower.
Credit card loans: Loans in this segment are unsecured and approvals are based primarily upon debt to income ratios and the borrower’s credit score. Repayment is dependent on the credit quality of the individual borrower.
Allocated component—The allocated component relates to loans that are classified as impaired. Impairment is measured on a loan by loan basis for commercial and municipal, commercial real estate and construction loans by either the present value of expected future cash flows discounted at the loan’s effective interest rate or the fair value of the collateral if the loan is collateral dependent. An allowance is established when the discounted cash flows (or collateral value) of the impaired loan are lower than the carrying value of that loan. Large groups of smaller balance homogeneous loans are collectively evaluated for impairment. Accordingly, the Company does not separately identify individual consumer and residential real estate loans for impairment, unless such loans meet certain criteria as outlined in the Company’s loan policy or are subject to a troubled debt restructuring agreement.
A loan is considered impaired when, based on current information and events, it is probable that the Company will be unable to collect the scheduled payments of principal or interest when due according to the contractual terms of the loan agreement. Factors considered by management in determining impairment include payment status, collateral value, and the probability of collecting scheduled principal and interest payments when due. Loans that experience insignificant payment delays and payment shortfalls generally are not classified as impaired. Management determines the significance of payment delays and payment shortfalls on a case-by-case basis, taking into consideration all of the circumstances surrounding the loan and the borrower, including the
F-12
Table of Contents
length of the delay, the reasons for the delay, the borrower’s prior payment record, and the amount of the shortfall in relation to the principal and interest owed. Impairment is measured on a loan by loan basis for commercial and municipal, commercial real estate and construction loans by either the present value of expected future cash flows discounted at the loan’s effective interest rate, the loan’s obtainable market price, or the fair value of the collateral if the loan is collateral dependent.
The Company periodically may agree to modify the contractual terms of loans. When a loan is modified and a concession is made to a borrower experiencing financial difficulty, the modification is considered a troubled debt restructuring (“TDR”). All TDRs are initially classified as impaired.
Unallocated component—An unallocated component may be maintained to cover uncertainties that could affect management’s estimate of probable losses. The unallocated component of the allowance reflects the margin of imprecision inherent in the underlying assumptions used in the methodologies for estimating allocated and general reserves in the portfolio.
Deferred loan origination fees/costs—Loan origination fees, commitment fees and certain direct origination costs are deferred, and the net amount is amortized as an adjustment of the related loan’s yield. The Company amortizes these amounts over the contractual lives of the related loans.
Loan servicing—The Company recognizes as separate assets from their related loans the rights to service mortgage loans for others, either through acquisition of those rights or from the sale or securitization of loans with the servicing rights retained on those loans, based on their relative fair values. To determine the fair value of the servicing rights created, the Company uses the market prices under comparable servicing sale contracts, when available, or alternatively uses a valuation model that calculates the present value of future cash flows to determine the fair value of the servicing rights. In using this valuation method, the Company incorporates assumptions that market participants would use in estimating future net servicing income, which includes estimates of the cost of servicing loans, the discount rate, ancillary income, prepayment speeds and default rates.
Mortgage servicing rights are amortized in proportion to, and over the period of, estimated net servicing revenues. Refinance activities are considered in estimating the period’s net servicing revenues. Impairment of mortgage servicing rights is assessed based on the fair value of those rights. Fair values are estimated using discounted cash flows based on a current market interest rate. For purposes of measuring impairment, the rights are stratified based on the interest rate risk characteristics of the underlying loans. The amount of impairment recognized is the amount by which the capitalized mortgage servicing rights for a stratum exceed their fair value.
Concentration of credit risk—Most of the Company’s business activity is with customers located within the states of New Hampshire and Vermont. There are no concentrations of credit to borrowers that have similar economic characteristics. The majority of the Company’s loan portfolio is composed of loans collateralized by real estate located in the states of New Hampshire and Vermont.
Premises and equipment—Company premises and equipment are stated at cost, less accumulated depreciation. Depreciation is computed using straight-line and accelerated methods over the estimated useful lives of the assets. Estimated lives are 5 to 40 years for buildings and premises and 3 to 15 years for furniture, fixtures and equipment. Expenditures for replacements or major improvements are capitalized and expenditures for normal maintenance and repairs are charged to expense as incurred. Upon the sale or retirement of Company premises and equipment, the cost and accumulated depreciation are removed from the respective accounts and any gain or loss is included in income.
Investment in real estate—Investment in real estate is carried at the lower of cost or estimated fair value. The buildings are being depreciated over their useful lives. The properties consist of three buildings that the Company rents for commercial purposes. Rental income is recorded in income when received and expenses for maintaining these assets are charged to expense as incurred.
F-13
Table of Contents
Real estate owned and property acquired in settlement of loans— Assets acquired through, or in lieu of, loan foreclosure or repossession are held for sale and are initially recorded at fair value less estimated costs to sell at the date of foreclosure or repossession, establishing a new cost basis. Subsequently, valuations are periodically performed by management and the assets are carried at the lower of carrying amount or fair value less estimated costs to sell.
Earnings per share—Basic earnings per share represents net income available to common stockholders divided by the weighted-average number of common shares outstanding during the period. If rights to dividends on unvested options/awards are non-forfeitable, these unvested awards/options are considered outstanding in the computation of basic earnings per share. Diluted earnings per share, if applicable, reflects the potential dilution that could occur if securities or other contracts to issue common stock were exercised or converted into common stock or resulted in the issuance of common stock that then shared in the earnings of the entity.
Advertising—The Company directly expenses costs associated with advertising as they are incurred.
Income taxes—The Company recognizes income taxes under the asset and liability method. Under this method, deferred tax assets and liabilities are established for the temporary differences between the accounting basis and the tax basis of the Company’s assets and liabilities at enacted tax rates expected to be in effect when the amounts related to such temporary differences are realized or settled.
Goodwill and other intangibles—Business combinations are accounted for using the acquisition method of accounting. Accordingly, the net assets of the companies acquired are recorded at their fair values at the date of acquisition. Goodwill represents the excess of purchase price over the fair value of net assets acquired and is assigned to specific reporting units which are the same as the operating segments. Other intangible assets represent purchased assets that lack physical substance, but can be distinguished from goodwill because of contractual or other legal rights, or because the asset is capable of being sold or exchanged either on its own, or in combination with a related contract, asset, or liability.
The Company evaluates goodwill and other intangibles on an annual basis or whenever there is an indicator of impairment. Any impairment losses are charged to earnings. The Company amortizes other intangible assets over their respective estimated useful lives. The Company has estimated the remaining useful life of its insurance agency customer list intangible, trust company customer list intangible, and core deposit intangible assets to have a weighted-average of fifteen years, fifteen years, and ten years, respectively. Intangible assets are stated at cost less accumulated amortization.
Fair value of financial instruments—The following methods and assumptions were used by the Company in estimating fair values of financial instruments as disclosed herein:
Cash and cash equivalents—The carrying amounts of cash and cash equivalents approximate their fair values.
Available-for-sale securities—Fair values for available-for-sale securities are based on quoted market prices, where available. If quoted market prices are not available, fair values are based on quoted market prices of comparable instruments.
Loans held-for-sale—Fair values of loans held-for-sale are based on estimated market values.
Loans receivable—For variable-rate loans that reprice frequently and have no significant change in credit risk, fair values are based on carrying values. Fair values for all other loans are estimated using discounted cash flow analyses, using interest rates currently being offered for loans with similar terms to borrowers of similar credit quality. Fair values for impaired loans are estimated using discounted cash flow analyses or underlying collateral values, where applicable.
Investment in unconsolidated subsidiaries—Fair value of investment in unconsolidated subsidiaries is estimated using discounted cash flow analyses, using interest rates currently being offered for similar investments.
F-14
Table of Contents
Accrued interest receivable—The carrying amounts of accrued interest receivable approximate their fair values.
Deposit liabilities—The fair values disclosed for demand deposits are, by definition, equal to the amount payable on demand at the reporting date (that is, their carrying amounts). The carrying amounts of variable-rate, fixed term money-market accounts and certificates of deposits (CDs) approximate their fair values at the reporting date. Fair values for fixed-rate CDs are estimated using a discounted cash flow calculation that applies interest rates currently being offered on certificates to a schedule of aggregated expected monthly maturities on time deposits.
Federal Home Loan Bank advances—Fair values for FHLB advances are estimated using a discounted cash flow technique that applies interest rates currently being offered on advances to a schedule of aggregated expected monthly maturities on FHLB advances.
Securities sold under agreements to repurchase—The carrying amounts of securities sold under agreements to repurchase approximate their fair values.
Subordinated debentures—Fair values of subordinated debentures are estimated using discounted cash flow analyses, using interest rates currently being offered for debentures with similar terms.
Interest rate lock commitments – Fair values for interest rate lock commitments are based on quoted prices for similar loans in active markets and the likelihood that the loan in the lock position will close.
Forward sale commitments – Fair values of forward sale commitments are based on quoted prices in the market place that are observable and adjusted for inputs which are not observable.
Off-balance sheet instruments—Fair values for loan commitments have not been presented as the future revenue derived from such financial instruments is not significant.
Stock-based compensation—At December 31, 2015, the Company has one stock-based employee compensation plan under which additional shares are available to be granted. The Company accounts for this plan under ASC 718-10, “Compensation—Stock Compensation—Overall.” See Note 12.
Operating Segments—The Company’s operations are managed along two reportable segments that represent the core businesses: Banking and Wealth Management. The Banking segment provides a wide array of lending and depository-related products and services to individuals, businesses and municipal enterprises. The Banking segment also provides insurance and brokerage services through the Bank’s subsidiaries, MEI and LSFSC, respectively. The Wealth Management segment provides trust and investment services through the Bank’s subsidiaries, CHC and CTC. A summary of the financial results for each of our operating segments is included in Note 24—Operating Segments.
Recent Accounting Pronouncements— In May 2014 and August 2015, respectively, the Financial Accounting Standards Board (“FASB”) issued Accounting Standards Update (“ASU”) 2014-09 and 2015-14, “Revenue from Contracts with Customers (Topic 606).” The objective of ASU 2014-09 is to clarify principles for recognizing revenue and to develop a common revenue standard for U.S. GAAP and International Financial Reporting Standards. The guidance in ASU 2014-09 affects any entity that either enters into contracts with customers to transfer goods or services or enters into contracts for the transfer of nonfinancial assets unless those contracts are within the scope of other standards. The core principal of the guidance is that an entity should recognize revenue to depict the transfer of promised goods or services to customers in an amount that reflects the consideration to which the entity expects to be entitled in exchange for those goods or services. For public entities, the amendments in ASU 2015-14 defer the effective date of ASU 2014-09 to interim and annual reporting periods beginning after December 15, 2017. Early adoption is permitted, but not before the original effective date (i.e., interim and annual reporting periods beginning after December 15, 2016). The Company is currently reviewing ASUs 2014-09 and 2015-14 to determine if they will have an impact on its consolidated financial statements.
F-15
Table of Contents
In February 2015, FASB issued ASU 2015-02, “Consolidation (Topic 810): Amendments to the Consolidation Analysis.” The amendments in this ASU affect reporting entities that are required to evaluate whether they should consolidate certain legal entities. Specifically, the amendments: (1) modify the evaluation of whether limited partnerships and similar legal entities are variable interest entities (“VIEs”) or voting interest entities; (2) eliminate the presumption that a general partner should consolidate a limited partnership; (3) affect the consolidation analysis of reporting entities that are involved with VIEs, particularly those that have fee arrangements and related party relationships; and (4) provide a scope exception from consolidation guidance for reporting entities with interests in legal entities that are required to comply with or operate in accordance with requirements that are similar to those in Rule 2a-7 of the Investment Company Act of 1940 for registered money market funds. ASU 2015-02 is effective for interim and annual reporting periods beginning after December 15, 2015. Early adoption is permitted. The Company anticipates that the adoption of this ASU will not have a material impact on its consolidated financial statements.
In April 2015, FASB issued ASU 2015-03, “Interest—Imputation of Interest (Subtopic 835-30): Simplifying the Presentation of Debt Issuance Costs.” The amendments in this ASU require that debt issuance costs related to a recognized debt liability be presented in the balance sheet as a direct deduction from the carrying amount of that debt liability, consistent with debt discounts. The recognition and measurement guidance for debt issuance costs is not affected by the amendments in this ASU. The standard is effective for interim and annual reporting periods beginning after December 15, 2015, with early adoption permitted. The guidance should be applied on a retrospective basis. The Company anticipates that the adoption of this ASU will not have a material impact on its consolidated financial statements.
In April 2015, FASB issued ASU 2015-05, “Intangibles – Goodwill and Other—Internal-Use Software (Subtopic 350-40): Customer’s Accounting for Fees Paid in a Cloud Computing Arrangement.” This ASU provides guidance to customers about whether a cloud computing arrangement includes a software license. If a cloud computing arrangement includes a software license, the customer should account for the software license element of the arrangement consistent with the acquisition of other software licenses. If a cloud computing arrangement does not include a software license, the customer should account for the arrangement as a service contract. The new guidance does not change the accounting for a customer’s accounting for service contracts. ASU 2015-05 is effective for interim and annual reporting periods beginning after December 15, 2015. Early adoption is permitted. The Company anticipates that the adoption of this ASU will not have a material impact on its consolidated financial statements.
In August 2015, FASB issued ASU 2015-16, “Business Combinations (Topic 805): Simplifying the Accounting for Measurement-Period Adjustments.” This ASU requires the acquirer in a business combination to recognize adjustments to provisional amounts that are identified during the measurement period in the reporting period in which the adjustment amounts are determined. The amendments in the Update require the acquirer record, in the same period’s financial statements, the effect on earnings of changes in depreciation, amortization, or other income effects, if any, as a result of the change to the provisional amounts, calculated as if the accounting had been completed at the acquisition date. ASU 2015-16 is effective for interim and annual reporting periods beginning after December 15, 2015. The Company anticipates that the adoption of this ASU will not have a material impact on its consolidated financial statements.
In January 2016, FASB issued ASU 2016-01, “Financial Instruments – Overall (Subtopic 825-10): Recognition and Measurement of Financial Assets and Liabilities.” The amendments in this update make targeted improvements to GAAP as follows:
| 1. | Require equity investments (except those accounted for under the equity method of accounting or those that result in consolidation of the investee) to be measured at fair value with changes in fair value recognized in net income. However, an entity may choose to measure equity investments that do not have readily determinable fair values at cost minus impairment, if any, plus or minus changes resulting from observable price changes in orderly transactions for the identical or a similar investment of the same issuer. |
F-16
Table of Contents
| 2. | Simplify the impairment assessment of equity investments without readily determinable fair values by requiring a qualitative assessment to identify impairment. When a qualitative assessment indicates that impairment exists, an entity is required to measure the investment at fair value. |
| 3. | Eliminate the requirement to disclose the fair value of financial instruments measured at amortized cost for entities that are not public business entities. |
| 4. | Eliminate the requirement for public business entities to disclose the method(s) and significant assumptions used to estimate the fair value that is required to be disclosed for financial instruments measured at amortized cost on the balance sheet. |
| 5. | Require public business entities to use the exit price notion when measuring the fair value of financial instruments for disclosure purposes. |
| 6. | Require an entity to present separately in other comprehensive income the portion of the total change in the fair value of a liability resulting from a change in the instrument-specific credit risk when the entity has elected to measure the liability at fair value in accordance with the fair value option for financial instruments. |
| 7. | Require separate presentation of financial assets and financial liabilities by measurement category and form of financial asset (that is, securities or loans and receivables) on the balance sheet or the accompanying notes to the financial statements. |
| 8. | Clarify that an entity should evaluate the need for a valuation allowance on a deferred tax asset related to available-for-sale securities in combination with the entity’s other deferred tax assets. |
The standard is effective for interim and annual reporting periods beginning after December 15, 2017. Early adoption of item 6 above is permitted for financial statements of fiscal years or interim periods that have not yet been issued. Early adoption of other items above is not permitted. The Company anticipates that the adoption of this ASU will not have a material impact on its consolidated financial statements.
In February 2016, FASB issued ASU 2016-02, “Leases (Topic 842).” This ASU was issued to increase transparency and comparability among organizations by requiring reporting entities to recognize all leases, including operating, as lease assets and lease liabilities on the balance sheet and disclosing key information about leasing arrangements. The amendments in this ASU are effective for public entities for fiscal years beginning after December 15, 2018, including interim periods within those fiscal years. The Company anticipates that the adoption of this ASU will not have a material impact on its consolidated financial statements.
NOTE 2. Issuance of capital securities:
On March 30, 2004, NHTB Capital Trust II (“Trust II”), a Connecticut statutory trust formed by the Company, completed the sale of $10.0 million of Floating Capital Securities, adjustable every three months at LIBOR plus 2.79% (“Capital Securities II”). Trust II also issued common securities to the Company and used the net proceeds from the offering to purchase a like amount of Junior Subordinated Deferrable Interest Debentures (“Debentures II”) of the Company. Debentures II are the sole assets of Trust II. The Company used a portion of the proceeds to redeem the balance of securities issued by NHTB Capital Trust I, which were callable on September 30, 2004. The balance of the proceeds of Trust II is being used for general corporate purposes. Total expenses associated with the offering of $99 thousand and $104 thousand are included in other assets as of December 31, 2015 and 2014, respectively, and are being amortized on a straight-line basis over the life of Debentures II.
Capital Securities II accrue and pay distributions quarterly based on the stated liquidation amount of $10 per Capital Security. The Company has fully and unconditionally guaranteed all of the obligations of Trust II. The guaranty covers the quarterly distributions and payments on liquidation or redemption of Capital Securities II, but only to the extent that Trust II has funds necessary to make these payments.
F-17
Table of Contents
Capital Securities II are mandatorily redeemable upon the maturing of Debentures II on March 30, 2034 or upon earlier redemption as provided in the Indenture. The Company has the right to redeem Debentures II, in whole or in part at the liquidation amount plus any accrued but unpaid interest to the redemption date.
On March 30, 2004, NHTB Capital Trust III (“Trust III”), a Connecticut statutory trust formed by the Company, completed the sale of $10.0 million of 6.06% 5 year Fixed-Floating Capital Securities (“Capital Securities III”). Trust III also issued common securities to the Company and used the net proceeds from the offering to purchase a like amount of 6.06% Junior Subordinated Deferrable Interest Debentures (“Debentures III”) of the Company. Debentures III are the sole assets of Trust III. The Company used the proceeds to redeem the securities issued by NHTB Capital Trust I, a wholly owned subsidiary of the Company, which were callable on September 30, 2004. Total expenses associated with the offering of $99 thousand and $104 thousand are included in other assets as of December 31, 2015 and 2014, respectively, and are being amortized on a straight-line basis over the life of Debentures III.
Capital Securities III accrue and pay distributions quarterly at an annual rate of 6.06% for the first 5 years of the stated liquidation amount of $10 per Capital Security. The Company has fully and unconditionally guaranteed all of the obligations of the Trust. The guaranty covers the quarterly distributions and payments on liquidation or redemption of Capital Securities III, but only to the extent that the Trust has funds necessary to make these payments.
Capital Securities III are mandatorily redeemable upon the maturing of Debentures III on March 30, 2034 or upon earlier redemption as provided in the Indenture. The Company has the right to redeem Debentures III, in whole or in part, at the liquidation amount plus any accrued but unpaid interest to the redemption date.
On October 29, 2014, the Company entered into a Subordinated Note Purchase Agreement with certain accredited investors under which the Company issued an aggregate of $17.0 million of subordinated notes (the “Notes”) to the accredited investors. The Notes have a maturity date of November 1, 2024, and will bear interest at a fixed rate of 6.75% per annum. The Company may, at its option, beginning with the interest payment date of November 1, 2019, and on any interest payment date thereafter, redeem the Notes, in whole or in part, at par plus accrued and unpaid interest to the date of redemption. Any partial redemption will be made pro rata among all of the noteholders. The Notes are not subject to repayment at the option of the noteholders. The Notes will be unsecured, subordinated obligations of the Company and will rank junior in right of payment to the Company’s senior indebtedness and to the Company’s obligations to its general creditors.
F-18
Table of Contents
NOTE 3. Securities:
Debt and equity securities have been classified in the consolidated balance sheets according to management’s intent.
The amortized cost basis of securities and their approximate fair values are summarized as follows:
| (Dollars in thousands) | Amortized Cost Basis |
Gross Unrealized Gains |
Gross Unrealized Losses |
Fair Value |
||||||||||||
| December 31, 2015: |
||||||||||||||||
| Available-for-sale securities |
||||||||||||||||
| Bonds and notes— |
||||||||||||||||
| U.S. Treasury notes |
$ | 35,282 | $ | — | $ | 343 | $ | 34,939 | ||||||||
| U.S. Government-sponsored enterprise bonds |
7,305 | 1 | 95 | 7,211 | ||||||||||||
| Mortgage-backed securities |
70,169 | 14 | 849 | 69,334 | ||||||||||||
| Municipal bonds |
8,418 | 34 | 148 | 8,304 | ||||||||||||
| Other bonds and debentures |
108 | 4 | — | 112 | ||||||||||||
| Equity securities |
258 | 49 | 9 | 298 | ||||||||||||
|
|
|
|
|
|
|
|
|
|||||||||
| Total available-for-sale |
$ | 121,540 | $ | 102 | $ | 1,444 | $ | 120,198 | ||||||||
|
|
|
|
|
|
|
|
|
|||||||||
| December 31, 2014: |
||||||||||||||||
| Available-for-sale securities |
||||||||||||||||
| Bonds and notes— |
||||||||||||||||
| U.S. Treasury notes |
$ | 40,512 | $ | — | $ | 389 | $ | 40,123 | ||||||||
| U.S. Government-sponsored enterprise bonds |
7,361 | 2 | 98 | 7,265 | ||||||||||||
| Mortgage-backed securities |
58,439 | 112 | 271 | 58,280 | ||||||||||||
| Municipal bonds |
9,579 | 103 | 86 | 9,596 | ||||||||||||
| Other bonds and debentures |
114 | 12 | — | 126 | ||||||||||||
| Equity securities |
258 | 51 | 1 | 308 | ||||||||||||
|
|
|
|
|
|
|
|
|
|||||||||
| Total available-for-sale |
$ | 116,263 | $ | 280 | $ | 845 | $ | 115,698 | ||||||||
|
|
|
|
|
|
|
|
|
|||||||||
For the year ended December 31, 2015, proceeds from sales of securities available-for-sale amounted to $85.3 million. Gross gains of $396 thousand and gross losses of $49 thousand were realized during 2015 on sales of available-for-sale securities. The tax provision applicable to these net realized gains amounted to $137 thousand. For the year ended December 31, 2014, proceeds from sales of securities available-for-sale amounted to $125.8 million. Gross gains of $951 thousand and gross losses of $1 thousand were realized during 2014 on sales of available-for-sale securities. The tax provision applicable to these net realized gains amounted to $376 thousand. For the year ended December 31, 2013, proceeds from sales of securities available-for-sale amounted to $125.8 million. Gross gains of $1.2 million and gross losses of $222 thousand were realized during 2013 on sales of available-for-sale securities. The tax provision applicable to these net realized gains amounted to $382 thousand.
F-19
Table of Contents
Maturities of debt securities, excluding mortgage-backed securities, classified as available-for-sale are as follows as of December 31, 2015:
| (Dollars in thousands) | Fair Value |
|||
| Municipal bonds |
$ | 1,869 | ||
| Other bonds and debentures |
90 | |||
|
|
|
|||
| Total due in less than one year |
$ | 1,959 | ||
|
|
|
|||
| U.S. Treasury notes |
$ | 34,939 | ||
| U.S. Government-sponsored enterprise bonds |
6,909 | |||
| Municipal bonds |
4,541 | |||
| Total due after one year through five years |
$ | 46,389 | ||
|
|
|
|||
| U.S. Government-sponsored enterprise bonds |
$ | 143 | ||
| Municipal bonds |
728 | |||
|
|
|
|||
| Total due after five years through ten years |
$ | 871 | ||
|
|
|
|||
| U.S. Government-sponsored enterprise bonds |
$ | 159 | ||
| Municipal bonds |
1,166 | |||
| Other bonds and debentures |
22 | |||
|
|
|
|||
| Total due after ten years |
$ | 1,347 | ||
|
|
|
|||
There were no issuers of securities, other than U.S. government and agency obligations, whose aggregate carrying value exceeded 10% of stockholders’ equity as of December 31, 2015.
Securities carried at $119.8 million and $115.1 million were pledged to secure public deposits, Federal Home Loan Bank advances and securities sold under agreements to repurchase as of December 31, 2015 and 2014, respectively.
The aggregate fair value and unrealized losses of securities that have been in a continuous unrealized loss position for less than 12 months and for 12 months or more, and are not other-than-temporarily impaired, are as follows as of December 31:
| Less than 12 Months | 12 Months or Longer | Total | ||||||||||||||||||||||
| (Dollars in thousands) | Fair Value |
Unrealized Losses |
Fair Value |
Unrealized Losses |
Fair Value |
Unrealized Losses |
||||||||||||||||||
| December 31, 2015: |
||||||||||||||||||||||||
| Bonds and notes— |
||||||||||||||||||||||||
| U.S. Treasury notes |
$ | 24,817 | $ | 199 | $ | 10,122 | $ | 144 | $ | 34,939 | $ | 343 | ||||||||||||
| U.S. Government-sponsored enterprise bonds |
2,967 | 33 | 4,101 | 62 | 7,068 | 95 | ||||||||||||||||||
| Mortgage-backed securities |
56,351 | 592 | 11,681 | 257 | 68,032 | 849 | ||||||||||||||||||
| Municipal bonds |
1,420 | 38 | 2,208 | 110 | 3,628 | 148 | ||||||||||||||||||
| Equity securities |
53 | 9 | — | — | 53 | 9 | ||||||||||||||||||
|
|
|
|
|
|
|
|
|
|
|
|
|
|||||||||||||
| Total temporarily impaired securities |
$ | 85,608 | $ | 871 | $ | 28,112 | $ | 573 | $ | 113,720 | $ | 1,444 | ||||||||||||
|
|
|
|
|
|
|
|
|
|
|
|
|
|||||||||||||
F-20
Table of Contents
| Less than 12 Months | 12 Months or Longer | Total | ||||||||||||||||||||||
| (Dollars in thousands) | Fair Value |
Unrealized Losses |
Fair Value |
Unrealized Losses |
Fair Value |
Unrealized Losses |
||||||||||||||||||
| December 31, 2014: |
||||||||||||||||||||||||
| Bonds and notes— |
||||||||||||||||||||||||
| U.S. Treasury notes |
$ | 10,112 | $ | 53 | $ | 20,012 | $ | 336 | $ | 30,124 | $ | 389 | ||||||||||||
| U.S. Government-sponsored enterprise bonds |
— | — | 7,077 | 98 | 7,077 | 98 | ||||||||||||||||||
| Mortgage-backed securities |
12,109 | 14 | 13,675 | 257 | 25,784 | 271 | ||||||||||||||||||
| Municipal bonds |
— | — | 3,554 | 86 | 3,554 | 86 | ||||||||||||||||||
| Equity securities |
42 | 1 | — | — | 42 | 1 | ||||||||||||||||||
|
|
|
|
|
|
|
|
|
|
|
|
|
|||||||||||||
| Total temporarily impaired securities |
$ | 22,263 | $ | 68 | $ | 44,318 | $ | 777 | $ | 66,581 | $ | 845 | ||||||||||||
|
|
|
|
|
|
|
|
|
|
|
|
|
|||||||||||||
The investments in the Company’s investment portfolio that are temporarily impaired as of December 31, 2015 consist of bonds and mortgage-backed securities issued by U.S. government—sponsored enterprises and agencies, municipal bonds, U.S. Treasury notes and equity securities. The unrealized losses on these 39 debt securities are primarily attributable to changes in market interest rates and current market inefficiencies. As Company management has the ability and intent to hold debt securities until maturity, no declines are deemed to be other-than-temporary. The unrealized losses on 9 equity securities have occurred for less than 12 months and the Company does not feel the losses relate to credit quality of the issuers. The Company has the ability and intent to hold these investments until a recovery of cost basis.
NOTE 4. Loans receivable:
Loans receivable consisted of the following as of December 31:
| 2015 | 2014 | |||||||||||||||||||||||
| (Dollars in thousands) | Originated | Acquired | Total | Originated | Acquired | Total | ||||||||||||||||||
| Real estate: |
||||||||||||||||||||||||
| Conventional |
$ | 600,763 | $ | 41,895 | $ | 642,658 | $ | 592,386 | $ | 53,304 | $ | 645,690 | ||||||||||||
| Home equity |
66,708 | 5,547 | 72,255 | 63,176 | 6,027 | 69,203 | ||||||||||||||||||
| Commercial |
259,834 | 63,434 | 323,268 | 235,640 | 77,377 | 313,017 | ||||||||||||||||||
| Construction |
33,663 | 1,255 | 34,918 | 34,988 | 1,457 | 36,445 | ||||||||||||||||||
|
|
|
|
|
|
|
|
|
|
|
|
|
|||||||||||||
| 960,968 | 112,131 | 1,073,099 | 926,190 | 138,165 | 1,064,355 | |||||||||||||||||||
| Commercial and municipal loans |
133,596 | 8,925 | 142,521 | 125,161 | 13,414 | 138,575 | ||||||||||||||||||
| Consumer loans |
5,411 | 1,077 | 6,488 | 7,438 | 1,712 | 9,150 | ||||||||||||||||||
|
|
|
|
|
|
|
|
|
|
|
|
|
|||||||||||||
| Total loans |
1,099,975 | 122,133 | 1,222,108 | 1,058,789 | 153,291 | 1,212,080 | ||||||||||||||||||
| Allowance for loan losses |
(8,607 | ) | (298 | ) | (8,905 | ) | (9,269 | ) | — | (9,269 | ) | |||||||||||||
| Deferred loan origination costs, net |
4,258 | — | 4,258 | 4,034 | — | 4,034 | ||||||||||||||||||
|
|
|
|
|
|
|
|
|
|
|
|
|
|||||||||||||
| Loans receivable, net |
$ | 1,095,626 | $ | 121,835 | $ | 1,217,461 | $ | 1,053,554 | $ | 153,291 | $ | 1,206,845 | ||||||||||||
|
|
|
|
|
|
|
|
|
|
|
|
|
|||||||||||||
Certain directors and executive officers of the Company and companies in which they have significant ownership interest were customers of the Bank during 2015. Total outstanding loan balances to such persons and their companies amounted to $848 thousand as of December 31, 2015. During 2015, principal advances of $339 thousand were made and principal payments totaled $270 thousand.
F-21
Table of Contents
The following tables set forth information regarding the allowance for loan and lease losses by portfolio segment as of and for the years ended December 31:
| Real Estate: | Consumer | Unallocated | Total | |||||||||||||||||||||||||
| (Dollars in thousands) | Conventional and Home Equity |
Commercial | Construction | Commercial and Municipal |
||||||||||||||||||||||||
| December 31, 2015: |
||||||||||||||||||||||||||||
| Allowance for loan losses: |
||||||||||||||||||||||||||||
| Originated: |
||||||||||||||||||||||||||||
| Beginning balance |
$ | 4,763 | $ | 2,724 | $ | 991 | $ | 635 | $ | 86 | $ | 70 | $ | 9,269 | ||||||||||||||
| Charge-offs |
(465 | ) | (769 | ) | — | (29 | ) | (203 | ) | — | (1,466 | ) | ||||||||||||||||
| Recoveries |
108 | 475 | — | 76 | 120 | — | 779 | |||||||||||||||||||||
| (Benefit) provision |
(209 | ) | 454 | (794 | ) | 517 | 65 | (8 | ) | 25 | ||||||||||||||||||
|
|
|
|
|
|
|
|
|
|
|
|
|
|
|
|||||||||||||||
| Ending balance |
$ | 4,197 | $ | 2,884 | $ | 197 | $ | 1,199 | $ | 68 | $ | 62 | $ | 8,607 | ||||||||||||||
|
|
|
|
|
|
|
|
|
|
|
|
|
|
|
|||||||||||||||
| Acquired: |
||||||||||||||||||||||||||||
| Beginning balance |
$ | — | $ | — | $ | — | $ | — | $ | — | $ | — | $ | — | ||||||||||||||
| Charge-offs |
(301 | ) | (420 | ) | — | (31 | ) | (20 | ) | — | (772 | ) | ||||||||||||||||
| Recoveries |
9 | 1 | — | 20 | 9 | — | 39 | |||||||||||||||||||||
| Provision (benefit) |
355 | 609 | 21 | 35 | 11 | — | 1,031 | |||||||||||||||||||||
|
|
|
|
|
|
|
|
|
|
|
|
|
|
|
|||||||||||||||
| Ending balance |
$ | 63 | $ | 190 | $ | 21 | $ | 24 | $ | — | $ | — | $ | 298 | ||||||||||||||
|
|
|
|
|
|
|
|
|
|
|
|
|
|
|
|||||||||||||||
| Originated: |
||||||||||||||||||||||||||||
| Individually evaluated for impairment |
$ | 200 | $ | 133 | $ | 15 | $ | 7 | $ | — | $ | — | $ | 355 | ||||||||||||||
| Collectively evaluated for impairment |
3,997 | 2,751 | 182 | 1,192 | 68 | 62 | 8,252 | |||||||||||||||||||||
| Acquired loans: |
||||||||||||||||||||||||||||
| (discounts related to credit quality) |
63 | 190 | 21 | 24 | — | — | 298 | |||||||||||||||||||||
|
|
|
|
|
|
|
|
|
|
|
|
|
|
|
|||||||||||||||
| Total allowance for loan losses ending balance |
$ | 4,260 | $ | 3,074 | $ | 218 | $ | 1,223 | $ | 68 | $ | 62 | $ | 8,905 | ||||||||||||||
|
|
|
|
|
|
|
|
|
|
|
|
|
|
|
|||||||||||||||
| Loans: |
||||||||||||||||||||||||||||
| Originated: |
||||||||||||||||||||||||||||
| Individually evaluated for impairment |
$ | 6,707 | $ | 5,078 | $ | 442 | $ | 732 | $ | — | $ | — | $ | 12,959 | ||||||||||||||
| Collectively evaluated for impairment |
660,764 | 254,756 | 33,221 | 132,864 | 5,411 | — | 1,087,016 | |||||||||||||||||||||
| Acquired loans: |
||||||||||||||||||||||||||||
| (discounts related to credit quality) |
47,442 | 63,434 | 1,255 | 8,925 | 1,077 | — | 122,133 | |||||||||||||||||||||
|
|
|
|
|
|
|
|
|
|
|
|
|
|
|
|||||||||||||||
| Total loans ending balance |
$ | 714,913 | $ | 323,268 | $ | 34,918 | $ | 142,521 | $ | 6,488 | $ | — | $ | 1,222,108 | ||||||||||||||
|
|
|
|
|
|
|
|
|
|
|
|
|
|
|
|||||||||||||||
F-22
Table of Contents
| Real Estate: | Consumer | Unallocated | Total | |||||||||||||||||||||||||
| (Dollars in thousands) | Conventional and Home Equity |
Commercial | Construction | Commercial and Municipal |
||||||||||||||||||||||||
| December 31, 2014: |
||||||||||||||||||||||||||||
| Allowance for loan losses: |
||||||||||||||||||||||||||||
| Originated: |
||||||||||||||||||||||||||||
| Beginning balance |
$ | 5,385 | $ | 2,143 | $ | 353 | $ | 1,561 | $ | 75 | $ | 240 | $ | 9,757 | ||||||||||||||
| Charge-offs |
(681 | ) | (533 | ) | — | (445 | ) | (219 | ) | — | (1,878 | ) | ||||||||||||||||
| Recoveries |
314 | 1 | — | 57 | 113 | — | 485 | |||||||||||||||||||||
| (Benefit) provision |
(255 | ) | 1,113 | 638 | (538 | ) | 117 | (170 | ) | 905 | ||||||||||||||||||
|
|
|
|
|
|
|
|
|
|
|
|
|
|
|
|||||||||||||||
| Ending balance |
$ | 4,763 | $ | 2,724 | $ | 991 | $ | 635 | $ | 86 | $ | 70 | $ | 9,269 | ||||||||||||||
|
|
|
|
|
|
|
|
|
|
|
|
|
|
|
|||||||||||||||
| Acquired: |
||||||||||||||||||||||||||||
| Beginning balance |
$ | — | $ | — | $ | — | $ | — | $ | — | $ | — | $ | — | ||||||||||||||
| Charge-offs |
— | — | — | — | — | — | — | |||||||||||||||||||||
| Recoveries |
— | — | — | — | — | — | — | |||||||||||||||||||||
| Provision (benefit) |
— | — | — | — | — | — | — | |||||||||||||||||||||
|
|
|
|
|
|
|
|
|
|
|
|
|
|
|
|||||||||||||||
| Ending balance |
$ | — | $ | — | $ | — | $ | — | $ | — | $ | — | $ | — | ||||||||||||||
|
|
|
|
|
|
|
|
|
|
|
|
|
|
|
|||||||||||||||
| Originated: |
||||||||||||||||||||||||||||
| Individually evaluated for impairment |
$ | 50 | $ | 17 | $ | — | $ | — | $ | — | $ | — | $ | 67 | ||||||||||||||
| Collectively evaluated for impairment |
4,713 | 2,707 | 991 | 635 | 86 | 70 | 9,202 | |||||||||||||||||||||
| Acquired loans: |
||||||||||||||||||||||||||||
| (discounts related to credit quality) |
— | — | — | — | — | — | — | |||||||||||||||||||||
|
|
|
|
|
|
|
|
|
|
|
|
|
|
|
|||||||||||||||
| Total allowance for loan losses ending balance |
$ | 4,763 | $ | 2,724 | $ | 991 | $ | 635 | $ | 86 | $ | 70 | $ | 9,269 | ||||||||||||||
|
|
|
|
|
|
|
|
|
|
|
|
|
|
|
|||||||||||||||
| Loans: |
||||||||||||||||||||||||||||
| Originated: |
||||||||||||||||||||||||||||
| Individually evaluated for impairment |
$ | 5,965 | $ | 8,110 | $ | 1,163 | $ | 880 | $ | — | $ | — | $ | 16,118 | ||||||||||||||
| Collectively evaluated for impairment |
649,597 | 227,530 | 33,825 | 124,281 | 7,438 | — | 1,042,671 | |||||||||||||||||||||
| Acquired loans: |
||||||||||||||||||||||||||||
| (discounts related to credit quality) |
59,331 | 77,377 | 1,457 | 13,414 | 1,712 | — | 153,291 | |||||||||||||||||||||
|
|
|
|
|
|
|
|
|
|
|
|
|
|
|
|||||||||||||||
| Total loans ending balance |
$ | 714,893 | $ | 313,017 | $ | 36,445 | $ | 138,575 | $ | 9,150 | $ | — | $ | 1,212,080 | ||||||||||||||
|
|
|
|
|
|
|
|
|
|
|
|
|
|
|
|||||||||||||||
F-23
Table of Contents
| Real Estate: | Commercial and Municipal |
Consumer | Unallocated | Total | ||||||||||||||||||||||||
| (Dollars in thousands) | Conventional and Home Equity |
Commercial | Construction | |||||||||||||||||||||||||
| December 31, 2013: |
||||||||||||||||||||||||||||
| Allowance for loan losses: |
||||||||||||||||||||||||||||
| Originated: |
||||||||||||||||||||||||||||
| Beginning balance |
$ | 4,897 | $ | 3,616 | $ | 208 | $ | 918 | $ | 58 | $ | 226 | $ | 9,923 | ||||||||||||||
| Charge-offs |
(851 | ) | (593 | ) | — | (302 | ) | (230 | ) | — | (1,976 | ) | ||||||||||||||||
| Recoveries |
267 | 284 | — | 154 | 142 | — | 847 | |||||||||||||||||||||
| Provision (benefit) |
1,072 | (1,164 | ) | 145 | 791 | 105 | 14 | 963 | ||||||||||||||||||||
|
|
|
|
|
|
|
|
|
|
|
|
|
|
|
|||||||||||||||
| Ending balance |
$ | 5,385 | $ | 2,143 | $ | 353 | $ | 1,561 | $ | 75 | $ | 240 | $ | 9,757 | ||||||||||||||
|
|
|
|
|
|
|
|
|
|
|
|
|
|
|
|||||||||||||||
| Acquired: |
||||||||||||||||||||||||||||
| Beginning balance |
$ | — | $ | — | $ | — | $ | — | $ | — | $ | — | $ | — | ||||||||||||||
| Charge-offs |
— | — | — | — | — | — | — | |||||||||||||||||||||
| Recoveries |
— | — | — | — | — | — | — | |||||||||||||||||||||
| Provision (benefit) |
— | — | — | — | — | — | — | |||||||||||||||||||||
|
|
|
|
|
|
|
|
|
|
|
|
|
|
|
|||||||||||||||
| Ending balance |
$ | — | $ | — | $ | — | $ | — | $ | — | $ | — | $ | — | ||||||||||||||
|
|
|
|
|
|
|
|
|
|
|
|
|
|
|
|||||||||||||||
| Originated: |
||||||||||||||||||||||||||||
| Individually evaluated for impairment |
$ | 71 | $ | 116 | $ | — | $ | 10 | $ | — | $ | — | $ | 197 | ||||||||||||||
| Collectively evaluated for impairment |
5,314 | 2,027 | 353 | 1,551 | 75 | 240 | 9,560 | |||||||||||||||||||||
| Acquired loans: |
||||||||||||||||||||||||||||
| (discounts related to credit quality) |
— | — | — | — | — | — | — | |||||||||||||||||||||
|
|
|
|
|
|
|
|
|
|
|
|
|
|
|
|||||||||||||||
| Total allowance for loan losses ending balance |
$ | 5,385 | $ | 2,143 | $ | 353 | $ | 1,561 | $ | 75 | $ | 240 | $ | 9,757 | ||||||||||||||
|
|
|
|
|
|
|
|
|
|
|
|
|
|
|
|||||||||||||||
| Loans: |
||||||||||||||||||||||||||||
| Originated: |
||||||||||||||||||||||||||||
| Individually evaluated for impairment |
$ | 6,716 | $ | 11,363 | $ | 1,494 | $ | 1,582 | $ | — | $ | — | $ | 21,155 | ||||||||||||||
| Collectively evaluated for impairment |
593,608 | 187,378 | 24,568 | 119,674 | 6,829 | — | 932,057 | |||||||||||||||||||||
| Acquired loans: |
||||||||||||||||||||||||||||
| (discounts related to credit quality) |
72,510 | 89,072 | 3,660 | 18,815 | 2,988 | — | 187,045 | |||||||||||||||||||||
|
|
|
|
|
|
|
|
|
|
|
|
|
|
|
|||||||||||||||
| Total loans ending balance |
$ | 672,834 | $ | 287,813 | $ | 29,722 | $ | 140,071 | $ | 9,817 | $ | — | $ | 1,140,257 | ||||||||||||||
|
|
|
|
|
|
|
|
|
|
|
|
|
|
|
|||||||||||||||
F-24
Table of Contents
The following tables set forth information regarding nonaccrual and past due loans as of December 31, 2015 and December 31, 2014:
| (Dollars in thousands) | 30-59 Days | 60-89 Days | 90 Days or More Past Due |
Total Past Due |
Total Current |
Total | 90 Days or More Past Due and Accruing |
Nonaccrual Loans |
||||||||||||||||||||||||
| December 31, 2015: |
||||||||||||||||||||||||||||||||
| Originated: |
||||||||||||||||||||||||||||||||
| Real estate: |
||||||||||||||||||||||||||||||||
| Conventional |
$ | 1,644 | $ | 1,309 | $ | 1,454 | $ | 4,407 | $ | 596,356 | $ | 600,763 | $ | — | $ | 2,310 | ||||||||||||||||
| Home equity |
180 | — | 166 | 346 | 66,362 | 66,708 | — | 166 | ||||||||||||||||||||||||
| Commercial |
1,028 | 482 | 309 | 1,819 | 258,015 | 259,834 | — | 1,565 | ||||||||||||||||||||||||
| Construction |
24 | — | — | 24 | 33,639 | 33,663 | — | — | ||||||||||||||||||||||||
| Commercial and municipal |
89 | 50 | 584 | 723 | 132,873 | 133,596 | — | 584 | ||||||||||||||||||||||||
| Consumer (including credit card) |
16 | 7 | — | 23 | 5,388 | 5,411 | — | — | ||||||||||||||||||||||||
|
|
|
|
|
|
|
|
|
|
|
|
|
|
|
|
|
|||||||||||||||||
| Total |
$ | 2,981 | $ | 1,848 | $ | 2,513 | $ | 7,342 | $ | 1,092,633 | $ | 1,099,975 | $ | — | $ | 4,625 | ||||||||||||||||
|
|
|
|
|
|
|
|
|
|
|
|
|
|
|
|
|
|||||||||||||||||
| Acquired: |
||||||||||||||||||||||||||||||||
| Real estate: |
||||||||||||||||||||||||||||||||
| Conventional |
$ | 514 | $ | 238 | $ | 654 | $ | 1,406 | $ | 40,489 | $ | 41,895 | $ | — | $ | 707 | ||||||||||||||||
| Home equity |
12 | — | 17 | 29 | 5,518 | 5,547 | — | 17 | ||||||||||||||||||||||||
| Commercial |
386 | — | 677 | 1,063 | 62,371 | 63,434 | — | 677 | ||||||||||||||||||||||||
| Construction |
— | — | — | — | 1,255 | 1,255 | — | — | ||||||||||||||||||||||||
| Commercial and municipal |
5 | — | — | 5 | 8,920 | 8,925 | — | — | ||||||||||||||||||||||||
| Consumer (including credit card) |
6 | 12 | — | 18 | 1,059 | 1,077 | — | — | ||||||||||||||||||||||||
|
|
|
|
|
|
|
|
|
|
|
|
|
|
|
|
|
|||||||||||||||||
| Total |
$ | 923 | $ | 250 | $ | 1,348 | $ | 2,521 | $ | 119,612 | $ | 122,133 | $ | — | $ | 1,401 | ||||||||||||||||
|
|
|
|
|
|
|
|
|
|
|
|
|
|
|
|
|
|||||||||||||||||
| Total Loans: |
||||||||||||||||||||||||||||||||
| Real estate: |
||||||||||||||||||||||||||||||||
| Conventional |
$ | 2,158 | $ | 1,547 | $ | 2,108 | $ | 5,813 | $ | 636,845 | $ | 642,658 | $ | — | $ | 3,017 | ||||||||||||||||
| Home equity |
192 | — | 183 | 375 | 71,880 | 72,255 | — | 183 | ||||||||||||||||||||||||
| Commercial |
1,414 | 482 | 986 | 2,882 | 320,386 | 323,268 | — | 2,242 | ||||||||||||||||||||||||
| Construction |
24 | — | — | 24 | 34,894 | 34,918 | — | — | ||||||||||||||||||||||||
| Commercial and municipal |
94 | 50 | 584 | 728 | 141,793 | 142,521 | — | 584 | ||||||||||||||||||||||||
| Consumer (including credit card) |
22 | 19 | 1 | 42 | 6,446 | 6,488 | — | — | ||||||||||||||||||||||||
|
|
|
|
|
|
|
|
|
|
|
|
|
|
|
|
|
|||||||||||||||||
| Total |
$ | 3,904 | $ | 2,098 | $ | 3,862 | $ | 9,864 | $ | 1,212,244 | $ | 1,222,108 | $ | — | $ | 6,026 | ||||||||||||||||
|
|
|
|
|
|
|
|
|
|
|
|
|
|
|
|
|
|||||||||||||||||
F-25
Table of Contents
| (Dollars in thousands) | 30-59 Days | 60-89 Days | 90 Days or More Past Due |
Total Past Due |
Total Current |
Total | 90 Days or More Past Due and Accruing |
Nonaccrual Loans |
||||||||||||||||||||||||
| December 31, 2014: |
||||||||||||||||||||||||||||||||
| Originated: |
||||||||||||||||||||||||||||||||
| Real estate: |
||||||||||||||||||||||||||||||||
| Conventional |
$ | 2,639 | $ | 810 | $ | 1,080 | $ | 4,529 | $ | 587,857 | $ | 592,386 | $ | — | $ | 1,577 | ||||||||||||||||
| Home equity |
60 | 31 | 181 | 272 | 62,904 | 63,176 | — | 181 | ||||||||||||||||||||||||
| Commercial |
1,683 | 365 | 672 | 2,720 | 232,920 | 235,640 | — | 2,290 | ||||||||||||||||||||||||
| Construction |
— | 28 | — | 28 | 34,960 | 34,988 | — | — | ||||||||||||||||||||||||
| Commercial and municipal |
304 | 48 | 330 | 682 | 124,479 | 125,161 | — | 659 | ||||||||||||||||||||||||
| Consumer (including credit card) |
34 | 6 | — | 40 | 7,398 | 7,438 | — | — | ||||||||||||||||||||||||
|
|
|
|
|
|
|
|
|
|
|
|
|
|
|
|
|
|||||||||||||||||
| Total |
$ | 4,720 | $ | 1,288 | $ | 2,263 | $ | 8,271 | $ | 1,050,518 | $ | 1,058,789 | $ | — | $ | 4,707 | ||||||||||||||||
|
|
|
|
|
|
|
|
|
|
|
|
|
|
|
|
|
|||||||||||||||||
| Acquired: |
||||||||||||||||||||||||||||||||
| Real estate: |
||||||||||||||||||||||||||||||||
| Conventional |
$ | 907 | $ | 589 | $ | 352 | $ | 1,848 | $ | 51,456 | $ | 53,304 | $ | — | $ | 849 | ||||||||||||||||
| Home equity |
— | — | — | — | 6,027 | 6,027 | — | — | ||||||||||||||||||||||||
| Commercial |
545 | 1,107 | 671 | 2,323 | 75,054 | 77,377 | — | 1,636 | ||||||||||||||||||||||||
| Construction |
— | — | 15 | 15 | 1,442 | 1,457 | — | 15 | ||||||||||||||||||||||||
| Commercial and municipal |
1 | 415 | — | 416 | 12,998 | 13,414 | — | 120 | ||||||||||||||||||||||||
| Consumer (including credit card) |
37 | 15 | — | 52 | 1,660 | 1,712 | — | — | ||||||||||||||||||||||||
|
|
|
|
|
|
|
|
|
|
|
|
|
|
|
|
|
|||||||||||||||||
| Total |
$ | 1,490 | $ | 2,126 | $ | 1,038 | $ | 4,654 | $ | 148,637 | $ | 153,291 | $ | — | $ | 2,620 | ||||||||||||||||
|
|
|
|
|
|
|
|
|
|
|
|
|
|
|
|
|
|||||||||||||||||
| Total Loans: |
||||||||||||||||||||||||||||||||
| Real estate: |
||||||||||||||||||||||||||||||||
| Conventional |
$ | 3,546 | $ | 1,399 | $ | 1,432 | $ | 6,377 | $ | 639,313 | $ | 645,690 | $ | — | $ | 2,426 | ||||||||||||||||
| Home equity |
60 | 31 | 181 | 272 | 68,931 | 69,203 | — | 181 | ||||||||||||||||||||||||
| Commercial |
2,228 | 1,472 | 1,343 | 5,043 | 307,974 | 313,017 | — | 3,926 | ||||||||||||||||||||||||
| Construction |
— | 28 | 15 | 43 | 36,402 | 36,445 | — | 15 | ||||||||||||||||||||||||
| Commercial and municipal |
305 | 463 | 330 | 1,098 | 137,477 | 138,575 | — | 779 | ||||||||||||||||||||||||
| Consumer (including credit card) |
71 | 21 | — | 92 | 9,058 | 9,150 | — | — | ||||||||||||||||||||||||
|
|
|
|
|
|
|
|
|
|
|
|
|
|
|
|
|
|||||||||||||||||
| Total |
$ | 6,210 | $ | 3,414 | $ | 3,301 | $ | 12,925 | $ | 1,199,155 | $ | 1,212,080 | $ | — | $ | 7,327 | ||||||||||||||||
|
|
|
|
|
|
|
|
|
|
|
|
|
|
|
|
|
|||||||||||||||||
F-26
Table of Contents
As of December 31, 2015, the Company’s impaired loans consist of certain loans, including all TDRs. The following tables summarizes, by class of loan, information related to impaired loans as of December 31, 2015 and December 31, 2014:
| (Dollars in thousands) | Recorded Investment |
Unpaid Principal Balance |
Related Allowance |
Average Recorded Investment |
Interest Income Recognized |
|||||||||||||||
| December 31, 2015: |
||||||||||||||||||||
| With no related allowance recorded: |
||||||||||||||||||||
| Real estate: |
||||||||||||||||||||
| Conventional |
$ | 3,175 | $ | 3,895 | $ | — | $ | 4,083 | $ | 128 | ||||||||||
| Home equity |
213 | 340 | — | 183 | 11 | |||||||||||||||
| Commercial |
2,589 | 3,028 | — | 3,273 | 144 | |||||||||||||||
| Construction |
— | — | — | 278 | — | |||||||||||||||
| Commercial and municipal |
691 | 696 | — | 629 | 29 | |||||||||||||||
|
|
|
|
|
|
|
|
|
|
|
|||||||||||
| Total impaired with no related allowance |
$ | 6,668 | $ | 7,959 | $ | — | $ | 8,446 | $ | 312 | ||||||||||
|
|
|
|
|
|
|
|
|
|
|
|||||||||||
| With an allowance recorded: |
||||||||||||||||||||
| Real estate: |
||||||||||||||||||||
| Conventional |
$ | 3,319 | $ | 3,548 | $ | 231 | $ | 2,348 | $ | 159 | ||||||||||
| Commercial |
2,489 | 2,546 | 133 | 1,311 | 77 | |||||||||||||||
| Construction |
442 | 476 | 15 | 337 | 18 | |||||||||||||||
| Commercial and municipal |
41 | 42 | 7 | 34 | 3 | |||||||||||||||
|
|
|
|
|
|
|
|
|
|
|
|||||||||||
| Total impaired with an allowance recorded |
$ | 6,291 | $ | 6,612 | $ | 386 | $ | 4,030 | $ | 257 | ||||||||||
|
|
|
|
|
|
|
|
|
|
|
|||||||||||
| Total |
||||||||||||||||||||
| Real estate: |
||||||||||||||||||||
| Conventional |
$ | 6,494 | $ | 7,443 | $ | 231 | $ | 6,431 | $ | 287 | ||||||||||
| Home equity |
213 | 340 | — | 183 | 11 | |||||||||||||||
| Commercial |
5,078 | 5,574 | 133 | 4,584 | 221 | |||||||||||||||
| Construction |
442 | 476 | 15 | 615 | 18 | |||||||||||||||
| Commercial and municipal |
732 | 738 | 7 | 663 | 32 | |||||||||||||||
|
|
|
|
|
|
|
|
|
|
|
|||||||||||
| Total impaired loans |
$ | 12,959 | $ | 14,571 | $ | 386 | $ | 12,476 | $ | 569 | ||||||||||
|
|
|
|
|
|
|
|
|
|
|
|||||||||||
F-27
Table of Contents
| (Dollars in thousands) | Recorded Investment |
Unpaid Principal Balance |
Related Allowance |
Average Recorded Investment |
Interest Income Recognized |
|||||||||||||||
| December 31, 2014: |
||||||||||||||||||||
| With no related allowance recorded: |
||||||||||||||||||||
| Real estate: |
||||||||||||||||||||
| Conventional |
$ | 5,447 | $ | 6,028 | $ | — | $ | 5,735 | $ | 342 | ||||||||||
| Home equity |
181 | 264 | — | 232 | 5 | |||||||||||||||
| Commercial |
7,383 | 8,151 | — | 8,093 | 379 | |||||||||||||||
| Construction |
1,163 | 1,185 | — | 1,233 | 53 | |||||||||||||||
| Commercial and municipal |
880 | 1,204 | — | 1,118 | 77 | |||||||||||||||
|
|
|
|
|
|
|
|
|
|
|
|||||||||||
| Total impaired with no related allowance |
$ | 15,054 | $ | 16,832 | $ | — | $ | 16,411 | $ | 856 | ||||||||||
|
|
|
|
|
|
|
|
|
|
|
|||||||||||
| With an allowance recorded: |
||||||||||||||||||||
| Real estate: |
||||||||||||||||||||
| Conventional |
$ | 337 | $ | 370 | $ | 50 | $ | 546 | $ | 17 | ||||||||||
| Commercial |
727 | 727 | 17 | 1,539 | 32 | |||||||||||||||
| Commercial and municipal |
— | — | — | 350 | — | |||||||||||||||
|
|
|
|
|
|
|
|
|
|
|
|||||||||||
| Total impaired with an allowance recorded |
$ | 1,064 | $ | 1,097 | $ | 67 | $ | 2,435 | $ | 49 | ||||||||||
|
|
|
|
|
|
|
|
|
|
|
|||||||||||
| Total |
||||||||||||||||||||
| Real estate: |
||||||||||||||||||||
| Conventional |
$ | 5,784 | $ | 6,398 | $ | 50 | $ | 6,281 | $ | 359 | ||||||||||
| Home equity |
181 | 264 | — | 232 | 5 | |||||||||||||||
| Commercial |
8,110 | 8,878 | 17 | 9,632 | 411 | |||||||||||||||
| Construction |
1,163 | 1,185 | — | 1,233 | 53 | |||||||||||||||
| Commercial and municipal |
880 | 1,204 | — | 1,468 | 77 | |||||||||||||||
|
|
|
|
|
|
|
|
|
|
|
|||||||||||
| Total impaired loans |
$ | 16,118 | $ | 17,929 | $ | 67 | $ | 18,846 | $ | 905 | ||||||||||
|
|
|
|
|
|
|
|
|
|
|
|||||||||||
The recorded investment of conventional real estate loans in the process of foreclosure was $1.2 million at December 31, 2015. OREO was $904 thousand, representing three residential properties and two commercial properties, at December 31, 2015, compared to $251 thousand, representing two residential OREO properties and property acquired in settlement of loans at December 31, 2014.
The carrying amount of acquired loans at December 31, 2015 totaled $121.9 million. A subset of these loans was determined to have evidence of credit deterioration at acquisition date, which is accounted for in accordance with ASC 310-30. These purchased credit-impaired loans maintain a carrying value of $2.4 million and an outstanding principal balance of $3.1 million at December 31, 2015. These loans are evaluated for impairment through the periodic reforecasting of expected cash flows.
The carrying amount of acquired loans at December 31, 2014 totaled $153.3 million. A subset of these loans was determined to have evidence of credit deterioration at acquisition date, which is accounted for in accordance with ASC 310-30. These purchased credit-impaired loans maintain a carrying value of $2.7 million and an outstanding principal balance of $3.1 million at December 31, 2014. These loans are evaluated for impairment through the periodic reforecasting of expected cash flows.
F-28
Table of Contents
The following table presents the Company’s activity in the accretable yield for the purchased credit impaired loans during the years ended December 31:
| (Dollars in thousands) | December 31, 2015 |
December 31, 2014 |
||||||
| Accretable yield at the beginning of the period |
$ | 2,125 | $ | 2,723 | ||||
| Reclassification from nonaccretable difference for loans with improved cash flows |
348 | — | ||||||
| Accretion |
(260 | ) | (598 | ) | ||||
|
|
|
|
|
|||||
| Accretable yield at the end of the period |
$ | 2,213 | $ | 2,125 | ||||
|
|
|
|
|
|||||
The following table presents modified loans by class that were determined to be TDRs that occurred during the years ended December 31:
| (Dollars in thousands) | Number of Contracts |
Pre-Modification Outstanding Recorded Investment |
Post-Modification Outstanding Recorded Investment |
|||||||||
| December 31, 2015: |
||||||||||||
| Troubled Debt Restructurings: |
||||||||||||
| Real estate: |
||||||||||||
| Conventional |
6 | $ | 979 | $ | 979 | |||||||
| Home equity |
1 | 30 | 30 | |||||||||
| Commercial |
3 | 1,157 | 1,157 | |||||||||
| Commercial and municipal |
1 | 7 | 7 | |||||||||
|
|
|
|
|
|
|
|||||||
| 11 | $ | 2,173 | $ | 2,173 | ||||||||
|
|
|
|
|
|
|
|||||||
| (Dollars in thousands) | Number of Contracts |
Pre-Modification Outstanding Recorded Investment |
Post-Modification Outstanding Recorded Investment |
|||||||||
| December 31, 2014: |
||||||||||||
| Troubled Debt Restructurings: |
||||||||||||
| Real estate: |
||||||||||||
| Conventional |
16 | $ | 1,257 | $ | 1,257 | |||||||
| Commercial |
4 | 991 | 991 | |||||||||
| Construction |
1 | 95 | 95 | |||||||||
| Commercial and municipal |
1 | 35 | 35 | |||||||||
|
|
|
|
|
|
|
|||||||
| 22 | $ | 2,378 | $ | 2,378 | ||||||||
|
|
|
|
|
|
|
|||||||
Troubled debt restructured loans and leases are considered impaired and are included in the previous impaired loan disclosures in this footnote. As of December 31, 2015 and 2014, the Company has not committed to lend additional amounts to customers with outstanding loans and leases that are classified as troubled debt restructurings.
During the years ended December 31, 2015 and 2014, certain loans and lease modifications were executed which constituted troubled debt restructurings. Substantially all of these modifications included one or a combination of the following: an extension of the maturity date at a stated rate of interest lower than the current market rate for new debt with similar risk; temporary reduction in the interest rate; or change in scheduled payment amount.
F-29
Table of Contents
The following tables present information on how loans were modified as TDRs during the years ended December 31:
| (Dollars in thousands) | Extended Maturity |
Interest Rate |
Interest Rate and Maturity |
Combination of Interest Only Payments and Maturity |
Combination of Interest Only Payments, Rate and Maturity |
Total | ||||||||||||||||||
| December 31, 2015: |
||||||||||||||||||||||||
| Real estate: |
||||||||||||||||||||||||
| Conventional |
$ | 243 | $ | — | $ | 51 | $ | 287 | $ | 398 | $ | 979 | ||||||||||||
| Home equity |
30 | — | — | — | — | 30 | ||||||||||||||||||
| Commercial |
— | — | 1,085 | — | 72 | 1,157 | ||||||||||||||||||
| Commercial and municipal |
— | 7 | — | — | — | 7 | ||||||||||||||||||
|
|
|
|
|
|
|
|
|
|
|
|
|
|||||||||||||
| Total TDRs |
$ | 273 | $ | 7 | $ | 1,136 | $ | 287 | $ | 470 | $ | 2,173 | ||||||||||||
|
|
|
|
|
|
|
|
|
|
|
|
|
|||||||||||||
| (Dollars in thousands) | Extended Maturity |
Combination of Payments, Rate And Maturity |
Combination of Interest Only Payments and Maturity |
Combination of Interest Rate, Maturity and Reamortized |
Other (a) | Total | ||||||||||||||||||
| December 31, 2014: |
||||||||||||||||||||||||
| Real estate: |
||||||||||||||||||||||||
| Conventional |
$ | — | $ | 516 | $ | 619 | $ | 122 | $ | — | $ | 1,257 | ||||||||||||
| Commercial |
211 | 210 | — | — | 570 | 991 | ||||||||||||||||||
| Construction |
— | — | 95 | — | — | 95 | ||||||||||||||||||
| Commercial and municipal |
— | — | — | — | 35 | 35 | ||||||||||||||||||
|
|
|
|
|
|
|
|
|
|
|
|
|
|||||||||||||
| Total TDRs |
$ | 211 | $ | 726 | $ | 714 | $ | 122 | $ | 605 | $ | 2,378 | ||||||||||||
|
|
|
|
|
|
|
|
|
|
|
|
|
|||||||||||||
There were four new TDRs that have subsequently defaulted during the year ended December 31, 2015 including one residential loan totaling $240 thousand which is on nonaccrual as of December 31, 2015. All TDRs are individually evaluated for impairment. There are 27 TDRs with an impairment measurement totaling $368 thousand, included in specific allowances as of December 31, 2015.
There were no new TDRs that have subsequently defaulted during the year ended December 31, 2014. All TDRs are individually evaluated for impairment. There are three TDRs with an impairment measurement totaling $53 thousand, included in specific allowances as of December 31, 2014.
F-30
Table of Contents
The following tables present the Company’s loans by risk rating as of December 31:
| Real Estate: | Commercial and Municipal |
Consumer | Total | |||||||||||||||||||||
| (Dollars in thousands) | Conventional and Home Equity |
Commercial | Construction | |||||||||||||||||||||
| December 31, 2015: |
||||||||||||||||||||||||
| Originated |
||||||||||||||||||||||||
| Grade: |
||||||||||||||||||||||||
| Pass |
$ | — | $ | 222,466 | $ | 19,208 | $ | 111,653 | $ | — | $ | 353,327 | ||||||||||||
| Special mention |
— | 4,278 | 18 | 112 | — | 4,408 | ||||||||||||||||||
| Substandard |
5,272 | 7,670 | 567 | 416 | — | 13,925 | ||||||||||||||||||
| Loans not formally rated |
662,199 | 25,420 | 13,870 | 21,415 | 5,411 | 728,315 | ||||||||||||||||||
|
|
|
|
|
|
|
|
|
|
|
|
|
|||||||||||||
| Total |
$ | 667,471 | $ | 259,834 | $ | 33,663 | $ | 133,596 | $ | 5,411 | $ | 1,099,975 | ||||||||||||
|
|
|
|
|
|
|
|
|
|
|
|
|
|||||||||||||
| Acquired |
||||||||||||||||||||||||
| Grade: |
||||||||||||||||||||||||
| Pass |
$ | — | $ | 56,212 | $ | 1,047 | $ | 8,031 | $ | — | $ | 65,290 | ||||||||||||
| Special mention |
— | 1,643 | — | — | — | 1,643 | ||||||||||||||||||
| Substandard |
1,038 | 4,097 | 92 | 509 | — | 5,736 | ||||||||||||||||||
| Loans not formally rated |
46,404 | 1,482 | 116 | 385 | 1,077 | 49,464 | ||||||||||||||||||
|
|
|
|
|
|
|
|
|
|
|
|
|
|||||||||||||
| Total |
$ | 47,442 | $ | 63,434 | $ | 1,255 | $ | 8,925 | $ | 1,077 | $ | 122,133 | ||||||||||||
|
|
|
|
|
|
|
|
|
|
|
|
|
|||||||||||||
| (Dollars in thousands) | ||||||||||||||||||||||||
| December 31, 2014: |
||||||||||||||||||||||||
| Originated |
||||||||||||||||||||||||
| Grade: |
||||||||||||||||||||||||
| Pass |
$ | — | $ | 205,158 | $ | 19,798 | $ | 99,705 | $ | — | $ | 324,661 | ||||||||||||
| Special mention |
— | 2,952 | 35 | 850 | — | 3,837 | ||||||||||||||||||
| Substandard |
4,790 | 11,944 | 2,384 | 359 | — | 19,477 | ||||||||||||||||||
| Loans not formally rated |
650,772 | 15,586 | 12,771 | 24,247 | 7,438 | 710,814 | ||||||||||||||||||
|
|
|
|
|
|
|
|
|
|
|
|
|
|||||||||||||
| Total |
$ | 655,562 | $ | 235,640 | $ | 34,988 | $ | 125,161 | $ | 7,438 | $ | 1,058,789 | ||||||||||||
|
|
|
|
|
|
|
|
|
|
|
|
|
|||||||||||||
| Acquired |
||||||||||||||||||||||||
| Grade: |
||||||||||||||||||||||||
| Pass |
$ | — | $ | 64,441 | $ | 924 | $ | 10,676 | $ | — | $ | 76,041 | ||||||||||||
| Special mention |
— | 5,600 | — | 401 | — | 6,001 | ||||||||||||||||||
| Substandard |
863 | 5,693 | 389 | 1,811 | — | 8,756 | ||||||||||||||||||
| Loans not formally rated |
58,468 | 1,643 | 144 | 526 | 1,712 | 62,493 | ||||||||||||||||||
|
|
|
|
|
|
|
|
|
|
|
|
|
|||||||||||||
| Total |
$ | 59,331 | $ | 77,377 | $ | 1,457 | $ | 13,414 | $ | 1,712 | $ | 153,291 | ||||||||||||
|
|
|
|
|
|
|
|
|
|
|
|
|
|||||||||||||
Credit Quality Information
The Company utilizes an eight-grade internal loan rating system for commercial real estate, construction and commercial and municipal loans as follows:
Loans rated 10-37: Loans in these categories are considered “pass” rated loans with low to average risk.
Loans rated 40: Loans in this category are considered “special mention.” These loans are starting to show signs of potential weakness and are being closely monitored by management.
Loans rated 50: Loans in this category are considered “substandard.” Generally, a loan is considered substandard if it is inadequately protected by the current net worth and paying capacity of the obligors and/or the collateral pledged. There is a distinct possibility that the Company will sustain some loss if the weakness is not corrected.
F-31
Table of Contents
Loans rated 60: Loans in this category are considered “doubtful.” Loans classified as doubtful have all the weaknesses inherent in those classified substandard with the added characteristic that the weaknesses make collection or liquidation in full, on the basis of currently existing facts, highly questionable and improbable.
Loans rated 70: Loans in this category are considered uncollectible (“loss”) and of such little value that their continuance as loans is not warranted.
On an annual basis, or more often if needed, the Company formally reviews the ratings on all commercial real estate, construction and commercial and municipal loans over $250 thousand. For residential real estate and consumer loans, the Company initially assesses credit quality based upon the borrower’s ability to pay and subsequently monitors these loans based on the borrower’s payment activity.
Loan Servicing Rights
In addition to total loans previously shown, the Company services loans for other financial institutions. Participation loans are loans originated by the Company for a group of banks. Sold loans are loans originated by the Company and sold to the secondary market. The Company services these loans and remits the payments received to the buyer. The Company specifically originates long-term, fixed-rate loans to sell. The amount of loans sold and participated out which are serviced by the Company are as follows as of December 31:
| (Dollars in thousands) | 2015 | 2014 | ||||||
| Sold loans |
$ | 445,855 | $ | 411,583 | ||||
|
|
|
|
|
|||||
| Participation loans |
$ | 28,280 | $ | 31,147 | ||||
|
|
|
|
|
|||||
The balance of capitalized servicing rights, net of valuation allowances, included in other assets at December 31, 2015 and 2014 was $2.4 million and $2.4 million, respectively.
Servicing rights of $1.1 million, $518 thousand and $1.6 million were capitalized in 2015, 2014 and 2013, respectively. Amortization of capitalized servicing rights was $1.0 million, $867 thousand, and $1.0 million in 2015, 2014, and 2013, respectively.
The fair value of capitalized servicing rights was $4.0 million and $4.2 million as of December 31, 2015 and 2014, respectively. Following is an analysis of the aggregate changes in the valuation allowances for capitalized servicing rights:
| (Dollars in thousands) | 2015 | 2014 | ||||||
| Balance, beginning of year |
$ | 19 | $ | 65 | ||||
| Additions |
81 | 4 | ||||||
| Reductions |
(27 | ) | (50 | ) | ||||
|
|
|
|
|
|||||
| Balance, end of year |
$ | 73 | $ | 19 | ||||
|
|
|
|
|
|||||
F-32
Table of Contents
NOTE 5. Premises and equipment:
Premises and equipment are shown on the consolidated balance sheets at cost, net of accumulated depreciation, as follows as of December 31:
| (Dollars in thousands) | 2015 | 2014 | ||||||
| Land and land improvements |
$ | 3,229 | $ | 3,235 | ||||
| Buildings and premises |
26,961 | 26,441 | ||||||
| Furniture, fixtures and equipment |
13,859 | 13,961 | ||||||
| Premises and equipment in process |
271 | 357 | ||||||
|
|
|
|
|
|||||
| 44,320 | 43,994 | |||||||
| Less—accumulated depreciation |
19,899 | 19,603 | ||||||
|
|
|
|
|
|||||
| $ | 24,421 | $ | 24,391 | |||||
|
|
|
|
|
|||||
Depreciation expense amounted to $2.2 million, $2.1 million and $1.5 million for the years ending December 31, 2015, 2014 and 2013, respectively.
NOTE 6. Investment in real estate:
The balance in investment in real estate consisted of the following as of December 31:
| (Dollars in thousands) | 2015 | 2014 | ||||||
| Land and land improvements |
$ | 412 | $ | 412 | ||||
| Buildings and premises |
4,170 | 4,163 | ||||||
|
|
|
|
|
|||||
| 4,582 | 4,575 | |||||||
| Less—accumulated depreciation |
1,190 | 1,042 | ||||||
|
|
|
|
|
|||||
| $ | 3,392 | $ | 3,533 | |||||
|
|
|
|
|
|||||
Rental income from investment in real estate amounted to $310 thousand, $308 thousand and $309 thousand for the years ended December 31, 2015, 2014 and 2013, respectively. Depreciation expense amounted to $148 thousand, $148 thousand and $153 thousand for the years ending December 31, 2015, 2014 and 2013, respectively.
NOTE 7. Deposits:
Deposits are summarized as follows as of December 31:
| (Dollars in thousands) | 2015 | 2014 | ||||||
| Demand deposits |
$ | 127,428 | $ | 117,889 | ||||
| Savings |
253,349 | 233,697 | ||||||
| N.O.W. |
359,376 | 333,984 | ||||||
| Money market |
105,286 | 103,817 | ||||||
| Time deposits |
311,913 | 363,327 | ||||||
|
|
|
|
|
|||||
| $ | 1,157,352 | $ | 1,152,714 | |||||
|
|
|
|
|
|||||
F-33
Table of Contents
The following is a summary of maturities of time deposits as of December 31, 2015:
| (Dollars in thousands) | ||||
| 2016 |
$ | 211,352 | ||
| 2017 |
38,773 | |||
| 2018 |
37,822 | |||
| 2019 |
16,317 | |||
| 2020 |
7,649 | |||
|
|
|
|||
| Total |
$ | 311,913 | ||
|
|
|
|||
Interest expense by major category of interest-bearing deposits is summarized as follows for the years ended December 31:
| (Dollars in thousands) | 2015 | 2014 | 2013 | |||||||||
| Time deposits |
$ | 2,943 | $ | 3,635 | $ | 3,283 | ||||||
| N.O.W. |
297 | 259 | 248 | |||||||||
| Money market |
334 | 314 | 297 | |||||||||
| Savings |
339 | 256 | 227 | |||||||||
|
|
|
|
|
|
|
|||||||
| $ | 3,913 | $ | 4,464 | $ | 4,055 | |||||||
|
|
|
|
|
|
|
|||||||
Deposits from related parties held by the Bank as of December 31, 2015 and 2014 amounted to $2.7 million and $3.7 million, respectively.
As of December 31, 2015 and 2014, time deposits include $27.6 million and $48.4 million, respectively, of certificates of deposit with a minimum balance of $250 thousand. Generally, deposits in excess of $250 thousand are not federally insured.
The aggregate amount of brokered time deposits as of December 31, 2015 and 2014 was $50.8 million and $51.1 million, respectively and are not included in time deposits accounts in denominations of $250 thousand or more, above.
NOTE 8. Federal Home Loan Bank advances and letters of credit:
Advances consist of funds borrowed from the FHLB.
Maturities of advances from the FHLB for the years ending after December 31, 2015 are summarized as follows:
| (Dollars in thousands) | ||||
| 2016 |
$ | 90,000 | ||
| 2018 |
30,000 | |||
| 2019 |
20,000 | |||
| 2020 |
10,000 | |||
|
|
|
|||
| $ | 150,000 | |||
|
|
|
|||
F-34
Table of Contents
As of December 31, 2015, the following advances from the FHLB were redeemable at par at the option of the FHLB (dollars in thousands):
| Maturity Date |
Optional Redemption Date |
Amount | ||||
| April 30, 2018 |
January 28, 2016 and quarterly thereafter | $ | 10,000 | |||
| March 26, 2019 |
March 29, 2016 one time call | $ | 10,000 | |||
| March 26, 2020 |
March 29, 2016 one time call | $ | 10,000 | |||
| September 30, 2019 |
September 29, 2016 one time call | $ | 10,000 | |||
At December 31, 2015, the interest rates on FHLB advances ranged from 0.28% to 2.54%. The weighted average interest rate at December 31, 2015 was 0.84%.
At December 31, 2015 and December 31, 2014, the Company had $48.8 million and $44.2 million, respectively, of stand-by letters of credit issued by the FHLB to secure customer deposits.
At December 31, 2015 and 2014, the Company had a $5 million line of credit available through the FHLB. There were no advances on this line outstanding as of December 31, 2015 and 2014.
Borrowings, including letters of credit, from the FHLB are secured by a blanket lien on qualified collateral, consisting primarily of loans with first mortgages secured by one-to-four family properties, certain unencumbered investment securities and other qualified assets.
NOTE 9. Securities sold under agreements to repurchase:
The securities sold under agreements to repurchase are securities sold on a short-term basis by the Bank that have been accounted for not as sales but as borrowings. The securities consisted of debt securities issued by the U.S. Treasury and government-sponsored enterprises, mortgage-backed securities and municipal bonds. The securities were held in the Bank’s safekeeping account at the Federal Home Loan Bank of Boston under the control of the Bank and pledged to the purchasers of the securities. The purchasers have agreed to sell to the Bank substantially identical securities at the maturity of the agreements.
The following table represents the Company’s short-term collateralized financing obtained through repurchase agreements and the related collateral pledged as of the periods indicated:
| (Dollars in thousands) | December 31, 2015 |
|||
| Repurchase agreements collateral |
||||
| U.S. Treasury notes |
$ | 20,973 | ||
| U.S. Government-sponsored enterprise bonds |
414 | |||
| Mortgage-backed securities |
2,896 | |||
| Municipal bonds |
729 | |||
|
|
|
|||
| Total |
$ | 25,012 | ||
|
|
|
|||
| Repurchase agreements |
$ | 17,957 | ||
NOTE 10. Income taxes:
The components of income tax expense are as follows for the years ended December 31:
| (Dollars in thousands) | 2015 | 2014 | 2013 | |||||||||
| Current tax expense |
$ | 3,676 | $ | 2,410 | $ | 2,535 | ||||||
| Deferred tax (benefit) expense |
(78 | ) | 1,154 | 592 | ||||||||
|
|
|
|
|
|
|
|||||||
| Total income tax expense |
$ | 3,598 | $ | 3,564 | $ | 3,127 | ||||||
|
|
|
|
|
|
|
|||||||
F-35
Table of Contents
The reasons for the differences between the tax at the statutory federal income tax rate and the effective tax rates are summarized as follows for the years ended December 31:
| 2015 | 2014 | 2013 | ||||||||||
| % of Income |
% of Income |
% of Income |
||||||||||
| Federal income tax at statutory rate |
34.0 | % | 34.0 | % | 34.0 | % | ||||||
| Increase (decrease) in tax resulting from: |
||||||||||||
| Tax-exempt income |
(5.8 | ) | (5.7 | ) | (6.8 | ) | ||||||
| Dividends received deduction |
(0.2 | ) | (0.1 | ) | (1.0 | ) | ||||||
| Federal tax credits |
(1.8 | ) | (2.4 | ) | (0.3 | ) | ||||||
| Merger related expenses |
— | — | 2.3 | |||||||||
| Other, net |
2.3 | 0.4 | (1.1 | ) | ||||||||
|
|
|
|
|
|
|
|||||||
| Effective tax rates |
28.5 | % | 26.2 | % | 27.1 | % | ||||||
|
|
|
|
|
|
|
|||||||
The Company had gross deferred tax assets and gross deferred tax liabilities as follows as of December 31:
| (Dollars in thousands) | 2015 | 2014 | ||||||
| Deferred tax assets: |
||||||||
| Interest on non-performing loans |
$ | 276 | $ | 216 | ||||
| Allowance for loan losses |
3,118 | 3,203 | ||||||
| Deferred compensation |
843 | 804 | ||||||
| Deferred retirement expense |
1,676 | 1,478 | ||||||
| Restricted stock awards |
73 | 37 | ||||||
| Accrued directors fees |
11 | 16 | ||||||
| Accrued group health contingency |
15 | 12 | ||||||
| Write-down of other real estate owned |
14 | 13 | ||||||
| Net unrealized loss on available-for-sale securities |
532 | 224 | ||||||
| Unrecognized employee benefits under ASC 715-10 |
1,992 | 1,966 | ||||||
| Other |
106 | 262 | ||||||
|
|
|
|
|
|||||
| Gross deferred tax assets |
8,656 | 8,231 | ||||||
|
|
|
|
|
|||||
| Deferred tax liabilities: |
||||||||
| Deferred loan costs, net of fees |
(1,653 | ) | (1,621 | ) | ||||
| Prepaid pension |
(1,628 | ) | (1,662 | ) | ||||
| Accelerated depreciation |
(947 | ) | (805 | ) | ||||
| Purchased goodwill |
(3,729 | ) | (3,729 | ) | ||||
| Mortgage servicing rights |
(901 | ) | (864 | ) | ||||
| Core deposit intangibles and other market value adjustments |
(2,096 | ) | (2,313 | ) | ||||
| Other |
(312 | ) | (259 | ) | ||||
|
|
|
|
|
|||||
| Gross deferred tax liabilities |
(11,266 | ) | (11,253 | ) | ||||
|
|
|
|
|
|||||
| Net deferred tax liability |
$ | (2,610 | ) | $ | (3,022 | ) | ||
|
|
|
|
|
|||||
It is the Company’s policy to provide for uncertain tax positions and the related interest and penalties based upon management’s assessment of whether a tax benefit is more likely than not to be sustained upon examination by tax authorities. As of December 31, 2015 and 2014, there were no material uncertain tax positions related to federal and state income tax matters. The Company is currently open to audit under the statute of limitations by the Internal Revenue Service and state taxing authorities for the years ended December 31, 2012 through December 31, 2015.
F-36
Table of Contents
NOTE 11. Derivative Instruments and Hedging Activities
The Company’s mortgage banking activities include interest rate lock commitments (“IRLCs”) and forward sales commitments that result in derivative financial instruments. IRLCs are provided on applications for residential mortgages intended for resale and are accounted for as non-hedging derivatives. The Company arranges offsetting forward sales commitments for these rate-locks, which are designated as economic hedges.
The IRLCs generally terminate once the loan is funded, the lock period expires or the borrower decides not to contract for the loan. The forward commitments generally terminate once the loan is sold, the commitment period expires or the borrower decides not to contract for the loan.
The following table summarizes the fair values of derivative financial instruments in the consolidated balance sheet as of December 31, 2015. There were no IRLCs and forward sale commitments recorded at December 31, 2014.
| (Dollars in thousands) | December 31, 2015 | |||||||
| Notional Amount |
Fair Value Asset/(Liability) |
|||||||
| Interest rate lock commitments |
$ | 4,623 | $ | 32 | ||||
| Forward loan sale commitments |
$ | 5,135 | $ | (14 | ) | |||
NOTE 12. Stock compensation plans:
During December 31, 2015, the Company had two fixed stock-based employee compensation plans, the 2014 Stock Incentive Plan (the “2014 Plan”) and the 2004 Stock Incentive Plan (the “2004 Plan” and collectively, the “Plans”).
As of December 31, 2015, 410,000 shares were available to be granted under the 2014 Plan in the form of grants of options or shares of restricted stock. As of December 31, 2015, there were no options and 93,950 restricted stock non-vested awards outstanding under the 2004 Plan. There are currently no outstanding options under the 2014 Plan.
Under the 2004 Plan, the exercise price of each option equals the market price of the Company’s stock on the date of grant and an option’s maximum term is 10 years. Options were exercisable immediately upon grant. No modifications have been made to the terms of the option agreements.
A summary of the options issued pursuant to the 2004 Plan as of December 31, 2015, 2014 and 2013 and changes during the years ending on those dates is presented below:
| 2015 | 2014 | 2013 | ||||||||||||||||||||||
| Shares | Weighted- Average Exercise Price |
Shares | Weighted- Average Exercise Price |
Shares | Weighted- Average Exercise Price |
|||||||||||||||||||
| Outstanding at beginning of year |
113,500 | $ | 13.39 | 123,000 | $ | 13.38 | 245,000 | $ | 13.23 | |||||||||||||||
| Forfeited |
(7,500 | ) | 15.30 | (2,500 | ) | 13.25 | (18,600 | ) | 13.15 | |||||||||||||||
| Exercised |
(106,000 | ) | 13.25 | (7,000 | ) | 13.25 | (103,400 | ) | 13.07 | |||||||||||||||
|
|
|
|
|
|
|
|||||||||||||||||||
| Outstanding at end of year |
— | $ | — | 113,500 | $ | 13.39 | 123,000 | $ | 13.38 | |||||||||||||||
|
|
|
|
|
|
|
|||||||||||||||||||
| Options exercisable at year-end |
— | 113,500 | 123,000 | |||||||||||||||||||||
| Weighted-average fair value of options granted during the year |
— | — | — | |||||||||||||||||||||
F-37
Table of Contents
The Company granted 64,250 shares of restricted stock to officers of the Company effective June 11, 2015. The restricted stock was granted under the 2014 Stock Incentive Plan and awarded officers shares of restricted common stock of the Company. In 2015, 3,000 shares of the awarded restricted stock shares were forfeited, leaving 61,250 shares of restricted stock outstanding at December 31, 2015. The restricted stock vests ratably over a five-year period beginning June 11, 2016. Compensation expense relating to the restricted stock awards is based on the grant-date fair value of $15.25 per share and amounted to $93 thousand for the year ending December 31, 2015. The remaining unrecognized compensation expense at December 31, 2015 of $840 thousand will be recognized over the next 4.4 years.
The Company granted 15,000 shares of restricted stock to10 directors effective May 1, 2014. The restricted stock was granted under the 2004 Plan and awards directors shares of restricted common stock of the Company. The restricted stock vests ratably over a five-year period beginning on May 1, 2015. Compensation expense relating to the restricted stock awards is based on the grant-date fair value of $14.75 per share and amounted to $44 thousand for the year ending December 31, 2015 and $30 thousand for the year ending December 31, 2014. The remaining unrecognized compensation expense at December 31, 2015 of $148 thousand will be recognized over the next 3.3 years.
The Company granted 1,500 shares of restricted stock to one director effective May 1, 2014 under the 2004 Plan. The restricted stock was immediately vested on the grant date. Compensation expense relating to the restricted stock awards is based on the grant-date fair value of $14.75 per share and amounted to $22 thousand for the year ending December 31, 2014.
The Company granted a total of 4,500 shares of restricted stock to a non-executive employee effective March 1, 2013. The restricted stock was granted under the 2004 Plan. The restricted stock vests ratably over a five-year period beginning on March 1, 2014. Compensation expense relating to these restricted stock awards is based on the grant-date fair value of $13.50 per share and amounted to $12 thousand for the years ending December 31, 2015 and December 31, 2014 and $10 thousand for the year ending December 31, 2013. The remaining unrecognized compensation expense at December 31, 2015 of $27 thousand will be recognized over the next 2.2 years.
The Company granted a total of 10,000 shares of restricted stock to the Executive Chairman effective May 1, 2013. The restricted stock was granted under the 2004 Plan. The restricted stock vests ratably over a five-year period beginning on May 1, 2014. Compensation expense relating to these restricted stock awards is based on the grant-date fair value of $12.81 per share and amounted to $26 thousand for the years ending December 31, 2015 and December 31, 2014 and $17 thousand for the year ending December 31, 2013. The remaining unrecognized compensation expense at December 31, 2015 of $59 thousand will be recognized over the next 2.3 years.
The Company granted a total of 35,000 shares of restricted stock to seven directors effective June 14, 2012. The restricted stock was granted under the 2004 Plan and awards directors shares of restricted common stock of the Company. In 2012, 5,000 shares of the awarded restricted stock shares were forfeited, leaving 30,000 shares of restricted stock outstanding at December 31, 2015. The restricted stock vests ratably over a five-year period beginning on June 13, 2013. Compensation expense relating to the restricted stock awards is based on the grant-date fair value of $12.56 per share and amounted to $75 thousand for the years ending December 31, 2015, December 31, 2014 and December 31, 2013. The remaining unrecognized compensation expense at December 31, 2015 of $113 thousand will be recognized over the next 1.5 years.
NOTE 13. Employee benefit plans:
Defined Benefit Pension Plan
The Company has a defined benefit pension plan covering substantially all full-time employees who have attained age 21 and have completed one year of service. Annual contributions to the plan are based on actuarial estimates. In December 2006, the Company elected to suspend the plan so that employees no longer earn additional benefits for future service under this plan.
F-38
Table of Contents
The following tables set forth information about the plan for the years ended December 31, 2015, 2014 and 2013:
| (Dollars in thousands) | 2015 | 2014 | 2013 | |||||||||
| Change in projected benefit obligation: |
||||||||||||
| Benefit obligation at beginning of year |
$ | 8,974 | $ | 6,961 | $ | 7,507 | ||||||
| Interest cost |
373 | 341 | 332 | |||||||||
| Actuarial (gain) loss |
(349 | ) | 2,069 | (648 | ) | |||||||
| Benefits paid |
(248 | ) | (247 | ) | (220 | ) | ||||||
| Settlements |
(167 | ) | (150 | ) | (10 | ) | ||||||
|
|
|
|
|
|
|
|||||||
| Benefit obligation at end of year |
8,583 | 8,974 | 6,961 | |||||||||
|
|
|
|
|
|
|
|||||||
| Change in plan assets: |
||||||||||||
| Plan assets at estimated fair value at beginning of year |
8,179 | 8,186 | 7,361 | |||||||||
| Actual return on plan assets |
(132 | ) | 390 | 1,055 | ||||||||
| Benefits paid |
(248 | ) | (247 | ) | (220 | ) | ||||||
| Settlements |
(167 | ) | (150 | ) | (10 | ) | ||||||
|
|
|
|
|
|
|
|||||||
| Fair value of plan assets at end of year |
7,632 | 8,179 | 8,186 | |||||||||
|
|
|
|
|
|
|
|||||||
| Funded status |
$ | (951 | ) | $ | (795 | ) | $ | 1,225 | ||||
|
|
|
|
|
|
|
|||||||
Amounts recognized in accumulated other comprehensive loss, before tax effect, consist of unrecognized net actuarial losses of $5.0 million for the years ending December 31, 2015 and December 31, 2014.
The discount rate and rate of increase in future compensation levels used in determining the actuarial present value of the projected benefit obligation were 4.40% and 0%, respectively, at December 31, 2015, 4.24% and 0%, respectively, at December 31, 2014, and 5.00% and 0%, respectively, at December 31, 2013.
The accumulated benefit obligation for the defined benefit pension plan was $8.6 million and $9.0 million at December 31, 2015 and 2014, respectively.
Components of net periodic pension cost (benefit) and other comprehensive loss (income) for the years ended December 31:
| (Dollars in thousands) | 2015 | 2014 | 2013 | |||||||||
| Interest cost on benefit obligation |
$ | 373 | $ | 341 | $ | 332 | ||||||
| Expected return on assets |
(640 | ) | (646 | ) | (579 | ) | ||||||
| Amortization of unrecognized actuarial loss |
355 | 173 | 303 | |||||||||
|
|
|
|
|
|
|
|||||||
| Net periodic pension cost (benefit) |
88 | (132 | ) | 56 | ||||||||
|
|
|
|
|
|
|
|||||||
| Other changes in plan assets and benefit obligations recognized as other comprehensive loss (income), before tax effect: |
||||||||||||
| Actuarial loss (gain) |
423 | 2,325 | (1,124 | ) | ||||||||
| Amortization of unrecognized actuarial loss |
(355 | ) | (173 | ) | (303 | ) | ||||||
|
|
|
|
|
|
|
|||||||
| Total recognized as other comprehensive loss (income) |
68 | 2,152 | (1,427 | ) | ||||||||
|
|
|
|
|
|
|
|||||||
| Total recognized as net periodic pension cost (benefit) and other comprehensive loss (income) |
$ | 156 | $ | 2,020 | $ | (1,371 | ) | |||||
|
|
|
|
|
|
|
|||||||
The estimated net loss that will be amortized from accumulated other comprehensive loss into net periodic pension cost over the year ended December 31, 2016 is $384 thousand.
F-39
Table of Contents
For the years ended December 31, 2015, 2014 and 2013, the assumptions used to determine the net period pension cost are as follows:
| 2015 | 2014 | 2013 | ||||||||||
| Discount rate |
4.24 | % | 5.00 | % | 4.50 | % | ||||||
| Increase in future compensation levels |
— | — | — | |||||||||
| Expected long-term rate of return on plan assets |
8.00 | 8.00 | 8.00 | |||||||||
The Company has examined the historical benchmarks for returns in each asset class in its portfolio, and based on the target asset mix has developed a weighted-average expected return for the portfolio as a whole, partly taking into consideration forecasts of long-term expected inflation rates of 2.5%. The long-term rate of return used by the Company is 8.0%. This rate was determined by adding the expected inflation rates to the weighted sum of the expected long-term return on each asset allocation.
Plan Assets
The Company’s pension plan assets measured at fair value at December 31, 2015, by asset category, are as follows:
| Fair Value Measurements at Reporting Date Using: | ||||||||||||||||
| Asset Category |
Total | Quoted Prices in Active Markets for Identical Assets Level 1 |
Significant Other Observable Inputs Level 2 |
Significant Unobservable Inputs Level 3 |
||||||||||||
| (Dollars in thousands) | ||||||||||||||||
| December 31, 2015: |
||||||||||||||||
| U.S. equity securities |
$ | 732 | $ | 425 | $ | 307 | $ | — | ||||||||
| Registered investment companies (a) |
6,783 | 6,783 | — | — | ||||||||||||
| Money market |
117 | 117 | — | — | ||||||||||||
|
|
|
|
|
|
|
|
|
|||||||||
| Totals |
$ | 7,632 | $ | 7,325 | $ | 307 | $ | — | ||||||||
|
|
|
|
|
|
|
|
|
|||||||||
| (a) | Includes 59% invested in fixed income funds and 41% invested in equity and index funds. |
The Company’s pension plan assets measured at fair value at December 31, 2014, by asset category, are as follows:
| Fair Value Measurements at Reporting Date Using: | ||||||||||||||||
| Asset Category |
Total | Quoted Prices in Active Markets for Identical Assets Level 1 |
Significant Other Observable Inputs Level 2 |
Significant Unobservable Inputs Level 3 |
||||||||||||
| (Dollars in thousands) | ||||||||||||||||
| December 31, 2014: |
||||||||||||||||
| U.S. equity securities |
$ | 868 | $ | 473 | $ | 395 | $ | — | ||||||||
| Registered investment companies (a) |
7,271 | 7,271 | — | — | ||||||||||||
| Money market |
40 | 40 | — | — | ||||||||||||
|
|
|
|
|
|
|
|
|
|||||||||
| Totals |
$ | 8,179 | $ | 7,784 | $ | 395 | $ | — | ||||||||
|
|
|
|
|
|
|
|
|
|||||||||
| (a) | Includes 52% invested in fixed income funds and 48% invested in equity and index funds. |
The Company’s pension plan assets are generally classified within level 1 or level 2 of the fair value hierarchy (See Note 15, “Fair Value Measurements,” to the Consolidated Financial Statements for a description of the fair value hierarchy) because they are valued using quoted market prices, broker or dealer quotations, or alternative pricing sources with reasonable levels of price transparency.
F-40
Table of Contents
Equity securities include 30,294 shares of the Company’s common stock as of December 31, 2015 and 2014. The fair values of the shares on those dates were $425 thousand (5.6% of total plan assets) and $473 thousand (5.8% of total plan assets), respectively.
The investment policy for the defined benefit pension plan sponsored by the Company is based on ERISA standards for prudent investing. The Company seeks maximum return, while limiting risk, through a balanced portfolio of equity and fixed income investments. The investment objectives also include appreciation of principal with a modest requirement for current income. The investment horizon varies with circumstances. Within each asset class, a diversified mix of individual securities and bonds is selected.
To maximize the ability of achieving the Company’s overall goals for the plan’s assets and to provide the required level of income each year, the allocation between common stocks, bonds and cash equivalents shall adhere to the following target allocation based on market value:
| Target Allocation | ||||
| Equities |
38-58 | % | ||
| Fixed income |
42-62 | % | ||
The Company expects to contribute $2.3 million to the defined benefit pension plan in 2016.
Estimated future benefit payments, which reflect expected future service, as appropriate, are as follows:
| (Dollars in thousands) | ||||
| 2016 |
$ | 341 | ||
| 2017 |
366 | |||
| 2018 |
384 | |||
| 2019 |
405 | |||
| 2020 |
435 | |||
| Years 2021-2025 |
2,316 | |||
Defined Contribution Plans
The Bank sponsors a Profit Sharing—Stock Ownership Plan for employees of the Bank and McCrillis & Eldredge. The Bank may elect, but is not required, to make discretionary and/or matching contributions to the Plan.
Effective January 1, 2008, the Bank amended the Profit Sharing—Stock Ownership Plan whereby employees will receive a safe harbor, non-elective contribution equal to 3% of eligible compensation for the plan year, as defined in the plan. In addition, the Bank shall make a matching contribution in an amount equal to employees’ elective deferrals up to a percentage of compensation for the plan year, to be determined annually, not to exceed 4%. Finally, the Bank may make an additional profit sharing contribution, determined annually, to be allocated on a pro rata basis to eligible employees based on their compensation in relation to the compensation of all participants.
CTC sponsors a Charter Trust Company Profit Sharing Plan for employees of CTC. CTC may elect, but is not required, to make discretionary and/or matching contributions to the CTC Plan. The CTC Plan allows employees to make qualified retirement plan (pre-tax) contributions as well as Roth (after tax) contributions. Employees will receive a safe harbor, non-elective contribution equal to 3% of eligible compensation for the plan year, as defined in the CTC Plan. In addition, CTC may make an elective matching contribution in an amount to be determined by CTC on an annual basis and discretionary matching contributions will be made on both pre-tax and Roth contributions. Employee and safe harbor contributions are vested 100% immediately. Employer discretionary match contributions are vested 20% for each year of service and become 100% vested at five years of service. For 2015, 2014, and 2013, there were no discretionary employer matching contributions.
F-41
Table of Contents
For 2015, 2014, and 2013, participating employees in both plans had contributions totaling $1.3 million, $1.3 million and $954 thousand, respectively. The Company made contributions totaling $932 thousand for 2015, $929 thousand for 2014 and $802 thousand for 2013 for both plans. A participant’s retirement benefit will depend on the amount of the contributions to the Plans together with the gains or losses on the investments.
Other Plans and Employment Agreements
The Company has entered into salary continuation agreements for supplemental retirement income with certain executives and senior officers. The total liability for these agreements included in other liabilities was $5.1 million and $4.8 million for the years ended December 31, 2015 and 2014, respectively. Expense recorded under these agreements was $744 thousand, $939 thousand and $690 thousand in 2015, 2014 and 2013, respectively. A total of $209 thousand was paid to retired executives and one active employee in 2015 per the agreements, $166 thousand was paid to retired executives and one active employee in 2014 and $219 thousand was paid to retired executives and one active employee in 2013.
Effective as of June 1, 2012, the Company and the Bank each entered into an employment agreement (“the Agreement”) with the President and Chief Executive Officer of the Company and the Bank (the “Executive”). The Agreements have an initial term of three years and will automatically extend annually for one year unless either the Company, Bank or the President gives contrary written notice in advance. The Agreements provide for a guaranteed minimum salary and certain benefits. In the event of voluntary termination without cause or voluntary termination with good reason, the Executive is entitled to receive a severance benefit equal to a lump sum payment equal to salary and bonus which the executive would have received had he continued to work for the remaining unexpired term, and certain other benefits per the Agreement. Upon a Change in Control, as defined in the Agreement, the Executive will receive the severance benefits described above with such benefits being calculated as if the remaining unexpired term of the agreement was three years.
The Company and the Bank has a three-year change in control agreement with the Chief Operating Officer in which the officer will receive a lump sum severance payment equal to three year’s annual base salary in effect as of the date of termination.
The Company also has one-year change of control agreements with the Chief Financial Officer and five other officers in which the officer will receive a lump sum severance payment equal to one year’s annual base salary in effect as of the date of termination.
On October 7, 2011, the Bank entered into parallel employment agreements with the Chief Executive Officer and the Chief Financial Officer of MEI. The employment agreements are for a period of three years, and extend automatically for three additional three year renewal periods unless either the Company or the executive give contrary written notice in advance. The employment agreements provide for a guaranteed minimum salary, performance bonus and certain benefits.
The employment agreements also provide for severance benefits upon termination without cause, or following a change in control, in amounts of and/or for the remaining unexpired employment period as defined in the employment agreement.
In 2008, the Company adopted ASC 715, “Compensation—Retirement Benefits,” and recognized a liability for the Company’s future postretirement benefit obligations under endorsement split-dollar life insurance arrangements. The total liability for the arrangements included in other liabilities was $528 thousand at December 31, 2015 and $457 thousand at December 31, 2014. The Company recorded expense under this arrangement of $71 thousand in 2015, $93 thousand in 2014 and $14 thousand in 2013.
F-42
Table of Contents
NOTE 14. Commitments and contingencies:
In the normal course of business, the Company has outstanding various commitments and contingent liabilities, such as legal claims, which are not reflected in the consolidated financial statements. Management does not anticipate any material loss as a result of these transactions.
As of December 31, 2015, the Company was obligated under non-cancelable operating leases for bank premises and equipment expiring between March 31, 2016 and October 31, 2025. The total minimum rent commitments due in future periods under these existing agreements are as follows as of December 31, 2015:
| (Dollars in thousands) | ||||
| 2016 |
$ | 612 | ||
| 2017 |
521 | |||
| 2018 |
439 | |||
| 2019 |
380 | |||
| 2020 |
199 | |||
| Thereafter |
657 | |||
|
|
|
|||
| Total minimum lease payments |
$ | 2,808 | ||
|
|
|
|||
Certain leases contain provisions for escalation of minimum lease payments contingent upon increases in real estate taxes and percentage increases in the consumer price index. The total rental expense amounted to $716 thousand, $758 thousand and $603 thousand for the years ended December 31, 2015, 2014 and 2013, respectively.
NOTE 15. Fair value measurements:
ASC 820-10, “Fair Value Measurement—Overall,” provides a framework for measuring fair value under generally accepted accounting principles. This guidance also allows an entity the irrevocable option to elect fair value for the initial and subsequent measurement for certain financial assets and liabilities on a contract-by-contract basis.
In accordance with ASC 820-10, the Company groups its financial assets and financial liabilities measured at fair value in three levels, based on the markets in which the assets and liabilities are traded and the reliability of the assumptions used to determine fair value.
Level 1—Valuations for assets and liabilities traded in active exchange markets, such as the New York Stock Exchange. Level 1 also includes U.S. Treasury, other U.S. Government and agency mortgage-backed securities that are traded by dealers or brokers in active markets. Valuations are obtained from readily available pricing sources for market transactions involving identical assets or liabilities.
Level 2—Valuations for assets and liabilities traded in less active dealer or broker markets. Valuations are obtained from third party pricing services for identical or comparable assets or liabilities.
Level 3—Valuations for assets and liabilities that are derived from other methodologies, including option pricing models, discounted cash flow models and similar techniques, are not based on market exchange, dealer, or broker traded transactions. Level 3 valuations incorporate certain assumptions and projections in determining the fair value assigned to such assets and liabilities.
A financial instrument’s level within the fair value hierarchy is based on the lowest level of input that is significant to the fair value measurement.
A description of the valuation methodologies used for instruments measured at fair value, as well as the general classification of such instruments pursuant to the valuation hierarchy, is set forth below. These valuation
F-43
Table of Contents
methodologies were applied to all of the Company’s financial assets and financial liabilities carried at fair value for December 31, 2015 and 2014. The Company did not have any significant transfers of assets between level 1 and level 2 of the fair value hierarchy during the year ended December 31, 2015.
The Company’s investments in marketable equity securities are generally classified within level 1 or level 2 of the fair value hierarchy because they are valued using quoted market prices, broker or dealer quotations, or alternative pricing sources with reasonable levels of price transparency.
The Company’s investment in mortgage-backed securities, asset-backed securities, and other debt securities available-for-sale are generally classified within level 2 of the fair value hierarchy. For these securities, the Company obtains fair value measurements from independent pricing services. The fair value measurements consider observable data that may include dealer quotes, market spreads, cash flows, the U.S. treasury yield curve, trading levels, market consensus prepayment speeds, credit information and the instrument’s terms and conditions.
The Company enters into interest rate lock commitments for residential mortgage loans intended for sale, which commit the Company to lend funds to a potential borrower at a specific interest rate and within a specified period of time. The estimated fair value of commitments to originate residential mortgage loans for sale is based on quoted prices for similar loans in active markets. However, this value is adjusted by a factor which considers the likelihood that the loan in a lock position will ultimately close. The closing ratio is derived from the Company’s internal data and is adjusted using significant management judgment which is not observable. As such, interest rate lock commitments are classified as Level 3 measurements.
The Company utilizes forward sale commitments as economic hedges against potential changes in the values of the interest rate lock commitments and loans held for sale. The fair values of the Company’s mandatory delivery loan sale commitments are determined similarly to the IRLCs using quoted prices in the market place that are observable and adjusted for inputs which are not observable, as discussed above. As such, best efforts and mandatory delivery forward sale commitments are classified as Level 3 measurements.
Level 3 is for positions that are not traded in active markets or are subject to transfer restrictions, valuations are adjusted to reflect illiquidity and/or non-transferability, and such adjustments are generally based on available market evidence. In the absence of such evidence, management’s best estimate is used. Subsequent to inception, management only changes level 3 inputs and assumptions when corroborated by evidence such as transactions in similar instruments, completed or pending third-party transactions in the underlying investment or comparable entities, subsequent rounds of financing, recapitalization and other transactions across the capital structure, offerings in the equity or debt markets, and changes in financial ratios or cash flows.
The Company’s impaired loans are reported at the fair value of the underlying collateral less costs to sell if repayment is expected solely from the collateral. Collateral values are estimated using level 2 inputs based upon appraisals of similar properties obtained from a third party. For level 3 inputs, fair value is based upon management estimates of the value of the underlying collateral or the present value of the expected cash flows.
Other real estate owned values are estimated using level 2 inputs based upon appraisals of similar properties obtained from a third party. For level 3 inputs, fair values are based on management estimates.
F-44
Table of Contents
The following summarizes assets measured at fair value on a recurring basis as of December 31, 2015 and 2014.
| Fair Value Measurements at Reporting Date Using: | ||||||||||||||||
| (Dollars in thousands) | Total | Quoted Prices in Active Markets for Identical Assets Level 1 |
Significant Other Observable Inputs Level 2 |
Significant Unobservable Inputs Level 3 |
||||||||||||
| December 31, 2015: |
||||||||||||||||
| U.S. Treasury notes |
$ | 34,939 | $ | — | $ | 34,939 | $ | — | ||||||||
| U.S. Government-sponsored enterprise bonds |
7,211 | — | 7,211 | — | ||||||||||||
| Mortgage-backed securities |
69,334 | — | 69,334 | — | ||||||||||||
| Municipal bonds |
8,304 | — | 8,304 | — | ||||||||||||
| Other bonds and debentures |
112 | — | 112 | — | ||||||||||||
| Equity securities |
298 | 298 | — | — | ||||||||||||
| Interest rate lock commitments |
32 | — | — | 32 | ||||||||||||
|
|
|
|
|
|
|
|
|
|||||||||
| Totals |
$ | 120,230 | $ | 298 | $ | 119,900 | $ | 32 | ||||||||
|
|
|
|
|
|
|
|
|
|||||||||
| December 31, 2014: |
||||||||||||||||
| U.S. Treasury notes |
$ | 40,123 | $ | — | $ | 40,123 | $ | — | ||||||||
| U.S. Government-sponsored enterprise bonds |
7,265 | — | 7,265 | — | ||||||||||||
| Mortgage-backed securities |
58,280 | — | 58,280 | — | ||||||||||||
| Municipal bonds |
9,596 | — | 9,596 | — | ||||||||||||
| Other bonds and debentures |
126 | — | 126 | — | ||||||||||||
| Equity securities |
308 | 308 | — | — | ||||||||||||
|
|
|
|
|
|
|
|
|
|||||||||
| Totals |
$ | 115,698 | $ | 308 | $ | 115,390 | $ | — | ||||||||
|
|
|
|
|
|
|
|
|
|||||||||
The following summarizes assets measured at fair value on a recurring basis as of December 31, 2015. There were no liabilities measured at fair value on a recurring basis as of December 31, 2014.
| Fair Value Measurements at Reporting Date Using: | ||||||||||||||||
| (Dollars in thousands) | Total | Quoted Prices in Active Markets for Identical Assets Level 1 |
Significant Other Observable Inputs Level 2 |
Significant Unobservable Inputs Level 3 |
||||||||||||
| December 31, 2015: |
||||||||||||||||
| Forward loan sale commitments |
$ | 14 | $ | — | $ | — | $ | 14 | ||||||||
|
|
|
|
|
|
|
|
|
|||||||||
| Totals |
$ | 14 | $ | — | $ | — | $ | 14 | ||||||||
|
|
|
|
|
|
|
|
|
|||||||||
The following table presents the changes in Level 3 assets and liabilities that were measured at fair value on a recurring basis for the year ending December 31, 2015.
| (Dollars in thousands) | Forward Loan Sale Commitments |
Interest Rate Lock Commitments |
||||||
| Balance as of December 31, 2014 |
$ | — | $ | — | ||||
| Realized (loss) gain recognized in non-interest income |
(14 | ) | 342 | |||||
| Transfers to loans held for sale |
— | (310 | ) | |||||
|
|
|
|
|
|||||
| Balance as of December 31, 2015 |
$ | (14 | ) | $ | 32 | |||
|
|
|
|
|
|||||
F-45
Table of Contents
The following table presents the assets carried on the consolidated balance sheet by caption and by level in the fair value hierarchy at December 31, 2015 and 2014 for which a nonrecurring change in fair value has been recorded:
| Fair Value Measurements at Reporting Date Using: | ||||||||||||||||
| (Dollars in thousands) | Total | Quoted Prices in Active Markets for Identical Assets Level 1 |
Significant Other Observable Inputs Level 2 |
Significant Unobservable Inputs Level 3 |
||||||||||||
| December 31, 2015: |
||||||||||||||||
| Impaired loans |
$ | 5,905 | $ | — | $ | — | $ | 5,905 | ||||||||
| Mortgage servicing rights |
2,441 | — | — | 2,441 | ||||||||||||
| Other real estate owned |
904 | — | — | 904 | ||||||||||||
|
|
|
|
|
|
|
|
|
|||||||||
| Totals |
$ | 9,250 | $ | — | $ | — | $ | 9,250 | ||||||||
|
|
|
|
|
|
|
|
|
|||||||||
| December 31, 2014: |
||||||||||||||||
| Impaired loans |
$ | 997 | $ | — | $ | — | $ | 997 | ||||||||
| Mortgage servicing rights |
2,378 | — | — | 2,378 | ||||||||||||
| Other real estate owned |
251 | — | — | 251 | ||||||||||||
|
|
|
|
|
|
|
|
|
|||||||||
| Totals |
$ | 3,626 | $ | — | $ | — | $ | 3,626 | ||||||||
|
|
|
|
|
|
|
|
|
|||||||||
The estimated fair values of the Company’s financial instruments, all of which are held or issued for purposes other than trading, were as follows as of December 31:
| December 31, 2015 | ||||||||||||||||||||
| Carrying Amount |
Fair Value | |||||||||||||||||||
| (Dollars in thousands) | Level 1 | Level 2 | Level 3 | Total | ||||||||||||||||
| Financial assets: |
||||||||||||||||||||
| Cash and cash equivalents |
$ | 42,566 | $ | 42,566 | $ | — | $ | — | $ | 42,566 | ||||||||||
| Securities available-for-sale |
120,198 | 298 | 119,900 | — | 120,198 | |||||||||||||||
| Federal Home Loan Bank stock |
9,963 | 9,963 | — | — | 9,963 | |||||||||||||||
| Loans held-for-sale |
2,188 | — | 2,202 | — | 2,202 | |||||||||||||||
| Loans, net |
1,217,461 | — | — | 1,215,166 | 1,215,166 | |||||||||||||||
| Investment in unconsolidated subsidiaries |
620 | — | — | 349 | 349 | |||||||||||||||
| Accrued interest receivable |
2,431 | 2,431 | — | — | 2,431 | |||||||||||||||
| Interest rate lock commitments |
32 | — | — | 32 | 32 | |||||||||||||||
| Financial liabilities: |
||||||||||||||||||||
| Deposits |
1,157,352 | — | 1,157,080 | — | 1,157,080 | |||||||||||||||
| FHLB advances |
150,000 | — | 150,312 | — | 150,312 | |||||||||||||||
| Securities sold under agreements to repurchase |
17,957 | 17,957 | — | — | 17,957 | |||||||||||||||
| Subordinated debentures |
37,620 | — | — | 28,730 | 28,730 | |||||||||||||||
| Forward loan sale commitments |
14 | — | — | 14 | 14 | |||||||||||||||
F-46
Table of Contents
| December 31, 2014 | ||||||||||||||||||||
| Carrying Amount |
Fair Value | |||||||||||||||||||
| (Dollars in thousands) | Level 1 | Level 2 | Level 3 | Total | ||||||||||||||||
| Financial assets: |
||||||||||||||||||||
| Cash and cash equivalents |
$ | 51,120 | $ | 51,120 | $ | — | $ | — | $ | 51,120 | ||||||||||
| Interest-bearing time deposits with other banks |
747 | — | 747 | — | 747 | |||||||||||||||
| Securities available-for-sale |
115,698 | 308 | 115,390 | — | 115,698 | |||||||||||||||
| Federal Home Loan Bank stock |
10,762 | 10,762 | — | — | 10,762 | |||||||||||||||
| Loans held-for-sale |
2,000 | — | 2,029 | — | 2,029 | |||||||||||||||
| Loans, net |
1,206,845 | — | — | 1,205,578 | 1,205,578 | |||||||||||||||
| Investment in unconsolidated subsidiaries |
620 | — | — | 400 | 400 | |||||||||||||||
| Accrued interest receivable |
2,576 | 2,576 | — | — | 2,576 | |||||||||||||||
| Financial liabilities: |
||||||||||||||||||||
| Deposits |
1,152,714 | — | 1,154,466 | — | 1,154,466 | |||||||||||||||
| FHLB advances |
140,992 | — | 141,746 | — | 141,746 | |||||||||||||||
| Securities sold under agreements to repurchase |
16,756 | 16,756 | — | — | 16,756 | |||||||||||||||
| Subordinated debentures |
37,620 | — | — | 29,909 | 29,909 | |||||||||||||||
The carrying amounts of financial instruments shown in the above table are included in the consolidated balance sheets under the indicated captions, except for investment in unconsolidated subsidiaries, which is included in other assets and interest rate lock commitments and forward loan sale commitments, which are included in other assets and other liabilities, respectively. Accounting policies related to financial instruments are described in Note 1.
NOTE 16. Acquisitions:
On September 4, 2013, the Bank acquired the remaining 50% of CHC that was not previously owned by the Company for $6.2 million in cash. The Bank was one of the six original owners of CHC and now, as a result of this acquisition, is the sole owner of CHC and its subsidiaries. Goodwill recognized amounted to $4.6 million and of that total, none is deductible for tax purposes. A remeasurement gain of $1.4 million was recorded in noninterest income based on the fair value of the Company’s equity interest in CHC immediately before the business combination. The acquisition date fair value of the Company’s equity interest in CHC was based on independent third party valuations of CHC as a whole obtained by the buyer and the seller and the agreed-upon arm’s length purchase price of fifty percent of CHC from another financial institution. The agreed-upon purchase price of $6.2 million was based on the third party valuations. The carrying value of the equity investment prior to acquisition was $4.8 million resulting in the remeasurement gain of $1.4 million to reflect the value of $6.2 million for 50% ownership at acquisition.
CTC, a subsidiary of CHC, was formed in 1984 as a New Hampshire-chartered non-depository trust company and is regulated by the State of New Hampshire Banking Department. Headquartered in Concord, New Hampshire, CTC also has offices in New London, Meredith, Peterborough, Hanover and Rochester. CTC’s team of professional wealth advisors and investment managers work confidentially with individuals and families to create, manage and preserve wealth. Managing over $1.5 billion in client assets, CTC acts as fiduciaries for clients in 43 states and 10 countries. For the Bank, full ownership of CTC marks an important milestone in the Bank’s plan to provide a fully comprehensive one-stop financial services company. As part of this plan, the Bank also acquired a New Hampshire-based independent insurance agency, MEI, in 2011. With these strategic acquisitions, the Bank can now offer financial leadership, products and services to customers at any stage of life.
On October 25, 2013, the Company acquired a 100% ownership interest in Central Financial Corporation. Costs to acquire consisted of 1,087,416 shares issued with a market value of $14.70 per share for a total
F-47
Table of Contents
acquisition cost of $16 million. Goodwill recognized amounted to $4.6 million and of that total, none is deductible for tax purposes. The Company acquired Central Financial Corporation to solidify its presence in Vermont, doubling the number of banking offices with the single acquisition to serve present and future customers.
A summary of the fair values of assets acquired and liabilities assumed at the date of the acquisitions is as follows:
| (Dollars in thousands) | Central Financial Corporation |
Charter Holding Corporation |
||||||
| Cash and due from banks |
$ | 17,512 | $ | 3,095 | ||||
| Interest-bearing time deposits with other banks |
1,992 | — | ||||||
| Federal Home Loan Bank stock |
467 | — | ||||||
| Securities available-for-sale |
6,494 | 633 | ||||||
| Loans, net |
127,721 | — | ||||||
| Other real estate owned |
1,477 | — | ||||||
| Premises and equipment |
2,532 | 1,365 | ||||||
| Other assets and accrued interest receivable |
1,669 | 1,411 | ||||||
|
|
|
|
|
|||||
| Total assets acquired |
159,864 | 6,504 | ||||||
|
|
|
|
|
|||||
| Total deposits |
149,684 | — | ||||||
| Securities sold under agreements to repurchase |
2,602 | — | ||||||
| Accrued expenses and other liabilities |
791 | 2,706 | ||||||
|
|
|
|
|
|||||
| Total liabilities assumed |
153,077 | 2,706 | ||||||
|
|
|
|
|
|||||
| Net assets acquired |
6,787 | 3,798 | ||||||
| Goodwill |
4,630 | 4,566 | ||||||
| Core deposit intangible asset |
4,568 | — | ||||||
| Customer list intangible asset |
— | 4,036 | ||||||
|
|
|
|
|
|||||
| Total purchase price |
$ | 15,985 | $ | 12,400 | ||||
|
|
|
|
|
|||||
The results of operations of the acquired entities have been included in the Company’s consolidated financial statements since the respective acquisition dates.
The following pro forma information assumes that the acquisitions had occurred at the beginning of the period presented.
| (Dollars in thousands, except per share data) | 2013 | |||
| Total revenue |
$ | 65,880 | ||
| Net income |
$ | 10,219 | ||
| Net income available to common shareholders |
$ | 9,903 | ||
| Earnings per share: |
||||
| Basic |
$ | 1.21 | ||
| Diluted |
$ | 1.21 | ||
The pro forma information is presented for information purposes only and is not necessarily indicative of the results of operations that actually would have been achieved had the acquisition been consummated as of that time, nor is it intended to be a projection of future results.
F-48
Table of Contents
NOTE 17. Stockholders’ equity:
Liquidation account—On May 22, 1986, the Lake Sunapee Bank, FSB received approval from the FHLB and converted from a federally chartered mutual savings bank to a federally chartered stock savings bank. At the time of conversion, the Bank established a liquidation account in an amount of $4.3 million (equal to the Bank’s net worth as of the date of the latest financial statement included in the final offering circular used in connection with the conversion). The liquidation account will be maintained for the benefit of eligible account holders who maintain their deposit accounts in the Bank after conversion. In the event of a complete liquidation of the Bank subsequent to conversion (and only in such event), each eligible account holder will be entitled to receive a liquidation distribution from the liquidation account before any liquidation distribution may be made with respect to capital stock. The amount of the liquidation account is reduced to the extent that the balances of eligible deposit accounts are reduced on any year-end closing date subsequent to the conversion. Company management believes the balance in the liquidation account would be immaterial to the consolidated financial statements as of December 31, 2015.
Dividends—The Bank may not declare or pay a cash dividend on or purchase any of its stock if the effect would be to reduce the net worth of the Bank below either the amount of the liquidation account or the net worth requirements of the banking regulators.
Special bad debts deduction—In prior years, the Bank was allowed a special tax-basis bad debt deduction under certain provisions of the Internal Revenue Code. As a result, retained income of the Bank, as of December 31, 2015, includes $2.1 million for which federal and state income taxes have not been provided. If the Bank no longer qualifies as a bank as defined in certain provisions of the Internal Revenue Code, this amount will be subject to recapture in taxable income ratably over four (4) years, subject to a combined federal and state tax rate of approximately 40%.
NOTE 18. Earnings per share (EPS):
The Company computes earnings per share in accordance with FASB ASC 260-10. Under the guidance, unvested restricted stock awards that contain non-forfeitable rights to dividends or dividend equivalents are participating securities and, therefore, are included in computing basic EPS pursuant to the two-class method. The two-class method determines earnings per share for each class of common stock and participating securities according to dividends or dividend equivalents and their respective participation rights in undistributed earnings.
Basic EPS has been computed using the weighted average number of common shares outstanding during each period. Diluted EPS assumes, as of the beginning of the period, exercise of stock awards using the treasury stock method. Certain of our stock awards that would potentially dilute Basic EPS in the future were antidilutive for years ending December 31, 2015 and 2014 and are discussed below.
F-49
Table of Contents
The following is a reconciliation of the numerators and denominators used in the calculation of Basic and Diluted EPS for the years ending December 31, 2015 and 2014:
| (Dollars in thousands, except for per share data): | Income (Numerator) |
Shares (Denominator) |
Per-Share Amount |
|||||||||
| Year ended December 31, 2015 |
||||||||||||
| Basic EPS |
||||||||||||
| Net income as reported |
$ | 9,029 | ||||||||||
| Cumulative preferred stock dividend earned |
(74 | ) | ||||||||||
| Dividends and undistributed earnings allocated to participating shares |
(77 | ) | ||||||||||
|
|
|
|||||||||||
| Net income applicable to common stock |
8,878 | 8,245,233 | $ | 1.08 | ||||||||
| Effect of dilutive equity-based awards |
— | 10,593 | ||||||||||
|
|
|
|
|
|||||||||
| Diluted EPS |
||||||||||||
| Income available to common stockholders and assumed conversions |
$ | 8,878 | 8,255,826 | $ | 1.08 | |||||||
|
|
|
|
|
|||||||||
| Year ended December 31, 2014 |
||||||||||||
| Basic EPS |
||||||||||||
| Net income as reported |
$ | 10,040 | ||||||||||
| Cumulative preferred stock dividend earned |
(230 | ) | ||||||||||
|
|
|
|||||||||||
| Net income available to common stockholders |
9,810 | 8,235,213 | $ | 1.19 | ||||||||
| Effect of dilutive securities, options |
— | 11,315 | ||||||||||
|
|
|
|
|
|||||||||
| Diluted EPS |
||||||||||||
| Income available to common stockholders and assumed conversions |
$ | 9,810 | 8,246,528 | $ | 1.19 | |||||||
|
|
|
|
|
|||||||||
| Year ended December 31, 2013 |
||||||||||||
| Basic EPS |
||||||||||||
| Net income as reported |
$ | 8,414 | ||||||||||
| Cumulative preferred stock dividend earned |
(316 | ) | ||||||||||
|
|
|
|||||||||||
| Net income available to common stockholders |
8,098 | 7,294,916 | $ | 1.11 | ||||||||
| Effect of dilutive securities, options |
— | 6,945 | ||||||||||
|
|
|
|
|
|||||||||
| Diluted EPS |
||||||||||||
| Income available to common stockholders and assumed conversions |
$ | 8,098 | 7,301,861 | $ | 1.11 | |||||||
|
|
|
|
|
|||||||||
NOTE 19. Other comprehensive loss:
Accounting principles generally require that recognized revenue, expenses, gains and losses be included in net income. Although certain changes in assets and liabilities are reported as a separate component of the equity section of the consolidated balance sheets, such items, along with net income, are components of comprehensive income.
F-50
Table of Contents
The components of other comprehensive loss included in stockholders’ equity are as follows during the years ended December 31:
| (Dollars in thousands) | 2015 | 2014 | 2013 | |||||||||
| Net unrealized holding (losses) gains on available-for-sale securities |
$ | (430 | ) | $ | 2,367 | $ | (2,979 | ) | ||||
| Reclassification adjustment for realized gains in net income |
(347 | ) | (950 | ) | (964 | ) | ||||||
|
|
|
|
|
|
|
|||||||
| Other comprehensive (loss) income before income tax effect |
(777 | ) | 1,417 | (3,943 | ) | |||||||
| Income tax benefit (expense) |
308 | (560 | ) | 1,561 | ||||||||
|
|
|
|
|
|
|
|||||||
| (469 | ) | 857 | (2,382 | ) | ||||||||
|
|
|
|
|
|
|
|||||||
| Other comprehensive (loss) income—pension plan (See Note 13) |
(68 | ) | (2,152 | ) | 1,427 | |||||||
| Income tax benefit (expense) |
26 | 853 | (567 | ) | ||||||||
|
|
|
|
|
|
|
|||||||
| (42 | ) | (1,299 | ) | 860 | ||||||||
|
|
|
|
|
|
|
|||||||
| Change in fair value of derivatives used for cash flow hedges |
— | — | 166 | |||||||||
| Income tax expense |
— | — | (65 | ) | ||||||||
|
|
|
|
|
|
|
|||||||
| — | — | 101 | ||||||||||
|
|
|
|
|
|
|
|||||||
| Other comprehensive income—equity investment |
— | — | 12 | |||||||||
| Reclassification adjustment for realized gains in net income |
— | — | (44 | ) | ||||||||
|
|
|
|
|
|
|
|||||||
| Other comprehensive loss before income tax effect |
— | — | (32 | ) | ||||||||
| Income tax benefit (expense) |
— | — | — | |||||||||
|
|
|
|
|
|
|
|||||||
| — | — | (32 | ) | |||||||||
|
|
|
|
|
|
|
|||||||
| Other comprehensive loss, net of tax effect |
$ | (511 | ) | $ | (442 | ) | $ | (1,453 | ) | |||
|
|
|
|
|
|
|
|||||||
Accumulated other comprehensive loss consists of the following as of December 31:
| (Dollars in thousands) | 2015 | 2014 | ||||||
| Net unrealized holding losses on available-for-sale securities, net of taxes |
$ | (810 | ) | $ | (341 | ) | ||
| Unrecognized net actuarial loss, defined benefit pension plan, net of tax |
(3,040 | ) | (2,998 | ) | ||||
|
|
|
|
|
|||||
| Accumulated other comprehensive loss |
$ | (3,850 | ) | $ | (3,339 | ) | ||
|
|
|
|
|
|||||
Realized gains and losses on securities are identified on the consolidated statements of income as net gain on sales and calls of securities. Amortization of unrecognized actuarial losses related to the Company’s pension plan was reported on the consolidated statements of income within salaries and employee benefits. Gains from the former equity investment in CHC were reported on the consolidated statements of income within remeasurement gain of equity interest in CHC. The tax effect of these realized gains and losses, if any, are included in provision for income taxes, and the after tax amount is included in the net income.
NOTE 20. Regulatory matters:
The Company and the Bank are subject to various regulatory capital requirements administered by the federal banking agencies. Failure to meet minimum capital requirements can initiate certain mandatory and possibly additional discretionary actions by the agencies that, if undertaken, could have a direct material effect on the Company’s and the Bank’s financial statements. Under capital adequacy guidelines and the regulatory framework for prompt corrective action, the Company and the Bank must meet specific capital guidelines that involve quantitative measures of assets, liabilities and certain off-balance sheet items as calculated under regulatory accounting practices. The Company’s and the Bank’s capital amounts and classification are also subject to qualitative judgments by the regulators about components, risk weightings and other factors.
F-51
Table of Contents
Effective January 1, 2015 (with a phase-in period of two to four years for certain components), the Company and the Bank became subject to new capital regulations adopted by the FRB and the OCC, which implement the Basel III regulatory capital reforms and the changes required by the Dodd-Frank Act. The new regulations require a new common equity Tier 1 (“CET1”) capital ratio of 4.5%, increase the minimum Tier 1 capital to risk-weighted assets ratio to 6.0% from 4.0%, require a minimum total capital to risk-weighted assets ratio of 8.0% and require a minimum Tier 1 leverage ratio of 4.0%. CET1 generally consists of common stock and retained earnings, subject to applicable adjustments and deductions. Under new prompt corrective action regulations, in order to be considered “well capitalized,” the Bank must maintain a CET1 capital ratio of 6.5% (new) and a Tier 1 ratio of 8.0% (increased from 6.0%), a total risk based capital ratio of 10.0% (unchanged) and a Tier 1 leverage ratio of 5.0% (unchanged). In addition, the regulations establish a capital conservation buffer above the required capital ratios that phased in beginning January 1, 2016 at 0.625% of risk-weighted assets and increases each year by 0.625% until it is fully phased in at 2.5% effective January 1, 2019. Beginning January 1, 2016, failure to maintain the capital conservation buffer will limit the ability of the Company and the Bank to pay dividends, repurchase shares or pay discretionary bonuses to executive officers and similar employees.
The new regulations implemented changes to what constitutes regulatory capital. Certain instruments will no longer constitute qualifying capital, subject to phase-out periods. In addition, Tier 2 capital is no longer limited to the amount of Tier 1 capital included in total capital. Mortgage servicing rights, certain deferred tax assets and investments in unconsolidated subsidiaries over designated percentages of CET1 will be deducted from capital. The Company and the Bank have elected to permanently opt out of the inclusion of accumulated other comprehensive income in capital calculations, as permitted by the regulations. This opt-out will reduce the impact of market volatility on our regulatory capital ratios.
The new regulations also changed the risk weights of certain assets, including an increase in the risk weight of certain high volatility commercial real estate acquisition, development and construction loans and non-residential mortgage loans that are 90 days past due or on non-accrual status to 150% from 100%, a credit conversion factor for the unused portion of commitments with maturities of less than one year that are not cancellable to 20% from 0%, an increase in the risk weight for mortgage servicing and deferred tax assets that are not deducted from capital to 250% from 100%, and an increase in the risk weight for equity exposures to 600% from 0%.
As of December 31, 2015, the Company and the Bank met each of their capital requirements and the most recent notification from the OCC categorized the Bank as “well-capitalized.” There are no conditions or events since that notification that management believes have changed the Bank’s category.
The Company’s and the Bank’s actual capital amounts and ratios are presented in the table below as of December 31, :
| Actual | For Capital Adequacy Purposes |
To Be Well Capitalized Under Prompt Corrective Action Provisions |
||||||||||||||||||||||
| (Dollars in thousands) | Amount | Ratio | Amount | Ratio | Amount | Ratio | ||||||||||||||||||
| As of December 31, 2015: |
||||||||||||||||||||||||
| Lake Sunapee Bank Group: |
||||||||||||||||||||||||
| Tier 1 Leverage Capital |
$ | 117,270 | 8.03 | % | $ | 58,380 | 4.0 | % | N/A | N/A | ||||||||||||||
| Tier 1 Risk-Based Capital |
117,270 | 11.34 | 62,029 | 6.0 | N/A | N/A | ||||||||||||||||||
| Total Risk-Based Capital |
126,352 | 12.22 | 82,705 | 8.0 | N/A | N/A | ||||||||||||||||||
| Common Equity Tier 1 Capital |
97,270 | 9.41 | 46,521 | 4.5 | N/A | N/A | ||||||||||||||||||
| Lake Sunapee Bank, fsb: |
||||||||||||||||||||||||
| Tier 1 Leverage Capital |
$ | 131,586 | 9.02 | % | $ | 58,346 | 4.0 | % | $ | 72,933 | 5.0 | % | ||||||||||||
| Tier 1 Risk-Based Capital |
131,586 | 12.74 | 61,976 | 6.0 | 82,635 | 8.0 | ||||||||||||||||||
| Total Risk-Based Capital |
140,668 | 13.62 | 82,635 | 8.0 | 103,294 | 10.0 | ||||||||||||||||||
| Common Equity Tier 1 Capital |
131,586 | 12.74 | 46,482 | 4.5 | 67,141 | 6.5 | ||||||||||||||||||
F-52
Table of Contents
| Actual | For Capital Adequacy Purposes |
To Be Well Capitalized Under Prompt Corrective Action Provisions |
||||||||||||||||||||||
| (Dollars in thousands) | Amount | Ratio | Amount | Ratio | Amount | Ratio | ||||||||||||||||||
| As of December 31, 2014: |
||||||||||||||||||||||||
| Lake Sunapee Bank, fsb: |
||||||||||||||||||||||||
| Total Capital to Risk Weighted Assets |
$ | 131,597 | 13.28 | % | $ | 79,283 | 8.0 | % | $ | 99,103 | 10.0 | % | ||||||||||||
| Tier 1 Capital to Risk Weighted Assets |
122,161 | 12.33 | 39,641 | 4.0 | 59,462 | 6.0 | ||||||||||||||||||
| Tier 1 Capital to Total Assets |
122,161 | 8.43 | 57,937 | 4.0 | 72,421 | 5.0 | ||||||||||||||||||
The following is a reconcilement of the Bank’s total equity, included in the consolidated balance sheet, to the regulatory capital ratios disclosed in the table above:
| December 31, 2015 | December 31, 2014 | |||||||||||||||
| (Dollars in thousands) | Tier 1 Capital |
Total Capital |
Tier 1 Capital |
Total Capital |
||||||||||||
| Total stockholders’ equity |
$ | 170,936 | $ | 170,936 | $ | 172,730 | $ | 172,730 | ||||||||
| Accumulated other comprehensive loss |
3,850 | 3,850 | 3,339 | 3,339 | ||||||||||||
| Allowable allowance for loan losses |
— | 9,064 | — | 9,436 | ||||||||||||
| Goodwill and intangible assets |
(43,200 | ) | (43,200 | ) | (53,908 | ) | (53,908 | ) | ||||||||
| Unrealized gains on equity exposures |
— | 18 | — | — | ||||||||||||
|
|
|
|
|
|
|
|
|
|||||||||
| Totals |
$ | 131,586 | $ | 140,668 | $ | 122,161 | $ | 131,597 | ||||||||
|
|
|
|
|
|
|
|
|
|||||||||
NOTE 21. Preferred stock:
On August 25, 2011, as part of the Small Business Lending Fund (“SBLF”), the Company entered into a Purchase Agreement with the U.S. Department of the Treasury (“Treasury”) pursuant to which the Company issued and sold to the Treasury 20,000 shares of the Company’s Non-Cumulative Perpetual Preferred Stock, Series B, par value $0.01 per preferred share, having a liquidation preference of $1,000 per preferred share (the “Series B Preferred Stock”).
As part of the acquisition of The Nashua Bank, on December 21, 2012, the Company assumed The Nashua Bank’s outstanding 3,000 shares of Senior Non-Cumulative Perpetual Preferred Stock, Series A (the “TNB Preferred Stock”) issued to Treasury under the SBLF program.
The Company’s initial dividend rate payable on SBLF capital is, at most, five percent, and the dividend rate falls to one percent if a bank’s small business lending increases by ten percent or more. Banks that increase their lending by less than ten percent but more than 2.5 percent pay rates between two percent and four percent. If a bank’s lending does not increase in the first two years, however, the rate increases to seven percent, and after 4.5 years total, the rate increases to nine percent regardless of the amount of small business lending activities. The dividend will be paid only when declared by the Company’s Board of Directors. The Series B Preferred Stock has no maturity date and ranks senior to the Common Stock with respect to the payment of dividends and distributions and amounts payable upon liquidation, dissolution and winding up of the Company. The Series B Preferred Stock generally is non-voting, other than class voting on certain matters that could adversely affect the Series B Preferred Stock.
The SBLF Preferred Stock may be redeemed at any time by the Company, subject to the approval of its federal banking regulator. The redemption price is the aggregate liquidation preference of the SBLF Preferred Stock plus accrued but unpaid dividends and pro rata portion of any lending incentive fee. All redemptions must be in an amount at least equal to 25% of the number of originally issued shares of SBLF Preferred Stock, or 100% of the then-outstanding shares if less than 25% of the number of shares originally issued.
F-53
Table of Contents
On December 29, 2014, the Company redeemed $15.0 million of the outstanding preferred securities issued under the U.S. Treasury’s SBLF program. The redemption was funded with the proceeds of the $17.0 million private placement of subordinated notes, which the Company completed in October 2014, as described in Note 2. At December 31, 2014, $8.0 million of preferred securities were outstanding under the SBLF program.
On December 3, 2015, the Company redeemed the remaining $8.0 million of the outstanding preferred securities issued under the U.S. Treasury’s SBLF program. The redemption was funded from a dividend from the Bank to the Company.
NOTE 22. Financial instruments:
The Company is party to financial instruments with off-balance sheet risk in the normal course of business to meet the financing needs of its customers. These financial instruments include commitments to originate loans, standby letters of credit and unadvanced funds on loans. The instruments involve, to varying degrees, elements of credit risk in excess of the amount recognized in the balance sheets. The contract amounts of those instruments reflect the extent of involvement the Company has in particular classes of financial instruments.
The Company’s exposure to credit loss in the event of nonperformance by the other party to the financial instrument for loan commitments and standby letters of credit is represented by the contractual amounts of those instruments. The Company uses the same credit policies in making commitments and conditional obligations as it does for on-balance sheet instruments.
Commitments to originate loans are agreements to lend to a customer provided there is no violation of any condition established in the contract. Commitments generally have fixed expiration dates or other termination clauses and may require payment of a fee. Since many of the commitments are expected to expire without being drawn upon, the total commitment amounts do not necessarily represent future cash requirements. The Company evaluates each customer’s creditworthiness on a case-by-case basis. The amount of collateral obtained, if deemed necessary by the Company upon extension of credit, is based on management’s credit evaluation of the borrower. Collateral held varies, but may include secured interests in mortgages, accounts receivable, inventory, property, plant and equipment and income-producing properties.
Standby letters of credit are conditional commitments issued by the Company to guarantee the performance by a customer to a third party. The credit risk involved in issuing letters of credit is essentially the same as that involved in extending loan facilities to customers. As of December 31, 2015 and 2014, the maximum potential amount of the Company’s obligation was $1.1 million for financial and standby letters of credit. The Company’s outstanding letters of credit generally have a term of less than one year. If a letter of credit is drawn upon, the Company may seek recourse through the customer’s underlying line of credit. If the customer’s line of credit is also in default, the Company may take possession of the collateral, if any, securing the line of credit.
Notional amounts of financial liabilities with off-balance sheet credit risk are as follows as of December 31:
| (Dollars in thousands) | 2015 | 2014 | ||||||
| Commitments to extend credit |
$ | 27,421 | $ | 25,503 | ||||
|
|
|
|
|
|||||
| Letters of credit |
$ | 1,074 | $ | 1,146 | ||||
|
|
|
|
|
|||||
| Lines of credit |
$ | 109,127 | $ | 119,901 | ||||
|
|
|
|
|
|||||
| Unadvanced portion of construction loans |
$ | 6,358 | $ | 12,560 | ||||
|
|
|
|
|
|||||
F-54
Table of Contents
NOTE 23. Goodwill and intangible assets:
The following table represents the Company’s goodwill and intangible assets by related acquisition at December 31, 2015:
| (Dollars in thousands) | Goodwill | Intangible Assets |
Goodwill and Intangible Assets |
|||||||||
| Landmark Bank |
$ | 2,472 | $ | — | $ | 2,472 | ||||||
| New London Trust |
9,668 | — | 9,668 | |||||||||
| First Brandon |
7,503 | 83 | 7,586 | |||||||||
| First Community |
7,651 | 45 | 7,696 | |||||||||
| McCrillis & Eldredge |
1,356 | 336 | 1,692 | |||||||||
| The Nashua Bank |
6,786 | 1,062 | 7,848 | |||||||||
| Charter Holding Corporation |
4,760 | 2,915 | 7,675 | |||||||||
| Central Financial Corporation |
4,380 | 3,381 | 7,761 | |||||||||
|
|
|
|
|
|
|
|||||||
| Total |
$ | 44,576 | $ | 7,822 | $ | 52,398 | ||||||
|
|
|
|
|
|
|
|||||||
The Company evaluated its goodwill and intangible assets as of December 31, 2015 and 2014 and found no impairment.
A summary of acquired amortizing intangible assets is as follows:
| (Dollars in thousands) | Gross Carrying Amount |
Accumulated Amortization |
Net Carrying Amount |
|||||||||
| December 31, 2015: |
||||||||||||
| Core deposit intangible—First Brandon |
$ | 2,476 | $ | 2,393 | $ | 83 | ||||||
| Core deposit intangible—First Community |
992 | 947 | 45 | |||||||||
| Customer list intangible—McCrillis & Eldredge |
629 | 293 | 336 | |||||||||
| Core deposit intangible—The Nashua Bank |
2,086 | 1,024 | 1,062 | |||||||||
| Customer list intangible—Charter Holding Corporation |
4,036 | 1,121 | 2,915 | |||||||||
| Core deposit intangible—Central Financial Corporation |
4,568 | 1,187 | 3,381 | |||||||||
|
|
|
|
|
|
|
|||||||
| Total |
$ | 14,787 | $ | 6,965 | $ | 7,822 | ||||||
|
|
|
|
|
|
|
|||||||
| December 31, 2014: |
||||||||||||
| Core deposit intangible—First Brandon |
$ | 2,476 | $ | 2,285 | $ | 191 | ||||||
| Core deposit intangible—First Community |
992 | 897 | 95 | |||||||||
| Customer list intangible—McCrillis & Eldredge |
629 | 231 | 398 | |||||||||
| Core deposit intangible—The Nashua Bank |
2,086 | 720 | 1,366 | |||||||||
| Customer list intangible—Charter Holding Corporation |
4,036 | 662 | 3,374 | |||||||||
| Core deposit intangible—Central Financial Corporation |
4,568 | 660 | 3,908 | |||||||||
|
|
|
|
|
|
|
|||||||
| Total |
$ | 14,787 | $ | 5,455 | $ | 9,332 | ||||||
|
|
|
|
|
|
|
|||||||
Aggregate amortization expense for core deposit intangibles was $989 thousand in 2015, $1.1 million in 2014 and $759 thousand in 2013. Amortization for core deposit intangibles is being calculated on the sum-of-the-years digits method over periods ranging from ten through fifteen years. Aggregate amortization expense for customer list intangibles was $521 thousand in 2015, $561 thousand in 2014 and $241 thousand in 2013. Amortization for customer list intangibles is being calculated on the sum-of-the-years digits method over 15 years.
F-55
Table of Contents
Estimated amortization expense for each of the five years succeeding 2015 is as follows:
| (Dollars in thousands) | ||||
| 2016 |
$ | 1,332 | ||
| 2017 |
1,154 | |||
| 2018 |
1,007 | |||
| 2019 |
892 | |||
| 2020 |
777 | |||
NOTE 24. Operating Segments:
The Company has two reportable operating segments: Banking, which includes the activities of the Bank and its subsidiaries, excluding CHC, and Wealth Management, which includes the activities of CHC and its subsidiaries. Lake Sunapee Bank Group operates as the parent company of the Bank and its subsidiaries and all financial activity between them is eliminated.
The accounting policies of each reportable segment are the same as those of the Company. Income tax expense for the individual segments is calculated based on the activity of the segments. CHC was acquired on September 4, 2013 and did not meet the requirements for disclosure of a reportable segment for the year ended December 31, 2013.
A summary of the Company’s operating segments is as follows:
| (Dollars in thousands) | Banking | Wealth Management |
Holding Company |
Eliminations | Total Consolidated |
|||||||||||||||
| Year Ended December 31, 2015 |
||||||||||||||||||||
| Net interest and dividend income (expense) |
$ | 43,094 | $ | 17 | $ | (1,847 | ) | $ | — | $ | 41,264 | |||||||||
| Provision for loan losses |
1,056 | — | — | — | 1,056 | |||||||||||||||
| Non-interest income |
10,686 | 8,449 | 10,715 | (11,226 | ) | 18,624 | ||||||||||||||
| Non-interest expense |
38,284 | 7,017 | 904 | — | 46,205 | |||||||||||||||
|
|
|
|
|
|
|
|
|
|
|
|||||||||||
| Income before provision for income taxes |
14,440 | 1,449 | 7,964 | (11,226 | ) | 12,627 | ||||||||||||||
| Provision (benefit) for income taxes |
4,126 | 537 | (1,065 | ) | — | 3,598 | ||||||||||||||
|
|
|
|
|
|
|
|
|
|
|
|||||||||||
| Net income |
$ | 10,314 | $ | 912 | $ | 9,029 | $ | (11,226 | ) | $ | 9,029 | |||||||||
|
|
|
|
|
|
|
|
|
|
|
|||||||||||
| Total Assets |
$ | 1,518,244 | $ | 22,858 | $ | 174,789 | $ | (197,370 | ) | $ | 1,518,521 | |||||||||
| (Dollars in thousands) | Banking | Wealth Management |
Holding Company |
Eliminations | Total Consolidated |
|||||||||||||||
| Year Ended December 31, 2014 |
||||||||||||||||||||
| Net interest and dividend income (expense) |
$ | 42,757 | $ | 7 | $ | (835 | ) | $ | — | $ | 41,929 | |||||||||
| Provision for loan losses |
905 | — | — | — | 905 | |||||||||||||||
| Non-interest income |
10,810 | 8,416 | 6,993 | (6,993 | ) | 19,226 | ||||||||||||||
| Non-interest expense |
38,865 | 7,035 | 746 | — | 46,646 | |||||||||||||||
|
|
|
|
|
|
|
|
|
|
|
|||||||||||
| Income before provision for income taxes |
13,797 | 1,388 | 5,412 | (6,993 | ) | 13,604 | ||||||||||||||
| Provision (benefit) for income taxes |
3,704 | 488 | (628 | ) | — | 3,564 | ||||||||||||||
|
|
|
|
|
|
|
|
|
|
|
|||||||||||
| Net income |
$ | 10,093 | $ | 900 | $ | 6,040 | $ | (6,993 | ) | $ | 10,040 | |||||||||
|
|
|
|
|
|
|
|
|
|
|
|||||||||||
| Total Assets |
$ | 1,480,357 | $ | 18,325 | $ | 177,837 | $ | (172,733 | ) | $ | 1,503,786 | |||||||||
F-56
Table of Contents
NOTE 25. Condensed parent company only financial statements:
The following are condensed balance sheets, statements of income and cash flows for Lake Sunapee Bank Group (“Parent Company Only”) as of and for the years ended December 31:
CONDENSED BALANCE SHEETS
| (Dollars in thousands) | 2015 | 2014 | ||||||
| ASSETS |
||||||||
| Cash |
$ | 1,679 | $ | 3,079 | ||||
| Investment in subsidiary, Lake Sunapee Bank |
170,936 | 172,730 | ||||||
| Investment in affiliate, NHTB Capital Trust II |
310 | 310 | ||||||
| Investment in affiliate, NHTB Capital Trust III |
310 | 310 | ||||||
| Deferred expenses |
747 | 818 | ||||||
| Advances to Lake Sunapee Bank |
91 | 68 | ||||||
| Other assets |
716 | 522 | ||||||
|
|
|
|
|
|||||
| Total assets |
$ | 174,789 | $ | 177,837 | ||||
|
|
|
|
|
|||||
| LIABILITIES |
||||||||
| Subordinated debentures |
$ | 37,620 | $ | 37,620 | ||||
| Other liabilities |
461 | 381 | ||||||
|
|
|
|
|
|||||
| Total liabilities |
38,081 | 38,001 | ||||||
| STOCKHOLDERS’ EQUITY |
||||||||
| Stockholders’ equity |
136,708 | 139,836 | ||||||
|
|
|
|
|
|||||
| Total liabilities and stockholders’ equity |
$ | 174,789 | $ | 177,837 | ||||
|
|
|
|
|
|||||
CONDENSED STATEMENTS OF INCOME
| (Dollars in thousands) | 2015 | 2014 | 2013 | |||||||||
| Dividends from subsidiary, Lake Sunapee Bank |
$ | 12,000 | $ | 4,000 | $ | 4,000 | ||||||
| Dividends from subsidiaries, NHTB Capital Trust II and III |
20 | 20 | 19 | |||||||||
| Interest expense on subordinated debentures |
1,867 | 855 | 806 | |||||||||
| Net operating income (loss) including tax benefit |
161 | (118 | ) | (796 | ) | |||||||
|
|
|
|
|
|
|
|||||||
| Income before equity in undistributed earnings of subsidiaries |
10,314 | 3,047 | 2,417 | |||||||||
| Equity in undistributed earnings of subsidiaries(1) |
(1,285 | ) | 6,993 | 5,997 | ||||||||
|
|
|
|
|
|
|
|||||||
| Net income |
$ | 9,029 | $ | 10,040 | $ | 8,414 | ||||||
|
|
|
|
|
|
|
|||||||
| (1) | In 2015 distributions of $12 million were made from the Bank to Lake Sunapee Bank Group which exceeded the current year earnings of subsidiaries. |
F-57
Table of Contents
CONDENSED STATEMENTS OF CASH FLOWS
| (Dollars in thousands) | 2015 | 2014 | 2013 | |||||||||
| Cash flows from operating activities: |
||||||||||||
| Net income |
$ | 9,029 | $ | 10,040 | $ | 8,414 | ||||||
| Decrease (increase) in other assets |
28 | 31 | (16 | ) | ||||||||
| Increase (decrease) in accrued interest payable and other liabilities |
80 | 164 | (397 | ) | ||||||||
| Increase in taxes receivable |
(150 | ) | (113 | ) | (87 | ) | ||||||
| Deferred tax benefit |
(36 | ) | (11 | ) | (11 | ) | ||||||
| Tax benefit for stock options and awards |
(38 | ) | (2 | ) | (30 | ) | ||||||
| Amortization of deferred expenses relating to issuance of capital securities and subordinated debentures |
71 | 20 | 11 | |||||||||
| Stock award expense |
157 | 165 | 103 | |||||||||
| Equity in undistributed earnings of subsidiaries |
1,285 | (6,993 | ) | (5,997 | ) | |||||||
|
|
|
|
|
|
|
|||||||
| Net cash provided by operating activities |
10,426 | 3,301 | 1,990 | |||||||||
|
|
|
|
|
|
|
|||||||
| Cash flows from investing activities: |
||||||||||||
| Investment in subsidiary, Lake Sunapee Bank |
— | 3 | (15,884 | ) | ||||||||
| Net change in advances to subsidiary, Lake Sunapee Bank |
(23 | ) | (40 | ) | 45 | |||||||
|
|
|
|
|
|
|
|||||||
| Net cash used in investing activities |
(23 | ) | (37 | ) | (15,839 | ) | ||||||
|
|
|
|
|
|
|
|||||||
| Cash flows from financing activities: |
||||||||||||
| Proceeds from exercise of stock options |
530 | 92 | 514 | |||||||||
| Forfeiture of stock options |
(28 | ) | — | — | ||||||||
| Issuance of subordinated debt, net of issuance costs |
— | 16,380 | — | |||||||||
| Issuance of common stock through dividend reinvestment plan contributions |
61 | 109 | 202 | |||||||||
| Redemption of preferred stock |
(8,000 | ) | (15,000 | ) | — | |||||||
| Acquisition of Central Financial Corporation |
— | — | 15,985 | |||||||||
| Tax benefit for stock options and awards |
38 | 2 | 30 | |||||||||
| Dividends paid on preferred stock |
(74 | ) | (230 | ) | (316 | ) | ||||||
| Dividends paid on common stock |
(4,330 | ) | (4,127 | ) | (3,684 | ) | ||||||
|
|
|
|
|
|
|
|||||||
| Net cash (used in) provided by financing activities |
(11,803 | ) | (2,774 | ) | 12,731 | |||||||
|
|
|
|
|
|
|
|||||||
| Net (decrease) increase in cash |
(1,400 | ) | 490 | (1,118 | ) | |||||||
| Cash, beginning of year |
3,079 | 2,589 | 3,707 | |||||||||
|
|
|
|
|
|
|
|||||||
| Cash, end of year |
$ | 1,679 | $ | 3,079 | $ | 2,589 | ||||||
|
|
|
|
|
|
|
|||||||
The parent company only Statements of Changes in Stockholders’ Equity are identical to the Consolidated Statements of Changes in Stockholders’ Equity for the years ended December 31, 2015, 2014 and 2013 and are therefore not reprinted here.
F-58
Table of Contents
NOTE 26. Quarterly Results of Operations (UNAUDITED)
Summarized quarterly financial data for 2015 and 2014 follows:
| (In thousands, except earnings per share) 2015 Quarters Ended |
||||||||||||||||
| March 31 | June 30 | Sept 30 | Dec 31 | |||||||||||||
| Interest and dividend income |
$ | 12,056 | $ | 11,883 | $ | 12,082 | $ | 12,112 | ||||||||
| Interest expense |
1,823 | 1,717 | 1,639 | 1,690 | ||||||||||||
|
|
|
|
|
|
|
|
|
|||||||||
| Net interest and dividend income |
10,233 | 10,166 | 10,443 | 10,422 | ||||||||||||
| Provision for loan losses |
205 | 215 | 21 | 615 | ||||||||||||
| Noninterest income |
4,757 | 5,064 | 4,386 | 4,417 | ||||||||||||
| Noninterest expense |
11,414 | 11,518 | 11,756 | 11,517 | ||||||||||||
|
|
|
|
|
|
|
|
|
|||||||||
| Income before income taxes |
3,371 | 3,497 | 3,052 | 2,707 | ||||||||||||
| Income tax expense |
1,068 | 1,079 | 905 | 546 | ||||||||||||
|
|
|
|
|
|
|
|
|
|||||||||
| Net income |
$ | 2,303 | $ | 2,418 | $ | 2,147 | $ | 2,161 | ||||||||
|
|
|
|
|
|
|
|
|
|||||||||
| Net income available to common stockholders |
$ | 2,283 | $ | 2,398 | $ | 2,127 | $ | 2,123 | ||||||||
|
|
|
|
|
|
|
|
|
|||||||||
| Basic earnings per common share |
$ | 0.28 | $ | 0.29 | $ | 0.25 | $ | 0.26 | ||||||||
|
|
|
|
|
|
|
|
|
|||||||||
| Earnings per common share, assuming dilution |
$ | 0.28 | $ | 0.29 | $ | 0.25 | $ | 0.26 | ||||||||
|
|
|
|
|
|
|
|
|
|||||||||
| (In thousands, except earnings per share) 2014 Quarters Ended |
||||||||||||||||
| March 31 | June 30 | Sept 30 | Dec 31 | |||||||||||||
| Interest and dividend income |
$ | 11,880 | $ | 12,254 | $ | 12,319 | $ | 12,275 | ||||||||
| Interest expense |
1,627 | 1,591 | 1,689 | 1,892 | ||||||||||||
|
|
|
|
|
|
|
|
|
|||||||||
| Net interest and dividend income |
10,253 | 10,663 | 10,630 | 10,383 | ||||||||||||
| Provision for loan losses |
— | 709 | 27 | 169 | ||||||||||||
| Noninterest income |
4,382 | 5,072 | 4,868 | 4,904 | ||||||||||||
| Noninterest expense |
11,593 | 11,690 | 11,458 | 11,905 | ||||||||||||
|
|
|
|
|
|
|
|
|
|||||||||
| Income before income taxes |
3,042 | 3,336 | 4,013 | 3,213 | ||||||||||||
| Income tax expense |
899 | 994 | 1,309 | 362 | ||||||||||||
|
|
|
|
|
|
|
|
|
|||||||||
| Net income |
$ | 2,143 | $ | 2,342 | $ | 2,704 | $ | 2,851 | ||||||||
|
|
|
|
|
|
|
|
|
|||||||||
| Net income available to common stockholders |
$ | 2,085 | $ | 2,284 | $ | 2,646 | $ | 2,795 | ||||||||
|
|
|
|
|
|
|
|
|
|||||||||
| Basic earnings per common share |
$ | 0.25 | $ | 0.28 | $ | 0.32 | $ | 0.34 | ||||||||
|
|
|
|
|
|
|
|
|
|||||||||
| Earnings per common share, assuming dilution |
$ | 0.25 | $ | 0.28 | $ | 0.32 | $ | 0.34 | ||||||||
|
|
|
|
|
|
|
|
|
|||||||||
NOTE 27. Subsequent Events
On January 11, 2016, the Company declared a regular quarterly cash dividend of $0.14 per share, payable January 29, 2016 to stockholders of record as of January 25, 2016.
NOTE 28. Reclassification
Certain amounts in the prior years have been reclassified to be consistent with the current year’s statement presentation.
F-59
Table of Contents
SIGNATURES
Pursuant to the requirements of Section 13 or 15(d) of the Securities Exchange Act of 1934, the Registrant has duly caused this report to be signed on its behalf by the undersigned, thereunto duly authorized.
Lake Sunapee Bank Group
| By: | /s/ Stephen R. Theroux |
President and Chief Executive Officer (Principal Executive Officer) |
March 15, 2016 | |||
| Stephen R. Theroux |
POWER OF ATTORNEY
Each person whose individual signature appears below hereby authorizes and appoints Stephen R. Theroux and Laura Jacobi, and each of them, with full power of substitution and resubstitution and full power to act without the other, as his or her true and lawful attorney-in-fact and agent to act in his or her name, place and stead and to execute in the name and on behalf of each person, individually and in each capacity stated below, and to file any and all amendments to this report on Form 10-K, and to file the same, with all exhibits thereto, and other documents in connection therewith, with the Securities and Exchange Commission, granting unto said attorneys-in-fact and agents, and each of them, full power and authority to do and perform each and every act and thing, ratifying and confirming all that said attorneys-in-fact and agents or any of them or their or his or her substitute or substitutes may lawfully do or cause to be done by virtue thereof.
Pursuant to the requirements of the Securities Exchange Act of 1934, as amended, this report on Form 10-K has been signed below by the following persons on behalf of the Registrant and in the capacities indicated on March 15, 2016.
| Name |
Title | |
| /s/ Stephen W. Ensign Stephen W. Ensign |
Executive Chairman of the Board | |
| /s/ Stephen R. Theroux Stephen R. Theroux |
Vice Chairman of the Board, President and Chief Executive Officer (Principal Executive Officer) | |
| /s/ Laura Jacobi Laura Jacobi |
Executive Vice President, Chief Financial Officer, and Chief Accounting Officer (Principal Financial and Accounting Officer) | |
| /s/ Leonard R. Cashman Leonard R. Cashman |
Director | |
| /s/ Steven H. Dimick Steven H. Dimick |
Director | |
| /s/ Catherine A. Feeney Catherine A. Feeney |
Director | |
| /s/ Stephen J. Frasca Stephen J. Frasca |
Director | |
Table of Contents
| Name |
Title | |
| /s/ William C. Horn William C. Horn |
Director | |
| /s/ Peter R. Lovely Peter R. Lovely |
Director | |
| /s/ Jack H. Nelson Jack H. Nelson |
Director | |
| /s/ John P. Stabile II John P. Stabile II |
Director | |
| /s/ Joseph B. Willey Joseph B. Willey |
Director | |
Table of Contents
Exhibit Index
| Exhibit No. |
Description | |
| 2.1 | Purchase and Sale Agreement, dated February 15, 2013, by and between Lake Sunapee Bank, fsb, and Meredith Village Savings Bank (incorporated by reference to Exhibit 2.1 to the Company’s Current Report on Form 8-K filed with the SEC on February 22, 2013). | |
| 2.2 | Amendment to Purchase and Sale Agreement, dated March 21, 2013, between Lake Sunapee Bank, fsb, and Meredith Village Savings Bank (incorporated by reference to Exhibit 2.1 to the Company’s Current Report on Form 8-K filed with the SEC on March 27, 2013). | |
| 2.3 | Agreement and Plan of Merger, dated April 3, 2013, by and between the Company and Central Financial Corporation (incorporated by reference to Exhibit 2.1 to the Company’s Current Report on Form 8-K filed with the SEC on April 3, 2013). | |
| 3.1 | Amended and Restated Certificate of Incorporation (filed as Exhibit 4.1 to the Company’s Registration Statement on Form S-3 filed with the SEC on January 9, 2015). | |
| 3.2 | Certificate of Amendment to the Amended and Restated Certificate of Incorporation (incorporated by reference to Exhibit 3.1 to the Company’s Current Report on Form 8-K filed with the SEC on May 20, 2015). | |
| 3.3 | Certificate of Designations establishing the rights of the Company’s Fixed Rate Cumulative Perpetual Preferred Stock, Series A (incorporated by reference to Exhibit 3.1 to the Company’s Current Report on Form 8-K filed with the SEC on January 22, 2009). | |
| 3.4 | Amended and Restated Certificate of Designations establishing the rights of the Company’s Non-Cumulative Perpetual Preferred Stock, Series B (incorporated by reference to Exhibit 3.1 to the Company’s Current Report on Form 8-K filed with the SEC on March 25, 2013). | |
| 3.5 | Amended and Restated Bylaws (incorporated by reference to Exhibit 3.1 to the Company’s Current Report on Form 8-K filed with the SEC on December 16, 2014). | |
| 4.1 | Stock Certificate (incorporated by reference to the Company’s Registration Statement on Form S-4 filed with the SEC on March 1, 1989). | |
| 4.2 | Indenture by and between the Company, as Issuer, and U.S. Bank National Association, as Trustee, dated March 30, 2004 for Floating Rate Junior Subordinated Deferrable Interest Debentures (incorporated by reference to Exhibit 4.2 to the Company’s Annual Report on Form 10-K for the year ended December 31, 2004 filed with the SEC on March 29, 2005). | |
| 4.3 | Form of Floating Rate Junior Subordinated Deferrable Interest Debenture issued by the Company to U.S. Bank National Association dated March 30, 2004 (incorporated by reference to Exhibit A to Exhibit 4.2 to the Company’s Annual Report on Form 10-K for the year ended December 31, 2004 filed with the SEC on March 29, 2005). | |
| 4.4 | Indenture by and between the Company, as Issuer, and U.S. Bank National Association, as Trustee, dated March 30, 2004 for Fixed/Floating Rate Junior Subordinated Deferrable Interest Debentures (incorporated by reference to Exhibit 4.4 to LSBG’s Annual Report on Form 10-K for the year ended December 31, 2004 filed with the SEC on March 29, 2005). | |
| 4.5 | Form of Fixed/Floating Rate Junior Subordinated Deferrable Interest Debentures issued by the Company to U.S. Bank National Association, dated March 30, 2004 (incorporated by reference to Exhibit A to Exhibit 4.4 to the Company’s Annual Report on Form 10-K for the year ended December 31, 2004 filed with the SEC on March 29, 2005). | |
| 4.6 | Form of Subordinated Note issued by the Company to certain noteholders, dated October 24, 2014 (incorporated by reference to Exhibit 4.1 to the Company’s Current Report on Form 8-K filed with the SEC on October 29, 2014). | |
Table of Contents
| Exhibit No. |
Description | |
| 10.1 | Guarantee Agreement by and between the Company and U.S. Bank National Association, dated March 30, 2004 (incorporated by reference to Exhibit 10.7 to the Company’s Annual Report on Form 10-K for the year ended December 31, 2004 filed with the SEC on March 29, 2005). | |
| 10.2 | Guarantee Agreement by and between the Company and U.S. Bank National Association, dated March 30, 2004 (incorporated by reference to Exhibit 10.8 to the Company’s Annual Report on Form 10-K for the year ended December 31, 2004 filed with the SEC on March 29, 2005). | |
| 10.3 | Subordinated Note Purchase Agreement by and among the Company and the noteholders named therein, dated October 29, 2014 (incorporated by reference to Exhibit 10.1 to the Company’s Current Report on Form 8-K filed with the SEC on October 29, 2014). | |
| 10.4* | The Company’s 2004 Stock Incentive Plan (incorporated by reference to Appendix B to the Company’s Definitive Proxy Statement filed with the SEC on April 8, 2004). | |
| 10.5* | The Company’s 2014 Stock Incentive Plan (incorporated by reference to Exhibit 10.1 to the Company’s Registration Statement on Form S-8 filed with the SEC on July 11, 2014). | |
| 10.6* | Form of Incentive Stock Option Agreement under the 2014 Stock Incentive Plan (incorporated by reference to Exhibit 10.2 to the Company’s Registration Statement on Form S-8 filed with the SEC on July 11, 2014). | |
| 10.7* | Form of Non-Qualified Stock Option Agreement under the 2014 Stock Incentive Plan (incorporated by reference to Exhibit 10.3 to the Company’s Registration Statement on Form S-8 filed with the SEC on July 11, 2014). | |
| 10.8* | Form of Restricted Stock Agreement under the 2014 Stock Incentive Plan (incorporated by reference to Exhibit 10.4 to the Company’s Registration Statement on Form S-8 filed with the SEC on July 11, 2014). | |
| 10.9* | Executive Officer Incentive Bonus Program (incorporated by reference to Exhibit 10.1 to the Company’s Current Report on Form 8-K filed with the SEC on April 14, 2015). | |
| 10.10* | Amended and Restated Supplemental Executive Retirement Plan of the Company (incorporated by reference to Exhibit 10.9 to the Company’s Current Report on Form 8-K filed with SEC on December 14, 2005). | |
| 10.11* | Amendment to the Supplemental Executive Retirement Plan of the Company, effective as of March 9, 2006 (incorporated by reference to Exhibit 10.9 to the Company’s Current Report on Form 8-K filed with SEC on March 14, 2006). | |
| 10.12* | Amendment to the Supplemental Executive Retirement Plan of the Company, effective as of January 1, 2007 (incorporated by reference to Exhibit 10.13 to the Company’s Current Report on Form 8-K filed with the SEC on April 2, 2007). | |
| 10.13* | Form of Executive Salary Continuation Agreement (incorporated by reference to Exhibit 10.14 to the Company’s Current Report on Form 8-K filed with the SEC on February 21, 2008). | |
| 10.14* | Executive Salary Continuation Agreement between the Bank and Stephen R. Theroux (incorporated by reference to Exhibit 10.1 to the Company’s Current Report on Form 8-K filed with the SEC on January 9, 2012). | |
| 10.15* | Executive Salary Continuation Agreement between the Bank and Laura Jacobi (incorporated by reference to Exhibit 10.4 to the Company’s Current Report on Form 8-K filed with the SEC on March 19, 2014). | |
| 10.16 | Small Business Lending Fund—Securities Purchase Agreement, dated as of August 25, 2011, between the Company and Secretary of the Treasury (incorporated by reference to Exhibit 10.1 to the Company’s Current Report on Form 8-K filed with the SEC on August 29, 2011). | |
Table of Contents
| Exhibit No. |
Description | |
| 10.17 | First Amendment to Securities Purchase Agreement, dated March 20, 2013, between the Company and Secretary of the Treasury (incorporated by reference to Exhibit 10.1 to the Company’s Current Report on Form 8-K filed with the SEC on March 25, 2013). | |
| 10.18* | Amended and Restated Employment Agreement, effective June 1, 2012, by and between the Bank and Stephen R. Theroux (incorporated by reference to Exhibit 10.20 to the Company’s Annual Report on Form 10-K for the year ended December 31, 2011, filed with the SEC on March 23, 2012). | |
| 10.19* | Amended and Restated Employment Agreement, effective June 1, 2012, by and between the Company and Stephen R. Theroux (incorporated by reference to Exhibit 10.21 to the Company’s Annual Report on Form 10-K for the year ended December 31, 2011, filed with the SEC on March 23, 2012). | |
| 10.20* | Form of One-Year Change of Control Agreement (incorporated by reference to Exhibit 10.22 to the Company’s Annual Report on Form 10-K for the year ended December 31, 2011, filed with the SEC on March 23, 2012). | |
| 10.21* | Consulting Services Letter Agreement by and between the Company, the Bank and Stephen W. Ensign, dated February 14, 2013 (incorporated by reference to Exhibit 10.1 to the Company’s Current Report on Form 8-K filed with the SEC on February 22, 2013). | |
| 10.22* | Three-Year Change of Control Agreement by and between the Company, the Bank and William J. McIver, dated February 14, 2013 (incorporated by reference to Exhibit 10.2 to the Company’s Current Report on Form 8-K filed with the SEC on February 22, 2013). | |
| 16.1 | Letter, dated August 17, 2015, from Shatswell, MacLeod & Company, P.C. to the Securities and Exchange Commission regarding change in certifying accountant (incorporated by reference to Exhibit 16.1 to the Company’s Current Report on Form 8-K filed with the SEC on August 17, 2015). | |
| 21.1 | Subsidiaries of the Company (incorporated by reference to Exhibit 21.1 to the Company’s Annual Report on Form 10-K for the year ended December 31, 2013 filed with the SEC on March 17, 2014). | |
| 23.1 | Consent of Baker Newman and Noyes, LLC | |
| 23.2 | Consent of Shatswell, MacLeod & Company, P.C. | |
| 31.1 | Rule 13a-14(a)/15d-14(a) Certification of the Chief Executive Officer. | |
| 31.2 | Rule 13a-14(a)/15d-14(a) Certification of the Chief Financial Officer. | |
| 32.1** | Section 1350 Certification of the Chief Executive Officer. | |
| 32.2** | Section 1350 Certification of the Chief Financial Officer. | |
| 101 | Financial statements from the Annual Report on Form 10-K of the Company for the year ended December 31, 2015, formatted in XBRL (eXtensible Business Reporting Language): (i) the Consolidated Balance Sheets, (ii) the Consolidated Statements of Income, (iii) the Consolidated Statements of Comprehensive Income, (iv) the Consolidated Statements of Changes in Stockholders’ Equity, (v) the Consolidated Statements of Cash Flows and (vi) Notes to Consolidated Financial Statements. | |
| * | Denotes management contract or compensatory plan or arrangement. |
| ** | Furnished herewith and not deemed to be “filed” for purposes of Section 18 of the Securities Exchange Act of 1934, as amended (the “Exchange Act”), and shall not be deemed to be incorporated by reference into any filing under the Securities Act of 1933, as amended, or the Exchange Act. |