Attached files
UNITED STATES SECURITIES AND EXCHANGE COMMISSION
WASHINGTON, D.C. 20549
Form 10-K
x | ANNUAL REPORT PURSUANT TO SECTION 13 OR 15(d) OF THE SECURITIES EXCHANGE ACT OF 1934 |
For the fiscal year ended December 31, 2015
¨ | TRANSITION REPORT PURSUANT TO SECTION 13 OR 15(d) OF THE SECURITIES EXCHANGE ACT OF 1934 |
For the transition period from _______________ to _______________
Commission file number: 000-51719

LINN ENERGY, LLC
(Exact name of registrant as specified in its charter)
Delaware | 65-1177591 | |
(State or other jurisdiction of incorporation or organization) | (I.R.S. Employer Identification No.) | |
600 Travis, Suite 5100 Houston, Texas | 77002 | |
(Address of principal executive offices) | (Zip Code) | |
Registrant’s telephone number, including area code
(281) 840-4000
Securities registered pursuant to Section 12(b) of the Act:
Title of each class | Name of each exchange on which registered | |
Units Representing Limited Liability Company Interests | The NASDAQ Global Select Market | |
Securities registered pursuant to Section 12(g) of the Act:
None
Indicate by check mark if the registrant is a well-known seasoned issuer, as defined in Rule 405 of the Securities
Act. Yes x No ¨
Indicate by check mark if the registrant is not required to file reports pursuant to Section 13 or Section 15(d) of the Act. Yes ¨ No x
Indicate by check mark whether the registrant (1) has filed all reports required to be filed by Section 13 or 15(d) of the Securities Exchange Act of 1934 during the preceding 12 months (or for such shorter period that the registrant was required to file such reports), and (2) has been subject to such filing requirements for the past 90 days.
Yes x No ¨
Indicate by check mark whether the registrant has submitted electronically and posted on its corporate Website, if any, every Interactive Data File required to be submitted and posted pursuant to Rule 405 of Regulation S-T (§232.405) during the preceding 12 months (or for such shorter period that the registrant was required to submit and post such files).
Yes x No ¨
Indicate by check mark if disclosure of delinquent filers pursuant to Item 405 of Regulation S-K (§229.405) is not contained herein, and will not be contained, to the best of registrant’s knowledge, in definitive proxy or information statements incorporated by reference in Part III of this Form 10-K or any amendment to this Form 10-K. x
Indicate by check mark whether the registrant is a large accelerated filer, an accelerated filer, a non-accelerated filer, or a smaller reporting company. See the definitions of “large accelerated filer,” “accelerated filer” and “smaller reporting company” in Rule 12b-2 of the Exchange Act.
Large accelerated filer x Accelerated filer ¨ Non-accelerated filer ¨ Smaller reporting company ¨
Indicate by check-mark whether the registrant is a shell company (as defined in Rule 12b-2 of the Act).
Yes ¨ No x
The aggregate market value of voting and non-voting common equity held by non-affiliates of the registrant was approximately $2.0 billion on June 30, 2015, based on $8.91 per unit, the last reported sales price of the units on the NASDAQ Global Select Market on such date.
As of January 31, 2016, there were 355,241,631 units outstanding.
Documents Incorporated By Reference:
Certain information called for in Items 10, 11, 12, 13 and 14 of Part III are incorporated by reference to the registrant’s definitive proxy statement for its annual meeting of unitholders, or will be included in an amendment to this Annual Report on Form 10-K.
TABLE OF CONTENTS
Page | ||
i
Glossary of Terms
As commonly used in the oil and natural gas industry and as used in this Annual Report on Form 10-K, the following terms have the following meanings:
Basin. A large area with a relatively thick accumulation of sedimentary rocks.
Bbl. One stock tank barrel or 42 United States gallons liquid volume.
Bcf. One billion cubic feet.
Bcfe. One billion cubic feet equivalent, determined using the ratio of six Mcf of natural gas to one Bbl of oil, condensate or natural gas liquids.
Btu. One British thermal unit, which is the heat required to raise the temperature of a one-pound mass of water from 58.5 degrees to 59.5 degrees Fahrenheit.
Development well. A well drilled within the proved area of a reservoir to the depth of a stratigraphic horizon known to be productive.
Diatomite. A sedimentary rock composed primarily of siliceous, diatom shells.
Dry hole or well. A well found to be incapable of producing hydrocarbons in sufficient quantities such that proceeds from the sale of such production would exceed production expenses and taxes.
Enhanced oil recovery. A technique for increasing the amount of oil that can be extracted from a field.
Field. An area consisting of a single reservoir or multiple reservoirs all grouped on or related to the same individual geological structural feature and/or stratigraphic condition.
Formation. A stratum of rock that is recognizable from adjacent strata consisting primarily of a certain type of rock or combination of rock types with thickness that may range from less than two feet to hundreds of feet.
Gross acres or gross wells. The total acres or wells, as the case may be, in which a working interest is owned.
MBbls. One thousand barrels of oil or other liquid hydrocarbons.
MBbls/d. MBbls per day.
Mcf. One thousand cubic feet.
Mcfe. One thousand cubic feet equivalent, determined using the ratio of six Mcf of natural gas to one Bbl of oil, condensate or natural gas liquids.
MMBbls. One million barrels of oil or other liquid hydrocarbons.
MMBtu. One million British thermal units.
MMcf. One million cubic feet.
MMcf/d. MMcf per day.
MMcfe. One million cubic feet equivalent, determined using the ratio of six Mcf of natural gas to one Bbl of oil, condensate or natural gas liquids.
MMcfe/d. MMcfe per day.
MMMBtu. One billion British thermal units.
ii
Glossary of Terms - Continued
Net acres or net wells. The sum of the fractional working interests owned in gross acres or gross wells, as the case may be.
NGL. Natural gas liquids, which are the hydrocarbon liquids contained within natural gas.
Productive well. A well that is found to be capable of producing hydrocarbons in sufficient quantities such that proceeds from the sale of such production exceeds production expenses and taxes.
Proved developed reserves. Reserves that can be expected to be recovered through existing wells with existing equipment and operating methods or in which the cost of the required equipment is relatively minor compared to the cost of a new well; and through installed extraction equipment and infrastructure operational at the time of the reserves estimate if the extraction is by means not involving a well.
Proved reserves. Reserves that by analysis of geoscience and engineering data can be estimated with reasonable certainty to be economically producible from a given date forward, from known reservoirs, and under existing economic conditions, operating methods, and government regulations prior to the time at which contracts providing the right to operate expire, unless evidence indicates that renewal is reasonably certain. The project to extract the hydrocarbons must have commenced or the operator must be reasonably certain that it will commence the project within a reasonable time.
Proved undeveloped drilling location. A site on which a development well can be drilled consistent with spacing rules for purposes of recovering proved undeveloped reserves.
Proved undeveloped reserves or PUDs. Reserves that are expected to be recovered from new wells on undrilled acreage, or from existing wells where a relatively major expenditure is required for recompletion. Reserves on undrilled acreage are limited to those directly offsetting development spacing areas that are reasonably certain of production when drilled, unless evidence using reliable technology exists that establishes reasonable certainty of economic producibility at greater distances. Undrilled locations can be classified as having undeveloped reserves only if a development plan has been adopted indicating that they are scheduled to be drilled within five years, unless the specific circumstances justify a longer time. Estimates for proved undeveloped reserves are not attributed to any acreage for which an application of fluid injection or other improved recovery technique is contemplated, unless such techniques have been proved effective by actual projects in the same reservoir or an analogous reservoir, or by other evidence using reliable technology establishing reasonable certainty.
Recompletion. The completion for production of an existing wellbore in another formation from that which the well has been previously completed.
Reservoir. A porous and permeable underground formation containing a natural accumulation of economically productive natural gas and/or oil that is confined by impermeable rock or water barriers and is individual and separate from other reserves.
Royalty interest. An interest that entitles the owner of such interest to a share of the mineral production from a property or to a share of the proceeds there from. It does not contain the rights and obligations of operating the property and normally does not bear any of the costs of exploration, development and operation of the property.
Spacing. The number of wells which conservation laws allow to be drilled on a given area of land.
Standardized measure of discounted future net cash flows. The present value of estimated future net revenues to be generated from the production of proved reserves, determined in accordance with the regulations of the Securities and Exchange Commission, without giving effect to non-property related expenses such as general and administrative expenses, debt service, future income tax expenses or depreciation, depletion and amortization; discounted using an annual discount rate of 10%.
Tcfe. One trillion cubic feet equivalent, determined using the ratio of six Mcf of natural gas to one Bbl of oil, condensate or natural gas liquids.
Undeveloped acreage. Lease acreage on which wells have not been drilled or completed to a point that would permit the production of commercial quantities of oil, natural gas and NGL regardless of whether such acreage contains proved reserves.
iii
Glossary of Terms - Continued
Unproved reserves. Reserves that are considered less certain to be recovered than proved reserves. Unproved reserves may be further sub-classified to denote progressively increasing uncertainty of recoverability and include probable reserves and possible reserves.
Working interest. The operating interest that gives the owner the right to drill, produce and conduct operating activities on the property and a share of production.
Workover. Maintenance on a producing well to restore or increase production.
Zone. A stratigraphic interval containing one or more reservoirs.
iv
Part I
Item 1. Business
This Annual Report on Form 10-K contains forward-looking statements based on expectations, estimates and assumptions as of the date of this filing. These statements by their nature are subject to a number of risks and uncertainties. Actual results may differ materially from those discussed in the forward-looking statements. For more information, see “Cautionary Statement Regarding Forward-Looking Statements” included at the end of this Item 1. “Business” and see also Item 1A. “Risk Factors.”
References
When referring to Linn Energy, LLC (“LINN Energy” or the “Company”), the intent is to refer to LINN Energy and its consolidated subsidiaries as a whole or on an individual basis, depending on the context in which the statements are made. The reference to “Berry” herein refers to Berry Petroleum Company, LLC, which is an indirect 100% wholly owned subsidiary of the Company.
The reference to a “Note” herein refers to the accompanying Notes to Consolidated Financial Statements contained in Item 8. “Financial Statements and Supplementary Data.”
Overview
LINN Energy’s mission is to acquire, develop and maximize cash flow from a growing portfolio of long-life oil and natural gas assets. LINN Energy is an independent oil and natural gas company that began operations in March 2003 and completed its initial public offering in January 2006. The Company’s properties are located in the United States (“U.S.”), in the Hugoton Basin, the Rockies, California, east Texas and north Louisiana (“TexLa”), the Mid-Continent, Michigan/Illinois, the Permian Basin and south Texas.
Proved reserves at December 31, 2015, were approximately 4,488 Bcfe, of which approximately 26% were oil, 59% were natural gas and 15% were natural gas liquids (“NGL”). All proved reserves were classified as proved developed, with a total standardized measure of discounted future net cash flows of approximately $3.0 billion. At December 31, 2015, the Company operated 19,294 or approximately 72% of its 26,808 gross productive wells and had an average proved reserve-life index of approximately 11 years, based on the December 31, 2015, reserve reports and year-end 2015 production.
Strategy
The Company is pursuing several strategies in the current low commodity price environment, as discussed below.
• | Evaluate Strategic Alternatives. The Company’s Board of Directors and management are in the process of evaluating strategic alternatives to help provide the Company with financial stability, but no assurance can be given as to the outcome or timing of this process. See below under “Recent Developments” for additional details. |
• | Live Within Cash Flow While Maximizing Liquidity and Financial Flexibility. The Company has taken the following steps to live within cash flow while maximizing liquidity and financial flexibility in the current low commodity price environment: |
• | In January 2015, the Company reduced its distribution to $1.25 per unit, from the previous level of $2.90 per unit, on an annualized basis. In October 2015, the Company suspended payment of its distribution; |
• | For 2015, the Company decreased its total capital expenditures approximately 67% compared to the amount spent in 2014. For 2016, the Company estimates its total capital expenditures will be approximately $340 million, representing a decrease of approximately 34% compared to the amount spent in 2015; |
• | During the year ended December 31, 2015, the Company repurchased at a discount, through privately negotiated transactions and on the open market, approximately $992 million of its outstanding senior notes, and in November 2015, the Company issued $1.0 billion in aggregate principal amount of new 12.00% senior secured second lien notes due December 2020 in exchange for approximately $2.0 billion in aggregate principal amount of certain of its outstanding senior notes (see below for additional details); |
1
Item 1. Business - Continued
• | The Company continues to implement cost reduction initiatives across its organization. During 2015, the Company took steps to reduce its lease operating expenses, general and administrative expenses, interest costs and capital costs; and |
• | The Company has a commodity hedge book with a fair value of approximately $1.8 billion as of December 31, 2015 (see Note 7). |
As a result of these steps, the Company has reduced its spending levels with the goal of living within cash flow. For the year ended December 31, 2015, after discretionary adjustments considered by its Board of Directors, the Company had an excess of approximately $368 million of net cash provided by operating activities after funding its interest costs, total oil and natural gas development costs and its distributions to unitholders paid through September 2015 (“excess cash”). The excess cash was used primarily to reduce indebtedness.
Also, in June 2015, the Company formed strategic alliances with affiliates of private capital investor GSO Capital Partners LP (“GSO”) and affiliates of private capital investor Quantum Energy Partners (“Quantum”) which may give the Company access to additional capital. Funds managed by GSO have agreed to commit up to $500 million with 5-year availability to fund drilling programs while funds managed by Quantum have committed $1 billion to fund selected future oil and natural gas acquisitions. See below for additional details.
In addition, in February 2016, the Company borrowed approximately $919 million under the LINN Credit Facility, which represented the remaining undrawn amount that was available under the LINN Credit Facility, the proceeds of which were deposited in an unencumbered account with a bank that is not a lender under either the LINN or Berry Credit Facility. These funds are intended to be used for general corporate purposes. As of February 29, 2016, there was less than $1 million of available borrowing capacity under the Credit Facilities, as defined in Note 6.
• | Efficiently Operate and Develop Properties. The Company has organized the operation of its properties into defined operating regions to minimize operating costs and maximize production and capital efficiency. The Company maintains a large inventory of drilling and optimization projects within each region to achieve organic growth from its capital development program. The Company generally seeks to be the operator of its properties so that it can develop drilling programs and optimization projects intended to not only replace production, but add value through reserve and production growth and future operational synergies. The development program is focused on lower-risk, repeatable drilling opportunities to maintain and/or grow net cash provided by operating activities. Many of the Company’s wells are completed in multiple producing zones with commingled production and long economic lives. In addition, the Company seeks to deliver attractive financial returns by leveraging its experienced workforce and scalable infrastructure. |
Recent Developments
See Item 7. “Management’s Discussion and Analysis of Financial Condition and Results of Operations” for details about the Company’s going concern uncertainty.
Process to Explore Strategic Alternatives Related to the Company’s Capital Structure
In February 2016, the Company announced that it had initiated a process to explore strategic alternatives to strengthen its balance sheet and maximize the value of the Company. The Company’s Board of Directors and management are in the process of evaluating strategic alternatives to help provide the Company with financial stability, but no assurance can be given as to the outcome or timing of this process. The Company has retained Lazard as its financial advisor and Kirkland & Ellis LLP as its legal advisor to assist the Board of Directors and management team with the strategic review process.
Reduction and Suspension of Distribution
In January 2015, the Company reduced its distribution to $1.25 per unit, from the previous level of $2.90 per unit, on an annualized basis. Monthly distributions were paid by the Company through September 2015. In October 2015, following the recommendation from management, the Company’s Board of Directors determined to suspend payment of the Company’s distribution and reserve any excess cash that would otherwise be available for distribution. The Company’s Board of Directors and management believe the suspension to be in the best long-term interest of all Company stakeholders. The Company’s Board of Directors will continue to evaluate the Company’s ability to reinstate the distribution.
2
Item 1. Business - Continued
2016 Oil and Natural Gas Capital Budget
For 2016, the Company estimates its total capital expenditures, excluding acquisitions, will be approximately $340 million, including approximately $250 million related to its oil and natural gas capital program and approximately $75 million related to its plant and pipeline capital. The 2016 budget contemplates continued low commodity prices and is under continuous review and subject to ongoing adjustments. The Company expects to fund its capital expenditures primarily from net cash provided by operating activities; however, there is uncertainty regarding the Company’s liquidity as discussed in Item 7. “Management’s Discussion and Analysis of Financial Condition and Results of Operations.”
Alliance with GSO Capital Partners
The Company signed definitive agreements dated June 30, 2015, with GSO, the credit platform of The Blackstone Group L.P., to fund oil and natural gas development (“DrillCo”). Funds managed by GSO have agreed to commit up to $500 million with 5-year availability to fund drilling programs on locations provided by LINN Energy. Subject to adjustments depending on asset characteristics and return expectations of the selected drilling plan, GSO will fund 100% of the costs associated with new wells drilled under the DrillCo agreement and is expected to receive an 85% working interest in these wells until it achieves a 15% internal rate of return on annual groupings of wells, while LINN Energy is expected to receive a 15% carried working interest during this period. Upon reaching the internal rate of return target, GSO’s interest will be reduced to 5%, while LINN Energy’s interest will increase to 95%. As of December 31, 2015, no development activities had been funded under the agreement.
Alliance with Quantum Energy Partners
The Company signed definitive agreements dated June 30, 2015, with Quantum to fund selected future oil and natural gas acquisitions and the development of those acquired assets (“AcqCo”). See the Company’s Current Report on Form 8-K filed on July 7, 2015, for additional details regarding these agreements.
Divestiture
On August 31, 2015, the Company, through certain of its wholly owned subsidiaries, completed the sale of its remaining position in Howard County in the Permian Basin. Cash proceeds received from the sale of these properties were approximately $276 million. The Company used the net proceeds from the sale to repay a portion of the outstanding indebtedness under the LINN Credit Facility.
Financing Activities
In November 2015, the Company entered into separate, privately-negotiated, exchange agreements (“Exchange Agreements”) with certain holders of the Company’s outstanding 6.50% senior notes due May 2019, 6.25% senior notes due November 2019, 8.625% senior notes due April 2020, 7.75% senior notes due February 2021 and 6.50% senior notes due September 2021 (“Exchanged Notes”). The Exchange Agreements provided that the Company issue $1.0 billion in aggregate principal amount of new 12.00% senior secured second lien notes due December 2020 in exchange for approximately $2.0 billion in aggregate principal amount of the Company’s Exchanged Notes held by such holders. The indenture governing the second lien notes (“Second Lien Indenture”) required the Company to deliver mortgages by February 18, 2016, subject to a 45 day grace period. The Company elected to exercise its right to the grace period and not deliver the mortgages, and as a result, the Company is currently in default under the Second Lien Indenture. See Item 7. “Management’s Discussion and Analysis of Financial Condition and Results of Operations – Going Concern Uncertainty” for additional information.
In addition, during the year ended December 31, 2015, the Company repurchased at a discount, through privately negotiated transactions and on the open market, approximately $992 million of its outstanding senior notes.
The spring 2015 semi-annual borrowing base redeterminations of the Company’s Credit Facilities were completed in May 2015, and as a result of lower commodity prices, the borrowing base under the LINN Credit Facility decreased from $4.5 billion to $4.05 billion and the borrowing base under the Berry Credit Facility decreased from $1.4 billion to $1.2 billion, including $250 million posted as restricted cash (discussed below). The fall 2015 semi-annual redeterminations were completed in October 2015 and the borrowing base under the LINN Credit Facility was reaffirmed at $4.05 billion, subject to certain conditions being met on or before January 1, 2016, and the borrowing base under the Berry Credit Facility decreased from $1.2 billion to $900 million, including the $250 million of restricted cash. In connection with the reduction in Berry’s
3
Item 1. Business - Continued
borrowing base in October 2015, Berry repaid $300 million of borrowings outstanding under the Berry Credit Facility. The borrowing base under the LINN Credit Facility automatically decreased to $3.6 billion on January 1, 2016, since certain conditions were not met. Also, in October 2015, LINN Energy and Berry each entered into an amendment to its Credit Facility.
Continued low commodity prices, reductions in the Company’s capital budget and the resulting reserve write-downs, along with the maturity schedule of the Company’s hedges, are expected to adversely impact future redeterminations.
In connection with the reduction in Berry’s borrowing base in May 2015, LINN Energy borrowed $250 million under the LINN Credit Facility and contributed it to Berry to post as restricted cash with Berry’s lenders. As directed by LINN Energy, the $250 million was deposited on Berry’s behalf in a security account with the administrative agent subject to a security control agreement. Berry’s ability to withdraw funds from this account is subject to a concurrent reduction of the borrowing base under the Berry Credit Facility or lender’s consent in connection with a redetermination of such borrowing base. The $250 million may be used to satisfy obligations under the Berry Credit Facility or, subject to restrictions in the indentures governing Berry’s senior notes, may be returned to LINN Energy in the future.
See Note 6 for additional details about the Company’s debt.
During the year ended December 31, 2015, the Company, under its equity distribution agreement, sold 3,621,983 units representing limited liability company interests at an average price of $12.37 per unit for net proceeds of approximately $44 million (net of approximately $448,000 in commissions). The Company used the net proceeds for general corporate purposes, including the open market repurchases of a portion of its senior notes (see Note 6). At December 31, 2015, units totaling approximately $455 million in aggregate offering price remained available to be sold under the agreement.
In May 2015, the Company sold 16,000,000 units representing limited liability company interests in an underwritten public offering at $11.79 per unit ($11.32 per unit, net of underwriting discount) for net proceeds of approximately $181 million (after underwriting discount and offering costs of approximately $8 million). The Company used the net proceeds from the sale of these units to repay a portion of the outstanding indebtedness under the LINN Credit Facility.
Commodity Derivatives
During the year ended December 31, 2015, the Company entered into commodity derivative contracts consisting of natural gas basis swaps for May 2015 through December 2017 to hedge exposure to differentials in certain producing areas and oil swaps for April 2015 through December 2015. In addition, the Company entered into natural gas basis swaps for May 2015 through December 2016 to hedge exposure to the differential in California, where it consumes natural gas in its heavy oil development operations.
During the fourth quarter of 2015, the Company canceled certain of its commodity derivative contracts, consisting of Permian basis swaps for 2016 and 2017, trade month roll swaps for 2016 and 2017, and positions representing oil swaps which could have been extended at counterparty election for 2017. The Company received net cash settlements of approximately $5 million from the cancellations.
Operating Regions
The Company’s properties are located in eight operating regions in the U.S.:
• | Hugoton Basin, which includes properties located in Kansas, the Oklahoma Panhandle and the Shallow Texas Panhandle; |
• | Rockies, which includes properties located in Wyoming (Green River, Washakie and Powder River basins), Utah (Uinta Basin), North Dakota (Williston Basin) and Colorado (Piceance Basin); |
• | California, which includes properties located in the San Joaquin Valley and Los Angeles basins; |
• | TexLa, which includes properties located in east Texas and north Louisiana; |
• | Mid-Continent, which includes Oklahoma properties located in the Anadarko and Arkoma basins, as well as waterfloods in the Central Oklahoma Platform; |
• | Michigan/Illinois, which includes properties located in the Antrim Shale formation in north Michigan and oil properties in south Illinois; |
4
Item 1. Business - Continued
• | Permian Basin, which includes properties located in west Texas and southeast New Mexico; and |
• | South Texas. |
Hugoton Basin
The Hugoton Basin is a large oil and natural gas producing area located in southwest Kansas extending through the Oklahoma Panhandle into the central portion of the Texas Panhandle. The Company’s Kansas and Oklahoma Panhandle properties primarily produce from the Council Grove and Chase formations at depths ranging from 2,200 feet to 3,100 feet and its Texas properties in the basin primarily produce from the Brown Dolomite formation at depths of approximately 3,200 feet. The Company’s properties in this region are primarily mature, low-decline natural gas wells.
To more efficiently transport its natural gas in the Texas Panhandle to market, the Company owns and operates a network of natural gas gathering systems comprised of approximately 665 miles of pipeline and associated compression and metering facilities that connect to numerous sales outlets in the area. The Company also operates two natural gas processing plants in southwest Kansas. The Company owns the Jayhawk natural gas processing plant with capacity of approximately 450 MMcf/d, and has a 51% operating interest in the Satanta natural gas processing plant with capacity of approximately 220 MMcf/d, allowing it to receive maximum value from the liquids-rich natural gas produced in the area. The Company’s production in the area is delivered to the plants via a system of approximately 3,920 miles of pipeline and related facilities operated by the Company, of which approximately 2,065 miles of pipeline are owned by the Company.
Hugoton Basin proved reserves represented approximately 31% of total proved reserves at December 31, 2015, all of which were classified as proved developed. This region produced approximately 252 MMcfe/d or 21% of the Company’s 2015 average daily production. During 2015, the Company invested approximately $9 million to develop the properties in this region. During 2016, the Company anticipates spending approximately 1% of its total oil and natural gas capital budget for development activities in the Hugoton Basin region.
Rockies
The Rockies region consists of properties located in Wyoming (Green River, Washakie and Powder River basins), northeast Utah (Uinta Basin), North Dakota (Bakken and Three Forks formations in the Williston Basin) and northwest Colorado (Piceance Basin). Wells in this diverse region produce from both oil and natural gas reservoirs at depths ranging from 1,000 feet to 15,000 feet. The Company’s properties in the Jonah Field located in the Green River Basin of southwest Wyoming produce from the Lance and Mesaverde formations at depths ranging from 8,000 feet to 14,500 feet. The Company’s properties in the Washakie Basin produce at depths ranging from 7,500 feet to 11,500 feet. The Company’s properties in the Powder River Basin consist of a CO2 flood operated by Fleur de Lis Energy, LLC in the Salt Creek Field. The Company’s properties in the Uinta Basin produce at depths ranging from 5,000 feet to 15,000 feet. The Company’s nonoperated properties in the Williston Basin produce at depths ranging from 9,000 feet to 12,000 feet and its properties in the Piceance Basin produce at depths ranging from 7,500 feet to 9,500 feet.
To more efficiently transport its natural gas in the Uinta Basin to market, the Company owns and operates a network of natural gas gathering systems comprised of approximately 845 miles of pipeline and associated compression and metering facilities that connect to numerous sales outlets in the area. The Company also owns the Brundage Canyon natural gas processing plant with capacity of approximately 30 MMcf/d.
Rockies proved reserves represented approximately 22% of total proved reserves at December 31, 2015, all of which were classified as proved developed. This region produced approximately 426 MMcfe/d or 35% of the Company’s 2015 average daily production. During 2015, the Company invested approximately $209 million to develop the properties in this region. During 2016, the Company anticipates spending approximately 30% of its total oil and natural gas capital budget for development activities in the Rockies region.
California
The California region consists of properties located in the Midway-Sunset, McKittrick, Poso Creek and South Belridge fields in the San Joaquin Valley Basin as well as the Brea Olinda and Placerita fields in the Los Angeles Basin. The properties in the Midway-Sunset, McKittrick, Placerita, Poso Creek and South Belridge fields produce using thermal enhanced oil
5
Item 1. Business - Continued
recovery methods at depths ranging from 800 feet to 2,000 feet. Thermal production in the San Joaquin Valley Basin is primarily from the Tulare, Potter, Monarch and Diatomite formations, and in the Los Angeles Basin, thermal production is from the upper and lower Kraft formations. The Brea Olinda Field was discovered in 1880 and produces from the shallow Pliocene formation to the deeper Miocene formation at depths ranging from 1,000 feet to 7,500 feet. The Company’s properties in this region are primarily mature, low-decline oil wells.
California proved reserves represented approximately 16% of total proved reserves at December 31, 2015, all of which were classified as proved developed. This region produced approximately 185 MMcfe/d or 16% of the Company’s 2015 average daily production. During 2015, the Company invested approximately $138 million to develop the properties in this region. During 2016, the Company anticipates spending approximately 13% of its total oil and natural gas capital budget for development activities in the California region.
TexLa
The TexLa region consists of properties located in east Texas and north Louisiana and primarily produces natural gas from the Cotton Valley and Travis Peak formations at depths ranging from 7,000 feet to 11,500 feet. Proved reserves for these mature, low-decline producing properties represented approximately 10% of total proved reserves at December 31, 2015, all of which were classified as proved developed. To more efficiently transport its natural gas in east Texas to market, the Company owns and operates a network of natural gas gathering systems comprised of approximately 630 miles of pipeline and associated compression and metering facilities that connect to numerous sales outlets in the area. This region produced approximately 82 MMcfe/d or 7% of the Company’s 2015 average daily production. During 2015, the Company invested approximately $35 million to develop properties in this region and approximately $10 million in exploration activity. During 2016, the Company anticipates spending approximately 5% of its total oil and natural gas capital budget for development activities in the TexLa region.
Mid-Continent
The Mid-Continent region consists of properties located in the Anadarko and Arkoma basins in Oklahoma, as well as waterfloods in the Central Oklahoma Platform. In December 2014, the Company completed the sale of its entire position in the Granite Wash and Cleveland plays located in the Texas Panhandle and western Oklahoma. The Company’s properties in this diverse region produce from both oil and natural gas reservoirs at depths ranging from 1,500 feet to 11,000 feet. As of December 31, 2015, the Company’s properties in this region are primarily mature, low-decline oil and natural gas wells.
Mid-Continent proved reserves represented approximately 9% of total proved reserves at December 31, 2015, all of which were classified as proved developed. This region produced approximately 100 MMcfe/d or 8% of the Company’s 2015 average daily production. During 2015, the Company invested approximately $10 million to develop the properties in this region and approximately $10 million in exploration activity. During 2016, the Company anticipates spending approximately 44% of its total oil and natural gas capital budget for development activities in the Mid-Continent region.
Michigan/Illinois
The Michigan/Illinois region consists primarily of natural gas properties in the Antrim Shale formation in north Michigan and oil properties in south Illinois. These wells produce at depths ranging from 600 feet to 4,000 feet. Michigan/Illinois proved reserves represented approximately 7% of total proved reserves at December 31, 2015, all of which were classified as proved developed. To more efficiently transport its natural gas in Michigan to market, the Company owns and operates a network of natural gas gathering systems comprised of approximately 1,480 miles of pipeline and associated compression and metering facilities that connect to numerous sales outlets in the area. This region produced approximately 31 MMcfe/d or 3% of the Company’s 2015 average daily production. During 2015, the Company invested approximately $2 million to develop properties in this region. During 2016, the Company anticipates spending approximately 1% of its total oil and natural gas capital budget for development activities in the Michigan/Illinois region.
Permian Basin
The Permian Basin is one of the largest and most prolific oil and natural gas basins in the U.S. During the second half of 2014, the Company completed divestitures of the majority of its Midland Basin properties, and in August 2015, the Company completed an additional divestiture in this region. The Company’s properties are located in west Texas and southeast New
6
Item 1. Business - Continued
Mexico and primarily produce at depths ranging from 2,000 feet to 12,000 feet, and are primarily mature, low-decline oil and natural gas wells including several waterflood properties located across the basin.
Permian Basin proved reserves represented approximately 3% of total proved reserves at December 31, 2015, all of which were classified as proved developed. This region produced approximately 80 MMcfe/d or 7% of the Company’s 2015 average daily production. During 2015, the Company invested approximately $20 million to develop the properties in this region. During 2016, the Company anticipates spending approximately 2% of its total oil and natural gas capital budget for development activities in the Permian Basin region.
South Texas
The South Texas region consists of a widely diverse set of oil and natural gas properties located in a large area extending from north Houston to the border of Mexico. These wells produce at depths ranging from 2,000 feet to 17,000 feet. Proved reserves for these mature properties, the majority of which are natural gas with associated NGL, represented approximately 2% of total proved reserves at December 31, 2015, all of which were classified as proved developed. This region produced approximately 32 MMcfe/d or 3% of the Company’s 2015 average daily production. During 2015, the Company invested approximately $7 million to develop properties in this region. During 2016, the Company anticipates spending approximately 4% of its total oil and natural gas capital budget for development activities in the South Texas region.
Drilling and Acreage
The following table sets forth the wells drilled during the periods indicated:
Year Ended December 31, | ||||||||
2015 | 2014 | 2013 | ||||||
Gross wells: | ||||||||
Productive | 584 | 917 | 557 | |||||
Dry | 5 | 1 | 2 | |||||
589 | 918 | 559 | ||||||
Net development wells: | ||||||||
Productive | 302 | 698 | 304 | |||||
Dry | 1 | 1 | 1 | |||||
303 | 699 | 305 | ||||||
Net exploratory wells: | ||||||||
Productive | 1 | — | 1 | |||||
Dry | 1 | — | — | |||||
2 | — | 1 | ||||||
There were two lateral segments added to existing vertical wellbores during the year ended December 31, 2015. There were no lateral segments added to existing vertical wellbores during the years ended December 31, 2014, or December 31, 2013. As of December 31, 2015, the Company had 92 gross (7 net) wells in progress (53 gross and 4 net wells were temporarily suspended).
This information should not be considered indicative of future performance, nor should it be assumed that there is necessarily any correlation between the number of productive wells drilled and the quantities or economic value of reserves found. Productive wells are those that produce commercial quantities of oil, natural gas or NGL, regardless of whether they generate a reasonable rate of return.
7
Item 1. Business - Continued
The following table sets forth information about the Company’s drilling locations and net acres of leasehold interests as of December 31, 2015:
Total (1) | ||
Proved undeveloped | — | |
Other locations | 5,631 | |
Total drilling locations | 5,631 | |
Leasehold interests – net acres (in thousands) | 3,575 | |
(1) | Does not include optimization projects. |
As a result of the uncertainty regarding the Company’s future commitment to capital, the Company reclassified all of its proved undeveloped reserves (“PUDs”) to unproved as of December 31, 2015. See Item 7. “Management’s Discussion and Analysis of Financial Condition and Results of Operations” for details regarding the Company’s going concern uncertainty. As of December 31, 2015, the Company had identified 5,631 unproved drilling locations (specific drilling locations as to which DeGolyer and MacNaughton has not assigned any proved reserves) on acreage that the Company has under existing leases. Successful development wells frequently result in the reclassification of adjacent lease acreage from unproved to proved. The number of unproved drilling locations that will be reclassified as proved drilling locations will depend on the Company’s drilling program, its commitment to capital and commodity prices.
Productive Wells
The following table sets forth information relating to the productive wells in which the Company owned a working interest as of December 31, 2015. Productive wells consist of producing wells and wells capable of production, including wells awaiting pipeline or other connections to commence deliveries. The number of wells below does not include approximately 2,620 gross productive wells in which the Company owns a royalty interest only.
Natural Gas Wells | Oil Wells | Total Wells | |||||||||||||||
Gross | Net | Gross | Net | Gross | Net | ||||||||||||
Operated (1) | 11,949 | 10,662 | 7,345 | 7,000 | 19,294 | 17,662 | |||||||||||
Nonoperated (2) | 4,872 | 1,892 | 2,642 | 307 | 7,514 | 2,199 | |||||||||||
16,821 | 12,554 | 9,987 | 7,307 | 26,808 | 19,861 | ||||||||||||
(1) | The Company had 32 operated wells with multiple completions at December 31, 2015. |
(2) | The Company had 20 nonoperated wells with multiple completions at December 31, 2015. |
Developed and Undeveloped Acreage
The following table sets forth information relating to leasehold acreage as of December 31, 2015:
Developed Acreage | Undeveloped Acreage | Total Acreage | |||||||||||||||
Gross | Net | Gross | Net | Gross | Net | ||||||||||||
(in thousands) | |||||||||||||||||
Leasehold acreage | 4,608 | 3,212 | 584 | 363 | 5,192 | 3,575 | |||||||||||
8
Item 1. Business - Continued
Future Acreage Expirations
If production is not established or the Company takes no other action to extend the terms of the related leases, undeveloped acreage will expire over the next three years as follows:
2016 | 2017 | 2018 | |||||||||||||||
Gross | Net | Gross | Net | Gross | Net | ||||||||||||
(in thousands) | |||||||||||||||||
Leasehold acreage | 35 | 20 | 155 | 91 | 54 | 50 | |||||||||||
The Company’s investment in developed and undeveloped acreage comprises numerous leases. The terms and conditions under which the Company maintains exploration or production rights to the acreage are property-specific, contractually defined and vary significantly from property to property. Work programs are designed to ensure that the exploration potential of any property is fully evaluated before expiration. In some instances, the Company may elect to relinquish acreage in advance of the contractual expiration date if the evaluation process is complete and there is not a business basis for extension. In cases where additional time may be required to fully evaluate acreage, the Company has generally been successful in obtaining extensions. The Company utilizes various methods to manage the expiration of leases, including drilling the acreage prior to lease expiration or extending lease terms. The Company currently has no plans to develop or extend the lease terms on the majority of the acreage related to leases that are due to expire in 2016.
Production, Price and Cost History
The Company’s natural gas production is primarily sold under market-sensitive contracts that are typically priced at a differential to the published natural gas index price for the producing area due to the natural gas quality and the proximity to major consuming markets. The Company’s natural gas production is sold to purchasers under percentage-of-proceeds contracts, percentage-of-index contracts or spot price contracts. Under percentage-of-proceeds contracts, the Company receives a percentage of the resale price received by the purchaser for sales of residual natural gas and NGL recovered after transportation and processing of natural gas. These purchasers sell the residual natural gas and NGL based primarily on spot market prices. Under percentage-of-index contracts, the Company receives a price for natural gas and NGL based on indexes published for the producing area. Although exact percentages vary daily, as of December 31, 2015, approximately 90% of the Company’s natural gas and NGL production was sold under short-term contracts at market-sensitive or spot prices. In certain circumstances, the Company has entered into natural gas processing contracts whereby the residual natural gas is sold under short-term contracts but the related NGL are sold under long-term contracts. In all such cases, the residual natural gas and NGL are sold at market-sensitive index prices. As of December 31, 2015, the Company had natural gas delivery commitments under a long-term contract of approximately 15 Bcf to be delivered each year through 2018 and approximately 2 Bcf to be delivered in 2019. In addition, the Company had NGL delivery commitments under long-term contracts of approximately 5,279 MBbls and 4,180 MBbls to be delivered in 2016 and 2017, respectively, and approximately 1,000 MBbls to be delivered in each subsequent year through 2022.
The Company’s oil production is primarily sold under market-sensitive contracts that are typically priced at a differential to the New York Mercantile Exchange (“NYMEX”) price or at purchaser posted prices for the producing area, and as of December 31, 2015, approximately 90% of its oil production was sold under short-term contracts. As of December 31, 2015, the Company had oil delivery commitments under long-term contracts of approximately 3,400 MBbls to be delivered by June 2018.
The Company’s natural gas is transported through its own and third-party gathering systems and pipelines. The Company incurs processing, gathering and transportation expenses to move its natural gas from the wellhead to a purchaser-specified delivery point. These expenses vary based on the volume, distance shipped and the fee charged by the third-party processor or transporter. In connection with the Berry acquisition, the Company assumed certain firm transportation contracts on interstate and intrastate pipelines entered into by Berry to assure the delivery of its natural gas to market. These commitments generally require a minimum monthly charge regardless of whether the contracted capacity is used or not. The Company is negatively impacted by the minimum monthly charge for the Rockies Express, Wyoming Interstate Company and Ruby pipelines. The Company somewhat mitigates this impact through various marketing arrangements.
9
Item 1. Business - Continued
The following table sets forth information about material long-term firm transportation contracts for pipeline capacity as of December 31, 2015:
Pipeline | From | To | Quantity | Term | Demand Charge per MMBtu | Remaining Contractual Obligations | |||||||||||
(Avg. MMBtu/d) | (in thousands) | ||||||||||||||||
Rockies Express Pipeline | Meeker, CO | Clarington, OH | 25,000 | 2/2008 to 1/2018 | $ | 1.13 | (1) | $ | 21,558 | ||||||||
Rockies Express Pipeline | Meeker, CO | Clarington, OH | 10,000 | 6/2009 to 11/2019 | 1.09 | (1) | 15,427 | ||||||||||
Questar Pipeline | Chipeta Plant, UT | Various UT locations | 6,200 | 2/2013 to 2/2021 | 0.17 | 1,559 | |||||||||||
Ruby Pipeline | Opal, WY | Malin, OR | 37,857 | 8/2011 to 7/2021 | 0.95 | 73,292 | |||||||||||
Wyoming Interstate Company Pipeline | Meeker, CO | Opal, WY | 37,857 | 8/2011 to 7/2021 | 0.31 | 23,662 | |||||||||||
Questar Pipeline | Chipeta Plant, UT | Goshen, UT | 5,000 | 9/2003 to 10/2022 | 0.26 | 3,209 | |||||||||||
Questar Pipeline | Brundage Canyon, UT | Chipeta Plant, UT | 15,640 | 9/2013 to 8/2023 | 0.17 | 8,274 | |||||||||||
Total | $ | 146,981 | |||||||||||||||
(1) | Based on weighted average cost. |
10
Item 1. Business - Continued
The following table sets forth information regarding average daily production, total production, average prices and average costs for each of the years indicated:
Year Ended December 31, | |||||||||||
2015 | 2014 | 2013 | |||||||||
Average daily production: | |||||||||||
Natural gas (MMcf/d) | 642 | 572 | 443 | ||||||||
Oil (MBbls/d) | 62.4 | 72.9 | 33.5 | ||||||||
NGL (MBbls/d) | 28.6 | 33.5 | 29.7 | ||||||||
Total (MMcfe/d) | 1,188 | 1,210 | 822 | ||||||||
Total production: | |||||||||||
Natural gas (MMcf) | 234,340 | 208,608 | 161,550 | ||||||||
Oil (MBbls) | 22,782 | 26,606 | 12,239 | ||||||||
NGL (MBbls) | 10,426 | 12,240 | 10,839 | ||||||||
Total (MMcfe) | 433,586 | 441,684 | 300,015 | ||||||||
Weighted average prices: (1) | |||||||||||
Natural gas (Mcf) | $ | 2.57 | $ | 4.29 | $ | 3.62 | |||||
Oil (Bbl) | $ | 43.16 | $ | 86.28 | $ | 94.15 | |||||
NGL (Bbl) | $ | 13.45 | $ | 34.40 | $ | 30.96 | |||||
Average NYMEX prices: | |||||||||||
Natural gas (MMBtu) | $ | 2.66 | $ | 4.41 | $ | 3.65 | |||||
Oil (Bbl) | $ | 48.80 | $ | 93.00 | $ | 97.97 | |||||
Costs per Mcfe of production: | |||||||||||
Lease operating expenses | $ | 1.42 | $ | 1.82 | $ | 1.24 | |||||
Transportation expenses | $ | 0.51 | $ | 0.47 | $ | 0.43 | |||||
General and administrative expenses (2) | $ | 0.68 | $ | 0.66 | $ | 0.79 | |||||
Depreciation, depletion and amortization | $ | 1.86 | $ | 2.43 | $ | 2.76 | |||||
Taxes, other than income taxes | $ | 0.42 | $ | 0.61 | $ | 0.46 | |||||
(1) | Does not include the effect of gains (losses) on derivatives. |
(2) | General and administrative expenses for the years ended December 31, 2015, December 31, 2014, and December 31, 2013, include approximately $47 million, $45 million and $37 million, respectively, of noncash unit-based compensation expenses. |
11
Item 1. Business - Continued
The following table sets forth information regarding production volumes for fields with greater than 15% of the Company’s total proved reserves for each of the years indicated:
Year Ended December 31, | ||||||||
2015 | 2014 | 2013 | ||||||
Total production: | ||||||||
Hugoton Basin Field: | ||||||||
Natural gas (MMcf) | 58,125 | 36,738 | 25,929 | |||||
Oil (MBbls) | 21 | 16 | 2 | |||||
NGL (MBbls) | 3,875 | 2,572 | 2,336 | |||||
Total (MMcfe) | 81,502 | 52,263 | 39,958 | |||||
Green River Basin Field: | ||||||||
Natural gas (MMcf) | * | * | 42,531 | |||||
Oil (MBbls) | * | * | 364 | |||||
NGL (MBbls) | * | * | 1,124 | |||||
Total (MMcfe) | * | * | 51,458 | |||||
* Represented less than 15% of the Company’s total proved reserves for the year indicated.
Steaming Operations
Certain of the Company’s California assets consist of heavy crude oil, which requires heat, supplied in the form of steam, injected into the oil producing formations to reduce the oil viscosity, thereby allowing the oil to flow to the wellbore for production. The Company utilizes cyclic steam and/or steam flood recovery methods on these assets.
The Company’s use of these oil recovery methods exposes it to certain annual greenhouse gas emissions obligations in California. The state provides for a certain number of free allowances to offset a portion of the projected emissions. The remainder of the allowances must be purchased at any of the California carbon allowance auctions held in February, May, August and November of each year or in over-the-counter transactions. The Company believes it has met its obligations for the year ended December 31, 2015.
Cogeneration Steam Supply
The Company believes one of the primary methods to keep steam costs low is through the ownership and efficient operation of three cogeneration facilities located on its properties. These cogeneration facilities include a 38 megawatt (“MW”) facility and an 18 MW facility located in the Midway-Sunset Field and a 42 MW facility located in the Placerita Field. Cogeneration, also called combined heat and power, extracts energy from the exhaust of a turbine to produce steam and increases the efficiency of the combined process.
Conventional Steam Generation
The Company also owns 79 fully permitted conventional steam generators. The number of generators operated at any point in time is dependent on the steam volume required to achieve the Company’s targeted production and the price of natural gas compared to the realized price of crude oil sold. Ownership of these varied steam generation facilities and sources allows for maximum operational control over the steam supply, location and, to some extent, the aggregated cost of steam generation. The Company’s steam supply and flexibility are crucial for the maximization of California thermally enhanced heavy oil production, cost control and ultimate oil recovery. The natural gas the Company purchases to generate steam and electricity is primarily based on California price indexes. The Company pays distribution/transportation charges for the delivery of natural gas to its various locations where it uses the natural gas for steam generation purposes. In some cases, this transportation cost is embedded in the price of the natural gas the Company purchases.
Electricity
Generation
The total average electrical generation capacity of the Company’s three cogeneration facilities, which are centrally located on certain of its oil producing properties, was approximately 90 MW for the year ended December 31, 2015. The steam
12
Item 1. Business - Continued
generated by each facility is capable of being delivered to numerous wells that require steam for the enhanced oil recovery process. The sole purpose of the cogeneration facilities is to reduce the steam costs in the Company’s heavy oil operations and secure operating control of the respective steam generation. Expenses of operating the cogeneration plants are analyzed regularly to determine whether they are advantageous versus conventional steam generators.
Cogeneration costs are allocated between electricity generation and oil and natural gas operations based on the conversion efficiency (of fuel to electricity and steam) of each cogeneration facility and certain direct costs to produce steam. Cogeneration costs allocated to electricity will vary based on, among other factors, the thermal efficiency of the Company’s cogeneration plants, the price of natural gas used for fuel in generating electricity and steam, and the terms of the Company’s power contracts. The Company views any profit or loss from the generation of electricity as a decrease or increase, respectively, to its total cost of producing heavy oil in California.
Reserve Data
Proved Reserves
The following table sets forth estimated proved oil, natural gas and NGL reserves and the standardized measure of discounted future net cash flows at December 31, 2015, based on reserve reports prepared by independent engineers, DeGolyer and MacNaughton:
Estimated proved developed reserves: | |||
Natural gas (Bcf) | 2,619 | ||
Oil (MMBbls) | 197 | ||
NGL (MMBbls) | 114 | ||
Total (Bcfe) | 4,488 | ||
Estimated proved undeveloped reserves: | |||
Natural gas (Bcf) | — | ||
Oil (MMBbls) | — | ||
NGL (MMBbls) | — | ||
Total (Bcfe) | — | ||
Estimated total proved reserves: | |||
Natural gas (Bcf) | 2,619 | ||
Oil (MMBbls) | 197 | ||
NGL (MMBbls) | 114 | ||
Total (Bcfe) | 4,488 | ||
Proved developed reserves as a percentage of total proved reserves | 100 | % | |
Standardized measure of discounted future net cash flows (in millions) (1) | $ | 3,034 | |
Representative NYMEX prices: (2) | |||
Natural gas (MMBtu) | $ | 2.59 | |
Oil (Bbl) | $ | 50.16 | |
(1) | This measure is not intended to represent the market value of estimated reserves. |
(2) | In accordance with Securities and Exchange Commission (“SEC”) regulations, reserves were estimated using the average price during the 12-month period, determined as an unweighted average of the first-day-of-the-month price for each month, excluding escalations based upon future conditions. The average price used to estimate reserves is held constant over the life of the reserves. |
13
Item 1. Business - Continued
During the year ended December 31, 2015, the Company’s PUDs decreased to zero from 1,486 Bcfe at December 31, 2014. The decrease was due to 1,359 Bcfe of negative revisions (728 Bcfe due to lower commodity prices, 349 Bcfe due to uncertainty regarding the Company’s future commitment to capital and 302 Bcfe due to the SEC five-year development limitation on PUDs, partially offset by 20 Bcfe of positive revisions due to asset performance), 105 Bcfe of PUDs developed during 2015 and 22 Bcfe related to 2015 divestitures. During the year ended December 31, 2015, the Company incurred approximately $159 million in capital expenditures to convert the 105 Bcfe of reserves that were classified as PUDs at December 31, 2014, to proved developed reserves.
As a result of the uncertainty regarding the Company’s future commitment to capital, the Company reclassified all of its PUDs to unproved as of December 31, 2015. See Item 7. “Management’s Discussion and Analysis of Financial Condition and Results of Operations” for details regarding the Company’s going concern uncertainty.
Reserve engineering is inherently a subjective process of estimating underground accumulations of oil, natural gas and NGL that cannot be measured exactly. The accuracy of any reserve estimate is a function of the quality of available data and engineering and geological interpretation and judgment. Accordingly, reserve estimates may vary from the quantities of oil, natural gas and NGL that are ultimately recovered. Future prices received for production may vary, perhaps significantly, from the prices assumed for the purposes of estimating the standardized measure of discounted future net cash flows. The standardized measure of discounted future net cash flows should not be construed as the market value of the reserves at the dates shown. The 10% discount factor required to be used under the provisions of applicable accounting standards may not be the most appropriate discount factor based on interest rates in effect from time to time and risks associated with the Company or the oil and natural gas industry. The standardized measure of discounted future net cash flows is materially affected by assumptions regarding the timing of future production, which may prove to be inaccurate.
The reserve estimates reported herein were prepared by independent engineers, DeGolyer and MacNaughton. The process performed by the independent engineers to prepare reserve amounts included their estimation of reserve quantities, future production rates, future net revenue and the present value of such future net revenue, based in part on data provided by the Company. When preparing the reserve estimates, the independent engineering firm did not independently verify the accuracy and completeness of the information and data furnished by the Company with respect to ownership interests, production, well test data, historical costs of operation and development, product prices, or any agreements relating to current and future operations of the properties and sales of production. However, if in the course of their work, something came to their attention that brought into question the validity or sufficiency of any such information or data, they did not rely on such information or data until they had satisfactorily resolved their questions relating thereto. The estimates of reserves conform to the guidelines of the SEC, including the criteria of “reasonable certainty,” as it pertains to expectations about the recoverability of reserves in future years. The independent engineering firm also prepared estimates with respect to reserve categorization, using the definitions of proved reserves set forth in Regulation S-X Rule 4-10(a) and subsequent SEC staff interpretations and guidance.
The Company’s internal control over the preparation of reserve estimates is a process designed to provide reasonable assurance regarding the reliability of the Company’s reserve estimates in accordance with SEC regulations. The preparation of reserve estimates was overseen by the Company’s Corporate Reserves Manager, who has Master of Petroleum Engineering and Master of Business Administration degrees and more than 30 years of oil and natural gas industry experience. The reserve estimates were reviewed and approved by the Company’s senior engineering staff and management, with final approval by its Executive Vice President and Chief Operating Officer. For additional information regarding estimates of reserves, including the standardized measure of discounted future net cash flows, see “Supplemental Oil and Natural Gas Data (Unaudited)” in Item 8. “Financial Statements and Supplementary Data.” The Company has not filed reserve estimates with any federal authority or agency, with the exception of the SEC.
Operational Overview
General
The Company generally seeks to be the operator of its properties so that it can develop drilling programs and optimization projects intended to not only replace production, but add value through reserve and production growth and future operational synergies. Many of the Company’s wells are completed in multiple producing zones with commingled production and long economic lives.
14
Item 1. Business - Continued
Principal Customers
For the year ended December 31, 2015, sales of oil, natural gas and NGL to Phillips 66 accounted for approximately 12% of the Company’s sales. If the Company were to lose any one of its major oil and natural gas purchasers, the loss could temporarily cease or delay production and sale of its oil and natural gas in that particular purchaser’s service area. If the Company were to lose a purchaser, it believes it could identify a substitute purchaser. However, if one or more of the large purchasers ceased purchasing oil and natural gas altogether, it could have a detrimental effect on the oil and natural gas market in general and on the prices and volumes of oil, natural gas and NGL that the Company is able to sell.
Competition
The oil and natural gas industry is highly competitive. The Company encounters strong competition from other independent operators and master limited partnerships in acquiring properties, contracting for drilling and other related services, and securing trained personnel. The Company is also affected by competition for drilling rigs and the availability of related equipment. In the past, the oil and natural gas industry has experienced shortages of drilling rigs, equipment, pipe and personnel, which has delayed development drilling and has caused significant price increases. The Company is unable to predict when, or if, such shortages may occur or how they would affect its drilling program.
Operating Hazards and Insurance
The oil and natural gas industry involves a variety of operating hazards and risks that could result in substantial losses from, among other things, injury or loss of life, severe damage to or destruction of property, natural resources and equipment, pollution or other environmental damage, cleanup responsibilities, regulatory investigation and penalties, and suspension of operations. The Company may be liable for environmental damages caused by previous owners of property it purchases and leases. As a result, the Company may incur substantial liabilities to third parties or governmental entities, the payment of which could reduce or eliminate funds available for acquisitions, development or distributions, or result in the loss of properties. In addition, the Company participates in wells on a nonoperated basis and therefore may be limited in its ability to control the risks associated with the operation of such wells.
In accordance with customary industry practices, the Company maintains insurance against some, but not all, potential losses. The Company cannot provide assurance that any insurance it obtains will be adequate to cover any losses or liabilities. The Company has elected to self-insure for certain items for which it has determined that the cost of available insurance is excessive relative to the risks presented. In addition, pollution and environmental risks generally are not fully insurable. The occurrence of an event not fully covered by insurance could have a material adverse effect on the Company’s financial position, results of operations and cash flows. For more information about potential risks that could affect the Company, see Item 1A. “Risk Factors.”
Title to Properties
Prior to the commencement of drilling operations, the Company conducts a title examination and performs curative work with respect to significant defects. To the extent title opinions or other investigations reflect title defects on those properties, the Company is typically responsible for curing any title defects at its expense prior to commencing drilling operations. Prior to completing an acquisition of producing leases, the Company performs title reviews on the most significant leases and, depending on the materiality of properties, the Company may obtain a title opinion or review previously obtained title opinions. As a result, the Company has obtained title opinions on a significant portion of its properties and believes that it has satisfactory title to its producing properties in accordance with standards generally accepted in the industry.
Seasonal Nature of Business
Seasonal weather conditions and lease stipulations can limit the drilling and producing activities and other operations in regions of the U.S. in which the Company operates. These seasonal conditions can pose challenges for meeting the well drilling objectives and increase competition for equipment, supplies and personnel, which could lead to shortages and increase costs or delay operations. For example, Company operations may be impacted by ice and snow in the winter and by electrical storms and high temperatures in the spring and summer, as well as by wild fires in the fall.
15
Item 1. Business - Continued
The demand for natural gas typically decreases during the summer months and increases during the winter months. Seasonal anomalies sometimes lessen this fluctuation. In addition, certain natural gas consumers utilize natural gas storage facilities and purchase some of their anticipated winter requirements during the summer, which can also lessen seasonal demand fluctuations.
Environmental Matters and Regulation
The Company’s operations are subject to stringent federal, state and local laws and regulations governing the discharge of materials into the environment or otherwise relating to environmental protection. The Company’s operations are subject to the same environmental laws and regulations as other companies in the oil and natural gas industry. These laws and regulations may:
• | require the acquisition of various permits before drilling commences; |
• | require the installation of expensive pollution control equipment; |
• | restrict the types, quantities and concentration of various substances that can be released into the environment in connection with drilling and production activities; |
• | limit or prohibit drilling activities on lands located within wilderness, wetlands, areas inhabited by endangered species and other protected areas; |
• | require remedial measures to prevent pollution from former operations, such as pit closure and plugging of abandoned wells; |
• | impose substantial liabilities for pollution resulting from operations; and |
• | require preparation of a Resource Management Plan, an Environmental Assessment, and/or an Environmental Impact Statement with respect to operations affecting federal lands or leases. |
These laws, rules and regulations may also restrict the production rate of oil, natural gas and NGL below the rate that would otherwise be possible. The regulatory burden on the industry increases the cost of doing business and consequently affects profitability. Additionally, Congress and federal and state agencies frequently revise environmental laws and regulations, and any changes that result in more stringent and costly waste handling, disposal and cleanup requirements for the oil and natural gas industry could have a significant impact on operating costs.
The environmental laws and regulations applicable to the Company and its operations include, among others, the following U.S. federal laws and regulations:
• | Clean Air Act (“CAA”), and its amendments, which governs air emissions; |
• | Clean Water Act, which governs discharges to and excavations within the waters of the U.S.; |
• | Comprehensive Environmental Response, Compensation and Liability Act (“CERCLA”), which imposes liability where hazardous releases have occurred or are threatened to occur (commonly known as “Superfund”); |
• | Energy Independence and Security Act of 2007, which prescribes new fuel economy standards and other energy saving measures; |
• | National Environmental Policy Act, which governs oil and natural gas production activities on federal lands; |
• | Resource Conservation and Recovery Act (“RCRA”), which governs the management of solid waste; |
• | Safe Drinking Water Act, which governs the underground injection and disposal of wastewater; and |
• | U.S. Department of Interior regulations, which impose liability for pollution cleanup and damages. |
Various states regulate the drilling for, and the production, gathering and sale of, oil, natural gas and NGL, including imposing production taxes and requirements for obtaining drilling permits. States also regulate the method of developing new fields, the spacing and operation of wells and the prevention of waste of resources. States may regulate rates of production and may establish maximum daily production allowables from natural gas wells based on market demand or resource conservation, or both. States do not regulate wellhead prices or engage in other similar direct economic regulations, but there can be no assurance that they will not do so in the future. The effect of these regulations may be to limit the amounts of oil, natural gas and NGL that may be produced from the Company’s wells and to limit the number of wells or locations it can drill. The oil and natural gas industry is also subject to compliance with various other federal, state and local regulations and laws. Some of those laws relate to occupational safety, resource conservation and equal opportunity employment.
16
Item 1. Business - Continued
The Company believes that it substantially complies with all current applicable environmental laws and regulations and that continued compliance with existing requirements will not have a material adverse impact on its business, financial condition, results of operations or cash flows. Future regulatory issues that could impact the Company include new rules or legislation relating to the items discussed below.
Climate Change
In December 2009, the Environmental Protection Agency (“EPA”) determined that emissions of carbon dioxide, methane and other “greenhouse gases” (“GHG”) present an endangerment to public health and the environment because emissions of such gases are, according to the EPA, contributing to warming of the earth’s atmosphere and other climatic changes. Based on these findings, the EPA has begun adopting and implementing regulations to restrict emissions of GHGs under existing provisions of the CAA. The EPA has adopted three sets of rules regulating GHG emissions under the CAA, one that requires a reduction in emissions of GHGs from motor vehicles, a second that regulates emissions of GHGs from certain large stationary sources under the CAA’s Prevention of Significant Deterioration and Title V permitting programs, and a third that regulates GHG emissions from fossil fuel-burning power plants. In addition, in September 2015, the EPA published a proposed rule that would update and expand the New Source Performance Standards by setting additional emissions limits for volatile organic compounds and regulating methane emissions for new and modified sources in the oil and gas industry. The EPA has also adopted rules requiring the monitoring and reporting of GHG emissions from specified sources in the U.S., including, among other things, certain onshore oil and natural gas production facilities, on an annual basis. In addition, in 2015, the U.S. participated in the United Nations Conference on Climate Change, which led to the creation of the Paris Agreement. The Paris Agreement will be open for signing on April 22, 2016, and will require countries to review and “represent a progression” in their intended nationally determined contributions, which set GHG emission reduction goals, every five years beginning in 2020. Legislation has from time to time been introduced in Congress that would establish measures restricting GHG emissions in the U.S. At the state level, almost one half of the states, including California, have begun taking actions to control and/or reduce emissions of GHGs. See “California GHG Regulations” below for additional details on current GHG regulations in the state of California.
California GHG Regulations
In October 2006, California adopted the Global Warming Solutions Act of 2006 (“Assembly Bill 32”), which established a statewide “cap and trade” program with an enforceable compliance obligation beginning with 2013 GHG emissions. The program is designed to reduce the state’s GHG emissions to 1990 levels by 2020. Assembly Bill 32 sets maximum limits or caps on total emissions of GHGs from industrial sectors of which the Company is a part, as its California operations emit GHGs. The cap will decline annually through 2020. The Company is required to remit compliance instruments for each metric ton of GHG that it emits, in the form of allowances (each the equivalent of one ton of carbon dioxide) or qualifying offset credits. The availability of allowances will decline over time in accordance with the declining cap, and the cost to acquire such allowances may increase over time. Under Assembly Bill 32, the Company will be granted a certain number of California carbon allowances (“CCA”) and the Company will need to purchase CCAs and/or offset credits to cover the remaining amount of its emissions. Compliance with Assembly Bill 32 could significantly increase the Company’s capital, compliance and operating costs and could also reduce demand for the oil and natural gas the Company produces. The Company’s cost of acquiring compliance instruments in 2015 was approximately $2.00 per barrel of its California production. In the future, the cost to acquire compliance instruments will depend on the market price for such instruments at the time they are purchased, the distribution of cost-free allowances among various industry sectors by the California Air Resources Board and the Company’s ability to limit its GHG emissions and implement cost-containment measures. The cap and trade program is currently scheduled to be in effect through 2020, although it may be continued thereafter.
Hydraulic Fracturing
Hydraulic fracturing is an important and common practice that is used to stimulate production of hydrocarbons from tight formations. The process involves the injection of water, sand and chemicals under pressure into formations to fracture the surrounding rock and stimulate production. Hydraulic fracturing operations have historically been overseen by state regulators as part of their oil and natural gas regulatory programs. However, on May 9, 2014, the EPA announced an advance notice of proposed rulemaking under the Toxic Substances Control Act, relating to chemical substances and mixtures used in oil and natural gas exploration or production. Further, in March 2015, the Department of the Interior’s Bureau of Land Management (“BLM”) adopted a rule requiring, among other things, public disclosure to the BLM of chemicals used in
17
Item 1. Business - Continued
hydraulic fracturing operations after fracturing operations have been completed and would strengthen standards for well-bore integrity and management of fluids that return to the surface during and after fracturing operations on federal and Indian lands. In September 2015, a federal district judge in Wyoming, in litigation pursued by several states, industry associations and an Indian tribe, granted a preliminary injunction against BLM’s enforcement of the new rule; the litigation remains pending. In addition, legislation has been introduced before Congress that would provide for federal regulation of hydraulic fracturing and would require disclosure of the chemicals used in the fracturing process. If enacted, these or similar bills could result in additional permitting requirements for hydraulic fracturing operations as well as various restrictions on those operations. These permitting requirements and restrictions could result in delays in operations at well sites and also increased costs to make wells productive.
There may be other attempts to further regulate hydraulic fracturing under the Safe Drinking Water Act, the Toxic Substances Control Act and/or other regulatory mechanisms. President Obama created the Interagency Working Group on Unconventional Natural Gas and Oil by Executive Order on April 13, 2012, which is charged with coordinating and aligning federal agency research and scientific studies on unconventional natural gas and oil resources. Moreover, some states and local governments have adopted, and other states and local governments are considering adopting, regulations that could restrict hydraulic fracturing in certain circumstances. For example, both Texas and Louisiana have adopted disclosure regulations requiring varying degrees of disclosure of the constituents in hydraulic fracturing fluids. In addition, the regulation or prohibition of hydraulic fracturing is the subject of significant political activity in a number of jurisdictions, some of which have resulted in tighter regulation (including, most recently, new regulations in California requiring a permit to conduct well stimulation), bans, and/or recognition of local government authority to implement such restrictions. In many instances, litigation has ensued, some of which remains pending. If new laws or regulations that significantly restrict hydraulic fracturing are adopted, such laws could make it more difficult or costly for the Company to perform fracturing to stimulate production from tight formations. In addition, any such added regulation could lead to operational delays, increased operating costs and additional regulatory burdens, and reduced production of oil and natural gas, which could adversely affect the Company’s revenues, results of operations and net cash provided by operating activities.
The Company uses a significant amount of water in its hydraulic fracturing operations. The Company’s inability to locate sufficient amounts of water, or dispose of or recycle water used in its drilling and production operations, could adversely impact its operations. Moreover, new environmental initiatives and regulations could include restrictions on the Company’s ability to conduct certain operations such as hydraulic fracturing or disposal of waste, including, but not limited to, produced water, drilling fluids and other wastes associated with the development or production of natural gas.
Finally, in some instances, the operation of underground injection wells has been alleged to cause earthquakes. Such issues have sometimes led to orders prohibiting continued injection in certain wells identified as possible sources of seismic activity. Such concerns also have resulted in stricter regulatory requirements in some jurisdictions relating to the location and operation of underground injection wells. Future orders or regulations addressing concerns about seismic activity from well injection could affect the Company, either directly or indirectly, depending on the wells affected.
Endangered Species Act
The federal Endangered Species Act (“ESA”) restricts activities that may affect endangered and threatened species or their habitats. Some of the Company’s operations may be located in areas that are designated as habitats for endangered or threatened species. The Company believes that it is currently in substantial compliance with the ESA. However, the designation of previously unprotected species as being endangered or threatened could cause the Company to incur additional costs or become subject to operating restrictions in areas where the species are known to exist.
Air Emissions
On August 15, 2012, the EPA issued final rules that subject oil and natural gas production, processing, transmission and storage operations to regulation under the New Source Performance Standards (“NSPS”) and National Emission Standards for Hazardous Air Pollutants (“NESHAP”) programs. The EPA rules include NSPS standards for completions of hydraulically fractured natural gas wells. These standards require operators to capture the gas from natural gas well completions and make it available for use or sale, which can be done through the use of green completions. The standards are applicable to newly fractured wells and existing wells that are refractured. Further, the finalized regulations also establish specific new requirements for emissions from compressors, controllers, dehydrators, storage tanks, gas processing plants and certain other equipment. The EPA amended these rules in December 2014 to specify requirements for different flowback
18
Item 1. Business - Continued
stages and to expand the rules to cover more storage vessels, among other changes. These rules may require changes to the Company’s operations, including the installation of new equipment to control emissions.
The Company’s costs for environmental compliance may increase in the future based on new environmental regulations. For example, in September 2015, the EPA published proposed rules that would “aggregate” certain oil and gas production facilities for purposes of determining the applicability of certain CAA regulatory requirements. In January 2016, the BLM proposed rules to require additional efforts by producers to reduce venting, flaring and leaking of natural gas produced on federal and Native American lands.
Natural Gas Sales and Transportation
Section 1(b) of the Natural Gas Act (“NGA”) exempts natural gas gathering facilities from regulation by the Federal Energy Regulatory Commission (“FERC”) as a natural gas company under the NGA. The Company believes that the natural gas pipelines in its gathering systems meet the traditional tests FERC has used to establish a pipeline’s status as a gatherer not subject to regulation as a natural gas company, but the status of these lines has never been challenged before FERC. The distinction between FERC-regulated transmission services and federally unregulated gathering services is subject to change based on future determinations by FERC, the courts, or Congress, and application of existing FERC policies to individual factual circumstances. Accordingly, the classification and regulation of some of the Company’s natural gas gathering facilities may be subject to challenge before FERC or subject to change based on future determinations by FERC, the courts, or Congress. In the event the Company’s gathering facilities are reclassified to FERC-regulated transmission services, it may be required to charge lower rates and its revenues could thereby be reduced.
FERC requires certain participants in the natural gas market, including natural gas gatherers and marketers which engage in a minimum level of natural gas sales or purchases, to submit annual reports regarding those transactions to FERC. Should the Company fail to comply with this requirement or any other applicable FERC-administered statute, rule, regulation or order, it could be subject to substantial penalties and fines.
Pipeline Safety Regulations
The U.S. Department of Transportation’s Pipeline and Hazardous Materials Safety Administration (“PHMSA”) regulates safety of oil and natural gas pipelines, including, with some specific exceptions, oil and natural gas gathering lines. From time to time, PHMSA, the courts, or Congress may make determinations that affect PHMSA’s regulations or their applicability to the Company’s pipelines. These determinations may affect the costs the Company incurs in complying with applicable safety regulations.
Future Impacts and Current Expenditures
The Company cannot predict how future environmental laws and regulations may impact its properties or operations. For the year ended December 31, 2015, the Company did not incur any material capital expenditures for installation of remediation or pollution control equipment at any of its facilities. The Company is not aware of any environmental issues or claims that will require material capital expenditures during 2016 or that will otherwise have a material impact on its financial position, results of operations or cash flows.
Employees
As of December 31, 2015, the Company employed approximately 1,760 personnel. None of the employees are represented by labor unions or covered by any collective bargaining agreement. The Company believes that its relationship with its employees is satisfactory.
Principal Executive Offices
The Company is a Delaware limited liability company with headquarters in Houston, Texas. The principal executive offices are located at 600 Travis, Suite 5100, Houston, Texas 77002. The main telephone number is (281) 840-4000.
19
Item 1. Business - Continued
Company Website
The Company’s internet website is www.linnenergy.com. The Company makes available free of charge on or through its website Annual Reports on Form 10-K, Quarterly Reports on Form 10-Q, Current Reports on Form 8-K, and any amendments to those reports filed or furnished pursuant to Section 13(a) or 15(d) of the Securities Exchange Act of 1934 as soon as reasonably practicable after the Company electronically files such material with, or furnishes it to, the SEC. Information on the Company’s website should not be considered a part of, or incorporated by reference into, this Annual Report on Form 10-K.
The SEC maintains an internet website that contains these reports at www.sec.gov. Any materials that the Company files with the SEC may be read or copied at the SEC’s Public Reference Room at 100 F Street, NE, Washington, DC 20549. Information concerning the operation of the Public Reference Room may be obtained by calling the SEC at (800) 732-0330.
Cautionary Statement Regarding Forward-Looking Statements
This Annual Report on Form 10-K contains forward-looking statements that are subject to a number of risks and uncertainties, many of which are beyond the Company’s control. These statements may include discussions about the Company’s:
• | business strategy; |
• | acquisition strategy; |
• | financial strategy; |
• | effects of legal proceedings; |
• | ability to resume payment of distributions in the future or maintain or grow them after such resumption; |
• | drilling locations; |
• | oil, natural gas and NGL reserves; |
• | realized oil, natural gas and NGL prices; |
• | production volumes; |
• | capital expenditures; |
• | economic and competitive advantages; |
• | credit and capital market conditions; |
• | regulatory changes; |
• | lease operating expenses, general and administrative expenses and development costs; |
• | future operating results, including results of acquired properties; |
• | plans, objectives, expectations and intentions; and |
• | integration of acquired businesses and operations and commencement of activities in the Company’s strategic alliances with GSO and Quantum, which may take longer than anticipated, may be more costly than anticipated as a result of unexpected factors or events and may have an unanticipated adverse effect on the Company’s business. |
All of these types of statements, other than statements of historical fact included in this Annual Report on Form 10-K, are forward-looking statements. These forward-looking statements may be found in Item 1. “Business;” Item 1A. “Risk Factors;” Item 7. “Management’s Discussion and Analysis of Financial Condition and Results of Operations” and other items within this Annual Report on Form 10-K. In some cases, forward-looking statements can be identified by terminology such as “may,” “will,” “could,” “should,” “expect,” “plan,” “project,” “intend,” “anticipate,” “believe,” “estimate,” “predict,” “potential,” “pursue,” “target,” “continue,” the negative of such terms or other comparable terminology.
The forward-looking statements contained in this Annual Report on Form 10-K are largely based on Company expectations, which reflect estimates and assumptions made by Company management. These estimates and assumptions reflect management’s best judgment based on currently known market conditions and other factors. Although the Company believes such estimates and assumptions to be reasonable, they are inherently uncertain and involve a number of risks and uncertainties beyond its control. In addition, management’s assumptions may prove to be inaccurate. The Company cautions that the forward-looking statements contained in this Annual Report on Form 10-K are not guarantees of future performance, and it cannot assure any reader that such statements will be realized or the events will occur. Actual results may differ materially from those anticipated or implied in forward-looking statements due to factors set forth in Item 1A. “Risk Factors” and elsewhere in this Annual Report on Form 10-K. The forward-looking statements speak only as of the date made and,
20
Item 1. Business - Continued
other than as required by law, the Company undertakes no obligation to publicly update or revise any forward-looking statement, whether as a result of new information, future events or otherwise.
Item 1A. Risk Factors
Our business has many risks. Factors that could materially adversely affect our business, financial condition, operating results or liquidity and the trading price of our units are described below. This information should be considered carefully, together with other information in this report and other reports and materials we file with the SEC.
If we are unable to repay or refinance our existing and future debt as it becomes due, whether at maturity or as a result of acceleration, we may be unable to continue as a going concern.
We have significant indebtedness under our May 2019 senior notes, November 2019 senior notes, April 2020 senior notes, Berry November 2020 senior notes, December 2020 senior secured second lien notes, February 2021 senior notes, September 2021 senior notes and Berry September 2022 senior notes (collectively, “Notes”) and our Credit Facilities. As of February 29, 2016, we had an aggregate amount of approximately $9.3 billion outstanding under our Notes and our Credit Facilities (with additional borrowing capacity of less than $1 million). As a result of our indebtedness, we use a significant portion of our cash flow to pay interest and principal (when due) on our Notes and Credit Facilities, which reduces the cash available to finance our operations and other business activities and limits our flexibility in planning for or reacting to changes in our business and the industry in which we operate.
Based on our current estimates and expectations for commodity prices in 2016, we do not expect to remain in compliance with all of the restrictive covenants contained in our Credit Facilities throughout 2016 unless those requirements are waived or amended. Additionally, the borrowing bases under our Credit Facilities are subject to redeterminations in April 2016. Because the Credit Facilities are effectively fully drawn, any reduction in the borrowing bases would require us to make mandatory prepayments to the extent existing indebtedness exceeds the new borrowing bases. We also have substantial interest payments due during the next twelve months on our Notes and our Credit Facilities. If we fail to satisfy our obligations with respect to our indebtedness or fail to comply with the financial and other restrictive covenants contained in our Credit Facilities or the indentures governing our Notes, an Event of Default (as defined in the applicable agreements) could result, which would permit acceleration of the indebtedness under certain circumstances and could result in an Event of Default and acceleration of our other debt and permit our secured lenders to foreclose on any of our assets securing such debt. Any accelerated debt would become immediately due and payable.
While we will attempt to take appropriate mitigating actions to refinance any indebtedness prior to its maturity or otherwise extend the maturity dates, and to cure any potential defaults, there is no assurance that any particular actions with respect to refinancing existing indebtedness, extending the maturity of existing indebtedness or curing potential defaults in our existing and future debt agreements will be sufficient. The uncertainty associated with our ability to meet our obligations as they become due raises substantial doubt about our ability to continue as a going concern. The report of the Company’s independent registered public accounting firm that accompanies its audited consolidated financial statements in this Annual Report on Form 10-K contains an explanatory paragraph regarding the substantial doubt about the Company’s ability to continue as a going concern.
We are currently in default under the LINN Credit Facility and the Second Lien Indenture.
Under the LINN Credit Facility, we are required to deliver audited consolidated financial statements without a going concern or like qualification or explanation. Because the audit report prepared by our auditors with respect to the consolidated financial statements includes such going concern explanation, we are currently in default under the LINN Credit Facility.
If we are unable to obtain a waiver or other suitable relief from the lenders under the LINN Credit Facility prior to the expiration of the 30 day grace period, an Event of Default will result and the lenders holding a majority of the commitments under the LINN Credit Facility could accelerate the outstanding indebtedness, which would make it immediately due and payable. If we are unable to obtain a waiver from or otherwise reach an agreement with the lenders under the LINN Credit Facility and the indebtedness under the LINN Credit Facility is accelerated, then an Event of Default under LINN Energy’s senior notes and second lien notes would occur, which, if it continues beyond any applicable cure periods, would, to the extent the applicable lenders so elect, result in the acceleration of those obligations. Furthermore, an Event of Default under
21
Item 1A. Risk Factors - Continued
the LINN Credit Facility will also result in an Event of Default under the Berry Credit Facility, which in the absence of a waiver or other suitable relief and upon the election of the agent or lenders holding a majority of commitments under the Berry Credit Facility would result in the acceleration of indebtedness under the Berry Credit Facility. Such Event of Default would trigger an Event of Default under the Berry senior notes. If such Event of Default continues beyond any applicable cure periods, such Event of Default would result in an acceleration of the Berry senior notes.
Additionally, the Second Lien Indenture required us to deliver mortgages by February 18, 2016, subject to a 45 day grace period. We elected to exercise our right to the grace period and not deliver the mortgages, and as a result, we are currently in default under the Second Lien Indenture. If we do not deliver the mortgages within the 45 day grace period or is otherwise unable to obtain a waiver or other suitable relief from the holders under the Second Lien Indenture prior to the expiration of the 45 day grace period, an Event of Default (as defined in the Second Lien Indenture) will result and if the trustee or noteholders holding at least 25% in the aggregate outstanding principal amount of the second lien notes so elect would accelerate the second lien notes causing them to be immediately due and payable.
An Event of Default under the Second Lien Indenture triggers a cross-default under the LINN Credit Facility and Berry Credit Facility and, as discussed above, if the applicable lenders so elect would result in acceleration under the LINN Credit Facility and Berry Credit Facility. In addition, as discussed above, an acceleration of the obligations under the Second Lien Indenture or LINN Credit Facility would trigger a cross-default to LINN Energy’s senior notes and if the applicable lenders so elect would result in a cross-acceleration under LINN Energy’s senior notes, and an acceleration of the Berry Credit Facility if the applicable lenders so elect would result in cross-acceleration under the Berry senior notes.
If lenders, and subsequently noteholders, accelerate our outstanding indebtedness, it will become immediately due and payable and we will not have sufficient liquidity to repay those amounts. We are currently in discussions with various stakeholders and are pursuing or considering a number of actions, but there can be no assurance that sufficient liquidity can be obtained from one or more of these actions or that these actions can be consummated within the period needed to meet certain obligations, and we could be required to immediately file for protection under Chapter 11 of the U.S. Bankruptcy Code.
In addition, we expect the audit report Berry will receive with respect to its financial statements to contain an explanatory paragraph expressing uncertainty as to its ability to continue as a going concern, which would constitute a default under the Berry Credit Facility. If Berry does not obtain a waiver or other suitable relief from the lenders under the Berry Credit Facility before the expiration of the 30 day grace period, there will be an Event of Default under the Berry Credit Facility. If an Event of Default occurs under the Berry Credit Facility, the lenders holding a majority of the commitments could accelerate the loans outstanding under the Berry Credit Facility, which would in turn trigger cross-acceleration rights under the LINN Credit Facility and the indentures governing the Notes.
We may seek the protection of the United States Bankruptcy Court (“Bankruptcy Court”) which may harm our business and place equity holders at significant risk of losing all of their investment in us.
We have engaged financial and legal advisors to assist us in, among other things, analyzing various strategic alternatives to address our liquidity and capital structure, including strategic and refinancing alternatives through a private restructuring. However, a filing under Chapter 11 of the U.S. Bankruptcy Code (“Chapter 11”) may be unavoidable. Seeking Bankruptcy Court protection could have a material adverse effect on our business, financial condition, results of operations and liquidity. As long as a Chapter 11 proceeding continues, our senior management would be required to spend a significant amount of time and effort dealing with the reorganization instead of focusing exclusively on our business operations. Bankruptcy Court protection also might make it more difficult to retain management and other key personnel necessary to the success and growth of our business. Also during the Chapter 11 proceedings, our ability to enter into new commodity derivatives covering additional estimated future production would be dependent upon either entering into unsecured hedges or obtaining Bankruptcy Court approval to enter into secured hedges. Furthermore, counterparties under our existing hedge transactions may elect to terminate those transactions in connection with a bankruptcy filing without our consent.
We have a significant amount of indebtedness that is senior to our units in our capital structure. As a result, we believe that seeking Bankruptcy Court protection under a Chapter 11 proceeding could cause our units to be canceled, result in a limited recovery for unitholders, if any, and place current equity holders at significant risk of losing all of their investment in us.
22
Item 1A. Risk Factors - Continued
Any reduction of the borrowing bases under our Credit Facilities will require us to repay that portion of indebtedness that exceeds the new borrowing bases under our Credit Facilities earlier than anticipated, which will adversely impact our liquidity.
As of February 29, 2016, total borrowings (including outstanding letters of credit) under the LINN Credit Facility were $3.6 billion with no remaining availability. Total borrowings under the Berry Credit Facility were approximately $899 million with less than $1 million available. Each of our Credit Facilities is subject to scheduled redeterminations of its borrowing base, semi-annually in April and October, based primarily on reserve reports using lender commodity price expectations at such time. Additionally, the lenders under the LINN Credit Facility have the ability to request an interim redetermination of the borrowing base once per calendar year and the lenders under the Berry Credit Facility have the ability to request an interim redetermination of the borrowing base once between scheduled redeterminations. Continued low commodity prices, reductions in our capital budget and the resulting reserve write-downs, along with the maturity schedule of our hedges, are expected to adversely impact future redeterminations.
Because the Credit Facilities are effectively fully drawn, any reduction in the Credit Facilities’ borrowing bases will require us or Berry to make mandatory prepayments under the Credit Facilities to the extent existing indebtedness under the Credit Facilities exceeds the new borrowing bases. Although we are not required to, we may choose to contribute or otherwise provide cash to Berry or post restricted cash on Berry’s behalf, which would reduce our liquidity position. We may have insufficient cash on hand to be able to make mandatory prepayments under the Credit Facilities. Any failure to repay indebtedness in excess of our borrowing bases in accordance with the terms of the Credit Facilities would constitute an Event of Default under the Credit Facilities. Such Event of Default would permit our lenders to accelerate the debt, which, if actually accelerated, would become immediately due and payable and could result in a cross-default and cross-acceleration under our other outstanding indebtedness, and could permit our secured lenders to foreclose on any of our assets securing such indebtedness.
Our ability to comply with financial covenants and ratios in our Credit Facilities and the indentures governing the Notes is affected by events beyond our control, including, among other things, continued low commodity prices. Absent a waiver or amendment, failure to meet these covenants and ratios could result in a default and potentially an acceleration of our existing indebtedness.
The Credit Facilities require us to maintain compliance with specified financial ratios and satisfy certain financial condition tests. Based on current estimates and expectations for commodity prices in 2016, we do not expect to remain in compliance with all of the financial covenants and ratios throughout 2016 unless those requirements are waived or amended. Our inability to comply with the required financial ratios will, if not amended or waived, result in a default under the Credit Facilities.
In addition, the LINN Credit Facility requires delivery of audited consolidated financial statements without a going concern or like qualification or explanation to the lenders no later than 90 days after the end of our fiscal year. Due to delivery of the audit report with such going concern explanation, we are in default under the LINN Credit Facility. While the audit opinion is as of December 31, 2015, the default under the LINN Credit Facility does not occur until we have failed to deliver an audit opinion without a going concern or like qualification or explanation, which is the filing date.
A default under the Credit Facilities, if not cured or waived, could result in an Event of Default which permits the acceleration of all indebtedness outstanding thereunder. The accelerated debt would become immediately due and payable, which would in turn trigger cross-acceleration under our other debt. In addition, if an Event of Default under the Credit Facilities occurs, the lenders could foreclose on the collateral and compel us to apply all of our available cash to repay our borrowings or they could prevent us from making payments on our Notes. If the amounts outstanding under the Credit Facilities, our Notes or any of our other indebtedness were to be accelerated, our assets may not be sufficient to repay in full the money owed to the lenders or to our other debt holders and we may be unable to borrow sufficient funds to refinance our debt. Even if new financing were available, any such financing may not be on terms that are acceptable to us and may impose financial restrictions and other covenants on us that may be more restrictive than the Credit Facilities or the indentures governing our Notes.
23
Item 1A. Risk Factors - Continued
Restrictive covenants in the Credit Facilities and in the indentures governing the Notes could limit our growth and our ability to finance our operations, fund our capital needs, respond to changing conditions and engage in other business activities that may be in our best interests.
Restrictive covenants in the Credit Facilities and in the indentures governing the Notes impose significant operating and financial restrictions on us. These restrictions limit our ability and that of our restricted subsidiaries to, among other things:
• | make distributions to our unitholders or make other restricted payments; |
• | incur or guarantee additional indebtedness; |
• | refinance certain indebtedness; |
• | create or incur liens; |
• | engage in certain mergers or consolidations or otherwise dispose of all or substantially all of our assets; |
• | make certain investments or acquisitions; |
• | make certain sales, dispositions or transfers of assets; |
• | engage in specified transactions with subsidiaries and affiliates; |
• | repurchase, redeem or retire our units or Notes; and |
• | pursue other corporate activities. |
We may be prevented from taking advantage of business opportunities that arise because of the limitations imposed on us by the restrictive covenants in the Credit Facilities and in the indentures governing the Notes. The restrictions contained in the Credit Facilities and those indentures could:
• | limit our ability to plan for, or react to, market conditions, to meet capital needs or otherwise to restrict our activities or business plan; and |
• | adversely affect our ability to finance our operations, enter into acquisitions or to engage in other business activities that would be in our interest. |
We have a significant level of debt, which could have significant consequences for our business and future prospects.
As of February 29, 2016, we had an aggregate amount of approximately $9.3 billion outstanding under our Notes and our Credit Facilities (with additional borrowing capacity of less than $1 million). Our debt and the limitations imposed on us by our existing or future debt agreements could have significant consequences for our business and future prospects, including the following:
• | we will be required to dedicate a significant portion of our cash flow to payments of interest and principal on our Credit Facilities and Notes when due; |
• | we may be limited in our flexibility to plan for or react to changes in our business and industry in which we operate; |
• | we may not be able to finance our operations and other business activities; and |
• | we may have a competitive disadvantage relative to our competitors that have less debt. |
Our ability to make payments on and to refinance our indebtedness, including our Credit Facilities and Notes, and to fund planned capital expenditures will depend on our ability to generate cash flow in the future. We expect our earnings and cash flow to vary significantly from year to year due to the cyclical nature of our industry. As a result, the amount of debt that we can manage in some periods may not be appropriate for us in other periods. A range of economic, competitive, business and industry factors will affect our future financial performance, and, as a result, our ability to generate cash flow from operations and to pay our debt. Many of these factors, such as oil, natural gas and NGL prices, economic and financial conditions in our industry and the global economy, the impact of legislative or regulatory actions on how we conduct our business or competitive initiatives of our competitors, are beyond our control. Consequently, our future cash flow may be insufficient to meet our debt obligations and commitments. Any cash flow insufficiency could negatively impact our business, financial condition and results of operations. To the extent we are unable to make scheduled interest payments or repay our indebtedness as it becomes due or at maturity with cash on hand, we will need to refinance our debt, sell assets or seek additional debt or equity financing. Additional indebtedness and debt or equity financing may not be available to us in the future for the refinancing or repayment of existing indebtedness, and we may not be able to complete asset sales in a timely manner sufficient to make such repayments.
24
Item 1A. Risk Factors - Continued
Despite our and our subsidiaries’ current level of indebtedness, we may still be able to incur more debt. This could further exacerbate the risks associated with our substantial indebtedness.
We and our subsidiaries may be able to incur additional indebtedness in the future. Although the credit agreements governing our Credit Facilities and the indentures that govern our Notes contain restrictions on the incurrence of additional indebtedness, these restrictions are subject to a number of qualifications and exceptions, and the additional indebtedness incurred in compliance with these restrictions could be substantial. Moreover, these restrictions will not prevent us from incurring obligations that do not constitute indebtedness, as defined in the applicable agreements governing our existing indebtedness.
If new debt is added to our current debt levels, the related risks that we and our subsidiaries now face could intensify. Our level of indebtedness could, for instance, prevent us from engaging in transactions that might otherwise be beneficial to us or from making desirable capital expenditures. This could put us at a competitive disadvantage relative to other less leveraged competitors that have more cash flow to devote to their operations. In addition, the incurrence of additional indebtedness could make it more difficult to satisfy our existing financial obligations.
Our debt rating has been downgraded and liquidity concerns could result in a further downgrade in our debt ratings which could restrict our access to, and negatively impact the terms of, current or future financings or trade credit.
Our ability to obtain financings and trade credit and the terms of any financings or trade credit are, in part, dependent on the credit ratings assigned to our debt by independent credit rating agencies. We cannot provide assurance that any of our current ratings will remain in effect for any given period of time or that a rating will not be lowered or withdrawn entirely by a rating agency if, in its judgment, circumstances so warrant. Factors that may impact our credit ratings include debt levels, liquidity, asset quality, cost structure, product mix and commodity pricing levels. Further ratings downgrades could adversely impact our ability to access financings or trade credit, increase our borrowing costs and potentially require us to post letters of credit or other credit support for certain obligations.
Our substantial indebtedness, liquidity concerns and potential restructuring transactions may have a material adverse effect on our business and operations.
Our substantial indebtedness, liquidity concerns and potential restructuring transactions may result in uncertainty about our business and cause, among other things:
• | our suppliers, vendors, derivatives counterparties and service providers to renegotiate the terms of our agreements, terminate their relationship with us or require financial assurances from us; |
• | third parties to lose confidence in our ability to produce oil, natural gas and NGL, resulting in a significant decline in our revenues, profitability and cash flow; |
• | difficulty retaining, attracting or replacing key employees; and |
• | employees to be distracted from performance of their duties or more easily attracted to other career opportunities. |
These events, among others, may have a material adverse effect on our business and operations.
Failure to maintain the continued listing standards of the NASDAQ Global Select Market could result in delisting of our common units, which could negatively impact the market price and liquidity of our common units and our ability to access the capital markets.
Our common units are listed on the NASDAQ Global Select Market (“NASDAQ”) and the continued listing of our common units on NASDAQ is subject to our ability to comply with NASDAQ’s continued listing requirements, including, among other things, a minimum closing bid price requirement of $1.00 per common unit. If we fail to satisfy such requirement for a period of 30 consecutive business days, NASDAQ will send us a deficiency notice indicating that we have a compliance period of 180 calendar days from such notice to cure the deficiency by satisfying the minimum bid requirement for a minimum of ten consecutive business days. Failure to regain compliance with the minimum closing bid price requirement could result in delisting of our common units from NASDAQ.
25
Item 1A. Risk Factors - Continued
To date in 2016, the bid price of our common units closed below the $1.00 per unit minimum bid price on several occasions. Any delisting from NASDAQ could have a negative impact on the market price and liquidity of our common units. In addition, delisting could harm our ability to access the capital markets and result in the potential loss of confidence by investors, increased employee turnover and fewer business development opportunities.
Disruptions in the capital and credit markets, continued low commodity prices, our debt level and other factors may restrict our ability to raise capital on favorable terms, or at all.
Disruptions in the capital and credit markets, in particular with respect to companies in the energy sector, could limit our ability to access these markets or may significantly increase our cost to borrow. Continued low commodity prices, among other factors, have caused some lenders to increase interest rates, enact tighter lending standards which we may not satisfy as a result of our debt level or otherwise, refuse to refinance existing debt at maturity on favorable terms, or at all, and in certain instances have reduced or ceased to provide funding to borrowers. If we are unable to access the capital and credit markets on favorable terms or at all, it could adversely affect our business, financial condition and results of operations.
Our Board of Directors has the ability to reserve any or all of our cash on hand at the end of a quarter for purposes other than distribution to unitholders, including reduction of indebtedness.
Although we may have generated sufficient net cash provided by operating activities during any particular quarter, our Board of Directors has the ability under our limited liability company agreement to establish a cash reserve, which could encompass all of the cash otherwise available for distribution, to provide for the proper conduct of our business in both the short and long term. To provide for the proper conduct of our business, the Board of Directors can determine to reserve cash to reduce indebtedness, among other things. For example, in October 2015, our Board of Directors approved a suspension of our distribution. Our decision to reserve all of our cash on hand for such allowed purposes and not distribute it may significantly impact our unitholders, as well as our business and operations. The market value of our units may remain depressed or further decrease unless and until we resume a distribution. In addition, refinancing or restructuring of our debt may require us to accept covenants that further restrict our ability to reinstate the distribution to our unitholders. External perceptions of the health of our business and our liquidity may also be impacted, which could further limit our ability to access capital markets, cause our vendors to tighten our credit terms and cause a strain in our relationship with landowners and other business partners.
Commodity prices are volatile, and prolonged depressed prices or a further decline in prices would reduce our revenues, net cash provided by operating activities and profitability and would significantly affect our financial condition and results of operations.
Our revenues, profitability, cash flow and the carrying value of our properties depend on the prices of and demand for oil, natural gas and NGL. Historically, the oil, natural gas and NGL markets have been very volatile and are expected to continue to be volatile in the future, and prolonged depressed prices or a further decline in prices will significantly affect our financial results and impede our growth. Changes in oil, natural gas and NGL prices have a significant impact on the value of our reserves and on our net cash provided by operating activities. In addition, revenues from certain wells may exceed production costs and nevertheless not generate sufficient return on capital. Prices for these commodities may fluctuate widely in response to relatively minor changes in the supply of and demand for them, market uncertainty and a variety of additional factors that are beyond our control, such as:
• | the domestic and foreign supply of and demand for oil, natural gas and NGL; |
• | the price and level of foreign imports; |
• | the level of consumer product demand; |
• | weather conditions; |
• | overall domestic and global economic conditions; |
• | political and economic conditions in oil and natural gas producing countries; |
• | the ability of members of the Organization of Petroleum Exporting Countries to agree to and maintain price and production controls; |
• | the impact of the U.S. dollar exchange rates on oil, natural gas and NGL prices; |
• | technological advances affecting energy consumption; |
• | domestic and foreign governmental regulations and taxation; |
26
Item 1A. Risk Factors - Continued
• | the impact of energy conservation efforts; |
• | the proximity and capacity of pipelines and other transportation facilities; and |
• | the price and availability of alternative fuels. |
During 2015, the prices of oil, natural gas and NGL were extremely volatile and declined significantly. Downward pressure on commodity prices has continued in 2016 and may continue for the foreseeable future. The speed and severity of the decline in oil prices from 2014 to 2016 has materially affected our results of operations. If commodity prices continue at current levels for a prolonged period or further decline, our net cash provided by operating activities will decline and our financial position, the quantities of oil and natural gas reserves that we can economically produce, our cash flow available for capital expenditures, our ability to service our debt obligations, our ability to generate free cash flow after capital expenditures and debt service and our ability to access funds under our Credit Facilities and through the capital markets may be materially and adversely affected.
The sustained oil, natural gas and NGL price declines have resulted in significant impairments of certain of our properties. Future declines in commodity prices, changes in expected capital development, increases in operating costs or adverse changes in well performance may result in additional write-downs of the carrying amounts of our assets, which could materially and adversely affect our results of operations in the period incurred.
We evaluate the impairment of our oil and natural gas properties on a field-by-field basis whenever events or changes in circumstances indicate that the carrying value may not be recoverable. For the year ended December 31, 2015, we recorded noncash impairment charges (before and after tax) of approximately $5.8 billion. Future declines in oil, natural gas and NGL prices, changes in expected capital development, increases in operating costs or adverse changes in well performance, among other things, may result in us having to make additional material write-downs of the carrying amounts of our assets, which could materially and adversely affect our results of operations in the period incurred.
We may experience difficulties in fully utilizing our alliances with GSO and Quantum, which could cause us to fail to realize many of the anticipated potential benefits of those alliances.
As part of our plan to (i) create new sources of capital to allow us to acquire and develop assets without increasing capital intensity, (ii) enhance our long-term ability to live within cash flow and (iii) provide opportunities for dropdowns of stable production over time, we entered into strategic alliances with GSO Capital Partners LP (“GSO”), the credit platform of The Blackstone Group L.P., to fund oil and natural gas development (“DrillCo”) and Quantum Energy Partners (“Quantum”) to fund selected future oil and natural gas acquisitions and the development of those acquired assets through a new entity (“AcqCo”).
Achieving the anticipated benefits of DrillCo will depend in part on whether we and GSO are able to agree on a drilling plan during any of the five years of the term of DrillCo, as well as our ability to execute on that drilling plan. Achieving the anticipated benefits of AcqCo will depend in part on whether we are able to come to an agreement with Quantum and AcqCo regarding identification and acquisition of suitable assets for AcqCo, whether we are able to fund the acquisition of our required minimum working interest in such assets and ultimately whether we are able to purchase back assets from AcqCo after they have matured into conventional MLP assets. An inability to realize the full extent of the anticipated benefits of these alliances may affect our ability to accomplish the objectives identified above.
If we are unable to replace declines in production, proved developed producing reserves and cash flow, our net cash provided by operating activities could be reduced, which could adversely affect our ability to service debt or to resume payment of distributions to our unitholders.
In determining the amount of cash that we distribute to unitholders, if any, our Board of Directors establishes at the end of each year an amount of capital expenditures for the next year (which we refer to as discretionary reductions for a portion of oil and natural gas development costs) with the objective of replacing proved developed producing reserves, current production and cash flow, taking into consideration our overall commodity mix. Management evaluates all of these objectives as part of the decision-making process to determine the discretionary reductions for a portion of oil and natural gas development costs for the year, although every objective may not be met in each year. Furthermore, there may be certain years in which commodity prices and other economic conditions do not merit capital spending at a level sufficient to accomplish any of these objectives.
27
Item 1A. Risk Factors - Continued
In determining this portion of oil and natural gas development costs (which may include estimated drilling and development costs associated with projects to convert a portion of non-producing reserves to producing status but does not include the historical cost of acquired properties as those amounts have already been spent in prior periods and were financed primarily with external sources of funding), management evaluates historical results of our drilling and development activities based on periodically revised and updated information from past years to assess the costs, adequacy and effectiveness of such activities and future assumptions regarding cost trends, production and decline rates and reserve recoveries. However, our management does not conduct an analysis to evaluate historical amounts of capital actually spent on such drilling and development activities. Our ability to pursue projects with the intent to replace proved developed producing reserves, current production and cash flow through drilling and development activities is limited to our inventory of development opportunities on our existing acreage position. Management’s estimate of this discretionary portion of our oil and natural gas development costs does not include the historical acquisition cost of projects pursued during the year or the acquisition of new oil and natural gas reserves. Moreover, our assumptions regarding costs, production and decline rates and reserve recoveries may prove to be incorrect. After establishing the amount of discretionary reductions for a portion of oil and natural gas development costs, if we do not fully replace proved developed producing reserves, current production and cash flow, our net cash provided by operating activities could be reduced, which could adversely affect our ability to service debt or to resume payment of distributions to our unitholders. Furthermore, our existing reserves, inventory of drilling locations and production levels will decline over time as a result of development and production activities. Consequently, if we were to limit our total capital expenditures to this discretionary portion of our oil and natural gas development costs and not complete acquisitions of new reserves, total reserves would decrease over time, resulting in an inability to sustain production at current levels, which could also adversely affect our ability to service debt and to resume payment of distributions to our unitholders.
Our commodity derivative activities could result in financial losses or could reduce our income, which may adversely affect our net cash provided by operating activities, financial condition and results of operations.
To achieve more predictable net cash provided by operating activities and to reduce our exposure to adverse fluctuations in the prices of oil and natural gas, we have entered into commodity derivative contracts for a portion of our production. Commodity derivative arrangements expose us to the risk of financial loss in some circumstances, including situations when production is less than expected. If we experience a sustained material interruption in our production or if we are unable to perform our drilling activity as planned, we might be forced to satisfy all or a portion of our derivative obligations without the benefit of the sale of our underlying physical commodity, which may adversely affect our net cash provided by operating activities, financial condition and results of operations.
We may be unable to hedge additional anticipated production volumes on attractive terms or at all, which would subject us to further potential commodity price uncertainty and could adversely affect our net cash provided by operating activities, financial condition and results of operations.
Although LINN Energy has hedged a significant portion of its natural gas production through 2017, its oil production is hedged to a lesser extent for 2016 and beyond, and its NGL production is completely unhedged. In addition, Berry’s oil production is completed unhedged. Based on current expectations for continued low future commodity prices, reduced hedging market liquidity and potential reduced counterparty willingness to enter into new hedges with us, we may be unable to hedge additional anticipated production volumes on attractive terms or at all, which would subject us to further potential commodity price uncertainty and could adversely affect our net cash provided by operating activities, financial condition and results of operations.
Counterparty failure may adversely affect our derivative positions.
We cannot be assured that our counterparties will be able to perform under our derivative contracts. If a counterparty fails to perform and the derivative arrangement is terminated, our net cash provided by operating activities, financial condition and results of operations would be adversely affected.
Derivatives legislation and implementing rules could have an adverse impact on our ability to hedge risks associated with our business.
Title VII of the Dodd-Frank Wall Street Reform and Consumer Protection Act (the “Dodd-Frank Act”), enacted in 2010, expands federal oversight and regulation of the derivatives market and entities, such as us, that participate in that market. Those markets involve derivative transactions, which include certain instruments, such as interest rate swaps, forward
28
Item 1A. Risk Factors - Continued
contracts, option contracts, financial contracts and other contracts, used in our risk management activities. The Dodd-Frank Act requires that most swaps ultimately will be cleared through a registered clearing facility and that they be traded on a designated exchange or swap execution facility, with certain exceptions for entities that use swaps to hedge or mitigate commercial risk. The Dodd-Frank requirements relating to derivative transactions have not been fully implemented by the SEC and the Commodities Futures Trading Commission. When fully implemented, the law and any new regulations could increase the operational and transactional cost of derivatives contracts and affect the number and/or creditworthiness of available counterparties.
In addition, we may transact with counterparties based in the European Union, Canada or other jurisdictions which, like the U.S., are in the process of implementing regulations to regulate derivatives transactions, some of which are currently in effect and impose operational and transactional costs on our derivatives activities.
Unless we replace our reserves, our future reserves and production will decline, which would adversely affect our net cash provided by operating activities, financial condition and results of operations.
Producing oil, natural gas and NGL reservoirs are characterized by declining production rates that vary depending on reservoir characteristics and other factors. The overall rate of decline for our production will change if production from our existing wells declines in a different manner than we have estimated and can change when we drill additional wells, make acquisitions and under other circumstances. Thus, our future oil, natural gas and NGL reserves and production and, therefore, our cash flow and income, are highly dependent on our success in efficiently developing our current reserves and economically finding or acquiring additional recoverable reserves. We may not be able to develop, find or acquire additional reserves to replace our current and future production at acceptable costs, which would adversely affect our net cash provided by operating activities, financial condition and results of operations. In addition, given our significant level of indebtedness, current market conditions and restrictive covenants under our debt agreements, we may be unable to finance such potential acquisitions of reserves on terms that are acceptable to us or at all. Our ability to make the necessary capital investment to maintain or expand our asset base of oil and natural gas reserves would be impaired to the extent cash flow from operations is reduced and external sources of capital become limited or unavailable. We may not be successful in exploring for, developing or acquiring additional reserves. We also may not be successful in raising funds to acquire additional reserves.
Our estimated reserves are based on many assumptions that may prove to be inaccurate. Any material inaccuracies in these reserve estimates or underlying assumptions will materially affect the quantities and present value of our reserves.
No one can measure underground accumulations of oil, natural gas and NGL in an exact manner. Reserve engineering requires subjective estimates of underground accumulations of oil, natural gas and NGL and assumptions concerning future oil, natural gas and NGL prices, production levels and operating and development costs. As a result, estimated quantities of proved reserves and projections of future production rates and the timing of development expenditures may prove to be inaccurate. An independent petroleum engineering firm prepares estimates of our proved reserves. Some of our reserve estimates are made without the benefit of a lengthy production history, which are less reliable than estimates based on a lengthy production history. Also, we make certain assumptions regarding future oil, natural gas and NGL prices, production levels and operating and development costs that may prove incorrect. Any significant variance from these assumptions by actual amounts could greatly affect our estimates of reserves, the economically recoverable quantities of oil, natural gas and NGL attributable to any particular group of properties, the classifications of reserves based on risk of recovery and estimates of the future net cash flows. Decreases in commodity prices can result in a reduction of our estimated reserves if development of those reserves would not be economic at those lower prices. Numerous changes over time to the assumptions on which our reserve estimates are based, as described above, often result in the actual quantities of oil, natural gas and NGL we ultimately recover being different from our reserve estimates.
The present value of future net cash flows from our proved reserves is not necessarily the same as the current market value of our estimated oil, natural gas and NGL reserves. We base the estimated discounted future net cash flows from our proved reserves on an unweighted average of the first-day-of-the month price for each month during the 12-month calendar year and year-end costs. However, actual future net cash flows from our oil and natural gas properties also will be affected by factors such as:
• | actual prices we receive for oil, natural gas and NGL; |
• | the amount and timing of actual production; |
29
Item 1A. Risk Factors - Continued
• | capital and operating expenditures; |
• | the timing and success of development activities; |
• | supply of and demand for oil, natural gas and NGL; and |
• | changes in governmental regulations or taxation. |
In addition, the 10% discount factor required to be used under the provisions of applicable accounting standards when calculating discounted future net cash flows, may not be the most appropriate discount factor based on interest rates in effect from time to time and risks associated with us or the oil and natural gas industry in general.
Our development operations require substantial capital expenditures, which will reduce our cash available to service debt. We may be unable to obtain needed capital or financing on satisfactory terms, which could lead to a decline in our reserves.
The oil and natural gas industry is capital intensive. We make and expect to continue to make substantial capital expenditures in our business for the development and production of oil, natural gas and NGL reserves. These expenditures will reduce our cash available to service debt or to resume payment of distributions to our unitholders. We intend to finance our future capital expenditures primarily with net cash provided by operating activities. Our net cash provided by operating activities and access to capital are subject to a number of variables, including:
• | our proved reserves; |
• | the level of oil, natural gas and NGL we are able to produce from existing wells; |
• | the prices at which we are able to sell our oil, natural gas and NGL; |
• | the level of operating expenses; and |
• | our ability to acquire, locate and produce new reserves. |
If our net cash provided by operating activities or the borrowing bases under our Credit Facilities decrease, we may have limited ability to obtain the capital necessary to sustain our operations at current levels. In addition, as noted previously, our Credit Facilities are effectively fully drawn, precluding our ability to utilize our Credit Facilities to fund our operations. Our Credit Facilities also restrict our ability to obtain new financing. If additional capital is needed, we may not be able to obtain debt or equity financing on terms favorable to us, or at all. If net cash provided by operating activities or cash available under our Credit Facilities is not sufficient to meet our capital requirements, the failure to obtain such additional debt or equity financing could result in a curtailment of our development operations, which in turn could lead to a decline in our reserves.
We may decide not to drill some of the prospects we have identified, and locations that we decide to drill may not yield oil, natural gas and NGL in commercially viable quantities.
Our prospective drilling locations are in various stages of evaluation, ranging from a prospect that is ready to drill to a prospect that will require additional geological and engineering analysis. Based on a variety of factors, including future oil, natural gas and NGL prices, the generation of additional seismic or geological information, the current and future availability of drilling rigs and other factors, we may decide not to drill one or more of these prospects. In addition, the cost of drilling, completing and operating a well is often uncertain, and cost factors can adversely affect the economics of a well. Our efforts will be uneconomic if we drill dry holes or wells that are productive but do not produce enough oil, natural gas and NGL to be commercially viable after drilling, operating and other costs. As a result, we may not be able to increase or sustain our reserves or production, which in turn could have an adverse effect on our business, financial condition, results of operations and cash flows.
The SEC’s reserve reporting rules include a general requirement that, subject to limited exceptions, proved undeveloped reserves may only be recorded if they relate to wells scheduled to be drilled within five years. As a result of the uncertainty regarding our future commitment to capital, we reclassified all of our proved undeveloped reserves to unproved as of December 31, 2015. See Item 7. “Management’s Discussion and Analysis of Financial Condition and Results of Operations” for details regarding our going concern uncertainty.
Our business depends on gathering and transportation facilities. Any limitation in the availability of those facilities would interfere with our ability to market the oil, natural gas and NGL we produce, and could reduce our cash available to
30
Item 1A. Risk Factors - Continued
service debt or to resume payment of distributions to our unitholders and adversely impact expected increases in oil, natural gas and NGL production from our drilling program.
The marketability of our oil, natural gas and NGL production depends in part on the availability, proximity and capacity of gathering systems and pipelines. The amount of oil, natural gas and NGL that can be produced and sold is subject to limitation in certain circumstances, such as pipeline interruptions due to scheduled and unscheduled maintenance, excessive pressure, physical damage to the gathering or transportation system, or lack of contracted capacity on such systems. The curtailments arising from these and similar circumstances may last from a few days to several months. In many cases, we are provided only with limited, if any, notice as to when these circumstances will arise and their duration. In addition, some of our wells are drilled in locations that are not serviced by gathering and transportation pipelines, or the gathering and transportation pipelines in the area may not have sufficient capacity to transport additional production. As a result, we may not be able to sell the oil, natural gas and NGL production from these wells until the necessary gathering and transportation systems are constructed. Any significant curtailment in gathering system or pipeline capacity, or significant delay in the construction of necessary gathering and transportation facilities, would interfere with our ability to market the oil, natural gas and NGL we produce, and could reduce our cash available to service debt or to resume payment of distributions to our unitholders and adversely impact expected increases in oil, natural gas and NGL production from our drilling program.
We depend on certain key customers for sales of our oil, natural gas and NGL. To the extent these and other customers reduce the volumes they purchase from us or delay payment, our revenues and cash available to service debt or to resume payment of distributions to our unitholders could decline. Further, a general increase in nonpayment could have an adverse impact on our financial position and results of operations.
For the year ended December 31, 2015, sales of oil, natural gas and NGL to Phillips 66 accounted for approximately 12% of our sales. To the extent this and other customers reduce the volumes of oil, natural gas or NGL that they purchase from us, our revenues and cash available to service debt or to resume payment of distributions to our unitholders could decline.
We may be unable to retain key employees.
Our future success will depend in part on our ability to retain key employees. Since the fourth quarter of 2014, the prices of oil, natural gas and NGL have been extremely volatile, have declined significantly and downward pressure on commodity prices may continue for the foreseeable future. Key employees may depart because of issues relating to the uncertainty during times of commodity price volatility. Accordingly, no assurance can be given that we will be able to retain key employees to the same extent as in the past.
Many of our leases are in areas that have been partially depleted or drained by offset wells.
Many of our leases are in areas that have already been partially depleted or drained by earlier offset drilling. This may inhibit our ability to find economically recoverable quantities of reserves in these areas. Our identified drilling location inventories are scheduled out over several years, making them susceptible to uncertainties that could materially alter the occurrence or timing of their drilling, which could have a material adverse effect on our business, financial condition, results of operations and cash flows.
Drilling for and producing oil, natural gas and NGL are high risk activities with many uncertainties that could adversely affect our financial position, results of operations and cash flows and, as a result, our ability to service debt or to resume payment of distributions to our unitholders.
Our drilling activities are subject to many risks, including the risk that we will not discover commercially productive reservoirs. Drilling for oil, natural gas and NGL can be uneconomic, not only from dry holes, but also from productive wells that do not produce sufficient revenues to be commercially viable. In addition, our drilling and producing operations may be curtailed, delayed or canceled as a result of other factors, including:
• | the high cost, shortages or delivery delays of equipment and services; |
• | unexpected operational events; |
• | adverse weather conditions; |
• | facility or equipment malfunctions; |
31
Item 1A. Risk Factors - Continued
• | title problems; |
• | pipeline ruptures or spills; |
• | compliance with environmental and other governmental requirements; |
• | unusual or unexpected geological formations; |
• | loss of drilling fluid circulation; |
• | formations with abnormal pressures; |
• | fires; |
• | blowouts, craterings and explosions; and |
• | uncontrollable flows of oil, natural gas and NGL or well fluids. |
Any of these events can cause increased costs or restrict our ability to drill the wells and conduct the operations which we currently have planned. Any delay in the drilling program or significant increase in costs could impact our financial position, results of operations and cash flows, and as a result, our ability to service debt or to resume payment of distributions to our unitholders.
We have limited control over the activities on properties we do not operate.
Other companies operate some of the properties in which we have an interest. As of December 31, 2015, nonoperated wells represented approximately 28% of our owned gross wells, or approximately 11% of our owned net wells. We have limited ability to influence or control the operation or future development of these nonoperated properties, including timing of drilling and other scheduled operations activities, compliance with environmental, safety and other regulations, or the amount of capital expenditures that we are required to fund with respect to them. The failure of an operator of our wells to adequately perform operations, an operator’s breach of the applicable agreements or an operator’s failure to act in ways that are in our best interest could reduce our production and revenues, and lead to unexpected future costs.
Because we handle oil, natural gas and NGL and other hydrocarbons, we may incur significant costs and liabilities in the future resulting from a failure to comply with new or existing environmental regulations or an accidental release of hazardous substances into the environment.
The operations of our wells, gathering systems, turbines, pipelines and other facilities are subject to stringent and complex federal, state and local environmental laws and regulations. Failure to comply with these laws and regulations may trigger a variety of administrative, civil and criminal enforcement measures, including the assessment of monetary penalties, the imposition of remedial requirements, and the issuance of orders enjoining future operations. There is an inherent risk that we may incur environmental costs and liabilities due to the nature of our business and the substances we handle. Certain environmental statutes, including the RCRA, CERCLA and analogous state laws and regulations, impose strict, joint and several liability for costs required to clean up and restore sites where hazardous substances have been disposed of or otherwise released. In addition, an accidental release from one of our wells or gathering pipelines could subject us to substantial liabilities arising from environmental cleanup and restoration costs, claims made by neighboring landowners and other third parties for personal injury and property damage and fines or penalties for related violations of environmental laws or regulations.
Moreover, the possibility exists that stricter laws, regulations or enforcement policies could significantly increase our compliance costs and the cost of any remediation that may become necessary, and these costs may not be recoverable from insurance. For a more detailed discussion of environmental and regulatory matters impacting our business, see Item 1. “Business - Environmental Matters and Regulation.”
We are subject to complex federal, state, local and other laws and regulations that could adversely affect the cost, manner or feasibility of doing business.
Our operations are regulated extensively at the federal, state and local levels. Environmental and other governmental laws and regulations have resulted in delays and increased the costs to plan, design, drill, install, operate and abandon oil and natural gas wells. Under these laws and regulations, we could also be liable for personal injuries, property damage and other damages. Failure to comply with these laws and regulations may result in the suspension or termination of our operations and subject us to administrative, civil and criminal penalties. Moreover, public interest in environmental protection has increased in recent years, and environmental organizations have opposed, with some success, certain drilling projects.
32
Item 1A. Risk Factors - Continued
Part of the regulatory environment in which we operate includes, in some cases, legal requirements for obtaining environmental assessments, environmental impact studies and/or plans of development before commencing drilling and production activities. In addition, our activities are subject to the regulations regarding conservation practices and protection of correlative rights. These regulations affect our operations and limit the quantity of oil, natural gas and NGL we may produce and sell. A major risk inherent in our drilling plans is the need to obtain drilling permits from state and local authorities. Delays in obtaining regulatory approvals or drilling permits, the failure to obtain a drilling permit for a well or the receipt of a permit with unreasonable conditions or costs could have a material adverse effect on our ability to develop our properties. Additionally, the regulatory environment could change in ways that might substantially increase the financial and managerial costs of compliance with these laws and regulations and, consequently, adversely affect our financial condition and results of operations, as well as our ability to service debt or to resume payment of distributions to our unitholders. For a description of the laws and regulations that affect us, see Item 1. “Business - Environmental Matters and Regulation.”
Legislation and regulation of hydraulic fracturing could adversely affect our business.
Hydraulic fracturing is an important and common practice that is used to stimulate production of hydrocarbons from tight formations. The process involves the injection of water, sand and chemicals under pressure into formations to fracture the surrounding rock and stimulate production. For a description of the laws and regulations that affect us, including our hydraulic fracturing operations, see Item 1. “Business - Environmental Matters and Regulation.” If adopted, certain bills could result in additional permitting requirements for hydraulic fracturing operations as well as various restrictions on those operations. Any such added regulation could lead to operational delays, increased operating costs and additional regulatory burdens, and reduced production of oil and natural gas, which could adversely affect our business, financial position, results of operations and net cash provided by operating activities.
We use a significant amount of water in our hydraulic fracturing operations. Our inability to locate sufficient amounts of water, or dispose of or recycle water used in our drilling and production operations, could adversely impact our operations. Moreover, new environmental initiatives and regulations could include restrictions on our ability to conduct certain operations such as hydraulic fracturing or disposal of waste, including, but not limited to, produced water, drilling fluids and other wastes associated with the development or production of natural gas.
Finally, in some instances, the operation of underground injection wells has been alleged to cause earthquakes. Such issues have sometimes led to orders prohibiting continued injection in certain wells identified as possible sources of seismic activity. Such concerns also have resulted in stricter regulatory requirements in some jurisdictions relating to the location and operation of underground injection wells. Future orders or regulations addressing concerns about seismic activity from well injection could affect us, either directly or indirectly, depending on the wells affected.
Legislation and regulation of greenhouse gases could adversely affect our business.
In December 2009, the Environmental Protection Agency (“EPA“) determined that emissions of carbon dioxide, methane and other “greenhouse gases” (“GHG”) present an endangerment to public health and the environment because emissions of such gases are, according to the EPA, contributing to warming of the earth’s atmosphere and other climatic changes. Based on these findings, the EPA has begun adopting and implementing regulations to restrict emissions of GHGs under existing provisions of the Clean Air Act (“CAA”). The EPA has adopted three sets of rules regulating GHG emissions under the CAA, one that requires a reduction in emissions of GHGs from motor vehicles, a second that regulates emissions of GHGs from certain large stationary sources under the CAA’s Prevention of Significant Deterioration and Title V permitting programs, and a third that regulates GHG emissions from fossil fuel-burning power plants. In addition, in September 2015, the EPA published a proposed rule that would update and expand the New Source Performance Standards by setting additional emissions limits for volatile organic compounds and regulating methane emissions from new and modified sources in the oil and gas industry. The EPA has also adopted rules requiring the monitoring and reporting of GHG emissions from specified sources in the U.S., including, among other things, certain onshore oil and natural gas production facilities, on an annual basis. In addition, in 2015, the U.S. participated in the United Nations Conference on Climate Change, which led to the creation of the Paris Agreement. The Paris Agreement will be open for signing on April 22, 2016, and will require countries to review and “represent a progression” in their intended nationally determined contributions, which set GHG emission reduction goals, every five years beginning in 2020. Legislation has from time to time been introduced in Congress that would establish measures restricting GHG emissions in the U.S. At the state level, almost one half of the states,
33
Item 1A. Risk Factors - Continued
including California, have begun taking actions to control and/or reduce emissions of GHGs. For a description of the California “cap and trade” program, see Item 1. “Business – Environmental Matters and Regulation.” Any such added regulation could lead to operational delays, increased operating costs and additional regulatory burdens, and reduced production of oil and natural gas, which could adversely affect our business, financial position, results of operations and net cash provided by operating activities.
Recent regulatory changes in California have and may continue to adversely affect our production and operating costs related to our Diatomite assets.
Recent regulatory changes in California have impacted production from our Diatomite assets. In 2010, Diatomite production decreased significantly due to the inability to drill new wells pending the receipt of permits from the California Division of Oil, Gas and Geothermal Resources (“DOGGR”). Berry received a new full-field development approval in late July 2011 from DOGGR, which contained stringent operating requirements. Revisions to the July 2011 project approval letter were received in February 2012. Implementation of these new operating requirements negatively impacted the pace of drilling and steam injection and increased Berry’s operating costs for its Diatomite assets. The requirements continued to affect Berry’s operations through 2015, and we may not be successful in streamlining the review process with DOGGR or in taking additional steps to more efficiently manage our operations to avoid additional delays. In addition, DOGGR may impose additional operational restrictions or requirements. For example, currently DOGGR is developing new regulations for shallow, thermal Diatomite. In such case, we may experience additional delays in production and increased operating costs related to our Diatomite assets, which could adversely affect our business, financial position, results of operations and net cash provided by operating activities.
We may issue additional units without unitholder approval, which would dilute existing ownership interests.
We may issue an unlimited number of limited liability company interests of any type, including units, without the approval of our unitholders.
The issuance of additional units or other equity securities may have the following effects:
• | an individual unitholder’s proportionate ownership interest in us may decrease; |
• | the relative voting strength of each previously outstanding unit may be reduced; |
• | the amount of cash available for distribution per unit may decrease; and |
• | the market price of the units may decline. |
Our management may have conflicts of interest with the unitholders. Our limited liability company agreement limits the remedies available to our unitholders in the event unitholders have a claim relating to conflicts of interest.
Conflicts of interest may arise between our management on one hand, and the Company and our unitholders on the other hand, related to the divergent interests of our management. Situations in which the interests of our management may differ from interests of our nonaffiliated unitholders include, among others, the following situations:
• | our limited liability company agreement gives our Board of Directors broad discretion in establishing cash reserves for the proper conduct of our business, which will affect the amount of cash available for distributions to our unitholders. For example, our management will use its reasonable discretion to establish and maintain cash reserves sufficient to fund our drilling program, and may also determine to reduce indebtedness; |
• | our management team, subject to oversight from our Board of Directors, determines the timing and extent of our drilling program and related capital expenditures, asset purchases and sales, borrowings, issuances of additional units and reserve adjustments, all of which will affect the amount of cash available to service debt or to resume payment of distributions to our unitholders; and |
• | affiliates of our directors are not prohibited from investing or engaging in other businesses or activities that compete with the Company. |
34
Item 1A. Risk Factors - Continued
Your units are subject to limited call rights that could result in your having to involuntarily sell your units at a time or price that may be undesirable.
If at any time a person owns more than 90% of our outstanding units, such person may elect to purchase all, but not less than all, of our remaining outstanding units at a price equal to the higher of the current market price (as defined in our limited liability company agreement) and the highest price paid by such person or any of its affiliates for any of our units purchased during the 90-day period preceding the date notice was mailed to the our unitholders informing them of such election. In this case, you will be required to tender all of your outstanding units and you may receive a payment that is effectively less than the price at which you would prefer to sell your units.
Unitholders who are not “Eligible Holders” will be subject to redemption of their units.
In order to comply with U.S. laws with respect to the ownership of interests in oil and natural gas leases on federal lands, we have adopted certain requirements regarding those investors who may own our units. As used herein, an Eligible Holder means a person or entity qualified to hold an interest in oil and natural gas leases on federal lands. Unitholders who are not persons or entities who meet the requirements to be an Eligible Holder will not be entitled to receive distributions in kind on their units in a liquidation and they run the risk of having their units redeemed by us at the then-current market price.
Tax Risks
We are exploring strategic alternatives to strengthen our balance sheet and maximize our value. We may consider alternatives that could have significant adverse tax consequences to our unitholders.
We are exploring strategic alternatives to strengthen our balance sheet and maximize our value. We may consider alternatives that could have significant adverse tax consequences to our unitholders. For example, we may engage in additional transactions that result in significant cancellation of debt (“COD”) income to our unitholders. As described below, any COD income may cause a unitholder to be allocated income with respect to our units with no corresponding distribution of cash to fund the payment of the resulting tax liability to the unitholder. In addition, we may engage in transactions that trigger a unitholder’s tax gain or loss with respect to our units. A transaction that triggers a unitholder’s gain may not be accompanied by any receipt of cash to fund the payment of the resulting tax liability to the unitholder. Under certain circumstances, a unitholder’s loss upon any such transaction may be permanently disallowed.
We urge our unitholders to consult their tax advisors regarding the potential adverse effects of the various strategic alternatives that may be available to us.
Unitholders are required to pay taxes on their share of our taxable income, including their share of ordinary income and capital gain upon dispositions of properties by us or cancellation of debt, even if they do not receive any cash distributions from us to fund any resulting tax liability. A unitholder’s share of our taxable income, gain, loss and deduction, or specific items thereof, may be substantially different than the unitholder’s interest in our economic profits.
Our unitholders are required to pay federal income taxes and, in some cases, state and local income taxes on their share of our taxable income, whether or not they receive any cash distributions from us. Even if our distributions are reinstated, our unitholders may not receive cash distributions from us equal to their share of our taxable income or even equal to the actual tax liability that results from their share of our taxable income.
For example, a unitholder’s share of our taxable income will include any COD income recognized upon the satisfaction of our outstanding indebtedness for total consideration less than the adjusted issue price (and any accrued but unpaid interest) of such indebtedness. During 2015, we repurchased and exchanged approximately $3.0 billion of our outstanding senior notes at a significant discount, resulting in substantial COD income. We may engage in other transactions that result in COD income in the future. Depending upon the net amount of other items related to our loss (or income) allocable to a unitholder, any COD income may cause a unitholder to be allocated income with respect to our units with no corresponding distribution of cash to fund the payment of the resulting tax liability to the unitholder. Furthermore, such COD income event may not be fully offset, either now or in the future, by capital losses, which are subject to significant limitations, or other losses. Accordingly, a COD income event could cause a unitholder to realize taxable income without corresponding future economic benefits or offsetting tax deductions.
35
Item 1A. Risk Factors - Continued
In addition, we may sell a portion of our properties and use the proceeds to pay down debt or acquire other properties rather than distributing the proceeds to our unitholders, and some or all of our unitholders may be allocated substantial taxable income or loss with respect to that sale. A unitholder’s share of our taxable income upon a disposition of property by us may be ordinary income or capital gain or some combination thereof. Even where we dispose of properties that are capital assets, what otherwise would be capital gains may be recharacterized as ordinary income in order to “recapture” ordinary deductions that were previously allocated to that unitholder related to the same properties.
A unitholder’s share of our taxable income and gain (or specific items thereof) may be substantially greater than, or our tax losses and deductions (or specific items thereof) may be substantially less than, the unitholder’s interest in our economic profits. This may occur, for example, in the case of a unitholder who purchases units at a time when the value of our units or of one or more of our properties is relatively low or a unitholder who acquires units directly from us in exchange for property whose fair market value exceeds its tax basis at the time of the exchange. Cash distributions from us decrease a unitholder’s tax basis in its units, and the amount, if any, of excess distributions over a unitholder’s tax basis in its units will, in effect, become taxable income to the unitholder, above and beyond the unitholder’s share of our taxable income and gain (or specific items thereof).
Our tax treatment depends on our status as a partnership for federal income tax purposes, as well as our not being subject to a material amount of additional entity level taxation by individual states. If the Internal Revenue Service (“IRS”) were to treat us as a corporation for federal income tax purposes or we were to become subject to material additional entity level taxation for state tax purposes, taxes paid, if any, would reduce the amount of cash available to service debt or to resume payment of distributions to our unitholders.
The anticipated after-tax economic benefit of an investment in our units depends largely on us being treated as a partnership for federal income tax purposes. We have not requested, and do not currently plan to request, a ruling from the IRS on this or any other tax matter that affects us.
If we were treated as a corporation for federal income tax purposes, we would pay federal income tax on our taxable income at the corporate tax rates, currently at a maximum rate of 35%. Distributions, if any, would generally be taxed again as corporate distributions, and no income, gain, loss, deduction or credit would flow through to unitholders. Because a tax may be imposed on us as a corporation, our cash available to service debt or to resume payment of distributions to our unitholders could be reduced.
Current law or our business may change and cause us to be treated as a corporation for federal income tax purposes or otherwise subject us to entity level taxation. Any modification to current law or interpretations thereof may or may not be applied retroactively and could make it more difficult or impossible to meet the requirements for partnership status, affect or cause us to change our business activities, affect the tax considerations of an investment in us, change the character or treatment of portions of our income and adversely affect an investment in our units.
In addition, because of widespread state budget deficits and other reasons, several states are evaluating ways to subject partnerships and limited liability companies to entity level taxation through the imposition of state income, franchise or other forms of taxation. For example, we may be required to pay Texas franchise tax on our total revenue apportioned to Texas at a maximum effective rate of approximately 0.5%. Imposition of a similar entity-level tax on our income or receipts by any other state would reduce the amount of cash available to service debt or to resume payment of distributions to our unitholders.
A successful IRS contest of the federal income tax positions we take may adversely affect the market for our units, and the cost of an IRS contest will reduce our cash available to service debt or to resume payment of distributions to our unitholders.
The IRS may adopt tax positions that differ from the positions we take. It may be necessary to resort to administrative or court proceedings to sustain some or all of the positions we take. A court may not agree with some or all of the positions we take. Any contest with the IRS may materially and adversely impact the market for our units and the price at which they trade, as well as reduce our cash available to service debt or to resume payment of distributions to our unitholders.
36
Item 1A. Risk Factors - Continued
If the IRS makes audit adjustments to our income tax returns for tax years beginning after 2017, it (and some states) may collect any resulting taxes (including any applicable penalties and interest) directly from us, in which case our cash available to service debt or to pay distributions to our unitholders, if and when resumed, might be substantially reduced.
Pursuant to the Bipartisan Budget Act of 2015, if the IRS makes audit adjustments to our income tax returns for tax years beginning after 2017, it may collect any resulting taxes (including any applicable penalties and interest) directly from us. We will generally have the ability to shift any such tax liability to our unitholders in accordance with their interests in us during the year under audit, but there can be no assurance that we will be able to do so (and will choose to do so) under all circumstances, or that we will be able to (or choose to) effect corresponding shifts in state income or similar tax liability resulting from the IRS adjustment in states in which we do business in the year under audit or in the adjustment year. If we make payments of taxes, penalties and interest resulting from audit adjustments, our cash available to service debt or to resume payment of distributions to our unitholders could be reduced.
A unitholder’s taxable gain or loss on the disposition of our units could be more or less than expected.
If unitholders sell their units, they will recognize a gain or loss equal to the difference between the amount realized and their tax basis in those units. Prior distributions to our unitholders in excess of the total net taxable income they were allocated for a unit, which decreases their tax basis, will become taxable income to our unitholders if the unit is sold at a price greater than their tax basis in that unit, even if the price received is less than their original cost.
A substantial portion of the amount realized, whether or not representing gain, may be ordinary income. In addition, if unitholders sell their units, they may incur a tax liability in excess of the amount of cash they receive from the sale. If the IRS successfully contests some positions we take, unitholders could recognize more gain on the sale of units than would be the case under those positions, without the benefit of decreased income in prior years.
Tax-exempt entities and non-U.S. persons face unique tax issues from owning our units that may result in adverse tax consequences to them.
Investment in units by tax-exempt entities, such as individual retirement accounts (known as IRAs) and other retirement plans, and non-U.S. persons raises issues unique to them. For example, virtually all of our income allocated to organizations that are exempt from federal income tax, including IRAs and other retirement plans, will be unrelated business taxable income and will be taxable to them. Distributions to non-U.S. persons will be reduced by withholding taxes at the highest applicable effective tax rate, and non-U.S. persons will be required to file U.S. federal tax returns and pay tax on their share of our taxable income.
We treat each purchaser of units as having the same economic and tax characteristics without regard to the units purchased. The IRS may challenge this treatment, which could adversely affect the value of the units.
Because we cannot match transferors and transferees of units, we must maintain uniformity of the economic and tax characteristics of our units to a purchaser of units. We take depletion, depreciation and amortization and other positions that are intended to maintain such uniformity. These positions may not conform with all aspects of existing Treasury regulations and may affect the amount or timing of income, gain, loss or deduction allocable to a unitholder or the amount of gain from a unitholder’s sale of units. A successful IRS challenge to those positions could also adversely affect the amount or timing of income, gain, loss or deduction allocable to a unitholder, or the amount of gain from a unitholder’s sale of units and could have a negative impact on the value of our units or result in audit adjustments to unitholders tax returns.
We prorate our items of income, gain, loss and deduction between transferors and transferees of our units each month (or in some cases for periods shorter than a month) based upon the ownership of our units on the first day of each month (or shorter period), instead of on the basis of the date a particular unit is transferred. The IRS may challenge this treatment, which could change the allocation of items of income, gain, loss and deduction among our unitholders.
We prorate our items of income, gain, loss and deduction between transferors and transferees of our units each month (or in some cases for periods shorter than a month) based upon the ownership of our units on the first day of each month (or shorter period), instead of on the basis of the date a particular unit is transferred. The use of this proration method may not be
37
Item 1A. Risk Factors - Continued
permitted under existing Treasury regulations. If the IRS were to challenge this method or new Treasury regulations were issued, we may be required to change the allocation of items of income, gain, loss and deduction among our unitholders.
The sale or exchange of 50% or more of our capital and profits interests within a 12-month period will result in the deemed termination of our tax partnership for federal income tax purposes.
We will be considered to have terminated for federal income tax purposes if there is a sale or exchange of 50% or more of the total interests in our capital and profits within a 12-month period. Our termination would, among other things, result in the closing of our taxable year for all unitholders and could result in a deferral of depreciation deductions allowable in computing our taxable income. If this occurs, our unitholders will be allocated an increased amount of federal taxable income for the year in which we are considered to be terminated as a percentage of the cash distributed to the unitholders with respect to that period.
A unitholder whose units are loaned to a “short seller” to cover a short sale of units may be considered as having disposed of those units. If so, the unitholder would no longer be treated for tax purposes as a partner with respect to those units during the period of the loan and may recognize gain or loss from the disposition.
Because a unitholder whose units are loaned to a “short seller” to cover a short sale of units may be considered as having disposed of the loaned units, the unitholder may no longer be treated for tax purposes as a partner with respect to those units during the period of the loan to the short seller and the unitholder may recognize gain or loss from such disposition. Moreover, during the period of the loan to the short seller, any of our income, gain, loss, or deduction with respect to those units may not be reportable by the unitholder and any cash distributions received by the unitholder as to those units could be fully taxable as ordinary income. Unitholders desiring to assure their status as partners and avoid the risk of gain recognition from a loan to a short seller are urged to modify any applicable brokerage account agreements to prohibit their brokers from borrowing their units.
Unitholders may be subject to state and local taxes and return filing requirements in states and jurisdictions where they do not live as a result of investing in our units.
In addition to federal income taxes, our unitholders will likely be subject to other taxes, including state and local taxes, unincorporated business taxes and estate, inheritance or intangible taxes that are imposed by the various jurisdictions in which we do business or own property now or in the future, even if they do not reside in any of those jurisdictions. Our unitholders will likely be required to file foreign, state and local income tax returns and pay state and local income taxes in some or all of these jurisdictions. Further, our unitholders may be subject to penalties for failure to comply with those requirements. In 2015, we have been registered to do business or have owned assets in Alabama, Arkansas, California, Colorado, Illinois, Indiana, Kansas, Louisiana, Michigan, Mississippi, Montana, New Mexico, North Dakota, Oklahoma, South Dakota, Texas, Utah and Wyoming. As we make acquisitions or expand our business, we may do business or own assets in other states in the future. It is the responsibility of each unitholder to file all U.S. federal, state and local tax returns that may be required of such unitholder.
Changes to current federal tax laws may affect the tax treatment of publicly traded partnerships or unitholders’ ability to take certain tax deductions, possibly on a retroactive basis.
Substantive changes to the existing federal income tax laws have been proposed that, if adopted, would affect, among other things, the ability to take certain operations-related deductions, including deductions for intangible drilling and deductions for U.S. production activities. Other proposed changes may affect our ability to remain taxable as a partnership for federal income tax purposes or tax publicly traded partnerships with qualifying income from fossil fuels activities as a corporation. Additionally, in May 2015, the IRS and the U.S. Department of the Treasury published proposed regulations that provide industry-specific guidance regarding whether income earned from certain activities will constitute qualifying income. We are unable to predict whether any changes, or other proposals to such laws, ultimately will be enacted or, if enacted, will be applied retroactively, or whether proposed regulations, once issued in final form, will materially change interpretations of the current law. Any such changes could negatively impact the value of an investment in our units.
Item 1B. Unresolved Staff Comments
None
Item 2. Properties
Information concerning proved reserves, production, wells, acreage and related matters are contained in Item 1. “Business.”
The Company’s obligations under its Credit Facilities and senior secured second lien notes are secured by mortgages on a substantial majority of its oil and natural gas properties. See Item 7. “Management’s Discussion and Analysis of Financial Condition and Results of Operations” and Note 6 for additional details about the Credit Facilities and senior secured second lien notes.
Offices
The Company’s principal corporate office is located at 600 Travis, Suite 5100, Houston, Texas 77002. The Company maintains additional offices in California, Colorado, Illinois, Kansas, Louisiana, Michigan, New Mexico, Oklahoma, Texas, Utah and Wyoming.
Item 3. Legal Proceedings
For certain statewide class action royalty payment disputes where a reserve has not yet been established, the Company has denied that it has any liability on the claims and has raised arguments and defenses that, if accepted by the courts, will result in no loss to the Company. In addition, the Company is involved in various other disputes arising in the ordinary course of business. The Company is not currently a party to any litigation or pending claims that it believes would have a material adverse effect on its overall business, financial position, results of operations or liquidity; however, cash flow could be significantly impacted in the reporting periods in which such matters are resolved.
Item 4. Mine Safety Disclosures
Not applicable
38
Part II
Item 5. | Market for Registrant’s Common Equity, Related Stockholder Matters and Issuer Purchases of Equity Securities |
The Company’s units are listed on the NASDAQ Global Select Market (“NASDAQ”) under the symbol “LINE.” At the close of business on January 31, 2016, there were approximately 143 unitholders of record.
The following table sets forth the range of high and low last reported sales prices per unit, as reported by NASDAQ, for the quarters indicated. In addition, distributions declared during each quarter are presented.
Unit Price Range | Cash Distributions Declared Per Unit | |||||||||||
Quarter | High | Low | ||||||||||
2015: | ||||||||||||
October 1 – December 31 | $ | 3.41 | $ | 1.12 | $ | — | ||||||
July 1 – September 30 | $ | 9.16 | $ | 2.11 | $ | 0.313 | ||||||
April 1 – June 30 | $ | 13.94 | $ | 8.91 | $ | 0.313 | ||||||
January 1 – March 31 | $ | 14.25 | $ | 9.22 | $ | 0.313 | ||||||
2014: | ||||||||||||
October 1 – December 31 | $ | 29.58 | $ | 9.83 | $ | 0.725 | ||||||
July 1 – September 30 | $ | 32.57 | $ | 29.81 | $ | 0.725 | ||||||
April 1 – June 30 | $ | 32.35 | $ | 27.96 | $ | 0.725 | ||||||
January 1 – March 31 | $ | 33.72 | $ | 27.18 | $ | 0.725 | ||||||
Distributions
Under the Company’s limited liability company agreement, unitholders are entitled to receive a distribution of available cash, which includes cash on hand plus borrowings less any reserves established by the Company’s Board of Directors to provide for the proper conduct of the Company’s business (including reserves for future capital expenditures, including drilling, acquisitions and anticipated future credit needs) or to fund distributions, if any, over the next four quarters. In January 2015, the Company reduced its distribution to $1.25 per unit, from the previous level of $2.90 per unit, on an annualized basis. Monthly distributions were paid by the Company through September 2015. In October 2015, the Company’s Board of Directors determined to suspend payment of the Company’s distribution. The Company’s Board of Directors will continue to evaluate the Company’s ability to reinstate the distribution. For additional information, see “Distribution Practices” in Item 7. “Management’s Discussion and Analysis of Financial Condition and Results of Operations.”
39
Item 5. | Market for Registrant’s Common Equity, Related Stockholder Matters and Issuer Purchases of Equity Securities - Continued |
Unitholder Return Performance Presentation
The performance graph below compares the total unitholder return on the Company’s units with the total return of the Standard & Poor’s 500 Index (“S&P 500 Index”) and the Alerian MLP Index, a weighted composite of certain prominent energy master limited partnerships. Total return includes the change in the market price, adjusted for reinvested dividends or distributions, for the period shown on the performance graph and assumes that $100 was invested in the Company, the S&P 500 Index and the Alerian MLP Index on December 31, 2010. The results shown in the graph below are not necessarily indicative of future performance.
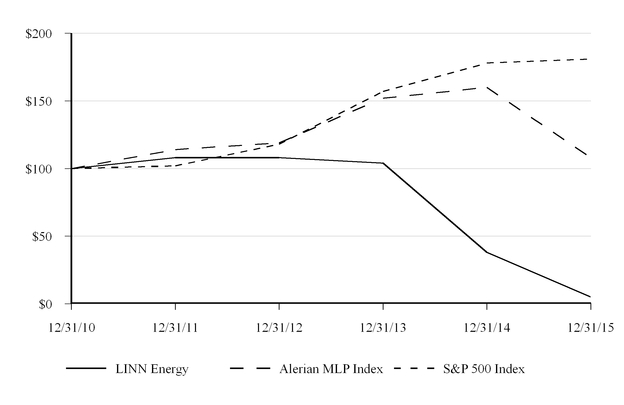
December 31, 2010 | December 31, 2011 | December 31, 2012 | December 31, 2013 | December 31, 2014 | December 31, 2015 | |||||||||||||||||||
LINN Energy | $ | 100 | $ | 108 | $ | 108 | $ | 104 | $ | 38 | $ | 5 | ||||||||||||
Alerian MLP Index | $ | 100 | $ | 114 | $ | 119 | $ | 152 | $ | 160 | $ | 108 | ||||||||||||
S&P 500 Index | $ | 100 | $ | 102 | $ | 118 | $ | 157 | $ | 178 | $ | 181 | ||||||||||||
Notwithstanding anything to the contrary set forth in any of the Company’s previous or future filings under the Securities Act of 1933 or the Securities Exchange Act of 1934 that might incorporate this Annual Report on Form 10-K or future filings with the Securities and Exchange Commission (“SEC”), in whole or in part, the preceding performance information shall not be deemed to be “soliciting material” or to be “filed” with the SEC or incorporated by reference into any filing except to the extent this performance presentation is specifically incorporated by reference therein.
Securities Authorized for Issuance Under Equity Compensation Plans
See the information incorporated by reference in Item 12. “Security Ownership of Certain Beneficial Owners and Management and Related Stockholder Matters” regarding securities authorized for issuance under the Company’s equity compensation plans, which information is incorporated by reference into this Item 5.
40
Item 5. | Market for Registrant’s Common Equity, Related Stockholder Matters and Issuer Purchases of Equity Securities - Continued |
Sales of Unregistered Securities
In conjunction with LinnCo, LLC’s (“LinnCo”) contribution of Berry Petroleum Company, now Berry Petroleum Company, LLC (“Berry”) to LINN Energy (see Note 2), on December 16, 2013, LINN Energy issued 93,756,674 units to LinnCo, which were not and will not be registered under the Securities Act of 1933, as amended, and the rules and regulations promulgated thereunder (“Securities Act”), or any state securities laws, in reliance on Section 4(2) of the Securities Act as these transactions were by an issuer not involving a public offering. Total units issued to LinnCo included 40,938 (approximately $1 million) of Berry equity awards that vested and were converted to LinnCo common shares on the Berry acquisition date and included in total consideration. These shares were issued in 2014 due to six month deferred issuance provisions in the original Berry award agreements.
Issuer Purchases of Equity Securities
The Company’s Board of Directors has authorized the repurchase of up to $250 million of the Company’s outstanding units from time to time on the open market or in negotiated purchases. The timing and amounts of any such repurchases are at the discretion of management, subject to market conditions and other factors, and in accordance with applicable securities laws and other legal requirements. The repurchase plan does not obligate the Company to acquire any specific number of units and may be discontinued at any time. The Company did not repurchase any units during the year ended December 31, 2015, and as of December 31, 2015, the entire amount remained available for unit repurchase under the program.
41
Item 6. | Selected Financial Data |
The selected financial data set forth below should be read in conjunction with Item 7. “Management’s Discussion and Analysis of Financial Condition and Results of Operations” and Item 8. “Financial Statements and Supplementary Data.”
Because of rapid growth through acquisitions and development of properties, the Company’s historical results of operations and period-to-period comparisons of those results and certain other financial data may not be meaningful or indicative of future results.
At or for the Year Ended December 31, | |||||||||||||||||||
2015 | 2014 | 2013 | 2012 | 2011 | |||||||||||||||
(in thousands, except per unit amounts) | |||||||||||||||||||
Statement of operations data: | |||||||||||||||||||
Oil, natural gas and natural gas liquids sales | $ | 1,726,271 | $ | 3,610,539 | $ | 2,073,240 | $ | 1,601,180 | $ | 1,162,037 | |||||||||
Gains on oil and natural gas derivatives | 1,056,189 | 1,206,179 | 177,857 | 124,762 | 449,940 | ||||||||||||||
Depreciation, depletion and amortization | 805,757 | 1,073,902 | 829,311 | 606,150 | 334,084 | ||||||||||||||
Interest expense, net of amounts capitalized | 546,453 | 587,838 | 421,137 | 379,937 | 259,725 | ||||||||||||||
Net income (loss) | (4,759,811 | ) | (451,809 | ) | (691,337 | ) | (386,616 | ) | 438,439 | ||||||||||
Net income (loss) per unit: | |||||||||||||||||||
Basic | (13.87 | ) | (1.40 | ) | (2.94 | ) | (1.92 | ) | 2.52 | ||||||||||
Diluted | (13.87 | ) | (1.40 | ) | (2.94 | ) | (1.92 | ) | 2.51 | ||||||||||
Distributions declared per unit | 0.938 | 2.90 | 2.90 | 2.87 | 2.70 | ||||||||||||||
Weighted average units outstanding | 343,323 | 328,918 | 237,544 | 203,775 | 172,004 | ||||||||||||||
Cash flow data: | |||||||||||||||||||
Net cash provided by (used in): | |||||||||||||||||||
Operating activities (1) | $ | 1,249,457 | $ | 1,711,890 | $ | 1,166,212 | $ | 350,907 | $ | 518,706 | |||||||||
Investing activities | (307,302 | ) | (1,920,104 | ) | (1,253,317 | ) | (3,684,829 | ) | (2,130,360 | ) | |||||||||
Financing activities | (941,796 | ) | 157,852 | 138,033 | 3,334,051 | 1,376,767 | |||||||||||||
Balance sheet data: | |||||||||||||||||||
Total assets | $ | 9,976,946 | $ | 16,423,509 | $ | 16,504,964 | $ | 11,451,238 | $ | 7,928,854 | |||||||||
Current portion of long-term debt | 3,716,508 | — | 211,558 | — | — | ||||||||||||||
Long-term debt, net | 5,328,235 | 10,295,809 | 8,958,658 | 6,037,817 | 3,993,657 | ||||||||||||||
Unitholders’ capital (deficit) | (268,901 | ) | 4,543,605 | 5,891,427 | 4,427,180 | 3,428,910 | |||||||||||||
(1) | Net of payments made for commodity derivative premiums of approximately $583 million and $134 million for the years ended December 31, 2012, and December 31, 2011, respectively. |
42
Item 6. Selected Financial Data - Continued
At or for the Year Ended December 31, | ||||||||||||||
2015 | 2014 | 2013 | 2012 | 2011 | ||||||||||
Production data: | ||||||||||||||
Average daily production: | ||||||||||||||
Natural gas (MMcf/d) | 642 | 572 | 443 | 349 | 175 | |||||||||
Oil (MBbls/d) | 62.4 | 72.9 | 33.5 | 29.2 | 21.5 | |||||||||
NGL (MBbls/d) | 28.6 | 33.5 | 29.7 | 24.5 | 10.8 | |||||||||
Total (MMcfe/d) | 1,188 | 1,210 | 822 | 671 | 369 | |||||||||
Estimated proved reserves: (1) | ||||||||||||||
Natural gas (Bcf) | 2,619 | 4,255 | 3,010 | 2,571 | 1,675 | |||||||||
Oil (MMBbls) | 197 | 342 | 366 | 191 | 189 | |||||||||
NGL (MMBbls) | 114 | 166 | 200 | 179 | 94 | |||||||||
Total (Bcfe) | 4,488 | 7,304 | 6,403 | 4,796 | 3,370 | |||||||||
(1) | In accordance with Securities and Exchange Commission regulations, reserves were estimated using the average price during the 12-month period, determined as an unweighted average of the first-day-of-the-month price for each month, excluding escalations based upon future conditions. The average price used to estimate reserves is held constant over the life of the reserves. |
43
Item 7. Management’s Discussion and Analysis of Financial Condition and Results of Operations
The following discussion and analysis should be read in conjunction with the financial statements and related notes, which are included in this Annual Report on Form 10-K in Item 8. “Financial Statements and Supplementary Data.” The following discussion contains forward-looking statements based on expectations, estimates and assumptions. Actual results may differ materially from those discussed in the forward-looking statements. Factors that could cause or contribute to such differences include, but are not limited to, market prices for oil, natural gas and NGL, production volumes, estimates of proved reserves, capital expenditures, economic and competitive conditions, credit and capital market conditions, regulatory changes and other uncertainties, as well as those factors set forth in “Cautionary Statement Regarding Forward-Looking Statements” in Item 1. “Business” and in Item 1A. “Risk Factors.”
When referring to Linn Energy, LLC (“LINN Energy” or the “Company”), the intent is to refer to LINN Energy and its consolidated subsidiaries as a whole or on an individual basis, depending on the context in which the statements are made.
The reference to a “Note” herein refers to the accompanying Notes to Consolidated Financial Statements contained in Item 8. “Financial Statements and Supplementary Data.”
Executive Overview
LINN Energy’s mission is to acquire, develop and maximize cash flow from a growing portfolio of long-life oil and natural gas assets. LINN Energy is an independent oil and natural gas company that began operations in March 2003 and completed its initial public offering in January 2006. The Company’s properties are located in eight operating regions in the United States (“U.S.”):
• | Hugoton Basin, which includes properties located in Kansas, the Oklahoma Panhandle and the Shallow Texas Panhandle; |
• | Rockies, which includes properties located in Wyoming (Green River, Washakie and Powder River basins), Utah (Uinta Basin), North Dakota (Williston Basin) and Colorado (Piceance Basin); |
• | California, which includes properties located in the San Joaquin Valley and Los Angeles basins; |
• | TexLa, which includes properties located in east Texas and north Louisiana; |
• | Mid-Continent, which includes Oklahoma properties located in the Anadarko and Arkoma basins, as well as waterfloods in the Central Oklahoma Platform; |
• | Michigan/Illinois, which includes properties located in the Antrim Shale formation in north Michigan and oil properties in south Illinois; |
• | Permian Basin, which includes properties located in west Texas and southeast New Mexico; and |
• | South Texas. |
For a discussion of the Company’s eight operating regions, see Item 1 “Business.”
Results for the year ended December 31, 2015, included the following:
• | oil, natural gas and NGL sales of approximately $1.7 billion compared to $3.6 billion for 2014; |
• | average daily production of approximately 1,188 MMcfe/d compared to 1,210 MMcfe/d for 2014; |
• | net loss of approximately $4.8 billion compared to $452 million for 2014; |
• | net cash provided by operating activities of approximately $1.2 billion compared to $1.7 billion for 2014; |
• | capital expenditures, excluding acquisitions, of approximately $518 million compared to $1.6 billion for 2014; and |
• | 589 wells drilled (584 successful) compared to 918 wells drilled (917 successful) for 2014. |
Process to Explore Strategic Alternatives Related to the Company’s Capital Structure
In February 2016, the Company announced that it had initiated a process to explore strategic alternatives to strengthen its balance sheet and maximize the value of the Company. The Company’s Board of Directors and management are in the process of evaluating strategic alternatives to help provide the Company with financial stability, but no assurance can be given as to the outcome or timing of this process. The Company has retained Lazard as its financial advisor and Kirkland & Ellis LLP as its legal advisor to assist the Board of Directors and management team with the strategic review process.
44
Item 7. Management’s Discussion and Analysis of Financial Condition and Results of Operations - Continued
Going Concern Uncertainty
The Company’s liquidity outlook has changed since the third quarter of 2015 due to continued low commodity prices, which are expected to result in significantly lower levels of cash flow from operating activities in the future as the Company’s current commodity derivative contracts expire, and have limited the Company’s ability to access the capital markets. In addition, each of the Company’s Credit Facilities is subject to scheduled redeterminations of its borrowing base, semi-annually in April and October, based primarily on reserve reports using lender commodity price expectations at such time. Continued low commodity prices, reductions in the Company’s capital budget and the resulting reserve write-downs, along with the maturity schedule of the Company’s hedges, are expected to adversely impact the upcoming April redeterminations and will likely have a significant negative impact on the Company’s liquidity.
As a result of these and other factors, the following issues have adversely impacted the Company’s ability to continue as a going concern:
• | the Company’s ability to comply with financial covenants and ratios in its Credit Facilities and indentures has been affected by continued low commodity prices. Absent a waiver or amendment, failure to meet these covenants and ratios would result in a default and, to the extent the applicable lenders so elect, an acceleration of the Company’s existing indebtedness, causing such debt of approximately $3.6 billion to be immediately due and payable. Based on the Company’s current estimates and expectations for commodity prices in 2016, the Company does not expect to remain in compliance with all of the restrictive covenants contained in its Credit Facilities throughout 2016 unless those requirements are waived or amended. The Company does not currently have adequate liquidity to repay all of its outstanding debt in full if such debt were accelerated; |
• | because the Credit Facilities are effectively fully drawn, any reduction of the borrowing bases under the Company’s Credit Facilities would require mandatory prepayments to the extent existing indebtedness exceeds the new borrowing bases. The Company may not have sufficient cash on hand to be able to make any such mandatory prepayments; and |
• | the Company’s ability to make interest payments as they become due and repay indebtedness upon maturities (whether under existing terms or as a result of acceleration) is impacted by the Company’s liquidity. As of February 29, 2016, there was less than $1 million of available borrowing capacity under the Credit Facilities. |
The Company’s Board of Directors and management are in the process of evaluating strategic alternatives to help provide the Company with financial stability, but no assurance can be given as to the outcome or timing of this process.
The report of the Company’s independent registered public accounting firm that accompanies its audited consolidated financial statements in this Annual Report on Form 10-K contains an explanatory paragraph regarding the substantial doubt about the Company’s ability to continue as a going concern. The consolidated financial statements do not include any adjustments that might result from the outcome of the going concern uncertainty.
The Company’s Credit Facilities contain the requirement to deliver audited consolidated financial statements without a going concern or like qualification or exception. Consequently, as of the filing date, March 15, 2016, the Company is in default under the LINN Credit Facility. If the Company is unable to obtain a waiver or other suitable relief from the lenders under the LINN Credit Facility prior to the expiration of the 30 day grace period, an Event of Default (as defined in the applicable agreements) will result and the lenders holding a majority of the commitments under the LINN Credit Facility could accelerate the outstanding indebtedness, which would make it immediately due and payable. If the Company is unable to obtain a waiver from or otherwise reach an agreement with the lenders under the LINN Credit Facility and the indebtedness under the LINN Credit Facility is accelerated, then an Event of Default under LINN Energy’s senior notes and second lien notes would occur, which, if it continues beyond any applicable cure periods, would, to the extent the applicable lenders so elect, result in the acceleration of those obligations. Furthermore, an Event of Default under the LINN Credit Facility will also result in an Event of Default under the Berry Credit Facility, which in the absence of a waiver or other suitable relief and upon the election of the agent or lenders holding a majority of commitments under the Berry Credit Facility would result in the acceleration of indebtedness under the Berry Credit Facility. Such Event of Default would trigger an Event of Default under the Berry senior notes. If such Event of Default continues beyond any applicable cure periods, such Event of Default would result in an acceleration of the Berry senior notes.
45
Item 7. Management’s Discussion and Analysis of Financial Condition and Results of Operations - Continued
Additionally, the indenture governing the second lien notes (“Second Lien Indenture”) required the Company to deliver mortgages by February 18, 2016, subject to a 45 day grace period. The Company elected to exercise its right to the grace period and not deliver the mortgages, and as a result, the Company is currently in default under the Second Lien Indenture. If the Company does not deliver the mortgages within the 45 day grace period or is otherwise unable to obtain a waiver or other suitable relief from the holders under the Second Lien Indenture prior to the expiration of the 45 day grace period, an Event of Default (as defined in the Second Lien Indenture) will result and if the trustee or noteholders holding at least 25% in the aggregate outstanding principal amount of the second lien notes so elect would accelerate the second lien notes causing them to be immediately due and payable.
Furthermore, the Company has decided to defer making interest payments totaling approximately $60 million due March 15, 2016, including approximately $30 million on LINN Energy’s 7.75% senior notes due February 2021, approximately $12 million on LINN Energy’s 6.50% senior notes due September 2021 and approximately $18 million on Berry’s senior notes due September 2022, which will result in the Company being in default under these senior notes. The indentures governing each of the applicable series of notes permit the Company a 30 day grace period to make the interest payments. If the Company fails to make the interest payments within the grace period, or is otherwise unable to obtain a waiver or suitable relief from the holders of these senior notes, an Event of Default will result and if the trustee or noteholders holding at least 25% in the aggregate outstanding principal amount of each series of notes so elect would accelerate the notes causing them to be immediately due and payable.
An Event of Default under the Second Lien Indenture or any of the indentures governing the senior notes triggers a cross-default under the LINN Credit Facility and Berry Credit Facility and, as discussed above, if the applicable lenders so elect would result in acceleration under the LINN Credit Facility and Berry Credit Facility. In addition, as discussed above, an acceleration of the obligations under the Second Lien Indenture or LINN Credit Facility would trigger a cross-default to LINN Energy’s senior notes and if the applicable lenders so elect would result in a cross-acceleration under LINN Energy’s senior notes, and an acceleration of the Berry Credit Facility if the applicable lenders so elect would result in cross-acceleration under the Berry senior notes.
If lenders, and subsequently noteholders, accelerate the Company’s outstanding indebtedness, it will become immediately due and payable and the Company will not have sufficient liquidity to repay those amounts. If the Company is unable to reach an agreement with its creditors prior to any of the above described accelerations, the Company could be required to immediately file for protection under Chapter 11 of the U.S. Bankruptcy Code.
The Company is currently in discussions with various stakeholders and is pursuing or considering a number of actions including: (i) obtaining additional sources of capital from asset sales, private issuances of equity or equity-linked securities, debt for equity swaps, or any combination thereof; (ii) pursuing in- and out-of-court restructuring transactions; (iii) obtaining waivers or amendments from its lenders; and (iv) continuing to minimize its capital expenditures, reduce costs and maximize cash flows from operations. There can be no assurance that sufficient liquidity can be obtained from one or more of these actions or that these actions can be consummated within the period needed.
Reduction and Suspension of Distribution
In January 2015, the Company reduced its distribution to $1.25 per unit, from the previous level of $2.90 per unit, on an annualized basis. Monthly distributions were paid by the Company through September 2015. In October 2015, following the recommendation from management, the Company’s Board of Directors determined to suspend payment of the Company’s distribution and reserve any excess cash that would otherwise be available for distribution. The Company’s Board of Directors and management believe the suspension to be in the best long-term interest of all Company stakeholders. The Company’s Board of Directors will continue to evaluate the Company’s ability to reinstate the distribution. For additional information, see “Distribution Practices” below.
2016 Oil and Natural Gas Capital Budget
For 2016, the Company estimates its total capital expenditures, excluding acquisitions, will be approximately $340 million, including approximately $250 million related to its oil and natural gas capital program and approximately $75 million related to its plant and pipeline capital. The 2016 budget contemplates continued low commodity prices and is under continuous review and subject to ongoing adjustments. The Company expects to fund its capital expenditures primarily from net cash
46
Item 7. Management’s Discussion and Analysis of Financial Condition and Results of Operations - Continued
provided by operating activities; however, there is uncertainty regarding the Company’s liquidity as discussed above. In addition, at this level of capital spending, the Company expects its total reserves to decline.
Alliance with GSO Capital Partners
The Company signed definitive agreements dated June 30, 2015, with affiliates of private capital investor GSO Capital Partners LP (“GSO”), the credit platform of The Blackstone Group L.P., to fund oil and natural gas development (“DrillCo”). Funds managed by GSO have agreed to commit up to $500 million with 5-year availability to fund drilling programs on locations provided by LINN Energy. Subject to adjustments depending on asset characteristics and return expectations of the selected drilling plan, GSO will fund 100% of the costs associated with new wells drilled under the DrillCo agreement and is expected to receive an 85% working interest in these wells until it achieves a 15% internal rate of return on annual groupings of wells, while LINN Energy is expected to receive a 15% carried working interest during this period. Upon reaching the internal rate of return target, GSO’s interest will be reduced to 5%, while LINN Energy’s interest will increase to 95%. As of December 31, 2015, no development activities had been funded under the agreement.
Alliance with Quantum Energy Partners
The Company signed definitive agreements dated June 30, 2015, with affiliates of private capital investor Quantum Energy Partners to fund selected future oil and natural gas acquisitions and the development of those acquired assets (“AcqCo”). See the Company’s Current Report on Form 8-K filed on July 7, 2015, for additional details regarding these agreements.
Divestiture
On August 31, 2015, the Company, through certain of its wholly owned subsidiaries, completed the sale of its remaining position in Howard County in the Permian Basin (“Howard County Assets Sale”). Cash proceeds received from the sale of these properties were approximately $276 million. The Company used the net proceeds from the sale to repay a portion of the outstanding indebtedness under the LINN Credit Facility.
Financing Activities
In February 2016, the Company borrowed approximately $919 million under the LINN Credit Facility, which represented the remaining undrawn amount that was available under the LINN Credit Facility, the proceeds of which were deposited in an unencumbered account with a bank that is not a lender under either the LINN or Berry Credit Facility. These funds are intended to be used for general corporate purposes. As of February 29, 2016, total borrowings (including outstanding letters of credit) under the LINN Credit Facility were $3.6 billion with no remaining availability. Total borrowings under the Berry Credit Facility were approximately $899 million with less than $1 million available.
In November 2015, the Company entered into separate, privately-negotiated, exchange agreements (“Exchange Agreements”) with certain holders of the Company’s outstanding 6.50% senior notes due May 2019, 6.25% senior notes due November 2019, 8.625% senior notes due April 2020, 7.75% senior notes due February 2021 and 6.50% senior notes due September 2021 (“Exchanged Notes”). The Exchange Agreements provided that the Company issue $1.0 billion in aggregate principal amount of new 12.00% senior secured second lien notes due December 2020 (“Second Lien Notes”) in exchange for approximately $2.0 billion in aggregate principal amount of the Company’s Exchanged Notes held by such holders.
In addition, during the year ended December 31, 2015, the Company repurchased at a discount, through privately negotiated transactions and on the open market, approximately $992 million of its outstanding senior notes.
The spring 2015 semi-annual borrowing base redeterminations of the Company’s Credit Facilities, as defined in Note 6, were completed in May 2015 and, as a result of lower commodity prices, the borrowing base under the LINN Credit Facility decreased from $4.5 billion to $4.05 billion and the borrowing base under the Berry Credit Facility decreased from $1.4 billion to $1.2 billion, including $250 million posted as restricted cash (discussed below). The fall 2015 semi-annual redeterminations were completed in October 2015 and the borrowing base under the LINN Credit Facility was reaffirmed at $4.05 billion, subject to certain conditions being met on or before January 1, 2016, and the borrowing base under the Berry Credit Facility decreased from $1.2 billion to $900 million, including the $250 million of restricted cash. In connection with the reduction in Berry’s borrowing base in October 2015, Berry repaid $300 million of borrowings outstanding under the
47
Item 7. Management’s Discussion and Analysis of Financial Condition and Results of Operations - Continued
Berry Credit Facility. The borrowing base under the LINN Credit Facility automatically decreased to $3.6 billion on January 1, 2016, since certain conditions were not met. Also, in October 2015, LINN Energy and Berry each entered into an amendment to its Credit Facility.
Continued low commodity prices, reductions in the Company’s capital budget and the resulting reserve write-downs, along with the maturity schedule of the Company’s hedges, are expected to adversely impact future redeterminations.
In connection with the reduction in Berry’s borrowing base in May 2015, LINN Energy borrowed $250 million under the LINN Credit Facility and contributed it to Berry to post as restricted cash with Berry’s lenders. As directed by LINN Energy, the $250 million was deposited on Berry’s behalf in a security account with the administrative agent subject to a security control agreement. Berry’s ability to withdraw funds from this account is subject to a concurrent reduction of the borrowing base under the Berry Credit Facility or lender’s consent in connection with a redetermination of such borrowing base. The $250 million may be used to satisfy obligations under the Berry Credit Facility or, subject to restrictions in the indentures governing Berry’s senior notes, may be returned to LINN Energy in the future.
See Note 6 for additional details about the Company’s debt.
During the year ended December 31, 2015, the Company, under its equity distribution agreement, sold 3,621,983 units representing limited liability company interests at an average price of $12.37 per unit for net proceeds of approximately $44 million (net of approximately $448,000 in commissions). The Company used the net proceeds for general corporate purposes, including the open market repurchases of a portion of its senior notes (see Note 6). At December 31, 2015, units totaling approximately $455 million in aggregate offering price remained available to be sold under the agreement.
In May 2015, the Company sold 16,000,000 units representing limited liability company interests in an underwritten public offering at $11.79 per unit ($11.32 per unit, net of underwriting discount) for net proceeds of approximately $181 million (after underwriting discount and offering costs of approximately $8 million). The Company used the net proceeds from the sale of these units to repay a portion of the outstanding indebtedness under the LINN Credit Facility.
Commodity Derivatives
During the year ended December 31, 2015, the Company entered into commodity derivative contracts consisting of natural gas basis swaps for May 2015 through December 2017 to hedge exposure to differentials in certain producing areas and oil swaps for April 2015 through December 2015. In addition, the Company entered into natural gas basis swaps for May 2015 through December 2016 to hedge exposure to the differential in California, where it consumes natural gas in its heavy oil development operations.
During the fourth quarter of 2015, the Company canceled certain of its commodity derivative contracts, consisting of Permian basis swaps for 2016 and 2017, trade month roll swaps for 2016 and 2017, and positions representing oil swaps which could have been extended at counterparty election for 2017. The Company received net cash settlements of approximately $5 million from the cancellations.
48
Item 7. Management’s Discussion and Analysis of Financial Condition and Results of Operations - Continued
Results of Operations
Year Ended December 31, 2015, Compared to Year Ended December 31, 2014
Year Ended December 31, | |||||||||||
2015 | 2014 | Variance | |||||||||
(in thousands) | |||||||||||
Revenues and other: | |||||||||||
Natural gas sales | $ | 602,688 | $ | 894,043 | $ | (291,355 | ) | ||||
Oil sales | 983,337 | 2,295,491 | (1,312,154 | ) | |||||||
NGL sales | 140,246 | 421,005 | (280,759 | ) | |||||||
Total oil, natural gas and NGL sales | 1,726,271 | 3,610,539 | (1,884,268 | ) | |||||||
Gains on oil and natural gas derivatives | 1,056,189 | 1,206,179 | (149,990 | ) | |||||||
Marketing and other revenues | 100,874 | 166,585 | (65,711 | ) | |||||||
2,883,334 | 4,983,303 | (2,099,969 | ) | ||||||||
Expenses: | |||||||||||
Lease operating expenses | 617,764 | 805,164 | (187,400 | ) | |||||||
Transportation expenses | 219,721 | 207,331 | 12,390 | ||||||||
Marketing expenses | 57,144 | 117,465 | (60,321 | ) | |||||||
General and administrative expenses (1) | 296,887 | 293,073 | 3,814 | ||||||||
Exploration costs | 9,473 | 125,037 | (115,564 | ) | |||||||
Depreciation, depletion and amortization | 805,757 | 1,073,902 | (268,145 | ) | |||||||
Impairment of long-lived assets | 5,813,954 | 2,303,749 | 3,510,205 | ||||||||
Taxes, other than income taxes | 181,895 | 267,403 | (85,508 | ) | |||||||
Gains on sale of assets and other, net | (197,409 | ) | (366,500 | ) | 169,091 | ||||||
7,805,186 | 4,826,624 | 2,978,562 | |||||||||
Other income and (expenses) | 155,580 | (604,051 | ) | 759,631 | |||||||
Loss before income taxes | (4,766,272 | ) | (447,372 | ) | (4,318,900 | ) | |||||
Income tax expense (benefit) | (6,461 | ) | 4,437 | (10,898 | ) | ||||||
Net loss | $ | (4,759,811 | ) | $ | (451,809 | ) | $ | (4,308,002 | ) | ||
(1) | General and administrative expenses for the years ended December 31, 2015, and December 31, 2014, include approximately $47 million and $45 million, respectively, of noncash unit-based compensation expenses. |
49
Item 7. Management’s Discussion and Analysis of Financial Condition and Results of Operations - Continued
Year Ended December 31, | ||||||||||
2015 | 2014 | Variance | ||||||||
Average daily production: | ||||||||||
Natural gas (MMcf/d) | 642 | 572 | 12 | % | ||||||
Oil (MBbls/d) | 62.4 | 72.9 | (14 | )% | ||||||
NGL (MBbls/d) | 28.6 | 33.5 | (15 | )% | ||||||
Total (MMcfe/d) | 1,188 | 1,210 | (2 | )% | ||||||
Weighted average prices: (1) | ||||||||||
Natural gas (Mcf) | $ | 2.57 | $ | 4.29 | (40 | )% | ||||
Oil (Bbl) | $ | 43.16 | $ | 86.28 | (50 | )% | ||||
NGL (Bbl) | $ | 13.45 | $ | 34.40 | (61 | )% | ||||
Average NYMEX prices: | ||||||||||
Natural gas (MMBtu) | $ | 2.66 | $ | 4.41 | (40 | )% | ||||
Oil (Bbl) | $ | 48.80 | $ | 93.00 | (48 | )% | ||||
Costs per Mcfe of production: | ||||||||||
Lease operating expenses | $ | 1.42 | $ | 1.82 | (22 | )% | ||||
Transportation expenses | $ | 0.51 | $ | 0.47 | 9 | % | ||||
General and administrative expenses (2) | $ | 0.68 | $ | 0.66 | 3 | % | ||||
Depreciation, depletion and amortization | $ | 1.86 | $ | 2.43 | (23 | )% | ||||
Taxes, other than income taxes | $ | 0.42 | $ | 0.61 | (31 | )% | ||||
(1) | Does not include the effect of gains (losses) on derivatives. |
(2) | General and administrative expenses for the years ended December 31, 2015, and December 31, 2014, include approximately $47 million and $45 million, respectively, of noncash unit-based compensation expenses. |
50
Item 7. Management’s Discussion and Analysis of Financial Condition and Results of Operations - Continued
Revenues and Other
Oil, Natural Gas and NGL Sales
Oil, natural gas and NGL sales decreased by approximately $1.9 billion or 52% to approximately $1.7 billion for the year ended December 31, 2015, from approximately $3.6 billion for the year ended December 31, 2014, due to lower oil, natural gas and NGL prices and lower production volumes. Lower oil, natural gas and NGL prices resulted in a decrease in revenues of approximately $982 million, $402 million and $218 million, respectively.
Average daily production volumes decreased to approximately 1,188 MMcfe/d for the year ended December 31, 2015, from approximately 1,210 MMcfe/d for the year ended December 31, 2014. Lower oil and NGL production volumes resulted in a decrease in revenues of approximately $330 million and $62 million, respectively. Higher natural gas production volumes resulted in an increase in revenues of approximately $110 million.
The following table sets forth average daily production by region:
Year Ended December 31, | |||||||||||
2015 | 2014 | Variance | |||||||||
Average daily production (MMcfe/d): | |||||||||||
Rockies | 426 | 318 | 108 | 34 | % | ||||||
Hugoton Basin | 252 | 188 | 64 | 35 | % | ||||||
California | 185 | 171 | 14 | 8 | % | ||||||
Mid-Continent | 100 | 287 | (187 | ) | (65 | )% | |||||
TexLa | 82 | 48 | 34 | 70 | % | ||||||
Permian Basin | 80 | 153 | (73 | ) | (48 | )% | |||||
South Texas | 32 | 12 | 20 | 172 | % | ||||||
Michigan/Illinois | 31 | 33 | (2 | ) | (5 | )% | |||||
1,188 | 1,210 | (22 | ) | (2 | )% | ||||||
The increase in average daily production volumes in the Rockies region primarily reflects the impact of the acquisition of properties from subsidiaries of Devon Energy Corporation (“Devon” and the acquisition, the “Devon Assets Acquisition”) on August 29, 2014, and development capital spending. The increase in average daily production volumes in the Hugoton Basin region primarily reflects the impact of the properties received in the exchange with Exxon Mobil Corporation and its affiliates, including its wholly owned subsidiary XTO Energy Inc. (“Exxon XTO”) on August 15, 2014, and the acquisition of properties from Pioneer Natural Resources Company (“Pioneer” and the acquisition, the “Pioneer Assets Acquisition”) on September 11, 2014. The increase in average daily production volumes in the California region primarily reflects the impact of the properties received in the exchange with Exxon Mobil Corporation (“ExxonMobil”) on November 21, 2014, and development capital spending. The decrease in average daily production volumes in the Mid-Continent region primarily reflects lower production volumes as a result of the properties sold to privately held institutional affiliates of EnerVest, Ltd. and its joint venture partner FourPoint Energy, LLC (“Granite Wash Assets Sale”) on December 15, 2014, partially offset by the impact of the Devon Assets Acquisition. The increase in average daily production volumes in the TexLa region primarily reflects the impact of the Devon Assets Acquisition. The decrease in average daily production volumes in the Permian Basin region primarily reflects lower production volumes as a result of the properties relinquished in the two exchanges with Exxon XTO and ExxonMobil, the properties sold to Fleur de Lis Energy, LLC (“Permian Basin Assets Sale”) on November 14, 2014, and the Howard County Assets Sale on August 31, 2015. The increase in average daily production volumes in the South Texas region reflects the full year impact of the Devon Assets Acquisition. The decrease in average daily production volumes in the Michigan/Illinois region primarily reflects a low-decline asset base with minimal development capital spending.
Gains (Losses) on Oil and Natural Gas Derivatives
Gains on oil and natural gas derivatives were approximately $1.1 billion and $1.2 billion for the years ended December 31, 2015, and December 31, 2014, respectively, representing a decrease of approximately $150 million. Gains on oil and natural gas derivatives decreased primarily due to changes in fair value of the derivative contracts. The results for 2015 and 2014 also include cash settlements of approximately $5 million and $12 million, respectively, related to canceled derivatives
51
Item 7. Management’s Discussion and Analysis of Financial Condition and Results of Operations - Continued
contracts. In addition, the results for 2015 and 2014 include gains of approximately $4 million and $7 million, respectively, related to the recoveries of a bankruptcy claim (see Note 11). The fair value on unsettled derivatives contracts changes as future commodity price expectations change compared to the contract prices on the derivatives. If the expected future commodity prices increase compared to the contract prices on the derivatives, losses are recognized; and if the expected future commodity prices decrease compared to the contract prices on the derivatives, gains are recognized.
During the year ended December 31, 2015, the Company had commodity derivative contracts for approximately 81% of its natural gas production and 83% of its oil production. During the year ended December 31, 2014, the Company had commodity derivative contracts for approximately 85% of its natural gas production and 94% of its oil production. The Company does not hedge the portion of natural gas production used to economically offset natural gas consumption related to its heavy oil development operations in California.
The Company determines the fair value of its oil and natural gas derivatives utilizing pricing models that use a variety of techniques, including market quotes and pricing analysis. See Item 7A. “Quantitative and Qualitative Disclosures About Market Risk” and Note 7 and Note 8 for additional details about the Company’s commodity derivatives. For information about the Company’s credit risk related to derivative contracts, see “Counterparty Credit Risk” under “Liquidity and Capital Resources” below.
Marketing and Other Revenues
Marketing revenues represent third-party activities associated with company-owned gathering systems, plants and facilities. Marketing and other revenues decreased by approximately $66 million or 39% to approximately $101 million for the year ended December 31, 2015, from approximately $167 million for the year ended December 31, 2014. The decrease was primarily due to lower revenues generated by the Jayhawk natural gas processing plant in Kansas, principally driven by a change in contract terms, lower electricity sales revenues generated by the Company’s California cogeneration facilities and the impact of properties sold during the fourth quarter of 2014, partially offset by higher helium sales revenue in the Hugoton Basin.
Expenses
Lease Operating Expenses
Lease operating expenses include expenses such as labor, field office, vehicle, supervision, maintenance, tools and supplies, and workover expenses. Lease operating expenses decreased by approximately $187 million or 23% to approximately $618 million for the year ended December 31, 2015, from approximately $805 million for the year ended December 31, 2014. The decrease was primarily due to cost savings initiatives, lower costs as a result of the properties sold during the fourth quarter of 2014 and a decrease in steam costs caused by lower prices for natural gas used in steam generation, partially offset by costs associated with properties acquired during the third quarter of 2014. Lease operating expenses per Mcfe also decreased to $1.42 per Mcfe for the year ended December 31, 2015, from $1.82 per Mcfe for the year ended December 31, 2014.
Transportation Expenses
Transportation expenses increased by approximately $13 million or 6% to approximately $220 million for the year ended December 31, 2015, from approximately $207 million for the year ended December 31, 2014. The increase was primarily due to costs associated with properties acquired during the third quarter of 2014 partially offset by lower costs as a result of the properties sold during the fourth quarter of 2014. Transportation expenses per Mcfe also increased to $0.51 per Mcfe for the year ended December 31, 2015, from $0.47 per Mcfe for the year ended December 31, 2014.
Marketing Expenses
Marketing expenses represent third-party activities associated with company-owned gathering systems, plants and facilities. Marketing expenses decreased by approximately $60 million or 51% to approximately $57 million for the year ended December 31, 2015, from approximately $117 million for the year ended December 31, 2014. The decrease was primarily due to lower expenses associated with the Jayhawk natural gas processing plant in Kansas, principally driven by a change in contract terms, and lower electricity generation expenses incurred by the Company’s California cogeneration facilities.
General and Administrative Expenses
General and administrative expenses are costs not directly associated with field operations and reflect the costs of employees including executive officers, related benefits, office leases and professional fees. General and administrative expenses
52
Item 7. Management’s Discussion and Analysis of Financial Condition and Results of Operations - Continued
increased by approximately $4 million or 1% to approximately $297 million for the year ended December 31, 2015, from approximately $293 million for the year ended December 31, 2014. The increase was primarily due to higher advisory fees related to the alliance agreements partially offset by lower acquisition expenses. General and administrative expenses per Mcfe also increased to $0.68 per Mcfe for the year ended December 31, 2015, from $0.66 per Mcfe for the year ended December 31, 2014.
Exploration Costs
Exploration costs decreased by approximately $116 million to approximately $9 million for the year ended December 31, 2015, from approximately $125 million for the year ended December 31, 2014. The decrease was primarily due to lower leasehold impairment expenses on unproved properties.
Depreciation, Depletion and Amortization
Depreciation, depletion and amortization decreased by approximately $268 million or 25% to approximately $806 million for the year ended December 31, 2015, from approximately $1.1 billion for the year ended December 31, 2014. The decrease was primarily due to the divestitures of properties in 2014 with higher rates compared to the rates of properties acquired in 2014, lower rates as a result of the impairments recorded in the prior year and the first and third quarters of 2015, and lower total production volumes. Depreciation, depletion and amortization per Mcfe also decreased to $1.86 per Mcfe for the year ended December 31, 2015, from $2.43 per Mcfe for the year ended December 31, 2014. As a result of the uncertainty regarding the Company’s future commitment to capital, the Company reclassified all of its proved undeveloped reserves to unproved as of December 31, 2015, which may impact depletion in the future.
Impairment of Long-Lived Assets
The Company recorded the following noncash impairment charges (before and after tax) associated with proved and unproved oil and natural gas properties:
Year Ended December 31, | |||||||
2015 | 2014 | ||||||
(in thousands) | |||||||
Rockies region | $ | 1,758,939 | $ | 585,705 | |||
Hugoton Basin region | 1,667,768 | — | |||||
California region | 537,511 | 22 | |||||
TexLa region | 430,859 | 4,836 | |||||
Mid-Continent region | 405,370 | 244,413 | |||||
Permian Basin region | 71,990 | 1,337,444 | |||||
South Texas region | 42,433 | 131,329 | |||||
Proved oil and natural gas properties | 4,914,870 | 2,303,749 | |||||
TexLa region | 416,846 | — | |||||
Permian Basin region | 226,922 | — | |||||
Rockies region | 184,137 | — | |||||
California region | 71,179 | — | |||||
Unproved oil and natural gas properties | 899,084 | — | |||||
Impairment of long-lived assets | $ | 5,813,954 | $ | 2,303,749 | |||
The impairment charges in 2015 were due to a decline in commodity prices, changes in expected capital development and a decline in the Company’s estimates of proved reserves. The impairment charges in 2014 include approximately $1.7 billion due to a steep decline in commodity prices during the fourth quarter of 2014 and approximately $603 million due to the divestiture of certain high valued unproved properties in the Midland Basin in which the expected cash flows were previously included in the impairment assessment for proved oil and natural gas properties.
53
Item 7. Management’s Discussion and Analysis of Financial Condition and Results of Operations - Continued
Subsequent to December 31, 2015, the prices of oil, natural gas and NGL have continued to be volatile. In the future, if forward price curves continue to decline, the Company may have additional impairments which could have a material impact on its results of operations.
(Gains) Losses on Sale of Assets and Other, Net
During the year ended December 31, 2015, the Company recorded a net gain of approximately $177 million, including costs to sell of approximately $1 million, on the Howard County Assets Sale. During the year ended December 31, 2014, the Company recorded the following net gains and losses on divestitures and exchanges of properties:
• | Net gain of approximately $294 million, including costs to sell of approximately $10 million, on the Granite Wash Assets Sale; |
• | Net loss of approximately $28 million, including costs to sell of approximately $2 million, on the Permian Basin Assets Sale; |
• | Net gain of approximately $20 million, including costs to sell of approximately $3 million, on the noncash exchange of a portion of its Permian Basin properties to ExxonMobil for properties in California’s South Belridge Field; |
• | Net gain of approximately $65 million, including costs to sell of approximately $3 million, on the noncash exchange of a portion of its Permian Basin properties to Exxon XTO, for properties in the Hugoton Basin; and |
• | Net gain of approximately $36 million on the sale of the Company’s interests in certain non-producing oil and natural gas properties located in the Mid-Continent region. |
See Note 2 for additional details of divestitures and exchanges of properties.
Taxes, Other Than Income Taxes
Year Ended December 31, | |||||||||||
2015 | 2014 | Variance | |||||||||
(in thousands) | |||||||||||
Severance taxes | $ | 62,000 | $ | 133,933 | $ | (71,933 | ) | ||||
Ad valorem taxes | 99,368 | 114,955 | (15,587 | ) | |||||||
California carbon allowances | 20,573 | 18,212 | 2,361 | ||||||||
Other | (46 | ) | 303 | (349 | ) | ||||||
$ | 181,895 | $ | 267,403 | $ | (85,508 | ) | |||||
Taxes, other than income taxes decreased by approximately $86 million or 32% for the year ended December 31, 2015, compared to the year ended December 31, 2014. Severance taxes, which are a function of revenues generated from production, decreased primarily due to lower oil, natural gas and NGL prices and lower production volumes. Ad valorem taxes, which are based on the value of reserves and production equipment and vary by location, decreased primarily due to a lower estimated valuation on certain of the Company’s properties, partially offset by acquisitions completed during the third quarter of 2014. California carbon allowances increased primarily due to an increase in estimated emissions for which credits are needed and higher costs for acquired allowances.
Other Income and (Expenses)
Year Ended December 31, | |||||||||||
2015 | 2014 | Variance | |||||||||
(in thousands) | |||||||||||
Interest expense, net of amounts capitalized | $ | (546,453 | ) | $ | (587,838 | ) | $ | 41,385 | |||
Gain on extinguishment of debt | 719,259 | — | 719,259 | ||||||||
Other, net | (17,226 | ) | (16,213 | ) | (1,013 | ) | |||||
$ | 155,580 | $ | (604,051 | ) | $ | 759,631 | |||||
54
Item 7. Management’s Discussion and Analysis of Financial Condition and Results of Operations - Continued
Other income and (expenses) decreased by approximately $760 million for the year ended December 31, 2015, compared to the year ended December 31, 2014. Interest expense decreased primarily due to lower outstanding debt during the period and lower amortization of financing fees and expenses primarily related to the bridge loan and term loan that were repaid during 2014 and senior notes that were repurchased during 2015, partially offset by a decrease in capitalized interest. In addition, for the year ended December 31, 2015, the Company recorded a gain on extinguishment of debt of approximately $719 million as a result of the repurchases of a portion of its senior notes and the exchange of Exchanged Notes for the Second Lien Notes. See “Debt” under “Liquidity and Capital Resources” below for additional details. Other expenses increased during 2015 primarily due to write-offs of deferred financing fees related to the Credit Facilities.
Income Tax Expense (Benefit)
The Company is a limited liability company treated as a partnership for federal and state income tax purposes, with the exception of the state of Texas, in which income tax liabilities and/or benefits of the Company are passed through to its unitholders. Limited liability companies are subject to Texas margin tax. In addition, certain of the Company’s subsidiaries are Subchapter C-corporations subject to federal and state income taxes. The Company recognized an income tax benefit of approximately $6 million for the year ended December 31, 2015, compared to income tax expense of approximately $4 million for the year ended December 31, 2014. The income tax benefit was primarily due to lower income from the Company’s taxable subsidiaries in 2015 compared to 2014.
Net Loss
Net loss increased by approximately $4.3 billion to approximately $4.8 billion for the year ended December 31, 2015, from approximately $452 million for the year ended December 31, 2014. The increase was primarily due to higher impairment charges, lower production revenues and lower gains on oil and natural gas derivatives, partially offset by the gain on extinguishment of debt and lower expenses, including interest. See discussion above for explanations of variances.
55
Item 7. Management’s Discussion and Analysis of Financial Condition and Results of Operations - Continued
Results of Operations
Year Ended December 31, 2014, Compared to Year Ended December 31, 2013
Year Ended December 31, | |||||||||||
2014 | 2013 | Variance | |||||||||
(in thousands) | |||||||||||
Revenues and other: | |||||||||||
Natural gas sales | $ | 894,043 | $ | 585,501 | $ | 308,542 | |||||
Oil sales | 2,295,491 | 1,152,213 | 1,143,278 | ||||||||
NGL sales | 421,005 | 335,526 | 85,479 | ||||||||
Total oil, natural gas and NGL sales | 3,610,539 | 2,073,240 | 1,537,299 | ||||||||
Gains on oil and natural gas derivatives | 1,206,179 | 177,857 | 1,028,322 | ||||||||
Marketing and other revenues | 166,585 | 80,558 | 86,027 | ||||||||
4,983,303 | 2,331,655 | 2,651,648 | |||||||||
Expenses: | |||||||||||
Lease operating expenses | 805,164 | 372,523 | 432,641 | ||||||||
Transportation expenses | 207,331 | 128,440 | 78,891 | ||||||||
Marketing expenses | 117,465 | 37,892 | 79,573 | ||||||||
General and administrative expenses (1) | 293,073 | 236,271 | 56,802 | ||||||||
Exploration costs | 125,037 | 5,251 | 119,786 | ||||||||
Depreciation, depletion and amortization | 1,073,902 | 829,311 | 244,591 | ||||||||
Impairment of long-lived assets | 2,303,749 | 828,317 | 1,475,432 | ||||||||
Taxes, other than income taxes | 267,403 | 138,631 | 128,772 | ||||||||
(Gains) losses on sale of assets and other, net | (366,500 | ) | 13,637 | (380,137 | ) | ||||||
4,826,624 | 2,590,273 | 2,236,351 | |||||||||
Other income and (expenses) | (604,051 | ) | (434,918 | ) | (169,133 | ) | |||||
Loss before income taxes | (447,372 | ) | (693,536 | ) | 246,164 | ||||||
Income tax expense (benefit) | 4,437 | (2,199 | ) | 6,636 | |||||||
Net loss | $ | (451,809 | ) | $ | (691,337 | ) | $ | 239,528 | |||
(1) | General and administrative expenses for the years ended December 31, 2014, and December 31, 2013, include approximately $45 million and $37 million, respectively, of noncash unit-based compensation expenses. |
56
Item 7. Management’s Discussion and Analysis of Financial Condition and Results of Operations - Continued
Year Ended December 31, | ||||||||||
2014 | 2013 | Variance | ||||||||
Average daily production: | ||||||||||
Natural gas (MMcf/d) | 572 | 443 | 29 | % | ||||||
Oil (MBbls/d) | 72.9 | 33.5 | 118 | % | ||||||
NGL (MBbls/d) | 33.5 | 29.7 | 13 | % | ||||||
Total (MMcfe/d) | 1,210 | 822 | 47 | % | ||||||
Weighted average prices: (1) | ||||||||||
Natural gas (Mcf) | $ | 4.29 | $ | 3.62 | 19 | % | ||||
Oil (Bbl) | $ | 86.28 | $ | 94.15 | (8 | )% | ||||
NGL (Bbl) | $ | 34.40 | $ | 30.96 | 11 | % | ||||
Average NYMEX prices: | ||||||||||
Natural gas (MMBtu) | $ | 4.41 | $ | 3.65 | 21 | % | ||||
Oil (Bbl) | $ | 93.00 | $ | 97.97 | (5 | )% | ||||
Costs per Mcfe of production: | ||||||||||
Lease operating expenses | $ | 1.82 | $ | 1.24 | 47 | % | ||||
Transportation expenses | $ | 0.47 | $ | 0.43 | 9 | % | ||||
General and administrative expenses (2) | $ | 0.66 | $ | 0.79 | (16 | )% | ||||
Depreciation, depletion and amortization | $ | 2.43 | $ | 2.76 | (12 | )% | ||||
Taxes, other than income taxes | $ | 0.61 | $ | 0.46 | 33 | % | ||||
(1) | Does not include the effect of gains (losses) on derivatives. |
(2) | General and administrative expenses for the years ended December 31, 2014, and December 31, 2013, include approximately $45 million and $37 million, respectively, of noncash unit-based compensation expenses. |
57
Item 7. Management’s Discussion and Analysis of Financial Condition and Results of Operations - Continued
Revenues and Other
Oil, Natural Gas and NGL Sales
Oil, natural gas and NGL sales increased by approximately $1.5 billion or 74% to approximately $3.6 billion for the year ended December 31, 2014, from approximately $2.1 billion for the year ended December 31, 2013, due to higher production volumes and higher natural gas and NGL prices partially offset by lower oil prices. Higher natural gas and NGL prices resulted in an increase in revenues of approximately $138 million and $42 million, respectively. Lower oil prices resulted in a decrease in revenues of approximately $209 million.
Average daily production volumes increased to approximately 1,210 MMcfe/d for the year ended December 31, 2014, from approximately 822 MMcfe/d for the year ended December 31, 2013. Higher oil, natural gas and NGL production volumes resulted in an increase in revenues of approximately $1.4 billion, $171 million and $43 million, respectively.
The following table sets forth average daily production by region:
Year Ended December 31, | |||||||||||
2014 | 2013 | Variance | |||||||||
Average daily production (MMcfe/d): | |||||||||||
Rockies | 318 | 187 | 131 | 71 | % | ||||||
Mid-Continent | 287 | 330 | (43 | ) | (13 | )% | |||||
Hugoton Basin | 188 | 143 | 45 | 31 | % | ||||||
California | 171 | 19 | 152 | 824 | % | ||||||
Permian Basin | 153 | 87 | 66 | 76 | % | ||||||
TexLa | 48 | 22 | 26 | 122 | % | ||||||
Michigan/Illinois | 33 | 34 | (1 | ) | (3 | )% | |||||
South Texas | 12 | — | 12 | — | |||||||
1,210 | 822 | 388 | 47 | % | |||||||
The increase in average daily production volumes in the Rockies region primarily reflects the impact of the Berry acquisition in December 2013, the Devon Assets Acquisition on August 29, 2014, and development capital spending. The decrease in average daily production volumes in the Mid-Continent region primarily reflects lower development capital spending in the Granite Wash and lower production volumes as a result of the properties sold in the Granite Wash Assets Sale on December 15, 2014, partially offset by the impact of the Devon Assets Acquisition. The increase in average daily production volumes in the Hugoton Basin region primarily reflects the impact of the properties received in the exchange with Exxon XTO on August 15, 2014, the Pioneer Assets Acquisition on September 11, 2014, and development capital spending. The increase in average daily production volumes in the California region primarily reflects the impact of the Berry acquisition and the impact of the properties received in the exchange with ExxonMobil on November 21, 2014. The increase in average daily production volumes in the Permian Basin region primarily reflects the impact of an acquisition in October 2013, the Berry acquisition and development capital spending, partially offset by lower production volumes as a result of the properties relinquished in the two exchanges with Exxon XTO and ExxonMobil and the Permian Basin Assets Sale on November 14, 2014. The increase in average daily production volumes in the TexLa region primarily reflects the impact of the Berry acquisition and the Devon Assets Acquisition. The Michigan/Illinois region consists of a low-decline asset base and continues to produce at consistent levels. Average daily production volumes in the South Texas region reflect the impact of the Devon Assets Acquisition.
Gains (Losses) on Oil and Natural Gas Derivatives
Gains on oil and natural gas derivatives were approximately $1.2 billion and $178 million for the years ended December 31, 2014, and December 31, 2013, respectively, representing an increase of $1.0 billion. Gains on oil and natural gas derivatives increased primarily due to changes in fair value on unsettled derivative contracts. The results for 2014 also include cash settlements of approximately $12 million related to canceled derivatives contracts. In addition, the results for 2014 and 2013 include gains of approximately $7 million and $11 million, respectively, related to the recoveries of a bankruptcy claim (see Note 11). The fair value on unsettled derivatives contracts changes as future commodity price expectations change compared to the contract prices on the derivatives. If the expected future commodity prices increase compared to the contract prices on
58
Item 7. Management’s Discussion and Analysis of Financial Condition and Results of Operations - Continued
the derivatives, losses are recognized; and if the expected future commodity prices decrease compared to the contract prices on the derivatives, gains are recognized.
During the year ended December 31, 2014, the Company had commodity derivative contracts for approximately 85% of its natural gas production and 94% of its oil production. During the year ended December 31, 2013, the Company had commodity derivative contracts for approximately 107% of its natural gas production and 127% of its oil production. The Company does not hedge the portion of natural gas production used to economically offset natural gas consumption related to its heavy oil development operations in California.
The Company determines the fair value of its oil and natural gas derivatives utilizing pricing models that use a variety of techniques, including market quotes and pricing analysis. See Item 7A. “Quantitative and Qualitative Disclosures About Market Risk” and Note 7 and Note 8 for additional details about the Company’s commodity derivatives. For information about the Company’s credit risk related to derivative contracts, see “Counterparty Credit Risk” under “Liquidity and Capital Resources” below.
Marketing and Other Revenues
Marketing revenues represent third-party activities associated with company-owned gathering systems, plants and facilities. Marketing and other revenues increased by approximately $86 million or 107% to approximately $167 million for the year ended December 31, 2014, from approximately $81 million for the year ended December 31, 2013. The increase was primarily due to electricity sales revenues generated by the Company’s California cogeneration facilities acquired and certain contracts assumed in the Berry acquisition in December 2013, as well as higher revenues generated by the Jayhawk natural gas processing plant.
Expenses
Lease Operating Expenses
Lease operating expenses include expenses such as labor, field office, vehicle, supervision, maintenance, tools and supplies, and workover expenses. Lease operating expenses increased by approximately $432 million or 116% to approximately $805 million for the year ended December 31, 2014, from approximately $373 million for the year ended December 31, 2013. Lease operating expenses increased primarily due to costs associated with properties acquired in the Berry acquisition and acquisitions completed during the third quarter of 2014 (see Note 2). Lease operating expenses per Mcfe also increased to $1.82 per Mcfe for the year ended December 31, 2014, from $1.24 per Mcfe for the year ended December 31, 2013, primarily due to higher unit rates on newly acquired oil properties.
Transportation Expenses
Transportation expenses increased by approximately $79 million or 61% to approximately $207 million for the year ended December 31, 2014, from approximately $128 million for the year ended December 31, 2013. The increase was primarily due to costs associated with properties acquired in the Berry acquisition and acquisitions during the third quarter of 2014. Transportation expenses per Mcfe also increased to $0.47 per Mcfe for the year ended December 31, 2014, from $0.43 per Mcfe for the year ended December 31, 2013, primarily due to higher rates on Berry properties acquired in the Rockies region.
Marketing Expenses
Marketing expenses represent third-party activities associated with company-owned gathering systems, plants and facilities. Marketing expenses increased by approximately $79 million or 210% to approximately $117 million for the year ended December 31, 2014, from approximately $38 million for the year ended December 31, 2013. The increase was primarily due to electricity generation expenses incurred by the Company’s California cogeneration facilities acquired and certain contracts assumed in the Berry acquisition, as well as higher expenses associated with the Jayhawk natural gas processing plant.
General and Administrative Expenses
General and administrative expenses are costs not directly associated with field operations and reflect the costs of employees including executive officers, related benefits, office leases and professional fees. General and administrative expenses increased by approximately $57 million or 24% to approximately $293 million for the year ended December 31, 2014, from approximately $236 million for the year ended December 31, 2013. The increase was primarily due to higher salaries and benefits related expenses, primarily driven by increased employee headcount and unit-based compensation, higher professional services expenses and higher various other administrative expenses, partially offset by lower non-payroll related
59
Item 7. Management’s Discussion and Analysis of Financial Condition and Results of Operations - Continued
acquisition expenses. Although general and administrative expenses increased, the unit rate decreased to $0.66 per Mcfe for the year ended December 31, 2014, from $0.79 per Mcfe for the year ended December 31, 2013.
Exploration Costs
Exploration costs increased by approximately $120 million to approximately $125 million for the year ended December 31, 2014, from approximately $5 million for the year ended December 31, 2013. The increase was due to higher leasehold impairment expenses on unproved properties, primarily in Michigan, the Mid-Continent and the Powder River Basin.
Depreciation, Depletion and Amortization
Depreciation, depletion and amortization increased by approximately $245 million or 29% to approximately $1.1 billion for the year ended December 31, 2014, from approximately $829 million for the year ended December 31, 2013. Higher total production volumes were the primary reason for the increased expense. Depreciation, depletion and amortization per Mcfe decreased to $2.43 per Mcfe for the year ended December 31, 2014, from $2.76 per Mcfe for the year ended December 31, 2013, primarily due to a lower rate in the Granite Wash formation as a result of the impairment recorded in the prior year and properties held for sale at September 30, 2014, that were divested on December 15, 2014.
Impairment of Long-Lived Assets
The Company recorded the following noncash impairment charges (before and after tax) associated with proved oil and natural gas properties:
Year Ended December 31, | |||||||
2014 | 2013 | ||||||
(in thousands) | |||||||
Permian Basin region | $ | 1,337,444 | $ | — | |||
Rockies region | 585,705 | — | |||||
Mid-Continent region | 244,413 | 828,317 | |||||
South Texas region | 131,329 | — | |||||
TexLa region | 4,836 | — | |||||
California region | 22 | — | |||||
$ | 2,303,749 | $ | 828,317 | ||||
The impairment charges in 2014 include approximately $1.7 billion due to a steep decline in commodity prices during the fourth quarter of 2014 and approximately $603 million due to the divestiture of certain high valued unproved properties in the Midland Basin in which the expected cash flows were previously included in the impairment assessment for proved oil and natural gas properties. The impairment charges in 2013 include approximately $791 million associated with properties in the Granite Wash formation related to asset performance resulting in reserve revisions and a decline in commodity prices as well as approximately $37 million associated with the write-down of the carrying value of the Panther Operated Cleveland Properties sold in May 2013 (see Note 2).
(Gains) Losses on Sale of Assets and Other, Net
During the year ended December 31, 2014, the Company recorded the following net gains and losses on divestitures and exchanges of properties:
• | Net gain of approximately $294 million, including costs to sell of approximately $10 million, on the Granite Wash Assets Sale; |
• | Net loss of approximately $28 million, including costs to sell of approximately $2 million, on the Permian Basin Assets Sale; |
• | Net gain of approximately $20 million, including costs to sell of approximately $3 million, on the noncash exchange of a portion of its Permian Basin properties to ExxonMobil for properties in California’s South Belridge Field; |
• | Net gain of approximately $65 million, including costs to sell of approximately $3 million, on the noncash exchange of a portion of its Permian Basin properties to Exxon XTO, for properties in the Hugoton Basin; and |
60
Item 7. Management’s Discussion and Analysis of Financial Condition and Results of Operations - Continued
• | Net gain of approximately $36 million on the sale of the Company’s interests in certain non-producing oil and natural gas properties located in the Mid-Continent region. |
See Note 2 for additional details of divestitures and exchanges of properties.
Taxes, Other Than Income Taxes
Year Ended December 31, | |||||||||||
2014 | 2013 | Variance | |||||||||
(in thousands) | |||||||||||
Severance taxes | $ | 133,933 | $ | 90,655 | $ | 43,278 | |||||
Ad valorem taxes | 114,955 | 48,547 | 66,408 | ||||||||
California carbon allowances | 18,212 | 355 | 17,857 | ||||||||
Other | 303 | (926 | ) | 1,229 | |||||||
$ | 267,403 | $ | 138,631 | $ | 128,772 | ||||||
Taxes, other than income taxes increased by approximately $129 million or 93% for the year ended December 31, 2014, compared to the year ended December 31, 2013. Severance taxes, which are a function of revenues generated from production, increased primarily due to higher production volumes and higher natural gas and NGL prices partially offset by lower oil prices. Ad valorem taxes, which are primarily based on the value of reserves and production equipment and vary by location, increased primarily due to the Berry acquisition and acquisitions completed during the third quarter of 2014. California carbon allowances increased primarily due to the California properties acquired in the Berry acquisition.
Other Income and (Expenses)
Year Ended December 31, | |||||||||||
2014 | 2013 | Variance | |||||||||
(in thousands) | |||||||||||
Interest expense, net of amounts capitalized | $ | (587,838 | ) | $ | (421,137 | ) | $ | (166,701 | ) | ||
Loss on extinguishment of debt | — | (5,304 | ) | 5,304 | |||||||
Other, net | (16,213 | ) | (8,477 | ) | (7,736 | ) | |||||
$ | (604,051 | ) | $ | (434,918 | ) | $ | (169,133 | ) | |||
Other income and (expenses) increased by approximately $169 million for the year ended December 31, 2014, compared to the year ended December 31, 2013. Interest expense increased primarily due to higher outstanding debt during the period and higher amortization of financing fees and expenses associated with the bridge loan and term loan that were repaid during 2014, the senior notes issued in September 2014 and amendments made to the Company’s Credit Facilities during 2014 and 2013. For the year ended December 31, 2013, the Company recorded a loss on extinguishment of debt of approximately $5 million as a result of the redemption of the remaining outstanding senior notes due 2017 and 2018. See “Debt” under “Liquidity and Capital Resources” below for additional details. Other expenses increased primarily due to write-offs of deferred financing fees related to the term loan that was repaid and the LINN Credit Facility that was amended during 2014. There were no such write-offs during 2013.
Income Tax Expense (Benefit)
The Company is a limited liability company treated as a partnership for federal and state income tax purposes, with the exception of the state of Texas, in which income tax liabilities and/or benefits of the Company are passed through to its unitholders. Limited liability companies are subject to Texas margin tax. In addition, certain of the Company’s subsidiaries are Subchapter C-corporations subject to federal and state income taxes. The Company recognized income tax expense of approximately $4 million for the year ended December 31, 2014, compared to an income tax benefit of approximately $2 million for the year ended December 31, 2013. Income tax expense increased primarily due to higher income from the Company’s taxable subsidiaries in 2014 compared to 2013.
61
Item 7. Management’s Discussion and Analysis of Financial Condition and Results of Operations - Continued
Net Loss
Net loss decreased by approximately $239 million or 35% to approximately $452 million for the year ended December 31, 2014, from approximately $691 million for the year ended December 31, 2013. The decrease was primarily due to higher production revenues and higher gains on oil and natural gas derivatives, partially offset by higher impairment charges and other expenses, including interest. See discussions above for explanations of variances.
Liquidity and Capital Resources
The Company’s liquidity outlook has changed since the third quarter of 2015 due to continued low commodity prices. The significant risks and uncertainties described under “Executive Overview” raise substantial doubt about the Company’s ability to continue as a going concern. The report of the Company’s independent registered public accounting firm that accompanies its audited consolidated financial statements in this Annual Report on Form 10-K contains an explanatory paragraph regarding the substantial doubt about the Company’s ability to continue as a going concern.
The Company’s Credit Facilities contain the requirement to deliver audited consolidated financial statements without a going concern or like qualification or exception. Consequently, as of the filing date, March 15, 2016, the Company is in default under the LINN Credit Facility. If the Company is unable to obtain a waiver or other suitable relief from the lenders under the LINN Credit Facility prior to the expiration of the 30 day grace period, an Event of Default will result and the lenders holding a majority of the commitments under the LINN Credit Facility could accelerate the outstanding indebtedness, which would make it immediately due and payable. If the Company is unable to obtain a waiver from or otherwise reach an agreement with the lenders under the LINN Credit Facility and the indebtedness under the LINN Credit Facility is accelerated, then an Event of Default under LINN Energy’s senior notes and second lien notes would occur, which, if it continues beyond any applicable cure periods, would, to the extent the applicable lenders so elect, result in the acceleration of those obligations. Furthermore, an Event of Default under the LINN Credit Facility will also result in an Event of Default under the Berry Credit Facility, which in the absence of a waiver or other suitable relief and upon the election of the agent or lenders holding a majority of commitments under the Berry Credit Facility would result in the acceleration of indebtedness under the Berry Credit Facility. Such Event of Default would trigger an Event of Default under the Berry senior notes. If such Event of Default continues beyond any applicable cure periods, such Event of Default would result in an acceleration of the Berry senior notes.
Additionally, the indenture governing the second lien notes (“Second Lien Indenture”) required the Company to deliver mortgages by February 18, 2016, subject to a 45 day grace period. The Company elected to exercise its right to the grace period and not deliver the mortgages, and as a result, the Company is currently in default under the Second Lien Indenture. If the Company does not deliver the mortgages within the 45 day grace period or is otherwise unable to obtain a waiver or other suitable relief from the holders under the Second Lien Indenture prior to the expiration of the 45 day grace period, an Event of Default will result and if the trustee or noteholders holding at least 25% in the aggregate outstanding principal amount of the second lien notes so elect would accelerate the second lien notes causing them to be immediately due and payable.
Furthermore, the Company has decided to defer making interest payments totaling approximately $60 million due March 15, 2016, including approximately $30 million on LINN Energy’s 7.75% senior notes due February 2021, approximately $12 million on LINN Energy’s 6.50% senior notes due September 2021 and approximately $18 million on Berry’s senior notes due September 2022, which will result in the Company being in default under these senior notes. The indentures governing each of the applicable series of notes permit the Company a 30 day grace period to make the interest payments. If the Company fails to make the interest payments within the grace period, or is otherwise unable to obtain a waiver or suitable relief from the holders of these senior notes, an Event of Default will result and if the trustee or noteholders holding at least 25% in the aggregate outstanding principal amount of each series of notes so elect would accelerate the notes causing them to be immediately due and payable.
An Event of Default under the Second Lien Indenture or any of the indentures governing the senior notes triggers a cross-default under the LINN Credit Facility and Berry Credit Facility and, as discussed above, if the applicable lenders so elect would result in acceleration under the LINN Credit Facility and Berry Credit Facility. In addition, as discussed above, an acceleration of the obligations under the Second Lien Indenture or LINN Credit Facility would trigger a cross-default to LINN Energy’s senior notes and if the applicable lenders so elect would result in a cross-acceleration under LINN Energy’s
62
Item 7. Management’s Discussion and Analysis of Financial Condition and Results of Operations - Continued
senior notes, and an acceleration of the Berry Credit Facility if the applicable lenders so elect would result in cross-acceleration under the Berry senior notes.
If lenders, and subsequently noteholders, accelerate the Company’s outstanding indebtedness, it will become immediately due and payable and the Company will not have sufficient liquidity to repay those amounts. If the Company is unable to reach an agreement with its creditors prior to any of the above described accelerations, the Company could be required to immediately file for protection under Chapter 11 of the U.S. Bankruptcy Code.
The Company is currently in discussions with various stakeholders and is pursuing or considering a number of actions including: (i) obtaining additional sources of capital from asset sales, private issuances of equity or equity-linked securities, debt for equity swaps, or any combination thereof; (ii) pursuing in- and out-of-court restructuring transactions; (iii) obtaining waivers or amendments from its lenders; and (iv) continuing to minimize its capital expenditures, reduce costs and maximize cash flows from operations. There can be no assurance that sufficient liquidity can be obtained from one or more of these actions or that these actions can be consummated within the period needed.
The Company has utilized funds from debt and equity offerings, borrowings under its Credit Facilities and net cash provided by operating activities for capital resources and liquidity. To date, the primary use of capital has been for acquisitions and the development of oil and natural gas properties. For the year ended December 31, 2015, the Company’s total capital expenditures, excluding acquisitions, were approximately $518 million.
See below for details regarding capital expenditures for the periods presented:
Year Ended December 31, | |||||||||||
2015 | 2014 | 2013 | |||||||||
(in thousands) | |||||||||||
Oil and natural gas | $ | 450,286 | $ | 1,487,996 | $ | 1,166,866 | |||||
Plant and pipeline | 20,580 | 19,756 | 63,035 | ||||||||
Other | 46,829 | 48,182 | 34,664 | ||||||||
Capital expenditures, excluding acquisitions | $ | 517,695 | $ | 1,555,934 | $ | 1,264,565 | |||||
For 2016, the Company estimates its total capital expenditures, excluding acquisitions, will be approximately $340 million, including approximately $250 million related to its oil and natural gas capital program and approximately $75 million related to its plant and pipeline capital. This estimate is under continuous review and subject to ongoing adjustments. The Company expects to fund its capital expenditures primarily from net cash provided by operating activities; however, there is uncertainty regarding the Company’s liquidity as discussed above.
In February 2016, the Company borrowed approximately $919 million under the LINN Credit Facility, which represented the remaining undrawn amount that was available under the LINN Credit Facility, the proceeds of which were deposited in an unencumbered account with a bank that is not a lender under either the LINN or Berry Credit Facility. As of February 29, 2016, there was less than $1 million of available borrowing capacity under the Credit Facilities. See “Process to Explore Strategic Alternatives Related to the Company’s Capital Structure” under “Executive Overview” for additional details.
In November 2015, the Company issued $1.0 billion in aggregate principal amount of new Second Lien Notes in exchange for approximately $2.0 billion in aggregate principal amount of certain of its outstanding senior notes. The exchanges were accounted for as a troubled debt restructuring (“TDR”). See Note 6 for additional details. TDR accounting requires that interest payments on the Second Lien Notes reduce the carrying value of the debt with no interest expense recognized. As a result, the Company’s reported interest expense will be significantly less than the contractual interest payments throughout the term of the Second Lien Notes. For the year ended December 31, 2015, accrued contractual interest on the Second Lien Notes was approximately $14 million, and no interest payments were made during the year.
63
Item 7. Management’s Discussion and Analysis of Financial Condition and Results of Operations - Continued
In October 2015, LINN Energy and Berry each entered into an amendment to its credit facility. See Note 6 for additional details.
The spring 2015 semi-annual borrowing base redeterminations of the Company’s Credit Facilities were completed in May 2015, and as a result of lower commodity prices, the borrowing base under the LINN Credit Facility decreased from $4.5 billion to $4.05 billion and the borrowing base under the Berry Credit Facility decreased from $1.4 billion to $1.2 billion. The fall 2015 semi-annual redeterminations were completed in October 2015 and the borrowing base under the LINN Credit Facility was reaffirmed at $4.05 billion, subject to certain conditions being met on or before January 1, 2016, and the borrowing base under the Berry Credit Facility decreased from $1.2 billion to $900 million. In connection with the reduction in Berry’s borrowing base in October 2015, Berry repaid $300 million of borrowings outstanding under the Berry Credit Facility. The borrowing base under the LINN Credit Facility automatically decreased to $3.6 billion on January 1, 2016, since certain conditions were not met.
Continued low commodity prices, reductions in the Company’s capital budget and the resulting reserve write-downs, along with the maturity schedule of the Company’s hedges, are expected to adversely impact future redeterminations. The Company may have insufficient cash on hand to be able to make mandatory prepayments under the Credit Facilities.
In connection with the reduction in Berry’s borrowing base in May 2015, LINN Energy borrowed $250 million under the LINN Credit Facility and contributed it to Berry to post as restricted cash with Berry’s lenders. As directed by LINN Energy, the $250 million was deposited on Berry’s behalf in a security account with the administrative agent subject to a security control agreement. Berry’s ability to withdraw funds from this account is subject to a concurrent reduction of the borrowing base under the Berry Credit Facility or lender’s consent in connection with a redetermination of such borrowing base. The $250 million may be used to satisfy obligations under the Berry Credit Facility or, subject to restrictions in the indentures governing Berry’s senior notes, may be returned to LINN Energy in the future.
As the Company pursues growth, it continually monitors the capital resources available to meet future financial obligations and planned capital expenditures. The Company’s future success in growing reserves and production volumes will be highly dependent on the capital resources available and its success in drilling for or acquiring additional reserves. The Company actively reviews acquisition opportunities on an ongoing basis. If the Company were to make significant additional acquisitions for cash, it would need to borrow additional amounts under its Credit Facilities, if available, or obtain additional debt or equity financing. The Company’s Credit Facilities and indentures governing its senior notes impose certain restrictions on the Company’s ability to obtain additional debt financing. See Item 1A. “Risk Factors,” for additional information about liquidity risks, the risk that the Company may be unable to repay or refinance its existing and future debt as it becomes due, and other risks that could affect the Company.
Statements of Cash Flows
The following is a comparative cash flow summary:
Year Ended December 31, | |||||||||||
2015 | 2014 | 2013 | |||||||||
(in thousands) | |||||||||||
Net cash: | |||||||||||
Provided by operating activities | $ | 1,249,457 | $ | 1,711,890 | $ | 1,166,212 | |||||
Used in investing activities | (307,302 | ) | (1,920,104 | ) | (1,253,317 | ) | |||||
Provided by (used in) financing activities | (941,796 | ) | 157,852 | 138,033 | |||||||
Net increase (decrease) in cash and cash equivalents | $ | 359 | $ | (50,362 | ) | $ | 50,928 | ||||
Operating Activities
Cash provided by operating activities for the year ended December 31, 2015, was approximately $1.2 billion, compared to approximately $1.7 billion for the year ended December 31, 2014. The decrease was primarily due to lower production related revenues principally due to lower commodity prices, partially offset by higher cash settlements on derivatives.
64
Item 7. Management’s Discussion and Analysis of Financial Condition and Results of Operations - Continued
Cash provided by operating activities for the year ended December 31, 2014, was approximately $1.7 billion, compared to approximately $1.2 billion for the year ended December 31, 2013. The increase was primarily due to higher production related revenues principally due to increased production volumes and higher natural gas and NGL prices, partially offset by higher expenses and lower cash settlements on derivatives.
Investing Activities
The following provides a comparative summary of cash flow from investing activities:
Year Ended December 31, | |||||||||||
2015 | 2014 | 2013 | |||||||||
(in thousands) | |||||||||||
Cash flow from investing activities: | |||||||||||
Acquisition of oil and natural gas properties and joint-venture funding, net of cash acquired | $ | — | $ | (2,479,252 | ) | $ | (279,213 | ) | |||
Capital expenditures | (675,597 | ) | (1,644,417 | ) | (1,170,377 | ) | |||||
Proceeds from sale of properties and equipment and other | 368,295 | 2,203,565 | 196,273 | ||||||||
$ | (307,302 | ) | $ | (1,920,104 | ) | $ | (1,253,317 | ) | |||
The primary use of cash in investing activities is for capital spending, including acquisitions and the development of the Company’s oil and natural gas properties. The Company made no acquisitions of properties during 2015. The increase in 2014 compared to 2013 was primarily due to two significant cash acquisitions of properties from Pioneer and Devon consummated during 2014, compared to one significant cash acquisition of properties in the Permian Basin region consummated during 2013. The amount reported for the year ended December 31, 2013, includes approximately $451 million of cash acquired in the Berry acquisition. See Note 2 for additional details of acquisitions.
Capital expenditures decreased during 2015 primarily due to lower spending on development activities throughout the Company’s various operating regions as a result of declining commodity prices. Capital expenditures were higher during 2014 compared to 2013 primarily due to increased development activities of properties in the Rockies, California and Permian Basin regions, partially offset by decreased development activities of properties in the Mid-Continent region.
Proceeds from the sale of properties and equipment and other for the year ended December 31, 2015, include approximately $276 million in net cash proceeds received from the Howard County Assets Sale in August 2015. Proceeds from sale of properties and equipment and other for the year ended December 31, 2014, include approximately $1.8 billion and $352 million in net cash proceeds received from the Granite Wash Assets Sale and the Permian Basin Assets Sale, respectively, compared to $218 million in net cash proceeds received from the sale of the Panther Operated Cleveland Properties in 2013. See Note 2 for additional details of divestitures.
Financing Activities
Cash used in financing activities for the year ended December 31, 2015, was approximately $942 million compared to cash provided by financing activities of approximately $158 million for the year ended December 31, 2014. Financing cash flow needs decreased primarily due to reduced capital expenditures and acquisition activity for the year ended December 31, 2015. Cash provided by financing activities was approximately $138 million for the year ended December 31, 2013.
65
Item 7. Management’s Discussion and Analysis of Financial Condition and Results of Operations - Continued
The following provides a comparative summary of proceeds from borrowings and repayments of debt:
Year Ended December 31, | |||||||||||
2015 | 2014 | 2013 | |||||||||
(in thousands) | |||||||||||
Proceeds from borrowings: | |||||||||||
LINN Credit Facility | $ | 1,445,000 | $ | 2,540,000 | $ | 1,730,000 | |||||
Senior notes | — | 1,100,024 | — | ||||||||
Bridge loan and term loans | — | 2,300,000 | 500,000 | ||||||||
$ | 1,445,000 | $ | 5,940,024 | $ | 2,230,000 | ||||||
Repayments of debt: | |||||||||||
LINN Credit Facility | $ | (1,275,000 | ) | $ | (2,305,000 | ) | $ | (1,350,000 | ) | ||
Berry Credit Facility | (300,000 | ) | — | — | |||||||
Senior notes | (608,879 | ) | (206,124 | ) | (54,898 | ) | |||||
Bridge loan and term loan | — | (2,300,000 | ) | — | |||||||
$ | (2,183,879 | ) | $ | (4,811,124 | ) | $ | (1,404,898 | ) | |||
In addition, in May 2015, LINN Energy borrowed $250 million under the LINN Credit Facility and contributed it to Berry to post as restricted cash with Berry’s lenders (see Note 6).
In November 2015, the Company issued $1.0 billion in aggregate principal amount of Second Lien Notes in exchange for approximately $2.0 billion in aggregate principal amount of certain of its outstanding senior notes. See Note 6 for additional details.
Debt
The following summarizes the Company’s outstanding debt:
December 31, | |||||||
2015 | 2014 | ||||||
(in thousands, except percentages) | |||||||
LINN Credit Facility | $ | 2,215,000 | $ | 1,795,000 | |||
Berry Credit Facility | 873,175 | 1,173,175 | |||||
Term loan | 500,000 | 500,000 | |||||
6.50% senior notes due May 2019 | 562,234 | 1,200,000 | |||||
6.25% senior notes due November 2019 | 581,402 | 1,800,000 | |||||
8.625% senior notes due April 2020 | 718,596 | 1,300,000 | |||||
6.75% Berry senior notes due November 2020 | 261,100 | 299,970 | |||||
12.00% senior secured second lien notes due December 2020 (1) | 1,000,000 | — | |||||
Interest payable on second lien notes due December 2020 (1) | 608,333 | — | |||||
7.75% senior notes due February 2021 | 779,474 | 1,000,000 | |||||
6.50% senior notes due September 2021 | 381,423 | 650,000 | |||||
6.375% Berry senior notes due September 2022 | 572,700 | 599,163 | |||||
Net unamortized discounts and premiums | (8,694 | ) | (21,499 | ) | |||
Total debt, net | 9,044,743 | 10,295,809 | |||||
Less current portion (2) | (3,716,508 | ) | — | ||||
Total long-term debt, net | $ | 5,328,235 | $ | 10,295,809 | |||
(1) | In November 2015, the Company issued $1.0 billion in aggregate principal amount of new Second Lien Notes in exchange for approximately $2.0 billion in aggregate principal amount of certain of its outstanding senior notes. The exchanges were accounted for |
66
Item 7. Management’s Discussion and Analysis of Financial Condition and Results of Operations - Continued
as a TDR. See Note 6 for additional details. TDR accounting requires that interest payments on the Second Lien Notes reduce the carrying value of the debt with no interest expense recognized.
(2) | Due to existing and anticipated covenant violations, the Company’s Credit Facilities and term loan were classified as current at December 31, 2015. The current portion also includes approximately $128 million of interest payable on the Second Lien Notes due within one year. |
During the year ended December 31, 2015, the Company repurchased, through privately negotiated transactions and on the open market, approximately $992 million of its outstanding senior notes as follows:
• | 6.50% senior notes due May 2019 – $53 million; |
• | 6.25% senior notes due November 2019 – $395 million; |
• | 8.625% senior notes due April 2020 – $295 million; |
• | 6.75% Berry senior notes due November 2020 – $39 million; |
• | 7.75% senior notes due February 2021 – $36 million; |
• | 6.50% senior notes due September 2021 – $148 million; and |
• | 6.375% Berry senior notes due September 2022 – $26 million. |
In connection, with the repurchases, the Company paid approximately $609 million in cash and recorded a gain on extinguishment of debt of approximately $367 million for the year ended December 31, 2015.
In February 2016, the Company borrowed approximately $919 million under the LINN Credit Facility, which represented the remaining undrawn amount that was available under the LINN Credit Facility, the proceeds of which were deposited in an unencumbered account with a bank that is not a lender under either the LINN or Berry Credit Facility. As of February 29, 2016, there was less than $1 million of available borrowing capacity under the Credit Facilities. For additional information related to the Company’s outstanding debt, see Note 6. The Company plans to file Berry’s stand-alone financial statements with the Securities and Exchange Commission at a later date.
Financial Covenants
The Credit Facilities, as amended in October 2015, contain requirements and financial covenants, among others, to maintain: 1) a ratio of EBITDA to Interest Expense (as each term is defined in the LINN Credit Facility) and Adjusted EBITDAX to Interest Expense (as each term is defined in the Berry Credit Facility) (“Interest Coverage Ratio”) for the preceding four quarters of greater than 2.5 to 1.0 through September 30, 2015, 2.0 to 1.0 currently, 2.25 to 1.0 from March 31, 2017 through June 30, 2017 and returning to 2.5 to 1.0 thereafter, and 2) a ratio of adjusted current assets to adjusted current liabilities (as described in the LINN Credit Facility) and Current Assets to Current Liabilities (as each term is defined in the Berry Credit Facility) (“Current Ratio”) as of the last day of any fiscal quarter of greater than 1.0 to 1.0. The Interest Coverage Ratio is intended as a measure of the Company’s ability to make interest payments on its outstanding indebtedness and the Current Ratio is intended as a measure of the Company’s solvency. The Company is required to demonstrate compliance with each of these ratios on a quarterly basis. The following represents the calculations of the Interest Coverage Ratio and the Current Ratio as presented to the lenders under the Credit Facilities:
At or for the Quarter Ended | Twelve Months Ended | |||||||||||||
March 31, 2015 | June 30, 2015 | September 30, 2015 | December 31, 2015 | December 31, 2015 | ||||||||||
LINN Credit Facility: | ||||||||||||||
Interest Coverage Ratio | 2.9 | 3.0 | 3.4 | 3.5 | 3.2 | |||||||||
Current Ratio | 3.0 | 2.9 | 2.8 | 2.0 | 2.0 | |||||||||
Berry Credit Facility: | ||||||||||||||
Interest Coverage Ratio | 1.7 | 2.6 | 2.2 | 1.6 | 2.0 | |||||||||
Current Ratio (1) | 0.6 | 0.5 | 2.0 | 0.4 | 0.4 | |||||||||
Current Ratio (consolidated) (1) | 3.2 | 2.9 | 2.6 | 1.7 | 1.7 | |||||||||
(1) | The Berry Credit Facility allows Berry to demonstrate its compliance with the Current Ratio financial covenant on a consolidated basis with LINN Energy for up to three quarters of each calendar year. |
67
Item 7. Management’s Discussion and Analysis of Financial Condition and Results of Operations - Continued
The Company has included disclosure of the Interest Coverage Ratio for the twelve months ended December 31, 2015, and the Current Ratio as of December 31, 2015, to demonstrate its compliance for the quarter ended December 31, 2015, as well as the Interest Coverage Ratio for each of the preceding four quarters on an individual basis (rather than on a last twelve months basis) and the Current Ratio as of the end of each of the preceding four quarters to provide investors with trend information about the Company’s ongoing compliance with these financial covenants. If the Company fails to demonstrate compliance with either or both of the Interest Coverage Ratio or the Current Ratio as of the end of the quarter and such failure continues beyond applicable cure periods, an event of default would occur and the Company would be unable to make additional borrowings and outstanding indebtedness may be accelerated. The Company depends, in part, on its Credit Facilities for future capital needs. In addition, the Company has drawn on the LINN Credit Facility in the past to fund or partially fund cash distribution payments. Absent such borrowings, the Company would have at times experienced a shortfall in cash available to pay the declared cash distribution amount. For additional information, see “Distribution Practices” below.
See “Going Concern Uncertainty” above under “Executive Overview” for information about the impact to the Company’s compliance with its covenants resulting from the auditors’ opinion issued in connection with the consolidated financial statements that includes a going concern explanation.
Contingencies
See Item 3. “Legal Proceedings” for information regarding legal proceedings that the Company is party to and any contingencies related to these legal proceedings.
Commitments and Contractual Obligations
The following is a summary of the Company’s commitments and contractual obligations as of December 31, 2015:
Payments Due | ||||||||||||||||||||
Contractual Obligations | Total | 2016 | 2017 – 2018 | 2019 – 2020 | 2021 and Beyond | |||||||||||||||
(in thousands) | ||||||||||||||||||||
Debt obligations: | ||||||||||||||||||||
Credit facilities (1) | $ | 3,088,175 | $ | 3,088,175 | $ | — | $ | — | $ | — | ||||||||||
Term loan (1) | 500,000 | 500,000 | — | — | — | |||||||||||||||
Second lien notes (2) | 1,608,333 | 128,333 | 240,000 | 1,240,000 | — | |||||||||||||||
Senior notes | 3,856,929 | — | — | 2,123,332 | 1,733,597 | |||||||||||||||
Interest (3) | 1,684,097 | 376,647 | 753,292 | 433,693 | 120,465 | |||||||||||||||
Operating lease obligations: | ||||||||||||||||||||
Office, property and equipment leases | 69,977 | 10,647 | 16,408 | 15,586 | 27,336 | |||||||||||||||
Other: | ||||||||||||||||||||
Commodity derivatives | 3,098 | 2,241 | 857 | — | — | |||||||||||||||
Asset retirement obligations | 523,541 | 14,234 | 20,501 | 23,303 | 465,503 | |||||||||||||||
Firm natural gas transportation contracts (4) | 146,981 | 33,446 | 57,389 | 41,651 | 14,495 | |||||||||||||||
Other | 3,464 | 2,503 | 122 | 122 | 717 | |||||||||||||||
$ | 11,484,595 | $ | 4,156,226 | $ | 1,088,569 | $ | 3,877,687 | $ | 2,362,113 | |||||||||||
(1) | The contractual maturity date for the Credit Facilities and term loan is April 2019; however, the LINN Credit Facility and term loan are subject to springing maturities based on the maturity of any outstanding LINN Energy junior lien debt and, based on current junior lien debt outstanding, may mature as early as November 2018. Due to existing and anticipated covenant violations, the Company’s Credit Facilities and term loan were classified as current at December 31, 2015. |
(2) | Represents $1.0 billion of Second Lien Notes and approximately $608 million of future contractual interest payable reflected on the consolidated balance sheet at December 31, 2015. The maturity date reflected for the Second Lien Notes is December 2020; however, these notes are subject to a springing maturity based on the maturity of any outstanding LINN Energy unsecured debt and, based on current unsecured debt outstanding, may mature as early as February 2019. |
68
Item 7. Management’s Discussion and Analysis of Financial Condition and Results of Operations - Continued
(3) | Represents interest on the LINN Credit Facility computed at 2.66% through contractual maturity in April 2019, and interest on the Berry Credit Facility and term loan each computed at 3.17% through contractual maturities in April 2019. Interest on the December 2020 Second Lien Notes computed at a fixed rate of 12.00%. Interest on the May 2019 senior notes, November 2019 senior notes, April 2020 senior notes, Berry November 2020 senior notes, February 2021 senior notes, September 2021 senior notes and Berry September 2022 senior notes computed at fixed rates of 6.50%, 6.25%, 8.625%, 6.75%, 7.75%, 6.50% and 6.375%, respectively. |
(4) | Represent certain firm commitments to transport natural gas production to market and to transport natural gas for use in the Company’s cogeneration and conventional steam generation facilities. The remaining terms of these contracts range from two to eight years and require a minimum monthly charge regardless of whether the contracted capacity is used or not. |
Counterparty Credit Risk
The Company accounts for its commodity derivatives at fair value. The Company’s counterparties are current participants or affiliates of participants in its Credit Facilities or were participants or affiliates of participants in its Credit Facilities at the time it originally entered into the derivatives. The LINN Credit Facility and the Berry Credit Facility are secured by each company’s oil, natural gas and NGL reserves; therefore, the Company is not required to post any collateral. The Company does not receive collateral from its counterparties. The Company minimizes the credit risk in derivative instruments by: (i) limiting its exposure to any single counterparty; (ii) entering into derivative instruments only with counterparties that meet the Company’s minimum credit quality standard, or have a guarantee from an affiliate that meets the Company’s minimum credit quality standard; and (iii) monitoring the creditworthiness of the Company’s counterparties on an ongoing basis. In accordance with the Company’s standard practice, its commodity derivatives are subject to counterparty netting under agreements governing such derivatives and therefore the risk of loss due to counterparty nonperformance is somewhat mitigated.
At-the-Market Offering Program
The Company’s Board of Directors has authorized the sale of up to $500 million of units under an at-the-market offering program. Sales of units, if any, will be made under an equity distribution agreement by means of ordinary brokers’ transactions, through the facilities of the NASDAQ Global Select Market, any other national securities exchange or facility thereof, a trading facility of a national securities association or an alternate trading system, to or through a market maker or directly on or through an electronic communication network, a “dark pool” or any similar market venue, at market prices, in block transactions, or as otherwise agreed with a sales agent. The Company expects to use the net proceeds from any sale of units for general corporate purposes, which may include, among other things, capital expenditures, acquisitions and the repayment of debt.
During the year ended December 31, 2015, the Company, under its equity distribution agreement, sold 3,621,983 units representing limited liability company interests at an average price of $12.37 per unit for net proceeds of approximately $44 million (net of approximately $448,000 in commissions). In connection with the issuance and sale of these units, the Company also incurred professional services expenses of approximately $459,000. The Company used the net proceeds for general corporate purposes, including the open market repurchases of a portion of its senior notes (see Note 6). At December 31, 2015, units totaling approximately $455 million in aggregate offering price remained available to be sold under the agreement.
Public Offering of Units
In May 2015, the Company sold 16,000,000 units representing limited liability company interests in an underwritten public offering at $11.79 per unit ($11.32 per unit, net of underwriting discount) for net proceeds of approximately $181 million (after underwriting discount and offering costs of approximately $8 million). The Company used the net proceeds from the sale of these units to repay a portion of the outstanding indebtedness under the LINN Credit Facility.
Issuance of Units for Berry Acquisition
On December 16, 2013, the Company completed the transactions contemplated by the merger agreement under which LinnCo, LLC (“LinnCo”), an affiliate of LINN Energy, acquired all of the outstanding common shares of Berry and the contribution agreement between LinnCo and the Company, under which LinnCo contributed Berry to the Company in exchange for LINN Energy units. Under the merger agreement, as amended, Berry’s shareholders received 1.68 LinnCo common shares for each Berry common share they owned, totaling 93,756,674 LinnCo common shares. Under the
69
Item 7. Management’s Discussion and Analysis of Financial Condition and Results of Operations - Continued
contribution agreement, LinnCo contributed Berry to LINN Energy in exchange for 93,756,674 newly issued LINN Energy units with a value of approximately $2.8 billion.
Distributions
Under the Company’s limited liability company agreement, unitholders are entitled to receive a distribution of available cash, which includes cash on hand plus borrowings less any reserves established by the Company’s Board of Directors to provide for the proper conduct of the Company’s business (including reserves for future capital expenditures, including drilling, acquisitions and anticipated future credit needs) or to fund distributions, if any, over the next four quarters. The following provides a summary of distributions paid by the Company during the year ended December 31, 2015:
Date Paid | Distributions Per Unit | Total Distributions | ||||||
(in millions) | ||||||||
September 2015 | $ | 0.1042 | $ | 37 | ||||
August 2015 | $ | 0.1042 | $ | 37 | ||||
July 2015 | $ | 0.1042 | $ | 37 | ||||
June 2015 | $ | 0.1042 | $ | 37 | ||||
May 2015 | $ | 0.1042 | $ | 35 | ||||
April 2015 | $ | 0.1042 | $ | 35 | ||||
March 2015 | $ | 0.1042 | $ | 35 | ||||
February 2015 | $ | 0.1042 | $ | 35 | ||||
January 2015 | $ | 0.1042 | $ | 35 | ||||
In October 2015, the Company’s Board of Directors determined to suspend payment of the Company’s distribution. For additional information, see “Distribution Practices” below.
Distribution Practices
The Company’s Board of Directors determines the appropriate level of distributions on a periodic basis in accordance with the provisions of the Company’s limited liability company agreement. Management considers the timing and size of planned capital expenditures and long-term views about expected results in determining the amount of its distributions. Capital spending and resulting production and net cash provided by operating activities do not typically occur evenly throughout the year due to a variety of factors which are difficult to predict, including rig availability, weather, well performance, the timing of completions and the commodity price environment.
The Company’s Board of Directors reviews historical financial results and forecasts for future periods, including oil and natural gas development activities and the impact of significant acquisitions or dispositions, as well as considers the level of the Company’s indebtedness and its liquidity position in making a determination to increase, decrease or maintain the current level of distribution. If shortfalls are sustained over time and forecasts demonstrate expectations for continued future shortfalls, or the Company’s Board of Directors determines that it is necessary to reserve cash for the future conduct of business, it may determine to reduce, suspend or discontinue paying distributions. For example, in October 2015, following the recommendation from management, the Company’s Board of Directors determined to suspend payment of the Company’s distribution and reserve any excess cash that would otherwise be available for distribution. The Board of Directors will continue to evaluate the Company’s ability to reinstate the distribution based on the considerations discussed above.
For 2015, the Company intended to fund interest expense, its total oil and natural gas development costs and distributions to unitholders paid through September 2015 from net cash provided by operating activities, and presents “excess (shortfall) of net cash provided by operating activities after distributions to unitholders and discretionary adjustments considered by the Board of Directors” after deducting total oil and natural gas development costs. Previously, the Company intended to fund interest expense, a portion of its oil and natural gas development costs and distributions to unitholders from net cash provided by operating activities and presented “excess (shortfall) of net cash provided by operating activities after distributions to unitholders and discretionary adjustments considered by the Board of Directors” after deducting only a portion of oil and natural gas development costs.
70
Item 7. Management’s Discussion and Analysis of Financial Condition and Results of Operations - Continued
The Company funds acquisitions and premiums paid for derivatives, if any, primarily with proceeds from debt or equity offerings, borrowings under the LINN Credit Facility or other external sources of funding. Although it is the Company’s practice to acquire or modify derivative instruments with external sources of funding, any cash settlements on derivatives are reported as net cash provided by operating activities and may be used to fund distributions, if any.
See below for details regarding the discretionary adjustments considered by the Company’s Board of Directors in assessing the appropriate distribution amount for each period, as well as the extent to which sources of funding have been sufficient for the periods presented:
Year Ended December 31, | |||||||||||
2015 | 2014 | 2013 | |||||||||
(in thousands) | |||||||||||
Net cash provided by operating activities | $ | 1,249,457 | $ | 1,711,890 | $ | 1,166,212 | |||||
Distributions to unitholders | (323,878 | ) | (962,048 | ) | (682,241 | ) | |||||
Excess of net cash provided by operating activities after distributions to unitholders | 925,579 | 749,842 | 483,971 | ||||||||
Discretionary adjustments considered by the Board of Directors: | |||||||||||
Discretionary reductions for a portion of oil and natural gas development costs (1) | NM* | (823,562 | ) | (476,507 | ) | ||||||
Development of oil and natural gas properties (2) | (450,286 | ) | NM* | NM* | |||||||
Cash settlements on canceled derivatives (3) | (4,679 | ) | (12,281 | ) | — | ||||||
Cash recoveries of bankruptcy claim (4) | (4,232 | ) | (6,639 | ) | (11,222 | ) | |||||
Cash received (paid) for acquisitions or divestitures – revenues less operating expenses (5) | (2,712 | ) | 91,890 | 7,144 | |||||||
Provision for legal matters (6) | (1,000 | ) | 1,598 | 1,000 | |||||||
Changes in operating assets and liabilities and other, net (7) | (94,365 | ) | 23,228 | (9,030 | ) | ||||||
Excess of net cash provided by operating activities after distributions to unitholders and discretionary adjustments considered by the Board of Directors, including total development of oil and natural gas properties (8) | $ | 368,305 | NM* | NM* | |||||||
Excess (shortfall) of net cash provided by operating activities after distributions to unitholders and discretionary adjustments considered by the Board of Directors, including a portion of oil and natural gas development costs (8) | NM* | $ | 24,076 | $ | (4,644 | ) | |||||
* | Not meaningful due to the 2015 change in presentation. |
(1) | Represent discretionary reductions for a portion of oil and natural gas development costs, an estimated component of total development costs. The Board of Directors establishes the discretionary reductions with the objective of replacing proved developed producing reserves, current production and cash flow, taking into consideration the Company’s overall commodity mix. Management evaluates all of these objectives as part of the decision-making process to determine the discretionary reductions for a portion of oil and natural gas development costs for the year, although every objective may not be met in each year. Furthermore, there may be certain years in which commodity prices and other economic conditions do not merit capital spending at a level sufficient to accomplish any of these objectives. The 2014 amounts were established by the Board of Directors at the end of the previous year, allocated across four quarters, and were intended to fully offset declines in production and proved developed producing reserves during the year as compared to the prior year. |
The portion of oil and natural gas development costs includes estimated drilling and development costs associated with projects to convert a portion of non-producing reserves to producing status. However, the amounts do not include the historical cost of acquired properties as those amounts have already been spent in prior periods, were financed primarily with external sources of funding and do not affect the Company’s ability to pay distributions in the current period. The Company’s existing reserves, inventory of drilling locations and production levels will decline over time as a result of development and production activities. Consequently, if the Company were to limit its total capital expenditures to this portion of oil and natural gas development costs and not acquire new reserves, total reserves would decrease over time, resulting in an inability to maintain production at current levels, which could adversely affect the Company’s ability to pay a distribution, if and when resumed. However, the Company’s current total reserves do not include reserve additions that may result from converting existing probable and possible resources to additional proved reserves, potential additional discoveries or technological advancements on the Company’s existing acreage position.
71
Item 7. Management’s Discussion and Analysis of Financial Condition and Results of Operations - Continued
(2) | Represents total capital expenditures for the development of oil and natural gas properties as presented on an accrual basis. For 2015, the Company intends to fund its total oil and natural gas capital program, in addition to interest expense and distributions to unitholders, from net cash provided by operating activities; however, in October 2015, the Company’s Board of Directors approved the suspension of the Company’s distribution. Previously, the Company intended to fund only a portion of its oil and natural gas capital program, in addition to interest expense and distributions to unitholders, from net cash provided by operating activities. |
(3) | Represent derivatives canceled prior to the contract settlement date. |
(4) | Represent the recoveries of a bankruptcy claim against Lehman Brothers which was not a transaction occurring in the ordinary course of the Company’s business. |
(5) | Represents adjustments to the purchase price of acquisitions and divestitures, based on the Company’s contractual right to revenues less operating expenses for periods from the effective date of a transaction to the closing date of a transaction. When the Company is the buyer, it is legally entitled to revenues less operating expenses generated during this period, and the Company’s Board of Directors has historically made a discretionary adjustment to include this cash in the amount available for distribution. Conversely, when the Company is the seller, the Company’s Board of Directors has historically made a discretionary adjustment to reduce this cash from the amount available for distribution during the period. Beginning with the quarter ended June 30, 2015, the Board decided to no longer make this discretionary adjustment. |
(6) | Represents reserves and settlements related to legal matters. |
(7) | Represents primarily working capital adjustments. These adjustments may or may not impact cash provided by (used in) operating activities during the respective period, but are included as discretionary adjustments considered by the Company’s Board of Directors as the Board historically has not varied the distribution it declares period to period based on uneven cash flows. The Company’s Board of Directors, when determining the appropriate level of cash distributions, excluded the impact of the timing of cash receipts and payments; as such, this adjustment is necessary to show the historical amounts considered by the Company’s Board of Directors in assessing the appropriate distribution amount for each period. This adjustment also includes a reduction for accrued contractual interest on the Second Lien Notes of approximately $14 million for the year ended December 31, 2015. |
(8) | Represents the excess (shortfall) of net operating cash flow after distributions to unitholders and discretionary adjustments. Any excess was retained by the Company for future operations, future capital expenditures, future debt service or other future obligations. Any shortfall was funded with cash on hand and/or borrowings under the LINN Credit Facility. In a period where no distribution is paid, the Company will retain all excess of net operating cash flow for future operations, future capital expenditures, future debt service or other future obligations. |
Any cash generated by Berry is currently being used by Berry to fund its activities. To the extent that Berry generates cash in excess of its needs and determines to distribute such amounts to LINN Energy, the indentures governing Berry’s senior notes limit the amount it may distribute to LINN Energy to the amount available under a “restricted payments basket,” and Berry may not distribute any such amounts unless it is permitted by the indentures to incur additional debt pursuant to the consolidated coverage ratio test set forth in the Berry indentures. Berry’s restricted payments basket was approximately $529 million at December 31, 2015, and may be increased in accordance with the terms of the Berry indentures by, among other things, 50% of Berry’s future net income, reductions in its indebtedness and restricted investments, and future capital contributions.
A summary of the significant sources and uses of funding for the respective periods is presented below:
Year Ended December 31, | |||||||||||
2015 | 2014 | 2013 | |||||||||
(in thousands) | |||||||||||
Net cash provided by operating activities | $ | 1,249,457 | $ | 1,711,890 | $ | 1,166,212 | |||||
Distributions to unitholders | (323,878 | ) | (962,048 | ) | (682,241 | ) | |||||
Excess of net cash provided by operating activities after distributions to unitholders | 925,579 | 749,842 | 483,971 | ||||||||
Plus (less): | |||||||||||
Net cash provided by (used in) financing activities (excluding distributions to unitholders) | (617,918 | ) | 1,119,900 | 820,274 | |||||||
Acquisition of oil and natural gas properties and joint-venture funding, net of cash acquired | — | (2,479,252 | ) | (279,213 | ) | ||||||
Development of oil and natural gas properties | (608,889 | ) | (1,569,877 | ) | (1,078,025 | ) | |||||
Purchases of other property and equipment | (66,708 | ) | (74,540 | ) | (92,352 | ) | |||||
Proceeds from sale of properties and equipment and other | 368,295 | 2,203,565 | 196,273 | ||||||||
Net increase (decrease) in cash and cash equivalents | $ | 359 | $ | (50,362 | ) | $ | 50,928 | ||||
72
Item 7. Management’s Discussion and Analysis of Financial Condition and Results of Operations - Continued
Critical Accounting Policies and Estimates
The discussion and analysis of the Company’s financial condition and results of operations is based on the consolidated financial statements, which have been prepared in accordance with U.S. generally accepted accounting principles. The preparation of these financial statements requires management of the Company to make estimates and assumptions that affect the reported amounts of assets, liabilities, revenues and expenses, and related disclosures of contingent assets and liabilities. These estimates and assumptions are based on management’s best estimates and judgment. Management evaluates its estimates and assumptions on an ongoing basis using historical experience and other factors that are believed to be reasonable under the circumstances. Such estimates and assumptions are adjusted when facts and circumstances dictate. Actual results may differ from these estimates and assumptions used in the preparation of the financial statements.
Below are expanded discussions of the Company’s more significant accounting policies, estimates and judgments, i.e., those that reflect more significant estimates and assumptions used in the preparation of its financial statements. See Note 1 for details about additional accounting policies and estimates made by Company management.
Recently Issued Accounting Standards
For a discussion of recently issued accounting standards, see Note 1.
Oil and Natural Gas Reserves
Proved reserves are based on the quantities of oil, natural gas and NGL that by analysis of geoscience and engineering data can be estimated with reasonable certainty to be economically producible from a given date forward, from known reservoirs, and under existing economic conditions, operating methods and government regulations prior to the time at which contracts providing the right to operate expire, unless evidence indicates that renewal is reasonably certain. The independent engineering firm, DeGolyer and MacNaughton, prepared a reserve and economic evaluation of all of the Company properties on a well-by-well basis as of December 31, 2015, and the reserve estimates reported herein were prepared by DeGolyer and MacNaughton. The reserve estimates were reviewed and approved by the Company’s senior engineering staff and management, with final approval by its Executive Vice President and Chief Operating Officer.
Reserves and their relation to estimated future net cash flows impact the Company’s depletion and impairment calculations. As a result, adjustments to depletion and impairment are made concurrently with changes to reserve estimates. The process performed by the independent engineers to prepare reserve amounts included their estimation of reserve quantities, future production rates, future net revenue and the present value of such future net revenue, based in part on data provided by the Company. The estimates of reserves conform to the guidelines of the SEC, including the criteria of “reasonable certainty,” as it pertains to expectations about the recoverability of reserves in future years.
The accuracy of reserve estimates is a function of many factors including the following: the quality and quantity of available data, the interpretation of that data, the accuracy of various mandated economic assumptions and the judgments of the individuals preparing the estimates. In addition, reserve estimates are a function of many assumptions, all of which could deviate significantly from actual results. As such, reserve estimates may materially vary from the ultimate quantities of oil, natural gas and NGL eventually recovered. For additional information regarding estimates of reserves, including the standardized measure of discounted future net cash flows, see “Supplemental Oil and Natural Gas Data (Unaudited)” in Item 8. “Financial Statements and Supplementary Data” and see also Item 1. “Business.”
Oil and Natural Gas Properties
Proved Properties
The Company accounts for oil and natural gas properties in accordance with the successful efforts method. In accordance with this method, all leasehold and development costs of proved properties are capitalized and amortized on a unit-of-production basis over the remaining life of the proved reserves and proved developed reserves, respectively. Costs of retired, sold or abandoned properties that constitute a part of an amortization base are charged or credited, net of proceeds, to accumulated depreciation, depletion and amortization unless doing so significantly affects the unit-of-production amortization rate, in which case a gain or loss is recognized currently. Gains or losses from the disposal of other properties are recognized currently. Expenditures for maintenance and repairs necessary to maintain properties in operating condition
73
Item 7. Management’s Discussion and Analysis of Financial Condition and Results of Operations - Continued
are expensed as incurred. Estimated dismantlement and abandonment costs are capitalized, net of salvage, at their estimated net present value and amortized on a unit-of-production basis over the remaining life of the related proved developed reserves. The Company capitalizes interest on borrowed funds related to its share of costs associated with the drilling and completion of new oil and natural gas wells. Interest is capitalized only during the periods in which these assets are brought to their intended use. The Company capitalized interest costs of approximately $5 million, $9 million and $2 million for the years ended December 31, 2015, December 31, 2014, and December 31, 2013, respectively.
The Company evaluates the impairment of its proved oil and natural gas properties on a field-by-field basis whenever events or changes in circumstances indicate that the carrying value may not be recoverable. The carrying values of proved properties are reduced to fair value when the expected undiscounted future cash flows of proved and risk-adjusted probable and possible reserves are less than net book value. The fair values of proved properties are measured using valuation techniques consistent with the income approach, converting future cash flows to a single discounted amount. Significant inputs used to determine the fair values of proved properties include estimates of: (i) reserves; (ii) future operating and development costs; (iii) future commodity prices; and (iv) a market-based weighted average cost of capital rate. These inputs require significant judgments and estimates by the Company’s management at the time of the valuation and are the most sensitive and subject to change. The underlying commodity prices embedded in the Company’s estimated cash flows are the product of a process that begins with New York Mercantile Exchange forward curve pricing, adjusted for estimated location and quality differentials, as well as other factors that Company management believes will impact realizable prices.
Based on the analysis described above, for the years ended December 31, 2015, December 31, 2014, and December 31, 2013, the Company recorded noncash impairment charges (before and after tax) of approximately $4.9 billion, $2.3 billion and $791 million, respectively, associated with proved oil and natural gas properties. The carrying values of the impaired proved properties were reduced to fair value, estimated using inputs characteristic of a Level 3 fair value measurement. The impairment charges are included in “impairment of long-lived assets” on the consolidated statements of operations.
Unproved Properties
Costs related to unproved properties include costs incurred to acquire unproved reserves. Because these reserves do not meet the definition of proved reserves, the related costs are not classified as proved properties. Unproved leasehold costs are capitalized and amortized on a composite basis if individually insignificant, based on past success, experience and average lease-term lives. Individually significant leases are reclassified to proved properties if successful and expensed on a lease by lease basis if unsuccessful or the lease term expires. Unamortized leasehold costs related to successful exploratory drilling are reclassified to proved properties and depleted on a unit-of-production basis. The Company assesses unproved properties for impairment quarterly on the basis of its experience in similar situations and other factors such as the primary lease terms of the properties, the average holding period of unproved properties and the relative proportion of such properties on which proved reserves have been found in the past.
Based primarily on no future plans to develop properties in certain operating areas as a result of declines in commodity prices, for the year ended December 31, 2015, the Company recorded noncash impairment charges (before and after tax) of approximately $899 million associated with unproved oil and natural gas properties. The carrying values of the impaired unproved properties were reduced to fair value, estimated using inputs characteristic of a Level 3 fair value measurement. The impairment charges are included in “impairment of long-lived assets” on the consolidated statement of operations.
Exploration Costs
Geological and geophysical costs, delay rentals, amortization and impairment of unproved leasehold costs and costs to drill exploratory wells that do not find proved reserves are expensed as exploration costs. The costs of any exploratory wells are carried as an asset if the well finds a sufficient quantity of reserves to justify its capitalization as a producing well and as long as the Company is making sufficient progress towards assessing the reserves and the economic and operating viability of the project. The Company recorded noncash leasehold impairment expenses related to unproved properties of approximately $2 million, $125 million and $5 million for the years ended December 31, 2015, December 31, 2014, and December 31, 2013, respectively, which are included in “exploration costs” on the consolidated statements of operations.
Revenue Recognition
Sales of oil, natural gas and NGL are recognized when the product has been delivered to a custody transfer point, persuasive evidence of a sales arrangement exists, the rights and responsibility of ownership pass to the purchaser upon delivery,
74
Item 7. Management’s Discussion and Analysis of Financial Condition and Results of Operations - Continued
collection of revenue from the sale is reasonably assured and the sales price is fixed or determinable. In addition, the Company engages in the purchase, gathering and transportation of third-party natural gas and subsequently markets such natural gas to independent purchasers under separate arrangements. As such, the Company separately reports third-party marketing revenues and marketing expenses.
Derivative Instruments
The Company has hedged a portion of its forecasted production to reduce exposure to fluctuations in oil and natural gas prices. The current direct NGL hedging market is constrained in terms of price, volume, duration and number of counterparties, which limits the Company’s ability to effectively hedge its NGL production. The Company also hedges its exposure to natural gas differentials in certain operating areas but does not currently hedge exposure to oil differentials. By removing a portion of the price volatility associated with future production, the Company expects to mitigate, but not eliminate, the potential effects of variability in net cash provided by operating activities due to fluctuations in commodity prices.
The Company maintains a substantial portion of its hedges in the form of swap contracts. From time to time, the Company has chosen to purchase put option contracts to hedge volumes in excess of those already hedged with swap contracts. In 2013, the Company assumed certain derivative contracts that Berry had entered into prior to the acquisition date, including swap contracts, collars and three-way collars. The Company does not enter into derivative contracts for trading purposes.
A swap contract specifies a fixed price that the Company will receive from the counterparty as compared to floating market prices, and on the settlement date the Company will receive or pay the difference between the swap price and the market price. A put option requires the Company to pay the counterparty a premium equal to the fair value of the option at the purchase date and receive from the counterparty the excess, if any, of the fixed price floor over the market price at the settlement date. Collar contracts specify floor and ceiling prices to be received as compared to floating market prices. Three-way collar contracts combine a short put (the lower price), a long put (the middle price) and a short call (the higher price) to provide a higher ceiling price as compared to a regular collar and limit downside risk to the market price plus the difference between the middle price and the lower price if the market price drops below the lower price.
Derivative instruments are recorded at fair value and included on the consolidated balance sheets as assets or liabilities. The Company did not designate any of its contracts as cash flow hedges; therefore, the changes in fair value of these instruments are recorded in current earnings. The Company determines the fair value of its oil and natural gas derivatives utilizing pricing models that use a variety of techniques, including market quotes and pricing analysis. Inputs to the pricing models include publicly available prices and forward price curves generated from a compilation of data gathered from third parties. Company management validates the data provided by third parties by understanding the pricing models used, obtaining market values from other pricing sources, analyzing pricing data in certain situations and confirming that those instruments trade in active markets. Assumed credit risk adjustments, based on published credit ratings, public bond yield spreads and credit default swap spreads are applied to the Company’s commodity derivatives. See Note 7 and Note 8 for additional details about the Company’s derivative financial instruments. See Item 7A. “Quantitative and Qualitative Disclosures About Market Risk” for sensitivity analysis regarding the Company’s derivative financial instruments.
The Company may from time to time enter into derivative contracts in the form of interest rate swaps to minimize the effects of fluctuations in interest rates. At December 31, 2015, the Company had no outstanding derivative contracts in the form of interest rate swaps.
Acquisition Accounting
The Company accounts for business combinations under the acquisition method of accounting (see Note 2). Accordingly, the Company recognizes amounts for identifiable assets acquired and liabilities assumed equal to their estimated acquisition date fair values. Transaction and integration costs associated with business combinations are expensed as incurred. Any excess of the acquisition price over the estimated fair value of net assets acquired is recorded as goodwill while any excess of the estimated fair value of net assets acquired over the acquisition price is recorded in current earnings as a gain.
The Company makes various assumptions in estimating the fair values of assets acquired and liabilities assumed. As fair value is a market-based measurement, it is determined based on the assumptions that market participants would use. The
75
Item 7. Management’s Discussion and Analysis of Financial Condition and Results of Operations - Continued
most significant assumptions relate to the estimated fair values of proved and unproved oil and natural gas properties. The fair values of these properties are measured using valuation techniques that convert future cash flows to a single discounted amount. Significant inputs to the valuation include estimates of: (i) reserves; (ii) future operating and development costs; (iii) future commodity prices; and (iv) a market-based weighted average cost of capital rate. The market-based weighted average cost of capital rate is subjected to additional project-specific risking factors. To compensate for the inherent risk of estimating and valuing unproved properties, the discounted future net revenues of probable and possible reserves are reduced by additional risk-weighting factors. In addition, when appropriate, the Company reviews comparable purchases and sales of oil and natural gas properties within the same regions, and uses that data as a proxy for fair market value; i.e., the amount a willing buyer and seller would enter into in exchange for such properties.
While the estimated fair values of the assets acquired and liabilities assumed have no effect on cash flow, they can have an effect on future results of operations. Generally, higher fair values assigned to oil and natural gas properties result in higher future depreciation, depletion and amortization expense, which results in decreased future net income. Also, a higher fair value assigned to oil and natural gas properties, based on higher future estimates of commodity prices, could increase the likelihood of impairment in the event of lower commodity prices or higher operating costs than those originally used to determine fair value. The recording of impairment expense has no effect on cash flow but results in a decrease in net income for the period in which the impairment is recorded.
Item 7A. Quantitative and Qualitative Disclosures About Market Risk
The Company’s primary market risks are attributable to fluctuations in commodity prices and interest rates. These risks can affect the Company’s business, financial condition, operating results and cash flows. See below for quantitative and qualitative information about these risks. The disclosures are not meant to be precise indicators of expected future losses, but rather indicators of reasonably possible losses. This forward-looking information provides indicators of how the Company views and manages its ongoing market risk exposures.
The following should be read in conjunction with the financial statements and related notes included elsewhere in this Annual Report on Form 10-K. The reference to a “Note” herein refers to the accompanying Notes to Consolidated Financial Statements contained in Item 8. “Financial Statements and Supplementary Data.”
Commodity Price Risk
The Company’s most significant market risk relates to prices of oil, natural gas and NGL. The Company expects commodity prices to remain volatile and unpredictable. As commodity prices decline or rise significantly, revenues and cash flows are likewise affected. In addition, future declines in commodity prices may result in noncash write-downs of the Company’s carrying amounts of its assets.
The Company has hedged a portion of its forecasted production to reduce exposure to fluctuations in oil and natural gas prices and provide long-term cash flow predictability to manage its business, service debt, and, if and when resumed, pay distributions. The current direct NGL hedging market is constrained in terms of price, volume, duration and number of counterparties, which limits the Company’s ability to effectively hedge its NGL production. The Company also hedges its exposure to natural gas differentials in certain operating areas but does not currently hedge exposure to oil differentials. By removing a portion of the price volatility associated with future production, the Company expects to mitigate, but not eliminate, the potential effects of variability in net cash provided by operating activities due to fluctuations in commodity prices.
The appropriate level of production to be hedged is an ongoing consideration and is based on a variety of factors, including current and future expected commodity market prices, cost and availability of put option contracts, the level of acquisition activity and the Company’s overall risk profile, including leverage and size and scale considerations. In addition, when commodity prices are depressed and forward commodity price curves are flat or in backwardation, the Company may determine that the benefit of hedging its anticipated production at these levels is outweighed by its resultant inability to obtain higher revenues for its production if commodity prices recover during the duration of the contracts. As a result, the appropriate percentage of production volumes to be hedged may change over time.
76
Item 7A. Quantitative and Qualitative Disclosures About Market Risk - Continued
The Company maintains a substantial portion of its hedges in the form of swap contracts. From time to time, the Company has chosen to purchase put option contracts to hedge volumes in excess of those already hedged with swap contracts; however, the Company did not purchase any put options in 2015, 2014 or 2013. In 2013, the Company assumed certain derivative contracts that Berry Petroleum Company, now Berry Petroleum Company, LLC (“Berry”) had entered into prior to the acquisition date, including swap contracts, collars and three-way collars. The Company does not enter into derivative contracts for trading purposes. There have been no significant changes to the Company’s objectives, general strategies or instruments used to manage the Company’s commodity price risk exposures from the year ended December 31, 2014.
In certain historical periods, the Company paid an incremental premium to increase the fixed price floors on existing put options because the Company typically hedges multiple years in advance and in some cases commodity prices had increased significantly beyond the initial hedge prices. As a result, the Company determined that the existing put option strike prices did not provide reasonable downside protection in the context of the current market.
At December 31, 2015, the fair value of fixed price swaps and put option contracts was a net asset of approximately $1.7 billion. A 10% increase in the index oil and natural gas prices above December 31, 2015, prices would result in a net asset of approximately $1.5 billion, which represents a decrease in the fair value of approximately $190 million; conversely, a 10% decrease in the index oil and natural gas prices below December 31, 2015, prices would result in a net asset of approximately $1.9 billion, which represents an increase in the fair value of approximately $190 million.
At December 31, 2014, the fair value of fixed price swaps, put option contracts, collars and three-way collars was a net asset of approximately $1.8 billion. A 10% increase in the index oil and natural gas prices above December 31, 2014, prices would result in a net asset of approximately $1.4 billion, which represents a decrease in the fair value of approximately $423 million; conversely, a 10% decrease in the index oil and natural gas prices below December 31, 2014, prices would result in a net asset of approximately $2.2 billion, which represents an increase in the fair value of approximately $421 million.
The Company determines the fair value of its oil and natural gas derivatives utilizing pricing models that use a variety of techniques, including market quotes and pricing analysis. Inputs to the pricing models include publicly available prices and forward price curves generated from a compilation of data gathered from third parties. Company management validates the data provided by third parties by understanding the pricing models used, obtaining market values from other pricing sources, analyzing pricing data in certain situations and confirming that those instruments trade in active markets.
The prices of oil, natural gas and NGL have been extremely volatile, and the Company expects this volatility to continue. Prices for these commodities may fluctuate widely in response to relatively minor changes in the supply of and demand for such commodities, market uncertainty and a variety of additional factors that are beyond its control. Actual gains or losses recognized related to the Company’s derivative contracts will likely differ from those estimated at December 31, 2015, and will depend exclusively on the price of the commodities on the specified settlement dates provided by the derivative contracts.
The Company cannot be assured that its counterparties will be able to perform under its derivative contracts. If a counterparty fails to perform and the derivative arrangement is terminated, the Company’s cash flows could be impacted.
Interest Rate Risk
At December 31, 2015, the Company had debt outstanding under its credit facilities and term loan of approximately $3.6 billion which incurred interest at floating rates (see Note 6). A 1% increase in the London Interbank Offered Rate (“LIBOR”) would result in an estimated $36 million increase in annual interest expense.
At December 31, 2014, the Company had debt outstanding under its credit facilities and term loan of approximately $3.5 billion which incurred interest at floating rates. A 1% increase in the LIBOR would result in an estimated $35 million increase in annual interest expense.
77
Item 7A. Quantitative and Qualitative Disclosures About Market Risk - Continued
Counterparty Credit Risk
The Company accounts for its commodity derivatives at fair value on a recurring basis (see Note 8). The fair value of these derivative financial instruments includes the impact of assumed credit risk adjustments, which are based on the Company’s and counterparties’ published credit ratings, public bond yield spreads and credit default swap spreads, as applicable.
At December 31, 2015, the average public bond yield spread utilized to estimate the impact of the Company’s credit risk on derivative liabilities was approximately 3.23%. A 1% increase in the average public bond yield spread would result in an estimated $25,000 increase in net income for the year ended December 31, 2015. At December 31, 2015, the credit default swap spreads utilized to estimate the impact of counterparties’ credit risk on derivative assets ranged between 0% and 2.64%. A 1% increase in each of the counterparties’ credit default swap spreads would result in an estimated $15 million decrease in net income for the year ended December 31, 2015.
At December 31, 2014, the average public bond yield spread utilized to estimate the impact of the Company’s credit risk on derivative liabilities was approximately 1.85%. A 1% increase in the average public bond yield spread would result in an estimated $18,000 increase in net income for the year ended December 31, 2014. At December 31, 2014, the credit default swap spreads utilized to estimate the impact of counterparties’ credit risk on derivative assets ranged between 0% and 2.15%. A 1% increase in each of the counterparties’ credit default swap spreads would result in an estimated $20 million decrease in net income for the year ended December 31, 2014.
78
Item 8. Financial Statements and Supplementary Data
INDEX TO CONSOLIDATED FINANCIAL STATEMENTS AND SUPPLEMENTARY DATA
Page | |
79
MANAGEMENT’S REPORT ON INTERNAL CONTROL OVER FINANCIAL REPORTING
Our management is responsible for establishing and maintaining adequate internal control over financial reporting, as defined in Rules 13a-15(f) and 15d-15(f) of the Securities Exchange Act of 1934, as amended. Our internal control over financial reporting is a process designed under the supervision of our Chief Executive Officer and Chief Financial Officer to provide reasonable assurance regarding the reliability of financial reporting and the preparation of consolidated financial statements for external purposes in accordance with accounting principles generally accepted in the United States.
Because of its inherent limitations, internal control over financial reporting may not detect or prevent misstatements. Projections of any evaluation of the effectiveness to future periods are subject to risk that controls may become inadequate because of changes in conditions, or that the degree of compliance with the policies or processes may deteriorate.
As of December 31, 2015, our management assessed the effectiveness of the Company’s internal control over financial reporting based on the criteria for effective internal control over financial reporting established in Internal Control – Integrated Framework (2013) by the Committee of Sponsoring Organizations of the Treadway Commission (COSO). Based on the assessment, management determined that we maintained effective internal control over financial reporting as of December 31, 2015, based on those criteria.
KPMG LLP, the independent registered public accounting firm that audited the consolidated financial statements of the Company included in this Annual Report on Form 10-K, has issued an attestation report on the effectiveness of the Company’s internal control over financial reporting as of December 31, 2015, which is included herein.
/s/ Linn Energy, LLC
80
REPORT OF INDEPENDENT REGISTERED PUBLIC ACCOUNTING FIRM
The Board of Directors and Unitholders
Linn Energy, LLC:
We have audited the accompanying consolidated balance sheets of Linn Energy, LLC and subsidiaries as of December 31, 2015 and 2014, and the related consolidated statements of operations, unitholders’ capital (deficit), and cash flows for each of the years in the three-year period ended December 31, 2015. These consolidated financial statements are the responsibility of the Company’s management. Our responsibility is to express an opinion on these consolidated financial statements based on our audits.
We conducted our audits in accordance with the standards of the Public Company Accounting Oversight Board (United States). Those standards require that we plan and perform the audit to obtain reasonable assurance about whether the financial statements are free of material misstatement. An audit includes examining, on a test basis, evidence supporting the amounts and disclosures in the financial statements. An audit also includes assessing the accounting principles used and significant estimates made by management, as well as evaluating the overall financial statement presentation. We believe that our audits provide a reasonable basis for our opinion.
In our opinion, the consolidated financial statements referred to above present fairly, in all material respects, the financial position of Linn Energy, LLC and subsidiaries as of December 31, 2015 and 2014, and the results of their operations and their cash flows for each of the years in the three-year period ended December 31, 2015, in conformity with U.S. generally accepted accounting principles.
The accompanying consolidated financial statements have been prepared assuming that the Company will continue as a going concern. As discussed in Note 1 to the consolidated financial statements, because of continued low commodity prices, the Company has suffered recurring losses from operations and is in violation of a restrictive covenant and expects to be in violation of financial covenants contained in its credit facilities that would accelerate the maturity of the outstanding indebtedness making it immediately due and payable. The Company does not have sufficient liquidity to meet the accelerated debt service requirements. These issues raise substantial doubt about the Company’s ability to continue as a going concern. Management’s plans in regard to these matters are also described in Note 1. The financial statements do not include any adjustments that might result from the outcome of this uncertainty.
We also have audited, in accordance with the standards of the Public Company Accounting Oversight Board (United States), Linn Energy, LLC’s internal control over financial reporting as of December 31, 2015, based on criteria established in Internal Control – Integrated Framework (2013) issued by the Committee of Sponsoring Organizations of the Treadway Commission (COSO), and our report dated March 15, 2016, expressed an unqualified opinion on the effectiveness of the Company’s internal control over financial reporting.
/s/ KPMG LLP
Houston, Texas
March 15, 2016
81
REPORT OF INDEPENDENT REGISTERED PUBLIC ACCOUNTING FIRM
The Board of Directors and Unitholders
Linn Energy, LLC:
We have audited Linn Energy, LLC’s internal control over financial reporting as of December 31, 2015, based on criteria established in Internal Control – Integrated Framework (2013) issued by the Committee of Sponsoring Organizations of the Treadway Commission (COSO). Linn Energy, LLC’s management is responsible for maintaining effective internal control over financial reporting and for its assessment of the effectiveness of internal control over financial reporting, included in the accompanying Management’s Report on Internal Control Over Financial Reporting. Our responsibility is to express an opinion on the Company’s internal control over financial reporting based on our audit.
We conducted our audit in accordance with the standards of the Public Company Accounting Oversight Board (United States). Those standards require that we plan and perform the audit to obtain reasonable assurance about whether effective internal control over financial reporting was maintained in all material respects. Our audit included obtaining an understanding of internal control over financial reporting, assessing the risk that a material weakness exists, and testing and evaluating the design and operating effectiveness of internal control based on the assessed risk. Our audit also included performing such other procedures as we considered necessary in the circumstances. We believe that our audit provides a reasonable basis for our opinion.
A company’s internal control over financial reporting is a process designed to provide reasonable assurance regarding the reliability of financial reporting and the preparation of financial statements for external purposes in accordance with generally accepted accounting principles. A company’s internal control over financial reporting includes those policies and procedures that (1) pertain to the maintenance of records that, in reasonable detail, accurately and fairly reflect the transactions and dispositions of the assets of the company; (2) provide reasonable assurance that transactions are recorded as necessary to permit preparation of financial statements in accordance with generally accepted accounting principles, and that receipts and expenditures of the company are being made only in accordance with authorizations of management and directors of the company; and (3) provide reasonable assurance regarding prevention or timely detection of unauthorized acquisition, use, or disposition of the company’s assets that could have a material effect on the financial statements.
Because of its inherent limitations, internal control over financial reporting may not prevent or detect misstatements. Also, projections of any evaluation of effectiveness to future periods are subject to the risk that controls may become inadequate because of changes in conditions, or that the degree of compliance with the policies or procedures may deteriorate.
In our opinion, Linn Energy, LLC maintained, in all material respects, effective internal control over financial reporting as of December 31, 2015, based on criteria established in Internal Control – Integrated Framework (2013) issued by the Committee of Sponsoring Organizations of the Treadway Commission (COSO).
We also have audited, in accordance with the standards of the Public Company Accounting Oversight Board (United States), the consolidated balance sheets of Linn Energy, LLC and subsidiaries as of December 31, 2015 and 2014, and the related consolidated statements of operations, unitholders’ capital (deficit), and cash flows for each of the years in the three-year period ended December 31, 2015, and our report dated March 15, 2016, expressed an unqualified opinion on those consolidated financial statements. Our report dated March 15, 2016, contains an explanatory paragraph that states there is substantial doubt about the Company’s ability to continue as a going concern. The consolidated financial statements do not include any adjustments that might result from the outcome of this uncertainty.
/s/ KPMG LLP
Houston, Texas
March 15, 2016
82
LINN ENERGY, LLC
CONSOLIDATED BALANCE SHEETS
December 31, | |||||||
2015 | 2014 | ||||||
(in thousands, except unit amounts) | |||||||
ASSETS | |||||||
Current assets: | |||||||
Cash and cash equivalents | $ | 2,168 | $ | 1,809 | |||
Accounts receivable – trade, net | 216,556 | 471,684 | |||||
Derivative instruments | 1,220,230 | 1,077,142 | |||||
Other current assets | 119,921 | 155,955 | |||||
Total current assets | 1,558,875 | 1,706,590 | |||||
Noncurrent assets: | |||||||
Oil and natural gas properties (successful efforts method) | 18,121,155 | 18,068,900 | |||||
Less accumulated depletion and amortization | (11,097,492 | ) | (4,867,682 | ) | |||
7,023,663 | 13,201,218 | ||||||
Other property and equipment | 708,711 | 669,149 | |||||
Less accumulated depreciation | (195,661 | ) | (144,282 | ) | |||
513,050 | 524,867 | ||||||
Derivative instruments | 566,401 | 848,097 | |||||
Restricted cash | 257,363 | 6,225 | |||||
Other noncurrent assets | 57,594 | 136,512 | |||||
881,358 | 990,834 | ||||||
Total noncurrent assets | 8,418,071 | 14,716,919 | |||||
Total assets | $ | 9,976,946 | $ | 16,423,509 | |||
LIABILITIES AND UNITHOLDERS’ CAPITAL (DEFICIT) | |||||||
Current liabilities: | |||||||
Accounts payable and accrued expenses | $ | 455,374 | $ | 814,809 | |||
Derivative instruments | 2,241 | — | |||||
Current portion of long-term debt | 3,716,508 | — | |||||
Other accrued liabilities | 119,593 | 167,736 | |||||
Total current liabilities | 4,293,716 | 982,545 | |||||
Noncurrent liabilities: | |||||||
Derivative instruments | 857 | 684 | |||||
Long-term debt, net | 5,328,235 | 10,295,809 | |||||
Other noncurrent liabilities | 623,039 | 600,866 | |||||
Total noncurrent liabilities | 5,952,131 | 10,897,359 | |||||
Commitments and contingencies (Note 11) | |||||||
Unitholders’ capital (deficit): | |||||||
355,017,428 units and 331,974,913 units issued and outstanding at December 31, 2015, and December 31, 2014, respectively | 5,343,116 | 5,395,811 | |||||
Accumulated deficit | (5,612,017 | ) | (852,206 | ) | |||
(268,901 | ) | 4,543,605 | |||||
Total liabilities and unitholders’ capital (deficit) | $ | 9,976,946 | $ | 16,423,509 | |||
The accompanying notes are an integral part of these consolidated financial statements.
83
LINN ENERGY, LLC
CONSOLIDATED STATEMENTS OF OPERATIONS
Year Ended December 31, | |||||||||||
2015 | 2014 | 2013 | |||||||||
(in thousands, except per unit amounts) | |||||||||||
Revenues and other: | |||||||||||
Oil, natural gas and natural gas liquids sales | $ | 1,726,271 | $ | 3,610,539 | $ | 2,073,240 | |||||
Gains on oil and natural gas derivatives | 1,056,189 | 1,206,179 | 177,857 | ||||||||
Marketing revenues | 74,129 | 135,260 | 54,171 | ||||||||
Other revenues | 26,745 | 31,325 | 26,387 | ||||||||
2,883,334 | 4,983,303 | 2,331,655 | |||||||||
Expenses: | |||||||||||
Lease operating expenses | 617,764 | 805,164 | 372,523 | ||||||||
Transportation expenses | 219,721 | 207,331 | 128,440 | ||||||||
Marketing expenses | 57,144 | 117,465 | 37,892 | ||||||||
General and administrative expenses | 296,887 | 293,073 | 236,271 | ||||||||
Exploration costs | 9,473 | 125,037 | 5,251 | ||||||||
Depreciation, depletion and amortization | 805,757 | 1,073,902 | 829,311 | ||||||||
Impairment of long-lived assets | 5,813,954 | 2,303,749 | 828,317 | ||||||||
Taxes, other than income taxes | 181,895 | 267,403 | 138,631 | ||||||||
(Gains) losses on sale of assets and other, net | (197,409 | ) | (366,500 | ) | 13,637 | ||||||
7,805,186 | 4,826,624 | 2,590,273 | |||||||||
Other income and (expenses): | |||||||||||
Interest expense, net of amounts capitalized | (546,453 | ) | (587,838 | ) | (421,137 | ) | |||||
Gain (loss) on extinguishment of debt | 719,259 | — | (5,304 | ) | |||||||
Other, net | (17,226 | ) | (16,213 | ) | (8,477 | ) | |||||
155,580 | (604,051 | ) | (434,918 | ) | |||||||
Loss before income taxes | (4,766,272 | ) | (447,372 | ) | (693,536 | ) | |||||
Income tax expense (benefit) | (6,461 | ) | 4,437 | (2,199 | ) | ||||||
Net loss | $ | (4,759,811 | ) | $ | (451,809 | ) | $ | (691,337 | ) | ||
Net loss per unit: | |||||||||||
Basic | $ | (13.87 | ) | $ | (1.40 | ) | $ | (2.94 | ) | ||
Diluted | $ | (13.87 | ) | $ | (1.40 | ) | $ | (2.94 | ) | ||
Weighted average units outstanding: | |||||||||||
Basic | 343,323 | 328,918 | 237,544 | ||||||||
Diluted | 343,323 | 328,918 | 237,544 | ||||||||
Distributions declared per unit | $ | 0.938 | $ | 2.90 | $ | 2.90 | |||||
The accompanying notes are an integral part of these consolidated financial statements.
84
LINN ENERGY, LLC
CONSOLIDATED STATEMENTS OF UNITHOLDERS’ CAPITAL (DEFICIT)
Units | Unitholders’ Capital | Accumulated Income (Deficit) | Treasury Units (at Cost) | Total Unitholders’ Capital (Deficit) | ||||||||||||||
(in thousands) | ||||||||||||||||||
December 31, 2012 | 234,513 | $ | 4,136,240 | $ | 290,940 | $ | — | $ | 4,427,180 | |||||||||
Issuance of units | 95,148 | 2,783,907 | — | — | 2,783,907 | |||||||||||||
Distributions to unitholders | (682,241 | ) | — | — | (682,241 | ) | ||||||||||||
Unit-based compensation expenses | 42,703 | — | — | 42,703 | ||||||||||||||
Reclassification of distributions paid on forfeited restricted units | 176 | — | — | 176 | ||||||||||||||
Excess tax benefit from unit-based compensation | 160 | — | — | 160 | ||||||||||||||
Deferred tax on capital contribution | 10,879 | — | — | 10,879 | ||||||||||||||
Net loss | — | (691,337 | ) | — | (691,337 | ) | ||||||||||||
December 31, 2013 | 329,661 | 6,291,824 | (400,397 | ) | — | 5,891,427 | ||||||||||||
Issuance of units | 2,314 | 13,354 | — | — | 13,354 | |||||||||||||
Distributions to unitholders | (962,048 | ) | — | — | (962,048 | ) | ||||||||||||
Unit-based compensation expenses | 53,284 | — | — | 53,284 | ||||||||||||||
Reclassification of distributions paid on forfeited restricted units | 602 | — | — | 602 | ||||||||||||||
Excess tax benefit from unit-based compensation and other | 347 | — | — | 347 | ||||||||||||||
Deferred tax on capital contribution | (1,552 | ) | — | — | (1,552 | ) | ||||||||||||
Net loss | — | (451,809 | ) | — | (451,809 | ) | ||||||||||||
December 31, 2014 | 331,975 | 5,395,811 | (852,206 | ) | — | 4,543,605 | ||||||||||||
Sale of units, net of offering costs of $8,762 | 19,622 | 224,665 | — | — | 224,665 | |||||||||||||
Issuance of units | 3,611 | — | — | — | — | |||||||||||||
Cancellation of units | (191 | ) | (672 | ) | — | 672 | — | |||||||||||
Purchase of units | — | — | (672 | ) | (672 | ) | ||||||||||||
Distributions to unitholders | (323,878 | ) | — | — | (323,878 | ) | ||||||||||||
Unit-based compensation expenses | 56,136 | — | — | 56,136 | ||||||||||||||
Reclassification of distributions paid on forfeited restricted units | 865 | — | — | 865 | ||||||||||||||
Excess tax benefit from unit-based compensation and other | (9,811 | ) | — | — | (9,811 | ) | ||||||||||||
Net loss | — | (4,759,811 | ) | — | (4,759,811 | ) | ||||||||||||
December 31, 2015 | 355,017 | $ | 5,343,116 | $ | (5,612,017 | ) | $ | — | $ | (268,901 | ) | |||||||
The accompanying notes are an integral part of these consolidated financial statements.
85
LINN ENERGY, LLC
CONSOLIDATED STATEMENTS OF CASH FLOWS
Year Ended December 31, | |||||||||||
2015 | 2014 | 2013 | |||||||||
(in thousands) | |||||||||||
Cash flow from operating activities: | |||||||||||
Net loss | $ | (4,759,811 | ) | $ | (451,809 | ) | $ | (691,337 | ) | ||
Adjustments to reconcile net loss to net cash provided by operating activities: | |||||||||||
Depreciation, depletion and amortization | 805,757 | 1,073,902 | 829,311 | ||||||||
Impairment of long-lived assets | 5,813,954 | 2,303,749 | 828,317 | ||||||||
Unit-based compensation expenses | 56,136 | 53,284 | 42,703 | ||||||||
(Gain) loss on extinguishment of debt | (719,259 | ) | — | 5,304 | |||||||
Amortization and write-off of deferred financing fees | 34,743 | 50,926 | 21,507 | ||||||||
(Gains) losses on sale of assets and other, net | (189,161 | ) | (261,571 | ) | 37,232 | ||||||
Deferred income taxes | 4,538 | 3,943 | (2,541 | ) | |||||||
Derivatives activities: | |||||||||||
Total gains | (1,063,082 | ) | (1,206,179 | ) | (177,857 | ) | |||||
Cash settlements | 1,199,410 | 95,514 | 248,862 | ||||||||
Cash settlements on canceled derivatives | 4,679 | 12,281 | — | ||||||||
Changes in assets and liabilities: | |||||||||||
Decrease in accounts receivable – trade, net | 267,241 | 5,064 | 89,188 | ||||||||
(Increase) decrease in other assets | 9,582 | (17,824 | ) | 16,179 | |||||||
Increase (decrease) in accounts payable and accrued expenses | (156,394 | ) | 99,029 | (76,993 | ) | ||||||
Decrease in other liabilities | (58,876 | ) | (48,419 | ) | (3,663 | ) | |||||
Net cash provided by operating activities | 1,249,457 | 1,711,890 | 1,166,212 | ||||||||
Cash flow from investing activities: | |||||||||||
Acquisition of oil and natural gas properties and joint-venture funding, net of cash acquired | — | (2,479,252 | ) | (279,213 | ) | ||||||
Development of oil and natural gas properties | (608,889 | ) | (1,569,877 | ) | (1,078,025 | ) | |||||
Purchases of other property and equipment | (66,708 | ) | (74,540 | ) | (92,352 | ) | |||||
Proceeds from sale of properties and equipment and other | 368,295 | 2,203,565 | 196,273 | ||||||||
Net cash used in investing activities | (307,302 | ) | (1,920,104 | ) | (1,253,317 | ) | |||||
Cash flow from financing activities: | |||||||||||
Proceeds from sale of units | 233,427 | — | — | ||||||||
Proceeds from borrowings | 1,445,000 | 5,940,024 | 2,230,000 | ||||||||
Repayments of debt | (2,183,879 | ) | (4,811,124 | ) | (1,404,898 | ) | |||||
Distributions to unitholders | (323,878 | ) | (962,048 | ) | (682,241 | ) | |||||
Financing fees and offering costs | (28,055 | ) | (69,694 | ) | (16,033 | ) | |||||
Excess tax benefit from unit-based compensation | (9,467 | ) | 766 | 160 | |||||||
Other | (74,944 | ) | 59,928 | 11,045 | |||||||
Net cash provided by (used in) financing activities | (941,796 | ) | 157,852 | 138,033 | |||||||
Net increase (decrease) in cash and cash equivalents | 359 | (50,362 | ) | 50,928 | |||||||
Cash and cash equivalents: | |||||||||||
Beginning | 1,809 | 52,171 | 1,243 | ||||||||
Ending | $ | 2,168 | $ | 1,809 | $ | 52,171 | |||||
The accompanying notes are an integral part of these consolidated financial statements.
86
LINN ENERGY, LLC
NOTES TO CONSOLIDATED FINANCIAL STATEMENTS
Note 1 – Basis of Presentation and Significant Accounting Policies
Nature of Business
Linn Energy, LLC (“LINN Energy” or the “Company”) is an independent oil and natural gas company that began operations in March 2003 and was formed as a Delaware limited liability company in April 2005. The Company completed its initial public offering in January 2006 and its units representing limited liability company interests (“units”) are listed on the NASDAQ Global Select Market (“NASDAQ”) under the symbol “LINE.” LINN Energy’s mission is to acquire, develop and maximize cash flow from a growing portfolio of long-life oil and natural gas assets.
The Company’s properties are located in eight operating regions in the United States (“U.S.”): Hugoton Basin, which includes properties located in Kansas, the Oklahoma Panhandle and the Shallow Texas Panhandle; Rockies, which includes properties located in Wyoming (Green River, Washakie and Powder River basins), Utah (Uinta Basin), North Dakota (Williston Basin) and Colorado (Piceance Basin); California, which includes properties located in the San Joaquin Valley and Los Angeles basins; TexLa, which includes properties located in east Texas and north Louisiana; Mid-Continent, which includes properties located in the Anadarko and Arkoma basins in Oklahoma, as well as waterfloods in the Central Oklahoma Platform; Michigan/Illinois, which includes properties located in the Antrim Shale formation in north Michigan and oil properties in south Illinois; Permian Basin, which includes properties located in west Texas and southeast New Mexico; and South Texas.
The operations of the Company are governed by the provisions of a limited liability company agreement executed by and among its members. The agreement includes specific provisions with respect to the maintenance of the capital accounts of each of the Company’s unitholders. Pursuant to applicable provisions of the Delaware Limited Liability Company Act (“Delaware Act”) and the Third Amended and Restated Limited Liability Company Agreement of Linn Energy, LLC, as amended (“LLC Agreement”), unitholders have no liability for the debts, obligations and liabilities of the Company, except as expressly required in the LLC Agreement or the Delaware Act. The Company will remain in existence unless and until dissolved in accordance with the terms of the LLC Agreement.
Going Concern Uncertainty
The Company’s liquidity outlook has changed since the third quarter of 2015 due to continued low commodity prices, which are expected to result in significantly lower levels of cash flow from operating activities in the future as the Company’s current commodity derivative contracts expire, and have limited the Company’s ability to access the capital markets. In addition, each of the Company’s Credit Facilities is subject to scheduled redeterminations of its borrowing base, semi-annually in April and October, based primarily on reserve reports using lender commodity price expectations at such time. Continued low commodity prices, reductions in the Company’s capital budget and the resulting reserve write-downs, along with the maturity schedule of the Company’s hedges, are expected to adversely impact the upcoming April redeterminations and will likely have a significant negative impact on the Company’s liquidity.
As a result of these and other factors, the following issues have adversely impacted the Company’s ability to continue as a going concern:
• | the Company’s ability to comply with financial covenants and ratios in its Credit Facilities and indentures has been affected by continued low commodity prices. Absent a waiver or amendment, failure to meet these covenants and ratios would result in a default and, to the extent the applicable lenders so elect, an acceleration of the Company’s existing indebtedness, causing such debt of approximately $3.6 billion to be immediately due and payable. Based on the Company’s current estimates and expectations for commodity prices in 2016, the Company does not expect to remain in compliance with all of the restrictive covenants contained in its Credit Facilities throughout 2016 unless those requirements are waived or amended. The Company does not currently have adequate liquidity to repay all of its outstanding debt in full if such debt were accelerated; |
• | because the Credit Facilities are effectively fully drawn, any reduction of the borrowing bases under the Company’s Credit Facilities would require mandatory prepayments to the extent existing indebtedness exceeds the new borrowing bases. The Company may not have sufficient cash on hand to be able to make any such mandatory prepayments; and |
87
• | the Company’s ability to make interest payments as they become due and repay indebtedness upon maturities (whether under existing terms or as a result of acceleration) is impacted by the Company’s liquidity. As of February 29, 2016, there was less than $1 million of available borrowing capacity under the Credit Facilities. |
The Company’s Credit Facilities contain the requirement to deliver audited consolidated financial statements without a going concern or like qualification or exception. Consequently, as of the filing date, March 15, 2016, the Company is in default under the LINN Credit Facility. If the Company is unable to obtain a waiver or other suitable relief from the lenders under the LINN Credit Facility prior to the expiration of the 30 day grace period, an Event of Default (as defined in the applicable agreements) will result and the lenders holding a majority of the commitments under the LINN Credit Facility could accelerate the outstanding indebtedness, which would make it immediately due and payable. If the Company is unable to obtain a waiver from or otherwise reach an agreement with the lenders under the LINN Credit Facility and the indebtedness under the LINN Credit Facility is accelerated, then an Event of Default under LINN Energy’s senior notes and second lien notes would occur, which, if it continues beyond any applicable cure periods, would, to the extent the applicable lenders so elect, result in the acceleration of those obligations. Furthermore, an Event of Default under the LINN Credit Facility will also result in an Event of Default under the Berry Credit Facility, which in the absence of a waiver or other suitable relief and upon the election of the agent or lenders holding a majority of commitments under the Berry Credit Facility would result in the acceleration of indebtedness under the Berry Credit Facility. Such Event of Default would trigger an Event of Default under the Berry senior notes. If such Event of Default continues beyond any applicable cure periods, such Event of Default would result in an acceleration of the Berry senior notes.
Additionally, the indenture governing the second lien notes (“Second Lien Indenture”) required the Company to deliver mortgages by February 18, 2016, subject to a 45 day grace period. The Company elected to exercise its right to the grace period and not deliver the mortgages, and as a result, the Company is currently in default under the Second Lien Indenture. If the Company does not deliver the mortgages within the 45 day grace period or is otherwise unable to obtain a waiver or other suitable relief from the holders under the Second Lien Indenture prior to the expiration of the 45 day grace period, an Event of Default (as defined in the Second Lien Indenture) will result and if the trustee or noteholders holding at least 25% in the aggregate outstanding principal amount of the second lien notes so elect would accelerate the second lien notes causing them to be immediately due and payable.
Furthermore, the Company has decided to defer making interest payments totaling approximately $60 million due March 15, 2016, including approximately $30 million on LINN Energy’s 7.75% senior notes due February 2021, approximately $12 million on LINN Energy’s 6.50% senior notes due September 2021 and approximately $18 million on Berry’s senior notes due September 2022, which will result in the Company being in default under these senior notes. The indentures governing each of the applicable series of notes permit the Company a 30 day grace period to make the interest payments. If the Company fails to make the interest payments within the grace period, or is otherwise unable to obtain a waiver or suitable relief from the holders of these senior notes, an Event of Default will result and if the trustee or noteholders holding at least 25% in the aggregate outstanding principal amount of each series of notes so elect would accelerate the notes causing them to be immediately due and payable.
An Event of Default under the Second Lien Indenture or any of the indentures governing the senior notes triggers a cross-default under the LINN Credit Facility and Berry Credit Facility and, as discussed above, if the applicable lenders so elect would result in acceleration under the LINN Credit Facility and Berry Credit Facility. In addition, as discussed above, an acceleration of the obligations under the Second Lien Indenture or LINN Credit Facility would trigger a cross-default to LINN Energy’s senior notes and if the applicable lenders so elect would result in a cross-acceleration under LINN Energy’s senior notes, and an acceleration of the Berry Credit Facility if the applicable lenders so elect would result in cross-acceleration under the Berry senior notes.
See Note 6 for additional details about the Company’s debt.
If lenders, and subsequently noteholders, accelerate the Company’s outstanding indebtedness (approximately $9.0 billion as of December 31, 2015), it will become immediately due and payable and the Company will not have sufficient liquidity to repay those amounts. If the Company is unable to reach an agreement with its creditors prior to any of the above described accelerations, the Company could be required to immediately file for protection under Chapter 11 of the U.S. Bankruptcy Code.
88
The significant risks and uncertainties described above raise substantial doubt about the Company’s ability to continue as a going concern. The consolidated financial statements have been prepared on a going concern basis of accounting, which contemplates continuity of operations, realization of assets, and satisfaction of liabilities and commitments in the normal course of business. The consolidated financial statements do not include any adjustments that might result from the outcome of the going concern uncertainty.
The Company is currently in discussions with various stakeholders and is pursuing or considering a number of actions including: (i) obtaining additional sources of capital from asset sales, private issuances of equity or equity-linked securities, debt for equity swaps, or any combination thereof; (ii) pursuing in- and out-of-court restructuring transactions; (iii) obtaining waivers or amendments from its lenders; and (iv) continuing to minimize its capital expenditures, reduce costs and maximize cash flows from operations. There can be no assurance that sufficient liquidity can be obtained from one or more of these actions or that these actions can be consummated within the period needed.
Principles of Consolidation and Reporting
The Company presents its consolidated financial statements in accordance with U.S. generally accepted accounting principles (“GAAP”). The consolidated financial statements include the accounts of the Company and its wholly owned subsidiaries. All significant intercompany transactions and balances have been eliminated upon consolidation. Investments in noncontrolled entities over which the Company exercises significant influence are accounted for under the equity method.
The consolidated financial statements for previous periods include certain reclassifications that were made to conform to current presentation. Such reclassifications have no impact on previously reported net income (loss), unitholders’ capital (deficit) or cash flows.
Use of Estimates
The preparation of the accompanying consolidated financial statements in conformity with GAAP requires management of the Company to make estimates and assumptions about future events. These estimates and the underlying assumptions affect the amount of assets and liabilities reported, disclosures about contingent assets and liabilities, and reported amounts of revenues and expenses. The estimates that are particularly significant to the financial statements include estimates of the Company’s reserves of oil, natural gas and natural gas liquids (“NGL”), future cash flows from oil and natural gas properties, depreciation, depletion and amortization, asset retirement obligations, certain revenues and operating expenses, fair values of commodity derivatives and fair values of assets acquired and liabilities assumed. As fair value is a market-based measurement, it is determined based on the assumptions that market participants would use. These estimates and assumptions are based on management’s best estimates and judgment. Management evaluates its estimates and assumptions on an ongoing basis using historical experience and other factors, including the current economic environment, which management believes to be reasonable under the circumstances. Such estimates and assumptions are adjusted when facts and circumstances dictate. As future events and their effects cannot be determined with precision, actual results could differ from these estimates. Any changes in estimates resulting from continuing changes in the economic environment will be reflected in the financial statements in future periods.
Recently Issued Accounting Standards
In November 2015, the Financial Accounting Standards Board (“FASB”) issued an Accounting Standards Update (“ASU”) that is intended to simplify the presentation of deferred taxes by requiring that all deferred taxes be presented as noncurrent. This ASU will be applied either prospectively or retrospectively as of the date of adoption and is effective for fiscal years beginning after December 15, 2016, and interim periods within those years (early adoption permitted). Adoption of this ASU is expected to result in a decrease in the Company’s current assets or current liabilities on its consolidated balance sheets, depending on its deferred taxes classification at such date, with no impact to the consolidated statements of operations.
In April 2015, the FASB issued an ASU that is intended to simplify the presentation of debt issuance costs by requiring that debt issuance costs related to a recognized debt liability be presented in the balance sheet as a direct deduction from the carrying amount of that debt liability, consistent with debt discounts. This ASU will be applied retrospectively as of the date of adoption and is effective for fiscal years beginning after December 15, 2015, and interim periods within those years (early adoption permitted). Adoption of this ASU is expected to result in a decrease to the Company’s assets and liabilities in its consolidated balance sheets, with no impact to the consolidated statements of operations.
89
In August 2014, the FASB issued an ASU that provides guidance about management’s responsibility to evaluate whether there is substantial doubt about an entity’s ability to continue as a going concern and to provide related footnote disclosures. This ASU is effective for the annual period ending after December 15, 2016, and for annual periods and interim periods thereafter (early adoption permitted). The Company does not expect the adoption of this ASU to have a material impact on its financial statements or related disclosures.
In May 2014, the FASB issued an ASU that is intended to improve and converge the financial reporting requirements for revenue from contracts with customers. This ASU will be applied either retrospectively or as a cumulative-effect adjustment as of the date of adoption and is effective for fiscal years beginning after December 15, 2017, and interim periods within those years (early adoption permitted for fiscal years beginning after December 15, 2016, including interim periods within that year). The Company is currently evaluating the impact, if any, of the adoption of this ASU on its consolidated financial statements and related disclosures.
Cash Equivalents
For purposes of the consolidated statements of cash flows, the Company considers all highly liquid short-term investments with original maturities of three months or less to be cash equivalents. Outstanding checks in excess of funds on deposit are included in “accounts payable and accrued expenses” on the consolidated balance sheets and are classified as financing activities on the consolidated statements of cash flows.
Accounts Receivable – Trade, Net
Trade accounts receivable are recorded at the invoiced amount and do not bear interest. The Company maintains an allowance for doubtful accounts for estimated losses inherent in its accounts receivable portfolio. In establishing the required allowance, management considers historical losses, current receivables aging, and existing industry and national economic data. The Company reviews its allowance for doubtful accounts monthly. Past due balances over 90 days and over a specified amount are reviewed individually for collectibility. Account balances are charged off against the allowance after all means of collection have been exhausted and the potential recovery is remote. The balance in the Company’s allowance for doubtful accounts related to trade accounts receivable was approximately $1 million at both December 31, 2015, and December 31, 2014.
Inventories
Materials, supplies and commodity inventories are valued at the lower of average cost or market. Inventories also include California carbon allowance instruments.
Oil and Natural Gas Properties
Proved Properties
The Company accounts for oil and natural gas properties in accordance with the successful efforts method. In accordance with this method, all leasehold and development costs of proved properties are capitalized and amortized on a unit-of-production basis over the remaining life of the proved reserves and proved developed reserves, respectively. Costs of retired, sold or abandoned properties that constitute a part of an amortization base are charged or credited, net of proceeds, to accumulated depreciation, depletion and amortization unless doing so significantly affects the unit-of-production amortization rate, in which case a gain or loss is recognized currently. Gains or losses from the disposal of other properties are recognized currently. Expenditures for maintenance and repairs necessary to maintain properties in operating condition are expensed as incurred. Estimated dismantlement and abandonment costs are capitalized, net of salvage, at their estimated net present value and amortized on a unit-of-production basis over the remaining life of the related proved developed reserves. The Company capitalizes interest on borrowed funds related to its share of costs associated with the drilling and completion of new oil and natural gas wells. Interest is capitalized only during the periods in which these assets are brought to their intended use. The Company capitalized interest costs of approximately $5 million, $9 million and $2 million for the years ended December 31, 2015, December 31, 2014, and December 31, 2013, respectively.
The Company evaluates the impairment of its proved oil and natural gas properties on a field-by-field basis whenever events or changes in circumstances indicate that the carrying value may not be recoverable. The carrying values of proved properties are reduced to fair value when the expected undiscounted future cash flows of proved and risk-adjusted probable and possible reserves are less than net book value. The fair values of proved properties are measured using valuation
90
techniques consistent with the income approach, converting future cash flows to a single discounted amount. Significant inputs used to determine the fair values of proved properties include estimates of: (i) reserves; (ii) future operating and development costs; (iii) future commodity prices; and (iv) a market-based weighted average cost of capital rate. These inputs require significant judgments and estimates by the Company’s management at the time of the valuation and are the most sensitive and subject to change. The underlying commodity prices embedded in the Company’s estimated cash flows are the product of a process that begins with New York Mercantile Exchange (“NYMEX”) forward curve pricing, adjusted for estimated location and quality differentials, as well as other factors that Company management believes will impact realizable prices.
Based on the analysis described above, the Company recorded the following noncash impairment charges (before and after tax) associated with proved oil and natural gas properties:
Year Ended December 31, | |||||||||||
2015 | 2014 | 2013 | |||||||||
(in thousands) | |||||||||||
Rockies region | $ | 1,758,939 | $ | 585,705 | $ | — | |||||
Hugoton Basin region | 1,667,768 | — | — | ||||||||
California region | 537,511 | 22 | — | ||||||||
TexLa region | 430,859 | 4,836 | — | ||||||||
Mid-Continent region | 405,370 | 244,413 | 828,317 | ||||||||
Permian Basin region | 71,990 | 1,337,444 | — | ||||||||
South Texas region | 42,433 | 131,329 | — | ||||||||
$ | 4,914,870 | $ | 2,303,749 | $ | 828,317 | ||||||
The impairment charges in 2015 were due to a decline in commodity prices, changes in expected capital development and a decline in the Company’s estimates of proved reserves. The impairment charges in 2014 include approximately $1.7 billion due to a steep decline in commodity prices during the fourth quarter of 2014 and approximately $603 million due to the divestiture of certain high valued unproved properties in the Midland Basin in which the expected cash flows were previously included in the impairment assessment for proved oil and natural gas properties. The impairment charges in 2013 include approximately $791 million associated with properties in the Granite Wash formation related to asset performance resulting in reserve revisions and a decline in commodity prices as well as approximately $37 million associated with the write-down of the carrying value of the Panther Operated Cleveland Properties sold in May 2013 (see Note 2).
The carrying values of the impaired proved properties were reduced to fair value, estimated using inputs characteristic of a Level 3 fair value measurement. The impairment charges are included in “impairment of long-lived assets” on the consolidated statements of operations.
Subsequent to December 31, 2015, the prices of oil, natural gas and NGL have continued to be volatile. In the future, if forward price curves continue to decline, the Company may have additional impairments which could have a material impact on its results of operations.
Unproved Properties
Costs related to unproved properties include costs incurred to acquire unproved reserves. Because these reserves do not meet the definition of proved reserves, the related costs are not classified as proved properties. Unproved leasehold costs are capitalized and amortized on a composite basis if individually insignificant, based on past success, experience and average lease-term lives. Individually significant leases are reclassified to proved properties if successful and expensed on a lease by lease basis if unsuccessful or the lease term expires. Unamortized leasehold costs related to successful exploratory drilling are reclassified to proved properties and depleted on a unit-of-production basis. The Company assesses unproved properties for impairment quarterly on the basis of its experience in similar situations and other factors such as the primary lease terms of the properties, the average holding period of unproved properties and the relative proportion of such properties on which proved reserves have been found in the past.
91
The Company recorded the following noncash impairment charges (before and after tax) associated with unproved oil and natural gas properties:
Year Ended December 31, 2015 | |||
(in thousands) | |||
TexLa region | $ | 416,846 | |
Permian Basin region | 226,922 | ||
Rockies region | 184,137 | ||
California region | 71,179 | ||
$ | 899,084 | ||
The Company recorded no impairment charges for unproved properties for the years ended December 31, 2014, or December 31, 2013.
The impairment charges in 2015 were due to a decline in commodity prices and changes in expected capital development. The carrying values of the impaired unproved properties were reduced to fair value, estimated using inputs characteristic of a Level 3 fair value measurement. The impairment charges are included in “impairment of long-lived assets” on the consolidated statement of operations.
Exploration Costs
Geological and geophysical costs, delay rentals, amortization and impairment of unproved leasehold costs and costs to drill exploratory wells that do not find proved reserves are expensed as exploration costs. The costs of any exploratory wells are carried as an asset if the well finds a sufficient quantity of reserves to justify its capitalization as a producing well and as long as the Company is making sufficient progress towards assessing the reserves and the economic and operating viability of the project. The Company recorded noncash leasehold impairment expenses related to unproved properties of approximately $2 million, $125 million and $5 million for the years ended December 31, 2015, December 31, 2014, and December 31, 2013, respectively, which are included in “exploration costs” on the consolidated statements of operations.
Other Property and Equipment
Other property and equipment includes natural gas gathering systems, pipelines, buildings, software, data processing and telecommunications equipment, office furniture and equipment, and other fixed assets. These assets are recorded at cost and are depreciated using the straight-line method based on expected lives ranging from two to 39 years for the individual asset or group of assets.
Restricted Cash
At December 31, 2015, “restricted cash” on the consolidated balance sheet includes $250 million that LINN Energy borrowed under the LINN Credit Facility and contributed to Berry Petroleum Company, LLC (“Berry”) in May 2015 to post with Berry’s lenders in connection with the reduction in the Berry Credit Facility’s borrowing base. See Note 6 for additional details. Restricted cash also includes approximately $7 million and $6 million at December 31, 2015, and December 31, 2014, respectively, of cash deposited by the Company into a separate account designated for asset retirement obligations in accordance with contractual agreements.
Derivative Instruments
The Company has hedged a portion of its forecasted production to reduce exposure to fluctuations in oil and natural gas prices. The current direct NGL hedging market is constrained in terms of price, volume, duration and number of counterparties, which limits the Company’s ability to effectively hedge its NGL production. The Company also hedges its exposure to natural gas differentials in certain operating areas but does not currently hedge exposure to oil differentials. By
92
removing a portion of the price volatility associated with future production, the Company expects to mitigate, but not eliminate, the potential effects of variability in net cash provided by operating activities due to fluctuations in commodity prices.
The Company maintains a substantial portion of its hedges in the form of swap contracts. From time to time, the Company has chosen to purchase put option contracts to hedge volumes in excess of those already hedged with swap contracts. In 2013, the Company assumed certain derivative contracts that Berry had entered into prior to the acquisition date, including swap contracts, collars and three-way collars. The Company does not enter into derivative contracts for trading purposes.
A swap contract specifies a fixed price that the Company will receive from the counterparty as compared to floating market prices, and on the settlement date the Company will receive or pay the difference between the swap price and the market price. A put option requires the Company to pay the counterparty a premium equal to the fair value of the option at the purchase date and receive from the counterparty the excess, if any, of the fixed price floor over the market price at the settlement date. Collar contracts specify floor and ceiling prices to be received as compared to floating market prices. Three-way collar contracts combine a short put (the lower price), a long put (the middle price) and a short call (the higher price) to provide a higher ceiling price as compared to a regular collar and limit downside risk to the market price plus the difference between the middle price and the lower price if the market price drops below the lower price.
Derivative instruments are recorded at fair value and included on the consolidated balance sheets as assets or liabilities. The Company did not designate any of its contracts as cash flow hedges; therefore, the changes in fair value of these instruments are recorded in current earnings. The Company determines the fair value of its oil and natural gas derivatives utilizing pricing models that use a variety of techniques, including market quotes and pricing analysis. Inputs to the pricing models include publicly available prices and forward price curves generated from a compilation of data gathered from third parties. Company management validates the data provided by third parties by understanding the pricing models used, obtaining market values from other pricing sources, analyzing pricing data in certain situations and confirming that those instruments trade in active markets. Assumed credit risk adjustments, based on published credit ratings, public bond yield spreads and credit default swap spreads are applied to the Company’s commodity derivatives. See Note 7 and Note 8 for additional details about the Company’s derivative financial instruments.
The Company may from time to time enter into derivative contracts in the form of interest rate swaps to minimize the effects of fluctuations in interest rates. At December 31, 2015, the Company had no outstanding derivative contracts in the form of interest rate swaps.
Revenue Recognition
Revenues representative of the Company’s ownership interest in its properties are presented on a gross basis on the consolidated statements of operations. Sales of oil, natural gas and NGL are recognized when the product has been delivered to a custody transfer point, persuasive evidence of a sales arrangement exists, the rights and responsibility of ownership pass to the purchaser upon delivery, collection of revenue from the sale is reasonably assured and the sales price is fixed or determinable.
The Company has elected the entitlements method to account for natural gas production imbalances. Imbalances occur when the Company sells more or less than its entitled ownership percentage of total natural gas production. In accordance with the entitlements method, any amount received in excess of the Company’s share is treated as a liability. If the Company receives less than its entitled share, the underproduction is recorded as a receivable. Imbalance receivables and payables are valued at the lower of the price in effect at the time of production, the current market value or, if a contract is in hand, the contract price. At December 31, 2015, and December 31, 2014, the Company had natural gas production imbalance receivables of approximately $13 million and $17 million, respectively, which are included in “accounts receivable – trade, net” on the consolidated balance sheets. At December 31, 2015, and December 31, 2014, the Company had natural gas production imbalance payables of approximately $11 million and $13 million, respectively, which are included in “accounts payable and accrued expenses” on the consolidated balance sheets.
93
The Company engages in the purchase, gathering and transportation of third-party natural gas and subsequently markets such natural gas to independent purchasers under separate arrangements. As such, the Company separately reports third-party marketing revenues and marketing expenses.
The Company generates electricity with excess natural gas, which it uses to serve certain of its operating facilities in California. Any excess electricity is sold to the California wholesale power market. The revenue from this activity is included in “other revenues” on the consolidated statements of operations.
Unit-Based Compensation
The Company recognizes expense for unit-based compensation over the requisite service period in an amount equal to the fair value of unit-based awards granted to employees and nonemployee directors. The fair value of unit-based awards, excluding liability awards, is computed at the date of grant and is not remeasured. The fair value of liability awards is remeasured at each reporting date through the settlement date with the change in fair value recognized as compensation expense over that period.
The Company has made a policy decision to recognize compensation expense for service-based awards on a straight-line basis over the requisite service period for the entire award. See Note 5 for additional details about the Company’s accounting for unit-based compensation.
The benefit of tax deductions in excess of recognized compensation costs is required to be reported as financing cash flow rather than operating cash flow. This requirement reduces net operating cash flow and increases net financing cash flow in periods in which such tax benefit exists. The amount of the Company’s excess tax benefit is also reported in “excess tax benefit from unit-based compensation and other” on the consolidated statements of unitholders’ capital (deficit).
Deferred Financing Fees
The Company incurred legal and bank fees related to the issuance of debt. At December 31, 2015, net deferred financing fees of approximately $35 million are included in “other current assets” and approximately $36 million are included in “other noncurrent assets” on the consolidated balance sheet. At December 31, 2014, net deferred financing fees of approximately $129 million are included in “other noncurrent assets” on the consolidated balance sheet. These debt issuance costs are amortized over the life of the debt agreement. Upon early retirement or amendment to the debt agreement, certain fees are written off to expense. For the years ended December 31, 2015, December 31, 2014, and December 31, 2013, amortization expense of approximately $23 million, $46 million and $18 million, respectively, is included in “interest expense, net of amounts capitalized” on the consolidated statements of operations. For the year ended December 31, 2015, approximately $10 million were written off to expense and included in “other, net” on the consolidated statement of operations related to amendments of the Credit Facilities (as defined in Note 6). For the year ended December 31, 2014, approximately $8 million were written off to expense and included in “other, net” on the consolidated statement of operations related to the term loan that was repaid and the Credit Facilities that were amended in 2014. No fees related to amendments of the Credit Facilities were written off to expense during the year ended December 31, 2013.
Fair Value of Financial Instruments
The carrying values of the Company’s receivables, payables and Credit Facilities are estimated to be substantially the same as their fair values at December 31, 2015, and December 31, 2014. See Note 6 for fair value disclosures related to the Company’s other outstanding debt. As noted above, the Company carries its derivative financial instruments at fair value. See Note 8 for details about the fair value of the Company’s derivative financial instruments.
Income Taxes
The Company is a limited liability company treated as a partnership for federal and state income tax purposes, with the exception of the state of Texas, in which income tax liabilities and/or benefits of the Company are passed through to its unitholders. Limited liability companies are subject to Texas margin tax. In addition, certain of the Company’s subsidiaries are Subchapter C-corporations subject to federal and state income taxes, which are accounted for using the asset and liability
94
method. As such, with the exception of the state of Texas and certain subsidiaries, the Company is not a taxable entity, it does not directly pay federal and state income taxes and recognition has not been given to federal and state income taxes for the operations of the Company.
Deferred tax assets and liabilities are recognized for the future tax consequences attributable to differences between the financial statement carrying amounts of existing assets and liabilities and their respective tax basis and tax carryforwards. Deferred tax assets and liabilities are measured using enacted tax rates expected to apply to taxable income in the years in which those temporary differences are expected to be recovered or settled. The effect on deferred tax assets and liabilities of a change in tax rates is recognized in income in the period that includes the enactment date. See Note 14 for details of amounts recorded in the consolidated financial statements.
Note 2 – Divestitures, Exchanges of Properties, Acquisitions and Joint-Venture Funding
Divestiture – 2015
On August 31, 2015, the Company, through certain of its wholly owned subsidiaries, completed the sale of its remaining position in Howard County in the Permian Basin (“Howard County Assets Sale”). Cash proceeds received from the sale of these properties were approximately $276 million, net of costs to sell of approximately $1 million, and the Company recognized a net gain of approximately $177 million. The gain is included in “gains (losses) on sale of assets and other, net” on the consolidated statement of operations. The Company used the net proceeds from the sale to repay a portion of the outstanding indebtedness under the LINN Credit Facility.
Divestitures – 2014
On December 15, 2014, the Company completed the sale of its entire position in the Granite Wash and Cleveland plays located in the Texas Panhandle and western Oklahoma to privately held institutional affiliates of EnerVest, Ltd. and its joint venture partner FourPoint Energy, LLC. Cash proceeds received from the sale of these properties were approximately $1.8 billion, net of costs to sell of approximately $10 million, and the Company recognized a net gain of approximately $294 million.
On November 14, 2014, the Company completed the sale of certain of its Wolfberry properties in Ector and Midland counties in the Permian Basin to Fleur de Lis Energy, LLC. Cash proceeds received from the sale of these properties were approximately $352 million, net of costs to sell of approximately $2 million, and the Company recognized a net loss of approximately $28 million.
On October 30, 2014, the Company completed the sale of its interests in certain non-producing oil and natural gas properties located in the Mid-Continent region. Cash proceeds received from the sale of these properties were approximately $44 million, and the Company recognized a net gain of approximately $36 million.
The gains and loss on divestitures in 2014 are included in “(gains) losses on the sale of assets and other, net” on the consolidated statement of operations.
The Company used the net cash proceeds received from these sales to repay the short-period term loan in full as well as repay a portion of the borrowings outstanding under the LINN Credit Facility.
Exchanges of Properties – 2014
On November 21, 2014, the Company, through two of its wholly owned subsidiaries, completed the trade of a portion of its Permian Basin properties to Exxon Mobil Corporation (“ExxonMobil”) in exchange for properties in California’s South Belridge Field. The noncash exchange was accounted for at fair value and the Company recognized a net gain of approximately $20 million, including costs to sell of approximately $3 million.
On August 15, 2014, the Company, through two of its wholly owned subsidiaries, completed the trade of a portion of its Permian Basin properties to Exxon Mobil Corporation and its affiliates, including its wholly owned subsidiary XTO Energy Inc. (“Exxon XTO”), in exchange for properties in the Hugoton Basin. The noncash exchange was accounted for at fair value and the Company recognized a net gain of approximately $65 million, including costs to sell of approximately $3 million.
95
The gains on the exchanges are equal to the difference between the carrying value and the fair value of the assets exchanged less costs to sell, and are included in “(gains) losses on sale of assets and other, net” on the consolidated statement of operations in 2014. The fair value measurements were based on inputs that are not observable in the market and therefore represent Level 3 inputs under the fair value hierarchy.
Acquisitions – 2014
On September 11, 2014, the Company completed the acquisition of certain oil and natural gas properties located in the Hugoton Basin from Pioneer Natural Resources Company for total consideration of approximately $328 million, which was initially financed with borrowings under the LINN Credit Facility.
On August 29, 2014, the Company completed the acquisition of certain oil and natural gas properties located in five operating regions in the U.S. from subsidiaries of Devon Energy Corporation (“Devon” and the acquisition, the “Devon Assets Acquisition”) for total consideration of approximately $2.1 billion, which was initially financed with proceeds from a bridge loan and borrowings under a short-period term loan.
During the third quarter of 2014, the Company used the net proceeds from the issuance of its 6.50% senior notes due May 2019 and 6.50% senior notes due September 2021 to repay the bridge loan in full. During the fourth quarter of 2014, the Company used the net proceeds from the sales of its Granite Wash properties as well as certain of its Wolfberry properties to repay the short-period term loan in full.
These acquisitions were accounted for under the acquisition method of accounting. Accordingly, the Company conducted assessments of net assets acquired and recognized amounts for identifiable assets acquired and liabilities assumed at their estimated fair values on the acquisition dates, while transaction and integration costs associated with the acquisitions were expensed as incurred. The results of operations of all acquisitions have been included in the consolidated financial statements since the acquisition dates.
The revenues and expenses related to the Devon Assets Acquisition are included on the Company’s consolidated statements of operations as of August 29, 2014. The following unaudited pro forma financial information presents a summary of the Company’s condensed combined results of operations for the year ended December 31, 2014, assuming the Devon Assets Acquisition had been completed as of January 1, 2014, including adjustments to reflect the values assigned to the net assets acquired. The pro forma financial information has been prepared for informational purposes only and does not purport to represent what the actual results of operations would have been had the transaction been completed as of the date assumed, nor is this information necessarily indicative of future consolidated results of operations. The pro forma financial information does not give effect to the costs of any integration activities or benefits that may result from the realization of future cost savings from operating efficiencies, or any other synergies that may result from the transaction.
Year Ended December 31, 2014 | |||
(in thousands, except per unit amounts) | |||
Total revenues and other | $ | 5,335,442 | |
Total operating expenses | $ | (5,039,279 | ) |
Net loss | $ | (403,415 | ) |
Net loss per unit: | |||
Basic | $ | (1.25 | ) |
Diluted | $ | (1.25 | ) |
96
The pro forma condensed combined results of operations includes adjustments to:
• | Reflect the results of the Devon Assets Acquisition. |
• | Reflect incremental depreciation, depletion and amortization expense, using the unit-of-production method related to oil and natural gas properties acquired and an estimated useful life of 10 years for other property and equipment. |
• | Reflect incremental accretion expense related to asset retirement obligations on oil and natural gas properties acquired. |
• | Reflect an increase in interest expense related to incremental debt of $2.3 billion incurred to fund the purchase price. |
• | Reflect incremental amortization of deferred financing fees associated with debt incurred to fund the purchase price. |
• | Exclude transaction costs related to the Devon Assets Acquisition included in the historical statements of operations as they reflect nonrecurring charges not expected to have a continuing impact on the combined results. |
Joint-Venture Funding – 2014
For the year ended December 31, 2014, the Company paid approximately $25 million, including interest, to fund the commitment related to the joint-venture agreement it entered into with an affiliate of Anadarko Petroleum Company in April 2012. For the years ended December 31, 2013, and December 31, 2012, the Company paid approximately $173 million and $202 million, respectively, to fund the commitment. As of February 2014, the Company had fully funded the total commitment of $400 million.
Berry Acquisition – 2013
On December 16, 2013, the Company completed the transactions contemplated by the merger agreement between the Company, LinnCo, LLC (“LinnCo”), an affiliate of LINN Energy, and Berry under which LinnCo acquired all of the outstanding common shares of Berry and the contribution agreement between LinnCo and the Company, under which LinnCo contributed Berry to the Company in exchange for LINN Energy units. Under the merger agreement, as amended, Berry’s shareholders received 1.68 LinnCo common shares for each Berry common share they owned, totaling 93,756,674 LinnCo common shares. Under the contribution agreement, LinnCo contributed Berry to LINN Energy in exchange for 93,756,674 newly issued LINN Energy units, after which Berry became an indirect wholly owned subsidiary of LINN Energy. The transaction was valued at approximately $4.6 billion, including the assumption of approximately $2.3 billion of Berry’s debt and net of cash acquired of approximately $451 million.
Note 3 – Unitholders’ Capital (Deficit)
At-the-Market Offering Program
The Company’s Board of Directors has authorized the sale of up to $500 million of units under an at-the-market offering program. Sales of units, if any, will be made under an equity distribution agreement by means of ordinary brokers’ transactions, through the facilities of the NASDAQ, any other national securities exchange or facility thereof, a trading facility of a national securities association or an alternate trading system, to or through a market maker or directly on or through an electronic communication network, a “dark pool” or any similar market venue, at market prices, in block transactions, or as otherwise agreed with a sales agent. The Company expects to use the net proceeds from any sale of units for general corporate purposes, which may include, among other things, capital expenditures, acquisitions and the repayment of debt.
During the year ended December 31, 2015, the Company, under its equity distribution agreement, sold 3,621,983 units representing limited liability company interests at an average price of $12.37 per unit for net proceeds of approximately $44 million (net of approximately $448,000 in commissions). In connection with the issuance and sale of these units, the Company also incurred professional services expenses of approximately $459,000. The Company used the net proceeds for general corporate purposes, including the open market repurchases of a portion of its senior notes (see Note 6). At
97
December 31, 2015, units totaling approximately $455 million in aggregate offering price remained available to be sold under the agreement.
Public Offering of Units
In May 2015, the Company sold 16,000,000 units representing limited liability company interests in an underwritten public offering at $11.79 per unit ($11.32 per unit, net of underwriting discount) for net proceeds of approximately $181 million (after underwriting discount and offering costs of approximately $8 million). The Company used the net proceeds from the sale of these units to repay a portion of the outstanding indebtedness under the LINN Credit Facility.
Forfeiture of Units in Exchange for Cash
In August 2015, in accordance with terms of the separation agreement between the Company and Kolja Rockov, former Chief Financial Officer, dated August 31, 2015, Mr. Rockov agreed to forfeit 191,446 units issued to him under the Company’s equity compensation plan (see Note 5) in exchange for a cash payment of approximately $672,000. These units are available for issuance under the Company’s equity compensation plan.
Distributions
Under the Company’s limited liability company agreement, unitholders are entitled to receive a distribution of available cash, which includes cash on hand plus borrowings less any reserves established by the Company’s Board of Directors to provide for the proper conduct of the Company’s business (including reserves for future capital expenditures, including drilling, acquisitions and anticipated future credit needs) or to fund distributions, if any, over the next four quarters. Distributions paid by the Company are presented on the consolidated statements of unitholders’ capital (deficit) and the consolidated statements of cash flows. Monthly distributions were paid by the Company through September 2015. In October 2015, the Company’s Board of Directors determined to suspend payment of the Company’s distribution. The Company’s Board of Directors will continue to evaluate the Company’s ability to reinstate the distribution.
Unit Repurchase Plan
The Company’s Board of Directors has authorized the repurchase of up to $250 million of the Company’s outstanding units from time to time on the open market or in negotiated purchases. The timing and amounts of any such repurchases are at the discretion of management, subject to market conditions and other factors, and in accordance with applicable securities laws and other legal requirements. The repurchase plan does not obligate the Company to acquire any specific number of units and may be discontinued at any time. The Company did not repurchase any units during the years ended December 31, 2015, December 31, 2014, and December 31, 2013, and as of December 31, 2015, the entire amount remained available for unit repurchase under the program.
Berry Acquisition
On December 16, 2013, in connection with the Berry acquisition (see Note 2), Berry’s shareholders received 1.68 LinnCo common shares for each Berry common share they owned, totaling 93,756,674 LinnCo common shares. LinnCo contributed Berry to LINN Energy in exchange for 93,756,674 newly issued LINN Energy units with a value of approximately $2.8 billion.
Note 4 – Significant Customers
The Company has a concentration of customers who are engaged in oil and natural gas purchasing, transportation and/or refining within the U.S. This concentration of customers may impact the Company’s overall exposure to credit risk, either positively or negatively, in that the customers may be similarly affected by changes in economic or other conditions. The Company’s customers consist primarily of major oil and natural gas purchasers and the Company generally does not require collateral since it has not experienced significant credit losses on such sales. The Company routinely assesses the recoverability of all material trade and other receivables to determine collectibility (see Note 1).
98
For the years ended December 31, 2015, December 31, 2014, and December 31, 2013, the Company’s largest customer represented approximately 12%, 14% and 12%, respectively, of the Company’s sales.
At December 31, 2015, no individual customer exceeded 10% of the Company’s receivables. At December 31, 2014, trade accounts receivable from one customer represented approximately 11% of the Company’s receivables.
Note 5 – Unit-Based Compensation and Other Benefit Plans
Incentive Plan Summary
The Linn Energy, LLC Amended and Restated Long-Term Incentive Plan, as amended (the “Plan”), originally became effective in December 2005. The Plan, which is administered by the Compensation Committee of the Board of Directors (“Compensation Committee”), permits granting unrestricted units, restricted units, phantom units, unit options, performance units and unit appreciation rights to employees, consultants and nonemployee directors under the terms of the Plan. The restricted units, phantom units and unit options generally vest ratably over three years. The contractual life of unit options is 10 years. Performance units were granted for the first time in January 2014 to certain executive officers. The initial 2014 awards vest 50% in two years and 50% in three years from the award date. Performance units granted in January 2015 vest three years from the award date.
The Plan limits the number of units that may be delivered pursuant to awards to 21 million units. The Board of Directors and the Compensation Committee have the right to alter or amend the Plan or any part of the Plan from time to time, including increasing the number of units that may be granted, subject to unitholder approval as required by the exchange upon which the units are listed at that time. However, no change in any outstanding grant may be made that would materially reduce the benefits to the participant without the consent of the participant.
Units to be delivered as restricted units, upon the vesting of phantom units or performance units, or upon exercise of a unit option or unit appreciation right may be new units issued by the Company, units acquired by the Company in the open market, units acquired by the Company from any other person, units already owned by the Company, or any combination of the foregoing. If the Company issues new units upon the grant of restricted units, vesting of phantom units or performance units, or exercise of a unit option or unit appreciation right, the total number of units outstanding will increase. To date, the Company has issued awards of unrestricted units, restricted units, phantom units, performance units and unit options. The Plan provides for all of the following types of awards:
Unit Grants – A unit grant is the grant of an unrestricted unit that vests immediately upon issuance.
Restricted Units – A restricted unit is a unit that vests over a period of time and that during such time is subject to forfeiture. The Company intends the restricted units under the Plan to serve as a means of incentive compensation for performance. Therefore, Plan participants do not pay any consideration for the units they receive. If a grantee’s employment, consulting relationship or membership on the Company’s Board of Directors terminates for any reason, other than death, the grantee’s restricted units will be automatically forfeited unless, and to the extent, the Compensation Committee or the terms of the award agreement provide otherwise. The restricted units will vest upon a change of control, unless provided otherwise by the Compensation Committee.
Phantom Units – A phantom unit entitles the grantee to receive a unit upon the vesting of the phantom unit or, at the discretion of the Compensation Committee, cash equivalent to the value of a unit. The Compensation Committee may grant tandem distribution equivalent rights with respect to phantom units that entitle the holder to receive cash equal to any cash distributions made on units while the phantom units are outstanding. The Compensation Committee determines the period over which phantom units will vest, subject to applicable minimum vesting periods except with respect to phantom unit grants to nonemployee directors. The Company intends the phantom units under the Plan to serve as a means of incentive compensation for performance. Therefore, Plan participants do not pay any consideration for the units they receive. If a grantee’s employment, consulting relationship or membership on the Company’s Board of Directors terminates for any reason, other than death or retirement, the grantee’s phantom units will be automatically forfeited unless, and to the extent, the Compensation Committee or
the terms of the award agreement provide otherwise. The phantom units will vest upon a change of control, unless provided otherwise by the Compensation Committee.
Unit Options – A unit option is a right to purchase a unit at a specified price. Unit options have an exercise price that is equal to the fair market value of the units on the date of grant. If a grantee’s employment, consulting relationship or membership on the Company’s Board of Directors terminates for any reason, the grantee’s unvested unit options will be automatically forfeited unless, and to the extent, the Compensation Committee or the terms of the award agreement provide otherwise. The unit options will become exercisable upon a change of control, unless provided otherwise by the Compensation Committee.
Performance Units – A performance unit is a unit that vests over a period of time in an amount based on certain comparative performance criteria. The Company intends the performance units under the Plan to serve as a means of incentive compensation for performance. Therefore, Plan participants do not pay any consideration for the units they receive. Upon termination of employment with the Company other than for “Cause” or with “Good Reason” (as those terms are defined in the employment agreement), the performance units vest on the original scheduled vesting date at the performance level multiplier applicable on that date. If employment terminates by reason of death or “Disability” (as defined in the employment agreement), the performance units immediately vest at the target level. Additionally, performance units vest upon a change of control and the number of units awarded is determined as if the vesting period ended on the change of control date instead of the original scheduled date.
Unit Appreciation Rights – A unit appreciation right is an award that, upon exercise, entitles the participant to receive the excess of the fair market value of a unit on the exercise date over the exercise price established for the unit appreciation right. The excess may be paid in the Company’s units, cash or a combination thereof, as determined by the Compensation Committee in its discretion. To date, the Company has not granted any unit appreciation rights.
Securities Authorized for Issuance Under the Plan
As of December 31, 2015, approximately 5.8 million units were issuable under the Plan pursuant to outstanding award or other agreements, including unvested restricted units, phantom units and outstanding unit options, and 5.4 million additional units were reserved for future issuance under the Plan.
Accounting for Unit-Based Compensation
The Company recognizes as expense, beginning at the grant date, the fair value of equity-based compensation issued to employees and nonemployee directors. The value of the portion of the award that is ultimately expected to vest is recognized as expense over the requisite service period using the straight-line method in the Company’s consolidated statements of operations. A summary of unit-based compensation expenses included in the consolidated statements of operations is presented below:
Year Ended December 31, | |||||||||||
2015 | 2014 | 2013 | |||||||||
(in thousands) | |||||||||||
General and administrative expenses | $ | 47,312 | $ | 45,195 | $ | 37,375 | |||||
Lease operating expenses | 8,824 | 8,089 | 5,328 | ||||||||
Total unit-based compensation expenses | $ | 56,136 | $ | 53,284 | $ | 42,703 | |||||
Income tax benefit | $ | 20,742 | $ | 19,688 | $ | 15,779 | |||||
100
Restricted Units/Phantom Units/Unrestricted Units
The fair value of restricted units, phantom units and unrestricted unit grants issued is determined based on the fair market value of the Company units on the date of grant. As of December 31, 2015, a summary of the status of the nonvested units is presented below:
Number of Nonvested Units | Weighted Average Grant-Date Fair Value Per Unit | |||||
Nonvested units at December 31, 2014 | 2,838,973 | $ | 32.70 | |||
Granted | 4,576,631 | $ | 10.21 | |||
Vested | (1,870,384 | ) | $ | 26.41 | ||
Forfeited | (618,648 | ) | $ | 16.65 | ||
Nonvested units at December 31, 2015 | 4,926,572 | $ | 16.22 | |||
The weighted average grant-date fair value of restricted units, phantom units and unrestricted units granted was $33.10 per unit and $30.71 per unit during the years ended December 31, 2014, and December 31, 2013, respectively. The total fair value of units that vested was approximately $49 million, $42 million and $31 million for the years ended December 31, 2015, December 31, 2014, and December 31, 2013, respectively. As of December 31, 2015, there was approximately $31 million of unrecognized compensation cost related to nonvested restricted units and phantom units. The cost is expected to be recognized over a weighted average period of approximately 1.5 years.
Cash-Based Performance Unit Awards
In January 2015, the Company granted 567,320 performance units (the maximum number of units available to be earned) to certain executive officers. The 2015 performance unit awards vest three years from the award date. The vesting of these units is determined based on the Company’s performance compared to the performance of a predetermined group of peer companies over a specified performance period, and the value of vested units is to be paid in cash. To date, no performance units have vested and no amounts have been paid to settle any such awards. Performance unit awards that are settled in cash are recorded as a liability with the changes in fair value recognized over the vesting period. Based on the performance criteria, there was no liability recorded for these performance unit awards at December 31, 2015.
Unit Options
The following provides information related to unit option activity for the year ended December 31, 2015:
Number of Units Underlying Options | Weighted Average Exercise Price Per Unit | Weighted Average Remaining Contractual Life in Years | Aggregate Intrinsic Value | |||||||||
Outstanding at December 31, 2014 | 5,444,417 | $ | 31.95 | 5.12 | $ | — | ||||||
Forfeited or expired | (4,619,706 | ) | $ | 33.60 | ||||||||
Outstanding at December 31, 2015 | 824,711 | $ | 22.72 | 2.27 | $ | — | ||||||
Exercisable at December 31, 2015 | 821,787 | $ | 22.69 | 2.25 | $ | — | ||||||
No unit options were granted during the years ended December 31, 2015, or December 31, 2014. During the year ended December 31, 2013, the weighted average grant-date fair value of unit options granted was $7.52 per unit. All unit options granted in 2013 were replacement awards issued in exchange for options assumed in the Berry acquisition. There were no unit options exercised during the year ended December 31, 2015. During the years ended December 31, 2014, and
101
December 31, 2013, the total intrinsic value of unit options exercised was approximately $11 million and $2 million, respectively. There was no unrecognized compensation cost related to nonvested unit options as of December 31, 2015.
The fair value of unit-based compensation for unit options was estimated on the date of grant using a Black-Scholes pricing model based on certain assumptions. That value may not be indicative of the fair value observed in a willing buyer/willing seller market transaction. The Company’s determination of the fair value of unit-based awards is affected by the Company’s unit price as well as assumptions consisting of a number of complex and subjective variables. The Company’s employee unit options have various restrictions including vesting provisions and restrictions on transfers and hedging, among others, and often are expected to be exercised prior to their contractual maturity.
Expected volatilities used in the estimation of fair value of the unit option grants have been determined using available volatility data for the Company. Expected distributions are estimated based on the Company’s distribution rate at the date of grant. Forfeitures are estimated using historical Company data and are revised, if necessary, in subsequent periods if actual forfeitures differ from estimates. The risk-free rate for periods within the expected term of the unit option is based on the U.S. Treasury yield curve in effect at the time of grant. Historical data of the Company is used to estimate expected term. All employees granted awards have been determined to have similar behaviors for purposes of determining the expected term used to estimate fair value. The fair values of the Company’s unit option grants were based upon the following assumptions:
2013 (1) | |
Expected volatility | 29.65% – 50.88% |
Expected distributions | 9.84% |
Risk-free rate | 0.13% – 1.55% |
Expected term | 0.68 years – 5 years |
(1) | All unit options granted in 2013 were replacement awards issued in exchange for options assumed in the Berry acquisition. |
Berry Acquisition
On December 16, 2013, in connection with the Berry acquisition (see Note 2), certain Berry awards were exchanged for awards issued by the Company. Each unvested Berry restricted stock unit (“RSU”) (excluding any Berry RSUs held by a former nonemployee director of Berry or by an employee of Berry whose employment was terminated in connection with the acquisition as agreed by the parties and any performance-based Berry RSUs) was converted into a restricted unit award in respect of the number of LINN Energy units. Each option to purchase shares of Berry common stock was converted into an option to purchase a number of LINN Energy units.
Under the acquisition method of accounting, Berry employee RSUs and options were measured and recorded at their fair values on the acquisition date, resulting in additional purchase price consideration of approximately $19 million. The portion of the replacement awards attributable to post-combination service was calculated as the difference between the fair value of the replacement awards and the amount attributed to pre-combination service, and is recognized as compensation expense over the vesting period.
Nonemployee Grants
At December 31, 2015, the Company had 15,000 outstanding unit warrants with an exercise price of $25.50 per unit, which are fully exercisable and expire in 2017.
Defined Contribution Plan
The Company sponsors a 401(k) defined contribution plan for eligible employees. Company contributions to the 401(k) plan consist of a discretionary matching contribution equal to 100% of the first 6% of eligible compensation contributed by the employee on a before-tax basis. The Company contributed approximately $11 million, $10 million and $7 million during the
102
years ended December 31, 2015, December 31, 2014, and December 31, 2013, respectively, to the 401(k) plan’s trustee account. The 401(k) plan funds are held in a trustee account on behalf of the plan participants.
Note 6 – Debt
The following summarizes the Company’s outstanding debt:
December 31, | |||||||
2015 | 2014 | ||||||
(in thousands, except percentages) | |||||||
LINN credit facility (1) | $ | 2,215,000 | $ | 1,795,000 | |||
Berry credit facility (2) | 873,175 | 1,173,175 | |||||
Term loan (3) | 500,000 | 500,000 | |||||
6.50% senior notes due May 2019 | 562,234 | 1,200,000 | |||||
6.25% senior notes due November 2019 | 581,402 | 1,800,000 | |||||
8.625% senior notes due April 2020 | 718,596 | 1,300,000 | |||||
6.75% Berry senior notes due November 2020 | 261,100 | 299,970 | |||||
12.00% senior secured second lien notes due December 2020 (4) | 1,000,000 | — | |||||
Interest payable on second lien notes due December 2020 (4) | 608,333 | — | |||||
7.75% senior notes due February 2021 | 779,474 | 1,000,000 | |||||
6.50% senior notes due September 2021 | 381,423 | 650,000 | |||||
6.375% Berry senior notes due September 2022 | 572,700 | 599,163 | |||||
Net unamortized discounts and premiums | (8,694 | ) | (21,499 | ) | |||
Total debt, net | 9,044,743 | 10,295,809 | |||||
Less current portion (5) | (3,716,508 | ) | — | ||||
Total long-term debt, net | $ | 5,328,235 | $ | 10,295,809 | |||
(1) | Variable interest rates of 2.66% and 1.92% at December 31, 2015, and December 31, 2014, respectively. |
(2) | Variable interest rates of 3.17% and 2.67% at December 31, 2015, and December 31, 2014, respectively. |
(3) | Variable interest rates of 3.17% and 2.66% at December 31, 2015 and December 31, 2014, respectively. |
(4) | In November 2015, the Company issued $1.0 billion in aggregate principal amount of new 12.00% senior secured second lien notes due December 2020 in exchange for approximately $2.0 billion in aggregate principal amount of certain of its outstanding senior notes. See below for additional details. |
(5) | Due to existing and anticipated covenant violations, the Company’s Credit Facilities and term loan were classified as current at December 31, 2015. The current portion also includes approximately $128 million of interest payable on the Second Lien Notes due within one year. |
Fair Value
The Company’s debt is recorded at the carrying amount in the consolidated balance sheets. The carrying amounts of the Company’s credit facilities and term loan approximate fair value because the interest rates are variable and reflective of market rates. The Company uses a market approach to determine the fair value of its senior secured second lien notes and senior notes using estimates based on prices quoted from third-party financial institutions, which is a Level 2 fair value measurement.
103
December 31, 2015 | December 31, 2014 | ||||||||||||||
Carrying Value | Fair Value | Carrying Value | Fair Value | ||||||||||||
(in thousands) | |||||||||||||||
Credit facilities | $ | 3,088,175 | $ | 3,088,175 | $ | 2,968,175 | $ | 2,968,175 | |||||||
Term loan | 500,000 | 500,000 | 500,000 | 500,000 | |||||||||||
Senior secured second lien notes | 1,000,000 | 501,250 | — | — | |||||||||||
Interest payable on second lien notes | 608,333 | 608,333 | — | — | |||||||||||
Senior notes, net | 3,848,235 | 662,179 | 6,827,634 | 5,703,649 | |||||||||||
Total debt, net | $ | 9,044,743 | $ | 5,359,937 | $ | 10,295,809 | $ | 9,171,824 | |||||||
Credit Facilities
LINN Credit Facility
The Company’s Sixth Amended and Restated Credit Agreement (“LINN Credit Facility”) provides for (1) a senior secured revolving credit facility and (2) a $500 million senior secured term loan, in aggregate subject to the then-effective borrowing base. Borrowing capacity under the revolving credit facility is limited to the lesser of: (i) the then-effective borrowing base reduced by the $500 million term loan and (ii) the maximum commitment amount of $4.0 billion, and was $3.1 billion as of December 31, 2015. The maturity date is April 2019.
At December 31, 2015, the borrowing base under the LINN Credit Facility was $4.05 billion, but the maximum borrowing availability was limited to $3.6 billion due to certain conditions. The borrowing base under the LINN Credit Facility automatically decreased to $3.6 billion on January 1, 2016, since certain conditions were not met. At December 31, 2015, availability under the revolving credit facility was approximately $879 million, which includes reductions for the $500 million term loan and $6 million of outstanding letters of credit.
In October 2015, the Company entered into an amendment to the LINN Credit Facility to provide for, among other things: (i) a “springing maturity” based on the maturity of any outstanding LINN Energy junior lien debt; (ii) the ability to incur up to $4.0 billion of junior lien debt to accommodate exchanges of the Company’s outstanding unsecured senior notes and Berry senior notes or as additional indebtedness, but such additional indebtedness may not exceed $1.0 billion; (iii) a minimum liquidity requirement equal to the greater of $500 million and 15% of the then effective available borrowing base after giving effect to certain redemptions or repurchases of certain debt; (iv) a decrease in the covenant requiring the maintenance of an EBITDA to Interest Expense ratio of 2.5 to 1.0, such that the minimum required ratio is decreased to 2.0 to 1.0 from December 31, 2015 through December 31, 2016, to 2.25 to 1.0 from March 31, 2017 through June 30, 2017 and returning to 2.5 to 1.0 thereafter; (v) the ability to make necessary tax-related distributions or contributions to LinnCo, LLC; (vi) an increase in the mortgage requirement on the total value of the oil and natural gas properties included on our most recent reserve report from 80% to 90%; and (vii) an increase to the applicable margin charged on borrowings under the LINN Credit Facility by 0.25% and an increase in the commitment fee under the LINN Credit Facility on the average daily unused amount of the maximum commitment amount of the lenders to 0.5% per annum.
Redetermination of the borrowing base under the LINN Credit Facility, based primarily on reserve reports using lender commodity price expectations at such time, occurs semi-annually, in April and October. The administrative agent, at the direction of a super-majority of certain of the lenders, has the right to request one interim borrowing base redetermination per year. The Company also has the right to request one interim borrowing base redetermination per year, as well as the right to an additional interim redetermination each year in connection with certain acquisitions. Continued low commodity prices, reductions in the Company’s capital budget and the resulting reserve write-downs, along with the maturity schedule of the Company’s hedges, are expected to adversely impact future redeterminations.
The spring 2015 semi-annual borrowing base redetermination was completed in May 2015, and as a result of lower commodity prices, the borrowing base under the LINN Credit Facility decreased from $4.5 billion to $4.05 billion. The fall 2015 semi-annual redetermination was completed in October 2015 and the borrowing base under the LINN Credit Facility
104
was reaffirmed at $4.05 billion, subject to certain conditions being met on or before January 1, 2016. On January 1, 2016, the borrowing base automatically decreased to $3.6 billion.
The Company’s obligations under the LINN Credit Facility, as amended, are secured by mortgages on certain of its material subsidiaries’ oil and natural gas properties and other personal property as well as a pledge of all ownership interests in the Company’s direct and indirect material subsidiaries. The Company is required to maintain mortgages on properties representing at least 90% of the total value of oil and natural gas properties included on its most recent reserve report. Additionally, the obligations under the LINN Credit Facility are guaranteed by all of the Company’s material subsidiaries, other than Berry, and are required to be guaranteed by any future material subsidiaries.
At the Company’s election, interest on borrowings under the LINN Credit Facility, as amended, is determined by reference to either the London Interbank Offered Rate (“LIBOR”) plus an applicable margin between 1.75% and 2.75% per annum (depending on the then-current level of borrowings under the LINN Credit Facility) or the alternate base rate (“ABR”) plus an applicable margin between 0.75% and 1.75% per annum (depending on the then-current level of borrowings under the LINN Credit Facility). Interest is generally payable quarterly for loans bearing interest based on the ABR and at the end of the applicable interest period for loans bearing interest at the LIBOR. The Company is required to pay a commitment fee to the lenders under the LINN Credit Facility, which accrues at a rate per annum of 0.50% on the average daily unused amount of the maximum commitment amount of the lenders.
The $500 million term loan has a maturity date of April 2019, subject to a “springing maturity” based on the maturity of any outstanding LINN Energy junior lien debt, and incurs interest based on either the LIBOR plus a margin of 2.75% per annum or the ABR plus a margin of 1.75% per annum, at the Company’s election. Interest is generally payable quarterly for loans bearing interest based on the ABR and at the end of the applicable interest period for loans bearing interest at the LIBOR. The term loan may be repaid at the option of the Company without premium or penalty, subject to breakage costs. While the term loan is outstanding, the Company is required to maintain either: 1) mortgages on properties representing at least 80% of the total value of oil and natural gas properties included on its most recent reserve report, or 2) a Term Loan Collateral Coverage Ratio of at least 2.5 to 1.0. The Term Loan Collateral Coverage Ratio is defined as the ratio of the present value of future cash flows from proved reserves from the currently mortgaged properties to the lesser of: (i) the then-effective borrowing base and (ii) the maximum commitment amount and the aggregate amount of the term loan outstanding. The other terms and conditions of the LINN Credit Facility, including the financial and other restrictive covenants set forth therein, are applicable to the term loan.
Berry Credit Facility
Berry’s Second Amended and Restated Credit Agreement (“Berry Credit Facility”) had a borrowing base of $900 million, subject to lender commitments, as of December 31, 2015. The maturity date is April 2019. At December 31, 2015, lender commitments under the facility were also $900 million but there was less than $1 million of available borrowing capacity, including outstanding letters of credit.
In October 2015, Berry entered into an amendment to the Berry Credit Facility to provide for, among other things: (i) a springing maturity based on the maturity of any outstanding Berry junior lien debt; (ii) the ability of Berry to incur junior lien debt to refinance its senior notes or as additional indebtedness, but such additional indebtedness issued may not exceed $500 million outstanding at any one time and is subject to a borrowing base reduction; (iii) a decrease in Berry’s covenant requiring the maintenance of an EBITDA to Interest Expense ratio of 2.5 to 1.0, such that the permissible ratio is decreased to 2.0 to 1.0 from December 31, 2015 through December 31, 2016, to 2.25 to 1.0 from March 31, 2017 through June 30, 2017 and returning to 2.5 to 1.0 thereafter; (iv) an increase in the mortgage requirement on the total value of the oil and natural gas properties included in Berry’s most recent reserve report from 80% to 90%; (v) an increase to the applicable margin charged on borrowings under the Berry Credit Facility by 0.25% and increase the commitment fee under the Berry Credit Facility to 0.5% per annum; and (vi) permission to prepay or exchange Berry’s senior notes with notes issued by LINN Energy.
Redetermination of the borrowing base under the Berry Credit Facility, based primarily on reserve reports using lender commodity price expectations at such time, occurs semi-annually, in April and October. A super-majority of the lenders under the Berry Credit Facility and Berry also have the right to request interim borrowing base redeterminations once between scheduled redeterminations. The spring 2015 semi-annual borrowing base redetermination was completed in May
105
2015, and as a result of lower commodity prices, the borrowing base under the Berry Credit Facility decreased from $1.4 billion to $1.2 billion. The fall 2015 semi-annual redetermination was completed in October 2015 and the borrowing base under the Berry Credit Facility decreased from $1.2 billion to $900 million. In connection with the reduction in Berry’s borrowing base in October 2015, Berry repaid $300 million of borrowings outstanding under the Berry Credit Facility. Continued low commodity prices, reductions in the Company’s capital budget and the resulting reserve write-downs are expected to adversely impact future redeterminations.
In connection with the reduction in Berry’s borrowing base in May 2015, LINN Energy borrowed $250 million under the LINN Credit Facility and contributed it to Berry to post as restricted cash with Berry’s lenders. As directed by LINN Energy, the $250 million was deposited on Berry’s behalf in a security account with the administrative agent subject to a security control agreement. Berry’s ability to withdraw funds from this account is subject to a concurrent reduction of the borrowing base under the Berry Credit Facility or lender’s consent in connection with a redetermination of such borrowing base. The $250 million may be used to satisfy obligations under the Berry Credit Facility or, subject to restrictions in the indentures governing Berry’s senior notes, may be returned to LINN Energy in the future. The amount is included in “restricted cash” on the consolidated balance sheet.
Berry’s obligations under the Berry Credit Facility, as amended, are secured by mortgages on its oil and natural gas properties and other personal property. Berry is required to maintain mortgages on properties representing at least 90% of the present value of its oil and natural gas proved reserves.
At Berry’s election, interest on borrowings under the Berry Credit Facility, as amended, is determined by reference to either the LIBOR plus an applicable margin between 1.75% and 2.75% per annum (depending on the then-current level of borrowings under the Berry Credit Facility) or a Base Rate (as defined in the Berry Credit Facility) plus an applicable margin between 0.75% and 1.75% per annum (depending on the then-current level of borrowings under the Berry Credit Facility). Interest is generally payable quarterly for loans bearing interest based on the Base Rate and at the end of the applicable interest period for loans bearing interest at the LIBOR. Berry is required to pay a commitment fee to the lenders under the Berry Credit Facility, which accrues at a rate per annum of 0.5% on the average daily unused amount of the maximum commitment amount of the lenders.
The Company refers to the LINN Credit Facility and the Berry Credit Facility, collectively, as the “Credit Facilities.”
Senior Secured Second Lien Notes Due December 2020
On November 20, 2015, the Company issued $1.0 billion in aggregate principal amount of 12.00% senior secured second lien notes due December 2020 (“Second Lien Notes”) in exchange for approximately $2.0 billion in aggregate principal amount of certain of its outstanding senior notes as follows (in thousands):
Par Value of Senior Notes Exchanged | |||
6.50% senior notes due May 2019 | $ | 584,422 | |
6.25% senior notes due November 2019 | 824,348 | ||
8.625% senior notes due April 2020 | 286,344 | ||
7.75% senior notes due February 2021 | 184,300 | ||
6.50% senior notes due September 2021 | 120,586 | ||
$ | 2,000,000 | ||
The exchanges were accounted for as a troubled debt restructuring (“TDR”). Since the total future cash payments of the new debt were less than the carrying amount of the previous debt, a gain of approximately $352 million, or $1.03 per unit, was recognized and included in “gain (loss) on extinguishment of debt” on the consolidated statement of operations. TDR accounting requires that interest payments on the Second Lien Notes reduce the carrying value of the debt with no interest expense recognized. As a result, the Company’s reported interest expense will be significantly less than the contractual
106
interest payments throughout the term of the Second Lien Notes. There were no interest payments made on the Second Lien Notes for the year ended December 31, 2015.
The Second Lien Notes were issued under an indenture dated as of November 20, 2015, entered into by the Company and certain of its material domestic subsidiaries (the “Subsidiary Guarantors”). The Second Lien Notes mature on December 15, 2020, subject to a “springing maturity date” ahead of junior lien or unsecured indebtedness if more than $250 million of a particular series of such indebtedness is outstanding 92 days prior to the respective maturity date of such series, and bear interest at a rate of 12.00% per year, payable semiannually in arrears on June 15 and December 15 of each year, beginning on June 15, 2016.
The Second Lien Notes are secured by second-priority liens on all of the Company’s and Subsidiary Guarantors’ assets that secure the LINN Credit Facility (the “Collateral”), and rank effectively junior to any indebtedness of the Company secured on a priority basis to the Second Lien Notes, including indebtedness under the LINN Credit Facility, to the extent of the value of the assets securing such indebtedness. The Collateral consists of: (i) certain of the Company’s and the Subsidiary Guarantors’ oil and natural gas properties and other personal property, as well as (ii) a pledge of all ownership interests in the Subsidiary Guarantors.
At any time prior to December 15, 2018, the Company may on one or more occasions redeem up to 35% of the aggregate principal amount of Second Lien Notes at a redemption price of 112.00% of the principal amount, plus accrued and unpaid interest and Additional Interest (as defined in the Second Lien Notes indenture), if any, to the redemption date using the net cash proceeds of one or more equity offerings by the Company, provided that:
• | at least 65% of the aggregate principal amount of the Second Lien Notes remain outstanding immediately after the occurrence of such redemption (excluding Second Lien Notes held by the Company); and |
• | the redemption occurs within 180 days of the date of the closing of such equity offering. |
Prior to December 15, 2018, the Company may redeem all or part of the Second Lien Notes, upon not less than 30 or more than 60 days’ notice, at a redemption price equal to the sum of:
• | 100% of the principal amount thereof, plus |
• | the Make Whole Premium (as defined in the Second Lien Notes indenture) at the redemption date, plus |
• | accrued and unpaid interest, if any, to the redemption date. |
On and after December 15, 2018, the Company has the option to redeem all or part of the Second Lien Notes, upon not less than 30 or more than 60 days’ notice, at the redemption prices (expressed as percentages of principal amount) set forth below, plus accrued and unpaid interest and Additional Interest, if any, to the redemption date, if redeemed during the twelve-month period beginning on December 15 of the years indicated below:
Percentage | ||
2018 | 112.000 | % |
2019 and thereafter | 106.000 | % |
The Second Lien Notes indenture contains covenants that, among other things, limit the Company’s ability and the ability of the Company’s restricted subsidiaries to: (i) declare or pay distributions on, purchase or redeem the Company’s units or purchase or redeem the Company’s or its restricted subsidiaries’ indebtedness secured by liens junior in priority to liens securing the Second Lien Notes, unsecured indebtedness or subordinated indebtedness; (ii) make investments; (iii) incur or guarantee additional indebtedness or issue certain types of equity securities; (iv) create certain liens; (v) sell assets; (vi) consolidate, merge or transfer all or substantially all of the Company’s assets; (vii) enter into agreements that restrict distributions or other payments from the Company’s restricted subsidiaries to the Company; (viii) engage in transactions with affiliates; and (ix) create unrestricted subsidiaries.
107
In connection with the issuance of the Second Lien Notes, the Company entered into a Registration Rights Agreement with each of the holders (collectively, the “Registration Rights Agreements”), pursuant to the terms of the exchange agreements. Under the Registration Rights Agreements, the Company agreed to use its reasonable efforts to file with the U.S. Securities and Exchange Commission and cause to become effective a registration statement relating to an offer to issue new notes having terms substantially identical to the Second Lien Notes in exchange for outstanding Second Lien Notes within 370 days after the notes were issued. In certain circumstances, the Company may be required to file a shelf registration statement to cover resales of the Second Lien Notes. The Company will be obligated to file one or more registration statements as described above only if the restrictive legend on the Second Lien Notes has not been removed and the Second Lien Notes are not freely tradable pursuant to Rule 144 under the Securities Act of 1933, as amended, as of the 370th day after the notes were issued. If the Company fails to satisfy these obligations, the Company may be required to pay additional interest to holders of the Second Lien Notes under certain circumstances.
Repurchases of Senior Notes
During the year ended December 31, 2015, the Company repurchased, through privately negotiated transactions and on the open market, approximately $992 million of its outstanding senior notes as follows:
• | 6.50% senior notes due May 2019 – $53 million; |
• | 6.25% senior notes due November 2019 – $395 million; |
• | 8.625% senior notes due April 2020 – $295 million; |
• | 6.75% Berry senior notes due November 2020 – $39 million; |
• | 7.75% senior notes due February 2021 – $36 million; |
• | 6.50% senior notes due September 2021 – $148 million; and |
• | 6.375% Berry senior notes due September 2022 – $26 million. |
In connection with the repurchases, the Company paid approximately $609 million in cash and recorded a gain on extinguishment of debt of approximately $367 million for the year ended December 31, 2015.
Senior Notes Covenants
The Company’s senior notes contain covenants that, among other things, may limit its ability to: (i) pay distributions on, purchase or redeem the Company’s units or redeem its subordinated debt; (ii) make investments; (iii) incur or guarantee additional indebtedness or issue certain types of equity securities; (iv) create certain liens; (v) sell assets; (vi) consolidate, merge or transfer all or substantially all of the Company’s assets; (vii) enter into agreements that restrict distributions or other payments from the Company’s restricted subsidiaries to the Company; (viii) engage in transactions with affiliates; and (ix) create unrestricted subsidiaries. As of December 31, 2015, the Company was in compliance with all financial and other covenants of its senior notes.
Berry’s senior notes contain covenants that, among other things, may limit its ability to: (i) incur or guarantee additional indebtedness; (ii) pay distributions or dividends on Berry’s equity or redeem its subordinated debt; (iii) create certain liens; (iv) enter into agreements that restrict distributions or other payments from Berry’s restricted subsidiaries to Berry; (v) sell assets; (vi) engage in transactions with affiliates; and (vii) consolidate, merge or transfer all or substantially all of Berry’s assets. As of December 31, 2015, Berry was in compliance with all financial and other covenants of its senior notes.
In addition, any cash generated by Berry is currently being used by Berry to fund its activities. To the extent that Berry generates cash in excess of its needs and determines to distribute such amounts to LINN Energy, the indentures governing Berry’s senior notes limit the amount it may distribute to LINN Energy to the amount available under a “restricted payments basket,” and Berry may not distribute any such amounts unless it is permitted by the indentures to incur additional debt pursuant to the consolidated coverage ratio test set forth in the Berry indentures. Berry’s restricted payments basket may be increased in accordance with the terms of the Berry indentures by, among other things, 50% of Berry’s future net income, reductions in its indebtedness and restricted investments, and future capital contributions.
108
Covenant Violations
The audit report the Company received with respect to its consolidated financial statements contains an explanatory paragraph expressing uncertainty as to the Company’s ability to continue as a going concern, the delivery of which constitutes a default under the LINN Credit Facility. The Company is also currently in default under the Second Lien Indenture due to its failure to deliver mortgages by February 18, 2016. See “Going Concern Uncertainty” in Note 1 for additional information.
Note 7 – Derivatives
Commodity Derivatives
The Company has hedged a portion of its forecasted production to reduce exposure to fluctuations in oil and natural gas prices and provide long-term cash flow predictability to manage its business, service debt and, if and when resumed, pay distributions. The current direct NGL hedging market is constrained in terms of price, volume, duration and number of counterparties, which limits the Company’s ability to effectively hedge its NGL production. The Company also hedges its exposure to natural gas differentials in certain operating areas but does not currently hedge exposure to oil differentials.
The Company enters into commodity hedging transactions primarily in the form of swap contracts that are designed to provide a fixed price and, from time to time, put options that are designed to provide a fixed price floor with the opportunity for upside. The Company enters into these transactions with respect to a portion of its projected production or consumption to provide an economic hedge of the risk related to the future commodity prices received or paid. The Company does not enter into derivative contracts for trading purposes. In connection with the 2013 acquisition of Berry, the Company assumed certain derivative contracts that Berry had entered into prior to the acquisition date, including swap contracts, collars and three-way collars. The Company did not designate any of its contracts as cash flow hedges; therefore, the changes in fair value of these instruments are recorded in current earnings. See Note 8 for fair value disclosures about oil and natural gas commodity derivatives.
The following table presents derivative positions for the periods indicated as of December 31, 2015:
2016 | 2017 | 2018 | |||||||||
Natural gas positions: | |||||||||||
Fixed price swaps (NYMEX Henry Hub): | |||||||||||
Hedged volume (MMMBtu) | 121,841 | 120,122 | 36,500 | ||||||||
Average price ($/MMBtu) | $ | 4.20 | $ | 4.26 | $ | 5.00 | |||||
Put options (NYMEX Henry Hub): | |||||||||||
Hedged volume (MMMBtu) | 76,269 | 66,886 | — | ||||||||
Average price ($/MMBtu) | $ | 5.00 | $ | 4.88 | $ | — | |||||
Oil positions: | |||||||||||
Fixed price swaps (NYMEX WTI): (1) | |||||||||||
Hedged volume (MBbls) | 11,465 | 4,755 | — | ||||||||
Average price ($/Bbl) | $ | 90.56 | $ | 89.02 | $ | — | |||||
Put options (NYMEX WTI): | |||||||||||
Hedged volume (MBbls) | 3,271 | 384 | — | ||||||||
Average price ($/Bbl) | $ | 90.00 | $ | 90.00 | $ | — | |||||
Natural gas basis differential positions: (2) | |||||||||||
Panhandle basis swaps: (3) | |||||||||||
Hedged volume (MMMBtu) | 59,954 | 59,138 | 16,425 | ||||||||
Hedged differential ($/MMBtu) | $ | (0.32 | ) | $ | (0.33 | ) | $ | (0.33 | ) | ||
109
2016 | 2017 | 2018 | |||||||||
NWPL Rockies basis swaps: (3) | |||||||||||
Hedged volume (MMMBtu) | 65,794 | 38,880 | 10,804 | ||||||||
Hedged differential ($/MMBtu) | $ | (0.24 | ) | $ | (0.19 | ) | $ | (0.19 | ) | ||
MichCon basis swaps: (3) | |||||||||||
Hedged volume (MMMBtu) | 7,768 | 7,437 | 2,044 | ||||||||
Hedged differential ($/MMBtu) | $ | 0.05 | $ | 0.05 | $ | 0.05 | |||||
Houston Ship Channel basis swaps: (3) | |||||||||||
Hedged volume (MMMBtu) | 34,364 | 36,730 | 986 | ||||||||
Hedged differential ($/MMBtu) | $ | (0.02 | ) | $ | (0.02 | ) | $ | (0.08 | ) | ||
Permian basis swaps: (3) | |||||||||||
Hedged volume (MMMBtu) | 2,975 | 2,629 | 1,314 | ||||||||
Hedged differential ($/MMBtu) | $ | (0.20 | ) | $ | (0.20 | ) | $ | (0.20 | ) | ||
SoCal basis swaps: (4) | |||||||||||
Hedged volume (MMMBtu) | 32,940 | — | — | ||||||||
Hedged differential ($/MMBtu) | $ | (0.03 | ) | $ | — | $ | — | ||||
Oil timing differential positions: | |||||||||||
Trade month roll swaps (NYMEX WTI): (5) | |||||||||||
Hedged volume (MBbls) | 2,652 | 2,654 | — | ||||||||
Hedged differential ($/Bbl) | $ | 0.25 | $ | 0.25 | $ | — | |||||
(1) | Includes certain outstanding fixed price oil swaps of approximately 5,384 MBbls which may be extended annually at a price of $100.00 per Bbl for the year ending December 31, 2018, and $90.00 per Bbl for the year ending December 31, 2019, at counterparty election on a designated date in each respective preceding year. The extension for each year is exercisable without respect to the other years. |
(2) | Settle on the respective pricing index to hedge basis differential to the NYMEX Henry Hub natural gas price. |
(3) | For positions which hedge exposure to differentials in producing areas, the Company receives the NYMEX Henry Hub natural gas price plus the respective spread and pays the specified index price. Cash settlements are made on a net basis. |
(4) | For positions which hedge exposure to differentials in consuming areas, the Company pays the NYMEX Henry Hub natural gas price plus the respective spread and receives the specified index price. Cash settlements are made on a net basis. |
(5) | The Company hedges the timing risk associated with the sales price of oil in the Mid-Continent, Hugoton Basin and Permian Basin regions. In these regions, the Company generally sells oil for the delivery month at a sales price based on the average NYMEX WTI price during that month, plus an adjustment calculated as a spread between the weighted average prices of the delivery month, the next month and the following month during the period when the delivery month is prompt (the “trade month roll”). |
During the year ended December 31, 2015, the Company entered into commodity derivative contracts consisting of natural gas basis swaps for May 2015 through December 2017 to hedge exposure to differentials in certain producing areas and oil swaps for April 2015 through December 2015. In addition, the Company entered into natural gas basis swaps for May 2015 through December 2016 to hedge exposure to the differential in California, where it consumes natural gas in its heavy oil development operations.
During the fourth quarter of 2015, the Company canceled certain of its commodity derivative contracts, consisting of Permian basis swaps for 2016 and 2017, trade month roll swaps for 2016 and 2017, and positions representing oil swaps which could have been extended at counterparty election for 2017. The Company received net cash settlements of approximately $5 million from the cancellations. During the fourth quarter of 2014, the Company canceled all of its ICE Brent – NYMEX WTI basis swaps for 2015 and received cash settlements of approximately $12 million. As of December 31, 2014, the Company had no outstanding ICE Brent – NYMEX WTI basis swaps.
110
During the year ended December 31, 2013, the Company entered into commodity derivative contracts consisting of oil basis swaps for 2013 and natural gas basis swaps for 2013 through 2018. Also, in connection with the Berry acquisition (see Note 2), the Company assumed certain derivative contracts that Berry had entered into prior to the acquisition date, including oil swaps, oil trade month roll swaps and oil collars through 2014, and oil basis swaps and oil three-way collars through 2015.
Settled derivatives on natural gas production for the year ended December 31, 2015, included volumes of 189,895 MMMBtu at an average contract price of $5.12 per MMBtu. Settled derivatives on oil production for the year ended December 31, 2015, included volumes of 18,884 MBbls at an average contract price of $89.28 per Bbl. Settled derivatives on natural gas production for the year ended December 31, 2014, included volumes of 177,029 MMMBtu at an average contract price of $5.14 per MMBtu. Settled derivatives on oil production for the year ended December 31, 2014, included volumes of 24,988 MBbls at an average contract price of $92.39 per Bbl. Settled derivatives on natural gas production for the year ended December 31, 2013, included volumes of 173,488 MMMBtu at an average contract price of $5.29 per MMBtu. Settled derivatives on oil production for the year ended December 31, 2013, included volumes of 15,590 MBbls at an average contract price of $95.35 per Bbl.
The natural gas derivatives are settled based on the closing price of NYMEX Henry Hub natural gas on the last trading day for the delivery month, which occurs on the third business day preceding the delivery month, or the relevant index prices of natural gas published in Inside FERC’s Gas Market Report on the first business day of the delivery month. The oil derivatives are settled based on the average closing price of NYMEX WTI crude oil for each day of the delivery month.
Balance Sheet Presentation
The Company’s commodity derivatives are presented on a net basis in “derivative instruments” on the consolidated balance sheets. The following table summarizes the fair value of derivatives outstanding on a gross basis:
December 31, | |||||||
2015 | 2014 | ||||||
(in thousands) | |||||||
Assets: | |||||||
Commodity derivatives | $ | 1,812,375 | $ | 2,014,815 | |||
Liabilities: | |||||||
Commodity derivatives | $ | 28,842 | $ | 90,260 | |||
By using derivative instruments to economically hedge exposures to changes in commodity prices, the Company exposes itself to credit risk and market risk. Credit risk is the failure of the counterparty to perform under the terms of the derivative contract. When the fair value of a derivative contract is positive, the counterparty owes the Company, which creates credit risk. The Company’s counterparties are current participants or affiliates of participants in its Credit Facilities or were participants or affiliates of participants in its Credit Facilities at the time it originally entered into the derivatives. The Credit Facilities are secured by the Company’s oil, natural gas and NGL reserves; therefore, the Company is not required to post any collateral. The Company does not receive collateral from its counterparties. The maximum amount of loss due to credit risk that the Company would incur if its counterparties failed completely to perform according to the terms of the contracts, based on the gross fair value of financial instruments, was approximately $1.8 billion at December 31, 2015. The Company minimizes the credit risk in derivative instruments by: (i) limiting its exposure to any single counterparty; (ii) entering into derivative instruments only with counterparties that meet the Company’s minimum credit quality standard, or have a guarantee from an affiliate that meets the Company’s minimum credit quality standard; and (iii) monitoring the creditworthiness of the Company’s counterparties on an ongoing basis. In accordance with the Company’s standard practice, its commodity derivatives are subject to counterparty netting under agreements governing such derivatives and therefore the risk of loss due to counterparty nonperformance is somewhat mitigated.
111
Gains (Losses) on Derivatives
A summary of gains and losses on derivatives included on the consolidated statements of operations is presented below:
Year Ended December 31, | |||||||||||
2015 | 2014 | 2013 | |||||||||
(in thousands) | |||||||||||
Gains on oil and natural gas derivatives | $ | 1,056,189 | $ | 1,206,179 | $ | 177,857 | |||||
Lease operating expenses (1) | 6,893 | — | — | ||||||||
Total gains on oil and natural gas derivatives | $ | 1,063,082 | $ | 1,206,179 | $ | 177,857 | |||||
(1) | Consists of gains and (losses) on derivatives used to hedge exposure to differentials in consuming areas, which were entered into in March 2015. |
For the years ended December 31, 2015, December 31, 2014, and December 31, 2013, the Company received net cash settlements of approximately $1.2 billion, $108 million and $249 million, respectively.
Note 8 – Fair Value Measurements on a Recurring Basis
The Company accounts for its commodity derivatives at fair value (see Note 7) on a recurring basis. The Company determines the fair value of its oil and natural gas derivatives utilizing pricing models that use a variety of techniques, including market quotes and pricing analysis. Inputs to the pricing models include publicly available prices and forward price curves generated from a compilation of data gathered from third parties. Company management validates the data provided by third parties by understanding the pricing models used, obtaining market values from other pricing sources, analyzing pricing data in certain situations and confirming that those instruments trade in active markets. Assumed credit risk adjustments, based on published credit ratings, public bond yield spreads and credit default swap spreads are applied to the Company’s commodity derivatives.
Fair Value Hierarchy
In accordance with applicable accounting standards, the Company has categorized its financial instruments, based on the priority of inputs to the valuation technique, into a three-level fair value hierarchy. The fair value hierarchy gives the highest priority to quoted prices in active markets for identical assets or liabilities (Level 1) and the lowest priority to unobservable inputs (Level 3).
Financial assets and liabilities recorded in the consolidated balance sheets are categorized based on the inputs to the valuation techniques as follows:
Level 1 | Financial assets and liabilities for which values are based on unadjusted quoted prices for identical assets or liabilities in an active market that management has the ability to access. |
Level 2 | Financial assets and liabilities for which values are based on quoted prices in markets that are not active or model inputs that are observable either directly or indirectly for substantially the full term of the asset or liability (commodity derivatives). |
Level 3 | Financial assets and liabilities for which values are based on prices or valuation techniques that require inputs that are both unobservable and significant to the overall fair value measurement. These inputs reflect management’s own assumptions about the assumptions a market participant would use in pricing the asset or liability. |
When the inputs used to measure fair value fall within different levels of the hierarchy in a liquid environment, the level within which the fair value measurement is categorized is based on the lowest level input that is significant to the fair value
112
measurement in its entirety. The Company conducts a review of fair value hierarchy classifications on a quarterly basis. Changes in the observability of valuation inputs may result in a reclassification for certain financial assets or liabilities.
The following presents the fair value hierarchy for assets and liabilities measured at fair value on a recurring basis:
December 31, 2015 | |||||||||||
Level 2 | Netting (1) | Total | |||||||||
(in thousands) | |||||||||||
Assets: | |||||||||||
Commodity derivatives | $ | 1,812,375 | $ | (25,744 | ) | $ | 1,786,631 | ||||
Liabilities: | |||||||||||
Commodity derivatives | $ | 28,842 | $ | (25,744 | ) | $ | 3,098 | ||||
December 31, 2014 | |||||||||||
Level 2 | Netting (1) | Total | |||||||||
(in thousands) | |||||||||||
Assets: | |||||||||||
Commodity derivatives | $ | 2,014,815 | $ | (89,576 | ) | $ | 1,925,239 | ||||
Liabilities: | |||||||||||
Commodity derivatives | $ | 90,260 | $ | (89,576 | ) | $ | 684 | ||||
(1) | Represents counterparty netting under agreements governing such derivatives. |
Note 9 – Other Property and Equipment
Other property and equipment consists of the following:
December 31, | |||||||
2015 | 2014 | ||||||
(in thousands) | |||||||
Natural gas plant and pipeline | $ | 480,161 | $ | 479,754 | |||
Furniture and office equipment | 106,462 | 88,893 | |||||
Buildings and leasehold improvements | 72,976 | 49,046 | |||||
Vehicles | 37,641 | 36,534 | |||||
Drilling and other equipment | 7,934 | 6,994 | |||||
Land | 3,537 | 7,928 | |||||
708,711 | 669,149 | ||||||
Less accumulated depreciation | (195,661 | ) | (144,282 | ) | |||
$ | 513,050 | $ | 524,867 | ||||
Note 10 – Asset Retirement Obligations
The Company has the obligation to plug and abandon oil and natural gas wells and related equipment at the end of production operations. Estimated asset retirement costs are recognized as liabilities with an increase to the carrying amounts of the related long-lived assets when the obligation is incurred. The liabilities are included in “other accrued liabilities” and “other noncurrent liabilities” on the consolidated balance sheets. Accretion expense is included in “depreciation, depletion and amortization” on the consolidated statements of operations. The fair value of additions to the asset retirement obligations is estimated using valuation techniques that convert future cash flows to a single discounted amount. Significant inputs to the
113
valuation include estimates of: (i) plug and abandon costs per well based on existing regulatory requirements; (ii) remaining life per well; (iii) future inflation factors (2% for each of the years in the three-year period ended December 31, 2015); and (iv) a credit-adjusted risk-free interest rate (average of 5.5%, 5.3% and 6.2% for the years ended December 31, 2015, December 31, 2014, and December 31, 2013, respectively). These inputs require significant judgments and estimates by the Company’s management at the time of the valuation and are the most sensitive and subject to change.
The following table presents a reconciliation of the Company’s asset retirement obligations:
December 31, | |||||||
2015 | 2014 | ||||||
(in thousands) | |||||||
Asset retirement obligations at beginning of year | $ | 497,570 | $ | 289,321 | |||
Liabilities added from acquisitions | — | 176,538 | |||||
Liabilities added from drilling | 3,574 | 10,476 | |||||
Liabilities associated with assets divested | (3,306 | ) | (25,656 | ) | |||
Current year accretion expense | 30,016 | 22,164 | |||||
Settlements | (6,336 | ) | (12,620 | ) | |||
Revision of estimates | 2,023 | 37,347 | |||||
Asset retirement obligations at end of year | $ | 523,541 | $ | 497,570 | |||
Note 11 – Commitments and Contingencies
For certain statewide class action royalty payment disputes where a reserve has not yet been established, the Company has denied that it has any liability on the claims and has raised arguments and defenses that, if accepted by the courts, will result in no loss to the Company. In addition, the Company is involved in various other disputes arising in the ordinary course of business. The Company is not currently a party to any litigation or pending claims that it believes would have a material adverse effect on its overall business, financial position, results of operations or liquidity; however, cash flow could be significantly impacted in the reporting periods in which such matters are resolved.
During the years ended December 31, 2015, December 31, 2014, and December 31, 2013, the Company made no significant payments to settle any legal, environmental or tax proceedings. The Company regularly analyzes current information and accrues for probable liabilities on the disposition of certain matters as necessary. Liabilities for loss contingencies arising from claims, assessments, litigation or other sources are recorded when it is probable that a liability has been incurred and the amount can be reasonably estimated.
In 2008, Lehman Brothers Holdings Inc. and Lehman Brothers Commodity Services Inc. (together “Lehman”), filed voluntary petitions for reorganization under Chapter 11 of the U.S. Bankruptcy Code with the U.S. Bankruptcy Court for the Southern District of New York. In March 2011, the Company and Lehman entered into Termination Agreements under which the Company was granted general unsecured claims against Lehman in the amount of $51 million (the “Company Claim”). In December 2011, a Chapter 11 Plan was approved by the Bankruptcy Court. In 2015, 2014 and 2013, the Company received approximately $4 million, $7 million and $11 million, respectively, of the Company Claim which are each included in “gains on oil and natural gas derivatives” on the consolidated statements of operations. In the aggregate, the Company has received approximately $50 million of the Company Claim.
Note 12 – Operating Leases
The Company leases office space and other property and equipment under lease agreements expiring on various dates through 2034. The Company recognized expense under operating leases of approximately $21 million, $14 million and $7 million for the years ended December 31, 2015, December 31, 2014, and December 31, 2013, respectively.
114
As of December 31, 2015, future minimum lease payments were as follows (in thousands):
2016 | $ | 10,647 | |
2017 | 8,887 | ||
2018 | 7,521 | ||
2019 | 7,865 | ||
2020 | 7,721 | ||
Thereafter | 27,336 | ||
$ | 69,977 | ||
Note 13 – Earnings Per Unit
Basic earnings per unit is computed by dividing net earnings attributable to unitholders by the weighted average number of units outstanding during each period. Diluted earnings per unit is computed by adjusting the average number of units outstanding for the dilutive effect, if any, of unit equivalents. The Company uses the treasury stock method to determine the dilutive effect.
The following table provides a reconciliation of the numerators and denominators of the basic and diluted per unit computations for net loss:
Year Ended December 31, | |||||||||||
2015 | 2014 | 2013 | |||||||||
(in thousands, except per unit data) | |||||||||||
Net loss | $ | (4,759,811 | ) | $ | (451,809 | ) | $ | (691,337 | ) | ||
Allocated to participating securities | (3,039 | ) | (7,117 | ) | (5,935 | ) | |||||
$ | (4,762,850 | ) | $ | (458,926 | ) | $ | (697,272 | ) | |||
Basic net loss per unit | $ | (13.87 | ) | $ | (1.40 | ) | $ | (2.94 | ) | ||
Diluted net loss per unit | $ | (13.87 | ) | $ | (1.40 | ) | $ | (2.94 | ) | ||
Basic weighted average units outstanding | 343,323 | 328,918 | 237,544 | ||||||||
Dilutive effect of unit equivalents | — | — | — | ||||||||
Diluted weighted average units outstanding | 343,323 | 328,918 | 237,544 | ||||||||
Basic units outstanding excludes the effect of weighted average anti-dilutive unit equivalents related to approximately 4 million, 6 million and 4 million unit options and warrants for the years ended December 31, 2015, December 31, 2014, and December 31, 2013, respectively. All equivalent units were antidilutive for each of the years ended December 31, 2015, December 31, 2014, and December 31, 2013.
Note 14 – Income Taxes
The Company is a limited liability company treated as a partnership for federal and state income tax purposes, with the exception of the state of Texas, in which income tax liabilities and/or benefits of the Company are passed through to its unitholders. Limited liability companies are subject to Texas margin tax. In addition, certain of the Company’s subsidiaries are Subchapter C-corporations subject to federal and state income taxes. As such, with the exception of the state of Texas and certain subsidiaries, the Company is not a taxable entity, it does not directly pay federal and state income taxes and recognition has not been given to federal and state income taxes for the operations of the Company, except as set forth in the tables below. Amounts recognized for income taxes are reported in “income tax expense (benefit)” on the consolidated statements of operations.
115
The Company’s taxable income or loss, which may vary substantially from the net income or net loss reported on the consolidated statements of operations, is includable in the federal and state income tax returns of each unitholder. The aggregate difference in the basis of net assets for financial and tax reporting purposes cannot be readily determined as the Company does not have access to information about each unitholder’s tax attributes.
Certain of the Company’s subsidiaries are Subchapter C-corporations subject to federal and state income taxes. Income tax expense (benefit) consisted of the following:
Year Ended December 31, | |||||||||||
2015 | 2014 | 2013 | |||||||||
(in thousands) | |||||||||||
Current taxes: | |||||||||||
Federal | $ | (12,021 | ) | $ | 473 | $ | 144 | ||||
State | 1,022 | 21 | 198 | ||||||||
Deferred taxes: | |||||||||||
Federal | 8,237 | (104 | ) | (2,805 | ) | ||||||
State | (3,699 | ) | 4,047 | 264 | |||||||
$ | (6,461 | ) | $ | 4,437 | $ | (2,199 | ) | ||||
As of December 31, 2015, the Company’s taxable entities had approximately $1 million of net operating loss carryforwards for federal income tax purposes which will begin expiring in 2036.
A reconciliation of the federal statutory tax rate to the effective tax rate is as follows:
Year Ended December 31, | ||||||||
2015 | 2014 | 2013 | ||||||
Federal statutory rate | 35.0 | % | 35.0 | % | 35.0 | % | ||
State, net of federal tax benefit | 0.1 | (0.9 | ) | (0.1 | ) | |||
Loss excluded from nontaxable entities | (34.8 | ) | (34.6 | ) | (34.6 | ) | ||
Other | (0.2 | ) | (0.5 | ) | — | |||
Effective rate | 0.1 | % | (1.0 | )% | 0.3 | % | ||
Significant components of the deferred tax assets and liabilities were as follows:
December 31, | |||||||
2015 | 2014 | ||||||
(in thousands) | |||||||
Deferred tax assets: | |||||||
Net operating loss carryforwards | $ | 370 | $ | — | |||
Unit-based compensation | 18,214 | 22,105 | |||||
Valuation allowance | (2,159 | ) | — | ||||
Other | 7,300 | 6,857 | |||||
Total deferred tax assets | 23,725 | 28,962 | |||||
Deferred tax liabilities: | |||||||
Property and equipment principally due to differences in depreciation | (12,534 | ) | (10,991 | ) | |||
Other | 8 | (6,370 | ) | ||||
Total deferred tax liabilities | (12,526 | ) | (17,361 | ) | |||
Net deferred tax assets | $ | 11,199 | $ | 11,601 | |||
116
Net deferred tax assets and liabilities were classified on the consolidated balance sheets as follows:
December 31, | |||||||
2015 | 2014 | ||||||
(in thousands) | |||||||
Deferred tax assets | $ | 23,188 | $ | 28,442 | |||
Deferred tax liabilities | (675 | ) | (2,964 | ) | |||
Other current assets | $ | 22,513 | $ | 25,478 | |||
Deferred tax assets | $ | 537 | $ | 520 | |||
Deferred tax liabilities | (11,851 | ) | (14,397 | ) | |||
Other noncurrent liabilities | $ | (11,314 | ) | $ | (13,877 | ) | |
In assessing the realizability of deferred tax assets, management considers whether it is more likely than not that some portion or all of the deferred tax assets will not be realized. The ultimate realization of deferred tax assets is dependent upon the generation of future taxable income during the periods in which those temporary differences become deductible. Management considers the scheduled reversal of deferred tax liabilities, projected future taxable income and tax planning strategies in making this assessment. At December 31, 2015, based on projections of future taxable income for the periods in which the deferred tax assets are deductible, valuation allowances of approximately $2 million were recorded for tax carryforwards and attributes to reduce the net deferred tax assets to an amount that is more likely than not to be realized. The amount of deferred tax assets considered realizable could be reduced in the future if estimates of future taxable income during the carryforward period are reduced.
In accordance with the applicable accounting standards, the Company recognizes only the impact of income tax positions that, based on their merits, are more likely than not to be sustained upon audit by a taxing authority. To evaluate its current tax positions in order to identify any material uncertain tax positions, the Company developed a policy of identifying and evaluating uncertain tax positions that considers support for each tax position, industry standards, tax return disclosures and schedules and the significance of each position. It is the Company’s policy to recognize interest and penalties, if any, related to unrecognized tax benefits in income tax expense. The Company had no material uncertain tax positions at December 31, 2015, and December 31, 2014. The tax years 2012 – 2015 remain open to examination for federal income tax purposes.
Note 15 – Supplemental Disclosures to the Consolidated Balance Sheets and Consolidated Statements of Cash Flows
“Other accrued liabilities” reported on the consolidated balance sheets include the following:
December 31, | |||||||
2015 | 2014 | ||||||
(in thousands) | |||||||
Accrued interest | $ | 63,957 | $ | 105,310 | |||
Accrued compensation | 37,061 | 44,875 | |||||
Asset retirement obligations | 14,234 | 16,187 | |||||
Other | 4,341 | 1,364 | |||||
$ | 119,593 | $ | 167,736 | ||||
117
Supplemental disclosures to the consolidated statements of cash flows are presented below:
Year Ended December 31, | |||||||||||
2015 | 2014 | 2013 | |||||||||
(in thousands) | |||||||||||
Cash payments for interest, net of amounts capitalized | $ | 562,303 | $ | 542,775 | $ | 392,607 | |||||
Cash payments for income taxes | $ | 643 | $ | — | $ | 14 | |||||
Noncash investing and financing activities: | |||||||||||
In connection with the acquisition of oil and natural gas properties and joint-venture funding, assets were acquired and liabilities were assumed as follow: | |||||||||||
Fair value of assets acquired | $ | — | $ | 2,679,547 | $ | 5,726,681 | |||||
Cash paid, net of cash acquired | — | (2,395,339 | ) | (109,350 | ) | ||||||
Units issued in connection with the Berry acquisition | — | — | (2,781,888 | ) | |||||||
Noncash gains on exchanges of properties | — | (85,493 | ) | — | |||||||
Receivables from sellers | — | 16,213 | (93 | ) | |||||||
Payables to sellers | — | (3,515 | ) | (6,854 | ) | ||||||
Liabilities assumed | $ | — | $ | 211,413 | $ | 2,828,496 | |||||
Accrued capital expenditures | $ | 81,656 | $ | 240,331 | $ | 334,542 | |||||
Included in “acquisition of oil and natural gas properties and joint-venture funding, net of cash acquired” on the consolidated statements of cash flows for the years ended December 31, 2014, and December 31, 2013, is approximately $25 million and $170 million, respectively, paid by the Company towards the future funding commitment related to the joint-venture agreement entered into with Anadarko (see Note 2).
In November 2015, the Company issued $1.0 billion in aggregate principal amount of Second Lien Notes in exchange for approximately $2.0 billion in aggregate principal amount of certain of its outstanding senior notes (see Note 6).
On November 21, 2014, the Company, through two of its wholly owned subsidiaries, completed a noncash exchange of a portion of its Permian Basin properties to ExxonMobil in exchange for properties in California’s South Belridge Field. On August 15, 2014, the Company, through two of its wholly owned subsidiaries, completed a noncash exchange of a portion of its Permian Basin properties to Exxon XTO for properties in the Hugoton Basin.
For purposes of the consolidated statements of cash flows, the Company considers all highly liquid short-term investments with original maturities of three months or less to be cash equivalents. At December 31, 2015, “restricted cash” on the consolidated balance sheet includes $250 million that LINN Energy borrowed under the LINN Credit Facility and contributed to Berry in May 2015 to post with Berry’s lenders in connection with the reduction in the Berry Credit Facility’s borrowing base. Restricted cash also includes approximately $7 million and $6 million at December 31, 2015, and December 31, 2014, respectively, of cash deposited by the Company into a separate account designated for asset retirement obligations in accordance with contractual agreements.
The Company manages its working capital and cash requirements to borrow only as needed from its Credit Facilities. At December 31, 2015, and December 31, 2014, net outstanding checks of approximately $21 million and $95 million, respectively, were reclassified and included in “accounts payable and accrued expenses” on the consolidated balance sheets. Net outstanding checks are presented as cash flows from financing activities and included in “other” on the consolidated statements of cash flows.
118
Note 16 – Related Party Transactions
LinnCo
LinnCo, an affiliate of LINN Energy, was formed on April 30, 2012. LinnCo’s initial sole purpose was to own units in LINN Energy. In connection with the acquisition of Berry, LinnCo amended its limited liability company agreement to permit, among other things, the acquisition and subsequent contribution of assets to LINN Energy. All of LinnCo’s common shares are held by the public. As of December 31, 2015, LinnCo had no significant assets or operations other than those related to its interest in LINN Energy and owned approximately 37% of LINN Energy’s outstanding units.
On December 16, 2013, LinnCo and LINN Energy completed the transactions contemplated by the merger agreement, as amended, under which Berry’s shareholders received 1.68 LinnCo common shares for each Berry common share they owned, totaling 93,756,674 LinnCo common shares. Under the contribution agreement between LinnCo and LINN Energy, LinnCo contributed Berry to LINN Energy in exchange for 93,756,674 newly issued LINN Energy units valued at approximately $2.8 billion.
LINN Energy has agreed to provide to LinnCo, or to pay on LinnCo’s behalf, any financial, legal, accounting, tax advisory, financial advisory and engineering fees, and other administrative and out-of-pocket expenses incurred by LinnCo, along with any other expenses incurred in connection with any public offering of shares in LinnCo or incurred as a result of being a publicly traded entity. These expenses include costs associated with annual, quarterly and other reports to holders of LinnCo shares, tax return and Form 1099 preparation and distribution, NASDAQ listing fees, printing costs, independent auditor fees and expenses, legal counsel fees and expenses, limited liability company governance and compliance expenses and registrar and transfer agent fees. In addition, the Company has agreed to indemnify LinnCo and its officers and directors for damages suffered or costs incurred (other than income taxes payable by LinnCo) in connection with carrying out LinnCo’s activities. All expenses and costs paid by LINN Energy on LinnCo’s behalf are expensed by LINN Energy.
For the year ended December 31, 2015, LinnCo incurred total general and administrative expenses and certain offering costs of approximately $3 million, all of which had been paid by LINN Energy on LinnCo’s behalf as of December 31, 2015. The expenses for the year ended December 31, 2015, include approximately $2 million related to services provided by LINN Energy necessary for the conduct of LinnCo’s business, such as accounting, legal, tax, information technology and other expenses.
For the year ended December 31, 2014, LinnCo incurred total general and administrative expenses and certain offering costs of approximately $3 million, all of which had been paid by LINN Energy on LinnCo’s behalf as of December 31, 2014. The expenses for the year ended December 31, 2014, include approximately $2 million related to services provided by LINN Energy necessary for the conduct of LinnCo’s business, such as accounting, legal, tax, information technology and other expenses. In addition, during the year ended December 31, 2014, LINN Energy paid approximately $11 million on LinnCo’s behalf for general and administrative expenses incurred by LinnCo in 2013.
For the year ended December 31, 2013, LinnCo incurred total general and administrative expenses and certain offering costs of approximately $42 million. The expenses for the year ended December 31, 2013, include approximately $40 million of transaction costs related to the Berry acquisition (see Note 2), including approximately $9 million of noncash share-based compensation expense. The expenses for the year ended December 31, 2013, also include approximately $2 million related to services provided by LINN Energy necessary for the conduct of LinnCo’s business, such as accounting, legal, tax, information technology and other expenses.
During the years ended December 31, 2015, December 31, 2014, and December 31, 2013, the Company paid approximately $121 million, $373 million and $101 million, respectively, in distributions to LinnCo attributable to LinnCo’s interest in LINN Energy.
Other
One of the Company’s directors is the President and Chief Executive Officer of Superior Energy Services, Inc. (“Superior”), which provides oilfield services to the Company. For the years ended December 31, 2015, December 31, 2014, and
119
December 31, 2013, the Company incurred expenditures of approximately $9 million, $21 million and $26 million, respectively, related to services rendered by Superior and its subsidiaries.
Note 17 – Subsidiary Guarantors
Linn Energy, LLC’s May 2019 senior notes, November 2019 senior notes, April 2020 senior notes, December 2020 second lien notes, February 2021 senior notes and September 2021 senior notes are guaranteed by all of the Company’s material subsidiaries, other than Berry Petroleum Company, LLC, which is an indirect 100% wholly owned subsidiary of the Company.
The following condensed consolidating financial information presents the financial information of Linn Energy, LLC, the guarantor subsidiaries and the non-guarantor subsidiary in accordance with Securities and Exchange Commission (“SEC”) Regulation S-X Rule 3-10. The condensed consolidating financial information for the co-issuer, Linn Energy Finance Corp., is not presented as it has no assets, operations or cash flows. The financial information may not necessarily be indicative of the financial position or results of operations had the guarantor subsidiaries or non-guarantor subsidiary operated as independent entities. There are no restrictions on the Company’s ability to obtain cash dividends or other distributions of funds from the guarantor subsidiaries.
120
CONDENSED CONSOLIDATING BALANCE SHEETS
December 31, 2015
LINN Energy, LLC | Guarantor Subsidiaries | Non- Guarantor Subsidiary | Eliminations | Consolidated | |||||||||||||||
(in thousands) | |||||||||||||||||||
ASSETS | |||||||||||||||||||
Current assets: | |||||||||||||||||||
Cash and cash equivalents | $ | 1,073 | $ | 72 | $ | 1,023 | $ | — | $ | 2,168 | |||||||||
Accounts receivable – trade, net | — | 170,503 | 46,053 | — | 216,556 | ||||||||||||||
Accounts receivable – affiliates | 2,920,082 | 8,621 | — | (2,928,703 | ) | — | |||||||||||||
Derivative instruments | — | 1,207,012 | 13,218 | — | 1,220,230 | ||||||||||||||
Other current assets | 26,905 | 72,120 | 20,897 | (1 | ) | 119,921 | |||||||||||||
Total current assets | 2,948,060 | 1,458,328 | 81,191 | (2,928,704 | ) | 1,558,875 | |||||||||||||
Noncurrent assets: | |||||||||||||||||||
Oil and natural gas properties (successful efforts method) | — | 13,110,094 | 5,011,061 | — | 18,121,155 | ||||||||||||||
Less accumulated depletion and amortization | — | (9,557,283 | ) | (1,596,165 | ) | 55,956 | (11,097,492 | ) | |||||||||||
— | 3,552,811 | 3,414,896 | 55,956 | 7,023,663 | |||||||||||||||
Other property and equipment | — | 597,216 | 111,495 | — | 708,711 | ||||||||||||||
Less accumulated depreciation | — | (183,139 | ) | (12,522 | ) | — | (195,661 | ) | |||||||||||
— | 414,077 | 98,973 | — | 513,050 | |||||||||||||||
Derivative instruments | — | 566,401 | — | — | 566,401 | ||||||||||||||
Restricted cash | — | 7,004 | 250,359 | — | 257,363 | ||||||||||||||
Notes receivable – affiliates | 175,100 | — | — | (175,100 | ) | — | |||||||||||||
Investments in consolidated subsidiaries | 3,940,444 | — | — | (3,940,444 | ) | — | |||||||||||||
Other noncurrent assets | 35,559 | 5,978 | 16,057 | — | 57,594 | ||||||||||||||
4,151,103 | 579,383 | 266,416 | (4,115,544 | ) | 881,358 | ||||||||||||||
Total noncurrent assets | 4,151,103 | 4,546,271 | 3,780,285 | (4,059,588 | ) | 8,418,071 | |||||||||||||
Total assets | $ | 7,099,163 | $ | 6,004,599 | $ | 3,861,476 | $ | (6,988,292 | ) | $ | 9,976,946 | ||||||||
LIABILITIES AND UNITHOLDERS’ CAPITAL (DEFICIT) | |||||||||||||||||||
Current liabilities: | |||||||||||||||||||
Accounts payable and accrued expenses | $ | 1,285 | $ | 336,962 | $ | 117,127 | $ | — | $ | 455,374 | |||||||||
Accounts payable – affiliates | — | 2,920,082 | 8,621 | (2,928,703 | ) | — | |||||||||||||
Derivative instruments | — | — | 2,241 | — | 2,241 | ||||||||||||||
Current portion of long-term debt | 2,843,333 | — | 873,175 | — | 3,716,508 | ||||||||||||||
Other accrued liabilities | 49,861 | 52,997 | 16,736 | (1 | ) | 119,593 | |||||||||||||
Total current liabilities | 2,894,479 | 3,310,041 | 1,017,900 | (2,928,704 | ) | 4,293,716 | |||||||||||||
Noncurrent liabilities: | |||||||||||||||||||
Derivative instruments | — | 857 | — | — | 857 | ||||||||||||||
Long-term debt, net | 4,482,867 | — | 845,368 | — | 5,328,235 | ||||||||||||||
Notes payable – affiliates | — | 175,100 | — | (175,100 | ) | — | |||||||||||||
Other noncurrent liabilities | — | 410,990 | 212,049 | — | 623,039 | ||||||||||||||
Total noncurrent liabilities | 4,482,867 | 586,947 | 1,057,417 | (175,100 | ) | 5,952,131 | |||||||||||||
Unitholders’ capital (deficit): | |||||||||||||||||||
Units issued and outstanding | 5,333,834 | 4,831,758 | 2,798,713 | (7,621,189 | ) | 5,343,116 | |||||||||||||
Accumulated deficit | (5,612,017 | ) | (2,724,147 | ) | (1,012,554 | ) | 3,736,701 | (5,612,017 | ) | ||||||||||
(278,183 | ) | 2,107,611 | 1,786,159 | (3,884,488 | ) | (268,901 | ) | ||||||||||||
Total liabilities and unitholders’ capital (deficit) | $ | 7,099,163 | $ | 6,004,599 | $ | 3,861,476 | $ | (6,988,292 | ) | $ | 9,976,946 | ||||||||
121
CONDENSED CONSOLIDATING BALANCE SHEETS
December 31, 2014
LINN Energy, LLC | Guarantor Subsidiaries | Non- Guarantor Subsidiary | Eliminations | Consolidated | |||||||||||||||
(in thousands) | |||||||||||||||||||
ASSETS | |||||||||||||||||||
Current assets: | |||||||||||||||||||
Cash and cash equivalents | $ | 38 | $ | 185 | $ | 1,586 | $ | — | $ | 1,809 | |||||||||
Accounts receivable – trade, net | — | 371,325 | 100,359 | — | 471,684 | ||||||||||||||
Accounts receivable – affiliates | 4,028,890 | 13,205 | — | (4,042,095 | ) | — | |||||||||||||
Derivative instruments | — | 1,033,448 | 43,694 | — | 1,077,142 | ||||||||||||||
Other current assets | 18 | 96,678 | 59,259 | — | 155,955 | ||||||||||||||
Total current assets | 4,028,946 | 1,514,841 | 204,898 | (4,042,095 | ) | 1,706,590 | |||||||||||||
Noncurrent assets: | |||||||||||||||||||
Oil and natural gas properties (successful efforts method) | — | 13,196,841 | 4,872,059 | — | 18,068,900 | ||||||||||||||
Less accumulated depletion and amortization | — | (4,342,675 | ) | (525,007 | ) | — | (4,867,682 | ) | |||||||||||
— | 8,854,166 | 4,347,052 | — | 13,201,218 | |||||||||||||||
Other property and equipment | — | 553,150 | 115,999 | — | 669,149 | ||||||||||||||
Less accumulated depreciation | — | (135,830 | ) | (8,452 | ) | — | (144,282 | ) | |||||||||||
— | 417,320 | 107,547 | — | 524,867 | |||||||||||||||
Derivative instruments | — | 848,097 | — | — | 848,097 | ||||||||||||||
Restricted cash | — | 6,100 | 125 | — | 6,225 | ||||||||||||||
Notes receivable – affiliates | 130,500 | — | — | (130,500 | ) | — | |||||||||||||
Advance to affiliate | — | — | 293,627 | (293,627 | ) | — | |||||||||||||
Investments in consolidated subsidiaries | 8,562,608 | — | — | (8,562,608 | ) | — | |||||||||||||
Other noncurrent assets | 116,637 | 5,716 | 14,159 | — | 136,512 | ||||||||||||||
8,809,745 | 859,913 | 307,911 | (8,986,735 | ) | 990,834 | ||||||||||||||
Total noncurrent assets | 8,809,745 | 10,131,399 | 4,762,510 | (8,986,735 | ) | 14,716,919 | |||||||||||||
Total assets | $ | 12,838,691 | $ | 11,646,240 | $ | 4,967,408 | $ | (13,028,830 | ) | $ | 16,423,509 | ||||||||
LIABILITIES AND UNITHOLDERS’ CAPITAL | |||||||||||||||||||
Current liabilities: | |||||||||||||||||||
Accounts payable and accrued expenses | $ | 3,784 | $ | 581,880 | $ | 229,145 | $ | — | $ | 814,809 | |||||||||
Accounts payable – affiliates | — | 4,028,890 | 13,205 | (4,042,095 | ) | — | |||||||||||||
Advance from affiliate | — | 293,627 | — | (293,627 | ) | — | |||||||||||||
Other accrued liabilities | 89,507 | 59,142 | 19,087 | — | 167,736 | ||||||||||||||
Total current liabilities | 93,291 | 4,963,539 | 261,437 | (4,335,722 | ) | 982,545 | |||||||||||||
Noncurrent liabilities: | |||||||||||||||||||
Long-term debt, net | 8,208,857 | — | 2,086,952 | — | 10,295,809 | ||||||||||||||
Notes payable – affiliates | — | 130,500 | — | (130,500 | ) | — | |||||||||||||
Derivative instruments | — | 684 | — | — | 684 | ||||||||||||||
Other noncurrent liabilities | — | 400,851 | 200,015 | — | 600,866 | ||||||||||||||
Total noncurrent liabilities | 8,208,857 | 532,035 | 2,286,967 | (130,500 | ) | 10,897,359 | |||||||||||||
Unitholders’ capital: | |||||||||||||||||||
Units issued and outstanding | 5,388,749 | 4,831,339 | 2,416,381 | (7,240,658 | ) | 5,395,811 | |||||||||||||
Accumulated income (deficit) | (852,206 | ) | 1,319,327 | 2,623 | (1,321,950 | ) | (852,206 | ) | |||||||||||
4,536,543 | 6,150,666 | 2,419,004 | (8,562,608 | ) | 4,543,605 | ||||||||||||||
Total liabilities and unitholders’ capital | $ | 12,838,691 | $ | 11,646,240 | $ | 4,967,408 | $ | (13,028,830 | ) | $ | 16,423,509 | ||||||||
122
CONDENSED CONSOLIDATING STATEMENTS OF OPERATIONS
For the Year Ended December 31, 2015
LINN Energy, LLC | Guarantor Subsidiaries | Non- Guarantor Subsidiary | Eliminations | Consolidated | |||||||||||||||
(in thousands) | |||||||||||||||||||
Revenues and other: | |||||||||||||||||||
Oil, natural gas and natural gas liquids sales | $ | — | $ | 1,151,240 | $ | 575,031 | $ | — | $ | 1,726,271 | |||||||||
Gains on oil and natural gas derivatives | — | 1,027,014 | 29,175 | — | 1,056,189 | ||||||||||||||
Marketing revenues | — | 43,876 | 30,253 | — | 74,129 | ||||||||||||||
Other revenues | — | 19,550 | 7,195 | — | 26,745 | ||||||||||||||
— | 2,241,680 | 641,654 | — | 2,883,334 | |||||||||||||||
Expenses: | |||||||||||||||||||
Lease operating expenses | — | 372,609 | 245,155 | — | 617,764 | ||||||||||||||
Transportation expenses | — | 167,561 | 52,160 | — | 219,721 | ||||||||||||||
Marketing expenses | — | 35,278 | 21,866 | — | 57,144 | ||||||||||||||
General and administrative expenses | — | 210,894 | 85,993 | — | 296,887 | ||||||||||||||
Exploration costs | — | 9,473 | — | — | 9,473 | ||||||||||||||
Depreciation, depletion and amortization | — | 547,675 | 251,371 | 6,711 | 805,757 | ||||||||||||||
Impairment of long-lived assets | — | 5,024,944 | 853,810 | (64,800 | ) | 5,813,954 | |||||||||||||
Taxes, other than income taxes | 2 | 111,300 | 70,593 | — | 181,895 | ||||||||||||||
Gains on sale of assets and other, net | — | (195,490 | ) | (1,919 | ) | — | (197,409 | ) | |||||||||||
2 | 6,284,244 | 1,579,029 | (58,089 | ) | 7,805,186 | ||||||||||||||
Other income and (expenses): | |||||||||||||||||||
Interest expense, net of amounts capitalized | (463,168 | ) | 2,533 | (85,818 | ) | — | (546,453 | ) | |||||||||||
Interest expense – affiliates | — | (12,123 | ) | — | 12,123 | — | |||||||||||||
Interest income – affiliates | 12,123 | — | — | (12,123 | ) | — | |||||||||||||
Gain on extinguishment of debt | 708,050 | — | 11,209 | — | 719,259 | ||||||||||||||
Equity in losses from consolidated subsidiaries | (5,002,695 | ) | — | — | 5,002,695 | — | |||||||||||||
Other, net | (13,804 | ) | (161 | ) | (3,261 | ) | — | (17,226 | ) | ||||||||||
(4,759,494 | ) | (9,751 | ) | (77,870 | ) | 5,002,695 | 155,580 | ||||||||||||
Loss before income taxes | (4,759,496 | ) | (4,052,315 | ) | (1,015,245 | ) | 5,060,784 | (4,766,272 | ) | ||||||||||
Income tax expense (benefit) | 315 | (6,708 | ) | (68 | ) | — | (6,461 | ) | |||||||||||
Net loss | $ | (4,759,811 | ) | $ | (4,045,607 | ) | $ | (1,015,177 | ) | $ | 5,060,784 | $ | (4,759,811 | ) | |||||
123
CONDENSED CONSOLIDATING STATEMENTS OF OPERATIONS
For the Year Ended December 31, 2014
LINN Energy, LLC | Guarantor Subsidiaries | Non- Guarantor Subsidiary | Eliminations | Consolidated | |||||||||||||||
(in thousands) | |||||||||||||||||||
Revenues and other: | |||||||||||||||||||
Oil, natural gas and natural gas liquids sales | $ | — | $ | 2,312,137 | $ | 1,298,402 | $ | — | $ | 3,610,539 | |||||||||
Gains on oil and natural gas derivatives | — | 1,127,395 | 78,784 | — | 1,206,179 | ||||||||||||||
Marketing revenues | — | 84,349 | 50,911 | — | 135,260 | ||||||||||||||
Other revenues | — | 28,133 | 3,192 | — | 31,325 | ||||||||||||||
— | 3,552,014 | 1,431,289 | — | 4,983,303 | |||||||||||||||
Expenses: | |||||||||||||||||||
Lease operating expenses | — | 440,624 | 364,540 | — | 805,164 | ||||||||||||||
Transportation expenses | — | 165,489 | 41,842 | — | 207,331 | ||||||||||||||
Marketing expenses | — | 81,210 | 36,255 | — | 117,465 | ||||||||||||||
General and administrative expenses | — | 190,286 | 102,787 | — | 293,073 | ||||||||||||||
Exploration costs | — | 125,037 | — | — | 125,037 | ||||||||||||||
Depreciation, depletion and amortization | — | 771,549 | 302,353 | — | 1,073,902 | ||||||||||||||
Impairment of long-lived assets | — | 2,050,387 | 253,362 | — | 2,303,749 | ||||||||||||||
Taxes, other than income taxes | 40 | 169,655 | 97,708 | — | 267,403 | ||||||||||||||
(Gains) losses on sale of assets and other, net | — | (487,286 | ) | 120,786 | — | (366,500 | ) | ||||||||||||
40 | 3,506,951 | 1,319,633 | — | 4,826,624 | |||||||||||||||
Other income and (expenses): | |||||||||||||||||||
Interest expense, net of amounts capitalized | (480,259 | ) | (19,631 | ) | (87,948 | ) | — | (587,838 | ) | ||||||||||
Interest expense – affiliates | — | (7,954 | ) | — | 7,954 | — | |||||||||||||
Interest income – affiliates | 7,954 | — | — | (7,954 | ) | — | |||||||||||||
Equity in earnings from consolidated subsidiaries | 28,397 | — | — | (28,397 | ) | — | |||||||||||||
Other, net | (7,861 | ) | (7,309 | ) | (1,043 | ) | — | (16,213 | ) | ||||||||||
(451,769 | ) | (34,894 | ) | (88,991 | ) | (28,397 | ) | (604,051 | ) | ||||||||||
Income (loss) before income taxes | (451,809 | ) | 10,169 | 22,665 | (28,397 | ) | (447,372 | ) | |||||||||||
Income tax expense | — | 4,368 | 69 | — | 4,437 | ||||||||||||||
Net income (loss) | $ | (451,809 | ) | $ | 5,801 | $ | 22,596 | $ | (28,397 | ) | $ | (451,809 | ) | ||||||
124
CONDENSED CONSOLIDATING STATEMENTS OF OPERATIONS
For the Year Ended December 31, 2013
LINN Energy, LLC | Guarantor Subsidiaries | Non- Guarantor Subsidiary | Eliminations | Consolidated | |||||||||||||||
(in thousands) | |||||||||||||||||||
Revenues and other: | |||||||||||||||||||
Oil, natural gas and natural gas liquids sales | $ | — | $ | 2,022,916 | $ | 50,324 | $ | — | $ | 2,073,240 | |||||||||
Gains (losses) on oil and natural gas derivatives | — | 182,906 | (5,049 | ) | — | 177,857 | |||||||||||||
Marketing revenues | — | 52,328 | 1,843 | — | 54,171 | ||||||||||||||
Other revenues | — | 26,387 | — | — | 26,387 | ||||||||||||||
— | 2,284,537 | 47,118 | — | 2,331,655 | |||||||||||||||
Expenses: | |||||||||||||||||||
Lease operating expenses | — | 357,113 | 15,410 | — | 372,523 | ||||||||||||||
Transportation expenses | — | 125,864 | 2,576 | — | 128,440 | ||||||||||||||
Marketing expenses | — | 36,259 | 1,633 | — | 37,892 | ||||||||||||||
General and administrative expenses | — | 215,973 | 20,298 | — | 236,271 | ||||||||||||||
Exploration costs | — | 5,251 | — | — | 5,251 | ||||||||||||||
Depreciation, depletion and amortization | — | 818,466 | 10,845 | — | 829,311 | ||||||||||||||
Impairment of long-lived assets | — | 828,317 | — | — | 828,317 | ||||||||||||||
Taxes, other than income taxes | — | 136,501 | 2,130 | — | 138,631 | ||||||||||||||
Losses on sale of assets and other, net | 724 | 2,705 | 10,208 | — | 13,637 | ||||||||||||||
724 | 2,526,449 | 63,100 | — | 2,590,273 | |||||||||||||||
Other income and (expenses): | |||||||||||||||||||
Interest expense, net of amounts capitalized | (415,670 | ) | (1,504 | ) | (3,963 | ) | — | (421,137 | ) | ||||||||||
Interest expense – affiliates | — | (5,543 | ) | — | 5,543 | — | |||||||||||||
Interest income – affiliates | 5,543 | — | — | (5,543 | ) | — | |||||||||||||
Loss on extinguishment of debt | (5,304 | ) | — | — | — | (5,304 | ) | ||||||||||||
Equity in losses from consolidated subsidiaries | (266,899 | ) | — | — | 266,899 | — | |||||||||||||
Other, net | (8,283 | ) | (166 | ) | (28 | ) | — | (8,477 | ) | ||||||||||
(690,613 | ) | (7,213 | ) | (3,991 | ) | 266,899 | (434,918 | ) | |||||||||||
Loss before income taxes | (691,337 | ) | (249,125 | ) | (19,973 | ) | 266,899 | (693,536 | ) | ||||||||||
Income tax benefit | — | (2,199 | ) | — | — | (2,199 | ) | ||||||||||||
Net loss | $ | (691,337 | ) | $ | (246,926 | ) | $ | (19,973 | ) | $ | 266,899 | $ | (691,337 | ) | |||||
125
CONDENSED CONSOLIDATING STATEMENTS OF CASH FLOWS
For the Year Ended December 31, 2015
LINN Energy, LLC | Guarantor Subsidiaries | Non- Guarantor Subsidiary | Eliminations | Consolidated | |||||||||||||||
(in thousands) | |||||||||||||||||||
Cash flow from operating activities: | |||||||||||||||||||
Net loss | $ | (4,759,811 | ) | $ | (4,045,607 | ) | $ | (1,015,177 | ) | $ | 5,060,784 | $ | (4,759,811 | ) | |||||
Adjustments to reconcile net loss to net cash provided by operating activities: | |||||||||||||||||||
Depreciation, depletion and amortization | — | 547,675 | 251,371 | 6,711 | 805,757 | ||||||||||||||
Impairment of long-lived assets | — | 5,024,944 | 853,810 | (64,800 | ) | 5,813,954 | |||||||||||||
Unit-based compensation expenses | — | 56,136 | — | — | 56,136 | ||||||||||||||
Gain on extinguishment of debt | (708,050 | ) | — | (11,209 | ) | — | (719,259 | ) | |||||||||||
Amortization and write-off of deferred financing fees | 30,993 | — | 3,750 | — | 34,743 | ||||||||||||||
Gains on sale of assets and other, net | — | (188,200 | ) | (961 | ) | — | (189,161 | ) | |||||||||||
Equity in losses from consolidated subsidiaries | 5,002,695 | — | — | (5,002,695 | ) | — | |||||||||||||
Deferred income taxes | — | 4,606 | (68 | ) | — | 4,538 | |||||||||||||
Derivatives activities: | |||||||||||||||||||
Total gains | — | (1,027,014 | ) | (36,068 | ) | — | (1,063,082 | ) | |||||||||||
Cash settlements | — | 1,130,640 | 68,770 | — | 1,199,410 | ||||||||||||||
Cash settlements on canceled derivatives | — | 4,679 | — | — | 4,679 | ||||||||||||||
Changes in assets and liabilities: | |||||||||||||||||||
Decrease in accounts receivable – trade, net | — | 207,300 | 59,941 | — | 267,241 | ||||||||||||||
Decrease in accounts receivable – affiliates | 1,167,823 | 4,584 | — | (1,172,407 | ) | — | |||||||||||||
(Increase) decrease in other assets | — | (9,142 | ) | 18,724 | — | 9,582 | |||||||||||||
Decrease in accounts payable and accrued expenses | (14 | ) | (98,209 | ) | (58,171 | ) | — | (156,394 | ) | ||||||||||
Decrease in accounts payable and accrued expenses – affiliates | — | (1,167,823 | ) | (4,584 | ) | 1,172,407 | — | ||||||||||||
Decrease in other liabilities | (39,646 | ) | (11,620 | ) | (7,610 | ) | — | (58,876 | ) | ||||||||||
Net cash provided by operating activities | 693,990 | 432,949 | 122,518 | — | 1,249,457 | ||||||||||||||
Cash flow from investing activities: | |||||||||||||||||||
Development of oil and natural gas properties | — | (576,256 | ) | (32,633 | ) | — | (608,889 | ) | |||||||||||
Purchases of other property and equipment | — | (48,967 | ) | (17,741 | ) | — | (66,708 | ) | |||||||||||
Investment in affiliates | (132,332 | ) | — | — | 132,332 | — | |||||||||||||
Change in notes receivable with affiliate | (44,600 | ) | — | — | 44,600 | — | |||||||||||||
Settlement of advance to affiliate | — | — | 129,217 | (129,217 | ) | — | |||||||||||||
Proceeds from sale of properties and equipment and other | (3,430 | ) | 349,200 | 22,525 | — | 368,295 | |||||||||||||
Net cash provided by (used in) investing activities | (180,362 | ) | (276,023 | ) | 101,368 | 47,715 | (307,302 | ) | |||||||||||
126
LINN Energy, LLC | Guarantor Subsidiaries | Non- Guarantor Subsidiary | Eliminations | Consolidated | |||||||||||||||
(in thousands) | |||||||||||||||||||
Cash flow from financing activities: | |||||||||||||||||||
Proceeds from sale of units | 233,427 | — | — | — | 233,427 | ||||||||||||||
Proceeds from borrowings | 1,445,000 | — | — | — | 1,445,000 | ||||||||||||||
Repayments of debt | (1,828,461 | ) | — | (355,418 | ) | — | (2,183,879 | ) | |||||||||||
Distributions to unitholders | (323,878 | ) | — | — | — | (323,878 | ) | ||||||||||||
Financing fees and offering costs | (26,678 | ) | — | (1,377 | ) | — | (28,055 | ) | |||||||||||
Change in note payable with affiliate | — | 44,600 | — | (44,600 | ) | — | |||||||||||||
Settlement of advance from affiliate | — | (129,217 | ) | — | 129,217 | — | |||||||||||||
Capital contributions – affiliates | — | — | 132,332 | (132,332 | ) | — | |||||||||||||
Excess tax benefit from unit-based compensation | (9,467 | ) | — | — | — | (9,467 | ) | ||||||||||||
Other | (2,536 | ) | (72,422 | ) | 14 | — | (74,944 | ) | |||||||||||
Net cash used in financing activities | (512,593 | ) | (157,039 | ) | (224,449 | ) | (47,715 | ) | (941,796 | ) | |||||||||
Net increase (decrease) in cash and cash equivalents | 1,035 | (113 | ) | (563 | ) | — | 359 | ||||||||||||
Cash and cash equivalents: | |||||||||||||||||||
Beginning | 38 | 185 | 1,586 | — | 1,809 | ||||||||||||||
Ending | $ | 1,073 | $ | 72 | $ | 1,023 | $ | — | $ | 2,168 | |||||||||
127
CONDENSED CONSOLIDATING STATEMENTS OF CASH FLOWS
For the Year Ended December 31, 2014
LINN Energy, LLC | Guarantor Subsidiaries | Non- Guarantor Subsidiary | Eliminations | Consolidated | |||||||||||||||
(in thousands) | |||||||||||||||||||
Cash flow from operating activities: | |||||||||||||||||||
Net income (loss) | $ | (451,809 | ) | $ | 5,801 | $ | 22,596 | $ | (28,397 | ) | $ | (451,809 | ) | ||||||
Adjustments to reconcile net income (loss) to net cash provided by (used in) operating activities: | |||||||||||||||||||
Depreciation, depletion and amortization | — | 771,549 | 302,353 | — | 1,073,902 | ||||||||||||||
Impairment of long-lived assets | — | 2,050,387 | 253,362 | — | 2,303,749 | ||||||||||||||
Unit-based compensation expenses | — | 53,284 | — | — | 53,284 | ||||||||||||||
Amortization and write-off of deferred financing fees | 38,785 | 17,054 | (4,913 | ) | — | 50,926 | |||||||||||||
(Gains) losses on sale of assets and other, net | — | (372,945 | ) | 111,374 | — | (261,571 | ) | ||||||||||||
Equity in earnings from consolidated subsidiaries | (28,397 | ) | — | — | 28,397 | — | |||||||||||||
Deferred income taxes | — | 3,874 | 69 | — | 3,943 | ||||||||||||||
Derivatives activities: | |||||||||||||||||||
Total gains | — | (1,127,395 | ) | (78,784 | ) | — | (1,206,179 | ) | |||||||||||
Cash settlements | — | 88,776 | 6,738 | — | 95,514 | ||||||||||||||
Cash settlements on canceled derivatives | — | — | 12,281 | — | 12,281 | ||||||||||||||
Changes in assets and liabilities: | |||||||||||||||||||
(Increase) decrease in accounts receivable – trade, net | — | (11,419 | ) | 16,483 | — | 5,064 | |||||||||||||
Decrease in accounts receivable – affiliates | 257,485 | 16,950 | — | (274,435 | ) | — | |||||||||||||
(Increase) decrease in other assets | 312 | (2,187 | ) | (15,949 | ) | — | (17,824 | ) | |||||||||||
Increase in accounts payable and accrued expenses | — | 99,003 | 26 | — | 99,029 | ||||||||||||||
Decrease in accounts payable and accrued expenses – affiliates | — | (270,690 | ) | (3,745 | ) | 274,435 | — | ||||||||||||
Increase (decrease) in other liabilities | 14,465 | (24,473 | ) | (38,411 | ) | — | (48,419 | ) | |||||||||||
Net cash provided by (used in) operating activities | (169,159 | ) | 1,297,569 | 583,480 | — | 1,711,890 | |||||||||||||
Cash flow from investing activities: | |||||||||||||||||||
Acquisition of oil and natural gas properties and joint-venture funding, net of cash acquired | — | (2,475,315 | ) | (3,937 | ) | — | (2,479,252 | ) | |||||||||||
Development of oil and natural gas properties | — | (1,061,395 | ) | (508,482 | ) | — | (1,569,877 | ) | |||||||||||
Purchases of other property and equipment | — | (63,070 | ) | (11,470 | ) | — | (74,540 | ) | |||||||||||
Investment in affiliates | (100,921 | ) | — | — | 100,921 | — | |||||||||||||
Change in notes receivable with affiliate | (44,300 | ) | — | — | 44,300 | — | |||||||||||||
Proceeds from sale of properties and equipment and other | (14,117 | ) | 2,210,015 | 7,667 | — | 2,203,565 | |||||||||||||
Net cash used in investing activities | (159,338 | ) | (1,389,765 | ) | (516,222 | ) | 145,221 | (1,920,104 | ) | ||||||||||
128
LINN Energy, LLC | Guarantor Subsidiaries | Non- Guarantor Subsidiary | Eliminations | Consolidated | |||||||||||||||
(in thousands) | |||||||||||||||||||
Cash flow from financing activities: | |||||||||||||||||||
Proceeds from borrowings | 4,640,024 | 1,300,000 | — | — | 5,940,024 | ||||||||||||||
Repayments of debt | (3,305,000 | ) | (1,300,000 | ) | (206,124 | ) | — | (4,811,124 | ) | ||||||||||
Distributions to unitholders | (962,048 | ) | — | — | — | (962,048 | ) | ||||||||||||
Financing fees and offering costs | (59,048 | ) | — | (10,646 | ) | — | (69,694 | ) | |||||||||||
Change in note payable with affiliate | — | 44,300 | — | (44,300 | ) | — | |||||||||||||
Capital contribution – affiliates | — | — | 100,921 | (100,921 | ) | — | |||||||||||||
Excess tax benefit from unit-based compensation | 810 | (44 | ) | — | — | 766 | |||||||||||||
Other | 13,745 | 47,047 | (864 | ) | — | 59,928 | |||||||||||||
Net cash provided by (used in) financing activities | 328,483 | 91,303 | (116,713 | ) | (145,221 | ) | 157,852 | ||||||||||||
Net decrease in cash and cash equivalents | (14 | ) | (893 | ) | (49,455 | ) | — | (50,362 | ) | ||||||||||
Cash and cash equivalents: | |||||||||||||||||||
Beginning | 52 | 1,078 | 51,041 | — | 52,171 | ||||||||||||||
Ending | $ | 38 | $ | 185 | $ | 1,586 | $ | — | $ | 1,809 | |||||||||
129
CONDENSED CONSOLIDATING STATEMENTS OF CASH FLOWS
For the Year Ended December 31, 2013
LINN Energy, LLC | Guarantor Subsidiaries | Non- Guarantor Subsidiary | Eliminations | Consolidated | |||||||||||||||
(in thousands) | |||||||||||||||||||
Cash flow from operating activities: | |||||||||||||||||||
Net loss | $ | (691,337 | ) | $ | (246,926 | ) | $ | (19,973 | ) | $ | 266,899 | $ | (691,337 | ) | |||||
Adjustments to reconcile net loss to net cash provided by (used in) operating activities: | |||||||||||||||||||
Depreciation, depletion and amortization | — | 818,466 | 10,845 | — | 829,311 | ||||||||||||||
Impairment of long-lived assets | — | 828,317 | — | — | 828,317 | ||||||||||||||
Unit-based compensation expenses | — | 42,703 | — | — | 42,703 | ||||||||||||||
Loss on extinguishment of debt | 5,304 | — | — | — | 5,304 | ||||||||||||||
Amortization and write-off of deferred financing fees | 22,122 | — | (615 | ) | — | 21,507 | |||||||||||||
Losses on sale of assets and other, net | — | 37,232 | — | — | 37,232 | ||||||||||||||
Equity in losses from consolidated subsidiaries | 266,899 | — | — | (266,899 | ) | — | |||||||||||||
Deferred income taxes | — | (2,541 | ) | — | — | (2,541 | ) | ||||||||||||
Derivatives activities: | |||||||||||||||||||
Total (gains) losses | — | (182,906 | ) | 5,049 | — | (177,857 | ) | ||||||||||||
Cash settlements | — | 248,862 | — | — | 248,862 | ||||||||||||||
Changes in assets and liabilities: | |||||||||||||||||||
Decrease in accounts receivable – trade, net | — | 17,754 | 71,434 | — | 89,188 | ||||||||||||||
Increase in accounts receivable – affiliates | (120,967 | ) | (16,950 | ) | — | 137,917 | — | ||||||||||||
(Increase) decrease in other assets | (330 | ) | 5,896 | 10,613 | — | 16,179 | |||||||||||||
Increase (decrease) in accounts payable and accrued expenses | 178 | (52,143 | ) | (25,028 | ) | — | (76,993 | ) | |||||||||||
Increase in accounts payable and accrued expenses – affiliates | — | 120,967 | 16,950 | (137,917 | ) | — | |||||||||||||
Increase (decrease) in other liabilities | 2,092 | 6,842 | (12,597 | ) | — | (3,663 | ) | ||||||||||||
Net cash provided by (used in) operating activities | (516,039 | ) | 1,625,573 | 56,678 | — | 1,166,212 | |||||||||||||
Cash flow from investing activities: | |||||||||||||||||||
Acquisition of oil and natural gas properties and joint-venture funding, net of cash acquired | — | (730,326 | ) | 451,113 | — | (279,213 | ) | ||||||||||||
Development of oil and natural gas properties | — | (1,060,547 | ) | (17,478 | ) | — | (1,078,025 | ) | |||||||||||
Purchases of other property and equipment | — | (92,352 | ) | — | — | (92,352 | ) | ||||||||||||
Investment in affiliates | 435,000 | — | — | (435,000 | ) | — | |||||||||||||
Change in notes receivable with affiliate | (26,700 | ) | — | — | 26,700 | — | |||||||||||||
Proceeds from sale of properties and equipment and other | (22,039 | ) | 218,312 | — | — | 196,273 | |||||||||||||
Net cash provided by (used in) investing activities | 386,261 | (1,664,913 | ) | 433,635 | (408,300 | ) | (1,253,317 | ) | |||||||||||
130
LINN Energy, LLC | Guarantor Subsidiaries | Non- Guarantor Subsidiary | Eliminations | Consolidated | |||||||||||||||
(in thousands) | |||||||||||||||||||
Cash flow from financing activities: | |||||||||||||||||||
Proceeds from borrowings | 2,230,000 | — | — | — | 2,230,000 | ||||||||||||||
Repayments of debt | (1,404,898 | ) | — | — | — | (1,404,898 | ) | ||||||||||||
Distributions to unitholders | (682,241 | ) | — | — | — | (682,241 | ) | ||||||||||||
Financing fees and offering costs | (16,033 | ) | — | — | — | (16,033 | ) | ||||||||||||
Change in note payable with affiliate | — | 26,700 | — | (26,700 | ) | — | |||||||||||||
Capital contribution – affiliates | — | — | (435,000 | ) | 435,000 | — | |||||||||||||
Excess tax benefit from unit-based compensation | — | 160 | — | — | 160 | ||||||||||||||
Other | 2,895 | 12,422 | (4,272 | ) | — | 11,045 | |||||||||||||
Net cash provided by (used in) financing activities | 129,723 | 39,282 | (439,272 | ) | 408,300 | 138,033 | |||||||||||||
Net increase (decrease) in cash and cash equivalents | (55 | ) | (58 | ) | 51,041 | — | 50,928 | ||||||||||||
Cash and cash equivalents: | |||||||||||||||||||
Beginning | 107 | 1,136 | — | — | 1,243 | ||||||||||||||
Ending | $ | 52 | $ | 1,078 | $ | 51,041 | $ | — | $ | 52,171 | |||||||||
131
The following discussion and analysis should be read in conjunction with the “Consolidated Financial Statements” and “Notes to Consolidated Financial Statements,” which are included in this Annual Report on Form 10-K in Item 8. “Financial Statements and Supplementary Data.”
Costs Incurred in Oil and Natural Gas Property Acquisition, Exploration and Development Activities
Costs incurred in oil and natural gas property acquisition, exploration and development, whether capitalized or expensed, are presented below:
Year Ended December 31, | |||||||||||
2015 | 2014 | 2013 | |||||||||
(in thousands) | |||||||||||
Property acquisition costs: (1) | |||||||||||
Proved | $ | — | $ | 2,784,852 | $ | 3,740,379 | |||||
Unproved | — | 788,682 | 1,638,302 | ||||||||
Exploration costs | 19,929 | 792 | 13,096 | ||||||||
Development costs | 430,357 | 1,487,204 | 1,153,770 | ||||||||
Asset retirement costs | 6,303 | 20,919 | 7,351 | ||||||||
Total costs incurred | $ | 456,589 | $ | 5,082,449 | $ | 6,552,898 | |||||
(1) | See Note 2 for details about the Company’s acquisitions. |
Oil and Natural Gas Capitalized Costs
Aggregate capitalized costs related to oil, natural gas and NGL production activities with applicable accumulated depletion and amortization are presented below:
December 31, | |||||||
2015 | 2014 | ||||||
(in thousands) | |||||||
Proved properties: | |||||||
Leasehold acquisition | $ | 13,361,171 | $ | 13,362,642 | |||
Development | 2,976,643 | 2,830,841 | |||||
Unproved properties | 1,783,341 | 1,875,417 | |||||
18,121,155 | 18,068,900 | ||||||
Less accumulated depletion and amortization | (11,097,492 | ) | (4,867,682 | ) | |||
$ | 7,023,663 | $ | 13,201,218 | ||||
132
Results of Oil and Natural Gas Producing Activities
The results of operations for oil, natural gas and NGL producing activities (excluding corporate overhead and interest costs) are presented below:
Year Ended December 31, | |||||||||||
2015 | 2014 | 2013 | |||||||||
(in thousands) | |||||||||||
Revenues and other: | |||||||||||
Oil, natural gas and natural gas liquids sales | $ | 1,726,271 | $ | 3,610,539 | $ | 2,073,240 | |||||
Gains on oil and natural gas derivatives | 1,056,189 | 1,206,179 | 177,857 | ||||||||
2,782,460 | 4,816,718 | 2,251,097 | |||||||||
Production costs: | |||||||||||
Lease operating expenses | 617,764 | 805,164 | 372,523 | ||||||||
Transportation expenses | 219,721 | 207,331 | 128,440 | ||||||||
Severance taxes, ad valorem taxes and California carbon allowances | 181,941 | 267,100 | 139,202 | ||||||||
1,019,426 | 1,279,595 | 640,165 | |||||||||
Other costs: | |||||||||||
Exploration costs | 9,473 | 125,037 | 5,251 | ||||||||
Depletion and amortization | 745,512 | 1,020,674 | 790,320 | ||||||||
Impairment of long-lived assets | 5,813,954 | 2,303,749 | 828,317 | ||||||||
Gains on sale of assets and other, net | (198,924 | ) | (388,733 | ) | (138 | ) | |||||
Texas margin tax expense (benefit) | (2,789 | ) | 4,053 | 458 | |||||||
6,367,226 | 3,064,780 | 1,624,208 | |||||||||
Results of operations | $ | (4,604,192 | ) | $ | 472,343 | $ | (13,276 | ) | |||
There is no federal tax provision included in the results above because the Company’s subsidiaries subject to federal tax do not own any of the Company’s oil and natural gas interests. Limited liability companies are subject to Texas margin tax. See Note 14 for additional information about income taxes.
133
Proved Oil, Natural Gas and NGL Reserves
The proved reserves of oil, natural gas and NGL of the Company have been prepared by the independent engineering firm, DeGolyer and MacNaughton. In accordance with SEC regulations, reserves at December 31, 2015, December 31, 2014, and December 31, 2013, were estimated using the average price during the 12-month period, determined as an unweighted average of the first-day-of-the-month price for each month, excluding escalations based upon future conditions. An analysis of the change in estimated quantities of oil, natural gas and NGL reserves, all of which are located within the U.S., is shown below:
Year Ended December 31, 2015 | |||||||||||
Natural Gas (Bcf) | Oil (MMBbls) | NGL (MMBbls) | Total (Bcfe) | ||||||||
Proved developed and undeveloped reserves: | |||||||||||
Beginning of year | 4,255 | 341.8 | 166.3 | 7,304 | |||||||
Revisions of previous estimates | (1,404 | ) | (122.2 | ) | (40.4 | ) | (2,379 | ) | |||
Sales of minerals in place | (13 | ) | (4.1 | ) | (2.0 | ) | (50 | ) | |||
Extensions, discoveries and other additions | 15 | 4.6 | 0.8 | 47 | |||||||
Production | (234 | ) | (22.8 | ) | (10.4 | ) | (434 | ) | |||
End of year | 2,619 | 197.3 | 114.3 | 4,488 | |||||||
Proved developed reserves: | |||||||||||
Beginning of year | 3,549 | 246.0 | 132.2 | 5,818 | |||||||
End of year | 2,619 | 197.3 | 114.3 | 4,488 | |||||||
Proved undeveloped reserves: | |||||||||||
Beginning of year | 706 | 95.8 | 34.1 | 1,486 | |||||||
End of year | — | — | — | — | |||||||
Year Ended December 31, 2014 | |||||||||||
Natural Gas (Bcf) | Oil (MMBbls) | NGL (MMBbls) | Total (Bcfe) | ||||||||
Proved developed and undeveloped reserves: | |||||||||||
Beginning of year | 3,010 | 365.6 | 200.0 | 6,403 | |||||||
Revisions of previous estimates | 96 | (22.3 | ) | (46.8 | ) | (318 | ) | ||||
Purchases of minerals in place | 1,763 | 50.0 | 71.9 | 2,495 | |||||||
Sales of minerals in place | (477 | ) | (51.7 | ) | (49.5 | ) | (1,084 | ) | |||
Extensions, discoveries and other additions | 72 | 26.8 | 2.9 | 250 | |||||||
Production | (209 | ) | (26.6 | ) | (12.2 | ) | (442 | ) | |||
End of year | 4,255 | 341.8 | 166.3 | 7,304 | |||||||
Proved developed reserves: | |||||||||||
Beginning of year | 2,027 | 252.4 | 133.2 | 4,340 | |||||||
End of year | 3,549 | 246.0 | 132.2 | 5,818 | |||||||
Proved undeveloped reserves: | |||||||||||
Beginning of year | 983 | 113.2 | 66.8 | 2,063 | |||||||
End of year | 706 | 95.8 | 34.1 | 1,486 | |||||||
134
Year Ended December 31, 2013 | |||||||||||
Natural Gas (Bcf) | Oil (MMBbls) | NGL (MMBbls) | Total (Bcfe) | ||||||||
Proved developed and undeveloped reserves: | |||||||||||
Beginning of year | 2,571 | 191.5 | 179.4 | 4,796 | |||||||
Revisions of previous estimates | (17 | ) | (21.3 | ) | (2.0 | ) | (157 | ) | |||
Purchases of minerals in place | 356 | 191.1 | 17.8 | 1,610 | |||||||
Sales of minerals in place | (24 | ) | (5.2 | ) | (2.9 | ) | (73 | ) | |||
Extensions, discoveries and other additions | 286 | 21.7 | 18.5 | 527 | |||||||
Production | (162 | ) | (12.2 | ) | (10.8 | ) | (300 | ) | |||
End of year | 3,010 | 365.6 | 200.0 | 6,403 | |||||||
Proved developed reserves: | |||||||||||
Beginning of year | 1,661 | 131.4 | 113.0 | 3,127 | |||||||
End of year | 2,027 | 252.4 | 133.2 | 4,340 | |||||||
Proved undeveloped reserves: | |||||||||||
Beginning of year | 910 | 60.1 | 66.4 | 1,669 | |||||||
End of year | 983 | 113.2 | 66.8 | 2,063 | |||||||
The tables above include changes in estimated quantities of oil and NGL reserves shown in Mcf equivalents using the ratio of one barrel to six Mcf.
Proved reserves decreased by approximately 2,816 Bcfe to approximately 4,488 Bcfe for the year ended December 31, 2015, from 7,304 Bcfe for the year ended December 31, 2014. The year ended December 31, 2015, includes approximately 2,379 Bcfe of negative revisions of previous estimates (1,776 Bcfe due to lower commodity prices, 349 Bcfe due to uncertainty regarding the Company’s future commitment to capital and 302 Bcfe due to the SEC five-year development limitation on PUDs, partially offset by 48 Bcfe of positive revisions due to asset performance). During the year ended December 31, 2015, divestitures including the Howard County Assets Sale decreased proved reserves by approximately 50 Bcfe. In addition, extensions and discoveries, primarily from 584 productive wells drilled during the year, contributed approximately 47 Bcfe to the increase in proved reserves.
As a result of the uncertainty regarding the Company’s future commitment to capital, the Company reclassified all of its PUDs to unproved as of December 31, 2015. See Item 7. “Management’s Discussion and Analysis of Financial Condition and Results of Operations” for details regarding the Company’s going concern uncertainty.
The prices of oil, natural gas and NGL have continued to be volatile in 2016. In the future, if commodity prices continue to decline, the Company may have additional negative revisions which could have a material impact on its estimated quantities of oil, natural gas and NGL reserves. For information about potential risks that could affect the Company if lower commodity prices were to continue, see Item 1A. “Risk Factors.”
Proved reserves increased by approximately 901 Bcfe to approximately 7,304 Bcfe for the year ended December 31, 2014, from 6,403 Bcfe for the year ended December 31, 2013. The year ended December 31, 2014, includes approximately 318 Bcfe of negative revisions of previous estimates, due primarily to 174 Bcfe of negative revisions due to ethane rejection in the Hugoton and Green River basins, 146 Bcfe of negative revisions due to the SEC five-year development limitation on PUDs and 43 Bcfe of negative revisions due to asset performance, partially offset by 45 Bcfe of positive revisions primarily due to higher natural gas prices. During the year ended December 31, 2014, acquisitions and properties acquired in the two exchanges with Exxon XTO and ExxonMobil increased proved reserves by approximately 2,495 Bcfe and the 2014 divestitures and properties relinquished in the two exchanges with Exxon XTO and ExxonMobil decreased proved reserves by approximately 1,084 Bcfe. In addition, extensions and discoveries, primarily from 917 productive wells drilled during the year, contributed approximately 250 Bcfe to the increase in proved reserves.
135
Proved reserves increased by approximately 1,607 Bcfe to approximately 6,403 Bcfe for the year ended December 31, 2013, from 4,796 Bcfe for the year ended December 31, 2012. The year ended December 31, 2013, includes 157 Bcfe of negative revisions of previous estimates, due primarily to 100 Bcfe of negative revisions due to asset performance, 109 Bcfe of negative revisions due to the SEC five-year development limitation on PUDs, partially offset by 52 Bcfe of positive revisions primarily due to higher natural gas prices. During the year ended December 31, 2013, three acquisitions increased proved reserves by approximately 1,610 Bcfe and the sale of the Panther Operated Cleveland Properties decreased proved reserves by approximately 73 Bcfe. In addition, extensions and discoveries, primarily from 557 productive wells drilled during the year, contributed approximately 527 Bcfe to the increase in proved reserves.
Standardized Measure of Discounted Future Net Cash Flows and Changes Therein Relating to Proved Reserves
Information with respect to the standardized measure of discounted future net cash flows relating to proved reserves is summarized below. Future cash inflows are computed by applying applicable prices relating to the Company’s proved reserves to the year-end quantities of those reserves. Future production, development, site restoration and abandonment costs are derived based on current costs assuming continuation of existing economic conditions. There are no future income tax expenses because the Company is not subject to federal income taxes. Limited liability companies are subject to Texas margin tax; however, these amounts are not material. See Note 14 for additional information about income taxes.
December 31, | |||||||||||
2015 | 2014 | 2013 | |||||||||
(in thousands) | |||||||||||
Future estimated revenues | $ | 17,293,943 | $ | 55,195,268 | $ | 51,112,346 | |||||
Future estimated production costs | (10,734,979 | ) | (24,100,468 | ) | (19,306,728 | ) | |||||
Future estimated development costs | (1,107,639 | ) | (4,032,588 | ) | (5,110,896 | ) | |||||
Future net cash flows | 5,451,325 | 27,062,212 | 26,694,722 | ||||||||
10% annual discount for estimated timing of cash flows | (2,417,780 | ) | (14,549,921 | ) | (14,795,393 | ) | |||||
Standardized measure of discounted future net cash flows | $ | 3,033,545 | $ | 12,512,291 | $ | 11,899,329 | |||||
Representative NYMEX prices: (1) | |||||||||||
Natural gas (MMBtu) | $ | 2.59 | $ | 4.35 | $ | 3.67 | |||||
Oil (Bbl) | $ | 50.16 | $ | 95.27 | $ | 96.89 | |||||
(1) | In accordance with SEC regulations, reserves were estimated using the average price during the 12-month period, determined as an unweighted average of the first-day-of-the-month price for each month, excluding escalations based upon future conditions. The average price used to estimate reserves is held constant over the life of the reserves. |
136
The following table summarizes the principal sources of change in the standardized measure of discounted future net cash flows:
Year Ended December 31, | |||||||||||
2015 | 2014 | 2013 | |||||||||
(in thousands) | |||||||||||
Sales and transfers of oil, natural gas and NGL produced during the period | $ | (706,845 | ) | $ | (2,330,944 | ) | $ | (1,433,075 | ) | ||
Changes in estimated future development costs | 1,501,593 | 156,614 | 317,064 | ||||||||
Net change in sales and transfer prices and production costs related to future production | (9,309,151 | ) | (599,121 | ) | 203,370 | ||||||
Purchases of minerals in place | — | 3,021,768 | 5,113,335 | ||||||||
Sales of minerals in place | (97,785 | ) | (1,681,504 | ) | (139,384 | ) | |||||
Extensions, discoveries and improved recovery | 90,090 | 910,787 | 801,254 | ||||||||
Previously estimated development costs incurred during the period | 159,248 | 819,987 | 444,861 | ||||||||
Net change due to revisions in quantity estimates | (1,633,958 | ) | (672,800 | ) | (220,224 | ) | |||||
Accretion of discount | 1,251,229 | 1,189,933 | 607,298 | ||||||||
Changes in production rates and other | (733,167 | ) | (201,758 | ) | 131,849 | ||||||
$ | (9,478,746 | ) | $ | 612,962 | $ | 5,826,348 | |||||
The data presented should not be viewed as representing the expected cash flow from, or current value of, existing proved reserves since the computations are based on a large number of estimates and assumptions. The required projection of production and related expenditures over time requires further estimates with respect to pipeline availability, rates of demand and governmental control. Actual future prices and costs are likely to be substantially different from the current prices and costs utilized in the computation of reported amounts. Any analysis or evaluation of the reported amounts should give specific recognition to the computational methods utilized and the limitations inherent therein.
137
LINN ENERGY, LLC
SUPPLEMENTAL QUARTERLY DATA (Unaudited)
The following discussion and analysis should be read in conjunction with the “Consolidated Financial Statements” and “Notes to Consolidated Financial Statements,” which are included in this Annual Report on Form 10-K in Item 8. “Financial Statements and Supplementary Data.”
Quarterly Financial Data
Quarters Ended | |||||||||||||||
March 31 | June 30 | September 30 | December 31 | ||||||||||||
(in thousands, except per unit amounts) | |||||||||||||||
2015: | |||||||||||||||
Oil, natural gas and natural gas liquids sales | $ | 450,569 | $ | 496,419 | $ | 427,245 | $ | 352,038 | |||||||
Gains (losses) on oil and natural gas derivatives | 424,781 | (191,188 | ) | 549,029 | 273,567 | ||||||||||
Total revenues and other | 916,547 | 321,828 | 998,304 | 646,655 | |||||||||||
Total expenses (1) | 1,136,442 | 578,586 | 2,790,081 | 3,497,486 | |||||||||||
Gains on sale of assets and other, net | (12,287 | ) | (17,996 | ) | (166,980 | ) | (146 | ) | |||||||
Net loss | (339,160 | ) | (379,127 | ) | (1,569,317 | ) | (2,472,207 | ) | |||||||
Net loss per unit: | |||||||||||||||
Basic | $ | (1.03 | ) | $ | (1.12 | ) | $ | (4.47 | ) | $ | (7.05 | ) | |||
Diluted | $ | (1.03 | ) | $ | (1.12 | ) | $ | (4.47 | ) | $ | (7.05 | ) | |||
Quarters Ended | |||||||||||||||
March 31 | June 30 | September 30 | December 31 | ||||||||||||
(in thousands, except per unit amounts) | |||||||||||||||
2014: | |||||||||||||||
Oil, natural gas and natural gas liquids sales | $ | 938,877 | $ | 967,850 | $ | 937,458 | $ | 766,354 | |||||||
Gains (losses) on oil and natural gas derivatives | (241,493 | ) | (408,788 | ) | 451,702 | 1,404,758 | |||||||||
Total revenues and other | 733,587 | 596,951 | 1,435,115 | 2,217,650 | |||||||||||
Total expenses (1) | 674,568 | 664,452 | 1,320,157 | 2,533,947 | |||||||||||
(Gains) losses on sale of assets and other, net | 2,586 | 5,467 | (35,803 | ) | (338,750 | ) | |||||||||
Net loss | (85,337 | ) | (207,870 | ) | (4,100 | ) | (154,502 | ) | |||||||
Net loss per unit: | |||||||||||||||
Basic | $ | (0.27 | ) | $ | (0.64 | ) | $ | (0.02 | ) | $ | (0.47 | ) | |||
Diluted | $ | (0.27 | ) | $ | (0.64 | ) | $ | (0.02 | ) | $ | (0.47 | ) | |||
(1) | Includes the following expenses: lease operating, transportation, marketing, general and administrative, exploration, depreciation, depletion and amortization, impairment of long-lived assets and taxes, other than income taxes. |
138
Item 9. Changes in and Disagreements With Accountants on Accounting and Financial Disclosure
None
Item 9A. Controls and Procedures
Evaluation of Disclosure Controls and Procedures
The Company maintains disclosure controls and procedures that are designed to ensure that information required to be disclosed in the Company’s reports under the Securities Exchange Act of 1934, as amended (the “Exchange Act”) is recorded, processed, summarized and reported within the time periods specified in the SEC’s rules and forms, and that such information is accumulated and communicated to management, including the Company’s Chief Executive Officer and Chief Financial Officer, and the Company’s Audit Committee of the Board of Directors, as appropriate, to allow timely decisions regarding required disclosure. In designing and evaluating the disclosure controls and procedures, management recognizes that any controls and procedures, no matter how well designed and operated, can provide only reasonable assurance of achieving the desired control objectives, and management is required to apply its judgment in evaluating the cost-benefit relationship of possible controls and procedures.
The Company carried out an evaluation under the supervision and with the participation of its management, including its Chief Executive Officer and Chief Financial Officer, of the effectiveness of its disclosure controls and procedures as of the end of the period covered by this report. Based on this evaluation, the Chief Executive Officer and Chief Financial Officer concluded that the Company’s disclosure controls and procedures were effective as of December 31, 2015.
Management’s Annual Report on Internal Control Over Financial Reporting
See “Management’s Report on Internal Control Over Financial Reporting” in Item 8. “Financial Statements and Supplementary Data.”
Changes in the Company’s Internal Control Over Financial Reporting
The Company’s management is also responsible for establishing and maintaining adequate internal control over financial reporting, as defined in Rules 13a-15(f) and 15d-15(f) of the Exchange Act. The Company’s internal controls were designed to provide reasonable assurance as to the reliability of its financial reporting and the preparation and presentation of the consolidated financial statements for external purposes in accordance with accounting principles generally accepted in the United States.
Because of its inherent limitations, internal control over financial reporting may not detect or prevent misstatements. Projections of any evaluation of the effectiveness to future periods are subject to the risk that controls may become inadequate because of changes in conditions, or that the degree of compliance with the policies or procedures may deteriorate.
There were no changes in the Company’s internal control over financial reporting during the fourth quarter of 2015 that materially affected, or were reasonably likely to materially affect, the Company’s internal control over financial reporting.
Item 9B. Other Information
None
139
Part III
Item 10. Directors, Executive Officers and Corporate Governance
A list of the Company’s executive officers and biographical information appears below under the caption “Executive Officers of the Company.” Additional information required by this item is incorporated herein by reference to the Company’s definitive proxy statement for the annual meeting of unitholders (the “2016 Proxy Statement”).
Executive Officers of the Company
Name | Age | Position with the Company | ||
Mark E. Ellis | 59 | Chairman, President and Chief Executive Officer | ||
David B. Rottino | 49 | Executive Vice President and Chief Financial Officer | ||
Arden L. Walker, Jr. | 56 | Executive Vice President and Chief Operating Officer | ||
Thomas E. Emmons | 47 | Senior Vice President – Corporate Services | ||
Jamin B. McNeil | 50 | Senior Vice President – Houston Division Operations | ||
Candice J. Wells | 41 | Senior Vice President, General Counsel and Corporate Secretary | ||
Mark E. Ellis is the Chairman, President and Chief Executive Officer and has served in such capacity since December 2011. He previously served as President, Chief Executive Officer and Director from January 2010 to December 2011 and from December 2007 to January 2010, Mr. Ellis served as President and Chief Operating Officer of the Company. Mr. Ellis serves on the boards of the Independent Petroleum Association of America, American Exploration & Production Council, Houston Museum of Natural Science and The Center for the Performing Arts at The Woodlands. In addition, he holds a position as trustee on the Texas A&M University 12th Man Foundation Board of Trustees. Mr. Ellis is a member of the National Petroleum Council and the Society of Petroleum Engineers.
David B. Rottino is the Executive Vice President and Chief Financial Officer and has served in such capacity since August 2015. He previously served as Executive Vice President, Business Development and Chief Accounting Officer from January 2014 to August 2015. From July 2010 to January 2014, he served as Senior Vice President of Finance, Business Development and Chief Accounting Officer and from June 2008 to July 2010, Mr. Rottino served as Senior Vice President and Chief Accounting Officer.
Arden L. Walker, Jr. is the Executive Vice President and Chief Operating Officer and has served in such capacity since January 2011. From January 2010 to January 2011, he served as Senior Vice President and Chief Operating Officer. Mr. Walker joined the Company in February 2007 as Senior Vice President, Operations and Chief Engineer. Mr. Walker is a member of the Society of Petroleum Engineers and Independent Petroleum Association of America. He also serves on the boards of the Sam Houston Area Council of the Boy Scouts of America and Theatre Under The Stars.
Thomas E. Emmons is the Senior Vice President – Corporate Services and has served in such capacity since January 2014. He previously served as Vice President – Corporate Services from September 2012 to January 2014 and from August 2008 to September 2012, Mr. Emmons served as Vice President, Human Resources and Environmental, Health and Safety. He also serves on the Board of the Nehemiah Center in Houston.
Jamin B. McNeil is the Senior Vice President – Houston Division Operations and has served in such capacity since January 2014. From June 2007 to January 2014, Mr. McNeil served as Vice President – Houston Division Operations. Mr. McNeil is a member of the Society of Petroleum Engineers.
Candice J. Wells is the Senior Vice President, General Counsel and Corporate Secretary and has served in such capacity since January 2016. From October 2013 to January 2016, Ms. Wells served as Vice President, General Counsel and Corporate Secretary. From March 2013 to October 2013, Ms. Wells served as Vice President, acting General Counsel and Corporate Secretary and from September 2011 to March 2013, she served as Vice President, Assistant General Counsel and Corporate Secretary. Ms. Wells serves on the Board of the Youth Development Center.
Item 11. Executive Compensation
Information required by this item is incorporated herein by reference to the 2016 Proxy Statement.
140
Item 12. Security Ownership of Certain Beneficial Owners and Management and Related Stockholder Matters
Information required by this item is incorporated herein by reference to the 2016 Proxy Statement.
Securities Authorized for Issuance Under Equity Compensation Plans
The following summarizes information regarding the number of units that are available for issuance under all of the Company’s equity compensation plans as of December 31, 2015:
Plan Category | Number of Securities to be Issued Upon Exercise of Outstanding Unit Options, Warrants and Rights | Weighted Average Exercise Price of Outstanding Unit Options, Warrants and Rights | Number of Securities Remaining Available for Future Issuance Under Equity Compensation Plans (Excluding Securities Reflected in Column (a)) | |||||||
(a) | (b) | (c) | ||||||||
Equity compensation plans approved by security holders | 824,711 | $ | 22.72 | 5,426,690 | ||||||
Equity compensation plans not approved by security holders | — | — | — | |||||||
824,711 | $ | 22.72 | 5,426,690 | |||||||
Item 13. Certain Relationships and Related Transactions, and Director Independence
Information required by this item is incorporated herein by reference to the 2016 Proxy Statement.
Item 14. Principal Accounting Fees and Services
Information required by this item is incorporated herein by reference to the 2016 Proxy Statement.
141
Part IV
Item 15. Exhibits and Financial Statement Schedules
(a) - 1. Financial Statements:
All financial statements are omitted for the reason that they are not required or the information is otherwise supplied in Item 8. “Financial Statements and Supplementary Data” in this Annual Report on Form 10-K.
(a) - 2. Financial Statement Schedules:
All schedules are omitted for the reason that they are not required or the information is otherwise supplied in Item 8. “Financial Statements and Supplementary Data” in this Annual Report on Form 10-K.
(a) - 3. Exhibits:
The exhibits required to be filed by this Item 15 are set forth in the “Index to Exhibits” accompanying this report.
142
SIGNATURES
Pursuant to the requirements of Section 13 or 15(d) of the Securities Exchange Act of 1934, the registrant has duly caused this report to be signed on its behalf by the undersigned, thereunto duly authorized.
LINN ENERGY, LLC | ||
Date: March 15, 2016 | By: | /s/ Mark E. Ellis |
Mark E. Ellis Chairman, President and Chief Executive Officer | ||
Date: March 15, 2016 | By: | /s/ David B. Rottino |
David B. Rottino Executive Vice President and Chief Financial Officer | ||
Date: March 15, 2016 | By: | /s/ Darren R. Schluter |
Darren R. Schluter Vice President and Controller (Duly Authorized Officer and Principal Accounting Officer) | ||
Pursuant to the requirements of the Securities Exchange Act of 1934, this report has been signed below by the following persons on behalf of the registrant and in the capacities and on the dates indicated.
Signature | Title | Date | ||
/s/ Mark E. Ellis | Chairman, President and Chief Executive Officer (Principal Executive Officer) | March 15, 2016 | ||
Mark E. Ellis | ||||
/s/ David B. Rottino | Executive Vice President and Chief Financial Officer (Principal Financial Officer) | March 15, 2016 | ||
David B. Rottino | ||||
/s/ Darren R. Schluter | Vice President and Controller (Principal Accounting Officer) | March 15, 2016 | ||
Darren R. Schluter | ||||
/s/ Michael C. Linn | Founder and Independent Director | March 15, 2016 | ||
Michael C. Linn | ||||
/s/ David D. Dunlap | Independent Director | March 15, 2016 | ||
David D. Dunlap | ||||
/s/ Stephen J. Hadden | Independent Director | March 15, 2016 | ||
Stephen J. Hadden | ||||
/s/ Joseph P. McCoy | Independent Director | March 15, 2016 | ||
Joseph P. McCoy | ||||
/s/ Jeffrey C. Swoveland | Independent Director | March 15, 2016 | ||
Jeffrey C. Swoveland | ||||
143
Index to Exhibits
Exhibit Number | Description | |
3.1 | — | Certificate of Formation of Linn Energy Holdings, LLC (now Linn Energy, LLC) (incorporated herein by reference to Exhibit 3.1 to Registration Statement on Form S-1 (File No. 333-125501) filed on June 3, 2005) |
3.2 | — | Certificate of Amendment to Certificate of Formation of Linn Energy Holdings, LLC (now Linn Energy, LLC) (incorporated herein by reference to Exhibit 3.2 to Registration Statement on Form S‑1 (File No. 333-125501) filed on June 3, 2005) |
3.3 | — | Third Amended and Restated Limited Liability Company Agreement of Linn Energy, LLC dated September 3, 2010, (incorporated herein by reference to Exhibit 3.1 to Current Report on Form 8-K filed on September 7, 2010) |
3.4 | — | Amendment No. 1, dated April 23, 2013, to Third Amended and Restated LLC Agreement of Linn Energy, LLC, dated September 3, 2010 (incorporated herein by reference to Exhibit 3.1 to Quarterly Report on Form 10-Q filed on April 25, 2013) |
4.1 | — | Form of specimen unit certificate for the units of Linn Energy, LLC (incorporated herein by reference to Exhibit 4.1 to Annual Report on Form 10-K for the year ended December 31, 2005, filed on May 31, 2006) |
4.2 | — | Indenture, dated as of April 6, 2010, among Linn Energy, LLC, Linn Energy Finance Corp., the Subsidiary Guarantors named therein and U.S. Bank National Association, as Trustee (incorporated herein by reference to Exhibit 4.1 to Current Report on Form 8-K filed on April 9, 2010) |
4.3 | — | Indenture, dated as of September 13, 2010, among Linn Energy, LLC, Linn Energy Finance Corp., the Subsidiary Guarantors named therein and U.S. Bank National Association, as Trustee (incorporated herein by reference to Exhibit 4.1 to Current Report on Form 8-K filed on September 13, 2010) |
4.4 | — | Indenture, dated as of May 13, 2011, among Linn Energy, LLC, Linn Energy Finance Corp., the Subsidiary Guarantors named therein and U.S. Bank National Association, as Trustee (incorporated herein by reference to Exhibit 4.1 to Current Report on Form 8-K filed on May 16, 2011) |
4.5 | — | Indenture, dated as of March 2, 2012, among Linn Energy, LLC, Linn Energy Finance Corp., the Subsidiary Guarantors named therein and U. S. Bank National Association, as Trustee (incorporated herein by reference to Exhibit 4.1 to Current Report on Form 8-K filed on March 2, 2012) |
4.6 | — | First Supplemental Indenture, dated as of July 2, 2010, to Indenture, dated as of April 6, 2010, between Linn Energy, LLC, Linn Energy Finance Corp., the Subsidiary Guarantors named therein and U.S. Bank National Association, as Trustee (incorporated herein by reference to Exhibit 4.3 to Quarterly Report on Form 10-Q filed on July 29, 2010) |
4.7 | — | First Supplemental Indenture relating to 6.500% senior notes due 2019, dated September 9, 2014, among Linn Energy, LLC, Linn Energy Finance Corp., the Subsidiary Guarantors named therein and U. S. Bank National Association, as trustee (incorporated herein by reference to Exhibit 4.1 to Current Report on Form 8-K filed on September 9, 2014) |
4.8 | — | Senior Indenture, dated September 9, 2014, among Linn Energy, LLC, Linn Energy Finance Corp., the Subsidiary Guarantors named therein and U. S. Bank National Association, as trustee (incorporated herein by reference to Exhibit 4.2 to Current Report on Form 8-K filed on September 9, 2014) |
4.9 | — | First Supplemental Indenture relating to 6.500% senior notes due 2021, dated September 9, 2014, among Linn Energy, LLC, Linn Energy Finance Corp., the Subsidiary Guarantors named therein and U. S. Bank National Association, as trustee (incorporated herein by reference to Exhibit 4.3 to Current Report on Form 8-K filed on September 9, 2014) |
4.10 | — | Indenture, dated June 15, 2006, between Berry Petroleum Company and Wells Fargo Bank, National Association, as trustee, relating to senior debt securities (incorporated by reference to Exhibit 4.1 to Berry Petroleum Company’s Current Report on Form 8-K filed on May 29, 2009) |
144
Index to Exhibits - Continued
Exhibit Number | Description | |
4.11 | — | Second Supplemental Indenture, dated November 1, 2010, between Berry Petroleum Company and Wells Fargo Bank, National Association, as trustee, including the form of 6.75% senior note due 2020 (incorporated by reference to Exhibit 4.2 to Berry Petroleum Company’s Current Report on Form 8-K filed on November 1, 2010) |
4.12 | — | Third Supplemental Indenture, dated March 9, 2012, between Berry Petroleum Company and Wells Fargo Bank, National Association, as trustee, including the form of 6.375% senior note due 2022 (incorporated by reference to Exhibit 4.2 to Berry Petroleum Company’s Current Report on Form 8‑K filed on March 9, 2012) |
4.13 | — | Indenture, dated as of November 20, 2015, by and between Linn Energy, LLC, Linn Energy Finance Corp., the guarantors named therein, and U.S. Bank National Association, as trustee (incorporated by reference to Exhibit 4.1 to Current Report on Form 8-K filed on November 23, 2015) |
10.1* | — | Linn Energy, LLC Amended and Restated Long-Term Incentive Plan (incorporated herein by reference to Annex D to the Joint Proxy Statement/Prospectus for 2013 Annual Meeting, filed on November 14, 2013) |
10.2* | — | Form of Executive Unit Option Agreement pursuant to the Linn Energy, LLC Amended and Restated Long-Term Incentive Plan (incorporated herein by reference to Exhibit 10.3 to Annual Report on Form 10-K for the year ended December 31, 2008, filed on February 26, 2009) |
10.3* | — | Form of Executive Restricted Unit Agreement pursuant to the Linn Energy, LLC Amended and Restated Long-Term Incentive Plan (incorporated herein by reference to Exhibit 10.4 to Annual Report on Form 10-K for the year ended December 31, 2008, filed on February 26, 2009) |
10.4* | — | Form of Phantom Unit Grant Agreement for Independent Directors pursuant to the Linn Energy, LLC Amended and Restated Long-Term Incentive Plan (incorporated herein by reference to Exhibit 10.1 to Current Report on Form 8-K filed on August 9, 2006) |
10.5* | — | Form of Director Restricted Unit Grant Agreement pursuant to the Linn Energy, LLC Amended and Restated Long-Term Incentive Plan (incorporated herein by reference to Exhibit 10.6 to Annual Report on Form 10-K for the year ended December 31, 2008, filed on February 26, 2009) |
10.6* | — | Form of Non-Executive Phantom Unit Agreement pursuant to the Linn Energy, LLC Amended and Restated Long-Term Incentive Plan (incorporated herein by reference to Exhibit 10.8 to Annual Report on Form 10-K for the year ended December 31, 2012, filed on February 21, 2013) |
10.7* | — | Form of Performance Unit Award Agreement pursuant to the Linn Energy, LLC Amended and Restated Long-Term Incentive Plan (incorporated herein by reference to Exhibit 10.7 to Annual Report on Form 10-K for the year ended December 31, 2013, filed on February 27, 2014) |
10.8* | — | Form of Executive Phantom Performance Unit Grant Agreement (2015-2017 Performance Period) (incorporated herein by reference to Exhibit 10.5 to Quarterly Report on Form 10-Q filed on July 30, 2015) |
10.9* | — | Retirement Agreement, dated as of November 29, 2011, by and among Linn Operating, Inc., Linn Energy, LLC and Michael C. Linn (incorporated by reference to Exhibit 10.1 to Current Report on Form 8-K filed on December 1, 2011) |
10.10* | — | Amended and Restated Employment Agreement, dated effective as of December 17, 2008, between Linn Operating, Inc. and Mark E. Ellis (incorporated herein by reference to Exhibit 10.9 to Annual Report on Form 10-K for the year ended December 31, 2008, filed on February 26, 2009) |
10.11* | — | Amendment No. 1, dated effective as of January 1, 2010, to Amended and Restated Employment Agreement, dated effective as of December 17, 2008, between Linn Operating, Inc. and Mark E. Ellis (incorporated herein by reference to Exhibit 10.29 to Annual Report on Form 10-K for the year ended December 31, 2009, filed on February 25, 2010) |
10.12* | — | Amended and Restated Employment Agreement, dated effective December 17, 2008, between Linn Operating, Inc. and Arden L. Walker, Jr. (incorporated herein by reference to Exhibit 10.11 to Annual Report on Form 10-K for the year ended December 31, 2008, filed on February 26, 2009) |
145
Index to Exhibits - Continued
Exhibit Number | Description | |
10.13* | — | Amendment No. 1, dated April 26, 2011, to First Amended and Restated Employment Agreement, dated December 17, 2008, between Linn Operating, Inc. and Arden L. Walker, Jr. (incorporated herein by reference to Quarterly Report on Form 10-Q filed on April 28, 2011) |
10.14* | — | Second Amended and Restated Employment Agreement, dated December 17, 2008, between Linn Operating, Inc. and David B. Rottino (incorporated herein by reference to Exhibit 10.12 to Annual Report on Form 10-K for the year ended December 31, 2008, filed on February 26, 2009) |
10.15* | — | Indemnity Agreement, dated as of February 4, 2009, between Linn Energy, LLC and George A. Alcorn (incorporated herein by reference to Exhibit 10.15 to Annual Report on Form 10-K for the year ended December 31, 2008, filed on February 26, 2009) |
10.16* | — | Indemnity Agreement, dated as of February 4, 2009, between Linn Energy, LLC and Joseph P. McCoy (incorporated herein by reference to Exhibit 10.16 to Annual Report on Form 10-K for the year ended December 31, 2008, filed on February 26, 2009) |
10.17* | — | Indemnity Agreement, dated as of February 4, 2009, between Linn Energy, LLC and Terrence S. Jacobs (incorporated herein by reference to Exhibit 10.17 to Annual Report on Form 10-K for the year ended December 31, 2008, filed on February 26, 2009) |
10.18* | — | Indemnity Agreement, dated as of February 4, 2009, between Linn Energy, LLC and Jeffrey C. Swoveland (incorporated herein by reference to Exhibit 10.18 to Annual Report on Form 10-K for the year ended December 31, 2008, filed on February 26, 2009) |
10.19* | — | Indemnity Agreement, dated as of February 4, 2009, between Linn Energy, LLC and Michael C. Linn (incorporated herein by reference to Exhibit 10.19 to Annual Report on Form 10-K for the year ended December 31, 2008, filed on February 26, 2009) |
10.20* | — | Indemnity Agreement, dated as of February 4, 2009, between Linn Energy, LLC and Mark E. Ellis (incorporated herein by reference to Exhibit 10.20 to Annual Report on Form 10-K for the year ended December 31, 2008, filed on February 26, 2009) |
10.21* | — | Indemnity Agreement, dated as of February 4, 2009, between Linn Energy, LLC and Kolja Rockov (incorporated herein by reference to Exhibit 10.21 to Annual Report on Form 10-K for the year ended December 31, 2008, filed on February 26, 2009) |
10.22* | — | Indemnity Agreement, dated as of February 4, 2009, between Linn Energy, LLC and David B. Rottino (incorporated herein by reference to Exhibit 10.23 to Annual Report on Form 10-K for the year ended December 31, 2008, filed on February 26, 2009) |
10.23* | — | Indemnity Agreement, dated as of February 4, 2009, between Linn Energy, LLC and Arden L. Walker, Jr. (incorporated herein by reference to Exhibit 10.24 to Annual Report on Form 10-K for the year ended December 31, 2008, filed on February 26, 2009) |
10.24* | — | Indemnity Agreement, dated as of July 10, 2012, between Linn Energy, LLC and David D. Dunlap (incorporated herein by reference to Exhibit 10.28 to Annual Report on Form 10-K for the year ended December 31, 2012, filed on February 21, 2013) |
10.25* | — | Indemnity Agreement, dated as of February 4, 2013, between Linn Energy, LLC and Linda M. Stephens (incorporated herein by reference to Exhibit 10.29 to Annual Report on Form 10-K for the year ended December 31, 2012, filed on February 21, 2013) |
10.26* | — | Amended and Restated Indemnity Agreement, dated as of January 16, 2014, between Linn Energy, LLC, LinnCo, LLC and Stephen J. Hadden (incorporated herein by reference to Exhibit 10.26 to Annual Report on Form 10-K for the year ended December 31, 2013, filed on February 27, 2014) |
10.27 | — | Sixth Amended and Restated Credit Agreement dated as of April 24, 2013, among Linn Energy, LLC as Borrower, Wells Fargo Bank, National Association as Administrative Agent, and the Lenders and agents party thereto (incorporated herein by reference to Exhibit 10.1 to Quarterly Report on Form 10-Q filed on April 25, 2013) |
146
Index to Exhibits - Continued
Exhibit Number | Description | |
10.28 | — | First Amendment to Sixth Amended and Restated Credit Agreement, dated October 30, 2013, among Linn Energy, LLC as Borrower, Wells Fargo Bank, National Association as Administrative Agent, and the Lenders and agents party thereto (incorporated herein by reference to Exhibit 10.28 to Annual Report on Form 10-K for the year ended December 31, 2013, filed on February 27, 2014) |
10.29 | — | Second Amendment to Sixth Amended and Restated Credit Agreement, dated December 13, 2013, among Linn Energy, LLC as Borrower, Wells Fargo Bank, National Association as Administrative Agent, and the Lenders and agents party thereto (incorporated herein by reference to Exhibit 10.29 to Annual Report on Form 10-K for the year ended December 31, 2013, filed on February 27, 2014) |
10.30 | — | Third Amendment to Sixth Amended and Restated Credit Agreement, dated April 30, 2014, among Linn Energy, LLC as Borrower, Wells Fargo Bank, National Association as Administrative Agent, and the Lenders and agents party thereto (incorporated by reference to Exhibit 10.2 to Quarterly Report on Form 10-Q filed on May 1, 2014) |
10.31 | — | Fourth Amendment to Sixth Amended and Restated Credit Agreement, dated as of August 6, 2014, among Linn Energy, LLC as Borrower, Wells Fargo Bank, National Association as Administrative Agent, and the Lenders and agents party thereto (incorporated by reference to Exhibit 10.1 to Quarterly Report on Form 10-Q filed on November 4, 2014) |
10.32 | — | Fifth Amendment to Sixth Amended and Restated Credit Agreement, dated as of September 10, 2014, among Linn Energy, LLC as Borrower, Wells Fargo Bank, National Association as Administrative Agent, and the Lenders and agents party thereto (incorporated by reference to Exhibit 10.2 to Quarterly Report on Form 10-Q filed on November 4, 2014) |
10.33 | — | Sixth Amendment to Sixth Amended and Restated Credit Agreement, dated as of May 12, 2015, among Linn Energy, LLC as Borrower, Wells Fargo Bank, National Association as Administrative Agent, and the Lenders and agents party thereto (incorporated herein by reference to Exhibit 10.1 to Current Report on Form 8-K filed on May 15, 2015) |
10.34 | — | Seventh Amendment to Sixth Amended and Restated Credit Agreement, dated as of October 21, 2015, among Linn Energy, LLC, as borrower, the guarantors named therein, Wells Fargo Bank, National Association, as administrative agent, and each of the lenders party thereto (incorporated herein by reference to Exhibit 10.1 to Current Report on Form 8-K filed on October 22, 2015) |
10.35 | — | Second Amended and Restated Credit Agreement, dated November 15, 2010, by and among Berry Petroleum Company, Wells Fargo Bank, N.A., as administrative agent, and the lenders party thereto (incorporated by reference to Exhibit 99.1 to Berry Petroleum Company’s Current Report on Form 8-K filed on November 17, 2010). |
10.36 | — | First Amendment to Second Amended and Restated Credit Agreement, dated April 13, 2011, by and among Berry Petroleum Company, Wells Fargo Bank, N.A., as administrative agent, and the lenders party thereto (incorporated by reference to Exhibit 4.1 to Berry Petroleum Company’s Current Report on Form 8-K filed on April 13, 2011) |
10.37 | — | Second Amendment to Second Amended and Restated Credit Agreement, dated June 17, 2011, by and among Berry Petroleum Company, Wells Fargo Bank, N.A., as administrative agent, and the lenders party thereto. (incorporated by reference to Exhibit 4.1 to Berry Petroleum Company’s Quarterly Report on Form 10-Q filed on November 3, 2011) |
10.38 | — | Third Amendment to Second Amended and Restated Credit Agreement, dated October 26, 2011, by and among Berry Petroleum Company, Wells Fargo Bank, N.A. and the other lenders party thereto (incorporated by reference to Exhibit 4.1 to Berry Petroleum Company’s Current Report on Form 8‑K filed on October 27, 2011) |
10.39 | — | Fourth Amendment to Second Amended and Restated Credit Agreement dated April 13, 2012 by and among the Registrant and Wells Fargo Bank, N.A. and other lenders (incorporated by reference to Exhibit 4.1 to Berry Petroleum Company’s Current Report on Form 8-K filed on April 17, 2012) |
147
Index to Exhibits - Continued
Exhibit Number | Description | |
10.40 | — | Fifth Amendment to Second Amended and Restated Credit Agreement, dated May 21, 2012, by and among Berry Petroleum Company, Wells Fargo Bank, N.A., as administrative agent, and the lenders party thereto (incorporated herein by reference to Exhibit 10.1 to Berry Petroleum Company’s Quarterly Report on Form 10-Q filed on October 24, 2013) |
10.41 | — | Sixth Amendment to Second Amended and Restated Credit Agreement, dated October 22, 2013, by and among Berry Petroleum Company, Wells Fargo Bank, N.A., as administrative agent, and the lenders party thereto (incorporated herein by reference to Exhibit 10.2 to Berry Petroleum Company’s Quarterly Report on Form 10-Q filed on October 24, 2013) |
10.42 | — | Seventh Amendment to Second Amended and Restated Credit Agreement of Berry Petroleum Company, LLC, dated December 16, 2013, among Berry Petroleum Company, LLC as Borrower, Wells Fargo Bank, National Association as Administrative Agent, and the Lenders and agents party thereto (incorporated herein by reference to Exhibit 10.37 to Annual Report on Form 10-K for the year ended December 31, 2013, filed on February 27, 2014) |
10.43 | — | Eighth Amendment to Second Amended and Restated Credit Agreement of Berry Petroleum Company, LLC, dated February 21, 2014, among Berry Petroleum Company, LLC as Borrower, Wells Fargo Bank, National Association as Administrative Agent, and the Lenders and agents party thereto (incorporated herein by reference to Exhibit 10.38 to Annual Report on Form 10-K for the year ended December 31, 2013, filed on February 27, 2014) |
10.44 | — | Ninth Amendment to Second Amended and Restated Credit Agreement of Berry Petroleum Company, LLC, dated April 30, 2014, among Berry Petroleum Company, LLC as Borrower, Wells Fargo Bank, National Association as Administrative Agent, and the Lenders and agents party thereto (incorporated herein by reference to Exhibit 10.4 to Quarterly Report on Form 10-Q filed on May 1, 2014) |
10.45 | — | Tenth Amendment and Borrowing Base Agreement to Second Amended and Restated Credit Agreement of Berry Petroleum Company, LLC, dated as of May 12, 2015, among Berry Petroleum Company, LLC as Borrower, Wells Fargo Bank, National Association as Administrative Agent, and the Lenders and agents party thereto (incorporated herein by reference to Exhibit 10.2 to Current Report on Form 8-K filed on May 15, 2015) |
10.46 | — | Eleventh Amendment and Borrowing Base Agreement, dated as of October 21, 2015, among Berry Petroleum Company, LLC, as borrower, Wells Fargo Bank, National Association, as administrative agent, and each of the lenders party thereto (incorporated herein by reference to Exhibit 10.2 to Current Report on Form 8-K filed on October 22, 2015) |
10.47 | — | Fifth Amended and Restated Guaranty and Pledge Agreement, dated as of May 2, 2011, made by Linn Energy, LLC and each of the other Obligors in favor of BNP Paribas, as Administrative Agent (incorporated herein by reference to Exhibit 10.1 to Quarterly Report on Form 10-Q filed on July 28, 2011) |
10.48 | — | Second Lien Pledge Agreement, dated as of November 20, 2015, by and among Linn Energy, LLC, the guarantors named therein and U.S. Bank National Association, as collateral trustee (incorporated herein by reference to Exhibit 10.1 to Current Report on Form 8-K filed on November 23, 2015) |
10.49 | — | Form of Exchange Agreement (incorporated herein by reference to Exhibit 10.1 to Current Report on Form 8-K filed on November 17, 2015) |
10.50 | — | Form of Registration Rights Agreement (incorporated herein by reference to Exhibit 10.2 to Current Report on Form 8-K filed on November 23, 2015) |
10.51 | — | Intercreditor Agreement, dated as of November 20, 2015, by and among Wells Fargo Bank, National Association, as priority lien agent, and U.S. Bank National Association, as second lien collateral trustee, and acknowledged and agreed to by Linn Energy, LLC and certain of its subsidiaries (incorporated herein by reference to Exhibit 10.3 to Current Report on Form 8-K filed on November 23, 2015) |
148
Index to Exhibits - Continued
Exhibit Number | Description | |
10.52 | — | Collateral Trust Agreement, dated as of November 20, 2015, by and among Linn Energy, LLC, the guarantors named therein, and U.S. Bank National Association as trustee and collateral trustee (incorporated herein by reference to Exhibit 10.4 to Current Report on Form 8-K filed on November 23, 2015) |
10.53** | — | Linn Energy, LLC Amended and Restated Change of Control Protection Plan, dated as of February 2, 2016 |
10.54* ** | — | Linn Energy, LLC Severance Plan, dated as of February 2, 2016 |
10.55* ** | — | Linn Energy, LLC Executive Incentive Plan, dated as of February 2, 2016 |
10.56 | — | Limited Liability Company Agreement of QL Energy I, LLC, dated as of June 30, 2015 (incorporated herein by reference to Exhibit 10.1 to Current Report on Form 8-K filed on July 7, 2015) |
10.57 | — | Development Agreement, by and between Linn Energy, LLC and QL Energy I, LLC, dated as of June 30, 2015 (incorporated herein by reference to Exhibit 10.2 to Current Report on Form 8-K filed on July 7, 2015) |
10.58 | — | Separation Agreement by and between Linn Operating, Inc. and Kolja Rockov, effective as of August 31, 2015 (incorporated herein by reference to Exhibit 10.1 to Quarterly Report on Form 10‑Q filed on November 5, 2015) |
10.59* ** | — | Form of Clawback Agreement, dated as of March 11, 2016, between Linn Energy, LLC and each executive officer |
12.1** | — | Computation of Ratio of Earnings to Fixed Charges |
21.1** | — | Significant Subsidiaries of Linn Energy, LLC |
23.1** | — | Consent of KPMG LLP |
23.2** | — | Consent of DeGolyer and MacNaughton |
31.1** | — | Section 302 Certification of Mark E. Ellis, Chairman, President and Chief Executive Officer of Linn Energy, LLC |
31.2** | — | Section 302 Certification of David B. Rottino, Executive Vice President and Chief Financial Officer of Linn Energy, LLC |
32.1** | — | Section 906 Certification of Mark E. Ellis, Chairman, President and Chief Executive Officer of Linn Energy, LLC |
32.2** | — | Section 906 Certification of David B. Rottino, Executive Vice President and Chief Financial Officer of Linn Energy, LLC |
99.1** | — | 2015 Report of DeGolyer and MacNaughton |
101.INS† | — | XBRL Instance Document |
101.SCH† | — | XBRL Taxonomy Extension Schema Document |
101.CAL† | — | XBRL Taxonomy Extension Calculation Linkbase Document |
101.DEF† | — | XBRL Taxonomy Extension Definition Linkbase Document |
101.LAB† | — | XBRL Taxonomy Extension Label Linkbase Document |
101.PRE† | — | XBRL Taxonomy Extension Presentation Linkbase Document |
* | Management Contract or Compensatory Plan or Arrangement required to be filed as an exhibit hereto pursuant to Item 601 of Regulation S-K. |
** | Filed herewith. |
† | Furnished herewith. |
149