Attached files
| file | filename |
|---|---|
| 8-K - 8-K - CenterState Bank Corp | csfl-8k_20160315.htm |
The Burton Partnership Investor Presentation Tampa, FL March 16, 2016 Exhibit 99.1
This presentation contains forward-looking statements, as defined by Federal Securities Laws, relating to present or future trends or factors affecting the operations, markets and products of CenterState Banks, Inc. (CSFL). These statements are provided to assist in the understanding of future financial performance. Any such statements are based on current expectations and involve a number of risks and uncertainties. For a discussion of factors that may cause such forward-looking statements to differ materially from actual results, please refer to CSFL’s most recent Form 10-Q and Form 10-K filed with the Securities Exchange Commission. CSFL undertakes no obligation to release revisions to these forward-looking statements or reflect events or circumstances after the date of this presentation. Forward Looking Statement
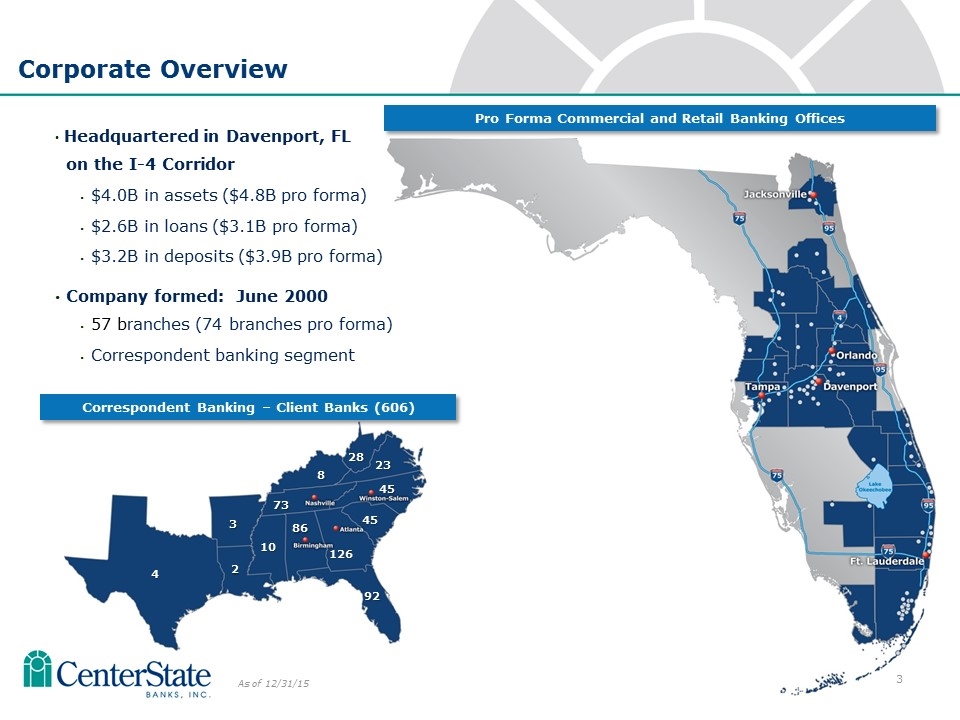
4 3 2 10 86 73 92 126 45 45 8 23 28 As of 12/31/15 Headquartered in Davenport, FL on the I-4 Corridor $4.0B in assets ($4.8B pro forma) $2.6B in loans ($3.1B pro forma) $3.2B in deposits ($3.9B pro forma) Company formed: June 2000 57 branches (74 branches pro forma) Correspondent banking segment Corporate Overview Pro Forma Commercial and Retail Banking Offices Correspondent Banking – Client Banks (606)
Banking the Sunshine State
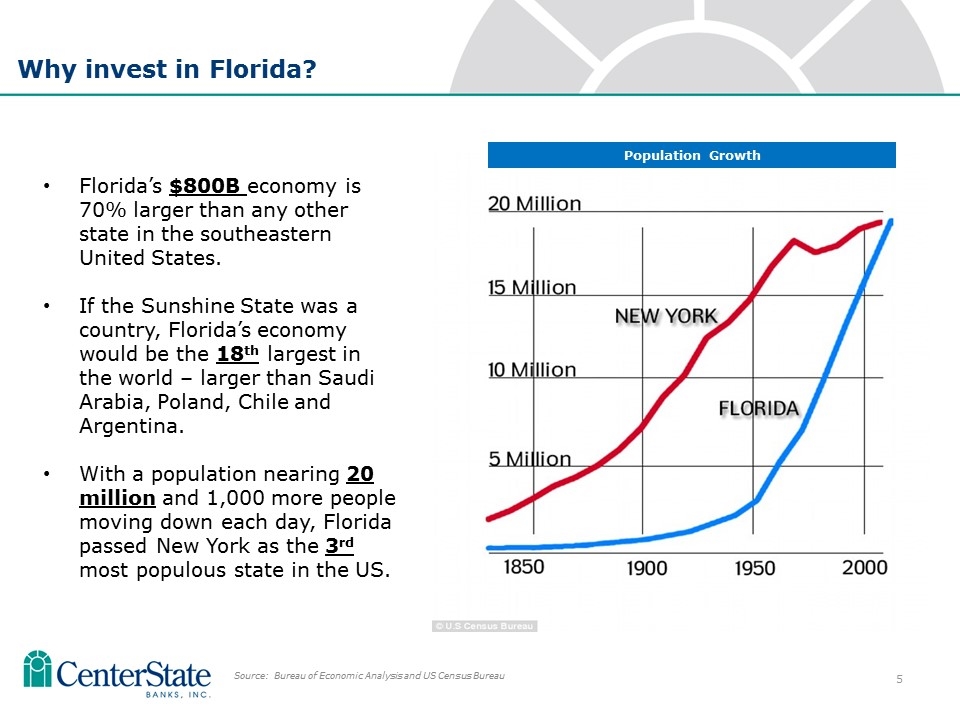
Florida’s $800B economy is 70% larger than any other state in the southeastern United States. If the Sunshine State was a country, Florida’s economy would be the 18th largest in the world – larger than Saudi Arabia, Poland, Chile and Argentina. With a population nearing 20 million and 1,000 more people moving down each day, Florida passed New York as the 3rd most populous state in the US. Why invest in Florida? Source: Bureau of Economic Analysis and US Census Bureau Population Growth
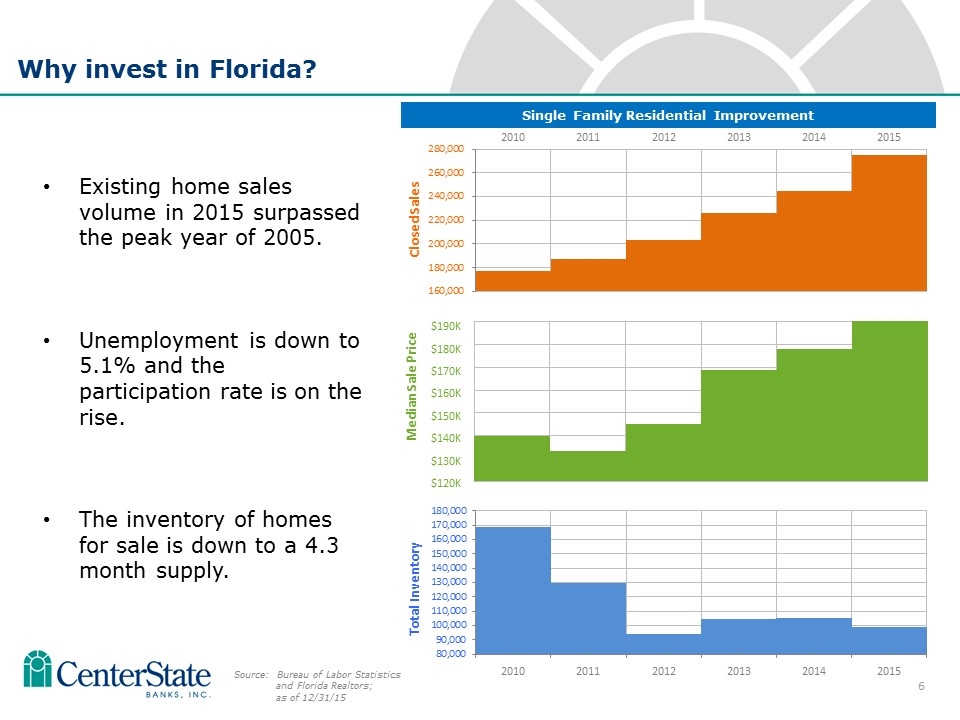
Existing home sales volume in 2015 surpassed the peak year of 2005. Unemployment is down to 5.1% and the participation rate is on the rise. The inventory of homes for sale is down to a 4.3 month supply. Why invest in Florida? Source: Bureau of Labor Statistics and Florida Realtors; as of 12/31/15 Median Sale Price $190K $180K $170K $160K $150K $140K $130K $120K Single Family Residential Improvement
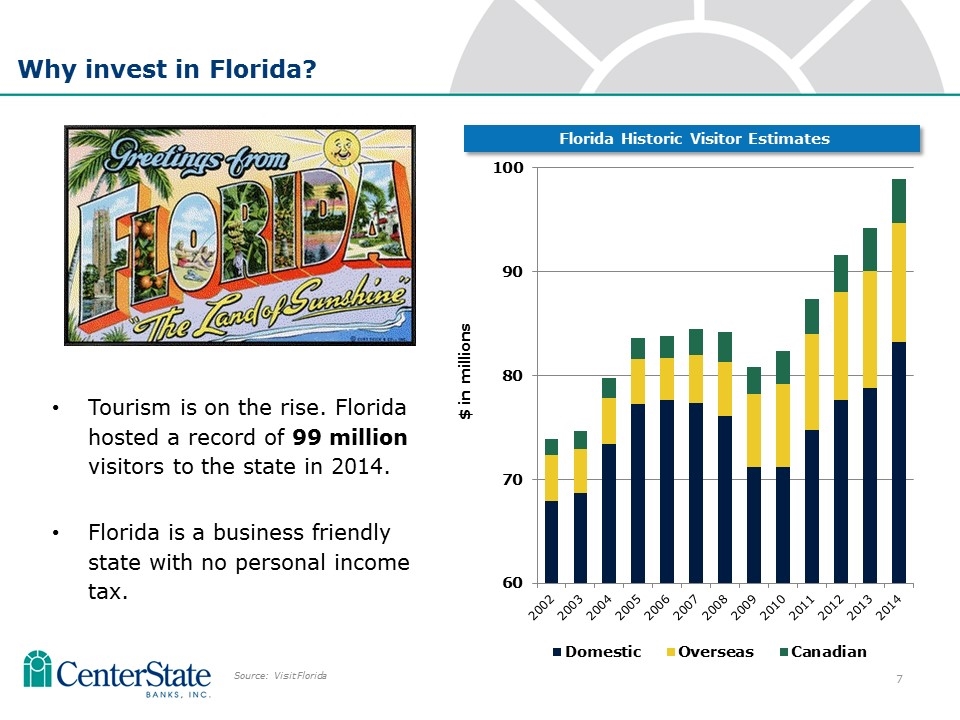
Tourism is on the rise. Florida hosted a record of 99 million visitors to the state in 2014. Florida is a business friendly state with no personal income tax. Why invest in Florida? Source: Visit Florida Florida Historic Visitor Estimates
Capital Management
Capital Management Bank acquisitions Support organic growth Stock repurchase plan Dividends
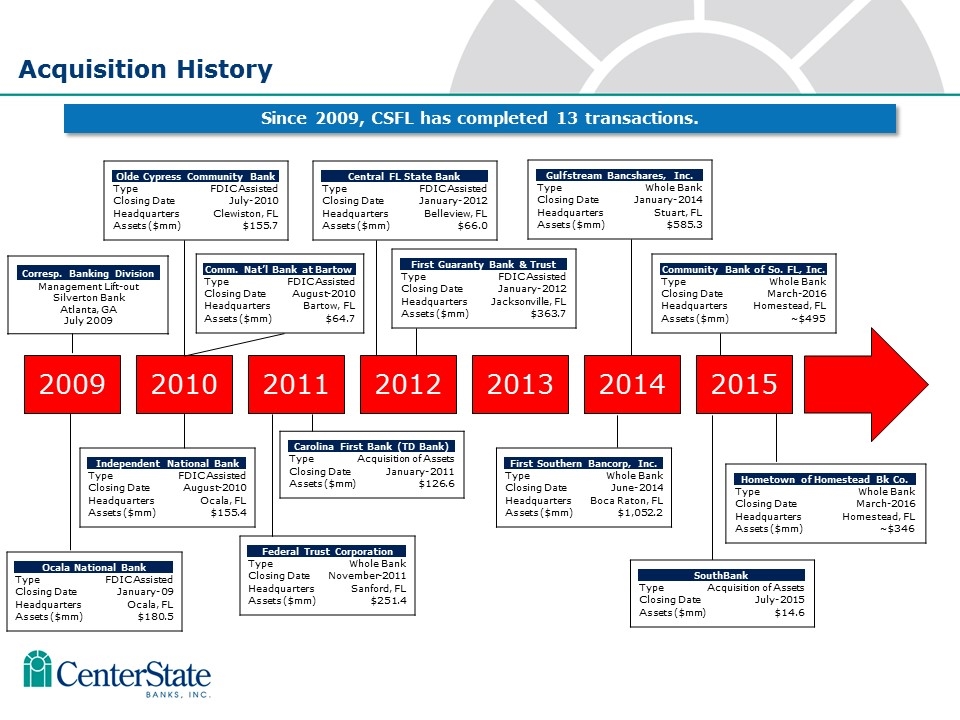
Acquisition History 2009 2010 2011 2012 2013 2014 2015 Corresp. Banking Division Management Lift-out Silverton Bank Atlanta, GA July 2009 Ocala National Bank Type FDIC Assisted Closing Date January-09 Headquarters Ocala, FL Assets ($mm) $180.5 Olde Cypress Community Bank Type FDIC Assisted Closing Date July-2010 Headquarters Clewiston, FL Assets ($mm) $155.7 Independent National Bank Type FDIC Assisted Closing Date August-2010 Headquarters Ocala, FL Assets ($mm) $155.4 Comm. Nat’l Bank at Bartow Type FDIC Assisted Closing Date August-2010 Headquarters Bartow, FL Assets ($mm) $64.7 Carolina First Bank (TD Bank) Type Acquisition of Assets Closing Date January-2011 Assets ($mm) $126.6 Federal Trust Corporation Type Whole Bank Closing Date November-2011 Headquarters Sanford, FL Assets ($mm) $251.4 Central FL State Bank Type FDIC Assisted Closing Date January-2012 Headquarters Belleview, FL Assets ($mm) $66.0 First Guaranty Bank & Trust Type FDIC Assisted Closing Date January-2012 Headquarters Jacksonville, FL Assets ($mm) $363.7 Gulfstream Bancshares, Inc. Type Whole Bank Closing Date January-2014 Headquarters Stuart, FL Assets ($mm) $585.3 First Southern Bancorp, Inc. Type Whole Bank Closing Date June-2014 Headquarters Boca Raton, FL Assets ($mm) $1,052.2 Community Bank of So. FL, Inc. Type Whole Bank Closing Date March-2016 Headquarters Homestead, FL Assets ($mm) ~$495 Hometown of Homestead Bk Co. Type Whole Bank Closing Date March-2016 Headquarters Homestead, FL Assets ($mm) ~$346 SouthBank Type Acquisition of Assets Closing Date July-2015 Assets ($mm) $14.6 Since 2009, CSFL has completed 13 transactions.
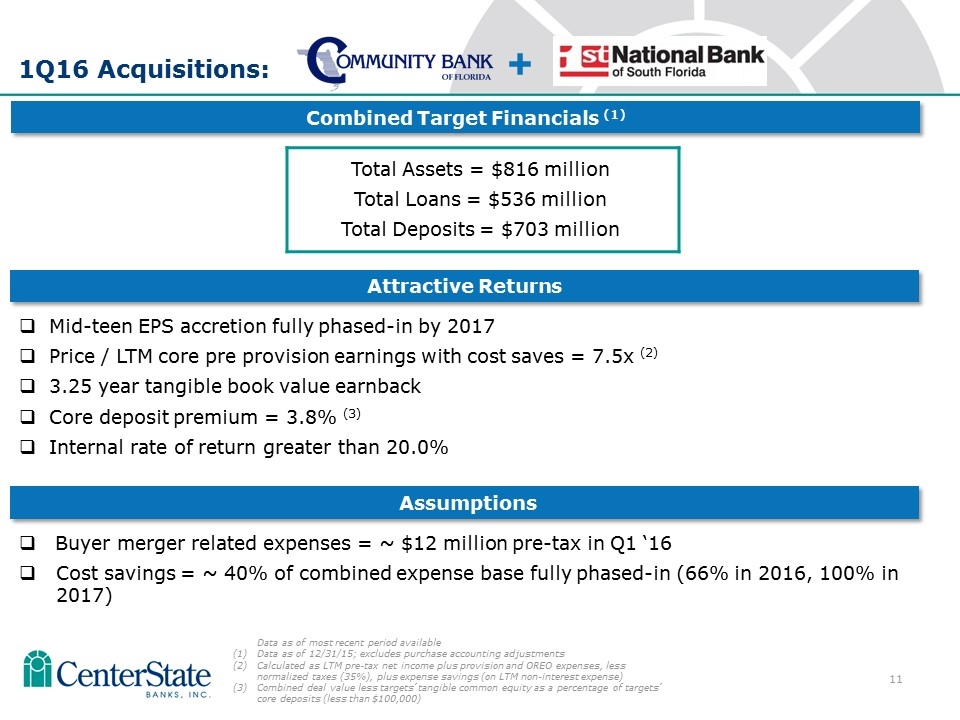
1Q16 Acquisitions: Total Assets = $816 million Total Loans = $536 million Total Deposits = $703 million Assumptions Buyer merger related expenses = ~ $12 million pre-tax in Q1 ‘16 Cost savings = ~ 40% of combined expense base fully phased-in (66% in 2016, 100% in 2017) Combined Target Financials (1) Data as of most recent period available Data as of 12/31/15; excludes purchase accounting adjustments Calculated as LTM pre-tax net income plus provision and OREO expenses, less normalized taxes (35%), plus expense savings (on LTM non-interest expense) Combined deal value less targets’ tangible common equity as a percentage of targets’ core deposits (less than $100,000) + Attractive Returns Mid-teen EPS accretion fully phased-in by 2017 Price / LTM core pre provision earnings with cost saves = 7.5x (2) 3.25 year tangible book value earnback Core deposit premium = 3.8% (3) Internal rate of return greater than 20.0%
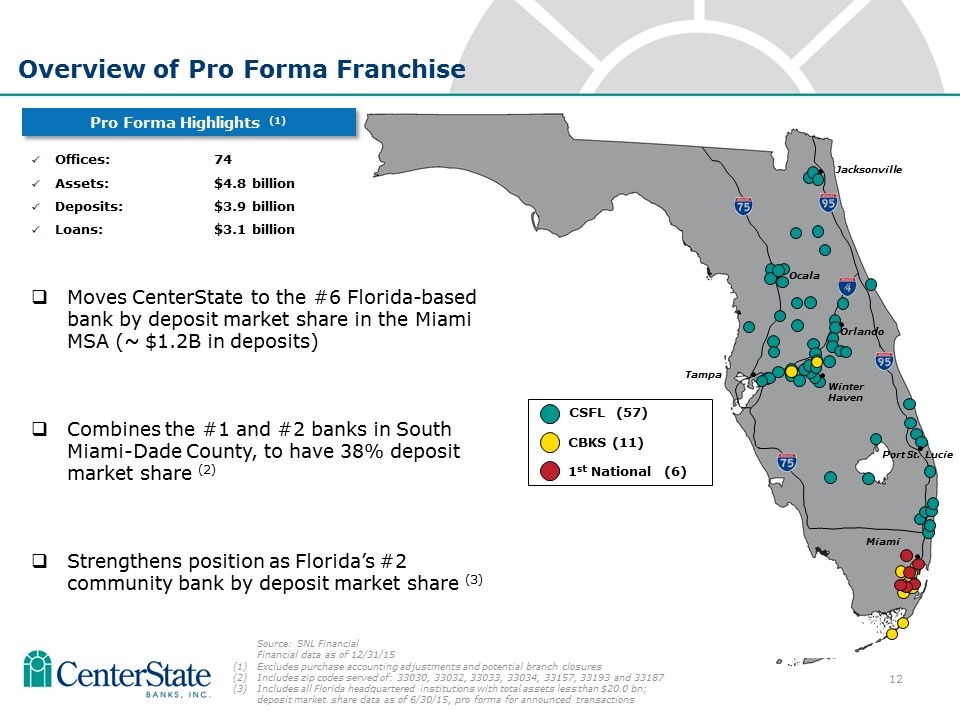
Offices: 74 Assets: $4.8 billion Deposits: $3.9 billion Loans: $3.1 billion CSFL (57) CBKS (11) 1st National (6) Tampa Jacksonville Orlando Winter Haven Miami Port St. Lucie Overview of Pro Forma Franchise Source: SNL Financial Financial data as of 12/31/15 Excludes purchase accounting adjustments and potential branch closures Includes zip codes served of: 33030, 33032, 33033, 33034, 33157, 33193 and 33187 Includes all Florida headquartered institutions with total assets less than $20.0 bn; deposit market share data as of 6/30/15, pro forma for announced transactions Pro Forma Highlights (1) Moves CenterState to the #6 Florida-based bank by deposit market share in the Miami MSA (~ $1.2B in deposits) Combines the #1 and #2 banks in South Miami-Dade County, to have 38% deposit market share (2) Strengthens position as Florida’s #2 community bank by deposit market share (3) Ocala
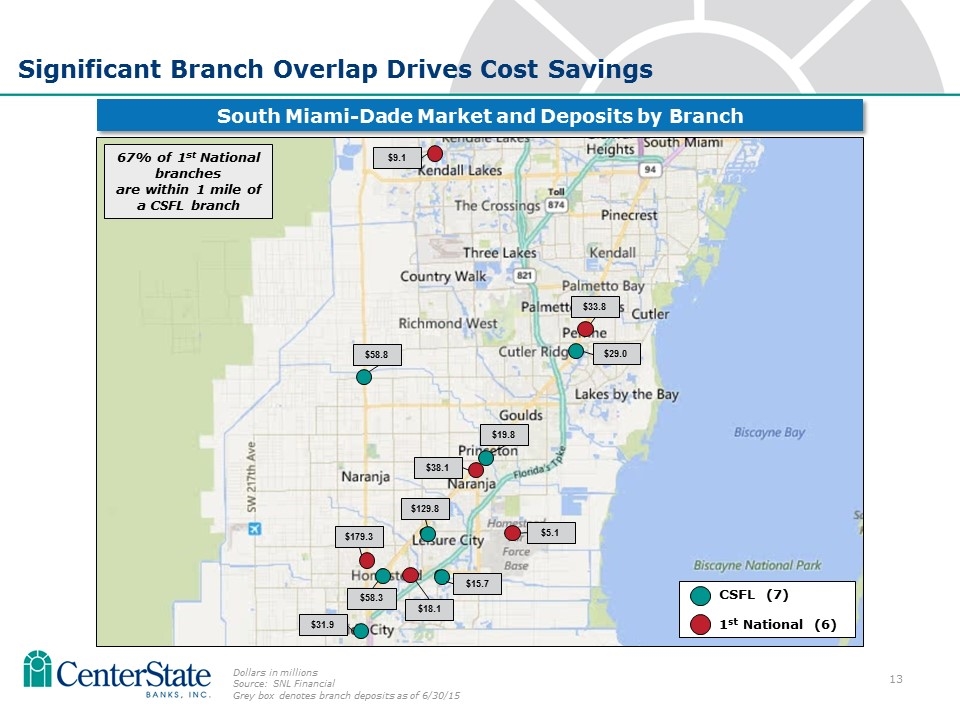
Significant Branch Overlap Drives Cost Savings South Miami-Dade Market and Deposits by Branch Dollars in millions Source: SNL Financial Grey box denotes branch deposits as of 6/30/15 $29.0 $19.8 $31.9 $179.3 67% of 1st National branches are within 1 mile of a CSFL branch CSFL (7) 1st National (6) $58.3 $15.7 $18.1 $129.8 $5.1 $33.8 $58.8 $9.1 $38.1
Earnings
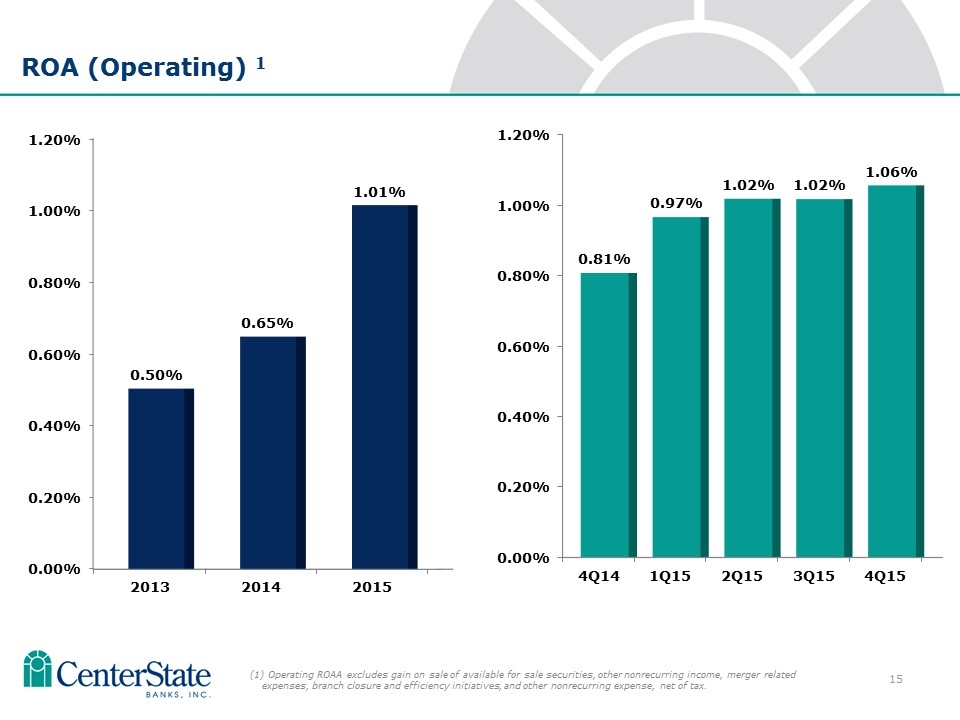
ROA (Operating) 1 (1) Operating ROAA excludes gain on sale of available for sale securities, other nonrecurring income, merger related expenses, branch closure and efficiency initiatives, and other nonrecurring expense, net of tax.
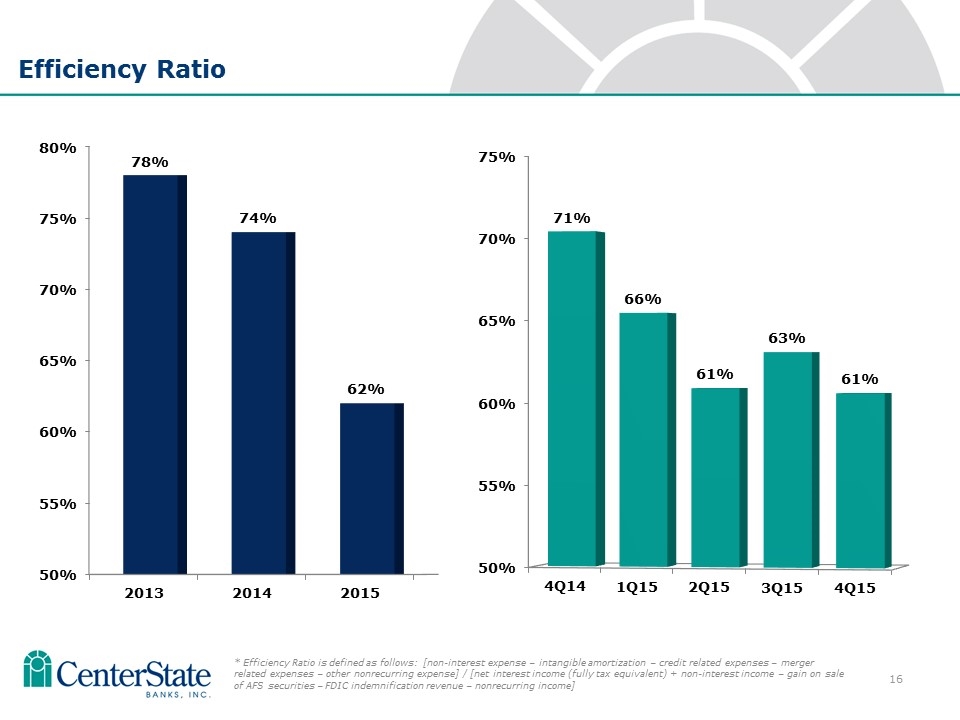
10 Efficiency Ratio * Efficiency Ratio is defined as follows: [non-interest expense – intangible amortization – credit related expenses – merger related expenses – other nonrecurring expense] / [net interest income (fully tax equivalent) + non-interest income – gain on sale of AFS securities – FDIC indemnification revenue – nonrecurring income]
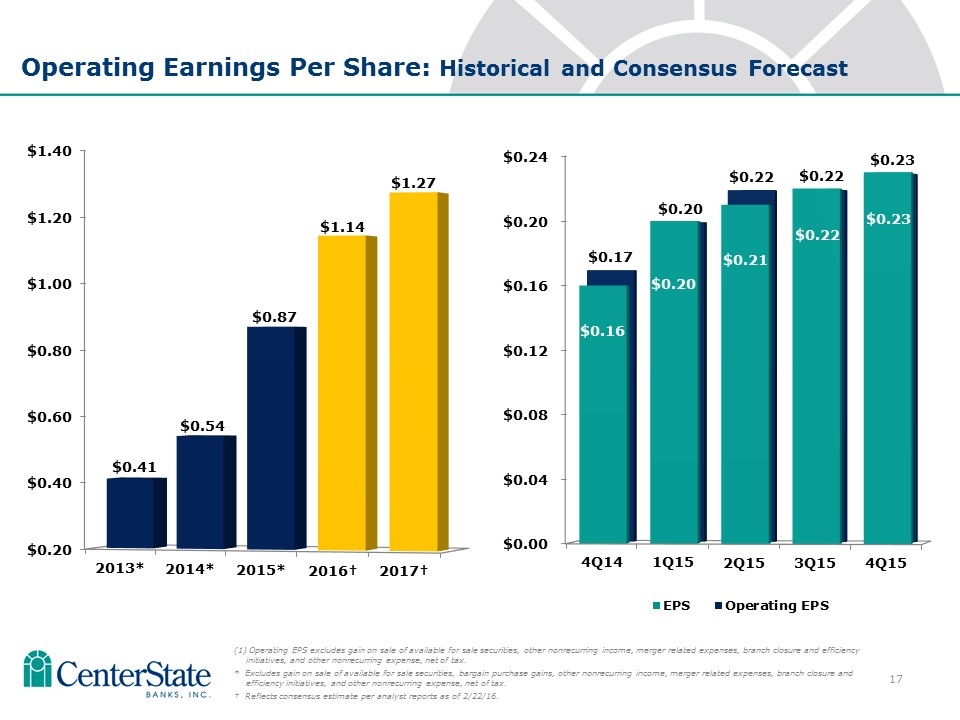
Operating Earnings Per Share: Historical and Consensus Forecast (1) Operating EPS excludes gain on sale of available for sale securities, other nonrecurring income, merger related expenses, branch closure and efficiency initiatives, and other nonrecurring expense, net of tax. * Excludes gain on sale of available for sale securities, bargain purchase gains, other nonrecurring income, merger related expenses, branch closure and efficiency initiatives, and other nonrecurring expense, net of tax. † Reflects consensus estimate per analyst reports as of 2/22/16.
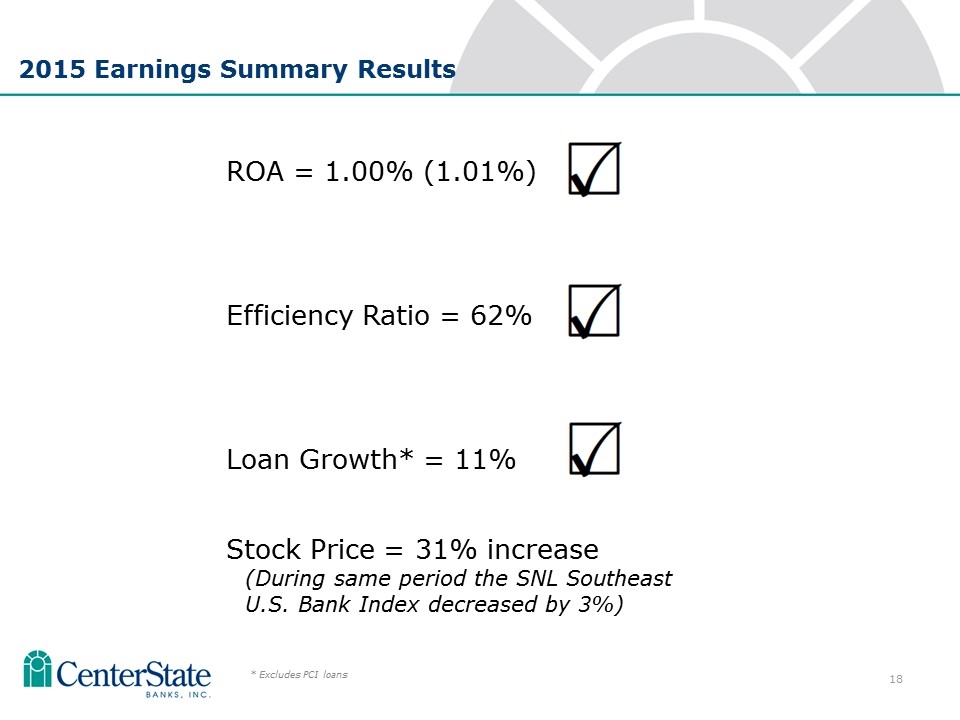
2015 Earnings Summary Results ROA = 1.00% (1.01%) Efficiency Ratio = 62% Loan Growth* = 11% Stock Price = 31% increase (During same period the SNL Southeast U.S. Bank Index decreased by 3%) * Excludes PCI loans
Operating Performance & Efficiency The Catalysts Ahead
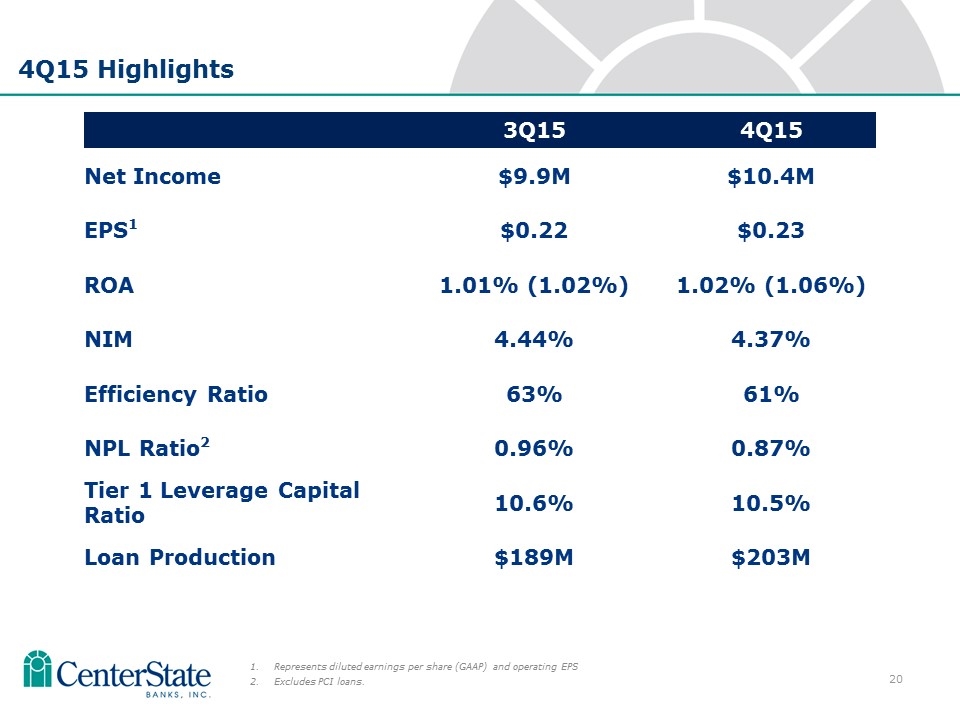
4Q15 Highlights 3Q15 4Q15 Net Income $9.9M $10.4M EPS1 $0.22 $0.23 ROA 1.01% (1.02%) 1.02% (1.06%) NIM 4.44% 4.37% Efficiency Ratio 63% 61% NPL Ratio2 0.96% 0.87% Tier 1 Leverage Capital Ratio 10.6% 10.5% Loan Production $189M $203M Represents diluted earnings per share (GAAP) and operating EPS Excludes PCI loans.
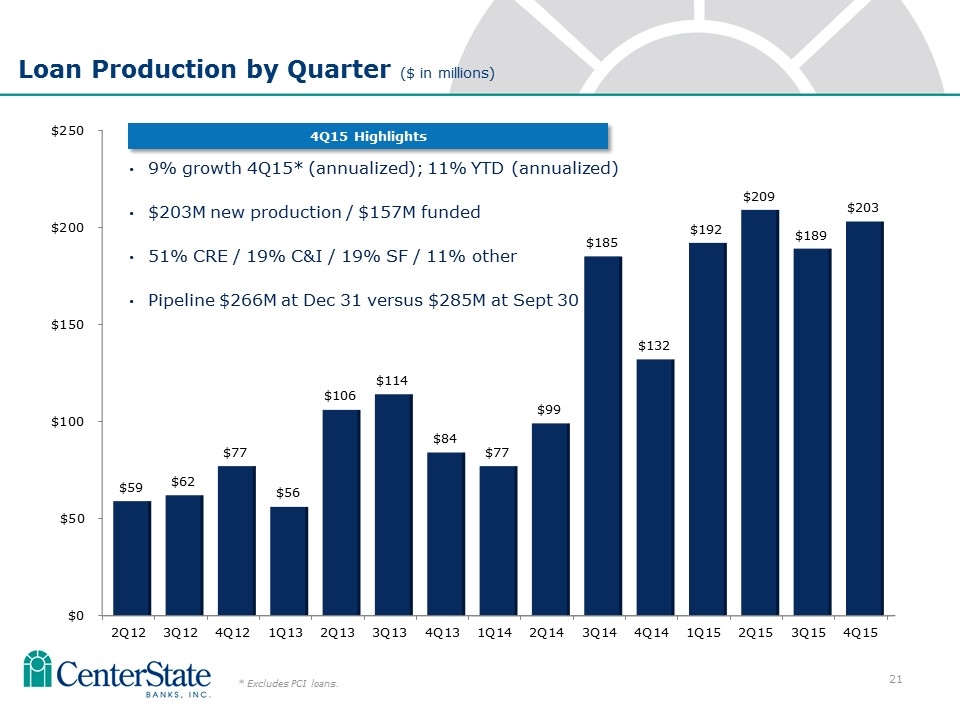
Loan Production by Quarter ($ in millions) 9% growth 4Q15* (annualized); 11% YTD (annualized) $203M new production / $157M funded 51% CRE / 19% C&I / 19% SF / 11% other Pipeline $266M at Dec 31 versus $285M at Sept 30 * Excludes PCI loans. 4Q15 Highlights
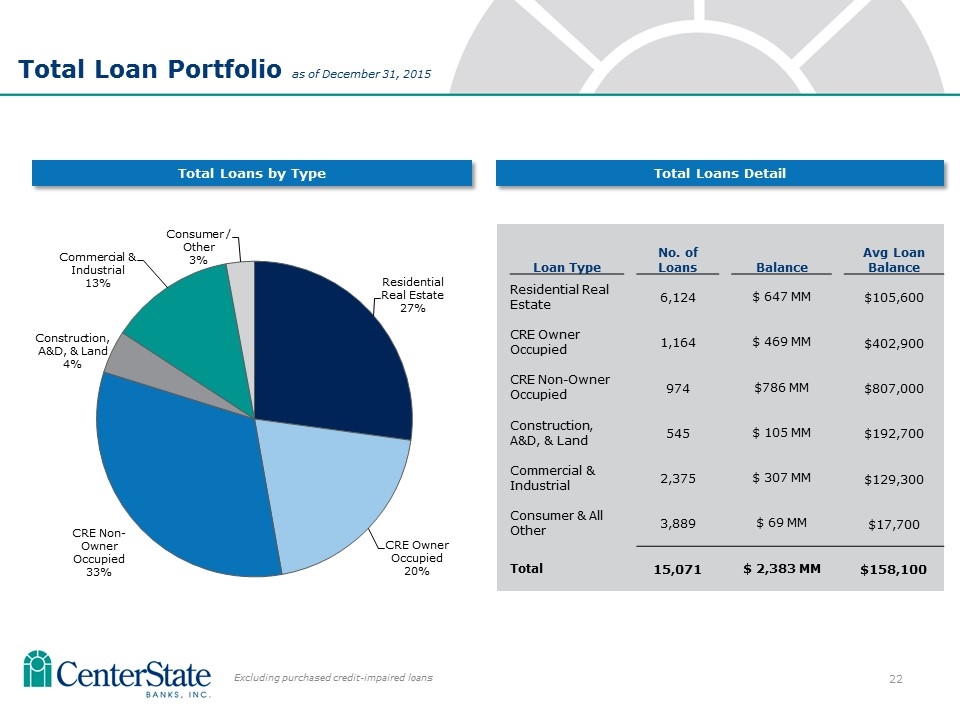
Total Loans by Type Total Loans Detail Loan Type No. of Loans Balance Avg Loan Balance Residential Real Estate 6,124 $ 647 MM $105,600 CRE Owner Occupied 1,164 $ 469 MM $402,900 CRE Non-Owner Occupied 974 $786 MM $807,000 Construction, A&D, & Land 545 $ 105 MM $192,700 Commercial & Industrial 2,375 $ 307 MM $129,300 Consumer & All Other 3,889 $ 69 MM $17,700 Total 15,071 $ 2,383 MM $158,100 Total Loan Portfolio as of December 31, 2015 Excluding purchased credit-impaired loans
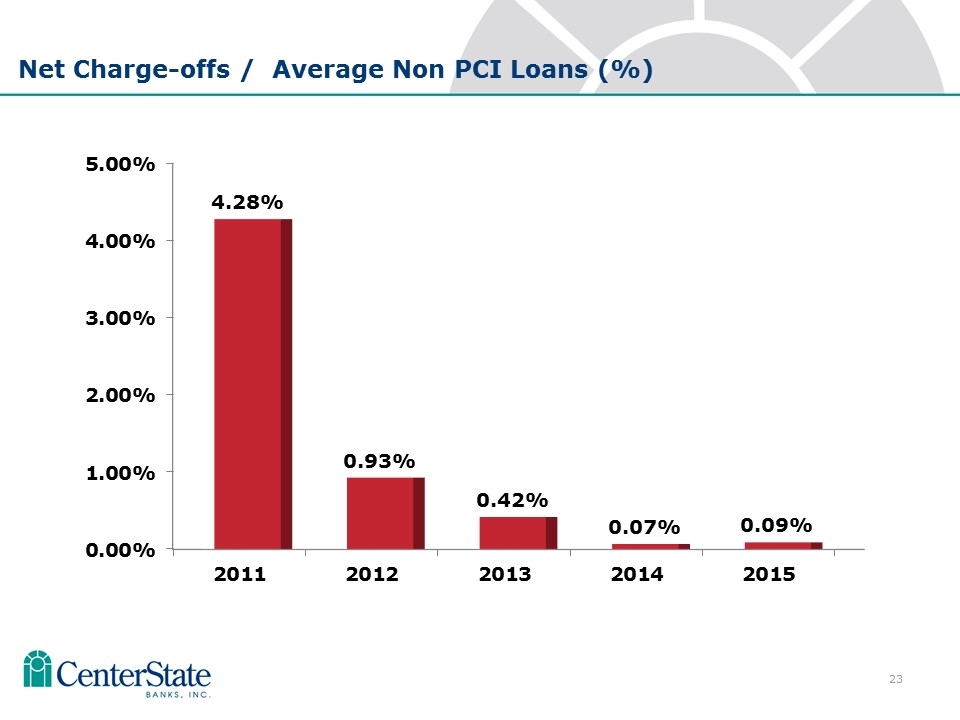
Net Charge-offs / Average Non PCI Loans (%)
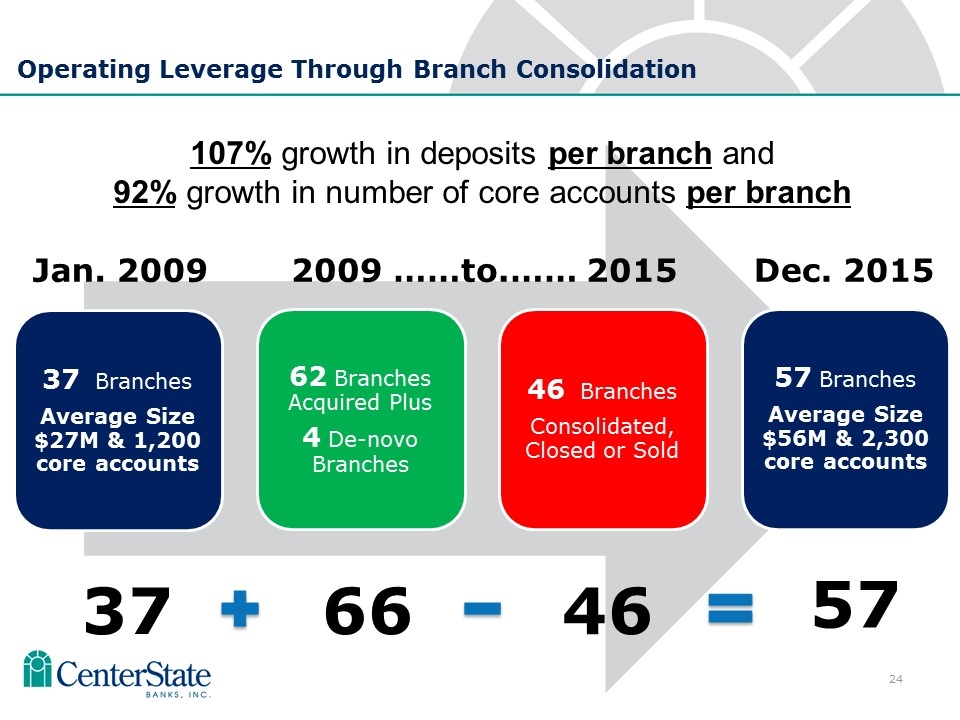
Operating Leverage Through Branch Consolidation 107% growth in deposits per branch and 92% growth in number of core accounts per branch 37 66 46 57 Jan. 2009 2009 ……to.…… 2015 Dec. 2015 37 Branches Average Size $27M & 1,200 core accounts 62 Branches Acquired Plus 4 De-novo Branches 46 Branches Consolidated, Closed or Sold 57 Branches Average Size $56M & 2,300 core accounts
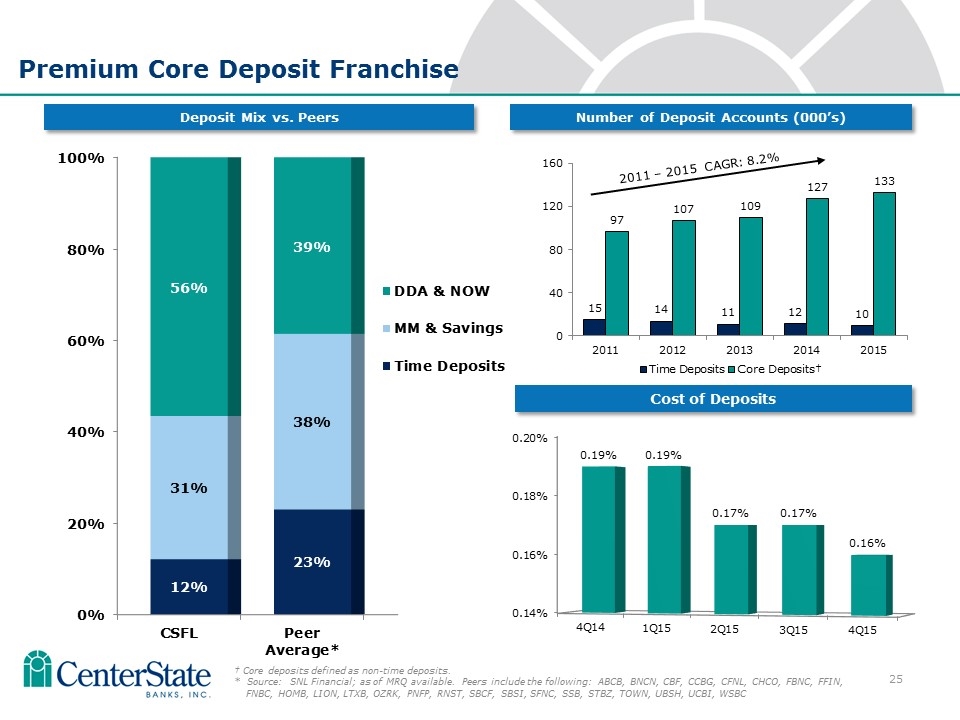
Number of Deposit Accounts (000’s) Premium Core Deposit Franchise Cost of Deposits 2011 – 2015 CAGR: 8.2% Deposit Mix vs. Peers † Core deposits defined as non-time deposits. * Source: SNL Financial; as of MRQ available. Peers include the following: ABCB, BNCN, CBF, CCBG, CFNL, CHCO, FBNC, FFIN, FNBC, HOMB, LION, LTXB, OZRK, PNFP, RNST, SBCF, SBSI, SFNC, SSB, STBZ, TOWN, UBSH, UCBI, WSBC
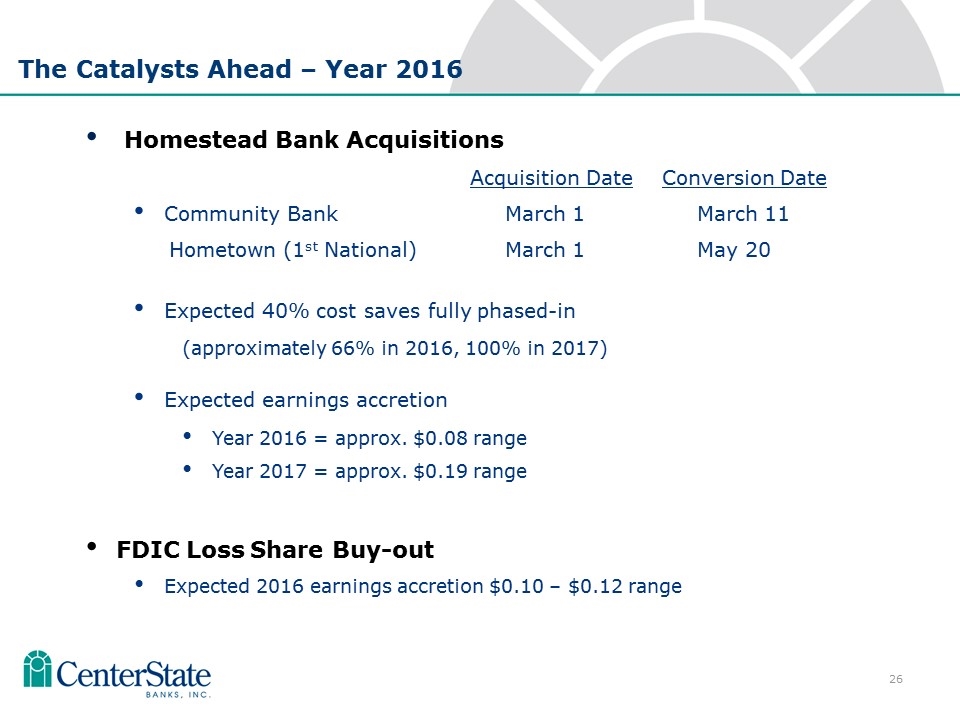
The Catalysts Ahead – Year 2016 Homestead Bank Acquisitions Acquisition Date Conversion Date Community Bank March 1 March 11 Hometown (1st National) March 1 May 20 Expected 40% cost saves fully phased-in (approximately 66% in 2016, 100% in 2017) Expected earnings accretion Year 2016 = approx. $0.08 range Year 2017 = approx. $0.19 range FDIC Loss Share Buy-out Expected 2016 earnings accretion $0.10 – $0.12 range
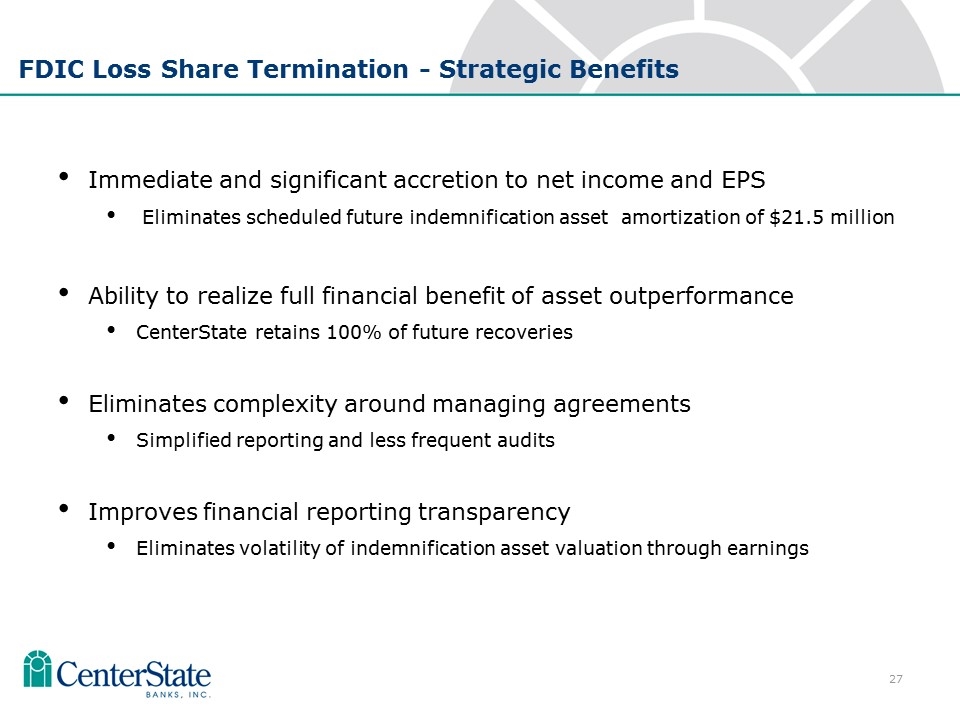
FDIC Loss Share Termination - Strategic Benefits Immediate and significant accretion to net income and EPS Eliminates scheduled future indemnification asset amortization of $21.5 million Ability to realize full financial benefit of asset outperformance CenterState retains 100% of future recoveries Eliminates complexity around managing agreements Simplified reporting and less frequent audits Improves financial reporting transparency Eliminates volatility of indemnification asset valuation through earnings
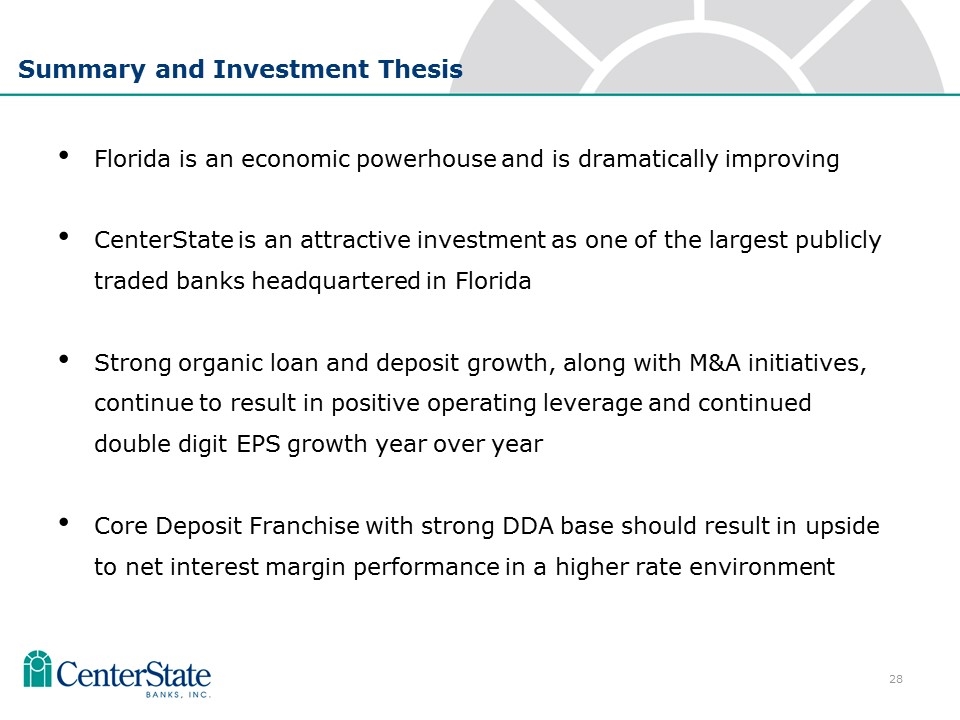
Summary and Investment Thesis Florida is an economic powerhouse and is dramatically improving CenterState is an attractive investment as one of the largest publicly traded banks headquartered in Florida Strong organic loan and deposit growth, along with M&A initiatives, continue to result in positive operating leverage and continued double digit EPS growth year over year Core Deposit Franchise with strong DDA base should result in upside to net interest margin performance in a higher rate environment
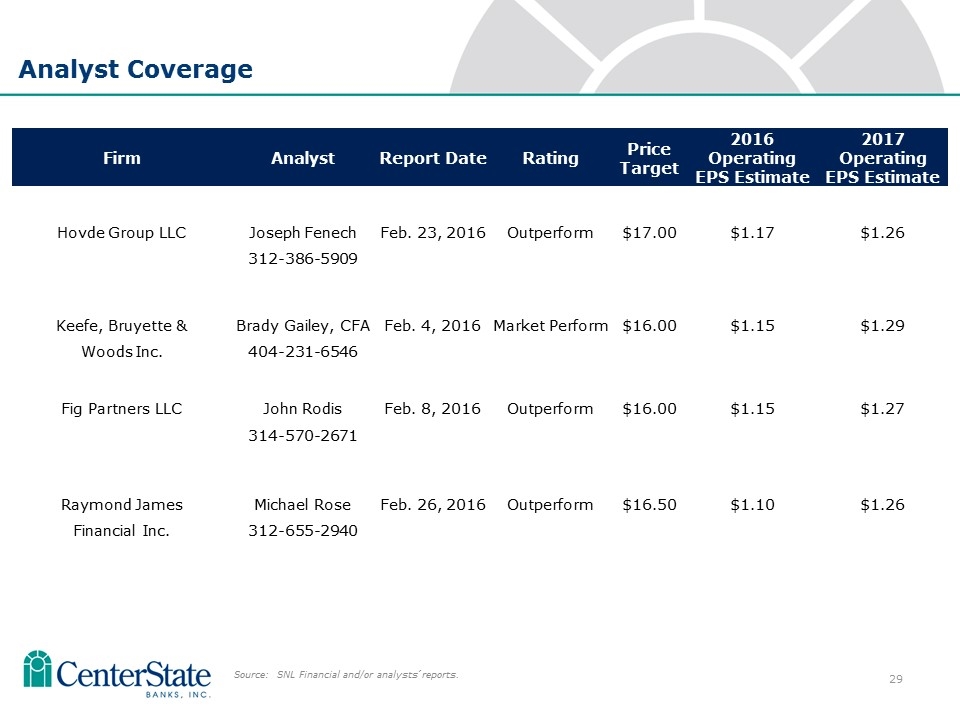
Analyst Coverage Source: SNL Financial and/or analysts’ reports. Firm Analyst Report Date Rating Price Target 2016 Operating EPS Estimate 2017 Operating EPS Estimate Hovde Group LLC Joseph Fenech Feb. 23, 2016 Outperform $17.00 $1.17 $1.26 312-386-5909 Keefe, Bruyette & Brady Gailey, CFA Feb. 4, 2016 Market Perform $16.00 $1.15 $1.29 Woods Inc. 404-231-6546 Fig Partners LLC John Rodis Feb. 8, 2016 Outperform $16.00 $1.15 $1.27 314-570-2671 Raymond James Michael Rose Feb. 26, 2016 Outperform $16.50 $1.10 $1.26 Financial Inc. 312-655-2940
