Attached files
Table of Contents
SECURITIES AND EXCHANGE COMMISSION
Washington, D.C. 20549
FORM 10-K
| x | ANNUAL REPORT PURSUANT TO SECTION 13 or 15(d) OF THE SECURITIES EXCHANGE ACT OF 1934 |
For the Fiscal Year Ended December 31, 2009
OR
| ¨ | TRANSITION REPORT PURSUANT TO SECTION 13 OR 15(d) OF THE SECURITIES EXCHANGE ACT OF 1934 |
Commission File Number 000-32017
CENTERSTATE BANKS, INC.
(Name of registrant as specified in its charter)
| Florida | 59-3606741 | |
| (State or other jurisdiction of incorporation or organization) |
(I.R.S. Employer Identification No.) | |
| 42745 U.S. Highway 27, Davenport, Florida | 33837 | |
| (Address of principal executive offices) | (Zip Code) | |
Issuer’s telephone number, including area code:
(863) 419-7750
Securities registered pursuant to Section 12(b) of the Act:
Common Stock, par value $0.01 per share
Securities registered pursuant to Section 12(g) of the Act:
None
The registrant is a well-known seasoned issuer, as defined in Rule 405 of the Securities Act. YES ¨ NO x
The registrant is not required to file reports pursuant to Section 13 or Section 15(d) of the Act. YES ¨ NO x
Check whether the issuer has (1) filed all reports required to be filed by Section 13 or 15(d) of the Securities Exchange Act of 1934 during the past 12 months (or for such shorter period that the issuer was required to file such reports), and (2) has been subject to such filing requirements for the past 90 days. YES x NO ¨
Indicate by check mark whether the registrant has submitted electronically and posted on its corporate Web site, if any, every Interactive Data File required to be submitted and posted pursuant to Rule 405 of Regulation S-T during the preceding 12 months (or for such shorter period that the Registrant was required to submit and post such files). YES ¨ NO ¨
Check if there is no disclosure of delinquent filers in response to Item 405 of Regulation SK contained in this form, and no disclosure will be contained, to the best of issuer’s knowledge, in definitive proxy or information statements incorporated by reference in Part III of this Form 10-K or any amendment to this Form 10-K. x
Indicate by check mark if the registrant is a large accelerated filer, an accelerated filer, a non-accelerated filer, or a smaller reporting company. See the definitions of “large accelerated filer,” “accelerated filer” and “smaller reporting company” in Rule 12b-2 of the Exchange Act. (Check one):
| Large accelerated filer ¨ | Accelerated filer x | |
| Non-accelerated filer ¨ | Smaller reporting company ¨ |
The registrant is a shell company, as defined in Rule 12b-2 of the Exchange Act. YES ¨ NO x
The aggregate market value of the Common Stock of the issuer held by non-affiliates of the issuer (8,697,011 shares) on June 30, 2009, was approximately $64,532,000. The aggregate market value was computed by reference the last sale of the Common Stock of the issuer at $7.42 per share on June 30, 2009. For the purposes of this response, directors, executive officers and holders of 5% or more of the issuer’s Common Stock are considered the affiliates of the issuer at that date.
As of March 1, 2010 there were outstanding 25,778,229 shares of the issuer’s Common Stock.
DOCUMENTS INCORPORATED BY REFERENCE
Portions of the Proxy Statement for the Annual Meeting of Shareholders to be held on May 10, 2010 to be filed with the Securities and Exchange Commission pursuant to Regulation 14A within 120 days of the issuer’s fiscal year end are incorporated by reference into Part III, of this Annual Report on Form 10-K.
Table of Contents
| Page | ||||
| Item 1. |
1 | |||
| 1 | ||||
| 2 | ||||
| 2 | ||||
| 4 | ||||
| 4 | ||||
| 5 | ||||
| 5 | ||||
| 5 | ||||
| 5 | ||||
| 6 | ||||
| 11 | ||||
| 12 | ||||
| 12 | ||||
| 12 | ||||
| Item 1A |
12 | |||
| Item 1B |
21 | |||
| Item 2. |
21 | |||
| Item 3. |
21 | |||
| Item 4. |
21 | |||
| Item 5. |
Market for Common Equity, Related Stockholder Matters, and Issuer Purchases of Equity Securities |
22 | ||
| Item 6. |
24 | |||
| Item 7. |
Management’s Discussion and Analysis of Financial Condition and Results of Operations |
26 | ||
| Item 7A. |
64 | |||
| Item 8. |
65 | |||
| Item 9. |
Changes in and Disagreements With Accountants on Accounting and Financial Disclosure |
65 | ||
| Item 9A. |
65 | |||
| Item 9B. |
65 | |||
| Item 10. |
66 | |||
| Item 11. |
66 | |||
| Item 12. |
Security Ownership of Certain Beneficial Owners and Management and Related Stockholder Matters |
66 | ||
| Item 13. |
Certain Relationships and Related Transactions, and Director Independence |
66 | ||
| Item 14. |
66 | |||
| Item 15. |
66 | |||
| 110 | ||||
Table of Contents
| Item 1. | Business |
CenterState Banks, Inc. (“We,” “CenterState,” “CSFL,” or the “Company”) was incorporated under the laws of the State of Florida on September 20, 1999. CenterState is a registered bank holding company under the Bank Holding Company Act of 1956, as amended (the “BHC Act”) and owns all the outstanding shares of CenterState Bank Central Florida, N.A. (“Central”), CenterState Bank National Association (“CSNA”), CenterState Bank of Florida, N.A. (“CSB”), and Valrico State Bank (“VSB”) (collectively, the “Banks”).
In April 2007, we closed the acquisition of Valrico Bancorp, Inc. and its wholly owned subsidiary bank, VSB. VSB operates in Hillsborough County, which is contiguous to Pasco and Polk Counties, where we currently have banking locations.
On November 30, 2007, CSNA acquired all of the assets and assumed all of the liabilities of CenterState Bank Mid Florida, a bank we purchased on March 31, 2006. Following the acquisition by CSNA of CenterState Bank Mid Florida, the shell of CenterState Bank Mid Florida was merged with and into Atlantic Southern Bank, a wholly owned subsidiary of Atlantic Southern Financial Group, Inc., for a payment by Atlantic Southern Bank to CenterState of $1.0 million. The transaction allowed us to consolidate our two subsidiary banks, and facilitated Atlantic Southern Bank’s expansion into Florida.
Central and CSNA commenced operations in 1989. CSB commenced operations in 1992. Central’s operations are conducted from its main office located in Kissimmee, Florida, and branch offices located in St. Cloud, Poinciana, and Orlando, Florida. CSNA operations are conducted from its main office located in Zephyrhills, Florida, and branch offices located in Zephyrhills, Bushnell, Dade City, Inverness, Spring Hill, Crystal River, Leesburg, Clermont, Groveland, and Eustis, Florida. CSB operates through twelve banking locations within Polk County and four locations in Marion County, Florida. These cities within Polk County include Winter Haven, Haines City, Davenport, Lake Alfred, Auburndale, Lakeland and Lake Wales. The Marion County branches are in Ocala, Florida. VSB conducts business from its main office located in Valrico, Florida and branch offices located in Brandon, Lithia, Plant City and Riverview, Florida. Our three national bank subsidiaries are subject to the supervision of the Office of the Comptroller of the Currency (the “OCC”) and our state bank subsidiary (VSB) is under the supervision of the Florida Office of Financial Regulation (the “Florida Office”) and the FDIC. As of December 31, 2009, we operated through our four wholly owned subsidiary banks, with 38 banking locations located in ten counties in central Florida.
Our Company provides a range of consumer and commercial banking services to individuals, businesses and industries. The basic services we offer include: demand interest-bearing and noninterest-bearing accounts, money market deposit accounts, time deposits, safe deposit services, cash management, direct deposits, notary services, money orders, night depository, travelers’ checks, cashier’s checks, domestic collections, savings bonds, bank drafts, automated teller services, drive-in tellers, and banking by mail and by internet. In addition, we make residential and commercial real estate loans, secured and unsecured commercial loans and consumer loans. Our Company provides automated teller machine (ATM) cards, thereby permitting customers to utilize the convenience of larger ATM networks. We also offer internet banking services to our customers. In addition to the foregoing services, our offices provide customers with extended banking hours. We do not have a trust department, however, trust services are available to customers through a business relationship with another institution. We also offer other financial products to our customers, including mutual funds, annuities and other products, through a relationship with Infinex Investment, Inc.
The revenue of our Company is primarily derived from interest on, and fees received in connection with, real estate and other loans, interest and dividends from investment securities and short-term investments, and commissions on bond sales. The principal sources of funds for our lending activities are customer deposits,
1
Table of Contents
repayment of loans, and the sale and maturity of investment securities. Our principal expenses are interest paid on deposits, and operating and general administrative expenses.
In addition to providing traditional deposit and lending products and services to our commercial and retail customers through our 38 locations in central Florida, we also operate a correspondent banking and bond sales division. The division is integrated with and part of our lead subsidiary bank, CSB, located in Winter Haven, Florida, although the majority of our bond salesmen and traders are physically housed in leased facilities located in Birmingham, Alabama and Atlanta, Georgia. The business lines of this division are primarily divided into three inter-related revenue generating activities. The first, and largest, revenue generator is commissions earned on fixed income security sales. The second category includes: (a) correspondent bank deposits (i.e., federal funds purchased); (b) correspondent bank checking accounts; and (c) loans to correspondent banks. The third, and smallest revenue generating category, includes fees from safe-keeping activities, bond accounting services for correspondents, and asset/liability consulting related activities. The customer base includes small to medium size financial institutions primarily located in Florida, Alabama and Georgia.
As is the case with banking institutions generally, our Company’s operations are materially and significantly influenced by the real estate market, general economic conditions and by related monetary and fiscal policies of financial institution regulatory agencies, including the Board of Governors of the Federal Reserve System (the “Federal Reserve”). Deposit flows and costs of funds are influenced by interest rates on competing investments and general market rates of interest. Lending activities are affected by the demand for financing of real estate and other types of loans, which in turn is affected by the interest rates at which such financing may be offered and other factors affecting local demand and availability of funds. We face strong competition in the attraction of deposits (our primary source of lendable funds) and in the origination of loans. See “Competition.”
CenterState Shared Services (“CSS”) (formerly C.S. Processing, Inc.) is a wholly owned subsidiary of our Company’s subsidiary banks. CSS processes checks and renders statements (i.e. “item processing center”), provides certain information technology services, human resource services and credit analysis services for our subsidiary banks.
At December 31, 2009, our Company’s primary assets were our ownership of 100% of the stock of each of our four banks. At December 31, 2009, we had total consolidated assets of $1,751,299,000, total consolidated deposits of $1,305,036,000, and total consolidated stockholders’ equity of $229,410,000.
Note about Forward-Looking Statements
This Form 10-K contains forward-looking statements, such as statements relating to our financial condition, results of operations, plans, objectives, future performance and business operations. These statements relate to expectations concerning matters that are not historical facts. These forward-looking statements reflect our current views and expectations based largely upon the information currently available to us and are subject to inherent risks and uncertainties. Although we believe our expectations are based on reasonable assumptions, they are not guarantees of future performance and there are a number of important factors that could cause actual results to differ materially from those expressed or implied by such forward-looking statements. By making these forward-looking statements, we do not undertake to update them in any manner except as may be required by our disclosure obligations in filings we make with the Securities and Exchange Commission under the Federal securities laws. Our actual results may differ materially from our forward-looking statements.
We offer a range of lending services, including real estate, consumer and commercial loans, to individuals and small businesses and other organizations that are located in or conduct a substantial portion of their business in our market area. The Company’s consolidated loans at December 31, 2009 and 2008 were $959,021,000, or 55% and $892,001,000 or 67%, respectively, of total consolidated assets. The interest rates charged on loans vary
2
Table of Contents
with the degree of risk, maturity, and amount of the loan, and are further subject to competitive pressures, money market rates, availability of funds, and government regulations. We have no foreign loans or loans for highly leveraged transactions.
Our loans are concentrated in three major areas: commercial loans, real estate loans, and consumer loans. A majority of our loans are made on a secured basis. As of December 31, 2009, approximately 84% of our consolidated loan portfolio consisted of loans secured by mortgages on real estate, 10% of the loan portfolio consisted of commercial loans (not secured by real estate) and 6% of our loan portfolio consisted of consumer and other loans.
Our commercial loan portfolio includes loans to individuals and small-to-medium sized businesses located primarily in Polk, Osceola, Pasco, Hernando, Hillsborough, Citrus, Sumter, Lake, Marion and Orange counties for working capital, equipment purchases, and various other business purposes. A majority of commercial loans are secured by equipment or similar assets, but these loans may also be made on an unsecured basis. Commercial loans may be made at variable or fixed rates of interest. Commercial lines of credit are typically granted on a one-year basis, with loan covenants and monetary thresholds. Other commercial loans with terms or amortization schedules of longer than one year will normally carry interest rates which vary with the prime lending rate and will become payable in full and are generally refinanced in three to five years. Commercial and agricultural loans not secured by real estate amounted to approximately 10% and 9% of our Company’s total loan portfolio as of December 31, 2009 and 2008, respectively.
Our real estate loans are secured by mortgages and consist primarily of loans to individuals and businesses for the purchase, improvement of or investment in real estate, for the construction of single-family residential and commercial units, and for the development of single-family residential building lots. These real estate loans may be made at fixed or variable interest rates. Generally, we do not make fixed-rate commercial real estate loans for terms exceeding five years. Loans in excess of five years are generally adjustable. Our residential real estate loans generally are repayable in monthly installments based on up to a 15-year or a 30-year amortization schedule with variable or fixed interest rates.
Our consumer loan portfolio consists primarily of loans to individuals for various consumer purposes, but includes some business purpose loans which are payable on an installment basis. The majority of these loans are for terms of less than five years and are secured by liens on various personal assets of the borrowers, but consumer loans may also be made on an unsecured basis. Consumer loans are made at fixed and variable interest rates, and are often based on up to a five-year amortization schedule.
For additional information regarding the Company’s loan portfolio, see “Management’s Discussion and Analysis of Financial Condition and Results of Operations.”
Loan originations are derived primarily from employee loan officers within our local market areas, but can also be attributed to referrals from existing customers and borrowers, advertising, or walk-in customers.
Certain credit risks are inherent in making loans. These include prepayment risks, risks resulting from uncertainties in the future value of collateral, risks resulting from changes in economic and industry conditions, and risks inherent in dealing with individual borrowers. In particular, longer maturities increase the risk that economic conditions will change and adversely affect collectibility. We attempt to minimize credit losses through various means. In particular, on larger credits, we generally rely on the cash flow of a debtor as the source of repayment and secondarily on the value of the underlying collateral. In addition, we attempt to utilize shorter loan terms in order to reduce the risk of a decline in the value of such collateral.
3
Table of Contents
Deposits are the major source of our funds for lending and other investment activities. We consider the majority of our regular savings, demand, NOW and money market deposit accounts to be core deposits. These accounts comprised approximately 56% and 51% of our consolidated total deposits at December 31, 2009 and 2008, respectively. Approximately 44% of our consolidated deposits at December 31, 2009, were certificates of deposit compared to 49% at December 31, 2008. Generally, we attempt to maintain the rates paid on our deposits at a competitive level. Time deposits of $100,000 and over made up approximately 24% of consolidated total deposits at December 31, 2009 and 27% at December 31, 2008. The majority of the deposits are generated from Polk, Osceola, Orange, Pasco, Hernando, Hillsborough, Sumter, Lake, Marion and Citrus counties. Generally, we do not accept brokered deposits and we do not solicit deposits on a national level. We obtain all of our deposits from customers in our local markets. For additional information regarding the Company’s deposit accounts, see “Management’s Discussion and Analysis of Financial Condition and Results of Operations—Deposits.”
Our investment securities portfolio available for sale was $463,186,000 and $252,080,000 at December 31, 2009 and 2008, respectively, representing 26% and 19% of our total consolidated assets. At December 31, 2009 approximately 88% of this portfolio was invested in U.S. government mortgage backed securities (“MBS”). We do not own any private label MBS. Approximately 8%, or $35,496,000 of this portfolio is invested in municipal securities, and the remaining 4%, or $17,910,000 is invested in obligations of U.S. government agencies. Our investments are managed in relation to loan demand and deposit growth, and are generally used to provide for the investment of excess funds at acceptable risks levels while providing liquidity to fund increases in loan demand or to offset fluctuations in deposits. Investment securities available for sale are recorded on our balance sheet at market value at each balance sheet date. Any change in market value is recorded directly in our stockholders’ equity account and is not recognized in our income statement unless the security is sold or unless it is impaired and the impairment is other than temporary. During 2009, we sold approximately $202,857,000 of these securities and recognized in our income statement a net gain on the sales of approximately $2,516,000.
We have selected these types of investments because such securities generally represent a minimal investment risk. Occasionally, we may purchase certificates of deposits of national and state banks. These investments may exceed $250,000 in any one institution (the limit of FDIC insurance for deposit accounts). Federal funds sold, money market accounts and interest bearing deposits held at the Federal Reserve Bank represent the excess cash we have available over and above daily cash needs. Federal funds sold and money market funds are invested on an overnight basis with approved correspondent banks.
We monitor changes in financial markets. In addition to investments for our portfolio, we monitor daily cash positions to ensure that all available funds earn interest at the earliest possible date. A portion of the investment account is invested in liquid securities that can be readily converted to cash with minimum risk of market loss. These investments usually consist of obligations of U.S. government agencies, mortgage backed securities and federal funds. The remainder of the investment account may be placed in investment securities of different type and/or longer maturity. Daily surplus funds are sold in the federal funds market for one business day. We attempt to stagger the maturities of our securities so as to produce a steady cash-flow in the event cash is needed, or economic conditions change.
Beginning in the third quarter of 2009, we initiated a trading securities portfolio at our lead subsidiary bank. For this portfolio, realized and unrealized gains and losses are included in trading securities revenue, a component of non interest income in our Consolidated Statement of Operations. Securities purchased for this portfolio have primarily been municipal securities and are held for short periods of time. During 2009 we purchased approximately $32,714,000 of securities for this portfolio and sold all of them before the end of the year recognizing a net gain on sale of approximately $427,000. At December 31, 2009, we did not own any securities in our trading portfolio.
4
Table of Contents
Correspondent banking involves one bank providing services to another bank which cannot provide that service for itself from an economic or practical standpoint.
Through our lead subsidiary bank in Winter Haven, Florida, we have initiated a correspondent banking and bond sales division during the fourth quarter of 2008. This new business line was created by way of a management lift-out. We hired substantially all the employees (17) of the Royal Bank of Canada’s (“RBC”) bond sales division, who were previously employees of Alabama National Bank (“ALAB”) prior to RBC’s acquisition of ALAB. We augmented this group during July 2009 when we hired approximately 40 individuals who were prior employees of the failed Silverton Bank in Atlanta, Georgia.
The division operates out of leased facilities in Birmingham, Alabama and Atlanta, Georgia. The business lines are primarily divided into three inter-related revenue generating activities. The first, and largest, revenue generator is commissions earned on fixed income security sales. The second category includes: correspondent bank deposits (i.e. federal funds purchased); correspondent bank checking accounts; and, loans to correspondent banks. The third, and smallest revenue generating category, includes fees from safe-keeping activities, bond accounting for correspondents, and asset/liability consulting related activities. The customer base includes small to medium size financial institutions primarily located in Florida, Georgia and Alabama, but will also include several other southeastern States.
Beginning in December 2007 and ending in February 2008 each of our banks converted their third party core data processing service bureau to a single in-house solution operated through our banks wholly owned subsidiary CSS. The core data processing system provides automated general ledgers, deposit processing and accounting services, and loan processing and accounting services. The systems were substantially identical to the third party system, except all the processing now occurs in-house. Each of our subsidiary business units maintains its own data processing system, with its own general ledger, deposit accounting system and loan accounting system, all housed on the same equipment maintained at CSS. The output of each of these comprehensive systems for each of our banks is then consolidated at the holding company level.
CSS also provides item processing services and certain other information technology (“IT”) services for our subsidiary banks. These services include; sorting, encoding, processing, and imaging checks and rendering checking and other deposit statements to commercial and retail customers, as well as provide IT services, including intranet and internet services for each subsidiary bank and the Company overall. The total cost of providing these services are charged to each subsidiary bank based on usage.
Effect of Governmental Policies
The earnings and business of our Company are and will be affected by the policies of various regulatory authorities of the United States, especially the Federal Reserve. The Federal Reserve, among other things, regulates the supply of credit and deals with general economic conditions within the United States. The instruments of monetary policy employed by the Federal Reserve for these purposes influence in various ways the overall level of investments, loans, other extensions of credit and deposits, and the interest rates paid on liabilities and received on assets.
Our Company is subject to numerous state and federal statutes that affect the interest rates that may be charged on loans. These laws do not, under present market conditions, deter us from continuing the process of originating loans.
5
Table of Contents
Banks and their holding companies, and many of their affiliates, are extensively regulated under both federal and state law. The following is a brief summary of certain statutes, rules, and regulations affecting our Company, and our subsidiary Banks. This summary is qualified in its entirety by reference to the particular statutory and regulatory provisions referred to below and is not intended to be an exhaustive description of the statutes or regulations applicable to the business of our Company and subsidiary Banks. Supervision, regulation, and examination of banks by regulatory agencies are intended primarily for the protection of depositors, rather than shareholders.
Bank Holding Company Regulation. Our Company is a bank holding company, registered with the Federal Reserve under the BHC Act. As such, we are subject to the supervision, examination and reporting requirements of the BHC Act and the regulations of the Federal Reserve. The BHC Act requires that a bank holding company obtain the prior approval of the Federal Reserve before (i) acquiring direct or indirect ownership or control of more than 5% of the voting shares of any bank, (ii) taking any action that causes a bank to become a subsidiary of the bank holding company, or (iii) merging or consolidating with any other bank holding company.
The BHC Act further provides that the Federal Reserve may not approve any transaction that would result in a monopoly or would be in furtherance of any combination or conspiracy to monopolize or attempt to monopolize the business of banking in any section of the United States, or the effect of which may be substantially to lessen competition or to tend to create a monopoly in any section of the country, or that in any other manner would be in restraint of trade, unless the anticompetitive effects of the proposed transaction are clearly outweighed by the public interest in meeting the convenience and needs of the community to be served. The Federal Reserve is also required to consider the financial and managerial resources and future prospects of the bank holding companies and banks concerned and the convenience, and needs of the community to be served. Consideration of financial resources generally focuses on capital adequacy and consideration of convenience and needs issues includes the parties’ performance under the Community Reinvestment Act of 1977 (the “CRA”), both of which are discussed below.
Banks are subject to the provisions of the CRA. Under the terms of the CRA, the appropriate federal bank regulatory agency is required, in connection with its examination of a bank, to assess such bank’s record in meeting the credit needs of the community served by that bank, including low- and moderate-income neighborhoods. The regulatory agency’s assessment of the bank’s record is made available to the public. Further, such assessment is required of any bank which has applied to:
| • | charter a bank, |
| • | obtain deposit insurance coverage for a newly chartered institution, |
| • | establish a new branch office that will accept deposits, |
| • | relocate an office, or |
| • | merge or consolidate with, or acquire the assets or assume the liabilities of, a federally regulated financial institution |
In the case of a bank holding company applying for approval to acquire a bank or other bank holding company, the Federal Reserve will assess the record of each subsidiary bank of the applicant bank holding company, and such records may be the basis for denying the application.
The BHC Act generally prohibits a bank holding company from engaging in activities other than banking, or managing or controlling banks or other permissible subsidiaries, and from acquiring or retaining direct or indirect control of any company engaged in any activities other than those activities determined by the Federal Reserve to be so closely related to banking or managing or controlling banks as to be a proper incident thereto. In
6
Table of Contents
determining whether a particular activity is permissible, the Federal Reserve must consider whether the performance of such an activity can reasonably be expected to produce benefits to the public, such as greater convenience, increased competition, or gains in efficiency that outweigh possible adverse effects, such as undue concentration of resources, decreased or unfair competition, conflicts of interest, or unsound banking practices. For example, factoring accounts receivable, acquiring or servicing loans, leasing personal property, conducting securities brokerage activities, performing certain data processing services, acting as agent or broker in selling credit life insurance and certain other types of insurance in connection with credit transactions, and certain insurance underwriting activities have all been determined by regulations of the Federal Reserve to be permissible activities of bank holding companies. Despite prior approval, the Federal Reserve has the power to order a holding company or its subsidiaries to terminate any activity or terminate its ownership or control of any subsidiary, when it has reasonable cause to believe that continuation of such activity or such ownership or control constitutes a serious risk to the financial safety, soundness, or stability of any bank subsidiary of that bank holding company.
Gramm-Leach-Bliley Act. Enacted in 1999, the Gramm-Leach-Bliley Act permits the creation of financial services holding companies that can offer a full range of financial products under a regulatory structure based on the principle of functional regulation. The law eliminated the legal barriers to affiliations among banks and securities firms, insurance companies, and other financial services companies. The law also provides financial organizations with the opportunity to structure these new financial affiliations through a holding company structure or a financial subsidiary. The law reserves the role of the Federal Reserve Board as the supervisor for bank holding companies. At the same time, the law also provides a system of functional regulation which is designed to utilize the various existing federal and state regulatory bodies. The law also sets up a process for coordination between the Federal Reserve Board and the Secretary of the Treasury regarding the approval of new financial activities for both bank holding companies and national bank financial subsidiaries.
The law also includes a minimum federal standard of financial privacy. Financial institutions are required to have written privacy policies that must be disclosed to customers. The disclosure of a financial institution’s privacy policy must take place at the time a customer relationship is established and not less than annually during the continuation of the relationship. The act also provides for the functional regulation of bank securities activities. The law repealed the exemption that banks were afforded from the definition of “broker,” and replaced it with a set of limited exemptions that allow the continuation of some historical activities performed by banks. In addition, the act amended the securities laws to include banks within the general definition of dealer. Regarding new bank products, the law provides a procedure for handling products sold by banks that have securities elements. In the area of Community Reinvestment Act activities, the law generally requires that financial institutions address the credit needs of low-to-moderate income individuals and neighborhoods in the communities in which they operate. Bank regulators are required to take the Community Reinvestment Act ratings of a bank or of the bank subsidiaries of a holding company into account when acting upon certain branch and bank merger and acquisition applications filed by the institution. Under the law, financial holding companies and banks that desire to engage in new financial activities are required to have satisfactory or better Community Reinvestment Act ratings when they commence the new activity.
Bank Regulation. Central, CSB and CSNA are chartered under the national banking laws and are subject to comprehensive regulation, examination and supervision by the OCC. Valrico State Bank is a State chartered Bank and is subject to comprehensive regulation, examination and supervision by the FDIC and the Florida Office. Each of the deposits of the Banks is insured by the FDIC to the extent provided by law. The Banks also are subject to various laws and regulations applicable to banks. Such regulations include limitations on loans to a single borrower and to its directors, officers and employees; restrictions on the opening and closing of branch offices; the maintenance of required capital and liquidity ratios; the granting of credit under equal and fair conditions; and the disclosure of the costs and terms of such credit. The Banks submit to their examining agencies periodic reports regarding their financial condition and other matters. The bank regulatory agencies have a broad range of powers to enforce regulations under their jurisdiction, and to take discretionary actions determined to be for the protection and safety and soundness of banks, including the institution of cease and
7
Table of Contents
desist orders and the removal of directors and officers. The bank regulatory agencies also have the authority to approve or disapprove mergers, consolidations, and similar corporate actions.
There are various statutory limitations on the ability of our Company to pay dividends. The bank regulatory agencies also have the general authority to limit the dividend payment by banks if such payment may be deemed to constitute an unsafe and unsound practice. For information on the restrictions on the right of our Banks to pay dividends to our Company, see Part II—Item 5 “Market for the Registrant’s Common Equity, Related Stockholder Matters and Purchases of Equity Securities.”
Under federal law, federally insured banks are subject, with certain exceptions, to certain restrictions on any extension of credit to their parent holding companies or other affiliates, on investment in the stock or other securities of affiliates, and on the taking of such stock or securities as collateral from any borrower. In addition, banks are prohibited from engaging in certain tie-in arrangements in connection with any extension of credit or the providing of any property or service.
The Financial Institutions Reform, Recovery and Enforcement Act of 1989 (“FIRREA”) imposed major regulatory reforms, stronger capital standards for savings and loan associations and stronger civil and criminal enforcement provisions. FIRREA also provides that a depository institution insured by the FDIC can be held liable for any loss incurred by, or reasonably expected to be incurred by, the FDIC in connection with:
| • | the default of a commonly controlled FDIC insured depository institution; or |
| • | any assistance provided by the FDIC to a commonly controlled FDIC insured institution in danger of default. |
The FDIC Improvement Act of 1993 (“FDICIA”) made a number of reforms addressing the safety and soundness of deposit insurance funds, supervision, accounting, and prompt regulatory action, and also implemented other regulatory improvements. Periodic full-scope, on-site examinations are required of all insured depository institutions. The cost for conducting an examination of an institution may be assessed to that institution, with special consideration given to affiliates and any penalties imposed for failure to provide information requested. Insured state banks also are precluded from engaging as principal in any type of activity that is impermissible for a national bank, including activities relating to insurance and equity investments. The Act also recodified restrictions on extensions of credit to insiders under the Federal Reserve Act.
Capital Requirements. The Federal Reserve Board and bank regulatory agencies require bank holding companies and financial institutions to maintain capital at adequate levels based on a percentage of assets and off-balance sheet exposures, adjusted for risk weights ranging from 0% to 100%. Under the risk-based standard, capital is classified into two tiers. Tier 1 capital consists of common shareholders’ equity (excluding the unrealized gain (loss) on available-for-sale securities), trust preferred securities subject to certain limitations, and minus certain intangible assets. Tier 2 capital consists of the general allowance for credit losses except for certain limitations. An institution’s qualifying capital base for purposes of its risk-based capital ratio consists of the sum of its Tier 1 and Tier 2 capital. The regulatory minimum requirements are 4% for Tier 1 and 8% for total risk-based capital. At December 31, 2009, our Tier 1 and total risk-based capital ratios were 18.0% and 19.2%, respectively.
Bank holding companies and banks are also required to maintain capital at a minimum level based on total assets, which is known as the leverage ratio. The minimum requirement for the leverage ratio is 4%, but all but the highest rated institutions are required to maintain ratios 100 to 200 basis points above the minimum. At December 31, 2009, our leverage ratio was 11.4%.
FDICIA contains “prompt corrective action” provisions pursuant to which banks are to be classified into one of five categories based upon capital adequacy, ranging from “well capitalized” to “critically undercapitalized” and which require (subject to certain exceptions) the appropriate federal banking agency to take prompt
8
Table of Contents
corrective action with respect to an institution which becomes “significantly undercapitalized” or “critically undercapitalized.”
The OCC and the FDIC have issued regulations to implement the “prompt corrective action” provisions of FDICIA. In general, the regulations define the five capital categories as follows:
| • | an institution is “well capitalized” if it has a total risk-based capital ratio of 10% or greater, has a Tier 1 risk-based capital ratio of 6% or greater, has a leverage ratio of 5% or greater and is not subject to any written capital order or directive to meet and maintain a specific capital level for any capital measures; |
| • | an institution is “adequately capitalized” if it has a total risk-based capital ratio of 8% or greater, has a Tier 1 risk-based capital ratio of 4% or greater, and has a leverage ratio of 4% or greater; |
| • | an institution is “undercapitalized” if it has a total risk-based capital ratio of less than 8%, has a Tier 1 risk-based capital ratio that is less than 4% or has a leverage ratio that is less than 4%; |
| • | an institution is “significantly undercapitalized” if it has a total risk-based capital ratio that is less than 6%, a Tier 1 risk-based capital ratio that is less than 3% or a leverage ratio that is less than 3%; and |
| • | an institution is “critically undercapitalized” if its “tangible equity” is equal to or less than 2% of its total assets. |
The OCC and the FDIC, after an opportunity for a hearing, have authority to downgrade an institution from “well capitalized” to “adequately capitalized” or to subject an “adequately capitalized” or “undercapitalized” institution to the supervisory actions applicable to the next lower category, for supervisory concerns.
Generally, FDICIA requires that an “undercapitalized” institution must submit an acceptable capital restoration plan to the appropriate federal banking agency within 45 days after the institution becomes “undercapitalized” and the agency must take action on the plan within 60 days. The appropriate federal banking agency may not accept a capital restoration plan unless, among other requirements, each company having control of the institution has guaranteed that the institution will comply with the plan until the institution has been adequately capitalized on average during each of the three consecutive calendar quarters and has provided adequate assurances of performance. The aggregate liability under this provision of all companies having control of an institution is limited to the lesser of:
| • | 5% of the institution’s total assets at the time the institution becomes “undercapitalized” or |
| • | the amount which is necessary, or would have been necessary, to bring the institution into compliance with all capital standards applicable to the institution as of the time the institution fails to comply with the plan filed pursuant to FDICIA |
An “undercapitalized” institution may not acquire an interest in any company or any other insured depository institution, establish or acquire additional branch offices or engage in any new business unless the appropriate federal banking agency has accepted its capital restoration plan, the institution is implementing the plan, and the agency determines that the proposed action is consistent with and will further the achievement of the plan, or the appropriate Federal banking agency determines the proposed action will further the purpose of the “prompt corrective action” sections of FDICIA.
If an institution is “critically undercapitalized,” it must comply with the restrictions described above. In addition, the appropriate Federal banking agency is authorized to restrict the activities of any “critically undercapitalized” institution and to prohibit such an institution, without the appropriate Federal banking agency’s prior written approval, from:
| • | entering into any material transaction other than in the usual course of business; |
| • | engaging in any covered transaction with affiliates (as defined in Section 23A(b) of the Federal Reserve Act); |
9
Table of Contents
| • | paying excessive compensation or bonuses; and |
| • | paying interest on new or renewed liabilities at a rate that would increase the institution’s weighted average costs of funds to a level significantly exceeding the prevailing rates of interest on insured deposits in the institution’s normal market areas. |
The “prompt corrective action” provisions of FDICIA also provide that in general no institution may make a capital distribution if it would cause the institution to become “undercapitalized.” Capital distributions include cash (but not stock) dividends, stock purchases, redemptions, and other distributions of capital to the owners of an institution.
Additionally, FDICIA requires, among other things, that:
| • | only a “well capitalized” depository institution may accept brokered deposits without prior regulatory approval and |
| • | the appropriate federal banking agency annually examine all insured depository institutions, with some exceptions for small, “well capitalized” institutions and state-chartered institutions examined by state regulators. |
FDICIA also contains a number of consumer banking provisions, including disclosure requirements and substantive contractual limitations with respect to deposit accounts.
As of December 31, 2009, each of our subsidiary Banks met the capital requirements of a “well capitalized” institution.
Enforcement Powers. Congress has provided the federal bank regulatory agencies with an array of powers to enforce laws, rules, regulations and orders. Among other things, the agencies may require that institutions cease and desist from certain activities, may preclude persons from participating in the affairs of insured depository institutions, may suspend or remove deposit insurance, and may impose civil money penalties against institution-affiliated parties for certain violations.
Maximum Legal Interest Rates. Like the laws of many states, Florida law contains provisions on interest rates that may be charged by banks and other lenders on certain types of loans. Numerous exceptions exist to the general interest limitations imposed by Florida law. The relative importance of these interest limitation laws to the financial operations of the Banks will vary from time to time, depending on a number of factors, including conditions in the money markets, the costs and availability of funds, and prevailing interest rates.
Branch Banking. Banks in Florida are permitted to branch state wide. Such branch banking, however, is subject to prior approval by the bank regulatory agencies. Any such approval would take into consideration several factors, including the bank’s level of capital, the prospects and economics of the proposed branch office, and other conditions deemed relevant by the bank regulatory agencies for purposes of determining whether approval should be granted to open a branch office.
Change of Control. Federal law restricts the amount of voting stock of a bank holding company and a bank that a person may acquire without the prior approval of banking regulators. The overall effect of such laws is to make it more difficult to acquire a bank holding company and a bank by tender offer or similar means than it might be to acquire control of another type of corporation. Consequently, shareholders of the Company may be less likely to benefit from the rapid increases in stock prices that may result from tender offers or similar efforts to acquire control of other companies. Federal law also imposes restrictions on acquisitions of stock in a bank holding company and a state bank. Under the federal Change in Bank Control Act and the regulations thereunder, a person or group must give advance notice to the Federal Reserve before acquiring control of any bank holding company, the OCC before acquiring control of any national bank and the FDIC and the Florida Department
10
Table of Contents
before acquiring control of a state bank. Upon receipt of such notice, the bank regulatory agencies may approve or disapprove the acquisition. The Change in Bank Control Act creates a rebuttable presumption of control if a member or group acquires a certain percentage or more of a bank holding company’s or state bank’s voting stock, or if one or more other control factors set forth in the Act are present.
Interstate Banking. Federal law provides for nationwide interstate banking and branching. Under the law, interstate acquisitions of banks or bank holding companies in any state by bank holding companies in any other state are permissible subject to certain limitations. Florida has a law that allows out-of-state bank holding companies (located in states that allow Florida bank holding companies to acquire banks and bank holding companies in that state) to acquire Florida banks and Florida bank holding companies. The law essentially provides for out-of-state entry by acquisition only (and not by interstate branching) and requires the acquired Florida bank to have been in existence for at least three years.
Effect of Governmental Policies. Our earnings and businesses are affected by the policies of various regulatory authorities of the United States, especially the Federal Reserve. The Federal Reserve, among other things, regulates the supply of credit and deals with general economic conditions within the United States. The instruments of monetary policy employed by the Federal Reserve for those purposes influence in various ways the overall level of investments, loans, other extensions of credit, and deposits, and the interest rates paid on liabilities and received on assets.
Sarbanes-Oxley Act. In 2002, the Sarbanes-Oxley Act was enacted which imposes a myriad of corporate governance and accounting measures designed that shareholders are treated and have full and accurate information about the public companies in which they invest. All public companies are affected by the Act. Some of the principal provisions of the Act include:
| • | the creation of an independent accounting oversight board (“PCAOB”) to oversee the audit of public companies and auditors who perform such audits; |
| • | auditor independence provisions which restrict non-audit services that independent accountants may provide to their audit clients; |
| • | additional corporate governance and responsibility measures which (a) require the chief executive officer and chief financial officer to certify financial statements and internal controls and to forfeit salary and bonuses in certain situations, and (b) protect whistleblowers and informants; |
| • | expansion of the authority and responsibilities of the company’s audit, nominating and compensation committees; |
| • | mandatory disclosure by analysts of potential conflicts of interest; and |
| • | enhanced penalties for fraud and other violations. |
USA Patriot Act. In 2001, the USA Patriot Act was enacted. The Act requires financial institutions to help prevent, detect and prosecute international money laundering and financing of terrorism. The effectiveness of a financial institution in combating money laundering activities is a factor to be considered in any application submitted by the financial institution with the bank regulatory agencies. Our Banks have adopted systems and procedures designed to comply with the USA Patriot Act and regulations adopted thereunder by the Secretary of the Treasury.
We encounter strong competition both in making loans and in attracting deposits. The deregulation of the banking industry and the widespread enactment of state laws which permit multi-bank holding companies as well as an increasing level of interstate banking have created a highly competitive environment for commercial banking. In one or more aspects of its business, our Company competes with other commercial banks, savings
11
Table of Contents
and loan associations, credit unions, finance companies, mutual funds, insurance companies, brokerage and investment banking companies, and other financial intermediaries. Most of these competitors, some of which are affiliated with bank holding companies, have substantially greater resources and lending limits, and may offer certain services that we do not currently provide. In addition, many of our non-bank competitors are not subject to the same extensive federal regulations that govern bank holding companies and federally insured banks. Recent federal and state legislation has heightened the competitive environment in which financial institutions must conduct their business, and the potential for competition among financial institutions of all types has increased significantly.
To compete, we rely upon specialized services, responsive handling of customer needs, and personal contacts by its officers, directors, and staff. Large multi-branch banking competitors tend to compete primarily by rate and the number and location of branches while smaller, independent financial institutions tend to compete primarily by rate and personal service.
As of December 31, 2009, we had a total of approximately 478 full-time equivalent employees. The employees are not represented by a collective bargaining unit. We consider relations with employees to be good.
Statistical Profile and Other Financial Data
Reference is hereby made to the statistical and financial data contained in the section captioned “Management’s Discussion and Analysis of Financial Condition and Results of Operations,” for statistical and financial data providing a review of our Company’s business activities.
Availability of Reports furnished or filed with the Securities and Exchange Commission (SEC)
Our annual report on Form 10-K, quarterly reports on Form 10-Q, current reports on Form 8-K, and amendments to those reports filed or furnished pursuant to Section 13(a) or 15(d) of the Exchange Act are available on our internet website at www.centerstatebanks.com.
| Item 1A. | Risk Factors |
We have identified risk factors described below, which should be viewed in conjunction with the other information contained in this document and information incorporated by reference, including our consolidated financial statements and related notes. If any of the following risks or other risks which have not been identified or which we may believe are immaterial or unlikely, actually occur, our business, financial condition and results of operations could be harmed. As noted previously, this report contains forward-looking statements that involve risks and uncertainties, including statements about our future plans, objectives, intentions and expectations. Many factors, including those described below, could cause actual results to differ materially from those discussed in forward-looking statements.
Recent developments in the financial services industry and the U.S. and global capital markets may adversely impact our operations and results.
Developments in the last two years in the capital markets have resulted in uncertainty in the financial markets in general, with the expectation of the general economic downturn continuing in the 2010 and beyond. Loan portfolio performance has deteriorated at many institutions resulting from, among other factors, a weak economy and a decline in the value of collateral. The competition for our deposits has increased significantly due to liquidity concerns at many of these same institutions. Stock prices of bank holding companies, like ours, have
12
Table of Contents
been negatively affected by the current condition of the financial markets, as has our ability, if needed, to raise capital or borrow in the debt markets, compared to prior years. As a result, there is a potential for new federal or state laws and regulations regarding lending and funding practices and capital and liquidity standards, and financial institution regulatory agencies are expected to be very aggressive in responding to concerns and trends identified in examinations, including the expected issuance of many formal enforcement actions. Developments in the financial services industry and the impact of any new legislation in response to those developments could negatively impact us by restricting our business operations, including our ability to originate or sell loans, and adversely impact our financial performance.
We cannot predict the effect on our operations of recent legislative and regulatory initiatives that were enacted in response to the ongoing financial crisis.
The U.S. federal, state and foreign governments have taken and continue to consider taking extraordinary actions in an attempt to deal with the worldwide financial crisis and the severe decline in the global economy. To the extent adopted, many of these actions have been in effect for only a limited time, and have produced limited or no relief to the capital, credit and real estate markets. There is no assurance that these actions or other actions under consideration will ultimately be successful. In the United States, the federal government has adopted the Emergency Economic Stabilization Act of 2008 (enacted on October 3, 2008), or the EESA, and the American Recovery and Reinvestment Act of 2009 (enacted on February 17, 2009), or the ARRA. With authority granted under these laws, the Treasury has proposed a financial stability plan that is intended to:
| • | provide for the government to invest additional capital into banks and otherwise facilitate bank capital formation; |
| • | temporarily increase the limits on federal deposit insurance; and |
| • | provide for various forms of economic stimulus, including to assist homeowners restructure and lower mortgage payments on qualifying loans. |
In addition, President Obama recently announced a financial regulatory reform proposal, and the House and Senate are expected to consider competing proposals over the coming years. There can be no assurance that the financial stability plan proposed by the Treasury Department, the other proposals under consideration or any other legislative or regulatory initiatives will be effective at dealing with the ongoing economic crisis and improving economic conditions globally, nationally or in our markets, or that the measures adopted will not have adverse consequences.
Deterioration in local economic and housing markets has led to loan losses and reduced earnings and could lead to additional loan losses and reduced earnings.
For the past two years, there has been a dramatic decrease in housing and real estate values in Florida, coupled with a significant increase in the rate of unemployment. These trends have contributed to an increase in the Banks’ non-performing loans and reduced asset quality. As of December 31, 2009, the Company’s non-performing loans were approximately $42.3 million, or 4.42% of the loan portfolio. Nonperforming assets were approximately $53.5 million as of this same date, or 3.05% of total assets. In addition, we had approximately $12.2 million in accruing loans that were between 30 and 89 days delinquent at December 31, 2009. If market conditions continue to deteriorate, they may lead to additional valuation adjustments on the Banks’ loan portfolios and real estate owned as the Banks continue to reassess the market value of their loan portfolios, the losses associated with the loans in default and the net realizable value of real estate owned.
Our non-performing assets adversely affect our net income in various ways. Until economic and market conditions improve, we expect to continue to incur additional losses relating to an increase in non-performing loans. We do not record interest income on non-accrual loans or other real estate owned, thereby adversely affecting our income, and increasing our loan administration costs. When we take collateral in foreclosures and
13
Table of Contents
similar proceedings, we are required to mark the related loan to the then-fair market value of the collateral, which may result in a loss. These loans and other real estate owned also increase our risk profile and the capital our regulators believe is appropriate in light of such risks. In addition, the resolution of nonperforming assets requires significant commitments of time from management and our directors, which can be detrimental to the performance of their other responsibilities.
A portion of our loans are to customers who have been adversely affected by the home building industry.
Customers who are builders and developers face greater difficulty in selling their homes in markets where the decrease in housing and real estate values are more pronounced. Consequently, the Banks are facing increased delinquencies and non-performing assets as these customers are forced to default on their loans. The Banks do not anticipate that the housing market will improve in the near-term, and accordingly, additional downgrades, provisions for loan losses and charge-offs relating to their loan portfolios may occur.
Our loan portfolio includes commercial and commercial real estate loans that have higher risks.
The Banks’ commercial and commercial real estate loans at December 31, 2009 and 2008 were $536.8 million and $515.0 million, respectively, or 56% and 58% of total loans. Commercial and commercial real estate loans generally carry larger loan balances and can involve a greater degree of financial and credit risk than other loans. As a result, banking regulators continue to give greater scrutiny to lenders with a high concentration of commercial real estate loans in their portfolios, and such lenders are expected to implement stricter underwriting, internal controls, risk management policies and portfolio stress testing, as well as higher capital levels and loss allowances. The increased financial and credit risk associated with these types of loans are a result of several factors, including the concentration of principal in a limited number of loans and borrowers, the size of loan balances, the effects of general economic conditions on income-producing properties and the increased difficulty of evaluating and monitoring these types of loans.
During 2006, the federal bank regulatory agencies released guidance on “Concentrations in Commercial Real Estate Lending” (the “Guidance”). The Guidance defines commercial real estate loans as exposures secured by raw land, land development and construction (including 1-4 family residential construction), multi-family property, and non-farm nonresidential property where the primary or a significant source of repayment is derived from rental income associated with the property (that is, loans for which 50% or more of the source of repayment comes from third party, non-affiliated, rental income) or the proceeds of the sale, refinancing, or permanent financing of the property. The Guidance requires that appropriate processes be in place to identify, monitor and control risks associated with real estate lending concentrations. This could include enhanced strategic planning, underwriting policies, risk management, internal controls, portfolio stress testing and risk exposure limits as well as appropriately designed compensation and incentive programs. Higher allowances for loan losses and capital levels may also be required. The Guidance is triggered when commercial real estate loan concentrations exceed either:
| • | total reported loans for construction, land development, and other land of 100% or more of a bank’s total capital; or |
| • | Total reported loans secured by multifamily and nonfarm nonresidential properties and loans for construction, land development, and other land of 300% or more of a bank’s total capital. |
The Guidance applies to the lending activities of all four of the Banks. Although our regulators have not required us to maintain elevated levels of capital or liquidity due to our commercial real estate loan concentrations, the regulators may do so in the future, especially if there is a further downturn in our local real estate markets.
In addition, when underwriting a commercial or industrial loan, the Banks may take a security interest in commercial real estate, and, in some instances upon a default by the borrower, we may foreclose on and take title to the property, which may lead to potential financial risks for us under applicable environmental laws. If
14
Table of Contents
hazardous substances were discovered on any of these properties, we may be liable to governmental agencies or third parties for the costs of remediation of the hazard, as well as for personal injury and property damage. Many environmental laws can impose liability regardless of whether the Banks knew of, or were responsible for, the contamination.
Furthermore, the repayment of loans secured by commercial real estate is typically dependent upon the successful operation of the related real estate or commercial project. If the cash flows from the project are reduced, a borrower’s ability to repay the loan may be impaired. This cash flow shortage may result in the failure to make loan payments. In such cases, the Banks may be compelled to modify the terms of the loan. In addition, the nature of these loans is such that they are generally less predictable and more difficult to evaluate and monitor. As a result, repayment of these loans may, to a greater extent than residential loans, be subject to adverse conditions in the real estate market or economy.
Our business is subject to the success of the local economies where we operate.
Our success significantly depends upon the growth in population, income levels, deposits and housing starts in our primary and secondary markets. Over the past two years, the rate of growth of each of these four factors has decreased substantially and in some cases has turned negative. If the communities in which we operate do not grow or if prevailing economic conditions locally or nationally continue to remain challenging, our business may be adversely affected. Our specific market areas have experienced decreased growth, which has affected the ability of our customers to repay their loans to us and has generally affected our financial condition and results of operations. We are less able than a larger institution to spread the risks of unfavorable local economic conditions across a large number of diversified economies. Moreover, we cannot give any assurance we will benefit from any market growth or favorable economic conditions in our primary market areas if they do occur.
If the value of real estate in our core central Florida markets were to remain depressed or decline further, a significant portion of our loan portfolio could become under-collateralized, which could have a material adverse effect on us.
With most of our loans concentrated in central Florida, the decline in local economic conditions has adversely affected the values of our real estate collateral and will likely continue to do so for the foreseeable future. Consequently, a prolonged decline in local economic conditions may have a greater effect on our earnings and capital than on the earnings and capital of larger financial institutions whose real estate loan portfolios are geographically diverse.
In addition to relying on the financial strength and cash flow characteristics of the borrower in each case, the Banks often secure loans with real estate collateral. At December 31, 2009, approximately 84% of the Banks’ loans have real estate as a primary or secondary component of collateral. The real estate collateral in each case provides an alternate source of repayment in the event of default by the borrower but may deteriorate in value during the time credit is extended. If we are required to liquidate the collateral securing a loan to satisfy the debt during a period of reduced real estate values, our earnings and capital could be adversely affected.
An inadequate allowance for loan losses would reduce our earnings.
The risk of credit losses on loans varies with, among other things, general economic conditions, the type of loan being made, the creditworthiness of the borrower over the term of the loan and, in the case of a collateralized loan, the value and marketability of the collateral for the loan. Management maintains an allowance for loan losses based upon, among other things, historical experience, an evaluation of economic conditions and regular reviews of delinquencies and loan portfolio quality. Based upon such factors, management makes various assumptions and judgments about the ultimate collectibility of the loan portfolio and provides an allowance for loan losses based upon a percentage of the outstanding balances and for specific loans when their ultimate collectibility is considered questionable. If management’s assumptions and judgments prove to be
15
Table of Contents
incorrect and the allowance for loan losses is inadequate to absorb losses, or if bank regulatory authorities require the Banks to increase the allowance for loan losses as a part of their examination process, the Banks’ earnings and capital could be significantly and adversely affected.
A lack of liquidity could affect our operations and jeopardize our financial condition.
Liquidity is essential to our business. An inability to raise funds through deposits, borrowings, the sale of loans and other sources could have a substantial negative effect on our liquidity. Our funding sources include federal funds purchased, securities sold under repurchase agreements, non-core deposits, and short- and long-term debt. There are other sources of liquidity available to us or the Banks should they be needed, including our ability to acquire additional non-core deposits, the issuance and sale of debt securities, and the issuance and sale of preferred or common securities in public or private transactions. Our access to funding sources in amounts adequate to finance or capitalize our activities or on terms that are acceptable to us could be impaired by factors that affect us specifically or the financial services industry or economy in general. Our ability to borrow could be impaired by factors that are not specific to us, such as further disruption in the financial markets or negative views and expectations about the prospects for the financial services industry in light of the recent turmoil faced by banking organizations and the continued deterioration in credit markets.
We are required to maintain capital to meet regulatory requirements, and if we fail to maintain sufficient capital, whether due to losses, an inability to raise additional capital or otherwise, our financial condition, liquidity and results of operations, as well as our ability to maintain regulatory compliance, would be adversely affected.
Both our bank holding company and the Banks must meet regulatory capital requirements and maintain sufficient liquidity. Our ability to raise additional capital, when and if needed, will depend on conditions in the capital markets, economic conditions and a number of other factors, including investor perceptions regarding the banking industry and market condition, and governmental activities, many of which are outside our control, and on our financial condition and performance. Accordingly, we cannot assure you that we will be able to raise additional capital if needed or on terms acceptable to us. If we fail to meet these capital and other regulatory requirements, our financial condition, liquidity and results of operations would be materially and adversely affected.
Our failure to remain “well capitalized” for bank regulatory purposes could affect customer confidence, our ability to grow, our costs of funds and FDIC insurance costs, our ability to pay dividends on common stock and make distributions on our trust preferred securities, our ability to make acquisitions, and our business, results of operations and financial condition. Under FDIC rules, if any of the Banks ceases to be a “well capitalized” institution for bank regulatory purposes, the interest rates that it pays and its ability to accept brokered deposits may be restricted. Although the Banks had no wholesale brokered deposits as of December 31, 2009, they had $31.5 million of in-market Cedars deposits, which are considered brokered deposits for regulatory purposes.
Our business strategy includes continued growth, and our financial condition and results of operations could be negatively affected if we fail to grow or fail to manage our growth effectively.
We intend to continue pursuing a growth strategy for our business. Our prospects must be considered in light of the risks, expenses and difficulties frequently encountered by companies in significant growth stages of development. Particularly in light of prevailing economic conditions, we cannot assure you we will be able to expand our market presence in our existing markets or successfully enter new markets or that any such expansion will not adversely affect our results of operations. Failure to manage our growth effectively could have a material adverse effect on our business, future prospects, financial condition or results of operations, and could adversely affect our ability to successfully implement our business strategy. Also, if our growth occurs more slowly than anticipated or declines, our operating results could be materially adversely affected.
16
Table of Contents
Our ability to successfully grow will depend on a variety of factors including the continued availability of desirable business opportunities, the competitive responses from other financial institutions in our market areas and our ability to manage our growth. While we believe we have the management resources and internal systems in place to successfully manage our future growth, there can be no assurance growth opportunities will be available or growth will be successfully managed.
We may face risks with respect to future expansion.
We may acquire other financial institutions or parts of those institutions in the future and we may engage in additional de novo branch expansion. We may also consider and enter into new lines of business or offer new products or services. We also may receive future inquiries and have discussions with potential acquirors of us. Acquisitions and mergers involve a number of risks, including:
| • | the time and costs associated with identifying and evaluating potential acquisitions and merger partners; |
| • | inaccurate estimates and judgments regarding credit, operations, management and market risks of the target institution; |
| • | the time and costs of evaluating new markets, hiring experienced local management and opening new offices, and the time lags between these activities and the generation of sufficient assets and deposits to support the costs of the expansion; |
| • | our ability to finance an acquisition and possible dilution to our existing shareholders; |
| • | the diversion of our management’s attention to the negotiation of a transaction, and the integration of the operations and personnel of the combining businesses; |
| • | entry into new markets where we lack experience; |
| • | the strain of growth on our infrastructure, staff, internal controls and management, which may require additional personnel, time and expenditures; |
| • | exposure to potential asset quality issues with acquired institutions; |
| • | the introduction of new products and services into our business; |
| • | the possibility of unknown or contingent liabilities; |
| • | the incurrence and possible impairment of goodwill associated with an acquisition and possible adverse short-term effects on our results of operations; and |
| • | the risk of loss of key employees and customers. |
We may incur substantial costs to expand, and we can give no assurance such expansion will result in the levels of profits we seek. There can be no assurance that integration efforts for any future mergers or acquisitions will be successful. Also, we may issue equity securities, including common stock and securities convertible into shares of our common stock, in connection with future acquisitions, which could cause ownership and economic dilution to our current shareholders and to investors purchasing common stock in this offering. There is no assurance that, following any future mergers or acquisitions, our integration efforts will be successful or our company, after giving effect to the acquisition, will achieve profits comparable to or better than our historical experience.
Attractive acquisition opportunities may not be available to us in the future.
While we seek continued organic growth, as our earnings and capital position improve, we may consider the acquisition of other businesses. We expect that other banking and financial companies, many of which have significantly greater resources, will compete with us to acquire financial services businesses. This competition
17
Table of Contents
could increase prices for potential acquisitions that we believe are attractive. Also, acquisitions are subject to various regulatory approvals. If we fail to receive the appropriate regulatory approvals, we will not be able to consummate an acquisition that we believe is in our best interests. Among other things, our regulators consider our capital, liquidity, profitability, regulatory compliance and levels of goodwill and intangibles when considering acquisition and expansion proposals. Any acquisition could be dilutive to our earnings and shareholders’ equity per share of our common stock.
Our recent results may not be indicative of our future results.
We may not be able to sustain our historical rate of growth or may not even be able to grow our business at all. In addition, our recent growth may distort some of our historical financial ratios and statistics. Various factors, such as economic conditions, regulatory and legislative considerations and competition, may also impede or prohibit our ability to expand our market presence. If we experience a significant decrease in our historical rate of growth, our results of operations and financial condition may be adversely affected due to a high percentage of our operating costs being fixed expenses.
Our continued pace of growth may require us to raise additional capital in the future, but that capital may not be available when it is needed.
We are required by federal and state regulatory authorities to maintain adequate levels of capital to support our operations. Our ability to raise additional capital, if needed, will depend on conditions in the capital markets at that time, which are outside our control, and on our financial performance. Accordingly, we cannot assure you of our ability to raise additional capital if needed on terms acceptable to us. If we cannot raise additional capital when needed, our ability to further expand our operations through internal growth and acquisitions could be materially impaired.
Changes in interest rates may negatively affect our earnings and the value of our assets.
Our earnings and cash flows are largely dependent upon our net interest income. Net interest income is the difference between interest income earned on interest-earnings assets, such as loans and investment securities, and interest expense paid on interest-bearing liabilities, such as deposits and borrowed funds. Interest rates are sensitive to many factors that are beyond our control, including general economic conditions, competition and policies of various governmental and regulatory agencies and, in particular, the policies of the Federal Reserve. Changes in monetary policy, including changes in interest rates, could influence not only the interest our Banks receive on loans and investment securities and the amount of interest they pay on deposits and borrowings, but such changes could also affect (i) the Banks’ ability to originate loans and obtain deposits, (ii) the fair value of our financial assets and liabilities, including the available for sale securities portfolio, and (iii) the average duration of our interest-earning assets. Changes in monetary policy could also expose us to the risk that interest-earning assets may be more responsive to changes in interest rates than interest-bearing liabilities, or vice versa (repricing risk), the risk that the individual interest rates or rates indices underlying various interest-earning assets and interest-bearing liabilities may not change in the same degree over a given time period (basis risk), and the risk of changing interest rate relationships across the spectrum of interest-earning asset and interest-bearing liability maturities (yield curve risk), including a prolonged flat or inverted yield curve environment. Any substantial, unexpected, prolonged change in market interest rates could have a material adverse affect on our financial condition and results of operations.
Higher FDIC deposit insurance premiums and assessments could adversely affect our financial condition.
FDIC insurance premiums increased substantially in 2009 and we expect to pay significantly higher FDIC premiums in the future. Market developments have significantly depleted the insurance fund of the FDIC and reduced the ratio of reserves to insured deposits. On September 29, 2009, the FDIC adopted an Amended Restoration Plan to allow the Deposit Insurance Fund to return to a reserve ratio of 1.15% within eight years. The
18
Table of Contents
FDIC amended its prior ruling on deposit assessments to require insured institutions to prepay their estimated quarterly risk-based assessments for the fourth quarter 2009, and for all of 2010, 2011 and 2012. This prepaid assessment was collected on December 30, 2009, along with each institution’s regular quarterly risk-based deposit insurance assessment for the third quarter 2009. The FDIC also increased annual assessment rates uniformly by three basis points beginning 2011. Additional special assessments may be imposed by the FDIC for future periods. We participate in the FDIC’s Temporary Liquidity Guarantee Program, or TLG, for noninterest-bearing transaction deposit accounts. Banks that participate in the TLG’s noninterest-bearing transaction account guarantee will pay the FDIC an annual assessment of 10 basis points on the amounts in such accounts above the amounts covered by FDIC deposit insurance. To the extent that these TLG assessments are insufficient to cover any loss or expenses arising from the TLG program, the FDIC is authorized to impose an emergency special assessment on all FDIC-insured depository institutions. The FDIC has authority to impose charges for the TLG program upon depository institution holding companies, as well. These changes will cause the premiums and TLG assessments charged by the FDIC to increase. These actions could significantly increase our noninterest expense in 2010 and for the foreseeable future.
Current levels of market volatility are unprecedented.
The capital and credit markets have been experiencing volatility and disruption for more than a year. In some cases, the markets have produced downward pressure on stock prices and credit availability for certain issuers without regard to those issuers’ underlying financial condition or performance. If current levels of market disruption and volatility continue or worsen, we may experience adverse effects, which may be material, on our ability to maintain or access capital and on our business, financial condition and results of operations.
Our cost of funds may increase as a result of general economic conditions, FDIC insurance assessments, interest rates and competitive pressures.
Our cost of funds may increase as a result of general economic conditions, FDIC insurance assessments, interest rates and competitive pressures. We have traditionally obtained funds principally through local deposits and we have a base of lower cost transaction deposits. Generally, we believe local deposits are a less expensive and more stable source of funds than other borrowings because interest rates paid for local deposits are typically lower than interest rates charged for borrowings from other institutional lenders and reflect a mix of transaction and time deposits, whereas brokered deposits typically are higher cost time deposits. Our costs of funds and our profitability and liquidity are likely to be adversely affected, if and to the extent we have to rely upon higher cost borrowings from other institutional lenders or brokers to fund loan demand or liquidity needs, and changes in our deposit mix and growth could adversely affect our profitability and the ability to expand our loan portfolio.
Competition from financial institutions and other financial service providers may adversely affect our profitability.
The banking business is highly competitive and we experience competition in our markets from many other financial institutions. We compete with commercial banks, credit unions, savings and loan associations, mortgage banking firms, consumer finance companies, securities brokerage firms, insurance companies, money market funds, and other mutual funds, as well as other super-regional, national and international financial institutions that operate offices in our primary market areas and elsewhere. We compete with these institutions both in attracting deposits and in making loans. In addition, we have to attract our customer base from other existing financial institutions and from new residents. Many of our competitors are well-established, larger financial institutions. While we believe we can and do successfully compete with these other financial institutions in our primary markets, we may face a competitive disadvantage as a result of our smaller size, lack of geographic diversification and inability to spread our marketing costs across a broader market. Although we compete by concentrating our marketing efforts in our primary markets with local advertisements, personal contacts, and greater flexibility and responsiveness in working with local customers, we can give no assurance this strategy will be successful.
19
Table of Contents
The soundness of other financial institutions could adversely affect us.
Our ability to engage in routine funding and other transactions could be adversely affected by the actions and commercial soundness of other financial institutions. Financial services institutions are interrelated as a result of trading, clearing, counterparty or other relationships. Defaults by, or even rumors or questions about, one or more financial services institutions, or the financial services industry generally, have led to market-wide liquidity problems and losses of depositor, creditor and counterparty confidence and could lead to losses or defaults by us or by other institutions. We could experience increases in deposits and assets as a result of other banks’ difficulties or failure, which would increase the capital we need to support our growth.
We are subject to extensive regulation that could limit or restrict our activities.
We operate in a highly regulated industry and are subject to examination, supervision, and comprehensive regulation by various federal and state agencies, including the Federal Reserve, the OCC, the FDIC, FINRA, the SEC, and the Florida Office. These regulations are primarily intended to protect depositors, not shareholders. Our compliance with these regulations is costly and restricts certain of our activities, including payment of dividends, mergers and acquisitions, investments, loans and interest rates charged, interest rates paid on deposits and locations of offices. We are also subject to capitalization guidelines established by our regulators, which require us to maintain adequate capital to support our growth.
The laws and regulations applicable to the banking industry could change at any time, and we cannot
predict the effects of these changes on our business and profitability. Because government regulation greatly affects the business and financial results of all commercial banks and bank holding companies, our cost of compliance could adversely affect our ability to operate profitably.
We are dependent upon the services of our management team.
Our future success and profitability are substantially dependent upon the management and banking abilities of our senior executives. We currently do not have employment agreements in place with any member of senior management, and we cannot guarantee you that our senior executives will remain with us. Changes in key personnel and their responsibilities may be disruptive to our business and could have a material adverse effect on our business, financial condition and results of operations. We believe that our future results will also depend in part upon our attracting and retaining highly skilled and qualified management and sales and marketing personnel. Competition for such personnel is intense, and we cannot assure you that we will be successful in retaining such personnel.
Technological changes affect our business, and we may have fewer resources than many competitors to invest in technological improvements.
The financial services industry is undergoing rapid technological changes with frequent introductions of new technology-driven products and services. In addition to serving clients better, the effective use of technology may increase efficiency and may enable financial institutions to reduce costs. Our future success will depend, in part, upon our ability to use technology to provide products and services that provide convenience to customers and to create additional efficiencies in operations. We may need to make significant additional capital investments in technology in the future, and we may not be able to effectively implement new technology-driven products and services. Many competitors have substantially greater resources to invest in technological improvements.
Hurricanes or other adverse weather events would negatively affect our local economies or disrupt our operations, which would have an adverse effect on our business or results of operations.
Our market areas in Florida are susceptible to hurricanes and tropical storms and related flooding and wind damage. Such weather events can disrupt operations, result in damage to properties and negatively affect the
20
Table of Contents
local economies in the markets where they operate. We cannot predict whether or to what extent damage that may be caused by future hurricanes will affect our operations or the economies in our current or future market areas, but such weather events could result in a decline in loan originations, a decline in the value or destruction of properties securing our loans and an increase in delinquencies, foreclosures or loan losses. Our business or results of operations may be adversely affected by these and other negative effects of future hurricanes or tropical storms, including flooding and wind damage. Many of our customers have incurred significantly higher property and casualty insurance premiums on their properties located in our markets, which may adversely affect real estate sales and values in those markets.
| Item 1B. | Unresolved Staff Comments |
None
| Item 2. | Properties |
Our Holding Company owns no real property. Our corporate office is leased from one of our subsidiary banks, and is located at 42745 U.S. Highway 27, Davenport, Florida 33837. Our Company, through our Banks, currently operates a total of 38 banking offices. Of these offices there are two “mini” offices in active adult communities. These offices are leased for nominal amounts, and generally consist of a room that is set aside for us in the community club house or community center. These offices are opened for abbreviated periods and cater to the residents of the gated community. Of the 36 full service offices, we lease four of which two of these we built the building but are leasing the land. We own thirty and have a purchase agreement on the other two. See Note 7 to the Consolidated Financial Statements of our Company included in this Annual Report on Form 10-K and Managements Discussion and Analysis – Bank Premises and Equipment, for additional information regarding our premises and equipment.
| Item 3. | Legal Proceedings |
Our banks are periodically parties to or otherwise involved in legal proceedings arising in the normal course of business, such as claims to enforce liens, claims involving the making and servicing of real property loans, and other issues incident to their respective businesses. We do not believe that there is any pending or threatened proceeding against the Banks which would have a material adverse effect on our consolidated financial position.
| Item 4. | Reserved |
21
Table of Contents
| Item 5. | Market for Common Equity, Related Stockholder Matters and Issuer Purchases of Equity Securities |
The shares of our Common Stock are traded on the Nasdaq Global Select Market. The following sets forth the high and low trading prices for trades of our Common Stock that occurred during 2009 and 2008.
| 2009 | 2008 | |||||||||||
| High | Low | High | Low | |||||||||
| 1st Quarter |
$ | 17.15 | $ | 6.21 | $ | 17.61 | $ | 12.12 | ||||
| 2nd Quarter |
12.94 | 7.32 | 14.34 | 10.40 | ||||||||
| 3rd Quarter |
9.39 | 6.50 | 18.00 | 9.70 | ||||||||
| 4th Quarter |
10.92 | 6.92 | 18.00 | 12.81 | ||||||||
As of December 31, 2009, there are 25,773,229 shares of common stock outstanding. There were approximately 979 registered shareholders as of that date, as reported by our transfer agent, Continental Stock Transfer & Trust Company.
Dividends
We have historically paid cash dividends on a quarterly basis, on the last business day of the calendar quarter. The following sets forth per share cash dividends paid during 2009 and 2008.
| 2009 | 2008 | |||||
| 1st Quarter |
$ | 0.04 | $ | 0.04 | ||
| 2nd Quarter |
$ | 0.01 | $ | 0.04 | ||
| 3rd Quarter |
$ | 0.01 | $ | 0.04 | ||
| 4th Quarter |
$ | 0.01 | $ | 0.04 | ||
The payment of dividends is a decision of our Board of Directors based upon then-existing circumstances, including our rate of growth, profitability, financial condition, existing and anticipated capital requirements, the amount of funds legally available for the payment of cash dividends, regulatory constraints and such other factors as the Board determines relevant. Also, during the period the Company was under TARP restrictions, between November 21, 2008 and September 30, 2009, the Company was under a further restriction prohibiting any quarterly cash dividend in excess of $0.04 per share. The source of funds for payment of dividends by our Holding Company is dividends received from our Banks, or excess cash available at the Holding Company level. Payments by our subsidiary Banks to our Holding Company are limited by law and regulations of the bank regulatory authorities. There are various statutory and contractual limitations on the ability of our Banks to pay dividends to our Holding Company. The bank regulatory agencies also have the general authority to limit the dividends paid by banks if such payment may be deemed to constitute an unsafe and unsound practice. Our subsidiaries may not pay dividends from their paid-in surplus. All dividends must be paid out of undivided profits then on hand, after deducting expenses, including reserves for losses and bad debts. In addition, a national bank is prohibited from declaring a dividend on its shares of common stock until its surplus equals its stated capital, unless there has been transferred to surplus no less than one/tenth of the bank’s net profits of the preceding two consecutive half-year periods (in the case of an annual dividend). The approval of the OCC is required if the total of all dividends declared by a national bank in any calendar year exceeds the total of its net profits for that year combined with its retained net profits for the preceding two years, less any required transfers to surplus. As to a state bank, no dividends may be paid at a time when the Bank’s net income from the preceding two years is a loss or which would cause the capital accounts of the Bank to fall below the minimum amount required by law, regulation, order or any written agreement with the Florida Office or a Federal regulatory agency.
22
Table of Contents
Share Repurchases
We did not repurchase any shares of our common stock during 2009.
Stock Plans
With respect to information regarding our securities authorized for issuance under equity incentive plans, the information contained in the section entitled “Equity Compensation Plan Information” in our Definitive Proxy Statement for the 2009 Annual Meeting of Shareholders is incorporated herein by reference.
Performance Graph
Shares of our common stock are traded on the NASDAQ Global Select Market. The following graph compares the yearly percentage change in cumulative shareholder return on the Company’s common stock, with the cumulative total return of the SNL Southeast Bank Index and the NASDAQ Bank Index, since December 31, 2004 (assuming a $100 investment on December 31, 2004 and reinvestment of all dividends).
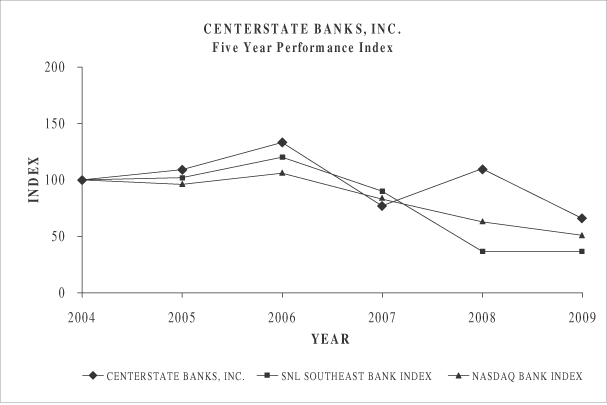
| 2004 | 2005 | 2006 | 2007 | 2008 | 2009 | |||||||
| CenterState Banks, Inc. |
100 | 109 | 133 | 77 | 110 | 66 | ||||||
| SNL Southeast Bank Index |
100 | 102 | 120 | 90 | 37 | 37 | ||||||
| NASDAQ Bank Index |
100 | 96 | 106 | 83 | 63 | 51 |
23
Table of Contents
| Item 6. | Selected Consolidated Financial Data |
The selected consolidated financial data presented below should be read in conjunction with management’s discussion and analysis of financial condition and results of operations, and the consolidated financial statements and footnotes thereto, of the Company at December 31, 2009 and 2008, and the three year period ended December 31, 2009, presented elsewhere herein.
Selected Consolidated Financial Data
For the twelve month period ending or as of December 31
| (Dollars in thousands except for share and per |
2009 | 2008 | 2007 | 2006 | 2005 | |||||||||||||||
| SUMMARY OF OPERATIONS: |
||||||||||||||||||||
| Total interest income |
$ | 73,944 | $ | 68,082 | $ | 75,173 | $ | 59,113 | $ | 40,266 | ||||||||||
| Total interest expense |
(22,290 | ) | (27,797 | ) | (32,825 | ) | (22,010 | ) | (11,722 | ) | ||||||||||
| Net interest income |
51,654 | 40,285 | 42,348 | 37,103 | 28,544 | |||||||||||||||
| Provision for loan losses |
(23,896 | ) | (6,520 | ) | (2,792 | ) | (717 | ) | (1,065 | ) | ||||||||||
| Net interest income after provision for loan losses |
27,758 | 33,765 | 39,556 | 36,386 | 27,479 | |||||||||||||||
| Non-interest income |
9,620 | 7,251 | 7,097 | 5,896 | 5,180 | |||||||||||||||
| Income from correspondent banking and bond sales division |
17,916 | 1,412 | — | — | — | |||||||||||||||
| Net gain (loss) on sale of securities available for sale |
2,516 | 661 | 7 | 17 | (3 | ) | ||||||||||||||
| Gain on sale of bank branch office real estate |
— | 1,483 | — | — | — | |||||||||||||||
| Sale of bank shell |
— | — | 1,000 | — | — | |||||||||||||||
| Impairment charge- core deposit intangible |
(1,200 | ) | — | — | — | — | ||||||||||||||
| Credit related expenses |
(4,553 | ) | (1,006 | ) | (76 | ) | — | — | ||||||||||||
| Non-interest expense |
(62,961 | ) | (38,930 | ) | (35,888 | ) | (28,981 | ) | (22,602 | ) | ||||||||||
| (Loss) income before income taxes |
(10,904 | ) | 4,636 | 11,696 | 13,318 | 10,054 | ||||||||||||||
| Income tax benefit (expense) |
4,687 | (1,215 | ) | (3,897 | ) | (4,859 | ) | (3,724 | ) | |||||||||||
| Net (loss) income |
$ | (6,217 | ) | $ | 3,421 | $ | 7,799 | $ | 8,459 | $ | 6,330 | |||||||||
| PER COMMON SHARE DATA: |
||||||||||||||||||||
| Basic (loss) earnings per share |
$ | (0.47 | ) | $ | 0.26 | $ | 0.64 | $ | 0.77 | $ | 0.68 | |||||||||
| Diluted (loss) earnings per share |
$ | (0.47 | ) | $ | 0.26 | $ | 0.63 | $ | 0.75 | $ | 0.66 | |||||||||
| Common equity per common share outstanding |
$ | 8.90 | $ | 12.22 | $ | 11.92 | $ | 10.54 | $ | 9.26 | ||||||||||
| Tangible common equity per common share outstanding |
$ | 7.53 | $ | 9.64 | $ | 9.28 | $ | 9.38 | $ | 8.77 | ||||||||||
| Dividends per common share |
$ | 0.07 | $ | 0.16 | $ | 0.15 | $ | 0.14 | $ | 0.13 | ||||||||||
| Actual shares outstanding |
25,773,229 | 12,474,315 | 12,436,407 | 11,129,020 | 10,500,772 | |||||||||||||||
| Weighted average common shares outstanding |
17,905,042 | 12,452,375 | 12,108,590 | 10,964,890 | 9,357,046 | |||||||||||||||
| Diluted weighted average common shares outstanding |
17,905,042 | 12,585,036 | 12,294,537 | 11,232,059 | 9,629,194 | |||||||||||||||
| BALANCE SHEET DATA: |
||||||||||||||||||||
| Assets |
$ | 1,751,299 | $ | 1,333,143 | $ | 1,217,430 | $ | 1,077,102 | $ | 871,521 | ||||||||||
| Total loans |
959,021 | 892,001 | 841,405 | 657,963 | 516,658 | |||||||||||||||
| Allowance for loan loss |
23,289 | 13,335 | 10,828 | 7,355 | 6,491 | |||||||||||||||
| Total deposits |
1,305,036 | 993,800 | 972,620 | 892,806 | 717,337 | |||||||||||||||
| Short-term borrowings |
195,501 | 141,183 | 75,646 | 52,792 | 42,811 | |||||||||||||||
| Corporate debenture |
12,500 | 12,500 | 12,500 | 10,000 | 10,000 | |||||||||||||||
| Preferred stockholders’ equity |
— | 26,787 | — | — | — | |||||||||||||||
| Common stockholders’ equity |
229,410 | 152,378 | 148,282 | 117,332 | 97,241 | |||||||||||||||
| Total stockholders’ equity |
229,410 | 179,165 | 148,282 | 117,332 | 97,241 | |||||||||||||||
| Tangible capital |
194,148 | 147,099 | 115,439 | 104,386 | 92,087 | |||||||||||||||
| Goodwill |
32,840 | 28,118 | 28,118 | 9,863 | 4,675 | |||||||||||||||
| Core deposit intangible (CDI) |
2,422 | 3,948 | 4,725 | 3,083 | 479 | |||||||||||||||
| Average total assets |
1,771,034 | 1,238,005 | 1,189,268 | 981,640 | 808,177 | |||||||||||||||
| Average loans |
923,080 | 856,260 | 791,886 | 605,236 | 482,819 | |||||||||||||||
| Average interest earning assets |
1,628,798 | 1,108,180 | 1,068,591 | 894,286 | 744,298 | |||||||||||||||
| Average deposits |
1,254,169 | 975,352 | 963,033 | 807,471 | 678,149 | |||||||||||||||
| Average interest bearing deposits |
1,047,436 | 823,121 | 775,282 | 610,732 | 496,046 | |||||||||||||||
| Average interest bearing liabilities |
1,346,051 | 923,591 | 854,251 | 670,562 | 544,663 | |||||||||||||||
| Average total stockholders’ equity |
206,914 | 154,521 | 138,425 | 109,794 | 78,037 | |||||||||||||||
24
Table of Contents
Selected Consolidated Financial Data—continued
For the twelve month period ending or as of December 31
| (Dollars in thousands except for share and per |
2009 | 2008 | 2007 | 2006 | 2005 | ||||||||||
| SELECTED FINANCIAL RATIOS: |
|||||||||||||||
| Return on average assets |
(0.35 | %) | 0.28 | % | 0.66 | % | 0.86 | % | 0.78 | % | |||||
| Return on average equity |
(3.00 | %) | 2.21 | % | 5.63 | % | 7.70 | % | 8.11 | % | |||||
| Dividend payout |
na | 58 | % | 23 | % | 18 | % | 19 | % | ||||||
| Efficiency (1) |
84 | % | 81 | % | 73 | % | 68 | % | 67 | % | |||||
| Net interest margin, tax equivalent basis (2) |
3.22 | % | 3.70 | % | 4.01 | % | 4.17 | % | 3.84 | % | |||||
| Net interest spread, tax equivalent basis (3) |
2.92 | % | 3.19 | % | 3.25 | % | 3.35 | % | 3.27 | % | |||||
| CAPITAL RATIOS: |
|||||||||||||||
| Tier 1 leverage ratio |
11.36 | % | 12.59 | % | 10.78 | % | 11.23 | % | 12.35 | % | |||||
| Risk-based capital |
|||||||||||||||
| Tier 1 |
17.99 | % | 16.17 | % | 13.80 | % | 15.60 | % | 18.10 | % | |||||
| Total |
19.25 | % | 17.43 | % | 14.97 | % | 16.60 | % | 19.23 | % | |||||
| Tangible common equity ratio |
11.31 | % | 9.25 | % | 9.75 | % | 9.81 | % | 10.63 | % | |||||
| ASSET QUALITY RATIOS: |
|||||||||||||||
| Net charge-offs to average loans |
1.51 | % | 0.47 | % | 0.12 | % | 0.08 | % | 0.05 | % | |||||
| Allowance to period end loans |
2.43 | % | 1.49 | % | 1.29 | % | 1.12 | % | 1.26 | % | |||||
| Allowance for loan losses to non-performing loans |
55 | % | 67 | % | 266 | % | 1,206 | % | 430 | % | |||||
| Non-performing assets to total assets |
3.05 | % | 1.86 | % | 0.40 | % | 0.06 | % | 0.18 | % | |||||
| OTHER DATA: |
|||||||||||||||
| Banking locations |
38 | 37 | 37 | 30 | 26 | ||||||||||
| Full-time equivalent employees |
478 | 399 | 371 | 320 | 275 | ||||||||||
| (1) | Efficiency ratio is non-interest expense divided by the sum of net interest income before the provision for loan losses plus non-interest income, exclusive of non-recurring items. |
| (2) | Net interest margin is net interest income divided by total average earning assets. |
| (3) | Net interest spread is the difference between the average yield on earning assets and the average yield on average interest bearing liabilities. |
25
Table of Contents
Quarterly Financial Information
The following table sets forth, for the periods indicated, certain consolidated quarterly financial information. This information is derived from our unaudited financial statements which include, in the opinion of management, all normal recurring adjustments which management considers necessary for a fair presentation of the results for such periods. The sum of the four quarters of earnings per share may not equal the total earnings per share for the full year due to rounding and due to the additional shares issued pursuant to our capital offering in August 2009. This information should be read in conjunction with our consolidated financial statements and the notes thereto included elsewhere in this document. The results for any quarter are not necessarily indicative of results for future periods.
Selected Quarterly Data
(unaudited)
(Dollars are in thousands)
| 2009 | 2008 | |||||||||||||||||||||||||||||||
| (Dollars in thousands except for per share data) |
4Q | 3Q | 2Q | 1Q | 4Q | 3Q | 2Q | 1Q | ||||||||||||||||||||||||
| Interest income |
$ | 18,144 | $ | 18,847 | $ | 18,906 | $ | 18,047 | $ | 16,429 | $ | 16,821 | $ | 16,866 | $ | 17,966 | ||||||||||||||||
| Interest expense |
(4,659 | ) | (5,022 | ) | (6,054 | ) | (6,555 | ) | (6,364 | ) | (6,445 | ) | (6,836 | ) | (8,152 | ) | ||||||||||||||||
| Net interest income |
13,485 | 13,825 | 12,852 | 11,492 | 10,065 | 10,376 | 10,030 | 9,814 | ||||||||||||||||||||||||
| Provision for loan losses |
(9,386 | ) | (8,682 | ) | (4,125 | ) | (1,703 | ) | (2,637 | ) | (1,764 | ) | (1,515 | ) | (604 | ) | ||||||||||||||||
| Net interest income after provision for loan losses |
4,099 | 5,143 | 8,727 | 9,789 | 7,428 | 8,612 | 8,515 | 9,210 | ||||||||||||||||||||||||
| Non-interest income |
2,792 | 2,649 | 2,204 | 1,975 | 1,934 | 1,810 | 1,750 | 1,757 | ||||||||||||||||||||||||
| Income from correspondent banking and bond sales division |
7,119 | 5,630 | 2,610 | 2,557 | 1,412 | — | — | — | ||||||||||||||||||||||||
| Gain on sale of bank branch office real estate |
— | — | — | — | — | — | 1,483 | — | ||||||||||||||||||||||||
| Securities gain (loss) |
1,538 | 257 | 303 | 418 | 426 | 197 | (6 | ) | 44 | |||||||||||||||||||||||
| Impairment charge on core deposit intangible |
(1,200 | ) | — | — | — | — | — | — | — | |||||||||||||||||||||||
| Non-interest expenses |
(21,005 | ) | (17,663 | ) | (15,145 | ) | (13,701 | ) | (11,356 | ) | (9,613 | ) | (9,560 | ) | (9,407 | ) | ||||||||||||||||
| (Loss) income before income tax |
(6,657 | ) | (3,984 | ) | (1,301 | ) | 1,038 | (156 | ) | 1,006 | 2,182 | 1,604 | ||||||||||||||||||||
| Income tax benefit (expense) |
2,630 | 1,754 | 569 | (266 | ) | 237 | (245 | ) | (714 | ) | (493 | ) | ||||||||||||||||||||
| Net (loss) income |
$ | (4,027 | ) | $ | (2,230 | ) | $ | (732 | ) | $ | 772 | $ | 81 | $ | 761 | $ | 1,468 | $ | 1,111 | |||||||||||||
| Basic (loss) earnings per common share |
$ | (0.16 | ) | $ | (0.17 | ) | $ | (0.09 | ) | $ | 0.03 | $ | (0.01 | ) | $ | 0.06 | $ | 0.12 | $ | 0.09 | ||||||||||||
| Diluted (loss) earnings per common share |
$ | (0.16 | ) | $ | (0.17 | ) | $ | (0.09 | ) | $ | 0.03 | $ | (0.01 | ) | $ | 0.06 | $ | 0.12 | $ | 0.09 | ||||||||||||
| Item 7. | Management’s Discussion and Analysis of Financial Condition and Results of Operations |
Some of the statements in this report constitute forward-looking statements, within the meaning of the Private Securities Litigation Reform Act of 1995 and the Securities Exchange Act of 1934. These statements related to future events, other future financial performance or business strategies, and include statements containing terminology such as “may,” “will,” “should,” “expects,” “scheduled,” “plans,” “intends,” “anticipates,” “believes,” “estimates,” “potential,” or “continue” or the negative of such terms or other comparable terminology. Actual events or results may differ materially from the results anticipated in these forward looking statements, due to a variety of factors, including, without limitation: the effects of future
26
Table of Contents
economic conditions; governmental monetary and fiscal policies, as well as legislative and regulatory changes; the risks of changes in interest rates and the level and composition of deposits, loan demand, and the values of loan collateral; and the effects of competition from other commercial banks, thrifts, consumer finance companies, and other financial institutions operating in our market area and elsewhere. All forward looking statements attributable to our Company are expressly qualified in their entirety by these cautionary statements. We disclaim any intent or obligation to update these forward looking statements, whether as a result of new information, future events or otherwise. There is no assurance that future results, levels of activity, performance or goals will be achieved.
Our discussion and analysis of earnings and related financial data are presented herein to assist investors in understanding the financial condition of our Company at December 31, 2009 and 2008, and the results of operations for the years ended December 31, 2009, 2008 and 2007. This discussion should be read in conjunction with the consolidated financial statements and related footnotes of our Company presented elsewhere herein. Historical per share data has been adjusted to reflect our May 2006 two for one stock split.
Executive Summary
Organizational structure
Our consolidated financial statements include the accounts of CenterState Banks, Inc. (the “Parent Company,” “Company,” “Corporate,” “CenterState” or “CSFL”), and our four wholly owned subsidiary banks, and their wholly owned subsidiary, CenterState Shared Services (“CSS”).
Our subsidiary banks operate through 38 locations in ten counties throughout Central Florida, providing traditional deposit and lending products and services to their commercial and retail customers. CSS is a wholly owned subsidiary of our subsidiary banks, which provides item processing services, human resource services, credit analyst services and information technology services for these subsidiary banks.
Through our subsidiary banks, we conduct commercial banking business consisting of attracting deposits from the general public and applying those funds to the origination of commercial, consumer and real estate loans (including commercial loans collateralized by real estate). Our profitability depends primarily on net interest income, which is the difference between interest income generated from interest-earning assets (i.e. loans and investments) less the interest expense incurred on interest-bearing liabilities (i.e. customer deposits and borrowed funds). Net interest income is affected by the relative amounts of interest-earning assets and interest-bearing liabilities, and the interest rate earned and paid on these balances. Net interest income is dependent upon the interest rate spread which is the difference between the average yield earned on our interest-earning assets and the average rate paid on our interest-bearing liabilities. The interest rate spread is impacted by interest rates, deposit flows, and loan demand. Additionally, and to a lesser extent, our profitability is affected by such factors as the level of non-interest income and expenses, the provision for credit losses, and the effective tax rate. Non-interest income consists primarily of service fees on deposit accounts and related services, and also includes commissions earned on bond sales, brokering single family home loans, sale of mutual funds, annuities and other non traditional and non insured investments. Non-interest expense consists of compensation, employee benefits, occupancy and equipment expenses, and other operating expenses.
We operate under a decentralized organizational structure. Each of our subsidiary banks is managed by its own bank president, who has the primary responsibility for the profitability and growth of the individual business unit. Each bank has its own charter, management team and board of directors, although most of the Company’s board directors are also board members of one or more of our subsidiary banks, and our Chairman is either the chairman or at least a board member of all our subsidiary banks. Except for the largest and/or riskier lending facilities, which require approval of a senior committee comprised of each subsidiary bank president and our CEO, each bank generally makes its own lending decisions. Although lending decisions are made at each bank, credit (loan) review is performed by Parent Company employees, who are independent of the loan origination
27
Table of Contents
process and of the individual banks. This system of checks and balances has worked well for us in the past, and is clearly being tested in this current economy and real estate market.
At December 31, 2009, our four subsidiary banks are operating an aggregate of 38 bank branch locations in ten Counties in Central Florida as summarized in the table below:
| Subsidiary Banks |
No. of locations |
Counties | ||
| CenterState Bank Central Florida, N.A. (“Central”) |
6 | Osceola, Orange | ||
| CenterState Bank, N.A. (“CSB/West”) |
11 | Pasco, Hernando, Citrus, Sumter, Lake | ||
| CenterState Bank of Florida (“CSB/Polk”) |
16 | Polk, Marion | ||
| Valrico State Bank (“VSB”) |
5 | Hillsborough |
Correspondent banking division
Through our lead subsidiary bank in Winter Haven, Florida, we have initiated a correspondent banking and bond sales division during the fourth quarter of 2008. This new business line was created by way of a management lift-out. We hired substantially all the employees (17) of the Royal Bank of Canada’s (“RBC”) bond sales division, who were previously employees of Alabama National Bank (“ALAB”) prior to RBC’s acquisition of ALAB. We augmented this group during July 2009 when we hired approximately 40 individuals who were prior employees of the failed Silverton Bank in Atlanta, Georgia.
The division operates out of leased facilities in Birmingham, Alabama and Atlanta, Georgia. The business lines are primarily divided into three inter-related revenue generating activities. The first, and largest, revenue generator is commissions earned on fixed income security sales. The second category includes: correspondent bank deposits (i.e. federal funds purchased); correspondent bank checking accounts; and loans to correspondent banks. The third, and smallest revenue generating category, includes fees from safe-keeping activities, bond accounting for correspondents, and asset/liability consulting related activities. The customer base includes small to medium size financial institutions primarily located in Florida, Georgia and Alabama, but will also include several other southeastern States.
Branching activities
We closed three small branches during 2009. The first one was closed March 31, 2009. It had been operating since 1996 and had total deposits of approximately $12 million. We sold the real estate and transferred the deposit and loan accounts to the nearest existing office. The other two were closed April 15, 2009. One operated from a leased facility since it opened in August 2007. It had less than $3 million in deposits. The other operated from a building owned by the Company since it opened in October 1998. It had approximately $10 million in deposits. We have the facility listed for sale. The deposit and loan accounts were transferred to other existing branches.
We did not open any new branches during 2009. However, we acquired four additional branches with $178 million of deposits pursuant to a FDIC assisted transaction on January 30, 2009. We purchased the deposits of the Ocala National Bank (“ONB”) from the FDIC for approximately $3 million, a premium of approximately 1.7%. Initially, we did not purchase any loans pursuant to this transaction, but subsequently we selected $18 million of loans included in the ONB loan portfolio, hand picked by our internal credit officers, which we purchased at par with no loss protection. ONB operated from four locations all within Ocala, Florida. Two were leased and two were owned. We subsequently purchased one of the leased locations, have agreed to purchase the two owned locations, and have entered into a short-term lease on the remaining leased location, while renovation is occurring at a new location which we have purchased, after which we will move the remaining leased facility to this new nearby location.
28
Table of Contents
Capital offering
During the third quarter of this year we raised additional capital through a public stock offering. We sold a total of 13,271,000 common shares at $6.50 per share. After investment banking fees and other expenses, the net increase to our common equity was approximately $81 million. At the time, this raise made us one of the strongest capitalized publicly traded bank in Florida. The purpose of the offering was partly defensive but primarily offensive in nature.
Although our credit metrics compare favorably to our peers in Florida, they were, and are, the worst we have ever seen compared to our own historical performance. We are in the greatest recession since the Great Depression. The real estate market is in crisis, especially in Florida, and approximately 84% of our loans are collateralized by real estate, primarily located in central Florida. Part of this capital raise was to mitigate against the effects of a continued challenging real estate market.
Sometimes the greatest opportunities can present themselves in a crisis. During 2009, 140 banks failed and were closed by the FDIC. We believe that the number will be significantly larger in 2010. We also believe that many of these bank failures will be in Florida, including those within or near our own market areas. We see a generational opportunity to potentially acquire several of these failed banks pursuant to FDIC assisted transactions including loss share arrangements. Raising this additional capital helps position ourselves to potentially take advantage of these future opportunities.
TARP issuance and subsequent repurchase
On November 21, 2008, as part of the Troubled Asset Relief Program (“TARP”) Capital Purchase Program, we issued and sold to the U.S. Department of the Treasury (the “Treasury”), (a) 27,875 shares (the “Preferred Shares”) of our Fixed Rate Cumulative Perpetual Preferred Stock, Series A, having a liquidation preference of $1,000 per share, and (b) a ten-year warrant (the “Warrant”) to purchase up to 250,825 shares of our voting common stock, par value $0.01 per share (“Common Stock”), at an exercise price of $16.67 per share.
For a detailed description of this program, what we agreed to do and what we received, refer to our Form 8-K filed on November 24, 2008, as well as our Form S-3 filed on December 17, 2008 and our 424B2 Prospectus filed on January 2, 2009. In summary, we issued 5% Cumulative Perpetual Preferred Stock along with a Warrant to purchase up to 250,825 shares of our common stock at an exercise price of $16.67 to the U.S. Department of Treasury, in exchange for $27,875,000 cash, which we received on November 21, 2008. The program provides that if an issuer raises qualifying equity capital (equal to $27,875,000 in the case of the Company) or more prior to December 31, 2009, half of the Warrant (125,412 shares in the case of the Company) will be cancelled.
On September 30, 2009, we repurchased the Preferred Shares issued pursuant to TARP, as described above. Also, because we raised qualifying common equity during 2009, as described previously, half of the 250,825 share Warrant was cancelled, pursuant to the TARP agreement. We purchased the remaining Warrant for 125,413 shares from Treasury for $212,000 on October 28, 2009.
Increase of authorized common shares
On December 15, 2009, a special shareholders meeting was held at which our shareholders voted to increase the number of common shares authorized from 40,000,000 to 100,000,000. Among the reasons for this increase in authorized shares was to allow for some flexibility in case a large FDIC assisted transaction presented itself, which might require us to raise some incremental capital specific to the transaction, and we had to act quickly.
Critical Accounting Policies
Our accounting policies are integral to understanding the results reported. Accounting policies are described in detail in Note 1 of the notes to the consolidated financial statements. The critical accounting policies require management’s judgment to ascertain the valuation of assets, liabilities, commitments and contingencies. We have
29
Table of Contents
established policies and control procedures that are intended to ensure valuation methods are well controlled and applied consistently from period to period. In addition, the policies and procedures are intended to ensure that the process for changing methodologies occurs in an appropriate manner. The following is a brief description of our current accounting policies involving significant management valuation judgments.
Allowance for Loan Losses
The allowance for loan losses represents our estimate of probable incurred losses inherent in the existing loan portfolio. The allowance for loan losses is increased by the provision for loan losses charged to expense and reduced by loans charged off, net of recoveries. The allowance for loan losses is determined based on our assessment of several factors: reviews and evaluation of individual loans, changes in the nature and volume of the loan portfolio, current economic conditions and the related impact on specific borrowers and industry concentrations, historical loan loss experiences and the level of classified and nonperforming loans.
Changes in the financial condition of individual borrowers, in economic conditions, in historical loss experience and in the condition of the various markets in which collateral may be sold may all affect the required level of the allowance for loan losses and the associated provision for loan losses.
A standardized loan grading system is utilized at each of our subsidiary banks. The grading system is integral to our risk assessment function related to lending. Loan officers of each bank assign a loan grade to their newly originated loans in accordance with the standard loan grades. Throughout the lending relationship, the loan officer is responsible for periodic reviews, and if warranted he/she will downgrade or upgrade a particular loan based on specific events and/or analyses. We use a loan grading system of 1 through 7. Grade 1 is “excellent” and grade 7 is “doubtful.” Loans graded 5 or higher are placed on a watch list each month end and reported to that particular bank’s board of directors. The Company’s loan review officer, who is independent of the lending function and is not an employee of any subsidiary bank, periodically reviews each bank’s loan portfolio and lending relationships. He may disagree with a particular bank’s grade on a particular loan and subsequently downgrade or upgrade such loan(s) based on his risk analysis. As such, our lending process is decentralized, but our credit review process is centralized.
Beginning in late 2007, the Company’s CEO initiated a new program referred to as “centercourt,” whereby all of our bank presidents and their chief lending officers are gathered together in one room along with our CEO, CFO, COO and Chief Loan Review officer. Each bank president and his chief lending officer present their prepared written report on the status of their bank’s loan portfolio. Past due, non accrual, impaired, potentially impaired, and loans in process of foreclosure, as well as OREO issues are presented and discussed. These meetings are generally held once per quarter. The objectives include early and quick identification and resolutions of potential loan losses, as well as sharing information and ideas between banks. The process also contributes to each bank’s allowance for loan loss analysis assumptions and preparation.
We maintain an allowance for loan losses that we believe is adequate to absorb probable incurred losses inherent in our loan portfolio. The allowance consists of two components. The first component consists of amounts specifically reserved (“specific allowance”) for specific loans identified as impaired, as defined by FASB Accounting Standards Codification No. 310 (“ASC 310”). Impaired loans are those loans that management has estimated will not repay as agreed upon. Each of these loans is required to have a written analysis supporting the amount of specific reserve allocated to the particular loan, if any. That is to say, a loan may be impaired (i.e. not expected to repay as agreed), but may be sufficiently collateralized such that we expect to recover all principle and interest eventually, and therefore no specific reserve is warranted.
The second component is a general reserve (“general allowance”) on all of the Company’s loans other than those identified as impaired. We group these loans into categories with similar characteristics and then apply a loss factor to each group which is derived from our historical loss factor for that category adjusted for current internal and external environmental factors, as well as for certain loan grading factors. The aggregate of these two components results in our total allowance for loan losses.
30
Table of Contents
Goodwill and Intangible Assets
Goodwill resulting from business combinations prior to January 1, 2009 represents the excess of the purchase price over the fair value of the net assets of businesses acquired. Goodwill resulting from business combinations after January 1, 2009, is generally determined as the excess of the fair value of the consideration transferred, plus the fair value of any noncontrolling interests in the acquiree, over the fair value of the net assets acquired and liabilities assumed as of the acquisition date. Goodwill and intangible assets acquired in a purchase business combination and determined to have an indefinite useful life are not amortized, but tested for impairment at least annually. The Company has selected November 30 as the date to perform the annual impairment test. Intangible assets with definite useful lives are amortized over their estimated useful lives to their estimated residual values. Goodwill is the only intangible asset with an indefinite life on our balance sheet.
Other intangible assets consist of core deposit intangible assets arising from whole bank and branch acquisitions. They are initially measure at the fair value and then amortized on an accelerated method over their estimated useful lives, generally 10 years.
Goodwill and intangible assets are described further in Note 8 of the notes to the consolidated financial statements.
COMPARISON OF RESULTS OF OPERATIONS FOR THE YEARS ENDED DECEMBER 31, 2009 AND DECEMBER 31, 2008.
Net Income
Our net loss for the year ended December 31, 2009 was $6,217,000 or $0.47 loss per share basic and diluted, compared to net income of $3,421,000, or $0.26 earnings per share basic and diluted for the year ended December 31, 2008.
The primary reasons for the decrease in 2009 earnings compared to 2008, was the increase in our loan loss provision ($23,896,000 versus $6,520,000), and an increase in our other credit related expenses ($4,553,000 versus $1,006,000), both of which were reflections of the continued deterioration of the real estate market in Florida specifically and the overall economy in general. These and other factors contributing to our 2009 net loss are discussed below.
Net Interest Income/Margin
Net interest income consists of interest income generated by earning assets, less interest expense.
Net interest income increased $11,369,000 or 28% to $51,654,000 during the year ended December 31, 2009 compared to $40,285,000 for the same period in 2008. The increase was the result of a $5,862,000 increase in interest income plus a $5,507,000 decrease in interest expense.
Interest earning assets averaged $1,628,798,000 during the year ended December 31, 2009 as compared to $1,108,180,000 for the same period in 2008, an increase of $520,618,000, or 47%. The yield on average interest earning assets decreased 160 basis points (“bps”) to 4.54% (162bps to 4.58% tax equivalent basis) during the year ended December 31, 2009, compared to 6.14% (6.20% tax equivalent basis) for the same period in 2008. The combined net effects of the $520,618,000 increase in average interest earning assets and the 160bps decrease in yield on average interest earning assets resulted in the $5,862,000 ($5,924,000 tax equivalent basis) increase in interest income between the two years.
Interest bearing liabilities averaged $1,346,051,000 during the year ended December 31, 2009 as compared to $923,591,000 for the same period in 2008, an increase of $422,460,000, or 46%. The cost of average interest bearing liabilities decreased 135bps to 1.66% during the year ended December 31, 2009, compared to 3.01% for the same period in 2008. The combined net effects of the $422,460,000 increase in average interest bearing
31
Table of Contents
liabilities and the 135bps decrease in cost of average interest bearing liabilities resulted in the $5,507,000 decrease in interest expense between the two years. See the tables “Average Balances – Yields & Rates,” and “Analysis of Changes in Interest Income and Expenses” below.
Average Balances(8)—Yields & Rates
(Dollars are in thousands)
| Years Ended December 31, | ||||||||||||||||||||
| 2009 | 2008 | |||||||||||||||||||
| Average Balance |
Interest Inc / Exp |
Average Rate |
Average Balance |
Interest Inc / Exp |
Average Rate |
|||||||||||||||
| ASSETS: |
||||||||||||||||||||
| Loans (1) (2) (7) |
$ | 923,080 | $ | 53,528 | 5.80 | % | $ | 856,260 | $ | 57,519 | 6.72 | % | ||||||||
| Securities available for sale—taxable |
475,160 | 18,436 | 3.88 | % | 154,270 | 7,822 | 5.07 | % | ||||||||||||
| Securities available for sale—tax exempt (7) |
36,634 | 2,098 | 5.73 | % | 38,070 | 2,060 | 5.41 | % | ||||||||||||
| Federal funds sold and other |
193,924 | 608 | 0.31 | % | 59,580 | 1,345 | 2.26 | % | ||||||||||||
| TOTAL INTEREST EARNING ASSETS |
$ | 1,628,798 | $ | 74,670 | 4.58 | % | $ | 1,108,180 | $ | 68,746 | 6.20 | % | ||||||||
| Allowance for loan losses |
(15,958 | ) | (11,750 | ) | ||||||||||||||||
| All other assets |
158,194 | 141,575 | ||||||||||||||||||
| TOTAL ASSETS |
$ | 1,771,034 | $ | 1,238,005 | ||||||||||||||||
| LIABILITIES & STOCKHOLDERS’ EQUITY |
||||||||||||||||||||
| Deposits: |
||||||||||||||||||||
| Now |
$ | 167,269 | $ | 849 | 0.51 | % | $ | 141,756 | $ | 953 | 0.67 | % | ||||||||
| Money market |
152,005 | 1,960 | 1.29 | % | 112,957 | 2,298 | 2.03 | % | ||||||||||||
| Savings |
119,768 | 1,197 | 1.00 | % | 67,215 | 733 | 1.09 | % | ||||||||||||
| Time deposits |
608,394 | 16,515 | 2.71 | % | 501,193 | 20,952 | 4.18 | % | ||||||||||||
| Repurchase agreements |
24,276 | 100 | 0.41 | % | 30,818 | 459 | 1.49 | % | ||||||||||||
| Other borrowed funds (3) |
261,839 | 1,196 | 0.46 | % | 57,152 | 1,584 | 2.77 | % | ||||||||||||
| Corporate debenture (4) |
12,500 | 473 | 3.78 | % | 12,500 | 818 | 6.54 | % | ||||||||||||
| TOTAL INTEREST BEARING LIABILITIES |
$ | 1,346,051 | $ | 22,290 | 1.66 | % | $ | 923,591 | $ | 27,797 | 3.01 | % | ||||||||
| Demand deposits |
206,733 | 152,231 | ||||||||||||||||||
| Other liabilities |
11,336 | 7,662 | ||||||||||||||||||
| Total stockholders’ equity |
206,914 | 154,521 | ||||||||||||||||||
| TOTAL LIABILITIES AND |
||||||||||||||||||||
| STOCKHOLDERS’ EQUITY |
$ | 1,771,034 | $ | 1,238,005 | ||||||||||||||||
| NET INTEREST SPREAD (tax equivalent basis) (5) |
2.92 | % | 3.19 | % | ||||||||||||||||
| NET INTEREST INCOME (tax equivalent basis) |
$ | 52,380 | $ | 40,949 | ||||||||||||||||
| NET INTEREST MARGIN (tax equivalent basis) (6) |
3.22 | % | 3.70 | % | ||||||||||||||||
| (1) | Loan balances are net of deferred origination fees and costs. Non accrual loans are included in total loan balances. |
32
Table of Contents
| (2) | Interest income on average loans includes loan fee recognition of $432 and $336 for the years ended December 31, 2009 and 2008, respectively. |
| (3) | Includes short-term (usually overnight) Federal Home Loan Bank advances, Federal Funds Purchased and correspondent bank deposits (Federal Funds Purchased). |
| (4) | Includes net amortization of origination costs and amortization of purchase accounting adjustment of ($19) and ($1) during year ended December 31, 2009 and 2008, respectively. |
| (5) | Represents the average rate earned on interest earning assets minus the average rate paid on interest bearing liabilities. |
| (6) | Represents net interest income divided by total earning assets. |
| (7) | Interest income and rates include the effects of a tax equivalent adjustment using applicable statutory tax rates to adjust tax exempt investment income on tax exempt investment securities and loans to a fully taxable basis. |
| (8) | Averages balances are average daily balances. |
Analysis of Changes in Interest Income and Expenses
(Dollars are in thousands)
| Net Change Dec 31, 2009 versus 2008 | ||||||||||||
| Volume | Rate | Net Change |
||||||||||
| INTEREST INCOME |
||||||||||||
| Loans (tax equivalent basis) |
$ | 4,266 | $ | (8,257 | ) | $ | (3,991 | ) | ||||
| Securities available for sale - taxable |
12,838 | (2,224 | ) | 10,614 | ||||||||
| Securities available for sale – tax exempt |
(79 | ) | 117 | 38 | ||||||||
| Federal funds sold and other |
1,143 | (1,880 | ) | (737 | ) | |||||||
| TOTAL INTEREST INCOME (tax equivalent basis) |
$ | 18,168 | $ | (12,244 | ) | $ | 5,924 | |||||
| INTEREST EXPENSE |
||||||||||||
| Deposits |
||||||||||||
| NOW accounts |
$ | 154 | $ | (258 | ) | $ | (104 | ) | ||||
| Money market accounts |
653 | (991 | ) | (338 | ) | |||||||
| Savings |
530 | (66 | ) | 464 | ||||||||
| Time deposits |
3,886 | (8,323 | ) | (4,437 | ) | |||||||
| Repurchase agreements |
(81 | ) | (278 | ) | (359 | ) | ||||||
| Other borrowed funds |
1,831 | (2,219 | ) | (388 | ) | |||||||
| Corporate debenture |
— | (345 | ) | (345 | ) | |||||||
| TOTAL INTEREST EXPENSE |
$ | 6,973 | $ | (12,480 | ) | $ | (5,507 | ) | ||||
| NET INTEREST INCOME (tax equivalent basis) |
$ | 11,195 | $ | 236 | $ | 11,431 | ||||||
The table above details the components of the changes in net interest income for the last two years. For each major category of interest earning assets and interest bearing liabilities, information is provided with respect to changes due to average volume and changes due to rates, with the changes in both volumes and rates allocated to these two categories based on the proportionate absolute changes in each category.
Provision for Loan Losses
The provision for loan losses (expense) increased $17,376,000, to $23,896,000 during the year ending December 31, 2009 compared to $6,520,000 for the comparable period in 2008. Our policy is to maintain the allowance for loan losses at a level sufficient to absorb probable incurred losses inherent in the loan portfolio. The allowance is increased by the provision for loan losses, which is a charge to current period earnings, and is
33
Table of Contents
decreased by charge-offs, net of recoveries on prior loan charge-offs. Therefore, the provision for loan losses (Income Statement effect) is a residual of management’s determination of allowance for loan losses (Balance Sheet approach). In determining the adequacy of the allowance for loan losses, we consider those levels maintained by conditions of individual borrowers, the historical loan loss experience, the general economic environment, the overall portfolio composition, and other information. As these factors change, the level of loan loss provision changes. See “credit quality and allowance for loan losses” regarding the allowance for loan losses for additional information.
Non-Interest Income
Non-interest income for the year ended December 31, 2009 was $30,052,000 compared to $10,807,000 for the comparable period in 2008. This increase was the result of the following components listed in the table below (amounts listed are in thousands of dollars).
| (in thousands of dollars) |
2009 | 2008 | $ increase (decrease) |
% Increase (decrease) |
||||||||||
| Service charges on deposit accounts |
$ | 5,450 | $ | 4,490 | $ | 960 | 2.1 | % | ||||||
| Commissions from bond sales |
17,916 | 1,412 | 16,504 | 1,168.8 | % | |||||||||
| Commissions from mortgage broker activities |
129 | 87 | 42 | 48.3 | % | |||||||||
| Commissions from sale of mutual funds and annuities |
532 | 503 | 29 | 5.8 | % | |||||||||
| Debit card and ATM fees |
1,341 | 1,075 | 266 | 24.7 | % | |||||||||
| Loan related fees |
452 | 402 | 50 | 12.4 | % | |||||||||
| BOLI income |
550 | 387 | 163 | 42.1 | % | |||||||||
| Trading securities revenue |
427 | — | 427 | n/a | ||||||||||
| Other service charges and fees |
660 | 320 | 340 | 106.2 | % | |||||||||
| Gain (loss) on sale or disposition of fixed assets |
79 | (13 | ) | 92 | 707.7 | % | ||||||||
| Gain on sale of securities |
2,516 | 661 | 1,855 | 280.6 | % | |||||||||
| Subtotal |
$ | 30,052 | $ | 9,324 | $ | 20,728 | 222.3 | % | ||||||
| Gain on sale of bank branch office real estate |
— | 1,483 | (1,483 | ) | n/a | |||||||||
| Total non-interest income |
$ | 30,052 | $ | 10,807 | $ | 19,245 | 178.1 | % | ||||||
We sold one of our branch office buildings on April 1, 2008 for $2,500,000 and simultaneously entered into an agreement to lease back the real estate for a period of one year with an option to renew the lease for an additional year. We recognized a pre-tax gain on the sale of approximately $1,483,000 during April. We did not renew the lease, and closed the office on March 31, 2009. We transferred all the loan and deposit accounts to one or more of our existing offices. See “Executive Summary” for a discussion on our branching activity including this sale.
We initiated a correspondent banking division during the fourth quarter of 2008. The primary revenue generator of this new business unit is bond sales to correspondent banks. During the fourth quarter of 2008, we recognized $1,412,000 of gross revenue from commissions on bond sales. During 2009 we recognized $17,916,000 of gross revenue from commissions on bond sales. See “Executive Summary” for further discussion relating to our new correspondent banking division.
We sold approximately $202,857,000 of securities available for sale during 2009, generating a net gain on sale of $2,516,000. During the previous year we sold approximately $38,034,000 of securities available for sale generating a net gain on sale of $661,000. The sales were a result of liquidity management and asset/liability management.
During the third quarter of 2009 we initiated a trading securities portfolio at our lead subsidiary bank. Realized and unrealized gains and losses are included in trading securities revenue, a component of our non interest income, included in the list above. Securities purchased for this portfolio have primarily been municipal securities and are held for short periods of time. During 2009 we purchased approximately $32,714,000 of
34
Table of Contents
securities for this portfolio and sold all of them before the end of the year recognizing a net gain on sale of approximately $427,000. At December 31, 2009, we did not own any securities in our trading portfolio. This activity was initiated to take advantage of market opportunities, when presented, for short term revenue gains.
Bank owned life insurance (“BOLI”) income is up year to year primarily due to the purchase of an additional $5,000,000 of BOLI early in 2009. Many of the other normal recurring related revenue items listed above have increased year to year due to our internally generated growth as well as our purchase of additional customer relationships related to the Ocala National Bank transaction in January 2009. Commissions from mortgage broker activities is dependent on market place forces including supply and demand of single family residential property in our local markets, and the interest rate environment which primarily effects refinancing activity. Sales of mutual funds and annuities are somewhat dependent on market place forces as well, but is also related to the successful efforts of our investment sales representatives. These commissions will fluctuate period to period.
Non-Interest Expense
Non-interest expense for the year ended December 31, 2009 increased $28,778,000, or 72.1%, to $68,714,000, compared to $39,936,000 for 2008. The table below breaks down the individual components. Amounts are in thousands of dollars.
| (in thousands of dollars) |
2009 | 2008 | $ increase (decrease) |
% Increase (decrease) |
|||||||||||
| Employee salaries and wages |
$ | 29,955 | $ | 17,172 | $ | 12,783 | 74.4 | % | |||||||
| Employee incentive/bonus compensation |
2,223 | 763 | 1,460 | 191.3 | % | ||||||||||
| Employee stock based compensation |
419 | 402 | 17 | 4.2 | % | ||||||||||
| Employer 401K matching contributions |
538 | 484 | 54 | 11.2 | % | ||||||||||
| Deferred compensation expense |
233 | 149 | 84 | 56.4 | % | ||||||||||
| Health insurance and other employee benefits |
1,869 | 1,743 | 126 | 7.2 | % | ||||||||||
| Payroll taxes |
1,714 | 1,209 | 505 | 41.8 | % | ||||||||||
| Other employee related expenses |
439 | 433 | 6 | 1.4 | % | ||||||||||
| Incremental direct cost of loan origination |
(720 | ) | (871 | ) | 151 | (17.3 | %) | ||||||||
| Total salaries, wages and employee benefits |
$ | 36,670 | $ | 21,484 | $ | 15,186 | 70.7 | % | |||||||
| Occupancy expense |
5,375 | 4,143 | 1,232 | 29.7 | % | ||||||||||
| Depreciation of premises and equipment |
2,882 | 2,590 | 292 | 11.3 | % | ||||||||||
| Supplies, stationary and printing |
848 | 743 | 105 | 14.1 | % | ||||||||||
| Marketing expenses |
1,910 | 1,359 | 551 | 40.5 | % | ||||||||||
| Data processing expense |
2,417 | 1,141 | 1,276 | 111.8 | % | ||||||||||
| Legal, auditing and other professional fees |
2,354 | 1,245 | 1,109 | 89.1 | % | ||||||||||
| Bank regulatory related expenses |
3,114 | 1,230 | 1,884 | 153.2 | % | ||||||||||
| Postage and delivery |
425 | 367 | 58 | 15.8 | % | ||||||||||
| ATM and debit card related expenses |
1,060 | 724 | 336 | 46.4 | % | ||||||||||
| CDI amortization |
792 | 777 | 15 | 1.9 | % | ||||||||||
| CDI impairment |
1,200 | — | 1,200 | — | % | ||||||||||
| Impairment of excess bank owned land held for sale |
939 | — | 939 | — | % | ||||||||||
| Loss on sale of repossessed real estate (“OREO”) |
772 | 51 | 721 | 1,413.7 | % | ||||||||||
| Valuation write down of repossessed real estate (“OREO”) |
2,188 | 434 | 1,754 | 404.1 | % | ||||||||||
| Loss on repossessed assets other than real estate |
544 | 125 | 419 | 335.2 | % | ||||||||||
| Foreclosure related expenses |
1,049 | 396 | 653 | 164.9 | % | ||||||||||
| Internet and telephone banking |
499 | 358 | 141 | 39.4 | % | ||||||||||
| Operational write-offs and losses |
225 | 291 | (66 | ) | (22.7 | %) | |||||||||
| Correspondent accounts and Federal Reserve charges |
319 | 263 | 56 | 21.3 | % | ||||||||||
| Conferences/Seminars/Education/Training |
392 | 223 | 169 | 75.8 | % | ||||||||||
| Director fees |
332 | 321 | 11 | 3.4 | % | ||||||||||
| Other expenses |
2,408 | 1,671 | 737 | 44.1 | % | ||||||||||
| Total non-interest expense |
$ | 68,714 | $ | 39,936 | $ | 28,778 | 72.1 | % | |||||||
35
Table of Contents
Overall, our non interest expenses increased significantly due to the growth in our business from the initiation of the correspondent banking business in Birmingham, Alabama (November 2008) and in Atlanta, Georgia (July 2009). See “Executive Summary” for a discussion relating to our new correspondent banking division. We also acquired four Ocala National Bank offices from the FDIC in January 2009. In addition to the added cost from growth, we also incurred substantially more credit related expenses this year compared to last year, due to the deterioration in real estate market. We also incurred an impairment charge relating to a core deposit intangible. Significant line items listed above are discussed in more detail below.
Our largest non interest expense is employee and employee related expenses. Total salaries, wages and employee benefits for 2009 accounted for 53% of our total non-interest expense, and 54% for 2008. Referring to the table above, employee salaries and wages increased by $12,783,000, or 74.4% to $29,955,000 for 2009, compared to $17,172,000 for 2008. The increase was primarily due to the correspondent banking division started in November 2008. The majority of employee salaries and wage expense from the correspondent banking division is related to commissions on bond sales, which is all variable based. The expense for 2009 was approximately $12,022,000 compared to $674,000 for 2008. The increase was due to a full year in 2009 versus two months for 2008 for the Birmingham office. The Atlanta office did not open until July 2009.
Excluding the correspondent banking division, discussed above, total salaries and wage expense was $17,933,000 for 2009 compared to $16,498,000 for 2008. This increase was due to the increase in full time equivalent employees (“FTEs”), excluding correspondent banking division. We closed three small branches during 2009, but acquired four larger branch offices in January 2009, which is the primary reason for the increase in FTEs, along with our internal growth. The table below summarizes the above discussion (in thousands of dollars).
| Year 2009 | Year 2008 | |||||||
| Employee salary and wages |
$ | 29,955 | $ | 17,172 | ||||
| Remove correspondent banking division salary and wages |
(12,022 | ) | (674 | ) | ||||
| Employee salary and wages, excluding correspondent banking division |
$ | 17,933 | $ | 16,498 | ||||
| Total average FTEs |
447.7 | 388.2 | ||||||
| Remove correspondent banking division average FTEs |
(38.1 | ) | (2.8 | ) | ||||
| Average FTEs excluding correspondent banking division |
409.6 | 385.4 | ||||||
| Cost per average FTE, excluding correspondent banking division |
$ | 44 | $ | 43 | ||||
We use a combination of performance incentive/bonus guidelines to motivate our employees to perform. These are primarily tied to earnings performance and growth metrics at each business unit. As our net income increases and our assets grow, our employee incentive/bonus compensation also increases. In addition, we also have incentive compensation programs tied to growth of core deposits for certain employee classes responsible for these types of deposit customer relationships. Although we reported a net loss for 2009 on a consolidated basis, two of our banks were profitable. In addition, our performance guidelines reward balance sheet growth as well, up to certain levels. As a result, several business units qualified for an incentive award. Approximately 80% of the $2,223,000 employee incentive/bonus compensation recognized during 2009 relates to our largest subsidiary bank, which is also our most profitable. The remaining 20% was dispersed among most of the remaining business units and several of the senior corporate officers. See our “Compensation Discussion and Analysis” in our current years’ Proxy Statement for a discussion of executive compensation.
During 2009 our occupancy expense increased by $1,232,000 (29.7%) and our depreciation expense increased by $292,000 (11.3%) compared to 2008. This increase was due to the correspondent banking
division which opened an office in Birmingham in November 2008 and in Atlanta in July 2009. In addition we acquired four larger bank branch offices in Ocala in January 2009 and closed three small ones in April 2009.
36
Table of Contents
Marketing expenses increased by $551,000, or 40.5% year to year. Most of this increase relates to the checking account marketing campaign which had previously been in place at one of our banks. That bank is continuing the program and our other three banks have started the program during various times in 2008. In addition to this program, the Company is also investing in another marketing effort related to the internet.
Data processing expenses increased by $1,276,000 (111.8%) during 2009 compared to 2008. This increase was primarily due to adding, converting and integrating our new correspondent banking division offices both in Birmingham and in Atlanta. These offices, with their Bloomberg terminals and other specialized IT equipment requirements are significantly more expensive than our average commercial bank branch office. However, in addition to converting these offices, we also converted four offices in Ocala which we purchased from the FDIC in January, after operating dual systems for almost four months during the conversion process.
The increase in the line item legal, accounting and other professional expenses was primarily due to monthly consulting fees paid relating to the correspondent banking business initiated during the fourth quarter of 2008, consulting fees paid for services relating to managing foreclosure and repossessed properties, outsourcing fees related to certain internal audit functions, and increases in legal fees associated with various lease negotiations, new and potentially new business lines and various regulatory issues.
We recognized a core deposit impairment charge related to deposits acquired in our 2006 acquisition of the former Mid Florida bank, now part of our CSNA bank. The transaction account balances have decayed faster than originally expected, and as such a write down in value was required.
We also recognized an impairment charge of $939,000 related to excess bank property held for sale. This property was not acquired as a result of foreclosed loans, but was purchased by the bank for future expansion, and in one case relates to a single family home purchased by the Company several years ago, at the then appraised value, as a result of moving one of our executive officers. Our intentions are to sell these parcels of land. During the last quarter of 2009, we obtained new appraisals and wrote the properties down to estimated market values based on these appraised values less estimated cost to sell.
Bank regulatory expenses, including deposit insurance expense, increased by $1,884,000, or 153.2% in 2009 compared to 2008. This increase was a result of increased deposit insurance premiums, which were a result of increased rates and growth in deposits, and a special assessment levied by the FDIC of approximately $800,000 during the second quarter of 2009. In December 2009, each of our banks were required to prepay a three year insurance premium, which in the aggregate is approximately $6,855,000 and is included in prepaid expenses and other assets in our Consolidated Balance Sheet.
Loss from the sale of repossessed real estate, loss from the write down in valuation of repossessed real estate and losses from other repossessed assets as well as foreclosure related expenses as a group was $4,553,000 during 2009 compared to $1,006,000 during 2008, resulting in an increase of $3,547,000, or 353%. The increase is reflective of the deterioration in the real estate market in central Florida and the economy in general.
Income Tax (Benefit)/Provision
We recognized an income tax benefit for the year ended December 31, 2009 of $4,687,000 (an effective tax rate of 43.0%) compared to an income tax provision (expense) of $1,215,000 (an effective tax rate of 26.2%) for the year ended December 31, 2008. The reason our current year’s effective tax rate was higher than our statutory tax rate is because we had substantial tax exempt income in excess of non deductible expenses thereby increasing our taxable loss substantially above our book loss as recorded in our Consolidated Statement of Operations. The primary reason for the difference in effective tax rates between the two years is that we went from a relative
37
Table of Contents
small pre-tax income amount in 2008 to a much larger pre-tax loss in 2009. The table below demonstrates this difference.
| Year 2009 | Year 2008 | ||||||
| (loss) income before provision for income taxes |
$(10,904) | $ | 4,636 | ||||
| net tax exempt income |
(1,551 | ) | (1,408 | ) | |||
| taxable (loss) income |
(12,455 | ) | 3,228 | ||||
| statutory income tax rates |
37.63 | % | 37.63 | % | |||
| income tax (benefit) provision |
$ (4,687) | $ | 1,215 | ||||
| effective tax rates |
43.0 | % | 26.2 | % | |||
COMPARISON OF RESULTS OF OPERATIONS FOR THE YEARS ENDED DECEMBER 31, 2008 AND DECEMBER 31, 2007.
Net Income
Our net income for the year ended December 31, 2008 was $3,421,000 or $0.26 per share basic and diluted, compared to $7,799,000 or $0.64 per share (basic) and $0.63 per share (diluted) for the year ended December 31, 2007.
The primary reasons for the decrease in 2008 net income compared to 2007, was the increase in our loan loss provision ($6,520,000 versus $2,792,000), which was a reflection of the continued deterioration of the real estate market in Florida specifically and the overall economy in general, and secondly, the decrease in our net interest income ($40,285,000 versus $42,348,000), which was caused by compression in our net interest margin (“NIM”). These and other factors contributing to the decrease in our 2008 net income compared to 2007 are discussed below.
Net Interest Income/Margin
Net interest income consists of interest income generated by earning assets, less interest expense.
Net interest income decreased $2,063,000 or 5% to $40,285,000 during the year ended December 31, 2008 compared to $42,348,000 for the same period in 2007. The decrease was the result of a $7,091,000 decrease in interest income less a $5,028,000 decrease in interest expense.
Interest earning assets averaged $1,108,180,000 during the year ended December 31, 2008 as compared to $1,068,591,000 for the same period in 2007, an increase of $39,589,000, or 4%. The yield on average interest earning assets decreased 89 basis points (“bps”) to 6.14% (89bps to 6.20% tax equivalent basis) during the year ended December 31, 2008, compared to 7.03% (7.09% tax equivalent basis) for the same period in 2007. The combined net effects of the $39,589,000 increase in average interest earning assets and the 89bps decrease in yield on average interest earning assets resulted in the $7,091,000 ($6,968,000 tax equivalent basis) decrease in interest income between the two years.
Interest bearing liabilities averaged $923,591,000 during the year ended December 31, 2008 as compared to $854,251,000 for the same period in 2007, an increase of $69,340,000, or 8%. The cost of average interest bearing liabilities decreased 83bps to 3.01% during the year ended December 31, 2008, compared to 3.84% for the same period in 2007. The combined net effects of the $69,340,000 increase in average interest bearing liabilities and the 83bps decrease in cost of average interest bearing liabilities resulted in the $5,028,000 decrease in interest expense between the two years.
38
Table of Contents
See the tables “Average Balances—Yields & Rates,” and “Analysis of Changes in Interest Income And Expenses” below.
Average Balances(8)—Yields & Rates
(Dollars are in thousands)
| Years Ended December 31, | ||||||||||||||||||||
| 2008 | 2007 | |||||||||||||||||||
| Average | Interest | Average | Average | Interest | Average | |||||||||||||||
| Balance | Inc / Exp | Rate | Balance | Inc / Exp | Rate | |||||||||||||||
| ASSETS: |
||||||||||||||||||||
| Loans (1) (2) (7) |
$ | 856,260 | $ | 57,519 | 6.72 | % | $ | 791,886 | $ | 61,971 | 7.83 | % | ||||||||
| Securities available for sale—taxable |
154,270 | 7,822 | 5.07 | % | 191,674 | 9,388 | 4.90 | % | ||||||||||||
| Securities available for sale—tax exempt (7) |
38,070 | 2,060 | 5.41 | % | 35,933 | 1,824 | 5.08 | % | ||||||||||||
| Federal funds sold and other |
59,580 | 1,345 | 2.26 | % | 49,098 | 2,531 | 5.15 | % | ||||||||||||
| TOTAL INTEREST EARNING ASSETS |
$ | 1,108,180 | $ | 68,746 | 6.20 | % | $ | 1,068,591 | $ | 75,714 | 7.09 | % | ||||||||
| Allowance for loan losses |
(11,750 | ) | (9,114 | ) | ||||||||||||||||
| All other assets |
141,575 | 129,791 | ||||||||||||||||||
| TOTAL ASSETS |
$ | 1,238,005 | $ | 1,189,268 | ||||||||||||||||
| LIABILITIES & STOCKHOLDERS’ EQUITY |
||||||||||||||||||||
| Deposits: |
||||||||||||||||||||
| Now |
$ | 141,756 | $ | 953 | 0.67 | % | $ | 125,468 | $ | 1,375 | 1.10 | % | ||||||||
| Money market |
112,957 | 2,298 | 2.03 | % | 114,457 | 3,314 | 2.90 | % | ||||||||||||
| Savings |
67,215 | 733 | 1.09 | % | 53,195 | 431 | 0.81 | % | ||||||||||||
| Time deposits |
501,193 | 20,952 | 4.18 | % | 482,162 | 23,570 | 4.89 | % | ||||||||||||
| Repurchase agreements |
30,818 | 459 | 1.49 | % | 58,329 | 2,582 | 4.43 | % | ||||||||||||
| Other borrowed funds (3) |
57,152 | 1,584 | 2.77 | % | 8,765 | 532 | 6.07 | % | ||||||||||||
| Corporate debenture (4) |
12,500 | 818 | 6.54 | % | 11,875 | 1,021 | 8.60 | % | ||||||||||||
| TOTAL INTEREST BEARING LIABILITIES |
$ | 923,591 | $ | 27,797 | 3.01 | % | $ | 854,251 | $ | 32,825 | 3.84 | % | ||||||||
| Demand deposits |
152,231 | 187,751 | ||||||||||||||||||
| Other liabilities |
7,662 | 8,841 | ||||||||||||||||||
| Total stockholders’ equity |
154,521 | 138,425 | ||||||||||||||||||
| TOTAL LIABILITIES AND |
||||||||||||||||||||
| STOCKHOLDERS’ EQUITY |
$ | 1,238,005 | $ | 1,189,268 | ||||||||||||||||
| NET INTEREST SPREAD (tax equivalent basis) (5) |
3.19 | % | 3.25 | % | ||||||||||||||||
| NET INTEREST INCOME (tax equivalent basis) |
$ | 40,949 | $ | 42,889 | ||||||||||||||||
| NET INTEREST MARGIN (tax equivalent basis) (6) |
3.70 | % | 4.01 | % | ||||||||||||||||
| (1) | Loan balances are net of deferred origination fees and costs. Non accrual loans are included in total loan balances. |
| (2) | Interest income on average loans includes loan fee recognition of $336 and $523 for the years ended December 31, 2008 and 2007, respectively. |
39
Table of Contents
| (3) | Includes short-term (usually overnight) Federal Home Loan Bank advances, Federal Funds Purchased and correspondent bank deposits (Federal Funds Purchased). |
| (4) | Includes net amortization of origination costs and amortization of purchase accounting adjustment of ($1) and $16 during year ended December 31, 2008 and 2007, respectively. |
| (5) | Represents the average rate earned on interest earning assets minus the average rate paid on interest bearing liabilities. |
| (6) | Represents net interest income divided by total earning assets. |
| (7) | Interest income and rates include the effects of a tax equivalent adjustment using applicable statutory tax rates to adjust tax exempt investment income on tax exempt investment securities and loans to a fully taxable basis. |
| (8) | Average balances are average daily balances. |
Analysis of Changes in Interest Income and Expenses
(Dollars are in thousands)
| Net Change Dec 31, 2008 versus 2007 | ||||||||||||
| Volume | Rate | Net Change |
||||||||||
| INTEREST INCOME |
||||||||||||
| Loans (tax equivalent basis) |
$ | 4,778 | $ | (9,230 | ) | $ | (4,452 | ) | ||||
| Securities available for sale—taxable |
(1,887 | ) | 321 | (1,566 | ) | |||||||
| Securities available for sale—tax exempt |
112 | 124 | 236 | |||||||||
| Federal funds sold and other |
457 | (1,643 | ) | (1,186 | ) | |||||||
| TOTAL INTEREST INCOME (tax equivalent basis) |
$ | 3,460 | $ | (10,428 | ) | $ | (6,968 | ) | ||||
| INTEREST EXPENSE |
||||||||||||
| Deposits |
||||||||||||
| NOW accounts |
$ | 161 | $ | (583 | ) | $ | (422 | ) | ||||
| Money market accounts |
(43 | ) | (973 | ) | (1,016 | ) | ||||||
| Savings |
131 | 171 | 302 | |||||||||
| Time deposits |
901 | (3,519 | ) | (2,618 | ) | |||||||
| Repurchase agreements |
(882 | ) | (1,241 | ) | (2,123 | ) | ||||||
| Other borrowed funds |
1,484 | (432 | ) | 1,052 | ||||||||
| Corporate debenture |
41 | (244 | ) | (203 | ) | |||||||
| TOTAL INTEREST EXPENSE |
$ | 1,793 | $ | (6,821 | ) | $ | (5,028 | ) | ||||
| NET INTEREST INCOME (tax equivalent basis) |
$ | 1,667 | $ | (3,607 | ) | $ | (1,940 | ) | ||||
The table above details the components of the changes in net interest income for the last two years. For each major category of interest earning assets and interest bearing liabilities, information is provided with respect to changes due to average volume and changes due to rates, with the changes in both volumes and rates allocated to these two categories based on the proportionate absolute changes in each category.
Provision for Loan Losses
The provision for loan losses (expense) increased $3,728,000, to $6,520,000 during the year ending December 31, 2008 compared to $2,792,000 for the comparable period in 2007. Our policy is to maintain the allowance for loan losses at a level sufficient to absorb probable incurred losses inherent in the loan portfolio. The allowance is increased by the provision for loan losses, which is a charge to current period earnings, and is decreased by charge-offs, net of recoveries on prior loan charge-offs. Therefore, the provision for loan losses (Income Statement effect) is a residual of management’s determination of allowance for loan losses (Balance
40
Table of Contents
Sheet approach). In determining the adequacy of the allowance for loan losses, we consider those levels maintained by conditions of individual borrowers, the historical loan loss experience, the general economic environment, the overall portfolio composition, and other information. As these factors change, the level of loan loss provision changes. See “credit quality and allowance for loan losses” regarding the allowance for loan losses for additional information.
Non-Interest Income
Non-interest income for the year ended December 31, 2008 was $10,807,000 compared to $8,104,000 for the comparable period in 2007. This increase was the result of the following components listed in the table below (amounts listed are in thousands of dollars).
| (in thousands of dollars) |
2008 | 2007 | $ increase (decrease) |
% Increase (decrease) |
|||||||||||
| Service charges on deposit accounts |
$ | 4,490 | $ | 4,436 | $ | 54 | 1.2 | % | |||||||
| Commissions from bond sales |
1,412 | — | 1,412 | n/a | |||||||||||
| Commissions from mortgage broker activities |
87 | 187 | (100 | ) | (53.5 | %) | |||||||||
| Commissions from sale of mutual funds and annuities |
503 | 586 | (83 | ) | (14.2 | %) | |||||||||
| Debit card and ATM fees |
1,075 | 905 | 170 | 18.8 | % | ||||||||||
| Loan related fees |
402 | 381 | 21 | 5.5 | % | ||||||||||
| BOLI income |
387 | 353 | 34 | 9.6 | % | ||||||||||
| Other service charges and fees |
320 | 269 | 51 | 19.0 | % | ||||||||||
| (Loss) on sale or disposition of fixed assets |
(13 | ) | (20 | ) | 7 | 35.0 | % | ||||||||
| Gain on sale of securities |
661 | 7 | 654 | 9,342.9 | % | ||||||||||
| Subtotal |
$ | 9,324 | $ | 7,104 | $ | 2,220 | 31.3 | % | |||||||
| Gain on sale of bank branch office real estate |
1,483 | — | 1,483 | n/a | |||||||||||
| Sale of bank charter |
— | 1,000 | (1,000 | ) | n/a | ||||||||||
| Total non-interest income |
$ | 10,807 | $ | 8,104 | $ | 2,703 | 33.4 | % | |||||||
We sold one of our branch office buildings on April 1, 2008 for $2,500,000 and simultaneously entered into an agreement to lease back the real estate for a period of one year with an option to renew the lease for an additional year. We recognized a pre-tax gain on the sale of approximately $1,483,000 during April. We did not renew the lease, and closed the office on March 31, 2009. We transfered all the loan and deposit accounts to one or more of our existing offices. See “Executive Summary” for a discussion on our branching activity including this sale.
The Parent Company and two of its subsidiary banks, (CenterState Bank West Florida, N.A. (“CSWFL”) and CenterState Bank Mid Florida (“Mid FL”)), Atlantic Southern Financial Group, Inc. (a Georgia Corporation) and it’s wholly owned subsidiary, Atlantic Southern Bank (collectively referred to as “Atlantic Southern”) entered into several related agreements (the “Transaction”) which closed on November 30, 2007. In summary, a description of the Transaction is as follows: CSWFL effectively purchased substantially all the assets and assumed the liabilities of Mid FL, except for the Mid FL main office (a leased office) and a minimum amount of deposits and capital required by banking laws. Atlantic Southern then acquired Mid FL, through a merger. Atlantic Southern paid to the Company an amount equal to the remaining amount of capital of Mid FL (after the sale (transfer) by Mid FL of its assets and liabilities to CSWFL) plus an additional amount of $1,000,000. Atlantic Southern then transferred Mid FL’s main office to CSWFL. The Company recognized a gain on the sale of $1,000,000 (included in non interest income) less transaction expenses of approximately $100,000. Transaction expenses are included in non interest expense. The Company continues to operate the same locations operated by CSWFL and Mid FL, except we are now operating these locations under one charter instead of two. All customer loan and deposit accounts/relationships have been retained by the Company. Following the Transaction, CSWFL changed its name to CenterState Bank, N.A.
41
Table of Contents
We acquired VSB on April 2, 2007, and, as such, we recognized nine months of non interest income generated by VSB in 2007 compared to twelve months in 2008. The difference between the two years related to the three months equates to approximately $200,000.
We initiated a correspondent banking division during the fourth quarter of 2008. The primary revenue generator of this new business unit is bond sales to correspondent banks. During the fourth quarter of 2008, we recognized $1,412,000 of gross revenue from commissions on bond sales. See “Executive Summary” for further discussion relating to our new correspondent banking division.
We sold approximately $38,000,000 of securities available for sale during 2008, generating a net gain on sale of $661,000. The sales were a result of liquidity management and asset/liability management.
Commissions from mortgage broker activities is dependent on market place forces including supply and demand of single family residential property in our local markets, and the interest rate environment which primarily effects refinancing activity. As the residential real estate market in Florida deteriorated, activity decreased, resulting in decreased commissions earned in 2008 compared to 2007.
Sales of mutual funds and annuities are somewhat dependent on market place forces, but primarily dependent on the successful efforts of our investment sales representatives. These commissions will fluctuate period to period.
42
Table of Contents
Non-Interest Expense
Non-interest expense for the year ended December 31, 2008 increased $3,972,000, or 11.0%, to $39,936,000, compared to $35,964,000 for 2007. The table below breaks down the individual components. Amounts are in thousands of dollars.
| (in thousands of dollars) |
2008 | 2007 | $ increase (decrease) |
% Increase (decrease) |
|||||||||||
| Employee salaries and wages |
$ | 17,172 | $ | 14,825 | $ | 2,347 | 15.8 | % | |||||||
| Employee incentive/bonus compensation |
763 | 1,501 | (738 | ) | (49.2 | %) | |||||||||
| Employee stock option expense |
402 | 509 | (107 | ) | (21.0 | %) | |||||||||
| Employer 401K matching contributions |
484 | 450 | 34 | 7.6 | % | ||||||||||
| Deferred compensation expense |
137 | — | 137 | — | % | ||||||||||
| Health insurance and other employee benefits |
1,743 | 2,266 | (523 | ) | (23.1 | %) | |||||||||
| Payroll taxes |
1,209 | 1,120 | 89 | 7.9 | % | ||||||||||
| Other employee related expenses |
445 | 390 | 55 | 14.1 | % | ||||||||||
| Incremental direct cost of loan origination |
(871 | ) | (1,034 | ) | 163 | 15.8 | % | ||||||||
| Total salaries, wages and employee benefits |
$ | 21,484 | $ | 20,027 | $ | 1,457 | 7.3 | % | |||||||
| Occupancy expense |
4,143 | 3,966 | 177 | 4.5 | % | ||||||||||
| Depreciation of premises and equipment |
2,590 | 2,305 | 285 | 12.4 | % | ||||||||||
| Supplies, stationary and printing |
743 | 690 | 53 | 7.7 | % | ||||||||||
| Marketing expenses |
1,359 | 1,096 | 263 | 24.0 | % | ||||||||||
| Data processing expense |
1,141 | 1,452 | (311 | ) | (21.4 | %) | |||||||||
| Legal, auditing and other professional fees |
1,245 | 1,101 | 144 | 13.1 | % | ||||||||||
| Bank regulatory related expenses |
1,230 | 468 | 762 | 162.8 | % | ||||||||||
| Postage and delivery |
367 | 308 | 59 | 19.2 | % | ||||||||||
| ATM and debit card related expenses |
724 | 667 | 57 | 8.5 | % | ||||||||||
| CDI amortization |
777 | 842 | (65 | ) | (7.7 | %) | |||||||||
| Loss on sale of repossessed real estate (“OREO”) |
51 | 5 | 46 | 920.0 | % | ||||||||||
| Valuation write down of repossessed real estate (“OREO”) |
434 | — | 434 | — | % | ||||||||||
| Loss on repossessed assets other than real estate |
125 | 2 | 123 | 6,150.0 | % | ||||||||||
| Foreclosure related expenses |
396 | 69 | 327 | 473.9 | % | ||||||||||
| Internet and telephone banking |
358 | 283 | 75 | 26.5 | % | ||||||||||
| Operational write-offs and losses |
291 | 314 | (23 | ) | (7.3 | %) | |||||||||
| Correspondent accounts and Federal Reserve charges |
263 | 259 | 4 | 1.5 | % | ||||||||||
| Conferences/Seminars/Education/Training |
223 | 199 | 24 | 12.1 | % | ||||||||||
| Director fees |
321 | 245 | 76 | 31.0 | % | ||||||||||
| Other expenses |
1,671 | 1,666 | 5 | 0.3 | % | ||||||||||
| Total non-interest expense |
$ | 39,936 | $ | 35,964 | $ | 3,972 | 11.0 | % | |||||||
We acquired VSB on April 2, 2007, and, as such, we recognized nine months of non-interest expense generated by VSB in 2007, compared to twelve months in 2008. Three months of operating expenses at VSB equates to approximately $1,400,000. Although we did not open any new branches in 2008, we did initiate a new correspondent banking division in Birmingham, Alabama during the fourth quarter of 2008. See “Executive Summary” for our discussion relating to our new correspondent banking division. The most significant expense related to this new division was compensation related expenses during November and December of 2008. These will be included in our compensation analysis below.
Our largest non-interest expense is employee and employee related expenses. Total salaries, wages and employee benefits for 2008 accounted for 54% of our total non-interest expense, compared to 56% for 2007. Looking at the table above, employee salaries and wages increased by $2,347,000, or 15.8% to $17,172,000 for
43
Table of Contents
2008, compared to $14,825,000 for 2007. The increase was due to (1) a 7% increase in average FTEs (“full time equivalent employees) year to year (388.2 versus 362.3), which was a result of twelve months of VSB in 2008 versus nine months in 2007, as well as adding some additional employees late in the year relating to our correspondent banking division, in addition to three of our newest branches were not opened for the entire year in 2007, but were in 2008, and (2) an 8% increase in our average salary expense per FTE year to year ($44,235 versus $40,919), which was due to adding higher compensated employees to our employee mix, as well as normal salary increases.
We use a combination of performance incentive/bonus guidelines to motivate our employees to perform. These are primarily all tied to earnings performance and growth metrics. As our net income increases and our assets grow, our employee incentive/bonus compensation also increases. In addition, we also have incentive compensation programs tied to growth of core deposits for certain employee classes responsible for these types of deposit customer relationships. As indicated in the table above, our incentive/bonus compensation expense for 2008 was $763,000, which represents a 49.2% decrease compared to $1,501,000 recorded in 2007. Comparing our 2008 financial results to 2007, our net income is less by 54% and our average assets year to year grew by 4%. Most of 2008 incentive/bonus compensation (approximately 77%) relates to two of our four banks. See our “Compensation Discussion and Analysis” in our current years’ Proxy Statement for a discussion of executive compensation.
We have been aggressively attempting to lower our employee health insurance costs since 2007. Effective October 1, 2007, we changed insurance company and third party administrators, and effective January 1, 2008, we initiated a Health Savings Account plan (“HSA”), as well as other consumer driven initiatives. The results of our efforts is reflected in the $523,000 decrease in health insurance and other employee benefits expense during 2008, compared to 2007, a 23.1% decrease.
During 2008 our occupancy expense increased by $177,000 (4.5%) and our depreciation expense increased by $285,000 (12.4%) compared to 2007. Most of this increase was due to our 2007 acquisition of VSB. VSB’s occupancy and depreciation expense was included in our consolidated financial statements for nine months during 2007 compared to twelve months in 2008. We also added three new branches which were not operating during the entire year of 2007 but were for the entire year in 2008. We moved one of our newer branches (pre 2007) from its temporary location to a newly constructed building in the beginning of 2008, and lastly we increased depreciation expense relative to the data processing equipment purchases that were made in late 2007 and early 2008 pursuant to converting our IT to an in-house solution.
As shown in the non-interest expense table above, marketing expenses increased by $263,000, or 24% year to year. Most of this increase relates to the checking account marketing campaign which had previously been in place at one of our banks. That bank is continuing the program and our other three have started the program during various times in 2008.
Data processing expense decrease $311,000 (21.4%) during 2008 compared to 2007. Beginning in December 2007 and ending in February 2008, we converted each of our banks’ core processing to in-house data processing solutions. This conversion was responsible for the decrease in this expense item year to year.
Bank regulatory expenses, including deposit insurance expense, increased by $762,000, or 162.8% in 2008 compared to 2007. The banking regulatory authorities began increasing their charges to our banks during the first quarter of 2008. Given the current banking environment, these charges could continue to increase further into the foreseeable future.
Loss on repossessed real estate and other assets as well as foreclosure related expenses as a group was $1,006,000 during 2008 compared to $76,000 during 2007, resulting in an increase of $930,000, or 1,234%. The increase is reflective of the real estate environment in central Florida and the economy in general.
44
Table of Contents
Income Tax Provision
The income tax provision for the year ended December 31, 2008, was $1,215,000, an effective tax rate of 26.2%, as compared to $3,897,000 for the year ended December 31, 2007, an effective tax rate of 33.3%. In 2009, we had more tax exempt interest income from tax exempt securities than last year, which is a decreasing effect on our effective tax rate. We also had more Bank Owned Life Insurance (“BOLI”) income this year than last year, which is also tax exempt and also results in a decreasing effect on our effect tax rate. In addition, we also had less stock option expense in 2008 relating to incentive stock options which are not tax deductible expenses, resulting in a decreasing effect on our effective tax rate. Because of our low taxable income this year compared to last year, our marginal federal tax was 34% in 2008 compared to 35% in the previous year. Lastly, in addition to having more tax exempt income in 2008 compared to 2007 in absolute terms, it resulted in a larger effect on our effective tax rate because we we’re working off a significantly lower taxable income number. Income taxes are described and discussed further in Note 14 of our notes to our consolidated financial statements.
COMPARISON OF BALANCE SHEETS AT DECEMBER 31, 2009 AND DECEMBER 31, 2008
Overview
Our total assets grew by $418,156,000, or 31%, from $1,333,143,000 at December 31, 2008 to $1,751,299,000 at December 31, 2009. The increase in our total assets was funded primarily by our growth in correspondent bank deposits (federal funds purchased), our acquisition of deposits related to the FDIC assisted transaction of a failed bank in Ocala, Florida, and our public stock offering this past summer.
Securities
We account for our investments at fair value and classify them as available for sale, except for trading securities. Unrealized holding gains and losses are included as a separate component of shareholders’ equity, net of the effect of deferred income taxes.
If our management intends to sell or it is more likely than not it will be required to sell the security before recovery of its amortized cost basis, less any current period credit loss, the other than temporary impairment (“OTTI”) shall be recognized in earnings equal to the entire difference between the investment’s amortized cost basis and its fair value at the balance sheet date. If our management does not intend to sell the security and it is not more likely than not that we will be required to sell the security before recovery of its amortized cost basis less any current period loss, the OTTI shall be separated into the amount representing the credit loss and the amount related to all other factors. The amount of the total OTTI related to the credit loss is determined based on the present value of cash flows expected to be collected and is recognized in earnings. The amount of the total OTTI related to other factors is recognized in other comprehensive income, net of applicable taxes. The previous amortized cost basis less the OTTI recognized in earnings becomes the new amortized cost basis of the investment. The assessment of whether an OTTI decline exists involves a high degree of subjectivity and judgment and is based on the information available to management at a point in time.
Our available for sale portfolio totaled $463,186,000 at December 31, 2009 and $252,080,000 at December 31, 2008, or 26% and 19%, respectively, of total assets. See the tables below for a summary of security type, maturity and average yield distributions.
We use our security portfolio primarily as a source of liquidity and a base from which to pledge assets for repurchase agreements and public deposits. When our liquidity position exceeds expected loan demand, other investments are considered as a secondary earnings alternative. Typically, we remain short-term in our decision to invest in certain securities. As these investments mature, they will be used to meet cash needs or will be reinvested to maintain a desired liquidity position. We have designated all of our securities as available for sale, except our trading portfolio, to provide flexibility, in case an immediate need for liquidity arises. We believe the composition of the portfolio offers flexibility in managing our liquidity position and interest rate sensitivity, without adversely impacting our regulatory capital levels. The available for sale portfolio is carried at fair market
45
Table of Contents
value and had a net unrealized gain of approximately $11,502,000 at December 31, 2009, compared to a net unrealized gain of approximately $2,695,000 at December 31, 2008.
We invest primarily in direct obligations of the United States, obligations guaranteed as to the principal and interest by the United States, mortgage backed securities, municipal securities and obligations of agencies of the United States. The Federal Reserve Bank and the Federal Home Loan Bank also require equity investments to be maintained by us, which are shown separately in our consolidated balance sheet.
The tables below summarize the maturity distribution of securities, weighted average yield by range of maturities, and distribution of securities for the periods provided (dollars are in thousands).
| One year or less |
Over one through five years |
Over five through ten years |
Over ten years | Total | ||||||||||||||||||||||||||
| $ | % | $ | % | $ | % | $ | % | $ | % | |||||||||||||||||||||
| AVAILABLE-FOR-SALE |
||||||||||||||||||||||||||||||
| US government agencies |
$ | 3,562 | 4.49 | % | $ | 1,015 | 5.29 | % | $ | 4,043 | 5.21 | % | $ | 9,290 | 5.03 | % | $ | 17,910 | 4.98 | % | ||||||||||
| State, county, & municipal |
789 | 3.20 | % | 3,661 | 4.05 | % | 6,830 | 3.93 | % | 24,216 | 4.06 | % | 35,496 | 4.02 | % | |||||||||||||||
| Mortgage-backed securities |
7,791 | 4.03 | % | 218,587 | 4.16 | % | 102,291 | 4.43 | % | 81,111 | 4.76 | % | 409,780 | 4.35 | % | |||||||||||||||
| Total |
$ | 12,142 | 4.12 | % | $ | 223,263 | 4.17 | % | $ | 113,164 | 4.43 | % | $ | 114,617 | 4.63 | % | $ | 463,186 | 4.35 | % | ||||||||||
Distribution of Investment Securities
(Dollars are in thousands)
| December 31, 2009 | December 31, 2008 | December 31, 2007 | ||||||||||||||||
| Amortized Cost |
Fair Value |
Amortized Cost |
Fair Value |
Amortized Cost |
Fair Value | |||||||||||||
| AVAILABLE-FOR-SALE |
||||||||||||||||||
| US treasury securities |
$ | — | $ | — | $ | 1,001 | $ | 1,028 | $ | 3,001 | $ | 3,038 | ||||||
| US government agencies |
17,826 | 17,910 | 23,031 | 23,597 | 39,771 | 40,498 | ||||||||||||
| State, county, & municipal |
35,376 | 35,496 | 37,134 | 35,472 | 38,325 | 38,182 | ||||||||||||
| Mortgage-backed securities |
398,482 | 409,780 | 188,219 | 191,983 | 117,202 | 117,716 | ||||||||||||
| Total |
$ | 451,684 | $ | 463,186 | $ | 249,385 | $ | 252,080 | $ | 198,299 | $ | 199,434 | ||||||
Beginning in 2009, we initiated a trading securities portfolio at our lead subsidiary bank. For this portfolio, realized and unrealized gains and losses are included in trading securities revenue, a component of non interest income in our Consolidated Statement of Operations. Securities purchased for this portfolio have primarily been municipal securities and are held for short periods of time. During 2009 we purchased approximately $32,714,000 of securities for this portfolio and sold all of them before the end of the year recognizing a net gain on sale of approximately $427,000. At December 31, 2009, we did not own any securities in our trading portfolio. This activity was initiated to take advantage of market opportunities, when presented, for short term revenue gains.
Loans
Lending-related income is the most important component of our net interest income and is a major contributor to profitability. The loan portfolio is the largest component of earning assets, and it therefore generates the largest portion of revenues. The absolute volume of loans and the volume of loans as a percentage of earning assets is an important determinant of net interest margin as loans are expected to produce higher yields
46
Table of Contents
than securities and other earning assets. Average loans during the year ended December 31, 2009, were $923,080,000, or 57% of average earning assets, as compared to $856,260,000, or 77% of average earning assets, for the year ending December 31, 2008. Total loans, net of unearned fees and cost, at December 31, 2009 and 2008 were $959,021,000 and $892,001,000, respectively, an increase of $67,020,000, or 8%. This represents a loan to total asset ratio of 55% and 67% and a loan to deposit ratio of 73% and 90%, at December 31, 2009 and 2008, respectively.
Approximately 84% of our loan portfolio is collateralized by real estate, 10% are commercial non real estate loans and the remaining 6% are consumer non real estate loans. The loans collateralized by real estate are further delineated as follows.
Residential real estate loans: These are single family home loans originated within our local market areas by employee loan officers. We do not use loan brokers to originate loans for our own portfolio, nor do we acquire loans outside of our geographical markets. The size of this portfolio is $251,634,000 representing approximately 26% of our total loans. Within this category there are approximately $9,508,000 non performing (non accrual) loans (64 loans) as of December 31, 2009.
Commercial real estate loans: This is the largest category ($438,540,000) of our loan portfolio representing approximately 46% of total loans. This category, along with commercial non real estate lending, is our primary business. There is no significant concentration by type of property in this category but there is a geographical concentration such that the properties are all located in central Florida. The borrowers are a mix of professionals, doctors, lawyers, and other small business people. Approximately 56% of these loans are owner occupied. Within this category there are approximately $21,178,000 non performing (non accrual) loans (43 loans) as of December 31, 2009.
Construction, development and land loans: We have no construction or development loans with national builders. We do business with local builders and developers that have typically been long time customers. This category represents approximately 12% ($115,937,000) of our total loan portfolio. The majority of this amount, approximately 87%, is land development, lots, and other land loans. The remaining amount, approximately 13%, represents vertical construction and the majority of that (approximately 75%) is commercial construction. Within the total of this category ($115,937,000) there are approximately $10,735,000 non performing (non accrual) loans (42 loans) as of December 31, 2009. Of these 42 non accrual loans, 39 loans ($9,085,000) are collateralized by residential building lots, commercial building lots, undeveloped land and vacant land both residential and commercial. Of the remaining three loans, there are two speculative single family home loans ($427,000) and one which covers several properties including a warehouse and commercial buildings ($1,223,000).
Loan concentrations are considered to exist where there are amounts loaned to multiple borrowers engaged in similar activities, which collectively could be similarly impacted by economic or other conditions and when the total of such amounts would exceed 25% of total capital. Due to the lack of diversified industry and the relative proximity of markets served, we have concentrations in geographic as well as in types of loans funded.
47
Table of Contents
The tables below provide a summary of the loan portfolio composition and maturities for the periods provided below.
Loan Portfolio Composition
(Dollars are in thousands)
Types of Loans
| at December 31: |
2009 | 2008 | 2007 | 2006 | 2005 | |||||||||||||||
| Real estate loans: |
||||||||||||||||||||
| Residential |
$ | 251,634 | $ | 223,290 | $ | 209,186 | $ | 180,869 | $ | 148,090 | ||||||||||
| Commercial |
438,540 | 434,488 | 385,669 | 291,536 | 219,094 | |||||||||||||||
| Construction, development, land |
115,937 | 92,475 | 108,615 | 60,950 | 36,352 | |||||||||||||||
| Total real estate loans |
806,111 | 750,253 | 703,470 | 533,355 | 403,536 | |||||||||||||||
| Commercial |
98,273 | 80,523 | 78,231 | 68,948 | 63,475 | |||||||||||||||
| Consumer and other loans |
55,376 | 61,939 | 60,687 | 56,684 | 50,413 | |||||||||||||||
| Total loans – gross |
959,760 | 892,715 | 842,388 | 658,987 | 517,424 | |||||||||||||||
| Less: unearned fees/costs |
(739 | ) | (714 | ) | (983 | ) | (1,024 | ) | (766 | ) | ||||||||||
| Total loans |
959,021 | 892,001 | 841,405 | 657,963 | 516,658 | |||||||||||||||
| Less: allowance for loan losses |
(23,289 | ) | (13,335 | ) | (10,828 | ) | (7,355 | ) | (6,491 | ) | ||||||||||
| Total loans, net |
$ | 935,732 | $ | 878,666 | $ | 830,577 | $ | 650,608 | $ | 510,167 | ||||||||||
The repayment of loans is a source of additional liquidity for our Company. The following table sets forth the loans maturing within specific intervals at December 31, 2009.
Loan Maturity Schedule
(Dollars are in thousands)
| December 31, 2009 | ||||||||||||
| 0 – 12 Months |
1 – 5 Years |
Over 5 Years |
Total | |||||||||
| All loans other than construction, development, land |
$ | 210,807 | $ | 401,423 | $ | 231,593 | $ | 843,823 | ||||
| Real estate – construction, development, land |
61,683 | 45,077 | 9,177 | 115,937 | ||||||||
| Total |
$ | 272,490 | $ | 446,500 | $ | 240,770 | $ | 959,760 | ||||
| Fixed interest rate |
$ | 96,998 | $ | 311,107 | $ | 107,792 | $ | 515,897 | ||||
| Variable interest rate |
175,492 | 135,393 | 132,978 | 443,863 | ||||||||
| Total |
$ | 272,490 | $ | 446,500 | $ | 240,770 | $ | 959,760 | ||||
The information presented in the above table is based upon the contractual maturities of the individual loans, including loans which may be subject to renewal at their contractual maturity. Renewal of such loans is subject to review and credit approval, as well as modification of terms upon their maturity. Consequently, management believes this treatment presents fairly the maturity structure of the loan portfolio. See “Liquidity and Market Risk Management” for a discussion regarding the repricing structure of the loan portfolio.
Credit Quality and Allowance for Loan Losses
We maintain an allowance for loan losses that we believe is adequate to absorb probable incurred losses inherent in our loan portfolio. The allowance is increased by the provision for loan losses, which is a charge to current period earnings and decreased by loan charge-offs net of recoveries of prior period loan charge-offs. Loans are charged against the allowance when management believes collection of the principal is unlikely.
48
Table of Contents
The allowance consists of two components. The first component consists of amounts reserved for impaired loans, as defined by ASC 310. Impaired loans are those loans that management has estimated will not repay as agreed upon. Each of these loans is required to have a written analysis supporting the amount of specific reserve allocated to the particular loan, if any. That is to say, a loan may be impaired (i.e. not expected to repay as agreed), but may be sufficiently collateralized such that we expect to recover all principle and interest eventually, and therefore no specific reserve is warranted.
The second component is a general reserve on all of the Company’s loans other than those identified as impaired. We group these loans into five general categories with similar characteristics as listed below:
Residential real estate loans
Commercial real estate loans
Construction, development, land loans
Commercial loans (not collateralized by real estate)
Consumer and all other loans (not collateralized by real estate)
Within our five general categories, we also delineate further into sub-categories where appropriate. We then apply an adjusted loss factor to each group of loans to determine the total amount of this second component of our allowance for loan losses. The adjusted loss factor for each category of loans is a derivative of our historical loss factor for that category, adjusted for current internal and external environmental factors, as well as for certain loan grading factors. The environmental factors that we consider are listed below.
We consider changes in the levels of and trends in past due loans, non-accrual loans and impaired loans, and the volume and severity of adversely classified or graded loans. Also, we consider changes in the value of underlying collateral for collateral-dependent loans.
We consider levels of and trends in charge-offs and recoveries.
We consider changes in the nature and volume of the portfolio and in the terms of loans.
We consider changes in lending policies, procedures and practices, including changes in underwriting standards and collection, charge-off, and recovery practices not considered elsewhere in estimating credit losses. We also consider changes in the quality of our loan review system.
We consider changes in the experience, ability, and depth of our lending management and other relevant staff.
We consider changes in international, national, regional, and local economic and business conditions and developments that affect the collectibility of the portfolio, including the condition of various market segments (national and local economic trends and conditions).
We consider the effect of other external factors such as competition and legal and regulatory requirements on the level of estimated credit losses in our existing portfolio (industry conditions).
We consider the existence and effect of any concentrations of credit, and changes in the level of such concentrations.
49
Table of Contents
In the table below we have shown the two components, as discussed above, of our allowance for loan losses at December 31, 2009 and 2008.
| December 31, | increase (decrease) | ||||||||||
| (amounts are in thousands of dollars) |
2009 | 2008 | |||||||||
| Impaired loans |
$ | 78,948 | $ | 24,191 | $ | 54,948 | |||||
| Component 1 (specific allowance) |
4,612 | 1,799 | 2,813 | ||||||||
| Specific allowance as percentage of impaired loans |
5.84 | % | 7.44 | % | (160)bps | ||||||
| Total loans other than impaired loans |
880,073 | 867,810 | 12,072 | ||||||||
| Component 2 (general allowance) |
18,677 | 11,536 | 7,141 | ||||||||
| General allowance as percentage of non impaired loans |
2.12 | % | 1.33 | % | 79bps | ||||||
| Total loans |
959,021 | 892,001 | 67,020 | ||||||||
| Total allowance for loan losses |
23,289 | 13,335 | 9,954 | ||||||||
| Allowance for loan losses as percentage of total loans |
2.43 | % | 1.49 | % | 94bps | ||||||
During 2009, we observed increasing trends in our loan delinquencies and non-accrual loans. We also observed a degradation of real estate values nationally in general, and within Florida specifically. We believe the changes in these trends differ significantly enough from historical trends such that we have increased our general allowance risk factors.
As shown in the table above, our allowance for loan losses (“ALLL”) as a percentage of total loans outstanding was 2.43% at December 31, 2009 and 1.49% at December 31, 2008. Our ALLL increased by $9,954,000 during this twelve month period. Of this amount, $7,141,000 relates to an increase in our Component 2, or general allowance, which is due to changes in this component’s risk factors, as discussed above, and the growth in the loan portfolio.
The remaining $2,813,000 increase is due to an increase in our Component 1, or specific allowance. This Component is the result of specific allowance analyses prepared for each of our impaired loans.
We are committed to the early recognition of problems and to maintaining a sufficient allowance. We believe our allowance for loan losses at December 31, 2009 was adequate.
50
Table of Contents
The table below sets forth the activity in the allowance for loan losses for the periods presented.
Activity in Allowance for Loan Losses
(Dollars are in thousands)
| 2009 | 2008 | 2007 | 2006 | 2005 | ||||||||||||||||
| Balance, beginning of year |
$ | 13,335 | $ | 10,828 | $ | 7,355 | $ | 6,491 | $ | 5,685 | ||||||||||
| Loans charged-off: |
||||||||||||||||||||
| Commercial |
(830 | ) | (856 | ) | (206 | ) | (368 | ) | (225 | ) | ||||||||||
| Real estate mortgage |
(12,900 | ) | (2,697 | ) | (386 | ) | (131 | ) | — | |||||||||||
| Consumer |
(353 | ) | (636 | ) | (405 | ) | (99 | ) | (134 | ) | ||||||||||
| Total loans charged-off |
(14,083 | ) | (4,189 | ) | (997 | ) | (598 | ) | (359 | ) | ||||||||||
| Recoveries on loans previously charged-off: |
||||||||||||||||||||
| Commercial |
29 | 14 | 1 | 53 | 52 | |||||||||||||||
| Real estate mortgage |
65 | 95 | 16 | 9 | 31 | |||||||||||||||
| Consumer |
47 | 67 | 44 | 36 | 17 | |||||||||||||||
| Total loan recoveries |
141 | 176 | 61 | 98 | 100 | |||||||||||||||
| Net loans charged-off |
(13,942 | ) | (4,013 | ) | (936 | ) | (500 | ) | (259 | ) | ||||||||||
| Provision for loan losses charged to expense |
23,896 | 6,520 | 2,792 | 717 | 1,065 | |||||||||||||||
| Acquisition of Mid FL |
— | — | — | 647 | — | |||||||||||||||
| Acquisition of VSB |
— | — | 1,617 | — | — | |||||||||||||||
| Balance, end of year |
$ | 23,289 | $ | 13,335 | $ | 10,828 | $ | 7,355 | $ | 6,491 | ||||||||||
| Total loans at year end |
$ | 959,021 | $ | 892,001 | $ | 841,405 | $ | 657,963 | $ | 516,658 | ||||||||||
| Average loans outstanding |
$ | 923,080 | $ | 856,260 | $ | 791,886 | $ | 605,236 | $ | 482,819 | ||||||||||
| Allowance for loan losses to total loans at year end |
2.43 | % | 1.49 | % | 1.29 | % | 1.12 | % | 1.26 | % | ||||||||||
| Net charge-offs to average loans outstanding |
1.51 | % | 0.47 | % | 0.12 | % | 0.08 | % | 0.05 | % | ||||||||||
Non performing loans consist of non accrual loans and loans past due 90 days or more and still accruing interest. Non performing assets consist of non-performing loans plus (a) OREO (i.e. real estate acquired through foreclosure or deed in lieu of foreclosure); and (b) other repossessed assets that is not real estate. We place loans on non accrual status when they are past due 90 days and management believes the borrower’s financial condition, after giving consideration to economic conditions and collection efforts, is such that collection of interest is doubtful. When we place a loan on non-accrual status, interest accruals cease and uncollected interest is reversed and charged against current income. Subsequent collections reduce the principal balance of the loan until the loan is returned to accrual status or interest is recognized only to extent received in cash.
51
Table of Contents
The largest component of non performing loans is non accrual loans, which as of December 31, 2009 totaled $42,059,000 (171 loans). This amount is further delineated by loan category as follows:
| Non accrual loans at 12/31/09 (in thousands of dollars) |
Aggregate loan amounts |
% of non accrual by category |
Number of loans | |||||
| Residential real estate |
$ | 9,508 | 23 | % | 64 | |||
| Commercial real estate |
21,178 | 50 | % | 43 | ||||
| Construction, development, land |
10,735 | 25 | % | 42 | ||||
| Commercial |
424 | 1 | % | 10 | ||||
| Consumer and other |
214 | 1 | % | 12 | ||||
| Total |
$ | 42,059 | 100 | % | 171 | |||
The other component of non performing loans are loans past due greater than 90 days and still accruing interest. At December 31, 2009 there were seven loans in this category with a total aggregate balance of approximately $282,000.
OREO at December 31, 2009 was $10,196,000, which represented twenty-one single family homes ($2,654,000), fifty-eight residential lots ($1,927,000), one commercial building lot ($138,000), ten commercial buildings ($3,283,000), seven mobile homes with land ($276,000), nine parcels of unimproved land ($1,693,000), and nine mixed properties ($225,000).
At December 31, 2009 repossessed assets other than real estate consisted of seventeen mobile homes, a small boat, a RV and other equipment with an aggregate balance of $915,000.
Non performing loans as of December 31, 2009, increased $22,428,000 or 113% to $42,341,000, compared to $19,913,000 as of December 31, 2008. Non-performing loans, as a percentage of total loans at December 31, 2009 and December 31, 2008, were 4.42% and 2.23%, respectively.
Total non performing assets as of December 31, 2009, increased $28,617,000 or 115% to $53,452,000, compared to $24,835,000 as of December 31, 2008. Non-performing assets, as a percentage of total assets at December 31, 2009 and December 31, 2008, were 3.05% and 1.86%, respectively.
The increases in non performing loans and non performing assets are a reflection of the real estate market in Florida and the overall economy in general.
Interest income not recognized on non-accrual loans was approximately $974,000, $490,000 and $78,000 for the years ended December 31, 2009, 2008 and 2007, respectively.
52
Table of Contents
The table below summarizes non performing loans and assets for the periods provided.
Non Performing Loans and Non Performing Assets
(Dollars are in thousands)
| December 31, | ||||||||||||||||||||
| 2009 | 2008 | 2007 | 2006 | 2005 | ||||||||||||||||
| Non accrual loans |
$ | 42,059 | $ | 19,863 | $ | 3,797 | $ | 448 | $ | 852 | ||||||||||
| Past due loans 90 days or more and still accruing interest |
282 | 50 | 277 | 162 | 658 | |||||||||||||||
| Total non performing loans |
42,341 | 19,913 | 4,074 | 610 | 1,510 | |||||||||||||||
| Repossessed real estate (“OREO”) |
10,196 | 4,494 | 583 | — | — | |||||||||||||||
| Repossessed assets other than real estate |
915 | 428 | 170 | 35 | 39 | |||||||||||||||
| Total non performing assets |
$ | 53,452 | $ | 24,835 | $ | 4,827 | $ | 645 | $ | 1,549 | ||||||||||
| Total non performing loans as a percentage of total loans |
4.42 | % | 2.23 | % | 0.48 | % | 0.09 | % | 0.29 | % | ||||||||||
| Total non performing assets as a percentage of total assets |
3.05 | % | 1.86 | % | 0.40 | % | 0.06 | % | 0.18 | % | ||||||||||
| Allowance for loan losses as a percentage of non performing loans |
55 | % | 67 | % | 266 | % | 1,206 | % | 430 | % | ||||||||||
Management considers a loan to be impaired when it is probable that we will not be repaid as agreed pursuant to the contractual terms of the loan agreement. Once the loan has been identified as impaired, a written analysis is performed to determine if there is a potential for a loss. If it is probable that a loss may occur, a specific reserve for that particular loan is then recognized, and the loan is placed on non accrual status and included in non performing loans. If the analysis indicates that a loss is not probable, then no specific reserve is recognized and if the loan is still accruing, it is not included in non performing loans.
Loans that are monitored for impairment pursuant to ASC 310 generally include commercial, commercial real estate, land, acquisition & development of land, and construction loans greater than $250,000. Smaller homogeneous loans, such as single family first and second mortgages, consumer loans, and small business and commercial related loans are not generally subject to impairment monitoring pursuant to ASC 310, but are analyzed for potential losses based on historical loss factors, current environmental factors and to some extent loan grading.
Relationship between impaired loans and trouble debt restructure (“TDRs”). In this current real estate crisis that the Nation in general and Florida in particular has been experiencing, it has become more common to restructure or modify the terms of certain loans under certain conditions. In certain circumstances it may be more beneficial to restructure the terms of a loan and work with the borrower for the benefit of both parties, versus forcing the property into foreclosure and having to dispose of it in an unfavorable and depressed real estate market. When we have modified the terms of a loan, we usually reduce the monthly payment for generally about twelve months. We have approximately $26,499,000 of TDRs. Of this amount $14,517,000 are performing pursuant to their modified terms, and $11,982,000 are not performing and have been placed on non accrual status and included in our non performing loans (“NPLs”).
Current accounting standards require TDRs to be included in our impaired loans, whether they are performing or not performing. Only non performing TDRs are included in our NPLs. The table below summarizes our impaired loans and TDRs for the periods provided.
53
Table of Contents
Impaired Loans and Troubled Debt Restructure (“TDRs”)
(Dollars are in thousands)
| December 31, | |||||||||||||||
| 2009 | 2008 | 2007 | 2006 | 2005 | |||||||||||
| Performing TDRs |
$ | 14,517 | $ | — | $ | — | $ | — | $ | — | |||||
| Non performing TDRs |
11,982 | — | — | — | — | ||||||||||
| Total TDRs |
$ | 26,499 | $ | — | $ | — | $ | — | $ | — | |||||
| Impaired loans that are not TDRs |
$ | 52,449 | $ | 24,191 | $ | 11,803 | $ | 4,986 | $ | 6,346 | |||||
| Impaired loans that are TDRs |
26,499 | — | — | — | — | ||||||||||
| Recorded investment in impaired loans |
$ | 78,948 | $ | 24,191 | $ | 11,803 | $ | 4,986 | $ | 6,346 | |||||
| Allowance for loan losses related to impaired loans |
$ | 4,612 | $ | 1,799 | $ | 812 | $ | 372 | $ | 1,017 | |||||
Interest income recognized on impaired loans was approximately $1,731,000, $867,000 and $492,000 for the years ended December 31, 2009, 2008 and 2007, respectively. The average recorded investment in impaired loans during 2009, 2008 and 2007 were $42,962,000, $19,526,000 and $6,094,000, respectively.
We are continually analyzing our loan portfolio in an effort to recognize and resolve our problem assets as quickly and efficiently as possible. While we believe we use the best information available at the time to make a determination with respect to the allowance for loan losses, we recognize that many factors can adversely impact various segments of our markets, and subsequent adjustments in the allowance may be necessary if future economic indications or other factors differ from the assumptions used in making the initial determination or if regulatory policies change. We continuously focus our attention on promptly identifying and providing for potential problem loans, as they arise. The table below summarizes our loans past due greater than 30 days and less than 90 days for the periods presented. Dollars are in thousands.
| December 31 | ||||||||||||||||||||
| 2009 | 2008 | 2007 | 2006 | 2005 | ||||||||||||||||
| past due loans 30-89 days |
$ | 12,237 | $ | 19,346 | $ | 9,399 | $ | 2,821 | $ | 5,782 | ||||||||||
| as percentage of total loans |
1.28 | % | 2.17 | % | 1.12 | % | 0.43 | % | 1.12 | % | ||||||||||
Although the total allowance for loan losses is available to absorb losses from all loans, management allocates the reserve among loan portfolio categories for informational and regulatory reporting purposes. Regulatory examiners may require us to recognize additions to the allowance based upon the regulators’ judgments about the information available to them at the time of their examination, which may differ from our judgments about the allowance for loan losses.
54
Table of Contents
While no portion of the allowance is in any way restricted to any individual loan or group of loans, and the entire allowance is available to absorb losses from any and all loans, the following table summarizes our allocation of allowance for loan losses by loan category and loans in each category as a percentage of total loans, for the periods presented. Dollar amounts are in thousands.
| December 31, | ||||||||||||||||||
| 2009 | 2008 | 2007 | ||||||||||||||||
| Real estate loans: |
||||||||||||||||||
| Residential |
$ | 5,827 | 26 | % | $ | 2,390 | 25 | % | $ | 1,441 | 25 | % | ||||||
| Commercial |
9,378 | 46 | % | 6,268 | 49 | % | 5,202 | 46 | % | |||||||||
| Construction, development, land |
4,882 | 12 | % | 2,058 | 10 | % | 1,636 | 13 | % | |||||||||
| Total real estate loans |
20,087 | 84 | % | 10,716 | 84 | % | 8,279 | 84 | % | |||||||||
| Commercial loans |
2,023 | 10 | % | 1,726 | 9 | % | 1,413 | 9 | % | |||||||||
| Consumer and other loans |
1,169 | 6 | % | 892 | 7 | % | 929 | 7 | % | |||||||||
| Unallocated |
10 | 1 | 207 | |||||||||||||||
| Total |
$ | 23,289 | 100 | % | $ | 13,335 | 100 | % | $ | 10,828 | 100 | % | ||||||
| December 31, | ||||||||||||
| 2006 | 2005 | |||||||||||
| Real estate loans: |
||||||||||||
| Residential |
$ | 998 | 28 | % | $ | 992 | 29 | % | ||||
| Commercial |
2,969 | 44 | % | 2,888 | 42 | % | ||||||
| Construction, development, land |
1,213 | 9 | % | 435 | 7 | % | ||||||
| Total real estate loans |
5,180 | 81 | % | 4,315 | 78 | % | ||||||
| Commercial loans |
1,271 | 10 | % | 1,303 | 12 | % | ||||||
| Consumer and other loans |
904 | 9 | % | 841 | 10 | % | ||||||
| Unallocated |
— | 32 | ||||||||||
| Total |
$ | 7,355 | 100 | % | $ | 6,491 | 100 | % | ||||
Bank Premises and Equipment
Bank premises and equipment was $62,368,000 at December 31, 2009 compared to $61,343,000 at December 31, 2008, an increase of $1,025,000 or 2%. The increase is the result of purchases and construction costs totaling approximately $6,606,000 less $2,882,000 of depreciation expense, $2,639,000 of land transferred out to held for sale and $60,000 in asset sales/disposals.
We operate from 38 banking locations in ten central Florida Counties. We lease six of these locations, own 30 and have purchase agreements on the other two. In addition to our banking locations, we lease non banking office space in Birmingham, Alabama and in Atlanta, Georgia, both are used by our correspondent banking division.
We also own excess bank real estate held for sale. This property was not acquired as a result of foreclosed loans, but was purchased by the bank for future expansion, and in one case relates to a single family home purchased by the Company several years ago, at the then appraised value, as a result of moving one of our executive officers. Our intentions are to sell these parcels of land. During the last quarter of 2009, we obtained new appraisals and wrote the properties down to estimated market values less selling expenses based on the recent appraisals. In the aggregate, the net market value of these assets were $2,368,000 at December 31, 2009 and is included in prepaid expenses and other assets in our the Consolidated Balance Sheet.
55
Table of Contents
Deposits
Total deposits increased $311,236,000, or 31%, to $1,305,036,000 as of December 31, 2009, compared to $993,800,000 at December 31, 2008. Average deposit balances for the year 2009 compared to 2008 increased by 28.6%. The growth in deposits was due to our acquisition of the Ocala National Bank branches from the FDIC, checking accounts from our correspondent bank customers and internally generated growth. We believe the value of our franchise is our core deposit customers and as such this is where we focus our marketing efforts. We initiated and/or continued various incentive programs as well as other marketing efforts focusing on core deposit (defined as non time deposit accounts) growth. Between December 31, 2009 and December 31, 2008, our core deposits increased by $227,622,000, or 45%. Average core deposit balances for the year 2009 compared to 2008 increased by 36.2%. The tables below summarize selected deposit information for the periods indicated.
| December 31, | ||||||||||||||||||
| (Dollars are in thousands) | 2009 | 2008 | 2007 | |||||||||||||||
| Non time deposits |
$ | 734,728 | 56.3 | % | $ | 507,106 | 51.0 | % | $ | 436,734 | 44.9 | % | ||||||
| Time deposits |
570,308 | 43.7 | % | 486,694 | 49.0 | % | 535,886 | 55.1 | % | |||||||||
| Total deposits |
$ | 1,305,036 | 100 | % | $ | 993,800 | 100 | % | $ | 972,620 | 100 | % | ||||||
Average deposit balance by type and average interest rates
(Dollars are in thousands)
| 2009 | 2008 | 2007 | ||||||||||||||||
| Average Balance |
Average Rate |
Average Balance |
Average Rate |
Average Balance |
Average Rate |
|||||||||||||
| Non interest bearing demand deposits |
$ | 206,733 | — | % | $ | 152,231 | — | % | $ | 187,751 | — | % | ||||||
| NOW accounts |
167,269 | 0.51 | % | 141,756 | 0.67 | % | 125,468 | 1.10 | % | |||||||||
| Money market accounts |
152,005 | 1.29 | % | 112,957 | 2.03 | % | 114,457 | 2.90 | % | |||||||||
| Savings accounts |
119,768 | 1.00 | % | 67,215 | 1.09 | % | 53,195 | 0.81 | % | |||||||||
| Time deposits |
608,394 | 2.71 | % | 501,193 | 4.18 | % | 482,162 | 4.89 | % | |||||||||
| Total |
$ | 1,254,169 | 1.63 | % | $ | 975,352 | 2.56 | % | $ | 963,033 | 2.98 | % | ||||||
Maturity of time deposits of $100,000 or more
(Dollars are in thousands)
| December 31, | |||||||||
| 2009 | 2008 | 2007 | |||||||
| Three months or less |
$ | 56,011 | $ | 80,726 | $ | 98,752 | |||
| Three through six months |
55,149 | 64,081 | 88,224 | ||||||
| Six through twelve months |
93,880 | 79,867 | 76,652 | ||||||
| Over twelve months |
107,190 | 44,814 | 33,673 | ||||||
| Total |
$ | 312,230 | $ | 269,488 | $ | 297,301 | |||
Repurchase Agreements
We enter into borrowing arrangements with retail business customers by agreements to repurchase (“repurchase agreements”) under which we pledge investment securities owned and under our control as collateral against the one-day borrowing arrangement. These arrangements are not transactions with investment
56
Table of Contents
bankers or brokerage firms, but rather, with several of our larger commercial customers who periodically have excess cash balances and do not want to keep those balances in non interest bearing checking accounts. Because our banks are not permitted to pay interest on commercial checking accounts, we offer an arrangement through a repurchase agreement whereby balances are transferred from their checking account into a repurchase agreement arrangement which we will pay a daily adjustable interest rate of the federal fund rate minus an amount that generally ranges between 0.35% and 0.75%.
The daily average balance of these short-term borrowing agreements for the years ended December 31, 2009, 2008 and 2007, was approximately $24,276,000, $30,818,000 and $58,329,000, respectively. Interest expense for the same periods was approximately $100,000, $459,000 and $2,582,000, respectively, resulting in an average rate paid of 1.01%, 1.49% and 4.43% for the years ended December 31, 2009, 2008, and 2007, respectively. The table below summarizes our repurchase agreements for the periods presented.
Schedule of short-term borrowing (1)
(Dollars are in thousands)
| Maximum outstanding at any month end |
Average balance |
Average interest rate during the year |
Ending Balance |
Weighted Average interest rate at year end |
|||||||||||
| Year ended December 31, |
|||||||||||||||
| 2009 |
$ | 29,562 | $ | 24,276 | 1.01 | % | $ | 29,562 | 0.40 | % | |||||
| 2008 |
36,825 | 30,818 | 1.49 | % | $ | 26,457 | 0.19 | % | |||||||
| 2007 |
74,526 | 58,329 | 4.43 | % | 33,128 | 2.93 | % | ||||||||
| (1) | Consist of securities sold under agreements to repurchase |
Other borrowed funds
From time to time we borrow on a short-term basis, usually overnight, either through Federal Home Loan Bank advances or Federal Funds Purchased. Included in Federal Funds Purchased are overnight deposits from correspondent banks. We began accepting correspondent bank deposits (classified as Federal Funds Purchased) during September 2008 pursuant to the initiation of our new correspondent banking division. At December 31, 2009 we had $144,939,000 overnight Federal Funds Purchased correspondent bank deposits. During the year, these deposits had a daily average balance of approximately $228,815,000. These accounts are included with other Federal Funds Purchased and Federal Home Loan Bank advances in the table below, which summarizes our other borrowings for the periods presented. For additional information refer to Notes 10 and 11 in our Notes to Consolidated Financial Statements.
Schedule of short-term borrowing (1)
(Dollars are in thousands)
| Maximum outstanding at any month end |
Average balance |
Average interest rate during the year |
Ending Balance |
Weighted Average interest rate at year end |
|||||||||||
| Year ended December 31, |
|||||||||||||||
| 2009 |
$ | 343,370 | $ | 261,839 | 0.46 | % | $ | 165,939 | 0.36 | % | |||||
| 2008 |
114,726 | 57,152 | 2.77 | % | $ | 114,726 | 0.84 | % | |||||||
| 2007 |
42,518 | 8,765 | 6.07 | % | 42,518 | 4.44 | % | ||||||||
| (1) | Consist of Federal Home Loan Bank advances and Federal Funds Purchased |
57
Table of Contents
Corporate debenture
We formed CenterState Banks of Florida Statutory Trust I (the “Trust”) for the purpose of issuing trust preferred securities. On September 22, 2003, we issued a floating rate corporate debenture in the amount of $10,000,000. The Trust used the proceeds from the issuance of a trust preferred security to acquire the corporate debenture of the Company. The trust preferred security essentially mirrors the corporate debenture, carrying a cumulative preferred dividend at a variable rate equal to the interest rate on the corporate debenture (three month LIBOR plus 305 basis points). The rate is subject to change quarterly. The rate in effect during the quarter ended December 31, 2009 was 3.33%. The corporate debenture and the trust preferred security each have 30-year lives. The trust preferred security and the corporate debenture are callable by the Company or the Trust, at their respective option after five years, and sooner in specific events, subject to prior approval by the Federal Reserve Board, if then required. Related debt issuance costs of $188,000 were capitalized and was amortized to interest expense over a five year period ending September 2008. The Company has treated the trust preferred security as Tier 1 capital up to the maximum amount allowed under the Federal Reserve guidelines for federal regulatory purposes.
In September 2004, Valrico Bancorp Inc. (“VBI”) formed Valrico Capital Statutory Trust (“Valrico Trust”) for the purpose of issuing trust preferred securities. On September 9, 2004, VBI issued a floating rate corporate debenture in the amount of $2,500,000. The Trust used the proceeds from the issuance of a trust preferred security to acquire the corporate debenture. The trust preferred security essentially mirrors the corporate debenture, carrying a cumulative preferred dividend at a variable rate equal to the interest rate on the corporate debenture (three month LIBOR plus 270 basis points). The rate is subject to change quarterly. The rate in effect during the quarter that included December 31, 2009 was 2.96%. The corporate debenture and the trust preferred security each have 30-year lives. The trust preferred security and the corporate debenture are callable by VBI or the Valrico Trust, at their respective option after five years, and sooner in specific events, subject to prior approval by the Federal Reserve, if then required. On April 2, 2007, the Company acquired all the assets and assumed all the liabilities of VBI pursuant to the merger agreement, including VBI’s corporate debenture and related trust preferred security discussed above. The Company has treated the trust preferred security as Tier 1 capital up to the maximum amount allowed under the Federal Reserve guidelines for federal regulatory purposes.
Liquidity and Market Risk Management
Market and public confidence in our financial strength and financial institutions in general will largely determine our access to appropriate levels of liquidity. This confidence is significantly dependent on our ability to maintain sound asset quality and appropriate levels of capital reserves.
Liquidity is defined as the ability to meet anticipated customer demands for funds under credit commitments and deposit withdrawals at a reasonable cost and on a timely basis. We measure our liquidity position by giving consideration to both on- and off-balance sheet sources of and demands for funds on a daily and weekly basis.
Liquidity risk involves the risk of being unable to fund assets with the appropriate duration and rate-based liabilities, as well as the risk of not being able to meet unexpected cash needs. Liquidity planning and management are necessary to ensure the ability to fund operations cost-effectively and to meet current and future potential obligations such as loan commitments, lease obligations, and unexpected deposit outflows. In this process, we focus on both assets and liabilities and on the manner in which they combine to provide adequate liquidity to meet our needs.
Interest rate sensitivity refers to the responsiveness of interest-earning assets and interest-bearing liabilities to changes in market interest rates. The rate sensitive position, or gap, is the difference in the volume of rate-sensitive assets and liabilities, at a given time interval, including both floating rate instruments and instruments which are approaching maturity. The measurement of our interest rate sensitivity, or gap, is one of the principal techniques we use in our asset/liability management effort. Each of our banks, generally attempts to maintain a
58
Table of Contents
range, set by policy, between rate-sensitive assets and liabilities by repricing periods. Each of our banks set their own range, approved by their board of directors. If any of our banks fall outside their pre-approved range, it requires board action and board approval, by that particular bank’s board of directors. The asset mix of our balance sheet is evaluated continually in terms of several variables: yield, credit quality, and appropriate funding sources and liquidity. Management of the liability mix of the balance sheet focuses on expanding the various funding sources.
Our gap and liquidity positions are reviewed periodically to determine whether or not changes in policies and procedures are necessary to achieve financial goals. At December 31, 2009, approximately 46% of total gross loans were adjustable rate. Approximately 88% of our investment securities ($409,780,000 fair value) are invested in U.S. Government Agency mortgage backed securities. Although most of these have maturities in excess of five years, these are amortizing instruments that generate cash flows each month. The duration (average life of expected cash flows) of our securities at December 31, 2009 was approximately 3.2 years. Deposit liabilities, at that date, consisted of approximately $193,527,000 (15%) in NOW accounts, $307,513,000 (24%) in money market accounts and savings, $570,308,000 (43%) in time deposits and $233,688,000 (18%) in non-interest bearing demand accounts.
59
Table of Contents
The table below presents the market risk associated with our financial instruments. In the “Rate Sensitivity Analysis” table, rate sensitive assets and liabilities are shown by repricing periods. The estimated fair value of each instrument category is also shown in the table. While these estimates of fair value are based on our judgment of the most appropriate factors, there is no assurance that, if we had to dispose of such instruments at December 31, 2009, the estimated fair values would necessarily have been achieved at that date, since market values may differ depending on various circumstances. The estimated fair values at December 31, 2009, should not necessarily be considered to apply at subsequent dates.
RATE SENSITIVITY ANALYSIS
December 31, 2009
(Dollars are in thousands)
| 0 - 1Yr | 1 - 2Yrs | 2 - 3Yrs | 3 - 4Yrs | 4 - 5Yrs | 5 Ys + | TOTAL | Est. Fair Value | ||||||||||||||||||||||||
| INTEREST EARNING ASSETS |
|||||||||||||||||||||||||||||||
| Fixed rate loans (3) |
$ | 96,998 | $ | 54,232 | $ | 69,553 | $ | 111,105 | $ | 76,217 | $ | 107,792 | $ | 515,897 | $ | 526,158 | |||||||||||||||
| Average interest rates |
6.23 | % | 7.26 | % | 7.22 | % | 6.60 | % | 6.65 | % | 7.04 | % | 6.78 | % | |||||||||||||||||
| Variable rate loans (3) |
365,934 | 18,215 | 12,004 | 15,843 | 21,507 | 10,360 | 443,863 | 443,863 | |||||||||||||||||||||||
| Average interest rates |
4.20 | % | 6.52 | % | 6.46 | % | 6.49 | % | 6.19 | % | 6.52 | % | 4.59 | % | |||||||||||||||||
| Investment securities (1) |
69,720 | 4,783 | 2,139 | 2,878 | 7,985 | 364,180 | 451,685 | 463,186 | |||||||||||||||||||||||
| Average interest rates |
4.69 | % | 4.44 | % | 4.73 | % | 4.50 | % | 2.75 | % | 4.30 | % | 4.34 | % | |||||||||||||||||
| Federal funds sold and |
178,595 | — | — | — | — | — | 178,595 | 178,595 | |||||||||||||||||||||||
| Average interest rates |
0.32 | % | 0.32 | % | |||||||||||||||||||||||||||
| Total interest-earning assets |
$ | 711,247 | $ | 77,230 | $ | 83,696 | $ | 129,826 | $ | 105,709 | $ | 482,332 | $ | 1,590,040 | $ | 1,611,802 | |||||||||||||||
| 3.55 | % | 6.91 | % | 7.04 | % | 6.54 | % | 6.26 | % | 4.96 | % | 4.75 | % | ||||||||||||||||||
| INTEREST BEARING LIABILITIES |
|||||||||||||||||||||||||||||||
| NOW accounts |
$ | 193,527 | $ | — | $ | — | $ | — | $ | — | $ | — | $ | 193,527 | $ | 193,527 | |||||||||||||||
| Average interest rates |
0.50 | % | 0.50 | % | |||||||||||||||||||||||||||
| Money Market Accounts |
158,598 | — | — | — | — | — | 158,598 | 158,598 | |||||||||||||||||||||||
| Average interest rates |
1.00 | % | 1.00 | % | |||||||||||||||||||||||||||
| Savings Accounts |
148,915 | — | — | — | — | — | 148,915 | 148,915 | |||||||||||||||||||||||
| Average interest rates |
1.00 | % | 1.00 | % | |||||||||||||||||||||||||||
| Time deposits |
413,507 | 53,038 | 68,560 | 13,847 | 19,774 | 1,582 | 570,308 | 576,237 | |||||||||||||||||||||||
| Average interest rates |
2.01 | % | 3.03 | % | 2.85 | % | 3.87 | % | 3.28 | % | 3.02 | % | 2.30 | % | |||||||||||||||||
| Securities sold under repurchase agreements |
29,562 | — | — | — | — | — | 29,562 | 29,562 | |||||||||||||||||||||||
| Average interest rates |
0.40 | % | 0.40 | % | |||||||||||||||||||||||||||
| Other borrowed funds (4) |
153,939 | 12,000 | — | — | — | — | 165,939 | 166,213 | |||||||||||||||||||||||
| Average interest rates |
0.16 | % | 2.93 | % | 0.36 | % | |||||||||||||||||||||||||
| Corporate debenture |
12,500 | — | — | — | — | — | 12,500 | 6,865 | |||||||||||||||||||||||
| Average interest rates |
3.26 | % | 3.26 | % | |||||||||||||||||||||||||||
| Total Interest-Bearing Liabilities |
$ | 1,110,548 | $ | 65,038 | $ | 68,560 | $ | 13,847 | $ | 19,774 | $ | 1,582 | $ | 1,279,349 | $ | 1,279,917 | |||||||||||||||
| 1.18 | % | 3.01 | % | 2.85 | % | 3.87 | % | 3.28 | % | 3.02 | % | 1.43 | % | ||||||||||||||||||
| Interest sensitivity gap |
(399,301 | ) | 12,192 | 15,136 | 115,979 | 85,935 | 480,750 | ||||||||||||||||||||||||
| Cumulative gap |
(399,301 | ) | (387,109 | ) | (371,973 | ) | (255,994 | ) | (170,059 | ) | 310,691 | ||||||||||||||||||||
| Cumulative gap |
0.64 | 0.67 | 0.70 | 0.80 | 0.87 | 1.24 | |||||||||||||||||||||||||
| (1) | Securities are shown at amortized cost. Includes $398,482 (amortized cost basis) of mortgage backed securities of which the majority are fixed rate. Although most have maturities greater than five years, these are amortizing instruments which generate cash flows on a monthly basis. |
| (2) | Includes federal funds sold and interest earning Federal Reserve stock and Federal Home Loan Bank stock. |
60
Table of Contents
| (3) | Loans are shown at gross value. |
| (4) | Includes federal funds purchased and Federal Home Loan Bank advances. |
| (5) | Rate sensitive assets (RSA) divided by rate sensitive liabilities (RSL), cumulative basis. |
As stated earlier, the rate sensitivity table above summarizes our interest earning assets and interest bearing liabilities by repricing periods at a point in time. It does not include assumptions about sensitivity to changes in various interest rates by asset or liability type, correlation between macro environment market rates and specific product types, lag periods, cash flows or other assumptions and projections. However, in addition to static gap analysis, our banks also use simulation models to estimate the sensitivity of their net interest income to changes in interest rates. Simulation is a better technique than gap analysis because variables are changed for the various rate conditions. Each category’s interest change is calculated as rates ramp up and down. In addition, the repayment speeds and repricing speeds are changed. Rate Shock is a method for stress testing the net interest margin over the next four quarters under several rate change levels. These levels span in 100bps increments up and down from the current interest rates. In order to simulate activity, maturing balances are replaced with the new balances at the new rate level, and repricing balances are adjusted to the new rate shock level. The interest is recalculated for each level along with the new average yield. Net interest margin is then calculated and a margin risk profile is developed. The results of these calculations, as of December 31, 2009 looking four quarters into the future, for our combined banks, are summarized in the table below.
| change in interest rates |
-300 bps | -200 bps | -100 bps | 0 bps | +100 bps | +200 bps | +300 bps | |||||||
| resulting effect on net interest income (a) |
-26.60% | -14.30% | -5.60% | current | +0.96% | +1.24% | +1.26% |
| (a) | The percentage change in each of these boxes represents a percentage change from the net interest income (dollars) that the models projected for the next four quarters. To put this in perspective, as an example, our net interest income for 2009 was $51,654,000. Assuming a 100bps decrease in rates, our model is suggesting that our net interest income would decrease by 5.60%, or approximately $2,893,000. Likewise, assuming a 100bps increase in rates, our model is suggesting that our net interest income would increase by 0.96%, or approximately $496,000. It is important to reiterate again, that these models are built on a multitude of assumptions and predictions. This is not an exact science. The benefit that we see is measuring our overall interest rate risk profile. Although we are by no means suggesting the exactness of the numbers above, what we see as a take away is that in general, it appears that if market interest rates increase, it would suggest a benefit to our net interest income. If market interest rates decrease, it would suggest a negative effect on our net interest income. We believe that our interest rate risk is manageable and under control as of December 31, 2009. |
Simulation and rate shock stress testing our net interest income (“NIM”) is a forward looking analysis. That is, it estimates, based on various assumptions, what the effect on our NIM might be given various changes in future interest rates. Another way of analyzing our interest rate risk profile is looking at history. The table below measures the correlation between our NIM and market interest rates over a ten year period starting at the beginning of 2000 and ending on December 31, 2009. We used Prime as a surrogate for market interest rates. This simple correlation is not perfect because we ignore changes in duration of our asset/liability portfolio over time and changes in the slope of the yield curve over time, as well as other significant environmental changes that may occur, such as the banking crisis of 2008 and 2009. However, it will demonstrate that over time our asset/liability portfolio generally tended to be asset sensitive. That is, in general, over this historical period, when market interest rates increased, our NIM increased, and when market interest rates decreased, our NIM decreased. In the table below, the Prime rate is measured by the vertical bars, and their scale is on the left hand side of the graph. Each bar represents a month. Our NIM is represented by the line graph and its scale is on the right hand side of the graph. The line graph is connecting a series of dots, which represents our NIM for a given quarter.
61
Table of Contents
Net Interest Margin vs. Prime
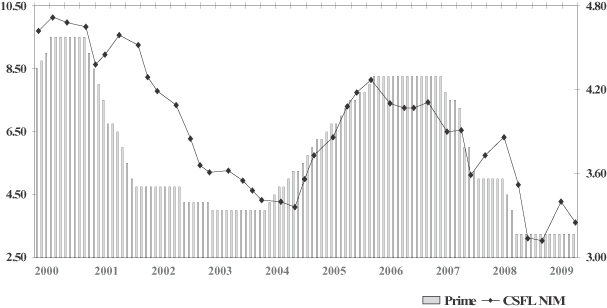
Managing interest rate risk is a dynamic process. Our philosophy is to not try to guess the market in either direction. We do not want to be excessively assets sensitive or excessively liability sensitive. We try to manage our asset/liability portfolio with the goal of optimizing our yield without taking on excessive interest rate risk.
Contractual Obligations
While our liquidity monitoring and management considers both present and future demands for and sources of liquidity, the following table of contractual commitments focuses only on our future obligations. In the table, all deposits with indeterminate maturities, such as demand deposits, checking accounts, savings accounts and money market accounts, are presented as having a maturity of one year or less.
| December 31, 2009 | |||||||||||||||
| (in thousands of dollars) |
Total | Due in one year or less |
Due over one year and less than three years |
Due over three years and less than five years |
Due over five Years | ||||||||||
| Contractual commitments: |
|||||||||||||||
| Deposit maturities |
$ | 1,305,036 | $ | 1,148,235 | $ | 121,598 | $ | 33,621 | $ | 1,582 | |||||
| Securities sold under agreements to repurchase |
29,562 | 29,562 | — | — | — | ||||||||||
| Corporate debenture |
12,500 | — | — | — | 12,500 | ||||||||||
| Other borrowed funds |
165,939 | 153,939 | 12,000 | — | — | ||||||||||
| Deferred compensation |
3,153 | 2,259 | 504 | 273 | 117 | ||||||||||
| Operating lease obligations |
3,207 | 683 | 1,338 | 1,186 | — | ||||||||||
| Total |
$ | 1,519,397 | $ | 1,334,678 | $ | 135,440 | $ | 35,080 | $ | 14,199 | |||||
Primary Sources and Uses of Funds
Our primary sources of funds during the year ended December 31, 2009 included $155,640,000 in net cash from the acquisition of the Ocala branches, $132,536,000 net increase in deposits, a $54,318,000 net increase in
62
Table of Contents
borrowings, $80,879,000 of proceeds from public stock offering net of related expenses, $15,940,000 in funds provided by operations, $187,000 of proceeds received upon exercise of stock options by our employees and/or directors, $4,419,000 of proceeds from the sale of OREO, and $92,000 of proceeds from the sale of premises and equipment.
Our primary uses of funds during 2009 included a $195,834,000 increase in investments and securities net of maturities/sales, $93,977,000 increase in net loans outstanding, $27,875,000 in redemption of perpetual preferred stock previously issued pursuant to TARP, $212,000 in repurchase of TARP warrant, $5,000,000 in purchase of bank owned life insurance, $3,917,000 net purchases of premises and equipment including construction costs, and $2,335,000 in dividends paid, a $6,000 adjustment to net proceeds from preferred stock and warrants, and a $114,855,000 increase in federal funds sold and other cash items
Capital Resources
Total stockholders’ equity at December 31, 2009 was $229,410,000, or 13.1% of total assets compared to $179,165,000, or 13.4% of total assets at December 31, 2008. The $50,245,000 increase was the result of the following items: issuance of common stock in a public stock offering ($80,879,000), plus exercise of stock options ($187,000), plus stock based compensation expense ($405,000), plus net change of unrealized gain in securities available for sale ($5,410,000), plus stock grants issued ($9,000), less redemption of preferred stock previously issued pursuant to TARP ($27,875,000), less purchase of warrants previously issued pursuant to TARP ($212,000), less net loss ($6,217,000), less dividends paid ($2,335,000), less adjustment to net proceeds from preferred stock and warrants ($6,000).
The bank regulatory agencies have established risk-based capital requirements for banks. These guidelines are intended to provide an additional measure of a bank’s capital adequacy by assigning weighted levels of risk to asset categories. Banks are also required to systematically maintain capital against such “off- balance sheet” activities as loans sold with recourse, loan commitments, guarantees and standby letters of credit. These guidelines are intended to strengthen the quality of capital by increasing the emphasis on common equity and restricting the amount of loan loss reserves and other forms of equity such as preferred stock that may be included in capital. Each of our Company’s subsidiary Banks’ objective is to maintain its current status as a “well-capitalized institution” as that term is defined by its regulators.
Under the terms of the guidelines, banks must meet minimum capital adequacy based upon both total assets and risk-adjusted assets. All banks are required to maintain a minimum ratio of total capital to risk-weighted assets of 8% and a minimum ratio of Tier 1 capital to risk-weighted assets of 4%. Adherence to these guidelines has not had an adverse impact on our Company.
63
Table of Contents
Selected consolidated capital ratios at December 31, 2009, and 2008 were as follows:
Capital Ratios
(Dollars are in thousands)
| Actual | Well Capitalized | Excess | |||||||||||||
| Amount | Ratio | Amount | Ratio | Amount | |||||||||||
| As of December 31, 2009: |
|||||||||||||||
| Total capital: (to risk weighted assets): |
$ | 213,569 | 19.2 | % | $ | 110,960 | 10.0 | % | $ | 102,609 | |||||
| Tier 1 capital: (to risk weighted assets): |
$ | 199,583 | 18.0 | % | $ | 66,576 | 6.0 | % | $ | 133,007 | |||||
| Tier 1 capital: (to average assets): |
$ | 199,583 | 11.4 | % | $ | 87,831 | 5.0 | % | $ | 111,752 | |||||
| As of December 31, 2008: |
|||||||||||||||
| Total capital: (to risk weighted assets): |
$ | 170,164 | 17.4 | % | $ | 97,648 | 10.0 | % | $ | 72,516 | |||||
| Tier 1 capital: (to risk weighted assets): |
$ | 157,944 | 16.2 | % | $ | 58,589 | 6.0 | % | $ | 99,355 | |||||
| Tier 1 capital: (to average assets): |
$ | 157,944 | 12.6 | % | $ | 62,751 | 5.0 | % | $ | 95,193 | |||||
Effects of Inflation and Changing Prices
The accompanying consolidated financial statements have been prepared in accordance with generally accepted accounting principles, which require the measurement of financial position and operating results in terms of historical dollars without considering the change in the relative purchasing power of money over time due to inflation. Unlike most industrial companies, virtually all of the assets and liabilities of a financial institution are monetary in nature. As a result, interest rates generally have a more significant impact on the performance of a financial institution than the effects of general levels of inflation. Although interest rates do not necessarily move in the same direction or to the same extent as the prices of goods and services, increases in inflation generally have resulted in increased interest rates. In addition, inflation affects financial institutions’ increased cost of goods and services purchased, the cost of salaries and benefits, occupancy expense, and similar items. Inflation and related increases in interest rates generally decrease the market value of investments and loans held and may adversely affect liquidity, earnings, and shareholders’ equity. Commercial and other loan originations and refinancings tend to slow as interest rates increase, and can reduce our earnings from such activities.
Off-Balance Sheet Arrangements
We do not currently have any off-balance sheet arrangements, other than approved and unfunded loans and letters and lines of credit to our customers in the ordinary course of business.
Accounting Pronouncements
Refer to Note 1(ab) in our Notes to Consolidated Financial Statements for a discussion on the effects of new accounting pronouncements.
| Item 7A. | Quantitative and qualitative disclosures about market risk. |
Market risk is the risk of economic loss from adverse changes in the fair value of financial instruments due to changes in (a) interest rates, (b) foreign exchange rates, or (c) other factors that relate to market volatility of the rate, index, or price underlying the financial instrument. Our market risk is composed primarily of interest rate risk. Each of our subsidiary Banks has an Asset/Liability Committee (“ALCO”) which is responsible for reviewing the interest rate sensitivity position, and establishing policies to monitor and limit the exposure to interest rate risk for their specific Bank. Substantially all of our interest rate risk exposure relates to the financial
64
Table of Contents
instrument activity of each of our subsidiary Banks. As such, the board of directors of each subsidiary Bank is responsible to review and approve the policies and guidelines established by their Bank’s ALCO.
The primary objective of asset/liability management is to provide an optimum and stable net interest margin, after-tax return on assets and return on equity capital, as well as adequate liquidity and capital. Interest rate risk is measured and monitored through gap analysis, which measures the amount of repricing risk associated with the balance sheet at specific points in time. See “Liquidity and Market Risk Management” presented in Item 7 above for quantitative disclosures in tabular format, as well as additional qualitative disclosures.
| Item 8. | Financial Statements and Supplementary Data |
The financial statements of our Company as of December 31, 2009 and 2008 and for the years ended December 31, 2009, 2008 and 2007 are set forth in this Form 10-K at page 79.
| Item 9. | Changes in and Disagreements with Accountants on Accounting and Financial Disclosure. |
None.
| Item 9A. | Controls and Procedures. |
| (a) | Evaluation of disclosure controls and procedures. The Company maintains controls and procedures designed to ensure that information required to be disclosed in the reports that the Company files or submits under the Securities Exchange Act of 1934 is recorded, processed, summarized and reported within the time periods specified in the rules and forms of the Securities and Exchange Commission. Based upon their evaluation of those controls and procedures performed within 90 days of the filing date of this report, the Chief Executive and Chief Financial officers of the Company concluded that the Company’s disclosure controls and procedures were adequate. |
| (b) | Changes in internal controls. The Company made no significant changes in its internal controls or in other factors that could significantly affect these controls subsequent to the date of the evaluation of those controls by the Chief Executive and Chief Financial officers. |
| (c) | Management’s report on internal control over financial reporting. Management is responsible for establishing and maintaining adequate internal control over financial reporting, as such term is defined in Exchange Act Rules 13a-15(f). Under the supervision and with the participation of our management, including our Chief Executive Officer and Chief Financial Officer, we conducted an evaluation of the effectiveness of our internal control over financial reporting based on the framework in Internal Control—Integrated Framework issued by the Committee of Sponsoring Organizations, also referred to as the Treadway Commission. Based upon our evaluation under the framework in Internal Control—Integrated Framework, management concluded that our internal control over financial reporting was effective as of December 31, 2009. The effectiveness of the Company’s internal control over financial reporting as of December 31, 2009 has been audited by Crowe Horwath LLP, an independent registered public accounting firm, as stated in their report which is included herein. |
| Item 9B. | Other Information. |
Not applicable.
65
Table of Contents
| Item 10. | Directors, Executive Officers and Corporate Governance |
Our Company has a Code of Ethics that applies to its principal executive officer and principal financial officer (who is also its principal accounting officer), a copy of which is included on the Company’s website, www.centerstatebanks.com, at Investor Relations / Governance Documents. The website also includes a copy of the Company’s Audit Committee Charter, Compensation Committee Charter and Nominating Committee Charter. The information contained under the sections captioned “Directors” and “Executive Officers” under “Proposal One—Election of Directors,” and in the sections captioned “Audit Committee Report” and “Section 16(a) Reporting Requirements,” in the registrant’s definitive Proxy Statement for the Annual Meeting of Shareholders to be held on May 10, 2010, to be filed with the SEC pursuant to Regulation 14A within 120 days of their registrant’s fiscal year end (the “Proxy Statement”), is incorporated herein by reference.
| Item 11. | Executive Compensation |
The information contained in the sections captioned “Information About the Board of Directors and Its Committees” under “Proposal One—Election of Directors,” and the sections captioned “Executive Compensation and Benefits,” and “Compensation Committee Report,” in the Proxy Statement, is incorporated herein by reference.
| Item 12. | Security Ownership of Certain Beneficial Owners and Management and Related Stockholder Matters |
Information contained in the section captioned “Directors” and “Management and Principal Stock Ownership” under “Election of Directors,” and under the table captioned “Equity Compensation Plan Information,” in the Proxy Statement, is incorporated herein by reference.
| Item 13. | Certain Relationships and Related Transactions, and Director Independence |
The information contained in the section entitled “Certain Transactions” under “Executive Compensation and Benefits” and the section entitled “Director Independence” in the Proxy Statement is incorporated herein by reference.
| Item 14. | Principal Accountant Fees and Services |
The information contained in the section captioned “Independent Auditors” in the Proxy Statement is incorporated herein by reference.
| Item 15. | Exhibits and Financial Statement Schedules |
| (a) | The following documents are filed as part of this report: |
1. Financial Statements
Reports of Independent Registered Public Accounting Firm
Consolidated Balance Sheets as of December 31, 2009 and 2008
Consolidated Statements of Operations for the years ended December 31, 2009, 2008 and 2007
Consolidated Statements of Cash Flows for the years ended December 31, 2009, 2008 and 2007
Consolidated Statement of Changes in Stockholders’ Equity and Comprehensive Income for the years ended December 31, 2009, 2008 and 2007
Notes to Consolidated Financial Statements
66
Table of Contents
| 2. | Financial Statement Schedules |
All schedules have been omitted as the required information is either inapplicable or included in the Notes to Consolidated Financial Statements.
| 3. | Exhibits |
| 3.1 | - | Articles of Incorporation of CenterState Banks, Inc. (Incorporated by reference to Exhibit 3.1 to the Company’s Registration Statement No. 333-95087 (the “Registration Statement”)) | ||
| 3.2 | - | Bylaws of CenterState Banks, Inc. (Incorporated by reference to Exhibit 3.2 to the Registration Statement) | ||
| 3.3 | - | Amendments to Articles of Incorporation of CenterState Banks, Inc. (Incorporated by reference to the Company’s Form 8-K dated April 25, 2006). | ||
| 3.4 | - | Amendment to bylaws of CenterState Banks, Inc. (Incorporated by reference to Exhibit 3.4 to the Company’s Form 10-K dated March 7, 2008.) | ||
| 3.5 | - | Articles of Amendment to the Articles of Incorporation authorizing the Preferred Shares (Incorporated by reference to Exhibit 3.1 to the Company’s Form 8-K dated November 24, 2008.) | ||
| 3.6 | - | Articles of Amendment to the Articles of Incorporation authorizing a change of the Corporations name from CenterState Banks Florida, Inc. to CenterState Banks, Inc. effective June 17, 2009. | ||
| 3.7 | - | Articles of Amendment to the Articles of Incorporation increasing the number of authorized common shares from 40,000,000 to 100,000,000 (Incorporated by reference to Exhibit 3.1 to the Company’s Form 8-K dated December 16, 2009.) | ||
| 4.1 | - | Specimen Stock Certificate of CenterState Banks, Inc. (Incorporated by reference to Exhibit 4.2 to the Registration Statement) | ||
| 10.1 | - | CenterState Banks, Inc. Stock Option Plan (Incorporated by reference to Exhibit 10.1 to the Registration Statement)* | ||
| 10.2 | - | CenterState Banks, Inc. Employee Stock Purchase Plan (Incorporated by reference to Appendix A to the Company’s Proxy Statement dated March 25, 2004)* | ||
| 10.3 | - | Form of CenterState Banks, Inc. Split Dollar Agreement (Incorporated by reference to Exhibit 10.1 to the Company’s Form 8-K dated January 11, 2006)* | ||
| 10.4 | - | Form of CenterState Banks, Inc. Change in Control and Severance Agreement for Ernest S. Pinner, President, CEO and Chairman of the Board, James J. Antal, Senior Vice President, CFO and Corporate Secretary (Incorporated by reference to Exhibit 10.1 to the Company’s Form 8-K dated July 12, 2006)* | ||
| 10.5 | - | Form of CenterState Banks, Inc. Change in Control and Severance Agreement for George H. Carefoot, Senior Vice President, Treasurer and Chief Operations Officer, and the Company’s four subsidiary bank Presidents Thomas E. White, John C. Corbett and Timothy A. Pierson. (Incorporated by reference to Exhibit 10.2 to the Company’s Form 8-K dated July 12, 2006)* | ||
| 10.6 | - | CenterState Banks, Inc. 2007 Equity Incentive Plan (Incorporated by reference to Appendix D to the Company’s Proxy Statement dated March 30, 2007)* | ||
| 10.7 | - | Noncompete and Nonsolicitation Agreement between CenterState Banks, Inc. and subsidiary bank president Timothy A. Pierson (Incorporated by reference to Exhibit 10.7 to the Company’s Form 10-K dated March 7, 2008.)* | ||
67
Table of Contents
| 10.8 | - | Executive Deferred Compensation Agreement between the Company and Ernest S. Pinner, its Chairman of the Board, Chief Executive Officer and President (Incorporated by reference to Exhibit 10.1 to the Company’s Form 8-K dated December 31, 2008.)* | ||
| 10.9 | - | Amendment to Change in Control and Severance Agreement between the Company and John C. Corbett, Timothy A. Pierson and Thomas E. White (Incorporated by reference to Exhibits 10.1, 10.2 and 10.3 to the Company’s Form 8-K dated January 14, 2009.) | ||
| 14.1 | - | Code of Ethics (Incorporated by reference to Exhibit 14.1 to the Company’s December 31, 2003 Form 10-K dated March 26, 2004) | ||
| 21.1 | - | List of Subsidiaries of CenterState Banks of Florida, Inc. | ||
| 23.1 | - | Consent of Crowe Horwath LLP | ||
| 31.1 | - | Certification of President and Chief Executive Officer under Section 302 of the Sarbanes–Oxley Act of 2002 | ||
| 31.2 | - | Certification of Chief Financial Officer under Section 302 of the Sarbanes-Oxley Act of 2002 | ||
| 32.1 | - | Certification of President and Chief Executive Officer under Section 906 of the Sarbanes–Oxley Act of 2002 | ||
| 32.2 | - | Certification of Chief Financial Officer under Section 906 of the Sarbanes-Oxley Act of 2002 | ||
| * | Represents a management contract or compensatory plan or arrangement required to be filed as an exhibit. |
68
Table of Contents
CENTERSTATE BANKS, INC. and SUBSIDIARIES
Index to consolidated financial statements
69
Table of Contents
REPORT OF INDEPENDENT REGISTERED PUBLIC ACCOUNTING FIRM
Board of Directors and Shareholders
CenterState Banks, Inc.
Davenport, Florida
We have audited the accompanying consolidated balance sheets of CenterState Banks, Inc. as of December 31, 2009 and 2008, and the related consolidated statements of operations, changes in stockholders’ equity, and cash flows for each of the three years ending December 31, 2009, 2008 and 2007. We also have audited the Company’s internal control over financial reporting as of December 31, 2009, based on criteria established in Internal Control—Integrated Framework issued by the Committee of Sponsoring Organizations of the Treadway Commission (COSO). The Company’s management is responsible for these financial statements, for maintaining effective internal control over financial reporting, and for its assessment of the effectiveness of internal control over financial reporting, included in Management’s report on internal control over financial reporting contained in Item 9A.(c) of the accompanying Form 10-K. Our responsibility is to express an opinion on these financial statements and an opinion on the Company’s internal control over financial reporting based on our audits.
We conducted our audits in accordance with the standards of the Public Company Accounting Oversight Board (United States). Those standards require that we plan and perform the audits to obtain reasonable assurance about whether the financial statements are free of material misstatement and whether effective internal control over financial reporting was maintained in all material respects. Our audits of the financial statements included examining, on a test basis, evidence supporting the amounts and disclosures in the financial statements, assessing the accounting principles used and significant estimates made by management, and evaluating the overall financial statement presentation. Our audit of internal control over financial reporting included obtaining an understanding of internal control over financial reporting, assessing the risk that a material weakness exists, and testing and evaluating the design and operating effectiveness of internal control based on the assessed risk. Our audits also included performing such other procedures as we considered necessary in the circumstances. We believe that our audits provide a reasonable basis for our opinions.
A company’s internal control over financial reporting is a process designed to provide reasonable assurance regarding the reliability of financial reporting and the preparation of financial statements for external purposes in accordance with generally accepted accounting principles. A company’s internal control over financial reporting includes those policies and procedures that (1) pertain to the maintenance of records that, in reasonable detail, accurately and fairly reflect the transactions and dispositions of the assets of the company; (2) provide reasonable assurance that transactions are recorded as necessary to permit preparation of financial statements in accordance with generally accepted accounting principles, and that receipts and expenditures of the company are being made only in accordance with authorizations of management and directors of the company; and (3) provide reasonable assurance regarding prevention or timely detection of unauthorized acquisition, use, or disposition of the company’s assets that could have a material effect on the financial statements.
Because of its inherent limitations, internal control over financial reporting may not prevent or detect misstatements. Also, projections of any evaluation of effectiveness to future periods are subject to the risk that controls may become inadequate because of changes in conditions, or that the degree of compliance with the policies or procedures may deteriorate.
In our opinion, the consolidated financial statements referred to above present fairly, in all material respects, the financial position of CenterState Banks, Inc. as of December 31, 2009 and 2008, and the results of its operations and its cash flows for each of the three years ending December 31, 2009, 2008 and 2007, in conformity with accounting principles generally accepted in the United States of America. Also in our opinion, the Company maintained, in all material respects, effective internal control over financial reporting as of December 31, 2009, based on criteria established in Internal Control—Integrated Framework issued by the Committee of Sponsoring Organizations of the Treadway Commission (COSO).
/s/ Crowe Horwath LLP
Crowe Horwath LLP
Fort Lauderdale, Florida
March 4, 2010
70
Table of Contents
CENTERSTATE BANKS, INC. AND SUBSIDIARIES
Consolidated Balance Sheets
December 31, 2009 and 2008
(in thousands of dollars, except per share data)
| 2009 | 2008 | |||||||
| Assets | ||||||||
| Cash and due from banks |
$ | 19,139 | $ | 19,702 | ||||
| Federal funds sold and Federal Reserve Bank deposits |
173,268 | 57,850 | ||||||
| Cash and cash equivalents |
192,407 | 77,552 | ||||||
| Investment securities available for sale, at fair value |
463,186 | 252,080 | ||||||
| Loans |
959,021 | 892,001 | ||||||
| Less allowance for loan losses |
(23,289 | ) | (13,335 | ) | ||||
| Net loans |
935,732 | 878,666 | ||||||
| Accrued interest receivable |
6,378 | 5,406 | ||||||
| Federal Home Loan Bank and Federal Reserve Bank stock |
7,908 | 5,327 | ||||||
| Bank premises and equipment, net |
62,368 | 61,343 | ||||||
| Deferred income taxes, net |
3,495 | 1,682 | ||||||
| Goodwill |
32,840 | 28,118 | ||||||
| Core deposit intangible |
2,422 | 3,948 | ||||||
| Bank owned life insurance |
15,665 | 10,115 | ||||||
| Other real estate owned |
10,196 | 4,494 | ||||||
| Prepaid expenses and other assets |
18,702 | 4,412 | ||||||
| Total assets |
$ | 1,751,299 | $ | 1,333,143 | ||||
| Liabilities and Stockholders’ Equity | ||||||||
| Deposits: |
||||||||
| Interest bearing |
$ | 1,071,348 | $ | 852,571 | ||||
| Noninterest bearing |
233,688 | 141,229 | ||||||
| Total deposits |
1,305,036 | 993,800 | ||||||
| Securities sold under agreement to repurchase |
29,562 | 26,457 | ||||||
| Federal funds purchased |
144,939 | 88,976 | ||||||
| Federal Home Loan Bank advances and other borrowed funds |
21,000 | 25,750 | ||||||
| Corporate debentures |
12,500 | 12,500 | ||||||
| Accrued interest payable |
1,268 | 1,410 | ||||||
| Accounts payable and accrued expenses |
7,584 | 5,085 | ||||||
| Total liabilities |
1,521,889 | 1,153,978 | ||||||
| Stockholders’ equity: |
||||||||
| Preferred stock, $.01 par value, $1,000 liquidation preference; 5,000,000 shares authorized, no shares and 27,875 issued and outstanding at December 31, 2009 and 2008, respectively |
— | 26,787 | ||||||
| Common stock, $.01 par value: 100,000,000 shares authorized; 25,773,229 and 12,474,315 shares issued and outstanding at December 31, 2009 and 2008, respectively |
258 | 125 | ||||||
| Additional paid-in capital |
193,464 | 112,329 | ||||||
| Retained earnings |
28,623 | 38,269 | ||||||
| Accumulated other comprehensive income |
7,065 | 1,655 | ||||||
| Total stockholders’ equity |
229,410 | 179,165 | ||||||
| Total liabilities and stockholders’ equity |
$ | 1,751,299 | $ | 1,333,143 | ||||
See accompanying notes to the consolidated financial statements
71
Table of Contents
CENTERSTATE BANKS, INC. AND SUBSIDIARIES
Consolidated Statements of Operations
Years ended December 31, 2009, 2008 and 2007
(in thousands of dollars, except per share data)
| 2009 | 2008 | 2007 | ||||||||
| Interest income: |
||||||||||
| Loans |
$ | 53,428 | $ | 57,403 | $ | 61,873 | ||||
| Investment securities available for sale: |
||||||||||
| Taxable |
18,436 | 7,822 | 9,388 | |||||||
| Tax-exempt |
1,472 | 1,512 | 1,381 | |||||||
| Federal funds sold and other |
608 | 1,345 | 2,531 | |||||||
| 73,944 | 68,082 | 75,173 | ||||||||
| Interest expense: |
||||||||||
| Deposits |
20,521 | 24,936 | 28,690 | |||||||
| Securities sold under agreement to repurchase |
100 | 459 | 2,582 | |||||||
| Corporate debentures |
473 | 818 | 1,021 | |||||||
| Federal funds purchased |
553 | 200 | — | |||||||
| Federal Home Loan Bank advances and other borrowings |
643 | 1,384 | 532 | |||||||
| 22,290 | 27,797 | 32,825 | ||||||||
| Net interest income |
51,654 | 40,285 | 42,348 | |||||||
| Provision for loan losses |
23,896 | 6,520 | 2,792 | |||||||
| Net interest income after provision for loan losses |
27,758 | 33,765 | 39,556 | |||||||
| Other income: |
||||||||||
| Service charges on deposit accounts |
5,450 | 4,490 | 4,436 | |||||||
| Income from correspondent banking and bond sales division |
17,916 | 1,412 | — | |||||||
| Commissions from mortgage broker activities |
129 | 87 | 187 | |||||||
| Commissions from sale of mutual funds and annuities |
532 | 503 | 586 | |||||||
| Debit card and ATM fees |
1,341 | 1,075 | 905 | |||||||
| Loan related fees |
452 | 402 | 381 | |||||||
| Gain on sale of bank branch office real estate |
— | 1,483 | — | |||||||
| Sale of bank shell |
— | — | 1,000 | |||||||
| BOLI income |
550 | 387 | 353 | |||||||
| Trading securities revenue |
427 | — | — | |||||||
| Net gain on sale of securities |
2,516 | 661 | 7 | |||||||
| Other service charges and fees |
739 | 307 | 249 | |||||||
| 30,052 | 10,807 | 8,104 | ||||||||
| Other expenses: |
||||||||||
| Salaries, wages and employee benefits |
36,670 | 21,484 | 20,027 | |||||||
| Occupancy expense |
5,375 | 4,143 | 3,966 | |||||||
| Depreciation of premises and equipment |
2,882 | 2,590 | 2,305 | |||||||
| Marketing expenses |
1,910 | 1,359 | 1,096 | |||||||
| Data processing expense |
2,417 | 1,141 | 1,452 | |||||||
| Legal, audit and other professional fees |
2,354 | 1,245 | 1,101 | |||||||
| Supplies, stationary and printing |
848 | 743 | 690 | |||||||
| Core deposit intangible (CDI) amortization |
792 | 777 | 842 | |||||||
| Core deposit intangible impairment |
1,200 | — | — | |||||||
| Bank regulatory expenses |
3,114 | 1,230 | 468 | |||||||
| ATM and debit card related expenses |
1,060 | 724 | 667 | |||||||
| Postage and delivery |
425 | 367 | 308 | |||||||
| Loss on sale of repossessed real estate (“OREO”) |
772 | 51 | 5 | |||||||
| Valuation write down of repossessed real estate (“OREO”) |
2,188 | 434 | — | |||||||
| Loss on repossessed assets other than real estate |
544 | 125 | 2 | |||||||
| Foreclosure related expenses |
1,049 | 396 | 69 | |||||||
| Other expenses |
5,114 | 3,127 | 2,966 | |||||||
| Total other expenses |
68,714 | 39,936 | 35,964 | |||||||
| (Loss) Income before provision for income taxes |
(10,904 | ) | 4,636 | 11,696 | ||||||
| Provision for income taxes |
(4,687 | ) | 1,215 | 3,897 | ||||||
| Net (loss) income |
$ | (6,217 | ) | $ | 3,421 | $ | 7,799 | |||
| (Loss) earnings per share: |
||||||||||
| Basic |
$ | (0.47 | ) | $ | 0.26 | $ | 0.64 | |||
| Diluted |
$ | (0.47 | ) | $ | 0.26 | $ | 0.63 | |||
| Common shares used in the calculation of (loss) earnings per share: |
||||||||||
| Basic |
17,905,042 | 12,452,375 | 12,108,590 | |||||||
| Diluted |
17,905,042 | 12,585,036 | 12,294,537 | |||||||
See accompanying notes to the consolidated financial statements.
72
Table of Contents
CENTERSTATE BANKS, INC. AND SUBSIDIARIES
Consolidated Statements of Changes in Stockholders’ Equity
Years ended December 31, 2009, 2008, and 2007
(in thousands of dollars)
| Number of Preferred Shares |
Preferred Stock |
Number of Common Shares |
Common stock |
Additional paid-in capital |
Retained earnings |
Accumulated other comprehensive income (loss) |
Total stockholders’ equity |
||||||||||||||||||||||||
| Balances at January 1, 2007 |
11,129,020 | $ | 111 | $ | 86,989 | $ | 30,878 | $ | (646 | ) | $ | 117,332 | |||||||||||||||||||
| Comprehensive income: |
|||||||||||||||||||||||||||||||
| Net income |
— | — | 7,799 | — | 7,799 | ||||||||||||||||||||||||||
| Unrealized holding gain on available for sale securities, net of deferred income taxes of $844 |
— | — | — | 1,343 | 1,343 | ||||||||||||||||||||||||||
| Total comprehensive income |
9,142 | ||||||||||||||||||||||||||||||
| Dividends paid ($0.15 per share) |
— | — | (1,820 | ) | — | (1,820 | ) | ||||||||||||||||||||||||
| Stock options exercised, including tax benefit |
67,470 | 1 | 675 | — | — | 676 | |||||||||||||||||||||||||
| Stock based compensation expense |
— | 509 | — | — | 509 | ||||||||||||||||||||||||||
| Shares issued pursuant to the acquisition of VSB |
1,239,917 | 12 | 22,431 | — | — | 22,443 | |||||||||||||||||||||||||
| Balances at December 31, 2007 |
12,436,407 | $ | 124 | $ | 110,604 | $ | 36,857 | $ | 697 | $ | 148,282 | ||||||||||||||||||||
| Comprehensive income: |
|||||||||||||||||||||||||||||||
| Net income |
3,421 | 3,421 | |||||||||||||||||||||||||||||
| Unrealized holding gain on available for sale securities, net of deferred income taxes of $601 |
958 | 958 | |||||||||||||||||||||||||||||
| Total comprehensive income |
4,379 | ||||||||||||||||||||||||||||||
| Dividends paid ($0.16 per share) |
(1,993 | ) | (1,993 | ) | |||||||||||||||||||||||||||
| Stock options exercised, including tax benefit |
37,908 | 1 | 334 | 335 | |||||||||||||||||||||||||||
| Stock based compensation expense |
402 | 402 | |||||||||||||||||||||||||||||
| Preferred stock issued pursuant to TARP |
27,875 | $ | 26,771 | 26,771 | |||||||||||||||||||||||||||
| Preferred stock amortization of discount |
16 | (16 | ) | — | |||||||||||||||||||||||||||
| Warrant issued pursuant to TARP |
989 | 989 | |||||||||||||||||||||||||||||
| Balances at December 31, 2008 |
27,875 | $ | 26,787 | 12,474,315 | $ | 125 | $ | 112,329 | $ | 38,269 | $ | 1,655 | $ | 179,165 | |||||||||||||||||
| Comprehensive income: |
|||||||||||||||||||||||||||||||
| Net loss |
(6,217 | ) | (6,217 | ) | |||||||||||||||||||||||||||
| Unrealized holding loss on available for sale securities, net of deferred income taxes of $3,397 |
5,410 | 5,410 | |||||||||||||||||||||||||||||
| Total comprehensive loss |
(807 | ) | |||||||||||||||||||||||||||||
| Dividends paid—common ($0.07 per share) |
(1,139 | ) | (1,139 | ) | |||||||||||||||||||||||||||
| Dividends paid—preferred (5%) |
(1,196 | ) | (1,196 | ) | |||||||||||||||||||||||||||
| Stock options exercised, including tax benefit |
26,974 | 187 | 187 | ||||||||||||||||||||||||||||
| Stock based compensation expense |
405 | 405 | |||||||||||||||||||||||||||||
| Stock grants issued |
940 | 9 | 9 | ||||||||||||||||||||||||||||
| Proceeds from public stock offering, net of $5,382 in underwriting fees and transaction costs |
13,271,000 | 133 | 80,746 | 80,879 | |||||||||||||||||||||||||||
| Preferred stock amortization of discount |
1,094 | (1,094 | ) | — | |||||||||||||||||||||||||||
| Redemption of perpetual preferred stock previously issued pursuant to TARP |
(27,875 | ) | (27,875 | ) | (27,875 | ) | |||||||||||||||||||||||||
| Purchased warrants previously issued pursuant to TARP |
(212 | ) | (212 | ) | |||||||||||||||||||||||||||
| Adjustment to preferred stock and warrants |
(6 | ) | (6 | ) | |||||||||||||||||||||||||||
| Balances at December 31, 2009 |
— | $ | — | 25,773,229 | $ | 258 | $ | 193,464 | $ | 28,623 | $ | 7,065 | $ | 229,410 | |||||||||||||||||
| 2009 | 2008 | 2007 | |||||||||||||||||||||||||||||
| Disclosure of reclassification amounts: |
|||||||||||||||||||||||||||||||
| Unrealized holding gain arising during the year, net of income taxes |
$ | 6,979 | $ | 1,370 | $ | 1,347 | |||||||||||||||||||||||||
| Add: reclassified adjustments for (gain) included in net income, net of income taxes, at December 31, 2009, 2008 and 2007 of $947, $249 and $3, respectively |
(1,569 | ) | (412 | ) | (4 | ) | |||||||||||||||||||||||||
| Net unrealized gain on securities, net of income taxes |
$ | 5,410 | $ | 958 | $ | 1,343 | |||||||||||||||||||||||||
See accompanying notes to the consolidated financial statements.
73
Table of Contents
CENTERSTATE BANKS, INC. AND SUBSIDIARIES
Consolidated Statements of Cash Flows
Years ended December 31, 2009, 2008 and 2007
(in thousands of dollars)
| 2009 | 2008 | 2007 | ||||||||||
| Cash flows from operating activities: |
||||||||||||
| Net (loss) income |
$ | (6,217 | ) | $ | 3,421 | $ | 7,799 | |||||
| Adjustments to reconcile net income to net cash provided by operating activities: |
||||||||||||
| Provision for loan losses |
23,896 | 6,520 | 2,792 | |||||||||
| Depreciation of premises and equipment |
2,882 | 2,590 | 2,305 | |||||||||
| Amortization of purchase accounting adjustments |
(800 | ) | 581 | 513 | ||||||||
| Impairment of core deposit intangible |
1,200 | — | — | |||||||||
| Net amortization of investment securities |
5,017 | 36 | 119 | |||||||||
| Net deferred loan origination fees |
25 | (268 | ) | (250 | ) | |||||||
| Loss on sale of other real estate owned |
772 | 51 | 5 | |||||||||
| Valuation write down on other real estate owned |
2,188 | 434 | — | |||||||||
| Loss on sale of repossessed assets other than real estate |
227 | 85 | — | |||||||||
| Valuation write down on repossessed assets other than real estate |
317 | 40 | — | |||||||||
| (Gain) loss on sale or disposal of fixed assets |
(79 | ) | (1,470 | ) | 20 | |||||||
| Deferred income taxes |
(5,211 | ) | (1,163 | ) | (1,366 | ) | ||||||
| Net realized gain on sale or call of available for sale securities |
(2,516 | ) | (661 | ) | (7 | ) | ||||||
| Trading securities revenue |
(427 | ) | — | — | ||||||||
| Purchases of trading securities |
(32,714 | ) | — | — | ||||||||
| Proceeds from sale of trading securities |
33,141 | — | — | |||||||||
| Stock based compensation expense |
414 | 402 | 509 | |||||||||
| Bank owned life insurance income |
(550 | ) | (387 | ) | (353 | ) | ||||||
| Gain on sale of bank shell |
— | — | (1,000 | ) | ||||||||
| Cash provided by (used in) changes in: |
||||||||||||
| Net change in accrued interest receivable, prepaid expenses, and other assets |
(7,694 | ) | (112 | ) | (2,335 | ) | ||||||
| Net change in interest payable, accounts payable and accrued expenses |
2,069 | (1,858 | ) | (1,087 | ) | |||||||
| Net cash provided by operating activities |
15,940 | 8,241 | 7,664 | |||||||||
| Cash flows from investing activities: |
||||||||||||
| Purchases of investment securities available for sale |
(25,792 | ) | (21,083 | ) | (16,612 | ) | ||||||
| Purchases of mortgage backed securities available for sale |
(530,920 | ) | (117,401 | ) | (16,819 | ) | ||||||
| Purchases of FHLB and FRB stock |
(2,724 | ) | (2,320 | ) | (1,981 | ) | ||||||
| Proceeds from callable investment securities available for sale |
11,039 | 11,613 | 1,250 | |||||||||
| Proceeds from maturities of investment securities available for sale |
5,993 | 5,614 | 38,000 | |||||||||
| Proceeds from pay-downs of mortgage backed securities available for sale |
143,570 | 32,761 | 32,486 | |||||||||
| Proceeds from sales of investment securities available for sale |
43,333 | 26,012 | 10,966 | |||||||||
| Proceeds from sales of mortgage backed securities available for sale |
159,524 | 12,022 | — | |||||||||
| Proceeds from sales of FHLB and FRB stock |
143 | 2,401 | 135 | |||||||||
| Purchase of bank owned life insurance |
(5,000 | ) | — | — | ||||||||
| Increase in loans, net of repayments |
(93,977 | ) | (59,126 | ) | (62,840 | ) | ||||||
| Purchases of premises and equipment, net |
(3,917 | ) | (9,209 | ) | (8,615 | ) | ||||||
| Proceeds from the sale of premises and equipment, net |
92 | 2,204 | — | |||||||||
| Proceeds from sale of bank shell |
— | — | 1,000 | |||||||||
| Proceeds from sale of other real estate owned |
4,419 | 590 | 210 | |||||||||
| Net cash from acquisition of Valrico State bank |
— | — | 7,650 | |||||||||
| Net cash from acquisition of Ocala branches |
155,640 | — | — | |||||||||
| Net cash used in investing activities |
(138,577 | ) | (115,922 | ) | (15,170 | ) | ||||||
| Cash flows from financing activities: |
||||||||||||
| Net increase (decrease) in deposits |
132,536 | 21,146 | (50,777 | ) | ||||||||
| Net increase (decrease) in securities sold under agreement to repurchase |
3,105 | (6,671 | ) | (19,664 | ) | |||||||
| Net increase in federal funds purchased |
55,963 | 88,976 | — | |||||||||
| Net (decrease) increase in other borrowed funds |
(4,750 | ) | (16,768 | ) | 31,518 | |||||||
| Net proceeds from preferred stock and warrant issuance |
— | 27,760 | — | |||||||||
| Redemption of perpetual preferred stock |
(27,875 | ) | — | — | ||||||||
| Repurchase of TARP warrant |
(212 | ) | — | — | ||||||||
| Adjustment to net proceeds from preferred stock and warrant issue |
(6 | ) | — | — | ||||||||
| Net proceeds from public stock offering |
80,879 | — | — | |||||||||
| Stock options exercised, including tax benefit |
187 | 335 | 676 | |||||||||
| Dividends paid |
(2,335 | ) | (1,993 | ) | (1,820 | ) | ||||||
| Net cash provided by (used in ) financing activities |
237,492 | 112,785 | (40,067 | ) | ||||||||
| Net increase (decrease) in cash and cash equivalents |
114,855 | 5,104 | (47,573 | ) | ||||||||
| Cash and cash equivalents, at beginning of year |
77,552 | 72,448 | 120,021 | |||||||||
| Cash and cash equivalents, at end of year |
$ | 192,407 | $ | 77,552 | $ | 72,448 | ||||||
74
Table of Contents
CENTERSTATE BANKS, INC. AND SUBSIDIARIES
Consolidated Statements of Cash Flows (continued)
Years ended December 31, 2009, 2008, and 2007
(in thousands of dollars)
| 2009 | 2008 | 2007 | |||||||
| Transfer of loans to other real estate owned |
$ | 13,081 | $ | 4,986 | $ | 798 | |||
| Shares issued pursuant to acquisitions |
$ | — | $ | — | $ | 22,443 | |||
| Cash paid during the year for: |
|||||||||
| Interest |
$ | 23,932 | $ | 28,328 | $ | 32,568 | |||
| Income taxes |
$ | 892 | $ | 2,796 | $ | 4,292 | |||
See accompanying notes to the consolidated financial statements.
75
Table of Contents
CENTERSTATE BANKS, INC. AND SUBSIDIARIES
Notes to Consolidated Financial Statements
(amounts are in thousands of dollars, except per share data)
December 31, 2009, 2008 and 2007
| (1) | Nature of Operations and Summary of Significant Accounting Policies |
The consolidated financial statements of CenterState Banks, Inc. (the “Company”) include the accounts of CenterState Banks, Inc. (the “Parent Company”), its four wholly owned subsidiary banks (CenterState Bank of Florida, N.A., CenterState Bank, N.A., CenterState Bank Central Florida, N.A. and Valrico State Bank) and their wholly owned subsidiary, CenterState Shared Services (“CSS”).
The Company, through its subsidiary banks, operates through 38 full service banking locations in ten counties throughout Central Florida, providing traditional deposit and lending products and services to its commercial and retail customers. CSS is a 100% owned subsidiary, which provides information technology, item processing, credit analysis, single family mortgage loan brokerage and human resource services for the Company’s four subsidiary banks. The Company’s primary deposit products are checking, savings and term certificate accounts, and its primary lending products include commercial real estate loans, residential real estate loans, commercial loans and consumer loans. Substantially all loans are secured by commercial real estate, residential real estate, business assets or consumer assets. There are no significant concentrations of loans to any one industry or customer. However, the customers’ ability to repay their loans is dependent on the real estate and general economic conditions in the area.
The Company also operates a correspondent banking and bond sales division. The division is integrated with and part of the lead subsidiary bank located in Winter Haven, Florida, although the majority of the bond salesmen and traders are physically located in leased facilities in Birmingham, Alabama and Atlanta, Georgia. The primary revenue generating activity of this division is commissions earned on fixed income security sales. Other revenue generating activities include correspondent bank deposits (i.e. federal funds purchased), correspondent bank checking accounts, fees earned from safe-keeping activities, bond accounting services for correspondents, and asset/liability consulting related activities.
The following is a description of the basis of presentation and the significant accounting and reporting policies, which the Company follows in preparing and presenting its consolidated financial statements.
| (a) | Principles of consolidation |
The accompanying consolidated financial statements include the accounts of the Parent Company, its four wholly owned banking subsidiaries (the “Banks”) and their wholly owned subsidiary, CSS. The operations of the Company currently consist primarily of the operations of each of the four banks. All significant intercompany accounts and transactions have been eliminated in consolidation.
| (b) | Use of estimates |
The preparation of the consolidated financial statements in conformity with accounting principles generally accepted in the United States of America with U.S. generally accepted accounting principles requires management to make estimates and assumptions that affect the reported amounts of assets and liabilities and disclosure of contingent assets and liabilities at the date of the financial statements and the reported amount of revenues and expenses during the reporting period. Significant items subject to estimates and assumptions include allowance for loan losses, fair values of financial instruments, useful life of intangibles and valuation of goodwill, fair value estimates of stock-based compensation, fair value estimates of OREO, and deferred tax assets. Actual results could differ from these estimates.
76
Table of Contents
CENTERSTATE BANKS, INC. AND SUBSIDIARIES
Notes to Consolidated Financial Statements—(Continued)
(amounts are in thousands of dollars, except per share data)
December 31, 2009, 2008 and 2007
| (c) | Cash flow reporting |
For purposes of the statement of cash flows, the Company considers cash and due from banks, federal funds sold, money market and non interest bearing deposits in other banks with a purchased maturity of three months or less to be cash equivalents. Net cash flows are reported for customer loan and deposit transactions, interest bearing deposits in other financial institutions, federal funds purchased, repurchase agreements, proceeds from capital offering and other borrowed funds.
| (d) | Trading securities |
The Company engages in trading activities for its own account. Securities that are held principally for resale in the near term are recorded at fair value with changes in fair value included in earnings. Interest is included in net interest income.
| (e) | Investment securities available for sale |
Debt securities not classified as held to maturity or trading are classified as available for sale. Securities available for sale are carried at fair value, with unrealized holding gains and losses reported in other comprehensive income, net of tax.
Interest income includes amortization of purchase premium or discount. Premiums and discounts on securities are amortized on the level-yield method without anticipating prepayments, except for mortgage backed securities where prepayments are anticipated. Gains and losses on sales are recorded on the trade date and determined using the specific identification method.
The assessment of whether an other-than-temporary decline exist involves a high degree of subjectivity and judgment and is based on the information available to management at a point in time. Management evaluates securities for other-than-temporary impairment at least on a quarterly basis, and more frequently when economic or market conditions warrant such an evaluation.
| (f) | Bond commissions revenue recognition |
Bond sales transactions and related revenue and expenses are recorded on a settlement date basis. The effect on the financial statements of using the settlement date basis rather than the trade date basis is not material.
| (g) | Loans |
Loans receivable that management has the intent and the Company has the ability to hold for the foreseeable future or payoff are reported at their outstanding unpaid principal balance, net of deferred loan fees and costs, and an allowance for loan losses.
Loan origination fees and the incremental direct cost of loan origination, are capitalized and recognized in interest income over the contractual life of the loans. If the loan is prepaid, the remaining unamortized fees and costs are charged or credited to interest income. Amortization ceases for non-accrual loans.
Loans are placed on nonaccrual status when the loan becomes 90 days past due as to interest or principal, or when the full timely collection of interest or principal becomes uncertain, unless the loan is both well secured and in the process of collection. All interest accrued but not received for loans
77
Table of Contents
CENTERSTATE BANKS, INC. AND SUBSIDIARIES
Notes to Consolidated Financial Statements—(Continued)
(amounts are in thousands of dollars, except per share data)
December 31, 2009, 2008 and 2007
placed on nonaccrual, is reversed against interest income. Interest received on such loans is accounted for on the cash-basis or cost-recovery method, until qualifying for return to accrual. Loans are returned to accrual status when all the principal and interest amounts contractually due are brought current and future payments are reasonably assured. Non real estate consumer loans are typically charged off no later than 120 days past due.
The Company, considering current information and events regarding the borrower’s ability to repay their obligations, considers a loan to be impaired when it is probable that the Company will be unable to collect all amounts due according to the contractual terms of the loan agreement. When a loan is considered to be impaired, the amount of the impairment is measured based on the present value of expected future cash flows discounted at the loan’s effective interest rate, the secondary market value of the loan, or the fair value of the collateral for collateral dependent loans. Impaired loans are written down to the extent that principal is judged to be uncollectible and, in the case of impaired collateral dependent loans where repayment is expected to be provided solely by the underlying collateral and there is no other available and reliable sources of repayment, are written down to the lower of cost or collateral value. Impairment losses are included in the allowance for loan losses. Large groups of smaller balance homogeneous loans, such as consumer and residential real estate loans, are collectively evaluated for impairment, and accordingly, they are not separately identified for impairment disclosures.
| (h) | Concentration of credit risk |
Most of the Company’s business activity is with customers located within central Florida. Therefore, the Company’s exposure to credit risk is significantly affected by changes in the economy and the real estate market within central Florida.
| (i) | Allowance for loan losses |
The allowance for loan losses is a valuation allowance for probable incurred credit losses. Loan losses are charged against the allowance when management believes the uncollectibility of a loan balance is confirmed. Subsequent recoveries, if any, are credited to the allowance. Management estimates the allowance balance required using past loan loss experience, the nature and volume of the portfolio, information about specific borrower situations and estimated collateral values, economic conditions, and other factors. Allocations of the allowance may be made for specific loans, but the entire allowance is available for any loan that, in management’s judgment, should be charged-off.
The allowance consists of specific and general components. The specific component relates to loans that are individually classified as impaired. The general component covers loans that are not individually classified as impaired and is based on historical loss experience adjusted for current factors.
A loan is impaired when, based on current information and events, it is probable that the Company will be unable to collect all amounts due according to the contractual terms of the loan agreement. Loans, for which the terms have been modified, and for which the borrower is experiencing financial difficulties, are considered troubled debt restructurings and classified as impaired.
Commercial, commercial real estate, land, acquisition and development, and construction loans over $250 are individually evaluated for impairment. If a loan is impaired, a portion of the allowance is
78
Table of Contents
CENTERSTATE BANKS, INC. AND SUBSIDIARIES
Notes to Consolidated Financial Statements—(Continued)
(amounts are in thousands of dollars, except per share data)
December 31, 2009, 2008 and 2007
allocated so that the loan is reported, net, at the present value of estimated future cash flows using the loan’s existing rate or at the fair value of collateral if repayment is expected solely from the collateral. Large groups of smaller balance homogeneous loans, such as consumer and residential real estate loans, are collectively evaluated for impairment, and accordingly, they are not separately identified for impairment disclosures. Troubled debt restructurings are measured at the present value of estimated future cash flows using the loan’s effective rate at inception.
| (j) | Foreclosed assets |
Assets acquired through or instead of loan foreclosure are initially recorded at lower of cost or fair value less costs to sell when acquired, establishing a new cost basis. If fair value declines subsequent to foreclosure, a valuation allowance is recorded through expense. Operating costs after acquisition are expensed.
| (k) | Premises and equipment |
Company premises and equipment are stated at cost less accumulated depreciation. Depreciation is provided on a straight-line basis over the estimated useful lives of the related assets (3 to 40 years). Leasehold improvements are depreciated over the shorter of their useful lives or the term of the lease. Major renewals and betterments of property are capitalized; maintenance, repairs, and minor renewals and betterments are expensed in the period incurred. Upon retirement or other disposition of the asset, the asset cost and related accumulated depreciation are removed from the accounts, and gains or losses are included in income.
| (l) | Federal Home Loan Bank (FHLB) and Federal Reserve Bank (FRB) stock |
The Company’s banks are members of the FHLB and FRB system. Members are required to own a certain amount of stock based on the level of borrowings and other factors, and may invest in additional amounts. FHLB and FRB stock is carried at cost, classified as a restricted security, and periodically evaluated for impairment based on ultimate recovery of par value. Both cash and stock dividends are reported as income.
| (m) | Bank owned life insurance (BOLI) |
The Company, through its subsidiary banks, has purchased life insurance policies on certain key executives. Bank owned life insurance is recorded at the amount that can be realized under the insurance contract at the balance sheet date, which is the cash surrender value adjusted for other charges or other amounts due that are probable at settlement.
| (n) | Goodwill and intangible assets |
Goodwill resulting from business combinations prior to January 1, 2009 represents the excess of the purchase price over the fair value of the net assets of businesses acquired. Goodwill resulting from business combinations after January 1, 2009, is generally determined as the excess of the fair value of the consideration transferred, plus the fair value of any noncontrolling interests in the acquiree, over the fair value of the net assets acquired and liabilities assumed as of the acquisition date. Goodwill and
79
Table of Contents
CENTERSTATE BANKS, INC. AND SUBSIDIARIES
Notes to Consolidated Financial Statements—(Continued)
(amounts are in thousands of dollars, except per share data)
December 31, 2009, 2008 and 2007
intangible assets acquired in a purchase business combination and determined to have an indefinite useful life are not amortized, but tested for impairment at least annually. The Company has selected November 30 as the date to perform the annual impairment test. Intangible assets with definite useful lives are amortized over their estimated useful lives to their estimated residual values. Goodwill is the only intangible asset with an indefinite life on the Company’s balance sheet.
The core deposit intangibles are intangible assets arising from either whole bank acquisitions or branch acquisitions. They are initially measured at fair value and then amortized over a ten-year period on an accelerated basis using the projected decay rates of the underlying core deposits.
| (o) | Long-term assets |
Premises and equipment, core deposit and other intangible assets, and other long-term assets are reviewed for impairment when events indicate their carrying amount may not be recoverable from future undiscounted cash flows. If impaired, the assets are recorded at fair value.
| (p) | Loan commitments and related financial instruments |
Financial instruments include off-balance sheet credit instruments, such as commitments to make loans and commercial letters of credit, issued to meet customer financing needs. The face amount for these items represents the exposure to loss, before considering customer collateral or ability to repay. Such financial instruments are recorded when they are funded.
| (q) | Stock-based compensation |
Compensation cost is recognized for stock options and restricted stock awards issued to employees, based on the fair value of these awards at the date of grant. A Black-Scholes model is utilized to estimate the fair value of stock options, while the market price of the Company’s common stock at the date of grant is used for restricted stock awards. Compensation cost is recognized over the required service period, generally defined as the vesting period.
| (r) | Retirement plans |
Employee 401(k) plan expense is the amount of matching contributions. Deferred compensation and supplemental retirement plan expense allocates the benefits over years of service.
| (s) | Marketing and advertising costs |
Marketing and advertising costs are expensed as incurred.
| (t) | Income taxes |
Income tax expense is the total of the current year income tax due or refundable and the change in deferred tax assets and liabilities. Deferred tax assets and liabilities are the expected future tax amounts for the temporary differences between carrying amounts and tax bases of assets and liabilities, computed using enacted tax rates. A valuation allowance, if needed, reduces deferred tax assets to the amount expected to be realized.
80
Table of Contents
CENTERSTATE BANKS, INC. AND SUBSIDIARIES
Notes to Consolidated Financial Statements—(Continued)
(amounts are in thousands of dollars, except per share data)
December 31, 2009, 2008 and 2007
The Company adopted guidance issued by the FASB with respect to accounting for uncertainty in income taxes as of January 1, 2007. A tax position is recognized as a benefit only if it is “more likely than not” that the tax position would be sustained in a tax examination, with a tax examination being presumed to occur. The amount recognized is the largest amount of tax benefit that is greater than 50% likely of being realized on examination. For tax positions not meeting the “more likely than not” test, no tax benefit is recorded. The adoption had no affect on the Company’s financial statements.
The Company recognizes interest and/or penalties related to income tax matters in other expenses.
| (u) | Basic earnings per common share |
Basic earnings per common share is net income available to common shareholders divided by the weighted average number of common shares outstanding during the period. All outstanding unvested share-based payment awards that contain rights to nonforfeitable dividends are considered participating securities for this calculation. Diluted earnings per common share includes the dilutive effect of additional potential common shares issuable under stock options. Earnings and dividends per share are restated for all stock splits and stock dividends through the date of issuance of the financial statements.
| (v) | Comprehensive income |
Comprehensive income consists of net income and other comprehensive income. Other comprehensive income includes unrealized gains and losses on securities available for sale, which are also recognized as separate components of shareholders’ equity.
| (w) | Loss contingencies |
Loss contingencies, including claims and legal actions arising in the ordinary course of business, are recorded as liabilities when the likelihood of loss is probable and an amount or range of loss can be reasonably estimated. Management does not believe there now are such matters that will have a material effect on the financial statements.
| (x) | Restrictions on cash |
Cash on hand or on deposit with the Federal Reserve Bank was required to meet regulatory reserve and clearing requirements. These balances generally do not earn interest.
| (y) | Dividend restriction |
Banking regulations require maintaining certain capital levels and may limit the dividends paid by the banks to the holding company or by the holding company to stockholders.
| (z) | Fair value of financial instruments |
Fair values of financial instruments are estimated using relevant market information and other assumptions, as more fully disclosed in a separate note. Fair value estimates involve uncertainties and matters of significant judgment regarding interest rates, credit risk, prepayments, and other factors, especially in the absence of broad markets for particular items. Changes in assumptions or in market conditions could significantly affect the estimates.
81
Table of Contents
CENTERSTATE BANKS, INC. AND SUBSIDIARIES
Notes to Consolidated Financial Statements—(Continued)
(amounts are in thousands of dollars, except per share data)
December 31, 2009, 2008 and 2007
| (aa) | Segment reporting |
The Company’s recently initiated correspondent banking and bond sales division represents a distinct reportable segment which differs from the Company’s primary business of commercial and retail banking in central Florida. Accordingly, a reconciliation of reportable segment revenues, expenses and profit to the Company’s consolidated total has been presented in note 23.
| (ab) | Reclassifications |
Some items in the prior year financial statements were reclassified to conform to the current presentation.
| (ac) | Effect of new pronouncements |
In September 2006, the FASB issued Statement No. 157, Fair Value Measurements (ASC 820-10). This Statement defines fair value, establishes a framework for measuring fair value and expands disclosures about fair value measurements. This Statement also establishes a fair value hierarchy about the assumptions used to measure fair value and clarifies assumptions about risk and the effect of a restriction on the sale or use of an asset. The standard was effective for fiscal years beginning after November 15, 2007. In February 2008, the FASB issued Staff Position (FSP) No. 157-2, Effective Date of FASB Statement No. 157, which is currently FASB ASC 820-10. This FSP delayed the effective date of FAS 157 for all nonfinancial assets and nonfinancial liabilities, except those that are recognized or disclosed at fair value on a recurring basis (at least annually) to fiscal years beginning after November 15, 2008, and interim periods within those fiscal years. The effect of adopting this new guidance was not material.
In December 2007, the FASB issued Statement of Financial Accounting Standards No. 141 (revised 2007), Business Combinations (ASC 805). ASC 805 establishes principles and requirements for how an acquirer recognizes and measures in its financial statements the identifiable assets acquired, the liabilities assumed, and any noncontrolling interest in an acquiree, including the recognition and measurement of goodwill acquired in a business combination. ASC 805 was effective for fiscal years beginning on or after December 15, 2008. The effect of adopting this new guidance was not material.
In March 2008, the FASB issued SFAS No. 161, “Disclosures about Derivative Instruments and Hedging Activities, an amendment of SFAS No. 133” (ASC 815) which amends and expands the disclosure requirements of SFAS No. 133 for derivative instruments and hedging activities. ASC 815 requires qualitative disclosure about objectives and strategies for using derivative and hedging instruments, quantitative disclosures about fair value amounts of the instruments and gains and losses on such instruments, as well as disclosures about credit-risk features in derivative agreements. ASC 815 was effective for financial statements issued for fiscal years and interim periods beginning after November 15, 2008. The effect of adopting this new guidance was not material.
82
Table of Contents
CENTERSTATE BANKS, INC. AND SUBSIDIARIES
Notes to Consolidated Financial Statements—(Continued)
(amounts are in thousands of dollars, except per share data)
December 31, 2009, 2008 and 2007
In June 2009, the FASB issued Statement of Financial Accounting Standards No. 168, The FASB Accounting Standards Codification and the Hierarchy of Generally Accepted Accounting Principles, to replace Statement 162, The Hierarchy of Generally Accepted Accounting Principles, and to establish the FASB Accounting Standards Codification TM as the source of authoritative accounting principles recognized by the FASB to be applied by nongovernmental entities in the preparation of financial statements in conformity with GAAP. Rules and interpretive releases of the Securities and Exchange Commission under authority of federal securities laws are also sources of authoritative GAAP for SEC registrants. The Codification was effective for financial statements issued for periods after September 15, 2009.
In June 2008, the FASB issued FASB Staff Position EITF 03-6-1—Determining Whether Instruments Granted in Share-Based Payment Transactions Are Participating Securities ( ASC 260-10). This FASB Staff Position (FSP) addresses whether instruments granted in share-based payment transactions are participating securities prior to vesting and, therefore, included in the earnings allocation in computing earnings per share (EPS) under the two-class method. ASC 260-10 provides that unvested share-based payment awards that contain non-forfeitable rights to dividends or dividend equivalents (whether paid or unpaid) are participating securities and shall be included in the computation of EPS pursuant to the two-class method. This FSP was effective for financial statements issued for fiscal years beginning after December 15, 2008, and interim periods within those years. All prior-period EPS data presented were to be adjusted retrospectively (including interim financial statements, summaries of earnings, and selected financial data) to conform to the provisions of this FSP. The effect of adopting this new guidance was not material.
In April 2009, the FASB issued Staff Position No. 115-2 and No. 124-2, Recognition and Presentation of Other-Than-Temporary Impairments (ASC 320-10), which amended existing guidance for determining whether impairment is other-than-temporary for debt securities. The requires an entity to assess whether it intends to sell, or it is more likely than not that it will be required to sell, a security in an unrealized loss position before recovery of its amortized cost basis. If either of these criteria is met, the entire difference between amortized cost and fair value is recognized as impairment through earnings. For securities that do not meet the aforementioned criteria, the amount of impairment is split into two components as follows: 1) other-than-temporary impairment (OTTI) related to other factors, which is recognized in other comprehensive income and 2) OTTI related to credit loss, which must be recognized in the income statement. The credit loss is determined as the difference between the present value of the cash flows expected to be collected and the amortized cost basis. Additionally, disclosures
83
Table of Contents
CENTERSTATE BANKS, INC. AND SUBSIDIARIES
Notes to Consolidated Financial Statements—(Continued)
(amounts are in thousands of dollars, except per share data)
December 31, 2009, 2008 and 2007
about other-than-temporary impairments for debt and equity securities were expanded. ASC 320-10 was effective for interim and annual reporting periods ending June 15, 2009. The effect of adopting this new guidance was not material.
In April 2009, the FASB issued Staff Position (FSP) No. 157-4, Determining Fair Value When the Volume and Level of Activity for the Asset and Liability Have Significantly Decreased and Identifying Transactions That Are Not Orderly (ASC 820-10). This FSP emphasizes that the objective of a fair value measurement does not change even when market activity for the asset or liability has decreased significantly. Fair value is the price that would be received for an asset sold or paid to transfer a liability in an orderly transaction (that is, not a forced liquidation or distressed sale) between market participants at the measurement date under current market conditions. When observable transactions or quoted prices are not considered orderly, then little, if any, weight should be assigned to the indication of the asset or liability’s fair value. Adjustments to those transactions or prices would be needed to determine the appropriate fair value. The FSP, which was applied prospectively, was effective for interim and annual reporting periods ending after June 15, 2009. The effect of adopting this new guidance was not material.
In August 2009, the FASB issued Accounting Standards Update (“ASU”) No. 2009-05, Measuring Liabilities at Fair Value (ASC 820). This Update provides amendments to ASC 820 for the fair value measurement of liabilities by clarifying that in circumstances in which a quoted price in an active market for the identical liability is not available, a reporting entity is required to measure fair value using a valuation technique that uses the quoted price of the identical liability when traded as an asset, quoted prices for similar liabilities or similar liabilities when traded as assets, or that is consistent with the principles of ASC 820. The amendments in this guidance also clarify that both a quoted price for the identical liability at the measurement date and the quoted price for the identical liability when traded as an asset in an active market when no adjustments to the quoted price of the asset are required are Level 1 fair value measurements. The guidance was effective for the first reporting period (including interim periods) beginning after issuance. The effect of adopting this new guidance was not material.
Newly Issued Not Yet Effective Standards
In June 2009, the FASB issued Statement of Financial Accounting Standards No. 166, Accounting for Transfers of Financial Assets, an Amendment of FASB Statement No. 140 (ASC 810). The new accounting requirement amends previous guidance relating to the transfers of financial assets and eliminates the concept of a qualifying special purpose entity. This Statement must be applied as of the beginning of each reporting entity’s first annual reporting period that begins after November 15, 2009, for interim periods within that first annual reporting period and for interim and annual reporting periods thereafter. This Statement must be applied to transfers occurring on or after the effective date. Additionally, on and after the effective date, the concept of a qualifying special-purpose entity is no longer relevant for accounting purposes. Therefore, formerly qualifying special-purpose entities should be evaluated for consolidation by reporting entities on and after the effective date in accordance with the applicable consolidation guidance. Additionally, the disclosure provisions of this Statement were also amended and apply to transfers that occurred both before and after the effective date of this Statement. The effect of adopting this new guidance is not expected to be material.
84
Table of Contents
CENTERSTATE BANKS, INC. AND SUBSIDIARIES
Notes to Consolidated Financial Statements—(Continued)
(amounts are in thousands of dollars, except per share data)
December 31, 2009, 2008 and 2007
| (2) | Trading Securities |
During the third quarter of 2009, the Company initiated a trading securities portfolio at its lead subsidiary bank. Realized and unrealized gains and losses are included in trading securities revenue, a component of non interest income. Securities purchased for this portfolio have primarily been municipal securities. A list of the activity in this portfolio for 2009 is summarized below.
| Beginning balance |
$ | — | ||
| Purchases |
32,714 | |||
| Proceeds from sales |
(33,141 | ) | ||
| Net realized gain on sales |
427 | |||
| Ending balance |
$ | — | ||
| (3) | Investment Securities Available for Sale |
All of the mortgaged back securities listed below are residential FNMA and FHLMC MBSs. The fair value of available for sale securities and the related gross unrealized gains and losses recognized in accumulated other comprehensive income (loss) were as follows:
| December 31, 2009 | ||||||||||||
| Amortized Cost |
Gross Unrealized Gains |
Gross Unrealized Losses |
Fair Value | |||||||||
| Obligations of U.S. government agencies |
$ | 17,826 | $ | 128 | $ | 44 | $ | 17,910 | ||||
| Mortgage backed securities |
398,482 | 11,467 | 169 | 409,780 | ||||||||
| Municipal securities |
35,376 | 396 | 276 | 35,496 | ||||||||
| Total |
$ | 451,684 | $ | 11,991 | $ | 489 | $ | 463,186 | ||||
| December 31, 2008 | ||||||||||||
| Amortized Cost |
Gross Unrealized Gains |
Gross Unrealized Losses |
Fair Value | |||||||||
| U.S. treasury securities |
$ | 1,000 | $ | 28 | $ | — | $ | 1,028 | ||||
| Obligations of U.S. government agencies |
23,031 | 566 | — | 23,597 | ||||||||
| Mortgage backed securities |
188,218 | 3,798 | 33 | 191,983 | ||||||||
| Municipal securities |
37,136 | 135 | 1,799 | 35,472 | ||||||||
| Total |
$ | 249,385 | $ | 4,527 | $ | 1,832 | $ | 252,080 | ||||
Sales of available for sale securities were as follows:
| 2009 | 2008 | 2007 | |||||||
| Proceeds |
$ | 202,857 | $ | 38,034 | $ | 10,966 | |||
| Gross gains |
$ | 2,567 | $ | 667 | $ | 7 | |||
| Gross losses |
$ | 51 | $ | 6 | $ | — | |||
The tax provisions related to these net realized gains were $947, $249 and $3, respectively.
85
Table of Contents
CENTERSTATE BANKS, INC. AND SUBSIDIARIES
Notes to Consolidated Financial Statements—(Continued)
(amounts are in thousands of dollars, except per share data)
December 31, 2009, 2008 and 2007
The fair value of available for sale securities at year end 2009 by contractual maturity were as follows. Securities not due at a single maturity date, primarily mortgage-backed securities, are shown separately.
| Fair Value | |||
| Investment securities available for sale |
|||
| Due in one year or less |
$ | 4,351 | |
| Due after one year through five years |
4,676 | ||
| Due after five years through ten years |
10,873 | ||
| Due after ten years through thirty years |
33,506 | ||
| Mortgage backed securities |
409,780 | ||
| $ | 463,186 | ||
Securities pledged at December 31, 2009 and 2008 had a carrying amount (estimated fair value) of $214,785 and $113,832, respectively. These securities were pledged primarily to secure public deposits and repurchase agreements.
At year-end 2009 and 2008, there were no holdings of securities of any one issuer, other than the U.S. Government and its agencies, in an amount greater than 10% of stockholders’ equity.
The following tables show the Company’s investments’ gross unrealized losses and fair value, aggregated by investment category and length of time the individual securities have been in a continuous unrealized loss position, at December 31, 2009 and 2008.
| December 31, 2009 | ||||||||||||||||||
| Less than 12 months | 12 months or more | Total | ||||||||||||||||
| Fair Value |
Unrealized Losses |
Fair Value |
Unrealized Losses |
Fair Value |
Unrealized Losses | |||||||||||||
| Obligations of U.S. government agencies |
$ | 7,287 | $ | 44 | $ | — | $ | — | $ | 7,287 | $ | 44 | ||||||
| Mortgage backed securities |
46,537 | 169 | — | — | 46,537 | 169 | ||||||||||||
| Municipal securities |
7,713 | 236 | 892 | 40 | 8,605 | 276 | ||||||||||||
| Total temporarily impaired securities |
$ | 61,537 | $ | 449 | $ | 892 | $ | 40 | $ | 62,429 | $ | 489 | ||||||
| December 31, 2008 | ||||||||||||||||||
| Less than 12 months | 12 months or more | Total | ||||||||||||||||
| Fair Value |
Unrealized Losses |
Fair Value |
Unrealized Losses |
Fair Value |
Unrealized Losses | |||||||||||||
| Mortgage backed securities |
$ | 8,969 | $ | 31 | $ | 1,347 | $ | 2 | $ | 10,316 | $ | 33 | ||||||
| Municipal securities |
26,844 | 1,689 | 1,390 | 110 | 28,234 | 1,799 | ||||||||||||
| Total temporarily impaired securities |
$ | 35,813 | $ | 1,720 | $ | 2,737 | $ | 112 | $ | 38,550 | $ | 1,832 | ||||||
Mortgage-backed securities: The unrealized losses on investments in mortgage-backed securities were caused by interest rate increases. Fannie Mae guarantees the contractual cash flows of these securities. It is expected that the securities would not be settled at a price less than the par value of the investment. Because the decline in fair value is attributable to changes in interest rates and not credit quality, and because the Company does not intend to sell these investments or more likely than not will not be required to sell these
86
Table of Contents
CENTERSTATE BANKS, INC. AND SUBSIDIARIES
Notes to Consolidated Financial Statements—(Continued)
(amounts are in thousands of dollars, except per share data)
December 31, 2009, 2008 and 2007
investments before their anticipated recovery, these investments are not considered other-than-temporarily impaired.
Municipal securities: Unrealized losses on municipal securities have not been recognized into income because the issuers bonds are of high quality, and because management does not intend to sell these investments or more likely than not will not be required to sell these investments before their anticipated recovery. The fair value is expected to recover as the securities approach maturity.
| (4) | Loans |
Major categories of loans included in the loan portfolio as of December 31, 2009 and 2008 are:
| December 31, | ||||||
| 2009 | 2008 | |||||
| Real estate: |
||||||
| Residential |
$ | 251,634 | $ | 223,290 | ||
| Commercial |
438,540 | 434,488 | ||||
| Construction, development, land |
115,937 | 92,475 | ||||
| Total real estate |
806,111 | 750,253 | ||||
| Commercial |
98,273 | 80,523 | ||||
| Consumer and other loans |
55,376 | 61,939 | ||||
| 959,760 | 892,715 | |||||
| Less: Deferred loan origination fees, net |
739 | 714 | ||||
| Total loans |
959,021 | 892,001 | ||||
| Less: Allowance for loan losses |
23,289 | 13,335 | ||||
| Total net loans |
$ | 935,732 | $ | 878,666 | ||
The following is a summary of information regarding impaired loans at December 31, 2009 and 2008:
| Individually impaired loans were as follows: |
December 31, | |||||
| 2009 | 2008 | |||||
| Impaired loans with no allocated allowance for loan losses |
$ | 63,557 | $ | 17,575 | ||
| Impaired loans with allocated allowance for loan losses |
15,391 | 6,616 | ||||
| Total |
$ | 78,948 | $ | 24,191 | ||
| Amount of the allowance for loan losses allocated to impaired loans |
$ | 4,612 | $ | 1,799 | ||
| 2009 | 2008 | 2007 | |||||||
| Average of impaired loans during the year |
$ | 42,962 | $ | 19,526 | $ | 6,094 | |||
Interest income recognized on impaired loans during the impairment period during 2009 and 2008 was $1,731 and $867, respectively. Cash basis interest income recognized during these same periods was $1,590 and $795, respectively.
Non performing loans include both smaller balance homogeneous loans that are collectively evaluated for impairment and individually classified impaired loans.
87
Table of Contents
CENTERSTATE BANKS, INC. AND SUBSIDIARIES
Notes to Consolidated Financial Statements—(Continued)
(amounts are in thousands of dollars, except per share data)
December 31, 2009, 2008 and 2007
| Non performing loans were as follows: |
December 31, | |||||
| 2009 | 2008 | |||||
| Non accrual loans |
$ | 42,059 | $ | 19,863 | ||
| Loans past due over 90 days and still accruing interest |
282 | 50 | ||||
| Total non performing loans |
$ | 42,341 | $ | 19,913 | ||
Included in the Company’s $4,612 of total specific reserves, is $2,739 of specific reserves which the Company has allocated to customers whose loan terms have been modified in troubled debt restructurings as of December 31, 2009. The Company has not committed to lend additional amounts to customers with outstanding loans that are classified as troubled debt restructurings.
Changes in the allowance for loan losses for the years ended December 31, 2009, 2008 and 2007, are as follows:
| December 31, | ||||||||||||
| 2009 | 2008 | 2007 | ||||||||||
| Balance, beginning of year |
$ | 13,335 | $ | 10,828 | $ | 7,355 | ||||||
| Provision charged to operations |
23,896 | 6,520 | 2,792 | |||||||||
| Loans charged-off |
(14,083 | ) | (4,189 | ) | (997 | ) | ||||||
| Recoveries of previous charge-offs |
141 | 176 | 61 | |||||||||
| Acquisition of Valrico State Bank |
— | — | 1,617 | |||||||||
| Balance, end of year |
$ | 23,289 | $ | 13,335 | $ | 10,828 | ||||||
| (5) | Other real estate owned |
Other real estate owned means real estate acquired through or instead of loan foreclosure. Activity in the valuation allowance was as follows:
| 2009 | 2008 | 2007 | |||||||||
| Beginning of year |
$ | 339 | $ | — | $ | — | |||||
| Additions charged to expenses |
2,188 | 434 | — | ||||||||
| Sales and/or dispositions |
(823 | ) | (95 | ) | — | ||||||
| End of year |
$ | 1,704 | $ | 339 | $ | — | |||||
Expenses related to foreclosed real estate include:
| 2009 | 2008 | 2007 | |||||||
| Net loss on sales |
$ | 772 | $ | 51 | $ | 5 | |||
| Provision for unrealized losses |
2,188 | 434 | — | ||||||
| Operating expenses, net of rental income |
1,049 | 396 | 69 | ||||||
| Total |
$ | 4,009 | $ | 881 | $ | 74 | |||
88
Table of Contents
CENTERSTATE BANKS, INC. AND SUBSIDIARIES
Notes to Consolidated Financial Statements—(Continued)
(amounts are in thousands of dollars, except per share data)
December 31, 2009, 2008 and 2007
| (6) | Fair value |
Generally accepted accounting principles establishes a fair value hierarchy which requires an entity to maximize the use of observable inputs and minimize the use of unobservable inputs when measuring fair value. The standard describes three levels of inputs that may be used to measure fair value:
Level 1: Quoted prices (unadjusted) for identical assets or liabilities in active markets that the entity has the ability to access as of the measurement date.
Level 2: Significant other observable inputs other than Level 1 prices such as quoted prices for similar assets or liabilities; quoted prices in markets that are not active; or other inputs that are observable or can be corroborated by observable market data.
Level 3: Significant unobservable inputs that reflect a reporting entity’s own assumptions about the assumptions that market participants would use in pricing an asset or liability.
The fair values of securities available for sale are determined by obtaining quoted prices on nationally recognized securities exchanges (Level 1 inputs) or matrix pricing, which is a mathematical technique widely used in the industry to value debt securities without relying exclusively on quoted prices for the specific securities but rather by relying on the securities’ relationship to other benchmark quoted securities (Level 2 inputs).
Assets and liabilities measured at fair value on a recurring basis are summarized below.
| Fair value measurements using | ||||||||||
| at December 31, 2009 |
Quoted prices in active markets for identical assets (Level 1) |
Significant Other Observable Inputs (Level 2) |
Significant unobservable inputs (Level 3) | |||||||
| Assets: |
||||||||||
| Available for sale securities |
||||||||||
| U.S. government agencies |
$ | 17,910 | — | $ | 17,910 | — | ||||
| Mortgage backed securities |
409,780 | — | 409,780 | — | ||||||
| Municipal securities |
35,496 | — | 35,496 | — | ||||||
| at December 31, 2008 |
||||||||||
| Assets: |
||||||||||
| Available for sale securities |
||||||||||
| U.S. treasury securities |
$ | 1,028 | — | $ | 1,028 | — | ||||
| U.S. government agencies |
23,597 | — | 23,597 | — | ||||||
| Mortgage backed securities |
191,983 | — | 191,983 | — | ||||||
| Municipal securities |
35,472 | — | 35,472 | — | ||||||
89
Table of Contents
CENTERSTATE BANKS, INC. AND SUBSIDIARIES
Notes to Consolidated Financial Statements—(Continued)
(amounts are in thousands of dollars, except per share data)
December 31, 2009, 2008 and 2007
Assets and liabilities measured at fair value on a non-recurring basis are summarized below.
| Fair value measurements using | |||||||||||
| at December 31, 2009 |
Quoted prices in active markets for identical assets (Level 1) |
Significant other observable Inputs (Level 2) |
Significant unobservable inputs (Level 3) | ||||||||
| Assets: |
|||||||||||
| Impaired loans |
$ | 10,779 | — | — | $ | 10,779 | |||||
| Other real estate owned |
$ | 10,196 | — | — | $ | 10,196 | |||||
| at December 31, 2008 |
|||||||||||
| Assets |
|||||||||||
| Impaired loans |
$ | 4,817 | — | $ | 4,817 | — | |||||
| Other real estate owned |
$ | 4,494 | — | — | $ | 4,494 | |||||
Impaired loans, which are measured for impairment using the fair value of the collateral for collateral dependent loans, had a carrying amount of $15,391, with a valuation allowance of $4,612, at December 31, 2009, and a carrying amount of $6,616, with a valuation allowance of $1,799, at December 31, 2008. The net increase in the specific allowance for loan losses was $2,813 and $987 during the twelve month periods ending December 31, 2009 and 2008, respectively.
The fair value of impaired loans with specific allocations of the allowance for loan losses is generally based on recent real estate appraisals. These appraisals may utilize a single valuation approach or a combination of approaches including comparable sales and the income approach. Beginning with the reporting period ending June 30, 2009, the Company reclassified its impaired loans from a Level 2 to a Level 3 because of the volatility in the real estate market, the age of appraisals, and the periodic need, in managements’ judgment, to make adjustments to the appraisals to an amount which management expects to be ultimately collected.
The fair value of the Company’s other real estate owned is determined using Level 3 inputs which include current and prior appraisals and estimated costs to sell. The decline in fair value of other real estate owned was $2,188 and $434 during the twelve month periods ending December 31, 2009 and 2008, respectively. Changes in fair value were recorded directly as an adjustment to current earnings through non interest expense.
Fair Value of Financial Instruments
The methods and assumptions used to estimate fair value are described as follows:
Carrying amount is the estimated fair value for cash and cash equivalents, interest bearing deposits, accrued interest receivable and payable, demand deposits, short-term debt, and variable rate loans or deposits that reprice frequently and fully. Security fair values are based on market prices or dealer quotes, and if no such information is available, on the rate and term of the security and information about the issuer. For fixed rate loans or deposits and for variable rate loans or deposits with infrequent repricing or repricing limits, fair value is based on discounted cash flows using current market rates applied to the estimated life and credit risk. Fair values for impaired loans are estimated using underlying collateral values. Fair value of debt is
90
Table of Contents
CENTERSTATE BANKS, INC. AND SUBSIDIARIES
Notes to Consolidated Financial Statements—(Continued)
(amounts are in thousands of dollars, except per share data)
December 31, 2009, 2008 and 2007
based on current rates for similar financing. It was not practicable to determine the fair value of Federal Home Loan Bank stock or Federal Reserve Bank stock due to restrictions placed on its transferability. The fair value of off-balance-sheet items is not considered material.
The following tables present the carrying amounts and estimated fair values of the Company’s financial instruments:
| Dec 31, 2009 | Dec 31, 2008 | |||||||||||
| Carrying Amount |
Fair Value |
Carrying Amount |
Fair Value | |||||||||
| Financial assets: |
||||||||||||
| Cash and cash equivalents |
$ | 192,407 | $ | 192,407 | $ | 77,552 | $ | 77,552 | ||||
| Investment securities available for sale |
463,186 | 463,186 | 252,080 | 252,080 | ||||||||
| FHLB and FRB stock |
7,908 | n/a | 5,327 | n/a | ||||||||
| Loans, less allowance for loan losses of |
||||||||||||
| $23,289 and $13,335, at December 31, 2009 and 2008, respectively |
935,732 | 945,993 | 878,666 | 906,355 | ||||||||
| Accrued interest receivable |
6,378 | 6,378 | 5,406 | 5,406 | ||||||||
| Financial liabilities: |
||||||||||||
| Deposits- without stated maturities |
$ | 734,728 | $ | 734,728 | $ | 507,106 | $ | 507,106 | ||||
| Deposits- with stated maturities |
570,308 | 576,237 | 486,694 | 491,830 | ||||||||
| Securities sold under agreement to repurchase |
29,562 | 29,562 | 26,457 | 26,457 | ||||||||
| Federal funds purchased (correspondent bank deposits) |
144,939 | 144,939 | 88,976 | 88,976 | ||||||||
| Federal Home Loan Bank advances and other borrowed funds |
21,000 | 21,274 | 25,750 | 26,047 | ||||||||
| Corporate debentures |
12,500 | 6,865 | 12,500 | 7,608 | ||||||||
| Accrued interest payable |
1,268 | 1,268 | 1,410 | 1,410 | ||||||||
| (7) | Bank Premises and Equipment |
A summary of bank premises and equipment as of December 31, 2009 and 2008, is as follows:
| December 31, | ||||||
| 2009 | 2008 | |||||
| Land |
$ | 24,577 | $ | 25,180 | ||
| Land improvements |
682 | 671 | ||||
| Buildings |
36,315 | 34,463 | ||||
| Leasehold improvements |
1,370 | 1,320 | ||||
| Furniture, fixtures and equipment |
14,982 | 14,080 | ||||
| Construction in progress |
1,247 | 317 | ||||
| 79,173 | 76,031 | |||||
| Less: Accumulated depreciation |
16,805 | 14,688 | ||||
| $ | 62,368 | $ | 61,343 | |||
91
Table of Contents
CENTERSTATE BANKS, INC. AND SUBSIDIARIES
Notes to Consolidated Financial Statements—(Continued)
(amounts are in thousands of dollars, except per share data)
December 31, 2009, 2008 and 2007
The Company leases land and certain facilities under noncancellable operating leases. The following is a schedule of future minimum annual rentals under the noncancellable operating leases:
| Year ending December 31, |
|||
| 2010 |
$ | 683 | |
| 2011 |
695 | ||
| 2012 |
643 | ||
| 2013 |
633 | ||
| 2014 |
553 | ||
| $ | 3,207 | ||
Rent expense for the years ended December 31, 2009, 2008 and 2007, was $1,059, $684 and $626, respectively, and is included in occupancy expense in the accompanying Consolidated Statements of Operations.
| (8) | Goodwill and Intangible Assets |
Goodwill was a result of whole bank acquisitions, all within the Company’s commercial and retail banking segment. The change in balance for goodwill during the years 2009, 2008 and 2007 is as follows:
| 2009 | 2008 | 2007 | |||||||
| Beginning of year |
$ | 28,118 | $ | 28,118 | $ | 9,863 | |||
| Acquired goodwill |
4,722 | — | 18,255 | ||||||
| Impairment |
— | — | — | ||||||
| End of year |
$ | 32,840 | $ | 28,118 | $ | 28,118 | |||
Acquired intangible assets consists of core deposit intangibles (“CDI”) which are intangible assets arising from whole bank acquisitions. They are initially measured at fair value and then amortized over a ten-year period on an accelerated basis using the projected decay rates of the underlying core deposits. The change in balance for CDI during the years 2009, 2008 and 2007 is as follows:
| 2009 | 2008 | 2007 | ||||||||||
| Beginning of year |
$ | 3,948 | $ | 4,725 | $ | 3,083 | ||||||
| Acquired CDI |
466 | — | 2,484 | |||||||||
| Amortization expense |
(792 | ) | (777 | ) | (842 | ) | ||||||
| Impairment expense |
(1,200 | ) | — | — | ||||||||
| End of year |
$ | 2,422 | $ | 3,948 | $ | 4,725 | ||||||
Due to a sustained loss of previously acquired core deposit accounts combined with an overall decrease in the cost of alternative funds, a core deposit intangible impairment loss of $1,200 was recognized at year end 2009. The fair value used to determine the impairment loss was estimated using present value of expected future cash flows.
92
Table of Contents
CENTERSTATE BANKS, INC. AND SUBSIDIARIES
Notes to Consolidated Financial Statements—(Continued)
(amounts are in thousands of dollars, except per share data)
December 31, 2009, 2008 and 2007
Acquired intangible assets were as followed for years ended December 31, 2009 and 2008:
| December 31, 2009 | December 31, 2008 | |||||||||||
| Gross Carrying Amount |
Accumulated Amortization |
Gross Carrying Amount |
Accumulated Amortization | |||||||||
| Amortized intangible assets: |
||||||||||||
| Core deposit intangibles |
$ | 5,607 | $ | 3,185 | $ | 6,341 | $ | 2,393 | ||||
Estimated amortization expense for each of the next five years:
| 2010 |
$ | 403 | |
| 2011 |
372 | ||
| 2012 |
364 | ||
| 2013 |
293 | ||
| 2014 |
293 |
| (9) | Deposits |
A detail of deposits at December 31, 2009 and 2008 is as follows:
| December 31, | ||||||||||||
| 2009 | Weighted Average Interest Rate |
2008 | Weighted Average Interest Rate |
|||||||||
| Non-interest bearing deposits |
$ | 233,688 | — | % | $ | 141,229 | — | % | ||||
| Interest bearing deposits: |
||||||||||||
| Interest bearing demand deposits |
193,527 | 0.5 | % | 143,510 | 0.6 | % | ||||||
| Savings deposits |
148,915 | 1.0 | % | 84,837 | 1.2 | % | ||||||
| Money market accounts |
158,598 | 1.0 | % | 137,530 | 2.1 | % | ||||||
| Time deposits less than $100,000 |
258,078 | 2.2 | % | 217,206 | 3.5 | % | ||||||
| Time deposits of $100,000 or greater |
312,230 | 2.4 | % | 269,488 | 3.8 | % | ||||||
| $ | 1,305,036 | 1.3 | % | $ | 993,800 | 2.3 | % | |||||
The following table presents the amount of certificate accounts at December 31, 2009, maturing during the periods reflected below:
| Year |
Amount | ||
| 2010 |
$ | 413,507 | |
| 2011 |
53,038 | ||
| 2012 |
68,560 | ||
| 2013 |
13,847 | ||
| 2014 |
19,774 | ||
| Thereafter |
1,582 | ||
| Total |
$ | 570,308 | |
93
Table of Contents
CENTERSTATE BANKS, INC. AND SUBSIDIARIES
Notes to Consolidated Financial Statements—(Continued)
(amounts are in thousands of dollars, except per share data)
December 31, 2009, 2008 and 2007
| (10) | Securities Sold Under Agreements to Repurchase |
The Company’s subsidiary banks enter into borrowing arrangements with their retail business customers by agreements to repurchase (“repurchase agreements”) under which the banks pledge investment securities owned and under its control as collateral against the one-day borrowing arrangement.
At December 31, 2009 and 2008, the Company had $29,562 and $26,457 in repurchase agreements. Repurchase agreements are secured by U.S. treasury securities and government agency securities with fair values of $72,567 and $61,050 at December 31, 2009 and 2008, respectively.
Information concerning repurchase agreements is summarized as follows:
| 2009 | 2008 | 2007 | ||||||||||
| Average daily balance during the year |
$ | 24,276 | $ | 30,818 | $ | 58,329 | ||||||
| Average interest rate during the year |
1.01 | % | 1.49 | % | 4.43 | % | ||||||
| Maximum month-end balance during the year |
$ | 29,562 | $ | 36,825 | $ | 74,526 | ||||||
| Weighted average interest rate at year end |
0.40 | % | 0.19 | % | 2.93 | % | ||||||
| (11) | Federal Funds Purchased |
Federal funds purchased, as listed below, are overnight deposits from correspondent banks. The Company commenced accepting correspondent bank deposits during September 2008. Information concerning these deposits is summarized as follows:
| 2009 | 2008 | 2007 | ||||||||
| Average daily balance during the year |
$ | 228,815 | $ | 19,651 | — | |||||
| Average interest rate during the period |
0.24 | % | 1.23 | % | — | |||||
| Maximum month-end balance during the year |
$ | 298,620 | $ | 88,976 | — | |||||
| Weighted average interest rate at year end |
0.10 | % | 0.45 | % | — | |||||
94
Table of Contents
CENTERSTATE BANKS, INC. AND SUBSIDIARIES
Notes to Consolidated Financial Statements—(Continued)
(amounts are in thousands of dollars, except per share data)
December 31, 2009, 2008 and 2007
| (12) | Federal Home Loan Bank advances and other borrowed funds |
From time to time, the Company borrows either through Federal Home Loan Bank advances or Federal Funds Purchased, other than correspondent bank deposits listed in note 8 above. At year end, advances from the Federal Home Loan Bank were as follows:
| 2009 | 2008 | 2007 | |||||||
| Daily overnight advances, the interest rate was 0.46% and 4.4% at December 31, 2008 and 2007, respectively |
$ | — | $ | 6,750 | $ | 36,000 | |||
| Matures January 2, 2008, interest rate is fixed at 4.6% |
— | — | 1,518 | ||||||
| Matures March 28, 2008, interest rate is fixed at 5.51% |
— | — | 2,000 | ||||||
| Matures December 31, 2008, interest rate is fixed at 4.11% |
— | — | 3,000 | ||||||
| Matures February 2, 2009, interest rate is fixed at 2.72% |
— | 10,000 | — | ||||||
| Matures June 29, 2009, interest rate is fixed at 1.18% |
— | 3,000 | — | ||||||
| Matures January 11, 2010, interest rate is fixed at 1.04% |
3,000 | — | — | ||||||
| Matures January 12, 2010, interest rate is fixed at 1.04% |
3,000 | — | — | ||||||
| Matures July 12, 2010, interest rate is fixed at 1.50% |
3,000 | — | — | ||||||
| Matures January 7, 2011, interest rate is fixed at 3.63% |
3,000 | 3,000 | — | ||||||
| Matures January 10, 2011, interest rate is fixed at 1.84% |
3,000 | — | — | ||||||
| Matures June 27, 2011, interest rate is fixed at 3.93% |
3,000 | 3,000 | — | ||||||
| Matures December 30, 2011, interest rate is fixed at 2.30% |
3,000 | — | — | ||||||
| Total |
$ | 21,000 | $ | 25,750 | $ | 42,518 | |||
Each advance is payable at its maturity date, with a prepayment penalty for fixed rate advances. The advances were collateralized by $267,849 of pledged securities, and residential and commercial loans under a blanket lien arrangement at year end. Based on this collateral and the Company’s holdings of FHLB stock, the Company is eligible to borrow up to $118,142 at year end 2009.
| (13) | Corporate Debenture |
In September 2003, the Company formed CenterState Banks of Florida Statutory Trust I (the “Trust”) for the purpose of issuing trust preferred securities. On September 22, 2003, the Company issued a floating rate corporate debenture in the amount of $10,000. The Trust used the proceeds from the issuance of a trust preferred security to acquire the corporate debenture. The trust preferred security essentially mirrors the corporate debenture, carrying a cumulative preferred dividend at a variable rate equal to the interest rate on the corporate debenture (three month LIBOR plus 305 basis points). The corporate debenture and the trust preferred security each have 30-year lives. The trust preferred security and the corporate debenture are callable by the Company or the Trust, at their respective option after five years, and sooner in specific events, subject to prior approval by the Federal Reserve, if then required. The Company has treated the trust preferred security as Tier 1 capital up to the maximum amount allowed under the Federal Reserve guidelines for federal regulatory purposes. The Company is not considered the primary beneficiary of this Trust (variable interest entity), therefore the trust is not consolidated in the Company’s financial statements, but rather the subordinated debentures are shown as a liability. The Company’s investment in the common stock of the trust was $310 and is included in other assets.
In September 2004, Valrico Bancorp Inc. (“VBI”) formed Valrico Capital Statutory Trust (“Valrico Trust”) for the purpose of issuing trust preferred securities. On September 9, 2004, VBI issued a floating rate
95
Table of Contents
CENTERSTATE BANKS, INC. AND SUBSIDIARIES
Notes to Consolidated Financial Statements—(Continued)
(amounts are in thousands of dollars, except per share data)
December 31, 2009, 2008 and 2007
corporate debenture in the amount of $2,500. The Trust used the proceeds from the issuance of a trust preferred security to acquire the corporate debenture. On April 2, 2007, the Company acquired all the assets and assumed all the liabilities of VBI pursuant to the merger agreement, including VBI’s corporate debenture and related trust preferred security discussed above. The trust preferred security essentially mirrors the corporate debenture, carrying a cumulative preferred dividend at a variable rate equal to the interest rate on the corporate debenture (three month LIBOR plus 270 basis points). The corporate debenture and the trust preferred security each have 30-year lives. The trust preferred security and the corporate debenture are callable by the Company or the Valrico Trust, at their respective option after five years, and sooner in specific events, subject to prior approval by the Federal Reserve, if then required. The Company has treated the trust preferred security as Tier 1 capital up to the maximum amount allowed under the Federal Reserve guidelines for federal regulatory purposes. The Company is not considered the primary beneficiary of this Trust (variable interest entity), therefore the trust is not consolidated in the Company’s financial statements, but rather the subordinated debentures are shown as a liability. The Company’s investment in the common stock of the trust was $77 and is included in other assets.
| (14) | Income Taxes |
Allocation of federal and state income taxes between current and deferred portions for the years ended December 31, 2009, 2008 and 2007, is as follows:
| Current | Deferred | Total | |||||||||
| December 31, 2009: |
|||||||||||
| Federal |
$ | 417 | $ | (4,499 | ) | $ | (4,082 | ) | |||
| State |
107 | (712 | ) | (605 | ) | ||||||
| $ | 524 | $ | (5,211 | ) | $ | (4,687 | ) | ||||
| December 31, 2008: |
|||||||||||
| Federal |
$ | 1,941 | $ | (985 | ) | $ | 956 | ||||
| State |
437 | (178 | ) | 259 | |||||||
| $ | 2,378 | $ | (1,163 | ) | $ | 1,215 | |||||
| December 31, 2007: |
|||||||||||
| Federal |
$ | 4,425 | $ | (1,171 | ) | $ | 3,254 | ||||
| State |
838 | (195 | ) | 643 | |||||||
| $ | 5,263 | $ | (1,366 | ) | $ | 3,897 | |||||
96
Table of Contents
CENTERSTATE BANKS, INC. AND SUBSIDIARIES
Notes to Consolidated Financial Statements—(Continued)
(amounts are in thousands of dollars, except per share data)
December 31, 2009, 2008 and 2007
The tax effect of temporary differences that give rise to significant portions of the deferred tax assets and deferred tax liabilities at December 31, 2009 and 2008, are presented below:
| December 31, | ||||||||
| 2009 | 2008 | |||||||
| Deferred tax assets: |
||||||||
| Allowance for loan losses |
$ | 8,917 | $ | 5,077 | ||||
| Deferred loan fees |
252 | 245 | ||||||
| Stock based compensation |
293 | 255 | ||||||
| Deferred compensation |
872 | 782 | ||||||
| Impairment expenses |
402 | — | ||||||
| Other real estate owned expenses |
701 | 167 | ||||||
| Nonaccrual interest |
291 | 189 | ||||||
| Other |
406 | 201 | ||||||
| Total deferred tax asset |
12,134 | 6,916 | ||||||
| Deferred tax liabilities: |
||||||||
| Premises and equipment, due to differences in depreciation methods and useful lives |
(2,700 | ) | (2,631 | ) | ||||
| Fair value adjustments |
(1,138 | ) | (1,206 | ) | ||||
| Like kind exchange |
(300 | ) | (300 | ) | ||||
| Unrealized gain on investment securities available for sale |
(4,437 | ) | (1,039 | ) | ||||
| Accretion of discounts on investments |
(64 | ) | (58 | ) | ||||
| Total deferred tax liability |
(8,639 | ) | (5,234 | ) | ||||
| Net deferred tax asset |
$ | 3,495 | $ | 1,682 | ||||
In assessing the realizability of deferred tax assets, management considers whether it is more likely than not that some portion or all of the deferred tax assets will not be realized. The ultimate realization of deferred tax assets is dependent upon the generation of future taxable income during the periods in which those temporary differences become deductible. Management considers the scheduled reversal of deferred tax liabilities, projected future taxable income, and tax planning strategies in making this assessment. Based upon the level of historical taxable income and projections for future taxable income over the periods in which the deferred tax assets are deductible, management believes it is more likely than not that the Company will realize the benefits of these deductible differences.
The Company and its subsidiaries are subject to U.S. federal income tax as well as income tax of the state of Florida. The Company is no longer subject to examination by taxing authorities for the years before 2006.
97
Table of Contents
CENTERSTATE BANKS, INC. AND SUBSIDIARIES
Notes to Consolidated Financial Statements—(Continued)
(amounts are in thousands of dollars, except per share data)
December 31, 2009, 2008 and 2007
A reconciliation between the actual tax expense and the “expected” tax (benefit) expense, computed by applying the U.S. federal corporate rate of 34 percent (35 percent for 2007) is as follows:
| December 31, | ||||||||||||
| 2009 | 2008 | 2007 | ||||||||||
| “Expected” tax (benefit) expense |
$ | (3,707 | ) | $ | 1,576 | $ | 4,094 | |||||
| Tax exempt interest, net |
(546 | ) | (561 | ) | (515 | ) | ||||||
| Bank owned life insurance |
(187 | ) | (132 | ) | (127 | ) | ||||||
| State income taxes, net of federal income tax benefits |
(400 | ) | 171 | 418 | ||||||||
| Stock based compensation |
106 | 110 | 81 | |||||||||
| Other, net |
47 | 51 | (54 | ) | ||||||||
| $ | (4,687 | ) | $ | 1,215 | $ | 3,897 | ||||||
| (15) | Related-Party Transactions |
Loans to principal officers, directors, and their affiliates during 2009 were as follows:
| Beginning balance |
$ | 26,445 | ||
| New loans |
15,425 | |||
| Effect of changes in composition of related parties |
— | |||
| Repayments |
(5,362 | ) | ||
| Ending balance |
$ | 36,508 | ||
At December 31, 2009 and 2008 principal officers, directors, and their affiliates had $11,933 and $8,445, respectively, available lines of credit.
Deposits from principal officers, directors, and their affiliates at year-end 2009 and 2008 were approximately $29,731 and $18,122, respectively.
| (16) | Regulatory Capital Matters |
The Company and the Banks are subject to various regulatory capital requirements administered by the federal banking agencies. Failure to meet minimum capital requirements can initiate certain mandatory and possibly additional discretionary actions by regulators that, if undertaken, could have a direct material effect on the Company’s consolidated financial statements. Under capital adequacy guidelines and the regulatory framework for prompt corrective action, the Company and the Banks must meet specific capital guidelines that involve quantitative measures of assets, liabilities and certain off-balance-sheet items as calculated under regulatory accounting practices. The capital amounts and classification are also subject to qualitative judgments by the regulators about components, risk weightings and other factors.
Quantitative measures established by regulation to ensure capital adequacy require the Company to maintain minimum amounts and ratios (set forth in the table below) of total and Tier I capital (as defined in the regulations) to risk-weighted assets. Management believes, as of December 31, 2009, that the Company meets all capital adequacy requirements to which it is subject.
98
Table of Contents
CENTERSTATE BANKS, INC. AND SUBSIDIARIES
Notes to Consolidated Financial Statements—(Continued)
(amounts are in thousands of dollars, except per share data)
December 31, 2009, 2008 and 2007
As of December 31, 2009, the most recent notification from the Office of Comptroller of the Currency and the FDIC categorized the Banks as well capitalized under the regulatory framework for prompt corrective action. To be categorized as well capitalized, the Banks must maintain total risk-based, Tier I risk-based and Tier I leverage ratios as set forth in the table. There are no conditions or events since that notification that management believes have changed the institution’s category.
A summary of actual, required, and capital levels necessary to be considered well-capitalized for the Company as of December 31, 2009 and 2008, are presented in the table below.
| Actual | For capital adequacy purposes |
To be well capitalized under Prompt corrective action provision |
||||||||||||||||||
| Amount | Ratio | Amount | Ratio | Amount | Ratio | |||||||||||||||
| December 31, 2009: |
||||||||||||||||||||
| Total capital (to risk weighted assets) |
$ | 213,569 | 19.2 | % | $ | 88,768 | ³ | 8 | % | $ | 110,960 | ³ | 10 | % | ||||||
| Tier 1 capital (to risk weighted assets) |
199,583 | 18.0 | % | 44,384 | ³ | 4 | % | 66,576 | ³ | 6 | % | |||||||||
| Tier 1 capital (to average assets) |
199,583 | 11.4 | % | 70,265 | ³ | 4 | % | 87,831 | ³ | 5 | % | |||||||||
| December 31, 2008: |
||||||||||||||||||||
| Total capital (to risk weighted assets) |
$ | 170,164 | 17.4 | % | $ | 78,119 | ³ | 8 | % | $ | 97,648 | ³ | 10 | % | ||||||
| Tier 1 capital (to risk weighted assets) |
157,944 | 16.2 | % | 39,059 | ³ | 4 | % | 58,589 | ³ | 6 | % | |||||||||
| Tier 1 capital (to average assets) |
157,944 | 12.6 | % | 50,201 | ³ | 4 | % | 62,751 | ³ | 5 | % | |||||||||
A summary of actual, required, and capital levels necessary to be considered well-capitalized for each of the Company’s subsidiary Banks as of December 31, 2009 and 2008, are presented in the table below.
| Actual | For capital adequacy purposes |
To be well capitalized under prompt corrective action provision |
||||||||||||||||||
| Amount | Ratio | Amount | Ratio | Amount | Ratio | |||||||||||||||
| December 31, 2009: |
||||||||||||||||||||
| CenterState Bank Central Florida, N.A. |
||||||||||||||||||||
| Total capital (to risk weighted assets) |
$ | 29,679 | 12.7 | % | $ | 18,769 | ³ | 8 | % | $ | 23,462 | ³ | 10 | % | ||||||
| Tier 1 capital (to risk weighted assets) |
26,705 | 11.4 | % | 9,385 | ³ | 4 | % | 14,077 | ³ | 6 | % | |||||||||
| Tier 1 capital (to average assets) |
26,705 | 8.9 | % | 12,034 | ³ | 4 | % | 15,042 | ³ | 5 | % | |||||||||
| CenterState Bank, N.A. |
||||||||||||||||||||
| Total capital (to risk weighted assets) |
37,932 | 14.0 | % | 21,752 | ³ | 8 | % | 27,190 | ³ | 10 | % | |||||||||
| Tier 1 capital (to risk weighted assets) |
34,498 | 12.7 | % | 10,876 | ³ | 4 | % | 16,314 | ³ | 6 | % | |||||||||
| Tier 1 capital (to average assets) |
34,498 | 9.8 | % | 14,134 | ³ | 4 | % | 17,667 | ³ | 5 | % | |||||||||
| CenterState Bank of Florida, N.A. |
||||||||||||||||||||
| Total capital (to risk weighted assets) |
75,093 | 16.4 | % | 36,658 | ³ | 8 | % | 45,823 | ³ | 10 | % | |||||||||
| Tier 1 capital (to risk weighted assets) |
69,347 | 15.1 | % | 18,329 | ³ | 4 | % | 27,494 | ³ | 6 | % | |||||||||
| Tier 1 capital (to average assets) |
69,347 | 7.4 | % | 37,689 | ³ | 4 | % | 47,111 | ³ | 5 | % | |||||||||
| Valrico State Bank |
||||||||||||||||||||
| Total capital (to risk weighted assets) |
23,722 | 16.3 | % | 11,624 | ³ | 8 | % | 14,530 | ³ | 10 | % | |||||||||
| Tier 1 capital (to risk weighted assets) |
21,880 | 15.1 | % | 5,812 | ³ | 4 | % | 8,718 | ³ | 6 | % | |||||||||
| Tier 1 capital (to average assets) |
21,880 | 11.9 | % | 7,353 | ³ | 4 | % | 9,192 | ³ | 5 | % | |||||||||
99
Table of Contents
CENTERSTATE BANKS, INC. AND SUBSIDIARIES
Notes to Consolidated Financial Statements—(Continued)
(amounts are in thousands of dollars, except per share data)
December 31, 2009, 2008 and 2007
| Actual | For capital adequacy purposes |
To be well capitalized under prompt corrective action provision |
||||||||||||||||||
| Amount |
Ratio | Amount | Ratio | Amount | Ratio | |||||||||||||||
| December 31, 2008: |
||||||||||||||||||||
| CenterState Bank Central Florida, N.A. |
||||||||||||||||||||
| Total capital (to risk weighted assets) |
$ | 26,951 | 12.2 | % | $ | 17,663 | ³ | 8 | % | $ | 22,079 | ³ | 10 | % | ||||||
| Tier 1 capital (to risk weighted assets) |
24,179 | 11.0 | % | 8,832 | ³ | 4 | % | 13,247 | ³ | 6 | % | |||||||||
| Tier 1 capital (to average assets) |
24,179 | 9.0 | % | 10,694 | ³ | 4 | % | 13,368 | ³ | 5 | % | |||||||||
| CenterState Bank, N.A. |
||||||||||||||||||||
| Total capital (to risk weighted assets) |
40,293 | 13.3 | % | 24,160 | ³ | 8 | % | 30,200 | ³ | 10 | % | |||||||||
| Tier 1 capital (to risk weighted assets) |
36,507 | 12.1 | % | 12,080 | ³ | 4 | % | 18,120 | ³ | 6 | % | |||||||||
| Tier 1 capital (to average assets) |
36,507 | 10.6 | % | 13,775 | ³ | 4 | % | 17,219 | ³ | 5 | % | |||||||||
| CenterState Bank of Florida, N.A. |
||||||||||||||||||||
| Total capital (to risk weighted assets) |
44,706 | 13.8 | % | 26,002 | ³ | 8 | % | 32,502 | ³ | 10 | % | |||||||||
| Tier 1 capital (to risk weighted assets) |
41,093 | 12.6 | % | 13,001 | ³ | 4 | % | 19,501 | ³ | 6 | % | |||||||||
| Tier 1 capital (to average assets) |
41,093 | 8.7 | % | 18,804 | ³ | 4 | % | 23,504 | ³ | 5 | % | |||||||||
| Valrico State Bank |
||||||||||||||||||||
| Total capital (to risk weighted assets) |
22,610 | 16.8 | % | 10,792 | ³ | 8 | % | 13,491 | ³ | 10 | % | |||||||||
| Tier 1 capital (to risk weighted assets) |
20,912 | 15.5 | % | 5,396 | ³ | 4 | % | 8,094 | ³ | 6 | % | |||||||||
| Tier 1 capital (to average assets) |
20,912 | 13.1 | % | 6,393 | ³ | 4 | % | 7,992 | ³ | 5 | % | |||||||||
| (17) | Dividends |
The Company declared and paid cash dividends on its common stock of $1,139, $1,993 and $1,820 during the years ended December 31, 2009, 2008 and 2007, respectively. The Company also paid dividends on its preferred stock issued pursuant to TARP of $1,196 during the year ended December 31, 2009. The Company repurchased all of its preferred stock issued pursuant to TARP on September 30, 2009 and is no long subject to preferred stock dividend payments. Banking regulations limit the amount of dividends that may be paid by the subsidiary banks to the Company without prior approval of the Bank’s regulatory agency. At December 31, 2009, dividends from the subsidiary banks available to be paid to the Company, without prior approval of the Banks’ regulatory agency, was $12,257, subject to the Banks meeting or exceeding regulatory capital requirements.
| (18) | Stock-Based Compensation |
On April 24, 2007, the Company’s shareholders approved the CenterState 2007 Equity Incentive Plan (the “2007 Plan”) and approved an amendment to the 2007 Plan on April 28, 2009. The 2007 Plan, as amended, replaces the 1999 Plan discussed below. The 2007 Plan, as amended, authorizes the issuance of up to 1,350,000 shares of the Company stock. Of this amount, 1,200,000 shares are allocated to employees, all of which may be issued as incentive stock options, and 150,000 shares are allocated to directors. During 2009, the Company granted employee incentive stock options for 145,500 shares, with a weighted average exercise price of $10.15 per share, pursuant to this plan. Options were granted at fair market value of the underlying stock at date of grant. Each option expires ten years from the date of grant. These options vest over a nine year period. At December 31, 2009, there were a total of 601,410 shares available for future grants pursuant to this Plan.
100
Table of Contents
CENTERSTATE BANKS, INC. AND SUBSIDIARIES
Notes to Consolidated Financial Statements—(Continued)
(amounts are in thousands of dollars, except per share data)
December 31, 2009, 2008 and 2007
In 1999, the Company authorized 730,000 common shares for employees of the Company under an incentive stock option and non-statutory stock option plan (the “1999 Plan”). Options were granted at fair market value of the underlying stock at date of grant. Each option expires ten years from the date of grant. Options became 25% vested immediately as of the grant date and continued to vest at a rate of 25% on each anniversary date thereafter until fully vested. There were no stock options granted pursuant to the 1999 Plan during 2009, 2008 and 2007. The 2007 Plan, discussed above, replaced the 1999 Plan. At December 31, 2009 there were 442,174 stock options outstanding which were granted pursuant to the 1999 Plan, all of which were currently exercisable. No future stock options will be granted from this Plan.
In addition to the 1999 Plan, the Company assumed and converted the stock option plans of its subsidiary banks consistent with the terms and conditions of their respective merger agreements. These options are all vested and exercisable. At December 31, 2009, they represented exercisable options for 147,990 shares of the Company’s common stock.
In 2004, the Company’s shareholders authorized an Employee Stock Purchase Plan (“ESPP”). The number of shares of common stock for which options may be granted under the ESPP is 400,000, which amount shall be increased on December 31 of each calendar year. At December 31, 2009, there were no options outstanding pursuant to this plan, and no activity occurred during the twelve month periods ending December 31, 2009, 2008 and 2007 relating to our ESPP.
The Company’s stock-based compensation consists primarily of stock options and commencing in 2009 also includes restricted stock grants. During the twelve month period ended December 31, 2009, 2008 and 2007, the Company recognized approximately $405, $402 and $509 of stock-based compensation expense, respectively. The total income tax benefit was $7, $52 and $126. As of December 31, 2009, the total remaining unrecognized compensation cost related to non-vested stock options, net of estimated forfeitures, was approximately $2,530 and will be recognized over the next nine years. The weighted average period over which this expense is expected to be recognized is approximately 4.1 years.
The Company granted stock options for 145,500, 540,000 and 84,000 shares of common stock during the twelve month periods ending December 31, 2009, 2008 and 2007, respectively.
The estimated fair value of options granted during these periods were calculated as of the grant date using the Black-Scholes option-pricing model. The weighted-average assumptions as of the grant date are as follows:
| 2009 | 2008 | 2007 | |||||||
| Expected option life |
7.7 years | 7.4 years | 6.4 years | ||||||
| Risk-free interest rate |
2.80 | % | 3.04 | % | 4.75 | % | |||
| Expected volatility |
33.6 | % | 31.2 | % | 29.7 | % | |||
| Dividend yield |
0.41 | % | 1.06 | % | 0.82 | % |
In 2009 and 2008, the Company determined the expected life of the stock options using the simplified method approach allowed for plain-vanilla share options as described in SAB 107. For options granted during 2007 and prior to 2006, the Company determined the expected life of the stock options using historical data adjusted for known factors that would alter historical exercise behavior including announced retirement dates. The risk-free interest rate is based on the U.S. Treasury yield curve in effect as of the grant date. Expected volatility was determined using historical volatility.
101
Table of Contents
CENTERSTATE BANKS, INC. AND SUBSIDIARIES
Notes to Consolidated Financial Statements—(Continued)
(amounts are in thousands of dollars, except per share data)
December 31, 2009, 2008 and 2007
ASC 718 requires the recognition of stock-based compensation for the number of awards that are ultimately expected to vest. As a result, for most awards, recognized stock compensation would be reduced for estimated forfeitures prior to vesting. Based on historical data, the Company expects the annual forfeiture rates to be immaterial. Estimated forfeitures will be reassessed in subsequent periods and may change based on new facts and circumstances. Prior to January 1, 2006, actual forfeitures were accounted for as they occurred for purposes of required pro forma stock compensation disclosures.
The weighted-average estimated fair value of stock options granted during the twelve month periods ended December 31, 2009, 2008 and 2007 were $4.12 per share, $5.31 per share and $6.33 per share respectively.
The table below present’s information related to stock option activity for the years ended December 31, 2009, 2008 and 2007 (in thousands of dollars):
| 2009 | 2008 | 2007 | |||||||
| Total intrinsic value of stock options exercised |
$ | 58 | $ | 292 | $ | 689 | |||
| Cash received from stock options exercised |
180 | 283 | 550 | ||||||
| Gross income tax benefit from the exercise of stock options |
7 | 52 | 126 | ||||||
A summary of stock option activity for the years ended December 31, 2009, 2008 and 2007 is as follows (dollars are in thousands, except for per share data):
| December 31, 2009 | December 31, 2008 | December 31, 2007 | ||||||||||||||||
| Number of Options |
Weighted- Average Exercise Price |
Number of Options |
Weighted- Average Exercise Price |
Number of Options |
Weighted- Average Exercise Price | |||||||||||||
| Options outstanding, beginning of period |
1,224,556 | $ | 13.66 | 737,674 | $ | 12.26 | 742,236 | $ | 11.41 | |||||||||
| Options granted |
145,500 | $ | 10.15 | 540,000 | $ | 15.14 | 84,000 | $ | 17.32 | |||||||||
| Options exercised |
(26,974 | ) | $ | 6.68 | (37,908 | ) | $ | 7.45 | (67,470 | ) | $ | 8.14 | ||||||
| Options forfeited |
(25,918 | ) | $ | 14.34 | (15,210 | ) | $ | 13.81 | (21,092 | ) | $ | 15.47 | ||||||
| Options outstanding, end of period |
1,317,164 | $ | 13.40 | 1,224,556 | $ | 13.66 | 737,674 | $ | 12.26 | |||||||||
| Number of Options |
Weighted- Average Exercise Price |
Weighted- Average Contractual Term |
Aggregate Intrinsic Value | |||||||
| Options outstanding, December 31, 2009 |
1,317,164 | $ | 13.40 | 6.2 years | $ | 642 | ||||
| Options fully vested and expected to vest, December 31, 2009 |
1,223,536 | $ | 13.42 | 8.7 years | $ | 642 | ||||
| Options exercisable, December 31, 2009 |
668,764 | $ | 12.60 | 4.1 years | $ | 596 | ||||
In April 2009, the Company awarded 3,500 shares of restricted stock with a fair value of $10.85 per share at the date of grate. In July 2009, the Company awarded 1,200 shares of restricted stock with a fair value of $7.69 per share at the date of grant. These awards vest at a rate of 20% at date of grant and 20% each anniversary date thereafter. In December 2009, the Company awarded 16,890 shares of restricted stock with a fair value of $10.36 per share at the date of grant. These shares will vest in December 2011.
During the twelve month period ended December 31, 2009, 2008 and 2007, the Company recognized approximately $15, $0 and $0 of stock-based compensation expense, respectively, related to restricted stock grants. The total income tax benefit was $6, $0 and $0. As of December 31, 2009, the total remaining
102
Table of Contents
CENTERSTATE BANKS, INC. AND SUBSIDIARIES
Notes to Consolidated Financial Statements—(Continued)
(amounts are in thousands of dollars, except per share data)
December 31, 2009, 2008 and 2007
unrecognized compensation cost related to restricted stock grants, net of estimated forfeitures, was approximately $207 and will be recognized over the next four years. The weighted average period over which this expense is expected to be recognized is approximately 1.6 years.
| (19) | Employee Benefit Plan |
Substantially all of the subsidiary banks’ employees are covered under the Company’s 401(k) compensation and incentive plan. Employees are eligible to participate in the plan after completing six months of continuous employment. The Company contributes an amount equal to a certain percentage of the employees’ contributions based on the discretion of the Board of Directors. In addition, the Company may also make additional contributions to the plan each year, subject to profitability and other factors, and based solely on the discretion of the Board of Directors. For the years ended December 31, 2009, 2008 and 2007, the Company’s contributions to the plan were $541, $556 and $668, respectively, which are included in salary and benefits on the Consolidated Statements of Operations.
| (20) | Parent Company Only Financial Statements |
Condensed financial statements of CenterState Banks of Florida, Inc. (parent company only) follow:
Condensed Balance Sheet
December 31, 2009 and 2008
| 2009 | 2008 | |||||
| Assets: | ||||||
| Cash and due from banks |
$ | 302 | $ | 1,078 | ||
| Inter-company receivable from bank subsidiaries |
37,300 | 35,000 | ||||
| Investment in wholly-owned bank subsidiaries |
194,757 | 156,411 | ||||
| Investment in other wholly-owned subsidiary |
9,513 | — | ||||
| Prepaid expenses and other assets |
2,463 | 2,043 | ||||
| Total assets |
$ | 244,335 | $ | 194,532 | ||
| Liabilities: | ||||||
| Accounts payable and accrued expenses |
$ | 2,425 | $ | 2,867 | ||
| Corporate debenture |
12,500 | 12,500 | ||||
| Total liabilities |
14,925 | 15,367 | ||||
| Stockholders’ Equity: | ||||||
| Preferred stock |
— | 26,787 | ||||
| Common stock |
258 | 125 | ||||
| Additional paid-in capital |
193,464 | 112,329 | ||||
| Retained earnings |
28,623 | 38,269 | ||||
| Accumulated other comprehensive income |
7,065 | 1,655 | ||||
| Total stockholders’ equity |
229,410 | 179,165 | ||||
| Total liabilities and stockholders’ equity |
$ | 244,335 | $ | 194,532 | ||
103
Table of Contents
CENTERSTATE BANKS, INC. AND SUBSIDIARIES
Notes to Consolidated Financial Statements—(Continued)
(amounts are in thousands of dollars, except per share data)
December 31, 2009, 2008 and 2007
Condensed Statements of Operations
Years ended December 31, 2009, 2008 and 2007
| 2009 | 2008 | 2007 | ||||||||||
| Other income |
$ | — | $ | 1 | $ | 4 | ||||||
| Interest expense |
473 | 818 | 1,021 | |||||||||
| Operating expenses |
2,576 | 2,594 | 2,721 | |||||||||
| Loss before equity in net earnings of subsidiaries |
(3,049 | ) | (3,411 | ) | (3,738 | ) | ||||||
| Equity in net earnings of subsidiaries (net of income tax (benefit) expense of ($3,559), $2,364 and $5,211 at December 31, 2009, 2008 and 2007, respectively) |
(4,296 | ) | 5,683 | 10,223 | ||||||||
| Net income before income tax benefit |
(7,345 | ) | 2,272 | 6,485 | ||||||||
| Income tax benefit |
(1,128 | ) | (1,149 | ) | (1,314 | ) | ||||||
| Net (loss) income |
$ | (6,217 | ) | $ | 3,421 | $ | 7,799 | |||||
Condensed Statements of Cash Flows
Years ended December 31, 2009, 2008 and 2007
| 2009 | 2008 | 2007 | ||||||||||
| Cash flows from operating activities: |
||||||||||||
| Net (loss) income |
$ | (6,217 | ) | $ | 3,421 | $ | 7,799 | |||||
| Adjustments to reconcile net income to net cash used in operating activities: |
||||||||||||
| Equity in net loss (earnings) of subsidiaries |
4,296 | (5,683 | ) | (10,223 | ) | |||||||
| Increase (decrease) in payables and accrued expenses |
209 | (334 | ) | 307 | ||||||||
| Increase in other assets Stock based compensation expense |
|
(420 125 |
)
|
|
(10 402 |
)
|
|
(278 509 |
)
| |||
| Net cash flows used in operating activities |
(2,007 | ) | (2,204 | ) | (1,886 | ) | ||||||
| Cash flows from investing activities: |
||||||||||||
| Inter-company receivables from subsidiary banks |
(2,300 | ) | (18,000 | ) | 15,000 | |||||||
| Cash payments for merger transaction costs |
— | — | (454 | ) | ||||||||
| Cash payments to VSB shareholders Cash payments to Mid FL shareholders |
|
(562 (89 |
) ) |
|
(338 (6 |
) ) |
|
(12,223 (47 |
) ) | |||
| Investment in subsidiaries |
(46,457 | ) | (5,000 | ) | — | |||||||
| Net cash flows (used in) provided by investing activities |
(49,408 | ) | (23,344 | ) | 2,276 | |||||||
| Cash flows from financing activities: |
||||||||||||
| Stock options exercised, net of tax benefit |
188 | 335 | 676 | |||||||||
| Dividends paid to shareholders |
(2,335 | ) | (1,993 | ) | (1,820 | ) | ||||||
| Net proceeds from issuance of preferred stock and warrant |
— | 27,760 | — | |||||||||
| Proceeds from public stock offering |
80,879 | — | — | |||||||||
| Adjustment to preferred stock and warrants |
(6 | ) | — | — | ||||||||
| Redemption of preferred stock previously issued pursuant to TARP |
(27,875 | ) | — | — | ||||||||
| Purchased warrants previously issued pursuant to TARP |
(212 | ) | — | — | ||||||||
| Net cash flows provided by (used in) financing activities |
50,639 | 26,102 | (1,144 | ) | ||||||||
| Net (decrease) increase in cash and cash equivalents |
(776 | ) | 554 | (754 | ) | |||||||
| Cash and cash equivalents at beginning of year |
1,078 | 524 | 1,278 | |||||||||
| Cash and cash equivalents at end of year |
$ | 302 | $ | 1,078 | $ | 524 | ||||||
104
Table of Contents
CENTERSTATE BANKS, INC. AND SUBSIDIARIES
Notes to Consolidated Financial Statements—(Continued)
(amounts are in thousands of dollars, except per share data)
December 31, 2009, 2008 and 2007
| (21) | Credit Commitments |
The Company has outstanding at any time a significant number of commitments to extend credit. These arrangements are subject to strict credit control assessments and each customer’s credit worthiness is evaluated on a case-by-case basis. A summary of commitments to extend credit and standby letters of credit written at December 31, 2009 and 2008, are as follows:
| December 31, | ||||||
| 2009 | 2008 | |||||
| Standby letters of credit |
$ | 5,309 | $ | 4,338 | ||
| Available lines of credit |
94,573 | 98,189 | ||||
| Unfunded loan commitments—fixed |
5,698 | 10,863 | ||||
| Unfunded loan commitments—variable |
1,691 | 6,846 | ||||
Because many commitments expire without being funded in whole or part, the contract amounts are not estimates of future cash flows.
Credit risk represents the accounting loss that would be recognized at the reporting date if counterparties failed completely to perform as contracted. The credit risk amounts are equal to the contractual amounts, assuming that the amounts are fully advanced and that the collateral or other security is of no value.
The Company’s policy is to require customers to provide collateral prior to the disbursement of approved loans. The amount of collateral obtained, if it is deemed necessary by the Company upon extension of credit, is based on management’s credit evaluation of the counterparty. Collateral held varies but may include accounts receivable, inventory, real estate and income providing commercial properties.
Standby letters of credit are contractual commitments issued by the Company to guarantee the performance of a customer to a third party. The credit risk involved in issuing letters of credit is essentially the same as that involved in extending loan facilities to customers.
Outstanding commitments are deemed to approximate fair value due to the variable nature of the interest rates involved and the short-term nature of the commitments.
| (22) | Concentrations of Credit Risk |
Most of the Company’s business activity is with customers located within Osceola, Orange, Pasco, Hernando, Citrus, Sumter, Lake, Hillsborough, Polk and Marion Counties of the State of Florida and portions of adjacent counties. The majority of commercial and mortgage loans are granted to customers doing business or residing in these areas. Generally, commercial loans are secured by real estate, and mortgage loans are secured by either first or second mortgages on residential or commercial property. As of December 31, 2009, substantially all of the Company’s loan portfolio was secured. Although the Company has a diversified loan portfolio, a substantial portion of its debtors’ ability to honor their contracts is dependent upon the economy of Osceola, Orange, Pasco, Hernando, Citrus, Sumter, Lake, Hillsborough, Polk and Marion Counties and portions of adjacent counties. The Company does not have significant exposure to any individual customer or counterparty.
| (23) | Basic and Diluted Earnings Per Share |
Basic earnings per share is based on the weighted average number of common shares outstanding during the periods. Diluted earnings per share includes the weighted average number of common shares outstanding
105
Table of Contents
CENTERSTATE BANKS, INC. AND SUBSIDIARIES
Notes to Consolidated Financial Statements—(Continued)
(amounts are in thousands of dollars, except per share data)
December 31, 2009, 2008 and 2007
during the periods and the further dilution from stock options using the treasury method. There were 1,078,300,000 stock options that were anti dilutive at December 31, 2009. The following is a reconciliation of the numerators and denominators of the basic and diluted earnings per share computations for the periods presented.
| 2009 | 2008 | 2007 | |||||||||
| Numerator for basic and diluted earnings per share: |
|||||||||||
| Net (loss) income |
$ | (6,217 | ) | $ | 3,421 | $ | 7,799 | ||||
| Preferred stock dividend |
(1,045 | ) | (151 | ) | — | ||||||
| Preferred stock discount accretion |
(1,088 | ) | (16 | ) | — | ||||||
| Net income available for common shareholders |
$ | (8,350 | ) | $ | 3,254 | $ | 7,799 | ||||
| Denominator: |
|||||||||||
| Denominator for basic earnings per share |
|||||||||||
| —weighted-average shares |
17,905,042 | 12,452,375 | 12,108,590 | ||||||||
| Effect of dilutive securities: |
|||||||||||
| Employee stock based compensation awards |
— | 132,661 | 185,947 | ||||||||
| Denominator for diluted earnings per share |
|||||||||||
| —adjusted weighted-average shares |
17,905,042 | 12,585,036 | 12,294,537 | ||||||||
| Basic (loss) earnings per share |
$ | (0.47 | ) | $ | 0.26 | $ | 0.64 | ||||
| Diluted (loss) earnings per share |
$ | (0.47 | ) | $ | 0.26 | $ | 0.63 | ||||
| (24) | Reportable segments |
The Company’s reportable segments represent the distinct product lines the Company offers and are viewed separately for strategic planning purposes by management. The tables below are reconciliations of the reportable segment revenues, expenses, and profit to the Company’s consolidated total for the year ending December 31, 2009 and 2008.
Year ending December 31, 2009
| Commercial and retail banking |
Correspondent banking and bond sales division |
Corporate overhead and administration |
Elimination entries |
Total | ||||||||||||||||
| Interest income |
$ | 66,749 | $ | 7,195 | $ | — | $ | 73,944 | ||||||||||||
| Interest expense |
(21,244 | ) | (573 | ) | (473 | ) | (22,290 | ) | ||||||||||||
| Net interest income |
45,505 | 6,622 | (473 | ) | 51,654 | |||||||||||||||
| Provision for loan losses |
(23,287 | ) | (12 | ) | — | (23,299 | ) | |||||||||||||
| Non interest income |
11,306 | 18,746 | — | 30,052 | ||||||||||||||||
| Non interest expense |
(50,781 | ) | (15,954 | ) | (2,576 | ) | (69,311 | ) | ||||||||||||
| Net income before taxes |
(17,257 | ) | 9,402 | (3,049 | ) | (10,904 | ) | |||||||||||||
| Income tax (benefit) provision |
6,841 | (3,282 | ) | 1,128 | 4,687 | |||||||||||||||
| Net (loss) income |
$ | (10,416 | ) | $ | 6,120 | $ | (1,921 | ) | $ | (6,217 | ) | |||||||||
| Total assets |
$ | 1,555,611 | $ | 201,018 | $ | 244,335 | $ | (249,665 | ) | $ | 1,751,299 | |||||||||
106
Table of Contents
CENTERSTATE BANKS, INC. AND SUBSIDIARIES
Notes to Consolidated Financial Statements—(Continued)
(amounts are in thousands of dollars, except per share data)
December 31, 2009, 2008 and 2007
Year ending December 31, 2008
| Commercial and retail banking |
Correspondent banking and bond sales division |
Corporate overhead and administration |
Elimination entries |
Total | ||||||||||||||||
| Interest income |
$ | 67,906 | $ | 176 | $ | — | $ | 68,082 | ||||||||||||
| Interest expense |
(26,779 | ) | (200 | ) | (818 | ) | (27,797 | ) | ||||||||||||
| Net interest income |
41,127 | (24 | ) | (818 | ) | 40,285 | ||||||||||||||
| Provision for loan losses |
(6,520 | ) | — | — | (6,520 | ) | ||||||||||||||
| Non interest income |
9,395 | 1,412 | — | 10,807 | ||||||||||||||||
| Non interest expense |
(36,340 | ) | (1,006 | ) | (2,590 | ) | (39,936 | ) | ||||||||||||
| Net income before taxes |
7,662 | 382 | (3,408 | ) | 4,636 | |||||||||||||||
| Income tax (benefit) provision |
(2,220 | ) | (144 | ) | 1,149 | (1,215 | ) | |||||||||||||
| Net income (loss) |
$ | 5,442 | $ | 238 | $ | (2,259 | ) | $ | 3,421 | |||||||||||
| Total assets |
$ | 1,243,232 | $ | 89,615 | $ | 194,532 | ($ | 194,236 | ) | $ | 1,333,143 | |||||||||
Commercial and retail banking: The Company’s primary business is commercial and retail banking. Currently, the Company operates through four separately chartered subsidiary banks with 38 locations in ten counties throughout Central Florida providing traditional deposit and lending products and services to its commercial and retail customers.
Corresponding banking and bond sales division: Operating as a division of the Company’s largest subsidiary bank, its primary revenue generating activities are as follows: 1) the first, and largest, revenue generator is commissions earned on fixed income security sales; 2) the second category includes: (a) correspondent bank deposits (i.e., federal funds purchased); (b) correspondent bank checking accounts; and (c) loans to correspondent banks; and, 3) the third, and smallest revenue generating category, includes fees from safe-keeping activities, bond accounting services for correspondents, and asset/liability consulting related activities. The customer base includes small to medium size financial institutions primarily located in Florida, Alabama and Georgia.
Corporate overhead and administration: Corporate overhead and administration is comprised primarily of compensation and benefits for certain members of management, interest on parent company debt, office occupancy and depreciation of parent company facilities, merger related costs and other expenses.
| (25) | Sale of branch real estate |
The Company sold one of its branch office buildings on April 1, 2008 for $2,500 and simultaneously entered into an agreement to lease back the real estate for a period of one year with an option to renew the lease for an additional year. A $1,483 pre-tax gain on the sale was recognized on the transaction. The sale was for the real estate only. The branch was subsequently closed and the related customer accounts were transferred to one of our existing branch locations.
| (26) | Business combinations |
On April 2, 2007, the Company acquired 100% of the outstanding shares of Valrico Bancorp, Inc. (“VBI”) and its wholly owned subsidiary, Valrico State Bank (“VSB”). The $36,100 purchase price was a
107
Table of Contents
CENTERSTATE BANKS, INC. AND SUBSIDIARIES
Notes to Consolidated Financial Statements—(Continued)
(amounts are in thousands of dollars, except per share data)
December 31, 2009, 2008 and 2007
combination of 65% stock and 35% cash. Other cost including change of control payments, accelerated deferred compensation arrangements and other transaction costs approximated $3,200. The total cost of the transaction was approximately $39,300. Operating results of VSB are included in the consolidated financial statements since the date of the acquisition. As a result of this acquisition, the Company expects to further solidify its market share in the Hillsborough County, Florida market, expand its customer base to enhance deposit fee income, and reduce operating costs through economies of scale.
The following table summarizes the fair values of the assets acquired and liabilities assumed at the date of acquisition:
| Assets: |
|||
| Cash and due from banks |
$ | 6,789 | |
| Federal funds sold |
13,039 | ||
| Securities available for sale |
12,177 | ||
| Loans—net |
120,226 | ||
| Premises and equipment |
9,289 | ||
| Goodwill |
18,256 | ||
| Core deposit intangible |
2,484 | ||
| Other assets |
1,830 | ||
| Total assets |
$ | 184,090 | |
| Liabilities: |
|||
| Deposits |
$ | 130,614 | |
| Other liabilities |
16,898 | ||
| Total liabilities |
147,512 | ||
| Net assets acquired |
36,578 | ||
| Total liabilities and net assets acquired |
$ | 184,090 | |
On January 30, 2009 the Company, through its lead bank headquartered in Winter Haven, Florida, purchased the deposits of Ocala National Bank (“ONB”), from the Federal Deposit Insurance Corporation (“FDIC”) for approximately $3,000, a premium of approximately 1.7%. Total deposits purchased approximated $178,000. At the date of acquisition, ONB operated from four branch locations all within Ocala. Two locations were leased and two were owned. The Company had the option to purchase the two owned locations at fair market value, to be determined by appraisal, and to assume the lease on the other two locations. Currently, the Company has purchased one of the leased locations, has agreed to purchase the two owned locations, and has entered into a short-term lease on the remaining leased location, while renovation is occurring at a new location which the Company is in the process of purchasing after which it will move the remaining leased facility to this new nearby location. As a result of this acquisition, the Company expects to further solidify its market share in the Marion County, Florida market, expand its customer base to enhance deposit fee income, and reduce operating costs through economies of scale. All of the goodwill and core deposit intangible listed below is tax deductible over a 15 year period on a straight line basis. The following table summarizes the fair values of the assets acquired and liabilities assumed at the date of acquisition.
108
Table of Contents
CENTERSTATE BANKS, INC. AND SUBSIDIARIES
Notes to Consolidated Financial Statements—(Continued)
(amounts are in thousands of dollars, except per share data)
December 31, 2009, 2008 and 2007
| Assets: |
|||
| Cash |
$ | 155,640 | |
| Securities available for sale |
11,549 | ||
| Goodwill |
4,722 | ||
| Core deposit intangible |
466 | ||
| Other assets |
8,113 | ||
| Total assets |
$ | 180,490 | |
| Liabilities: |
|||
| Deposits |
$ | 180,182 | |
| Other liabilities |
308 | ||
| Total liabilities |
$ | 180,490 | |
| (27) | Sale of bank shell |
On November 30, 2007 the Company closed a set of related transactions that effectively resulted in combining two of the Company’s subsidiary Banks into one and selling the shell of the other. The two Banks that we combined were CenterState Bank West Florida, N.A. (“CSWFL”) and CenterState Bank Mid Florida (“Mid FL”). CSWFL was the surviving bank and its name was subsequently changed to CenterState Bank, N.A. The Company effectively sold the shell of the Mid FL subsidiary Bank to an out of state bank for $1,000.
| (28) | Capital offering |
On August 4, 2009, the Company raised approximately $86,261 through a previously announced public offering by issuing 13,271,000 shares of common stock, including 1,731,000 shares pursuant to the exercise of the underwriters’ over-allotment option. The net proceeds of the offering, after all expenses including underwriters fees, were approximately $81,300.
| (29) | Preferred stock |
On November 21, 2008, as part of the Troubled Asset Relief Program (“TARP”) Capital Purchase Program, the Company issued and sold to the U. S. Department of the Treasury (the “Treasury”), (a) 27,875 shares (the “Preferred Shares”) of Fixed Rate Cumulative Perpetual Preferred Stock, Series A, having a liquidation preference of $1,000 per share, and (b) a ten-year warrant (the “Warrants”) to purchase up to 250,825 shares of voting common stock, par value $0.01 per share (“Common Stock”), at an exercise price of $16.67 per share.
On September 30, 2009, the Company repurchased all of the outstanding Preferred Shares issued pursuant to TARP for $28,875 plus accrued dividends. In October 2009, the Company purchased all remaining outstanding Warrants issued pursuant to TARP for $212.
109
Table of Contents
Pursuant to the requirements of Section 13 or 15(d) of the Securities Exchange Act of 1934, the Registrant has caused this report to be duly signed on its behalf by the undersigned, thereunto duly authorized, in the City of Davenport, State of Florida, on the 4th day of March, 2010.
| CENTERSTATE BANKS, INC. |
| /s/ ERNEST S. PINNER |
| Ernest S. Pinner |
| Chairman of the Board, |
| President and Chief Executive Officer |
| /s/ JAMES J. ANTAL |
| James J. Antal |
| Senior Vice President and Chief Financial Officer |
| (Principal financial officer and principal accounting officer) |
Pursuant to the requirements of the Securities Exchange Act of 1934, this report has been signed below by the following persons on behalf of the Registrant and in the capacities and on March 4, 2010.
| Signature |
Title | |
| /S/ ERNEST S. PINNER Ernest S. Pinner |
Chairman of the Board President and Chief Executive Officer | |
| /S/ JAMES H. BINGHAM |
Director | |
| James H. Bingham | ||
| /S/ G. ROBERT BLANCHARD, JR. |
Director | |
| G. Robert Blanchard, Jr. | ||
| /S/ C. DENNIS CARLTON |
Director | |
| C. Dennis Carlton | ||
| /S/ FRANK M. FOSTER, JR. |
Director | |
| Frank M. Foster, Jr. | ||
| /S/ GAIL E. GREGG-STRIMENOS |
Director | |
| Gail E. Gregg-Strimenos | ||
| /S/ BRYAN W. JUDGE |
Director | |
| Bryan W. Judge | ||
| /S/ SAMUEL L. LUPFER, IV |
Director | |
| Samuel L. Lupfer, IV | ||
| /S/ LAWRENCE W. MAXWELL |
Director | |
| Lawrence W. Maxwell | ||
| /S/ RULON D. MUNNS |
Director | |
| Rulon D. Munns | ||
| /S/ G. TIERSO NUNEZ II |
Director | |
| G. Tierso Nunez II | ||
| /S/ THOMAS E. OAKLEY |
Director | |
| Thomas E. Oakley | ||
| /S/ J. THOMAS ROCKER |
Director | |
| J. Thomas Rocker | ||
110
Table of Contents
CenterState Banks, Inc.
Form 10-K
For Fiscal Year Ending December 31, 2009
| Exhibit No. |
Exhibit | |
| 3.6 | Articles of Amendment to Articles of Incorporation of CenterState Banks, Inc. | |
| 21.1 | Subsidiaries of the Registrant | |
| 23.1 | Consent of Crowe Horwath LLP | |
| 31.1 | Certification of President and Chief Executive Officer under Section 302 of the Sarbanes-Oxley Act of 2002 | |
| 31.2 | Certification of Chief Financial Officer under Section 302 of the Sarbanes-Oxley Act of 2002 | |
| 32.1 | Certification of President and Chief Executive Officer under Section 906 of the Sarbanes-Oxley Act of 2002 | |
| 32.2 | Certification of Chief Financial Officer under Section 906 of the Sarbanes-Oxley Act of 2002 | |