Attached files
| file | filename |
|---|---|
| EX-32.2 - EX-32.2 - Nuveen Long/Short Commodity Total Return Fund | d115466dex322.htm |
| EX-31.1 - EX-31.1 - Nuveen Long/Short Commodity Total Return Fund | d115466dex311.htm |
| EX-31.2 - EX-31.2 - Nuveen Long/Short Commodity Total Return Fund | d115466dex312.htm |
| EX-32.1 - EX-32.1 - Nuveen Long/Short Commodity Total Return Fund | d115466dex321.htm |
Table of Contents
UNITED STATES
SECURITIES AND EXCHANGE COMMISSION
Washington, D.C. 20549
Form 10-K
(Mark One)
| x | ANNUAL REPORT PURSUANT TO SECTION 13 OR 15(d) OF THE SECURITIES EXCHANGE ACT OF 1934 |
For the fiscal year ended December 31, 2015
Or
| ¨ | TRANSITION REPORT PURSUANT TO SECTION 13 OR 15(d) OF THE SECURITIES EXCHANGE ACT OF 1934 |
For the transition period from to
Commission File Number 001-35710
Nuveen Long/Short Commodity
Total Return Fund
(Exact name of registrant as specified in its charter)
| Delaware | 45-2470177 | |
| (State or other jurisdiction of incorporation or organization) |
(I.R.S. Employer Identification No.) | |
| 333 West Wacker Drive Chicago Illinois |
60606 | |
| (Address of principal executive offices) | (Zip Code) | |
(877) 827-5920
(Registrant’s telephone number, including area code)
Securities registered pursuant to Section 12(b) of the Act:
| Title of Each Class |
Name of Each Exchange on Which Registered | |
| Common Units of Beneficial Interest | NYSE MKT |
Securities registered pursuant to Section 12(g) of the Act: None
Indicate by check mark if the Registrant is a well-known seasoned issuer, as defined in Rule 405 of the Securities Act. Yes ¨ No x
Indicate by check mark if the Registrant is not required to file reports pursuant to Section 13 or Section 15(d) of the Act. Yes ¨ No x
Indicate by check mark whether the registrant (1) has filed all reports required to be filed by Section 13 or 15(d) of the Securities Exchange Act of 1934 during the preceding 12 months (or for such shorter period that the registrant was required to file such reports), and (2) has been subject to such filing requirements for the past 90 days. Yes x No ¨
Indicate by check mark whether the registrant has submitted electronically and posted on its corporate Website, if any, every Interactive Data File required to be submitted and posted pursuant to Rule 405 of Regulation S-T (§229.405 of this chapter) during the preceding 12 months (or for such shorter period that the registrant was required to submit and post such files). Yes x No ¨
Indicate by check mark whether the registrant is a large accelerated filer, an accelerated filer, a non-accelerated file, or a smaller reporting company. See the definitions of “large accelerated filer,” “accelerated filer” and “smaller reporting company” in Rule 12b-2 of the Exchange Act. (Check one):
| Large accelerated filer | ¨ | Accelerated filer | x | |||||
| Non-accelerated filer | ¨ | (Do not check if smaller reporting company) | Smaller reporting company | ¨ | ||||
Indicate by check mark whether the registrant is a shell company (as defined in Rule 12b-2 of the Exchange Act). Yes ¨ No x
As of March 10, 2016, the registrant had 16,345,840 shares outstanding.
As of June 30, 2015, the aggregate market value of the shares held by non-affiliates was approximately $268,548,350.
Table of Contents
NUVEEN LONG/SHORT COMMODITY TOTAL RETURN FUND
UNITED STATES SECURITIES AND EXCHANGE COMMISSION
Washington, D.C. 20549
FORM 10-K
| Page No. | ||||||
| Part I |
||||||
| Item 1. | 2 | |||||
| Item 1A. | 10 | |||||
| Item 1B. | 24 | |||||
| Item 2. | 24 | |||||
| Item 3. | 24 | |||||
| Item 4. | 24 | |||||
| Part II | ||||||
| Item 5. | Market for Registrant’s Common Equity, Related Stockholder Matters and Issuer Purchases of Equity Securities | 25 | ||||
| Item 6. | 28 | |||||
| Item 7. | Management’s Discussion and Analysis of Financial Condition and Results of Operations | 30 | ||||
| Item 7A. | 44 | |||||
| Item 8. | 47 | |||||
| Item 9. | Changes in and Disagreements with Accountants on Accounting and Financial Disclosure | 70 | ||||
| Item 9A. | 70 | |||||
| Item 9B. | 71 | |||||
| Part III |
||||||
| Item 10. | 72 | |||||
| Item 11. | 76 | |||||
| Item 12. | Security Ownership of Certain Beneficial Owners and Management and Related Stockholder Matters | 76 | ||||
| Item 13. | Certain Relationships and Related Transactions, and Director Independence |
76 | ||||
| Item 14. | 77 | |||||
| Part IV | ||||||
| Item 15. | 78 | |||||
| Affirmation of the Commodity Pool Operator | 79 | |||||
| Signatures | 80 | |||||
Table of Contents
CAUTIONARY STATEMENT CONCERNING FORWARD-LOOKING INFORMATION
This annual report on Form 10-K (the “Annual Report”) includes forward-looking statements within the meaning of Section 27A of the Securities Act of 1933, as amended, and Section 21E of the Securities Exchange Act of 1934, as amended (the “Exchange Act”), that involve substantial risks and uncertainties. In some cases, you can identify forward-looking statements by terminology such as “may,” “will,” “should,” “expect,” “plan,” “anticipate,” “believe,” “estimate,” “predict,” “potential” or the negative of these terms or other comparable terminology. These forward-looking statements are based on current expectations, estimates and projections and are subject to a number of risks, uncertainties and other factors, both known (such as those described in “Risk Factors” and elsewhere in this Annual Report) and unknown, that could cause the actual results, performance, prospects or opportunities of the registrant to differ materially from those expressed in, or implied by, these forward-looking statements.
You should not place undue reliance on any forward-looking statements. Except as expressly required by the federal securities laws or otherwise, the registrant undertakes no obligation to publicly update or revise any forward-looking statements or the risks, uncertainties or other factors described in this Annual Report, as a result of new information, future events or changed circumstances or for any other reason after the date of this Annual Report.
1
Table of Contents
PART I
| Item 1. | Business |
Organization
The Nuveen Long/Short Commodity Total Return Fund (the “Fund”) was organized as a Delaware statutory trust on May 25, 2011, to operate as a commodity pool. Nuveen Commodities Asset Management, LLC, the Fund’s manager (“NCAM” or the “Manager”), is a Delaware limited liability company registered as a commodity pool operator (“CPO”) with the Commodity Futures Trading Commission (the “CFTC”) and is a member of the National Futures Association (“NFA”). The Fund commenced operations on October 25, 2012, with its initial public offering. The Fund operates pursuant to an Amended and Restated Trust Agreement (the “Trust Agreement”). The Fund’s shares represent units of fractional undivided beneficial interest in, and ownership of, the Fund. Fund shares trade on the NYSE MKT under the ticker symbol “CTF”. The Fund is not a mutual fund, a closed-end fund, or any other type of “investment company” within the meaning of the Investment Company Act of 1940, as amended (the “1940 Act”), and is not subject to regulation thereunder.
The Manager has selected its affiliate, Gresham Investment Management LLC (“Gresham LLC”), acting through its Near Term Active division (“Gresham NTA”), as the Fund’s commodity sub-adviser, which is referred to in this Annual Report in that capacity as “Gresham” or the “Commodity Sub-adviser.” Gresham LLC is a Delaware limited liability company, the successor to Gresham Investment Management, Inc., formed in July 1992. Gresham LLC is registered with the CFTC as a commodity trading advisor (“CTA”) and a CPO, is a member of the NFA and is registered with the Securities Exchange Commission (“SEC”) as an investment adviser.
The Manager has selected its affiliate, Nuveen Asset Management, LLC (“Nuveen Asset Management” or the “Collateral Sub-adviser”), to manage the Fund’s collateral invested in cash equivalents, U.S. government securities and other short-term, high grade debt securities. Nuveen Asset Management is a Delaware limited liability company and is registered with the SEC as an investment adviser.
The Manager, the Commodity Sub-adviser and the Collateral Sub-adviser are subsidiaries of Nuveen Investments, Inc. (“Nuveen Investments”). Nuveen Investments is a subsidiary of TIAA.
Proposed Conversion to Exchange-Traded Fund (“ETF”) Structure
On December 19, 2014, the Fund issued a press release announcing that the Manager had approved a plan to convert the Fund (the “Conversion”) into an open-ended ETF. On May 15, 2015, shareholders of the Fund approved amendments to the Fund’s Declaration of Trust that are necessary to complete the Conversion. To facilitate the Conversion, on July 9, 2015, the Fund filed a registration statement with the Securities and Exchange Commission (the “SEC”) to register common shares that may be issued from time to time after the Conversion. As of December 31, 2015 the Conversion remains subject to the receipt of certain regulatory approvals.
In connection with the Conversion, the Manager intends to implement a number of additional changes to the Fund that the Manager believes will better align a number of the Fund’s features with its newly-adopted ETF structure, including a reduction of the management fee, and changes to the Fund’s investment strategy, name and distribution policy. None of these expected changes have been finalized, and they remain subject to further revision by the Manager. In addition, following the Conversion, the Manager will continue to have the ability, without shareholder approval, to make subsequent changes to the operation of the Fund.
On March 2, 2016 (subsequent to the Fund’s fiscal year end), the Fund announced an update on the expected time frame for the Conversion. Assuming receipt of certain regulatory approval, the Conversion is expected to be completed in the second quarter of 2016. The Conversion requires regulatory clearance, including the adoption of a new exchange rule pursuant to which the Fund’s shares will trade following the Conversion. The Fund has been
2
Table of Contents
working with the NYSE MKT, which has initiated the rule making process for the new rule, which will ultimately require approval by the SEC. There can be no assurance that such clearance will be obtained, or if obtained, that the Conversion will be completed in the anticipated time frame.
The Fund is not currently, and after the Conversion will not be, a mutual fund or any other type of investment company within the meaning of 1940 Act. Until the Conversion occurs, the Fund will continue to operate as currently structured.
Investment Objective and Investment Strategy
The Fund’s investment objective is to generate attractive total returns. The Fund is actively managed and seeks to outperform its benchmark, the Morningstar® Long/Short Commodity IndexSM (the “Index”). The Index tracks the historical total return performance of a diverse portfolio of commodity futures, which may be invested long, short or flat. The Index uses a momentum rule to determine if each commodity futures position is long, short or “flat” (in the case of energy futures, as described below). In pursuing its investment objective, the Fund invests directly in a diverse portfolio of exchange-traded commodity futures contracts that represent the main commodity sectors and are among the most actively traded futures contracts in the global commodity markets. The Fund’s investment strategy has three principal elements:
| • | An actively managed long/short portfolio of exchange-traded commodity futures contracts; |
| • | A portfolio of exchange-traded commodity option contracts; and |
| • | A collateral portfolio of cash equivalents, U.S. government securities and other short-term, high grade debt securities. |
During temporary defensive periods or during adverse market circumstances, the Fund may deviate from its investment objective and policies.
Long/Short Commodity Investment Program. The Fund’s long/short commodity investment program is an actively managed, fully collateralized, rules-based commodity investment strategy that seeks to capitalize on opportunities in both up and down commodity markets. “Fully collateralized” means that the Fund will maintain as collateral cash equivalents, U.S. government securities and other short-term, high grade debt securities in an aggregate amount corresponding to the full notional value of its commodity investments. “Long/short” means that the Fund’s commodity futures contracts may be invested on both a long basis, seeking to profit from potential increases in commodity prices, and a short basis, seeking to profit from declines in commodity prices. “Rules-based” means that the Fund will manage its commodity investments consistent with program rules which specify minimum liquidity requirements for commodity futures contract investing and other parameters such as eligible commodity futures contracts, contract term, commodity weightings and annual and interim rebalancing of individual commodities and the long/short portfolio.
The Fund makes investments in the most actively traded commodity futures contracts in the four main commodity sectors in the global commodities markets:
| • | energy; |
| • | agriculture; |
| • | metals; and |
| • | livestock. |
Generally, the program rules are used to determine the specific commodity futures contracts in which the Fund will invest, the relative weighting for each commodity and whether a position is either long or short (or flat in the case of energy futures contracts). The Fund will not short energy futures contracts and will instead hold a flat
3
Table of Contents
position, because the prices of energy futures contracts are generally more sensitive to geopolitical events than to economic factors and, as a result, significant price variations are often driven by factors other than supply-demand imbalances. References to a flat position mean that instead of shorting an energy futures contract when market signals dictate, the Fund will not have a futures contract position for that energy commodity, and will instead move that position to cash.
The commodity markets are dynamic and as such the long/short commodity investment program may require frequent adjustments in the Fund’s commodity positions. The Commodity Sub-adviser expects to trade each position no less frequently than once per month. The relative balance of the Fund’s long/short commodity investments may vary significantly over time, and at certain times, the Fund’s aggregate exposure may be all long, all short and flat, or may consist of various combinations (long, short, and/or flat) thereof. Gresham will manage its overall strategy so that the notional amount of the Fund’s combined long, short and flat futures positions will not exceed 100% of the Fund’s net assets.
The specific commodities in which the Fund will invest, and the relative weighting of those contracts, will be determined annually by the Commodity Sub-adviser based upon the composition of the Index at that time. The target weightings of the underlying commodities are expected to remain unchanged until the next annual reconstitution each December. Upon annual reconstitution, the target weight of any individual commodity futures contract will be set and will be limited to 10% of the Fund’s net assets to provide for diversification. The Commodity Sub-adviser expects the actual portfolio weights to vary during the year due to market movements. If price movements cause an individual commodity contract to represent more than 10% of the Index at any time between monthly rebalancing, the Fund would seek to match the target weighting at the time of the monthly rebalancing. The Fund expects to invest in short-term commodity futures contracts with terms of up to one year.
Options Strategy. The Fund employs a commodity option writing strategy that seeks to produce option premiums for the purpose of enhancing the Fund’s risk-adjusted total return over time. Option premiums generated by this strategy may also enable the Fund to more efficiently implement its distribution policy. There can be no assurance that the Fund’s options strategy will be successful.
A call option gives its owner (buyer) the right but not the obligation to buy the underlying futures contract at a particular price, known as the strike price, at any time between the purchase date and the expiration date of the option. The person who sells the call option to the buyer is thus required to fulfill the contractual obligation (by selling the underlying futures contract to the buyer at the strike price) should the call option be exercised. A put option gives its owner (buyer) the right but not the obligation to sell the underlying futures contract at the strike price, at anytime between the purchase date and the expiration date of the option. The person who sells the put option to the buyer is thus required to fulfill the contractual obligation (by buying the underlying futures contract from the seller at the strike price) should the put option be exercised.
Pursuant to the options strategy, the Fund may sell exchange-traded commodity call or put options on a continual basis on up to approximately 25% of the notional value of each of its commodity futures contracts that, in Gresham’s determination, have sufficient option trading volume and liquidity. If Gresham buys the commodity futures contract, they will sell a call option on the same underlying commodity futures contract. If Gresham shorts the commodity futures contract, they will sell a put option on the same underlying commodity futures contract (except in the case of energy futures contracts). Gresham may exercise discretion with respect to commodity futures contract selection. Due to trading and liquidity considerations, Gresham may determine that it is in the best interest of Fund shareholders to sell options on like commodities (for example, gas oil and heating oil are like commodities) and not matched commodity futures contracts.
Generally, the Fund expects to sell short-term commodity options with terms of up to one year. Subject to the foregoing limitations, the implementation of the options strategy will be within Gresham’s discretion. Over extended periods of time, the “moneyness” of the commodity options may vary significantly. Upon sale, the
4
Table of Contents
commodity options may be “in-the-money,” “at-the-money” or “out-of-the-money.” A call option is said to be “in-the-money” if the exercise price is below current market levels, “out-of-the-money” if the exercise price is above current market levels and “at-the-money” if the exercise price is at current market levels. Conversely, a put option is said to be “in-the-money” if the exercise price is above the current market levels and “out-of-the-money” if the exercise price is below current market levels. The Fund sells commodity options that are U.S. exchange-traded and that are typically “American-Style” (exerciseable at any time prior to expiration). The Fund also may sell commodity options that are non-U.S. exchange traded and that are typically “European-style” (exerciseable only at the time of expiration). The Fund’s risk-adjusted return over any particular period may be positive or negative.
When initiating new trades, the Fund expects to sell covered in-the-money options and will not sell uncovered options. Because the Fund will maintain options positions until expiration, the Fund may have uncovered out-of-the-money options in its portfolio depending on price movements of the underlying futures contracts. In certain circumstances, the Fund may hold out-of-the-money option positions that due to subsequent trades by the Fund become uncovered. An out-of-the-money option is worthless and there is no expectation that it will be exercised. As long as the option remains out-of-the-money, there is no additional exposure for the Fund. For example, if the Fund is long wheat futures and sells covered call options on wheat futures, subsequent price movements (i.e., price declines) in wheat futures may result in Gresham, on behalf of the Fund, reversing from a long wheat futures contract position to a short wheat futures contract position. In this example, Gresham would then sell the long wheat futures contracts and continue to hold what would then be an out-of-the-money call option. At the same time, to effect its short position Gresham would short wheat futures contracts and sell covered put options on wheat futures. Due to market impact and other trading considerations, the Fund will hold the out-of-the-money call option instead of incurring additional trading costs to exit the position. The Fund will rebalance its positions no less often than monthly and as a result it is anticipated that no out-of-the-money option position would be uncovered for longer than one month. This element of the Fund’s options strategy increases the Fund’s gap risk, which is the risk that a commodity price will change from one level to another with no trading in between. In the event of an extreme market change or gap move in the price of a single commodity, the Fund’s options strategy may result in increased exposure to that commodity from any uncovered options. Continuing the wheat example above, if a gap move causes the out-of-the-money call option position to become in-the-money, the Fund may temporarily have exposure on the wheat call option position but no corresponding long position in the underlying wheat futures contracts. In response to such a gap move, Gresham would attempt to quickly move to implement appropriate offsetting trades consistent with its unleveraged commodity investment strategy. Gap risk could adversely affect the Fund’s performance and may negatively impact the trading price of the Fund’s shares. See “Item 1A. Risk Factors—Options Strategy Risks.”
If the Commodity Sub-adviser determines the Fund should have long exposure to an individual commodity futures contract, it will invest long in the commodity futures contract and sell a call option on the same underlying commodity futures contract with the same strike price and expiration date. In up markets where commodity prices increase, the portion of the Fund on which call options have been sold will forego potential appreciation in the value of the underlying contracts to the extent the price of those contracts exceeds the exercise price of call options sold plus the premium collected by selling the options. In flat or sideways markets, the portion of the Fund on which call options have been sold will generate current gains from the call option premiums collected by selling the options. In down markets where commodity prices decrease, the call options sold by the Fund will expire worthless. Regardless of the price performance of the long commodity futures position, the Fund will retain the net call option premiums received by the Fund.
If the Commodity Sub-advisor determines the Fund should have short exposure to an individual commodity futures contract, it will short the commodity futures contract and sell a put option on the same underlying commodity futures contract with the same strike price and expiration date. In down markets where commodity prices decrease, the portion of the Fund on which put options have been sold will forego potential appreciation in the value of the underlying futures contracts to the extent that the price of those contracts exceeds the exercise price of put options sold plus the premium collected by selling the options. In flat or sideways markets, the portion of the Fund on which
5
Table of Contents
put options have been sold will generate current gains from the put option premiums collected by selling the options. In up markets where commodity prices increase, the put options sold by the Fund will expire worthless. Regardless of the price performance of the short commodity futures position, the Fund will retain the net put option premiums received by the Fund.
Collateral Investments. The Fund’s commodity investments generally do not require significant outlays of principal. Currently, in the normal course of business, approximately 10%-25% of the Fund’s net assets are committed as “initial” and “variation” margin to secure the Fund’s futures contracts. These assets are placed in one or more commodity futures accounts maintained by the Fund at the Fund’s clearing broker, and are invested in high-quality instruments permitted under CFTC regulations. The remaining collateral (approximately 75%-90% of the Fund’s net assets) is held in a separate collateral investment account managed by the Collateral Sub-adviser.
The Fund’s assets held in this separate collateral account are invested in cash equivalents, U.S. government securities and other short-term, high grade debt securities with final terms not exceeding one year at the time of investment. These collateral investments (other than U.S. government securities) shall be rated at all times at the applicable highest short-term or long-term debt or deposit rating or money market fund rating as determined by at least one nationally recognized statistical rating organization (“NRSRO”) or, if unrated, judged by the Collateral Sub-adviser to be of comparable quality. These collateral investments consist primarily of direct and guaranteed obligations of the U.S. government and senior obligations of U.S. government agencies and may also include, among others, money market funds and bank money market accounts invested in U.S. government securities as well as repurchase agreements collateralized with U.S. government securities.
While the principal investment objective for the separate collateral account is the preservation of capital, the assets in the collateral account also provide the potential for returns that may supplement the returns from the Fund’s commodity investments. The assets in the separate collateral account may only be used for the purposes of making distributions to shareholders, payment of operating expenses and to replenish the Fund’s margin account, if necessary (and if there are excess funds in the margin account, those will be transferred to the separate collateral account). No parties other than the Fund have any access to, rights to, or ability to control the assets in the collateral account, and those assets will not be pledged. The Fund may not pledge any of its assets except to collateralize its investments in accordance with its investment objectives (i.e., for margin purposes), and only the assets maintained by the Fund with its clearing broker will be used for this purpose. Any declines in the value of the assets held in the Fund’s collateral account would negatively affect the net asset value of the Fund’s shares.
Management of the Fund
Trustee
Wilmington Trust Company (the “Delaware Trustee”), a Delaware trust company, is the resident Delaware trustee of the Fund. The Delaware Trustee is unaffiliated with the Manager. The Delaware Trustee’s duties with respect to the Fund’s management are limited to its express obligations under the Trust Agreement. In particular, the Delaware Trustee will accept service of legal process on the Fund in the State of Delaware and will make certain filings as required under the Delaware Statutory Trust Act, as amended (the “Delaware Statutory Trust Act”). The rights and duties of the Delaware Trustee, the Independent Committee (as defined below), the Manager and the shareholders are governed by the provisions of the Delaware Statutory Trust Act and by the Trust Agreement. Except for the limited duties described herein and in the Trust Agreement that are exercised by the Delaware Trustee and the Independent Committee, all duties and responsibilities to manage the business and affairs of the Fund are vested in the Manager, pursuant to the Trust Agreement and Delaware Statutory Trust Act.
Independent Committee
The Manager has established the independent committee, comprised of four members who are unaffiliated with the Manager (the “Independent Committee”), which fulfills the audit committee and nominating committee
6
Table of Contents
functions for the Fund, as well as any other functions required under the NYSE MKT listing standards or as set forth in the Trust Agreement. Each member of the Independent Committee receives an annual fee of $30,000, and each member of the Independent Committee also receives (a) a fee of $1,250 per meeting per fund for attendance in person or by telephone at a regularly scheduled quarterly meeting of the Independent Committee; and (b) a fee of $1,500 per meeting for attendance in person or by telephone at any special, non-regularly scheduled meeting of the Independent Committee. In addition to the payments described above, the Independent Committee chair receives an additional annual fee of $6,000. The Independent Committee members will also be compensated for out-of-pocket costs in connection with attending Independent Committee meetings. The fees of the Independent Committee members are paid by NCAM, which will be reimbursed for such fees on a pro rata
basis by each fund managed by NCAM. NCAM currently manages two funds, the Fund and the Nuveen Diversified Commodity Fund (“CFD”).
The Independent Committee does not have any duties (including fiduciary duties) or responsibilities to manage the Fund, all of which the Trust Agreement vests in the Manager, except those functions required under the listing standards of the NYSE MKT. Consequently, the Independent Committee does not have the wide-ranging duties and powers similar to a board of directors of an investment company. The Trust Agreement provides that the members of the Independent Committee will be indemnified by the Fund against liabilities arising out of the performance of their duties pursuant to the Trust Agreement, except to the extent that any such liabilities result from actual fraud or willful misconduct by such member of the Independent Committee. The Fund also provides Directors’ and Officers’ Insurance coverage to the members of the Independent Committee. The Independent Committee has the authority to remove any member of the Independent Committee who either ceases to be an “independent director” pursuant to the NYSE MKT listing standards or is subject to statutory disqualification under Sections 8a(2) or 8a(3) of the Commodities Exchange Act (“CEA”). The Independent Committee may appoint new members of the Independent Committee in the event of any vacancy caused by death, resignation or removal.
Manager
NCAM is the manager of the Fund, and is responsible for determining the Fund’s overall investment strategy and overseeing its implementation, managing the Fund’s business affairs and providing certain legal, accounting and other administrative support.
The Manager is registered with the CFTC as a CPO (effective date of registration January 4, 2006) and is a member of the NFA. The Manager was previously registered as a CTA, but withdrew its CTA registration effective as of March 5, 2013. Except to the extent carried out by the Independent Committee, the Manager has complete responsibility to ensure that the Fund complies with all obligations under the CEA. The Manager, Commodity Sub-adviser and Collateral Sub-adviser act in a similar capacity for CFD, a commodity pool traded on the NYSE MKT. Neither the Fund nor the Manager has established formal procedures to resolve potential conflicts of interest related to managing the investments and operations of the Fund.
The Manager may change, or temporarily deviate from, the Fund’s investment strategy and the manner in which the strategy is implemented if the Manager determines that it is in the best interests of Fund shareholders to do so based on existing market conditions or otherwise. For instance, the Manager could change or deviate from the Fund’s investment strategy or the manner in which it is implemented if, among other things, the commodity option markets experienced a lack of volatility or liquidity so that it was no longer in the best interest of the Fund and its shareholders for the Fund to employ the options strategy, or if other unforeseen circumstances arose that necessitated a change in the Fund’s strategy or its implementation. In addition, the Manager has the rights and obligations with respect to the Fund as described under the Trust Agreement. As permitted under Delaware law, the Trust Agreement provides that the Manager does not owe any duties (including fiduciary duties) to the Fund, other than the implied contractual covenant of good faith and fair dealing.
The Manager is a wholly-owned subsidiary of Nuveen Investments, a Delaware corporation. Founded in 1898, Nuveen Investments and its affiliates had approximately $225.7 billion of assets under management as of December 31, 2015. Nuveen Investments is a listed principal of the Manager.
7
Table of Contents
Commodity Sub-adviser
The Manager has selected its affiliate, Gresham LLC, acting through its Gresham NTA division, to manage the Fund’s commodity futures investment strategy and options strategy. Gresham LLC is a Delaware limited liability company, the successor to Gresham Investment Management, Inc., formed in July 1992. Gresham LLC is registered with the CFTC as a CTA (effective date of registration August 17, 1994) and as a CPO (effective date of registration August 17, 1994) and is a member of the NFA. Gresham LLC also is registered with the SEC as an investment adviser since April 2005. As of December 31, 2015, Gresham LLC had approximately $7.9 billion of client assets under management. Gresham LLC’s senior management team has extensive experience in overall supervision of commodities portfolio management and trading operations. Gresham LLC’s sole business activity is to render commodity investment advisory services and manage assets on behalf of its clients and in doing so it administers several commodity investment programs.
Gresham LLC offers investment management services through two independent divisions, Gresham NTA and the Term Structure Monetization division (“Gresham TSM”). Gresham NTA and Gresham TSM operate independently of each other under the independent account controller exemption under CFTC Regulation 150.3(a). Each division implements independent trading decisions and positions, and is restricted from having access to, or knowledge of, the other division’s trading decisions and positions, and is physically and technologically separated from the other division. See “Item 1A. Risk Factors—Commodity Investment Strategy Risks” for further discussion.
Collateral Sub-adviser
The Manager has selected its affiliate, Nuveen Asset Management, to invest the Fund’s collateral (excluding the initial and variation margin maintained at the Fund’s clearing broker). Nuveen Asset Management is a Delaware limited liability company and is registered with the SEC as an investment adviser. As of December 31, 2015, Nuveen Asset Management had approximately $142.2 billion of assets under management. The Fund’s collateral is invested in cash equivalents, U.S. government securities and other short-term, high grade debt securities, including corporate obligations. Such securities are common investments for Nuveen Asset Management in several of its investment strategies.
Management Fees
For the services and facilities provided by the Manager, the Fund pays the Manager an annual fee based on the Fund’s average daily net assets, payable on a monthly basis, according to the following schedule:
| Average Daily Net Assets |
Management Fee | |||
| For the first $500 million |
1.250 | % | ||
| For the next $500 million |
1.225 | |||
| For the next $500 million |
1.200 | |||
| For the next $500 million |
1.175 | |||
| For net assets over $2 billion |
1.150 | |||
Pursuant to an agreement among the Manager, the Fund, and the Commodity Sub-adviser, the Commodity Sub-adviser receives from the Manager an annual fee based on the Fund’s average daily net assets, payable on a monthly basis, according to the following schedule:
| Average Daily Net Assets |
Management Fee | |||
| For the first $250 million |
.500 | % | ||
| For the next $250 million |
.475 | |||
| For the next $250 million |
.450 | |||
| For the next $250 million |
.425 | |||
| For net assets over $1 billion |
.400 | |||
8
Table of Contents
Pursuant to an agreement among the Manager, the Fund, and the Collateral Sub-adviser, the Collateral Sub-adviser receives from the Manager an annual fee based on the Fund’s average daily net assets, payable on a monthly basis, according to the following schedule:
| Average Daily Net Assets |
Management Fee | |||
| For the first $250 million |
.150 | % | ||
| For the next $250 million |
.140 | |||
| For the next $250 million |
.130 | |||
| For the next $250 million |
.120 | |||
| For net assets over $1 billion |
.110 | |||
“Average daily net assets” means the total assets of the Fund, minus the sum of its total liabilities.
The fees of the Commodity Sub-adviser and Collateral Sub-adviser (collectively, the “Sub-advisers”) are paid by the Manager out of the fees the Manager receives from the Fund, and the Fund does not reimburse the Manager for those fees.
In addition to the fee of the Manager, the Fund pays all other costs and expenses of its operations, including, but not limited to, custody fees, transfer agent expenses, legal fees, expenses of independent auditors, and expenses of preparing, printing and distributing shareholder reports, notices, proxy statements and reports to governmental agencies, if any.
The agreements with each of the Sub-advisers may be terminated at any time, without penalty, by either the Manager or a Sub-adviser upon 120 days written notice. Also, the agreement with the Commodity Sub-adviser can be terminated by the Commodity Sub-adviser in certain circumstances on 90 days notice. Each of the agreements provides that each of the Sub-advisers will not be liable to the Fund in connection with the performance of its duties, and the Fund will indemnify the Sub-adviser for losses and costs arising out of its status as a Sub-adviser to the Fund if the Sub-adviser acted in good faith and in a manner it reasonably believed to be in, or not opposed to, the best interests of the Fund, except, in each case, for a loss resulting from the Sub-adviser’s willful misfeasance, bad faith or gross negligence or reckless disregard of its duties and obligations under the agreement. The Sub-advisers will indemnify the Fund and the Manager for losses and costs attributable to such willful misfeasance, bad faith, gross negligence or reckless disregard.
None of the foregoing agreements, or any extensions or replacements of such agreements, are subject to the approval of the Independent Committee or the Fund’s shareholders. As a result, the Manager may amend, extend or replace any such agreement in its sole discretion, and therefore may increase the fees of the Manager and any Sub-Adviser without any approval by the Independent Committee or the Fund’s shareholders.
Employees
The Fund has no employees.
Available Information
The Fund files with or submits to the SEC annual and quarterly reports and other information meeting the information requirements pursuant to Section 13(a) and 15(d) of the Securities Exchange Act of 1934 (the “Exchange Act”). These reports are available on the Fund’s website at http://www.nuveen.com/CommodityInvestments. Investors may also inspect and copy any materials the Fund files with the SEC at the SEC’s Public Reference Room at 100 F Street, NE, Washington, D.C. 20549. Investors may obtain information on the operation of the Public Reference Room by calling the SEC at 1-800-SEC-0330. In addition, the SEC maintains a website (http://www.sec.gov) which contains reports, proxy statements and other information filed electronically with the SEC. The Fund also posts on its website an information statement and certain daily and monthly reports required by CFTC regulations, all of which may contain information, including performance information of the Fund and the Commodity Sub-adviser, that is disclosed only through such website posting.
9
Table of Contents
| Item 1A. | Risk Factors |
An investment in the Fund involves a high degree of risk. Investors should be aware of the various risks, including those described below. Investors should consider carefully the risks described below before making an investment decision. Investors should also refer to the other information included in this Annual Report, including the Fund’s financial statements and the related notes and the Fund’s other filings with the SEC. Additional risks and uncertainties not presently known by the Fund or not presently deemed material by the Fund may also impair the Fund’s operations and performance. If any of the following events occur, the Fund’s performance could be materially and adversely affected. In such case, the Fund’s net asset value and the trading price of the Fund’s shares may decline and you may lose all or part of your investment.
An investment in the Fund involves a high degree of risk. You should not invest in shares unless you can afford to lose all of your investment.
Commodity Investment Strategy Risks
You may lose all of your investment. An investment in the Fund’s shares is subject to investment risk, including the possible loss of the entire amount that you invest. An investment in the Fund’s shares represents an indirect investment in the commodity futures contracts owned by the Fund, the prices of which can be volatile, particularly over short-term periods. Investments in individual commodity futures contracts and options on futures contracts historically have had a high degree of price variability and may be subject to rapid and substantial price changes. These price changes may be magnified by computer-driven algorithmic trading, which is becoming more prevalent in the commodities markets. The Fund could incur significant losses on its investments in those commodity futures contracts. If the Fund experiences greater losses than gains during the period you hold shares, you will experience a loss for the period even if the Fund’s historical performance is positive. The Fund’s returns over any particular period may be positive or negative.
Commodities have high levels of volatility and unpredictability. Movements in commodity prices are outside of the Fund’s control, are extremely difficult to predict and may not be anticipated by the Commodity Sub-adviser. Price movements may be influenced by, among other things:
| • | governmental, agricultural, trade, fiscal, monetary and exchange control programs and policies; |
| • | weather and climate conditions; |
| • | changing supply and demand relationships; |
| • | changes in international balances of payments and trade; |
| • | U.S. and international rates of inflation and economic growth; |
| • | currency fluctuations; |
| • | geopolitical events; |
| • | changes in interest and foreign currency/exchange rates; |
| • | market liquidity; and |
| • | changes in philosophies and emotions of market participants. |
The commodity markets have experienced periods of extreme volatility. General market uncertainty and consequent repricing risk have led to market imbalances of sellers and buyers, which in turn have resulted in significant reductions in values of a variety of commodities. Similar future market conditions may result in rapid and substantial swings in the valuation of the Fund’s holdings.
The changing interests of investors, hedgers and speculators in the commodity markets may influence whether futures prices are above or below the expected future spot price. In order to induce investors or speculators to
10
Table of Contents
take the corresponding long side of a futures contract, commodity producers must be willing to sell futures contracts at prices that are below the present value of expected future spot prices. Conversely, if the predominant participants in the futures market are the ultimate purchasers of the underlying commodity futures contracts in order to hedge against a rise in prices, then speculators would normally take the short side of the futures contract if the futures price is greater than the present value of the expected future spot price of the commodity. This can have significant implications for the Fund when it is time to reinvest the proceeds from a maturing futures contract into a new futures contract. If the interests of investors, hedgers and speculators in futures markets have shifted such that commodity purchasers are the predominant participants in the market, the Fund will be constrained to reinvest at higher futures prices which could have a negative effect on the Fund’s returns and may cause the Fund to suffer losses on its short positions. Conversely, if commodity sellers are the predominant participants in the market, the Fund will be constrained to reinvest at lower prices which could have a negative effect on the Fund’s returns and may cause it to suffer losses on its long positions.
The concentration of certain commodities in the Index may result in greater volatility. As of December 31, 2015, the Index had its highest weightings in the energy and agriculture groups (49.0% and 30.7%, respectively). As a result, the Fund may invest a substantial portion of its net assets in long positions in the energy and agriculture groups. Additionally, the Fund may place a substantial portion of its net assets in short positions in the agriculture group; such concentration could negatively impact the Fund if prices of agricultural commodities trend up. In addition, a downturn in the energy group could have a larger impact on the Fund than on a fund that does not concentrate in that group. Petroleum-related commodities (including WTI Crude, Brent Crude, Heating Oil, RBOB Gasoline, and Gas Oil) are unique in that their price has historically been sensitive to geopolitical events and may be less driven by supply and demand imbalances. As a result, the Fund will not short these energy contracts and would instead move to a flat position (or U.S. government securities, other short-term, high grade fixed income securities and cash equivalents). At times, the performance of commodities in the energy group may lag the performance of other groups or the broader commodity market. The energy group in general, and the price of oil in particular, recently has experienced a period of volatility that may continue. The prices of commodities in the energy group also may be adversely affected by weather and other catastrophic events such as leaks, fires, explosions, damage to facilities and equipment resulting from natural disasters, inadvertent damage to facilities and equipment, and terrorist acts.
Investing in commodity futures contracts in the energy sector may present more risks than if the Fund had no exposure to such contracts. A downturn in the energy sector could have a larger impact on the Fund than on a fund that does not invest in the energy sector. As discussed above, the performance of commodity contracts in the energy sector may, at times, lag the performance of other sectors or the broader market as a whole. In addition, there are several specific risks associated with investments in the energy sector, including commodity price risk, depletion risk (i.e., the depletion of reserves), supply and demand risk, regulatory risk, acquisition risk, weather risk and catastrophic event risk.
During a period when commodity prices are fairly stable, the absence of “backwardation” in the prices of commodity futures contracts held long by the Fund and the absence of “contango” in the prices of commodity futures contracts held short may cause the price of your shares to decrease. As the futures contracts included in the Index and held by the Fund near expiration, they are replaced by contracts that have a later expiration. For example, a contract purchased and held (long or short) in March 2016 may have an expiration date in June 2016. As this contract nears expiration, a long position in the contract may be replaced by selling the June 2016 contract and purchasing a contract expiring in September 2016, or a short position may be replaced by covering or purchasing the June 2016 contract and selling short the September 2016 contract. This process is known as “rolling.” Historically, the prices of some futures contracts (generally those relating to commodities such as crude oil, heating oil and sugar, that are typically consumed immediately rather than stored) have often been higher for contracts with near-term expirations than for contracts with longer-term expirations. This circumstance is referred to as “backwardation.” Absent other factors, in these circumstances, the sale of a long position in the June 2016 contract would be made at a higher price than the purchase of the September 2016 contract, thereby allowing the Fund to purchase a greater quantity of the September 2016 contract. Conversely, a “contango”
11
Table of Contents
market is one in which the prices of commodity futures contracts in the near-term months are lower than the prices of contracts in the longer-term months due to long-term storage costs and other factors. Commodities that have historically traded in a “contango” market are wheat, corn, gold, natural gas, coffee, lean hogs and soybean oil. Absent other factors, covering a short position in the September 2016 contract by purchasing that contract at a lower price than the price of replacing it with a short position in the December 2016 contract would allow the Fund to sell short a greater quantity of the December 2016 contract. Because the Fund’s strategy is based in part on taking advantage of such “backwardation” and “contango” situations, the absence of “backwardation” or “contango” in certain commodities in which the Fund is long or short could adversely affect the value of the Fund’s portfolio and consequently decrease the value of your shares. Generally, in “backwardation”, market roll yields are positive. In contango, market roll yields are negative.
The Fund may be subject to “whipsaw” risk, which is the risk that commodity price trends will change adversely to long or short positions taken by the Fund. Price momentum is an important factor in determining the Fund’s long and short/flat positions. As a result, “whipsaw” markets, in which significant price movements develop but then unexpectedly reverse, could cause substantial losses to the Fund. For example, price patterns in the commodity markets may indicate upward momentum, causing the Fund to shift from short or flat positions to long positions. However, such patterns may reverse unexpectedly, forcing the Fund to shift from long positions back to short or flat positions, leading to losses on such positions by the Fund. An unexpected change in government economic policy, a significant political or economic event, a surprise change in monetary policy, or a sudden shift in supply or demand could cause a severe reversal in a number of the Fund’s long or short positions, resulting in significant losses to the Fund.
Investments in futures contracts will expose the Fund to the risk of temporary aberrations or distortions in the commodity markets. The Fund is subject to the risk that temporary aberrations or distortions in the markets caused by certain events such as war, strikes, geopolitical events and natural disasters will occur that impact commodity prices and negatively impact the value of the Fund’s long and/or short positions, thereby adversely affecting the value of your shares.
Because futures contracts have no intrinsic value, the positive performance of your investment is wholly dependent upon an equal and offsetting loss. Futures trading is a risk transfer economic activity. For every gain there is an equal and offsetting loss rather than an opportunity to participate over time in general economic growth. An investment in shares of the Fund does not involve acquiring any asset with intrinsic value. Overall stock and bond prices could rise significantly and the economy as a whole may prosper while shares of the Fund trade unprofitably.
Regulatory developments could significantly and adversely affect the Fund. Commodity markets are subject to comprehensive statutes and regulations promulgated not only by the CFTC but also by self-regulatory organizations such as the NFA. Among other things, the CFTC and the exchanges on which futures contracts are traded are authorized to take extraordinary actions in the event of a market emergency, including, for example, the retroactive implementation of speculative position limits or higher margin requirements, the establishment of daily limits and the suspension of trading. Any of these actions, if taken, could adversely affect the returns of the Fund by limiting or precluding investment decisions the Fund might otherwise make. The regulation of commodity transactions in the U.S. is a rapidly changing area of law and is subject to ongoing modification by government, self-regulatory and judicial action. In addition, various national governments have expressed concern regarding the disruptive effects of speculative trading in the currency markets and the need to regulate the derivatives markets in general. The effect of any future regulatory change on the Fund is impossible to predict, but could be substantial and adverse to the Fund.
Daily trading limits imposed by the exchanges and position limits established by the CFTC may adversely affect the Fund. The CFTC and U.S. commodities exchanges limit the amount of fluctuation permitted in futures contract prices during a single trading day by regulations referred to as “daily price fluctuation limits” or “daily trading limits.” Once the daily trading limit has been reached in a particular futures contract, no trades may be
12
Table of Contents
made that day at a price beyond that limit or trading may be suspended for specified periods during the trading day. Futures contract prices could move to the limit for several consecutive trading days with little or no trading, thereby preventing prompt liquidation of futures positions and potentially disguising substantial losses the Fund may ultimately incur.
Separately, the CFTC and the U.S. commodities exchanges and certain non-U.S. exchanges have established limits referred to as “speculative position limits” or “accountability levels” on the maximum net long or short futures positions that any person, including the Fund, may hold or control in contracts traded on such exchanges. In October 2011, the CFTC adopted final regulations pursuant to the Dodd-Frank Wall Street Reform and Consumer Protection Act of 2010 (the “Dodd-Frank Act”) that would have imposed new position limits on 28 individual agricultural, metal and energy commodity futures and options contracts and on swaps that are economically equivalent to such contracts in order to prevent excessive speculation and manipulation in the commodity markets. On September 28, 2012, the U.S. District Court for the District of Columbia vacated the new position limit regulations and remanded the matter to the CFTC for further consideration consistent with the court’s opinion. The CFTC originally appealed the court’s decision, but in November 2013, the CFTC withdrew its appeal and re-proposed position limit regulations substantially as outlined above, with a few modifications. In addition, the CFTC proposed regulations that would expand certain exemptions from aggregation of accounts of related parties for these purposes. The initial public comment period for these proposed regulations closed on February 10, 2014. However, since that date, the CFTC has reopened the public comment period several times and has held public meetings to discuss certain position limit and aggregation issues. It remains to be seen whether the CFTC will modify the proposed regulations in response to public comments.
The CFTC’s existing position limit regulations require that a trader aggregate all positions in accounts over which the trader controls trading. However, a trader is not required to aggregate positions in multiple accounts or commodity pools if such trader (or its applicable divisions/subsidiaries) qualifies as an “independent account controller” under applicable CFTC regulations and avails itself of the independent account controller exemption under such regulations. In February 2013, Gresham NTA began operating under the independent account controller exemption such that Gresham NTA is not required to aggregate its positions with Gresham’s other division. The re-proposed regulations would maintain the independent account controller exemption. However, if the CFTC does not adopt or renew the independent account controller exemption, or if the exemption were modified or otherwise unavailable, Gresham NTA would be required to aggregate its positions with Gresham LLC’s other division for purposes of the CFTC’s position limits regulations. In that case, it is possible that investment decisions of the Commodity Sub-adviser would be modified and that positions held by the Fund would have to be liquidated to avoid exceeding such position limits, potentially resulting in substantial losses to the Fund and the value of your investment. In addition, failure to comply with the requirements of the independent account controller exemption could lead to an enforcement proceeding against Gresham LLC and could adversely affect the Fund.
Generally, current speculative position limits in the physical delivery markets are set at a stricter level during the spot month (that is, the month when the futures contract matures and becomes deliverable) versus the limits set for all other months. If the Manager determines that the Fund’s trading may be approaching any of these speculative position limits, the Fund may reduce its trading in that commodity or trade in other commodities.
The re-proposed regulations are extremely complex and, if ultimately implemented, whether in their current proposed form or an alternative form, may require further guidance and interpretation by the CFTC to determine in all respects how they apply to the Fund. Current or potential future position limits regulations could negatively impact the full implementation of the Fund’s investment strategy, including the Fund’s ability to reinvest in additional futures contracts and options on futures contracts.
Any deflation or unanticipated changes in inflation may negatively affect the expected future spot price of underlying commodities. Deflation or unanticipated changes in the rate of inflation may result in changes in the future spot price of the underlying commodities to which the Fund’s investments in futures contracts relate,
13
Table of Contents
which could negatively affect the Fund’s profitability and result in potential losses. In addition, reduced economic growth may lead to reduced demand for the underlying commodities and put downward pressure on future spot prices, adversely affecting the Fund’s operations and profitability, to the extent the Fund has taken a long position in the affected commodities.
Options Strategy Risks
There can be no assurance that the Fund’s options strategy will be successful. The Fund employs a commodity option writing strategy that seeks to produce option premiums for the purpose of enhancing the Fund’s risk adjusted total return over time. Option premiums generated by this strategy may also enable the Fund to more efficiently implement its distribution policy. The Fund’s use of options, however, may not provide any, or only partial, protection from adverse commodity price changes. In the event the Conversion occurs, the Fund will no longer employ an option writing strategy.
Specific price movements of the commodities or futures contracts underlying an option cannot be accurately predicted. There may be imperfect correlation between the changes in the market value of the futures contracts and the corresponding options contracts held by the Fund. Accordingly, the return performance of the Fund’s commodity futures contracts may not parallel the performance of the commodities that serve as the basis for the options bought or sold by the Fund; this basis risk may reduce the Fund’s overall returns. Investing in options is volatile and requires an accurate assessment of the market and the underlying instrument. Factors such as increased or reduced volatility, limited dollar value traded and timing of placing and executing orders may preclude the Fund from achieving the desired results of the options strategy and could affect the Fund’s ability to generate income and gains and limit losses. Because of the volatile nature of the commodities markets, writing (selling) commodity options involves a high degree of risk.
The Fund may forego gains (i.e., capital appreciation above the option exercise price for sold call options) on up to 25% of its long commodity futures contracts as a result of selling commodity call options. The Fund may forego gains on up to 25% of its short commodity futures contracts as a result of selling commodity put options. The Fund expects to sell short-term commodity call or put options with terms of up to twelve months on a continual basis on up to approximately 25% of the notional value of each of its commodity futures contracts that, in Gresham’s determination, have sufficient option trading volume and liquidity. Accordingly, the Fund is effectively limiting its potential for gains from price increases on long commodity futures positions and effectively limiting its potential for gains from price declines on short commodity futures positions during the option term on up to 25% of the notional value of its portfolio invested in commodity futures contracts. The extent of foregone capital appreciation depends on the value of the commodity futures contract relative to the exercise price of each such option and option premium realized.
The Fund is subject to gap risk, which is the risk that a commodity price will change from one level to another with no trading in between. Usually such movements occur when there are adverse news announcements, which can cause a commodity price to drop substantially from the previous day’s closing price. In the event of an extreme market change or gap move in the price of a single commodity when Gresham is unable to trade, the Fund’s exposure to that commodity will increase in proportion to the Fund’s option exposure. The Fund’s option strategy increases the Fund’s gap risk and could adversely affect the Fund’s performance in the event that the price of an individual commodity futures contract drops or increases substantially. Gap risk may also negatively impact the trading price of the Fund’s shares.
Risks Related to an Exchange Listing
NYSE MKT may halt trading in the shares which would adversely impact your ability to sell shares. The Fund’s shares are currently listed for trading on the NYSE MKT under the ticker symbol “CTF.” Trading in shares may be halted due to market conditions or, in light of the NYSE MKT rules and procedures, for reasons that, in the view of the NYSE MKT, make trading in shares inadvisable. In addition, trading is subject to trading halts
14
Table of Contents
caused by extraordinary market volatility pursuant to “circuit breaker” rules that require trading to be halted for a specified period based on a specified market decline. There can be no assurance that the requirements necessary to maintain the listing of the shares will continue to be met or will remain unchanged. If you buy or sell shares in the secondary market, you will incur customary brokerage commissions and charges and may pay some or all of the spread between the bid and the offered price in the secondary market on each leg of a roundtrip (purchase and sale) transaction. In times of severe market disruption or low trading volume in the Fund’s shares, this spread can increase significantly.
The lack of an active trading market for shares may result in losses on your investment at the time of disposition of your shares. There can be no guarantee that an active trading market for the shares will be maintained. If you need to sell your shares at a time when no active market for them exists, the price you receive for your shares, assuming that you are able to sell them, likely will be lower than that you would receive if an active market did exist.
Commodity Sub-adviser Risks
Past performance is no assurance of future results. The Fund’s performance to date is due in part to the proprietary commodity investment methodology employed by Gresham. Although the Manager does not anticipate a change in the Commodity Sub-adviser, any subsequent commodity sub-advisor to the Fund may employ a different commodity investment methodology than Gresham. Gresham’s proprietary methodology does not take into account unanticipated world events that may cause losses to the Fund. In any event, past performance does not assure future results.
Descriptions of the Commodity Sub-adviser’s strategies may not be applicable in the future. The Commodity Sub-adviser may make material changes to the investment strategy it uses in investing the Fund’s assets with the consent of the Manager, who has the sole authority to authorize any material changes. If this happens, the descriptions in this document would no longer be accurate or useful. You will be informed of any changes to the Commodity Sub-adviser’s strategy that the Manager deems to be material; however, you may not be notified until after a change occurs. Non-material changes may be made by the Commodity Sub-adviser without the Manager’s consent. Such potential changes may nevertheless affect the Fund’s performance. The Manager currently intends to make certain changes in strategy if the proposed Conversion of the Fund is approved and implemented. See “Regulatory and Operating Risks—The Conversion of the Fund may not occur.”
Speculative position limits and daily trading limits may reduce profitability and result in substantial losses. All accounts owned or managed by a commodity trading advisor, such as the Commodity Sub-adviser, its principals and its affiliates, are typically combined for speculative position limit purposes unless an exemption from aggregation is available.
It is possible that the Commodity Sub-adviser will approach or reach position limits for accounts managed within the Gresham NTA division, irrespective of the independent account controller exemption. If so, the Commodity Sub-adviser may have a conflict of interest with respect to allocating limited positions among various accounts it manages. Further, the investment decisions of the Commodity Sub-adviser may be modified to avoid exceeding regulatory “position limits,” potentially subjecting the Fund to substantial losses and forcing the Fund to forego certain opportunities. The Commodity Sub-adviser may have to reduce the size of positions that would otherwise be taken for the Fund, liquidate commodity futures contracts at disadvantageous times or prices, or not trade in certain markets on behalf of the Fund in order to avoid exceeding such limits.
Modification of trades that would otherwise be made by the Fund, if required, could adversely affect the Fund’s operations as well as profitability. In addition, a violation of speculative position limits by the Commodity Sub-adviser could lead to regulatory or self-regulatory action resulting in mandatory liquidation of certain positions held by the Commodity Sub-adviser on behalf of its accounts. There can be no assurance that the Commodity Sub-adviser will liquidate positions held on behalf of all the Commodity Sub-adviser’s accounts, including the
15
Table of Contents
Commodity Sub-adviser’s own accounts, in a proportionate manner. In the event the Commodity Sub-adviser chooses to liquidate a disproportionate number of positions held on behalf of the Fund at unfavorable prices, the Fund may incur substantial losses.
Risk that the Fund’s Shares May Trade at a Discount to Net Asset Value
There is a risk that the Fund’s shares may trade at prices other than the Fund’s net asset value per share. It is anticipated that the shares will trade in the secondary market at prices that may differ to varying degrees from the net asset value of the shares. The net asset value of each share will change as fluctuations occur in the market value of the Fund’s portfolio. Investors should be aware that the public trading price of a share may be different from the net asset value of a share and that shares may trade at a discount from their net asset value (which could be significant). The price difference may be due to the fact that supply and demand forces at work in the secondary trading market for shares are not necessarily the same as the forces influencing the prices of the commodity futures contracts and other instruments held by the Fund at any point in time.
Other Risks of the Fund’s Investment Strategy
The Fund may engage in frequent trading of its portfolio investments, or “Portfolio Turnover”. A portfolio turnover rate of 200%, for example, is equivalent to the Fund buying and selling all of its component instruments two times during the course of a year. A high portfolio turnover rate could result in high brokerage costs for the Fund. The Fund’s investment strategy of frequently rolling futures contracts will cause it to have a much higher portfolio turnover rate.
The Fund is subject to momentum investing risk, which is the risk that commodity futures contracts may be more volatile than the market as a whole, or that the returns on commodity futures contracts that previously exhibited price momentum are less than returns on other styles of investing. Momentum can turn quickly, and commodity futures contracts that previously exhibited high momentum may not experience continued momentum.
Shares may be adversely affected if Gresham makes changes to the Fund in response to changes in the composition and/or valuation of the Index. The composition of the Index may change over time as the commodity futures contracts in the Index are added or replaced. In addition, Index positions, and, therefore, positions taken by the Fund, may change quickly and frequently in response to changes in the commodities markets, which would result in greater trading expenses being incurred by the Fund. Furthermore, the Index sponsor may modify the method for determining the composition and weightings of the Index and for calculating its value in order to ensure that the Index represents a measure of the performance over time of the markets for the underlying commodities. Because the Index is serving as a benchmark measure for the Fund, the composition and weighting of their respective portfolios, while not identical, are likely to largely resemble each other. If the method for determining the Index composition and/or weighting were to change over time, any such changes could adversely impact the ability of the Fund to continue to track the Index.
An investment in the Fund may not necessarily diversify an investor’s overall portfolio and may exacerbate losses. The investment performance of the Index, the benchmark against which the Fund compares its performance, has shown little long-term historical correlation to the performance of other asset classes such as U.S. equities and U.S. bonds. Little correlation means that there is a low statistical relationship between the performance of the Index, on the one hand, and U.S. equities and U.S. bonds, on the other hand. Because there is little long-term historical correlation, the Fund cannot be expected to be automatically profitable during unfavorable periods in the stock or bond markets, or vice versa. If, during a particular period of time, the Fund’s performance moves in the same general direction as the other financial markets, or the Fund does not perform successfully relative to overall commodity markets, you may obtain little or no diversification benefits during that period from an investment in the Fund’s shares. In such a case, the Fund may have no gains to offset your losses from such other investments, your losses therefore may be exacerbated as you may suffer losses on your investment in the Fund at the same time as losses on your other investments increase.
16
Table of Contents
There may be a loss on investments in short-term debt securities. When the Fund purchases a futures contract, the Fund is required to deposit with its futures commission merchant only a portion of the value of the contract. This deposit is known as “initial margin.” If and when the market moves against the position, the Fund is required to make additional deposits known as “variation margin.” The Fund invests its assets, other than the amount of margin required to be maintained by the Fund, in cash equivalents, U.S. government securities and other short-term, high grade debt securities. The value of debt securities generally moves inversely with movements in interest rates (declining as interest rates rise). The value of debt securities might also decline if the credit quality of the issuer deteriorates, or if the issuer defaults on its obligations. If the Fund is required to sell short-term debt securities before they mature when the value of the securities has declined, the Fund will realize a loss. This loss may adversely impact the price of the Fund’s shares.
Daily disclosure of portfolio holdings could allow replication of the Fund’s portfolio and could have a negative effect on the Fund’s holdings. Because the Fund’s total portfolio holdings are disclosed on a daily basis, other investors may attempt to replicate the Fund’s portfolio or otherwise use the information in a manner that could have a negative effect on the Fund’s individual portfolio holdings and the Fund’s portfolio as a whole.
The Fund is subject to short exposure when it sells short a futures contract or writes a put option. Short sales are transactions in which the Fund initiates a position by selling a futures contract short. A short futures position allows the short seller to profit from declines in the price of the underlying commodity to the extent such declines exceed the transaction costs. In a short sale transaction, the Fund must deliver the underlying commodity at the contract price to a buyer of the contract who stands for delivery under the rules of the exchange that lists the contract or must offset the contract by entering into an opposite and offsetting transaction in the market.
Likewise, the writer of a call option is required to deliver the underlying futures contract at the strike price or offset the option by entering into an opposite and offsetting transaction in the market. The price at such time may be higher or lower than the price at which the futures contract was sold short or the strike price of the call option when the option was written. If the underlying price of the futures contract goes down between the time that the Fund sells the contract short and offsets the contract, the Fund will realize a gain on the transaction. If the price of the underlying futures contract drops below the strike price of the call option written, the option will expire worthless and the Fund also will realize a gain to the extent of the option premium received. Conversely, if the price of the underlying short futures contract goes up during the period, the Fund will realize a loss on the transaction. If the price of the underlying futures contract is higher than the strike price of a call option written, the option will become in-the-money and the Fund may realize a loss less any premium received for writing the option. A short sale creates the risk of an unlimited loss since the price of the underlying commodity in a futures contract or the underlying futures contract in a call option written could theoretically increase without limit, thus increasing the cost of covering the short positions. In circumstances where a market has reached its maximum price limits imposed by the exchange, the short seller may be unable to offset its short position until the next trading day, when prices could increase again in rapid trading.
Continuing effects of financial crisis. The financial crisis in the U.S. and global economies (including the European sovereign debt crisis) has resulted, and may continue to result, in an unusually high degree of volatility in the financial markets, both domestic and foreign. Liquidity in some markets has decreased and credit has become scarcer worldwide. Regulatory changes, including the Dodd-Frank Act and the introduction of new international capital and liquidity requirements under Basel III, may cause lending activity within the financial services sector to be constrained for several years as Basel III rules phase in and rules and regulations are promulgated and interpreted under the Dodd-Frank Act. In response to the crisis, the U.S. and other governments, and the Federal Reserve and certain foreign central banks, have taken steps to support financial markets. Withdrawal of this support (even when anticipated and done gradually), failure of efforts in response to the crisis, or investor perception that such efforts are not succeeding, could adversely impact the value and liquidity of certain securities and futures contracts.
In addition, since 2010, the risks of investing in certain foreign government debt have increased dramatically as a result of the European debt crisis, which began in Greece and spread to various other European countries. These
17
Table of Contents
debt crises and the ongoing efforts of governments around the world to address these debt crises have also resulted in increased volatility and uncertainty in the global financial markets. It is impossible to predict the effects of these or similar events in the future on the Fund, though it is possible that these or similar events could have a significant adverse impact on the value and risk of securities and commodities held by the Fund.
In addition, global economies and financial markets are becoming increasingly interconnected, which increases the possibilities that conditions in one country or region might adversely impact securities and commodities in a different country or region.
Risk of Investing in Non-U.S. Markets
Investing in non-U.S. markets will expose the Fund to additional credit and regulatory risk. The Fund may invest in commodity futures contracts and options on commodity futures contracts in non-U.S. markets. Some non-U.S. markets present risks because they are not subject to the same degree of regulation as their U.S. counterparts. None of the SEC, CFTC, NFA or any domestic exchange regulate activities of any foreign boards of trade or exchanges, including the execution, delivery and clearing of transactions, nor do they have the power to compel enforcement of the rules of a foreign board of trade or exchange or of any applicable non-U.S. laws or regulations. Similarly, the rights of market participants, such as the Fund, in the event of the insolvency or bankruptcy of a non-U.S. exchange or broker are also likely to be more limited than in the case of U.S. exchanges or brokers. As a result, in these markets, the Fund would have less legal and regulatory protection than it does when it invests domestically.
Investing through non-U.S. exchanges is subject to the risks presented by exchange controls, expropriation, increased tax burdens and exposure to local economic declines and political instability. An adverse development with respect to any of these variables could reduce the profit or increase the loss on investments of the Fund in the affected international markets.
Regulatory and Operating Risks
The shares are not federally insured. The shares do not represent a deposit or obligation of, and are not guaranteed or endorsed by, any bank or other insured depository institution, and are not federally insured by the Federal Deposit Insurance Corporation, the Federal Reserve Board or any other governmental agency.
The Conversion of the Fund may not occur. On December 19, 2014, the Fund issued a press release announcing that the Manager had approved a plan to convert the Fund into an open-end ETF. The purpose of the Conversion is to seek a closer alignment between the Fund’s share price and net asset value. On May 15, 2015, at the 2015 annual meeting of shareholders of the Fund, shareholders approved a proposal for the approval and adoption of a second amendment and restatement of the Amended and Restated Trust Agreement of the Fund, which will allow the Fund to effect the Conversion. The Conversion will only become effective upon receiving necessary regulatory clearance, including the adoption of a new exchange rule pursuant to which the Fund’s shares will trade following the Conversion. There can be no assurance as to when, or if, the Conversion actually will occur, and if it does occur, that it will achieve its stated purpose. In the event the Conversion does not occur, the Fund’s market price may fall, irrespective of the Fund’s performance.
The Fund is not a regulated investment company. Unlike certain other Nuveen Investments-sponsored funds, the Fund is not, and after the planned Conversion will not be, a mutual fund, a closed-end fund, or any other type of investment company within the meaning of the 1940 Act. Accordingly, you do not have the protections afforded by that statute which, among other things, regulates the relationship between the investment company and its investment adviser and mandates certain authority to be held by the board of directors of an investment company.
The value of the Fund’s shares could decrease if the Fund’s trading methodologies fail to produce the desired results or unanticipated operational or trading problems occur. There may be unanticipated problems or issues
18
Table of Contents
with respect to the trading and operational procedures of the Fund that could have a material adverse effect on an investment in the shares. In addition, there can be no assurance that the trading methodologies employed by the Fund will deliver the desired results.
Conflicts of interest could adversely affect the Fund. There are conflicts of interest in the structure and operation of the Fund. The Manager has sole authority to manage the Fund, and its interests may conflict with those of Fund shareholders. For example, the Manager’s fees are based on the Fund’s net assets, which could provide an incentive for the Manager to reduce or suspend distributions (if any) by the Fund. In addition, the Collateral Sub-adviser and Commodity Sub-adviser are affiliates of the Manager. Each Sub-adviser may encounter conflicts between the interests of the Fund and its other clients. Further, a conflict of interest may also arise when the Commodity Sub-adviser approaches or reaches position limits with respect to futures positions established for the benefit of the Fund and fails to allocate limited contracts available among other accounts it manages or, alternatively, liquidates positions held by other accounts in a disproportionate manner. Although the Fund, the Manager and the Sub-advisers have not established formal procedures to resolve potential conflicts of interest related to managing the investments and operations of the Fund, the Manager and the Sub-advisers have adopted codes of ethics in recognition of their fiduciary obligations to clients, including the Fund, and in accordance with applicable securities and commodities laws and regulations. Each of the Manager and the Sub-advisers resolve conflicts of interest as they arise based on its judgment and analysis of the particular conflict. The Manager and the Sub-advisers seek to resolve all potential conflicts in a manner that is fair and equitable to the Fund and its shareholders over time. However, it is possible that the Manager and/or the Sub-advisers could resolve a potential conflict in a manner that is not in the best interest of the Fund or its shareholders.
Departure of key personnel could adversely affect the Fund. In managing and directing the Fund’s activities and affairs, the Manager relies heavily on Gresham LLC, which has a relatively small number of personnel. If any of Jonathan S. Spencer, President and Chief Investment Officer of Gresham LLC, or Susan Wager and Randy Migdal, the Fund’s portfolio managers, were to leave Gresham LLC or be unable to carry out their present responsibilities, it could have an adverse effect on the Fund’s management. In addition, should market conditions deteriorate or for other reasons, Nuveen Investments, the Manager, the Collateral Sub-adviser and the Commodity Sub-adviser may need to implement cost reductions in the future which could make the retention of qualified and experienced personnel more difficult and could lead to personnel turnover.
The Fund’s long/short commodity investment strategy is not designed to provide the return of any single commodity or to replicate the performance of long-only commodity market benchmarks. In any given period, the net asset value returns of the Fund may differ substantially from any single commodity or long-only commodity market benchmarks. The relative balance of the Fund’s long/short exposure may vary significantly over time and at certain times the Fund’s aggregate exposure may be all long, all short or flat, or may consist of various combinations (long, short and flat) thereof. The Fund is not expected to provide a hedge against inflation in market environments when the Fund’s aggregate exposure is predominantly short and flat.
In the event of a loss on your investment, you have no recourse against Morningstar, Inc., the sponsor of the Index. The shares are not sponsored, endorsed, sold or promoted by the Index sponsor. The Index sponsor makes no representation or warranty, express or implied, to the owners of shares or any member of the public regarding the advisability of investing in commodity futures or option contracts or in the Fund. The Index sponsor’s only relationship to the Manager and the Fund is the licensing of certain trademarks, trade names and other intellectual property of the Index sponsor. The Index is determined and composed by the Index sponsor without regard to the Manager or the Fund. The Index sponsor has no obligation or liability in connection with the formation, management, marketing or promotion of shares or the trading of the Fund’s portfolio.
Shareholders have limited voting rights, and the Independent Committee has certain limited duties and powers, and neither will be able to affect management of the Fund regardless of performance. Unlike the holder of capital stock in an investment company, Fund shareholders have limited voting rights or other means to control or affect the Fund’s business. The Fund also does not have a board with the ability to control the management
19
Table of Contents
and operation of the Fund that would be typical of a board of directors of a corporation. In addition, the powers and duties of the Independent Committee are very limited with respect to the Fund. The sole power of the Independent Committee is to serve the audit committee and nominating committee functions of the Fund. The Independent Committee, unlike the board of directors of an investment company, does not have the power to cause the Fund to change its investment objective or policies, effect changes to operations, approve the advisory fees of the Manager or replace the Manager or Sub-advisers. Rather, the power to determine the Fund’s policies and direct its operations is conferred on the Manager. Thus, Fund shareholders do not benefit from the protection of their interests afforded to registered investment companies under the 1940 Act through the existence of an independent board of directors with extensive powers to control the operations of the company. Therefore, shareholders to a large extent are dependent on the abilities, judgment and good faith of the Manager in exercising its wide-ranging powers over the Fund, limited solely by the implied covenant of good faith and fair dealing applicable to the Manager in its relations with the Fund and its shareholders.
If the Manager voluntarily withdraws or is removed by a vote of shareholders and shareholders have not voted to elect a replacement Manager, the Fund will terminate and will liquidate its assets pursuant to the Trust Agreement. The Manager may not be removed by Fund shareholders except upon approval by the affirmative vote of the holders of over 50% of the outstanding shares (excluding shares owned by the Manager and its affiliates), subject to the satisfaction of certain conditions. Any removal of the Manager by Fund shareholders will result in the liquidation of the Fund if at the time there is not a remaining manager unless a successor manager is appointed as provided in the Trust Agreement. Thus, it is extremely unlikely that Fund shareholders will be able to make any changes in the management of the Fund, even if performance is poor.
Fees and expenses are charged regardless of Fund performance and may result in depletion of assets. Regardless of its investment performance, the Fund pays brokerage commissions, over-the-counter dealer spreads, management fees and operating and extraordinary expenses. A management fee will be paid by the Fund even if the Fund experiences a net loss for the year. Consequently, the expenses of the Fund could, over time, result in significant losses to your investment therein, including the loss of all of your investment. You may not achieve profits, significant or otherwise.
The value of the shares may be adversely affected if the Fund is required to indemnify the members of the Independent Committee or the Manager. Under the Trust Agreement, each of the members of the Independent Committee and the Manager has the right to be indemnified for any liability or expense it incurs absent actual fraud or willful misconduct. That means that the Manager may require the assets of the Fund to be sold in order to cover losses or liability suffered by it or by the members of the Independent Committee. Any sale of that kind would reduce the net asset value of the Fund and the value of the shares.
The failure of a clearing broker to comply with financial responsibility and customer segregation rules and/or the bankruptcy of one of the Fund’s clearing brokers could result in a total loss of Fund assets. Under current CFTC regulations, a clearing broker maintains customers’ assets in a bulk segregated account. There is a risk that assets deposited by the Fund with the clearing broker as margin for futures contracts may, in certain circumstances, be used to satisfy losses of other clients of the Fund’s clearing broker or the clearing broker’s own payment obligations. In addition, the assets of the Fund may not be fully protected in the event of that clearing broker’s bankruptcy, as the clearing broker’s customers, such as the Fund, are entitled to recover, even in respect of property specifically traceable to them, only a pro rata share of all property, if any, available for distribution to all of that clearing broker’s customers. The Fund also may be subject to the risk of the failure of, or delay in performance by, any exchanges and their clearing organizations, if any, on which commodity interest contracts are traded.
Similarly, the CEA requires a clearing organization approved by the CFTC as a derivatives clearing organization to segregate all funds and other property received from a clearing member’s clients in connection with domestic futures and options contracts from any funds held at the clearing organization to support the clearing member’s proprietary trading. Nevertheless, all customer funds held at a clearing organization in connection with any
20
Table of Contents
futures or options contracts are held in a commingled omnibus account and are not identified to the name of the clearing member’s individual customers. With respect to futures and options contracts, a clearing organization may use assets of a non-defaulting customer held in an omnibus account at the clearing organization to satisfy payment obligations of a defaulting customer of the clearing member to the clearing organization. As a result, in the event of a default of the clearing broker’s other clients or the clearing broker’s failure to extend its own funds in connection with any such default, the Fund would not be able to recover the full amount of assets deposited by the clearing broker on behalf of the Fund with the clearing organization.
The clearing brokers may be subject to legal or regulatory proceedings in the ordinary course of their business. A clearing broker’s involvement in costly or time-consuming legal proceedings may divert financial resources or personnel away from the clearing broker’s trading operations, which could impair the clearing broker’s ability to successfully execute and clear the Fund’s trades.
An investment in the shares may be adversely affected by competition from other methods of investing in commodities. The Fund competes with other financial vehicles, including other commodity pools, investment companies, hedge funds, traditional debt and equity securities issued by companies in the commodities industry, other securities backed by or linked to such commodities, and direct investments in the underlying commodities or commodity futures contracts. Market and financial conditions, and other conditions beyond the Manager’s or Commodity Sub-adviser’s control, may make it more attractive to invest in other financial vehicles or to invest in such commodities directly, which could limit the market for the shares.
The Fund has not been subject to independent review or review on your behalf. Shareholders do not have legal counsel representing them in connection with the Fund. Accordingly, a shareholder should consult its legal, tax and financial advisers regarding the desirability of investing in the Fund. As previously noted, you cannot predict the expected results of this Fund from the performance history of the Fund or of other accounts managed by the Commodity Sub-adviser.
Deregistration of the Manager or Sub-advisers could disrupt operations. The Manager and the Commodity Sub-adviser are registered commodity pool operators, the Commodity Sub-adviser is a registered commodity trading advisor and the Collateral Sub-adviser is a registered investment adviser. If the CFTC were to terminate, suspend, revoke or not renew the Manager’s commodity pool operator registration, the Manager would be compelled to withdraw as the Fund’s Manager, and shareholders would then determine whether to select a replacement manager or to dissolve the Fund. If the CFTC and/or the SEC, as applicable, were to terminate, suspend, revoke or not renew either of the Sub-advisers’ registrations, the Manager would terminate the management agreement with that Sub-adviser, in which case the Manager could choose to appoint a new sub-advisor or terminate the Fund. No regulatory action is currently pending or threatened against the Manager, the Commodity Sub-adviser or the Collateral Sub-adviser.
The Fund’s distribution policy may change at any time. Distributions paid by the Fund to its shareholders are generally expected over the long-term to be derived from the current income and gains from the Fund’s portfolio investments and the options strategy, but to the extent such current income and gains are not sufficient to pay distributions, the Fund’s distributions may represent a return of capital. The Fund’s actual financial performance will likely vary significantly from month-to-month and from year-to-year, and there may be periods, perhaps of extended durations of up to several years, when the distribution rate exceeds the Fund’s actual total returns. In that event, the Fund may liquidate investments in order to make distributions, and the timing and terms of any such liquidations could be disadvantageous to the Fund and its shareholders. The Manager reserves the right to change the Fund’s distribution policy and the basis for establishing the rate of its monthly distributions, or may suspend or reduce distributions without a change in policy, at any time and may do so without prior notice to shareholders. Any suspension or reduction of distributions will increase the Fund’s assets under management upon which the Manager earns management fees and may negatively affect the market price of the Fund’s shares. In the event the Conversion occurs, the Fund will discontinue its distribution policy.
21
Table of Contents
Tax Risk
As a partnership, the Fund may generate a tax liability regardless of whether you receive cash distributions. You will be taxed on your share of the Fund’s taxable income and gain each year, regardless of whether you receive any cash distributions from the Fund. The Fund is a partnership and not a regulated investment company; therefore, it is not required to make annual distributions. Your share of such income or gain, as well as the tax liability generated by such income or gain, may exceed the distributions, if any, that you receive from the Fund for the year.
Certain provisions of the Internal Revenue Code may cause investors who purchased Fund shares at a discount to net asset value to recognize gain in the first year of purchase without having sold their shares. The Fund is taxed as a partnership, and as a result, you are treated as owning your proportionate share of Fund assets. Section 743(b) of the Internal Revenue Code of 1986, as amended (the “Code”), generally requires the Fund to adjust your proportionate share of the basis in the Fund’s assets (your share of the “inside basis” in the Fund) to reflect your initial “outside basis” in your shares (i.e., the initial purchase price of your shares). In addition, Section 1256 of the Code requires the Fund to treat a large majority of its futures contracts as having been sold for tax purposes at the end of each year at their then-current market value.
The combined effect of Sections 743(b) and 1256 is that if you purchase Fund shares at a discount to net asset value during the year and hold those shares through year end, you would be deemed to have realized a capital gain substantially equal to the amount of that discount. Any such deemed gain would be reflected on your Schedule K-1 for that year (in addition to all other items of gain and loss for the year), and your “outside basis” in the Fund’s shares would be stepped up by the amount of that gain. This basis step-up would have the effect of reducing your capital gain (or increasing your capital loss) upon any subsequent sale of your shares. This would accelerate your realization of capital gain, but would not increase the amount of gain realized over the full period of the investment. This acceleration effect would be particularly acute for investors who purchase shares at substantial discounts to net asset value. This deemed capital gain would be avoided if the Fund’s net asset value per share were to fall below your purchase price per share by year end; conversely, if the Fund’s net asset value were to increase by year end, your deemed capital gain would be higher than the amount of the discount.
The calculations under Section 743(b) of the Code are complex, and there is little legal authority concerning the mechanics of the calculations, particularly in the context of publicly traded partnerships. It is possible that the Internal Revenue Service (“IRS”) will successfully assert that some or all of the conventions utilized by the Fund to determine and allocate the Section 743(b) basis adjustments do not satisfy the technical requirements of the Code or the regulations and, thus, will require different basis adjustments to be made.
You could owe tax on your share of the Fund’s ordinary income despite overall losses. Gain or loss on futures contracts and options on futures contracts will generally be taxed as capital gains or losses for U.S. Federal income tax purposes. Interest income is ordinary income. In the case of an individual, capital losses can only be used to offset capital gains plus $3,000 ($1,500 in the case of a married taxpayer filing a separate return) of ordinary income each year. Therefore, you may be required to pay U.S. Federal income tax on your allocable share of the Fund’s ordinary income, even though the Fund incurs overall losses.
Certain Fund expenses may be treated as miscellaneous itemized deductions rather than as deductible ordinary and necessary business expenses. Certain expenses incurred by the Fund may be treated as miscellaneous itemized deductions for U.S. Federal income tax purposes, rather than as deductible ordinary and necessary business expenses, with the result that shareholders who are individuals, trusts, or estates may be subject to limitations on the deductibility of their allocable share of such expenses.
Tax-exempt investors may recognize unrelated business taxable income with respect to their investment in the Fund. Persons that are otherwise exempt from U.S. Federal income tax may be allocated unrelated business taxable income as a result of their investment in the Fund. In particular, for charitable remainder trusts, an investment in the Fund may not be appropriate.
22
Table of Contents
Non-U.S. investors may face U.S. tax consequences. Non-U.S. investors should consult their own tax advisors concerning the applicable foreign as well as the U.S. Federal income tax implications of an investment in the Fund. Non-U.S. investors may also be subject to special withholding tax provisions if they fail to furnish the Fund (or another appropriate person) with a timely and properly completed Form W-8BEN or other applicable form.
Changes in the Fund’s tax treatment could adversely affect distributions to shareholders. The Fund believes that under current law and regulations it will be taxed as a partnership that is not subject to corporate income tax for U.S. Federal income tax purposes. However, the Fund has not requested, nor will it request, any ruling from the IRS as to this status. If the IRS were to challenge the U.S. Federal income tax status of the Fund, such a challenge could result in (i) an audit of each shareholder’s entire tax return and (ii) adjustments to items on that return that are unrelated to the ownership of shares. In addition, each shareholder would bear the cost of any expenses incurred in connection with an examination of its personal tax return.
The Fund generally could be impacted adversely by proposed changes and future changes in U.S. Federal income tax laws or tax administration, including changes that might treat publicly traded partnerships like the Fund as taxable corporations. If for any reason the Fund were taxable as a corporation for U.S. Federal income tax purposes in any taxable year, its income, gains, losses and deductions would be reflected on its own tax return rather than being passed through (proportionately) to shareholders. Its net income would be subject to taxation, reducing cash available for distributions, if any, and resulting in distributions, if any, being treated as dividends to the extent of current or accumulated earnings and profits. Such a tax reclassification could materially reduce the overall performance and after-tax returns of the Fund, possibly causing a decline in the price of the Fund shares.
Items of income, gain, deduction, loss and credit with respect to Fund shares could be reallocated if the IRS does not accept the conventions used by the Fund in allocating Fund tax items. U.S. Federal income tax rules applicable to partnerships are complex and often difficult to apply to widely held partnerships. The Fund will apply certain conventions in an attempt to comply with applicable rules and to report income, gain, deduction, loss and credit to Fund shareholders in a manner that reflects shareholders’ share of Fund items, but these conventions may not be in full technical compliance with applicable tax requirements. It is possible that the IRS will successfully assert that the conventions used by the Fund to allocate income to the shareholders do not satisfy the technical requirements of the U.S. Federal income tax law and could require that items of income, gain, deduction, loss or credit be reallocated in a manner that adversely affects you.
Tax rates and other features under current U.S. Federal income tax law may be adversely affected in the future. Long-term capital gains and ordinary income are now taxed to non-corporate investors at the applicable U.S. Federal income tax rates. There continue to be proposals for further changes to U.S. Federal income tax law, some of which could adversely affect the Fund or its shareholders.
Increased oversight of foreign financial assets. Under the Foreign Account Tax Compliance provisions of the Hiring Incentives to Restore Employment Act (commonly known as “FATCA”) enacted in 2010, foreign financial institutions and non-financial foreign entities and certain U.S. taxpayers holding foreign financial assets are subject to an enhanced reporting, disclosure, certification, withholding, and enforcement regime. Among other things, certain “withholdable payments” made to a foreign financial institution or non-financial foreign entity are generally subject to withholding tax unless the foreign financial institution enters into a disclosure compliance agreement with the U.S. Treasury or the non-financial foreign entity certifies as to its ownership. A foreign financial institution formed or doing business in a jurisdiction that has entered into an intergovernmental agreement to implement FATCA may need to comply with rules enacted by that jurisdiction, rather than entering into an agreement with U.S. Treasury. Such potentially “withholdable payments” under FATCA include certain interest, dividends, rents, and other gains or income from U.S. sources, but exclude income derived from the active conduct of a business. Investors should consult their tax advisors concerning the potential impact of FATCA on them.
23
Table of Contents
You will receive a Schedule K-1 and as a result may incur additional costs. Investors in the Fund will receive a Schedule K-1 (not a Form 1099) reporting their allocable portion of the tax items of the Fund. This form is expected to be available by the end of the first week of March following the taxable year to which it relates. If there were a delay in making Schedule K-1 available, it could be more difficult for investors to complete their tax return in a timely fashion. In the event the Fund has income and/or gains, investors may be required to pay taxes on their portion of such income and/or gains and the amount of those taxes may exceed their distributions from the Fund or the amount they receive when they sell their shares. Schedule K-1 is complex and shareholders who seek advice from tax advisors with respect to their Schedule K-1 may incur additional costs in the form of fees.
Possible constructive termination. Under U.S. Federal income tax law applicable to publicly traded partnerships like the Fund, if a partnership experiences sales or exchanges of 50% or more of its shares during a twelve month period, the partnership is “constructively terminated,” requiring it to close its tax year (and file its tax returns for that period or request an extension by the 15th day of the fourth month after the month in which the termination occurs, or the 15th day of the third month for tax years beginning after December 31, 2015) and restart a new tax year. It is difficult for publicly traded partnerships to ascertain on a real-time basis when constructive terminations occur given that shares are typically held in street name. Publicly traded partnerships typically identify actual beneficial owners only during the course of preparing year-end tax information for shareholders. Therefore, a publicly traded partnership may not be aware that a constructive termination occurred until well after the fact, which potentially subjects the partnership to substantial penalties for failing to file the tax return for the period preceding the termination in a timely manner. Based on information received by the Manager to date, the Manager does not believe the Fund experienced a constructive termination during the tax year ended December 31, 2015.
If you loan your shares to a “short seller” to cover a short sale of shares, you may be considered as having disposed of those shares. Because you may be considered to have sold shares that you loan to a “short seller” to cover a short sale of shares, you may no longer be treated for tax purposes as a partner with respect to those shares during the period of the loan to the short seller and you may recognize gain or loss from such disposition. Moreover, during the period of the loan to the short seller, any of our income, gain, loss or deduction with respect to those shares may not be reportable by you and any cash distributions you receive as to those shares could be fully taxable as ordinary income. Shareholders desiring to assure their status as partners and avoid the risk of gain recognition from a loan to a short seller are urged to modify any applicable brokerage account agreements to prohibit their brokers from borrowing their shares.
Shareholders are strongly urged to consult their own tax advisors and counsel with respect to the possible tax consequences to them of an investment in any shares. The tax consequences may differ in respect of different shareholders.
| Item 1B. | Unresolved Staff Comments |
None.
| Item 2. | Properties |
Not applicable.
| Item 3. | Legal Proceedings |
None.
| Item 4. | Mine Safety Disclosures |
Not applicable.
24
Table of Contents
PART II
| Item 5. | Market for Registrant’s Common Equity, Related Stockholder Matters and Issuer Purchases of Equity Securities |
a) The shares of the Fund trade on the NYSE MKT under the ticker symbol “CTF.”
The following table sets forth, for the calendar quarter indicated, the high and low intra-day market prices per share.
| Share Price | ||||||||
| Quarter Ended |
High | Low | ||||||
| December 2015 |
$ | 16.43 | $ | 15.27 | ||||
| September 2015 |
$ | 16.70 | $ | 15.70 | ||||
| June 2015 |
$ | 16.88 | $ | 16.18 | ||||
| March 2015 |
$ | 17.06 | $ | 16.31 | ||||
| December 2014 |
$ | 17.25 | $ | 14.19 | ||||
| September 2014 |
$ | 16.38 | $ | 14.63 | ||||
| June 2014 |
$ | 16.72 | $ | 15.95 | ||||
| March 2014 |
$ | 17.60 | $ | 16.40 | ||||
The Fund’s shares will likely trade at a market price that is different from the daily computed net asset value of a share of the Fund. This may be due, in large part, to supply and demand forces at work in the secondary trading market for shares of the Fund, which may be related to, but not identical to, the forces influencing the prices of the commodity futures contracts and other instruments held by the Fund that affect the net asset value of the Fund’s shares. When the Fund’s shares are trading on the NYSE MKT at a price above the net asset value, the shares are referred to as trading at a “premium,” and conversely when the Fund’s shares are trading on the exchange at a price below the net asset value, the shares are referred to as trading at a “discount.” The following table sets forth, for the calendar quarter indicated, the high and low end of day premium and/or (discount), as applicable.
| Quarter Ended |
High | Low | ||||||
| December 2015 |
(3.36 | )% | (6.42 | )% | ||||
| September 2015 |
(2.93 | )% | (5.02 | )% | ||||
| June 2015 |
(3.05 | )% | (7.45 | )% | ||||
| March 2015 |
(5.14 | )% | (7.46 | )% | ||||
| December 2014 |
(7.47 | %) | (22.65 | %) | ||||
| September 2014 |
(14.70 | %) | (21.07 | %) | ||||
| June 2014 |
(14.10 | %) | (17.65 | %) | ||||
| March 2014 |
(12.37 | %) | (17.08 | %) | ||||
Refer to the Fund Total Returns section of “Part II—Item 7. Management’s Discussion and Analysis of Financial Condition and Results of Operations” for a discussion of the proposed Conversion’s impact on the Fund’s shares discount.
As of December 31, 2015, the Fund had approximately 10,705 shareholders.
25
Table of Contents
The following graph presents the relationship between the Fund’s net asset value per share and its market price per share during the 2014 and 2015 calendar years.
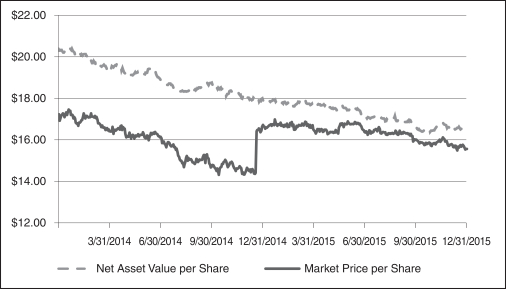
During the years ended December 31, 2015 and December 31, 2014, the Fund declared distributions per share as set forth in the following table:
| Ex Date | Record Date | Payable Date | Amount | |||||
| December 28, 2015 |
December 30, 2015 | December 31, 2015 | $ | 0.090 | ||||
| November 25, 2015 |
November 30, 2015 | December 1, 2015 | $ | 0.100 | ||||
| October 28, 2015 |
October 30, 2015 | November 2, 2015 | $ | 0.100 | ||||
| September 28, 2015 |
September 30, 2015 | October 1, 2015 | $ | 0.100 | ||||
| August 27, 2015 |
August 31, 2015 | September 1, 2015 | $ | 0.100 | ||||
| July 29, 2015 |
July 31, 2015 | August 3, 2015 | $ | 0.100 | ||||
| June 26, 2015 |
June 30, 2015 | July 1, 2015 | $ | 0.119 | ||||
| May 27, 2015 |
May 29, 2015 | June 1, 2015 | $ | 0.119 | ||||
| April 28, 2015 |
April 30, 2015 | May 1, 2015 | $ | 0.119 | ||||
| March 27, 2015 |
March 31, 2015 | April 1, 2015 | $ | 0.119 | ||||
| February 25, 2015 |
February 27, 2015 | March 2, 2015 | $ | 0.119 | ||||
| January 28, 2015 |
January 30, 2015 | February 2, 2015 | $ | 0.135 | ||||
| December 26, 2014 |
December 30, 2014 | December 31, 2014 | $ | 0.135 | ||||
| November 25, 2014 |
November 28, 2014 | December 1, 2014 | $ | 0.135 | ||||
| October 29, 2014 |
October 31, 2014 | November 3, 2014 | $ | 0.135 | ||||
| September 26, 2014 |
September 30, 2014 | October 1, 2014 | $ | 0.135 | ||||
| August 27, 2014 |
August 29, 2014 | September 2, 2014 | $ | 0.135 | ||||
| July 29, 2014 |
July 31, 2014 | August 1, 2014 | $ | 0.135 | ||||
| June 26, 2014 |
June 30, 2014 | July 1, 2014 | $ | 0.135 | ||||
| May 28, 2014 |
May 30, 2014 | June 2, 2014 | $ | 0.135 | ||||
| April 28, 2014 |
April 30, 2014 | May 1, 2014 | $ | 0.155 | ||||
| March 27, 2014 |
March 31, 2014 | April 1, 2014 | $ | 0.155 | ||||
| February 26, 2014 |
February 28, 2014 | March 3, 2014 | $ | 0.155 | ||||
| January 29, 2014 |
January 31, 2014 | February 3, 2014 | $ | 0.155 | ||||
26
Table of Contents
The Fund makes regular monthly distributions to its shareholders stated in terms of a fixed cents per share distribution rate. The Manager seeks to establish a distribution rate that, among other factors, roughly corresponds to its projections of the total return that could reasonably be expected to be generated by the Fund over an extended period of time. The Fund’s projected or actual distribution rate is not a prediction of what the Fund’s actual total returns will be over any specific future period.
The Fund’s ability to make distributions will depend on a number of factors, including, most importantly, the long-term total returns generated by the Fund’s commodity investments and the gains generated through the Fund’s options strategy. The Fund’s actual financial performance will likely vary significantly from month-to-month and from year-to-year, and there may be periods, perhaps of extended durations of up to several years, when the distribution rate exceeds the Fund’s actual total returns. In the event that the amount of income earned or capital gains realized by the Fund is not sufficient to cover the Fund’s distributions, the Fund may be required to liquidate investments to fund distributions at times or on terms that could be disadvantageous to the Fund and its shareholders.
Because the Fund’s investment performance since its inception has not been sufficient to cover the distributions made, the Fund has effectively been drawing upon its assets to meet payments prescribed by its distribution policy. The Fund also has paid fees and expenses that have also been drawn from the Fund’s assets.
As market conditions and portfolio performance may change, the rate of distributions on the shares and the Fund’s distribution policy could change. The Manager reserves the right to change the Fund’s distribution policy and the basis for establishing the rate of its monthly distributions, or may temporarily suspend or reduce distributions without a change in policy, at any time and may do so without prior notice to shareholders. The reduction or elimination of the Fund’s distributions could have the effect of increasing the Manager’s management fees.
b) Since the Fund’s initial public offering, no additional share offerings have taken place. Proceeds from the Fund’s initial public offering were invested in commodity futures contracts and options on commodity futures contracts, and cash equivalents, U.S. government securities and other short-term, high grade debt securities constituting collateral assets, in accordance with the Fund’s investment objective.
c) On March 14, 2013, the Fund adopted an open-market share repurchase program pursuant to which it was authorized to repurchase an aggregate of up to 10% of its outstanding common shares (approximately 1,800,000 shares) in open-market transactions at the Manager’s discretion. On March 6, 2014, the Fund reauthorized its share repurchase program, pursuant to which it may repurchase up to 10% of its outstanding common shares as of the reauthorization date (approximately 1,775,000 shares). During the year ended December 31, 2015, the Fund did not repurchase any shares. No shares have been repurchased outside of the program described.
27
Table of Contents
| Item 6. | Selected Financial Data |
The following table sets forth selected financial data for the Fund. The selected financial data as of and for the years ended December 31, 2015, 2014, 2013 and 2012, and for the period beginning on May 25, 2011 (the date on which the Fund was organized as a Delaware statutory trust) and ending on December 31, 2011, has been derived from the audited financial statements. The table also presents selected financial data for the quarters within the last two years. The quarterly financial data presented has been derived from unaudited financial data which, in the opinion of management, presents fairly, in all material respects, the financial positions and results of operations of the Fund. Prior to the Fund’s initial public offering on October 25, 2012, the Fund had no operations other than those related to organizational matters. The selected financial data presented herein should be read in conjunction with the Fund’s financial statements, including the notes thereto, which are included in this Annual Report.
| Year Ended December 31, | ||||||||||||||||||||
| 2015 | 2014 | 2013 | 2012 | 2011 | ||||||||||||||||
| Total assets |
$ | 273,672,836 | $ | 297,564,881 | $ | 372,991,675 | $ | 436,988,415 | $ | 588,055 | ||||||||||
| Total liabilities |
$ | 4,712,169 | $ | 4,388,146 | $ | 8,610,928 | $ | 9,876,852 | $ | 568,000 | ||||||||||
| Net assets |
$ | 268,960,667 | $ | 293,176,735 | $ | 364,380,747 | $ | 427,111,563 | $ | 20,055 | ||||||||||
| Net increase (decrease) in cash |
$ | — | $ | — | $ | — | $ | (20,055 | ) | $ | 20,055 | |||||||||
| Shares outstanding |
16,345,840 | 16,345,840 | 17,755,840 | 18,800,840 | 840 | |||||||||||||||
| Net asset value per share outstanding |
$ | 16.45 | $ | 17.94 | $ | 20.52 | $ | 22.72 | $ | 23.88 | ||||||||||
| Total distributions per share |
$ | 1.3200 | $ | 1.7000 | $ | 1.8600 | $ | 0.1550 | $ | — | ||||||||||
| Total investment income |
$ | 444,078 | $ | 278,885 | $ | 449,531 | $ | 87,459 | $ | — | (2) | |||||||||
| Net investment income (loss) |
$ | (5,167,444 | ) | $ | (5,465,243 | ) | $ | (6,388,304 | ) | $ | (1,275,616 | ) | $ | — | (2) | |||||
| Net realized gain (loss) and change in net unrealized appreciation (depreciation) |
$ | 2,529,235 | $ | (15,153,949 | ) | $ | (4,217,060 | ) | $ | (16,628,746 | ) | $ | — | (2) | ||||||
| Net income (loss) |
$ | (2,638,209 | ) | $ | (20,619,192 | ) | $ | (10,605,364 | ) | $ | (17,904,362 | ) | $ | — | (2) | |||||
| Net income (loss) per weighted-average share |
$ | (0.16 | ) | $ | (1.18 | ) | $ | (0.57 | ) | $ | (0.95 | )(1) | $ | — | (2) | |||||
| (1) | For the period October 25, 2012 (the Fund’s commencement of operations) through December 31, 2012. |
| (2) | For the period August 31, 2011 (initial issuance of shares to the Manager) through December 31, 2011. The Fund had not commenced operations during this period. |
Selected Quarterly Financial Data (Unaudited)
| For the Three Months Ended 2015 | ||||||||||||||||
| December 31 | September 30 | June 30 | March 31 | |||||||||||||
| Total investment income |
$ | 152,798 | $ | 119,171 | $ | 123,629 | $ | 48,480 | ||||||||
| Net investment income (loss) |
$ | (1,015,414 | ) | $ | (1,620,212 | ) | $ | (1,336,826 | ) | $ | (1,194,992 | ) | ||||
| Net realized gain (loss) and change in net unrealized appreciation (depreciation) |
$ | 1,906,985 | $ | 1,087,088 | $ | (4,290,518 | ) | $ | 3,825,680 | |||||||
| Net income (loss) |
$ | 891,571 | $ | (533,124 | ) | $ | (5,627,344 | ) | $ | 2,630,688 | ||||||
| Increase (decrease) in net assets |
$ | (3,848,717 | ) | $ | (5,436,885 | ) | $ | (11,462,806 | ) | $ | (3,467,660 | ) | ||||
| Net income (loss) per weighted-average share |
$ | 0.05 | $ | (0.03 | ) | $ | (0.34 | ) | $ | 0.16 | ||||||
28
Table of Contents
| For the Three Months Ended 2014 | ||||||||||||||||
| December 31 | September 30 | June 30 | March 31 | |||||||||||||
| Total investment income |
$ | 63,223 | $ | 64,461 | $ | 73,502 | $ | 77,699 | ||||||||
| Net investment income (loss) |
$ | (1,214,517 | ) | $ | (1,336,033 | ) | $ | (1,430,882 | ) | $ | (1,483,811 | ) | ||||
| Net realized gain (loss) and change in net unrealized appreciation (depreciation) |
$ | (7,736,248 | ) | $ | 1,070,682 | $ | 1,020,901 | $ | (9,509,284 | ) | ||||||
| Net income (loss) |
$ | (8,950,765 | ) | $ | (265,351 | ) | $ | (409,981 | ) | $ | (10,993,095 | ) | ||||
| Increase (decrease) in net assets |
$ | (27,027,089 | ) | $ | (16,085,279 | ) | $ | (8,842,084 | ) | $ | (19,249,560 | ) | ||||
| Net income (loss) per weighted-average share |
$ | (0.54 | ) | $ | (0.02 | ) | $ | (0.02 | ) | $ | (0.62 | ) | ||||
29
Table of Contents
| Item 7. | Management’s Discussion and Analysis of Financial Condition and Results of Operations |
This information should be read in conjunction with the financial statements and notes to financial statements included in this Annual Report. The discussion and analysis includes forward-looking statements that generally relate to future events or future performance. In some cases, you can identify forward-looking statements by terminology such as “may,” “will,” “should,” “expect,” “plan,” “anticipate,” “believe,” “estimate,” “predict,” “potential” or the negative of these terms or other comparable terminology. These forward-looking statements are based on information currently available to the Manager, the Commodity Sub-adviser and the Collateral Sub-adviser, and are subject to a number of risks, uncertainties and other factors, both known (such as those described in “Item 1A. Risk Factors” and elsewhere in this Annual Report) and unknown, that could cause the actual results, performance, prospects or opportunities of the Fund to differ materially from those expressed in, or implied by, these forward-looking statements.
You should not place undue reliance on any forward-looking statements. Except as expressly required by the federal securities laws or otherwise, the Fund and the Manager undertake no obligation to publicly update or revise any forward-looking statements or the risks, uncertainties or other factors described in this Annual Report, as a result of new information, future events or changed circumstances or for any other reason after the date of this Annual Report.
Introduction
The Fund is a commodity pool which was organized as a Delaware statutory trust on May 25, 2011 and commenced operations on October 25, 2012, with its public offering. The Fund’s shares trade on the NYSE MKT under the ticker symbol “CTF”. The Fund’s investment objective is to generate attractive total returns. The Fund is actively managed and seeks to outperform its benchmark, the Morningstar® Long/Short Commodity IndexSM (the “Index”). The Index tracks the historical total return performance of a diverse portfolio of commodity futures, which may be invested long, short or flat. The Index uses a momentum rule to determine if each commodity futures position is long, short or flat. In pursuing its investment objective, the Fund invests directly in a diverse portfolio of exchange-traded commodity futures contracts that represent the main commodity sectors and are among the most actively traded futures contracts in the global commodity markets, and also invests in commodity options contracts (the futures and options are sometimes referred to as the “commodity portfolio”). Individual commodity futures positions may be either long or short (or flat in the case of energy futures) depending upon market conditions. The Fund’s options strategy seeks to produce option premiums for the purpose of enhancing the Fund’s risk-adjusted total return over time. The Fund is unleveraged, and the Fund’s commodity contract positions are fully collateralized with cash equivalents, U.S. government securities and other short-term, high-grade debt securities.
Results of Operations
The Year Ended December 31, 2015—Fund Share Price
The Fund’s shares traded on the NYSE MKT at a price of $15.54 on the close of business on December 31, 2015. This represents a decrease of 6.39% in share price (not including an assumed reinvestment of distributions) from the $16.60 price at which the shares of the Fund traded on the close of business on December 31, 2014. The high and low intra-day share prices for the year were $17.06 (January 26, 2015) and $15.27 (December 14, 2015), respectively. During the year, the Fund paid distributions totaling $1.320 per share to shareholders. The Fund’s total return on market value for the year, which assumes reinvestment of such distributions, was 1.50%. At December 31, 2015, shares of the Fund traded at a 5.53% discount to the Fund’s net asset value of $16.45 per share.
The Year Ended December 31, 2014—Fund Share Price
The Fund’s shares traded on the NYSE MKT at a price of $16.60 on the close of business on December 31, 2014. This represents a decrease of 3.60% in share price (not including an assumed reinvestment of distributions) from
30
Table of Contents
the $17.22 at which the shares of the Fund traded on the close of business on December 31, 2013. The high and low intra-day prices for the year were $17.60 (January 22, 2014) and $14.19 (October 16, 2014), respectively. During the year, the Fund declared distributions totaling $1.700 per share to shareholders. The Fund’s total return on market value for the year, which assumes reinvestment of such distributions, was 7.27%. At December 31, 2014, shares of the Fund traded at a 7.47% discount to the Fund’s net asset value of $17.94 per share. During the year the Fund repurchased 1,410,000 shares.
The Year Ended December 31, 2013—Fund Share Price
The Fund’s shares traded on the NYSE MKT at a price of $17.22 on the close of business on December 31, 2013. This represents a decrease of 18.85% in share price (not including an assumed reinvestment of distributions) from the $21.22 at which the shares of the Fund traded on the close of business on December 31, 2012. The high and low intra-day share prices for the year were $23.93 (January 28, 2013) and $15.94 (November 11, 2013), respectively. During the year, the Fund paid distributions totaling $1.8600 per share to shareholders. The Fund’s cumulative total return on market value for the year, which assumes reinvestment of such distributions, was -10.41%. At December 31, 2013, the shares of the Fund traded at a 16.08% discount to the Fund’s net asset value of $20.52. During the year the Fund repurchased 1,045,000 shares.
The Year Ended December 31, 2015—Net Assets of the Fund
The Fund’s net assets decreased from $293.2 million at December 31, 2014, to $269.0 million at December 31, 2015, a decrease of $24.2 million. The decrease in the Fund’s net assets was due to a net loss of $2.6 million, in addition to $21.6 million of distributions to shareholders.
The Fund generated a net loss of $2.6 million for the year ended December 31, 2015, resulting from interest income of $0.4 million and net realized gains of approximately $2.9 million, offset by expenses of $5.6 million and change in net unrealized depreciation of $0.3 million.
During the year ended December 31, 2015, the Fund’s collateral investments generated interest income of $444,078, which represents 0.16% of average net assets for the year ended December 31, 2015.
The net asset value per share on December 31, 2015, was $16.45. This represents a decrease of 8.31% in net asset value (not including an assumed reinvestment of distributions) from the $17.94 net asset value as of December 31, 2014. During the year, the Fund paid distributions totaling $1.320 per share to shareholders. When an assumed reinvestment of these distributions is taken into account, the total return for the Fund on net asset value was -0.99% for the year ended December 31, 2015.
The Year Ended December 31, 2014—Net Assets of the Fund
The Fund’s net assets decreased from $364.4 million at December 31, 2013, to $293.2 million at December 31, 2014, a decrease of $71.2 million. The decrease in the Fund’s net assets was due to $29.6 million of distributions to shareholders, $21.0 million of share repurchases, and a net loss of $20.6 million.
The Fund generated a net loss of $20.6 million for the year ended December 31, 2014, resulting from interest income of $0.3 million, offset by net realized losses of $13.4 million, total expenses of $5.7 million, and net unrealized depreciation of $1.8 million.
During the year ended December 31, 2014, the Fund’s collateral investments generated interest income of $278,885, which represents 0.08% of average net assets for the year ended December 31, 2014.
The net asset value per share on December 31, 2014, was $17.94. This represents a decrease of 12.57% in net asset value (not including an assumed reinvestment of distributions) from the $20.52 net asset value as of
31
Table of Contents
December 31, 2013. The Fund declared distributions totaling $1.700 per share to shareholders during the year. When an assumed reinvestment of these distributions is taken into account, the total return for the Fund on net asset value was -4.36% for the year ended December 31, 2014.
The Year Ended December 31, 2013—Net Assets of the Fund
The Fund’s net assets decreased from $427.1 million at December 31, 2012, to $364.4 million at December 31, 2013, a decrease of $62.7 million. The decrease in the Fund’s net assets was due to $10.7 million in net realized losses and $6.5 million in net unrealized appreciation on the Fund’s portfolio during the year, a net investment loss of $6.4 million, $34.6 million of distributions to shareholders, and $17.5 million of share repurchases.
During the year ended December 31, 2013, the Fund’s collateral investments generated interest income of $449,531, which represents 0.11% of average net assets for the year ended December 31, 2013.
The net asset value per share on December 31, 2013, was $20.52. This represents a decrease of 9.68% in net asset value (not including an assumed reinvestment of distributions) from the $22.72 net asset value as of December 31, 2012. The Fund declared distributions totaling $1.8600 per share to shareholders during the year. When an assumed reinvestment of these distributions is taken into account, the cumulative total return for the Fund on net asset value was -1.37% for the year ended December 31, 2013.
The Fund generated a net loss of $10.6 million for the year ended December 31, 2013, resulting from interest income of $0.4 million, net expenses of $6.8 million, net realized losses of $10.7 million, and net unrealized appreciation of $6.5 million.
The Year Ended December 31, 2015—Overall Commodity Market Commentary
The environment for commodities continued to be challenging during the year ended December 31, 2015. Macroeconomic headwinds and unfavorable supply-demand dynamics contributed to falling prices and bearish sentiment for all commodities. The broad commodity market, as measured by the long-only Bloomberg Commodity Index (“BCOM”), fell 24.7% for the year, with declines in every commodity group.
In contrast, the Fund’s benchmark index, the Morningstar® Long/Short Commodity IndexSM (the “Index”), advanced 2.4% for the year. Within the Index, the livestock and metals groups experienced double-digit gains, the energy group had a flat return, and the agriculture group fell slightly.
The energy sector led the BCOM’s decline, with a loss of 38.9% for the year. The combination of falling global demand and rising inventories, along with a stronger U.S. dollar, weighed heavily on energy commodities. Sluggish economic growth globally and the deceleration in China’s economy continued to diminish expectations for crude oil demand. Despite falling prices, the Organization for the Petroleum Exporting Countries (OPEC) maintained its high output levels to try to keep its market share intact, while North American production demonstrated better-than-expected resilience. Additionally, the lifting of Western sanctions on Iranian oil exports was expected to further contribute to the global supply glut in 2016. Natural gas prices were also hurt by milder summer weather and a warmer start to winter, while storage was ample and production continued at near-record levels. Within the long-only BCOM, crude oil ended the year down 44.9%, heating oil lost 42.9% and natural gas fell 40.0%. Unleaded gasoline (RBOB) posted the smallest decline in the energy group, down 12.7% in the BCOM for the year, as refinery outages hurt production and lower prices helped spur consumer demand. The Index held flat positions across the energy complex for the entire year.
The agriculture sector also saw widespread negative performance in the broad market. Grain prices fell as generally favorable weather and increased plantings stoked fears of oversupply. Currency movements also pressured grain futures lower, particularly as U.S. dollar appreciation made foreign wheat crops look cheaper and weakening currencies in Brazil and Argentina were expected to boost their grain exports. Soybean oil
32
Table of Contents
experienced a smaller decline among the grain commodities, as a fourth-quarter rally driven by expectations for improving demand helped reverse some of its earlier losses. Arabica coffee and sugar prices were dampened by Brazil’s favorable growing conditions and its weak local currency, which were expected to contribute to robust supply and increased exports. While Arabica coffee prices slid 31.6% for the year in the BCOM, a fourth-quarter rebound in sugar prices, propelled by tighter supply expectations, helped trim its loss to 4.8% for the year. Cotton had a small gain of 2.9% for the year and was the only commodity in the BCOM with a positive return for the year. Cotton prices rallied in both the spring and early winter when key cotton-growing regions of the U.S. suffered heavy rains and flooding, raising concerns about diminished fiber quality. The Index stayed short or flat in most agriculture commodities for most of the year, resulting in a small loss of 1.5% for the year.
The metals group, composed of gold, silver and copper, trended lower in the broad market. The anticipation of the U.S. Federal Reserve’s rate hike kept gold and silver prices choppy all year. The U.S. Federal Reserve’s announcement to raise its main policy rate by 0.25% in December and waning demand for physical gold pushed gold prices near a six-year low. Copper continued to slide due to the overall lackluster global macroeconomic picture, and particularly China’s waning demand for metals. U.S. dollar strength, reports of rising inventories, and periods of aggressive selling and long liquidations, also weighed on copper price. The Index’s metals sector appreciated 11.9% during the year, due to its generally short positions across all three metals commodities.
The livestock group lost 18.9% for the year in the BCOM. Both macroeconomic and idiosyncratic factors weighed on lean hogs and live cattle prices throughout the year. The stronger U.S. dollar reduced beef and pork export demand, as well as encouraged beef imports from Mexico, Canada, and New Zealand, causing rising supply levels of both beef and pork. The avian flu outbreak during the spring created price competition with chicken, which hurt demand. In addition, pork supply was further bolstered by a sooner-than-expected dissipation of a fatal pig virus that had devastated herds over the past two years and by larger hog weights, as lower grain prices encouraged farmers to bulk up their livestock. Lean hogs prices were further pressured by the World Health Organization’s decision to classify processed meats as carcinogenic to humans, which was announced in October. Within the Index, livestock was the best-performing group for the year, up 17.9%, aided by its generally short bias during the year.
At year end, the Index experienced its annual reconstitution. Morningstar determines each constituent’s weighting by evaluating the magnitude and direction of its momentum signal, based on the 12-month average of the dollar value of open interest of each commodity. The top magnitude is capped at 10%, and any excess is redistributed to the remaining commodities. On the third Friday of December, Morningstar reset the constituent membership of the Index for the year, resulting in target weight increases to gas oil and corn, and decreases to natural gas, heating oil and lean hogs. No commodities were added to or removed from the Index.
The Year Ended December 31, 2014—Overall Commodity Market Commentary
The broad commodity market rallied early in the year, gaining 7.0% in the first quarter as measured by the BCOM, but retreated over the remainder of the year. Plentiful supply of energy and agriculture commodities led to steep price declines across these commodity groups, which dragged down the broad market’s return for the year.
While the long-only BCOM declined 17.0% for the year, the Index (the Morningstar® Long/Short Commodity IndexSM and the Fund’s benchmark), was down 5.4%. Within the Index, the livestock group posted the strongest advance, with the agriculture group up modestly. The energy and metals groups both lost value, dampening the Index’s return for the year. The commodity group discussion below presents the commodities as grouped by Gresham.
The largest group by weight, energy commodities represented 50.9% of the Index at the end of the year. The group was also the Index’s weakest performer, down 8.8% for the year, led by natural gas. Demand was high early in the year during the polar vortex in the U.S., which bolstered natural gas prices, but volatility persisted
33
Table of Contents
over the remainder of the year. Oversupply conditions resulted from demand falling below expectations, as weather during the year was milder than forecasted. Crude oil faced a difficult environment, particularly in the second half of the year when prices began to fall, as global demand slowed amid booming supply. In November, a price cut by Saudi Arabia was followed by an unexpected decision by OPEC to leave production levels unchanged, which hastened the decline in crude prices.
Agricultural commodities made up 27.9% of the Index at the end of the year and turned in a flat return, up 0.2% for the year. In the broad market, grains, cotton and sugar were generally down for the year as concerns about supply gluts weighed on futures prices. However, dry, hot weather in Brazil triggered fears of supply shortages of Arabica coffee, which saw its price rally strongly in the broad market for the year.
The Index includes three metals: gold, silver and copper, which totaled 15.1% of the Index at the end of the year. The metals group was down 7.5% in the Index for the year. In the broad market, gold and silver prices fell primarily in the second half of the year, as the U.S. dollar strengthened, which reduced demand for precious metals as a hedge against weakness in the U.S. dollar. Fears about slackening global demand, especially from China, continued to put downward pressure on copper prices.
Livestock is the smallest group, comprising 6.2% of the Index at the end of the year. The group was the top performer in the Index for the year, gaining 19.2%. Live cattle prices appreciated strongly on concerns throughout the year about weaker supply, while lean hogs prices were modestly lower by year’s end. After rallying early in the year on fears of supply shortfalls caused by a fatal virus outbreak, lean hogs prices retreated later in the year as cheaper feed costs encouraged farmers to bulk up their hogs.
At year end, the Index experienced its annual reconstitution. Morningstar determines each constituent’s weighting by evaluating the magnitude and direction of its momentum signal, based on the 12-month average of the dollar value of open interest of each commodity. The top magnitude is capped at 10%, and any excess is redistributed to the remaining commodities. On the third Friday of December, Morningstar reset the constituent membership of the Index for the year, resulting in target weight increases to RBOB gasoline, coffee, soybean meal, soybeans, lean hogs, and live cattle, and decreases to Brent crude, heating oil, gas oil, natural gas, corn, gold, and silver. The Index added a small weighting in cocoa, and no commodities were removed.
The Year Ended December 31, 2013—Overall Commodity Market Commentary
The broad commodity market suffered its third consecutive year of negative performance in 2013. Losses in the first, second, and fourth quarters overwhelmed a modest gain in the third quarter, as measured by the BCOM. In contrast, the Index (the Morningstar® Long/Short Commodity IndexSM, which is the Fund’s benchmark) rose 5.1% for the year. The Index’s precious metals position contributed the most to its overall gain for the year, with agriculture and livestock positions adding to that. The energy group, however, was disadvantageous to the Index’s performance.
At year end, the Index experienced its annual reconstitution. Morningstar determines each constituent’s weighting by evaluating the magnitude and direction of its momentum signal, based on the 12-month average of the dollar value of open interest of each commodity. The top exposure is capped at 10%, and any excess is redistributed to the remaining commodities. On the third Friday of December, Morningstar resets the constituent membership of the Index for the year, which resulted in target weight increases to gas oil, heating oil, natural gas, and sugar, and decreases to corn, wheat, coffee, gold, and silver. No commodities were added or deleted for the Index.
Energy commodities represented 53.0% of the Index at the end of the year, and were its most significant commodity group by weight. In the broad market, the group’s positive performance was driven by strength in crude oil and natural gas positions. However, the Index’s energy position fell 2.3% and was the only group in the Index with negative performance for the period. In crude oil, global supply and demand expectations fluctuated in 2013 amid flaring geopolitical tensions in the Middle East, which affects Brent prices, and the supply
34
Table of Contents
bottleneck at the Cushing, Oklahoma hub for West Texas Intermediate (WTI). As a result, the WTI-Brent spread experienced high volatility all year, with the intra-year spread ranging from $23 to nearly zero. This choppy environment was challenging for the Index, which switched between long and flat positions during the monthly resets, leading to a loss for the Index’s energy position.
Agricultural commodities made up 26.1% of the Index at the end of the year. In the broad market, corn, wheat, and soybean oil dragged down the overall group. Prices for these commodities were hampered by robust supply amid favorable growing conditions, with corn in particular seeing record harvests during 2013. Soybean oil also suffered from tepid demand given the availability of cheaper substitutes such as palm oil. The Index was mostly short in these contracts, which helped its overall position appreciate 5.9% for the year. A short position in coffee also bolstered the Index’s return, where strong supply has weighed on prices since May.
The Index includes three metals (gold, silver and copper), which made up a combined 15.9% of the Index at the end of the year. With economic data improving across the developed world, the demand for assets perceived as “safe havens” declined. Furthermore, speculation that the U.S. Federal Reserve would taper its asset buying helped ease inflation expectations, tempering the demand for gold as an inflation hedge. As a result, gold and silver posted a double-digit loss in the broad market during the year. Copper also declined in the broad market, despite a brief rally in the third quarter, as slowing growth in China, among other factors, is expected to weaken demand for copper and other raw materials. The Index’s metals group surged 34.3% for the year, aided by short positions in gold and silver.
Livestock is the smallest group, comprising 5.0% of the Index at the end of the year. Live cattle and lean hogs positions declined in the broad market, resulting in a moderate loss for the overall livestock group for the year. Early in the year, high grain costs in the wake of a 2012 drought prompted ranchers to bring livestock to market early, bolstering supply and driving lean hogs and live cattle prices lower. In the Index, positive performance in the live cattle position offset weakness in the lean hogs position, for a gain of 2.7% for the overall livestock group.
The Year Ended December 31, 2015—Fund Commodity Portfolio Commentary
The Fund’s commodity portfolio returned 0.9% for the 12-month period (before considering the expenses of the Fund or the performance of the collateral portfolio). The Fund outperformed the BCOM, which returned -24.7%, but trailed the Index, which returned 2.4%. The Fund’s total return on net asset value for the year, which includes the effect of the Fund’s expenses and the performance of the collateral portfolio, and assumes the reinvestment of the Fund’s distribution, was a loss of 0.99%.
The Fund may write—that is, sell—put and call options on up to 25% of the value of each of the Fund’s commodity futures contracts. During the period, Gresham generally wrote options on approximately 15% of each commodity futures contract seeking to limit return volatility and to provide cash flow to support the Fund’s distributions. The Fund receives cash premiums in return for writing options. If the Fund holds a long position in a specific commodity, it will sell covered calls on those contracts; if a short position is held, it will sell covered puts on contracts in that commodity. Typically, the options sold are at or in the money, and the Fund receives cash for the related premiums. Though the majority of the Fund’s option positions expire in the money, which can limit the Fund’s full participation in gains related to that commodity position, they are an important tool for reducing the Fund’s return volatility. For the period, the Fund had lower volatility than the Index, as measured by standard deviation of NAV return.
The Fund has the flexibility to sell both puts and calls on a single commodity, should such commodity “flip” positions (i.e., go from a long position to a short position) during the life of a particular option. In this case, the Fund can collect additional premiums. During the period, the Fund did so in agriculture commodities, gold, and live cattle, which contributed positively to performance. It is important to remember that a key driver of the Index’s long (and short) positions is the upward (or downward) momentum in the prices of its constituents relative to the moving averages of commodity prices. The Fund’s commodity portfolio long and short/flat
35
Table of Contents
positions share the same drivers as the Index, but are established more actively and with greater frequency (intra-month versus the Index’s once per month methodology). This dependence on momentum puts the Index and the Fund’s commodity portfolio at risk to price patterns that seem to demonstrate upward momentum (causing a shift from short/flat to long) but then shift to an equally compelling semblance of downward momentum (causing a shift from long to short/flat). This phenomenon is customarily described as a “whipsaw,” and the Fund’s greater potential for trading activity exposes it to greater whipsaw risk than the more passive Index in certain periods.
On an absolute performance basis, the Fund underperformed the Index in the livestock and metals groups, and slightly trailed in the agriculture group, while the energy group was neutral.
The Fund’s livestock position fell 2.3% for the year, while the Index’s rose 17.9%. Weakness in the Fund’s live cattle position drove the group’s underperformance. A choppy trading environment for live cattle futures caused the Fund to experience the whipsaw effect due to excess flipping activity, whereas the Index experienced less frequent position changes. However, during part of the year, the Fund collected additional options premium by selling both puts and calls on live cattle during these position changes, which helped offset some of the negative impact of the whipsaw effect. The Fund’s lean hogs position was up for the year, but the gain fell short of the Index’s lean hogs return.
Within the metals group, the Fund was up 8.5% and the Index was up 11.9% for the year. Early in the year, volatility in gold prices led to unfavorable flipping activity in the Fund’s position, as the Fund experienced the whipsaw effect and lagged the Index’s gold position for the year. However, the Fund was short gold for the remainder of the year, which helped mitigate some of the earlier losses, as did the additional premium the Fund collected from selling both puts and calls during the first quarter. The Fund’s copper position also lagged that of the Index for the year, due to losses caused by the whipsaw effect during the second quarter of 2015.
In the agriculture group, the Fund slightly underperformed the Index, down 2.0%% and 1.5%, respectively, for the year. The Fund’s cotton and soybean oil positions were the largest detractors within the sector, as the whipsaw effect weighed on performance, especially for cotton. The Fund’s coffee, soybean meal and sugar positions also lagged the Index’s positions. However, these losses were partially offset by outperformance in the Fund’s corn, soybean, wheat and cocoa positions.
The Fund had no trading activity in the energy group during the 12-month period, as both the Fund and the Index maintained flat positions across all energy commodities since the third quarter of 2014.
The Year Ended December 31, 2014—Fund Commodity Portfolio Commentary
The Fund’s commodity portfolio lost 4.5% for the 12-month period (before considering the expenses of the Fund or the performance of the collateral portfolio). The Fund outperformed both the BCOM, which declined 17%, and the Index, which lost 5.4%. The Fund’s total return on net asset value for the year, which includes the effect of the Fund’s expenses and the performance of the collateral portfolio and assumes the reinvestment of the Fund’s distribution, was a loss of 4.36%.
The Fund may write—that is, sell—put and call options on up to 25% of the value of each of the Fund’s commodity futures contracts. During the period, the Fund generally wrote options on approximately 15% of each commodity futures contract seeking to limit return volatility and to provide cash flow to support its distributions. The Fund receives cash premiums in return for writing options. If the Fund holds a long position in a specific commodity, it will sell covered calls on those contracts; if a short position is held, it will sell covered puts on contracts in that commodity. Typically, the options sold are at or in the money, and the Fund receives cash for the related premiums. Though the majority of the Fund’s option positions expire in the money, which can limit the Fund’s full participation in gains related to that commodity position, they are an important tool for reducing the Fund’s return volatility. For the year, the Fund had lower volatility than the Index, as measured by standard deviation of NAV return.
36
Table of Contents
The Fund has the flexibility to sell both puts and calls on a single commodity, should such commodity “flip” positions (i.e., go from a long position to a short position) during the life of a particular option. In this case, the Fund can collect additional premiums. During the year, the Fund was able to sell both puts and calls on sugar, corn, wheat, cotton, soybeans, soybean meal, gold, silver, and lean hogs, which contributed positively to Fund performance.
It is important to remember that a key driver of the Index’s long and short positions is the upward or downward momentum in the prices of its constituents relative to the moving averages of commodity prices. The Fund’s commodity portfolio long and short/flat positions share the same drivers as the Index, but are established more actively and with greater frequency (intra-month versus the Index’s once per month methodology). This dependence on momentum puts the Index and the Fund’s commodity portfolio at risk to price patterns that seem to demonstrate upward momentum, causing a shift from short/flat to long, but then shift to an equally compelling semblance of downward momentum, causing a shift from long to short/flat. This phenomenon is customarily described as a “whipsaw,” and the Fund’s greater potential for trading activity exposes it to greater whipsaw risk than the more passive Index in certain periods.
In terms of commodity groups, the Fund outperformed the Index in metals and energy, but trailed the Index in livestock and agriculture for the year overall. The commodity group discussion below presents the commodities as grouped by Gresham.
In the metals group, the Fund declined 3.1% and the Index lost 7.5%. The Fund’s gold and silver positions added value to relative returns, while copper somewhat detracted from performance. Throughout the year, performance was bolstered by the Fund’s more advantageous timing in managing gold and silver positions, as well as its options strategy in these two metals.
The Fund’s energy position fell 6.9% for the year, while the Index’s was down 8.8%. The chief contributors to relative performance were crude oil and natural gas, where the Fund benefited from more favorable timing in managing its positions.
Absolute returns in the livestock group were strong, up 12.9% in the Fund and 19.2% in the Index for the year. However, the Fund fell short of the Index primarily due to its lean hogs position. Flipping activity, especially in the choppy trading environments of the second and third quarters, was detrimental to performance. Flipping activity occurs when commodity prices trend sideways and the Fund switches from long to short (or flat in the case of energy) or vice versa. In seeking to outperform and get ahead of the Index, the Fund can experience excess flipping, which can adversely affect relative returns, since the Index is limited to changing positions once per month. The Fund’s live cattle position was a relative detractor as well.
Agriculture commodities as group were down 2.0% in the Fund but up 0.2% in the Index for the year. The Fund’s sugar position was the main drag on performance relative to the Index, as flipping activity hurt returns throughout the year. Soybeans detracted as well. However, the Fund achieved relative gains in its corn and coffee positions, partially offsetting the relative losses elsewhere.
The Year Ended December 31, 2013—Fund Commodity Portfolio Commentary
The Fund’s commodity portfolio returned -1.0% for the 12-month period (before considering the expenses of the Fund or the performance of the collateral portfolio). While the Fund outperformed the BCOM, which returned -9.6% for the year, it underperformed the Index, which returned 5.1%. The Fund’s total return on net asset value for the year, which includes the effect of the Fund’s expenses and the performance of the collateral portfolio and assumes the reinvestment of the Fund’s distribution, was -1.37%.
The Fund may write – that is, sell – put and call options on up to 25% of the value of each of the Fund’s commodity futures contracts. During the period, the Fund wrote options on approximately 15% of each
37
Table of Contents
commodity futures contract seeking to limit return volatility and to provide cash flow to support the Fund’s distributions. The Fund receives cash premiums in return for writing options. If the Fund holds a long position in a specific commodity, it will sell covered calls on those contracts; if a short position is held, it will sell covered puts on contracts in that commodity. Typically, the options sold are at or in the money, and the Fund receives cash for the related premiums. Though the majority of the Fund’s option positions expire in the money, which can limit the Fund’s full participation in gains related to that commodity position, they are an important tool for reducing the Fund’s return volatility. For the year, the Fund had slightly lower volatility than the Index, as measured by standard deviation of return.
The Fund has the flexibility to sell both puts and calls on a single commodity, should such commodity “flip” positions (i.e. go from a long position to a short position) during the life of a particular option. In this case, the Fund can collect additional premiums. During the period, the Fund was able to sell both puts and calls on several commodities, including corn, soybean meal, soybeans, cotton, wheat, gold, lean hogs, and live cattle, which contributed positively to Fund performance.
A key driver of the Index’s long (and short) positions is the upward (or downward) momentum in the prices of its constituents relative to the moving averages of commodity prices. The Fund’s commodity portfolio long and short/flat positions share the same drivers as the Index, but are established more actively and with greater frequency (intra-month versus the Index’s once per month methodology). This dependence on momentum puts the Index and the Fund’s commodity portfolio at risk to price patterns that seem to demonstrate upward momentum (causing a shift from short/flat to long) but then shift to an equally compelling semblance of downward momentum (causing a shift from long to short/flat). This phenomenon is customarily described as a “whipsaw,” and the Fund’s greater potential for trading activity exposes it to greater whipsaw risk than the more passive Index in certain periods. This was most evident early in the year as many commodity prices trended sideways and the Fund’s approach of switching between long and short (or flat in the case of energy) positions more often than the Index, which switches only once per month, had a negative impact on returns. Gresham took steps to reduce the frequency of the flipping in response to the market conditions, which generally benefitted the strategy in the middle and second half of the year. In terms of commodity groups, the Fund experienced absolute losses in energy, and absolute gains in metals, agriculture, and livestock. Relative to the Index, the Fund underperformed in energy and metals, and slightly outperformed in agriculture and livestock.
The metals group, which returned 12.3% for the Fund and 34.3% for the Index during the year, was the largest detractor from weighted relative performance. The Fund underperformed the Index in all three metals, as the whipsaw effect dampened the performance of the Fund’s gold and silver positions early in the year.
Energy was also detrimental to the Fund’s relative performance on a weighted basis. The Fund fell 8.8% versus a 2.3% decline in the Index for the year. Price volatility in many of the energy commodities caused the Fund to switch back and forth between flat and long positions – particularly in crude oil, gas heating oil, gasoline (RBOB), and natural gas – which was unfavorable to relative performance.
However, the Fund experienced a modest relative gain on a weighted basis in livestock. Livestock positions rose 4.6% in the Fund and 2.7% in the Index for the year. The Fund’s advance was largely due to appreciation in its lean hogs position, whereas the same position in the Index posted a loss. But, the group’s relatively small weight within the Fund and Index diminished the positive effect on relative outperformance.
The Fund’s agriculture commodities position increased 4.9%, while the Index’s advanced 5.9% for the period. However, on a weighted basis, the Fund slightly outpaced the Index, with gains in sugar and corn helping to offset a loss in wheat.
38
Table of Contents
Fund Total Returns
The following table presents selected total returns for the Fund and Index as of December 31, 2015. Market value and net asset value total returns are based on the change in market value and net asset value, respectively, for a share during the period presented. The total returns presented assume the reinvestment of distributions at market value on the distribution payment date for returns based on market value, and at net asset value on the distribution payment date for returns based on net asset value.
| Total Returns as of December 31, 2015 |
||||||||||||
| Cumulative | Average Annual | |||||||||||
| 3 Months | 1 Year | Since Inception |
||||||||||
| Market Value |
-1.07 | % | 1.50 | % | -5.54 | % | ||||||
| Net Asset Value |
0.31 | % | -0.99 | % | -3.43 | % | ||||||
| Index |
1.44 | % | 2.42 | % | 0.63 | % | ||||||
“Since inception” returns present performance for the period since the Fund’s commencement of operations on October 25, 2012.
Returns represent past performance, which is no guarantee of future performance.
The graph below presents the Fund’s inception to date cumulative total return as of each month end based on the market value and net asset value, as well as the Fund inception to date cumulative total return of the Index as of each month end, for the period October 25, 2012 (commencement of Fund operations) through December 31, 2015. The total returns on net asset value and market value assume the reinvestment of distributions on the distribution payment date as described above.
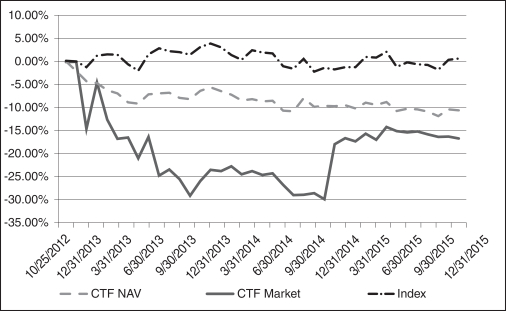
On December 19, 2014, the Fund issued a press release announcing that the Manager had approved a plan to convert the Fund into an open-end ETF. The stated purpose of the proposed Conversion is to seek a closer
39
Table of Contents
alignment between the Fund’s market price and its net asset value. Following the announcement, the Fund’s market price increased, substantially reducing the Fund’s discount. The Manager believes that investors may have been buying shares in anticipation of the Conversion. In the event that the Conversion does not occur, the Fund’s market price may fall, irrespective of the Fund’s performance.
Commodity Portfolio Composition and Weightings
The table below presents the composition and weightings of the Fund’s commodity portfolio and the Index as of December 31, 2015. The table below serves as a guide to how the composition and weightings of the Fund’s commodity portfolio compared to that of the Index as of December 31, 2015.
| Fund | Index | |||||||||||||
| Commodity Group |
Commodity | Exposure(1) | Composition | Exposure(1) | Composition | |||||||||
| Energy |
Crude Oil | Flat | 19.78 | % | Flat | 19.77 | % | |||||||
| Heating Oil | Flat | 16.09 | % | Flat | 16.10 | % | ||||||||
| Natural Gas | Flat | 6.87 | % | Flat | 6.87 | % | ||||||||
| Unleaded Gas | Flat | 6.34 | % | Flat | 6.35 | % | ||||||||
|
|
|
|
|
|||||||||||
| 49.08 | % | 49.09 | % | |||||||||||
|
|
|
|
|
|||||||||||
| Agriculturals |
Soybean | Short | 8.07 | % | Short | 8.03 | % | |||||||
| Corn | Short | 6.66 | % | Short | 6.66 | % | ||||||||
| Sugar | Long | 3.24 | % | Long | 3.26 | % | ||||||||
| Soybean Meal | Short | 3.05 | % | Short | 3.04 | % | ||||||||
| Wheat | Short | 2.71 | % | Short | 2.71 | % | ||||||||
| Coffee | Short | 2.19 | % | Short | 2.21 | % | ||||||||
| Soybean Oil | Short | 1.81 | % | Long | 1.80 | % | ||||||||
| Cocoa | Long | 1.54 | % | Long | 1.54 | % | ||||||||
| Cotton | Long | 1.48 | % | Long | 1.48 | % | ||||||||
|
|
|
|
|
|||||||||||
| 30.75 | % | 30.73 | % | |||||||||||
|
|
|
|
|
|||||||||||
| Metals |
Gold | Short | 9.32 | % | Short | 9.36 | % | |||||||
| Silver | Short | 3.32 | % | Short | 3.31 | % | ||||||||
| Copper | Short | 2.53 | % | Short | 2.52 | % | ||||||||
|
|
|
|
|
|||||||||||
| 15.17 | % | 15.19 | % | |||||||||||
|
|
|
|
|
|||||||||||
| Livestock |
Live Cattle | Short | 3.54 | % | Short | 3.53 | % | |||||||
| Lean Hogs | Short | 1.46 | % | Short | 1.46 | % | ||||||||
|
|
|
|
|
|||||||||||
| 5.00 | % | 4.99 | % | |||||||||||
|
|
|
|
|
|||||||||||
| Total |
100.00 | % | 100.00 | % | ||||||||||
|
|
|
|
|
|||||||||||
| (1) | The Fund and the Index may take long and short positions on commodity futures contracts. The Fund and the Index will not short energy futures contracts due to prices of energy futures contracts generally being more sensitive to geopolitical events than to economic factors. References to a flat position, if any, mean that instead of taking a futures contracts position (long or short) when market signals dictate, the Fund will not have a futures contracts position for that commodity, and will instead hold cash. The Fund may also have flat positions in other commodity groups for short periods of time in the course of implementing its investment strategy. |
40
Table of Contents
Liquidity and Capital Resources
The Fund pursues its investment objective by taking long and/or short positions in commodity futures contracts with a portion of the Fund’s assets, writing put and call options pursuant to the long/short commodity investment program, and by investing the remaining assets of the Fund as collateral in cash equivalents, U.S. government securities and other short-term, high-grade debt securities. The Fund’s investment activity in futures contracts and writing commodity options does not require a significant outlay of capital. The Fund currently expects to post approximately 10% to 25% of its net assets in a margin account with the Fund’s clearing broker to cover its futures contracts; the remaining assets are held by the Fund in a separate collateral pool managed by the Collateral Sub-adviser. The Fund believes the higher allocation to initial margin will provide a significant buffer to accommodate variations in the required margin posting that may result from market volatility, potential gains and losses on the contracts, and changes in margin rules, and will minimize the frequency of cash transfers from the Fund’s other collateral pool to meet variation margin requirements. The Fund does not intend to utilize leverage and its commodity contract positions are fully collateralized. Ordinary expenses and distributions are met by cash on hand, although distributions may at times consist of return of capital and may require that the Fund liquidate investments. The Fund earns interest on its continuing investments in cash equivalents, U.S. government securities and other short-term, high-grade debt securities. The Fund also generates cash from the premiums it receives when writing options on the Fund’s futures contracts.
The Fund’s investments in commodity futures contracts and options on commodity futures contracts may be subject to periods of illiquidity because of market conditions, regulatory considerations and other reasons. For example, commodity exchanges limit fluctuations in certain commodity futures contract prices during a single day by regulations referred to as “daily limits.” During a single day, no trades may be executed at prices beyond the daily limit. Once the price of a futures contract for a particular commodity has increased or decreased by an amount equal to the daily limit, positions in the futures contract can neither be taken nor liquidated unless the traders are willing to effect trades at or within the limit. Commodity futures prices have occasionally moved the daily limit for several consecutive days with little or no trading. Such market conditions could prevent the Fund from promptly liquidating its commodity futures positions.
The Fund’s shares trade on the NYSE MKT, and shares are not redeemed by the Fund in the normal course of business (although the Manager may decide to do so at its discretion), thereby alleviating the need for the Fund to have liquidity available for possible shareholder redemptions. On March 14, 2013, the Fund announced the adoption of an open-market share repurchase program pursuant to which it is authorized to repurchase an aggregate of up to 10% of its outstanding common shares as of the authorization date in open-market transactions. On March 6, 2014 the Fund reauthorized its share repurchase program, pursuant to which it may repurchase up to 10% of its outstanding common shares as of the reauthorization date (approximately 1,775,000 shares) in open-market transactions, at the Manager’s discretion. The Fund did not repurchase any shares during the year ended December 31, 2015.
The Fund is unaware of any other trends, demands, conditions or events that are reasonably likely to result in material changes to the Fund’s liquidity needs.
Because the Fund invests in commodity futures contracts, its capital is at risk from changes in the value of these contracts (market risk) or the potential inability of clearing brokers or counterparties to perform under the terms of the contracts (credit risk).
Market Risk
Investing in commodity futures contracts involves the Fund entering into contractual commitments to purchase or sell a particular commodity at a specified date and price. The market risk associated with the Fund’s commitments to purchase commodities will be limited to the gross or face amount of the contracts held.
41
Table of Contents
The Fund’s exposure to market risk may be influenced by a number of factors, including changes in international balances of payments and trade, currency devaluations and revaluations, changes in interest and foreign currency exchange rates, price volatility of commodity futures contracts and market liquidity, weather, geopolitical events and other factors. These factors also affect the Fund’s investments in options on commodity futures contracts. The inherent uncertainty of the Fund’s investments as well as the development of drastic market occurrences could ultimately lead to a loss of all, or substantially all, of investors’ capital.
Credit Risk
The Fund may be exposed to credit risk from its investments in commodity futures contracts and options on commodity futures contracts resulting from the clearing house associated with a particular exchange failing to meet its obligations to the Fund. In general, clearing houses are backed by their corporate members who may be required to share in the financial burden resulting from the nonperformance of one of their members, which should significantly reduce this credit risk. In cases where the clearing house is not backed by the clearing members (i.e., as in some foreign exchanges), it may be backed by a consortium of banks or other financial institutions. There can be no assurance that any counterparty, clearing member or clearing house will meet its obligations to the Fund.
The Fund attempts to minimize market risks, and the Commodity Sub-adviser attempts to minimize credit risks, by abiding by various investment limitations and policies, which include limiting margin accounts, investing only in liquid markets and permitting the use of stop-loss orders. The Commodity Sub-adviser implements procedures which include, but are not limited to:
| • | Employing the options strategy to limit directional risk (although there is no guarantee that the Fund’s options strategy will be successful); |
| • | Executing and clearing trades only with counterparties the Commodity Sub-adviser believes are creditworthy; |
| • | Limiting the amount of margin or premium required for any one commodity contract or all commodity contracts combined; and |
| • | Generally limiting transactions to contracts which are traded in sufficient volume to permit the efficient taking and liquidating of positions. |
A commodity broker, when acting as the Fund’s futures commission merchant, is required by Commodity Futures Trading Commission (“CFTC”) regulations to separately account for and segregate all assets of the Fund relating to domestic futures investments. A commodity broker is not allowed to commingle such assets with other assets of the commodity broker. In addition, CFTC regulations also require a commodity broker, when acting as the Fund’s futures commission merchant, to hold in a “secured” account the assets of the Fund related to foreign commodity futures investments and not commingle such assets with assets of the commodity broker.
As it relates to the Fund’s assets held as collateral for its investments in commodity futures contracts, there is credit risk present in the securities used to invest the Fund’s cash. While these consist of cash equivalents, U.S. government securities and other short-term, high-grade debt securities, like any investment, these too would be affected by any credit difficulties that might be experienced by their issuers.
Off-Balance Sheet Arrangements
As of December 31, 2015, the Fund has not utilized, nor does it expect to utilize in the future, special purpose entities to facilitate off-balance sheet financing arrangements and has no loan guarantee arrangements or off-balance sheet arrangements of any kind other than agreements entered into in the normal course of business, which may include indemnification provisions related to certain risks service providers undertake in performing services which are in the best interests of the Fund. While the Fund’s exposure under such indemnification provisions cannot be estimated, these general business indemnifications are not expected to have a material impact on the Fund’s financial position.
42
Table of Contents
Contractual Obligations
The Fund’s contractual obligations are with the Manager, the Commodity Sub-adviser, the Collateral Sub-adviser, the custodian, the transfer agent and the commodity broker. Management fee payments made to the Manager are calculated as a percentage of the Fund’s net assets. The custodian fee is primarily based on the Fund’s assets and trading activity. The transfer agent fee is calculated based on the Fund’s total number of registered accounts. Commission payments to the commodity broker are on a contract-by-contract or round-turn basis. The Manager cannot anticipate the amount of payments that will be required under these arrangements for future periods, as these payments are based on figures which are not known until a future date. Additionally, these agreements may be terminated by either party for various reasons.
Critical Accounting Policies
The Fund’s critical accounting policies are as follows:
| • | Preparation of the financial statements and related disclosures in conformity with accounting principles generally accepted in the United States requires the application of appropriate accounting rules and guidance, as well as the use of estimates and assumptions. The Fund’s application of these policies involves judgments and actual results may differ from the estimates used. |
| • | The Fund holds a significant portion of its assets in futures contracts, options contracts, and short-term, high-grade debt instruments, all of which are recorded on a trade date basis and recognized at fair value in the financial statements, with changes in fair value reported on the Statements of Operations as change in net unrealized appreciation (depreciation). |
| • | The use of fair value to measure financial instruments, with related unrealized appreciation (depreciation) recognized in earnings in each period, is fundamental to the Fund’s financial statements. |
| • | The fair value of a financial instrument is the amount that would be received to sell an asset or paid to transfer a liability in an orderly transaction between market participants at the measurement date. |
| • | Generally, commodity futures contracts and options on commodity futures contracts traded on an exchange will be valued at the final settlement price or official closing price as determined by the principal exchange on which the instruments are traded as supplied by independent pricing services. Over-the-counter (“OTC”) commodity futures contracts and options on commodity futures contracts not traded on an exchange will be valued, in order of hierarchy, by independent pricing services, price quotations obtained from counterparty broker-dealers, or through fair valuation methodologies as determined by the Manager. |
| • | Market quotations for exchange-traded commodity futures contracts and options on commodity futures contracts may not be readily available as a result of significant events, which can include, but are not limited to: trading halts or suspensions, market disruptions, or the absence of market makers willing to make a market in such instruments. In addition, events may occur after the close of the market, but prior to the determination of the Fund’s net asset value, which may affect the values of the Fund’s investments. In such circumstances, the Manager will determine a fair valuation for such investments that in its opinion is reflective of fair market value. |
| • | Realized gains (losses) on closed positions and changes in unrealized appreciation (depreciation) on open positions are determined on a specific identification basis and recognized in the Statements of Operations during the period in which the contract is closed or the changes occur, respectively. |
| • | Interest income, which reflects the amortization of premiums and includes accretion of discounts for financial reporting purposes, is recorded on an accrual basis. |
Refer to note 2 of the Fund’s Notes to Financial Statements in “Item 8. Financial Statements and Supplementary Data” of this Report for the summary of significant accounting policies of the Fund.
43
Table of Contents
| Item 7A. | Quantitative and Qualitative Disclosures About Market Risk |
Quantitative Disclosure
The Fund is exposed to commodity price risk through the futures contracts and the options on futures contracts that the Fund invests in as part of its investment strategy. These instruments have been entered into for trading purposes. The following table provides information about the Fund’s futures contracts and options on futures contracts, which are sensitive to changes in commodity prices, as of December 31, 2015.
Long Futures Contracts
| Commodity Group |
Contract |
Contract |
Contract |
Number of Contracts |
Valuation Price |
Contract Multiplier |
Notional Amount at Value |
|||||||||||||||
| Agriculture |
Sugar | |||||||||||||||||||||
| ICE Sugar Futures Contract | Long | March 2016 | 509 | $ | 0.1524 | 112,000 | $ | 8,688,019 | ||||||||||||||
| Cocoa | ||||||||||||||||||||||
| ICE Cocoa Futures Contract | Long | March 2016 | 128 | 3,211.0000 | 10 | 4,110,080 | ||||||||||||||||
| Cotton | ||||||||||||||||||||||
| ICE Cotton Futures Contract | Long | March 2016 | 124 | 0.6328 | 50,000 | 3,923,360 | ||||||||||||||||
Short Futures Contracts
| Commodity Group |
Contract |
Contract |
Contract |
Number |
Valuation Price |
Contract |
Notional | |||||||||
| Agriculture |
Soybean | |||||||||||||||
| CBOT Soybean Futures Contract | Short | March 2016 | (466) | $ | 8.6425 | 5,000 | $(20,137,025) | |||||||||
| Corn | ||||||||||||||||
| CBOT Corn Futures Contract | Short | March 2016 | (912) | 3.5875 | 5,000 | (16,359,000) | ||||||||||
| Soybean Meal | ||||||||||||||||
| CBOT Soybean Meal Futures Contract | Short | March 2016 | (271) | 265.5000 | 100 | (7,195,050) | ||||||||||
| Wheat | ||||||||||||||||
| CBOT Wheat Futures Contract | Short | March 2016 | (288) | 4.7000 | 5,000 | (6,768,000) | ||||||||||
| Coffee | ||||||||||||||||
| ICE Coffee C Futures Contract | Short | March 2016 | (142) | 1.2670 | 37,500 | (6,746,775) | ||||||||||
| Soybean Oil | ||||||||||||||||
| CBOT Soybean Oil Futures Contract | Short | March 2016 | (261) | 0.3075 | 60,000 | (4,815,450) | ||||||||||
| Metals |
Gold | |||||||||||||||
| CEC Gold Futures Contract | Short | February 2016 | (223) | 1,060.2000 | 100 | (23,642,460) | ||||||||||
| CEC Gold Futures Contract | Short | April 2016 | (10) | 1,060.8000 | 100 | (1,060,800) | ||||||||||
| Silver | ||||||||||||||||
| CEC Silver Futures Contract | Short | March 2016 | (123) | 13.8030 | 5,000 | (8,488,845) | ||||||||||
| Copper | ||||||||||||||||
| CEC Copper Futures Contract | Short | March 2016 | (129) | 2.1350 | 25,000 | (6,885,375) | ||||||||||
| Livestock |
Live Cattle | |||||||||||||||
| CME Live Cattle Futures Contract | Short | February 2016 | (79) | 1.3680 | 40,000 | (4,322,880) | ||||||||||
| CME Live Cattle Futures Contract | Short | April 2016 | (125) | 1.3798 | 40,000 | (6,898,750) | ||||||||||
| Lean Hogs | ||||||||||||||||
| CME Lean Hogs Futures Contract | Short | February 2016 | (29) | 0.5980 | 40,000 | (693,680) | ||||||||||
| CME Lean Hogs Futures Contract | Short | April 2016 | (141) | 0.6595 | 40,000 | (3,719,580) | ||||||||||
Commodity Call Options Written
| Commodity Group |
Contract |
Contract Expiration |
Number of Contracts |
Strike Price |
Value | |||||||||||||
| Agriculture |
Sugar |
|||||||||||||||||
| ICE Sugar Futures Options | February 2016 | (74 | ) | $ | 14.50 | $ | (87,853 | ) | ||||||||||
| Soybean Oil | ||||||||||||||||||
| CBOT Soybean Oil Futures Options | February 2016 | (39 | ) | 31.50 | (15,327 | ) | ||||||||||||
| Cocoa |
||||||||||||||||||
| ICE Cocoa Futures Options | February 2016 | (19 | ) | 3,000.00 | (42,560 | ) | ||||||||||||
| Cotton | ||||||||||||||||||
| ICE Cotton Futures Options | February 2016 | (19 | ) | 63.00 | (15,200 | ) | ||||||||||||
44
Table of Contents
Commodity Put Options Written
| Commodity Group |
Contract |
Contract Expiration |
Number of Contracts |
Strike Price |
Value | |||||||||||||
| Agriculture |
Soybean | |||||||||||||||||
| CBOT Soybean Futures Options | February 2016 | (70 | ) | $ | 960.00 | $ | (341,250 | ) | ||||||||||
| Corn |
||||||||||||||||||
| CBOT Corn Futures Options | February 2016 | (137 | ) | 410.00 | (357,913 | ) | ||||||||||||
| Sugar |
||||||||||||||||||
| ICE Sugar Futures Options | February 2016 | (74 | ) | 14.50 | (26,522 | ) | ||||||||||||
| Soybean Meal |
||||||||||||||||||
| CBOT Soybean Meal Futures Options | February 2016 | (41 | ) | 310.00 | (184,705 | ) | ||||||||||||
| Wheat |
||||||||||||||||||
| CBOT Wheat Futures Options | February 2016 | (43 | ) | 530.00 | (135,987 | ) | ||||||||||||
| Coffee |
||||||||||||||||||
| ICE Coffee C Futures Options | February 2016 | (21 | ) | 150.00 | (191,677 | ) | ||||||||||||
| Soybean Oil |
||||||||||||||||||
| CBOT Soybean Oil Futures Options | February 2016 | (39 | ) | 31.50 | (32,877 | ) | ||||||||||||
| Cotton |
||||||||||||||||||
| ICE Cotton Futures Options | February 2016 | (19 | ) | 63.00 | (12,540 | ) | ||||||||||||
| Metals |
Gold | |||||||||||||||||
| CEC Gold Futures Options | January 2016 | (35 | ) | 1,170.00 | (385,000 | ) | ||||||||||||
| Silver |
||||||||||||||||||
| CEC Silver Futures Options | February 2016 | (18 | ) | 16.00 | (200,790 | ) | ||||||||||||
| Livestock |
Live Cattle | |||||||||||||||||
| CME Live Cattle Futures Options | February 2016 | (31 | ) | 150.00 | (165,850 | ) | ||||||||||||
| Lean Hogs | ||||||||||||||||||
| CME Lean Hogs Futures Options | February 2016 | (26 | ) | 68.00 | (87,100 | ) | ||||||||||||
| CBOT | Chicago Board of Trade | |
| CEC | Commodities Exchange Center | |
| CME | Chicago Mercantile Exchange | |
| ICE | Intercontinental Exchange |
The Fund also invests the assets held as collateral for its investments in commodity futures contracts in cash equivalents, U.S. government securities, and other short-term high-grade debt securities, which exposes the Fund to interest rate risk. These instruments are deemed to be entered into for non-trading purposes, with an emphasis on current income, liquidity and preservation of capital. As of December 31, 2015, the Fund held U.S. Treasury Bills worth $228,580,099 with a total par value of $229,000,000 and a repurchase agreement worth $1,293,949.
Qualitative Disclosure
The Fund’s primary trading risk exposure is commodity price risk, which affects the futures contracts and options on futures contracts in which the Fund invests. There are numerous uncertainties, contingencies and risks associated with these investments (as discussed in “Item 1A. Risk Factors” and elsewhere in this Annual Report) which include, but are not limited to, government interventions, defaults and expropriations, adverse weather conditions, commodity supply factors, illiquid markets, the emergence of dominant fundamental factors, political upheavals, changes in historical price relationships, an influx of new market participants, and increased regulation. Investors may lose all or substantially all of their investment in the Fund.
The Fund invests in a diversified portfolio of commodity futures contracts to obtain broad exposure to all principal groups in the global commodity markets, thereby limiting its exposure to the commodity price risk of any one futures contract or any specific commodity group. To further help manage commodity price risk, the Fund uses its options strategy in an attempt to enhance the Fund’s risk-adjusted total returns. The impact of the options strategy on the Fund’s total returns in varying market environments is described below.
45
Table of Contents
If the Commodity Sub-adviser determines the Fund should have long exposure to an individual commodity futures contract, it will invest long in the commodity futures contract and sell a call option on the same underlying commodity futures contract with the same strike price and expiration date. In up markets where commodity prices increase, the portion of the Fund on which call options have been sold will forego potential appreciation in the value of the underlying contracts to the extent the price of those contracts exceeds the exercise price of call options sold plus the premium collected by selling the options. In flat or sideways markets, the portion of the Fund on which call options have been sold will generate current gains from the call option premiums collected by selling the options. In down markets where commodity prices decrease, the call options sold by the Fund will expire worthless. Regardless of the price performance of the long commodity futures position, the Fund will retain the net call option premiums received by the Fund.
If the Commodity Sub-adviser determines the Fund should have short exposure to an individual commodity futures contract, it will short the commodity futures contract and sell a put option on the same underlying commodity futures contract with the same strike price and expiration date. In down markets where commodity prices decrease, the portion of the Fund on which put options have been sold will forego potential appreciation in the value of the underlying futures contracts to the extent that the price of those contracts exceeds the exercise price of put options sold plus the premium collected by selling the options. In flat or sideways markets, the portion of the Fund on which put options have been sold will generate current gains from the put option premiums collected by selling the options. In up markets where commodity prices increase, the put options sold by the Fund will expire worthless. Regardless of the price performance of the short commodity futures position, the Fund will retain the net put option premiums received by the Fund.
There can be no assurance that the Fund’s options strategy will be successful. The Fund’s risk-adjusted returns over any particular period may be positive or negative.
The Fund’s primary non-trading risk exposures are interest rate risk and credit risk related to the collateral portfolio. Interest rate risk is mitigated by the short-term nature of the collateral portfolio’s debt securities. Credit risk is mitigated by the fact that the collateral portfolio’s debt securities (other than U.S. government securities) are rated at the highest applicable rating as determined by at least one NRSRO or, if unrated, judged by the Collateral Sub-adviser to be of comparable quality.
46
Table of Contents
| Item 8. | Financial Statements and Supplementary Data |
Report of Independent Registered Public Accounting Firm
To the Independent Committee and Shareholders of
Nuveen Long/Short Commodity Total Return Fund:
In our opinion, the accompanying schedule of investments at December 31, 2015 and the statements of financial condition, the related statements of operations, of changes in shareholders’ capital and of cash flows present fairly, in all material respects, the financial position of Nuveen Long/Short Commodity Total Return Fund (the “Company”) at December 31, 2015 and December 31, 2014, and the results of its operations and its cash flows for each of the three years in the period ended December 31, 2015, in conformity with accounting principles generally accepted in the United States of America. Also in our opinion, the Company maintained, in all material respects, effective internal control over financial reporting as of December 31, 2015, based on criteria established in Internal Control—Integrated Framework (2013) issued by the Committee of Sponsoring Organizations of the Treadway Commission (COSO). The Company’s management is responsible for these financial statements, for maintaining effective internal control over financial reporting and for its assessment of the effectiveness of internal control over financial reporting, included in Item 9A. Our responsibility is to express opinions on these financial statements, and on the Company’s internal control over financial reporting based on our integrated audits. We conducted our audits in accordance with the standards of the Public Company Accounting Oversight Board (United States). Those standards require that we plan and perform the audits to obtain reasonable assurance about whether the financial statements are free of material misstatement and whether effective internal control over financial reporting was maintained in all material respects. Our audits of the financial statements included examining, on a test basis, evidence supporting the amounts and disclosures in the financial statements, assessing the accounting principles used and significant estimates made by management, and evaluating the overall financial statement presentation. Our audit of internal control over financial reporting included obtaining an understanding of internal control over financial reporting, assessing the risk that a material weakness exists, and testing and evaluating the design and operating effectiveness of internal control based on the assessed risk. Our audits also included performing such other procedures as we considered necessary in the circumstances. We believe that our audits provide a reasonable basis for our opinions.
A company’s internal control over financial reporting is a process designed to provide reasonable assurance regarding the reliability of financial reporting and the preparation of financial statements for external purposes in accordance with generally accepted accounting principles. A company’s internal control over financial reporting includes those policies and procedures that (i) pertain to the maintenance of records that, in reasonable detail, accurately and fairly reflect the transactions and dispositions of the assets of the company; (ii) provide reasonable assurance that transactions are recorded as necessary to permit preparation of financial statements in accordance with generally accepted accounting principles, and that receipts and expenditures of the company are being made only in accordance with authorizations of management and directors of the company; and (iii) provide reasonable assurance regarding prevention or timely detection of unauthorized acquisition, use, or disposition of the company’s assets that could have a material effect on the financial statements.
Because of its inherent limitations, internal control over financial reporting may not prevent or detect misstatements. Also, projections of any evaluation of effectiveness to future periods are subject to the risk that controls may become inadequate because of changes in conditions, or that the degree of compliance with the policies or procedures may deteriorate.
PricewaterhouseCoopers LLP
Chicago, IL
March 11, 2016
47
Table of Contents
NUVEEN LONG/SHORT COMMODITY TOTAL RETURN FUND
SCHEDULE OF INVESTMENTS
December 31, 2015
Investments
| Principal Amount (000) |
Description | Coupon | Maturity | Ratings(1) | Value | |||||||||||||
| Short-Term Investments |
||||||||||||||||||
| U.S. Government and Agency Obligations |
||||||||||||||||||
| $ 13,000 |
U.S. Treasury Bills |
0.000 | % | 1/07/16 | Aaa | $ | 12,999,948 | |||||||||||
| 17,000 |
U.S. Treasury Bills |
0.000 | % | 2/04/16 | Aaa | 16,998,521 | ||||||||||||
| 11,000 |
U.S. Treasury Bills |
0.000 | % | 3/03/16 | Aaa | 10,998,064 | ||||||||||||
| 30,000 |
U.S. Treasury Bills |
0.000 | % | 3/31/16 | Aaa | 29,987,340 | ||||||||||||
| 35,000 |
U.S. Treasury Bills |
0.000 | % | 4/28/16 | Aaa | 34,970,670 | ||||||||||||
| 45,000 |
U.S. Treasury Bills |
0.000 | % | 5/26/16 | Aaa | 44,930,520 | ||||||||||||
| 10,000 |
U.S. Treasury Bills |
0.000 | % | 7/21/16 | Aaa | 9,971,830 | ||||||||||||
| 50,000 |
U.S. Treasury Bills |
0.000 | % | 9/15/16 | Aaa | 49,818,450 | ||||||||||||
| 6,000 |
U.S. Treasury Bills |
0.000 | % | 11/10/16 | Aaa | 5,972,892 | ||||||||||||
| 12,000 |
U.S. Treasury Bills | 0.000 | % | 12/08/16 | Aaa | 11,931,864 | ||||||||||||
|
|
|
|
||||||||||||||||
| $ 229,000 |
Total U.S. Government and Agency Obligations (cost $228,672,757) |
$ | 228,580,099 | |||||||||||||||
|
|
|
|
||||||||||||||||
| Repurchase Agreements | ||||||||||||||||||
| $ 1,294 |
Repurchase Agreement with State Street Bank, dated 12/31/15, repurchase price $1,293,949, collateralized by $1,225,000 U.S. Treasury Notes, 3.500%, due 5/15/20, value $1,321,469 | 0.010 | % | 1/04/16 | N/A | $ | 1,293,949 | |||||||||||
|
|
|
|
||||||||||||||||
| Total Repurchase Agreements (cost $1,293,949) | $ | 1,293,949 | ||||||||||||||||
|
|
|
|||||||||||||||||
| Total Short-Term Investments (cost $229,966,706) | $ | 229,874,048 | ||||||||||||||||
|
|
|
|
||||||||||||||||
48
Table of Contents
NUVEEN LONG/SHORT COMMODITY TOTAL RETURN FUND
SCHEDULE OF INVESTMENTS (Continued)
December 31, 2015
Investments in Derivatives
Futures Contracts outstanding:
| Commodity Group | Contract | Contract Position |
Contract Expiration |
Number of |
Notional Amount at Value(3) |
Unrealized Appreciation (Depreciation)(4) |
||||||||||||||||
| Agriculture |
Soybean | |||||||||||||||||||||
| CBOT Soybean Futures Contract | Short | March 2016 | (466 | ) | $ | (20,137,025 | ) | $ | 603,500 | |||||||||||||
|
|
|
|
||||||||||||||||||||
| Corn | ||||||||||||||||||||||
| CBOT Corn Futures Contract | Short | March 2016 | (912 | ) | (16,359,000 | ) | 563,781 | |||||||||||||||
|
|
|
|
||||||||||||||||||||
| Sugar | ||||||||||||||||||||||
| ICE Sugar Futures Contract | Long | March 2016 | 509 | 8,688,019 | 282,749 | |||||||||||||||||
|
|
|
|
||||||||||||||||||||
| Soybean Meal | ||||||||||||||||||||||
| CBOT Soybean Meal Futures Contract | Short | March 2016 | (271 | ) | (7,195,050 | ) | 498,120 | |||||||||||||||
|
|
|
|
||||||||||||||||||||
| Wheat | ||||||||||||||||||||||
| CBOT Wheat Futures Contract | Short | March 2016 | (288 | ) | (6,768,000 | ) | 343,850 | |||||||||||||||
|
|
|
|
||||||||||||||||||||
| Coffee | ||||||||||||||||||||||
| ICE Coffee C Futures Contract | Short | March 2016 | (142 | ) | (6,746,775 | ) | (164,550 | ) | ||||||||||||||
|
|
|
|
||||||||||||||||||||
| Soybean Oil | ||||||||||||||||||||||
| CBOT Soybean Oil Futures Contract | Short | March 2016 | (261 | ) | (4,815,450 | ) | 52,517 | |||||||||||||||
|
|
|
|
||||||||||||||||||||
| Cocoa | ||||||||||||||||||||||
| ICE Cocoa Futures Contract | Long | March 2016 | 128 | 4,110,080 | 16,886 | |||||||||||||||||
|
|
|
|
||||||||||||||||||||
| Cotton | ||||||||||||||||||||||
| ICE Cotton Futures Contract | Long | March 2016 | 124 | 3,923,360 | (42,792 | ) | ||||||||||||||||
|
|
|
|
||||||||||||||||||||
| Total Agriculture | 2,154,061 | |||||||||||||||||||||
|
|
|
|
||||||||||||||||||||
| Metals |
Gold | |||||||||||||||||||||
| CEC Gold Futures Contract | Short | February 2016 | (223 | ) | (23,642,460 | ) | 552,150 | |||||||||||||||
| CEC Gold Futures Contract | Short | April 2016 | (10 | ) | (1,060,800 | ) | (9,300 | ) | ||||||||||||||
|
|
|
|
||||||||||||||||||||
| Total Gold | 542,850 | |||||||||||||||||||||
|
|
|
|
||||||||||||||||||||
| Silver | ||||||||||||||||||||||
| CEC Silver Futures Contract | Short | March 2016 | (123 | ) | (8,488,845 | ) | 348,810 | |||||||||||||||
|
|
|
|
||||||||||||||||||||
| Copper | ||||||||||||||||||||||
| CEC Copper Futures Contract | Short | March 2016 | (129 | ) | (6,885,375 | ) | 436,250 | |||||||||||||||
|
|
|
|
||||||||||||||||||||
| Total Metals | 1,327,910 | |||||||||||||||||||||
|
|
|
|
||||||||||||||||||||
| Livestock |
Live Cattle | |||||||||||||||||||||
| CME Live Cattle Futures Contract | Short | February 2016 | (79 | ) | (4,322,880 | ) | (139,250 | ) | ||||||||||||||
| CME Live Cattle Futures Contract | Short | April 2016 | (125 | ) | (6,898,750 | ) | (579,779 | ) | ||||||||||||||
|
|
|
|
||||||||||||||||||||
| Total Live Cattle | (719,029 | ) | ||||||||||||||||||||
|
|
|
|
||||||||||||||||||||
| Lean Hogs | ||||||||||||||||||||||
| CME Lean Hogs Futures Contract | Short | February 2016 | (29 | ) | (693,680 | ) | (12,828 | ) | ||||||||||||||
| CME Lean Hogs Futures Contract | Short | April 2016 | (141 | ) | (3,719,580 | ) | (198,170 | ) | ||||||||||||||
|
|
|
|
||||||||||||||||||||
| Total Lean Hogs | (210,998 | ) | ||||||||||||||||||||
|
|
|
|
||||||||||||||||||||
| Total Livestock | (930,027 | ) | ||||||||||||||||||||
|
|
|
|
||||||||||||||||||||
| Total Futures Contracts outstanding | $ | 2,551,944 | ||||||||||||||||||||
|
|
|
|
||||||||||||||||||||
49
Table of Contents
NUVEEN LONG/SHORT COMMODITY TOTAL RETURN FUND
SCHEDULE OF INVESTMENTS (Continued)
December 31, 2015
Investments in Derivatives (Continued)
Call Options Written outstanding:
| Commodity Group | Contract | Contract Expiration |
Number of Contracts |
Strike Price |
Value | |||||||||||||
| Agriculture |
Sugar | |||||||||||||||||
| ICE Sugar Futures Options | February 2016 | (74 | ) | $ | 14.50 | $ | (87,853 | ) | ||||||||||
|
|
|
|
||||||||||||||||
| Soybean Oil | ||||||||||||||||||
| CBOT Soybean Oil Futures Options | February 2016 | (39 | ) | 31.50 | (15,327 | ) | ||||||||||||
|
|
|
|
||||||||||||||||
| Cocoa | ||||||||||||||||||
| ICE Cocoa Futures Options | February 2016 | (19 | ) | 3,000.00 | (42,560 | ) | ||||||||||||
|
|
|
|
||||||||||||||||
| Cotton | ||||||||||||||||||
| ICE Cotton Futures Options | February 2016 | (19 | ) | 63.00 | (15,200 | ) | ||||||||||||
|
|
|
|
||||||||||||||||
| Total Agriculture | (160,940 | ) | ||||||||||||||||
|
|
|
|
||||||||||||||||
| Total Call Options Written outstanding (premiums received $228,968) | (151 | ) | $ | (160,940 | ) | |||||||||||||
|
|
|
|
|
|
||||||||||||||
Put Options Written outstanding:
| Commodity Group | Contract | Contract Expiration |
Number of Contracts |
Strike Price |
Value | |||||||||||||
| Agriculture |
Soybean | |||||||||||||||||
| CBOT Soybean Futures Options | February 2016 | (70 | ) | $ | 960.00 | $ | (341,250 | ) | ||||||||||
|
|
|
|
||||||||||||||||
| Corn | ||||||||||||||||||
| CBOT Corn Futures Options | February 2016 | (137 | ) | 410.00 | (357,913 | ) | ||||||||||||
|
|
|
|
||||||||||||||||
| Sugar | ||||||||||||||||||
| ICE Sugar Futures Options | February 2016 | (74 | ) | 14.50 | (26,522 | ) | ||||||||||||
|
|
|
|
||||||||||||||||
| Soybean Meal | ||||||||||||||||||
| CBOT Soybean Meal Futures Options | February 2016 | (41 | ) | 310.00 | (184,705 | ) | ||||||||||||
|
|
|
|
||||||||||||||||
| Wheat | ||||||||||||||||||
| CBOT Wheat Futures Options | February 2016 | (43 | ) | 530.00 | (135,987 | ) | ||||||||||||
|
|
|
|
||||||||||||||||
| Coffee | ||||||||||||||||||
| ICE Coffee C Futures Options | February 2016 | (21 | ) | 150.00 | (191,677 | ) | ||||||||||||
|
|
|
|
||||||||||||||||
| Soybean Oil | ||||||||||||||||||
| CBOT Soybean Oil Futures Options | February 2016 | (39 | ) | 31.50 | (32,877 | ) | ||||||||||||
|
|
|
|
||||||||||||||||
| Cotton | ||||||||||||||||||
| ICE Cotton Futures Options | February 2016 | (19 | ) | 63.00 | (12,540 | ) | ||||||||||||
|
|
|
|
||||||||||||||||
| Total Agriculture | (1,283,471 | ) | ||||||||||||||||
|
|
|
|
||||||||||||||||
| Metals |
Gold | |||||||||||||||||
| CEC Gold Futures Options | January 2016 | (35 | ) | 1,170.00 | (385,000 | ) | ||||||||||||
|
|
|
|
||||||||||||||||
| Silver | ||||||||||||||||||
| CEC Silver Futures Options | February 2016 | (18 | ) | 16.00 | (200,790 | ) | ||||||||||||
|
|
|
|
||||||||||||||||
| Total Metals | (585,790 | ) | ||||||||||||||||
|
|
|
|
||||||||||||||||
50
Table of Contents
NUVEEN LONG/SHORT COMMODITY TOTAL RETURN FUND
SCHEDULE OF INVESTMENTS (Continued)
December 31, 2015
Investments in Derivatives (Continued)
Put Options Written outstanding (Continued):
| Commodity Group | Contract | |
Contract Expiration |
|
|
Number of Contracts |
|
|
Strike Price |
|
Value | |||||||
| Livestock |
Live Cattle | |||||||||||||||||
| CME Live Cattle Futures Options | February 2016 | (31 | ) | $ | 150.00 | $ | (165,850 | ) | ||||||||||
|
|
|
|
||||||||||||||||
| Lean Hogs |
||||||||||||||||||
| CME Lean Hogs Futures Options | February 2016 | (26 | ) | 68.00 | (87,100 | ) | ||||||||||||
|
|
|
|
||||||||||||||||
| Total Livestock |
(252,950 | ) | ||||||||||||||||
|
|
|
|
||||||||||||||||
| Total Put Options Written outstanding (premiums received $2,094,372) | (554 | ) | $ | (2,122,211 | ) | |||||||||||||
|
|
|
|
|
|
||||||||||||||
| Total Options Written outstanding (premiums received $2,323,340) | (705 | ) | $ | (2,283,151 | ) | |||||||||||||
|
|
|
|
|
|
| (1) | Ratings (not covered by the report of independent registered public accounting firm): Using the highest of Standard & Poor’s Group, Moody’s Investors Service, Inc. or Fitch, Inc. rating. | |
| (2) | The aggregate number of long and short futures contracts outstanding is 761 and (3,199), respectively. | |
| (3) | The aggregate notional amount at value for long and short futures contracts outstanding is $16,721,459 and $(117,733,670), respectively. | |
| (4) | The gross unrealized appreciation (depreciation) on futures contracts outstanding is $3,698,613 and $(1,146,669), respectively. | |
| N/A | Not applicable | |
| CBOT | Chicago Board of Trade | |
| CEC | Commodities Exchange Center | |
| CME | Chicago Mercantile Exchange | |
| ICE | Intercontinental Exchange |
See accompanying notes to financial statements.
51
Table of Contents
NUVEEN LONG/SHORT COMMODITY TOTAL RETURN FUND
STATEMENTS OF FINANCIAL CONDITION
At December 31, 2015 and December 31, 2014
| December 31, 2015 | December 31, 2014 | |||||||
| ASSETS | ||||||||
| Short-term investments, at value |
$ | 229,874,048 | $ | 249,875,345 | ||||
| Deposits with brokers |
40,100,175 | 44,088,266 | ||||||
| Unrealized appreciation on futures contracts |
3,698,613 | 3,601,270 | ||||||
|
|
|
|
|
|||||
| Total assets |
$ | 273,672,836 | $ | 297,564,881 | ||||
|
|
|
|
|
|||||
| LIABILITIES | ||||||||
| Options written, at value |
2,283,151 | 2,561,321 | ||||||
| Unrealized depreciation on futures contracts |
1,146,669 | 904,856 | ||||||
| Accrued expenses: |
||||||||
| Conversion |
427,718 | — | ||||||
| Management fees |
286,701 | 312,862 | ||||||
| Independent Committee fees |
30,574 | 28,397 | ||||||
| Professional fees |
308,014 | 292,335 | ||||||
| Other |
229,342 | 288,375 | ||||||
|
|
|
|
|
|||||
| Total liabilities |
4,712,169 | 4,388,146 | ||||||
|
|
|
|
|
|||||
| SHAREHOLDERS’ CAPITAL | ||||||||
| Paid-in capital, unlimited number of shares authorized, 16,345,840 shares issued and outstanding at December 31, 2015 and December 31, 2014 |
409,376,279 | 409,376,279 | ||||||
| Accumulated undistributed earnings (deficit) |
(140,415,612 | ) | (116,199,544 | ) | ||||
|
|
|
|
|
|||||
| Total shareholders’ capital (Net assets) |
268,960,667 | 293,176,735 | ||||||
|
|
|
|
|
|||||
| Total liabilities and shareholders’ capital |
$ | 273,672,836 | $ | 297,564,881 | ||||
|
|
|
|
|
|||||
| Net assets |
$ | 268,960,667 | $ | 293,176,735 | ||||
| Shares outstanding |
16,345,840 | 16,345,840 | ||||||
|
|
|
|
|
|||||
| Net asset value per share outstanding |
$ | 16.45 | $ | 17.94 | ||||
|
|
|
|
|
|||||
| Market value per share outstanding |
$ | 15.54 | $ | 16.60 | ||||
|
|
|
|
|
|||||
See accompanying notes to financial statements.
52
Table of Contents
NUVEEN LONG/SHORT COMMODITY TOTAL RETURN FUND
STATEMENTS OF OPERATIONS
For the Years Ended December 31, 2015, December 31, 2014 and December 31, 2013
| Year Ended December 31, | ||||||||||||
| 2015 | 2014 | 2013 | ||||||||||
| Investment Income: |
||||||||||||
| Interest |
$ | 444,078 | $ | 278,885 | $ | 449,531 | ||||||
|
|
|
|
|
|
|
|||||||
| Total Investment Income |
444,078 | 278,885 | 449,531 | |||||||||
|
|
|
|
|
|
|
|||||||
| Expenses: |
||||||||||||
| Management fees |
3,514,158 | 4,139,952 | 4,942,155 | |||||||||
| Brokerage commissions |
249,293 | 408,535 | 482,140 | |||||||||
| Conversion expenses |
776,205 | — | — | |||||||||
| Custodian fees and expenses |
94,903 | 136,467 | 153,662 | |||||||||
| Independent Committee fees and expenses |
124,593 | 116,689 | 116,413 | |||||||||
| Professional fees |
416,169 | 449,093 | 504,883 | |||||||||
| Shareholder reporting expenses |
117,186 | 132,176 | 209,636 | |||||||||
| Licensing fees |
288,192 | 330,880 | 406,908 | |||||||||
| Other expenses |
30,823 | 30,336 | 22,038 | |||||||||
|
|
|
|
|
|
|
|||||||
| Total expenses |
5,611,522 | 5,744,128 | 6,837,835 | |||||||||
|
|
|
|
|
|
|
|||||||
| Net investment income (loss) |
(5,167,444 | ) | (5,465,243 | ) | (6,388,304 | ) | ||||||
|
|
|
|
|
|
|
|||||||
| Net realized gain (loss) from: |
||||||||||||
| Short-term investments |
336 | 579 | 9,391 | |||||||||
| Futures contracts |
(9,480,921 | ) | (35,085,916 | ) | (41,169,967 | ) | ||||||
| Options written |
12,277,005 | 21,702,917 | 30,502,794 | |||||||||
| Change in net unrealized appreciation (depreciation) of: |
||||||||||||
| Short-term investments |
(87,321 | ) | (46,410 | ) | (29,754 | ) | ||||||
| Futures contracts |
(144,470 | ) | (2,198,050 | ) | 8,150,119 | |||||||
| Options written |
(35,394 | ) | 472,931 | (1,679,643 | ) | |||||||
|
|
|
|
|
|
|
|||||||
| Net realized gain (loss) and change in net unrealized appreciation (depreciation) |
2,529,235 | (15,153,949 | ) | (4,217,060 | ) | |||||||
|
|
|
|
|
|
|
|||||||
| Net income (loss) |
$ | (2,638,209 | ) | $ | (20,619,192 | ) | $ | (10,605,364 | ) | |||
|
|
|
|
|
|
|
|||||||
| Net income (loss) per weighted-average share |
$ | (0.16 | ) | $ | (1.18 | ) | $ | (0.57 | ) | |||
| Weighted-average shares outstanding |
16,345,840 | 17,412,370 | 18,632,974 | |||||||||
See accompanying notes to financial statements.
53
Table of Contents
NUVEEN LONG/SHORT COMMODITY TOTAL RETURN FUND
STATEMENTS OF CHANGES IN SHAREHOLDERS’ CAPITAL
For the Years Ended December 31, 2015, December 31, 2014 and December 31, 2013
| Year Ended December 31, | ||||||||||||
| 2015 | 2014 | 2013 | ||||||||||
| Shareholders’ capital-beginning of period |
$ | 293,176,735 | $ | 364,380,747 | $ | 427,111,563 | ||||||
| Repurchase of shares |
— | (21,026,758 | ) | (17,527,018 | ) | |||||||
|
|
|
|
|
|
|
|||||||
| Net increase (decrease) in shareholders’ capital resulting from operations: |
||||||||||||
| Net investment income (loss) |
(5,167,444 | ) | (5,465,243 | ) | (6,388,304 | ) | ||||||
| Net realized gain (loss) from: |
||||||||||||
| Short-term investments |
336 | 579 | 9,391 | |||||||||
| Futures contracts |
(9,480,921 | ) | (35,085,916 | ) | (41,169,967 | ) | ||||||
| Options written |
12,277,005 | 21,702,917 | 30,502,794 | |||||||||
| Change in net unrealized appreciation (depreciation) of: |
||||||||||||
| Short-term investments |
(87,321 | ) | (46,410 | ) | (29,754 | ) | ||||||
| Futures contracts |
(144,470 | ) | (2,198,050 | ) | 8,150,119 | |||||||
| Options written |
(35,394 | ) | 472,931 | (1,679,643 | ) | |||||||
|
|
|
|
|
|
|
|||||||
| Net income (loss) |
(2,638,209 | ) | (20,619,192 | ) | (10,605,364 | ) | ||||||
|
|
|
|
|
|
|
|||||||
| Distributions to shareholders |
(21,577,859 | ) | (29,558,062 | ) | (34,598,434 | ) | ||||||
|
|
|
|
|
|
|
|||||||
| Shareholders’ capital–end of period |
$ | 268,960,667 | $ | 293,176,735 | $ | 364,380,747 | ||||||
|
|
|
|
|
|
|
|||||||
| Shares–beginning of period |
16,345,840 | 17,755,840 | 18,800,840 | |||||||||
| Repurchase of shares |
— | (1,410,000 | ) | (1,045,000 | ) | |||||||
|
|
|
|
|
|
|
|||||||
| Shares–end of period |
16,345,840 | 16,345,840 | 17,755,840 | |||||||||
|
|
|
|
|
|
|
|||||||
See accompanying notes to financial statements.
54
Table of Contents
NUVEEN LONG/SHORT COMMODITY TOTAL RETURN FUND
STATEMENTS OF CASH FLOWS
For the Years Ended December 31, 2015, December 31, 2014 and December 31, 2013
| Year Ended December 31, | ||||||||||||
| 2015 | 2014 | 2013 | ||||||||||
| Cash flows from operating activities: |
||||||||||||
| Net income (loss) |
$ | (2,638,209 | ) | $ | (20,619,192 | ) | $ | (10,605,364 | ) | |||
| Adjustments to reconcile net income (loss) to net cash provided by (used in) operating activities: |
||||||||||||
| Purchases of U.S. government and agency obligations |
(229,358,050 | ) | (307,956,647 | ) | (309,434,951 | ) | ||||||
| Proceeds from sales and maturities of U.S. Government and agency obligations |
249,999,388 | 365,499,869 | 375,989,570 | |||||||||
| Proceeds from (Purchases of) repurchase agreements, net |
(286,780 | ) | 576,562 | (1,583,731 | ) | |||||||
| Premiums received for options written |
18,059,094 | 24,701,944 | 34,938,175 | |||||||||
| Cash paid for options written |
(6,095,653 | ) | (4,997,257 | ) | (4,547,966 | ) | ||||||
| Amortization (Accretion) of short-term investments |
(440,246 | ) | (278,885 | ) | (449,371 | ) | ||||||
| (Increase) Decrease in deposits with brokers |
3,988,091 | 13,978,744 | 5,117,980 | |||||||||
| Increase (Decrease) in: |
||||||||||||
| Accrued conversion expenses |
427,718 | — | — | |||||||||
| Accrued management fees |
(26,161 | ) | (78,559 | ) | (69,021 | ) | ||||||
| Accrued Independent Committee fees |
2,177 | (167 | ) | 2,764 | ||||||||
| Accrued professional fees |
15,679 | 98,583 | 101,132 | |||||||||
| Accrued other expenses |
(59,033 | ) | 17,192 | 122,733 | ||||||||
| Net realized (gain) loss from: |
||||||||||||
| Short-term investments |
(336 | ) | (579 | ) | (9,391 | ) | ||||||
| Options written |
(12,277,005 | ) | (21,702,917 | ) | (30,502,794 | ) | ||||||
| Change in net unrealized (appreciation) depreciation of: |
||||||||||||
| Short-term investments |
87,321 | 46,410 | 29,754 | |||||||||
| Futures contracts |
144,470 | 2,198,050 | (8,150,119 | ) | ||||||||
| Options written |
35,394 | (472,931 | ) | 1,679,643 | ||||||||
|
|
|
|
|
|
|
|||||||
| Net cash provided by (used in) operating activities |
21,577,859 | 51,010,220 | 52,629,043 | |||||||||
|
|
|
|
|
|
|
|||||||
| Cash flows from financing activities: |
||||||||||||
| Increase (Decrease) in cash overdraft |
— | — | (928,991 | ) | ||||||||
| Cash paid for shares repurchased |
— | (21,452,158 | ) | (17,101,618 | ) | |||||||
| Cash distributions paid to shareholders |
(21,577,859 | ) | (29,558,062 | ) | (34,598,434 | ) | ||||||
|
|
|
|
|
|
|
|||||||
| Net cash provided by (used in) financing activities |
(21,577,859 | ) | (51,010,220 | ) | (52,629,043 | ) | ||||||
|
|
|
|
|
|
|
|||||||
| Net increase (decrease) in cash |
— | — | — | |||||||||
| Cash—beginning of period |
— | — | — | |||||||||
|
|
|
|
|
|
|
|||||||
| Cash—end of period |
$ | — | $ | — | $ | — | ||||||
|
|
|
|
|
|
|
|||||||
See accompanying notes to financial statements.
55
Table of Contents
NUVEEN LONG/SHORT COMMODITY TOTAL RETURN FUND
NOTES TO FINANCIAL STATEMENTS
December 31, 2015
1. Organization
Fund Information
The Nuveen Long/Short Commodity Total Return Fund (the “Fund”) was organized as a Delaware statutory trust on May 25, 2011, to operate as a commodity pool. Nuveen Commodities Asset Management, LLC, the Fund’s manager (“NCAM” or the “Manager”), is a Delaware limited liability company registered as a commodity pool operator with the Commodity Futures Trading Commission (the “CFTC”) and is a member of the National Futures Association (the “NFA”). The Fund commenced operations on October 25, 2012, with its initial public offering of 18,800,000 shares. The Fund operates pursuant to an Amended and Restated Trust Agreement dated September 14, 2012 (the “Trust Agreement”). The Fund’s shares represent units of fractional undivided beneficial interest in, and ownership of, the Fund. The Fund’s shares trade on the NYSE MKT under the ticker symbol “CTF.” The Fund is not a mutual fund, a closed-end fund, or any other type of “investment company” within the meaning of the Investment Company Act of 1940, as amended, and is not subject to regulation thereunder.
Proposed Conversion to Exchange-Traded Fund (“ETF”) Structure
On December 19, 2014, the Fund issued a press release announcing that the Manager had approved a plan to convert the Fund (the “Conversion”) into an open-ended ETF. On May 15, 2015, shareholders of the Fund approved amendments to the Fund’s Declaration of Trust that are necessary to complete the Conversion. To facilitate the Conversion, on July 9, 2015, the Fund filed a registration statement with the Securities and Exchange Commission (the “SEC”) to register common shares that may be issued from time to time after the Conversion. As of December 31, 2015 the Conversion remains subject to the receipt of certain regulatory approvals.
In connection with the Conversion, the Manager intends to implement a number of additional changes to the Fund that the Manager believes will better align a number of the Fund’s features with its newly-adopted ETF structure, including a reduction of the management fee, and changes to the Fund’s investment strategy, name and distribution policy. None of these expected changes have been finalized, and they remain subject to further revision by the Manager. In addition, following the Conversion, the Manager will continue to have the ability, without shareholder approval, to make subsequent changes to the operation of the Fund.
On March 2, 2016 (subsequent to the Fund’s fiscal year end), the Fund announced an update on the expected time frame for the Conversion. Assuming receipt of certain regulatory approval, the Conversion is expected to be completed in the second quarter of 2016. The Conversion requires regulatory clearance, including the adoption of a new exchange rule pursuant to which the Fund’s shares will trade following the Conversion. The Fund has been working with the NYSE MKT, which has initiated the rule making process for the new rule, which will ultimately require approval by the SEC. There can be no assurance that such clearance will be obtained, or if obtained, that the Conversion will be completed in the anticipated time frame.
The Fund is not currently, and after the Conversion will not be, a mutual fund or any other type of investment company within the meaning of 1940 Act. Until the Conversion occurs, the Fund will continue to operate as currently structured.
Investment Adviser
The Manager has selected its affiliate, Gresham Investment Management LLC (“Gresham LLC”), acting through its Near Term Active division (in that capacity, “Gresham” or the “Commodity Sub-adviser”), to manage
56
Table of Contents
NUVEEN LONG/SHORT COMMODITY TOTAL RETURN FUND
NOTES TO FINANCIAL STATEMENTS (Continued)
December 31, 2015
1. Organization (Continued)
the Fund’s commodity investment strategy and its options strategy. Gresham LLC is a Delaware limited liability company, the successor to Gresham Investment Management, Inc., formed in July 1992. Gresham LLC is registered with the CFTC as a commodity trading adviser and commodity pool operator, is a member of the NFA and is registered with the Securities and Exchange Commission as an investment adviser.
The Manager has selected its affiliate, Nuveen Asset Management, LLC (“Nuveen Asset Management” or the “Collateral Sub-adviser”), to manage the Fund’s collateral invested in cash equivalents, U.S. government securities and other short-term, high grade debt securities. Nuveen Asset Management is a Delaware limited liability company and is registered with the SEC as an investment adviser.
The Manager, the Commodity Sub-adviser and the Collateral Sub-adviser are subsidiaries of Nuveen Investments, Inc. (“Nuveen Investments”). Nuveen Investments is a subsidiary of TIAA.
Investment Objectives and Principal Investment Strategies
The Fund’s investment objective is to generate attractive total returns. The Fund is actively managed and seeks to outperform its benchmark, the Morningstar® Long/Short Commodity IndexSM (the “Index”). In pursuing its investment objective, the Fund will invest directly in a diverse portfolio of exchange-traded commodity futures contracts that represent the main commodity sectors and are among the most actively traded futures contracts in the global commodity markets. Generally, individual commodity futures positions may be either long, short, or flat, depending upon market conditions. The Fund’s Commodity Sub-adviser uses a rules-based approach to determine the commodity futures contracts in which the Fund will invest, their respective weightings, and whether the futures positions in each commodity are held long, short or flat. The Fund’s commodity investments will, at all times, be fully collateralized. The Fund is not leveraged, and the notional amount of its combined long, short and flat futures positions will not exceed 100% of the Fund’s net assets. The Fund will also employ a commodity option writing strategy that seeks to produce option premiums for the purpose of enhancing the Fund’s risk-adjusted total return over time. Fund assets that are not committed as margin to the Fund’s clearing broker will be invested by the Collateral Sub-adviser in cash equivalents, U.S. government securities and other short-term, high grade debt securities.
2. Summary of Significant Accounting Policies
The Fund follows accounting and reporting guidance under Financial Accounting Standards Board (FASB) Accounting Standards Codification (ASC) Topic 946 “Financial Services-Investment Companies.” The following is a summary of significant accounting policies followed by the Fund in the preparation of its financial statements in accordance with accounting principles generally accepted in the United States (“U.S. GAAP”).
Basis of Accounting
The accompanying financial statements have been prepared in conformity with U.S. GAAP. The preparation of financial statements in conformity with U.S. GAAP requires management to make certain estimates and assumptions that affect the reported amounts of assets and liabilities and disclosures of contingent assets and liabilities at the date of the financial statements and the reported amounts of increases and decreases in net assets from operations during the reporting period. Actual results could differ from those estimates.
Futures Contracts
The Fund invests in commodity futures contracts. Upon execution of a futures contract, the Fund is obligated to deposit cash or eligible securities, also known as “initial margin,” into an account at its clearing
57
Table of Contents
NUVEEN LONG/SHORT COMMODITY TOTAL RETURN FUND
NOTES TO FINANCIAL STATEMENTS (Continued)
December 31, 2015
2. Summary of Significant Accounting Policies (Continued)
broker. Generally investments in futures contracts also obligate the investor and the clearing broker to settle monies on a daily basis representing changes in the prior days “mark-to-market” of the open contracts. If the Fund has unrealized appreciation the clearing broker would credit the Fund’s account with an amount equal to appreciation and conversely if the Fund has unrealized depreciation the clearing broker would debit the Fund’s account with an amount equal to depreciation. These daily cash settlements are also known as “variation margin.” In lieu of posting variation margin daily, the Fund has deposited cash with the clearing broker an amount generally representing approximately twice the required initial margin to cover the initial margin and the daily changes in the market value of its futures investments. Cash held by the clearing broker to cover both margin requirements on open futures contracts is recognized as “Deposits with brokers” on the Statements of Financial Condition.
During the period the futures contract is open, changes in the value of the contract are recognized as an unrealized gain or loss by “marking-to-market” on a daily basis to reflect the changes in market value of the contract, which are recognized as a component of “Unrealized appreciation or depreciation on futures contracts” on the Statements of Financial Condition and “Change in net unrealized appreciation (depreciation) of futures contracts” on the Statements of Operations. When the contract is closed, the Fund records a realized gain or loss equal to the difference between the value of the contract on the closing date and the value of the contract when originally entered into, which is recognized as a component of “Net realized gain (loss) from futures contracts” on the Statements of Operations.
Risks of investments in commodity futures contracts include possible adverse movement in the price of the commodities underlying the contracts, the possibility that there may not be a liquid secondary market for the contracts and the possibility that a change in the value of the contract may not correlate with a change in the value of the underlying commodities.
The average number of long and short futures contracts outstanding during the years ended December 31, 2015 and December 31, 2014 was as follows:
| Year Ended December 31, 2015 |
Year Ended December 31, 2014 |
|||||||
| Average number of long and short futures contracts outstanding* |
3,782 | 4,894 | ||||||
|
|
|
|
|
|||||
| * | The average number of contracts is calculated based on the absolute aggregate number of contracts outstanding at the beginning of the year and at the end of each quarter within the current period. |
Refer to Note 3—Derivative Instruments and Hedging Activities within these Notes to Financial Statements for further details on futures contracts activity.
Options Contracts
The Fund may write (sell) and purchase options on commodity futures contracts to enhance the Fund’s risk-adjusted total return. When the Fund writes an option, an amount equal to the premium received is recognized as a component of “Options written, at value” on the Statements of Financial Condition and is subsequently adjusted to reflect the current value of the written option until the option expires or the Fund enters into a closing purchase transaction. The changes in value of the options written during the reporting period are recognized as a component of “Change in net unrealized appreciation (depreciation) of options written” on the Statements of Operations. When an option is exercised or expires, or the Fund enters into a closing purchase transaction, the
58
Table of Contents
NUVEEN LONG/SHORT COMMODITY TOTAL RETURN FUND
NOTES TO FINANCIAL STATEMENTS (Continued)
December 31, 2015
2. Summary of Significant Accounting Policies (Continued)
difference between the net premium received and any amount paid at expiration or on executing a closing purchase transaction is recognized as a component of “Net realized gain (loss) from options written” on the Statements of Operations. The Fund, as writer of an option, has no control over whether the underlying instrument may be sold (called) and as a result bears the risk of an unfavorable change in the market value of the instrument underlying the written option. There is also the risk the Fund may not be able to enter into a closing transaction because of an illiquid market. During the year ended December 31, 2015 and December 31, 2014, the Fund wrote call and put options on futures contracts.
The Fund did not purchase options on futures contracts during the year ended December 31, 2015 and December 31, 2014. The purchase of options involves the risk of loss of all or part of the cash paid for the options (the premium). The market risk associated with purchasing options is limited to the premium paid. The counterparty credit risk of purchasing options, however, needs to take into account the current value of the option, as this is the performance expected from the counterparty.
Transactions in both call and put options written during the years ended December 31, 2015 and December 31, 2014, were as follows:
| Year Ended December 31, 2015 |
Year Ended December 31, 2014 |
|||||||||||||||
| Number of Contracts |
Premiums Received |
Number of Contracts |
Premiums Received |
|||||||||||||
| Outstanding, beginning of period |
597 | $ | 2,636,904 | 1,029 | $ | 4,635,134 | ||||||||||
| Options written |
4,982 | 18,059,094 | 6,301 | 24,701,944 | ||||||||||||
| Options terminated in closing purchase transactions |
(1,872 | ) | (7,032,710 | ) | (1,276 | ) | (5,507,366 | ) | ||||||||
| Options expired |
(701 | ) | (1,206,726 | ) | (1,523 | ) | (3,741,042 | ) | ||||||||
| Options exercised |
(2,301 | ) | (10,133,222 | ) | (3,934 | ) | (17,451,766 | ) | ||||||||
|
|
|
|
|
|
|
|
|
|||||||||
| Outstanding, end of the period |
705 | $ | 2,323,340 | 597 | $ | 2,636,904 | ||||||||||
|
|
|
|
|
|
|
|
|
|||||||||
The average number of both call and put options written outstanding during the years ended December 31, 2015 and December 31, 2014, was as follows:
| Year Ended December 31, 2015 |
Year Ended December 31, 2014 |
|||||||
| Average number of options written outstanding* |
704 | 891 | ||||||
|
|
|
|
|
|||||
| * | The average number of contracts is calculated based on the outstanding number of contracts at the beginning of the year and at the end of each quarter within the current period. |
Refer to Note 3—Derivative Instruments and Hedging Activities within these Notes to Financial Statements for further details on options activity.
Netting Agreements
In the ordinary course of business, the Fund has entered into transactions subject to enforceable master repurchase agreements or other similar arrangements (“netting agreements”). Generally, the right to offset in netting agreements allows the Fund to offset any exposure to a specific counterparty with any collateral received
59
Table of Contents
NUVEEN LONG/SHORT COMMODITY TOTAL RETURN FUND
NOTES TO FINANCIAL STATEMENTS (Continued)
December 31, 2015
2. Summary of Significant Accounting Policies (Continued)
or delivered to that counterparty based on the terms of the agreements. The Fund manages its cash collateral and securities collateral on a counterparty basis. As of December 31, 2015 and December 31, 2014, the Fund was not invested in any portfolio securities or derivatives, other than the repurchase agreements further described below, that are subject to netting agreements.
Repurchase Agreements
In connection with transactions in repurchase agreements, it is the Fund’s policy that its custodian take possession of the underlying collateral securities, the fair value of which exceeds the principal amount of the repurchase transaction, including accrued interest, at all times. If the counterparty defaults, and the fair value of the collateral declines, realization of the collateral may be delayed or limited.
The following tables present the repurchase agreements for the Fund, presented on the Statements of Financial Condition as of December 31, 2015 and December 31, 2014, and recognized as a component of “Short-term investments, at value,” that are subject to netting agreements as of the end of each reporting period, and the collateral delivered related to those repurchase agreements.
| December 31, 2015 | ||||||||||||||||
| Counterparty | Short-Term Investments, at Value |
Collateral Pledged (From) Counterparty* |
Net Exposure |
|||||||||||||
| Repurchase Agreements |
State Street Bank | $ | 1,293,949 | $ | (1,293,949 | ) | $ | — | ||||||||
|
|
|
|
|
|
|
|||||||||||
| December 31, 2014 | ||||||||||||||||
| Counterparty | Short-Term Investments, at Value |
Collateral Pledged (From) Counterparty* |
Net Exposure |
|||||||||||||
| Repurchase Agreements |
State Street Bank | $ | 1,007,169 | $ | (1,007,169 | ) | $ | — | ||||||||
|
|
|
|
|
|
|
|||||||||||
| * | As of December 31, 2015 and December 31, 2014, the value of the collateral pledged from the counterparty exceeded the value of the repurchase agreements. The value of the collateral pledged from the counterparty as of December 31, 2015 and December 31, 2014 was $ 1,321,469 and $1,029,007, respectively. |
Collateral Investments
Currently, approximately 15% of the Fund’s net assets are committed to secure the Fund’s futures contract positions. These assets are placed in a commodity futures account maintained by the Fund’s clearing broker, and are held in high-quality instruments permitted under CFTC regulations.
The Fund’s remaining assets are held in a separate collateral investment account managed by the Collateral Sub-adviser. The Fund’s assets held in the separate collateral account are invested in cash equivalents, U.S. government securities and other high-quality short-term debt securities with final terms not exceeding one year at the time of investment. The collateral portfolio’s debt securities (other than U.S. government securities) are rated at the highest applicable rating as determined by at least one nationally recognized statistical rating organization, or if unrated, judged by the Collateral Sub-adviser to be of comparable quality.
60
Table of Contents
NUVEEN LONG/SHORT COMMODITY TOTAL RETURN FUND
NOTES TO FINANCIAL STATEMENTS (Continued)
December 31, 2015
2. Summary of Significant Accounting Policies (Continued)
Investment Valuation
Commodity futures contracts and options on commodity futures contracts traded on an exchange are valued at the final settlement price or official closing price as determined by the principal exchange on which the instruments are traded as supplied by independent pricing services. These investments are generally classified as Level 1 for fair value measurement purposes. Over-the-counter commodity futures contracts and options on commodity futures contracts not traded on an exchange are valued, in order of hierarchy, by independent pricing services, price quotations obtained from counterparty broker-dealers, or through fair valuation methodologies as determined by the Manager. These investments are generally classified as Level 2. Additionally, events may occur after the close of the market, but prior to the determination of the Fund’s net asset value, that may affect the values of the Fund’s investments. In such circumstances, the Manager determines a fair valuation for such investments that in its opinion is reflective of fair market value. These investments are generally classified as Level 2 or Level 3 depending on the priority of the significant inputs.
Prices of fixed-income securities, including, but not limited to, highly-rated agency discount notes and U.S. Treasury bills, are provided by a pricing service approved by the Fund’s Manager. These securities are generally classified as Level 2. The pricing service establishes a security’s fair value using methods that may include consideration of the following: yields or prices of investments of comparable quality, type of issue, coupon, maturity and rating, market quotes or indications of value from security dealers, general market conditions and other information and analysis, including the obligor’s credit characteristics considered relevant. These securities are generally classified as Level 2 or Level 3 depending on the priority of the significant inputs.
Repurchase agreements are valued at contract amount plus accrued interest, which approximates market value. These securities are generally classified as Level 2.
Fair Value Measurements
Fair value is defined as the price that the Fund would receive upon selling an investment or transferring a liability in an orderly transaction to an independent buyer in the principal or most advantageous market for the investment. A three-tier hierarchy is used to maximize the use of observable market data and minimize the use of unobservable inputs and to establish classification of fair value measurements for disclosure purposes. Observable inputs reflect the assumptions market participants would use in pricing the asset or liability. Observable inputs are based on market data obtained from sources independent of the reporting entity. Unobservable inputs reflect the reporting entity’s own assumptions about the assumptions market participants would use in pricing the asset or liability. Unobservable inputs are based on the best information available in the circumstances. The following is a summary of the three-tier hierarchy of valuation inputs.
Level 1—Inputs are unadjusted and prices are determined by quoted prices in active markets for identical securities.
Level 2—Prices are determined using other significant observable inputs (including quoted prices for similar securities, interest rates, prepayment speeds, credit risk, etc.).
Level 3—Prices are determined using significant unobservable inputs (including management’s assumptions in determining the fair value of investments).
61
Table of Contents
NUVEEN LONG/SHORT COMMODITY TOTAL RETURN FUND
NOTES TO FINANCIAL STATEMENTS (Continued)
December 31, 2015
2. Summary of Significant Accounting Policies (Continued)
The inputs or methodologies used for valuing securities are not an indication of the risks associated with investing in those securities. The following is a summary of the Fund’s fair value measurements as of December 31, 2015 and December 31, 2014:
| December 31, 2015 | ||||||||||||||||
| Level 1 | Level 2 | Level 3 | Total | |||||||||||||
| Short-Term Investments: |
||||||||||||||||
| U.S. Government and Agency Obligations |
$ | — | $ | 228,580,099 | $ | — | $ | 228,580,099 | ||||||||
| Repurchase Agreements |
— | 1,293,949 | — | 1,293,949 | ||||||||||||
| Investments in Derivatives: |
||||||||||||||||
| Futures Contracts* |
2,551,944 | — | — | 2,551,944 | ||||||||||||
| Options Written |
(2,283,151 | ) | — | — | (2,283,151 | ) | ||||||||||
|
|
|
|
|
|
|
|
|
|||||||||
| Total |
$ | 268,793 | $ | 229,874,048 | $ | — | $ | 230,142,841 | ||||||||
|
|
|
|
|
|
|
|
|
|||||||||
| December 31, 2014 | ||||||||||||||||
| Level 1 | Level 2 | Level 3 | Total | |||||||||||||
| Short-Term Investments: |
||||||||||||||||
| U.S. Government and Agency Obligations |
$ | — | $ | 248,868,176 | $ | — | $ | 248,868,176 | ||||||||
| Repurchase Agreements |
— | 1,007,169 | — | 1,007,169 | ||||||||||||
| Investments in Derivatives: |
||||||||||||||||
| Futures Contracts* |
2,696,414 | — | — | 2,696,414 | ||||||||||||
| Options Written |
(2,561,321 | ) | — | — | (2,561,321 | ) | ||||||||||
|
|
|
|
|
|
|
|
|
|||||||||
| Total |
$ | 135,093 | $ | 249,875,345 | $ | — | $ | 250,010,438 | ||||||||
|
|
|
|
|
|
|
|
|
|||||||||
| * | Represents the net unrealized appreciation (depreciation) on futures contracts as reported on the Statements of Financial Condition. |
The Manager is responsible for the Fund’s valuation process and has delegated daily oversight of the process to the Manager’s Valuation Committee. The Valuation Committee, pursuant to its valuation policies and procedures, is responsible for making fair value determinations, evaluating the effectiveness of the Fund’s pricing policies, and reporting to the Manager’s senior management. The Valuation Committee is aided in its efforts by the Manager’s Securities Valuation Team, which is responsible for administering the daily valuation process and applying fair value methodologies as approved by the Valuation Committee. When determining the reliability of independent pricing services for investments owned by the Fund, the Valuation Committee, among other things, conducts due diligence reviews of the pricing services and monitors the quality of security prices received through various testing reports conducted by the Securities Valuation Team.
For each portfolio instrument that has been fair valued pursuant to the Valuation Committee’s policies, the fair value price is compared against the last available and next available market quotations. The Valuation Committee reviews the results of such testing and fair valuation occurrences are reported to the Manager’s senior management.
62
Table of Contents
NUVEEN LONG/SHORT COMMODITY TOTAL RETURN FUND
NOTES TO FINANCIAL STATEMENTS (Continued)
December 31, 2015
2. Summary of Significant Accounting Policies (Continued)
Investment Transactions
Investment transactions are recorded on a trade date basis. Realized gains and losses from investment transactions are determined on the specific identification method, which is the same for federal income tax purposes.
Investment Income
Interest income, which reflects the amortization of premiums and includes accretion of discounts for financial reporting purposes, is recorded on an accrual basis.
Brokerage Commissions and Fees
The Fund pays brokerage commissions, including applicable clearing costs, exchange fees, NFA fees, give-up fees, pit brokerage fees and other transaction-related fees and expenses, incurred in connection with its commodity trading activities.
Income Taxes
No provision for federal, state, and local income taxes has been made in the accompanying financial statements because the Fund has elected to be classified as a partnership for U.S. federal income tax purposes. Each owner of the Fund’s shares will be required to take into account its allocable share of the Fund’s income, gains, losses, deductions and other items for the Fund’s taxable year.
For all open tax years and all major taxing jurisdictions, the Manager of the Fund has concluded that there are no significant uncertain tax positions that would require recognition in the financial statements. Open tax years are those that are open for examination by taxing authorities (i.e., generally the last four tax year ends and the interim tax period since then). Furthermore, the Manager of the Fund is also not aware of any tax positions for which it is reasonably possible that the total amounts of unrecognized tax benefits will significantly change in the next twelve months.
Expense Recognition
All expenses of the Fund are recognized on an accrual basis. The Fund pays all routine and extraordinary costs and expenses of its operations, brokerage expenses, custody fees, transfer agent expenses, professional fees, expenses of preparing, printing and distributing reports, notices, information statements, proxy statements, reports to governmental agencies, and taxes, if any.
In connection with the Conversion described previously, the Fund has incurred certain costs and expenses. Such amounts are recognized as a component of “Accrued other expenses” on the Statements of Financial Condition and “Conversion expenses” on the Statements of Operations.
Calculation of Net Asset Value
The net asset value per share of the Fund on any given day is computed by dividing the value of all assets of the Fund (including any accrued interest), less all liabilities (including accrued expenses and distributions declared but unpaid), by the total number of shares outstanding.
63
Table of Contents
NUVEEN LONG/SHORT COMMODITY TOTAL RETURN FUND
NOTES TO FINANCIAL STATEMENTS (Continued)
December 31, 2015
2. Summary of Significant Accounting Policies (Continued)
Distributions
The Fund intends to make regular monthly distributions to its shareholders stated in terms of a fixed cents per share distribution rate. Among other factors, the Manager seeks to establish a distribution rate that roughly corresponds to its projections of the total return that could reasonably be expected to be generated by the Fund over an extended period of time. In the event that the amount of income earned or capital gains realized by the Fund is not sufficient to cover the Fund’s distributions, the Fund may be required to liquidate investments to fund distributions at times or on terms that are disadvantageous to the Fund and its shareholders. As market conditions and portfolio performance may change, the rate of distribution on the shares and the Fund’s distribution policy could change. The Manager reserves the right to change the Fund’s distribution policy and the basis for establishing the rate of the Fund’s monthly distributions, or may temporarily suspend or reduce distributions without a change in policy, at any time and may do so without prior notice to shareholders.
Distributions to shareholders are recorded on the ex-dividend date.
During the year ended December 31, 2015, the Fund’s monthly per share distribution rate decreased from $0.135 to $0.119 effective with the distribution payable March 2, 2015, from $0.119 to $0.100 effective with the distribution payable August 3, 2015, and from $0.100 to $0.090 with the distribution payable December 31, 2015.
Commitments and Contingencies
Under the Fund’s organizational documents, the Manager, Wilmington Trust Company (the Fund’s Delaware trustee) and the Manager’s Independent Committee members are indemnified against certain liabilities arising out of the performance of their duties to the Fund. In addition, in the normal course of business, the Fund enters into contracts that provide general indemnifications to other parties. The Fund’s maximum exposure under these arrangements is unknown, as this would involve future claims that may be made against the Fund that have not yet occurred. However, the Fund has not had prior claims or losses pursuant to these contracts and believes the risk of loss to be remote.
Financial Instrument Risk
The Fund utilizes commodity futures and options, whose values are based upon an underlying asset and generally represent future commitments that have a reasonable possibility of being settled in cash or through physical delivery. As of December 31, 2015 and December 31, 2014, the financial instruments held by the Fund were traded on an exchange and are standardized contracts.
Market risk is the potential for changes in the value of the financial instruments traded by the Fund due to market changes, including fluctuations in commodity prices. Investing in commodity futures contracts involves the Fund entering into contractual commitments to purchase or sell a particular commodity at a specified date and price. The market risk associated with the Fund’s commitments to purchase commodities will be limited to the gross or face amount of the contracts held. The Fund’s exposure to market risk may be influenced by a number of factors, including changes in international balances of payments and trade, currency devaluations and revaluations, changes in interest and foreign currency exchange rates, price volatility of commodity futures contracts and market liquidity, weather, geopolitical events and other factors. These factors also affect the Fund’s investments in options on commodity futures contracts. The inherent uncertainty of the Fund’s investments as well as the development of drastic market occurrences could ultimately lead to a loss of all, or substantially all, of investors’ capital.
64
Table of Contents
NUVEEN LONG/SHORT COMMODITY TOTAL RETURN FUND
NOTES TO FINANCIAL STATEMENTS (Continued)
December 31, 2015
2. Summary of Significant Accounting Policies (Continued)
Credit risk is the possibility that a loss may occur due to failure of a counterparty performing according to the terms of the futures and option contracts. The Fund may be exposed to credit risk from its investments in commodity futures contracts and options on commodity futures contracts resulting from the clearing house associated with a particular exchange failing to meet its obligations to the Fund. In general, clearing houses are backed by their corporate members who may be required to share in the financial burden resulting from the nonperformance of one of their members, which should significantly reduce this credit risk. In cases where the clearing house is not backed by the clearing members (i.e., as in some foreign exchanges), it may be backed by a consortium of banks or other financial institutions. There can be no assurance that any counterparty, clearing member or clearing house will meet its obligations to the Fund.
The Fund is subject to short exposure when it sells short a futures contract or writes a put option. Short sales are transactions in which the Fund initiates a position by selling a futures contract short. A short futures position allows the short seller to profit from declines in the price of the underlying commodity to the extent such declines exceed the transaction costs. In a short sale transaction, the Fund must deliver the underlying commodity at the contract price to a buyer of the contract who stands for delivery under the rules of the exchange that lists the contract or must offset the contract by entering into an opposite and offsetting transaction in the market. Likewise, the writer of a call option is required to deliver the underlying futures contract at the strike price or offset the option by entering into an opposite and offsetting transaction in the market. The price at such time may be higher or lower than the price at which the futures contract was sold short or the strike price of the call option when the option was written. If the underlying price of the futures contract goes down between the time that the Fund sells the contract short and offsets the contract, the Fund will realize a gain on the transaction. If the price of the underlying futures contract drops below the strike price of the call option written, the option will expire worthless and the Fund also will realize a gain to the extent of the option premium received. Conversely, if the price of the underlying short futures contract goes up during the period, the Fund will realize a loss on the transaction. If the price of the underlying futures contract is higher than the strike price of a call option written, the option will become in-the-money and the Fund may realize a loss less any premium received for writing the option. A short sale creates the risk of an unlimited loss since the price of the underlying commodity in a futures contract or the underlying futures contract in a call option written could theoretically increase without limit, thus increasing the cost of covering the short positions. In circumstances where a market has reached its maximum price limits imposed by the exchange, the short seller may be unable to offset its short position until the next trading day, when prices could increase again in rapid trading.
The commodity markets have volatility risk. The commodity markets have experienced periods of extreme volatility. General market uncertainty and consequent repricing risk have led to market imbalances of sellers and buyers, which in turn have resulted in significant reductions in values of a variety of commodities. Similar future market conditions may result in rapid and substantial valuation increases or decreases in the Fund’s holdings. In addition, volatility in the commodity and securities markets may directly and adversely affect the setting of distribution rates on the Fund’s shares.
3. Derivative Instruments and Hedging Activities
The Fund records derivative instruments at fair value, with changes in fair value recognized on the Statements of Operations.
65
Table of Contents
NUVEEN LONG/SHORT COMMODITY TOTAL RETURN FUND
NOTES TO FINANCIAL STATEMENTS (Continued)
December 31, 2015
3. Derivative Instruments and Hedging Activities (Continued)
The following tables present the fair value of all derivative instruments held by the Fund as of December 31, 2015 and December 31, 2014, the location of these instruments on the Statements of Financial Condition and the primary underlying risk exposure.
| December 31, 2015 |
||||||||||||||
|
Location on the Statements of Financial Condition |
||||||||||||||
| Underlying Risk Exposure |
Derivative Instrument |
Asset Derivatives |
Liability Derivatives |
|||||||||||
| Location | Value | Location | Value | |||||||||||
| Commodity |
Futures Contracts | Unrealized appreciation on futures contracts | $ | 3,698,613 | Unrealized depreciation on futures contracts | $ | 1,146,669 | |||||||
| Commodity |
Call Options | — | — | Options written, at value | 160,940 | |||||||||
| Commodity |
Put Options | — | — | Options written, at value | 2,122,211 | |||||||||
| Total |
$ | 3,698,613 | $ | 3,429,820 | ||||||||||
| December 31, 2014 |
||||||||||||||
| Location on the Statements of Financial Condition |
||||||||||||||
| Underlying Risk Exposure |
Derivative Instrument |
Asset Derivatives |
Liability Derivatives |
|||||||||||
| Location | Value | Location | Value | |||||||||||
| Commodity |
Futures Contracts |
Unrealized appreciation on futures contracts | $ | 3,601,270 | Unrealized depreciation on futures contracts | $ | 904,856 | |||||||
| Commodity |
Call Options | — | — | Options written, at value | 273,834 | |||||||||
| Commodity |
Put Options | — | — | Options written, at value | 2,287,487 | |||||||||
| Total |
$ | 3,601,270 | $ | 3,466,177 | ||||||||||
The following table presents the amount of net realized gain (loss) and change in net unrealized appreciation (depreciation) recognized on derivative instruments during the years ended December 31, 2015, December 31, 2014 and December 31, 2013, the location of these instruments on the Statements of Operations and the primary underlying risk exposure.
| Commodity Risk Exposure | Year Ended December 31, 2015 |
Year Ended December 31, 2014 |
Year Ended December 31, 2013 |
|||||||||
| Net realized gain (loss) from: |
||||||||||||
| Futures contracts |
$ | (9,480,921 | ) | $ | (35,085,916 | ) | $ | (41,169,967 | ) | |||
| Options written (call options) |
1,516,368 | 15,787,488 | 16,377,174 | |||||||||
| Options written (put options) |
10,760,637 | 5,915,429 | 14,125,620 | |||||||||
| Change in net unrealized appreciation (depreciation) of: |
||||||||||||
| Futures contracts |
$ | (144,470 | ) | $ | (2,198,050 | ) | $ | 8,150,119 | ||||
| Options written (call options) |
(61,528 | ) | 52,372 | (1,210,924 | ) | |||||||
| Options written (put options) |
26,134 | 420,558 | (468,719 | ) | ||||||||
66
Table of Contents
NUVEEN LONG/SHORT COMMODITY TOTAL RETURN FUND
NOTES TO FINANCIAL STATEMENTS (Continued)
December 31, 2015
4. Related Parties
The Manager, the Commodity Sub-adviser and the Collateral Sub-adviser are considered to be related parties to the Fund.
For the services and facilities provided by the Manager, the Fund pays the Manager an annual management fee, payable monthly, based on the Fund’s average daily net assets, according to the following schedule:
| Average Daily Net Assets |
Management Fee | |||
| For the first $500 million |
1.250 | % | ||
| For the next $500 million |
1.225 | |||
| For the next $500 million |
1.200 | |||
| For the next $500 million |
1.175 | |||
| For net assets over $2 billion |
1.150 | |||
“Average daily net assets” represents the total assets of the Fund, minus the sum of its total liabilities.
The Manager and the Fund have entered into sub-advisory agreements with the Commodity Sub-adviser and the Collateral Sub-adviser. Both the Commodity Sub-adviser and the Collateral Sub-adviser are compensated for their services to the Fund from the management fees paid to the Manager, and the Fund does not reimburse the Manager for those fees.
5. Share Repurchase Program
On March 14, 2013, the Fund adopted an open-market share repurchase program, pursuant to which it was authorized to repurchase up to 10% of its outstanding common shares (approximately 1,800,000 shares) in open-market transactions at the Manager’s discretion.
On March 6, 2014, the Fund reauthorized its share repurchase program, pursuant to which it may repurchase up to 10% of its outstanding common shares as of the reauthorization date (approximately 1,775,000 shares) in open-market transactions at the Manager’s discretion.
Transactions in share repurchases during the years ended December 31, 2015, December 31, 2014 and December 31, 2013, were as follows:
| Year Ended December 31, 2015 |
Year Ended December 31, 2014 |
Year Ended December 31, 2013 |
||||||||||
| Shares repurchased |
— | 1,410,000 | 1,045,000 | |||||||||
|
|
|
|
|
|
|
|||||||
| Weighted average price per share repurchased |
— | $ | 14.89 | $ | 16.75 | |||||||
|
|
|
|
|
|
|
|||||||
| Weighted average discount per share repurchased |
— | 19.02 | % | 18.32 | % | |||||||
|
|
|
|
|
|
|
|||||||
67
Table of Contents
NUVEEN LONG/SHORT COMMODITY TOTAL RETURN FUND
NOTES TO FINANCIAL STATEMENTS (Continued)
December 31, 2015
6. Financial Highlights
The following financial highlights relate to investment performance and operations for a Fund share outstanding during the years ended December 31, 2015, December 31, 2014, and December 31, 2013. The Net Asset Value presentation is calculated using average daily shares outstanding. The Ratios to Average Net Assets are calculated using average daily net assets and are annualized for periods less than a full year. The Total Returns at Net Asset Value and Market Value are based on the change in net asset value and market value, respectively, for a share during the period. An investor’s return and ratios will vary based on the timing of purchasing and selling Fund shares.
| Year Ended December 31, | ||||||||||||
| 2015 | 2014 | 2013 | ||||||||||
| Net Asset Value: |
||||||||||||
| Net asset value per share—beginning of period |
$ | 17.94 | $ | 20.52 | $ | 22.72 | ||||||
| Net investment income (loss) |
(0.32 | ) | (0.31 | ) | (0.34 | ) | ||||||
| Net realized and unrealized gain (loss) |
0.15 | (0.87 | ) | (0.21 | ) | |||||||
| Distributions |
(1.32 | ) | (1.70 | ) | (1.86 | ) | ||||||
| Offering costs |
— | — | — | |||||||||
| Discount from shares repurchased |
— | 0.30 | 0.21 | |||||||||
|
|
|
|
|
|
|
|||||||
| Net asset value per share—end of period |
$ | 16.45 | $ | 17.94 | $ | 20.52 | ||||||
|
|
|
|
|
|
|
|||||||
| Market Value: |
||||||||||||
| Market value per share—beginning of period |
$ | 16.60 | $ | 17.22 | $ | 21.22 | ||||||
|
|
|
|
|
|
|
|||||||
| Market value per share—end of period |
$ | 15.54 | $ | 16.60 | $ | 17.22 | ||||||
|
|
|
|
|
|
|
|||||||
| Ratios to Average Net Assets: |
||||||||||||
| Net investment income (loss) |
(1.84 | )% | (1.65 | )% | (1.62 | )% | ||||||
|
|
|
|
|
|
|
|||||||
| Expenses |
2.00 | % | 1.73 | % | 1.73 | % | ||||||
|
|
|
|
|
|
|
|||||||
| Total Returns:(a) |
||||||||||||
| Based on Net Asset Value |
(0.99 | )% | (4.36 | )% | (1.37 | )% | ||||||
|
|
|
|
|
|
|
|||||||
| Based on Market Value |
1.50 | % | 7.27 | % | (10.41 | )% | ||||||
|
|
|
|
|
|
|
|||||||
| (a) | Total Return Based on Net Asset Value is the combination of changes in net asset value per share and the assumed reinvestment of distributions, if any, at net asset value per share on the distribution payment date. The last distribution declared in the period, which is typically paid on the first business day of the following month, is assumed to be reinvested at the net asset value per share at the end of the period. Total returns are not annualized. |
Total Return Based on Market Value is the combination of changes in the market price per share and the assumed reinvestment of distributions, if any, at the ending market price per share on the distribution payment date. The last distribution declared in the period, which is typically paid on the first business day of the following month, is assumed to be reinvested at the ending market price per share at the end of the period. Total returns are not annualized.
68
Table of Contents
NUVEEN LONG/SHORT COMMODITY TOTAL RETURN FUND
NOTES TO FINANCIAL STATEMENTS (Continued)
December 31, 2015
7. Selected Quarterly Financial Data (Unaudited)
The following tables present unaudited quarterly results of operations for the quarters within the years ended December 31, 2015 and December 31, 2014. These quarterly results reflect all normal recurring adjustments that are, in the opinion of management, necessary for a fair statement of the results of the Fund.
| For the Three Months Ended 2015 | ||||||||||||||||
| December 31 | September 30 | June 30 | March 31 | |||||||||||||
| Total investment income |
$ | 152,798 | $ | 119,171 | $ | 123,629 | $ | 48,480 | ||||||||
| Net investment income (loss) |
$ | (1,015,414 | ) | $ | (1,620,212 | ) | $ | (1,336,826 | ) | $ | (1,194,992 | ) | ||||
| Net realized gain (loss) and change in net unrealized appreciation (depreciation) |
$ | 1,906,985 | $ | 1,087,088 | $ | (4,290,518 | ) | $ | 3,825,680 | |||||||
| Net income (loss) |
$ | 891,571 | $ | (533,124 | ) | $ | (5,627,344 | ) | $ | 2,630,688 | ||||||
| Increase (decrease) in net assets |
$ | (3,848,717 | ) | $ | (5,436,885 | ) | $ | (11,462,806 | ) | $ | (3,467,660 | ) | ||||
| Net income (loss) per weighted-average share |
$ | 0.05 | $ | (0.03 | ) | $ | (0.34 | ) | $ | 0.16 | ||||||
| For the Three Months Ended 2014 | ||||||||||||||||
| December 31 | September 30 | June 30 | March 31 | |||||||||||||
| Total investment income |
$ | 63,223 | $ | 64,461 | $ | 73,502 | $ | 77,699 | ||||||||
| Net investment income (loss) |
$ | (1,214,517 | ) | $ | (1,336,033 | ) | $ | (1,430,882 | ) | $ | (1,483,811 | ) | ||||
| Net realized gain (loss) and change in net unrealized appreciation (depreciation) |
$ | (7,736,248 | ) | $ | 1,070,682 | $ | 1,020,901 | $ | (9,509,284 | ) | ||||||
| Net income (loss) |
$ | (8,950,765 | ) | $ | (265,351 | ) | $ | (409,981 | ) | $ | (10,993,095 | ) | ||||
| Increase (decrease) in net assets |
$ | (27,027,089 | ) | $ | (16,085,279 | ) | $ | (8,842,084 | ) | $ | (19,249,560 | ) | ||||
| Net income (loss) per weighted-average share |
$ | (0.54 | ) | $ | (0.02 | ) | $ | (0.02 | ) | $ | (0.62 | ) | ||||
69
Table of Contents
| Item 9. | Changes in and Disagreements with Accountants on Accounting and Financial Disclosure |
None.
| Item 9A. | Controls and Procedures |
Disclosure Controls and Procedures
Under the supervision and with the participation of the principal executive officer and principal financial officer of the Manager of the Fund, the Manager has evaluated the effectiveness of the Fund’s disclosure controls and procedures pursuant to Rules 13a-15(e) and 15d-15(e) under the Exchange Act. Based upon that evaluation, the principal executive officer and principal financial officer concluded that the Fund’s disclosure controls and procedures were effective as of the end of the period covered by this Annual Report to provide reasonable assurance that information required to be disclosed in the reports that the Fund files or submits to the SEC under the Exchange Act is recorded, processed, summarized and reported, within the time periods specified in the applicable rules and forms, and that it is accumulated and communicated to the management of the Manager as appropriate to allow timely decisions regarding required disclosure.
Management’s Annual Report on Internal Control Over Financial Reporting
The Manager is responsible for establishing and maintaining adequate internal control over financial reporting, as defined under Rules 13a-15(f) and 15d-15(f) of the Exchange Act, for the Fund. The Fund’s internal control over financial reporting is a process designed to provide reasonable assurance regarding the reliability of financial reporting and the preparation of financial statements for external purposes in accordance with accounting principles generally accepted in the United States of America. Internal control over financial reporting includes those policies and procedures that: (1) pertain to the maintenance of records that, in reasonable detail, accurately and fairly reflect the transactions and dispositions of the Fund’s assets; (2) provide reasonable assurance that transactions are recorded as necessary to permit preparation of financial statements in accordance with generally accepted accounting principles in the United States of America, and that the Fund’s receipts and expenditures are being made only in accordance with appropriate authorizations; and (3) provide reasonable assurance regarding prevention or timely detection of unauthorized acquisition, use, or dispositions of the Fund’s assets that could have a material effect on the financial statements.
Because of its inherent limitations, internal control over financial reporting may not prevent or detect misstatements, errors, or fraud. Also, projections of any evaluation of effectiveness to future periods are subject to the risk that controls may become ineffective because of changes in conditions, or that the degree of compliance with the policies or procedures may deteriorate.
The principal executive officer and principal financial officer of the Manager assessed the effectiveness of the Fund’s internal control over financial reporting as of December 31, 2015. Their assessment included an evaluation of the design of the Fund’s internal control over financial reporting and testing of the operational effectiveness of their internal control over financial reporting. In making its assessment, the Manager has utilized the criteria set forth by the Committee of Sponsoring Organizations of the Treadway Commission (COSO) in its report entitled Internal Control—Integrated Framework (2013). Based on their assessment and those criteria, the principal executive officer and principal financial officer of the Manager concluded that the Fund maintained effective internal control over financial reporting as of December 31, 2015.
The effectiveness of the Fund’s internal control over financial reporting as of December 31, 2015, has been audited by PricewaterhouseCoopers LLP (“PwC”), the independent registered public accounting firm that audited and reported on the financial statements included in this Annual Report, as stated in their report which is included in “Item 8. Financial Statements and Supplementary Data” of this Annual Report.
70
Table of Contents
Changes in Internal Control over Financial Reporting
There were no changes in the Fund’s internal control over financial reporting (as defined in Rules 13a-15(f) and 15d-15(f) of the Exchange Act) that occurred during the Fund’s last fiscal quarter that have materially affected, or are reasonably likely to materially affect, the Fund’s internal control over financial reporting.
| Item 9B. | Other Information |
None.
71
Table of Contents
PART III
| Item 10. | Directors, Executive Officers and Corporate Governance |
The Fund has no executive officers and does not have any employees. The Fund is managed by the Manager and depends upon the Manager’s services and resources. The Delaware Trustee and the Independent Committee have limited duties and responsibilities to the Fund, as described below.
Trustee
Wilmington Trust Company, a Delaware banking corporation, is the Delaware Trustee of the Fund. The Delaware Trustee is unaffiliated with the Manager. The Delaware Trustee’s duties and responsibilities with respect to the Fund’s management are limited to its express obligations under the Trust Agreement. In particular, the Delaware Trustee will accept service of legal process on the Fund in the State of Delaware and will make certain filings as required under the Delaware Statutory Trust Act, as amended. The rights and duties of the Delaware Trustee, the Independent Committee, the Manager and the shareholders are governed by the provisions of the Delaware Statutory Trust Act and by the Trust Agreement. Except for the limited duties described herein and in the Trust Agreement that are exercised by the Delaware Trustee and the Independent Committee, all duties and responsibilities to manage the business and affairs of the Fund are vested in the Manager, pursuant to the Trust Agreement and the Delaware Statutory Trust Act.
Independent Committee
The Manager has established the Independent Committee, comprised of four members who are unaffiliated with the Manager, which fulfills the audit committee and nominating committee functions for the Fund, as well as any other functions required under the NYSE MKT listing standards or as set forth in the Trust Agreement. The Independent Committee is responsible for the appointment, compensation, retention and oversight of the work of the independent registered public accounting firm engaged by the Fund. The Independent Committee is also responsible for appointing members of the Independent Committee in the event of any vacancy caused by death, resignation or removal and determining their compensation. Other than the responsibilities mandated by the NYSE MKT, the Independent Committee will have only the limited authority and responsibilities as set forth under the Trust Agreement.
The persons listed below have been appointed by the Manager as members of the Independent Committee. The names of the members of the Independent Committee, their principal occupations and other affiliations during the past five years, and other directorships they hold are set forth below. The information listed below for each member of the Independent Committee includes the experiences, qualifications, attributes and skills that led to the conclusion that each member of the Independent Committee should serve as such.
Christopher A. Cotter. Mr. Cotter (age 56) is President and Founder of CAC Capital Advisory, LLC where he serves as a consultant to financial services firms and to boutique investment banks from 2015 to present and from 2009 to 2011. From 2011 to 2015, Mr. Cotter was a Managing Director at River Branch Capital, where he was responsible for originating and executing transactions in a financial advisory and merchant banking capacity. Prior to founding CAC Capital Advisory in 2009, Mr. Cotter was a 20-year veteran of William Blair & Company, serving as Principal in the Financial Services Group from 1994 to 2009 and Associate from 1989 to 1993. Mr. Cotter worked on a full range of capital markets transactions, including mergers and acquisitions, private equity placements and public equity offerings for financial institutions. From 1987 to 1989, Mr. Cotter worked as an investment banking associate at Goldman Sachs in New York. Prior to this, he was a Certified Public Accountant at Price Waterhouse in Dallas, Texas since 1981. He earned a Bachelor of Science in Finance from the University of Illinois and holds an MBA from Harvard Business School. Mr. Cotter holds the Series 7, 24, and 63 FINRA licenses.
72
Table of Contents
Jon C. Hunt. Mr. Hunt (age 64) retired in March 2013 from Convergent Capital Management, a multi-boutique asset management company, where he served as Managing Director and Chief Operating Officer from February 1998 through June 2012. He was involved in all management and acquisition activities and primarily responsible for post-acquisition affiliate support, including strategy design and execution, marketing, financial management, operations, governance, and compliance. Mr. Hunt serves as Trustee for the Advisors Inner Circle III Funds and related funds (since February 2014) sponsored by SEI Corporation. Mr. Hunt also serves as trustee (since March 2013) for City National Rochdale Funds, a proprietary fund complex. Prior to serving as trustee for City National Rochdale Funds, he worked as business manager for those Funds, responsible for negotiating contracts, board interaction and advisor/sub-advisor oversight. Prior to joining Convergent Capital, Mr. Hunt worked for the Northern Trust Company from 1973 to 1998. His most recent role was Senior Vice President in the Corporate and Institutional Services group, responsible for product development, product management, and marketing for Northern Trust Global Investments (“NTGI”). Prior to this role, Mr. Hunt was responsible for NTGI Investment Products and Sales and served as the leader of Treasury Management Product Management, Marketing, Production and Servicing. He earned a Bachelor of Arts in Economics from Northwestern University, and an MBA from Kellogg Graduate School of Management.
L. Joe Moravy. Mr. Moravy (age 65) is an independent consultant. From March 2010 to February 2014, he was a Managing Director with Finance Scholars Group, a boutique consulting firm providing litigation support services. From 2008 to March 2010, Mr. Moravy was a Managing Director at LJM Advisory Services, providing audit and accounting related litigation support services. From June 2002 to October 2008, Mr. Moravy was a Partner at Ernst & Young LLP in the Financial Services Practice, providing Assurance and Advisory Services to public and private financial services companies. Prior to Ernst & Young, Mr. Moravy was a Partner from 1987 to 2002 and Audit Professional from 1974 to 1987 at Arthur Andersen LLP. In this role, he provided audit services to public and private financial services companies, as well as advisory services related to derivatives and treasury risk management. Since 2008, Mr. Moravy is a trustee on the board of AQR Funds, where he is the designated financial expert, as well as the Chair of the Audit Committee and member of the Nominating & Governance Committee. Mr. Moravy earned a Bachelor of Science in Business Administration (Economics concentration) from Michigan Technological University in 1972 and an MBA (Accounting concentration) from the University of Michigan in 1974. Mr. Moravy is a Certified Public Accountant in Illinois since 1975. He serves as a Life Trustee of the Michigan Tech Fund and is a member of the American Institute of Certified Public Accountants, Illinois CPA Society and the Independent Directors Council of the Investment Company Institute.
Harry W. Short. Mr. Short (age 68) retired in April 2005 from a fifteen year career (since January 1990) at The Northern Trust Corporation and The Northern Trust Company, where he served most recently as Executive Vice President and Controller, responsible for all corporate-wide accounting and tax matters, and Sarbanes-Oxley 404 internal controls compliance. He was the Chairman of the Profit Improvement Committee, member of the Corporate Risk Compliance and Credit Policy Committees, and was primary liaison with the Audit Committee of the Board of Directors. Prior to his career at Northern Trust, Mr. Short was a Partner in the Financial Services Practice at the international accounting firm KPMG, where he served from 1969 through 1990, focusing on audit, due diligence, and relationship management for banking and financial services clients. Mr. Short was a Certified Public Accountant in Illinois, New York, and New Jersey. He earned a Bachelor of Business Administration from Siena College, and an MBA from St. John’s University. He served as President of the Board of Directors of the Chicago Children’s Advocacy Center. Mr. Short was a member of the American Institute of Certified Public Accountants, the Illinois CPA Society, the Executive Committee of the Chicago Civic Federation, the Audit Commission of the Bank Administration Institute, and DePaul University Finance Advisory Board.
The Independent Committee has determined that it has at least one “audit committee financial expert” (as defined in Item 407(d)(5) of Regulation S-K) serving on it. The registrant’s audit committee financial experts are Mr. Short and Mr. Moravy, each of whom meets the independent director requirements established by the NYSE MKT.
73
Table of Contents
Manager
NCAM is the manager of the Fund, and is responsible for determining the Fund’s overall investment strategy and overseeing its implementation, managing the Fund’s business affairs and providing certain legal, accounting and other administrative support.
The Manager may change, or temporarily deviate from, the Fund’s investment strategy and the manner in which the strategy is implemented if the Manager determines that it is in the best interests of Fund shareholders to do so based on existing market conditions or otherwise. In addition, the Manager has the rights and obligations with respect to the Fund as described in the Trust Agreement.
The Manager is a wholly-owned subsidiary of Nuveen Investments, a Delaware corporation. Founded in 1898, Nuveen Investments and its affiliates had approximately $225.7 billion of assets under management as of December 31, 2015. Nuveen Investments is a listed principal of the Manager.
The persons listed below serve as executive officers of the Manager. Their names, positions and tenure with the Manager and its affiliates are included below.
William Adams IV (age 60) has served as President of NCAM since August 2011 and was Managing Director of NCAM from April 2010 until August 2011. He is the principal executive officer of NCAM and supervises its overall business activities. Since January 1, 2011, Mr. Adams has also served as Co-President of Nuveen Fund Advisors, LLC (“NFAL”), a registered commodity pool operator that manages investment companies subject to CFTC regulation. As Co-President, he is the executive responsible for all business-related decisions involving closed-end funds managed by NFAL. Mr. Adams is also Co-Chief Executive Officer and Co-President (since March 2016), formerly Senior Executive Vice President (January 2011 – March 2016), and prior thereto, Executive Vice President of Global Structured Products at Nuveen Investments. He is also a member of the Board of Directors of the Nuveen Fund Board (since September 1, 2013). Previously, Mr. Adams was Managing Director of Structured Investments, effective September 1997, where he headed Nuveen’s closed-end fund and unit investment trust business units, and Vice President and Manager of Corporate Marketing, effective August 1994, where he was responsible for the distribution of Nuveen’s investment products, including overseeing all sales and marketing activities. Mr. Adams was listed as a principal and registered as an associated person of NCAM on May 7, 2010 and July 13, 2010, respectively, and of NFAL on August 8, 2012 and January 1, 2013, respectively.
Margo Cook (age 51) has been Managing Director of NCAM since August 2011. In her role as the Head of Investment Services, Ms. Cook serves as the key liaison with sub-advisors of funds managed by NCAM and NFAL. Ms. Cook’s responsibilities include Investment Oversight, Valuation and Risk Management for all investment teams, as well as overseeing investment-related issues on behalf of NCAM and NFAL. Ms. Cook is also Senior Executive Vice President of NFAL (Executive Vice President since 2011), the chair of NCAM and NFAL’s Oversight Committees and is a member of Nuveen Investments’ Executive, Product Development, Operations and Valuation Committees. Ms. Cook is also responsible for the co-management of Nuveen Investments’ Institutional Sales effort, including the Consultant Relations, Taft Hartley and Client Service teams. Ms. Cook is also Co-Chief Executive Officer (since March 2015), formerly, Executive Vice President (July 2013-2015), of Nuveen Securities, LLC. She is Co-Chief Executive Officer and Co-President (since March 2016), formerly Senior Executive Vice President (July 2015 – March 2016), and prior thereto Executive Vice President (May 2009 – July 2015) of Nuveen Investments, Inc. Prior to joining Nuveen Investments in October 2008, Ms. Cook served as Global Head of Bear Stearns Asset Management’s institutional asset management business from June 2007 to October 2008, which included managing several equity and fixed income portfolio teams, and serving on the firm’s Executive and Management Committees. Prior to joining Bear Stearns in June 2007, Ms. Cook held a number of leadership roles, starting in September 1986, within The Bank of New York Mellon’s asset management business, including: CIO and Head of Institutional Asset Management (2005 to 2007), Head of Institutional Fixed Income (1996 to 2005) and Senior Fixed Income Portfolio Manager (1988 to 1996). Ms. Cook is a Chartered Financial Analyst charterholder and received an executive MBA from Columbia University in May 2002. Ms. Cook was listed as a principal of NCAM on November 23, 2011, and of NFAL on December 14, 2012.
74
Table of Contents
Stephen D. Foy (age 61) has served as Chief Financial Officer and principal financial officer of NCAM since February 2010. Mr. Foy supervises the records and accounting systems of NCAM and the preparation of the Fund’s financial reports. Mr. Foy, a certified public accountant, is also a Managing Director (since 2014), formerly, Senior Vice President (2013 – 2014) and Vice President (2005 to 2013) of NFAL and Vice President and Controller of the Nuveen Funds (since 1998). In these capacities, Mr. Foy is responsible for overseeing the relationships and operations of the third party fund accountants and custodians for the Nuveen Funds; for managing the fund administration activities for the Nuveen Funds, including shareholder reporting and periodic regulatory filings, preparation of tax returns and performance of tax compliance, preparation of expense budgets and maintenance of accrued expenses; for maintaining the relationships with the independent accountants and the audit committees of the Boards of Directors/Trustees of the Nuveen Funds; and for overseeing the accounting, custody and administration services provided by third parties to certain Dublin-based UCITS funds and other investment vehicles advised by NFAL. Mr. Foy was listed as a principal of NCAM on May 19, 2010.
Carl M. Katerndahl (age 52) has been a Managing Director of NCAM since May 2010. Mr. Katerndahl has also been Senior Executive Vice President (since July 2015), formerly, Executive Vice President, Co-Head of Distribution for Nuveen Investments since December 2007, where he has been responsible for sales and client service for the entire firm, including NCAM and NFAL. In this role, he is responsible for identifying potential customers and financial intermediaries for distribution of NCAM’s and NFAL’s products and services. Previously, Mr. Katerndahl was Managing Director and Head of the Private Client Group for Nuveen Investments since July 2002. Prior thereto, Mr. Katerndahl was a Managing Director and Head of Sales for NWQ Investment Management Company, LLC, a registered investment adviser acquired by Nuveen Investments in August 2002. Mr. Katerndahl was listed as a principal and registered as an associated person of NCAM on June 18, 2010 and July 13, 2010, respectively, and of NFAL on December 7, 2012 and January 1, 2013, respectively. He withdrew his status as an associated person of NCAM and NFAL effective July 16, 2013.
Shanita Smith (age 37) has served as Chief Compliance Officer of NCAM since April 2013. She is responsible for implementing the compliance program and internal controls to ensure NCAM’s compliance with applicable regulatory requirements. Ms. Smith also oversees the compliance program of Nuveen Securities, LLC, a broker-dealer affiliate of NCAM (since May 2012). Ms. Smith assumed these positions after initially joining Nuveen Investments as a Senior Compliance Administrator in January 2011. Previously, Ms. Smith worked at Ariel Investments, an investment management firm (June 2006 to January 2011), where she held a variety of roles in compliance, transfer agent oversight and shareholder communications for the Ariel Mutual Funds. From April 2004 to June 2006, Ms. Smith worked at Vista360, a compliance consulting firm, where she managed client engagements. Prior thereto, Ms. Smith held a compliance position at U.S Bancorp Asset Management, an investment management firm (January 2001 to April 2004), focusing on fund compliance. Ms. Smith was listed as a principal of NCAM on May 6, 2013.
Code of Ethics
The Fund has no officers or employees and is managed by NCAM. NCAM has adopted as a code of ethics a Code of Conduct, which is available at http://www.nuveen.com/CommodityInvestments, on the Fund’s webpage, under the “Literature” tab.
Section 16(a) Beneficial Ownership Reporting Compliance
Section 16(a) of the Exchange Act requires certain personnel of the Manager and the Sub-advisers, members of the Independent Committee and persons who own more than 10% of the Fund’s shares to file reports with the SEC regarding their ownership of the Fund’s shares and changes in such ownership. Employees of the Manager prepare these reports for the Independent Committee members and personnel of the Manager and Sub-advisers who request it on the basis of information obtained from them. Based on the Manager’s review of copies of these reports and other information obtained by the Manager, the Manager believes that during the year ended December 31, 2015, all such necessary reports were filed in a timely manner.
75
Table of Contents
| Item 11. | Executive Compensation |
The Fund has no officers or employees and is managed by the Manager. None of the officers of the Manager receive compensation from the Fund. The annual fee for each member of the Independent Committee is $30,000, and each member of the Independent Committee also receives (a) a fee of $1,250 per meeting per fund for attendance in person or by telephone at a regularly scheduled quarterly meeting of the Independent Committee; and (b) a fee of $1,500 per meeting for attendance in person or by telephone at any special, non-regularly scheduled meeting of the Independent Committee. In addition, the Independent Committee chair receives an additional annual fee of $6,000. The Independent Committee members are also compensated for out-of-pocket costs in connection with attending Independent Committee meetings. The fees of the Independent Committee members are paid by NCAM, which is reimbursed for such fees on a pro rata basis by each fund managed by NCAM, which are currently the Fund and CFD.
For the services and facilities provided by the Manager, the Fund has agreed to pay the Manager an annual fee of 1.25%, payable monthly, based on its average daily net assets. “Average daily net assets” means the total assets of the Fund, minus the sum of its liabilities.
The Fund incurred $3,514,158 in management fees for the year ended December 31, 2015, of which $286,701 was still payable to the Manager at the end of the year.
| Item 12. | Security Ownership of Certain Beneficial Owners and Management and Related Stockholder Matters |
The Fund has no securities authorized for issuance under equity compensation plans.
The following table sets forth information regarding the beneficial ownership of shares of the Fund as of December 31, 2015, by the Manager and its executive officers, portfolio managers and members of the Independent Committee. The address of each beneficial owner is c/o Nuveen Investments, 333 W. Wacker Dr., Chicago, IL 60606.
| Name and Address of Beneficial Owner |
Amount of Beneficial Ownership |
Percent of Class |
||||||
| Manager |
840 Shares | 0.01 | % | |||||
|
|
|
|
|
|||||
| Independent Committee |
||||||||
| Jon C. Hunt |
4,000 Shares | 0.02 | % | |||||
| L. Joe Moravy |
1,500 Shares | 0.01 | % | |||||
|
|
|
|
|
|||||
Other than as set forth in the previous table, no executive officer of the Manager, portfolio manager or member of the Independent Committee owned shares of the Fund as of December 31, 2015. As of that date, no person was known by the Manager to own beneficially more than 5% of the outstanding shares of the Fund.
| Item 13. | Certain Relationships and Related Transactions, and Director Independence |
See “Item 10. Directors, Executive Officers and Corporate Governance” and “Item 11. Executive Compensation” of this Annual Report.
76
Table of Contents
| Item 14. | Principal Accounting Fees and Services |
The following table set forth the fees for professional services rendered by the Fund’s independent registered public accountant, PwC, for the years ended December 31, 2015 and December 31, 2014.
| 2015 | 2014 | |||||||
| Audit Fees |
$ | 120,600 | $ | 117,000 | ||||
| Audit-Related Fees |
— | — | ||||||
| Tax Fees |
212,626 | 210,053 | ||||||
| All Other Fees |
— | — | ||||||
|
|
|
|
|
|||||
| Total |
$ | 333,226 | $ | 327,053 | ||||
|
|
|
|
|
|||||
Audit fees consist of fees paid to PwC for the audits of the Fund’s December 31, 2015 and December 31, 2014 annual financial statements included on Form 10-K. Audit fees also include fees paid to PwC for the review of the Fund’s Form 10-Qs and services normally provided by independent registered public accountants in connection with statutory and regulatory filings of registration statements.
Tax fees cover certain tax compliance and reporting services to the Fund, including processing beneficial ownership information as it relates to the preparation of tax reporting packages and the subsequent delivery of related information to Fund shareholders and the IRS. Services also include assistance with tax reporting and related information using a web-based tax package product developed by PwC and a toll-free package support help line.
The members of the Independent Committee serve as the audit committee of the Fund. The audit committee is responsible for the appointment, compensation, retention and oversight of the work of the independent registered public accountant, currently PwC. All of the services provided by PwC were pre-approved by the audit committee.
77
Table of Contents
PART IV
| Item 15. | Exhibits and Financial Statement Schedules |
(a)(1) Financial Statements
See “Item 8. Financial Statements and Supplementary Data” of this Annual Report.
(a)(2) Financial Statement Schedules
No financial statement schedules are filed herewith because (i) such schedules are not required or (ii) the information required has been presented in the aforementioned financial statements.
(a)(3) Exhibits
| 4.1 | Amended and Restated Trust Agreement of the Fund. (1) | |
| 10.1 | Commodity Sub-Advisory Agreement. (2) | |
| 10.2 | Collateral Sub-Advisory Agreement. (2) | |
| 10.3 | Custodian Agreement. (2) | |
| 10.4 | Shareholder Transfer Agency and Service Agreement. (2) | |
| 10.5 | Subscription Agreement. (2) | |
| 10.6 | Investment Management Agreement. (2) | |
| 10.7 | Futures and Options Customer Account Agreement. (2) | |
| 31.1 | Certification of Principal Executive Officer Pursuant to Rule 13a-14(a) or Rule 15d-14(a), as adopted pursuant to Section 302 of the Sarbanes-Oxley Act of 2002. | |
| 31.2 | Certification of Principal Financial Officer Pursuant to Rule 13a-14(a) or Rule 15d-14(a), as adopted pursuant to Section 302 of the Sarbanes-Oxley Act of 2002. | |
| 32.1 | Certification of Principal Executive Officer Pursuant to 18 U.S.C. Section 1350, as adopted pursuant to Section 906 of the Sarbanes-Oxley Act of 2002. | |
| 32.2 | Certification of Principal Financial Officer Pursuant to 18 U.S.C. Section 1350, as adopted pursuant to Section 906 of the Sarbanes-Oxley Act of 2002. | |
| 101.INS | XBRL Instance Document. | |
| 101.SCH | XBRL Taxonomy Extension Schema Document. | |
| 101.CAL | XBRL Taxonomy Extension Calculation Linkbase Document. | |
| 101.LAB | XBRL Taxonomy Extension Label Linkbase Document. | |
| 101.PRE | XBRL Taxonomy Extension Presentation Linkbase Document. | |
| 101.DEF | XBRL Taxonomy Extension Definition Linkbase Document. | |
| (1) | Filed on September 20, 2012 with Amendment No. 6 to Registrant’s Registration Statement on Form S-1 (File No. 333-174764) and incorporated by reference herein. |
| (2) | Filed on December 7, 2012 as an exhibit to Registrant’s Quarterly Report on Form 10-Q for the quarter ended September 30, 2012 (Commission File No. 001-35710) and incorporated by reference herein. |
78
Table of Contents
AFFIRMATION OF THE COMMODITY POOL OPERATOR
To the shareholders of Nuveen Long/Short Commodity Total Return Fund:
Pursuant to Rule 4.22(h) under the Commodity Exchange Act, the undersigned represents that, to the best of his knowledge and belief, the information contained in the Annual Report on Form 10-K for the year ended December 31, 2015, for Nuveen Long/Short Commodity Total Return Fund is accurate and complete.
Nuveen Commodities Asset Management, LLC
Manager of Registrant
/s/ William Adams IV
President
(Principal Executive Officer)
79
Table of Contents
Pursuant to the requirements of Section 13 or 15(d) of the Securities Exchange Act of 1934, the Registrant has duly caused this report to be signed on its behalf by the undersigned, thereunto duly authorized, in the City of Chicago, State of Illinois, on March 14, 2016.
| Nuveen Long/Short Commodity Total Return Fund | ||
| By: | Nuveen Commodities Asset Management, LLC, its Manager | |
| By: | /s/ William Adams IV | |
| President (Principal Executive Officer) | ||
Pursuant to the requirements of the Securities Exchange Act of 1934, this report has been signed below by the following persons on behalf of the Registrant and in the capacities and on the dates indicated.
| Nuveen Commodities Asset Management, LLC Manager of Registrant |
| /s/ William Adams IV |
| President (Principal Executive Officer) March 14, 2016 |
| /s/ Stephen D. Foy |
| Chief Financial Officer (Principal Financial and Accounting Officer) March 14, 2016 |
80