Attached files
| file | filename |
|---|---|
| EX-32.2 - EX-32.2 - TUBEMOGUL INC | tube-ex322_255.htm |
| EX-32.1 - EX-32.1 - TUBEMOGUL INC | tube-ex321_256.htm |
| EX-31.2 - EX-31.2 - TUBEMOGUL INC | tube-ex312_257.htm |
| EX-23.1 - EX-23.1 - TUBEMOGUL INC | tube-ex231_962.htm |
| EX-31.1 - EX-31.1 - TUBEMOGUL INC | tube-ex311_258.htm |
| EX-21.1 - EX-21.1 - TUBEMOGUL INC | tube-ex211_259.htm |
UNITED STATES
SECURITIES AND EXCHANGE COMMISSION
Washington, D.C. 20549
FORM 10-K
(Mark One)
|
x |
ANNUAL REPORT PURSUANT TO SECTION 13 OR 15(d) OF THE SECURITIES EXCHANGE ACT OF 1934 |
For the fiscal year ended December 31, 2015
OR
|
¨ |
TRANSITION REPORT PURSUANT TO SECTION 13 OR 15(d) OF THE SECURITIES EXCHANGE ACT OF 1934 |
For the transition period from to
Commission File Number 001-36543
TubeMogul, Inc.
(Exact name of Registrant as specified in its Charter)
|
Delaware |
|
51-0633881 |
|
( State or other jurisdiction of incorporation or organization) |
|
(I.R.S. Employer Identification No.) |
|
1250 53rd Street, Suite 2 Emeryville, California |
|
94608 |
|
(Address of principal executive offices) |
|
(Zip Code) |
(510) 653-0126
(Registrant’s telephone number, including area code)
Securities registered pursuant to Section 12(b) of the Act:
|
Title of each class |
|
|
Name of each exchange on which registered |
|
Common Stock, $0.001 par value |
|
|
The NASDAQ Stock Market LLC |
Securities registered pursuant to Section 12(g) of the Act: None
Indicate by check mark if the Registrant is a well-known seasoned issuer, as defined in Rule 405 of the Securities Act. YES o NO x
Indicate by check mark if the Registrant is not required to file reports pursuant to Section 13 or 15(d) of the Act. YES ¨ NO x
Indicate by check mark whether the Registrant: (1) has filed all reports required to be filed by Section 13 or 15(d) of the Securities Exchange Act of 1934 during the preceding 12 months (or for such shorter period that the Registrant was required to file such reports), and (2) has been subject to such filing requirements for the past 90 days. YES x NO ¨
Indicate by check mark whether the Registrant has submitted electronically and posted on its corporate Web site, if any, every Interactive Data File required to be submitted and posted pursuant to Rule 405 of Regulation S-T (§232.405 of this chapter) during the preceding 12 months (or for such shorter period that the Registrant was required to submit and post such files). YES x NO ¨
Indicate by check mark if disclosure of delinquent filers pursuant to Item 405 of Regulation S-K (§229.405) is not contained herein, and will not be contained, to the best of Registrant’s knowledge, in definitive proxy or information statements incorporated by reference in Part III of this Report or any amendment to this Report. ¨
Indicate by check mark whether the Registrant is a large accelerated filer, an accelerated filer, a non-accelerated filer, or a smaller reporting company. See the definition of “large accelerated filer”, “accelerated filer”, and “smaller reporting company” in Rule 12b-2 of the Exchange Act. (Check one):
|
Large accelerated filer |
|
¨ |
|
Accelerated filer |
|
x |
|
|
|
|
|
|||
|
Non-accelerated filer |
|
¨ (Do not check if a smaller reporting company) |
|
Smaller reporting company |
|
¨ |
Indicate by check mark whether the Registrant is a shell company (as defined in Rule 12b-2 of the Exchange Act). YES ¨ NO x
The aggregate market value of voting stock held by non-affiliates of the Registrant on June 30, 2015, based on the closing price of $14.29 for shares of the Registrant’s common stock, was approximately $249.3 million. Shares of common stock held by each executive officer, director and by each person who owns 5% or more of the outstanding common stock have been excluded in that such persons may be deemed to be affiliates. This determination of affiliate status is not necessarily a conclusive determination for other purposes.
The number of shares of Registrant’s common stock outstanding as of March 1, 2016 was 35,559,301.
DOCUMENTS INCORPORATED BY REFERENCE
Portions of the Registrant’s Definitive Proxy Statement relating to the Annual Meeting of Stockholders are incorporated by reference into Part III of this Annual Report on Form 10-K. Such Definitive Proxy Statement will be filed with the Securities and Exchange Commission within 120 days after the end of the Registrant’s fiscal year ended December 31, 2015.
TABLE OF CONTENTS
|
|
|
|
|
Page |
|
|
|
|||
|
Item 1. |
|
|
5 |
|
|
Item 1A. |
|
|
18 |
|
|
Item 1B. |
|
|
36 |
|
|
Item 2. |
|
|
36 |
|
|
Item 3. |
|
|
36 |
|
|
Item 4. |
|
|
36 |
|
|
|
|
|||
|
Item 5. |
|
|
37 |
|
|
Item 6. |
|
|
39 |
|
|
Item 7. |
|
Management’s Discussion and Analysis of Financial Condition and Results of Operations |
|
40 |
|
Item 7A. |
|
|
55 |
|
|
Item 8. |
|
|
57 |
|
|
Item 9. |
|
Changes in and Disagreements With Accountants on Accounting and Financial Disclosures |
|
82 |
|
Item 9A. |
|
|
82 |
|
|
Item 9B. |
|
|
82 |
|
|
|
|
|||
|
Item 10. |
|
|
83 |
|
|
Item 11. |
|
|
83 |
|
|
Item 12. |
|
Security Ownership of Certain Beneficial Owners and Management and Related Stockholder Matters |
|
83 |
|
Item 13. |
|
Certain Relationships and Related Transactions, and Director Independence |
|
83 |
|
Item 14. |
|
|
83 |
|
|
|
|
|||
|
Item 15. |
|
|
84 |
|
|
|
86 |
|||
2
SPECIAL NOTE REGARDING FORWARD-LOOKING STATEMENTS
This Annual Report on Form 10-K, or the Report, contains forward-looking statements within the meaning of the Private Securities Litigation Reform Act of 1995. We have based these forward-looking statements largely on our current expectations and projections about future events and financial trends affecting our business. Forward-looking statements should not be read as guarantees of future performance or results, and will not necessarily be accurate indications of the times at, or by, which such performance or results will be achieved. Forward-looking statements are based on information available to our management at the date of this Report and our management’s good faith belief as of such date with respect to future events, and are subject to risks and uncertainties that could cause actual performance or results to differ materially from those expressed in or suggested by the forward-looking statements. Important factors that could cause such differences include, but are not limited to:
|
|
· |
our financial performance, including our revenue, costs, expenditures, growth rates and operating expenses, and our ability to become profitable; |
|
|
· |
our ability to maintain our rate of revenue growth; |
|
|
· |
our ability to expand our customer base; |
|
|
· |
our ability to convince our customers to maintain or increase their advertising spend through our platform; |
|
|
· |
the expansion of the digital video advertising market; |
|
|
· |
our ability to adapt to changing market conditions; |
|
|
· |
our ability to effectively manage our growth; |
|
|
· |
the effects of increased competition in our markets and our ability to compete effectively; |
|
|
· |
our ability to effectively grow and train our sales team; |
|
|
· |
our ability to maintain, protect and enhance our intellectual property; |
|
|
· |
costs associated with defending intellectual property infringement and other claims; |
|
|
· |
our ability to grow our market share in and penetrate emerging video advertising channels; |
|
|
· |
our ability to successfully enter new geographic markets; |
|
|
· |
our ability to develop and introduce enhancements and new features and functionality of our platform that achieve market acceptance; |
|
|
· |
our expectations concerning relationships with third parties; |
|
|
· |
our ability to retain our chief executive officer and co-founder and attract and retain qualified employees and key personnel; and |
|
|
· |
other factors discussed in this Report under Item 1A “Risk Factors” and Item 7 “Management’s Discussion and Analysis of Financial Condition and Results of Operations.” |
In addition, in this Report, the words “anticipate,” “believe,” “continue,” “could,” “seek,” “might,” “estimate,” “expect,” “intend,” “may,” “plan,” “potential,” “predict,” “approximately,” “project,” “should,” “will,” “would” or the negative or plural of these words or similar expressions, as they relate to our company, business and management, are intended to identify forward-looking statements. In light of these risks and uncertainties, the future events and circumstances discussed in this Report may not occur, and actual results could differ materially from those anticipated or implied in the forward-looking statements.
Forward-looking statements involve known and unknown risks, uncertainties and other factors that may cause our actual results, performance or achievements to be materially different from any future results, performance or achievements expressed or implied by the forward-looking statements. We discuss these risks in greater detail in Item 1A “Risk Factors” and elsewhere in this Report. We derive many of our forward-looking statements from our operating budgets and forecasts, which we base on many assumptions. While we believe that our assumptions are reasonable, we caution that it is difficult to predict the impact of known factors, and it is impossible for us to anticipate all factors that could affect our actual results. Given these uncertainties, you should not place undue reliance on these forward-looking statements. You should read this Report and the documents that we reference in this Report and have filed with the Securities Exchange Commission, or SEC, as exhibits thereto, completely and with the understanding that our actual future results may be materially different from what we expect.
3
Forward-looking statements speak only as of the date of this Report. We caution you that the foregoing list of important factors may not contain all of the material factors that are important to you. Except as required by law, we assume no obligation to publicly update or revise any forward-looking statement to reflect actual results, changes in assumptions based on new information, future events or otherwise. If we update one or more forward-looking statements, no inference should be drawn that we will make additional updates with respect to those or other forward-looking statements.
Unless the context otherwise requires, the terms “TubeMogul,” “the Company,” “we,” “us,” and “our” in this Report refer to TubeMogul, Inc., a Delaware corporation and our predecessor, TubeMogul, Inc., a California corporation, and where appropriate, their respective consolidated subsidiaries.
4
Overview
TubeMogul is a leader in software for brand advertising. Advertisers use TubeMogul’s software platform to plan, buy, measure, and optimize their global brand advertising. By reducing complexity, improving transparency and leveraging real-time data, our platform enables brands to gain greater control of their advertising spend and achieve their brand advertising objectives.
Our self-serve software platform enables advertisers to buy ad inventory across major advertising channels, including linear television, video-on-demand, connected TV, digital video, digital display and social media. By integrating programmatic technologies and disparate sources of inventory within a single platform, we enable our customers to launch sophisticated, scalable advertising campaigns — onto digital devices and televisions — within minutes. This is in contrast to the still prevailing and inefficient approach to media buying that occurs through a manual campaign-by-campaign request for proposal, or RFP, process, which often involves multiple digital advertising service providers.
Our customers are primarily brands and the advertising agencies that serve them. Brands generally refer to companies, or product lines within companies, that control advertising budgets for a single marketing brand or a group of marketing brands. Agency trading desks, ad networks and publishers also use our platform. We refer to our customers and other businesses that are engaged in purchasing digital and television media as advertisers.
Our platform is integrated with many public digital ad inventory sources, where individual ad impressions can be purchased dynamically utilizing real-time bidding technology, or RTB, as well as with suppliers of linear television inventory. Our platform automates the real-time purchase of ad impressions based upon campaign objectives. Additionally, our customers can easily integrate the ad inventory they source directly from digital and television publishers. As a result, our platform enables holistic campaign management across public and private inventory using a single interface.
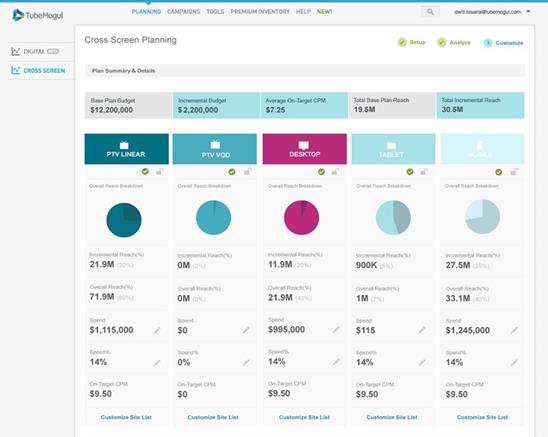
Brand advertisers seek to optimize their media buys across all channels, with TV the most important, as it is typically their largest advertising medium. However, TV spend and digital spend have traditionally been planned and bought separately. In the fourth quarter of 2015, we introduced cross-screen planning software that uses a brand’s TV spend as the input to help them create an optimized media plan across TV and digital channels. Our software recommends the most efficient budget allocation across linear TV, video-on-demand, connected TV, digital video, digital display and social channels to maximize incremental reach, as well as recommending the ideal sites and apps for the campaign. Advertisers can then execute the recommended media buy using our platform and verify the audience they reach using Nielsen reporting, thereby unifying the planning and measurement of TV and digital campaigns.
Our platform measures key brand advertising metrics including brand lift, as measured by integrated brand surveys, as well as gross rating points, or GRPs, and engagement. As a result, advertisers can verify the success and impact of their advertising campaigns by measuring the audience reached by the campaign, how the audience interacted with their advertisements and the impact the campaign had on the consumer’s perception of the brand. Using these real-time insights, our platform dynamically optimizes spend based upon brand advertising objectives set by the advertiser.
We offer advertisers unique visibility into the inventory they purchase, including enabling them to see ad performance and viewability at any dimension of a campaign. Our platform also includes a suite of integrated TubeMogul and third party brand safety technologies that can help minimize unacceptable ad placements, sites with inappropriate content, auto-play ad placements and fraudulent bot-driven traffic.
We make our platform available through two offerings: Platform Direct, which allows advertisers to continuously run campaigns through a self-serve model, and Platform Services, which allows advertisers to specify campaign objectives and have our team execute the campaign on their behalf using our platform.
Market Overview
Given the importance of branding to maintain and improve differentiation, market share and pricing power, a significant portion of global advertising dollars are spent on brand advertising. Brands rely on the sight, sound and motion of video advertising to establish an emotional connection with consumers that is critical to branding. Brands have primarily utilized traditional TV advertising to deliver video messages to the large audiences they require.
5
While TV advertising represents the largest single portion of today’s advertising spend, consumers are shifting their consumption of media content from analog mediums, such as TV, print and radio, to digital mediums such as websites and mobile applications. Consumers expect to be able to view media content seamlessly across multiple digital devices, including computers, tablets, smartphones and connected TVs.
Recognizing this trend, brands are increasingly shifting portions of their advertising spend to digital mediums. The majority of digital advertising spend to date has been directed to search and display advertising to achieve direct response objectives. Direct response advertising is designed to optimize the delivery of ads to increase ‘conversions’ or the action the viewer takes after seeing the ad, such as visiting a website, filling out a form or making an online purchase. However, direct response advertising does not serve the needs of brand advertisers who want to reach and persuade their target audiences and track the impact on consumer perceptions of their brand. As a result, brands are increasingly seeking to use digital video advertising channels in addition to TV for their brand advertising campaigns. This form of advertising allows brands to establish emotional connections with viewers by presenting powerful messages to consumers on whatever digital device they choose to view content. Further, as consumers watch video content on websites and within mobile applications, they create a record of their demographic, behavioral and socioeconomic data. By leveraging this data, brands are able to more effectively target the right audience, with the right message, on the right screen at the right time.
As brands shift advertising spend to digital media, they encounter increasing complexity in executing their advertising campaigns. Brands, their agencies and other entities, which we refer to as advertisers, generally need to use dozens of digital advertising service providers to execute a campaign. These service providers include the many sources of digital inventory available to advertisers, such as public ad exchanges, supply-side platforms, private marketplaces, ad networks and direct premium publishers, as well as providers of specific technologies, including ad serving, ad verification, data management, brand safety, rich media, audience data and analytics. Brands have traditionally relied on media agencies to allocate their spend to these service providers on a campaign-by-campaign basis through individual requests for proposal, or RFPs. This has resulted in a complex, fragmented and inefficient system.
Software’s Impact on Brand Advertising
Over the last two decades, enterprise software solutions, such as enterprise resource planning, customer relationship management and human capital management, have transformed many business processes. More recently, cloud-based solutions have reduced operating costs, increased scalability, and provided better data for decision making. Largely because software solutions that address the complexities of cross-screen advertising are in the early stages of development, brand marketers within large corporations have not yet realized the benefits that enterprise software solutions can offer.
While adoption of comprehensive enterprise software solutions for brand advertising is in its early stages, there has been rapid growth in the use of technology to buy and sell digital advertising inventory. This technology, which is generally referred to as programmatic, includes RTB where advertisers bid in real-time in hundredths of a second for the right to serve an ad to a particular consumer. The adoption of programmatic technology has been driven by the opportunity to apply the massive amounts of data, or big data, collected by brands and third parties to improve the performance of digital marketing campaigns.
To date, programmatic technology has been primarily applied to display advertising campaigns with direct response objectives. More recently, brands and their agencies have begun to adopt programmatic tools for video advertising campaigns with branding objectives.
Challenges of Digital Advertising for Brands
As the digital advertising market continues to develop and grow, advertisers are seeking alternatives to the highly manual, repetitive and uncoordinated processes that they have historically used to plan, execute and measure their digital advertising campaigns. However, they continue to face several specific challenges including:
|
|
· |
Fragmented and Manual System for Buying Digital Media. Compared to the number of national broadcast networks and cable networks on traditional TV, tens of thousands of digital publishers sell video advertising inventory. Digital publishers typically offer their premium inventory directly to advertisers, then make remaining inventory available through many service providers, including ad exchanges, supply-side platforms, and ad networks. Advertisers need to reach audiences on many websites to achieve campaign goals, and must do so across many types of digital devices. Advertisers also typically engage in repetitive manual RFP processes with multiple sources of inventory to select the digital advertising inventory suitable to reach their target audience, resulting in significant inefficiencies. |
6
|
|
· |
Challenging to Integrate and Leverage Multiple Technology Providers. Advertisers need multiple technologies to execute digital advertising campaigns, such as ad serving, ad verification, data management, brand safety, rich media, audience data and analytics technologies. However, these technologies are generally offered by different providers and it is difficult for advertisers to make these technologies work well together. This impedes campaign performance, increases costs and lowers efficiency. |
|
|
· |
Limited Options for Advertisers to Manage and Control Entire Buying Process. Current service providers do not allow advertisers to manage, control and optimize digital video campaigns using a self-serve model. Instead, to reach audiences across thousands of websites, advertisers are often forced to purchase inventory through media aggregators, which generally do not allow advertisers to choose the websites on which their ads run, make adjustments during the course of a given campaign, or obtain the performance data necessary to evaluate and improve ongoing campaign decision making. |
|
|
· |
TV Advertising and Digital Advertising are Purchased and Measured Differently. Traditional TV remains an important medium to reach consumers with brand messages. To date, TV and digital advertising campaigns have been executed separately and measured by different metrics, leading to inefficiencies. The separate processes and metrics make it difficult to effectively plan and measure campaigns focused on reaching targeted audiences across TV and digital channels. |
|
|
· |
Advertising Service Providers Have Conflicting Interests and Offer Limited Inventory and Economic Transparency. Many digital advertising service providers offer services to both advertisers and publishers. These service providers typically purchase advertising inventory directly from publishers and resell it to advertisers seeking to purchase the same inventory. This model can create conflicting interests. In particular, when fulfilling campaigns, such service providers may have an economic incentive to favor their own inventory, over equally effective or superior inventory that is otherwise available. Further, it may be in the interests of these service providers to not disclose to the advertiser the sites on which their advertising campaigns are shown or their cost to purchase that inventory. |
|
|
· |
Difficult to Measure Return on Investment. As consumers increasingly view content through a broader range of devices and channels, it is difficult for brands to verify a number of objectives important to brand advertising, such as reach and frequency among a target audience, engagement and brand lift. |
|
|
· |
Challenging to Deploy and Manage Global Campaigns. Advertisers often seek to reach and impact a global consumer base by launching targeted advertising campaigns across multiple countries simultaneously. Managing video advertising campaigns globally is currently a costly and inefficient process requiring brands to contract with multiple agencies, ad exchanges, ad networks, supply-side platforms, publishers and technology providers. |
|
|
· |
Difficult to Identify and Eliminate Undesired Ad Placements and Fraudulent Traffic. Given the emerging nature of the digital video advertising market, there are few standards and tools to categorize various types of digital video ad placements. For example, a video ad that requires a consumer to initiate a video is more valuable than a video ad that plays automatically in a display, or banner, space, but some providers do not make a distinction between the two placements. Advertisers also have limited control over the content alongside which their ad is placed, which is critical to brands, and whether each ad placement is viewable by the consumer. Finally, advertisers are also concerned with the increasing proportion of fraudulent web traffic that is generated by computers, or bots, resulting in advertisers paying for impressions that are not viewed by consumers. |
Our Solution
We enable advertisers to plan, buy, measure and optimize global advertising spend from a single platform. Our platform incorporates our proprietary programmatic technologies, including RTB, automated optimization and advanced audience targeting capabilities, and integrates key third-party technologies. Through an intuitive user interface, our customers are able to control and automate advertising spend across the various sources of inventory, including inventory acquired directly from individual publishers, to reach targeted audiences across digital devices at any time. In addition, by using a single platform, our customers benefit from comprehensive, real-time reporting that is comparable across sources of inventory, geographies, digital devices and ad formats. We make our cloud-based platform available through two offerings: Platform Direct, which allows advertisers to continuously run campaigns through a self-serve model, and Platform Services, which allows advertisers to specify campaign objectives and have our team execute on their behalf using our platform.
|
|
· |
Integrated Software Platform. Our platform integrates with over 30 third-party technology providers who offer specific technologies for digital and linear television campaigns. For example, we integrate with data management platforms to enhance audience targeting and reporting, with video rich media providers to enhance ad formats, and with contextual data providers to enhance brand safety. By using our platform, advertisers can utilize a single control interface that integrates with best-of-breed third-party technology suppliers for campaign execution. |
7
|
|
· |
Designed for Self-Serve Model. Through our Platform Direct offering, our platform is accessible using a cloud-based, self-serve model. Our Platform Direct customers have full control and transparency over their video advertising spend. Our intuitive user interface enables advertisers to manage an unlimited number of campaigns simultaneously on a single platform, thereby reducing cost, complexity and inefficiencies caused by intermediaries. |
|
|
· |
Cross-Screen Planning, Execution and Management. Our cross-screen planning software uses a brand’s TV spend as the input to help create an optimal media plan across TV and digital channels. The software recommends the most efficient budget allocation across linear TV, video-on-demand, connected TV, digital video, digital display and social channels to maximize incremental reach, as well as recommending the ideal sites and apps for the campaign. Advertisers can then execute the recommended media buy using our platform and verify the audience they reach using Nielsen reporting, thereby unifying the planning and measurement of TV and digital campaigns. |
|
|
· |
Independent and Transparent Buy-Side Positioning. We have built our business to serve only buyers of video advertising. We generally do not take an economic interest in the inventory that customers can access through our platform and as a result, we do not have an incentive to favor specific inventory when fulfilling campaigns. We show our customers the specific sites where ads are displayed and our Platform Direct customers can see the price they pay for the media. We charge our Platform Direct customers a fee as a percentage of their spend, providing them with greater economic transparency. |
|
|
· |
Verifies and Measures Campaign Performance and Brand Lift. Our platform enables advertisers to verify audience reach and engagement and measure the impact of an ad campaign on consumers through our integrated brand survey module. Our reporting is made available for multiple dimensions of a campaign, including by ad, ad format, website and mobile application. |
|
|
· |
Purpose-Built for Global Advertising. Our platform has been designed for brands to manage and execute global digital video campaigns using a single integrated workflow. Although substantially all of our revenue to date has been generated from English language countries, we currently enable campaigns in over 70 countries and our platform is currently available in four languages and supports 18 currencies. By providing access to inventory and targeting data across many countries, we enable brands to launch global campaigns without the need for additional service providers. |
|
|
· |
Integrated Brand Safety Tools. Our platform includes a suite of integrated TubeMogul and third party technologies designed to help minimize unacceptable ad placements. These technologies help to detect, categorize and block sites with inappropriate content, high rates of fraudulent bot-driven traffic and auto-play ad placements. |
Our Strengths
We believe the following attributes and capabilities provide us with long-term competitive advantages:
|
|
· |
Focused on Software-Based Solutions for Brands. Our platform offers advertisers a robust and comprehensive solution for branding, which we believe differentiates our offerings from those of our competitors. We work to continuously improve our platform to provide our customers with the necessary capabilities to meet their evolving brand advertising objectives. |
|
|
· |
Empower Customers Through Our Self-Serve Model. Our Platform Direct customers have direct access to our platform which enables them to execute their own strategies for their advertising spend. As a result of the performance and functionality of our platform, we believe many of our customers rely on our platform for a significant and growing portion of their advertising spend. These self-serve customers are highly engaged. For example, they attend and provide input at our various weekly webinars, TubeMogul University customer conferences, and quarterly business and roadmap updates to provide ongoing feedback to our product teams and management. |
|
|
· |
Product Built for Global Opportunity. Our platform is built for managing and executing global advertising campaigns. In addition, our intuitive user interface enables geographically dispersed personnel within a global organization to work together seamlessly with an auditable workflow. We have operations in many large advertising markets. |
|
|
· |
Industry Pioneer. We believe we were the first to deliver a programmatic digital video advertising platform designed exclusively for advertisers, and as a result, we believe we have developed a deep expertise and a strong reputation in our market. Additionally, we demonstrate thought leadership through industry initiatives such as founding the Open Video Viewability consortium and creating the first education and certification program for programmatic video. |
8
|
|
· |
Attractive and Scalable Financial Model. We are able to scale our operations in a highly efficient manner with our Platform Direct offering. Because our Platform Direct offering allows advertisers to continuously run campaigns on a self-serve basis, we require fewer sales resources following initial sales and, therefore, our sales expense tends to represent a lesser portion of follow-on Platform Direct Spend. |
|
|
· |
Experienced Team. We are a founder-led software company that has been focused on developing innovative software solutions for brand advertising since we were founded in 2007. The extensive industry and technology experience of our management team has allowed us to create and maintain a culture of innovation at every level of the company. |
Our Strategy
We believe that the advertising market is in the early stages of a significant shift toward enterprise software solutions that address the complexities of brand advertising. We intend to capitalize on this opportunity by pursuing the following key growth strategies.
|
|
· |
Expand Our Customer Base. Our global sales force is focused on growing the number of our customers, particularly our Platform Direct customers. To increase our global market share, we continue to invest in training and other initiatives to increase the productivity of our sales personnel. |
|
|
· |
Increase Our Share of Our Customers’ Advertising Spend. We continue to add features, functionality and inventory channels (e.g. PTV) to our platform that encourage customers to consolidate, and ultimately increase, their advertising spend on our platform. Our customer support team trains and educates our Platform Direct customers on these new features and identifies opportunities to capture an increased share of advertising spend from our existing customers. |
|
|
· |
Migrate Platform Services Customers to Platform Direct. We plan to continue to focus on educating our Platform Services customers about the benefits of our Platform Direct solution. Using our Platform Direct solution, customers are frequently able to save fifty percent of the fees exclusive of media costs that they would typically pay using our Platform Services solution. Using the self-service features of our Platform Direct solution, customers gain increased control over the execution of their campaigns and increased transparency into impression-level economics as compared to traditional insertion order, or IO, based purchasing. We believe that an increased migration to our Platform Direct solution will ultimately increase the number of recurring campaigns and size of advertising spend on our platform and as a result, increase our gross profit. |
|
|
· |
Expansion Into Cross-Screen Advertising. We have added television advertising and other digital advertising formats, including display and social, to our platform. The expansion into TV expands our addressable market and the addition of other digital formats makes our platform more compelling to brand advertisers that desire a single platform to manage all of their media buying. |
|
|
· |
Continue to Innovate. We intend to continue to make substantial investments in our platform by introducing enhancements and new features and functionality that position us to capture a larger share of new market opportunities. In addition to improving our algorithms and underlying software, we also intend to continue to invest in ways of extracting greater value from the data we collect for the benefit of our customers. We believe these investments will enhance our value proposition for both existing and prospective customers. |
|
|
· |
Extend Global Footprint. To best support our global advertisers, we plan to utilize our cloud-based architecture to expand our international presence in a cost-effective manner. |
Our Customers
Our customers include many of the world’s leading advertisers. For example, during 2015, advertising for 94 advertisers listed on the 2014 AdAge Top 100 U.S. Brands was placed through our platform. Our Platform Direct customers primarily consist of brands, agencies, agency trading desks, ad networks and publishers. Our Platform Services customers are primarily composed of media agencies working on behalf of brand advertisers. For 2015, we had 446 Platform Direct Clients and we had 271 Platform Services customers that had Total Spend of at least $10,000 through our platform. For this purpose, all branches of a single entity are considered a single Platform Services customer. Platform Direct customers that had Total Spend with us of less than $10,000 through our platform had spend of $0.6 million, $0.7 million and $0.4 million in the years ended December 31, 2015, 2014 and 2013, respectively.
There were no customers that accounted for more than 10% of our revenue during the years ended December 31, 2015, 2014 and 2013. For this purpose, we define a Platform Direct customer as one which operates under a distinct contract with us for our Platform Direct offering and we define a Platform Services customer as one which has provided an IO and has a distinct billing address. Branches or divisions of an advertiser that operate under distinct contracts are generally considered as separate customers. In particular, we treat as separate customers different groups within global advertising agencies if they are based in different jurisdictions
9
or with respect to which we have negotiated and manage separate contractual relationships. If all branches and divisions within each global advertising agency were considered to be a single customer, Publicis Groupe SA would have represented 18%, 12% and 11% of our revenue for the years ended December 31, 2015, 2014 and 2013, respectively; WPP plc would have represented 14%, 17% and 20% of our revenue for the years ended December 31, 2015, 2014 and 2013, respectively; Interpublic Group would have represented 11% and 11% of our revenue in the years ended December 31, 2015 and 2013, respectively.
Information about Segment and Geographic Revenue
Information about segment and geographic revenue is set forth in Note 11 to the Notes to Consolidated Financial Statements under Item 8 “Financial Statements and Supplementary Data” of this Report.
Our Platform
Our platform integrates the various technology components and ad inventory sources required to enable advertisers to manage and execute their advertising campaigns globally. Our platform is cloud-based and accessed using a simple and intuitive user interface. The components are organized into the three phases of managing a campaign: campaign planning, campaign execution and campaign measurement. The following graphic illustrates these components of our platform:
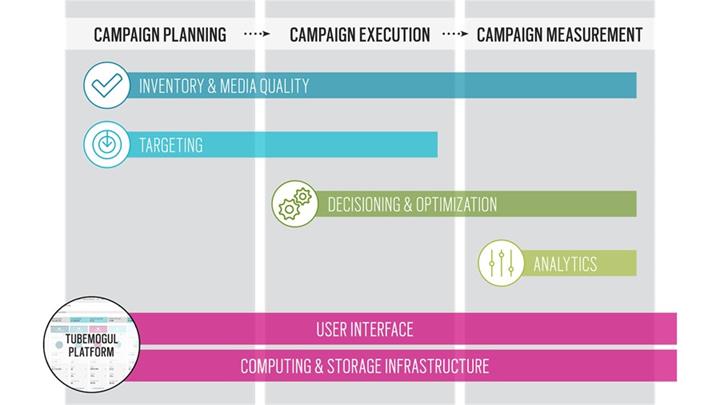
User Interface
Our user interface simplifies the ad buying process and enables advertisers to launch sophisticated campaigns in minutes. Each feature of the interface has been designed with the user in mind and offers an intuitive approach to planning campaigns, buying impressions, optimizing spend and measuring campaign effectiveness. Users can easily view trends in key campaign statistics over any time period, view sites, pacing, spend and key statistics for each placement and manage campaigns, creative assets, inventory sources and brand surveys from one interface.
10
Campaign Planning
Customers access the information critical for campaign planning and then select the campaign parameters they require. Our interface dynamically predicts available inventory levels based on the targeting options and ad formats selected by the customers. In addition, advertisers can choose to ingest their TV plans in order to develop optimized cross-screen plans down to the site and app level.
Global Inventory
Using our platform, customers can access inventory across both public and private sources of inventory, on desktop, mobile and connected TV devices, in over 70 countries. We display inventory availability by publisher and ad format, enabling our customers to plan campaigns more effectively.
|
|
· |
Public Inventory Sources. We connect with a large number of ad exchanges, including all major video exchanges. In addition, our Select Access offering allows access to inventory from premium publishers that only make their inventory available to designated high quality advertisers. |
11
|
|
· |
Private Inventory Sources. Many publishers seek to control their premium inventory and offer it directly to advertisers. Using our platform, advertisers can establish an automated connection to inventory they buy directly from premium publishers using our platform. By consolidating private inventory onto our platform, customers benefit from integrated planning, buying and reporting for their entire video buy. This provides customers with a more streamlined workflow, consistent application of targeting data and optimization across sources of inventory. |

Inventory Quality
BrandSafe is our multi-layered approach to protect brand equity that is part of our core platform and includes:
|
|
· |
SiteSafe. Every site that is available on our platform has been manually screened and categorized into a 3-Tier structure by site quality. Advertisers have control over which tiers they are comfortable running on and are able to select sites before, and even during, a campaign. |
|
|
· |
PageSafe. PageSafe examines the content of individual web pages and determines if they contain objectionable content. This technology is integrated into our real-time buying process, so we can block ads before they are served on pages with offensive content. Pages are categorized into safety ratings (G, PG-13, PG, R) and topics that may be objectionable to the advertiser, such as alcohol, tobacco or adult content. Advertisers can select the safety rating and topics on which they want to avoid running ads. |
|
|
· |
PlaySafe. PlaySafe prevents in-banner auto-play video ads from running within display banners on low quality sites. We manually identify and categorize these placements on the platform and run PlaySafe technology to detect ad unit and video player size. |
Audience Targeting
Our platform offers advertisers control over multiple targeting parameters to enable them to deliver campaigns to their desired audiences. Targeting options that can be selected include first- and third-party audience data, site-level contextual targeting, keyword topic targeting, global geo targeting, device, operating system, day of week and time of day.
Ad Formats and Rich Media
There are many different ways to present advertising on digital devices and we enable access to inventory across ad formats including: pre-roll video, in-banner (user-initiated) video, display, social, mobile, tablet and connected TV. An ad configurator within our platform allows simple and rapid creation of interactive creative elements, such as call-to-action animations, banner overlays or social network sharing buttons.
Campaign Execution
Our powerful, real-time optimization and decisioning engine helps enhance brand advertising performance while at the same time focusing on brand safety.
12
Media Buying
Our platform automates impression buying and ad serving for campaigns. Based on budget and targeting parameters set in the planning module, our platform continually evaluates impressions across sources of inventory and dynamically bids for each impression. When an auction is won, the platform serves the ad to the publisher site to be displayed to the user. The entire process typically takes less than 0.25 seconds.
Decisioning and Optimizing
Our platform enables customers to purchase the “best” impression each time according to the audience targeting criteria established in the campaign planning phase. Each second, our platform evaluates as many as 500,000 ad impressions, determines which impressions would be desirable for our customers, based on their targeting criteria, and bids accordingly.
In addition to the decisions made on each bid for an ad impression, our platform continually evaluates which of the criteria are delivering the best performance and then automatically makes adjustments to the bidding strategy to help maximize overall campaign performance.
Fraudulent Placements and Brand Safety
Using site, page and player safety technology, our platform is designed to screen and block sites with objectionable content, in-banner auto-play ad placements and fraudulent bot-driven traffic, with the goal of ensuring that ad placements are consistent with campaign objectives. Our multi-layered approach for protecting brand equity includes manual site screening and categorizing of websites according to content quality, combined with technology that assesses page and placement level content.
Campaign Measurement
We reduce the complexity typically associated with ad buys by offering a unified view of advertising performance across the campaign for all sources of inventory. Comprehensive and granular site, audience and video level analytics are delivered in real-time across all sources of inventory accessed through our platform.
Audience Verification
We enable advertisers to compare the reach and frequency of their digital and TV campaigns with a common GRP metric through our integration with Nielsen reporting. In addition, our audience analytics help brands gain valuable insights into the types of consumers they reach with information about age, gender and other relevant demographic traits that are important to advertisers. Using our platform, advertisers are able to dynamically review gender distribution, verify the audience reached by a campaign and cost per point and review the age breakdown for each campaign.
Brand Metrics
We offer our proprietary integrated brand survey module that enables advertisers to understand the impact of a campaign with survey-based measurement of brand awareness, favorability, purchase intent and other metrics. We also support major third-party brand survey providers.
Analytics
We provide transparent, site-by-site analytics that enable advertisers to measure the effectiveness of their campaigns. Detailed information on how viewers are consuming videos, display and social ads includes real-time tracking and analysis for metrics such as viewed minutes, completion rates, playtime per view, social shares and geo tracking down to the city level.
Viewability Measurement
We offer viewability reporting that enables advertisers to determine whether their ads were viewed based upon 11 metrics including viewable impressions, viewability rate, viewable completions and player size. Our viewability reporting is based on OpenVideoView, an open source software technology originally developed by us. We founded the OpenVideoView consortium, which is currently supported by over 30 industry members. We also integrate with third party viewability measurement providers.
13
BrandSights
BrandSights is an integrated survey module that enables advertisers to gather insights in real-time. In the same way campaigns are set up and managed on our platform, BrandSights enables customers to easily create, target and launch customized surveys to measure brand awareness, favorability and purchase intent.
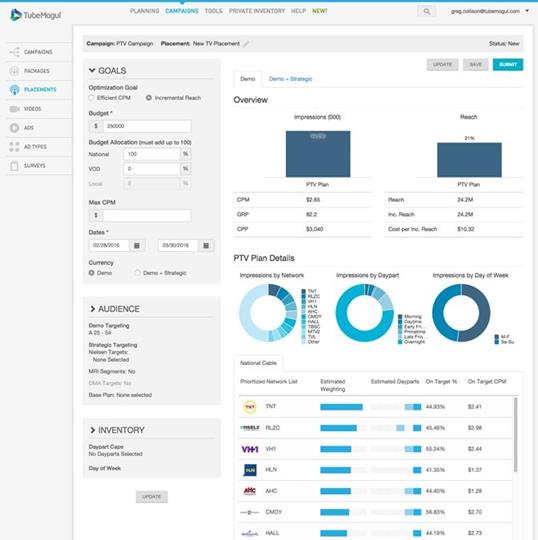
Programmatic Television (PTV)
TubeMogul PTV provides advertisers with an automated solution to plan, buy and measure TV ads. PTV enables brands to access linear TV inventory and use richer audience attributes to target their TV buys, all through the same software they use to execute their digital ad buys. As shown below, brands use our platform to plan their TV advertising spend, enabling a uniform and comprehensive view of their advertising plans.
Customer Service, Support and Training
We offer a full-service campaign management solution that runs on our platform for those advertisers seeking to transact on a campaign-by-campaign basis using our Platform Services team. This team utilizes our platform to execute campaigns according to customer specifications. Our sales and support teams respond to RFPs, execute campaigns and provide periodic reporting.
As part of our Platform Direct offering, we provide a dedicated customer support team to our customers. This team assists customers with advanced campaign setup and execution as needed. This team also educates customers on the benefits of our platform and provides training to customers to enable them to extract the most value from our platform. We also have a dedicated training team that designs the training curriculum, manages our extensive “Help Wiki” that customers can access via our platform, and runs the certification program we offer our customers to verify their skill level in using our platform.
14
Technology and Infrastructure
Our platform is the result of a significant and sustained financial investment over years of research and engineering efforts. Our product and research and development organizations are responsible for the design, development and testing of our platform. We are committed to continuous innovation and rapid introduction of new technologies, features and functionality that bring value to our customers.
Core elements of the platform include:
|
|
· |
Scalable Big Data Architecture. Our platform is composed of scalable and flexible services built from proprietary and open-source technologies. On a daily basis, the platform reviews billions of ad opportunities and runs over 10 terabytes of queries on this data. Our platform infrastructure is a hybrid of cloud services and collocated facilities in six global data centers across three continents. |
|
|
· |
Real-Time Bidding. On average, our real-time bidding technology evaluates more than 40 billion ad opportunities per day, and ad opportunities are evaluated in less than approximately 50 milliseconds. Our core bidding technology utilizes adapters that allow it to communicate in the format required by different sources of inventory. This allows our platform to easily adapt to a variety of inventory formats, including across channels such as mobile and connected TV. |
|
|
· |
User Demographics Predictive Models. Our machine learning team leverages the massive data sets captured by our platform to build predictive models around user demographic attributes to maximize alignment with Nielsen Online Campaign Ratings and/or Comscore Validated Campaign Essentials, the primary third-party verification services for the digital advertising industry. Data from our platform is continually fed back into these models, which are reconstructed daily, and improve with engagement with consumers. |
|
|
· |
Optimization. During campaign execution, the optimization engine continually scores a variety of attributes of each impression, such as website, industry vertical or geography, for their likelihood to achieve campaign performance goals. Our real-time bidding engine then shifts budget in real-time to those delivering the most optimal performance. Our platform enables customers to set multiple, simultaneous optimization goals. |
|
|
· |
Ad Serving. Our platform includes a robust, globally-distributed video ad server capable of low-latency delivery of digital ads onto digital devices. The ad server supports uploading video and other types of files, transcoding files into the required format and rendering custom interactive components. |
|
|
· |
Real-Time Analytics. Data is collected regarding inventory available for ad opportunities for continuous assessment of the availability of advertising inventory and the associated costs of that inventory. In addition, real-time campaign delivery and spend totals are used to manage campaign budgets and goal caps, as well as for campaign reporting. All collected data is fed back into the optimization engine to improve campaign performance, and into machine-learning models for user demographic predictive modeling. |
|
|
· |
World-Class User Interface. A self-serve user interface provides a robust and intuitive set of campaign workflow management, data reporting and visualization tools, ensuring advertising campaigns can be easily managed by our broad customer set. User experience and interface design have been paramount in designing an interface that is as simple as most consumer products. |
|
|
· |
Partner Integrations. Our platform is integrated with over 300 sources of inventory and dozens of data management platforms and data exchanges, making thousands of targeting segments available for reaching a desired audience through our platform. Our platform incorporates numerous third-party ad servers, ad verification services, survey vendors and other third-party campaign tools to streamline various campaign execution processes. |
The technical infrastructure for our platform is currently primarily managed through third-party web hosting services providers, or third-party service providers, and to a limited extent our own servers which are located at a third-party data center facility. We do not have long term agreements with these service providers and the operator of the data center facility.
Our research and development expenses were $41.0 million, $22.1 million and $11.8 million for the years ended December 31, 2015, 2014 and 2013, respectively.
Sales and Marketing
Sales
Our global sales force is focused on growing the number of our customers, particularly our Platform Direct customers. We plan to selectively add to our sales force. Our Platform Direct sales team sells our software solution to customers who want to directly manage and execute their digital and television advertising initiatives. These customers include brands, agencies, agency trading desks, ad networks, and publishers seeking to augment their own inventory to satisfy their campaign commitments. Platform Direct
15
sales are complex and difficult to complete. Prospective customers generally consider a number of factors at a senior level and over an extended period of time. Our Platform Direct sales team seeks to build relationships with senior-level decision makers, usually vice president and above at these organizations, and focuses their efforts on informing prospective customers about the value our platform offers. Our Platform Services team primarily addresses media agencies working on behalf of brand advertisers who prefer a fully managed service solution and typically purchase through an RFP and IO process. Our Platform Services team includes salespeople and the account managers who execute and optimize campaigns on our customers’ behalf.
Marketing
Our marketing activities are focused on increasing awareness of our brand, executing thought-leadership initiatives, supporting our direct sales team and generating new advertiser leads. We seek to accomplish these objectives by presenting at industry conferences, hosting customer conferences, publishing white papers and research, public relations, social media, and executing integrated advertising campaigns that include direct e-mail, digital advertising, webinars and blog posts.
We host three annual customer conferences, known as TubeMogul University, in North America, Europe and Asia-Pacific. We offer 2-3 days of education, training and other activities at these conferences. We believe these events have increased our profile in each region, developed our reputation as a thought-leader in the industry and helped to solidify relationships with customers.
Employees and Culture
As of December 31, 2015 we had 577 worldwide employees, 103 of which are located outside of the United States. Our corporate headquarters are located in Emeryville, California. None of our employees are covered by collective bargaining agreements. We believe our employee relations are good and we have never experienced any work stoppages.
We have a strong, founder-led culture that is cultivated and sustained through highly coordinated training and performance management. We have received many industry awards, including being ranked as a Leader in the Forrester Video Advertising DSP Wave in December 2015, receiving the 2013 ASPY Award for Best Customer Service and being named in 2015 as 5th Best Place to Work by Glassdoor for Small and Medium Businesses in the U.S.
Competition
The market to provide programmatic solutions for brand advertising is at an early stage of development. As such, this market is rapidly evolving and highly competitive, subject to changing technology, branding objectives and customer demands. We compete primarily with companies developing solutions to automate the purchase of video advertising impressions across multiple sources of inventory. We also compete with other companies that address certain aspects of the digital video advertising market, including demand-side platforms and video-focused ad networks, and in-house tools and custom solutions currently used by brand advertisers and their agencies and by publishers to manage advertising activities. In addition, we compete for advertising spend with large entities that offer digital video advertising services as part of a larger solution for digital media buying. In the future, we may compete with companies developing comprehensive marketing platforms. Other companies that offer analytics, mediation, exchange or other third-party specific technologies may also compete with us. As our platform evolves and we introduce new technologies, features and functionality of our platform, we may become subject to additional competition. Some of our competitors in the broader digital advertising market, such as Google, AOL (recently acquired by Verizon), Yahoo! and Adobe have substantially greater resources and longer histories than us in the digital advertising space, may actively seek to serve our market and have the power to significantly change the nature of the marketplace to their advantage. These companies could develop and offer new solutions that directly compete with ours or leverage their position to make changes to their existing platforms that could be disadvantageous to our competitive position.
We believe the principal competitive factors in our industry include the availability of brand-focused tools and an easy to use user interface, the capability to enable advertisers to effectively reach target audiences, multi-device campaign execution capability, buy-side positioning, proven and scalable technologies, relationships with leading brand advertisers and their respective agencies and brand awareness and reputation. We believe that we compete favorably with respect to all of these factors and are well-positioned as a provider of a brand advertising software platform.
Intellectual Property
The protection of our technology and intellectual property is an important component of our success. We rely on intellectual property laws, including trade secret, copyright, trademark and patent laws in the U.S. and abroad, and use contracts, confidentiality procedures, non-disclosure agreements, employee disclosure and invention assignment agreements and other contractual rights to protect our intellectual property.
16
As of December 31, 2015, we hold one issued U.S. patent, which expires in 2028, and have filed various non-provisional and provisional patent applications in the U.S. In addition, we maintain a trademark portfolio including common law trademarks, trademark applications pending in the U.S., Canada and the European Union, or EU, and a trademark registration with the World Intellectual Property Organization.
Circumstances outside of our control could pose a threat to our intellectual property rights. Effective intellectual property protection may not be available in the U.S. or other countries in which we provide our solution. In addition, the efforts we have taken to protect our intellectual property rights may not be sufficient or effective. Any impairment of our intellectual property rights could harm our business, our ability to compete and harm our operating results. In addition, as the number of competitors grows and solutions of competitors overlap, we may in the future face claims by third parties that we infringe upon or misappropriate their intellectual property rights, and we may be found to be infringing upon or to have misappropriated such rights. In the future, we, or our customers, may be the subject of legal proceedings alleging that our solutions or underlying technology infringe or violate the intellectual property rights of others.
Privacy and Government Regulation
We and our customers use data about Internet users collected through our platform to manage and execute ad campaigns in a variety of ways, including delivering advertisements to Internet users in particular geographic locations and using particular devices, and to enhance the accuracy of our demographic categorization of websites and Internet users. In addition, our customers may elect to use their own data about Internet users and data segments provided by third-party data companies on our platform to target advertisements to particular audiences. We do not use data that can be used to identify specific people by name, and we take steps to avoid collecting such personally identifiable information from any source. The definition of personally identifiable information, personal information or personal data, however, varies by country and is evolving, and therefore we have to continually assess our technology platform against an evolving legal landscape. Future regulation affecting our ability to collect and use this data could harm our business. The collection and use of data about Internet users has come under scrutiny by consumer advocacy organizations and regulatory agencies in the U.S. and abroad. More specifically, these groups have voiced concern about the use of cookies and other online tools to record an Internet user’s browsing history, and the use of that information to deliver advertisements online based on inferred interests of the Internet user. If future regulation, industry standards or consumer preferences make the collection or use of such data more difficult or impracticable, the value of online advertising could be adversely affected which, in turn, could impact the demand for our products. The costs of compliance with privacy and other laws and regulations are high and are likely to increase in the future and any failure on our part to comply with laws and regulations may expose us to significant liabilities.
We participate in several industry self-regulatory organizations, including the Network Advertising Initiative, or NAI, the Digital Advertising Alliance, or DAA, and the Internet Advertising Bureau. The self-regulatory principles for “interest based” or “online behavioral” advertising upheld by the NAI, the DAA and other organizations require us to provide consumers with notice and choice, including the ability to opt out of interest-based advertising. Our privacy policy offers consumers an easy, one-click opt-out mechanism, which we highlight for consumer users by using an icon with a link to our privacy policy in or around advertisements we handle that are targeted based on consumer interests. In addition to industry self-regulation, our compliance with our privacy policy is also subject to regulation by the U.S. Federal Trade Commission which may bring enforcement actions under Section 5 of the Federal Trade Commission Act against unfair and deceptive trade practices, including the violation of privacy policies.
Corporate Information
TubeMogul was incorporated in California in March 2007 and reincorporated in Delaware in March 2014. Our principal executive offices are located at 1250 53rd Street, Suite 2, Emeryville, California 94608, and our telephone number is (510) 653-0126. Our corporate website address is www.tubemogul.com.
Available Information
We file Annual Reports on Form 10-K, Quarterly Reports on Form 10-Q, Current Reports on Form 8-K, proxy and information statements and amendments to reports filed or furnished pursuant to Sections 13(a), 14 and 15(d) of the Securities Exchange Act of 1934, as amended, or the Exchange Act. The public may obtain these filings at the SEC’s Public Reference Room at 100 F Street, NE, Washington, DC 20549 or by calling the SEC at 1-800-SEC-0330. The SEC also maintains a website at http://www.sec.gov that contains reports, proxy and information statements and other information regarding TubeMogul and other companies that file materials with the SEC electronically. Copies of our reports on Form 10-K, Form 10-Q and Form 8-K, may be obtained, free of charge, electronically through our investor relations website, http://investor.tubemogul.com/sec.cfm. We have used, and intend to continue to use, our investor relations website, as well as certain blogs (http:/www.tubemogul.com/company/media-center/blog/) and Twitter accounts (@tubemogul, @bjwilson34), as means of disclosing material non-public information and for complying with its disclosure obligations under Regulation FD. The contents of the websites referred to above are not incorporated into this filing. Further, our references to the URLs for these websites are intended to be inactive textual references only.
17
You should carefully consider the risks described below together with the other information set forth in this Report, which could materially affect our business, financial condition and future results. The risks described below are not the only risks facing our company. Risks and uncertainties not currently known to us or that we currently deem to be immaterial also may materially adversely affect our business, financial condition and operating results. If any of the following risks is realized, our business, financial condition, results of operations and prospects could be materially and adversely affected. In that event, the trading price of our common stock could decline.
Risks Related to Our Business
We have a history of losses and we may not achieve or sustain profitability in the future.
We have incurred losses in each fiscal year since our incorporation in 2007 and had an accumulated deficit of $37.0 million as of December 31, 2015. We may not be profitable in the future as we anticipate that our operating expenses will increase significantly in the foreseeable future as we continue to invest in research and development to enhance our platform and in sales and marketing to acquire new customers. These efforts may prove more expensive than we currently anticipate, and we may not succeed in increasing our revenue sufficiently to offset these higher expenses. Even if we are successful in increasing our customer base, we may not become profitable in the future or may be unable to maintain any profitability achieved if we fail to increase our revenue and manage our operating expenses or if we incur unanticipated liabilities. Although our revenue has increased substantially in recent periods, the rate of growth has declined in recent quarters. We may not be able to slow or reverse this decline in the revenue growth rate and we may not be able to sustain current revenue levels. Revenue growth may slow or revenue may decline for a number of reasons, including slowing demand for our offering, increasing competition, lengthening sales cycles, decelerating growth of, or declines in, our overall market, or our failure to capitalize on growth opportunities or to introduce new offerings. We could also incur increased losses as we continue to focus on growing our Platform Direct offering because the sales cycle with those customers tends to be protracted, resulting in the majority of costs associated with sales of our Platform Direct offering being generally incurred up front, while customers are billed over time through our usage-based pricing model. Any failure by us to achieve and maintain profitability could cause the price of our common stock to decline significantly.
Our limited operating history makes it difficult to evaluate our current business and future prospects.
Although we began our operations in March 2007, we did not launch our platform or begin generating substantial revenue until the second half of 2011. While we have experienced significant growth in recent periods, our short operating history and developing business model make it difficult to evaluate our current business and our future prospects. We have encountered and will continue to encounter risks and difficulties frequently experienced by growing companies in rapidly developing and changing industries, including challenges in forecasting accuracy, determining appropriate investments of our limited resources, market acceptance of our platform and future features and functionality, competition from new and established companies, including those with greater financial and technical resources, acquiring and retaining customers and increasing revenue from existing customers, enhancing our platform and developing new technologies, features and functionality. You should consider our business and prospects in light of the risks and difficulties that we will encounter as we continue to develop our business model. We may not be able to address these risks and difficulties successfully, which would materially harm our business and operating results and cause the market price of our common stock to decline.
We may not maintain our recent revenue growth.
Our revenue growth will depend, in part, on our ability to acquire new customers, gain a larger amount of our existing customers’ advertising spend, continue to innovate and develop new technologies, features and functionality, extend our global footprint and increase our share of and compete successfully in new, growing digital video advertising markets, and we may fail to do so. A variety of factors outside of our control could affect our revenue growth, including changes in spend budgets of advertisers and the timing and size of their spend. Decisions by advertisers to delay or reduce their advertising spending or divert spending away from video advertising could slow our revenue growth or reduce our revenue. Our success in implementing our strategy of migrating customers from our Platform Services offering to our Platform Direct offering could also slow our revenue growth as we recognize a higher amount of revenue from the same amount of spend associated with our Platform Services offering than with our Platform Direct offering. You should not consider our recent growth rate in revenue as indicative of our future growth.
We may experience quarterly fluctuations in our operating results due to a number of factors which make our future results difficult to predict and could cause our operating results to fall below expectations.
Our quarterly operating results may fluctuate due to a variety of factors, many of which are outside of our control. As a result, comparing our operating results on a period-to-period basis may not be meaningful. You should not consider our past results, including our recent growth rates in terms of advertising spend and revenue, as indicative of our future performance.
18
In addition to other risk factors listed in this section, factors that may affect our quarterly operating results include the following:
|
|
· |
fluctuations in demand for our platform, including seasonal variations in our customers’ advertising spend; |
|
|
· |
the level of advertising spend managed through our platform for a particular quarter and the mix between spend managed through our Platform Direct offering and Platform Services offering; |
|
|
· |
budgeting cycles and changes in video advertising budgets of and spending by our customers; |
|
|
· |
the length and associated unpredictability of our sales cycle; |
|
|
· |
the timing and amount of operating expenses related to the maintenance and expansion of our business, operations and infrastructure; |
|
|
· |
the timing and amount of investment in the development of new technologies, and features and functionality of our platform; |
|
|
· |
changes in the availability or price of advertising inventory; |
|
|
· |
the timing and success of changes in our offerings or those of our competitors; |
|
|
· |
changes in our pricing or pricing of our competitors’ solutions and changes in the pricing of digital video advertising generally; |
|
|
· |
network outages or security breaches or the perception that our platform or customer or consumer data is not secure and any associated expenses; |
|
|
· |
delay between our payments for advertising inventory purchased through our platform and our subsequent collection of fees from our customers related to that inventory; |
|
|
· |
changes in the competitive dynamics of our industry, including consolidation among competitors or customers; |
|
|
· |
changes in government regulation applicable to our industry; |
|
|
· |
foreign currency exchange rate fluctuations; and |
|
|
· |
general economic and political conditions in our domestic and international markets. |
Based upon all of the factors described above, we have a limited ability to forecast our future revenue, costs and expenses, and as a result, our operating results may from time to time fall below our estimates.
If our customers do not maintain and increase their advertising spend through our platform, our revenue growth and results of operations will be adversely affected.
Our contracts and relationships with advertisers generally do not include long-term or exclusive obligations requiring them to use our platform or maintain or increase their advertising spend on our platform. Furthermore, advertisers generally use multiple providers in managing advertising spend. Accordingly, we must convince our customers to use our platform, increase their usage and spend a larger share of their advertising budgets with us, and do so on an on-going basis. We may not be successful at educating and training customers, particularly our newer customers, on the benefits of our platform to increase usage and generate higher levels of advertising spend. If these efforts are unsuccessful or advertisers decide not to continue to maintain or increase their advertising spend through our platform for any other reason, then we may not attract new advertisers or our existing customers may reduce their video advertising spend through or cease using our platform. Therefore, we cannot assure you that advertisers that have generated advertising spend through our platform in the past will continue to generate similar levels of advertising spend in the future or that they will continue to use our platform at all. We may not be able to replace customers who decrease or cease their usage of our platform with new customers that spend similarly on our platform. If our existing customers do not continue to use and increase their use of our platform, or if we are unable to attract sufficient advertising spend on our platform from new customers, our revenue could decline, which would materially and adversely harm our business and results of operations.
The market for software-based digital video advertising for brands is relatively new and evolving. If this market develops slower or differently than we expect, our business, growth prospects and financial condition would be adversely affected.
The substantial majority of our revenue has been derived from customers that purchase digital video advertising through our platform either on a self-serve basis or with us executing campaigns for them. We expect that spend on digital video advertising will continue to be our primary source of revenue for the foreseeable future, and that our revenue growth will largely depend on increasing digital video advertising spend through our platform. The market for digital video advertising is an emerging market and today advertisers generally devote a smaller portion of their advertising budgets to digital video advertising than to traditional advertising methods, such as TV, newspapers, radio and billboards. Our current and potential customers may find digital video advertising to be less effective than other brand advertising methods, and they may reduce their spending on digital video advertising as a result. To
19
date, digital advertising has been primarily for performance-based advertising, or relatively simple display advertising such as banner ads on websites and, until recently, was principally focused on online channels such as desktops. Emerging channels such as mobile and social media are unproven and may not develop into viable channels. The future growth of our business could be constrained by both the level of acceptance and expansion of digital video advertising as a format and emerging digital video advertising channels, including mobile video, connected TV, social video and TV formats such as video on demand, as well as the continued use and growth of existing channels. To date, our revenue has been derived primarily from advertising served to desktops. Even if these new channels become widely adopted, advertisers may not increase their advertising spend through platforms such as ours. If the market for digital video advertising deteriorates, develops more slowly than we expect or the shift from traditional advertising methods to digital video advertising does not continue, or there is a reduction in demand for digital video advertising caused by weakening economic conditions, decreases in corporate spending, perception that digital video advertising is less effective than other media or otherwise, it could reduce demand for our offerings, which could decrease revenue or otherwise adversely affect our business.
We have recently added the capability to buy linear television advertising using our platform. The market for software-based solutions for linear television advertising is new and unproven. Our current and potential customers may find software-based solutions for linear television advertising purchasing to be less effective than traditional methods, and they may determine not to utilize such solutions. The future growth of our business could be constrained by both the level of acceptance and expansion of the market for software-based solutions for linear television advertising. If the market for software-based solutions for linear television advertising develops more slowly than we expect, it could reduce demand for our offerings, which could decrease revenue or otherwise adversely affect our business.
We may not be able to compete successfully against current and future competitors.
We operate in a rapidly evolving and highly competitive market, subject to changing technology, branding objectives and customer demands and with many companies providing competing solutions. We compete primarily with companies developing solutions to automate the purchase of digital video advertising impressions across multiple sources of inventory. We also compete with other companies that address certain aspects of the online digital video advertising market, including demand-side platforms and video-focused ad networks, and in-house tools and custom solutions currently used by brand advertisers and their agencies and by publishers to manage advertising activities. In addition, we compete for advertising spend with large entities that offer digital video advertising services as part of a larger solution for digital media buying. In the future, we may compete with companies developing comprehensive marketing platforms. Other companies that offer analytics, mediation, exchange or other third-party specific technologies may also compete with us. As our platform evolves and we introduce new technologies, features and functionality of our platform, we may become subject to additional competition. Some of our current and prospective competitors in the broader digital advertising market have substantially greater resources and longer histories than us in the digital advertising space, may actively seek to serve our market and have the power to significantly change the nature of the marketplace to their advantage. These companies could develop and offer new solutions that directly compete with ours or leverage their position to make changes to their existing platforms that could be disadvantageous to our competitive position. We expect competition to increase with the changes in the competitive dynamics of our industry, including increasing consolidation among our competitors, customers and partners.
Increased competition may result in reduced pricing for our platform, longer sales cycles or a decrease of our market share, any of which could negatively affect our revenue and future operating results and our ability to grow our business. A number of competitive factors could cause us to lose potential sales or to sell at lower prices or at reduced margins, including, among others:
|
|
· |
competitors may establish or strengthen relationships with brands, agencies, sources of inventory or other parties, thereby limiting our ability to promote our platform and generate revenue; |
|
|
· |
competitors could introduce solutions that are similar to, or broader, than ours or comprehensive platforms that provide integrated solutions for multiple advertising channels including display, mobile and video; |
|
|
· |
competitors could reduce the prices they charge to brand advertisers and agencies; |
|
|
· |
companies may enter our market by expanding their platforms or acquiring a competitor; and |
|
|
· |
companies marketing search, social, display, mobile or web analytics services could bundle digital video advertising solutions or offer such products at a lower price as part of a larger product sale. |
In addition, many of our competitors, such as Google, AOL (recently acquired by Verizon), Yahoo! and Adobe, have greater customer relationships and financial, marketing and technical resources than we do, allowing them to leverage a larger customer base, adopt more aggressive pricing policies, and devote greater resources to the development, promotion and sale of their products, services and solutions, including products that may be based on new technologies or standards, than we can. Some of these large competitors also have substantial proprietary video advertising inventory that may provide them with competitive advantages, including far greater access to Internet data, the ability to significantly influence pricing for video advertising inventory and the ability to control access to proprietary inventory. If our competitors’ solutions become more accepted than our solution, our competitive position will be impaired and we may not be able to increase our revenue or may experience decreased gross margins.
20
We may not be able to compete successfully against current and future competitors. If we cannot compete successfully, our business, results of operations and financial condition could be negatively impacted.
If we are successful at increasing adoption of our self-serve platform, we may become dependent on a limited number of customers for a large portion of our revenue, which could impact the predictability of our revenue and adversely impact our results of operations.
To the extent our self-serve platform is adopted by major brands and other large advertisers, we may become more dependent upon a limited number of customers for a larger portion of our revenue. Since large advertisers tend to spend a much greater amount on advertising campaigns than our typical customers have in the past, it would be difficult to maintain our revenue growth rate without increases in spending from these customers. It also would be difficult to replace any revenue generated by these customers to the extent they lower their spend through our platform. Accordingly, if our revenue concentration increases and our largest customers do not generate revenue at the levels or within the timeframes that we expect, our ability to maintain or increase our revenue and meet our quarterly guidance will be adversely affected. Additionally, larger customers often seek to gain greater pricing concessions which can adversely impact our results of operations.
A substantial portion of our business is sourced through advertising agencies that do not pay us until they receive payment from the brand, therefore increasing the length of time between our payment for media inventory and our receipt of payment for use of our platform, and our ability to collect for non-payment may be limited to the brand, increasing our risk of non-payment.
Substantially all of our Platform Services revenue and a substantial majority of our Platform Direct revenue is sourced through advertising agencies. We contract with advertising agencies as an agent for the brand. We remit payment for media inventory purchased through our platform by our Platform Direct and Platform Services customers in advance of receiving payment from them as the advertising agency does not pay us for use of our platform until it has received payment from the brand. This payment process will increasingly consume working capital if we continue to be successful in growing our business. In addition, we typically experience slow payment by advertising agencies as is common in our industry. In this regard, we had average days sales outstanding, or DSO, of 103 days, and average days payable outstanding, or DPO, of 86 days for 2015. We compute our DSO and DPO as of a given date based on our average trade receivables or trade payables, respectively, for the trailing twelve month period divided by, for DSO, daily Total Spend and for DPO, daily cost of revenue and operating expenses, excluding noncash and payroll related expenses, in each case, over such period. The average trade receivables or trade payables are the average of the trade receivables or trade payables balances at the beginning and end of the twelve month period. Daily Total Spend is the spend for the trailing twelve month period divided by 365 days. Daily cost of revenue and operating expenses are the cost of revenue and operating expenses, excluding noncash and payroll related expenses, for the trailing twelve month period divided by 365 days. If our DSOs increase significantly, and we are unable to borrow against these receivables on commercially acceptable terms, our working capital availability could be reduced, and as a consequence our results of operations and financial condition would be adversely impacted. Many of our contracts with advertising agencies provide that if the brand does not pay the agency, the agency is not liable to us, and we must seek payment solely from the brand. Contracting with these agencies, which in certain cases have or may develop high-risk credit profiles, subjects us to greater credit risk than where we contract with brands directly. This credit risk may vary depending on the nature of an advertising agency’s aggregated brand advertiser base. Any write-offs for bad debt could have a material adverse effect on our results of operations for the periods in which the write-offs occur. Even if we are not paid, we are still obligated to pay for the advertising we have purchased for the advertising campaign, and as a consequence, our results of operations and financial condition would be adversely impacted.
Our business depends in part on advertising agencies and their holding companies as intermediaries, and this may adversely affect our ability to attract and retain business.
For the year ended December 31, 2015, over 5,000 brands executed campaigns through our platform, directly or through an agency. Many brands rely upon advertising agencies in planning and purchasing advertising. Although we maintain relationships with brands, we often do not contract with them directly. In cases where we do not have a direct contractual relationship with the brand, we sell to advertising agencies that utilize our advertising solutions on behalf of their customers. Each advertising agency allocates advertising spend from brands across numerous channels and has no obligation to work with us as it embarks on advertising campaigns. Accordingly, if we fail to maintain satisfactory relationships with an advertising agency, we risk losing business from the brands represented by that agency. If the advertising agency is owned by a holding company, this risk is magnified because we also risk losing business from the other agencies owned by such holding company and the brand advertisers those agencies represent. In addition, customer relationships with holding company media trading desks may adversely affect our business with advertising agencies affiliated with the holding company because some holding companies may seek to consolidate media buying to one trading desk and restrict their affiliated advertising agencies from relationships with providers that have a direct relationship with the trading desk. Because advertising agencies act as intermediaries for multiple brands, our customer base is more concentrated than might be reflected by the number of brands that use our platform. In addition, these intermediary relationships may impede our brand-building efforts, making it more difficult for us to achieve widespread brand awareness that is critical for broad customer adoption of our platform.
21
Our sales cycle can be long and unpredictable and require considerable time and expense before executing a customer agreement, which may make it difficult to project when, if at all, we will obtain new customers and when we will generate revenue from those customers.
The sales cycle for our Platform Direct business, from initial contact with a potential lead to contract execution and implementation, typically takes significant time and is difficult to predict. Our sales cycle in some cases has been up to nine months or more. Our sales efforts involve educating our customers about the use, technical capabilities and benefits of our platform. Some of our customers undertake a significant evaluation process that frequently involves not only our platform but also the offerings of our competitors. This process can be costly and time-consuming. As a result, it is difficult to predict when we will obtain new customers and begin generating revenue from these new customers. As part of our sales cycle, we may incur significant expenses before executing a definitive agreement with a prospective customer and before we are able to generate any revenue from such agreement. We have no assurance that the substantial time and money spent on our sales efforts will generate significant revenue. If conditions in the marketplace generally or with a specific prospective customer change negatively, it is possible that no definitive agreement will be executed, and we will be unable to recover any of these expenses. Even if our sales efforts result in obtaining a new customer, under our usage-based pricing model, the customer controls when and to what extent it uses our platform and it may not use our platform sufficiently to justify the expenses incurred to acquire the customer and integrate the customer’s data in our platform and related training and support. If we are not successful in targeting, supporting and streamlining our sales processes and if revenue expected to be generated from a prospective customer is not realized in the time period expected or not realized at all, our ability to grow our business, and our operating results and financial condition may be adversely affected. If our sales cycles lengthen, our future revenue could be lower than expected, which would have an adverse impact on our consolidated operating results and could cause our stock price to decline.
Our business and operations have experienced rapid growth in recent periods, which has placed, and may continue to place, significant demands on our management and infrastructure. If we fail to manage our growth effectively, we may be unable to execute our business plan, maintain high levels of service or address competitive challenges adequately.
We increased our number of full-time employees from 57 as of December 31, 2011 to 577 as of December 31, 2015. Our growth has placed, and may continue to place, a significant strain on our managerial, administrative, operational, financial and other resources as these personnel are integrated into and become productive within our organization. We intend to further expand our overall headcount and operations both domestically and internationally, with no assurance that our business or revenue will continue to grow to offset our investment in research and development and sales and marketing. Maintaining and growing a global organization and managing a geographically dispersed workforce will require substantial management effort, the allocation of valuable management resources and significant additional investment in our infrastructure. In this regard we will be required to continue to improve our operational, financial and management controls and our reporting procedures and we may not be able to do so effectively. Further, to accommodate our expected growth we must continually improve and maintain our technology, systems and network infrastructure. As such, we may be unable to manage our expenses effectively in the future, which would negatively impact our gross margin or operating expenses in any particular quarter. If we fail to manage our anticipated growth and change in a manner that does not preserve the key aspects of our corporate culture, the quality of our platform may suffer, which could negatively affect our brand and reputation and harm our ability to retain and attract key talent and customers.
Seasonal fluctuations in advertising spend impact our results of operations and cash flows.
Our results of operations and cash flows vary from quarter to quarter due to the seasonal nature of advertising spending. For example, many advertisers devote a disproportionate amount of their advertising budgets to the fourth quarter of the calendar year to coincide with increased holiday purchasing. In contrast, the first quarter of the calendar year is typically the slowest in terms of advertising spend. To the extent that seasonal fluctuations become more pronounced, or are not offset by other factors, our results of operations and operating cash flows could fluctuate materially from period to period.
We use a limited number of third-party service providers and data centers. Any disruption of service could harm our business.
The technical infrastructure for our platform is managed through a combination of third-party web hosting services providers, or third-party service providers, and our own servers which are located at a third-party data center facility. We do not control the operation of the third-party service providers or the operation of the third-party data center facility nor do we have long term agreements with the third-party service provider and data center facility that we utilize. The third-party service providers and owner of the data center facility have no obligation to continue to provide these services to us on commercially reasonable terms, or at all. If we are unable to renew these agreements on commercially reasonable terms, we may be required to use a new service provider or transfer to a new facility or facilities, and we may incur significant costs and possible service interruption in connection with doing so.
22
The facilities of third-party service providers and data centers are vulnerable to damage or service interruption resulting from human error, intentional bad acts, earthquakes, hurricanes, floods, fires, war, terrorist attacks, power losses, hardware failures, systems failures, telecommunications failures and similar events. Moreover, we have not implemented a disaster recovery capability whereby we maintain a back-up copy of our platform permitting us to immediately switch over to the back-up platform in the event of damage or service interruption at our data center. The occurrence of a natural disaster or an act of terrorism, any outages or vandalism or other misconduct, or a decision to close the facility without adequate notice or other unanticipated problems could result in lengthy interruptions in our platform’s performance, any of which could damage our reputation and materially and adversely affect our operating results and future prospects.
Any changes in service levels at the facilities or any errors, defects, disruptions or other performance problems at or related to the facilities that affect our platform could harm our reputation and may damage our customers’ businesses. Interruptions in our platform’s performance might reduce our revenue, subject us to potential liability, or result in reduced usage of our platform. In addition, some of our customer contracts require us to issue credits for downtime in excess of certain levels and the issuance of any credits or make-goods could harm our operating results and financial condition.
We also depend on third-party Internet-hosting providers and continuous and uninterrupted access to the Internet through third-party bandwidth providers to operate our business. If we lose the services of one or more of our Internet-hosting or bandwidth providers for any reason or if their services are disrupted, for example due to viruses or “denial-of-service” or other attacks on their systems, or due to human error, intentional bad acts, power loss, hardware failures, telecommunications failures, fires, wars, terrorist attacks, floods, earthquakes, hurricanes, tornadoes or similar events, we could experience disruption in our ability to offer our platform or we could be required to retain the services of replacement providers, any of which could increase our operating costs and harm our business and reputation.
As a result of our customers’ increased usage of our platform, we will need to continually improve our hosting infrastructure.
We have experienced significant growth in the number of customers, transactions and data that our hosting infrastructure supports. We seek to maintain sufficient excess capacity in our infrastructure to meet the needs of all of our customers. We also seek to maintain excess capacity to facilitate the increase in new customers and the expansion of existing customer advertising spend on our platform. For example, if we secure a large customer or a group of customers which require significant amounts of bandwidth or storage, we may need to increase bandwidth, storage, power or other elements of our application architecture and our infrastructure, and our existing systems may not be able to scale in a manner satisfactory to our existing or prospective customers.
The amount of infrastructure needed to support our customers is based on our estimates of anticipated usage. We will need to expand our infrastructure to meet anticipated increase in usage, for which we expect to incur additional costs. In addition, if we were to experience unforeseen increases in usage, we could be required to increase our infrastructure investments further and during a time other than we expect. As use of our platform grows, we will need to devote additional resources to improving our application architecture and our infrastructure in order to maintain the performance of our platform. We may need to incur additional costs to upgrade or expand our computer systems and architecture in order to accommodate increased or expected increases in demand. If we incur these costs, our gross margin would be adversely impacted.
We must develop and introduce enhancements and new features and functionality that achieve market acceptance or that keep pace with technological developments to remain competitive in our evolving industry.
We operate in a dynamic market characterized by rapidly changing technologies and industry and legal standards. The introduction of new advertising solutions by our competitors, the market acceptance of solutions based on new or alternative technologies, or the emergence of new advertising industry standards could render our platform obsolete. Our ability to compete successfully, attract new customers and increase revenue from existing customers depends in large part on our ability to enhance and improve our existing platform and to continually introduce or acquire new technologies and features and functionality demanded by the market we serve. The success of any enhancement or new solution depends on many factors, including timely completion, adequate quality testing, appropriate introduction and market acceptance. Any new solution, product or feature that we develop or acquire may not be introduced in a timely or cost-effective manner, may contain defects or may not achieve the broad market acceptance necessary to generate significant revenue. If we are unable to anticipate or timely and successfully develop or acquire new offerings or features or enhance our existing platform to meet evolving customer requirements, our business and operating results will be adversely affected.
23
Material defects or errors in our platform could result in customer dissatisfaction and harm our reputation, result in significant costs to us and impair our ability to sell our platform.
The software applications underlying our platform are inherently complex and may contain material defects or errors, which may cause disruptions in availability, misallocation of advertising spend or other performance problems. Any such errors, defects, disruptions in service or other performance problems with our platform could negatively impact our business and our customers’ businesses or the success of their advertising campaigns and causing customer dissatisfaction and harm to our reputation. If we have any errors, defects, disruptions in service or other performance problems with our platform, customers may reduce their usage or delay or withhold payment to us, which could result in an increase in our provision for doubtful accounts or lengthen our collection cycles for accounts receivable. Such performance problems could also result in customers making warranty or other claims against us, our giving credits to our customers toward future advertising spend or costly litigation. As a result, material defects or errors in our platform could have a material adverse impact on our business and financial performance.
The costs incurred in correcting any material defects or errors in our platform may be substantial and could adversely affect our operating results. After the release of new versions of our software, defects or errors may be identified from time to time by our internal team and by our customers. We implement bug fixes and upgrades as part of our regularly scheduled system maintenance. If we do not complete this maintenance according to schedule or if customers are otherwise dissatisfied with the frequency and/or duration of our maintenance, customers could reduce their usage of our platform or delay or withhold payment to us, or cause us to issue credits, make refunds or pay penalties.
Our business depends in part on the success of our strategic relationships with third parties.
Our business depends in part on our ability to continue to successfully manage and enter into successful strategic relationships with third parties. We currently have and are seeking to establish new relationships with third parties to develop integrations with complementary technologies, sources of inventory, such as Google, and data vendors such as Nielsen. For example, in order for customers to target ads in ways they desire and otherwise optimize and verify campaigns, our platform must have access to data regarding Internet user behavior and reports with demographic information regarding Internet users. We depend on various third parties to provide this audience data and demographic reporting. Maintaining and expanding our strategic relationships with third parties is critical to our continued success. Further, our relationships with these third parties are typically non-exclusive and do not prohibit the other party from working with our competitors, and in some cases our business partners also offer products or services that compete with ours, which makes these relationships more complicated and may over time lead to changes in our relationship including our loss of access to certain inventory or data supplied by these partners. These relationships may not result in additional customers or enable us to generate significant revenue and a change in these relationships could result in a loss of revenue. Identifying suitable business partners and negotiating, documenting, and maintaining relationships with them require significant time and resources. If we are unsuccessful in establishing or maintaining our relationships with these third parties, our ability to successfully execute campaigns, compete in the marketplace or to grow our revenue could be impaired and our operating results would suffer.
Our business model depends upon our ability to continue to access advertising inventory that we do not own.
Our platform depends on access to advertising inventory controlled by publishers and various other providers, such as public ad exchanges, supply-side platforms, private marketplaces, ad networks and direct premium publishers. In particular, we rely on continued access to premium ad inventory in high-quality and brand-safe environments, viewable to consumers across multiple screens. We do not own the inventory of advertising opportunities upon which our business depends and, therefore, we might not always have access to inventory of sufficient quality or volume to meet the needs of our customers’ campaigns. As a result, we may have limited visibility to our future access to inventory, especially premium ad inventory and inventory in international markets. Companies such as ad networks make media buying commitments to publishers, and may compete with us and restrict our access to media inventory of those publishers. Companies such as ad exchanges charge both publishers and advertisers fees and may be able to charge advertisers lower fees than us. In addition, many publishers sell a portion of their advertising inventory directly to advertisers, and publishers may seek to do so increasingly in the future. If that were to occur, we may have fewer opportunities to provide our customers access to inventory, which would harm our ability to grow our business and our financial condition and operating results would be adversely affected.
Furthermore, as the number of competing intermediaries that purchase advertising inventory from RTB exchanges and that utilize advertising solutions providers continues to increase, intermediaries or their bidding processes may favor other bidders and we may not be able to compete successfully for advertising inventory available on RTB exchanges. Even if our bids are successful, the inventory may be of low quality or misrepresented to us, despite our attempts to prevent fraud and conduct quality assurance checks on inventory and we could be subject to liability and our business could be harmed.
24
In connection with Platform Services arrangements, we commit to delivery of a campaign at a fixed price in advance of acquiring the advertising inventory required for the campaign, exposing us to the risk that we may be unable to fulfill these commitments cost-effectively or at all.
In order to execute and deliver campaigns under our Platform Services arrangements, we generally enter into binding IOs with fixed price commitments which are determined prior to the launch of an advertising campaign. We do not own or otherwise control the inventory necessary to fulfill these IOs. Further, in fulfilling IO commitments, we generally purchase advertising inventory on a real-time basis during the course of the advertising campaign period, and we generally do not have fixed priced sources of supply of such inventory. Accordingly, we are not assured of having access to inventory of sufficient quality or quantity to meet the needs of our customers’ campaigns on a cost-effective basis or at all. If we are unable to obtain inventory cost-effectively, or at all, our gross margins could be negatively affected or we could be unable to fulfill our obligations under the IO, which would have a negative impact on our ability to attract and retain customers, potentially damage our reputation, expose us to liability and harm our revenue and growth.
Our Platform Services customers are not obligated to pay for advertising inventory that is not consistent with their campaigns. Since we have no recourse to suppliers, we assume full risk of loss for inventory that is not accepted by our customers.
Our Platform Services customers are not obligated to pay for advertising impressions that are not consistent with the terms of their IO with us. Further, the sources of our advertising impressions generally make no representations regarding specific characteristics of an impression relevant to any campaign. In addition, we have made and expect to continue to make purchasing decisions during the fulfillment of campaigns resulting in the purchase of impressions that are not acceptable to the advertiser. These decisions may result from mistakes due to human error by our personnel or a systems error. In other cases, third-party verification technology used by the customer may reach a different conclusion about the suitability of the inventory. In any of these cases, the advertiser may reject impressions that do not meet the terms of the IO, we may be required to provide a credit or be considered to be in breach of our obligations and we would have no recourse to the supplier. As a result, our gross margins and our ability to attract and retain customers could be negatively affected, we could be exposed to liability and our revenue and growth could be harmed.
If we fail to detect fraudulent or unacceptable ad placements, or if we serve advertisements on websites with inappropriate content, our reputation will be damaged, advertisers may reduce the use of or stop using our platform, and we may incur liabilities.
Our business depends in part on providing our advertisers with services that are trusted and safe for their brands and that provide the anticipated value. We frequently have contractual commitments to take reasonable measures to prevent advertisements from appearing on websites with inappropriate content or on certain websites that our advertisers may identify. Our advertisers also expect that ad placements will not be misrepresented, such as auto-play in banner placements marketed as pre-roll inventory, and that ad impressions represent the legitimate activity of human internet users. We use proprietary technologies and third party services in our efforts to detect and block inventory on websites with inappropriate content, misrepresented ad placements and fraudulent bot generated impressions. However, technologies utilized by bad actors are constantly evolving and preventing and combating fraud and inappropriate content, which is an industry-wide issue requires constant vigilance and investment of time and resources. There has recently been a significant amount of negative publicity about bot generated impressions within our industry, so our ability to combat bot generated impressions has become increasingly important. We may not always be successful in our efforts to prevent and combat fraud and inappropriate content. We may serve advertisements on inventory that is objectionable to our advertisers, and our software may also inadvertently purchase inventory on behalf of our advertisers that proves to be unacceptable for advertising campaigns, such as fraudulent bot generated impressions. In addition, negative publicity around fraudulent digital advertising placements may adversely impact the perceptions of advertisers regarding programmatic purchasing of digital advertising. As a result, we may lose the trust of our advertisers, which would harm our brand and reputation, our advertisers may reduce the use of or stop using our platform, we may be exposed to liabilities or the need to provide credits or refunds, and our business and financial performance may be harmed.
If our information systems are disrupted or unauthorized access to customer data or our data is otherwise obtained, our platform may be perceived as not being secure, customers may reduce the use of or stop using our platform, our reputation could be harmed and we may incur significant liabilities.
We collect, store and transmit information of, or on behalf of, our advertisers. Security breaches could result in the loss of information or financial assets, litigation, indemnity obligations and other liability. While we have security measures in place, our information systems and networks and those of third parties that we use in our operations are vulnerable to cybersecurity risk and ongoing threats. Our security measures may be breached as a result of third-party action, including cyber-attacks such as viruses, hacking, phishing attacks or other intentional misconduct by computer hackers, employee error, malfeasance or otherwise. This could result in one or more third parties obtaining unauthorized access to our customers’ data, our data, including intellectual property and other confidential business information, or our financial assets. Such attacks may also cause interruptions to the services we provide and cause customers to lose confidence in our platform. Because techniques used to obtain unauthorized access or to sabotage systems change frequently and generally are not recognized until launched against a target, we may be unable to anticipate these techniques or to implement adequate preventative measures. To date, unauthorized users have not had a material impact on our systems; however, there can be no assurance that such attacks may not be successful in the future.
25
Third parties may also attempt to fraudulently induce employees or customers into disclosing sensitive information such as user names, passwords or other information in order to gain access to our customers’ data or our data, including intellectual property and other confidential business information or our financial assets. Although we have developed systems and processes that are designed to protect our data and customer data and to prevent other security breaches, we cannot assure you that such measures will provide absolute security, If an actual or perceived breach of our security occurs, the market perception of the effectiveness of our security measures could be harmed, we could lose potential sales and existing customers or we could be subject to liability.
In addition we utilize third-party cloud computing services in connection with our operations. Problems faced by us or our third-party hosting/cloud computing providers, including technological or business-related disruptions, as well as cybersecurity threats, could adversely impact our business and results of operations, our ability to accurately report our financial results, as well as the experience of our customers. As we expand our operations, we expect to utilize additional systems and service providers that may also be essential to managing our business. Although the systems and services that we require are typically available from a number of providers, it is time consuming and costly to qualify and implement these relationships. Therefore, our ability to manage our business would suffer if one or more of our providers suffer an interruption in their business, or experience delays, disruptions or quality control problems in their operations, or we have to change or add systems and services. We may not be able to control the quality of the systems and services we receive from third-party service providers, which could impair our ability to maintain proper controls over financial reporting and complete timely and accurate financial reporting, and may impact our business, results of operation and financial condition.
Any failure to protect our intellectual property rights could impair our ability to protect our proprietary technology and our brand.
Our success and ability to compete depend in part upon our intellectual property. We primarily rely on intellectual property laws, including trade secret, copyright, trademark and patent laws in the U.S. and abroad, and use contracts, confidentiality procedures, non-disclosure agreements, employee disclosure and invention assignment agreements and other contractual rights to protect our intellectual property. However, the steps we take to protect our intellectual property rights may be inadequate or we may be unable to secure intellectual property protection for all of our platform.
If we are unable to protect our intellectual property, our competitors could use our intellectual property to market products, services or solutions similar to ours and our ability to compete effectively would be impaired. Moreover, others may independently develop technologies that are competitive to ours or infringe our intellectual property. Any of our intellectual property rights may be challenged by others or invalidated through administrative processes or litigation. The enforcement of our intellectual property rights depends on our legal actions against these infringers being successful, but we cannot be sure these actions will be successful, even when our rights have been infringed. In addition, we might be required to spend significant resources to monitor and protect our intellectual property rights, and our efforts to enforce our intellectual property rights may be met with defenses, counterclaims and countersuits attacking the validity and enforceability of our intellectual property rights. Litigation to protect and enforce our intellectual property rights could be costly, time-consuming and distracting to management, whether or not it is resolved in our favor, and could ultimately result in the impairment or loss of portions of our intellectual property. Any patents issued in the future may not provide us with competitive advantages or may be successfully challenged by third parties.
Furthermore, legal standards relating to the validity, enforceability and scope of protection of intellectual property rights are uncertain. Effective protection of our intellectual property may not be available to us in every country in which our platform are available. The laws of some foreign countries may not be as protective of intellectual property rights as those in the U.S., and mechanisms for enforcement of intellectual property rights may be inadequate. Accordingly, despite our efforts, we may be unable to prevent third parties from infringing upon or misappropriating our intellectual property.
We could incur substantial costs as a result of any claim of infringement of another party’s intellectual property rights.
In recent years, there has been significant litigation involving patents and other intellectual property rights. Companies in the Internet and technology industries are increasingly bringing and becoming subject to suits alleging infringement of proprietary rights, particularly patent rights, and our competitors may hold patents or have pending patent applications, which could be related to our business. These risks have been amplified by the increase in third parties, or non-practicing entities, whose sole primary business is to assert such claims. We have received in the past, and expect to receive in the future, notices that claim we or our customers using our platform have misappropriated or misused other parties’ intellectual property rights. If we are sued by a third party that claims that our technology infringes its rights, the litigation could be expensive and could divert our management resources. We do not currently have an extensive patent portfolio of our own, which may limit the defenses available to us in any such litigation.
26
In addition, in many instances, we have agreed to indemnify our customers against certain claims that our platform infringes the intellectual property rights of third parties. The results of any intellectual property litigation to which we might become a party, or for which we are required to provide indemnification, may require us to do one or more of the following:
|
|
· |
cease offering or using technologies that incorporate the challenged intellectual property; |
|
|
· |
make substantial payments for legal fees, settlement payments or other costs or damages; |
|
|
· |
obtain a license, which may not be available on reasonable terms, to sell or use the relevant technology; or |
|
|
· |
redesign technology to avoid infringement. |
If we are required to make substantial payments or undertake any of the other actions noted above as a result of any intellectual property infringement claims against us or any obligation to indemnify our customers for such claims, such payments or costs could have a material adverse effect upon our business and financial results. Furthermore, our business could be adversely affected by any significant disputes between us and our customers as to the applicability or scope of our indemnification obligations to them.
Our use of open source technology could impose limitations on our ability to commercialize our platform.
We use open source software in our platform. Some open source software licenses require users who distribute open source software as part of their software to publicly disclose all or part of the source code to such software and/or make available any derivative works of the open source code on unfavorable terms or at no cost. The terms of various open source licenses have not been interpreted by the courts, and there is a risk that such licenses could be construed in a manner that imposes unanticipated conditions or restrictions on our ability to market our platform. While we monitor our use of open source software and try to ensure that none is used in a manner that would require us to disclose our source code or that would otherwise breach the terms of an open source agreement, such use could inadvertently occur and we may be required to release our proprietary source code, pay damages for breach of contract, re-engineer our applications, discontinue sales in the event re-engineering cannot be accomplished on a timely basis or take other remedial action that may divert resources away from our development efforts, any of which could cause us to breach customer contracts, harm our reputation, result in customer losses or claims, increase our costs or otherwise adversely affect our business and operating results.
Expanding our international operations subjects us to new challenges and risks.
As of December 31, 2015 we had offices in nine countries outside the U.S., and as we continue to expand our customer base outside the U.S., our business is increasingly susceptible to risks associated with international operations. However, we have a limited operating history outside the U.S., and our ability to manage our business and conduct our operations internationally requires considerable management attention and resources and is subject to particular challenges of supporting a rapidly growing business in an environment of diverse cultures, languages, customs, tax laws, legal systems, alternate dispute systems and regulatory systems. The risks and challenges associated with international expansion include:
|
|
· |
continued localization of our platform, including translation into foreign languages and associated expenses; |
|
|
· |
the need to support and integrate with local advertisers, agencies, publishers and partners; |
|
|
· |
competition with service providers that have greater experience in the local markets than we do or who have pre-existing relationships with potential customers in those markets; |
|
|
· |
compliance with multiple, potentially conflicting and changing governmental laws and regulations, including employment, tax, privacy and data protection laws and regulations such as the EU Data Privacy Directive; |
|
|
· |
compliance with anti-bribery laws, including compliance with the Foreign Corrupt Practices Act and the U.K. Anti-Bribery Act; |
|
|
· |
difficulties in invoicing and collecting in foreign currencies and associated foreign currency exposure; |
|
|
· |
difficulties in staffing and managing foreign operations and the increased travel, infrastructure and legal compliance costs associated with international operations; |
|
|
· |
different or lesser protection of our intellectual property rights; |
|
|
· |
difficulties in enforcing contracts and collecting accounts receivable, longer payment cycles, higher levels of credit risk and other collection difficulties; |
|
|
· |
compliance with applicable laws of taxing jurisdictions where we conduct business and applicable U.S. tax laws as they relate to our international operations, the complexity and adverse consequences of such tax laws and potentially adverse tax consequences due to changes in such tax laws; |
27
|
|
· |
restrictions on repatriation of earnings; and |
|
|
· |
regional economic and political conditions. |
As a result of these risks, any potential future international expansion efforts that we may undertake will not be successful.
Fluctuations in the exchange rate of foreign currencies could result in currency transactions losses.
We currently have foreign sales and accounts receivable denominated in multiple currencies including Australian dollars, Brazilian real, British pounds, Canadian dollars, Euros, Japanese Yen and Singapore dollars. In addition, we purchase advertising in local currencies and incur a portion of our operating expenses in the currencies of the countries where we have offices. To the extent that our revenue from international operations increases and the scope of our international operations grows, our operating results will become more susceptible to changes in currency exchange rates. We face exposure to adverse movements in currency exchange rates, which may cause our revenue and operating results to differ materially from expectations. A decline in the U.S. dollar relative to foreign currencies would increase our non-U.S. revenue when translated into U.S. dollars. Conversely, if the U.S. dollar strengthens relative to foreign currencies, our revenue from international operations could be adversely affected. Our operating results could be negatively impacted depending on the amount of cost of revenue or operating expense denominated in foreign currencies. As exchange rates vary and our mix of U.S. and foreign currency denominated transactions or expenses changes, revenue, cost of revenue, operating expenses and other operating results, when translated, may differ materially from expectations. We use foreign currency forward contracts to mitigate a portion of our foreign currency exposure. However, these derivative contracts may be limited in the protection they provide us from exposure to foreign exchange rate fluctuations and involve costs and risks of their own, such as ongoing management time and expertise, external costs to implement the contracts and potential accounting implications. Additionally, our hedging activities rely on our ability to forecast accurately and could expose us to additional risks that could adversely affect our financial condition and operating results and could contribute to increased losses as a result of volatility in the foreign currency market.
Unfavorable conditions in the global economy could limit our ability to grow our business and negatively affect our operating results.
Revenue growth and potential profitability of our business depends on the level of advertising spend in the markets we serve. To the extent that weak economic conditions cause our customers and potential customers to freeze or reduce their advertising budgets, particularly those for digital video advertising, demand for our platform may be negatively affected. Historically, economic downturns have resulted in overall reductions in advertising spend. If economic conditions deteriorate or do not materially improve, our customers and potential customers may elect to decrease their advertising budgets or defer or reconsider software and service purchases, which would limit our ability to grow our business and negatively affect our operating results.
Any forecasts of market growth that we have provided or may provide in the future may prove to be inaccurate, and even if the markets in which we compete achieve the forecasted growth, we cannot assure you our business will grow at similar rates, if at all.
Growth forecasts are subject to significant uncertainty and are based on assumptions and estimates, which may not prove to be accurate. Forecasts relating to the expected growth in advertising and other markets, may prove to be inaccurate. Even if these markets experience the forecasted growth, we may not grow our business at similar rates, or at all. Our growth is subject to many factors, including our success in implementing our business strategy, which is subject to many risks and uncertainties.
Our business depends on our chief executive officer and founder and retaining and attracting qualified management and technical personnel and maintaining or expanding our sales and marketing capabilities.
Our success depends upon the continued service of Brett Wilson, our co-founder, President and Chief Executive Officer, other members of our senior management team and key technical employees, as well as our ability to continue to attract and retain additional highly qualified management and operating personnel. We do not maintain key person life insurance policies on any of our employees. While we have offer letters with certain of our key employees, we do not have fixed term employment agreements with Mr. Wilson or any of our other key employees. Each of Mr. Wilson, other executive officers, key technical personnel and other employees could terminate his or her relationship with us at any time. Our business also requires skilled engineering, product and sales personnel, who are in high demand and are difficult to recruit and retain. As we continue to innovate and develop our platform and expand into additional geographic markets, we will require personnel with expertise in these areas. Competition for qualified employees is intense in our industry and particularly so in the San Francisco Bay Area, California, where most of our technical employees are based. The loss of Mr. Wilson or any other member of our senior management team or, even a few qualified employees, or an inability to attract, retain and motivate additional highly skilled employees required for the planned expansion of our business, could delay or prevent the achievement of our business objectives and could materially harm our business and our customer relationships.
28
Our ability to achieve revenue growth in the future will depend, in part, on our success in recruiting, training and retaining sufficient numbers of sales personnel. These new employees require significant training and experience before they achieve full productivity. For internal planning purposes, we assume that it will take approximately nine months before a newly hired sales representative is fully trained and productive in selling our platform. This amount of time may be longer for sales personnel focused on new geographies or specific market segments. As a result, the cost of hiring and carrying new representatives cannot be offset by the revenue they produce for a significant period of time, if at all. Our recent hires and planned hires may not become productive as quickly as we would like or to the extent we expect, and we may not be able to hire or retain sufficient numbers of qualified individuals in the markets where we do business. Our business will be seriously harmed if these efforts do not work as planned or generate a corresponding significant increase in revenue.
If the use of “third-party cookies” or other tracking technologies (including pixels) is rejected by Internet users, restricted or otherwise subject to unfavorable terms, such as by non-governmental entities, or if ad blocking technologies continue to become more widely utilized by Internet users, our performance may decline and we may lose customers and revenue.
Some features of our platform use cookies or other technologies, such as pixels, which we refer to generally as cookies. Our cookies are known as “third-party cookies” because they are placed on individual browsers when Internet users visit a website on which we serve an ad. These cookies are placed through an Internet browser on an Internet user’s computer and correspond with a data set that we keep on our servers. Our cookies record non-personal information about Internet users’ interactions with our advertiser customers through a browser while the cookie is active. We use these cookies to help us achieve our brand advertisers’ campaign goals, to help us ensure that the same Internet user does not see the same advertisement multiple times, to report aggregate information to our advertisers regarding the performance of their advertising campaigns, and to detect and prevent fraudulent activity. We also use data from cookies to help us decide whether to bid on, and how to price, an opportunity to place an advertisement in a certain location, at a given time, in front of a particular Internet user. If our access to cookie data is reduced, our ability to conduct our business in the current manner may be affected and thus undermine the effectiveness of our platform.
Internet users may easily block and/or delete cookies (e.g., through their browsers by resetting mobile device advertising identifiers). The most commonly used Internet browsers (Chrome, Firefox, Internet Explorer, and Safari) allow Internet users to modify their browser settings to prevent cookies from being accepted by their browsers, or are set to block third-party cookies by default. If more browser manufacturers and Internet users adopt these ad blocking settings, utilize privacy modes when browsing websites, or delete their cookies more frequently than they currently do, our business could be harmed. Some government regulators (discussed below) and privacy advocates have suggested creating a “Do Not Track” standard that would allow Internet users to express a preference, independent of cookie settings in their browser, not to have website browsing recorded. If Internet users adopt a “Do Not Track” browser setting, and the standard either imposed by state or federal legislation, or agreed upon by standard setting groups, prohibits us from using non-personal data as we currently do, then that could hinder growth of video advertising on the web generally, cause us to change our business practices and adversely affect our business.
In addition, browser manufacturers could replace cookies with their own product and require us to negotiate and pay them for use of such product to record information about Internet users’ interactions with our brand advertiser customers, which may not be available on commercially reasonable terms or at all.
We may be required to, or otherwise may determine that it is advisable to, develop or obtain additional tools and technologies to compensate for the lack of cookie data, which we may not be able to do. Moreover, even if we are able to do so, such additional tools may be subject to further regulation, time consuming to develop or costly to obtain, and less effective than our current use of cookies.
Ad blocking technologies have been developed, and will likely continue to be developed, that can block the display of online digital advertising in the browsers and on the mobile devices of internet users that have implemented these technologies. We derive a substantial majority of our revenue from our customers’ advertising spend on digital video advertising through our platform. As a result, if adoption of these ad blocking technologies by Internet users continues to increase, this could have a negative effect on our operating results.
Legislation and regulation of online businesses, including privacy and data protection regimes, is expansive, not clearly defined and rapidly evolving. Such regulation could create unexpected costs, subject us to enforcement actions for compliance failures, or restrict portions of our business or cause us to change our technology platform or business model.
Government regulation may increase the costs of doing business online. Federal, state, municipal and foreign governments and agencies have adopted and could in the future adopt, modify, apply or enforce laws, policies, and regulations covering user privacy, data security, technologies such as cookies that are used to collect, store and/or process data, advertising online, the use of data to inform advertising, the taxation of products and services, unfair and deceptive practices, and the collection (including the collection of information), use, processing, transfer, storage and/or disclosure of data associated with unique individual Internet users. Although we have not collected data that is traditionally considered personal data, such as name, email address, address, phone numbers, social security numbers, credit card numbers, financial data or health data, we typically do collect and store IP addresses and other device
29
identifiers, which are or may be considered personal data in some jurisdictions or otherwise may be the subject of legislation or regulation. In addition, certain U.S. laws impose requirements on the collection and use of information from or about users or their devices. For instance, the Children’s Online Privacy Protection Act, or COPPA, imposes requirements on website operators and online services that are aimed at children under the age of 13 years of age. COPPA requires notice and parental consent to include persistent identifiers for behavioral advertising and other tracking across websites. Other existing laws may in the future be revised, or new laws may be passed, to impose more stringent requirements on the use of identifiers to collect user information, including information of the type that we collect. Changes in regulations could affect the type of data that we may collect, restrict our ability to use identifiers to collect information, and, thus, affect our ability to collect data, the costs of doing business online, and affect the demand for our platform, the ability to expand or operate our business, and harm our business.
U.S. and non-U.S. regulators also may implement “Do-Not-Track” legislation, particularly if the industry does not implement a standard (discussed above). The California Online Privacy Protection Act of 2003 requires operators of commercial websites and online service providers, under certain circumstances, to disclose in their privacy policies how such operators and providers respond to browser “do not track” signals.
Some of our activities may also be subject to the laws of foreign jurisdictions, whether or not we are established or based in such jurisdictions. Within the EU, where we currently have an active presence in the United Kingdom, Directive 2009/136/EC, commonly referred to as the “Cookie Directive,” directs EU member states to ensure that accessing information on an Internet user’s computer, such as through a cookie, is allowed only if the Internet user has given his or her consent. In response, some member states have implemented legislation requiring entities to obtain the user’s consent before placing cookies for targeted advertising purposes. Additional EU member state laws may follow. We may be required to, or otherwise may determine that it is advisable to, develop or obtain additional tools and technologies to compensate for the lack of cookie data. Even if we are able to do so, such additional tools may be subject to further regulation, time consuming to develop or costly to obtain, and less effective than our current use of cookies. In addition, certain information, such as IP addresses as collected and used by us may constitute “personal data” in certain non-U.S. jurisdictions, including in the United Kingdom, and therefore certain of our activities could be subject to EU laws applicable to the processing and use of personal data. Furthermore, EU regulators have agreed on the text of a new General Data Protection Regulation, anticipated to take effect in 2018, which will largely replace many member state laws, potentially imposing additional obligations on us and allowing for substantial monetary penalties for non-compliance.
In addition, we may inadvertently receive personal information from advertisers or advertising agencies or through the process of executing video advertising campaigns or usage of our platform. Our failure to comply with applicable laws and regulations, or to protect personal data, could result in enforcement action against us, including fines, imprisonment of our officers and public censure, claims for damages by consumers and other affected individuals, damage to our reputation and loss of goodwill, any of which could have a material adverse impact on our operations, financial performance and business. Even the perception of privacy concerns, whether or not valid, may harm our reputation and inhibit adoption of our solution by current and future advertisers and advertising agencies.
In addition, data security is of increasing concern to U.S., state and foreign regulators and, as a result, the legal standards for data security and the consequences for violating those standards continue to evolve and the threat posed by cyber-attacks and data breaches continues to grow. While we take measures to protect the security of information that we collect, use, and disclose in the operation of our business, and to offer certain privacy protections with respect to such information, such measures may not always be effective.
Our revenue may be adversely affected if we are required to charge sales taxes or other taxes for our platform.
States, countries or other jurisdictions may seek to impose sales or other tax collection obligations on us in the future, or states or jurisdictions in which we already pay tax may increase the amount of taxes we are required to pay. A successful assertion by any state, country or other jurisdiction in which we do business that we should be collecting sales or other taxes on the revenue of our platform could, among other things, create significant administrative burdens for us, result in substantial tax liabilities for past sales, discourage customers from using our platform or otherwise substantially harm our business and results of operations.
We might require additional capital to support business growth, and this capital might not be available on acceptable terms, if at all.
We intend to continue to make investments to support our business growth and may require additional funds to respond to business challenges, such as keeping pace with technological developments in order to remain competitive in our evolving industry, improve our operating infrastructure or acquire complementary businesses and technologies. In addition, we remit payment for media inventory purchased through our platform by our Platform Direct and Platform Services customers in advance of receiving payment from them as the advertising agency does not pay us for use of our platform until it has received payment from the brand. This payment process will continue to consume working capital and the effect on our cash flows may become more pronounced if we continue to grow our business. As a result, we may need to engage in equity or debt financings to secure additional funds. If we raise
30
additional funds through further issuances of equity or convertible debt securities, our existing stockholders could suffer significant dilution, and any new equity securities we issue could have rights, preferences and privileges superior to those of holders of our common stock. Any debt financing secured by us in the future could involve restrictive covenants relating to our capital raising activities and other financial and operational matters, which may make it more difficult for us to obtain additional capital and to pursue business opportunities, including potential acquisitions. In addition, we may not be able to obtain additional financing on terms favorable to us, if at all. If we are unable to obtain adequate financing or financing on terms satisfactory to us, when we require it, our ability to continue to support our business growth, particularly if we experience unexpected increases in advertising spend through our platform, and to respond to business challenges could be significantly impaired.
Our credit facility subjects us to operating restrictions and financial covenants that impose risk of default and may restrict our business and financing activities.
Pursuant to our loan and security agreement with Silicon Valley Bank, as amended to date, we are subject to certain financial ratio and liquidity covenants, as well as restrictions that limit our ability, among other things, to:
|
|
· |
dispose of or sell our assets; |
|
|
· |
make material changes in our business or management; |
|
|
· |
consolidate or merge with other entities; |
|
|
· |
incur additional indebtedness; |
|
|
· |
create liens on our assets; |
|
|
· |
pay dividends; |
|
|
· |
make investments; |
|
|
· |
enter into transactions with affiliates; and |
|
|
· |
pay off or redeem subordinated indebtedness. |
These covenants may restrict our ability to finance our operations and to pursue our business activities and strategies. Our ability to comply with these covenants may be affected by events beyond our control. In the past, we were not compliant with certain administrative covenants. Although the bank waived such noncompliance in the past, there is no guarantee it will do so in the future. If a default were to occur and not be waived, such default could cause, among other remedies, all of the outstanding indebtedness under our loan and security agreement to become immediately due and payable. In such an event, our liquid assets might not be sufficient to meet our repayment obligations, and we might be forced to liquidate collateral assets at unfavorable prices or our assets may be foreclosed upon and sold at unfavorable valuations.
Our ability to renew our existing revolving line of credit, which matures in April 2017, or to enter into a new credit facility to replace or supplement the existing facility may be limited due to various factors, including the status of our business, global credit market conditions, and perceptions of our business or industry by sources of financing. In addition, if credit is available, lenders may seek more restrictive covenants and higher interest rates that may reduce our borrowing capacity, increase our costs, or reduce our operating flexibility.
If we do not have or are unable to generate sufficient cash available to repay our debt obligations when they become due and payable, either upon maturity or in the event of a default, we may not be able to obtain additional debt or equity financing on favorable terms, if at all. Our inability to obtain financing may negatively impact our ability to operate and continue our business as a going concern.
We may selectively pursue acquisitions of complementary businesses and technologies, which could divert our management’s attention, result in additional dilution to our stockholders and otherwise disrupt our operations and adversely affect our operating results.
We may selectively pursue acquisitions of complementary businesses and technologies that we believe could complement or expand our applications, enhance our technical capabilities or otherwise offer growth opportunities. The pursuit of potential acquisitions may divert the attention of management and cause us to incur various expenses in identifying, investigating and pursuing suitable acquisitions, whether or not they are consummated.
31
In addition, we have limited experience with acquiring other businesses or technologies. If we acquire businesses or technologies, we may not be able to integrate the acquired personnel, operations and technologies successfully, or effectively manage the combined business following the acquisition. We also may not achieve the anticipated benefits from the acquired business due to a number of factors, including:
|
|
· |
inability to integrate or benefit from acquired technologies or services in a profitable manner; |
|
|
· |
unanticipated costs or liabilities associated with the acquisition; |
|
|
· |
incurrence of acquisition-related costs; |
|
|
· |
difficulty integrating the accounting systems, operations and personnel of the acquired business; |
|
|
· |
difficulties and additional expenses associated with supporting legacy products and hosting infrastructure of the acquired business; |
|
|
· |
difficulty converting the customers of the acquired business onto our applications and contract terms, including disparities in the revenue, licensing, support or professional services model of the acquired company; |
|
|
· |
diversion of management’s attention from other business concerns; |
|
|
· |
adverse effects to our existing business relationships with business partners and customers as a result of the acquisition; |
|
|
· |
the potential loss of key employees; |
|
|
· |
use of resources that are needed in other parts of our business; and use of substantial portions of our available cash to consummate the acquisition. |
In addition, a significant portion of the purchase price of companies we acquire may be allocated to acquired goodwill and other intangible assets, which must be assessed for impairment at least annually. In the future, if our acquisitions do not yield expected returns, we may be required to take charges to our operating results based on this impairment assessment process, which could adversely affect our results of operations.
Acquisitions could also result in dilutive issuances of equity securities or the incurrence of debt, which could adversely affect our operating results. We may also unknowingly inherit liabilities from acquired businesses or assets that arise after the acquisition and that are not adequately covered by indemnities. In addition, if an acquired business fails to meet our expectations, our operating results, business and financial position may suffer.
If we fail to maintain effective internal control over financial reporting investors may lose confidence in the accuracy and completeness of our financial reports and the market price of our common stock may be negatively affected.
We are required to maintain internal control over financial reporting and to report any material weaknesses in such internal control. Section 404 of the Sarbanes-Oxley Act of 2002, or the Sarbanes-Oxley Act requires that we evaluate and determine the effectiveness of our internal control over financial reporting and, beginning with this Report, provide a management report on the internal control over financial reporting, which must be attested to by our independent registered public accounting firm to the extent we decide not to avail ourselves of the exemption provided to an emerging growth company, as defined by The Jumpstart Our Businesses Act of 2012, or the JOBS Act.
The process of designing and implementing the internal control over financial reporting required to comply with this obligation, is time consuming, costly, and complicated. We have expended, and anticipate that we will continue to expend, resources, including accounting and consulting expenses and management oversight as we continue to develop and refine our internal control over financial reporting. If we identify material weaknesses in our internal control over financial reporting, if we are unable to comply with the requirements of Section 404 of the Sarbanes-Oxley Act in a timely manner, if we are unable to assert that our internal control over financial reporting are effective, or if our independent registered public accounting firm is unable to express an opinion as to the effectiveness of our internal control over financial reporting, if and when required, investors may lose confidence in the accuracy and completeness of our financial reports and the market price of our common stock could be negatively affected, and we could become subject to investigations by the stock exchange on which our securities are listed, the Securities and Exchange Commission, or SEC, or other regulatory authorities, which could require additional financial and management resources.
We incur significantly increased costs and devote substantial management time as a result of operating as a public company.
As a public company, we incur significant legal, accounting and other expenses that we did not incur as a private company. For example, we are subject to the reporting requirements of the Exchange Act, and are required to comply with the applicable requirements of the Sarbanes-Oxley Act and the Dodd-Frank Wall Street Reform and Consumer Protection Act, as well as rules and regulations subsequently implemented by the SEC and The Nasdaq Stock Market, or NASDAQ, including the establishment and
32
maintenance of effective disclosure and financial controls and changes in corporate governance practices. Compliance with these requirements will continue to increase our legal and financial compliance costs and has and will increasingly make some activities more time consuming and costly. Our management team has limited experience managing a publicly-traded company and limited experience complying with the increasingly complex laws pertaining to public companies. Our management team may not successfully or efficiently manage our transition to being a public company that is subject to significant regulatory oversight and reporting obligations under the federal securities laws. In addition, we expect that our management and other personnel will need to divert attention from operational and other business matters to devote substantial time to these public company requirements. In particular, we expect to incur significant expenses and devote substantial management effort toward ensuring compliance with the requirements of Section 404 of the Sarbanes-Oxley Act. We will need to hire additional accounting and financial staff with appropriate public company experience and technical accounting knowledge and may need to establish an internal audit function.
As a public company it is more expensive for us to obtain director and officer liability insurance on the terms that we would like and we may find it more difficult for us to attract and retain qualified people to serve on our board of directors, our board committees or as executive officers.
We are an emerging growth company and we cannot be certain if the reduced disclosure requirements applicable to emerging growth companies will make our common stock less attractive to investors.
For as long as we are an emerging growth company, we intend to take advantage of certain exemptions from various reporting requirements that are applicable to other public companies including, but not limited to, reduced disclosure obligations regarding executive compensation in our periodic reports and proxy statements, and exemptions from the requirements of holding a nonbinding advisory vote on executive compensation and stockholder approval of any golden parachute payments not previously approved. We cannot predict if investors will find our common stock less attractive because we will rely on these exemptions. If some investors find our common stock less attractive as a result, there may be a less active trading market for our common stock and our stock price may be more volatile.
We will remain an emerging growth company until the earliest of (i) the end of the fiscal year in which the market value of our common stock that is held by non-affiliates exceeds $700 million as of June 30, (ii) the end of the fiscal year in which we have total annual gross revenue of $1 billion or more during such fiscal year, (iii) the date on which we issue more than $1 billion in non-convertible debt in a three-year period or (iv) July 17, 2019.
We may not be able to utilize a significant portion of our net operating loss or research tax credit carryforwards, which could adversely affect our profitability.
As of December 31, 2015, we had federal and state net operating loss carryforwards due to prior period losses, which if not utilized will begin to expire in 2017 for state purposes and 2027 for federal purposes. These net operating loss carryforwards could expire unused and be unavailable to offset future income tax liabilities, which could adversely affect our profitability.
In addition, under Section 382 of the Internal Revenue Code of 1986, as amended, or the Code, our ability to utilize net operating loss carryforwards or other tax attributes in any taxable year may be limited if we experience an “ownership change.” A Section 382 “ownership change” generally occurs if one or more stockholders or groups of stockholders who own at least 5% of our stock increase their ownership by more than 50 percentage points over their lowest ownership percentage within a rolling three-year period. Similar rules may apply under state tax laws.
Future issuances of our stock could cause an “ownership change.” It is possible that any future ownership change could have a material effect on the use of our net operating loss carryforwards or other tax attributes, which could adversely affect our profitability.
Our reported financial results may be adversely affected by changes in accounting principles generally accepted in the U.S.
Generally accepted accounting principles in the U.S. are subject to interpretation by the Financial Accounting Standards Board, the SEC, and various bodies formed to promulgate and interpret appropriate accounting principles. A change in these principles or interpretations could have a significant effect on our reported financial results, and could affect the reporting of transactions completed before the announcement of a change.
Risks Related to Ownership of Our Common Stock
We may fail to meet our publicly announced guidance or other expectations about our business and future operating results, which would cause our stock price to decline.
We have and may continue to provide guidance about our business and future operating results as part of our press releases, conference calls or otherwise. In developing this guidance, our management must make certain assumptions and judgments about our
33
future performance. Our business results may vary significantly from such guidance due to a number of factors, many of which are outside of our control, and which could adversely affect our operations and operating results. Furthermore, if our publicly announced guidance of future operating results fails to meet expectations of securities analysts, investors or other interested parties, the price of our common stock would decline.
The price of our common stock has been volatile and may continue to be volatile and may decline regardless of our financial performance.
Technology stock has historically experienced high levels of volatility. The trading price of our common stock has fluctuated and may continue to fluctuate significantly. Factors that could cause fluctuations in the trading price of our common stock include:
|
|
· |
overall performance of the equity markets; |
|
|
· |
the development and sustainability of an active trading market for our common stock; |
|
|
· |
our operating performance and the performance of other similar companies; |
|
|
· |
changes in the estimates of our operating results that we provide to the public, our failure to meet these projections or changes in recommendations by securities analysts that elect to follow our common stock; |
|
|
· |
press releases or other public announcements by us or others, including our filings with the SEC; |
|
|
· |
changes in the market perception of digital video advertising solutions generally or in the effectiveness of our platform in particular; |
|
|
· |
announcements of technological innovations, new applications, features, functionality or enhancements to products, services or solutions by us or by our competitors; |
|
|
· |
announcements of acquisitions, strategic alliances or significant agreements by us or by our competitors; |
|
|
· |
announcements of customer additions and customer cancellations or delays in customer purchases; |
|
|
· |
announcements regarding litigation involving us; |
|
|
· |
recruitment or departure of key personnel; |
|
|
· |
changes in our capital structure, such as future issuances of debt or equity securities; |
|
|
· |
our entry into new markets; |
|
|
· |
regulatory developments in the U.S. or foreign countries; |
|
|
· |
the economy as a whole, market conditions in our industry, and the industries of our customers; |
|
|
· |
the size of our market float; and |
|
|
· |
any other factors discussed in this Report. |
In addition, the stock markets have experienced extreme price and volume fluctuations that have affected and continue to affect the market prices of equity securities of many technology companies. Stock prices of many technology companies have fluctuated in a manner unrelated or disproportionate to the operating performance of those companies. In the past, stockholders have filed securities class action litigation following periods of market volatility. If we were to become involved in securities litigation, it could subject us to substantial costs, divert resources and the attention of management from our business, and adversely affect our business.
If securities or industry analysts do not publish research or publish inaccurate or unfavorable research about our business, our stock price and trading volume could decline.
The trading market for our common stock will depend in part on the research and reports that securities or industry analysts publish about us or our business. If few securities analysts commence coverage of us, or if industry analysts cease coverage of us, the trading price for our common stock would be negatively affected. If one or more of the analysts who cover us downgrade our common stock or publish inaccurate or unfavorable research about our business, our common stock price would likely decline. If one or more of these analysts cease coverage of us or fail to publish reports on us regularly, demand for our common stock could decrease, which might cause our common stock price and trading volume to decline.
Substantial future sales of shares by our stockholders could negatively affect our stock price.
Sales of a substantial number of shares of our common stock in the public market, particularly sales by our directors, executive officers, and significant stockholders, or the perception that these sales might occur or if there is a large number of shares of our
34
common stock available for sale, could depress the market price of our common stock and could impair our ability to raise capital through the sale of additional equity securities.
Our shares of common stock are freely tradable without restrictions or further registration under the Securities Act of 1933, as amended, or the Securities Act, except for any shares held by our affiliates as defined in Rule 144 under the Securities Act.
As of December 31, 2015, holders of an aggregate of approximately 10.9 million shares of our common stock have rights, subject to some conditions, to require us to file registration statements covering their shares or to include such shares in registration statements that we may file for ourselves or other stockholders. We have also registered shares of common stock that we have issued upon the exercise of outstanding stock options and RSUs, and that we may in the future issue, under our equity compensation plans. These can be freely sold in the public market upon issuance, subject to volume limitations applicable to affiliates.
Furthermore, certain of our executive officers have adopted, and other employees, executive officers or directors may in the future adopt written plans, known as “Rule 10b5-1 Plans,” under which they have contracted, or may in the future contract, with a broker to sell shares of our common stock on a periodic basis to diversify their assets and investments. Sales of substantial amounts of our common stock in the public market , including, but not limited to sales made by our employees, executive officers and directors pursuant to Rule 10b5-1 Plans, or the perception that these sales could occur, could cause the market price of our common stock to decline.
The concentration of our common stock ownership with our executive officers, directors and affiliates will limit your ability to influence corporate matters.
Our executive officers, directors and owners of 5% or more of our outstanding common stock and their respective affiliates beneficially owned, in the aggregate, approximately 42% of our outstanding common stock as of December 31, 2015. These stockholders will therefore have significant influence over management and affairs and over all matters requiring stockholder approval, including the election of directors and significant corporate transactions, such as a merger or other sale of our company or our assets, for the foreseeable future. This concentrated control will limit the ability of our public stockholders to influence corporate matters and, as a result, we may take actions that our stockholders do not view as beneficial. This ownership could affect the value of shares of our common stock.
We do not intend to pay dividends for the foreseeable future.
We have never declared nor paid cash dividends on our capital stock. We currently intend to retain any future earnings to finance the operation and expansion of our business, and we do not expect to declare or pay any dividends in the foreseeable future. Consequently, stockholders must rely on sales of their common stock after price appreciation, which may never occur, as the only way to realize any future gains on their investment.
Provisions in our charter documents and under Delaware law could discourage a takeover that stockholders may consider favorable.
Provisions in our certificate of incorporation and by-laws, may have the effect of delaying or preventing a change of control or changes in our management. These provisions include the following:
|
|
· |
authorize the issuance of “blank check” preferred stock that could be issued by our board of directors to defend against a takeover attempt; |
|
|
· |
establish a classified board of directors, as a result of which the successors to the directors whose terms have expired will be elected to serve from the time of election and qualification until the third annual meeting following their election; |
|
|
· |
require that directors only be removed from office for cause and only upon a supermajority stockholder vote; |
|
|
· |
provide that vacancies on the board of directors, including newly created directorships, may be filled only by a majority vote of directors then in office rather than by stockholders; |
|
|
· |
prevent stockholders from calling special meetings; and |
|
|
· |
prohibit stockholder action by written consent, requiring all actions to be taken at a meeting of the stockholders. |
35
In addition, we are governed by the provisions of Section 203 of the Delaware General Corporation Law, which generally prohibits a Delaware corporation from engaging in a broad range of business combinations with any “interested” stockholder for a period of three years following the date on which the stockholder becomes an “interested” stockholder.
Item 1B. Unresolved Staff Comments
None.
We maintain our principal office, totaling approximately 49,000 square feet, in Emeryville, California, under a combination of leases and subleases that expire in 2017. We also maintain additional leased space in several other locations in the U.S. and internationally, including in Kyiv, London, Paris, Sao Paulo, Shanghai, Singapore, Sydney, Tokyo and Toronto. We believe that our facilities are adequate to meet our needs for the immediate future, and that, should it be needed, we will be able to secure additional space to accommodate any such expansion of our operations.
We are not currently a party to any legal proceedings, litigation, or claims that could materially affect our business, results of operations, cash flows, or financial position. We may, from time to time, be party to litigation and subject to claims incident to the ordinary course of business. As our growth continues, we may become party to an increasing number of litigation matters and claims. The outcome of litigation and claims cannot be predicted with certainty, and the resolution of any future matters could materially affect our future results of operations, cash flows or financial position.
Item 4. Mine Safety Disclosures
Not applicable.
36
Item 5. Market for Registrant’s Common Equity, Related Stockholder Matters and Issuer Purchases of Equity Securities
Our common stock began trading on The Nasdaq Global Select Market on July 18, 2014 under the symbol “TUBE”. Prior to that date, there was no public trading market for our common stock.
The following table sets forth the high and low closing sales prices of our common stock during each full quarterly period within the last two fiscal years:
|
Fiscal 2015 |
|
High |
|
|
Low |
|
||
|
First Quarter |
|
$ |
21.09 |
|
|
$ |
11.83 |
|
|
Second Quarter |
|
|
17.24 |
|
|
|
13.75 |
|
|
Third Quarter |
|
|
16.00 |
|
|
|
9.50 |
|
|
Fourth Quarter |
|
|
14.08 |
|
|
|
10.44 |
|
|
|
|
|
|
|
|
|
|
|
|
Fiscal 2014 |
|
High |
|
|
Low |
|
||
|
Third Quarter (since July 18, 2014) |
|
$ |
13.89 |
|
|
$ |
9.00 |
|
|
Fourth Quarter |
|
|
23.62 |
|
|
|
10.78 |
|
Stockholders
According to the records of our transfer agent, as of March 1, 2016, TubeMogul had 33 stockholders of record (which number does not include the number of stockholders whose shares are held by a brokerage house or clearing agency, but does include, as one record holder each such brokerage house or clearing agency). Because many of our shares of common stock are held by brokers and other institutions on behalf of stockholders, we are unable to estimate the total number of stockholders represented by these record holders.
Dividend Policy
We have never paid a cash dividend on our common stock and do not intend to pay cash dividends on our common stock in the foreseeable future.
Securities Authorized for Issuance under Equity Compensation Plans
The information required by this item with respect to our equity compensation plans is incorporated by reference to our Proxy Statement for the Annual Meeting of Stockholders to be filed with the SEC within 120 days of the fiscal year ended December 31, 2015.
Recent Sales of Unregistered Securities
Since January 1, 2014, we have issued and sold the following unregistered securities that have not been previously included in a Quarterly Report on Form 10-Q or in a Current Report on Form 8-K:
From January 1, 2014 to March 31, 2014, we granted our directors, employees, consultants and other service providers options to purchase an aggregate of 140,500 shares of common stock under the 2007 Equity Compensation Plan (2007 Plan) at exercise prices ranging from $7.10 to $8.34 per share.
From January 1, 2014 to March 31, 2014, we granted our directors, employees, consultants and other service providers restricted stock units for an aggregate of 181,650 shares of common stock under the 2007 Plan in exchange for services.
From January 1, 2014 to March 31, 2014, we issued 449,868 shares of common stock to our directors, employees, consultants and other service providers upon exercise of options granted by us under our 2007 Plan, with exercise prices ranging from $0.02 to $7.10 per share, for an aggregate purchase price of $180,778.
No underwriters were involved in the foregoing sales of securities. The issuances of the securities described above were deemed to be exempt from registration under the Securities Act, in reliance on Rule 701 promulgated under Section 3(b) of the Securities Act as transactions pursuant to compensation benefits plans and contracts relating to compensation.
37
Stock Performance Graph
This performance graph shall not be deemed “soliciting material” or to be “filed” with the SEC for purposes of Section 18 of the Exchange Act, or otherwise subject to the liabilities under that Section, and shall not be deemed to be incorporated by reference into any of our filings under the Securities Act or the Exchange Act.
The following graph shows a comparison of the cumulative total return on an initial investment of $100 in our common stock on July 18, 2014 (the date our common stock commenced trading on The Nasdaq Global Select Market) through December 31, 2015 with the comparative cumulative total return of such amount on the Standard & Poor’s SmallCap 600 Information Technology Index (S&P SmallCap 600 Information Technology Index) and The Nasdaq Composite Index (NASDAQ Composite) for the same period. The data for the S&P SmallCap 600 Information Technology Index and the NASDAQ Composite assumes reinvestments of dividends. We have never declared or paid a cash dividend on our common stock and do not anticipate declaring or paying a cash dividend in the foreseeable future. The graph also assumes our closing sales price on July 18, 2014 of $11.50 as the initial value of our common stock.
The stock price performance shown in the graph below is based upon historical data and is not necessarily indicative of future stock price performance.
Comparison of Cumulative Total Return
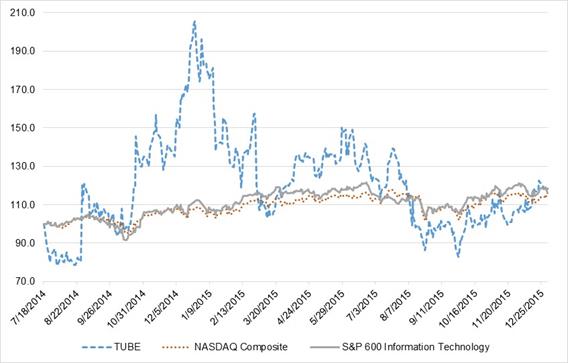
Use of Proceeds
On July 17, 2014, the SEC declared our Registration Statement on Form S-1 (File No. 333-194817) effective for our IPO. On June 10, 2015, the SEC declared our Registration Statement on Form S-1 (File No. 333-204629) effective for our follow-on offering. There have been no material changes in our use of the proceeds from our IPO and follow-on public offering as described in our final prospectuses filed with the SEC pursuant to Rule 424(b) of the Securities Act and other periodic reports previously filed with the SEC.
38
Item 6. Selected Financial Data
The following selected consolidated financial and other data should be read in conjunction with Item 7 “Management’s Discussion and Analysis of Financial Condition and Results of Operations” and our consolidated financial statements and related notes, which are included elsewhere in this Report. The consolidated statements of operations data for the years ended December 31, 2015, 2014 and 2013 and the consolidated balance sheet data as of December 31, 2015 and 2014 are derived from the audited consolidated financial statements that are included elsewhere in this Report. We derived the consolidated statements of operations data for the years ended December 31, 2012 and 2011, and the consolidated balance sheet data as of December 31, 2013, 2012 and 2011 from our audited consolidated financial statements that are not included in this Report. Our historical results are not necessarily indicative of the results to be expected in the future.
|
|
|
Years Ended |
|
|||||||||||||||||
|
|
|
December 31, |
|
|||||||||||||||||
|
|
|
2015 |
|
|
2014 |
|
|
2013 |
|
|
2012 |
|
|
2011 |
|
|||||
|
|
|
(in thousands except share, per share and client data) |
|
|||||||||||||||||
|
Consolidated Statements of Operations Data: |
|
|
|
|
|
|
|
|
|
|
|
|
|
|
|
|
|
|
|
|
|
Revenue |
|
$ |
180,696 |
|
|
$ |
114,243 |
|
|
$ |
57,214 |
|
|
$ |
34,159 |
|
|
$ |
15,659 |
|
|
Gross profit |
|
|
122,503 |
|
|
|
80,302 |
|
|
|
37,516 |
|
|
|
17,785 |
|
|
|
7,445 |
|
|
Operating expenses |
|
|
133,338 |
|
|
|
81,890 |
|
|
|
43,692 |
|
|
|
22,679 |
|
|
|
11,431 |
|
|
Net loss |
|
$ |
(13,731 |
) |
|
$ |
(4,444 |
) |
|
$ |
(7,411 |
) |
|
$ |
(3,565 |
) |
|
$ |
(4,093 |
) |
|
Basic and diluted net loss per share attributable to common stockholders (1) |
|
$ |
(0.42 |
) |
|
$ |
(0.22 |
) |
|
$ |
(1.12 |
) |
|
$ |
(0.55 |
) |
|
$ |
(0.66 |
) |
|
|
|
|
|
|
|
|
|
|
|
|
|
|
|
|
|
|
|
|
|
|
|
Consolidated Balance Sheet Data: |
|
|
|
|
|
|
|
|
|
|
|
|
|
|
|
|
|
|
|
|
|
Cash and cash equivalents |
|
$ |
83,439 |
|
|
$ |
46,592 |
|
|
$ |
19,475 |
|
|
$ |
19,670 |
|
|
$ |
5,467 |
|
|
Working capital |
|
|
121,066 |
|
|
|
65,906 |
|
|
|
25,915 |
|
|
|
25,039 |
|
|
|
8,153 |
|
|
Total assets |
|
$ |
258,733 |
|
|
$ |
142,707 |
|
|
$ |
70,615 |
|
|
$ |
43,905 |
|
|
$ |
15,074 |
|
|
Debt obligations, current and non-current, and convertible preferred stock warrant liability |
|
|
4,685 |
|
|
|
1,362 |
|
|
|
3,882 |
|
|
|
4,658 |
|
|
|
748 |
|
|
Total stockholders’ equity |
|
|
130,176 |
|
|
|
70,641 |
|
|
|
27,255 |
|
|
|
23,009 |
|
|
|
8,430 |
|
|
|
|
|
|
|
|
|
|
|
|
|
|
|
|
|
|
|
|
|
|
|
|
Other Operating and Financial Performance Metrics (unaudited) (2): |
|
|
|
|
|
|
|
|
|
|
|
|
|
|
|
|
|
|
|
|
|
Platform Direct Spend |
|
$ |
305,748 |
|
|
$ |
189,248 |
|
|
$ |
74,016 |
|
|
$ |
25,032 |
|
|
$ |
4,314 |
|
|
Total Spend |
|
$ |
414,232 |
|
|
$ |
254,260 |
|
|
$ |
111,899 |
|
|
$ |
53,758 |
|
|
$ |
17,802 |
|
|
Adjusted EBITDA |
|
$ |
3,358 |
|
|
$ |
2,553 |
|
|
$ |
(5,183 |
) |
|
$ |
(2,425 |
) |
|
$ |
(3,754 |
) |
|
Number of Platform Direct Clients |
|
|
446 |
|
|
|
333 |
|
|
|
208 |
|
|
|
86 |
|
|
|
25 |
|
|
(2) |
For a detailed discussion of our key operating and financial performance metrics and a reconciliation of Total Spend and Adjusted EBITDA to the most directly comparable financial measures calculated in accordance with GAAP, see Item 7 “Management’s Discussion and Analysis of Financial Condition and Results and Operations. |
39
Item 7. Management’s Discussion and Analysis of Financial Condition and Results of Operations
You should read the following discussion and analysis of our financial condition and results of operations in conjunction with the Consolidated Financial Statements and the related Notes to Consolidated Financial Statements included elsewhere in this Report. In addition to historical financial information, the following discussion contains forward-looking statements that reflect our plans, estimates, beliefs and expectations that involve risks and uncertainties. Our actual results and the timing of events could differ materially from those discussed in these forward-looking statements. Factors that could cause or contribute to these differences include those discussed below and elsewhere in this Report, particularly in Item 1A “Risk Factors” and “Special Note Regarding Forward-Looking Statements.”
Overview and 2015 Highlights
TubeMogul is a leader in software for brand advertising. Advertisers use TubeMogul’s software platform to plan, buy, measure, and optimize their global brand advertising. By reducing complexity, improving transparency and leveraging real-time data, our platform enables advertisers to gain greater control of their advertising spend and achieve their brand advertising objectives.
By integrating programmatic technologies and disparate sources of inventory within a single platform, we enable our customers to launch sophisticated, scalable advertising campaigns — onto digital devices and televisions — within minutes. Brands use our platform to verify the success and impact of their advertising campaigns by measuring the audience reached by the campaign, how the audience interacted with their advertisements and the impact the campaign had on the consumer’s perception of the brand. Our platform uses these real-time insights to dynamically optimize spend across multiple sources of inventory including digital ad exchanges, supply-side platforms, private marketplaces, ad networks and direct premium publishers. Our platform measures key brand advertising metrics including brand lift, as measured by integrated brand surveys, as well as GRPs and engagement.
We make our platform available through two offerings: Platform Direct, which allows advertisers to continuously run campaigns through a self-serve model, and Platform Services, which allows advertisers to specify campaign objectives and have our team execute the campaign on their behalf using our platform.
Our Platform Direct offering allows advertisers to run self-serve campaigns eliminating the often complex and inefficient RFP process through which digital media is typically bought. Platform Direct customers enter into master service agreements with us that enable them to execute all of their campaigns under the agreement without the need for campaign-by-campaign insertion orders or IOs. We generate Platform Direct revenue by charging our customers a utilization fee that is a percentage of media spend as well as fees for additional features offered through our platform. Because Platform Direct customers have control of the media purchasing decisions through our platform, our Platform Direct revenue is recognized on a net basis, meaning that it only includes our fees and not the cost of media purchased. The gross margin for our Platform Direct offering for the year ended December 31, 2015 was 96%.
Our Platform Services offering allows advertisers who continue to use a traditional RFP process to realize the benefits of our platform without needing to alter their purchasing process. Platform Services arrangements are generally in the form of discrete IOs which are negotiated on a campaign-by-campaign basis. We generate Platform Services revenue by delivering digital video advertisements based upon our customer’s campaign specifications. Our Platform Services revenue is recognized on a gross basis, meaning that it includes the cost of the media purchased. The gross margin for our Platform Services offering for the year ended December 31, 2015 was 49%.
For 2015, campaigns were executed through our platform for over 5,000 brands, both directly and through agencies. Total Spend through our platform has increased to $414.2 million for the year ended December 31, 2015 from $254.3 million and $111.9 million for the years ended December 31, 2014 and 2013, respectively, representing a compound annual growth rate, or CAGR, of 92%. We define Total Spend as the aggregate gross dollar volume that our Platform Direct customers and Platform Services customers spend through our platform, which includes media purchases and our fees. We actively engage with our Platform Services customers to educate them about the benefits of migrating to our Platform Direct offering.
We consider our global capabilities to be a competitive differentiator to global brands and agencies. Campaigns can be executed through our platform in over 70 countries using a single integrated workflow. For financial information about our geographic areas, please see Note 11 to the Notes to Consolidated Financial Statements under Item 8 “Financial Statements and Supplementary Data” in this Report.
40
We were incorporated in California in 2007 and reincorporated in Delaware in March 2014. We initially developed video content syndication and video analytics software for publishers and launched our advertiser-focused platform in 2011. For the year ended December 31, 2015, our revenue increased to $180.7 million from $114.2 million and $57.2 million in the years ended December 31, 2014 and 2013, respectively. For the year ended December 31, 2015, our gross margin was 67.8% compared to 70.3% and 65.6% in the years ended December 31, 2014 and 2013, respectively. We incurred net losses of $13.7 million, $4.4 million and $7.4 million for the years ended December 31, 2015, 2014 and 2013, respectively.
Fourth Quarter Highlights (Unaudited)
For the fourth quarter of 2015, we recorded Total Spend of $134.5 million, an increase of 63% as compared to the fourth quarter of 2014, revenue of $58.5 million, an increase of 62% as compared to the fourth quarter of 2014, and gross profit of $39.2 million, an increase of 52% as compared to the fourth quarter of 2014.
Operating loss was $0.7 million, compared to an operating loss of $2.4 in the fourth quarter of 2014, basic and diluted net loss per share was $0.04, compared to $0.14 in the fourth quarter of 2014.
Our Platform Direct offering represented 73% of Total Spend, with our Platform Services offering representing 27% of Total Spend.
Gross margin was 67%, compared with 71% in the fourth quarter of 2014, largely as a result of the increase in the proportion of Total Spend from Platform Services which has a lower gross margin than Platform Direct.
Please see “— Non-GAAP Financial Measures” below for a reconciliation of Total Spend to the most directly comparable financial measures calculated in accordance with GAAP.
Key Operating and Financial Performance Metrics
To help us monitor the overall performance of our business and identify trends, we evaluate the following key metrics: Total Spend, Platform Direct Spend, revenue, gross profit, gross margin, Adjusted EBITDA, and Number of Platform Direct Clients. Total Spend, Platform Direct Spend, Adjusted EBITDA and Number of Platform Direct Clients are discussed immediately following the table below. Revenue, gross profit and gross margin are further discussed under the headings “Components of our Results of Operations.”
|
|
|
Years ended |
|
|||||||||
|
|
|
December 31, |
|
|||||||||
|
|
|
2015 |
|
|
2014 |
|
|
2013 |
|
|||
|
|
|
(unaudited, in thousands, except percentages and clients) |
|
|||||||||
|
Key Metrics |
|
|
|
|
|
|
|
|
|
|
|
|
|
Platform Direct Spend |
|
$ |
305,748 |
|
|
$ |
189,248 |
|
|
$ |
74,016 |
|
|
Platform Services Spend |
|
|
108,484 |
|
|
|
65,012 |
|
|
|
37,883 |
|
|
Total Spend |
|
$ |
414,232 |
|
|
$ |
254,260 |
|
|
$ |
111,899 |
|
|
Platform Direct revenue |
|
$ |
72,212 |
|
|
$ |
49,231 |
|
|
$ |
19,331 |
|
|
Platform Services revenue |
|
|
108,484 |
|
|
|
65,012 |
|
|
|
37,883 |
|
|
Total revenue |
|
$ |
180,696 |
|
|
$ |
114,243 |
|
|
$ |
57,214 |
|
|
Gross profit |
|
$ |
122,503 |
|
|
$ |
80,302 |
|
|
$ |
37,516 |
|
|
Gross margin |
|
|
67.8 |
% |
|
|
70.3 |
% |
|
|
65.6 |
% |
|
Adjusted EBITDA |
|
$ |
3,358 |
|
|
$ |
2,553 |
|
|
$ |
(5,183 |
) |
|
Number of Platform Direct Clients |
|
|
446 |
|
|
|
333 |
|
|
|
208 |
|
Total Spend and Platform Direct Spend
For purposes of calculating Total Spend and Platform Direct Spend, we define spend as the aggregate gross dollar volume that our customers spend through our platform, which includes cost of media purchases and our fees. Platform Direct Spend does not represent revenue earned by us and is a non-GAAP financial measure defined by us as the Spend through our Platform Direct offering. Platform Services Spend equals our Platform Services revenue. Total Spend does not represent revenue earned by us and is a non-GAAP financial measure defined by us as the sum of Platform Direct Spend and Platform Services Spend. We believe Platform Direct
41
Spend and Total Spend are meaningful measures of our operating performance because our ability to generate increases in Platform Direct Spend and Total Spend are strongly correlated to our ability to generate increases in Platform Direct revenue and revenue, respectively. Platform Direct Spend and Total Spend are used by our management and board of directors to understand our business and make operating decisions. A limitation of each of Platform Direct Spend and Total Spend is that each is a measure that we have defined for internal purposes that may be unique to us, and therefore it may not enhance the comparability of our results to other companies in our industry that have similar business arrangements but present the impact of media costs differently. Because of these limitations you should consider Platform Direct Spend and Total Spend along with the corresponding GAAP-based measures. Please see “— Non-GAAP Financial Measures” below for reconciliations of these measures to Platform Direct revenue and revenue, the most directly comparable financial measures calculated in accordance with GAAP.
Adjusted EBITDA
Adjusted EBITDA is a non-GAAP financial measure defined by us as net loss before interest expense, net, provision for income tax, depreciation and amortization expense excluding amortization of internal use software development costs, stock-based compensation expense, foreign exchange gains and losses, both realized and unrealized, change in fair value of convertible preferred stock warrant liability and loss on extinguishment of convertible notes. Adjusted EBITDA is a key measure used by our management and board of directors to understand and evaluate our core operating performance and trends, to prepare and approve our annual budget and to develop short and long-term operational plans. In particular, we believe that the exclusion of the amounts eliminated in calculating Adjusted EBITDA can provide a useful measure for period-to-period comparisons of our core business. Accordingly, we believe that Adjusted EBITDA provides useful information to investors and others in understanding and evaluating our operating results in the same manner as our management and board of directors. Please see “— Non-GAAP Financial Measures” below for a reconciliation of Adjusted EBITDA to net loss, the most directly comparable financial measure calculated in accordance with GAAP.
Number of Platform Direct Clients
We define a Platform Direct Client as a customer that had total aggregate spend of at least $10,000 through our platform during the previous twelve months. For purposes of this definition, all branches or divisions of a customer that operate under its contract with us are considered a single Platform Direct Client. In a limited number of instances in any period, branches or divisions of an advertiser that operate under distinct contracts are each considered a separate Platform Direct Client. For example, of our 446 Platform Direct Clients in 2015, 70 represented distinct operations of 22 global companies, primarily advertising agencies, based in different jurisdictions and with respect to which we have negotiated and manage separate contractual relationships. We believe that our total number of Platform Direct Clients is an important measure of our ability to increase revenue and the effectiveness of our sales force.
Platform Direct Cohort Spend
In order to analyze the contribution to the growth of our business driven by the increase in spend from pre-existing Platform Direct customers, we measure Platform Direct Spend for the set of new customers, or Cohort, that commenced spending on our Platform Direct offering in a specific year relative to subsequent periods. As illustrated in the following table, the spend from our pre-existing Platform Direct customers has increased over subsequent periods.
We believe that this analysis is helpful in understanding our business.
|
|
|
Years Ended December 31, |
|
|||||||||||||||||
|
Cohort Spend (1) |
|
2011 |
|
|
2012 |
|
|
2013 |
|
|
2014 |
|
|
2015 |
|
|||||
|
|
|
(in thousands) |
|
|||||||||||||||||
|
Pre-existing Platform Direct customers |
|
$ |
— |
|
|
$ |
17,170 |
|
|
$ |
51,289 |
|
|
$ |
148,109 |
|
|
$ |
251,376 |
|
|
New Platform Direct customers |
|
|
2,552 |
|
|
|
6,847 |
|
|
|
22,189 |
|
|
|
40,785 |
|
|
|
54,188 |
|
|
Total |
|
$ |
2,552 |
|
|
$ |
24,017 |
|
|
$ |
73,478 |
|
|
$ |
188,894 |
|
|
$ |
305,564 |
|
|
(1) |
Does not include revenue, which equals spend, from our video syndication software offering, a legacy technology which is not part of our digital video advertising spend platform. Customers who use this software are generally not customers for our Platform Direct and Platform Services offerings. We believe that excluding such revenue from the cohort analysis presents a more accurate basis for comparing results across the periods presented. |
Factors Affecting Our Performance
We believe that the continued growth and future success of our business depend on various opportunities, challenges and other factors, including the following:
42
Retention of and Growth in Spend by Existing Customers
Our future revenue is dependent upon our ability to retain our existing customers and to gain a larger amount of their advertising spend through both our Platform Direct and Platform Services offerings. In particular, our recent growth in Total Spend has been driven by an increase in spend by our existing Platform Direct customers. For 2015, 82% of our Platform Direct Spend was from customers that first transacted through our Platform Direct offering in prior years. Of our 25 largest Platform Direct Clients by Platform Direct Spend in 2014, 23 or 92% were also Platform Direct Clients in 2015. Of our 50 largest Platform Direct Clients by Platform Direct Spend in 2014, 45 or 90% were also Platform Direct Clients in 2015.
Customer Transition from Platform Services to Platform Direct
Our sales strategy is to educate our customers about the benefits of shifting from Platform Services, where purchases are made on a campaign-by-campaign basis, to Platform Direct, where customers are able to consolidate their video advertising spend through one solution on a self-serve basis. Our future performance will be impacted by our ability to continue to convince customers to shift to our Platform Direct offering. Since 2011, the growth in the proportion of our Total Spend represented by Platform Direct Spend is an indicator of our ability to convince customers to shift from Platform Services to our Platform Direct offering.
Sales Leverage Improvement
Our ability to achieve and sustain profitability will depend on our ability to generate operating leverage inherent from the self-serve model of our Platform Direct offering. After our initial investments to acquire new Platform Direct clients, we typically generate significant revenue from these clients without commensurate increases in sales and marketing expenses.
Investment in Growth
We plan to continue to invest for long-term growth. We anticipate that our operating expenses will increase in the foreseeable future as we invest in research and development to maintain and enhance our platform, in sales and marketing primarily to acquire new customers and general and administrative expenses to support our growth. We believe that these investments will contribute to our long-term growth, although they will adversely affect our results of operations in the near term. In addition, the timing of these investments can result in fluctuations in our annual and quarterly operating results.
Market Growth
We expect to benefit from the continued growth in the digital video advertising market but any material change in the growth rate of this market could affect our performance. The growth of such market may be adversely impacted by a variety of factors including any delays in the shift of video advertising spend from traditional TV to digital channels. In addition, advertising spend is closely tied to the performance of the economy and a downturn in economic conditions could adversely affect the overall advertising market and our operating results.
Revenue Growth from Additional Media Markets
In 2015, 2014 and 2013 approximately 70%, 91% and 95% of our revenue, respectively, came from advertising served to personal computer users. Our future performance will be dependent in part upon the continued growth of digital video channels, including mobile video, connected TV, social video and TV formats such as video on demand, and upon our ability to grow our revenue in these channels. Accordingly, our business and operating results will be significantly affected by our ability to timely enhance our platform to address these emerging segments of the digital video advertising market and the speed with which advertisers adopt these channels to conduct their advertising campaigns.
Seasonality
In the advertising industry, companies commonly experience seasonal fluctuations in revenue. For example, many advertisers allocate the largest portion of their budgets to the fourth quarter of the calendar year to coincide with increased holiday purchasing. Historically, the fourth quarter of the year reflects our highest level of advertising activity, and the first quarter reflects the lowest level of such activity. We expect our revenue to continue to fluctuate based on seasonal factors that affect the advertising industry as a whole.
43
Components of Our Results of Operations
Revenue
We generate revenue from our Platform Direct customers from fees based on a percentage of their media spend through our platform as well as from fees for additional services delivered concurrently such as audience targeting data, ad serving, brand safety, topic targeting and other reporting related services that we offer. We generate revenue from our Platform Services customers by delivering digital video advertisements based upon a pre-agreed set of fixed objectives with an advertiser or agency. Our Platform Services business is generally priced based upon a cost per thousand impressions, or CPM, or based upon specific campaign specifications such as number of engagements, completed views or on-target impressions.
Cost of Revenue
Cost of revenue is comprised primarily of media costs. Media costs consist of advertising impressions we purchase from advertising sources of inventory in connection with our Platform Services offering. We typically pay for these impressions on a CPM basis. Cost of revenue also includes technical infrastructure costs which include the cost of internal and third-party servers and related services, internet access costs and amortization of internal use software development costs on revenue-producing technologies. Technical infrastructure costs represented 4% of our cost of revenue for the year ended December 31, 2015. After giving effect to the allocation of these costs between our Platform Direct revenue (in respect of which it is the largest component of cost of revenue) and Platform Services revenue based upon the amount of media purchases through each service, our gross margin for Platform Direct revenue and Platform Services revenue was 96% and 49%, respectively, for the year ended December 31, 2015.
In our Platform Services arrangements, we generally enter into binding IOs with fixed price commitments which are determined prior to the launch of an advertising campaign. To fulfill these commitments, we purchase advertising inventory on a real-time basis during the course of the advertising campaign period, which may be weeks or months. As a result, we are exposed to market risk that the cost of such inventory to us may be greater than we expected when we entered into the IO or we may benefit from market prices being less than we expected, either of which impact our media costs as a percentage of revenue.
Operating Expenses
We classify our operating expenses into three categories: research and development, sales and marketing and general and administrative. Our operating expenses consist primarily of personnel costs, technical infrastructure costs, marketing related costs, and facilities costs. Personnel costs include salaries, bonuses and commissions for sales personnel, stock-based compensation expense, and employee benefit costs.
Our research and development expenses consist primarily of personnel costs, outsourced engineering costs associated with the ongoing maintenance and development of our platform and related technologies, allocated technical infrastructure costs directly related to research and development activities, such as testing, and other operating costs allocable to engineering activities.
Our sales and marketing expenses consist primarily of personnel costs, including operations personnel costs allocable to sales and marketing activities, outsourced sales and marketing activities, brand marketing, trade shows, travel and entertainment, and marketing collateral.
Our general and administrative expenses consist primarily of personnel costs associated with our executive, finance, human resources, legal and other administrative personnel, and also include accounting, legal and other professional service fees, facility costs, bad debt expense, depreciation expense and other corporate expenses.
Other Expense, Net
Loss on extinguishment of convertible notes relates to the redemption of convertible notes from all of the investors in TubeMogul Japan, Inc. in 2014.
Interest expense, net is related to our term loan and revolving line of credit.
Change in fair value of convertible preferred stock warrant liability is related to a mark to market adjustment associated with a warrant to purchase our preferred stock, all of which was automatically converted into a warrant to purchase shares of common stock as a result of the IPO, which closed on July 23, 2014.
Foreign currency (gain) loss, net consists of gains and losses on foreign currency translation. We have foreign currency exposure related to our accounts receivable and accounts payable that are denominated in currencies other than the U.S. dollar,
44
principally the British pound, Canadian dollar, Euro and Australian dollar. To the extent that our revenue from international operations increases and the scope of our international operations grows, our operating results will become more susceptible to changes in foreign currency rates.
Provision for Income Taxes
Provision for income taxes consists primarily of state income taxes in the U.S. and income taxes in foreign jurisdictions in which we conduct business. Due to uncertainty as to the realization of benefits from our deferred tax assets, including net operating loss carry forwards, research and development and other tax credits, we have a full valuation allowance reserved against such assets.
Results of Operations
The following tables set forth our consolidated results of operations and our consolidated results of operations as a percentage of total revenue for the periods presented.
|
|
|
Years Ended |
|
|
|||||||||||||||||||||
|
|
|
December 31, |
|
|
|||||||||||||||||||||
|
|
|
2015 |
|
|
% of Revenue |
|
|
2014 |
|
|
% of Revenue |
|
|
2013 |
|
|
% of Revenue |
|
|
||||||
|
|
|
(in thousands, except percentages) |
|
|
|||||||||||||||||||||
|
Revenue: |
|
|
|
|
|
|
|
|
|
|
|
|
|
|
|
|
|
|
|
|
|
|
|
|
|
|
Platform Direct |
|
$ |
72,212 |
|
|
|
40 |
% |
|
$ |
49,231 |
|
|
|
43 |
% |
|
$ |
19,331 |
|
|
|
34 |
% |
|
|
Platform Services |
|
|
108,484 |
|
|
|
60 |
% |
|
|
65,012 |
|
|
|
57 |
% |
|
|
37,883 |
|
|
|
66 |
% |
|
|
Total revenue |
|
|
180,696 |
|
|
|
100 |
% |
|
|
114,243 |
|
|
|
100 |
% |
|
|
57,214 |
|
|
|
100 |
% |
|
|
Cost of revenue |
|
|
58,193 |
|
|
|
32 |
% |
|
|
33,941 |
|
|
|
30 |
% |
|
|
19,698 |
|
|
|
34 |
% |
|
|
Gross profit |
|
|
122,503 |
|
|
|
68 |
% |
|
|
80,302 |
|
|
|
70 |
% |
|
|
37,516 |
|
|
|
66 |
% |
|
|
Operating expenses: |
|
|
|
|
|
|
|
|
|
|
|
|
|
|
|
|
|
|
|
|
|
|
|
|
|
|
Research and development (1) |
|
|
41,007 |
|
|
|
23 |
% |
|
|
22,142 |
|
|
|
19 |
% |
|
|
11,837 |
|
|
|
21 |
% |
|
|
Sales and marketing (1) |
|
|
55,331 |
|
|
|
31 |
% |
|
|
38,133 |
|
|
|
33 |
% |
|
|
21,378 |
|
|
|
38 |
% |
|
|
General and administrative (1) |
|
|
37,000 |
|
|
|
20 |
% |
|
|
21,615 |
|
|
|
19 |
% |
|
|
10,477 |
|
|
|
18 |
% |
|
|
Total operating expenses |
|
|
133,338 |
|
|
|
74 |
% |
|
|
81,890 |
|
|
|
72 |
% |
|
|
43,692 |
|
|
|
77 |
% |
|
|
Loss from operations |
|
|
(10,835 |
) |
|
|
(6 |
)% |
|
|
(1,588 |
) |
|
|
(2 |
)% |
|
|
(6,176 |
) |
|
|
(11 |
)% |
|
|
Other expense, net: |
|
|
|
|
|
|
|
|
|
|
|
|
|
|
|
|
|
|
|
|
|
|
|
|
|
|
Interest expense, net |
|
|
(37 |
) |
|
|
(0 |
)% |
|
|
(216 |
) |
|
|
(0 |
)% |
|
|
(169 |
) |
|
|
(0 |
)% |
|
|
Other, net |
|
|
— |
|
|
|
— |
|
|
|
(370 |
) |
|
|
(0 |
)% |
|
|
(388 |
) |
|
|
(1 |
)% |
|
|
Foreign exchange loss, net |
|
|
(2,196 |
) |
|
|
(1 |
)% |
|
|
(1,987 |
) |
|
|
(2 |
)% |
|
|
(618 |
) |
|
|
(1 |
)% |
|
|
Other expense, net |
|
|
(2,233 |
) |
|
|
(1 |
)% |
|
|
(2,573 |
) |
|
|
(2 |
)% |
|
|
(1,175 |
) |
|
|
(2 |
)% |
|
|
Net loss before income taxes |
|
|
(13,068 |
) |
|
|
(7 |
)% |
|
|
(4,161 |
) |
|
|
(4 |
)% |
|
|
(7,351 |
) |
|
|
(13 |
)% |
|
|
Provision for income taxes |
|
|
(663 |
) |
|
|
(0 |
)% |
|
|
(283 |
) |
|
|
(0 |
)% |
|
|
(60 |
) |
|
|
(0 |
)% |
|
|
Net loss |
|
$ |
(13,731 |
) |
|
|
(7 |
)% |
|
$ |
(4,444 |
) |
|
|
(4 |
)% |
|
$ |
(7,411 |
) |
|
|
(13 |
)% |
|
|
(1) |
Stock-based compensation expense included above was as follows: |
|
|
|
Years Ended |
|
|||||||||
|
|
|
December 31, |
|
|||||||||
|
|
|
2015 |
|
|
2014 |
|
|
2013 |
|
|||
|
|
|
(in thousands) |
|
|||||||||
|
Research and development |
|
$ |
3,687 |
|
|
$ |
1,094 |
|
|
$ |
206 |
|
|
Sales and marketing |
|
|
3,717 |
|
|
|
1,058 |
|
|
|
230 |
|
|
General and administrative |
|
|
5,159 |
|
|
|
1,391 |
|
|
|
325 |
|
|
Total stock-based compensation |
|
$ |
12,563 |
|
|
$ |
3,543 |
|
|
$ |
761 |
|
45
Comparison of the Years Ended December 31, 2015, 2014, and 2013
Revenue
|
|
|
Years Ended December 31, |
|
|
$ Change |
|
|
% Change |
|
|||||||||||||||||||
|
|
|
2015 |
|
|
2014 |
|
|
2013 |
|
|
2015 vs. 2014 |
|
|
2014 vs. 2013 |
|
|
2015 vs. 2014 |
|
|
2014 vs. 2013 |
|
|||||||
|
|
|
(in thousands except percentages) |
|
|||||||||||||||||||||||||
|
Platform Direct |
|
$ |
72,212 |
|
|
$ |
49,231 |
|
|
$ |
19,331 |
|
|
$ |
22,981 |
|
|
$ |
29,900 |
|
|
|
47 |
% |
|
|
155 |
% |
|
Platform Services |
|
|
108,484 |
|
|
|
65,012 |
|
|
|
37,883 |
|
|
|
43,472 |
|
|
|
27,129 |
|
|
|
67 |
% |
|
|
72 |
% |
|
Total revenue |
|
$ |
180,696 |
|
|
$ |
114,243 |
|
|
$ |
57,214 |
|
|
$ |
66,453 |
|
|
$ |
57,029 |
|
|
|
58 |
% |
|
|
100 |
% |
Revenue increased $66.5 million, or 58%, during the year ended December 31, 2015 compared to the year ended December 31, 2014. Platform Direct revenue increased $23.0 million, or 47%, during the year ended December 31, 2015 compared to the year ended December 31, 2014. Platform Direct revenue from Platform Direct customers who were customers during the year ended December 31, 2014 contributed $8.7 million of the growth. The growth relating to existing customer revenue is consistent with our strategy of increasing Platform Direct Spend amongst our existing clients. Platform Direct revenue from Platform Direct customers who spent with us during the year ended December 31, 2015 that did not spend with us during the year ended December 31, 2014 contributed $14.3 million of the growth. The growth relating to new customer revenue resulted primarily from the increased number of Platform Direct Clients from 333 for the year ended December 31, 2014 to 446 for the year ended December 31, 2015. Platform Services revenue increased $43.5 million, or 67%, during the year ended December 31, 2015 compared to the year ended December 31, 2014. Platform Services revenue from Platform Services customers who were customers during the year ended December 31, 2014 contributed $25.5 million of the growth. Platform Services revenue from Platform Services customers who spent with us during the year ended December 31, 2015 that did not spend with us during the year ended December 31, 2014 contributed $18.0 million of the growth. The total Platform Services revenue growth resulted from both the increased number of Platform Services customers that had revenue of at least $10,000 from 228 for the year ended December 31, 2014 to 271 for the year ended December 31, 2015, and the increase in Platform Services revenue per Platform Services customer that had revenue of at least $10,000 from $0.3 million for the year ended December 31, 2014 to $0.4 million for the year ended December 31, 2015. We expect that revenue will increase as we expand our customer base and existing customers increase their advertising spend though our platform.
Revenue increased $57.0 million, or 100%, during the year ended December 31, 2014 compared to the year ended December 31, 2013. Platform Direct revenue increased $29.9 million, or 155%, during the year ended December 31, 2014 compared to the year ended December 31, 2013. Platform Direct revenue from Platform Direct customers who were customers during the year ended December 31, 2013 contributed $19.4 million of the growth. The growth relating to existing customer revenue is consistent with our strategy of increasing Platform Direct Spend amongst our existing clients. Platform Direct revenue from Platform Direct customers who spent with us during the year ended December 31, 2014 that did not spend with us during the year ended December 31, 2013 contributed $10.5 million of the growth. The growth relating to new customer spend resulted primarily from the increased number of Platform Direct Clients from 208 for the year ended December 31, 2013 to 333 for the year ended December 31, 2014. Platform Services revenue increased $27.1 million, or 72%, during the year ended December 31, 2014 compared to the year ended December 31, 2013. Platform Services revenue from Platform Services customers who were customers during the year ended December 31, 2013 contributed $16.5 million of the growth. Platform Services revenue from Platform Services customers who spent with us during the year ended December 31, 2014 that did not spend with us during the year ended December 31, 2013 contributed to $10.6 million of the growth. The total Platform Services revenue growth resulted from both the increased number of Platform Services customers that had revenue of at least $10,000 from 157 for the year ended December 31, 2013 to 228 for the year ended December 31, 2014, and the increase in Platform Services revenue per Platform Services customer that had revenue of at least $10,000 from $0.2 million for the year ended December 31, 2013 to $0.3 million for the year ended December 31, 2014.
Cost of Revenue, Gross Profit and Gross Margin
|
|
|
Years Ended December 31, |
|
|
$ Change |
|
|
% Change |
|
|||||||||||||||||||
|
|
|
2015 |
|
|
2014 |
|
|
2013 |
|
|
2015 vs. 2014 |
|
|
2014 vs. 2013 |
|
|
2015 vs. 2014 |
|
|
2014 vs. 2013 |
|
|||||||
|
|
|
(in thousands except percentages) |
|
|||||||||||||||||||||||||
|
Cost of revenue |
|
$ |
58,193 |
|
|
$ |
33,941 |
|
|
$ |
19,698 |
|
|
$ |
24,252 |
|
|
$ |
14,243 |
|
|
|
71 |
% |
|
|
72 |
% |
|
Gross profit |
|
|
122,503 |
|
|
|
80,302 |
|
|
|
37,516 |
|
|
|
42,201 |
|
|
|
42,786 |
|
|
|
53 |
% |
|
|
114 |
% |
|
Gross margin |
|
|
67.8 |
% |
|
|
70.3 |
% |
|
|
65.6 |
% |
|
|
|
|
|
|
|
|
|
|
|
|
|
|
|
|
Cost of revenue increased $24.3 million, or 71%, during the year ended December 31, 2015 compared to the year ended December 31, 2014. This increase was mainly due to a $22.7 million increase in media costs associated with the growth in Platform Services revenue. Technical infrastructure costs and costs related to certain guaranteed supplier contracts increased by $1.0 million, or
46
57%, for the year ended December 31, 2015. The increase in technical infrastructure cost was due to increased costs of third-party data center operations, hosting and ad server management and bandwidth costs which was associated with the growth in Platform Direct and Platform Services revenue in the year ended December 31, 2015. After giving effect to the allocation of these technical infrastructure costs between Platform Direct revenue and Platform Services revenue, gross profit from Platform Direct and Platform Services revenue increased to $69.3 million and $53.2 million for the year ended December 31, 2015 from $47.6 million and $32.7 million for the year ended December 31, 2014, respectively. Gross margin decreased to 67.8% for the year ended December 31, 2015 compared to 70.3% for the year ended December 31, 2014, primarily due to Platform Services representing 60% of total revenue compared to 57% in the comparable period. We anticipate that cost of revenue will increase in absolute dollars as our revenue increases, but will decrease as a percentage of revenue as our Platform Direct revenue increases as a percentage of our total revenue. We also expect that over time our Platform Services gross margins will decrease and our Platform Direct gross margins will remain relatively stable.
Cost of revenue increased $14.2 million, or 72%, during the year ended December 31, 2014 compared to the year ended December 31, 2013. This increase was mainly due to a $13.5 million increase in media costs associated with the growth in Platform Services revenue. Technical infrastructure costs increased by $0.5 million, or 51%, for the year ended December 31, 2014. After giving effect to the allocation of these technical infrastructure costs between Platform Direct revenue and Platform Services revenue, gross profit from Platform Direct and Platform Services revenue increased to $47.6 million and $32.7 million for the year ended December 31, 2014 from $18.4 million and $19.1 million for the year ended December 31, 2013, respectively. Gross margin increased to 70.3% for the year ended December 31, 2014 compared to 65.6% for the year ended December 31, 2013, primarily due to Platform Direct having grown to 43% of total revenue as compared to 34% in the comparable period.
Research and Development
|
|
|
Years Ended December 31, |
|
|
$ Change |
|
|
% Change |
|
|||||||||||||||||||
|
|
|
2015 |
|
|
2014 |
|
|
2013 |
|
|
2015 vs. 2014 |
|
|
2014 vs. 2013 |
|
|
2015 vs. 2014 |
|
|
2014 vs. 2013 |
|
|||||||
|
|
|
(in thousands except percentages) |
|
|||||||||||||||||||||||||
|
Research and development |
|
$ |
41,007 |
|
|
$ |
22,142 |
|
|
$ |
11,837 |
|
|
$ |
18,865 |
|
|
$ |
10,305 |
|
|
|
85 |
% |
|
|
87 |
% |
Research and development expense increased by $18.9 million, or 85%, during the year ended December 31, 2015 compared to the year ended December 31, 2014. The growth in absolute terms as well as a percentage of revenue was primarily due to an increase in personnel costs of $15.0 million and an increase in technical infrastructure costs of $5.1 million. The increase in personnel costs was primarily due to an increase in headcount, which reflected our continued investment in hiring technical personnel, including several engineering leads, to maintain our platform and support our research and development efforts. The increase in technical infrastructure costs was attributable to increased costs of third-party data center operations, hosting and ad server management and bandwidth costs necessary to support our increased research and development related activities. These increases were offset by capitalized internally developed software costs of $2.4 million during the year ended December 31, 2015 compared to $0.5 million during the year ended December 31, 2014. We believe that continued investment in our platform is critical to achieving our objectives, and we expect research and development expenses to continue to increase over time.
Research and development expense increased by $10.3 million, or 87%, during the year ended December 31, 2014 compared to the year ended December 31, 2013. The increase was primarily due to an increase in personnel costs of $7.7 million and an increase in technical infrastructure costs of $1.7 million. The increase in personnel costs, was primarily due to an increase in headcount, which reflected our continued investment in hiring technical personnel, including several engineering leads, to maintain our platform and support our research and development efforts. The increase in technical infrastructure costs was attributable to increased costs of third-party data center operations, hosting and ad server management and bandwidth costs necessary to support our increased research and development related activities. We also increased our engineering consulting expenses by $0.8 million due to additional product development costs and the need for specialized skills to support certain projects. Additionally, we capitalized internally developed software costs of $0.5 million during the year ended December 31, 2014 compared to $0.6 million during the year ended December 31, 2013.
Sales and Marketing
|
|
|
Years Ended December 31, |
|
|
$ Change |
|
|
% Change |
|
|||||||||||||||||||
|
|
|
2015 |
|
|
2014 |
|
|
2013 |
|
|
2015 vs. 2014 |
|
|
2014 vs. 2013 |
|
|
2015 vs. 2014 |
|
|
2014 vs. 2013 |
|
|||||||
|
|
|
(in thousands except percentages) |
|
|||||||||||||||||||||||||
|
Sales and marketing |
|
$ |
55,331 |
|
|
$ |
38,133 |
|
|
$ |
21,378 |
|
|
$ |
17,198 |
|
|
$ |
16,755 |
|
|
|
45 |
% |
|
|
78 |
% |
47
Sales and marketing expense increased in absolute terms by $17.2 million, or 45%, during the year ended December 31, 2015 compared to the year ended December 31, 2014. The increase was primarily due to an increase in personnel costs of $15.1 million, including a $1.9 million increase in sales commissions, and an increase in marketing expenses of $1.8 million. The increase in personnel costs was primarily due to an increase in sales and marketing headcount during the year ended December 31, 2015. We expect sales and marketing expenses to increase in future periods as we continue to actively invest in our business, including expanding our domestic and international business.
Sales and marketing expense increased by $16.8 million, or 78%, during the year ended December 31, 2014 compared to the year ended December 31, 2013. The increase was primarily due to an increase in personnel costs of $13.3 million, including a $3.7 million increase in sales commissions, and an increase in marketing expenses of $3.2 million. The increase in personnel costs was primarily due to an increase in sales and marketing headcount during the year ended December 31, 2014.
General and Administrative
|
|
|
Years Ended December 31, |
|
|
$ Change |
|
|
% Change |
|
|||||||||||||||||||
|
|
|
2015 |
|
|
2014 |
|
|
2013 |
|
|
2015 vs. 2014 |
|
|
2014 vs. 2013 |
|
|
2015 vs. 2014 |
|
|
2014 vs. 2013 |
|
|||||||
|
|
|
(in thousands except percentages) |
|
|||||||||||||||||||||||||
|
General and administrative |
|
$ |
37,000 |
|
|
$ |
21,615 |
|
|
$ |
10,477 |
|
|
$ |
15,385 |
|
|
$ |
11,138 |
|
|
|
71 |
% |
|
|
106 |
% |
General and administrative expense increased by $15.4 million, or 71%, during the year ended December 31, 2015 compared to the year ended December 31, 2014. The growth in absolute terms as well as a percentage of revenue was primarily due to an increase in personnel costs of $10.0 million related to an increase in headcount to support our growth, including additions of several senior administrative personnel, an increase in facility costs of $2.4 million as we opened new offices and expanded some of our existing facilities to accommodate our increase in personnel, an increase in depreciation expense of $1.0 million, an increase in professional fees of $0.8 million due to increased legal, accounting and audit services to support the Company’s operations as a public company, and an increase in bad debt expense of $0.4 million. We expect to continue to invest in our corporate infrastructure and incur further expenses related to being a public company, including accounting and legal costs, investor relations costs, insurance premiums and other compliance costs associated with Section 404 of the Sarbanes-Oxley Act. As a result, we anticipate that general and administrative expenses will increase in future periods.
General and administrative expense increased by $11.1 million, or 106%, during the year ended December 31, 2014 compared to the year ended December 31, 2013. The growth in absolute terms as well as a percentage of revenue was primarily due to an increase in personnel costs of $6.1 million related to an increase in headcount to support our growth, including additions of several senior administrative personnel, an increase in facility costs of $2.0 million as we opened new offices and expanded some of our existing facilities to accommodate our increase in personnel, an increase in professional fees of $1.8 million due to increased legal, accounting and audit services to support the Company’s operations as a public company and an increase in bad debt expense of $0.4 million.
Other Expense, Net
Loss on extinguishment of convertible notes relates to the redemption of convertible notes from all of the investors in TubeMogul Japan, Inc.
The increase in other expenses, net was primarily due to a loss on foreign currency translations due to the impact of foreign currency exchange rate fluctuations on our higher outstanding balance of foreign currency accounts receivable. Interest expense is expected to fluctuate as we draw on or pay down our line of credit and term debt.
Provision for Income Taxes
Our provision for income taxes for 2015, 2014 and 2013 primarily relates to taxes due in foreign jurisdictions. We expect to maintain this full valuation allowance in the near term.
48
Non-GAAP Financial Measures
Adjusted EBITDA
Our use of Adjusted EBITDA has limitations as an analytical tool, and you should not consider it in isolation or as a substitute for analysis of our financial results as reported under GAAP. Some of these limitations are as follows:
|
|
· |
although depreciation and amortization expense (excluding amortization of internal use software development costs) are non-cash charges, the assets being depreciated and amortized may have to be replaced in the future, and Adjusted EBITDA does not reflect cash capital expenditure requirements for such replacements or for new capital expenditure requirements; |
|
|
· |
Adjusted EBITDA does not reflect: (1) changes in, or cash requirements for, our working capital needs; (2) the potentially dilutive impact of stock-based compensation; (3) impact of foreign exchange gains and losses, both realized and unrealized; (4) loss on extinguishment of convertible notes; (5) change in fair value of convertible preferred stock warranty liability; or (6) tax payments that may represent a reduction in cash available to us; and |
|
|
· |
other companies, including companies in our industry, may calculate Adjusted EBITDA or similarly titled measures differently, which reduces its usefulness as a comparative measure. |
Because of these and other limitations, you should consider Adjusted EBITDA along with other GAAP-based financial performance measures, including various cash flow metrics, net loss, and our GAAP financial results. The following is a reconciliation of Adjusted EBITDA to net loss, the most directly comparable financial measure calculated in accordance with GAAP for each of the periods indicated:
|
|
|
Years Ended |
|
|||||||||||||||||
|
|
|
December 31, |
|
|||||||||||||||||
|
|
|
2015 |
|
|
2014 |
|
|
2013 |
|
|
2012 |
|
|
2011 |
|
|||||
|
|
|
(unaudited, in thousands) |
|
|||||||||||||||||
|
Net loss |
|
$ |
(13,731 |
) |
|
$ |
(4,444 |
) |
|
$ |
(7,411 |
) |
|
$ |
(3,565 |
) |
|
$ |
(4,093 |
) |
|
Interest expense, net |
|
|
37 |
|
|
|
216 |
|
|
|
169 |
|
|
|
232 |
|
|
|
72 |
|
|
Provision for income taxes |
|
|
663 |
|
|
|
283 |
|
|
|
60 |
|
|
|
94 |
|
|
|
1 |
|
|
Depreciation and amortization expense, excluding amortization of internal use software development costs |
|
|
1,630 |
|
|
|
598 |
|
|
|
232 |
|
|
|
89 |
|
|
|
99 |
|
|
Stock-based compensation expense |
|
|
12,563 |
|
|
|
3,543 |
|
|
|
761 |
|
|
|
430 |
|
|
|
133 |
|
|
Foreign exchange loss, net |
|
|
2,196 |
|
|
|
1,987 |
|
|
|
618 |
|
|
|
141 |
|
|
|
23 |
|
|
Change in fair value of convertible preferred stock warrant liability |
|
|
— |
|
|
|
(168 |
) |
|
|
388 |
|
|
|
154 |
|
|
|
11 |
|
|
Loss on extinguishment of convertible notes |
|
|
— |
|
|
|
538 |
|
|
|
— |
|
|
|
— |
|
|
|
— |
|
|
Adjusted EBITDA |
|
$ |
3,358 |
|
|
$ |
2,553 |
|
|
$ |
(5,183 |
) |
|
$ |
(2,425 |
) |
|
$ |
(3,754 |
) |
Total Spend and Platform Direct Spend
A limitation of each of Platform Direct Spend and Total Spend is that each is a measure that we have defined for internal purposes that may be unique to us, and therefore it may not enhance the comparability of our results to other companies in our industry that have similar business arrangements but present the impact of media costs differently. Because of these limitations you should consider Platform Direct Spend and Total Spend along with the corresponding GAAP-based measures. The following table presents a reconciliation of these measures to Platform Direct revenue and revenue, the most directly comparable financial measures calculated in accordance with GAAP:
|
|
|
Years ended |
|
|||||||||||||||||
|
|
|
December 31, |
|
|||||||||||||||||
|
|
|
2015 |
|
|
2014 |
|
|
2013 |
|
|
2012 |
|
|
2011 |
|
|||||
|
|
|
(unaudited, in thousands) |
|
|||||||||||||||||
|
Platform Direct Revenue |
|
$ |
72,212 |
|
|
$ |
49,231 |
|
|
$ |
19,331 |
|
|
$ |
5,433 |
|
|
$ |
2,171 |
|
|
Plus: Non-GAAP Platform Direct Media Cost |
|
|
233,536 |
|
|
|
140,017 |
|
|
|
54,685 |
|
|
|
19,599 |
|
|
|
2,143 |
|
|
Platform Direct Spend |
|
|
305,748 |
|
|
|
189,248 |
|
|
|
74,016 |
|
|
|
25,032 |
|
|
|
4,314 |
|
|
Platform Services Spend |
|
|
108,484 |
|
|
|
65,012 |
|
|
|
37,883 |
|
|
|
28,726 |
|
|
|
13,488 |
|
|
Total Spend |
|
$ |
414,232 |
|
|
$ |
254,260 |
|
|
$ |
111,899 |
|
|
$ |
53,758 |
|
|
$ |
17,802 |
|
49
Quarterly Results of Operations
The following tables set forth our unaudited quarterly consolidated statements of operations data in dollars and as a percentage of total revenue, unless otherwise noted, for each of the eight quarters in the period ended December 31, 2015. We have prepared the quarterly consolidated statements of operations data on a basis consistent with the audited financial statements included elsewhere in this Report. In the opinion of management, the financial information in these tables reflects all adjustments, consisting only of normal recurring adjustments, which management considers necessary for a fair presentation of this data. This information should be read in conjunction with the audited consolidated financial statements and related notes included elsewhere in this Report. The results of historical periods are not necessarily indicative of the results for any future period.
|
|
|
Three Months Ended |
|
|||||||||||||||||||||||||||||
|
|
|
Dec 31, |
|
|
Sep 30, |
|
|
Jun 30, |
|
|
Mar 31, |
|
|
Dec 31, |
|
|
Sep 30, |
|
|
Jun 30, |
|
|
Mar 31, |
|
||||||||
|
|
|
2015 |
|
|
2015 |
|
|
2015 |
|
|
2015 |
|
|
2014 |
|
|
2014 |
|
|
2014 |
|
|
2014 |
|
||||||||
|
|
|
(unaudited, in thousands except per share data) |
|
|||||||||||||||||||||||||||||
|
Revenue: |
|
|
|
|
|
|
|
|
|
|
|
|
|
|
|
|
|
|
|
|
|
|
|
|
|
|
|
|
|
|
|
|
|
Platform Direct |
|
$ |
22,187 |
|
|
$ |
17,895 |
|
|
$ |
17,826 |
|
|
$ |
14,304 |
|
|
$ |
16,302 |
|
|
$ |
12,114 |
|
|
$ |
11,567 |
|
|
$ |
9,248 |
|
|
Platform Services |
|
|
36,268 |
|
|
|
28,590 |
|
|
|
27,614 |
|
|
|
16,012 |
|
|
|
19,780 |
|
|
|
15,306 |
|
|
|
17,148 |
|
|
|
12,778 |
|
|
Total revenue |
|
|
58,455 |
|
|
|
46,485 |
|
|
|
45,440 |
|
|
|
30,316 |
|
|
|
36,082 |
|
|
|
27,420 |
|
|
|
28,715 |
|
|
|
22,026 |
|
|
Cost of revenue |
|
|
19,246 |
|
|
|
15,338 |
|
|
|
15,306 |
|
|
|
8,303 |
|
|
|
10,363 |
|
|
|
8,255 |
|
|
|
9,108 |
|
|
|
6,215 |
|
|
Gross profit |
|
|
39,209 |
|
|
|
31,147 |
|
|
|
30,134 |
|
|
|
22,013 |
|
|
|
25,719 |
|
|
|
19,165 |
|
|
|
19,607 |
|
|
|
15,811 |
|
|
Operating expenses: |
|
|
|
|
|
|
|
|
|
|
|
|
|
|
|
|
|
|
|
|
|
|
|
|
|
|
|
|
|
|
|
|
|
Research and development (1) |
|
|
11,804 |
|
|
|
10,931 |
|
|
|
9,503 |
|
|
|
8,769 |
|
|
|
8,107 |
|
|
|
5,287 |
|
|
|
4,940 |
|
|
|
3,808 |
|
|
Sales and marketing (1) |
|
|
17,256 |
|
|
|
13,466 |
|
|
|
13,497 |
|
|
|
11,112 |
|
|
|
13,136 |
|
|
|
8,783 |
|
|
|
8,285 |
|
|
|
7,929 |
|
|
General and administrative (1) |
|
|
10,827 |
|
|
|
9,731 |
|
|
|
8,615 |
|
|
|
7,827 |
|
|
|
6,890 |
|
|
|
5,583 |
|
|
|
4,704 |
|
|
|
4,438 |
|
|
Total operating expenses |
|
|
39,887 |
|
|
|
34,128 |
|
|
|
31,615 |
|
|
|
27,708 |
|
|
|
28,133 |
|
|
|
19,653 |
|
|
|
17,929 |
|
|
|
16,175 |
|
|
(Loss) Income from operations |
|
|
(678 |
) |
|
|
(2,981 |
) |
|
|
(1,481 |
) |
|
|
(5,695 |
) |
|
|
(2,414 |
) |
|
|
(488 |
) |
|
|
1,678 |
|
|
|
(364 |
) |
|
Other (expense) income, net: |
|
|
|
|
|
|
|
|
|
|
|
|
|
|
|
|
|
|
|
|
|
|
|
|
|
|
|
|
|
|
|
|
|
Interest income (expense), net |
|
|
20 |
|
|
|
(6 |
) |
|
|
(23 |
) |
|
|
(28 |
) |
|
|
(33 |
) |
|
|
(63 |
) |
|
|
(79 |
) |
|
|
(41 |
) |
|
Other, net |
|
— |
|
|
— |
|
|
— |
|
|
— |
|
|
|
(538 |
) |
|
— |
|
|
|
449 |
|
|
|
(281 |
) |
|||||
|
Foreign exchange gain (loss), net |
|
|
(436 |
) |
|
|
(719 |
) |
|
|
266 |
|
|
|
(1,307 |
) |
|
|
(977 |
) |
|
|
(1,102 |
) |
|
|
128 |
|
|
|
(36 |
) |
|
Other income (expense), net |
|
|
(416 |
) |
|
|
(725 |
) |
|
|
243 |
|
|
|
(1,335 |
) |
|
|
(1,548 |
) |
|
|
(1,165 |
) |
|
|
498 |
|
|
|
(358 |
) |
|
Net (loss) income before income taxes |
|
|
(1,094 |
) |
|
|
(3,706 |
) |
|
|
(1,238 |
) |
|
|
(7,030 |
) |
|
|
(3,962 |
) |
|
|
(1,653 |
) |
|
|
2,176 |
|
|
|
(722 |
) |
|
Provision for income taxes |
|
|
(406 |
) |
|
|
(48 |
) |
|
|
(95 |
) |
|
|
(114 |
) |
|
|
(82 |
) |
|
|
(64 |
) |
|
|
(92 |
) |
|
|
(45 |
) |
|
Net (loss) income |
|
$ |
(1,500 |
) |
|
$ |
(3,754 |
) |
|
$ |
(1,333 |
) |
|
$ |
(7,144 |
) |
|
$ |
(4,044 |
) |
|
$ |
(1,717 |
) |
|
$ |
2,084 |
|
|
$ |
(767 |
) |
|
Basic and diluted net (loss) income per share attributable to common stockholders (2) |
|
$ |
(0.04 |
) |
|
$ |
(0.11 |
) |
|
$ |
(0.12 |
) |
|
$ |
(0.12 |
) |
|
$ |
(0.14 |
) |
|
$ |
(0.06 |
) |
|
$ |
0.05 |
|
|
$ |
(0.11 |
) |
|
(1) |
Stock-based compensation expense included above was as follows: |
|
|
|
Three Months Ended |
|
|||||||||||||||||||||||||||||
|
|
|
Dec 31, |
|
|
Sep 30, |
|
|
Jun 30, |
|
|
Mar 31, |
|
|
Dec 31, |
|
|
Sep 30, |
|
|
Jun 30, |
|
|
Mar 31, |
|
||||||||
|
|
|
2015 |
|
|
2015 |
|
|
2015 |
|
|
2015 |
|
|
2014 |
|
|
2014 |
|
|
2014 |
|
|
2014 |
|
||||||||
|
|
|
(unaudited, in thousands) |
|
|||||||||||||||||||||||||||||
|
Research and development |
|
$ |
1,178 |
|
|
$ |
1,043 |
|
|
$ |
824 |
|
|
$ |
642 |
|
|
$ |
500 |
|
|
$ |
283 |
|
|
$ |
209 |
|
|
$ |
102 |
|
|
Sales and marketing |
|
|
1,142 |
|
|
|
1,058 |
|
|
|
808 |
|
|
|
709 |
|
|
|
481 |
|
|
|
244 |
|
|
|
193 |
|
|
|
140 |
|
|
General and administrative |
|
|
1,430 |
|
|
|
1,333 |
|
|
|
1,346 |
|
|
|
1,050 |
|
|
|
726 |
|
|
|
261 |
|
|
|
230 |
|
|
|
174 |
|
|
Total stock-based compensation |
|
$ |
3,750 |
|
|
$ |
3,434 |
|
|
$ |
2,978 |
|
|
$ |
2,401 |
|
|
$ |
1,707 |
|
|
$ |
788 |
|
|
$ |
632 |
|
|
$ |
416 |
|
|
(2) |
See Note 8 to the Notes to Consolidated Financial Statements under Item 8 “Financial Statements and Supplementary Data” in this Report for a description of the method used to compute basic and diluted net income (loss) per share. |
Liquidity and Capital Resources
Since our incorporation in March 2007, we have financed our operations and capital expenditures through private sales of convertible preferred stock, lines of credit, term debt and $106.0 million of net proceeds from our IPO and follow-on offerings, after deducting underwriting discounts, commissions and before deducting total expenses in connection with our public offerings of $4.2 million.
Our principal sources of cash are our existing cash and cash equivalents balances and funds that may be drawn under our revolving line of credit and our capital equipment term loan. As of December 31, 2015, we had cash and cash equivalents of $83.4 million and borrowing capacity of $37.9 million under our revolving line of credit and $2.4 million under our capital equipment term
50
loan. As of December 31, 2015 we had $2.1 million outstanding under the revolving line of credit and $2.6 million outstanding under the capital equipment term loan. We believe that our existing cash and cash equivalents together with the revolving line of credit and the capital equipment term loan, will be sufficient to meet our working capital requirements for at least the next 12 months. However, our liquidity assumptions may prove to be incorrect, and we could utilize our available financial resources sooner than we currently expect. Our future capital requirements and the adequacy of available funds will depend on many factors, including those set forth in the section of this Report entitled Item 1A “Risk Factors.”
Cash Flows
The following table summarizes our cash flows for the periods presented:
|
|
|
Years Ended |
|
|||||||||
|
|
|
December 31, |
|
|||||||||
|
|
|
2015 |
|
|
2014 |
|
|
2013 |
|
|||
|
|
|
(in thousands) |
|
|||||||||
|
Cash flows used in operating activities |
|
$ |
(20,471 |
) |
|
$ |
(13,922 |
) |
|
$ |
(8,154 |
) |
|
Cash flows used in investing activities |
|
|
(6,697 |
) |
|
|
(3,707 |
) |
|
|
(1,773 |
) |
|
Cash flows provided by financing activities |
|
|
64,057 |
|
|
|
44,820 |
|
|
|
9,774 |
|
|
Effects of exchange rate on cash and cash equivalents |
|
|
(42 |
) |
|
|
(74 |
) |
|
|
(42 |
) |
|
Increase (decrease) in cash and cash equivalents |
|
$ |
36,847 |
|
|
$ |
27,117 |
|
|
$ |
(195 |
) |
Operating Activities
Cash used in operating activities is primarily influenced by the amount of cash we invest in personnel and infrastructure to support the anticipated growth of our business and the increase in the Total Spend by customers using our platform. Cash used in operating activities has typically been due to net loss, adjusted for non-cash expense items such as depreciation, amortization and stock-based compensation expense, and changes in our operating assets and liabilities in particular accounts receivable, and liabilities as we grow our business. In periods of high growth, our working capital needs may become greater as we remit payment for media purchased through our platform by our Platform Direct and Platform Services customers in advance of receiving payment from our customers. Our average DPO was 86 days and our average DSO was 103 days for 2015. We compute our DSO and DPO as of a given date based on our average trade receivables or trade payables, respectively, for the trailing twelve month period divided by, for DSO, daily Total Spend and for DPO, daily cost of revenue and operating expenses, excluding noncash and payroll related expenses, in each case, over such period. The average trade receivables or trade payables are the average of the trade receivables or trade payables balances at the beginning and end of the twelve month period. Daily Total Spend is the spend for the trailing twelve month period divided by 365 days. Daily cost of revenue and operating expenses are the cost of revenue and operating expenses, excluding noncash and payroll related expenses, for the trailing twelve month period divided by 365 days. While we typically experience slow payment by advertising agencies, as is common in our industry, we have historically experienced minimal accounts receivable write-offs.
Cash used in operating activities in the year ended December 31, 2015 was $20.5 million, due to a net loss of $13.7 million and the $26.2 million effect of changes in operating assets and liabilities, offset by non-cash expenses, primarily stock-based compensation, totaling $19.5 million. The net change in working capital was due to an increase in accounts receivable of $76.0 million related to the increase of $160.0 million in Total Spend, offset by an increase of $51.5 million in accounts payable and accrued liabilities related to an increase in purchases of media and other liabilities to support the increase in Total Spend.
Cash used in operating activities in the year ended December 31, 2014 was $13.9 million, due to a net loss of $4.4 million and the $17.0 million effect of changes in operating assets and liabilities, offset by non-cash expenses, primarily stock-based compensation, totaling $7.5 million. The net change in working capital was due to an increase in accounts receivable of $44.3 million related to the increase of $142.4 million in Total Spend, offset by an increase of $31.1 million in accounts payable and accrued liabilities related to an increase in purchases of media and other liabilities to support the increase in Total Spend.
Cash used in operating activities in the year ended December 31, 2013 was $8.2 million, due to a net loss of $7.4 million and the $2.8 million effect of changes in operating assets and liabilities, offset by non-cash expenses totaling $2.0 million. The net change in working capital was due to an increase in accounts receivable of $24.3 million related to the increase in Total Spend, offset by an increase of $23.4 million in accrued liabilities related to an increase in purchases of media and other liabilities to support the increase in Total Spend.
We expect cash used by operating activities to fluctuate significantly in future periods as a result of a number of factors, some of which are outside of our control, including the timing of our billings and collections, our operating results, and the timing and amount of our media purchases and other liability payments.
51
Investing Activities
Cash used by investing activities was $6.7 million, $3.7 million and $1.8 million in the year ended December 31, 2015, 2014 and 2013, respectively, primarily due to purchases of equipment.
Financing Activities
Cash provided by financing activities in the year ended December 31, 2015 was $64.1 million primarily due to net proceeds of $58.3 million from our follow-on stock offering in June 2015, $4.7 million provided by our credit facilities, and $2.4 million in proceeds from the issuance of common stock from options exercised and employee stock purchases, offset by outflows of $1.4 million for the repayment of notes payable.
Cash provided by financing activities in the year ended December 31, 2014 was $44.8 million primarily due to $46.8 million of net proceeds from our IPO, offset by cash outflows of $1.4 million for the repayment of notes payable and $1.0 million for repayment of convertible notes.
Cash provided by financing activities in the year ended December 31, 2013 was $9.8 million primarily due to proceeds of $10.9 million from the issuance of convertible preferred stock, offset by cash outflows of $1.4 million for the repayment of notes payable.
Indemnification Agreements
In the normal course of business, we provide customers with indemnification provisions of varying scope against claims of intellectual property infringement by third parties arising from the use of our products. Historically, costs related to these indemnification provisions have not been significant and we are unable to estimate the maximum potential impact of these indemnification provisions on our future results of operations. In addition, we have entered into indemnification agreements with directors and certain officers and employees that will require us, among other things, to indemnify them against certain liabilities that may arise by reason of their status or service as directors, officers or employees. No demands have been made upon us to provide indemnification under such agreements and there are no claims that we are aware of that could have a material effect on our consolidated balance sheet, consolidated statement of operations, consolidated statement of comprehensive loss or consolidated cash flows.
Contractual Obligations and Commitments
Our contractual obligations at December 31, 2015, and the effect those contractual obligations are expected to have on our liquidity and cash flow over the next five years are as follows:
|
|
|
Payments Due by Period |
|
|||||||||||||||||
|
|
|
Total |
|
|
Less than 1 Year |
|
|
1-3 Years |
|
|
3-5 Years |
|
|
More Than 5 Years |
|
|||||
|
|
|
(in thousands) |
|
|||||||||||||||||
|
Operating lease obligations |
|
$ |
24,927 |
|
|
$ |
4,342 |
|
|
$ |
11,553 |
|
|
$ |
6,059 |
|
|
$ |
2,973 |
|
|
Note payable |
|
|
2,635 |
|
|
|
848 |
|
|
|
1,787 |
|
|
|
— |
|
|
|
— |
|
|
Revolving line of credit |
|
|
2,050 |
|
|
|
2,050 |
|
|
|
— |
|
|
|
— |
|
|
|
— |
|
|
|
|
$ |
29,612 |
|
|
$ |
7,240 |
|
|
$ |
13,340 |
|
|
$ |
6,059 |
|
|
$ |
2,973 |
|
In December, the Company entered into a sublease agreement under which it will receive sublease income of approximately $0.6 million in each of the years ended December 31, 2016, 2017, 2018, and 2019. The sublease income is not included in the operating lease obligation amounts above.
In August 2015, the Company entered into a commitment to purchase media from a single supplier in the amount of $7.5 million to $15.0 million, depending on the type of media purchased. These purchases can be made at any time from February 15, 2015 through September 30, 2016. As of December 31, 2015, the Company had purchased $1.6 million of media under this arrangement. Future payments under this arrangement are not included in the above table.
Credit Facilities
Our Loan and Security Agreement with Silicon Valley Bank that, as amended, (“Loan Agreement”), provides for a $40.0 million revolving line of credit with a maturity date of April 1, 2017 and a $5.0 million capital equipment term loan. The Loan Agreement also includes a financial covenant that requires that we meet certain minimum revenue levels. As of December 31, 2015,
52
the total borrowings outstanding under the revolving line of credit were $2.1 million and the total borrowings outstanding under the capital equipment term loan were $2.6 million. Advances under the line of credit accrue interest at a floating per annum rate equal to the prime rate as published in the Western Edition Wall Street Journal. The capital equipment term loan bears interest at a floating annual rate of prime plus 0.5%, and when utilized, we are required to make equal monthly payments of principal plus accrued interest over a period of 36 months from the date of borrowing.
Recently Issued Accounting Pronouncements
See “Recent Accounting Pronouncements” in Note 1 to the Notes to the Consolidated Financial Statements under Item 8 “Financial Statements and Supplementary Data” in this Report.
Critical Accounting Policies, Judgments and Estimates
Our consolidated financial statements are prepared in accordance with GAAP. Note 1 to the Notes to Consolidated Financial Statements under Item 8 “Financial Statements and Supplementary Data” in this Report describes the significant accounting policies and methods used in the preparation of the consolidated financial statements. The preparation of these consolidated financial statements requires us to make estimates and assumptions that affect the reported amounts of assets, liabilities, revenue, expenses and related disclosures. We evaluate our estimates and assumptions on an ongoing basis. Our estimates are based on historical experience and various other assumptions that we believe to be reasonable under the circumstances. Our actual results could differ from these estimates. We believe that the accounting policies discussed below are critical to understanding our historical and future performance as these policies involve a greater degree of judgment and complexity. Our senior management has reviewed these critical accounting policies and related disclosures with the Audit Committee of our board of directors.
Revenue Recognition
We recognize revenue related to the utilization of our advertising platform. Revenue is recognized when persuasive evidence of an arrangement exists, service has been provided to the customer, collection of the fees is reasonably assured, and fees are fixed or determinable. Arrangements with customers do not provide the customer with the right to take possession of the software or platform at any time. We generate revenue from our platform through our Platform Direct and Platform Services offerings. Revenue for both Platform Direct and Platform Services is recognized when the advertisement is displayed. Our arrangements are cancellable by the customer as to any unfulfilled portion of a campaign without penalty. Media is purchased on our platform on a real-time basis and purchasing ceases upon cancellation. For our Platform Services arrangements, once the advertising is delivered in accordance with the terms of the IO, the related amounts earned for such advertising delivery are non-refundable.
Our Platform Direct arrangements are evidenced by signed contracts. The Platform Services arrangements are evidenced through direct IOs. Revenue is recognized during the period in which the advertising is delivered. We also maintain processes to determine the collectability of amounts due from customers. To the extent any of the revenue recognition criteria are not met, we defer revenue.
Amounts that have been invoiced for services are recorded in accounts receivable and in deferred revenue or revenue, depending on whether the revenue recognition criteria outlined above have been met. In instances where customers prepay, we defer recognition of revenue until the criteria outlined above are met and actual ads have been delivered during the period based on the terms specified in the agreement with the customer.
In accordance with ASC Topic 605, Revenue Recognition, paragraph 45-1, we recognize revenue on a gross or net basis for each model based on its determination as to whether we acting as the principal in the revenue generation process or as an agent.
Indicators that an entity is acting as a principal include: (a) the entity has the primary responsibility (primary obligor) for providing the goods or services to the customer or for fulfilling the order; (b) the entity has inventory risk before or after the customer order; (c) the entity has latitude in establishing prices, either directly or indirectly; and (d) the entity bears the customer’s credit risk for the amount receivable from the customer.
Indicators that an entity is acting as an agent exist when it does not have exposure to the significant risks and rewards associated with the sale of goods or the rendering of services. One key feature indicating that an entity is acting as an agent is that the amount the entity earns is predetermined, being either a fixed fee per transaction or a stated percentage of the amount billed to the customer.
Platform Direct — Platform Direct provides customers with self-serve capabilities for real-time media buying, serving, targeting, optimization and brand measurement. Our programmatic television, or PTV, provides customers with an automated solution
53
to plan, buy and measure TV ads. We enter into contracts with customers under which fees earned by us are based on a utilization fee that is a percentage of media spend through the platform as well as fees for additional features offered through our platform. These features are delivered concurrently with the related advertising. Because the features are delivered concurrently, we do not allocate revenue between the two elements.
We recognize revenue for Platform Direct on a net basis primarily based on our determination that we are not deemed to be the primary obligor, we do not have inventory risk as the customer chooses the inventory to purchase on a real-time basis, the actual cost of the campaign is determined by the customer through the real-time bidding process, through management of the campaign the customer can define supplier preferences or specific suppliers from a list we maintain, and the amount earned by us is fixed based on a percentage of the media spend of a customer’s campaign.
Platform Services — Platform Services provide customers the opportunity to utilize our platform on a managed service basis, whereby we deliver digital video advertisements based upon a pre-agreed set of fixed objectives with an advertiser or agency. We enter into customer agreements through discrete binding IOs with fixed price commitments which are determined prior to the launch of an advertising campaign.
For Platform Services, we recognize revenue on a gross basis primarily based on our determination that we are subject to the risk of fluctuating costs from our media vendors, have latitude in establishing prices with our customer, have discretion in selecting media vendors when fulfilling a customer’s campaign, and have credit risks.
Sales Reserves and Bad Debt Allowances
We recognize allowances for estimated bad debt and credit memo losses in the period in which the related sale is recorded or when the loss becomes probable. Allowances for bad debts are estimated based on our historical write-off experience and an assessment of customer-specific circumstances including, aged balances, payment history, changes in payment terms, and other customer- specific information which may provide an indication that account balances are not collectible. Allowances for bad debt are recognized as an operating expense in the consolidated statement of operations. Credit memo losses primarily relate to billing discrepancies and customer concessions and are estimated using a combination of specifically identified potential claims and estimated amounts which are derived from actual historical experience. Reserves for credit memo losses are recognized as a reduction of revenue or cost of revenue in the consolidated statement of operations.
Stock-Based Compensation
Our stock-based compensation expense is estimated at the grant date based on the fair value of the award and is recognized as expense ratably over the requisite service period of the award. Determining the appropriate fair value and calculating the fair value of stock-based awards requires judgment, including estimating share price volatility, forfeiture rates, expected dividends, and expected life. We calculate the fair value of each restricted stock unit award to employees on the date of grant and to non-employees on each measurement date based on the fair value of our common stock. We calculate the fair value of each option award on the date of grant under the Black-Scholes option pricing model using certain assumptions. For nonemployee consultants, we revalue the unvested options at each measurement period.
The Black-Scholes model requires the use of highly subjective and complex assumptions, which determine the fair value of stock-based awards, including the option’s expected term and the price volatility of the underlying stock. Our current estimate of volatility is based on the volatility of comparable public companies. To the extent volatility of our stock price increases in the future, our estimates of the fair value of options granted in the future could increase, thereby increasing stock-based compensation in future periods. The computation of expected lives was based on expectations of future employee behavior. The interest rate for periods within the contractual life of the award is based on the U.S. Treasury yield curve in effect at the time of grant. In addition, we apply an expected forfeiture rate when amortizing stock-based compensation. To the extent we revise this estimate in the future; our stock-based compensation could be materially impacted in the year of revision.
For market condition awards, we use the Monte Carlo simulation model to determine the fair value of each such award. The determination of the grant date fair value of the awards using a simulation model is affected by our stock price as well as assumptions regarding a number of complex and subjective variables. These variables include the expected stock price volatility over the expected life of the awards, risk-free interest rates, and expected dividends. These variables include our expected stock price volatility over the expected life of the awards, risk-free interest rates, and expected dividends. Our current estimate of volatility is based on the volatility of comparable public companies. The risk free interest rate is equal to the U.S. Treasury constant maturity rates for the period equal to the expected life. We do not currently pay cash dividends on common stock and we do not anticipate doing so in the foreseeable future. Accordingly, the expected dividend yield is zero.
54
Internal-Use Software Development Costs
We capitalize certain internal-use software development costs associated with creating and enhancing internally developed software related to our technology infrastructure. These costs include personnel and related employee benefits expenses for employees who are directly associated with and who devote time to software projects, and external direct costs of materials and services consumed in developing or obtaining the software. Software development costs that do not meet the qualification for capitalization, as further discussed below, are expensed as incurred and recorded in research and development expenses in the consolidated statement of operations. We do not transfer ownership of our software, or lease our software, to third parties.
Software development activities generally consist of three stages, (i) the planning stage, (ii) the application and infrastructure development stage, and (iii) the post implementation stage. Costs incurred in the planning and post implementation stages of software development, including costs associated with the post-configuration training and repairs and maintenance of the developed technologies, are expensed as incurred. We capitalize costs associated with software developed for internal use when the preliminary project stage is completed, management has authorized further funding for the completion of the project, and it is probable that the project will be completed and perform as intended. Costs incurred in the application and infrastructure development stages, including significant enhancements and upgrades, are capitalized. Capitalization ends once a project is substantially complete and the software and technologies are ready for their intended purpose. Internal use software development costs are amortized on a straight-line basis over an estimated useful life of three years, commencing when the software is ready for its intended use.
We exercise judgment in determining the point at which various projects may be capitalized, in assessing the ongoing value of the capitalized costs, and in determining the estimated useful lives over which the costs are amortized. To the extent that we change the manner in which we develop and test new features and functionalities related to our software, assess the ongoing value of capitalized assets, or determine the estimated useful lives over which the costs are amortized, the amount we capitalize and amortize could change in future periods.
Income Taxes
We are subject to income taxes in the United States and multiple foreign jurisdictions. We account for income taxes using the asset and liability method, under which deferred tax liabilities and assets are recognized for the expected future tax consequences of temporary differences between the financial reporting and tax basis of assets and liabilities, as well as for net operating loss (NOL) and tax credit carryforwards. Deferred tax assets and liabilities are measured using the tax rates that are expected to apply to taxable income for the years in which those tax assets and liabilities are expected to be realized or settled. We record a valuation allowance to reduce deferred tax assets to the net amount that is more likely than not to be realized.
We utilize a two-step approach to evaluate tax positions. Recognition, step one, requires evaluation of the tax position to determine if based solely on technical merits it is more likely than not (MLTN) to be sustained upon examination. The MLTN standard is met when the likelihood of occurrence is greater than 50%. Measurement, step two, is addressed only if step one is satisfied. In step two, the tax benefit is measured as the largest amount of benefit, determined on a cumulative probability basis, which is MLTN to be realized upon ultimate settlement with tax authorities. If a position does not meet the MLTN threshold for recognition in step one, no benefit is recorded until the first subsequent period in which the MLTN standard is met, the issue is resolved with the tax authority, or the statute of limitations expires. Positions previously recognized are derecognized when we subsequently determine that the position is no longer MLTN to be sustained.
We recognize interest and penalties related to income taxes in our provision for income tax.
Item 7A. Quantitative and Qualitative Disclosures About Market Risk
We have operations both within the U.S. and internationally, and we are exposed to market risks in the ordinary course of our business. These risks primarily include interest rate and foreign exchange risks.
Interest Rate Fluctuation Risk
Our cash and cash equivalents consist of cash and money market funds. Our borrowings under our revolving credit facility and term loans are generally at floating interest rates. The primary objective of our investment activities is to preserve principal while maximizing income without significantly increasing risk. Because our cash and cash equivalents have a relatively short maturity, our portfolio’s fair value is relatively insensitive to interest rate changes. We do not believe that an increase or decrease in interest rates of 100 basis points would have a material effect on our operating results or financial condition. In future periods, we will continue to evaluate our investment policy in order to ensure that we continue to meet our overall objectives.
55
Foreign Currency Exchange Risk
We have limited foreign currency risks related to our revenue and operating expenses denominated in currencies other than the U.S. dollar, principally the Australian dollar, the Canadian dollar, the British pound and the Euro. The volatility of exchange rates depends on many factors that we cannot forecast with reliable accuracy. Although we have experienced and will continue to experience fluctuations in our net loss as a result of transaction gains (losses) related to revaluing certain cash balances, trade accounts receivable balances and intercompany balances that are denominated in currencies other than the U.S. dollar, we believe such a change will not have a material impact on our results of operations. As our international operations expand, our operating results may be more exposed to fluctuations in the exchange rates of the currencies in which we do business. We use derivative financial instruments to reduce foreign currency exchange risks. We use foreign currency forward contracts to partially mitigate the impact of fluctuations in cash and accounts receivable balances denominated in foreign currency. We do not use these contracts for speculative or trading purposes, nor are they designated as hedges. These contracts typically have a maturity of one month, and we record gains and losses from these instruments in other income (expense), net.
As of December 31, 2015, we had forward foreign exchange contracts to buy $21.5 million against various foreign currencies.
56
Item 8. Financial Statements and Supplementary Data
INDEX TO CONSOLIDATED FINANCIAL STATEMENTS
57
Report of Independent Registered Public Accounting Firm
The Board of Directors and Stockholders
TubeMogul, Inc.:
We have audited the accompanying consolidated balance sheets of TubeMogul, Inc. and subsidiaries (the Company) as of December 31, 2015 and 2014, and the related consolidated statements of operations, comprehensive loss, stockholders’ equity, and cash flows for each of the years in the three-year period ended December 31, 2015. These consolidated financial statements are the responsibility of the Company’s management. Our responsibility is to express an opinion on these consolidated financial statements based on our audits.
We conducted our audits in accordance with the standards of the Public Company Accounting Oversight Board (United States). Those standards require that we plan and perform the audit to obtain reasonable assurance about whether the financial statements are free of material misstatement. An audit includes examining, on a test basis, evidence supporting the amounts and disclosures in the financial statements. An audit also includes assessing the accounting principles used and significant estimates made by management, as well as evaluating the overall financial statement presentation. We believe that our audits provide a reasonable basis for our opinion.
In our opinion, the consolidated financial statements referred to above present fairly, in all material respects, the financial position of TubeMogul, Inc. and subsidiaries as of December 31, 2015 and 2014, and the results of their operations and their cash flows for each of the years in the three-year period ended December 31, 2015, in conformity with U.S. generally accepted accounting principles.
/s/ KPMG LLP
San Francisco, California
March 10, 2016
58
TUBEMOGUL, INC.
(In thousands, except per share data)
|
|
|
December 31, |
|
|
December 31, |
|
||
|
|
|
2015 |
|
|
2014 |
|
||
|
Assets |
|
|
|
|
|
|
|
|
|
Current assets: |
|
|
|
|
|
|
|
|
|
Cash and cash equivalents |
|
$ |
83,439 |
|
|
$ |
46,592 |
|
|
Accounts receivable, net |
|
|
159,899 |
|
|
|
88,457 |
|
|
Prepaid expenses and other current assets |
|
|
3,752 |
|
|
|
2,322 |
|
|
Total current assets |
|
|
247,090 |
|
|
|
137,371 |
|
|
Property, equipment and software, net |
|
|
8,585 |
|
|
|
3,902 |
|
|
Restricted cash |
|
|
1,563 |
|
|
|
742 |
|
|
Other assets |
|
|
1,495 |
|
|
|
692 |
|
|
Total assets |
|
$ |
258,733 |
|
|
$ |
142,707 |
|
|
Liabilities and Stockholders’ Equity |
|
|
|
|
|
|
|
|
|
Current liabilities: |
|
|
|
|
|
|
|
|
|
Accounts payable |
|
$ |
47,346 |
|
|
$ |
19,087 |
|
|
Accrued liabilities |
|
|
74,927 |
|
|
|
50,714 |
|
|
Revolving line of credit |
|
|
2,050 |
|
|
— |
|
|
|
Other current liabilities |
|
|
1,701 |
|
|
|
1,664 |
|
|
Total current liabilities |
|
|
126,024 |
|
|
|
71,465 |
|
|
Deferred rent |
|
|
746 |
|
|
|
601 |
|
|
Note payable, net of current portion |
|
|
1,787 |
|
|
— |
|
|
|
Total liabilities |
|
|
128,557 |
|
|
|
72,066 |
|
|
Commitments and contingencies (Note 6) |
|
|
|
|
|
|
|
|
|
Stockholders’ equity: |
|
|
|
|
|
|
|
|
|
Preferred stock; $0.001 par value; 10,000 shares authorized and 0 outstanding as of December 31, 2015 and 2014, respectively |
|
— |
|
|
— |
|
||
|
Common stock; $0.001 par value; 200,000 shares authorized and 35,344 and 29,838 shares issued and outstanding as of December 31, 2015 and 2014, respectively |
|
|
35 |
|
|
|
30 |
|
|
Additional paid-in capital |
|
|
167,316 |
|
|
|
94,013 |
|
|
Accumulated deficit |
|
|
(37,016 |
) |
|
|
(23,285 |
) |
|
Accumulated other comprehensive loss |
|
|
(159 |
) |
|
|
(117 |
) |
|
Total stockholders’ equity |
|
|
130,176 |
|
|
|
70,641 |
|
|
Total liabilities and stockholders’ equity |
|
$ |
258,733 |
|
|
$ |
142,707 |
|
See accompanying notes to these consolidated financial statements.
59
TUBEMOGUL, INC.
Consolidated Statements of Operations
(In thousands, except per share data)
|
|
|
Years Ended |
|
|||||||||
|
|
|
December 31, |
|
|||||||||
|
|
|
2015 |
|
|
2014 |
|
|
2013 |
|
|||
|
Revenue: |
|
|
|
|
|
|
|
|
|
|
|
|
|
Platform Direct |
|
$ |
72,212 |
|
|
$ |
49,231 |
|
|
$ |
19,331 |
|
|
Platform Services |
|
|
108,484 |
|
|
|
65,012 |
|
|
|
37,883 |
|
|
Total revenue |
|
|
180,696 |
|
|
|
114,243 |
|
|
|
57,214 |
|
|
Cost of revenue |
|
|
58,193 |
|
|
|
33,941 |
|
|
|
19,698 |
|
|
Gross profit |
|
|
122,503 |
|
|
|
80,302 |
|
|
|
37,516 |
|
|
Operating expenses: |
|
|
|
|
|
|
|
|
|
|
|
|
|
Research and development |
|
|
41,007 |
|
|
|
22,142 |
|
|
|
11,837 |
|
|
Sales and marketing |
|
|
55,331 |
|
|
|
38,133 |
|
|
|
21,378 |
|
|
General and administrative |
|
|
37,000 |
|
|
|
21,615 |
|
|
|
10,477 |
|
|
Total operating expenses |
|
|
133,338 |
|
|
|
81,890 |
|
|
|
43,692 |
|
|
Loss from operations |
|
|
(10,835 |
) |
|
|
(1,588 |
) |
|
|
(6,176 |
) |
|
Other expense, net: |
|
|
|
|
|
|
|
|
|
|
|
|
|
Interest expense, net |
|
|
(37 |
) |
|
|
(216 |
) |
|
|
(169 |
) |
|
Other, net |
|
|
— |
|
|
|
(370 |
) |
|
|
(388 |
) |
|
Foreign exchange loss, net |
|
|
(2,196 |
) |
|
|
(1,987 |
) |
|
|
(618 |
) |
|
Other expense, net |
|
|
(2,233 |
) |
|
|
(2,573 |
) |
|
|
(1,175 |
) |
|
Net loss before income taxes |
|
|
(13,068 |
) |
|
|
(4,161 |
) |
|
|
(7,351 |
) |
|
Provision for income taxes |
|
|
(663 |
) |
|
|
(283 |
) |
|
|
(60 |
) |
|
Net loss |
|
$ |
(13,731 |
) |
|
$ |
(4,444 |
) |
|
$ |
(7,411 |
) |
|
Basic and diluted net loss per share attributable to common stockholders |
|
$ |
(0.42 |
) |
|
$ |
(0.22 |
) |
|
$ |
(1.12 |
) |
|
Basic and diluted weighted-average shares used to compute net loss per share attributable to common stockholders |
|
|
32,736 |
|
|
|
19,928 |
|
|
|
6,613 |
|
See accompanying notes to these consolidated financial statements.
60
TUBEMOGUL, INC.
Consolidated Statements of Comprehensive Loss
(In thousands)
|
|
|
Years Ended |
|
|||||||||
|
|
|
December 31, |
|
|||||||||
|
|
|
2015 |
|
|
2014 |
|
|
2013 |
|
|||
|
Net loss |
|
$ |
(13,731 |
) |
|
$ |
(4,444 |
) |
|
$ |
(7,411 |
) |
|
Other comprehensive loss: |
|
|
|
|
|
|
|
|
|
|
|
|
|
Foreign currency translation adjustments |
|
|
(42 |
) |
|
|
(74 |
) |
|
|
(42 |
) |
|
Comprehensive loss |
|
$ |
(13,773 |
) |
|
$ |
(4,518 |
) |
|
$ |
(7,453 |
) |
See accompanying notes to these consolidated financial statements.
61
TUBEMOGUL, INC.
Consolidated Statements of Changes in Stockholders’ Equity
(In thousands, except share data)
|
|
|
|
Preferred Stock |
|
|
Common stock |
|
|
Additional |
|
|
|
|
|
|
Accumulated other |
|
|
Total |
|
|||||||||||||
|
|
|
|
Shares |
|
|
Amount |
|
|
Shares |
|
|
Amount |
|
|
paid-in capital |
|
|
Accumulated deficit |
|
|
comprehensive loss |
|
|
stockholders’ equity |
|
||||||||
|
Balances, January 1, 2013 |
|
|
|
13,824,958 |
|
|
$ |
14 |
|
|
|
6,576,978 |
|
|
$ |
7 |
|
|
$ |
34,419 |
|
|
$ |
(11,430 |
) |
|
$ |
(1 |
) |
|
$ |
23,009 |
|
|
Issuance of preferred stock net of issuance costs of $0 |
|
|
|
1,685,372 |
|
|
2 |
|
|
— |
|
|
— |
|
|
|
10,911 |
|
|
— |
|
|
— |
|
|
|
10,913 |
|
|||||
|
Issuance of common stock upon exercise of options |
|
|
— |
|
|
— |
|
|
|
97,779 |
|
|
— |
|
|
|
25 |
|
|
— |
|
|
— |
|
|
|
25 |
|
|||||
|
Stock-based compensation expense |
|
|
— |
|
|
— |
|
|
— |
|
|
— |
|
|
|
761 |
|
|
— |
|
|
— |
|
|
|
761 |
|
||||||
|
Foreign currency translation loss |
|
|
— |
|
|
— |
|
|
— |
|
|
— |
|
|
— |
|
|
— |
|
|
|
(42 |
) |
|
|
(42 |
) |
||||||
|
Net loss |
|
|
— |
|
|
— |
|
|
— |
|
|
— |
|
|
— |
|
|
|
(7,411 |
) |
|
— |
|
|
|
(7,411 |
) |
||||||
|
Balances, December 31, 2013 |
|
|
|
15,510,330 |
|
|
$ |
16 |
|
|
|
6,674,757 |
|
|
$ |
7 |
|
|
$ |
46,116 |
|
|
$ |
(18,841 |
) |
|
$ |
(43 |
) |
|
$ |
27,255 |
|
|
Issuance of common stock upon exercise of options |
|
|
— |
|
|
— |
|
|
|
372,025 |
|
|
— |
|
|
|
403 |
|
|
— |
|
|
— |
|
|
|
403 |
|
|||||
|
Conversion of convertible preferred stock to common stock |
|
|
|
(15,510,330 |
) |
|
|
(16 |
) |
|
|
15,510,330 |
|
|
|
16 |
|
|
— |
|
|
— |
|
|
— |
|
|
— |
|
||||
|
Cashless exercise of stock warrants to common stock |
|
|
— |
|
|
— |
|
|
|
93,280 |
|
|
— |
|
|
|
516 |
|
|
— |
|
|
— |
|
|
|
516 |
|
|||||
|
Issuance of common stock from initial public offering, net of issuance costs of $3,349 |
|
|
— |
|
|
— |
|
|
|
7,187,500 |
|
|
|
7 |
|
|
|
43,435 |
|
|
— |
|
|
— |
|
|
|
43,442 |
|
||||
|
Stock-based compensation expense |
|
|
— |
|
|
— |
|
|
— |
|
|
— |
|
|
|
3,543 |
|
|
— |
|
|
— |
|
|
|
3,543 |
|
||||||
|
Foreign currency translation loss |
|
|
— |
|
|
— |
|
|
— |
|
|
— |
|
|
— |
|
|
— |
|
|
|
(74 |
) |
|
|
(74 |
) |
||||||
|
Net loss |
|
|
— |
|
|
— |
|
|
— |
|
|
— |
|
|
— |
|
|
|
(4,444 |
) |
|
— |
|
|
|
(4,444 |
) |
||||||
|
Balances, December 31, 2014 |
|
|
— |
|
|
— |
|
|
|
29,837,892 |
|
|
$ |
30 |
|
|
$ |
94,013 |
|
|
$ |
(23,285 |
) |
|
$ |
(117 |
) |
|
$ |
70,641 |
|
||
|
Issuance of common stock upon public offering and follow-on public offering, net of issuance costs of $875 |
|
|
— |
|
|
— |
|
|
|
3,969,486 |
|
|
|
4 |
|
|
|
58,329 |
|
|
|
— |
|
|
|
— |
|
|
|
58,333 |
|
||
|
Issuance of common stock upon exercise of options and vesting of RSUs |
|
|
— |
|
|
— |
|
|
|
1,326,472 |
|
|
|
1 |
|
|
|
841 |
|
|
|
— |
|
|
|
— |
|
|
|
842 |
|
||
|
Issuance of common stock under ESPP |
|
|
— |
|
|
— |
|
|
|
209,793 |
|
|
|
— |
|
|
|
1,570 |
|
|
|
— |
|
|
|
— |
|
|
|
1,570 |
|
||
|
Stock-based compensation expense |
|
|
— |
|
|
— |
|
|
|
— |
|
|
|
— |
|
|
|
12,563 |
|
|
|
— |
|
|
|
— |
|
|
|
12,563 |
|
||
|
Foreign currency translation loss |
|
|
— |
|
|
— |
|
|
|
— |
|
|
|
— |
|
|
|
— |
|
|
|
— |
|
|
|
(42 |
) |
|
|
(42 |
) |
||
|
Net loss |
|
|
— |
|
|
— |
|
|
|
— |
|
|
|
— |
|
|
|
— |
|
|
|
(13,731 |
) |
|
|
— |
|
|
|
(13,731 |
) |
||
|
Balances, December 31, 2015 |
|
|
— |
|
|
— |
|
|
|
35,343,643 |
|
|
$ |
35 |
|
|
$ |
167,316 |
|
|
$ |
(37,016 |
) |
|
$ |
(159 |
) |
|
$ |
130,176 |
|
||
See accompanying notes to these consolidated financial statements.
62
TUBEMOGUL, INC.
Consolidated Statements of Cash Flows
(In thousands)
|
|
|
Years Ended |
|
|||||||||
|
|
|
December 31, |
|
|||||||||
|
|
|
2015 |
|
|
2014 |
|
|
2013 |
|
|||
|
Cash flows from operating activities: |
|
|
|
|
|
|
|
|
|
|
|
|
|
Net loss |
|
$ |
(13,731 |
) |
|
$ |
(4,444 |
) |
|
$ |
(7,411 |
) |
|
Adjustments to reconcile net loss to net cash used in operating activities: |
|
|
|
|
|
|
|
|
|
|
|
|
|
Depreciation and amortization |
|
|
2,408 |
|
|
|
864 |
|
|
|
322 |
|
|
Provision for doubtful accounts |
|
|
1,287 |
|
|
|
903 |
|
|
|
539 |
|
|
Provision for credit memos |
|
|
3,244 |
|
|
|
1,875 |
|
|
|
— |
|
|
Stock-based compensation expense |
|
|
12,563 |
|
|
|
3,543 |
|
|
|
761 |
|
|
Other gains, net |
|
|
— |
|
|
|
359 |
|
|
|
394 |
|
|
Changes in operating assets and liabilities: |
|
|
|
|
|
|
|
|
|
|
|
|
|
Accounts receivable |
|
|
(75,973 |
) |
|
|
(44,315 |
) |
|
|
(24,341 |
) |
|
Prepaid expenses and other current assets |
|
|
(1,430 |
) |
|
|
(902 |
) |
|
|
(1,100 |
) |
|
Payments of costs related to initial public offering |
|
|
— |
|
|
|
(3,349 |
) |
|
|
(129 |
) |
|
Other assets |
|
|
(1,079 |
) |
|
|
126 |
|
|
|
(192 |
) |
|
Accounts payable |
|
|
27,044 |
|
|
|
15,055 |
|
|
|
(637 |
) |
|
Accrued liabilities |
|
|
24,500 |
|
|
|
16,024 |
|
|
|
23,423 |
|
|
Other current and noncurrent liabilities |
|
|
696 |
|
|
|
339 |
|
|
|
217 |
|
|
Net cash used in operating activities |
|
|
(20,471 |
) |
|
|
(13,922 |
) |
|
|
(8,154 |
) |
|
Cash flows from investing activities: |
|
|
|
|
|
|
|
|
|
|
|
|
|
Increase in restricted cash |
|
|
(821 |
) |
|
|
(408 |
) |
|
|
(334 |
) |
|
Purchases of property, equipment and software |
|
|
(5,876 |
) |
|
|
(3,299 |
) |
|
|
(1,439 |
) |
|
Net cash used in investing activities |
|
|
(6,697 |
) |
|
|
(3,707 |
) |
|
|
(1,773 |
) |
|
Cash flows from financing activities: |
|
|
|
|
|
|
|
|
|
|
|
|
|
Proceeds from public offering of common stock, net of underwriting discounts, commission and offering costs |
|
|
58,333 |
|
|
|
46,791 |
|
|
|
— |
|
|
Proceeds from issuance of preferred stock, net of issuance cost |
|
|
— |
|
|
|
— |
|
|
|
10,913 |
|
|
Proceeds from note payable |
|
|
2,635 |
|
|
|
— |
|
|
|
— |
|
|
Repayment of note payable and convertible note |
|
|
(1,373 |
) |
|
|
(2,374 |
) |
|
|
(1,351 |
) |
|
Proceeds from line of credit |
|
|
2,050 |
|
|
|
11,800 |
|
|
|
100 |
|
|
Repayment of line of credit |
|
|
— |
|
|
|
(11,800 |
) |
|
|
(100 |
) |
|
Proceeds from issuances of common stock from options exercised, convertible note exercised and under ESPP |
|
|
2,412 |
|
|
|
403 |
|
|
|
212 |
|
|
Net cash provided by financing activities |
|
|
64,057 |
|
|
|
44,820 |
|
|
|
9,774 |
|
|
Effect of exchange rate changes on cash and cash equivalents |
|
|
(42 |
) |
|
|
(74 |
) |
|
|
(42 |
) |
|
Net increase in cash and cash equivalents |
|
|
36,847 |
|
|
|
27,117 |
|
|
|
(195 |
) |
|
Cash and cash equivalents, beginning of year |
|
|
46,592 |
|
|
|
19,475 |
|
|
|
19,670 |
|
|
Cash and cash equivalents, end of year |
|
$ |
83,439 |
|
|
$ |
46,592 |
|
|
$ |
19,475 |
|
|
Supplemental disclosures: |
|
|
|
|
|
|
|
|
|
|
|
|
|
Cash paid for income taxes |
|
$ |
348 |
|
|
$ |
97 |
|
|
$ |
1 |
|
|
Cash paid for interest |
|
|
108 |
|
|
|
226 |
|
|
|
170 |
|
|
Equipment purchased and unpaid at year end |
|
|
1,215 |
|
|
|
— |
|
|
|
— |
|
|
Conversion of preferred stock warrants to common stock warrants |
|
|
— |
|
|
|
516 |
|
|
|
— |
|
|
Cashless exercise of stock warrants to common stock |
|
|
— |
|
|
|
82 |
|
|
|
— |
|
|
Deferred offering costs recorded in accounts payable and accrued liabilities |
|
|
— |
|
|
|
— |
|
|
|
126 |
|
See accompanying notes to these consolidated financial statements.
63
TUBEMOGUL, INC.
Notes to Consolidated Financial Statements
(In thousands, except share and per share data and where otherwise noted)
1. The Company and its Significant Accounting Policies
The Company
TubeMogul, Inc., a Delaware corporation (the Company), is a leader in software for brand advertising. The Company’s customers include many of the world’s largest brands and their media agencies.
The Company is headquartered in Emeryville, California and has offices in several other locations in the U.S. and internationally including in Kyiv, London, Paris, Sao Paulo, Shanghai, Singapore, Sydney, Tokyo and Toronto.
The Company consummated its initial public offering (IPO) of 7,187,500 shares of common stock at an offering price of $7 per share in July 2014. The shares sold in the offering included 937,500 shares sold by the Company pursuant to the underwriters’ full exercise of their over-allotment option. The net proceeds to the Company from the offering were $46.8 million after deducting underwriting discounts and commissions, and before deducting total expenses in connection with the offering of $3.3 million.
The Company completed a follow-on public offering of common stock in June 2015. The Company sold 3,500,000 shares of its common stock and certain stockholders sold 1,763,246 shares. The shares were sold at a public offering price of $15.75 per share for net proceeds of $52.2 million to the Company, after deducting underwriting discounts and commissions of $2.9 million and before deducting total expenses in connection with this offering of approximately $875. On July 10, 2015, in connection with the Company’s public follow-on offering of common stock on June 10, 2015, the underwriters partially exercised their over-allotment option and purchased 469,486 shares of common stock for net proceeds of $7.0 million.
Use of Estimates
The preparation of the financial statements in accordance with U.S. GAAP requires management to make estimates and assumptions that affect reported amounts of assets and liabilities and disclosure of contingent assets and liabilities at the date of the financial statements and the reported amounts of revenues and expenses during the reporting period. Significant estimates in these consolidated financial statements include allowances for doubtful accounts and credit memos, useful lives for depreciation and amortization, loss contingencies, valuation of deferred tax assets, capitalization of software costs, delivery of impressions for campaigns using the Company’s programmatic TV (PTV) solution and assumptions used for valuation of stock-based compensation. Actual results could differ from those and other estimates.
Principles of Consolidation and Basis of Presentation
These consolidated financial statements include the accounts of the Company’s wholly owned subsidiaries. All intercompany transactions and balances have been eliminated in consolidation.
Certain reclassifications have been made in the prior years’ financial statements to conform to the 2015 presentation. Such reclassifications had no impact on previously reported net income or stockholders’ equity and are not considered material in any of the periods presented.
Cash and Cash Equivalents
The Company considers all highly liquid investments having original maturities of three months or less at the date of purchase to be cash equivalents. The Company’s cash equivalents consist of short-term money market instruments held at reputable financial institutions. Amounts held on deposit at financial institutions may exceed Federal Deposit Insurance Corporation (FDIC) insured limits. To date, the Company has not experienced any losses on such deposits.
Restricted Cash
Restricted cash represents cash restricted for the Company’s irrevocable standby letters of credit for the benefit of certain of the Company’s real property lessors.
64
Accounts Receivable
Accounts receivable are stated at net realizable value. The Company recognizes allowances for estimated bad debt and credit memo losses in the period in which the related sale is recorded. Allowances for bad debts are estimated based on the Company’s historical write-off experience and an assessment of customer-specific circumstances including, aged balances, payment history, changes in payment terms, and other customer- specific information which may provide an indication that account balances are not collectible.
Many of the Company’s contracts with advertising agencies provide that if the brand (i.e., the agency’s customer) does not pay the agency, the agency is not liable to the Company and the Company must seek payment from the brand. Accordingly, the Company considers the creditworthiness of the brand in establishing its allowance for doubtful accounts. However, since inception, the Company has not had to initiate collection efforts directly with any brands where the contract was with an advertising agency.
The following table presents the changes in the allowance for doubtful accounts:
|
|
|
Years Ended |
|
|||||||||
|
|
|
December 31, |
|
|||||||||
|
|
|
2015 |
|
|
2014 |
|
|
2013 |
|
|||
|
Balance, beginning of year |
|
$ |
(1,369 |
) |
|
$ |
(714 |
) |
|
$ |
(350 |
) |
|
Additions to allowance |
|
|
(1,287 |
) |
|
|
(903 |
) |
|
|
(539 |
) |
|
Write offs, net of recoveries |
|
|
546 |
|
|
|
248 |
|
|
|
175 |
|
|
Balance, end of year |
|
$ |
(2,110 |
) |
|
$ |
(1,369 |
) |
|
$ |
(714 |
) |
The Company established a reserve for sales adjustments and credit memos during the year ended December 31, 2014. Credit memo losses primarily relate to billing discrepancies and customer concessions and are estimated using a combination of specifically identified potential claims and estimated amounts which are derived from actual historical experience. Credit memo losses are recorded as a reduction to accounts receivable on the consolidated balance sheets.
The following table presents the changes in the allowance for credit memos losses:
|
|
|
Years Ended |
|
|||||
|
|
|
December 31, |
|
|||||
|
|
|
2015 |
|
|
2014 |
|
||
|
Balance, beginning of year |
|
$ |
(460 |
) |
|
$ |
— |
|
|
Additions to allowance |
|
|
(3,244 |
) |
|
|
(1,875 |
) |
|
Issued credit memos |
|
|
2,829 |
|
|
|
1,415 |
|
|
Balance, end of year |
|
$ |
(875 |
) |
|
$ |
(460 |
) |
Property, Equipment and Software, net
Property, equipment and software, net are carried at cost and are depreciated on the straight-line basis over their estimated useful lives ranging from three to seven years. Repairs and maintenance are charged to expense as incurred. When the assets are sold or retired or otherwise disposed of, their cost and related accumulated depreciation and amortization are written off with the resulting gain or loss reflected as an operating item in the accompanying consolidated statements of operations.
Leasehold improvements are amortized on a straight-line basis over the shorter of the remaining term of the lease or the useful life of the assets.
Construction in process mainly consists of leasehold improvements and furniture at the Company’s offices under construction, as well as server equipment that has not been placed in service as of the reporting date. Upon completion of construction, the assets will be depreciated over the shorter of their useful lives or the remaining lease term. Upon commencement of the use of the server, it will be depreciated over the useful life of the server, which will be determined upon commencement of the use.
Capitalized Internal-Use Software Development Costs
For web site development costs and development costs related to the Company’s platform, the Company capitalizes qualifying computer software costs which are incurred during the application development stage. Costs related to preliminary project activities and post implementation activities are expensed as incurred to research and development. The Company capitalizes costs when
65
preliminary efforts are successfully completed, management has authorized and committed project funding, and it is probable that the project will be completed and used as intended. Costs incurred for enhancements that are expected to result in additional material functionality are capitalized. The Company capitalized $2,421 and $523 in internal-use software development costs related to platform enhancement and website development during the years ended December 31, 2015 and 2014, respectively. These costs are included in property, equipment and software, net in the consolidated balance sheets. Amortization commences when the website or software for internal use is ready for its intended use and the amortization period is the estimated useful life of the related asset, which is generally three years. Amortization expense is recognized in cost of revenue in the Consolidated Statement of Operations. Costs for research and development efforts have been expensed as incurred and relate primarily to payroll costs incurred in the development of the platform.
Accounting for Impairment of Long-Lived Assets
The Company evaluates the recoverability of property, equipment and software and other assets, including identifiable intangible assets with definite lives, whenever events or changes in circumstances indicate that the carrying amount of an asset may not be recoverable. Recoverability of assets held and used is measured by comparison of the carrying amount of an asset or an asset group to estimated undiscounted future net cash flows expected to be generated by the asset or asset group. If the carrying amount of an asset exceeds these estimated future cash flows, an impairment charge is recognized by the amount by which the carrying amount of the assets exceeds the fair value of the asset or asset group, based on discounted cash flows. Assets to be disposed of are reported at the lower of their carrying amount or fair value less cost to sell. There were no material impairment charges recorded in any of the periods presented.
Fair Value Measurement and Financial Instruments
The Company measures the fair value of its financial instruments in accordance with Financial Accounting Standards Board (FASB) Accounting Standards Codification (ASC) Fair Value Measurements. Under this standard, fair value is defined as the price that would be received to sell an asset or paid to transfer a liability (i.e., the exit price) in an orderly transaction between market participants at the measurement date. In determining fair values of all reported assets and liabilities that represent financial instruments, the Company uses the carrying market values of such amounts. The provision establishes a hierarchy for inputs used in measuring fair value that maximizes the use of observable inputs and minimizes the use of unobservable inputs by requiring that the most observable inputs be used when available. Observable inputs are inputs that market participants would use in pricing the asset or liability developed based on market data obtained from sources independent of the Company.
Unobservable inputs are inputs that reflect the Company’s assumptions as to what market participants would use in pricing the asset or liability developed based on the best information available under the circumstances. The hierarchy is broken down into three levels based on the observability of inputs as follows:
Level 1 — Unadjusted quoted prices in active markets for identical assets or liabilities accessible to the reporting entity at the measurement date.
Level 2 — Other than quoted prices included in Level 1 inputs that are observable for the asset or liability, either directly or indirectly, for substantially the full term of the asset or liability.
Level 3 — Unobservable inputs for the asset or liability used to measure fair value to the extent that observable inputs are not available, thereby allowing for situations in which there is little, if any, market activity for the asset or liability at measurement date.
The Company had $72,416 and $45,166 of cash equivalents as of December 31, 2015 and 2014, respectively, which are measured at fair value on a recurring basis. Inputs used in measuring fair value of cash equivalents are categorized as Level 1.
From time to time the Company enters into foreign currency forward contracts to mitigate its exposure to foreign exchange risk. The foreign currency forward contracts are valued using observable inputs, such as quotations on forward foreign exchange points and foreign interest rates and are categorized as Level 2. Realized gains from these contracts were $562 for the year ended December 31, 2015. The Company did not enter into such contracts during the year ended December 31, 2014. The Company uses foreign currency forward contracts to mitigate the impact of foreign currency fluctuations of certain non-U.S. dollar denominated asset positions, primarily cash and accounts receivable. Gains and losses resulting from currency exchange rate movements on these forward contracts are recognized in other income (expense) in the accompanying condensed consolidated statements of operations in the period in which the exchange rates change and offset the foreign currency gains and losses on the underlying exposure being hedged. The Company does not enter into derivative financial instruments for trading or speculative purposes. As of December 31, 2015, the Company had forward foreign exchange contracts to buy a total notional value of $21.5 million against various foreign
66
currencies. Notional amounts represent amounts to be delivered and are not equivalent to gains or losses realized from settlement of these contracts. The Company does not apply hedge accounting to its derivative transactions. The Company is exposed to credit loss in the event of nonperformance by the counterparty to the foreign currency foreign exchange contracts. The Company continually monitors its positions and the credit ratings of the counterparties involved to mitigate the amount of credit exposure.
In fiscal year 2010, the Company issued a Series A-1 preferred stock warrant (as described in Note 4) that contained a price protection clause that provided that the exercise price of the warrants was to be adjusted downwards upon the Company issuing Additional Stock (as defined in the warrant agreement) at more favorable pricing. As a result of this price protection clause, the Company determined that the warrant was not considered indexed to the Company’s own stock and as a result recorded the warrant as a liability measured at fair value at the time of issuance. Prior to the conversion of all Company preferred stock as a result of the closing of the IPO on July 23, 2014, the Company recorded fair value adjustments each reporting period under other income expense, net. As the warrant’s fair value is based on significant inputs that were not observable in the market, they were categorized as Level 3. Changes in warrant liability consisted of the following during:
|
|
|
Year Ended |
|
|
|
|
|
December 31, |
|
|
|
|
|
2014 |
|
|
|
Balance, beginning of year |
|
$ |
684 |
|
|
Change in fair value of convertible preferred stock warrant liability |
|
|
(168 |
) |
|
Conversion of preferred stock warrants to common stock warrants |
|
|
(516 |
) |
|
Balance, end of year |
|
$ |
— |
|
Since all carrying amounts approximate fair value, no other comprehensive income or loss has been recognized. There were no sales, purchases, settlements, or other transfers in or out of Level 3 liabilities.
Other financial instruments not measured at fair value on the accompanying consolidated balance sheets at December 31, 2015 and December 31, 2014, but which require disclosure of their fair values, include accounts receivable, accounts payable, accrued liabilities and debt. The estimated fair values of such instruments at December 31, 2015 and December 31, 2014 approximated their carrying values due to being short term in nature. The fair values of all of these instruments are categorized as Level 2 in the fair value hierarchy.
Revenue Recognition and Deferred Revenue
The Company recognizes revenue related to the utilization of its advertising platform. Revenue is recognized when persuasive evidence of an arrangement exists, service has been provided to the customer, collection of the fees is reasonably assured, and fees are fixed or determinable. Arrangements with customers do not provide the customer with the right to take possession of the software or platform at any time. The Company generates revenue from its platform through its Platform Direct and Platform Services offerings. Revenue for both Platform Direct and Platform Services is recognized when the advertisement is displayed. The Company’s arrangements are cancellable by the customer as to any unfulfilled portion of a campaign without penalty. Media is purchased on the Company’s platform on a real-time basis and purchasing ceases upon cancellation. For the Company’s Platform Services arrangements, once the advertising is delivered in accordance with the terms of the insertion order (IO), the related amounts earned for such advertising delivery are non-refundable.
The Company’s Platform Direct arrangements are evidenced by signed contracts. The Platform Services arrangements are evidenced through direct IOs. Revenue is recognized during the period in which the advertising is delivered. To the extent any of the revenue recognition criteria are not met, the Company defers revenue.
Amounts that have been invoiced for services are recorded in accounts receivable and in deferred revenue or revenue, depending on whether the revenue recognition criteria outlined above have been met. In instances where customers prepay, the Company will defer recognition of revenue until the criteria outlined above are met and actual ads have been delivered during the period based on the terms specified in the agreement with the customer.
In accordance with ASC Topic 605, Revenue Recognition, paragraph 45-1, the Company recognizes revenue on a gross or net basis based on its determination as to whether the Company is acting as the principal in the revenue generation arrangement or as an agent.
67
Indicators that an entity is acting as a principal include: (a) the entity has the primary responsibility (primary obligor) for providing the goods or services to the customer or for fulfilling the order; (b) the entity has inventory risk before or after the customer order; (c) the entity has latitude in establishing prices, either directly or indirectly; and (d) the entity bears the customer’s credit risk for the amount receivable from the customer.
Indicators that an entity is acting as an agent exist when it does not have exposure to the significant risks and rewards associated with the sale of goods or the rendering of services. One key feature indicating that an entity is acting as an agent is that the amount the entity earns is predetermined, being either a fixed fee per transaction or a stated percentage of the amount billed to the customer.
Platform Direct — Platform Direct provides customers with self-serve capabilities for real-time media buying, serving, targeting, optimization and brand measurement. The Company’s programmatic television, or PTV, provides customers with an automated solution to plan, buy and measure TV ads. The Company enters into contracts with customers under which fees earned by the Company are based on a utilization fee that is a percentage of media spend through the platform as well as fees for additional features offered through the Company’s platform. These features are delivered concurrently with the related advertising. Due to the fact that the features are delivered concurrently, the Company does not allocate revenue between the two elements.
The Company recognizes revenue for Platform Direct on a net basis primarily based on the Company’s determination that it is not deemed to be the primary obligor, does not have inventory risk as the customer chooses the inventory to purchase on a real-time basis, the actual cost of the campaign is determined by the customer through the real-time bidding process, through management of the campaign the customer can define supplier preferences or specific suppliers from a list the Company maintains, and the amount earned by the Company is fixed based on a percentage of the media spend of a customer’s campaign.
Platform Services — Platform Services provide customers the opportunity to utilize the Company’s platform on a managed service basis, whereby the Company delivers digital video advertisements based upon a pre-agreed set of fixed objectives with an advertiser or agency. The Company enters into customer agreements through discrete binding IOs with fixed price commitments which are determined prior to the launch of an advertising campaign.
For Platform Services, the Company recognizes revenue on a gross basis primarily based on the Company’s determination that it is subject to the risk of fluctuating costs from its media vendors, has latitude in establishing prices with its customer, has discretion in selecting media vendors when fulfilling a customer’s campaign, and has credit risks.
Cost of Revenue
Cost of revenue is comprised primarily of media costs. Media costs are based on advertising impressions the Company purchases from inventory sources in connection with its Platform Services offering. The Company typically pays for these impressions on a cost per thousand impression (CPM) basis. Cost of revenue also includes technical infrastructure costs which include the cost of internal and third-party servers and related services, internet access costs and amortization of internal use software development costs on revenue-producing technologies.
Advertising Costs
The Company’s policy is to expense all advertising costs as incurred. Advertising expense includes costs for user conferences, tradeshows, print marketing and design consulting. Advertising expense was $7.7 million, $6.4 million and $3.8 million for the years ended December 31, 2015, 2014 and 2013, respectively, and is included in sales and marketing expense in the accompanying consolidated statements of operations.
Stock-Based Compensation
The Company’s stock-based compensation expense is estimated at the grant date based on the fair value of the award and is recognized as expense ratably over the requisite service period of the award. Determining the appropriate fair value and calculating the fair value of stock-based awards requires judgment, including estimating share price volatility, forfeiture rates, expected dividends, and expected life. The Company calculates the fair value of each restricted stock unit award to employees on the date of grant and to non-employees on each measurement date based on the fair value of its common stock. The Company calculates the fair value of each option award on the date of grant under the Black-Scholes option pricing model using certain assumptions. For nonemployee consultants, the Company revalues the unvested share based awards at each measurement period. Total expenses for nonemployee share based awards has been immaterial to date.
68
The Black-Scholes model requires the use of highly subjective and complex assumptions, which determine the fair value of stock-based awards, including the option’s expected term and the price volatility of the underlying stock. The Company’s current estimate of volatility is based on the volatility of comparable public companies. To the extent volatility of the Company’s stock price increases in the future, the Company’s estimates of the fair value of options granted in the future could increase, thereby increasing stock-based compensation in future periods. The Company uses the simplified calculation of expected term, as the Company does not have sufficient historical data to use any other method to estimate expected term. The interest rate for periods within the contractual life of the award is based on the U.S. Treasury yield curve in effect at the time of grant. In addition, the Company applies an expected forfeiture rate when recording stock-based compensation. To the extent the Company revises this estimate in the future; its stock-based compensation could be materially impacted in the year of revision.
For market based awards, the Company uses the Monte Carlo simulation model to determine the fair value of each market-based award. The determination of the grant date fair value of the awards using a simulation model is affected by the Company’s stock price as well as assumptions regarding a number of complex and subjective variables. These variables include the expected stock price volatility over the expected life of the awards, risk-free interest rates, and expected dividends. The Company’s current estimate of volatility is based on the volatility of comparable public companies. The risk free interest rate is equal to the U.S. Treasury constant maturity rates for the period equal to the expected life. The Company does not currently pay cash dividends on common stock and does not anticipate doing so in the foreseeable future. Accordingly, the expected dividend yield is zero.
The Company accounts for income taxes in accordance with ASC Topic 740, Income Taxes, under which deferred tax liabilities and assets are recognized for the expected future tax consequences of temporary differences between the financial reporting and tax basis of assets and liabilities, as well as for net operating loss (NOL) and tax credit carryforwards. Deferred tax assets and liabilities are measured using the tax rates that are expected to apply to taxable income for the years in which those tax assets and liabilities are expected to be realized or settled. The Company records a valuation allowance to reduce deferred tax assets to the net amount that is more likely than not to be realized.
The Company utilizes a two-step approach to evaluate tax positions. Recognition, step one, requires evaluation of the tax position to determine if based solely on technical merits it is more likely than not (MLTN) to be sustained upon examination. The MLTN standard is met when the likelihood of occurrence is greater than 50%. Measurement, step two, is addressed only if step one is satisfied. In step two, the tax benefit is measured as the largest amount of benefit, determined on a cumulative probability basis, which is MLTN to be realized upon ultimate settlement with tax authorities. If a position does not meet the MLTN threshold for recognition in step one, no benefit is recorded until the first subsequent period in which the MLTN standard is met, the issue is resolved with the tax authority, or the statute of limitations expires. Positions previously recognized are derecognized when the Company subsequently determines that the position is no longer MLTN to be sustained.
The Company recognizes interest and penalties related to income taxes in its provision for income tax.
Foreign Currency Translation and Transactions
The consolidated financial statements of the Company’s foreign subsidiaries are measured using the local currency as the functional currency. Assets and liabilities of foreign subsidiaries are translated at exchange rates in effect as of the balance sheet date. Revenues and expenses are translated at average exchanges rates in effect during the period. Translation adjustments are recorded within accumulated other comprehensive loss, a separate component of stockholders’ equity, on the accompanying consolidated balance sheets. Foreign exchange gain (loss) is impacted by movements in exchange rates and the amount of foreign-currency denominated receivables and payables. The foreign exchange loss in the years ended December 31, 2015, 2014 and 2013 was primarily attributable to the strengthening of the U.S. dollar in relation to the Australian dollar, Canadian dollar, British pound and Euro for foreign-currency denominated transactions.
Earnings Per Share
The Company applies the two-class method for calculation and presenting earnings per share. Under the two-class method, net income is allocated between common units and other participating securities based on their participating rights. Participating securities are defined as securities that participate in dividends with common units according to a pre-determined formula or a contractual obligation to share in the income of the entity. Following the conversion of the preferred stock and preferred stock warrants at the time of the IPO, there are no other participating securities outstanding. Basic net (loss) income per common unit is calculated by dividing the net income by the weighted-average number of common units outstanding for the period. Diluted net income per share is computed by giving effect to all potential dilutive common stock equivalents outstanding for the period. Due to the net losses for the years ended December 31, 2015, 2014 and 2013, there is no impact or change in presentation as a result of applying the two-class method.
69
Segments and Concentration of Risk
The Company’s chief operating decision maker (CODM), its Chief Executive Officer, reviews financial information for the Company on a consolidated basis. The Company manages its business on the basis of one operating segment. The Company’s principal decision-making functions are located in the U.S.
As of December 31, 2015 there was one customer that accounted for more than 14% of outstanding gross accounts receivable. There were no customers that accounted for more than 10% of gross accounts receivable as of December 31, 2014. There were no customers that accounted for more than 10% of revenue during the year ended December 31, 2015, 2014 or 2013. The Company considers publishers as its suppliers and there were no suppliers that accounted for more than 10% of the Company’s total media purchases in any of the years presented. Branches or divisions of an advertiser that operate under distinct contracts are generally considered as separate customers. In particular, the Company treats as separate customers different groups within global advertising agencies if they are based in different jurisdictions or with respect to which the Company negotiated and manages separate contractual relationships.
Recent Accounting Pronouncements
In February 2016, the FASB issued Accounting Standards Update (ASU) 2016-02, Leases. This ASU requires lessees to recognize a right-of-use asset and lease liability for all leases with terms of more than twelve months. Recognition, measurement and presentation of expenses will depend on classification as a finance or operating lease. The ASU also requires certain quantitative and qualitative disclosures. Accounting guidance for lessors is largely unchanged. The requirements should be applied on a modified retrospective basis and the updated standard will be effective for the Company in the first quarter of 2020. The Company is in the process of determining what impact, if any, the adoption of this ASU will have on its consolidated financial statements and related disclosures.
In November 2015, the FASB issued Accounting Standards Update (ASU) 2015-17, Balance Sheet Classification of Deferred Taxes. This ASU requires that deferred tax assets and liabilities be classified as non-current in a statement of financial position, and eliminates the prior guidance which required an entity to separate deferred tax liabilities and assets into a current amount and a noncurrent amount in a classified balance sheet. The Company has early-adopted ASU 2015-17 effective December 31, 2015 on a prospective basis. Adoption of this ASU resulted in a change in accounting principle and reclassification of our net current deferred tax asset and current deferred tax liability to the net non-current deferred tax asset in our Consolidated Balance Sheet as of December 31, 2015. No prior periods were retrospectively adjusted.
In April 2015, the FASB issued ASU No. 2015-05, Customer’s Accounting for Fees Paid in a Cloud Computing Arrangement, which provides explicit guidance to help companies evaluate the accounting for fees paid by a customer in a cloud computing arrangement. The new guidance clarifies that if a cloud computing arrangement includes a software license, the customer should account for the license consistent with its accounting for other software licenses. If the arrangement does not include a software license, the customer should account for the arrangement as a service contract. ASU 2015-05 is effective for public business entities for annual periods, including interim periods within those annual periods, beginning after December 15, 2015. An entity can elect to adopt the amendments either prospectively for all arrangements entered into or materially modified after the effective date, or retrospectively. Early adoption is permitted for all entities. The Company is in the process of determining what impact, if any, the adoption of this ASU will have on its consolidated financial statements and related disclosures. The Company does not anticipate that the adoption of this standard will have a material impact on its consolidated financial statements and footnote disclosures.
In May 2014, the FASB, issued Accounting Standards Update No. 2014-09, Revenue from Contracts with Customers, or ASU 2014-09, which clarifies existing accounting literature relating to how and when a company recognizes revenue. The updated standard will replace most existing revenue recognition guidance under U.S. generally accepted accounting principles (GAAP) when it becomes effective and permits the use of either the retrospective or cumulative effect transition method. Under ASU 2014-09, a company will recognize revenue when it transfers promised goods or services to customers in an amount that reflects the consideration to which the company expects to be entitled in exchange for those goods and services. Additionally, the guidance requires improved disclosures to help users of financial statements better understand the nature, amount, timing, and uncertainty of revenue and cash flows arising from contracts with customers. The FASB decided on July 9, 2015 to defer for one year the effective date of the new revenue standard for public and nonpublic entities reporting under GAAP. The FASB also decided to permit entities to early adopt the standard, for annual reporting periods beginning after December 15, 2016, including interim reporting periods within that reporting period. The updated standard will be effective for the Company in the first quarter of 2018. The Company is in the process of determining what impact, if any, the adoption of this ASU will have on its consolidated financial statements and related disclosures.
70
2. Property, Equipment and Software, net
Property, equipment and software, net consisted of the following:
|
|
|
December 31, |
|
|||||
|
|
|
2015 |
|
|
2014 |
|
||
|
Computer, software and office equipment |
|
$ |
4,509 |
|
|
$ |
1,928 |
|
|
Capitalized internal use software costs |
|
|
3,587 |
|
|
|
1,166 |
|
|
Furniture and fixtures |
|
|
1,821 |
|
|
|
1,049 |
|
|
Leasehold improvements |
|
|
2,336 |
|
|
|
1,043 |
|
|
|
|
|
12,253 |
|
|
|
5,186 |
|
|
Less accumulated depreciation and amortization |
|
|
(3,668 |
) |
|
|
(1,284 |
) |
|
Total |
|
$ |
8,585 |
|
|
$ |
3,902 |
|
Total depreciation and amortization expense, excluding amortization of capitalized internal use software costs, was $1,630, $597 and $232 for years ended December 31, 2015, 2014, and 2013, respectively. The amortization expense of capitalized internal use software costs was $778, $267, and $90 for years ended December 31, 2015, 2014, and 2013, respectively and is recorded in cost of revenue in the consolidated statement of operations.
3. Accrued Liabilities
Accrued liabilities consisted of the following:
|
|
|
December 31, |
|
|||||
|
|
|
2015 |
|
|
2014 |
|
||
|
Accrued media costs |
|
$ |
61,040 |
|
|
$ |
41,436 |
|
|
Sales commissions |
|
|
3,776 |
|
|
|
2,826 |
|
|
Payroll and related expenses |
|
|
6,314 |
|
|
|
3,757 |
|
|
Other accrued expenses |
|
|
3,797 |
|
|
|
2,695 |
|
|
Total |
|
$ |
74,927 |
|
|
$ |
50,714 |
|
Accrued media costs consist of amounts owed to the Company’s vendors for impressions delivered through December 31, 2015 and 2014.
4. Debt Obligations
|
|
|
December 31, |
|
|||||
|
|
|
2015 |
|
|
2014 |
|
||
|
Short-term debt and current portion of long-term debt |
|
|
|
|
|
|
|
|
|
Revolving credit facility |
|
$ |
2,050 |
|
|
$ |
— |
|
|
Current portion of long-term debt: |
|
|
|
|
|
|
|
|
|
Term loan |
|
|
848 |
|
|
|
1,362 |
|
|
Total current |
|
$ |
2,898 |
|
|
$ |
1,362 |
|
|
Long-term debt |
|
|
|
|
|
|
|
|
|
Term loan |
|
$ |
2,635 |
|
|
$ |
1,362 |
|
|
Less: current portion of long-term debt: |
|
|
848 |
|
|
|
1,362 |
|
|
Total noncurrent |
|
$ |
1,787 |
|
|
$ |
— |
|
On August 21, 2013, the Company entered into an amended and restated Loan and Security Agreement (Loan Agreement) providing for a growth capital term loan and a revolving line of credit.
71
Revolving Line of Credit
In April 2014, the Company entered into an amendment to its Loan Agreement. The amendment increased the amount of the revolving line of credit to $35.0 million and extended the availability and maturity through April 1, 2016. The amendment also introduced a new financial covenant that requires the Company to meet certain minimum revenue levels.
In December 2015, the Company entered into a second amendment to its Loan Agreement. The second amendment increased the amount of the revolving line of credit to $40.0 million, extended its maturity date to April 1, 2017.
Under the Loan Agreement, the Company may borrow under the revolving line of credit up to the lesser of (a) $40.0 million and (b) a borrowing base equal to 80% of eligible accounts receivable as defined in the agreement. The interest rate applicable to outstanding advances under the revolving line of credit did not change under the second amendment. Advances under the line of credit accrue interest at a floating per annum rate equal to the prime rate as published in the Western Edition Wall Street Journal. The Company is required to pay a minimum amount of interest equal to the amount of interest that would accrue per quarter on a notional outstanding principal balance of $2.1 million. The interest rate at December 31, 2015, was 3.50%.
The Loan Agreement includes a covenant whereby the Company is required to maintain an adjusted quick ratio of at least 1.10 to 1.00, tested as of the last day of each month, on a consolidated basis. This covenant is applicable to a given month if the Company fails to maintain, as of the last day of such month, consolidated revenues equal at least to 85% of the revenue projected in the business plan approved by the Company’s Board of Directors, measured on a trailing six-month basis.
If the combined amount of the Company’s cash on deposit with the lender, plus the availability under the revolving line of credit is less than $10.0 million, then the Company is required to deliver additional reporting, collections on accounts receivable are applied to immediately reduce the outstanding amount of advances under the revolving line, and the lender is allowed to take, in good faith, additional reserves against availability under the revolving line of credit.
As of December 31, 2015, the Company had $2.1 million outstanding and had $37.9 million available under the revolving line of credit and was in compliance with all financial covenants.
Term Loans
Under the Loan Agreement, the Company had the ability to borrow a maximum of $4.25 million at an interest rate of 4.75%. In 2014, the Loan Agreement was amended to add a new $3.0 million capital equipment term loan under which, the Company had $1.4 million outstanding at December 31, 2014. This term loan was repaid in 2015.
In 2015, the Company entered into a second amendment to its Loan Agreement. The second amendment added a new $5.0 million capital equipment term loan. The Company can request advances under the capital equipment financing facility through March 31, 2016, and outstanding amounts under the facility bear interest at a floating annual rate of prime plus 0.5%. The Company is required to repay each capital equipment financing facility loan in 36 equal monthly payments of principal plus accrued interest commencing on the first day of the month immediately following the funding of each capital equipment facility loan. As of December 31, 2015, the Company had $2.6 million outstanding under the capital equipment term loan. The interest rate at December 31, 2015, was 4.0%.
Future principal payments of debt instruments as of December 31, 2015 are as follows:
|
|
|
Principal Payments |
|
|
|
|
|
(in thousands) |
|
|
|
2016 |
|
$ |
2,898 |
|
|
2017 |
|
|
875 |
|
|
2018 |
|
|
912 |
|
|
Thereafter |
|
|
— |
|
|
Total payments |
|
$ |
4,685 |
|
72
Warrants
In connection with a note payable issued in March 2010, the Company issued a warrant to purchase 77,161 shares of Series A-1 preferred stock at a price of $0.8748 per share. The warrant contained a down round protection clause. The Company accounted for the warrant at fair value and recorded it as a liability in accordance with FASB ASC Subtopic 815-40, Derivatives and Hedging Contracts in Entity’s Own Equity. Changes in the fair value of the warrant from the date of issuance up to July 23, 2014, conversion date, were included in the accompanying consolidated statements of operations and comprehensive loss during the year. The fair value of the warrant liability is based on a Monte Carlo Simulation that utilizes various assumptions, including expected term, volatility, risk-free interest rate, share issuance frequency, and exercise price.
On July 23, 2014, upon the closing of the Company’s IPO, the warrant converted from a warrant to purchase Series A-1 preferred stock to a warrant to purchase shares of common stock, and the liability at its then fair value of $516 was reclassified to additional paid-in capital. Prior to this date, all changes in the fair value of the warrant were recorded in other (expense) income in the accompanying unaudited consolidated statements of operations. On August 15, 2014, the warrant was net exercised in full for 69,895 shares of common stock.
The following assumptions were used at July 23, 2014 (date of warrant conversion):
|
|
July 23, |
|
|
|
|
2014 |
|
|
|
Risk-free interest rate |
|
2.53 |
% |
|
Expected volatility |
|
80 |
% |
|
Expected lives |
5.8 years |
|
|
|
Fair value of underlying equity |
$ |
7.00 |
|
The Company recorded the fair value of the warrant at issuance of $56 as a discount to the note payable to be amortized over the three year life of the loan.
There were no amount outstanding in respect of the warrant liability at the years ended December 31, 2015 and 2014. A revaluation loss (gain) of $0, $(168), and $388 was recorded during the years ended December 31, 2015, 2014, and 2013, respectively, relating to the change in fair value in each period.
TubeMogul Japan Inc. Financing
In December 2012, the Company’s subsidiary TubeMogul Japan Inc. raised $232 from an investor through the issuance of a convertible note to finance its operations in Japan. In February 2013, the Company’s subsidiary raised an additional $187 in financing from three new investors, of which one is a member of the Company’s Board of Directors, through the issuance of convertible notes, to secure additional financing for the Company’s wholly-owned subsidiary in Japan. The notes are non-interest bearing and non-collateralized.
In October 2014, the Company redeemed the convertible notes from all of its investors for $957 (inclusive of a premium to induce repayment), of which the Company recorded $538 as loss on extinguishment of convertible notes in other (expense) income, net in the accompanying consolidated statements of operations.
5. Stockholders’ Equity
Common and Preferred Stock
In connection with the IPO, the Company’s board of directors and stockholders approved the amendment and restatement of the Company’s certificate of incorporation, which was effective immediately following the closing of the IPO on July 23, 2014. Under the Company’s amended and restated certificate of incorporation, the Company is authorized to issue up to 200,000,000 shares of common stock and 10,000,000 shares of undesignated preferred stock.
73
The following table presents the shares authorized and issued and outstanding as of December 31, 2015 and 2014:
|
|
|
|
|
|
|
Shares |
|
|
Issuance |
|
|
|
|
|
|
|
|
|
||
|
|
|
Shares |
|
|
Issued and |
|
|
Price Per |
|
|
Carrying |
|
|
Liquidation |
|
|||||
|
|
|
Authorized |
|
|
Outstanding |
|
|
Share |
|
|
Value |
|
|
Preference |
|
|||||
|
Series A |
|
|
4,177,390 |
|
|
|
1,257,838 |
|
|
$ |
1.21 |
|
|
$ |
1,448 |
|
|
$ |
1,525 |
|
|
Series A |
|
|
— |
|
|
|
830,866 |
|
|
|
0.91 |
|
|
|
756 |
|
|
|
1,007 |
|
|
Series A-1 |
|
|
7,847,028 |
|
|
|
3,675,129 |
|
|
|
0.87 |
|
|
|
3,128 |
|
|
|
3,215 |
|
|
Series A-1 |
|
|
— |
|
|
|
171,228 |
|
|
|
0.70 |
|
|
|
120 |
|
|
|
150 |
|
|
Series B |
|
|
10,298,658 |
|
|
|
5,149,330 |
|
|
|
1.94 |
|
|
|
9,896 |
|
|
|
10,000 |
|
|
Series C |
|
|
8,851,871 |
|
|
|
4,425,939 |
|
|
|
6.47 |
|
|
|
28,564 |
|
|
|
28,658 |
|
|
Common stock, $0.001 par value |
|
|
62,000,000 |
|
|
|
6,674,757 |
|
|
|
|
|
|
|
|
|
|
|
|
|
|
Balance as of December 31, 2013 |
|
|
93,174,947 |
|
|
|
22,185,087 |
|
|
|
|
|
|
$ |
43,912 |
|
|
$ |
44,555 |
|
|
Converted |
|
|
(31,174,947 |
) |
|
|
(15,510,330 |
) |
|
|
|
|
|
|
|
|
|
|
|
|
|
Preferred stock as of December 31, 2014 |
|
|
10,000,000 |
|
|
|
— |
|
|
|
|
|
|
|
|
|
|
|
|
|
|
Common stock, $0.001 par value as of December 31, 2014 |
|
|
200,000,000 |
|
|
|
29,837,892 |
|
|
|
|
|
|
|
|
|
|
|
|
|
|
|
|
|
|
|
|
|
|
|
|
|
|
|
|
|
|
|
|
|
|
|
|
Preferred stock as of December 31, 2015 |
|
|
10,000,000 |
|
|
|
— |
|
|
|
|
|
|
|
|
|
|
|
|
|
|
Common stock, $0.001 par value as of December 31, 2015 |
|
|
200,000,000 |
|
|
|
35,343,643 |
|
|
|
|
|
|
|
|
|
|
|
|
|
6. Commitments and Contingencies
Lease Commitments
The Company’s commitments for minimum rentals under its operating leases as of December 31, 2015 are as follows:
|
|
|
Operating |
|
|
|
|
|
leases |
|
|
|
2016 |
|
$ |
4,342 |
|
|
2017 |
|
|
4,283 |
|
|
2018 |
|
|
3,742 |
|
|
2019 |
|
|
3,528 |
|
|
2020 |
|
|
3,224 |
|
|
Thereafter |
|
|
5,808 |
|
|
Total minimum lease payments |
|
$ |
24,927 |
|
Rent expense was $2,875, $2,178, and $1,178 for the years ended December 31, 2015, 2014, and 2013, respectively. In December, the Company entered into a sublease agreement under which it will receive sublease income of $560, $577, $595, and $613 in 2016, 2017, 2018, and 2019, respectively. Sublease income is not included in the minimum lease payments above.
Purchase Commitments
In August 2015, the Company entered into a commitment to purchase media from a single supplier in the amount of $7.5 million to $15.0 million, depending on the type of media purchased. These purchases can be made at any time from February 15, 2015 through September 30, 2016. As of December 31, 2015, the Company had purchased $1.6 million of media under this arrangement.
Irrevocable Standby Letter of Credit
On July 2, 2013, the Company entered into an irrevocable standby letter of credit in the amount of $334 for the benefit of its sub landlord. The irrevocable letter of credit automatically renews on its anniversary so long that the sub-lease is still effective. The letter of credit may be canceled prior to the expiration date upon the written request of the beneficiary.
In February 2014, the Company entered into an irrevocable standby letter of credit in the amount of $408 for the benefit of one of its lessors. The irrevocable letter of credit automatically renews on its anniversary so long that the lease is still effective. The letter of credit may be canceled prior to the expiration date upon the written request of the beneficiary.
74
In October 2015, the Company entered into an irrevocable standby letter of credit in the amount of $821 for the benefit of one of its lessors. The irrevocable letter of credit automatically renews on its anniversary so long that the lease is still effective. The letter of credit may be canceled prior to the expiration date upon the written request of the beneficiary.
The Company is contractually required to keep the letters of credit for the term of the lease, therefore, the letters of credit are recorded as restricted cash and are classified as long-term assets on the consolidated Balance Sheets.
Legal
The Company is involved from time to time in various claims and legal actions arising in the ordinary course of business. While it is not feasible to predict or determine the ultimate outcome of these matters, the Company believes that none of its current legal proceedings will have a material adverse effect on its financial position or results of operations.
7. Stock-Based Compensation
On July 9, 2007, the board of directors and stockholders of the Company approved and adopted the TubeMogul, Inc. 2007 Equity Compensation Plan (the 2007 Plan) that permitted the grant of incentive and nonqualified stock options, stock awards (including restricted stock units), and stock appreciation rights to purchase shares of the common stock of the Company. Under the 2007 Plan, shares of common stock are reserved for the issuance of permitted awards to eligible participants. Options granted generally vest and become exercisable over a four-year term from the date of grant, at a rate of 25% after one year, then monthly on a straight-line basis thereafter. Options granted generally are exercisable for up to 10 years from the date of grant. Restricted stock units (RSUs) granted are generally released from restriction over a four-year term from the date of grant, at a rate of 25% after one year, then quarterly on a straight-line basis thereafter. Common shares purchased or issued under the 2007 Plan are subject to certain restrictions.
The Company has authorized and reserved a total of 6,093,703 shares of common stock under the 2007 Plan for the grant of permitted awards to employees, directors, consultants, and other service providers for the Company or related companies. The 2007 Plan terminated effective July 18, 2014, though it continues to govern outstanding awards issued under the 2007 Plan prior to July 18, 2014.
In February 2014, the Company’s board of directors and stockholders approved and adopted the TubeMogul, Inc. 2014 Equity Incentive Plan (the 2014 Plan), and the 2014 Plan became effective on July 16, 2014, the day immediately preceding the Company’s IPO. The 2014 Plan permits the grant of stock options, stock appreciation rights, restricted stock, RSUs, performance awards and other cash-based or stock-based awards. In addition, the 2014 Plan contains a mechanism through which the Company may adopt a deferred compensation arrangement in the future. Under the 2014 Plan, shares of common stock are reserved for the issuance of permitted awards to eligible participants. Options granted will generally vest and become exercisable over a four-year term from the date of grant, at a rate of 25% after one year, then monthly on a straight-line basis thereafter. Options granted generally are exercisable for up to 10 years from the date of grant. RSUs granted will generally be released from restriction over a four-year term from the date of grant, at a rate of 25% after one year, then quarterly on a straight-line basis thereafter.
The Company has initially authorized and reserved a total of 2,500,000 shares of common stock under the 2014 Plan for the grant of permitted awards. This reserve automatically increased on January 1, 2015 by 1,491,894 shares and will continue to increase on each subsequent anniversary through 2024, by an amount equal to the smaller of (a) five percent (5%) of the number of shares of common stock issued and outstanding on the immediately preceding December 31; and (b) an amount determined by the Company’s board of directors. This reserve also will be increased by up to an additional 4,975,000 shares, to include (a) any shares remaining available for grant under the 2007 Plan at the time of its termination; and (b) shares that would otherwise be returned to the 2007 Plan, upon the expiration or termination of awards granted under that plan.
Shares subject to awards which expire or are cancelled or forfeited will again become available for issuance under the 2014 Plan.
The shares available under the 2014 Plan will not be reduced by awards settled in cash. The shares available under the 2014 Plan will be reduced by shares withheld to satisfy tax withholding obligations with respect to stock options and stock appreciation rights. The gross number of shares issued upon the exercise of stock appreciation rights or options exercised by means of a net exercise or by tender of previously owned shares will be deducted from the shares available under the 2014 Plan.
75
For purposes of the tables below, the 2007 Plan and the 2014 Plan are collectively referred to as the “Plan”. The following table summarizes the Plan’s stock option activity (in thousands, except per share data):
|
|
|
|
|
|
|
Weighted- |
|
|
Weighted- |
|
|
|
|
|
|
Weighted |
|
|
|
|
|
|||
|
|
|
|
|
|
|
average |
|
|
average |
|
|
|
|
|
|
average |
|
|
|
|
|
|||
|
|
|
Outstanding |
|
|
exercise |
|
|
grant |
|
|
Total intrinsic |
|
|
remaining |
|
|
Aggregate |
|
||||||
|
|
|
number of |
|
|
price per |
|
|
date fair |
|
|
value of |
|
|
contractual |
|
|
intrinsic |
|
||||||
|
|
|
shares |
|
|
share |
|
|
value |
|
|
exercises |
|
|
life |
|
|
value |
|
||||||
|
Balance at December 31, 2014 |
|
|
5,166 |
|
|
$ |
5.32 |
|
|
|
|
|
|
|
|
|
|
|
7.75 |
|
|
$ |
83,132 |
|
|
Options granted |
|
|
112 |
|
|
|
14.91 |
|
|
$ |
8.95 |
|
|
|
|
|
|
|
|
|
|
|
|
|
|
Options exercised |
|
|
(936 |
) |
|
|
0.90 |
|
|
|
|
|
|
$ |
11,749 |
|
|
|
|
|
|
|
|
|
|
Options canceled |
|
|
(76 |
) |
|
|
5.37 |
|
|
|
|
|
|
|
|
|
|
|
|
|
|
|
|
|
|
Years Ended December 31, 2015 |
|
|
4,266 |
|
|
$ |
6.55 |
|
|
|
|
|
|
|
|
|
|
|
7.14 |
|
|
$ |
34,748 |
|
|
Options exercisable and vested at December 31, 2015 |
|
|
2,834 |
|
|
$ |
4.77 |
|
|
|
|
|
|
|
|
|
|
|
6.57 |
|
|
$ |
27,233 |
|
|
Options vested and expected to vest at December 31, 2015 |
|
|
4,165 |
|
|
$ |
6.42 |
|
|
|
|
|
|
|
|
|
|
|
7.11 |
|
|
$ |
34,349 |
|
The weighted average fair value of options granted was $8.95, $9.87, and $2.64 for the years ended December 31, 2015, 2014, and 2013, respectively. The aggregate intrinsic value of options exercised was $11.7 million, $2.9 million, and $7.4 million for the years ended December 31, 2015, 2014 and 2013, respectively.
The fair value of options granted to employees is estimated on the date of grant and to non-employees at each measurement period using the Black-Scholes-Merton option valuation model. This stock-based compensation expense valuation model requires the Company to make assumptions and judgments regarding the variables used in the calculation. These variances include the expected term (weighted average period of time that the options granted are expected to be outstanding), the expected volatility of the Company’s common stock, expected risk-free interest rate, expected dividends. To the extent actual results differ from the estimates, the difference will be recorded as a cumulative adjustment in the period estimates are revised. The Company uses the simplified calculation of expected term, as the Company does not have sufficient historical data to use any other method to estimate expected term. Expected volatility is based on an average of the historical volatilities of the common stock of several entities with characteristics similar to those of the Company. The expected risk-free rate is based on the U.S. Treasury yield curve in effect at the time of grant for periods corresponding with the expected life of the option. Expected forfeitures are based on the Company’s historical experience.
The following assumptions were used to calculate the fair value of options for employees:
|
|
|
Years Ended |
|||||
|
|
|
December 31, |
|||||
|
|
|
2015 |
|
|
2014 |
|
2013 |
|
Risk-free interest rate |
|
1.18% to 1.63% |
|
|
1.7% to 2.0% |
|
1.18% to 1.98% |
|
Dividend yield |
|
— % |
|
|
— % |
|
— % |
|
Volatility |
|
70% |
|
|
66% to 71% |
|
68% to 69% |
|
Expected term |
|
4.5 to 6.5 years |
|
|
5.6 to 6.4 years |
|
5.5 to 6.6 years |
The following table summarizes the Plan’s RSUs activity (in thousands, except per share data):
|
|
|
|
|
|
|
Weighted- |
|
|
|
|
|
Outstanding |
|
|
Average |
|
||
|
|
|
number of |
|
|
Grant Date |
|
||
|
|
|
shares |
|
|
Fair Value |
|
||
|
Balance at December 31, 2014 |
|
|
998 |
|
|
$ |
10.99 |
|
|
RSUs granted |
|
|
1,824 |
|
|
|
14.15 |
|
|
RSUs released |
|
|
(390 |
) |
|
|
12.19 |
|
|
RSUs canceled |
|
|
(365 |
) |
|
|
13.74 |
|
|
Years Ended December 31, 2015 |
|
|
2,067 |
|
|
$ |
13.51 |
|
The fair value of RSUs granted to employees is estimated on the date of grant and to non-employees at each measurement period using the fair value of the underlying common stock.
76
At December 31, 2015, there was approximately $34.8 million of total unrecognized compensation cost related to unvested stock-based compensation arrangements granted under the Plan. The remaining unrecognized compensation cost is expected to be recognized over the weighted average remaining vesting period of approximately 3.2 years at December 31, 2015.
In November 2014, the Company granted market-based performance options for a total of 385,035 shares under the Plan subject to vesting based upon the Company’s achievement of certain market valuations. The vesting conditions are as follows:
|
Vesting Condition |
Number of Options Vested |
Achievement of Market Capitalization |
Derived Service Period |
Vesting period |
Period of Expense Recognition |
|
A |
154,014 shares |
The Company obtains a $700 million market capitalization for 90 consecutive trading days calculated as the closing price of one share of the Company’s stock as reported by NASDAQ multiplied by the total number of outstanding shares as of each date. |
18 months |
Equal monthly installments over 24 months, beginning one month after the vesting condition is met |
42 months |
|
B |
231,021 shares |
The Company obtains a $1 billion market capitalization for 90 consecutive trading days calculated as the closing price of one share of the Company’s stock as reported by NASDAQ multiplied by the total number of outstanding shares as of each date. |
29 months |
Equal monthly installments over 24 months, beginning one month after the vesting condition is met |
53 months |
The options have an exercise price of $17.04 per share and expire in 10 years. The fair value of the awards subject to market conditions was $4.6 million which will be recognized over the requisite service period and was estimated using a Monte Carlo simulation model with the following assumptions used to estimate the fair value thereof:
|
|
|
Years Ended |
|||
|
|
|
December 31, |
|||
|
|
|
2015 |
|
|
2014 |
|
Risk-free interest rate |
|
1.18% to 1.63% |
|
|
1.7% to 2.0% |
|
Dividend yield |
|
— % |
|
|
— % |
|
Volatility |
|
70% |
|
|
66% to 71% |
|
Expected term |
|
4.5 to 6.5 years |
|
|
5.6 to 6.4 years |
Both the Black-Scholes and the Monte Carlo simulation fair value models require the use of highly subjective and complex assumptions, including the expected term of the award and the price volatility of the underlying stock. Changes in the Black-Scholes and the Monte Carlo valuation assumptions and the Company’s related estimates may change the fair value for stock-based compensation and the related expense recognized.
The following table summarizes the effects of stock-based compensation in the Company’s accompanying consolidated statements of operations:
|
|
|
Years Ended |
|
|||||||||
|
|
|
December 31, |
|
|||||||||
|
|
|
2015 |
|
|
2014 |
|
|
2013 |
|
|||
|
|
|
(in thousands) |
|
|||||||||
|
Research and development |
|
$ |
3,687 |
|
|
$ |
1,094 |
|
|
$ |
206 |
|
|
Sales and marketing |
|
|
3,717 |
|
|
|
1,058 |
|
|
|
230 |
|
|
General and administrative |
|
|
5,159 |
|
|
|
1,391 |
|
|
|
325 |
|
|
Total stock-based compensation |
|
$ |
12,563 |
|
|
$ |
3,543 |
|
|
$ |
761 |
|
Employee Stock Purchase Plan
In July 2014, the Company’s board of directors adopted and the stockholders approved the Company’s 2014 Employee Stock Purchase Plan (ESPP). The ESPP allows eligible employees to purchase shares of the Company’s common stock through payroll deductions of up to 15% of their eligible compensation, subject to any plan limitations. The administrator may, in its discretion, modify the terms of offering periods. Due to the timing of the IPO, the first offering period started July 17, 2014 and ended on February 16, 2015. At the end of each offering period, employees are able to purchase shares at 85% of the lower of the fair market value of the Company’s common stock on the first trading day of the offering period or on the last day of the offering period. As of December 31, 2015 the Company had 1,136,964 shares available for sale under the ESPP. The ESPP provides for annual increases in the number of shares available for issuance under the ESPP on the first day of each fiscal year, equal to the least of (a) two percent of
77
the number of shares of Stock issued and outstanding on the immediately preceding fiscal year, or (b) an amount determined by the Board. Compensation cost recognized under this plan was $792 and $248 in the years ended December 2015 and 2014, respectively.
8. Net Loss per Share
The Company calculates its basic and diluted net loss per share in conformity with the two-class method required for companies with participating securities. Under the two-class method, in periods when the Company has net income, net income is determined by allocating undistributed earnings, calculated as net income less current period convertible preferred stock non-cumulative dividends, between common stock and convertible preferred stock. In computing diluted net income, undistributed earnings are re-allocated to reflect the potential impact of dilutive securities.
The Company’s basic net loss per share is calculated by dividing the net loss by the weighted-average number of shares of common stock outstanding for the period. The diluted net loss per share is computed by giving effect to all potential dilutive common stock equivalents outstanding for the period. For purposes of this calculation, convertible preferred stock, options to purchase common stock, RSUs and preferred and common stock warrants are considered common stock equivalents but have been excluded from the calculation of diluted net loss per share as their effect is antidilutive as the Company had net losses for the years ended December 31, 2015, 2014 and 2013.
The following table sets forth the computation of net loss per common share (in thousands, except per share data):
|
|
|
Years Ended |
|
|||||||||
|
|
|
December 31, |
|
|||||||||
|
|
|
2015 |
|
|
2014 |
|
|
2013 |
|
|||
|
Net Loss |
|
$ |
(13,731 |
) |
|
$ |
(4,444 |
) |
|
$ |
(7,411 |
) |
|
Weighted-average shares used in computing basic and diluted net loss per share |
|
|
32,736 |
|
|
|
19,928 |
|
|
|
6,613 |
|
|
Basic and diluted net loss per share |
|
|
(0.42 |
) |
|
|
(0.22 |
) |
|
|
(1.12 |
) |
The following securities were excluded from the calculation of diluted net loss per share because their effect would have been anti-dilutive for the periods presented:
|
|
|
Years Ended |
|
|||||||||
|
|
|
December 31, |
|
|||||||||
|
|
|
2015 |
|
|
2014 |
|
|
2013 |
|
|||
|
Convertible preferred stock |
|
— |
|
|
— |
|
|
|
15,510 |
|
||
|
Employee stock options |
|
|
4,266 |
|
|
|
5,166 |
|
|
|
3,695 |
|
|
RSUs |
|
|
2,067 |
|
|
|
998 |
|
|
— |
|
|
|
ESPP |
|
|
122 |
|
|
|
124 |
|
|
— |
|
|
|
Convertible preferred stock warrants |
|
— |
|
|
— |
|
|
|
102 |
|
||
|
Total |
|
|
6,455 |
|
|
|
6,288 |
|
|
|
19,307 |
|
9. Employee Benefit Plans
The Company started a 401(k) Profit Sharing Plan (401(k) Plan), effective January 1, 2009 for U.S. employees who are 21 years of age or older. According to the terms of the Plan, the Company may make a discretionary contribution to the Plan each year, allocable to all plan participants. The Company did not match employee contributions during the year ended December 31, 2014, however, the Company began matching up to 25% of employee contributions starting in fiscal year 2015 and recorded $821 in related expense for the year ended December 31, 2015. The Company is responsible for administrative expenses of the 401(k) Plan.
78
10. Income Taxes
Income (loss) before income taxes is attributable to the following geographic locations:
|
|
|
December 31, |
|
|||||||||||||
|
|
|
2015 |
|
|
2014 |
|
|
2013 |
|
|
2012 |
|
||||
|
United States |
|
$ |
(13,248 |
) |
|
$ |
(3,210 |
) |
|
$ |
(6,955 |
) |
|
$ |
(3,532 |
) |
|
Foreign |
|
|
180 |
|
|
|
(951 |
) |
|
|
(396 |
) |
|
|
61 |
|
|
Net loss before income tax |
|
$ |
(13,068 |
) |
|
$ |
(4,161 |
) |
|
$ |
(7,351 |
) |
|
$ |
(3,471 |
) |
The components of the provision for income taxes are as follows:
|
|
|
December 31, |
|
|||||||||
|
|
|
2015 |
|
|
2014 |
|
|
2013 |
|
|||
|
Current income tax (benefit) expense: |
|
|
|
|
|
|
|
|
|
|
|
|
|
Federal |
|
$ |
(13 |
) |
|
$ |
37 |
|
|
$ |
— |
|
|
State |
|
|
148 |
|
|
|
37 |
|
|
|
20 |
|
|
Foreign |
|
|
540 |
|
|
|
220 |
|
|
|
40 |
|
|
Total current income tax expense |
|
|
675 |
|
|
|
294 |
|
|
|
60 |
|
|
Deferred income tax expense (benefit): |
|
|
|
|
|
|
|
|
|
|
|
|
|
Foreign |
|
|
(12 |
) |
|
|
(11 |
) |
|
|
— |
|
|
Total deferred income tax expense (benefit) |
|
|
(12 |
) |
|
|
(11 |
) |
|
|
— |
|
|
Total provision for income taxes |
|
$ |
663 |
|
|
$ |
283 |
|
|
$ |
60 |
|
The following is a reconciliation of the statutory federal income tax rate to the Company’s effective tax rate for the years ended December 31, 2015, 2014 and 2013.
|
|
|
Years Ended |
|
|||||||||||||||||||||
|
|
|
December 31, |
|
|||||||||||||||||||||
|
|
|
2015 |
|
|
|
|
|
|
2014 |
|
|
|
|
|
|
2013 |
|
|
|
|
|
|||
|
Net loss before income taxes |
|
$ |
(13,068 |
) |
|
|
|
|
|
$ |
(4,161 |
) |
|
|
|
|
|
$ |
(7,351 |
) |
|
|
|
|
|
Expected income tax expense at statutory rate |
|
$ |
(4,443 |
) |
|
|
34.0 |
% |
|
$ |
(1,415 |
) |
|
|
34.0 |
% |
|
$ |
(2,499 |
) |
|
|
34.0 |
% |
|
State taxes — net of federal benefit |
|
|
(477 |
) |
|
|
3.7 |
% |
|
|
(47 |
) |
|
|
1.1 |
% |
|
|
(316 |
) |
|
|
4.3 |
% |
|
Permanent book-tax differences |
|
|
716 |
|
|
|
(5.5 |
)% |
|
|
1,066 |
|
|
|
(25.6 |
)% |
|
|
514 |
|
|
|
(7.0 |
)% |
|
Stock based compensation |
|
|
738 |
|
|
|
(5.6 |
)% |
|
|
— |
|
|
|
— |
|
|
|
— |
|
|
|
— |
|
|
Change in valuation allowance |
|
|
4,000 |
|
|
|
(30.6 |
)% |
|
|
613 |
|
|
|
(14.7 |
)% |
|
|
2,371 |
|
|
|
(32.3 |
)% |
|
Other, net |
|
|
129 |
|
|
|
(1.0 |
)% |
|
|
66 |
|
|
|
(1.6 |
)% |
|
|
(10 |
) |
|
|
0.1 |
% |
|
Provision for income taxes |
|
$ |
663 |
|
|
|
(5.0 |
)% |
|
$ |
283 |
|
|
|
(6.8 |
)% |
|
$ |
60 |
|
|
|
(0.8 |
)% |
The tax effects of temporary differences and related deferred tax assets and liabilities as of December 31, 2015, 2014 and 2013 are as follows:
|
|
|
December 31, |
|
|||||||||
|
|
|
2015 |
|
|
2014 |
|
|
2013 |
|
|||
|
Accrued expenses |
|
$ |
667 |
|
|
$ |
470 |
|
|
$ |
266 |
|
|
Stock-based compensation |
|
|
3,278 |
|
|
|
1,072 |
|
|
|
236 |
|
|
Reserves and allowances |
|
|
1,219 |
|
|
|
708 |
|
|
|
302 |
|
|
Other |
|
|
419 |
|
|
|
468 |
|
|
|
64 |
|
|
Net operating losses |
|
|
7,963 |
|
|
|
5,954 |
|
|
|
6,451 |
|
|
Deferred Tax Assets |
|
$ |
13,546 |
|
|
$ |
8,672 |
|
|
$ |
7,319 |
|
|
Valuation allowance |
|
|
(11,610 |
) |
|
|
(7,417 |
) |
|
|
(6,804 |
) |
|
Total Deferred Tax Assets |
|
|
1,936 |
|
|
|
1,255 |
|
|
|
515 |
|
|
State deferred taxes |
|
|
(906 |
) |
|
|
(521 |
) |
|
|
(510 |
) |
|
Depreciation and amortization |
|
|
(1,007 |
) |
|
|
(723 |
) |
|
|
(5 |
) |
|
Total Deferred Tax Liabilities |
|
|
(1,913 |
) |
|
|
(1,244 |
) |
|
|
(515 |
) |
|
Net Deferred Tax Assets |
|
$ |
23 |
|
|
$ |
11 |
|
|
$ |
— |
|
79
Based on the available objective evidence, management believes it is more-likely-than not that the net deferred tax assets were not fully realizable as of the year ended December 31, 2015. Accordingly, the Company has established a valuation allowance against its net deferred tax assets.
For the year ended December 31, 2015, the Company has not provided for income taxes on its undistributed earnings for foreign subsidiaries because these earnings are intended to be permanently reinvested in operations outside the U.S. The unrecognized deferred tax liabilities associated with these earnings are insignificant.
The Company has elected to use the "with and without" approach as described in ASC 740-20, "Intraperiod Tax Allocation," in determining the order in which tax attributes are utilized. As a result, the Company will only recognize a tax benefit from stock-based awards in additional paid-in capital if an incremental tax benefit is realized after all other tax attributes currently available to the Company have been utilized.
As of December 31, 2015, the Company has a net operating loss carryforward of approximately $25.4 million for federal tax purposes and $52.8 million for state tax purposes. If not utilized, these losses will expire beginning in 2017 for state purposes and 2027 for federal purposes. If certain substantial changes in the entity's ownership occur, there could be an annual limitation on the amount of the carryforwards that can be utilized.
Utilization of the net operating loss carryforwards may be subject to an annual limitation due to the ownership change limitations provided by the Internal Revenue Code of 1986, as amended (IRC), and similar state provisions. The annual limitation may result in the expiration of net operating losses before utilization. The Company believes ownership changes, as defined under Section 382 of the IRC, existed in prior years, and has reduced its net operating loss carryforwards to reflect the limitation.
FASB authoritative guidance for the accounting for uncertainty in income taxes clarifies the accounting and reporting for income taxes where interpretation of the tax law on the Company’s tax positions may be uncertain. The guidance also prescribes a comprehensive model for the financial statement recognition, derecognition, measurement, presentation and disclosure of income tax uncertainties with respect to positions taken or expected to be taken in income tax returns. As of December 31, 2015, the Company does not have uncertain tax positions for which it has recorded a liability. While the Company may have unrecognized tax benefits included in its deferred tax assets, all of its tax benefits are subject to a full valuation allowance as of December 31, 2015 and 2014. Therefore, the Company has not yet performed a study to determine the amount of such unrecognized tax benefits that are more likely than not to be realized. The Company’s policy is to recognize interest and penalties accrued on any unrecognized tax benefits as a component of income tax expense. There was no interest and penalties accrued as of December 31, 2015 and 2014.
The Company files income tax returns in the U.S. federal jurisdiction as well as many U.S. states and foreign jurisdictions. Tax years 2008-2014 remain open for examination by the Internal Revenue Service and state taxing agencies. The Company has no ongoing tax examinations by tax authorities at this time.
11. Segment Information
The Company considers operating segments to be components of the Company in which separate financial information is available that is evaluated regularly by the Company’s CODM in deciding how to allocate resources and in assessing performance. The CODM for the Company is the Chief Executive Officer. The CODM reviews financial information presented on a consolidated basis for purposes of allocating resources and evaluating financial performance. The Company has one business activity, and there are no segment managers who are held accountable for operations, operating results or plans for levels or components below the consolidated unit level. Accordingly, the Company has determined that it has a single operating and reportable segment, which is to design, develop and market software for digital branding.
Total revenue from customers by location is defined based on the customers’ billing address. The following table summarizes total revenue from customers for the respective locations:
|
|
|
Years Ended |
|
|||||||||
|
|
|
December 31, |
|
|||||||||
|
|
|
2015 |
|
|
2014 |
|
|
2013 |
|
|||
|
United States |
|
$ |
146,294 |
|
|
$ |
78,686 |
|
|
$ |
38,196 |
|
|
All Other Countries |
|
|
34,402 |
|
|
|
35,557 |
|
|
|
19,018 |
|
|
Total revenue |
|
$ |
180,696 |
|
|
$ |
114,243 |
|
|
$ |
57,214 |
|
80
The following table summarized long-lived assets in the respective locations:
|
|
|
December 31, |
|
|||||
|
|
|
2015 |
|
|
2014 |
|
||
|
United States |
|
$ |
8,416 |
|
|
$ |
3,711 |
|
|
All Other Countries |
|
|
169 |
|
|
|
191 |
|
|
Total long-lived assets |
|
$ |
8,585 |
|
|
$ |
3,902 |
|
81
Item 9. Changes in and Disagreements With Accountants on Accounting and Financial Disclosure
None
Item 9A. Controls and Procedures
Evaluation of Disclosure Controls and Procedures
Our management, with the participation of our Chief Executive Officer and our Chief Financial Officer, evaluated the effectiveness of our disclosure controls and procedures as of December 31, 2015. The term “disclosure controls and procedures,” as defined in Rules 13a-15(e) and 15d-15(e) under the Exchange Act, means controls and other procedures of a company that are designed to ensure that information required to be disclosed by a company in the reports that it files or submits under the Exchange Act is recorded, processed, summarized and reported, within the time periods specified in the Securities and Exchange Commission’s rules and forms. Disclosure controls and procedures include, without limitation, controls and procedures designed to ensure that information required to be disclosed by a company in the reports that it files or submits under the Exchange Act is accumulated and communicated to the company’s management, including its principal executive and principal financial officers, as appropriate to allow timely decisions regarding required disclosure. Based on the evaluation of our disclosure controls and procedures as of December 31, 2015, our Chief Executive Officer and Chief Financial Officer concluded that, as of such date, our disclosure controls and procedures were effective at the reasonable assurance level.
Changes in Internal Control over Financial Reporting
There was no change in our internal control over financial reporting identified in connection with the evaluation required by Rule 13a-15(d) and 15d-15(d) of the Exchange Act that occurred during the fourth quarter of 2015 that has materially affected, or is reasonably likely to materially affect, our internal control over financial reporting.
Management's Report on Internal Control over Financial Reporting
Our management is responsible for establishing and maintaining adequate internal control over financial reporting (as defined in Rule 13a-15(f) under the Exchange Act). Our management conducted an assessment of the effectiveness of our internal control over financial reporting based on the criteria established in Internal Control - Integrated Framework (2013) issued by the Committee of Sponsoring Organizations of the Treadway Commission (COSO). Based on that assessment, our management has concluded that our internal control over financial reporting was effective as of December 31, 2015 to provide reasonable assurance regarding the reliability of financial reporting and the preparation of financial statements in accordance with GAAP.
Inherent Limitations on Effectiveness of Controls
Our disclosure controls and procedures and internal control over financial reporting are designed to provide reasonable assurance regarding the reliability of financial reporting and the preparation of financial statements in accordance with GAAP. However, our management, including our Chief Executive Officer and our Chief Financial Officer, does not expect that our disclosure controls and procedures will prevent or detect all errors and all fraud. A control system, no matter how well designed and operated, can provide only reasonable, not absolute, assurance that the objectives of the control system are met. Further, the design of a control system must reflect the fact that there are resource constraints and that management is required to apply judgment in evaluating the benefits of possible controls and procedures relative to their costs. Because of the inherent limitations in all control systems, no evaluation of controls can provide absolute assurance that all control issues and instances of fraud, if any, have been detected. Additionally, control systems may become inadequate because of changes in conditions or the degree of compliance with policies or procedures may deteriorate over time.
None
82
Item 10. Directors, Executive Officers and Corporate Governance.
The information called for by this item will be set forth in our Proxy Statement for the Annual Meeting of Stockholders to be filed with the SEC within 120 days of the fiscal year ended December 31, 2015 and is incorporated herein by reference.
Our board of directors has adopted a Code of Conduct and Ethics (“Code of Conduct”) applicable to all officers, directors and employees, which is available on our website (investor.tubemogul.com) under "Corporate Governance." We intend to satisfy the disclosure requirement under Item 5.05 of Form 8-K regarding amendment to, or waiver from, a provision of our Code of Conduct by posting such information on the website address and location specified above.
Item 11. Executive Compensation.
The information called for by this item will be set forth in our Proxy Statement for the Annual Meeting of Stockholders to be filed with the SEC within 120 days of the fiscal year ended December 31, 2015 and is incorporated herein by reference.
Item 12. Security Ownership of Certain Beneficial Owners and Management and Related Stockholder Matters.
The information called for by this item will be set forth in our Proxy Statement for the Annual Meeting of Stockholders to be filed with the SEC within 120 days of the fiscal year ended December 31, 2015 and is incorporated herein by reference.
Item 13. Certain Relationships and Related Transactions, and Director Independence.
The information called for by this item will be set forth in our Proxy Statement for the Annual Meeting of Stockholders to be filed with the SEC within 120 days of the fiscal year ended December 31, 2015 and is incorporated herein by reference.
Item 14. Principal Accounting Fees and Services.
The information required by this item will be set forth in our Proxy Statement for the Annual Meeting of Stockholders to be filed with the SEC within 120 days of the fiscal year ended December 31, 2015 and is incorporated herein by reference.
83
Item 15. Exhibits, Financial Statement Schedules.
|
(a) |
The following documents are filed as part of this Report: |
|
1. |
Our consolidated financial statements are listed in the “Index to Consolidated Financial Statements” under Part II, Item 8 of this Report. |
|
2. |
All schedules have been omitted because they are not required, not applicable, not present in amounts sufficient to require submission of the schedule, or the required information is otherwise included in our consolidated financial statements and related notes. |
|
3. |
The exhibits listed below in (b) are filed or incorporated by reference as part of this Report. |
|
(b) |
Exhibits: |
|
Exhibit |
|
|
|
Incorporated by Reference |
||||||||
|
Number |
|
Description |
|
Form |
|
File No. |
|
Exhibit(s) |
|
Filing Date |
|
Filed Herewith |
|
|
|
|
|
|
|
|
|
|
|
|
|
|
|
3.1 |
|
Amended and Restated Certificate of Incorporation of the Company |
|
10-Q |
|
001-36543 |
|
3.1 |
|
August 27, 2014 |
|
|
|
|
|
|
|
|
|
|
|
|
|
|
|
|
|
3.2 |
|
Amended and Restated Bylaws of the Company |
|
S-1/A |
|
333-194817 |
|
3.5 |
|
May 1, 2014 |
|
|
|
|
|
|
|
|
|
|
|
|
|
|
|
|
|
4.1 |
|
Form of common stock certificate of the Company |
|
S-1/A |
|
333-194817 |
|
4.1 |
|
May 1, 2014 |
|
|
|
|
|
|
|
|
|
|
|
|
|
|
|
|
|
4.2 |
|
Amended and Restated Investor Rights Agreement among the Company and certain holders of its common stock, dated December 10, 2012, as amended. |
|
S-1 |
|
333-194817 |
|
4.2 |
|
March 26, 2014 |
|
|
|
|
|
|
|
|
|
|
|
|
|
|
|
|
|
10.1* |
|
Form of Indemnification Agreement between the Company and each of its directors and executive officers. |
|
S-1 |
|
333-194817 |
|
10.1 |
|
March 26, 2014 |
|
|
|
|
|
|
|
|
|
|
|
|
|
|
|
|
|
10.2* |
|
2007 Equity Compensation Plan, as amended, and forms of agreement thereunder. |
|
S-1 |
|
333-194817 |
|
10.2 |
|
March 26, 2014 |
|
|
|
|
|
|
|
|
|
|
|
|
|
|
|
|
|
10.3* |
|
2014 Equity Incentive Plan, and forms of agreement thereunder. |
|
S-1/A |
|
333-194817 |
|
10.3 |
|
July 7, 2014 |
|
|
|
|
|
|
|
|
|
|
|
|
|
|
|
|
|
10.4* |
|
2014 Employee Stock Purchase Plan. |
|
S-1/A |
|
333-194817 |
|
10.4 |
|
May 1, 2014 |
|
|
|
|
|
|
|
|
|
|
|
|
|
|
|
|
|
10.5* |
|
Employment Offer Letter between the Company and Brett Wilson. |
|
S-1 |
|
333-194817 |
|
10.5 |
|
March 26, 2014 |
|
|
|
|
|
|
|
|
|
|
|
|
|
|
|
|
|
10.6* |
|
Employment Offer Letter between the Company and Chip Scovic. |
|
S-1 |
|
333-194817 |
|
10.7 |
|
March 26, 2014 |
|
|
|
|
|
|
|
|
|
|
|
|
|
|
|
|
|
10.7* |
|
Employment Offer Letter between the Company and Paul Joachim. |
|
10-K |
|
001-36543 |
|
10.7 |
|
March 31, 2015 |
|
|
|
|
|
|
|
|
|
|
|
|
|
|
|
|
|
10.8 |
|
Amended and Restated Loan and Security Agreement, by and between the Company and Silicon Valley Bank, dated as of August 21, 2013. |
|
S-1 |
|
333-194817 |
|
10.8 |
|
March 26, 2014 |
|
|
|
|
|
|
|
|
|
|
|
|
|
|
|
|
|
10.9 |
|
First Amendment to Amended and Restated Loan and Security Agreement, by and between the Company and Silicon Valley Bank, dated as of April 18, 2014. |
|
S-1/A |
|
333-194817 |
|
10.9 |
|
May 1, 2014 |
|
|
|
|
|
|
|
|
|
|
|
|
|
|
|
|
84
|
Exhibit |
|
|
|
Incorporated by Reference |
||||||||
|
Number |
|
Description |
|
Form |
|
File No. |
|
Exhibit(s) |
|
Filing Date |
|
Filed Herewith |
|
|
|
|
|
|
|
|
|
|
|
|
|
|
|
10.10 |
|
Second Amendment to Amended and Restated Loan and Security Agreement by and between the Company and Silicon Valley Bank, dated as of December 23, 2015. |
|
8-K |
|
001-36543 |
|
10.1 |
|
December 28, 2015 |
|
|
|
|
|
|
|
|
|
|
|
|
|
|
|
|
|
21.1 |
|
List of Subsidiaries of the Company. |
|
|
|
|
|
|
|
|
|
X |
|
|
|
|
|
|
|
|
|
|
|
|
|
|
|
23.1 |
|
Consent of Independent Registered Public Accounting Firm. |
|
|
|
|
|
|
|
|
|
X |
|
|
|
|
|
|
|
|
|
|
|
|
|
|
|
24.1 |
|
Power of Attorney (see signature page to this Report) |
|
|
|
|
|
|
|
|
|
X |
|
|
|
|
|
|
|
|
|
|
|
|
|
|
|
31.1 |
|
Certification of Principal Executive Officer required by Rule 13a-14(a) or Rule 15d-14(a) of the Securities Exchange Act of 1934, as adopted pursuant to Section 302 of the Sarbanes-Oxley Act of 2002. |
|
|
|
|
|
|
|
|
|
X |
|
|
|
|
|
|
|
|
|
|
|
|
|
|
|
31.2 |
|
Certification of Principal Financial Officer pursuant to Rule 13a-14(a) or Rule 15d-14(a) of the Securities Exchange Act of 1934, as adopted pursuant to Section 302 of the Sarbanes-Oxley Act of 2002. |
|
|
|
|
|
|
|
|
|
X |
|
|
|
|
|
|
|
|
|
|
|
|
|
|
|
32.1** |
|
Certification of Chief Executive Officer pursuant to 18 U.S.C. Section 1350, as adopted pursuant to Section 906 of the Sarbanes-Oxley Act of 2002. |
|
|
|
|
|
|
|
|
|
X |
|
|
|
|
|
|
|
|
|
|
|
|
|
|
|
32.2** |
|
Certification of Chief Financial Officer pursuant to 18 U.S.C. Section 1350, as adopted pursuant to Section 906 of the Sarbanes-Oxley Act of 2002. |
|
|
|
|
|
|
|
|
|
X |
|
|
|
|
|
|
|
|
|
|
|
|
|
|
|
101.INS |
|
XBRL Instance Document. |
|
|
|
|
|
|
|
|
|
X |
|
|
|
|
|
|
|
|
|
|
|
|
|
|
|
101.SCH |
|
XBRL Taxonomy Extension Schema Document. |
|
|
|
|
|
|
|
|
|
X |
|
|
|
|
|
|
|
|
|
|
|
|
|
|
|
101.CAL |
|
XBRL Taxonomy Extension Calculation Linkbase Document. |
|
|
|
|
|
|
|
|
|
X |
|
|
|
|
|
|
|
|
|
|
|
|
|
|
|
101.DEF |
|
XBRL Taxonomy Extension Definition Linkbase Document. |
|
|
|
|
|
|
|
|
|
X |
|
|
|
|
|
|
|
|
|
|
|
|
|
|
|
101.LAB |
|
XBRL Taxonomy Extension Label Linkbase Document. |
|
|
|
|
|
|
|
|
|
X |
|
|
|
|
|
|
|
|
|
|
|
|
|
|
|
101.PRE |
|
XBRL Taxonomy Extension Presentation Linkbase Document. |
|
|
|
|
|
|
|
|
|
X |
|
* |
Indicates a management contract or compensatory plan. |
|
** |
This certification is deemed furnished not filed for purposes of Section 18 of the Securities Exchange Act of 1934, as amended (Exchange Act), or otherwise subject to the liability of that section, nor shall it be deemed incorporated by reference into any filing under the Securities Act of 1933, as amended, or the Exchange Act. |
85
Pursuant to the requirements of Section 13 or 15(d) of the Securities Exchange Act of 1934, as amended, the Registrant has duly caused this Annual Report on Form 10-K to be signed on its behalf by the undersigned, thereunto duly authorized.
|
|
|
|
TUBEMOGUL, INC. |
||
|
|
|
|
|
|
|
|
Date: March 10, 2016 |
|
|
By: |
|
/s/ Brett Wilson |
|
|
|
|
|
|
Brett Wilson |
|
|
|
|
|
|
President and Chief Executive Officer |
POWER OF ATTORNEY
KNOW ALL PERSONS BY THESE PRESENTS, that each person whose signature appears below constitutes and appoints Brett Wilson and Paul Joachim, jointly and severally, his attorneys-in-fact, each with the power of substitution, for him in any and all capacities, to sign any amendments to this Annual Report on Form 10-K, and to file the same, with exhibits thereto and other documents in connection therewith, with the Securities and Exchange Commission, hereby ratifying and confirming all that each of said attorneys-in-fact, or his substitute or substitutes, may do or cause to be done by virtue hereof.
Pursuant to the requirements of the Securities Exchange Act of 1934, as amended, this Annual Report on Form 10-K has been signed below by the following persons on behalf of the Registrant in the capacities and on the dates indicated.
|
Signature |
|
Title |
|
Date |
|
/s/ Brett Wilson |
|
President, Chief Executive Officer and Director (Principal Executive Officer) |
|
March 10, 2016 |
|
Brett Wilson |
|
|
|
|
|
/s/ Paul Joachim |
|
Chief Financial Officer (Principal Financial Officer and Principal Accounting Officer) |
|
March 10, 2016 |
|
Paul Joachim |
|
|
|
|
|
/s/ David Toth |
|
Director |
|
March 10, 2016 |
|
David Toth |
|
|
|
|
|
/s/ Ajay Chopra |
|
Director |
|
March 10, 2016 |
|
Ajay Chopra |
|
|
|
|
|
/s/ Ashu Garg |
|
Director |
|
March 10, 2016 |
|
Ashu Garg |
|
|
|
|
|
/s/ Russell Fradin |
|
Director |
|
March 10, 2016 |
|
Russell Fradin |
|
|
|
|
|
/s/ Jack Lazar |
|
Director |
|
March 10, 2016 |
|
Jack Lazar |
|
|
|
|
86