Attached files
| file | filename |
|---|---|
| EX-21.1 - EXHIBIT 21.1 - Rouse Properties, LLC | q4-12312015xex211.htm |
| EX-31.1 - EXHIBIT 31.1 - Rouse Properties, LLC | q4-12312015xex311.htm |
| EX-32.1 - EXHIBIT 32.1 - Rouse Properties, LLC | q4-12312015xex321.htm |
| EX-32.2 - EXHIBIT 32.2 - Rouse Properties, LLC | q4-12312015xex322.htm |
| EX-31.2 - EXHIBIT 31.2 - Rouse Properties, LLC | q4-12312015xex312.htm |
| EX-10.22 - EXHIBIT 10.22 - Rouse Properties, LLC | q4-12312015xex1022.htm |
| EX-23.1 - EXHIBIT 23.1 - Rouse Properties, LLC | q4-12312015xex231.htm |
UNITED STATES
SECURITIES AND EXCHANGE COMMISSION
Washington, D.C. 20549
FORM 10-K
x | Annual report pursuant to Section 13 or 15(d) of the Securities Exchange Act of 1934 |
For the fiscal year ended December 31, 2015
or
o | Transition report pursuant to Section 13 or 15(d) of the Securities Exchange Act of 1934 |
For the Transition Period from to
COMMISSION FILE NUMBER 001-35287
ROUSE PROPERTIES, INC.
(Exact name of registrant as specified in its charter)
Delaware | 90-0750824 | |
(State or other jurisdiction of | (I.R.S. Employer | |
incorporation or organization) | Identification Number) | |
1114 Avenue of the Americas, Suite 2800, New York, NY | 10036 | |
(Address of principal executive offices) | (Zip Code) | |
(212) 608-5108
(Registrant’s telephone number, including area code)
Securities registered pursuant to Section 12(b) of the Act:
Title of Each Class | Name of Each Exchange on Which Registered | |
Shares of common stock, $0.01 par value | New York Stock Exchange | |
Securities registered pursuant to Section 12(g) of the Act: None
Indicate by check mark if the registrant is a well-known seasoned issuer, as defined in Rule 405 of the Securities Act. o Yes ý No
Indicate by check mark if the registrant is not required to file reports pursuant to Section 13 or Section 15(d) of the Act. o Yes ý No
Indicate by check mark whether the registrant (1) has filed all reports required to be filed by Section 13 or 15(d) of the Securities Exchange Act of 1934 (the “Exchange Act”) during the preceding 12 months (or for such shorter period that the registrant was required to file such reports), and (2) has been subject to such filing requirements for the past 90 days. x Yes o No
Indicate by check mark whether the registrant has submitted electronically and posted on its corporate Web site, if any, every Interactive Data File required to be submitted and posted pursuant to Rule 405 of Regulation S-T (§232.405 of this chapter) during the preceding 12 months (or for such shorter period that the registrant was required to submit and post such files). x Yes o No
Indicate by check mark if disclosure of delinquent filers pursuant to Item 405 of Regulation S-K (§229.405 of this chapter) is not contained herein, and will not be contained, to the best of registrant's knowledge, in definitive proxy or information statements incorporated by reference in Part III of this Form 10-K or any amendments to this Form 10-K. o
Indicate by check mark whether the registrant is a large accelerated filer, an accelerated filer, a non-accelerated filer or a smaller reporting company.
Large accelerated filer o | Accelerated filer ý | Non-accelerated filer o (Do not check if a smaller reporting company) | Smaller reporting company o | |||
Indicate by check mark whether the registrant is a shell company (as defined in Rule 12b-2 of the Exchange Act). o Yes ý No
The aggregate market value of shares of common stock held by non-affiliates of the Registrant was approximately $616.8 million based on the closing sale price of the New York Stock Exchange for such stock on June 30, 2015.
The number of shares of common stock, $0.01 par value, outstanding on February 26, 2016 was 57,855,034.
Documents Incorporated By Reference
Document | Parts Into Which Incorporated | |
Definitive Proxy Statement for 2016 Annual Meeting of Stockholders or Annual Report on Form 10-K/A | Part III | |
ROUSE PROPERTIES, INC
Annual Report on Form 10-K
December 31, 2015
TABLE OF CONTENTS
Item No. | PAGE NUMBER | ||
1. | |||
1A. | |||
1B. | |||
2. | |||
3. | |||
4. | |||
5. | |||
6. | |||
7. | |||
7A. | |||
8. | |||
9. | |||
9A. | |||
9B. | |||
10. | |||
11. | |||
12. | |||
13. | |||
14. | |||
15. | |||
2
CAUTIONARY STATEMENT REGARDING FORWARD-LOOKING STATEMENTS
This Annual Report on Form 10-K (this "Annual Report") contains certain forward-looking statements, including, without limitation, statements concerning our operations, economic performance and financial condition. Forward-looking statements give our current expectations relating to our financial condition, results of operations, plans, objectives, future performance and business. You can identify forward-looking statements by the fact that they do not relate strictly to current or historical facts. These statements may include words such as "anticipate," "estimate," "expect," "project," "forecast," "plan," "intend," "believe," "may," "should," "would," "could," "likely," and other words of similar expression. These forward-looking statements are made pursuant to the safe harbor provisions of the Private Securities Litigation Reform Act of 1995.
Forward-looking statements should not be unduly relied upon. They give our expectations about the future and are not guarantees. These statements involve known and unknown risks, uncertainties and other factors that may cause our actual results, performance and achievements to materially differ from any future results, performance and achievements expressed or implied by such forward-looking statements. We caution you, therefore, not to rely on these forward-looking statements.
In this Annual Report, for example, we make forward-looking statements discussing our expectations about:
• future repositioning and redevelopment opportunities;
• expectations regarding returns on acquisitions and developments;
• expectations of our revenues, income, funds from operations ("FFO"), core FFO ("Core FFO"), net operating income ("NOI"), core NOI ("Core NOI"), capital expenditures, income tax and other contingent liabilities, dividends, leverage, capital structure or other financial items;
• expectations and achievement of our goals regarding our occupancy levels and rents;
• future liquidity; and
• future management plans.
Factors that could cause actual results to differ materially from those expressed or implied by the forward-looking statements include:
• our limited operating history as an independent company;
• our inability to obtain operating and development capital;
• our inability to reposition and redevelop some of our properties;
• adverse economic conditions in the retail sector;
• our inability to lease or re-lease space in our properties;
• the inability of our tenants to pay minimum rents and expense recovery charges and the impact of co-tenancy provisions in our leases;
• our inability to sell real estate quickly and restrictions on transfer;
• our inability to compete effectively;
• our level of indebtedness;
• the adverse effect of inflation;
• our inability to maintain our status as a real estate investment trust ("REIT");
• our directors and officers may change our current long-range plans; and
• the other risks described in "Risk Factors."
In light of these risks and uncertainties, there can be no assurances that the results referred to in the forward-looking statements contained in this Annual Report will in fact occur. Except to the extent required by applicable law or regulation, we undertake no obligation to, and expressly disclaim any such obligation to, update or revise any forward-looking statements to reflect changed assumptions, the occurrence of anticipated or unanticipated events, changes to future results over time or otherwise.
3
PART I
ITEM 1. BUSINESS
Throughout this Annual Report, references to the "Company," "Rouse Properties," "Rouse," "we", "us", and "our" refer to Rouse Properties, Inc. and its consolidated subsidiaries, unless the context requires otherwise. Rouse Properties, a Delaware corporation, was organized in August 2011 and became a separate public company when we were spun-off from General Growth Properties, Inc. ("GGP") on January12, 2012.
As of December 31, 2015, our portfolio consisted of 36 malls and retail centers in 21 states totaling over 24.9 million square feet of retail space. We believe many of these malls function as town centers and are predominately located in markets or sub-markets that contain no other enclosed malls and have a high penetration of the trade area. In addition, our portfolio includes regional malls that we believe have significant growth potential through lease-up, repositioning and/or redevelopment. Some properties may require re-tenanting and re-constitution of the merchandising mix in order to provide new and relevant shopping and entertainment opportunities for the consumer.
Our principal focus is to own and manage dominant regional malls in protected markets or submarkets in the United States, in such locations that the malls are either market dominant (the only mall within an extended distance) or trade area dominant (the premier mall serving the defined regional consumer). Approximately 80% of our 36 mall assets are the only enclosed malls in their markets or submarkets. We seek to increase the value of our properties by executing individually tailored business plans designed to improve their operating performance. We actively manage all of our properties, performing the day-to-day functions, operations, leasing, maintenance, marketing and promotional services. Our platform is national in scope and we believe that it positions us to capitalize on existing department store, junior anchor and broad in-line retailer relationships across our portfolio.
Our malls are anchored by operators across the retail spectrum, including department stores such as Dick's Sporting Goods, TJ Maxx, Ross Stores, Macy's, Dillard's, Belk, JCPenney, Sears and Target; mall shop tenants like Victoria's Secret, Bath & Body Works, H&M, Forever 21, Francesca's, Chico's, Foot Locker, Maurice's, Justice and Ulta; restaurants ranging from food court leaders like Chick-fil-A and Panda Express to fast-casual chains like Chipotle, Panera Bread and Starbucks and high volume sit down restaurants such as BJ's Restaurant, Olive Garden, Red Lobster and Buffalo Wild Wings; movie theaters like Cinemark, AMC and Regal. The tenant mix within our property portfolio is also balanced, with no single tenant representing more than 5% of our total revenue in 2015.
We elected to be treated as a REIT beginning with the filing of our federal income tax return for the 2011 taxable year. Subject to our ability to meet the requirements of a REIT, we intend to maintain this status in future periods.
For the year ended December 31, 2015, we generated net income, operating income, NOI, Core NOI, FFO, and Core FFO of $40.7 million, $52.3 million, $191.7 million, $197.3 million, $87.8 million and $104.0 million, respectively. See "Selected Financial Data" for a discussion of our use of NOI, Core NOI, FFO, and Core FFO, which are non-GAAP financial measures, and for reconciliations of net income (loss) to NOI and Core NOI and net income (loss) to FFO and Core FFO.
A more detailed summary of our portfolio is presented under "Properties."
On January 16, 2016, our Board of Directors received a written, unsolicited, non-binding proposal from Brookfield Asset Management Inc. (“Brookfield Asset Management” and, together with its affiliates, “Brookfield”) on behalf of a real estate fund managed by Brookfield Asset Management, to acquire all the outstanding shares of our common stock, other than those shares currently held by Brookfield, collectively the beneficial owners of approximately 33.5% of our outstanding shares of common stock, for a purchase price of $17.00 per share in cash. Our Board of Directors established a special committee of the Board (the “Special Committee”), comprised of all of the directors of the Board, other than those directors who are also representatives of Brookfield, to, among other matters, evaluate and negotiate the Brookfield proposal, solicit other proposals and/or evaluate alternatives to the Brookfield proposal, as determined by the Special Committee in its sole discretion.
On February 25, 2016, we entered into a definitive merger agreement to be acquired by affiliates of Brookfield Asset Management for $18.25 per share in an all-cash transaction, a portion of which may be paid out as a special dividend. Under the terms of the merger agreement, Brookfield will acquire all of the outstanding shares of our common stock, other than those shares currently held by Brookfield Property Partners L.P. and its affiliates, in a transaction valued at approximately $2.8 billion, including our indebtedness. The merger agreement prohibits the payment of any further dividends by us, other than as necessary to maintain our REIT status and a closing dividend as part of the $18.25 per share consideration payable in the transaction. The purchase price represents a premium of approximately 35% over our closing stock price on January 15, 2016, the last trading day prior to Brookfield’s announcement of the proposal to acquire us. The Special Committee unanimously approved the merger agreement.
4
Completion of the transaction is expected to occur in the third quarter of 2016, and is contingent upon customary closing conditions, including the approval of the holders of a majority of the outstanding shares of our common stock and a majority of the outstanding shares of our common stock not currently held by Brookfield Property Partners L.P. and its affiliates. Brookfield Property Partners L.P. and its affiliates have agreed to vote in favor of the transaction. The transaction is not subject to a financing contingency.
Reference is made to our Current Report on Form 8-K filed on February 29, 2016 for a summary of the material terms of the merger agreement and other related agreements, which summary is incorporated herein by reference. Please also review Item 1A. Risk Factors —“Risks Related to Brookfield’s Proposed Acquisition of Our Company—There are risks and uncertainties as a result of Brookfield’s proposed acquisition of us” in this Annual Report for a discussion of certain risks relating to the transaction.
Competitive Strengths
We believe that we will continue to distinguish ourselves through the following competitive strengths:
Size and Geographic Scope. We have a nationally diversified mall portfolio consisting of 36 properties located in 21 states, with over 24.9 million square feet of retail space (7.3 million square feet of which is owned by anchor tenants). Our portfolio was 90.9% leased excluding anchors (95.7% leased including anchors) and 88.5% occupied excluding anchors as of December 31, 2015. The average distance between our malls and the nearest, competitive, enclosed mall is approximately 49 miles.
Strategic Relationships with Tenants. Our operations are national in scope and we have relationships with a wide range of tenants, which include department stores, junior anchors, movie theaters, national in-line tenants and local retailers. We believe that these relationships provide us with a competitive advantage in many of our markets.
As of December 31, 2015, our tenants that generate revenues equal to or exceeding 1.5% of our aggregate revenues are as follows:
Tenant | % of Aggregate Revenues | |
L Brands, Inc. | 4.3% | |
Foot Locker, Inc. | 3.5% | |
Signet Jewelers Limited | 3.3% | |
JCPenney Company, Inc. | 2.6% | |
Cinemark USA, Inc. | 2.1% | |
Sears Holdings Corporation | 2.0% | |
American Eagle Outfitters, Inc. | 1.7% | |
Genesco Inc. | 1.7% | |
Ascena Retail Group, Inc. | 1.7% | |
Macy's, Inc. | 1.7% | |
Luxottica Retail North America Inc. | 1.5% | |
Experienced Operational Management Team. We believe that, under the leadership of our executive management team, we are well positioned to execute our strategic plans and unlock value in our properties. Our management team includes:
• | Andrew Silberfein, our President and Chief Executive Officer. Mr. Silberfein has served as our President and Chief Executive Officer since January 2, 2012 and has served as a director since January 12, 2012. Mr. Silberfein previously held the position of Executive Vice President—Retail and Finance for Forest City Ratner Companies, where he was employed for over 15 years, from 1995 to 2011. Mr. Silberfein was responsible for managing all aspects of Forest City Ratner Companies' retail portfolio of shopping centers and malls. Also, Mr. Silberfein had the overall responsibility for managing all aspects of Forest City Ratner Companies' debt and equity financing requirements for its real estate portfolio. |
• | Brian Harper, our Chief Operating Officer. Mr. Harper has served as our Chief Operating Officer since April 22, 2015 and previously held the position of Executive Vice President of Leasing since January 12, 2012. Mr. Harper previously served as Senior Vice President of Leasing for GGP, where he was employed for over five years. While there, Mr. Harper oversaw all of the leasing efforts for a multi-state portfolio. He also was one of the original key members of our formation within GGP. Mr. Harper has over 16 years of experience in the retail real estate industry, including working with ground up development, asset repositions, distressed real estate and leasing. |
5
• | John Wain, our Chief Financial Officer. Mr. Wain has served as our Chief Financial Officer since October 3, 2012. Mr. Wain previously held the position of Managing Director and Head of Real Estate Americas at Credit Agricole Corporate and Investment Bank, where he was employed for eight years. At Credit Agricole, Mr. Wain was responsible for its U.S. real estate lending business and focused extensively on structuring and negotiating secured and unsecured corporate real estate facilities and property-level loans for public REITs. Mr. Wain has over 27 years of experience in the real estate and banking industries. |
• | Susan Elman, our Executive Vice President and General Counsel. Ms. Elman has served as our Executive Vice President, General Counsel and Secretary since April 5, 2012. Ms. Elman previously served as Senior Vice President and Deputy General Counsel at Forest City Ratner Companies, where she was employed for over 15 years. Ms. Elman has over 27 years of experience in the real estate industry and was responsible for the legal aspects of many complex real estate transactions at Forest City Ratner Companies. |
Favorable Economic and Industry Trends. We believe that we are positioned to benefit from positive economic and demographic trends in our markets, including anticipated growth in the number of households and household income in our markets and historically greater declines in unemployment in our markets as compared to the U.S. overall.
Track Record of Improving Occupancy Levels and Leasing. As of December 31, 2015, we have signed 8.9 million square feet of total in-line leases since we became a separate stand alone public company in January 2012. From that time, our portfolio's leased percentage increased from 87.7% to 90.9% excluding anchors (95.7% leased including anchors) as of December 31, 2015. During that same period, we have significantly increased the portion of our portfolio leased by permanent tenants by an additional 7.1% to 81.0%.
As of December 31, 2015, we have entered into new leases for over 1.1 million square feet of space, which is signed but not yet opened, representing approximately $15.2 million in incremental annual rent scheduled to commence throughout 2016 and 2017. The actual commencement of the payment of rent under certain of these leases is subject to the completion of the build-out of space and retailers' opening schedules.
We have also been successful at leasing anchor space. Since formation, we have leased 12 vacant anchor stores as of December 31, 2015. Replacement tenants include Regal Cinemas, Cinemark, Sports Authority, Sportsman's Warehouse, AMC, Bon-Ton and Dunham's Sports.
Platform for Attractive External Growth. We have closed approximately $1.1 billion of acquisitions since we became a separate public company in January 2012. Our completed acquisitions have included opportunistic and strategic purchases of ten malls and retail centers, nine of which are 100% owned and one joint venture in which we own a 52.8% controlling interest, as well as six anchor boxes. We target assets where we believe we are exposed to limited downside and significant growth opportunities by applying our national platform and expertise to improve retailer quality and composition, occupancy levels, NOI and sales productivity metrics.
Business Strategy
Our objective is to achieve growth in NOI, Core NOI, FFO and Core FFO by leasing, operating and repositioning retail properties with locations that are either market dominant (the only mall within an extended distance to service the trade area) or trade area dominant (positioned to be the premier mall serving the defined regional consumer). We seek to deliver an appropriate tenant mix, higher occupancy rates and increased sales productivity, resulting in higher minimum rents while continuing to control costs. In order to achieve our objective and to become a national leader in the regional mall space, we intend to further implement the following strategies:
Internal Growth through Tailored Strategic Planning and Investment. We have identified both strategic investment and cosmetic investment initiatives for our properties, taking into account customer demographics and the competitive environment of each property's market area, with a focus on increasing occupancy at the mall with a sustainable occupancy cost. We have identified opportunities to invest significant capital to reposition and refresh certain of our properties, and we intend to sequence our strategic capital projects based on leasing activity. When considering strategic investments at our properties, we generally target unlevered returns of 9% to 11% for such projects under current market conditions (although there can be no assurance that we will meet this target). Examples of value creation initiatives include, but are not limited to:
• | Re-tenanting vacant anchor space and transforming excess or under productive in-line gross leasable area ("GLA") into big box space to meet the customer demand for uses such as apparel, sporting goods, theaters, fitness centers, and supermarkets; |
• | Growing customer traffic by adding high-volume restaurants, entertainment and everyday uses; and |
6
• | Enhancing the shopping experience and maximizing market relevance by aggressively targeting tenants that cater to market demographics. |
We also seek to improve the overall mall experience by creating a sense of place and increasing the frequency and duration of visits to our malls. We have commenced a number of portfolio-wide initiatives including having installed state of the art Wi-Fi throughout all of the common areas, upgraded our common area amenities, created new modern soft seating environments and installed energy management systems to maximize efficiency. We believe these initiatives will continue to position our properties for increased occupancy and sales levels and financial growth. For a discussion of factors that could have an impact on our ability to realize these goals, see "Risk Factors" and "Cautionary Statement Regarding Forward-Looking Statements."
Improve Tenant Mix and the Performance of Our Properties. We are proactively optimizing the tenant mix of our malls by matching it to the consumer shopping patterns and the needs and desires of the demographics in a particular market area, which strengthens our competitive position and increases tenant sales and consumer traffic. Additionally, we continually seek to convert space occupied by temporary tenants to permanent tenants. To drive increasing traffic and sales, our targeted leasing approach is focused on adding entertainment tenants, high-volume restaurants, everyday uses and big-box anchors to further enhance the overall experience for our shoppers.
External Growth through Opportunistic and Strategic Acquisitions. We intend to continue to target retail assets that we believe can provide significant growth opportunities given our expertise in improving retailer quality and composition, occupancy levels, NOI and sales productivity metrics, but have limited downside due to their location in protected markets.
Leverage Our National Platform. National retailers benefit from our national platform for leasing, which provides them with high quality service and efficiency for negotiating leases at multiple locations with just one landlord. This national platform helps position our properties as attractive destinations for retailers. We utilize national contracts with certain vendors and suppliers for goods and services we obtain at generally more favorable terms than individual contracts.
Focus on Improvement of Key Leasing Metrics. As of December 31, 2015, our portfolio sales per square foot were $345 and percentage leased and percentage occupied were approximately 90.9% (95.7% leased including anchors) and 88.5%, respectively. Our leasing team employs a decentralized approach, with focused leasing strategies individually tailored to each asset.
Transactions
During 2015, we successfully completed transactions promoting our long-term strategy as a mall and retail center owner and operator:
Acquisitions
• | Acquired Mt. Shasta Mall located in Redding, CA for a total purchase price of approximately $49.0 million, net of closing costs and adjustments. In conjunction with the closing of this transaction, we closed on a new $31.9 million non-recourse mortgage loan that bears interest at 4.19%, matures in March 2025, is interest only for the first three years and amortizes over 30 years thereafter; |
• | Acquired Fig Garden Village located in Fresno, CA for a total purchase price of approximately $106.1 million, net of closing costs and adjustments. In conjunction with the closing of this transaction, we closed on a new $74.2 million non-recourse mortgage loan that bears interest at 4.14%, matures in June 2025, is interest only for the first five years and amortizes over 30 years thereafter; and |
• | Acquired The Shoppes at Carlsbad located in Carlsbad, CA for a total purchase price of approximately $170.0 million, net of closing costs and adjustments. In conjunction with the closing of this transaction, Rouse Properties, L.P., our operating partnership (the "Operating Partnership"), issued $140.0 million of its Series A Preferred Units of limited partnership interest (the "Series A Preferred Units") to the seller. Distributions on the Series A Preferred Units accumulate at an annual rate of 5% and are payable quarterly. The Series A Preferred Units may be redeemed by us after three years (subject to certain tax protection payments if we redeem the Series A Preferred Units prior to 2022) and by the holder after ten years, in either case at par plus accumulated and unpaid distributions and in the form of cash or common units of limited partnership interest ("Common Units") of the Operating Partnership, as determined by us. For further detail see Note 10 to our Consolidated Financial Statements. |
7
Refinancings
• | Exercised a portion of the "accordion feature" on our 2013 Senior Facility (as defined below), increasing the 2013 Term Loan (as defined below) from $260.0 million to $285.0 million and increasing the availability on the 2013 Revolver (as defined below) from $285.0 million to $310.0 million. |
• | Refinanced the mortgage loan associated with NewPark Mall for $135.0 million, with an initial funding of $114.3 million. The loan provides for an additional funding of up to $20.8 million upon achieving certain conditions. The loan bears interest at a floating rate of LIBOR (30 day) plus 210 basis points, has an initial maturity of September 2018 with a one year extension option. The loan is interest only during the first three years and amortizes over 30 years thereafter. An interest rate swap became effective on this loan beginning January 1, 2016, which fixed the interest rate at 3.26%, through September 2018. This loan replaced a $64.7 million non-recourse mortgage loan which had a floating rate of LIBOR (30 day) plus 235 basis points. |
• | Refinanced the mortgage loan associated with Greenville Mall with a new non-recourse mortgage loan for $45.5 million, which bears interest at a fixed rate of 4.46%, matures in November 2025, and amortizes over 30 years. This loan replaced a $40.2 million non-recourse mortgage loan which had a fixed interest rate of 5.29%. |
• | Refinanced the loan associated with The Shoppes at Bel Air with a new non-recourse mortgage loan for $120.0 million. The initial funding of $110.5 million was used to retire the outstanding mortgage loan of $109.5 million, which had a fixed interest rate of 5.30%. The loan provides for an additional subsequent funding of $9.5 million upon achieving certain conditions. The loan has an initial maturity of November 2018 and a one year extension option. The loan bears interest at a floating rate of LIBOR (30 day) plus 235 basis points and is interest only for the first two years. We entered into an interest rate swap on this loan commencing in January 2016, which fixed the interest rate at 3.34% through November 2018. |
• | Removed The Shoppes at Gateway from the 2013 Senior Facility collateral pool and placed a new $75.0 million non-recourse mortgage loan on the property. The loan bears interest at a floating rate of LIBOR (30 day) plus 220 basis points, has an initial maturity of January 2020 with a one year extension option and is interest only for the first four years. We entered into an interest rate swap on the loan which fixed the interest rate at 3.64% through January 2020. In connection with the removal of The Shoppes at Gateway from the 2013 Senior Facility, The Shoppes at Carlsbad was added to the 2013 Senior Facility collateral pool with no change to the outstanding 2013 Senior Facility balance. |
Competition
The nature and extent of the competition we face varies from property to property. Our direct competitors include other publicly-traded REITs, retail real estate companies, commercial property developers, internet retail sales and other owners of retail real estate that engage in similar businesses.
Within our portfolio of retail properties, we compete for retail tenants. We believe the principal factors that retailers consider in making their leasing decisions include:
• | consumer demographics; |
• | quality, design and location of properties; |
• | total number and geographic distribution of properties; |
• | diversity of retailers and anchor tenants at shopping center locations; |
• | management and operational expertise; and |
• | rental rates. |
Because our revenue potential is linked to the success of our retailers, we indirectly share exposure to the same competitive factors that our retail tenants experience in their respective markets when trying to attract individual shoppers. These dynamics include general competition from other regional shopping malls, including outlet malls and other discount shopping malls, as well as competition from discount shopping clubs, catalog companies, and internet retailers.
We actively manage our portfolio and continue to enhance the quality and desirability of our regional malls. The recent challenging economic conditions have resulted in suspensions and cancellations of many new mall projects, reducing an already small pipeline. While we operate on a smaller scale than many of our competitors, we believe that our enhanced portfolio and the lack of an alternative pipeline makes us appealing for retailers who are reevaluating their positioning within their respective market areas.
8
Environmental
Under various federal, state or local laws, ordinances and regulations, a current or previous owner or operator of real estate may be required to investigate and clean up hazardous or toxic substances released at a property and may be held liable to third parties for bodily injury or property damage (investigation and/or clean-up costs) incurred by the parties in connection with the contamination. These laws often impose liability without regard to whether the owner or operator knew of or otherwise caused the release of the hazardous or toxic substances. In addition, persons who arrange for the disposal or treatment of hazardous substances or other regulated materials may be liable for the costs of removal or remediation of such substances at a disposal or treatment facility, whether or not such facility is owned or operated by such person. The costs of remediation or removal of such substances may be substantial and the presence of contamination or the failure to remediate contamination discovered at our properties may adversely affect our ability to sell, lease or borrow with respect to the real estate. The operations of current and former tenants at our properties have involved, or may have involved, the use of hazardous materials or generated hazardous wastes. The release of such hazardous materials and wastes could result in our incurring liabilities to remediate any resulting contamination if the responsible party is unable or unwilling to do so. In addition, our properties may be exposed to the risk of contamination originating from other sources. While a property owner generally is not responsible for remediating contamination that has migrated on-site from an off-site source, the contaminant's presence can have adverse effects on operations and redevelopment of our properties. Environmental laws also may create liens on contaminated sites in favor of the government for damages and costs it incurs to address such contamination. Moreover, if contamination is discovered on our properties, environmental laws may impose restrictions on the manner in which that property may be used or how businesses may be operated on that property. Our properties have been subjected to varying degrees of environmental assessment at various times; however, the identification of new areas of contamination, a change in the extent or known scope of contamination or changes in cleanup requirements could result in significant costs to us.
A further discussion of the current effects and potential future impacts on our business and properties of compliance with federal, state and local environmental regulations is presented in this Annual Report under "Risks Factors—Risks Related to our Business—We could incur significant costs related to government regulation and litigation over environmental matters and various other federal, state and local regulatory requirements."
Seasonality
Although we have a year-long temporary leasing program, occupancies for short-term tenants and, therefore, rental income recognized are higher during the second half of the year. In addition, the majority of our tenants have December or January lease years for purposes of calculating annual overage rent amounts. Accordingly, overage rent thresholds are most commonly achieved in the fourth quarter. As a result, revenue production is generally highest in the fourth quarter of each year.
Employees
As of February 26, 2016, we had approximately 332 employees.
Insurance
We have comprehensive liability, fire, flood, extended coverage and rental loss insurance with respect to our portfolio of retail properties. Our management believes that such insurance provides adequate coverage.
Qualification as a Real Estate Investment Trust and Taxability of Distributions
Rouse Properties elected to be qualified as a REIT. As a REIT, we are not subject to federal income tax on our real estate investment trust taxable income so long as, among other requirements, certain distribution requirements are met with respect to such income. See "Item 1A. Risk Factors—Risks Related to our Status as a REIT".
Segment Disclosure
Refer to our discussion on segment disclosure in Note 1 to our Consolidated Financial Statements included elsewhere in this Annual Report.
9
Investor Information
Our website address is www.rouseproperties.com. Our Securities and Exchange Commission ("SEC") filings and amendments thereto filed or furnished pursuant to Section 13(a) or 15(d) of the Securities Exchange Act of 1934 (the "Exchange Act"), including our annual, quarterly, and current reports on Forms 10-K, 10-Q, and 8-K, respectively, and our proxy statements, are available or may be accessed free of charge through the "Investors" section of our website as soon as reasonably practicable after we electronically file such material with, or furnish it to, the SEC. Our website and included or linked information on the website are not intended to be incorporated into this Annual Report. Additionally, the public may read and copy any materials we file with the SEC at the SEC's Public Reference Room at 100 F Street, NE, Washington, DC 20549, and may obtain information on the operation of the Public Reference Room by calling the SEC at 1-800-SEC-0330. The SEC maintains an Internet site that contains reports, proxy and information statements, and other information regarding issuers that file electronically with the SEC, which can be accessed at www.sec.gov.
ITEM 1A. RISK FACTORS
You should carefully consider the risks described below in addition to all other information provided to you in this Annual Report. Any of the following risks could materially and adversely affect our business, financial condition, results of operations and prospects.
Risks Related to Brookfield’s Proposed Acquisition of our Company
There are risks and uncertainties as a result of Brookfield’s proposed acquisition of us.
As described above, on February 25, 2016, we entered into a definitive merger agreement to be acquired by affiliates of Brookfield Asset Management for $18.25 per share in an all-cash transaction. Under the terms of the merger agreement, Brookfield will acquire all of the outstanding shares of our common stock, other than those shares currently held by Brookfield Property Partners L.P. and its affiliates, in a transaction valued at approximately $2.8 billion, including our indebtedness. The merger agreement prohibits the payment of any further dividends by us, other than as necessary to maintain our REIT status and a closing dividend as part of the $18.25 per share consideration payable in the transaction. The Special Committee of our Board of Directors unanimously approved the merger agreement. Completion of the transaction is expected to occur in the third quarter of 2016, and is contingent upon customary closing conditions, including the approval of the holders of a majority of the outstanding shares of our common stock and a majority of the outstanding shares of our common stock not currently held by Brookfield Property Partners L.P. and its affiliates.
There are a number of risks and uncertainties relating to Brookfield’s proposed acquisition of us. For example, the proposed acquisition may not be consummated in the timeframe or manner currently anticipated or may not be consummated at all, as a result of several factors, including, among other things, the occurrence of any event, change or other circumstances that could give rise to the termination of the merger agreement, including a termination under circumstances that would require us to pay a termination fee, as described below. In addition, there can be no assurance that the approval by the holders of a majority of the outstanding shares of our common stock or a majority of the outstanding shares of our common stock not currently held by Brookfield Property Partners L.P. and its affiliates will be obtained, that the other conditions to closing will be satisfied or waived or that other events will not intervene to delay or result in the termination of the proposed acquisition. Further, Brookfield could default on its obligations under the merger agreement. Any delay in closing or a failure to close could materially and adversely affect our business and stock price as well as our relationships with our tenants, lenders, vendors, suppliers and employees.
Pending the closing of the proposed acquisition, the merger agreement restricts us from engaging in certain specified actions without Brookfield’s consent, and contains a “no-shop” provision in which we may not solicit any transaction that would result in the acquisition of more than 20% of us or our assets. (However, prior to receipt of the required stockholder approvals, we may consider any unsolicited, bona fide proposal that is or is reasonably likely to lead to a “Superior Proposal”, which is generally limited to those proposals for an acquisition of a majority of us or our assets that the Special Committee determines in good faith, after consultation with its financial advisor and outside legal counsel, is more favorable from a financial point of view to our stockholders than the Brookfield acquisition.) These provisions could prevent us from pursuing attractive business opportunities or more favorable alternative strategic transactions that may arise prior to the closing of the proposed acquisition.
In addition, pending the closing, the proposed acquisition could also cause disruptions to our business or business relationships, which could have a material adverse effect on our business, financial condition, results of operations and prospects.
10
For example:
• | the attention of our management may be directed to transaction-related considerations and may be diverted from the day-to-day operations of our business; |
• | our employees may experience uncertainty about their future roles with us, which might adversely affect our ability to retain and hire key personnel and other employees (notwithstanding our establishment in January 2016 of a Retention Plan for our named executive officers and certain other senior executives; see Note 19 to our Consolidated Financial Statements for more details regarding our Retention Plan); and |
• | tenants, lenders, suppliers, vendors and other parties with which we maintain business relationships may experience uncertainty about our future and seek retail space elsewhere (in the case of tenants and prospect tenants;) or alternative relationships with third parties or seek to alter their business relationships with us. |
If the merger agreement is terminated, depending on the circumstances giving rise to termination, we may be required to pay a termination fee of $40 million (net of any transaction expenses of Brookfield reimbursed by us, as described below). Specifically, we will be required to pay the termination fee if (i) we terminate the merger agreement and, substantially concurrently therewith, enter into a definitive agreement for a Superior Proposal, (ii) a “Triggering Event” occurs, which generally means that our Board of Directors or the Special Committee changes, withholds or fails to publicly affirm its recommendation that stockholders approve the Brookfield transactions, or we materially breach our “no-shop” obligations or obligations with respect to holding the stockholders meeting or (iii) (A) the merger agreement is terminated because the closing does not occur by October 31, 2016, the required stockholder approvals are not received or we materially breach the merger agreement, (B) following the date of the merger agreement, a competing acquisition proposal is publicly announced and not publicly withdrawn and (C) within 12 months following such termination of the merger agreement, a competing acquisition proposal is consummated or we enter into a definitive agreement for a competing acquisition proposal during such 12-month period, which is thereafter consummated. We and Brookfield will also be required to reimburse the other party’s transaction expenses if we or Brookfield, as applicable, materially breaches the merger agreement.
Moreover, we have incurred, and will continue to incur, significant costs, expenses and fees for professional services and other transaction costs in connection with the proposed acquisition, and most of these fees and costs may be payable by us even if the proposed acquisition is not consummated.
Risks Related to our Business
We have a limited operating history as an independent company upon which you can evaluate our performance, and accordingly, our prospects must be considered in light of the risks that any recently independent company encounters.
We are a Delaware corporation that was created to hold certain assets and liabilities of GGP. Prior to January 12, 2012, we were a wholly-owned subsidiary of GGP Limited Partnership ("GGPLP"). GGP distributed the assets and liabilities of 30 of its wholly-owned properties to us on January 12, 2012 ("Spin-Off Date"). We completed our spin-off from GGP on January 12, 2012, and have limited experience operating as an independent company and performing various corporate functions, including human resources, tax administration, legal (including compliance with the Sarbanes-Oxley Act of 2002 (the "Sarbanes-Oxley Act") and the Dodd-Frank Wall Street Reform and Consumer Protection Act (the "Dodd-Frank Act") and with the periodic reporting obligations of the Exchange Act), treasury administration, investor relations, internal audit, insurance, information technology and telecommunications services, and accounting functions.
Our business is subject to the substantial risks inherent in the early stages of a business enterprise in an intensely competitive industry. Our prospects must be considered in light of the risks, expenses and difficulties encountered by companies in the early stages of independent business operations, particularly companies that are heavily affected by economic conditions and operate in highly competitive environments.
We may be unable to reposition or redevelop some of our properties, which could have a material adverse effect on our business, financial condition, results of operations and prospects.
Our business strategy is focused on repositioning and redeveloping our properties. In connection with these repositioning and redevelopment projects, we are subject to various risks, including but not limited to the following:
• | we may not have sufficient capital to proceed with planned repositioning or redevelopment activities; |
11
• | redevelopment costs of a project may exceed original estimates or available financing, possibly making the project unfeasible or unprofitable; |
• | we may not be able to obtain zoning or other required governmental permits and authorizations; |
• | occupancy rates and rents at a completed project may not meet projections and, therefore, the project may not be profitable; and |
• | we may not be able to obtain anchor store and mortgage lender approvals, if applicable, for repositioning or redevelopment activities. |
There can be no assurance that our repositioning and redevelopment projects will have the desired results of attracting and retaining desirable tenants and increasing customer traffic. If repositioning or redevelopment projects are unsuccessful, our investments in those projects may not be fully recoverable from future operations, which could have a material adverse effect on our business, financial condition, results of operations and prospects.
Economic and market conditions, especially in the retail sector, may have a material adverse effect on our business, financial condition, results of operations and prospects.
The retail sector is affected by a number of factors that are largely beyond our control but could decrease the income generated by our properties. These factors include, but are not limited to:
• | changes in national, regional and local economic climates, which may be negatively impacted by plant closings, industry slowdowns, increased unemployment, lack of availability of consumer credit, increased levels of consumer debt, poor housing market conditions, adverse weather conditions, natural disasters and other factors; |
• | local real estate conditions, such as an oversupply of, or a reduction in demand for, retail space or retail goods, and the supply and creditworthiness of current and prospective tenants; |
• | levels of consumer spending, consumer confidence and seasonal spending; |
• | adverse changes in governmental regulations, such as local zoning and land use laws, environmental regulations or local tax structures; |
• | perceptions by retailers of the safety, convenience and attractiveness of our properties; |
• | the convenience and quality of competing retail properties and other retailing options, such as the Internet; and |
• | increased operating costs, such as increases in repairs and maintenance, real estate taxes, utility rates and insurance premiums. |
Sales at stores operating in our malls could be adversely affected as the result of one or more of these factors. Since we derive substantially all of our income from our retail tenants, a considerable decline in our tenants’ operations could have a material adverse effect on our business, financial condition, results of operations and prospects.
We may be unable to lease or re-lease space in our properties on favorable terms or at all, which could materially and adversely affect our business, financial condition, results of operations and prospects.
Our results of operations depend on our ability to strategically lease space in our properties, including re-leasing space in properties where leases are expiring, optimizing our tenant mix and leasing properties on more economically favorable terms. We are continually focused on our ability to lease properties and collect rents from tenants. If we are unable to lease or re-lease space in our properties to an appropriate mix of tenants at attractive rates or at all, our business, financial condition, results of operations and prospects could be materially and adversely affected.
Our tenants may be unable to pay minimum rents and expense recovery charges, which would have a material adverse effect on our business, financial condition, results of operations and prospects.
If the sales at stores operating in our malls decline, tenants might be unable to pay their existing minimum rents or expense recovery charges, since these rents and charges would represent a higher percentage of their sales. If our tenants' sales decline, new tenants
12
would be less likely to be willing to pay minimum rents as high as they would otherwise pay. We may not be able to collect rents sufficient to meet our costs. Because substantially all of our income is derived from rentals of real property, our business, financial condition, results of operations and prospects would be materially and adversely affected if a significant number of tenants are unable to meet their obligations.
Certain co-tenancy provisions in our lease agreements may result in reduced rent payments, which could materially and adversely affect our business, financial condition, results of operations and prospects.
Some of our lease agreements include a co-tenancy provision which allows the mall tenant to pay a reduced rent amount and, in certain instances, terminate the lease, if we fail to maintain a certain number of anchor tenants or a certain occupancy level at the mall. In addition, certain of our tenants have the ability to terminate their leases with us prior to the lease expiration date if their sales do not meet agreed upon thresholds. Therefore, if occupancy, tenancy or sales fall below certain thresholds, rents we are entitled to receive from our retail tenants could be reduced and our ability to attract new tenants may be limited, which could materially and adversely affect our business, financial condition, results of operations and prospects.
The failure to fully recover cost reimbursements for common area maintenance, taxes and insurance from tenants could materially and adversely affect our business, financial condition, results of operations and prospects.
The computation of cost reimbursements from tenants for common area maintenance ("CAM"), insurance and real estate taxes is complex and involves numerous judgments, including interpretation of lease terms and other tenant lease provisions. Most tenants make monthly fixed payments of CAM, real estate taxes and other cost reimbursement items. After the end of the calendar year, we compute each tenant's final cost reimbursements and issue a bill or credit for the full amount, after considering amounts paid by the tenant during the year. The billed amounts could be disputed by the tenant or become the subject of a tenant audit or even litigation. There can be no assurance that we will collect all or substantially all of this entire amount.
Our properties are also subject to the risk of increases in CAM and other operating expenses, which typically include real estate taxes, energy and other utility costs, repairs, maintenance and capital improvements to common areas, security, housekeeping, property and liability insurance and administrative costs. For example, municipalities might seek to raise real estate taxes paid by our property in their jurisdiction because of their strained budgets or for other reasons. If operating expenses increase, the availability of other comparable retail space in our specific geographic markets might limit our ability to pass these increases through to tenants, or, if we do pass all or a part of these increases on, might lead tenants to seek retail space elsewhere, which, in either case, could materially and adversely affect our business, financial condition, results of operations and prospects.
We rely on major tenants, making us vulnerable to changes in the business and financial condition of such tenants.
As of December 31, 2015, our tenants that generate revenues equal to or exceeding 1.5% of our aggregate revenues are as follows:
Tenant | % of Aggregate Revenues | |
L Brands, Inc. | 4.3% | |
Foot Locker, Inc. | 3.5% | |
Signet Jewelers Limited | 3.3% | |
JCPenney Company, Inc. | 2.6% | |
Cinemark USA, Inc. | 2.1% | |
Sears Holdings Corporation | 2.0% | |
American Eagle Outfitters, Inc. | 1.7% | |
Genesco Inc. | 1.7% | |
Ascena Retail Group, Inc. | 1.7% | |
Macy's, Inc. | 1.7% | |
Luxottica Retail North America Inc. | 1.5% | |
The retail shopping sector is affected by economic conditions as well as the competitive nature of the retail business and the competition for market share where stronger retailers have out-positioned some of the weaker retailers. These shifts have forced some market share away from weaker retailers and required them, in some cases, to declare bankruptcy and/or close stores.
13
In the event of deterioration in the financial condition of our major tenants, we may be required to write-off and/or accelerate depreciation and amortization expense associated with a significant portion of the tenant-related deferred charges in future periods. Our income and ability to meet financial obligations could also be materially and adversely affected in the event of the bankruptcy, insolvency or significant downturn in the business of one of these tenants. In addition, our results could be materially and adversely affected if one or more of these tenants do not renew their leases as they expire.
The bankruptcy or store closures of anchor stores or national tenants may materially and adversely affect our business, financial condition, results of operations and prospects.
The income we generate depends in part on the ability of our anchor stores and national tenants to attract customers to our properties and generate traffic, which affects the property's ability to attract in-line tenants, and thus the revenue generated by the property. We also derive significant revenues from these tenants. In recent years, in connection with economic conditions and other changes in the retail industry, some anchor stores and national tenants have experienced decreases in operating performance. As a result, a number of retailers, including some of our tenants, have declared bankruptcy, voluntarily closed their stores or sought lease modifications to reduce their rents or expense recovery charges. Certain anchor stores or national tenants have engaged in restructuring transactions, including mergers, consolidations and dispositions. Any such restructuring transaction could involve withdrawal from certain geographic areas, such as secondary or tertiary trade areas where many of our properties are located, and closures or sales of stores operated by them. If an anchor store or national tenant were to close its stores at our properties, we may experience difficulty and delay and incur significant expense in replacing the tenant, as well as in leasing spaces in areas adjacent to the vacant space, at attractive rates, or at all. Additionally, anchor store or national tenant closures may result in decreased customer traffic, which could lead to decreased sales at the property. Moreover, store closures by an anchor store and/or a national tenant may allow other tenants to terminate, or modify the economic terms of, their leases at the property pursuant to co-tenancy provisions described above. As a result, the bankruptcy, insolvency, closure or general downturn in the business of an anchor store or national tenant, as well as requests from such tenants for significant rent relief or other lease concessions, could materially and adversely affect our business, financial condition, results of operations and prospects.
Our ability to change our portfolio is limited because real estate investments are relatively illiquid.
Equity real estate investments are relatively illiquid, which may limit our ability to strategically change our portfolio promptly in response to changes in economic, financial, investment or other conditions. The real estate market is affected by many factors, such as general economic conditions, availability of financing and other factors, including supply and demand for space, that are beyond our control. Moreover, there are some limitations under federal income tax laws applicable to REITs that limit our ability to sell assets. We cannot predict whether we will be able to sell any property for the price or on the terms we set or at all, or whether any price or other terms offered by a prospective purchaser would be acceptable to us. The number of prospective buyers interested in purchasing malls is limited. We cannot predict the length of time needed to find a willing purchaser and to close the sale of a property. In addition, economic and capital market conditions might make it more difficult for us to sell properties or might adversely affect the price we receive for properties that we do sell, as prospective buyers might experience increased costs of debt financing or other difficulties in obtaining debt financing.
In addition, significant expenditures associated with each equity investment, such as mortgage payments, real estate taxes and maintenance costs, generally are not reduced when circumstances cause a reduction in income from the investment. If income from a property declines while the related expenses do not decline, our income and cash available to us would be adversely affected. If it becomes necessary or desirable for us to dispose of one or more of our mortgaged properties, we might not be able to obtain a release of the lien on the mortgaged property without payment of the associated debt. The foreclosure of a mortgage on a property or inability to sell a property could adversely affect the level of cash available to us. These factors and any others that would impede our ability to respond to adverse changes in the performance of our properties could materially and adversely affect our business, financial condition, results of operations and prospects.
We operate in a competitive business.
There are numerous shopping facilities that compete with our properties in attracting retailers to lease space and many of our competitors operate on a much larger scale than we do. Our properties are generally regional malls in protected markets or submarkets and our ability to compete for certain tenants may be limited as a result. In addition, retailers at our properties face continued competition from retailers at other regional malls, outlet malls and other discount shopping malls, discount shopping clubs, full-line large format value retailers, catalog companies, and through Internet sales and telemarketing. Competition could materially and adversely affect our business, financial condition, results of operations and prospects.
In particular, the increase in both the availability and popularity of online shopping has created a growing source of competitive pressure on the retailers at our properties. In certain categories, such as books, music and electronics, online retailing has become
14
a significant proportion of total sales and has affected retailers in those categories significantly. The ability of online retailers to offer a wide range of products for sale, often with substantial price and tax savings, and free or discounted shipping, allows these online retailers to compete with the retailers at our properties by offering added convenience and cost-saving incentives to consumers in both high density major metropolitan markets and rural areas. Additionally, small businesses and specialty retailers, who have previously been limited to marketing and selling their products within their immediate geographical area, are now able to reach a broader group of consumers and compete with the retailers at our properties.
We also compete with other major real estate investors with significant capital for attractive investment opportunities. These competitors include REITs, investment banking firms and private institutional investors. Competition for investment opportunities may result in increased purchase prices and may adversely affect our ability to make attractive investments on favorable terms, or at all.
Our ability to realize our strategies and capitalize on our competitive strengths are dependent on our ability to effectively operate a large portfolio of malls, maintain good relationships with our tenants and consumers, and remain well-capitalized, and our failure to do any of the foregoing could affect our ability to compete effectively in the markets in which we operate.
Our substantial indebtedness could have a material adverse effect on our business, financial condition, results of operations and prospects.
As of December 31, 2015, our total consolidated contractual debt, excluding non-cash debt market rate adjustments, was $1.71 billion, all of which was secured by our properties. As a result of our substantial debt, we are required to use a significant portion of our cash flows for our debt service requirements, which limits our ability to use those cash flows for our operations or other purposes, including to pay dividends. Additionally, any substantial decrease in our cash flows or increase in expenses could make it difficult for us to meet our debt service requirements or force us to modify our operations, which could have a material adverse effect on our business, financial condition, results of operations and prospects. In addition, our level of indebtedness could have other adverse consequences for us, including:
• | limiting our ability to borrow additional amounts for working capital, capital expenditures, debt service requirements, execution of our business strategy or other purposes; |
• | increasing our vulnerability to general adverse economic, market and industry conditions, including increases in interest rates, particularly given that certain of our indebtedness bears interest at variable rates; |
• | limiting our ability to capitalize on business opportunities, access equity, reinvest in and develop our properties, and to react to competitive pressures and adverse changes in government regulation; |
• | limiting our ability, or increasing the costs, to refinance indebtedness; |
• | limiting our ability to enter into marketing and hedging transactions by reducing the number of potential counterparties with whom we could enter into such transactions as well as the volume of those transactions; and |
• | giving secured lenders the ability to foreclose on our assets. |
If any of the foregoing occurs, our business, financial condition, results of operations and prospects could be materially and adversely affected.
15
The following table shows the scheduled maturities of mortgages, notes, and loans payable as of December 31, 2015 and for the next five years and thereafter (in thousands):
2016 | $ | 265,493 | |
2017 | 69,814 | ||
2018 | 579,480 | ||
2019 | 13,109 | ||
2020 | 89,243 | ||
Thereafter | 689,714 | ||
$ | 1,706,853 | ||
Unamortized market rate adjustment | (340 | ) | |
Total mortgages, notes and loans payable | $ | 1,706,513 | |
A deterioration of the capital and credit markets could materially and adversely affect our ability to access funds and the capital needed to refinance debt or obtain new debt.
We are significantly dependent upon external financing to fund the growth of our business and ensure that we meet our debt servicing requirements. Our access to financing depends on the willingness of lending institutions to grant credit to us and conditions in the capital markets in general. An economic recession may cause extreme volatility and disruption in the capital and credit markets. When markets are volatile, access to capital and credit markets could be disrupted over an extended period of time and many financial institutions may not have the available capital to meet their previous commitments. The failure of one or more significant participants to our 2013 Senior Facility to meet their funding commitments could have a material adverse effect on our business, financial condition, results of operations and prospects. This may make it difficult to obtain the financing we may need for future growth and/or to meet our debt service requirements as they mature. There can be no assurance as to whether we will be able to obtain debt in the future, or that the financing options available to us will be on favorable or acceptable terms.
If we are unable to comply with the covenants contained in our indebtedness, our business, financial condition, results of operations and prospects could be materially and adversely affected.
The 2013 Senior Facility contains representations and warranties, affirmative and negative covenants and default and cross-default provisions that are customary for such a real estate loan. In addition, the 2013 Senior Facility requires compliance with certain financial covenants, including borrowing base loan to value and debt yield, corporate maximum leverage ratio, minimum ratio of adjusted consolidated earnings before interest, tax, depreciation and amortization to fixed charges, minimum tangible net worth, minimum mortgaged property requirement, maximum unhedged variable rate debt and maximum recourse indebtedness. These covenants may restrict our ability to pursue certain business initiatives or certain transactions that might otherwise be advantageous to us. In addition, our ability to comply with these provisions might be affected by events beyond our control. Failure to comply with the covenants in the 2013 Senior Facility would result in a default thereunder and, absent a waiver or an amendment from our lenders, cause the acceleration of all outstanding borrowings under the 2013 Senior Facility and could result in the acceleration of other of our indebtedness, which could have a material adverse effect on our business, financial condition, results of operations and prospects. In addition, we have property level debt on two of our properties, which guarantor (Rouse Properties, L.P.), that contain minimum tangible net worth covenant calculations which could have a material adverse effect on our business.
We have a history of prior net losses and may not be profitable in the future.
Our historical consolidated financial data shows that we have a history of prior net losses, and we cannot assure you that we will achieve sustained profitability going forward. For the year ended December 31, 2015, we had GAAP net income of $40.7 million and for the years ended December 31, 2014 and 2013, we incurred GAAP net losses of $(51.7) million, and $(54.7) million, respectively. See "Selected Financial Data." If we do not improve our profitability or if we generate negative cash flow from operating activities, the trading value of our common stock may decline.
Our real estate assets may be subject to impairment charges.
On a periodic basis, we assess whether there are any indicators that the value of our real estate assets and other investments may be impaired. A property's value is impaired only if the estimate of the aggregate future cash flows (undiscounted and without interest charges) to be generated by the property are less than the carrying value of the property. In our estimate of cash flows, we
16
consider factors such as expected future operating income, trends and prospects, the effects of demand, competition and other factors. We are required to make subjective assessments as to whether there are impairments in the value of our real estate assets and other investments. If it is determined that an impairment has occurred, the amount of the impairment charge is equal to the excess of the asset's carrying value over its estimated fair value. Such a determination would have a direct impact on our earnings because recording an impairment charge results in an immediate negative adjustment to earnings. There can be no assurance that we will not take additional charges in the future related to the impairment of our assets. Any future impairment could have a material adverse effect on our results of operations in the period in which the charge is taken. During the year ended December 31, 2015, we took an impairment charge of $2.9 million on Collin Creek Mall as the aggregate carrying value was higher than the fair value of the asset. See Note 2 to our Consolidated Financial Statements for additional information regarding the impairment charge. We may be required to take additional impairment charges on our assets, including those we designate as "special consideration assets", in the future. A property is designated as a special consideration asset when it has a heightened probability of being conveyed to its lender absent substantive renegotiation.
Some of our properties are subject to potential natural or other disasters.
A number of our properties are located in areas which are subject to natural or other disasters, including hurricanes, tornadoes, earthquakes and oil spills. For example, certain of our properties are located in California or in other areas with higher risk of earthquakes. Furthermore, some of our properties are located in coastal regions, and would therefore be affected by any future rises in sea levels. The occurrence of natural or other disasters could delay redevelopment or development projects, increase investment costs to repair or replace damaged properties, increase future property insurance costs and negatively impact the tenant demand for lease space. If insurance is unavailable to us or is unavailable on acceptable terms, or our insurance is not adequate to cover losses from these events, our business, financial condition, results of operations and prospects could be materially and adversely affected.
Possible terrorist activity or other acts of violence could materially and adversely affect our business, financial condition, results of operations and prospects.
Future terrorist attacks in the United States or other acts of violence may result in declining economic activity, which could harm the demand for goods and services offered by our tenants and the value of our properties and might adversely affect the value of an investment in our securities. Such a decrease in retail demand could make it difficult for us to renew or re-lease our properties at lease rates equal to or above historical rates. Terrorist activities or violence also could directly affect the value of our properties through damage, destruction or loss, and the availability of insurance for such acts, or insurance generally, might be lower or cost more, which could increase our operating expenses and materially and adversely affect our business, financial condition, results of operations and prospects. To the extent that our tenants are affected by future attacks, their businesses similarly could be materially and adversely affected, including their ability to continue to meet obligations under their existing leases. These acts might erode business and consumer confidence and spending and might result in increased volatility in national and international financial markets and economies.
Any one of these events might decrease demand for real estate, decrease or delay the occupancy of our properties, and limit our access to capital or increase our cost of raising capital.
We could incur significant costs related to government regulation and litigation over environmental matters and various other federal, state and local regulatory requirements.
Under various federal, state or local laws, ordinances and regulations, a current or previous owner or operator of real estate may be required to investigate and clean up hazardous or toxic substances released at a property and may be held liable to third parties for bodily injury or property damage (investigation and/or clean-up costs) incurred by the parties in connection with the contamination. These laws often impose liability without regard to whether the owner or operator knew of or otherwise caused the release of the hazardous or toxic substances. In addition, persons who arrange for the disposal or treatment of hazardous substances or other regulated materials may be liable for the costs of removal or remediation of such substances at a disposal or treatment facility, whether or not such facility is owned or operated by such person. The costs of remediation or removal of such substances may be substantial and the presence of contamination or the failure to remediate contamination discovered at our properties could adversely affect our ability to sell, lease or borrow with respect to the real estate. The operations of current and former tenants at our properties have involved, or may have involved, the use of hazardous materials or generated hazardous wastes. The release of such hazardous materials and wastes could result in our incurring liabilities to remediate any resulting contamination if the responsible party is unable or unwilling to do so. In addition, our properties may be exposed to the risk of contamination originating from other sources. While a property owner generally is not responsible for remediating contamination that has migrated on-site from an off-site source, the contaminant's presence can have adverse effects on the operation or redevelopment of our properties. Environmental laws also may create liens on contaminated sites in favor of the government for
17
damages and costs it incurs to address such contamination. Moreover, if contamination is discovered on our properties, environmental laws may impose restrictions on the manner in which that property may be used or how businesses may be operated on that property.
Our properties have been subjected to varying degrees of environmental assessment at various times; however, the identification of new areas of contamination, a change in the extent or known scope of contamination or changes in cleanup requirements could result in significant costs to us.
Our properties are subject to various federal, state, and local environmental, health and safety regulatory requirements that address a wide variety of issues, including, but not limited to, storage tanks, storm water and wastewater discharges, potable wells, lead-based paint and waste management. We could incur substantial costs to comply with these environmental, health and safety laws and regulations and could be subject to significant fines and penalties for non-compliance with applicable laws. For example, certain federal, state and local laws, ordinances and regulations require abatement or removal of asbestos-containing materials in the event of demolition or certain renovations or remodeling, the cost of which may be substantial for certain redevelopments. These regulations also govern emissions of and exposure to asbestos fibers in the air, which may necessitate implementation of site specific maintenance practices. Certain laws also impose liability for release of asbestos-containing materials into the air and third parties may seek recovery from owners or operators of real properties for personal injury or property damage associated with asbestos-containing materials. Asbestos-containing building materials are present at some of our properties and may be present at others. To minimize the risk of onsite asbestos being improperly disturbed, we have developed and implemented asbestos operations and maintenance programs to manage asbestos-containing materials and suspected asbestos-containing materials in accordance with applicable legal requirements.
As of December 31, 2015, we have recorded a liability in our financial statements of $6.1 million related to potential environmental remediation at our properties which are not expected to have a material impact on our financial condition or results of operations. We have not been notified by any governmental authority, and are not otherwise aware, of any material noncompliance, liability or claim relating to hazardous or toxic substances in connection with any of our properties. Nevertheless, it is possible that the environmental assessments available to us do not reveal all potential environmental liabilities. It is also possible that subsequent investigations will identify material contamination, that adverse environmental conditions have arisen subsequent to the performance of the environmental assessments, or that there are material environmental liabilities of which management is unaware. Moreover, no assurances can be given that (i) future laws, ordinances or regulations will not impose any material environmental liability or (ii) the current environmental condition of our properties has not been or will not be affected by tenants and occupants of the properties, by the condition of properties in the vicinity of our properties or by third parties unrelated to us.
We also may incur costs to comply with the Americans with Disabilities Act of 1990 and similar laws, which require that all public accommodations meet federal requirements related to access and use by disabled persons. Compliance with such laws could have a material adverse effect on our business, financial condition, results of operations and prospects.
Some potential losses are not insured, which could adversely affect our profitability.
We carry comprehensive liability, fire, flood, earthquake, terrorism, extended coverage and rental loss insurance on all of our properties. We believe the policy specifications and insured limits of these policies are adequate and appropriate in light of the size and scope of our portfolio and business operations. There are, however, some types of losses, including lease and other contract claims, which generally are not insured. If an uninsured loss or a loss in excess of insured limits occurs, we could lose all or a portion of the capital we have invested in a property, as well as the anticipated future revenue from the property. If this happens, we might nevertheless remain obligated for any mortgage debt or other financial obligations related to the property.
Inflation could have a material adverse effect on us.
If inflation increases in the future, we may experience any or all of the following:
• | Difficulty in replacing or renewing expiring leases with new leases at higher rents; |
• | Decreasing tenant sales as a result of decreased consumer spending which could adversely affect the ability of our tenants to meet their rent obligations; and |
• | An inability to receive reimbursement from our tenants for their share of certain operating expenses, including CAM, real estate taxes and insurance. |
18
Inflation also poses a risk to us due to the possibility of future increases in interest rates. A rise in interest rates could have an immediate adverse effect on us due to our outstanding variable-rate debt. This risk can be managed or mitigated by utilizing interest rate protection products that generally allow us to replace variable-rate debt with fixed-rate debt. However, in an increasing interest rate environment the fixed rates we can obtain with such interest rate protection products will also continue to increase. In addition, in the event of a rise in interest rates, we may be unable to replace maturing debt with new debt at equal or better interest rates or at all.
Security breaches through cyber-attacks, cyber-intrusions, or other methods could disrupt our information technology networks and related systems.
Risks associated with security breaches, whether through cyber-attacks or cyber-intrusions over the Internet, malware, computer viruses, attachments to e-mails, or other methods, against persons inside our organization, persons with access to systems inside our organization, the U.S. government, financial markets or institutions, or major businesses, including tenants, could disrupt or disable networks and related systems, other critical infrastructures, and the normal operation of business. The risk of a security breach or disruption, particularly through cyber-attack or cyber-intrusion, including by computer hackers, foreign governments, and cyber-terrorists, has generally increased as the number, intensity, and sophistication of attempted attacks and intrusions from around the world have increased. Even though we may not be specifically targeted, cyber-attacks on the U.S. government, financial markets, financial institutions, or other major businesses, including tenants, could disrupt our normal business operations and networks, which may in turn have a material adverse effect on our business, financial condition, results of operations and prospects.
Information technology networks and related systems are essential to the operation of our business and our ability to perform day-to-day operations, including managing our building systems. They also may be critical to the operations of certain of our tenants and our service providers. Although we make efforts to maintain the security and integrity of these types of networks and related systems, and we have implemented various measures to manage the risk of a security breach or disruption, there can be no assurance that our security efforts and measures will be effective or that attempted security breaches or disruptions would not be successful or damaging. Even the most well protected information, networks, systems, and facilities remain potentially vulnerable because the techniques used in such attempted security breaches evolve and generally are not recognized until launched against a target, and in some cases are designed not to be detected and in fact may not be detected. While to date we have not experienced a cyber-attack or cyber-intrusion, we may be unable to anticipate or to implement adequate security barriers or other preventive measures. A security breach or other significant disruption involving our information technology networks and related systems (including those caused by energy blackouts, natural disasters, terrorism, war, and telecommunications failures) could:
• | disrupt the proper functioning of our networks and systems and therefore our operations and/or those of certain of our tenants; |
• | result in misstated financial reports, violations of loan covenants, missed reporting deadlines, and/or missed permitting deadlines; |
• | result in our inability to properly monitor our compliance with the rules and regulations regarding our qualification as a REIT; |
• | result in the unauthorized access to, and destruction, loss, theft, misappropriation, or release of, proprietary, confidential, sensitive, or otherwise valuable information of ours or others, which others could use to compete against us or for disruptive, destructive, or otherwise harmful purposes and outcomes; |
• | result in our inability to maintain the building systems relied upon by our tenants for the efficient use of their leased space; |
• | require significant management attention and resources to remedy any damages that result; |
• | subject us to claims for breach of contract, damages, credits, penalties, or termination of leases or other agreements; or |
• | damage our reputation among our tenants and investors generally. |
We may also incur additional significant costs to remedy damages caused by such disruptions. Any or all of the foregoing could have a material adverse effect on our business, financial condition, results of operations and prospects.
19
An ownership limit, certain anti-takeover defenses and applicable law may hinder any attempt to acquire us.
Our amended and restated certificate of incorporation, as amended (our "charter"), and our amended and restated bylaws (our "bylaws") contain the following limitations:
The ownership limit. Generally, for us to qualify as a REIT under the Code for a taxable year, not more than 50% in value of the outstanding shares of our capital stock may be owned, directly or indirectly, by five or fewer "individuals" at any time during the last half of such taxable year. Our charter provides that no person may own more than 9.9% of the number or value, whichever is more restrictive, of our outstanding shares of capital stock unless our Board of Directors provides a waiver from the ownership restrictions. The Code defines "individuals" for purposes of the requirement described above to include some types of entities. However, our charter also permits us to exempt a person from the ownership limit upon the satisfaction of certain conditions described therein. We have exempted Brookfield and certain others from the ownership limit, subject to certain conditions.
Selected provisions of our charter. Our charter authorizes our Board of Directors:
• | to cause us to issue additional authorized but unissued shares of common stock or preferred stock; |
• | to classify or reclassify, in one or more series, any unissued preferred stock; and |
• | to set the preferences, rights and other terms of any classified or reclassified stock that we issue. |
Our charter also prohibits our stockholders from acting by written consent.
Selected provisions of our bylaws. Our bylaws contain the following limitations:
• | restrictions on the ability of stockholders to call a special meeting without 20% or more of the voting power of the issued and outstanding shares entitled to vote generally in the election of directors; and |
• | rules regarding how stockholders may present proposals or nominate directors for election at stockholder meetings. |
Selected provisions of Delaware law. We are a Delaware corporation, and Section 203 of the Delaware General Corporation Law applies to us. In general, Section 203 prevents an "interested stockholder" (as defined below) from engaging in a "business combination" (as defined in the statute) with us for three years following the date that person becomes an interested stockholder unless one or more of the following occurs:
• | before that person became an interested stockholder, our Board of Directors approved the transaction in which the interested stockholder became an interested stockholder or approved the business combination; |
• | upon completion of the transaction that resulted in the interested stockholder becoming an interested stockholder, the interested stockholder owned at least 85% of our voting stock outstanding at the time the transaction commenced, excluding for purposes of determining the voting stock outstanding (but not the outstanding voting stock owned by the interested stockholder) stock held by directors who are also officers of our company and by employee stock plans that do not provide employees with the right to determine confidentially whether shares held under the plan will be tendered in a tender or exchange offer; or |
• | following the transaction in which that person became an interested stockholder, the business combination is approved by our Board of Directors and authorized at a meeting of stockholders by the affirmative vote of the holders of at least two-thirds of our outstanding voting stock not owned by the interested stockholder. |
The statute defines an "interested stockholder" as any person that is the owner of 15% or more of our outstanding voting stock or is our affiliate or associate and was the owner of 15% or more of our outstanding voting stock at any time within the three-year period immediately before the date of determination.
In accordance with Section 203, we approved the transactions in which Brookfield and certain of its controlled affiliates acquired shares of our common stock.
20
In addition, Brookfield has a significant ownership of our common stock. This ownership of our common stock may impede a change in control transaction. See "—Risks Related to our Common Stock Generally—Our substantial stockholder may exert influence over us that may be adverse to our best interests and those of our other stockholders."
Each item discussed above may delay, deter or prevent a change in control of our company, even if a proposed transaction is at a premium over the then current market price for our common stock. Further, these provisions may apply in instances where some stockholders consider a transaction beneficial to them.
We are subject to various reporting and other requirements under federal securities laws which may cause us to incur significant expense.
We are subject to the reporting requirements of the Exchange Act, the Sarbanes-Oxley Act and the Dodd-Frank Act and are required to prepare our financial statements according to the rules and regulations required by the SEC. In addition, the Exchange Act requires that we file annual, quarterly and current reports. Our failure to prepare and disclose this information in a timely manner or to otherwise comply with applicable law could subject us to penalties under federal securities laws, expose us to lawsuits and restrict our ability to access financing. The Sarbanes-Oxley Act requires that we, among other things, establish and maintain effective internal controls and procedures for financial reporting and disclosure purposes. Establishing and monitoring these controls could result in significant costs to us and require us to divert substantial resources, including management time, from other activities.
Compliance with changing regulations of corporate governance and public disclosure may result in additional expenses.
Changing laws, regulations and standards relating to corporate governance and public disclosure, including the Sarbanes-Oxley Act and the Dodd-Frank Act, are creating uncertainty for companies such as ours. We are committed to maintaining high standards of corporate governance and public disclosure. As a result, we intend to continue to invest reasonably necessary resources to comply with evolving standards, and this investment may result in increased general and administrative expenses and a diversion of management time and attention from revenue-generating activities to compliance activities, which could harm our business prospects.
Our historical combined financial information is not representative of the results we would have achieved as a stand-alone company and may not be a reliable indicator of our future results.
The historical combined financial information prior to our spin-off from GGP does not reflect the financial condition, results of operations or cash flows we would have achieved as a stand-alone company during the periods presented or those we will achieve in the future.
Risks Related to our Status as a REIT
We may not be able to maintain our status as a REIT, which would deny us certain favorable tax treatment.
We elected to be treated as a REIT beginning with the filing of our federal income tax return for 2011. Subject to our ability to meet the requirements of a REIT, we intend to maintain this status in future periods. We believe that, commencing with the 2011 taxable year, we were organized and have operated so as to qualify as a REIT for U.S. federal income tax purposes. In addition, once an entity is qualified as a REIT, the Internal Revenue Code of 1986 (the "Code") generally requires that such entity pay tax on or distribute 100% of its capital gains and distribute at least 90% of its ordinary taxable income to stockholders. To avoid current entity level U.S. federal income taxes, we expect to distribute 100% of our capital gains and ordinary income to stockholders annually.
If, with respect to any taxable year, we fail to maintain our qualification as a REIT, we would not be allowed to deduct distributions to stockholders in computing our taxable income and federal income tax. If any of our REIT subsidiaries fail to qualify as a REIT, such failure could result in our loss of REIT status. If we lose our REIT status, corporate level income tax, including any applicable alternative minimum tax, would apply to our taxable income at regular corporate rates. As a result, the amount available for distribution to holders of equity securities that would otherwise receive dividends would be reduced for the year or years involved, and we would no longer be required to make distributions. In addition, unless we were entitled to relief under the relevant statutory provisions, we would be disqualified from treatment as a REIT for four subsequent taxable years.
21
REIT distribution requirements could adversely affect our liquidity.
In order for us to qualify to be taxed as a REIT, and assuming that certain other requirements are also satisfied, we generally must distribute at least 90% of our REIT taxable income, determined without regard to the dividends paid deduction and excluding any net capital gains, to our stockholders each year, so that federal corporate income tax does not apply to earnings that we distribute. To the extent that we satisfy this distribution requirement and qualify for taxation as a REIT, but distribute less than 100% of our REIT taxable income, determined without regard to the dividends paid deduction and including any net capital gains, we will be subject to federal corporate income tax on our undistributed net taxable income. In addition, we will be subject to a 4% nondeductible excise tax if the actual amount that we distribute to our stockholders in a calendar year is less than a minimum amount specified under federal income tax laws. We intend to make distributions to our stockholders to comply with the REIT requirements of the Code.
From time to time, we might generate taxable income greater than our cash flow as a result of differences in timing between the recognition of taxable income and the actual receipt of cash or the effect of nondeductible capital expenditures, the creation of reserves, or required debt or amortization payments. If we do not have other funds available in these situations, we could be required to access capital on unfavorable terms (the receipt of which cannot be assured), sell assets at disadvantageous prices, distribute amounts that would otherwise be invested in future acquisitions, capital expenditures or repayment of debt, or make taxable distributions of our capital stock or debt securities to make distributions sufficient to enable us to pay out enough of our taxable income to satisfy the REIT distribution requirement and avoid corporate income tax and the 4% excise tax in a particular year. These alternatives could increase our costs or reduce our equity. Further, amounts distributed will not be available to fund the growth of our business. Thus, compliance with the REIT requirements may adversely affect our liquidity and our ability to execute our business plan.
Complying with REIT requirements might cause us to forego otherwise attractive investment opportunities or liquidate otherwise attractive investments.
To qualify to be taxed as a REIT for federal income tax purposes, we must ensure that, at the end of each calendar quarter, at least 75% of the value of our assets consist of cash, cash items, government securities and “real estate assets” (as defined in the Code), including certain mortgage loans and securities. The remainder of our investments (other than government securities, qualified real estate assets and securities issued by a taxable REIT subsidiary (a “TRS”)) generally cannot include more than 10% of the outstanding voting securities of any one issuer or more than 10% of the total value of the outstanding securities of any one issuer.
Additionally, in general, no more than 5% of the value of our total assets (other than government securities, qualified real estate assets and securities issued by a TRS) can consist of the securities of any one issuer, and no more than 25% (20% for taxable years beginning after December 31, 2017) of the value of our total assets can be represented by securities of one or more TRSs. If we fail to comply with these requirements at the end of any calendar quarter, we must correct the failure within 30 days after the end of the calendar quarter or qualify for certain statutory relief provisions to avoid losing our REIT qualification and suffering adverse tax consequences. As a result, we might be required to liquidate or forego otherwise attractive investments, which could have a material adverse effect on our business, financial condition, results of operations and prospects.
In addition to the asset tests set forth above, to qualify to be taxed as a REIT, we must continually satisfy tests concerning, among other things, the sources of our income, the amounts we distribute to our stockholders and the ownership of our shares. We might be unable to pursue investments that would be otherwise advantageous to us in order to satisfy the source-of-income or asset-diversification requirements for qualifying as a REIT. Thus, compliance with the REIT requirements may hinder our ability to make certain attractive investments.
New partnership tax audit rules could have a material adverse effect on our business, financial condition, results of operations and prospects.
The recently enacted Bipartisan Budget Act of 2015 changes the rules applicable to federal income tax audits of partnerships. Under the new rules (which are generally effective for taxable years beginning after December 31, 2017), among other changes and subject to certain exceptions, any audit adjustment to items of income, gain, loss, deduction, or credit of a partnership (and any partner’s distributive share thereof) is determined, and taxes, interest, or penalties attributable thereto are assessed and collected, at the partnership level. Although it is uncertain how these new rules will be implemented, it is possible that they could result in partnerships in which we directly or indirectly invest being required to pay additional taxes, interest and penalties as a result of an audit adjustment, and we, as a direct or indirect partner of these partnerships, could be required to bear the economic burden of those taxes, interest, and penalties even though we, as a REIT, may not otherwise have been required to pay additional corporate-level taxes had we owned the assets of the partnership directly. The new partnership tax audit rules will apply to the Operating Partnership and its subsidiaries that are classified as partnerships for federal income tax purposes. The changes created by these
22
new rules are sweeping and in many respects dependent on the promulgation of future regulations or other guidance by the U.S. Department of the Treasury (the “Treasury”) and, accordingly, there can be no assurance that these rules will not have a material adverse effect on our business, financial condition, results of operations and prospects.
Legislative, administrative, regulatory or other actions affecting REITs could have materially and adversely affect us.
The rules dealing with federal income taxation are constantly under review by persons involved in the legislative process, and by the Internal Revenue Service (the “IRS”) and the Treasury. Changes to the tax laws or interpretations thereof by the IRS and the Treasury, with or without retroactive application, could materially and adversely affect us or our investors. New legislation, Treasury regulations, administrative interpretations or court decisions could significantly and negatively affect our ability to qualify to be taxed as a REIT and/or the federal income tax consequences to us and our investors of such qualification.
Risks Related to our Common Stock Generally
The market price and trading volume of our common stock could be volatile and the market price of our common stock could decline.
The stock markets, including the New York Stock Exchange (the “NYSE”), which is the exchange on which our common stock is listed, have experienced significant price and volume fluctuations. Overall weakness in the economy and other factors have contributed to extreme volatility of the equity markets generally, including the market price of our common stock. As a result, the market price of our common stock has been and may continue to be volatile, and investors in our common stock may experience a decrease in the value of their shares, including decreases unrelated to our operating performance or prospects. Some of the factors that could negatively affect our stock price or result in fluctuations in the price or trading volume of our common stock include:
• | our actual or projected operating results, financial condition, cash flows and liquidity, or changes in business strategy or prospects; |
• | actual or perceived conflicts of interest with our directors, officers or other executives; |
• | equity issuances by us, or share resales by our stockholders, or the perception that such issuances or resales may occur; |
• | actual or anticipated accounting problems; |
• | publication of research reports about us or the real estate industry; |
• | changes in market valuations of similar companies; |
• | adverse market reaction to the level of leverage we employ; |
• | additions to or departures of our key personnel; |
• | speculation in the press or investment community; |
• | our failure to meet, or the lowering of, our earnings estimates or those of any securities analysts; |
• | increases in market interest rates, which may lead investors to demand a higher dividend yield for our common stock and would result in increased interest expenses on our debt; |
• | failure to maintain our REIT qualification; |
• | price and volume fluctuations in the stock market generally; and |
• | general market and economic conditions, including the current state of the credit and capital markets. |
In the past, securities class action litigation has often been instituted against companies following periods of volatility in their stock price. This type of litigation could result in substantial costs and divert our management’s attention and resources.
23
Future issuances of debt securities and equity securities may negatively affect the market price of our common stock.
In the future, we may issue debt or additional equity securities or incur additional borrowings. Upon our liquidation, holders of our debt securities and other loans and shares of preferred stock will receive a distribution of our available assets before common stockholders. If we incur additional debt in the future, our future interest costs could increase, and adversely affect our business, financial condition, results of operations and prospects. We are not required to offer any additional equity securities to existing common stockholders on a preemptive basis. Therefore, additional common stock issuances, directly or through convertible or exchangeable securities, warrants or options, will dilute the holdings of our existing common stockholders and such issuances or the perception of such issuances may reduce the market price of our common stock. Our shares of preferred stock, if issued, would likely have a preference on distribution payments, periodically or upon liquidation, which could eliminate or otherwise limit our ability to pay dividends to common stockholders. Because our decision to issue debt or additional equity securities or incur additional borrowings in the future will depend on market conditions and other factors beyond our control, we cannot predict or estimate the amount, timing, nature or success of our future capital raising efforts. Thus, common stockholders bear the risk that our future issuances of debt or equity securities or our incurrence of additional borrowings will negatively affect the market price of our common stock.
The number of shares of common stock available for future issuance or sale could materially and adversely affect the market price of our common stock.
As of February 26, 2016, approximately 57.9 million shares of our common stock were outstanding, and we have the authority to issue up to 500 million shares. Subject to applicable law, our Board of Directors has the authority, without further stockholder approval, to issue additional shares of our common stock on the terms and for the consideration it deems appropriate. Additionally, the resale by existing holders of a substantial number of our outstanding shares of common stock could materially and adversely affect the market price of our common stock. As of December 31, 2015, Brookfield beneficially owned approximately 33.5% of our common stock (based on their publicly reported holdings). Any disposition by Brookfield, or any other substantial stockholder, of our common stock in the public market, or the perception that such dispositions could occur, could adversely affect prevailing market prices of our common stock. The sale of substantial amounts of our common stock, whether directly by us or in the secondary market, the perception that such sales could occur or the availability for future sale of shares of our common stock or securities convertible into or exchangeable or exercisable for our common stock could, in turn, materially and adversely affect the market price of our common stock and our ability to raise capital through future offerings of equity or equity-related securities.
Our substantial stockholder may exert influence over us that may be adverse to our best interests and those of our other stockholders.
As of December 31, 2015, Brookfield beneficially owned approximately 33.5% of our common stock (based on their publicly reported holdings). The concentration of ownership of our outstanding common stock held by our substantial stockholder may make some transactions more difficult or impossible without the support of Brookfield. The interests of Brookfield could conflict with or differ from the interests of our other stockholders. For example, Brookfield’s concentration of ownership could allow Brookfield to influence our policies and strategies and could delay, defer or prevent a change of control or impede a merger, takeover or other business combination that may otherwise be favorable to us and our other stockholders. Brookfield may also pursue acquisition opportunities that may be complementary to our business, and as a result, those acquisition opportunities may not be available to us.
Brookfield has agreed that it will not, in connection with a merger, combination, sale of all or substantially all of our assets or other similar business combination transaction involving us, convert, sell, exchange, transfer or convey any shares of common stock that are owned, directly or indirectly, by it on terms that are more favorable than those available to all other holders of common stock. This restriction does not, however, limit Brookfield’s ability to sell its shares of common stock to a third party at a higher price in circumstances other than the foregoing transactions. See also “—Risks Related to Brookfield’s Proposed Acquisition of our Company—There are risks and uncertainties as a result of Brookfield’s proposed acquisition of us.”
We have not established a minimum dividend payment level and no assurance can be given that we will be able to pay dividends to our stockholders in the future at current levels or at all.
We are generally required to distribute to our stockholders at least 90% of our taxable income each year for us to qualify as a REIT under the Code, which requirement we currently intend to satisfy through quarterly dividends of all or substantially all of our REIT taxable income in such year, subject to certain adjustments. We have not established a minimum dividend payment level, and our ability to pay dividends may be adversely affected by a number of factors, including the risk factors contained in this Annual Report. Although we have paid, and anticipate continuing to pay, quarterly dividends to our stockholders, our Board of Directors has the sole discretion to determine the timing, form and amount of any future dividends to our stockholders, and such
24
determination will depend on our earnings, financial condition, debt covenants, maintenance of our REIT qualification and other factors as our Board of Directors may deem relevant from time to time. As a result, no assurance can be given that we will be able to continue to pay dividends to our stockholders in the future or that the level of any future dividends we do make to our stockholders will achieve a market yield or increase or even be maintained over time, any of which could materially and adversely affect our business, financial condition, results of operations and prospects.
In addition, dividends that we pay to our stockholders are generally taxable to our stockholders as ordinary income. However, a portion of our dividends may be designated by us as long-term capital gains to the extent that they are attributable to capital gain income recognized by us or may constitute a return of capital to the extent that they exceed our earnings and profits as determined for tax purposes. A return of capital is not taxable, but has the effect of reducing the basis of a stockholder’s investment in our common stock.
ITEM 1B. UNRESOLVED STAFF COMMENTS
None.
ITEM 2. PROPERTIES
Our investment in real estate as of December 31, 2015 consisted of our interests in the properties in our portfolio. We generally own the land underlying properties; however, at certain of our properties, all or part of the underlying land is owned by a third party that leases the land to us pursuant to a long-term ground lease. The leases generally contain various purchase options and typically provide us with a right of first refusal in the event of a proposed sale of the land by the landlord. Information regarding encumbrances on our properties is included in Schedule III of this Annual Report.
25
The following sets forth certain information regarding our retail properties as of December 31, 2015:
Property Name (1) | Location | Anchors / Major Tenants | Mall and Freestanding GLA | Office GLA | Anchor GLA (Rouse Owned) | Anchor GLA (Tenant Owned) | Total GLA | % Leased | % Occupied | ||||||||||||||
Animas Valley Mall | Farmington, NM | Dillard's, JCPenney, Sears | 277,983 | — | 188,817 | — | 466,800 | 90.9% | 90.9% | ||||||||||||||
Barnes Crossing, The Mall at | Tupelo, MS | Belk, Belk Home, JCPenney, Sears | 378,231 | — | 250,965 | 100,954 | 730,150 | 96.9 | 94.6 | ||||||||||||||
Bayshore Mall | Eureka, CA | Wal Mart, Kohl's, Sears | 365,510 | — | 161,209 | 59,235 | 585,954 | 86.5 | 85.4 | ||||||||||||||
Bel Air, The Shoppes at | Mobile, AL | Belk, Dillard's, Target, JCPenney | 393,947 | — | 325,148 | 440,865 | 1,159,960 | 93.6 | 87.8 | ||||||||||||||
Birchwood Mall | Port Huron, MI | Target, Macy's, JCPenney, Carson's, Sears | 302,880 | — | 161,216 | 264,918 | 729,014 | 91.7 | 91.7 | ||||||||||||||
Cache Valley Mall | Logan, UT | Herberger's, JCPenney | 236,685 | — | 109,476 | — | 346,161 | 94.0 | 92.1 | ||||||||||||||
Carlsbad, The Shoppes at | Carlsbad, CA | Macy's, JCPenney, Regal Cinema, 24 Hour Fitness, Sears | 518,163 | — | 148,958 | 421,093 | 1,088,214 | 85.1 | 83.9 | ||||||||||||||
Chesterfield Towne Center | Richmond, VA | Macy's, JCPenney, At Home, Sears | 484,931 | — | 543,572 | — | 1,028,503 | 92.7 | 92.2 | ||||||||||||||
Chula Vista Center | Chula Vista, CA | Macy's, AMC, JCPenney, Burlington, Sears | 321,788 | — | 163,232 | 377,600 | 862,620 | 92.3 | 92.1 | ||||||||||||||
Colony Square Mall | Zanesville, OH | Elder-Beerman, JCPenney, Dunham's Sports, Cinemark | 359,517 | — | 78,440 | 58,997 | 496,954 | 77.7 | 76.7 | ||||||||||||||
Fig Garden Village | Fresno, CA | Whole Foods, CVS | 267,740 | 33,181 | — | — | 300,921 | 93.8 | 93.8 | ||||||||||||||
Gateway, The Shoppes at | Springfield, OR | Kohl's, Sears, Target, Cabella's, Walmart Neighborhood Grocery, Cinemark | 478,789 | — | 218,055 | 113,613 | 810,457 | 95.4 | 88.5 | ||||||||||||||
Grand Traverse Mall | Traverse City, MI | Macy's, Target, JCPenney | 316,000 | — | — | 283,349 | 599,349 | 92.6 | 87.4 | ||||||||||||||
Greenville Mall | Greenville, NC | Belk, Belk Ladies, JCPenney, Dunham's Sports | 225,103 | 178,510 | 46,051 | 449,664 | 94.1 | 94.1 | |||||||||||||||
Lakeland Square | Lakeland, FL | Dillard's, Macy's, JCPenney, Cinemark, Sears | 351,171 | — | 276,358 | 257,353 | 884,882 | 96.6 | 91.9 | ||||||||||||||
Lansing Mall | Lansing, MI | Macy's, Regal Cinema, JCPenney, Younkers | 477,986 | — | 210,900 | 103,000 | 791,886 | 93.7 | 93.7 | ||||||||||||||
Mall St. Vincent | Shreveport, LA | Dillard's, Sears | 194,152 | — | — | 348,000 | 542,152 | 87.7 | 83.5 | ||||||||||||||
Mt. Shasta Mall | Redding, CA | Macy's, JCPenney, Sears | 188,558 | — | 130,444 | 202,594 | 521,596 | 99.1 | 86.2 | ||||||||||||||
NewPark Mall | Newark, CA | Macy's, JCPenney, AMC, Burlington Coat, Sears | 485,414 | — | 207,372 | 335,870 | 1,028,656 | 84.6 | 70.7 | ||||||||||||||
North Plains Mall | Clovis, NM | Dillard's, JCPenney, Sears, Beall's | 131,234 | — | 170,496 | — | 301,730 | 94.4 | 94.4 | ||||||||||||||
Pierre Bossier Mall | Bossier City, LA | Dillard's, JCPenney, Sears, Virginia College | 265,365 | — | 59,156 | 288,328 | 612,849 | 84.6 | 84.6 | ||||||||||||||
Salisbury, The Centre at | Salisbury, MD | Macy's, Dick's, Regal Cinema, Boscov's, Sears | 368,758 | — | 272,304 | 140,000 | 781,062 | 96.5 | 94.6 | ||||||||||||||
Sierra Vista, The Mall at | Sierra Vista, AZ | Dillard's, Cinemark, Sears | 170,185 | — | — | 196,492 | 366,677 | 95.1 | 95.1 | ||||||||||||||
Sikes Senter | Wichita Falls, TX | Dillard's, Dillard's Men's and Home, JCPenney, At Home | 293,031 | — | 374,690 | — | 667,721 | 88.2 | 85.8 | ||||||||||||||
Silver Lake Mall | Coeur D' Alene, ID | Macy's, JCPenney, Sears, Sports Authority | 153,220 | — | 172,253 | — | 325,473 | 85.1 | 85.1 | ||||||||||||||
Southland Center | Taylor, MI | Macy's, Cinemark, JCPenney | 371,567 | — | 215,787 | 292,377 | 879,731 | 97.0 | 96.1 | ||||||||||||||
Southland Mall | Hayward, CA | Macy's, JCPenney, Sears | 573,637 | — | 347,032 | 292,000 | 1,212,669 | 93.8 | 92.6 | ||||||||||||||
Spring Hill Mall | West Dundee, IL | Kohl's, Carson Pirie Scott, Macy's, Sears | 417,076 | — | 134,148 | 547,432 | 1,098,656 | 83.4 | 72.1 | ||||||||||||||
Three Rivers Mall | Kelso, WA | JCPenney, Macy's, Sportsman's Warehouse, Regal Cinema | 307,563 | — | 98,566 | — | 406,129 | 82.6 | 82.6 | ||||||||||||||
Turtle Creek, The Mall at | Jonesboro, AR | Dillard's, Target, JCPenney | 366,993 | — | — | 364,199 | 731,192 | 95.1 | 91.2 | ||||||||||||||
Valley Hills Mall | Hickory, NC | Belk, Dillard's, JCPenney, Sears | 316,741 | — | — | 611,516 | 928,257 | 88.5 | 91.1 | ||||||||||||||
Vista Ridge Mall | Lewisville, TX | Dillard's, JCPenney, Macy's, Cinemark, Sears | 390,078 | — | — | 670,210 | 1,060,288 | 83.2 | 83.2 | ||||||||||||||
26
Washington Park Mall | Bartlesville, OK | JCPenney, Dillard's, Sears | 161,864 | — | 122,894 | 71,402 | 356,160 | 91.3 | 91.3 | ||||||||||||||
West Valley Mall | Tracy, CA | Macy's, Target, Cinemark, JCPenney, Sears | 535,463 | — | 236,454 | 111,836 | 883,753 | 96.2 | 95.8 | ||||||||||||||
Westwood Mall | Jackson, MI | Wal-Mart, JCPenney, Younkers | 143,943 | — | 70,500 | 301,188 | 515,631 | 87.3 | 87.3 | ||||||||||||||
White Mountain Mall | Rock Springs, WY | Herberger's, JCPenney | 243,040 | — | 94,482 | — | 337,522 | 91.8 | 91.8 | ||||||||||||||
Total Rouse Portfolio | 11,834,306 | 33,181 | 5,721,434 | 7,300,472 | 24,889,393 | 90.9% | 88.5% | ||||||||||||||||
(1) All properties are 100% owned by Rouse Properties, Inc. and subsidiaries with the exception of The Mall at Barnes Crossing of which we own a 52.8% controlling interest.
27
Property Operating Data
For the year ended December 31, 2015, none of our properties accounted for more than 10% of our total consolidated assets and none of our properties accounted for more than 10% of our total consolidated gross revenue.
Same Property Portfolio
As of December 31, 2015, our total portfolio consisted of 36 properties (which excludes Collin Creek Mall, Knollwood Mall and Steeplegate Mall, which were disposed of during the year ended December 31, 2015). Properties that were in operation and owned as of January 1, 2014, excluding three properties that were undergoing redevelopment with significant disruption and one asset that has been reclassified as a special consideration asset(1), are referred to as the Same Property portfolio. As of December 31, 2015, our Same Property portfolio consisted of 27 properties. The following table identifies which of our properties were excluded from our Same Property portfolio:
Property | Location | |
Acquisitions: | ||
Fig Garden Village | Fresno, CA | |
Mt. Shasta Mall | Redding, CA | |
The Shoppes at Carlsbad | Carlsbad, CA | |
The Mall at Barnes Crossing | Tupelo, MS | |
The Shoppes at Bel Air | Mobile, AL | |
Redevelopments: | ||
The Shoppes at Gateway | Springfield, OR | |
NewPark Mall | Newark, CA | |
Spring Hill Mall | West Dundee, IL | |
Special Consideration Asset:(1) | ||
Vista Ridge Mall | Lewisville, TX | |
Dispositions: | ||
Collin Creek Mall | Plano, TX | |
Knollwood Mall | St. Louis Park, MN | |
Steeplegate Mall | Concord, NH | |
Explanatory Note: (1) A property is designated as a special consideration asset when it has a heightened probability of being conveyed to its lender absent substantive renegotiation.
Same Property Portfolio Trends
• | Same Property portfolio Core NOI was $151.8 million for the year ended December 31, 2015 compared to $148.0 million for the year ended December 31, 2014. See "—Non-GAAP Financial Measures" for a discussion of Core NOI and a reconciliation of Same Property Core NOI and Core NOI to consolidated net income (loss) allocable to common shareholders as computed in accordance with GAAP. |
• | Average total rent for mall spaces that are less than 10,000 square feet increased 5.5% to $41.79 as of December 31, 2015 from $39.62 per square foot as of December 31, 2014 in our Same Property portfolio. The increase is attributable to higher rents on new and renewal leases as compared to existing rents of the Same Property portfolio. |
28
Operating Metrics
Average In-Place Rent
The following table sets forth our occupancy rates and the average in-place annual gross rental rate per square foot as of December 31, for each of the last five years for our total portfolio:
Year End | Mall & Freestanding GLA | Leased GLA | Leased % (1) | Average In-Place Gross Rent per square foot less than 10,000 square feet(2)(3) | Average In-Place Gross Rent per square foot greater than 10,000 square feet(3)(4) | Average Effective In-Place Gross Rent per square foot for anchors(5) | |||||||||||||||
2011 | 9,084,925 | 7,967,699 | 87.7 | % | $ | 37.36 | $ | 10.97 | $ | 4.16 | |||||||||||
2012 | 10,109,530 | 9,097,913 | 90.0 | % | $ | 36.78 | $ | 10.67 | $ | 4.04 | |||||||||||
2013 | 11,008,927 | 10,035,651 | 91.2 | % | $ | 37.02 | $ | 13.63 | $ | 4.16 | |||||||||||
2014 | 11,972,219 | 10,854,231 | 90.7 | % | $ | 37.69 | $ | 13.91 | $ | 4.23 | |||||||||||
2015 | 11,834,306 | 10,760,033 | 90.9 | % | $ | 39.68 | $ | 15.03 | $ | 3.92 | |||||||||||
Explanatory Notes:
(1) Leased percentage represents contractual obligations for space in malls and excludes traditional anchor stores.
(2) Represents permanent tenants with spaces less than 10,000 square feet.
(3) Rent is presented on a cash basis and consists of base minimum rent, common area costs, and real estate taxes. The average in-place gross rent per square foot calculation includes the terms of each lease as in effect at the time of the calculation, including any tenant concessions that may have been granted.
(4) Represents permanent tenants with spaces in excess of 10,000 square feet, but excludes traditional anchor tenants.
(5) Represents traditional anchor tenants.
Leasing Volume
The following table represents the leases that we signed during 2015:
2015 Leasing Activity(1)(2) | Number of Leases | Square Feet | Term (in years) | Initial Inline Rent PSF (4)(5) | Initial Freestanding Rent PSF (4) (6) | Average Inline Rent PSF (5)(7) | Average Freestanding Rent PSF (6)(7) | ||||||||||||||
New Leases | |||||||||||||||||||||
Under 10,000 sq. ft. | 142 | 501,605 | 8.7 | $36.08 | $33.35 | $41.39 | $35.57 | ||||||||||||||
Over 10,000 sq. ft. | 19 | 444,463 | 10.2 | 15.64 | 18.50 | 16.51 | 19.75 | ||||||||||||||
Total New Leases | 161 | 946,068 | 9.4 | 26.27 | 28.84 | 29.46 | 30.76 | ||||||||||||||
Renewal Leases | |||||||||||||||||||||
Under 10,000 sq. ft. | 220 | 624,006 | 2.9 | $32.05 | $29.70 | $32.93 | $30.68 | ||||||||||||||
Over 10,000 sq. ft. | 14 | 441,297 | 4.8 | 9.59 | 7.75 | 9.81 | 7.75 | ||||||||||||||
Total Renewal Leases | 234 | 1,065,303 | 3.7 | 25.99 | 18.94 | 26.68 | 19.44 | ||||||||||||||
Sub-Total | 395 | 2,011,371 | 6.4 | 25.95 | 22.83 | 27.88 | 23.88 | ||||||||||||||
Percent in Lieu | 69 | 231,004 | n.a | n.a | n.a | n.a | n.a | ||||||||||||||
Total for the year ended December 31, 2015 (3) | 464 | 2,242,375 | 6.4 | $25.95 | $22.83 | $27.88 | $23.88 | ||||||||||||||
Explanatory Notes:
(1) Excludes anchors and specialty leasing. An anchor is defined as a department store or discount department store in traditional spaces whose merchandise appeals to a broad range of shoppers or spaces which are greater than 70,000 square feet.
(2) Represents signed leases as of December 31, 2015.
(3) The total leasing commissions were approximately $9.8 million for the year ended December 31, 2015. There were no material tenant concessions with respect to the leases signed during the year ended December 31, 2015.
(4) Represents initial rent at time of rent commencement consisting of base minimum rent, common area costs, and real estate taxes.
(5) Inline spaces are mall shop locations which exclude anchor and freestanding stores.
(6) Freestanding spaces are outparcel retail locations (locations that are not attached to the primary complex of buildings that comprise a shopping center). Excludes anchor stores.
(7) Represents average rent over the lease term consisting of base minimum rent, common area costs, and real estate taxes.
29
The following table represents our weighted average in-place rent for freestanding and mall space that is less than 10,000 square feet for the year ended December 31, 2015 for our Same Property portfolio:
In-Place Rent < 10k SF (1) | |
December 31, 2015 | |
Freestanding (2) | $20.77 |
Mall (3) | $41.79 |
Total Same Property portfolio | $38.96 |
Explanatory Notes:
(1) Rent is presented on a cash basis and consists of base minimum rent, common area maintenance costs, and real estate taxes.
(2) Freestanding spaces are outparcel retail locations (locations that are not attached to the primary complex of buildings that comprise a shopping center). Excludes anchor stores.
(3) Mall shop locations exclude anchor and freestanding stores.
New and Renewal Leasing Spread
The following table presents leasing and rent spread information for renewals and new leases that we signed during the year ended December 31, 2015, as compared to the rents of the expiring leases on the same space:
New and Renewal Leasing Spread (1) | |||||||||||||||||||||||||||
Number of Leases | Square Feet | Term (in years) | Initial Rent PSF (2) | Average Rent PSF (3) | Expiring Rent PSF (4) | Initial Rent Spread | Average Rent Spread | ||||||||||||||||||||
Total | 250 | 1,037,945 | 4.5 | $ | 27.15 | $ | 28.75 | $ | 24.18 | $2.96 | 12.3% | $4.57 | 18.9% | ||||||||||||||
Explanatory Notes:
(1) Excluding anchors, percent in lieu, and specialty leasing.
(2) Represents initial rent at time of rent commencement consisting of base minimum rent, common area costs, and real estate taxes.
(3) Represents average rent over the lease term consisting of base minimum rent, common area costs, and real estate taxes.
(4) Represents expiring rent at end of lease consisting of base minimum rent, common area costs, and real estate taxes.
Our expiring rent during 2016 is approximately $34.16 per square foot, which we believe is below current market rates. We expect that the leasing rates that we achieve, on average, over time will benefit from improving the quality of our assets through our various strategic and cosmetic renovation projects.
30
Lease Expirations(1)
The table below sets forth lease expiration data for all of our properties:
Year | Number of Expiring Leases | Expiring GLA | Expiring Rates ($ psf) (2) | Percent of Total Gross Rent | ||||||||
Specialty Leasing (3) | 501 | 1,181,385 | $ | 13.70 | ||||||||
Permanent Leasing | ||||||||||||
2015 and prior | 19 | 46,578 | 66.12 | 1.05 | % | |||||||
2016 | 392 | 1,128,717 | 34.16 | 13.15 | % | |||||||
2017 | 395 | 1,242,949 | 33.84 | 14.34 | % | |||||||
2018 | 246 | 1,024,926 | 35.69 | 12.47 | % | |||||||
2019 | 152 | 716,891 | 32.84 | 8.03 | % | |||||||
2020 | 146 | 621,549 | 29.32 | 6.21 | % | |||||||
2021 | 104 | 693,121 | 24.93 | 5.87 | % | |||||||
2022 | 92 | 481,824 | 28.86 | 4.74 | % | |||||||
2023 | 87 | 438,017 | 33.25 | 4.97 | % | |||||||
2024 | 93 | 663,038 | 23.06 | 5.21 | % | |||||||
2025 | 119 | 853,020 | 28.27 | 8.22 | % | |||||||
2026 | 82 | 624,115 | 28.40 | 6.04 | % | |||||||
2027 and thereafter | 47 | 1,040,232 | 27.24 | 9.70 | % | |||||||
Total Permanent Leasing | 1,974 | 9,574,977 | $ | 30.65 | 100.00 | % | ||||||
Total Leasing | 2,475 | 10,756,362 | ||||||||||
Explanatory Notes:
(1) Represents contractual obligations for space in regional malls and excludes traditional anchor stores.
(2) Excluded from the Expiring Rates are freestanding spaces, kiosks, and leases paying percent rent in lieu of base minimum rent.
(3) Includes Specialty Leasing license agreements with terms in excess of 12 months.
31
Mortgage and Other Debt
The following table sets forth certain information regarding the mortgages, notes, and loans payable encumbering our properties:
Maturity | Outstanding Balance | Balloon Payment at Maturity | |||||||||||||
Month | Year | Rate | |||||||||||||
(In thousands) | |||||||||||||||
Vista Ridge Mall (1) | Apr | 2016 | 6.87 | % | $ | 65,611 | $ | 64,660 | |||||||
The Centre at Salisbury (1) (2) | May | 2016 | 5.79 | 115,000 | 115,000 | ||||||||||
The Mall at Turtle Creek | Jun | 2016 | 6.54 | 76,615 | 76,079 | ||||||||||
NewPark Mall (3) | Sep | 2018 | 2.53 | 114,245 | 114,245 | ||||||||||
West Valley Mall (1) (4) | Sep | 2018 | 3.24 | 59,000 | 56,790 | ||||||||||
The Shoppes at Bel Air (1) (5) | Nov | 2018 | 2.78 | 110,450 | 108,800 | ||||||||||
The Shoppes at Gateway | Jan | 2020 | 3.64 | 75,000 | 75,000 | ||||||||||
Pierre Bossier Mall | May | 2022 | 4.94 | 45,875 | 39,891 | ||||||||||
Pierre Bossier Anchor | May | 2022 | 4.85 | 3,550 | 2,894 | ||||||||||
Southland Center (MI) | Jul | 2022 | 5.09 | 74,806 | 65,085 | ||||||||||
Chesterfield Towne Center | Oct | 2022 | 4.75 | 106,379 | 92,380 | ||||||||||
Animas Valley Mall | Nov | 2022 | 4.41 | 49,156 | 41,844 | ||||||||||
Lakeland Square | Apr | 2023 | 4.17 | 66,814 | 55,951 | ||||||||||
Valley Hills Mall | July | 2023 | 4.47 | 65,362 | 54,921 | ||||||||||
Chula Vista Center (6) | July | 2024 | 4.18 | 70,000 | 60,814 | ||||||||||
The Mall at Barnes Crossing | Sep | 2024 | 4.29 | 67,000 | 58,361 | ||||||||||
Bayshore Mall | Nov | 2024 | 3.96 | 46,500 | 40,185 | ||||||||||
Mt. Shasta Mall | Mar | 2025 | 4.19 | 31,850 | 27,747 | ||||||||||
Fig Garden Village | Jun | 2025 | 4.14 | 74,200 | 67,494 | ||||||||||
Greenville Mall | Nov | 2025 | 4.46 | 45,440 | 36,826 | ||||||||||
Total property level debt | 4.40 | 1,362,853 | 1,254,967 | ||||||||||||
2013 Term Loan (7) (8) | Nov | 2018 | 2.77 | 285,000 | 285,000 | ||||||||||
2013 Revolver (7) (8) | Nov | 2017 | 2.76 | 59,000 | 59,000 | ||||||||||
Total corporate level debt | 344,000 | 344,000 | |||||||||||||
Total mortgages, notes and loans payable | 4.07 | % | $ | 1,706,853 | $ | 1,598,967 | |||||||||
Market rate adjustment | (340 | ) | |||||||||||||
Total mortgages, notes and loans payable, net | $ | 1,706,513 | |||||||||||||
Explanatory Notes:
(1) Prepayable without a penalty.
(2) The Company guaranteed a maximum amount of $3.5 million until certain financial covenants are met for two consecutive years.
(3) LIBOR (30 day) plus 210 basis points. The Company entered into an interest rate swap transaction which fixed the interest rate on the loan for this property at 3.26% beginning January 2016, through September 2018. See Note 7 of our Consolidated Financial Statements for further details.
(4) During January 2014, the Company entered into an interest rate swap transaction which fixed the interest rate on the loan for this property at 3.24%, through June 2018. See Note 7 of our Consolidated Financial Statements for further details.
(5) LIBOR (30 day) plus 235 basis points. The Company entered into an interest rate swap transaction commencing January 2016, which fixed the interest rate at 3.34% through November 2018. See Note 7 of our Consolidated Financial Statements for further details.
(6) On July 1, 2014, the Company removed Chula Vista Center from the 2013 Senior Facility (as defined below) collateral pool and placed a new non-recourse mortgage loan on Chula Vista Center. Sikes Senter was repaid on July 1, 2014 from proceeds from the Chula Vista Center refinancing and upon repayment, Sikes Senter was added to the 2013 Senior Facility collateral pool with no change to the outstanding 2013 Senior Facility collateral pool balance.
(7) LIBOR (30 day) plus 233 basis points.
(8) On June 30, 2015, the Company exercised a portion of its "accordion feature" on the 2013 Senior Facility, increasing the 2013 Term Loan from $260.0 million to $285.0 million and increasing the availability on the 2013 Revolver from $285.0 million to $310.0 million.
ITEM 3. LEGAL PROCEEDINGS
Legal Proceedings
In the ordinary course of our business, we are from time to time involved in legal proceedings related to the ownership and operations of our properties. We are not currently involved in any legal or administrative proceedings that we believe are likely to have a material adverse effect on our business, financial condition, results of operations or prospects.
32
ITEM 4 MINE SAFETY DISCLOSURES
Not Applicable
33
PART II
ITEM 5. MARKET FOR REGISTRANT'S COMMON EQUITY, RELATED STOCKHOLDER MATTERS AND ISSUER PURCHASES OF EQUITY SECURITIES
The Company's common stock is listed on the NYSE under the symbol "RSE." The Company's common stock began "regular way" trading on January 13, 2012. The following table presents the high and low sales prices for our common stock on the NYSE and the dividends declared per share for the quarters set forth below for the periods indicated.
Stock Price | Dividends | |||||||||||
2015: | High | Low | Declared | |||||||||
First quarter | $ | 21.17 | $ | 17.18 | $ | 0.18 | ||||||
Second quarter | 19.44 | 16.01 | 0.18 | |||||||||
Third quarter | 18.19 | 15.15 | 0.18 | |||||||||
Fourth quarter | 18.61 | 14.09 | 0.18 | |||||||||
2014: | ||||||||||||
First quarter | $ | 22.03 | $ | 16.39 | $ | 0.17 | ||||||
Second quarter | 17.46 | 15.93 | 0.17 | |||||||||
Third quarter | 17.87 | 16.17 | 0.17 | |||||||||
Fourth quarter | 18.65 | 15.83 | 0.17 | |||||||||
On February 26, 2016, the closing sale price of the common stock as reported by the NYSE was $18.18. The Company had 1,823 holders of record of common stock as of February 26, 2016.
The Company declared four dividends during the year ended December 31, 2015 at $0.18 per share and four dividends during the year ended December 31, 2014 at $0.17 per share. The Company has elected to be taxed as a REIT beginning with the filing of its tax return for the 2011 fiscal year. As of December 31, 2015, the Company has met the requirements of a REIT and has filed its tax returns for the 2014 fiscal year accordingly. Subject to its ability to meet the requirements of a REIT, the Company intends to maintain this status in future periods.
To qualify as a REIT, the Company must meet a number of organizational and operational requirements, including requirements to distribute at least 90% of its ordinary taxable income and to either distribute capital gains to stockholders, or pay corporate income tax on the undistributed capital gains. A REIT will avoid entity level federal tax if it distributes 100% of its capital gains and ordinary income. In addition, the Company is required to meet certain asset and income tests.
Unregistered Sales of Securities
In November 2015, the Operating Partnership issued 5,600,000 Series A Preferred Units with a liquidation preference of $25.00 per unit (the "Series A Liquidation Preference"), to an affiliate of Westfield U.S. Holdings, LLC (the “Holder”) as a portion of the consideration for the Operating Partnership's acquisition of The Shoppes at Carlsbad. The Series A Preferred Units provide for a cumulative quarterly preferential cash distribution of 5% per annum of the Series A Liquidation Preference (i.e., $1.25 per unit). Subject to the obligations under the tax protection agreement described below, the Series A Preferred Units will be redeemable at the option of the Operating Partnership, in whole or in part, on or after November 12, 2018, at a redemption price equal to the Series A Liquidation Preference for the redeemed Series A Preferred Units plus accumulated and unpaid distributions to the redemption date (the "Redemption Price"). In addition, on or after November 12, 2025, the Holder will have the right to require the Operating Partnership to redeem all of the then-outstanding Series A Preferred Units at the Redemption Price. Further, if, at any time after January 1, 2022, the aggregate Series A Liquidation Preference exceeds 15% of the "equity base" (i.e., the value of the Operating Partnership's outstanding Common Units (with such value to be determined pursuant to a formula set forth in the Operating Partnership’s partnership agreement) plus the liquidation preference of the Operating Partnership's outstanding preferred units of limited partnership interest) as of the end of a calendar quarter, then the Holder will have the right to require the Operating Partnership to redeem, at the Redemption Price, up to the amount of Series A Preferred Units necessary for the outstanding Series A Preferred Units to represent 15% of the equity base.
Except as noted below, any redemption of the Series A Preferred Units may be satisfied, at the Operating Partnership's option, in cash or Common Units, or a combination thereof. The value of any Common Units issued in connection with a redemption will equal 96% of the volume-weighted average price (VWAP) of the Company's shares of common stock over the 30 trading days prior to the applicable redemption date. Pursuant to the Operating Partnership’s partnership agreement, holders of Common Units have the right to cause the Operating Partnership to redeem their Common Units for cash or, at the Company's election, shares of
34
common stock on a one-for-one basis, subject to adjustment as provided in the Operating Partnership’s partnership agreement. Notwithstanding the foregoing, the issuance by the Operating Partnership of Common Units, and the issuance by the Company of shares of common stock, as applicable, in connection with a redemption is subject to certain limitations, including that (i) a resale shelf registration statement with respect to such shares of common stock shall have been filed and become effective, in accordance with a registration rights agreement entered into between the Company and the Holder and (ii) as a result of the redemption, the Holder would not own more than 15% of the outstanding shares of the Company's common stock (assuming all Common Units issued in the redemption were immediately exchanged for common stock (the "As Exchanged Common Shares"). If the conditions of either (i) or (ii) in the prior sentence are not met, the redemption may only be satisfied in cash (in the case of (ii), only with respect to the number of Series A Preferred Units necessary such that the Holder would not own more than 15% of the As Exchanged Common Shares).
Also in connection with the acquisition of The Shoppes at Carlsbad, in November 2015, the Operating Partnership, the Company and the Holder entered into a tax protection agreement, pursuant to which the Operating Partnership agreed not to transfer the property for a period of six years (through December 31, 2021) (the "Tax Protection Period") if such transfer would result in the recognition of taxable income or gain to the Holder.
The tax protection agreement also requires the Company and the Operating Partnership to indemnify the Holder against certain tax liabilities (calculated pursuant to the tax protection agreement) resulting from specified events (all of which depend upon actions initiated by the Operating Partnership or the Company), including, among others: (i) a transfer of the property during the Tax Protection Period; (ii) the redemption of Series A Preferred Units for cash during the Tax Protection Period; (iii) the redemption of Common Units (previously received by the Holder in connection with an optional redemption of Series A Preferred Units) for cash or shares of common stock during the Tax Protection Period; and (iv) the sale by the Holder of shares of common stock to the extent such shares had been received pursuant to a redemption of Common Units (previously received by the Holder in connection with an optional redemption of Series A Preferred Units during the Tax Protection Period), subject to certain limitations.
Issuer Purchases of Equity Securities
The following table summarizes repurchases of our common stock during the three months ended December 31, 2015:
Total Number of Shares Purchased | Average Price Paid Per Share | Total Number of Shares Purchased as Part of Publicly Announced Plans | Maximum Dollar Value of Shares that May Yet be Purchased Under the Plans (1) | ||||||||||
October 1 - October 31, 2015 | — | $ | — | — | $ | 50,000,000 | |||||||
November 1 - November 30, 2015 | — | $ | — | — | $ | 50,000,000 | |||||||
December 1, 2015 - December 31, 2015 | 238,055 | $ | 14.73 | 238,055 | $ | 46,495,410 | |||||||
Explanatory Note:
(1)On October 29, 2015, the Board of Directors authorized management to implement a stock repurchase program in the maximum amount of $50.0 million over a period of up to two years at prevailing market or negotiated prices.
35
Performance Graph
The following graph is a comparison of the four-year cumulative total return of our shares of Common Stock, the Standard & Poor’s 500 Index (the “S&P 500 Index”) and the MSCI US REIT (RMS) Index, a peer group index. The graph assumes that $100 was invested on January 12, 2012 (the date of our spin-off from GGP) in our shares of Common Stock, the S&P 500 Index and the MSCI US REIT (RMS) Index and that all dividends were reinvested without the payment of any commissions. There can be no assurance that the performance of our shares will continue in line with the same or similar trends depicted in the graph below.
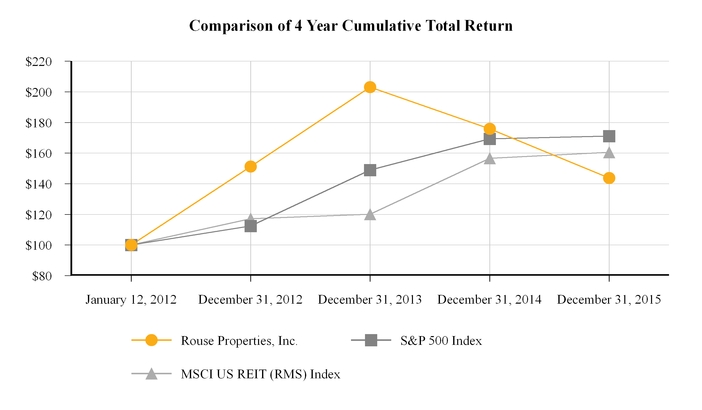
January 12, 2012 | December 31, 2012 | December 31, 2013 | December 31, 2014 | December 31, 2015 | |||||||||||
Rouse Properties, Inc. | $ | 100.00 | $ | 151.24 | $ | 203.10 | $ | 175.92 | $ | 143.78 | |||||
S&P 500 Index | $ | 100.00 | $ | 112.52 | $ | 148.97 | $ | 169.36 | $ | 171.10 | |||||
MSCI US REIT (RMS) Index | $ | 100.00 | $ | 117.20 | $ | 120.10 | $ | 156.58 | $ | 160.53 | |||||
36
ITEM 6. SELECTED FINANCIAL DATA
The following table sets forth the selected historical consolidated and combined financial and other data of our business. We were formed for the purpose of holding certain assets and assuming certain liabilities of GGP. Prior to January 12, 2012, we were a wholly-owned subsidiary of GGPLP. GGP distributed the assets and liabilities of 30 of its wholly-owned properties (“RPI Businesses”) to Rouse on January 12, 2012 (the “Spin-Off Date”). Prior to the completion of the spin-off, we did not conduct any business and did not have any material assets or liabilities. The selected historical financial data set forth below as of December 31, 2015, 2014, 2013, 2012 and 2011 and for the years ended December 31, 2015, 2014, 2013, 2012 and 2011 has been derived from our audited consolidated and combined financial statements.
Our consolidated and combined financial statements were carved-out from the financial information of GGP at a carrying value reflective of such historical cost in such GGP records for periods prior to the Spin-Off Date. Our historical financial results reflect allocations for certain corporate expenses which include, but are not limited to, costs related to property management, human resources, security, payroll and benefits, legal, corporate communications, information services and restructuring and reorganization. Costs of the services that were allocated or charged to us were based on either actual costs incurred or a proportion of costs estimated to be applicable to us based on a number of factors, most significantly our percentage of GGP's adjusted revenue, GLA of assets and number of properties. These results do not reflect what our expenses would have been had we been operating as a separate stand-alone public company in 2011. For the years ended December 31, 2012 and 2011, the corporate cost allocations were $0.4 million and $10.7 million, respectively.
Effective with the spin-off, we assumed responsibility for all of these functions and related costs and our costs as a stand-alone entity are higher than those allocated to us from GGP. The historical combined financial information presented prior to 2012 is not indicative of the results of operations, financial position or cash flows that would have been obtained if we had been an independent, stand-alone entity during those periods shown. See "Management's Discussion and Analysis of Financial Condition and Results of Operations—Overview—Basis of Presentation."
The historical results set forth below do not indicate results expected for any future periods. The selected financial data set forth below are qualified in their entirety by, and should be read in conjunction with, "Management's Discussion and Analysis of Financial Condition and Results of Operations" and our consolidated and combined financial statements and related notes thereto included elsewhere in this Annual Report.
37
Historical | ||||||||||||||||||||
Successor | ||||||||||||||||||||
Year Ended December 31, | ||||||||||||||||||||
2015 | 2014 | 2013 | 2012 | 2011 | ||||||||||||||||
(In thousands, except per share data ) | ||||||||||||||||||||
Operating Data: | ||||||||||||||||||||
Total revenues | $ | 305,384 | $ | 292,127 | $ | 243,542 | $ | 224,299 | $ | 223,359 | ||||||||||
Other operating expenses | (142,268 | ) | (144,422 | ) | (124,638 | ) | (129,565 | ) | (106,857 | ) | ||||||||||
Provisions for impairment | (2,900 | ) | (15,965 | ) | (15,159 | ) | — | — | ||||||||||||
Depreciation and amortization | (107,941 | ) | (100,302 | ) | (66,497 | ) | (67,709 | ) | (73,571 | ) | ||||||||||
Operating income | 52,275 | 31,438 | 37,248 | 27,025 | 42,931 | |||||||||||||||
Interest expense, net | (71,402 | ) | (82,586 | ) | (81,986 | ) | (89,348 | ) | (64,447 | ) | ||||||||||
Gain on extinguishment of debt | 26,558 | — | — | — | — | |||||||||||||||
Income (loss) before income taxes, gain on sale of real estate assets, and discontinued operations | 7,431 | (51,148 | ) | (44,738 | ) | (62,323 | ) | (21,516 | ) | |||||||||||
Provision for income taxes | (604 | ) | (537 | ) | (844 | ) | (445 | ) | (533 | ) | ||||||||||
Income (loss) from continuing operations before gain on sale of real estate assets | 6,827 | (51,685 | ) | (45,582 | ) | (62,768 | ) | (22,049 | ) | |||||||||||
Gain on sale of real estate assets | 34,796 | — | — | — | — | |||||||||||||||
Income (loss) from continuing operations | 41,623 | (51,685 | ) | (45,582 | ) | (62,768 | ) | (22,049 | ) | |||||||||||
Discontinued operations: | ||||||||||||||||||||
Loss from discontinued operations | — | — | (23,158 | ) | (5,891 | ) | (4,927 | ) | ||||||||||||
Gain on extinguishment of debt from discontinued operations | — | — | 13,995 | — | — | |||||||||||||||
Discontinued operations, net | — | — | (9,163 | ) | (5,891 | ) | (4,927 | ) | ||||||||||||
Net income (loss) | $ | 41,623 | $ | (51,685 | ) | $ | (54,745 | ) | $ | (68,659 | ) | $ | (26,976 | ) | ||||||
Net (income) loss attributable to non-controlling interests | 76 | (71 | ) | — | — | — | ||||||||||||||
Net income (loss) attributable to Rouse Properties, Inc. | $ | 41,699 | $ | (51,756 | ) | $ | (54,745 | ) | $ | (68,659 | ) | $ | (26,976 | ) | ||||||
Preferred distributions | (953 | ) | — | — | — | — | ||||||||||||||
Net income (loss) allocable to common shareholders | $ | 40,746 | $ | (51,756 | ) | $ | (54,745 | ) | $ | (68,659 | ) | $ | (26,976 | ) | ||||||
Net income (loss) from continuing operations per share attributable to Rouse Properties, Inc. - Basic | $ | 0.72 | $ | (0.90 | ) | $ | (0.92 | ) | $ | (1.36 | ) | $ | (0.61 | ) | ||||||
Net income (loss) from continuing operations per share attributable to Rouse Properties, Inc. - Diluted | $ | 0.72 | $ | (0.90 | ) | $ | (0.92 | ) | $ | (1.36 | ) | $ | (0.61 | ) | ||||||
Net income (loss) per share allocable to common shareholders- Basic | $ | 0.70 | $ | (0.90 | ) | $ | (1.11 | ) | $ | (1.49 | ) | $ | (0.75 | ) | ||||||
Net income (loss) per share allocable to common shareholders - Diluted | $ | 0.70 | $ | (0.90 | ) | $ | (1.11 | ) | $ | (1.49 | ) | $ | (0.75 | ) | ||||||
Dividends declared per share | $ | 0.72 | $ | 0.68 | $ | 0.52 | $ | 0.21 | $ | — | ||||||||||
Weighted average shares outstanding - Basic | 57,874,772 | 57,203,196 | 49,344,927 | 46,149,893 | 35,906,105 | |||||||||||||||
Weighted average shares outstanding - Diluted | 58,188,741 | 57,203,196 | 49,344,927 | 46,149,893 | 35,906,105 | |||||||||||||||
Cash Flow Data: | ||||||||||||||||||||
Operating activities | $ | 77,183 | $ | 82,301 | $ | 62,602 | $ | 38,277 | $ | 80,723 | ||||||||||
Investing activities | (229,987 | ) | (236,132 | ) | (464 | ) | (236,602 | ) | (25,370 | ) | ||||||||||
Financing activities | 143,916 | 153,915 | (56,006 | ) | 206,213 | (56,965 | ) | |||||||||||||
Other Financial Data: | ||||||||||||||||||||
NOI(1) | $ | 191,651 | $ | 178,054 | $ | 147,591 | $ | 129,627 | $ | 135,577 | ||||||||||
Core NOI(1) | 197,278 | 189,535 | 161,047 | 150,172 | 154,865 | |||||||||||||||
FFO(2) | 87,805 | 63,659 | 35,340 | 2,431 | 51,240 | |||||||||||||||
Core FFO(2) | 103,961 | 94,516 | 77,521 | 62,658 | 83,897 | |||||||||||||||
38
Historical | ||||||||||||||||||||
Successor | ||||||||||||||||||||
December 31, | ||||||||||||||||||||
2015 | 2014 | 2013 | 2012 | 2011 | ||||||||||||||||
(In thousands) | ||||||||||||||||||||
Investment in real estate, cost | $ | 2,579,600 | $ | 2,191,435 | $ | 1,948,131 | $ | 1,652,755 | $ | 1,462,482 | ||||||||||
Total assets | 2,529,258 | 2,270,400 | 2,019,510 | 1,905,073 | 1,583,524 | |||||||||||||||
Mortgage, notes and loans payable(3) | 1,706,513 | 1,584,499 | 1,454,546 | 1,283,491 | 1,059,684 | |||||||||||||||
Total liabilities | 1,853,801 | 1,737,065 | 1,564,229 | 1,372,177 | 1,157,196 | |||||||||||||||
Mezzanine equity | 140,953 | — | — | — | — | |||||||||||||||
Total equity | 534,504 | 533,335 | 455,281 | 532,896 | 426,328 | |||||||||||||||
Explanatory Notes:
(1) | NOI and Core NOI do not represent income from operations as defined by accounting principles generally accepted in the United States of America ("GAAP"). We use NOI and Core NOI as supplemental measures of our operating performance. For our definitions of NOI and Core NOI, as well as a discussion of their uses and inherent limitations, see "—Non-GAAP Financial Measures—Real Estate Property Net Operating Income and Core Net Operating Income" below. |
(2) | FFO and Core FFO do not represent cash flow from operations as defined by GAAP. We use FFO and Core FFO as supplemental measures of our operating performance. For our definitions of FFO and Core FFO as well as a discussion of their uses and inherent limitations, see "—Non-GAAP Financial Measures—Funds from Operations and Core Funds from Operations" below. |
(3) | Total debt includes $(0.3) million, $0.8 million, $9.6 million, $33.8 million, and $58.0 million of non-cash fair value adjustment on mortgage assumptions as of December 31, 2015, 2014, 2013, 2012 and 2011, respectively. |
Non-GAAP Financial Measures
Real Estate Property Net Operating Income and Core Net Operating Income
We present NOI and Core NOI, as defined below, in this Annual Report as supplemental measures of our performance that are not required by, or presented in accordance with, GAAP. We believe that NOI and Core NOI are useful supplemental measures of our operating performance. We define NOI as operating revenues (minimum rents, including lease termination fees, tenant recoveries, overage rents, and other income) less property and related expenses (real estate taxes, repairs and maintenance, marketing, other property expenses, and provision for doubtful accounts). We define Core NOI as NOI excluding straight-line rent, amortization of tenant inducements, amortization of above and below-market tenant leases, and amortization of above and below-market ground rent expense. Other real estate companies may use different methodologies for calculating NOI and Core NOI and, accordingly, our NOI and Core NOI may not be comparable to other real estate companies.
Because NOI and Core NOI exclude general and administrative expenses, interest expense, depreciation and amortization, impairment, other, reorganization items, strategic initiatives, provision for income taxes, gain (loss) on extinguishment of debt, gain (loss) on sale of real estate assets, preferred distributions, straight-line rent, above and below-market tenant leases, and above and below-market ground leases, we believe that NOI and Core NOI provide performance measures that, when compared year over year, reflect the revenues and expenses directly associated with owning and operating regional shopping malls and the impact on operations from trends in occupancy rates, rental rates and operating costs. These measures thereby provide an operating perspective not immediately apparent from GAAP operating income (loss) or net income (loss). We use NOI and Core NOI to evaluate our operating performance on a property-by-property basis because NOI and Core NOI allow us to evaluate the impact that factors such as lease structure, lease rates and tenant base, which vary by property, have on our operating results, gross margins and investment returns. Same Property portfolio Core NOI is presented to exclude termination income, the periodic effects of acquisitions of new properties, reductions in ownership as a result of sales or other transactions, certain properties undergoing redevelopment with significant disruption and assets that are considered special consideration assets due to a heightened probability of being conveyed to the lender absent substantive renegotiations.
In addition, management believes that NOI, Core NOI and Same Property portfolio Core NOI provide useful information to the investment community about our operating performance. However, due to the exclusions noted above, NOI and Core NOI should only be used as supplemental measures of our financial performance and not as an alternative to GAAP operating income (loss) or net income (loss). For reference, and as an aid in understanding management's computation of NOI, Core NOI and Same Property portfolio Core NOI, a reconciliation from consolidated net income (loss) allocable to common shareholders as computed in accordance with GAAP to NOI and Core NOI (including Same Property portfolio Core NOI) is presented below.
39
Successor | ||||||||||||||||||||
Year Ended December 31, | ||||||||||||||||||||
2015 | 2014 | 2013 | 2012 | 2011 | ||||||||||||||||
(In thousands) | ||||||||||||||||||||
Net income (loss) | $ | 41,623 | $ | (51,685 | ) | $ | (54,745 | ) | $ | (68,659 | ) | $ | (26,976 | ) | ||||||
Gain on extinguishment of debt | (26,558 | ) | — | (13,995 | ) | — | — | |||||||||||||
Gain on sale of real estate assets | (34,796 | ) | — | — | — | — | ||||||||||||||
Provision for income taxes | 604 | 537 | 844 | 445 | 533 | |||||||||||||||
Interest expense(1) | 71,420 | 82,909 | 85,761 | 96,889 | 70,984 | |||||||||||||||
Interest income | (18 | ) | (323 | ) | (548 | ) | (755 | ) | (36 | ) | ||||||||||
Other (2) | 6,491 | 5,437 | 4,223 | 9,965 | 1,526 | |||||||||||||||
Provision for impairment (3) | 2,900 | 15,965 | 36,820 | — | — | |||||||||||||||
Depreciation and amortization (4) | 107,941 | 100,302 | 67,260 | 71,090 | 78,216 | |||||||||||||||
General and administrative | 25,817 | 26,329 | 21,971 | 20,652 | 11,330 | |||||||||||||||
Non-controlling interest | (3,773 | ) | (1,417 | ) | — | — | — | |||||||||||||
NOI | $ | 191,651 | $ | 178,054 | $ | 147,591 | $ | 129,627 | $ | 135,577 | ||||||||||
Above and below market ground rent expense, net | 155 | 145 | 125 | 125 | 125 | |||||||||||||||
Above and below market tenant leases, net (5) | 6,562 | 13,066 | 15,848 | 24,028 | 25,194 | |||||||||||||||
Amortization of tenant inducements | 72 | 28 | 1,000 | — | — | |||||||||||||||
Amortization of straight line rent (6) | (1,162 | ) | (1,758 | ) | (3,517 | ) | (3,608 | ) | (6,031 | ) | ||||||||||
Core NOI | $ | 197,278 | $ | 189,535 | $ | 161,047 | $ | 150,172 | $ | 154,865 | ||||||||||
Non same property assets | (43,642 | ) | (39,301 | ) | (39,752 | ) | (44,854 | ) | — | |||||||||||
Termination income | (1,818 | ) | (2,203 | ) | (414 | ) | (507 | ) | — | |||||||||||
Same Property portfolio Core NOI | $ | 151,818 | $ | 148,031 | $ | 120,881 | $ | 104,811 | $ | 154,865 | ||||||||||
Explanatory Notes:
(1) For the years ended December 31, 2013, 2012, and 2011, interest expense included $3.2 million, $6.8 million and $6.5 million, respectively, of interest expense reclassified to discontinued operations.
(2) "Other" includes property acquisition costs, non-recurring costs related to the transition from Brookfield financial service center (our out-sourced provider of administrative services), and non-comparable costs related to the spin-off from GGP.
(3) For the year ended December 31, 2013, provision for impairment included $21.6 million of provision for impairment reclassified to discontinued operations.
(4) For the years ended December 31, 2013, 2012, and 2011, depreciation and amortization expense included $0.8 million, $3.4 million and $4.6 million, respectively, of depreciation and amortization reclassified to discontinued operations.
(5) For the years ended December 31, 2013, 2012, and 2011, above and below market tenant leases, net, included ($0.2) million, ($2.3) million, and ($2.6) million, respectively, which were reclassified to discontinued operations.
(6) For the years ended December 31, 2013, 2012, and 2011, amortization of straight line rent included $0.03 million, $0.2 million, and $0.02 million, respectively, which were reclassified to discontinued operations.
40
Funds from Operations and Core Funds from Operations
Consistent with real estate industry and investment community practices, we use FFO, as defined by the National Association of Real Estate Investment Trusts ("NAREIT"), as a supplemental measure of our operating performance. NAREIT defines FFO as net income (loss) allocable to common shareholders (computed in accordance with GAAP), excluding impairment write-downs on depreciable real estate, gains or losses from cumulative effects of accounting changes, extraordinary items and sales of depreciable properties, plus real estate related depreciation and amortization. We also include Core FFO as a supplemental measurement of operating performance. We define Core FFO as FFO excluding straight-line rent, amortization of tenant inducements, amortization of above- and below-market tenant leases, amortization of above- and below-market ground rent expense, reorganization items, amortization of deferred financing costs, mark-to-market adjustments on debt, write-off of market rate adjustments on debt, write-off of deferred financing costs, debt extinguishment costs, provision for income taxes, gain (loss) on extinguishment of debt, gain (loss) on sale of real estate assets and other expense. We also adjust for the portion of consolidated net income (loss) applicable to non-controlling interests of joint venture partners to reflect FFO allocable to the Company's common shareholders. Other real estate companies may use different methodologies for calculating FFO and Core FFO and, accordingly, our FFO and Core FFO may not be comparable to other real estate companies.
We consider FFO and Core FFO useful supplemental measures and a complement to GAAP measures because they facilitate an understanding of the operating performance of our properties. FFO does not include real estate depreciation and amortization required by GAAP because these amounts are computed to allocate the cost of a property over its useful life. Since values for well-maintained real estate assets have historically increased or decreased based upon prevailing market conditions, we believe that FFO provides investors with a clearer view of our operating performance, particularly with respect to our mall properties. Core FFO does not include certain items that are non-cash and certain non-comparable items. FFO and Core FFO are not measurements of our financial performance under GAAP and should not be considered as an alternative to revenues, operating income (loss), net income (loss) or any other performance measures derived in accordance with GAAP or as an alternative to cash flows from operating activities as a measure of our liquidity.
For reference, and as an aid in understanding management's computation of FFO and Core FFO, a reconciliation from the combined and consolidated net income (loss) as computed in accordance with GAAP to FFO allocable to the Company's common shareholders and Core FFO allocable to the Company's common shareholders is presented below:
41
Successor | ||||||||||||||||||||
2015 | 2014 | 2013 | 2012 | 2011 | ||||||||||||||||
Net income (loss) | $ | 41,623 | $ | (51,685 | ) | $ | (54,745 | ) | $ | (68,659 | ) | $ | (26,976 | ) | ||||||
Depreciation and amortization (1) | 107,941 | 100,302 | 67,260 | 71,090 | 78,216 | |||||||||||||||
Provision for impairment (2) | 2,900 | 15,965 | 36,820 | — | — | |||||||||||||||
Gain on extinguishment of debt | (26,558 | ) | — | (13,995 | ) | — | — | |||||||||||||
Gain on sale of real estate assets | (34,796 | ) | — | — | — | — | ||||||||||||||
Non-controlling interest | (2,352 | ) | (923 | ) | — | — | — | |||||||||||||
Preferred distributions | (953 | ) | — | — | — | — | ||||||||||||||
FFO allocable to the Company's common shareholders | $ | 87,805 | $ | 63,659 | $ | 35,340 | $ | 2,431 | $ | 51,240 | ||||||||||
Provision for income taxes | 604 | 537 | 844 | 445 | 533 | |||||||||||||||
Interest expense (3): | ||||||||||||||||||||
Amortization and write-off of market rate adjustments | (804 | ) | 8,877 | 8,755 | 19,460 | 9,721 | ||||||||||||||
Amortization and write-off of deferred financing costs | 4,214 | 4,209 | 12,544 | 9,812 | — | |||||||||||||||
Debt extinguishment costs | 7 | 259 | 2,276 | — | 1,589 | |||||||||||||||
Amortization of straight line rent for corporate and regional offices | 17 | 56 | 83 | — | — | |||||||||||||||
Other (4) | 6,491 | 5,437 | 4,223 | 9,965 | 1,526 | |||||||||||||||
Above and below market ground rent expense, net | 155 | 145 | 125 | 125 | 125 | |||||||||||||||
Above and below market tenant leases, net (5) | 6,562 | 13,066 | 15,848 | 24,028 | 25,194 | |||||||||||||||
Amortization of tenant inducements | 72 | 28 | 1,000 | — | — | |||||||||||||||
Amortization of straight line rent (6) | (1,162 | ) | (1,757 | ) | (3,517 | ) | (3,608 | ) | (6,031 | ) | ||||||||||
Core FFO allocable to the Company's common shareholders | $ | 103,961 | $ | 94,516 | $ | 77,521 | $ | 62,658 | $ | 83,897 | ||||||||||
Explanatory Notes:
(1) For the years ended December 31, 2013, 2012, and 2011, depreciation and amortization expense included $0.8 million, $3.4 million and $4.6 million, respectively, of depreciation and amortization reclassified to discontinued operations.
(2) For the year ended December 31, 2013, provision for impairment included $21.6 million of provision for impairment reclassified to discontinued operations. (3) For the years ended December 31, 2013, 2012, and 2011, interest expense included $3.2 million, $6.8 million, and $6.5 million, respectively, of interest expense reclassified to discontinued operations.
(4) "Other" includes property acquisition costs, non-recurring costs related to the transition from Brookfield financial service center (our out-sourced provider of administrative services), and non-comparable costs related to the spin-off from GGP.
(5) For the years ended December 31, 2013, 2012, and 2011, above and below market tenant leases, net, included ($0.2) million, ($2.3) million, and ($2.6) million, respectively, which were reclassified to discontinued operations.
(6) For the years ended December 31, 2013, 2012, and 2011, amortization of straight line rent included $0.03 million, $0.2 million, and $0.02 million, respectively, which were reclassified to discontinued operations.
ITEM 7. MANAGEMENT'S DISCUSSION AND ANALYSIS OF FINANCIAL CONDITION AND RESULTS OF OPERATIONS
This section contains forward-looking statements that involve risks and uncertainties. Our actual results may vary materially from those discussed in the forward-looking statements as a result of various factors, including, without limitation, those set forth in "Risk Factors" and the other matters set forth in this Annual Report. See "Cautionary Statement Regarding Forward-Looking Statements."
All references to numbered Notes are to specific footnotes to our Consolidated Financial Statements included in this Annual Report. You should read this discussion in conjunction with our Consolidated Financial Statements, the notes thereto and other financial information included elsewhere in this Annual Report. Our financial statements are prepared in accordance with GAAP. Capitalized terms used, but not defined, in this Management's Discussion and Analysis of Financial Condition and Results of Operations ("MD&A") have the same meanings as in such Notes.
42
Overview—Introduction
As of December 31, 2015, our portfolio consisted of 36 malls and retail centers in 21 states totaling over 24.9 million square feet of retail space which are 90.9% leased and 88.5% occupied. We elected to be treated as a REIT beginning with the filing of our tax returns for the 2011 taxable year. As of December 31, 2015, we have met the requirements of a REIT and have filed our tax returns for the 2014 fiscal year accordingly. Subject to our ability to meet the requirements of a REIT, we intend to maintain this status in future periods.
The majority of the income from our properties is derived from rents received through long-term leases with retail tenants. These long-term leases generally require the tenants to pay base rent which is a fixed amount specified in the lease. The base rent is often subject to scheduled increases during the term of the lease. Our financial statements refer to this as "minimum rents." Certain of our leases also include a component which requires tenants to pay amounts related to all or substantially all of their share of real estate taxes and certain property operating expenses, including common area maintenance and insurance. The revenue earned attributable to real estate tax and operating expense recoveries is recorded as "tenant recoveries." Another component of income is overage rent. Overage rent is paid by a tenant when its sales exceed an agreed upon minimum amount. Overage rent is calculated by multiplying the tenant's sales in excess of the minimum amount by a percentage defined in the lease. Overage rent is typically earned in the fourth quarter.
Our objective is to achieve growth in NOI, Core NOI, FFO and Core FFO by leasing, operating and repositioning retail properties with locations that are either market dominant (the only mall within an extended distance) or trade area dominant (the premier mall serving the defined regional consumer). We seek to continue to control costs and to deliver an appropriate tenant mix, higher occupancy rates and increased sales productivity, resulting in higher minimum rents.
We believe that the most significant operating factor affecting incremental cash flow, NOI, Core NOI, FFO and Core FFO is increased aggregate rents collected from tenants at our properties. These rental revenue increases are primarily achieved by:
• | Increasing occupancy at the properties so that more space is generating rent; |
• | Increasing tenant sales in which we participate through overage rent; |
• | Re-leasing existing space and renewing expiring leases at rates higher than expiring or existing rates; and |
• | Prudently investing capital into our properties to generate an increased overall return. |
Overview—Basis of Presentation
We were formed in August 2011 for the purpose of holding certain assets and assuming certain liabilities of GGP. Following the distribution of these assets and liabilities to us on January 12, 2012, we began operating our business as a stand-alone owner and operator of regional malls. The financial information included in this Annual Report has been presented on a consolidated basis for the period after the Spin-Off Date. The financial information is presented on a combined basis prior to the Spin-Off Date as the entities were under common control and ownership, and reflects the allocation of certain overhead items within property management and other costs in the accompanying financial statements.
The historical financial information included in this Annual Report prior to the Spin-Off Date does not necessarily reflect the financial condition, results of operations or cash flows that we would have achieved as a separate, publicly-traded company during the periods presented or those that we will achieve in the future primarily as a result of the following factors:
• | Prior to the spin-off, our business was operated by GGP as part of its broader corporate organization, rather than as a separate, stand-alone company. GGP or its affiliates performed various corporate functions for us, including, but not limited to, property management, human resources, security, payroll and benefits, legal, corporate communications, information services, restructuring and reorganization. Costs of the services that were allocated or charged to us were based on either actual costs incurred or a proportion of costs estimated to be applicable to us based on a number of factors, most significantly our percentage of GGP's adjusted revenue, GLA of assets and also the number of properties. Our historical financial results reflect allocations for certain corporate costs and we believe such allocations are reasonable; however, such results do not reflect what our expenses would have been had we been operating as a separate, stand-alone public company. |
• | Prior to the spin-off, portions of our business were integrated with the other businesses of GGP. Historically, we have shared economies of scope and scale in costs, employees, vendor relationships and certain customer relationships. We entered into a transition services agreement with GGP that governs certain commercial and other relationships. As of December 31, 2013, the agreement with GGP was terminated. |
43
Recent Developments
During 2015, we successfully completed transactions promoting our long-term strategy as a dominant regional mall owner and operator:
Acquisitions
• | Acquired Mt. Shasta Mall located in Redding, CA for a total purchase price of approximately $49.0 million, net of closing costs and adjustments. In conjunction with the closing of this transaction, we closed on a new $31.9 million non-recourse mortgage loan that bears interest at 4.19%, matures in March 2025, is interest only for the first three years and amortizes over 30 years thereafter; and |
• | Acquired Fig Garden Village located in Fresno, CA for a total purchase price of approximately $106.1 million, net of closing costs and adjustments. In conjunction with the closing of this transaction, we closed on a new $74.2 million non-recourse mortgage loan that bears interest at 4.14%, matures in June 2025, is interest only for the first five years and amortizes over 30 years thereafter; and |
• | Acquired The Shoppes at Carlsbad located in Carlsbad, CA for a total purchase price of approximately $170.0 million, net of closing costs and adjustments. In conjunction with the closing of this transaction, the Operating Partnership issued $140.0 million of its Series A Preferred Units to the seller. Distributions on the Series A Preferred Units accumulate at an annual rate of 5% and are payable quarterly. The Series A Preferred Units may be redeemed by us after three years (subject to certain tax protection payments if we redeem the Series A Preferred Units prior to 2022) and by the holder after ten years, in either case at par plus accumulated and unpaid distributions and in the form of cash or Common Units of the Operating Partnership, as determined by us. For further detail see Note 10 to our Consolidated Financial Statements. |
Dispositions
• | In January 2015, we sold The Shoppes at Knollwood Mall located in St. Louis Park, MN, for gross proceeds of $106.7 million. The mortgage debt of $35.1 million was defeased simultaneously with the sale of the property. Net proceeds of $54.7 million were available for general corporate purposes, including acquisitions and ongoing capital investments within the existing portfolio. We recognized a gain of $34.8 million as a result of the disposition, which is reflected in "Gain on sale of real estate assets" on our Consolidated Statements of Operations and Comprehensive Income (Loss) for the year ended December 31, 2015. |
• | In March 2015, we conveyed Steeplegate Mall located in Concord, NH to its mortgage lender in full satisfaction of the debt. The loan had a net outstanding balance of approximately $45.9 million. The Company recognized a $22.8 million gain related to the debt extinguishment which is reflected in "Gain on extinguishment of debt" on our Consolidated Statements of Operations and Comprehensive Income (Loss) for the year ended December 31, 2015. |
• | In April 2015, we conveyed Collin Creek Mall, located in Plano, TX, to its mortgage lender in full satisfaction of the debt. The loan had a net outstanding balance of approximately $57.6 million. The Company recognized a $3.8 million gain related to the debt extinguishment which is reflected in "Gain on extinguishment of debt" on our Consolidated Statements of Operations and Comprehensive Income (Loss) for the year ended December 31, 2015. |
Refinancing
• | Exercised a portion of the "accordion feature" on our 2013 Senior Facility, increasing the 2013 Term Loan from $260.0 million to $285.0 million and increasing the availability on the 2013 Revolver from $285.0 million to $310.0 million. |
• | Refinanced the mortgage loan associated with NewPark Mall for $135.0 million, with an initial funding of $114.3 million. The loan provides for an additional funding of up to $20.8 million upon achieving certain conditions. The loan bears interest at a floating rate of LIBOR (30 day) plus 210 basis points, matures in September 2018 and amortizes over 30 years thereafter. An interest rate swap is effective on this loan beginning January 1, 2016, which fixed the interest rate at 3.26%, through September 2018. This loan replaced a $64.7 million non-recourse mortgage loan which had a floating rate of LIBOR (30 day) plus 235 basis points. |
• | Refinanced the mortgage loan associated with Greenville Mall with a new non-recourse mortgage loan for $45.5 million, which bears interest at a fixed rate of 4.46%, matures in November 2025, and amortizes over 30 years. This loan replaced a $40.2 million non-recourse mortgage loan which had a fixed interest rate of 5.29%. |
44
• | Refinanced the loan associated with The Shoppes at Bel Air with a new non-recourse mortgage loan for $120.0 million. The initial funding of $110.5 million was used to retire the outstanding mortgage loan of $109.5 million, which had a fixed interest rate of 5.30%. The loan provides for an additional subsequent funding of $9.5 million upon achieving certain conditions. The loans bears interest at a floating rate of LIBOR (30 day) plus 235 basis points and is interest only for the first two years. We entered into an interest rate swap on this loan beginning in January 2016, which fixed the interest rate at 3.34% through September 2018. |
• | Removed The Shoppes at Gateway from the 2013 Senior Facility (as defined below) collateral pool and placed a new $75.0 million non-recourse mortgage loan on the property. The loan bears interest at a floating rate of LIBOR (30 day) plus 220 basis points, matures in January 2020, is interest only for the first 4 years and amortizes over 30 years thereafter. The mortgage loan on the property has a one year extension option. We entered into an interest rate swap on the loan which fixed the interest rate at 3.64% through January 2020. In connection with the removal of The Shoppes at Gateway from the 2013 Senior Facility, The Shoppes at Carlsbad was added to the 2013 Senior Facility collateral pool with no change to the outstanding 2013 Senior Facility balance. |
Equity
• | On October 29, 2015, our Board of Directors authorized management to implement a stock repurchase program in the maximum amount of $50.0 million over a period of up to two years. Purchases made pursuant to the stock repurchase program may be made in the open market from time to time as permitted by federal securities laws and other legal requirements. The timing, manner, price and amount of any repurchases will be determined by the Company in its discretion and will be subject to economic and market conditions, stock price, applicable legal requirements and other factors. The stock repurchase program may be suspended or discontinued at any time. |
• | During the year ended December 31, 2015, we repurchased 238,055 shares of our outstanding Common Stock for approximately $3.5 million, at an average cost of $14.73 per share. As of December 31, 2015, we had $46.5 million of remaining capacity to repurchase common stock under the stock repurchase program. |
Other
• | On February 25, 2016, we entered into a definitive merger agreement to be acquired by affiliates of Brookfield Asset Management for $18.25 per share in an all-cash transaction, a portion of which may be paid out as a special dividend. Under the terms of the merger agreement, Brookfield will acquire all of the outstanding shares of our common stock, other than those shares currently held by Brookfield Property Partners L.P. and its affiliates, in a transaction valued at approximately $2.8 billion, including our indebtedness. The merger agreement prohibits the payment of any further dividends by us, other than as necessary to maintain our REIT status and a closing dividend as part of the $18.25 per share consideration payable in the transaction. The purchase price represents a premium of approximately 35% over our closing stock price on January 15, 2016, the last trading day prior to Brookfield’s announcement of the proposal to acquire us. The Special Committee of our Board of Directors unanimously approved the merger agreement. Completion of the transaction is expected to occur in the third quarter of 2016, and is contingent upon customary closing conditions, including the approval of the holders of a majority of the outstanding shares of our common stock and a majority of the outstanding shares of our common stock not currently held by Brookfield Property Partners L.P. and its affiliates. Brookfield Property Partners L.P. and its affiliates have agreed to vote in favor of the transaction. The transaction is not subject to a financing contingency. |
45
Results of Operations
Year Ended December 31, 2015 compared to the Year Ended December 31, 2014
December 31, 2015 | December 31, 2014 | $ Change | % Change | ||||||||||||
(In thousands) | |||||||||||||||
Revenues: | |||||||||||||||
Minimum rents | $ | 212,072 | $ | 200,354 | $ | 11,718 | 5.8 | % | |||||||
Tenant recoveries | 78,287 | 77,580 | 707 | 0.9 | |||||||||||
Overage rents | 7,372 | 6,470 | 902 | 13.9 | |||||||||||
Other | 7,653 | 7,723 | (70 | ) | (0.9 | ) | |||||||||
Total revenues | 305,384 | 292,127 | 13,257 | 4.5 | |||||||||||
Expenses: | |||||||||||||||
Property operating costs | 68,770 | 70,269 | (1,499 | ) | (2.1 | ) | |||||||||
Real estate taxes | 27,075 | 26,571 | 504 | 1.9 | |||||||||||
Property maintenance costs | 10,223 | 11,331 | (1,108 | ) | (9.8 | ) | |||||||||
Marketing | 2,146 | 3,257 | (1,111 | ) | (34.1 | ) | |||||||||
Provision for doubtful accounts | 1,746 | 1,228 | 518 | 42.2 | |||||||||||
General and administrative | 25,817 | 26,329 | (512 | ) | (1.9 | ) | |||||||||
Provision for impairment | 2,900 | 15,965 | (13,065 | ) | (81.8 | ) | |||||||||
Depreciation and amortization | 107,941 | 100,302 | 7,639 | 7.6 | |||||||||||
Other | 6,491 | 5,437 | 1,054 | 19.4 | |||||||||||
Total operating expenses | 253,109 | 260,689 | (7,580 | ) | (2.9 | ) | |||||||||
Operating income | 52,275 | 31,438 | 20,837 | 66.3 | |||||||||||
Interest income | 18 | 323 | (305 | ) | (94.4 | ) | |||||||||
Interest expense | (71,420 | ) | (82,909 | ) | 11,489 | (13.9 | ) | ||||||||
Gain on extinguishment of debt | 26,558 | — | 26,558 | 100.0 | |||||||||||
Income (loss) before income taxes, gain on sale of real estate assets, and discontinued operations | 7,431 | (51,148 | ) | 58,579 | (114.5 | ) | |||||||||
Provision for income taxes | (604 | ) | (537 | ) | (67 | ) | 12.5 | ||||||||
Income (loss) from continuing operations before gain on sale of real estate assets | 6,827 | (51,685 | ) | 58,512 | (113.2 | ) | |||||||||
Gain on sale of real estate assets | 34,796 | — | 34,796 | 100.0 | |||||||||||
Income (loss) from continuing operations | 41,623 | (51,685 | ) | 93,308 | (180.5 | ) | |||||||||
Net income (loss) | $ | 41,623 | $ | (51,685 | ) | $ | 93,308 | (180.5 | )% | ||||||
Revenues
Total revenues increased by $13.3 million for the year ended December 31, 2015 compared to the year ended December 31, 2014. The acquisitions of The Shoppes at Bel Air, The Mall at Barnes Crossing, Mt. Shasta Mall, Fig Garden Village and The Shoppes at Carlsbad (the "Acquired Properties") during 2014 and 2015 provided $28.8 million of the increase in revenues. These increases were partially offset by a revenue decrease of $12.1 million related to the dispositions of The Shoppes at Knollwood Mall, Steeplegate Mall and Collin Creek Mall (the "Asset Dispositions") and $4.0 million related to the redevelopments of NewPark Mall, The Shoppes at Gateway and Spring Hill Mall (the "Redevelopment Properties").
Operating Expenses
Property operating expenses decreased by $2.7 million for the year ended December 31, 2015 compared to the year ended December 31, 2014. Property operating expenses include real estate taxes, property maintenance costs, marketing, property operating costs, and provision for doubtful accounts. Expenses related to the Acquired Properties increased property operating expenses by $9.3 million, which were offset by $7.3 million in decreased expenses related to the Asset Dispositions. Our Same
46
Property portfolio's operating expenses decreased by $2.7 million year over year with the remaining decrease related to our Redevelopment Properties. For the Same Property portfolio, expense savings were achieved through cost reduction initiatives in marketing and property operations.
General and administrative expenses decreased by $0.5 million for the year ended December 31, 2015 compared to the year ended December 31, 2014 due primarily to a decrease in information technology expenses resulting from the transition off the Brookfield IT platform to our IT platform.
Provision for impairment decreased by $13.1 million as a result of an impairment we recorded of $10.9 million and $5.1 million on Steeplegate Mall and Collin Creek Mall during the year ended December 31, 2014. The 2014 impairments were offset by an additional impairment of $2.9 million recorded on Collin Creek Mall during the year ended December 31, 2015.
Depreciation and amortization expense increased by $7.6 million for the year ended December 31, 2015 compared to the year ended December 31, 2014. The Acquired Properties added $17.2 million in depreciation and amortization expense year over year, offset by $4.1 million in decreased expense as a result of Asset Dispositions. Our Same Property portfolio's depreciation and amortization expense decreased by $5.5 million as a result of a decline in amortization expense of lease in place value and $2.4 million in acceleration of costs related to the Brookfield IT platform being fully depreciated upon implementation of our IT Platform in May 2015.
Other Income and Expenses
Other expenses increased by $1.1 million for the year ended December 31, 2015 compared to the year ended December 31, 2014, of which $1.0 million was due to the non-recurring transaction costs we incurred for properties acquired during 2015 and $0.9 million due to non-recurring costs we incurred for consultation associated with developing our IT platform and monthly Brookfield costs. This was offset by a decrease in compensation and benefits expenses of $0.6 million due Rouse no longer utilizing Brookfield's Financial Services Center.
47
Year Ended December 31, 2014 compared to the Year Ended December 31, 2013
December 31, 2014 | December 31, 2013 | $ Change | % Change | ||||||||||||
(In thousands) | |||||||||||||||
Revenues: | |||||||||||||||
Minimum rents | $ | 200,354 | $ | 165,097 | $ | 35,257 | 21.4 | % | |||||||
Tenant recoveries | 77,580 | 66,061 | 11,519 | 17.4 | |||||||||||
Overage rents | 6,470 | 5,943 | 527 | 8.9 | |||||||||||
Other | 7,723 | 6,441 | 1,282 | 19.9 | |||||||||||
Total revenues | 292,127 | 243,542 | 48,585 | 19.9 | |||||||||||
Expenses: | |||||||||||||||
Property operating costs | 70,269 | 60,288 | 9,981 | 16.6 | |||||||||||
Real estate taxes | 26,571 | 22,089 | 4,482 | 20.3 | |||||||||||
Property maintenance costs | 11,331 | 11,446 | (115 | ) | (1.0 | ) | |||||||||
Marketing | 3,257 | 3,734 | (477 | ) | (12.8 | ) | |||||||||
Provision for doubtful accounts | 1,228 | 887 | 341 | 38.4 | |||||||||||
General and administrative | 26,329 | 21,971 | 4,358 | 19.8 | |||||||||||
Provision for impairment | 15,965 | 15,159 | 806 | 5.3 | |||||||||||
Depreciation and amortization | 100,302 | 66,497 | 33,805 | 50.8 | |||||||||||
Other | 5,437 | 4,223 | 1,214 | 28.7 | |||||||||||
Total operating expenses | 260,689 | 206,294 | 54,395 | 26.4 | |||||||||||
Operating income | 31,438 | 37,248 | (5,810 | ) | (15.6 | ) | |||||||||
Interest income | 323 | 548 | (225 | ) | (41.1 | ) | |||||||||
Interest expense | (82,909 | ) | (82,534 | ) | (375 | ) | 0.5 | ||||||||
Loss before income taxes, gain on sale of real estate assets, and discontinued operations | (51,148 | ) | (44,738 | ) | (6,410 | ) | 14.3 | ||||||||
Provision for income taxes | (537 | ) | (844 | ) | 307 | (36.4 | ) | ||||||||
Loss from continuing operations before gain on sale of real estate assets | (51,685 | ) | (45,582 | ) | (6,103 | ) | 13.4 | ||||||||
Loss from continuing operations | (51,685 | ) | (45,582 | ) | (6,103 | ) | 13.4 | ||||||||
Discontinued operations: | |||||||||||||||
Loss from discontinued operations | — | (23,158 | ) | 23,158 | (100.0 | ) | |||||||||
Gain on extinguishment of debt from discontinued operations | — | 13,995 | (13,995 | ) | (100.0 | ) | |||||||||
Discontinued operations, net | — | (9,163 | ) | 9,163 | (100.0 | ) | |||||||||
Net loss | $ | (51,685 | ) | $ | (54,745 | ) | $ | 3,060 | (5.6 | )% | |||||
Revenues
Total revenues increased by $48.6 million for the year ended December 31, 2014 compared to the year ended December 31, 2013. The acquisitions of Greenville Mall, Chesterfield Towne Center, The Centre at Salisbury, The Shoppes at Bel Air and The Mall at Barnes Crossing during 2013 and 2014 provided $51.0 million of the increase in revenues, offset by a decline of $5.7 million in revenues on the properties undergoing redevelopment and special consideration assets. The Same Property portfolio contributed an increase in revenues of $3.3 million during the year ended December 31, 2014 compared to the year ended December 31, 2013.
Operating Expenses
Property operating expenses increased by $14.2 million for the year ended December 31, 2014 compared to the year ended December 31, 2013. Property operating expenses include real estate taxes, property maintenance costs, marketing, property operating costs, and provision for doubtful accounts. An increase of $14.6 million during the year ended December 31, 2014 resulted from the property acquisitions of Greenville Mall, Chesterfield Towne Center, The Centre at Salisbury, The Shoppes at Bel Air and The Mall at Barnes Crossing. The Same Property portfolio experienced an expense savings of $1.1 million while the operating expense of the properties undergoing redevelopment and special consideration assets increased by $0.7 million.
48
General and administrative expenses increased by $4.4 million for the year ended December 31, 2014 compared to the year ended December 31, 2013 which was primarily attributable to the increase of costs for our current outsourced information technology platform provided by Brookfield Corporate Operations, LLC ("BCO"). Also contributing to the increase was an additional $2.1 million in compensation related costs due to a full year of normalized salary for the ramp up of staffing that occurred throughout 2013 and new hires hired throughout 2014.
Provision for impairment increased by $0.8 million as a result of impairments recorded on Steeplegate Mall and Collin Creek Mall during the year ended December 31, 2014. During the year ended December 31, 2013, we recorded a provision for impairment of $15.2 million on Steeplegate Mall. As of December 31, 2014, we assessed whether the carrying value of the properties could be recovered through the estimated future undiscounted cash flows. As our intended holding period has changed for the two properties, the undiscounted cash flows were less than the carrying amount of the assets. As a result, we recorded an impairment charge of $16.0 million for the excess carrying amount over the estimated fair value.
Depreciation and amortization expense increased by $33.8 million for the year ended December 31, 2014 compared to the year ended December 31, 2013. The acquisitions of Greenville Mall, Chesterfield Towne Center, The Centre at Salisbury, The Shoppes at Bel Air and The Mall at Barnes Crossing resulted in $23.3 million of the increase in depreciation and amortization expense. The remaining increase is the result of additional depreciation and amortization on recently completed property redevelopments.
Other Income and Expenses
Discontinued operations, net, decreased for the year ended December 31, 2014 compared to the year ended December 31, 2013. During the year ended December 31, 2013, we conveyed our interest in Boulevard Mall to the lender of the loan (see Note 8 to the Consolidated Financial Statements) and, as such, the historical operations of this property are presented in "Discontinued operations, net". No assets were disposed of during the year ended December 31, 2014.
Liquidity and Capital Resources
Our primary uses of cash include payment of operating expenses, working capital, capital expenditures, debt repayment, including principal and interest, reinvestment in properties, development and redevelopment of properties, acquisitions, tenant allowances, and dividends.
Our primary sources of cash are operating cash flow, refinancings of existing loans, equity offerings, asset sales and borrowings under our 2013 Revolver.
Our short-term (less than one year) liquidity requirements include scheduled debt maturities, recurring operating costs, capital expenditures, debt service requirements, and dividend requirements on our shares of common stock. We anticipate that these needs will be met with cash flows provided by operations and funds available under our 2013 Revolver.
Our long-term (greater than one year) liquidity requirements include scheduled debt maturities, capital expenditures to maintain, renovate and expand existing malls, property acquisitions, and development projects. Management anticipates that net cash provided by operating activities, asset sales, the funds available under our 2013 Revolver, and funds received from equity offerings will provide sufficient capital resources to meet our long-term liquidity requirements.
As of December 31, 2015, our consolidated contractual debt, excluding non-cash debt market rate adjustments, was approximately $1.71 billion. The aggregate principal and interest payments due on our outstanding indebtedness as of December 31, 2015 was approximately $325.2 million for the year ending 2016 and approximately $122.8 million for the year ending 2017.
49
Mortgages, notes and loans payable and the weighted-average interest rates are summarized as follows as of December 31, 2015 and December 31, 2014 (dollars in thousands):
December 31, 2015 | Weighted Average Interest Rate | December 31, 2014 | Weighted Average Interest Rate | ||||||||||||
Fixed rate debt: | |||||||||||||||
Collateralized mortgages, notes and loans payable | $ | 1,138,158 | 4.75 | % | $ | 1,248,426 | 5.07 | % | |||||||
Total Fixed-rate debt | 1,138,158 | 4.75 | % | 1,248,426 | 5.07 | % | |||||||||
Variable rate debt: | |||||||||||||||
Collateralized mortgages, notes and loans payable (1) | 509,695 | 2.72 | % | 325,304 | 3.02 | % | |||||||||
2013 Revolver | 59,000 | 2.76 | % | 10,000 | 2.92 | % | |||||||||
Total Variable rate debt | 568,695 | 2.72 | % | 335,304 | 3.02 | % | |||||||||
Add: Market rate adjustments | (340 | ) | 769 | ||||||||||||
Total mortgages, notes and loans payable | $ | 1,706,513 | 4.07 | % | (2) | $ | 1,584,499 | 4.64 | % | (2) | |||||
Explanatory Notes:
(1) A swap is effective on two loans beginning January 1, 2016, which fixed the interest rate in 2016.
(2) Total mortgages, notes and loan payable weighted average interest rates excludes market rate adjustments.
Corporate Facility
2013 Senior Facility
On November 22, 2013, we entered into a $510.0 million secured credit facility that provides borrowings on a revolving basis of up to $250.0 million (the "2013 Revolver") and a $260.0 million senior secured term loan (the "2013 Term Loan" and together with the 2013 Revolver, the "2013 Senior Facility"). Borrowings on the 2013 Senior Facility bear interest at LIBOR plus 185 to 300 basis points based on the Company's corporate leverage. We have the option, subject to the satisfaction of certain conditions precedent, to exercise an "accordion" feature to increase the commitments under the 2013 Revolver and/or incur additional term loans in the aggregate amount of $250.0 million such that the aggregate amount of the commitments and outstanding loans under the 2013 Secured Facility does not exceed $760.0 million. During the year ended December 31, 2014, through an amendment to the 2013 Senior Facility (the "2014 Amendment") we exercised a portion of the "accordion" feature on the 2013 Senior Facility to increase the available borrowings of the 2013 Revolver thereunder from $250.0 million to $285.0 million. Then, during the year ended December 31, 2015, through an amendment to the 2013 Senior Facility, we exercised another portion of the "accordion" feature which increased the aggregate amount of commitments under the 2013 Senior Facility from $545.0 million million to $595.0 million. The exercise increased availability on the 2013 Revolver from $285.0 million to $310.0 million and increased the 2013 Term Loan from $260.0 million to $285.0 million. The term and rates of the 2013 Senior Facility were otherwise unchanged.
The 2013 Revolver has an initial term of four years with a one year extension option and the 2013 Term Loan has a term of five years. As of December 31, 2015, we have drawn $59.0 million on the 2013 Revolver. We are required to pay an unused fee related to the 2013 Revolver equal to 0.20% per year if the aggregate unused amount is greater than or equal to 50% of the 2013 Revolver or 0.30% per year if the aggregate unused amount is less than 50% of the 2013 Revolver. During the years ended December 31, 2015 and 2014, we incurred $0.7 million and $0.8 million, respectively, of unused fees related to the 2013 Revolver. Under the 2013 Revolver, letters of credit totaling $5.6 million were outstanding as of December 31, 2015 in connection with three properties. Additionally, we had $0.1 million of letters of credit outstanding in relation to The Shoppes at Knollwood Mall. During each of the years ended December 31, 2015 and 2014, the Company incurred $0.1 million of letter of credit fees.
The 2013 Senior Facility contains representations and warranties, affirmative and negative covenants and defaults and cross-default provisions that are customary for such a real estate loan. In addition, the 2013 Senior Facility requires compliance with certain financial covenants, including borrowing base loan to value and debt yield, corporate maximum leverage ratio, minimum ratio of adjusted consolidated earnings before interest, tax, depreciation and amortization to fixed charges, minimum tangible net worth, minimum mortgaged property requirement, maximum unhedged variable rate debt and maximum recourse indebtedness. Failure to comply with the covenants in the 2013 Senior Facility would result in a default thereunder and, absent a waiver or an amendment from our lenders, cause the acceleration of all outstanding borrowings under the 2013 Senior Facility. The default interest rate following a payment event of default under the 2013 Senior Facility is 3.0% more than the then-applicable interest
50
rate. No assurance can be given that we would be successful in obtaining such waiver or amendment, or that any accommodations that we were able to negotiate would be on terms as favorable as those in the 2013 Senior Facility. In connection with the 2014 Amendment, certain modifications were made to the financial covenant calculations in the 2013 Senior Facility. As of December 31, 2015, we were in compliance with all of the debt covenants related to the 2013 Senior Facility.
Hedging Instruments
Our objectives in using interest rate derivatives are to add stability to interest expense and to manage our exposure to interest rate movements. To accomplish these objectives, we primarily use interest rate swaps and caps as part of our interest rate risk management strategy. Interest rate swaps designated as cash flow hedges involve the receipt of variable-rate amounts from the counterparty in exchange for us making fixed-rate payments over the life of the agreements without exchange of the underlying notional amount. Interest rate caps designated as cash flow hedges involve the receipt of variable-rate amounts from a counterparty if interest rates rise above the strike rate on the contract in exchange for an up-front premium.
The table below presents the fair value of our derivative financial instruments as well as their classification on our Consolidated Balance Sheets as of December 31, 2015 and December 31, 2014:
Instrument Type | Location in Consolidated Balance Sheets | Notional Amount | Designated Benchmark Interest Rate | Strike Rate | Fair Value at December 31, 2015 | Fair Value at December 31, 2014 | Maturity Date | ||||||||||||||
Derivative not designated as hedging instruments | (dollars in thousands) | ||||||||||||||||||||
Interest Rate Cap | Prepaid expenses and other assets, net | $ | 64,445 | One-month LIBOR | 4.5 | % | $ | — | $ | 1 | May 2016 | ||||||||||
Derivative designated as hedging instruments | |||||||||||||||||||||
Pay fixed / receive variable rate swap | Accounts payable and accrued expenses, net | $ | 59,000 | One-month LIBOR | 1.5 | % | $ | (577 | ) | $ | (482 | ) | June 2018 | ||||||||
Pay fixed / receive variable rate swap | Accounts payable and accrued expenses, net | $ | 114,250 | One-month LIBOR | 1.2 | % | $ | (24 | ) | $ | — | September 2018 | |||||||||
Pay fixed / receive variable rate swap | Prepaid expenses and other assets, net | $ | 110,450 | One-month LIBOR | 1.0 | % | $ | 612 | $ | — | November 2018 | ||||||||||
Pay fixed / receive variable rate swap | Accounts payable and accrued expenses, net | $ | 75,000 | One-month LIBOR | 1.4 | % | $ | (75 | ) | $ | — | January 2020 | |||||||||
Capital Expenditures
Redevelopment
We continue to evaluate and execute the redevelopment of various malls within our portfolio in order to generate higher returns. A component of our business strategy is to identify value creation initiatives for our properties and to then invest capital to reposition and redevelop our properties. These redevelopment opportunities are typically commenced in conjunction with leasing activity for the respective space. We anticipate funding our redevelopment projects with the net cash provided by operating activities and corporate and property level borrowings.
The table below describes our current redevelopment projects which commenced during 2014 and 2015 (dollars in thousands):
51
Property | Description | Total Project Square Feet | Total Estimated Project Cost | Cost as of December 31, 2015 | ||||
NewPark Mall Newark, CA | 140,000 SF of new entertainment, including AMC Theater and a two level restaurant pavilion with patio seating. | 175,000 | $64,232 (1) | $59,819 | ||||
The Shoppes at Gateway Springfield, OR | De-mall and construct new exterior facing junior boxes including Marshall's, Hobby Lobby, Petco and new outparcels | 288,000 | $45,200 | $37,220 | ||||
Southland Center Taylor, MI | Demolish vacant anchor and construct new 50,000 SF Cinemark Theater and restaurant collection. | 62,000 | $15,300 | $2,096 | ||||
Southland Mall Hayward, CA | Redevelop former Kohl's anchor for new Dick's Sporting Goods, convert inline space to new Cinemark Theater, junior boxes and full service and fast casual restaurants. | 243,000 | $44,400 | $5,505 | ||||
Spring Hill Mall West Dundee, IL | Replace former JCPenney anchor and inline space with new 37,000 SF Cinemark Theater, streetscape, multi-tenant buildings and restaurant collection. | 93,000 | $23,216 (2) | $14,024 | ||||
Explanatory Notes:
(1) After deducting the estimated benefit of the net present value of municipal incentives currently estimated at $9.6 million.
(2) After deducting the estimated benefit of the net present value of municipal incentives currently estimated at $6.5 million.
Operating Property Capital Expenditures
The table below describes our operating property capital expenditures:
Year Ended | |||||
(in thousands) | December 31, 2015 | ||||
Ordinary capital expenditures (1) | $ | 1,493 | |||
Cosmetic capital expenditures | 12,739 | ||||
Tenant improvements and allowances (2) | 29,442 | ||||
Total | $ | 43,674 | |||
Explanatory Notes:
(1) Includes non-tenant recurring and non-recurring capital expenditures.
(2) Includes tenant improvements and allowances on current operating properties, excluding anchors and strategic projects.
Summary of Cash Flows
Years Ended December 31, 2015, 2014 and 2013
Cash Flows from Operating Activities
Net cash provided by operating activities was $77.2 million, $82.3 million and $62.6 million for the years ended December 31, 2015, 2014 and 2013, respectively.
The decrease of $5.1 million in net cash provided by operating activities from December 31, 2014 to December 31, 2015 was primarily attributable to capital expenditure accruals related to the current redevelopment projects at December 31, 2015. Partially offsetting the increase in capital expenditure accruals was an increase in Core NOI of $7.8 million of which $3.8 million was contributed by the Same Property portfolio.
The increase of $19.7 million in net cash provided by operating activities from December 31, 2013 to December 31, 2014 was primarily attributable to the acquisitions during 2013 and 2014. Our acquired properties increased Core NOI by approximately $33.0 million which was offset by an increase in cash interest expense of $6.6 million and a decrease of $6.0 million in Core NOI resulting from our special consideration assets.
52
Cash Flows from Investing Activities
Net cash used in investing activities was $230.0 million, $236.1 million and $0.5 million for the years ended December 31, 2015, 2014 and 2013, respectively.
The change in cash used in investing activities of $6.1 million from December 31, 2014 to December 31, 2015 was a result of $90.4 million in proceeds from the disposition of The Shoppes of Knollwood which was used in the acquisitions of Mt. Shasta Mall, Fig Garden Village and The Shoppes at Carlsbad. During 2015, $154.9 million was spent on strategic and cosmetic development projects along with tenant improvements. The 2015 results also include a change in restricted cash of $14.2 million as a result of debt payoffs and refinancings and the use of restricted cash to fund capital expenditures.
The change in cash used in investing activities of $235.6 million from December 31, 2013 to December 31, 2014 was a result of the acquisitions of The Shoppes at Bel Air, a controlling joint venture interest in The Mall at Barnes Crossing and the purchase of an anchor box at Bayshore Mall. During 2014, $122.3 million was spent on strategic and cosmetic development projects along with tenant improvements. The 2013 results also include the receipt of $150.0 million in a demand deposit from Brookfield U.S. Holdings, offsetting other investing activities.
Cash Flows from Financing Activities
Net cash provided by (used in) financing activities was $143.9 million, $153.9 million and $(56.0) million for the years ended December 31, 2015, 2014 and 2013, respectively.
The decrease in cash provided by financing activities of $10.0 million from December 31, 2014 to December 31, 2015 was the result of $150.7 million in net proceeds from the issuance of common stock in 2014, which was partially offset in 2015 by a net increase in borrowings on the revolving line of credit of $87.0 million and $61.5 million in net borrowings over 2014. The remaining change from 2014 is due to an increase in dividends paid and an increase in deferred financing costs as a result of the additional borrowings.
The increase in cash provided by financing activities of $209.9 million from December 31, 2013 to December 31, 2014 was the result of $150.7 million in net proceeds from the issuance of common stock in 2014 and $183.5 million in proceeds on new mortgage debt obtained during 2014, offset by repayments of $103.2 million. Cash was used in 2014 to increase dividends paid by $14.2 million and to reduce the 2013 Revolver by $38.0 million during the year ended December 31, 2014.
Contractual Cash Obligations and Commitments
The following table aggregates our contractual cash obligations and commitments as of December 31, 2015 (in thousands):
2016 | 2017 | 2018 | 2019 | 2020 | Thereafter | Total | ||||||||||||||||||||||
Long-term debt-principal(1) | $ | 265,493 | $ | 69,814 | $ | 579,480 | $ | 13,109 | $ | 89,243 | $ | 689,714 | $ | 1,706,853 | ||||||||||||||
Interest payments(2) | 59,703 | 52,963 | 49,661 | 34,818 | 31,759 | 91,159 | 320,063 | |||||||||||||||||||||
Operating lease obligations(3) | 1,424 | 1,493 | 1,505 | 1,426 | 1,147 | 1,083 | 8,078 | |||||||||||||||||||||
Total | $ | 326,620 | $ | 124,270 | $ | 630,646 | $ | 49,353 | $ | 122,149 | $ | 781,956 | $ | 2,034,994 | ||||||||||||||
Explanatory Notes:
(1) Excludes $(0.3) million of non-cash debt market rate adjustments.
(2) Based on rates as of December 31, 2015. Variable rates are based on LIBOR rate of 0.43%.
(3) Operating lease obligations relate to leases for New York and Dallas office space.
We lease land or buildings at certain properties from third parties. The leases generally provide us with a right of first refusal in the event of a proposed sale of the land by the landlord. Rental payments are expensed as incurred and have, to the extent applicable, been straight-lined over the term of the lease.
Off-Balance Sheet Financing Arrangements
We do not have any off-balance sheet financing arrangements.
REIT Requirements
In order to maintain our qualification as a REIT for federal income tax purposes, among other requirements, we must distribute or pay tax on 100% of our capital gains and we must distribute at least 90% of our ordinary taxable income to stockholders. To
53
avoid current entity level U.S. federal income taxes, we plan to distribute 100% of our capital gains and ordinary income to our stockholders annually. We may not have sufficient liquidity to meet these distribution requirements. We have no present intention to pay any dividends on our common stock in the future other than in order to maintain our REIT status. Our Board of Directors may decide to pay dividends in the form of cash, common stock or a combination of cash and common stock.
Recently Issued Accounting Pronouncements
See Note 2 to our Consolidated Financial Statements for information on recently issued accounting pronouncements.
Seasonality
Although we have a year-long temporary leasing program, occupancies for short-term tenants and, therefore, rental income recognized, are typically higher during the second half of the year. In addition, the majority of our tenants have December or January lease years for purposes of calculating annual overage rent amounts. Accordingly, overage rent thresholds are most commonly achieved in the fourth quarter. As a result, revenue production is generally the highest in the fourth quarter of each year.
Use of Estimates
The preparation of financial statements in conformity with GAAP requires management to make estimates and assumptions. These estimates and assumptions affect the reported amounts of assets and liabilities and the disclosure of contingent assets and liabilities at the date of the financial statements and the reported amounts of revenues and expenses during the reporting periods. For example, estimates and assumptions have been made with respect to fair values of assets and liabilities for purposes of applying the acquisition method of accounting, the useful lives of assets, capitalization of development and leasing costs, recoverable amounts of receivables, initial valuations and related amortization periods of deferred costs and intangibles, particularly with respect to acquisitions, impairment of long-lived assets, fair value of debt, and valuation of stock options granted. Actual results could differ from these and other estimates.
Critical Accounting Policies
Critical accounting policies are those that are both significant to the overall presentation of our financial condition and results of operations and require management to make difficult, complex or subjective judgments. Our critical accounting policies are those applicable to the following:
Properties
Acquisition accounting was applied to real estate assets within the Rouse portfolio either when GGP emerged from bankruptcy in November 2010 or upon any subsequent acquisition. Estimated cash flows and other valuation techniques were used to allocate the purchase price of acquired property between land, buildings and improvements, equipment, debt, liabilities assumed and identifiable intangible assets and liabilities such as amounts related to in-place tenant leases, acquired above and below-market tenant and ground leases and tenant relationships. After acquisition accounting is applied, the real estate assets are carried at the cost basis less accumulated depreciation. Real estate taxes and interest costs (including amortization of market rate adjustments and deferred financing costs) incurred during development periods are capitalized. Capitalized interest costs are based on qualified expenditures and interest rates in place during the development period. Capitalized real estate taxes, interest and interest related costs are amortized over lives which are consistent with the developed assets.
Pre-development costs, which generally include legal and professional fees and other directly-related third party costs, are capitalized as part of the property being developed. In the event a development is no longer deemed to be probable, the costs previously capitalized are expensed.
Tenant improvements, either paid directly or in the form of construction allowances paid to tenants, are capitalized and depreciated over the shorter of the useful life or applicable lease term. Maintenance and repair costs are expensed when incurred. Expenditures for significant betterments and improvements are capitalized. In leasing tenant space, we may provide funding to the lessee through a tenant allowance. In accounting for a tenant allowance, we determine whether the allowance represents funding for the construction of leasehold improvements and evaluate the ownership of such improvements. If we are considered the owner of the leasehold improvements for accounting purposes, we capitalize the amount of the tenant allowance and depreciate it over the shorter of the useful life of the leasehold improvements or the related lease term. If the tenant allowance represents a payment for a purpose other than funding leasehold improvements, or in the event that we are not considered the owner of the improvements for accounting
54
purposes, the allowance is capitalized as a lease incentive and is recognized over the lease term as a reduction of rental revenue on a straight-line basis.
Depreciation or amortization expense is computed using the straight-line method based upon the following estimated useful lives:
Years | |
Buildings and improvements | 40 |
Equipment and fixtures | 5 - 10 |
Tenant improvements | Shorter of useful life or applicable lease term |
We review depreciable lives of our properties periodically and make adjustments when necessary to reflect a shorter economic life.
Impairment
Operating properties and intangible assets
Accounting for the impairment or disposal of long-lived assets requires that if impairment indicators exist and the undiscounted cash flows expected to be generated by an asset are less than its carrying amount, an impairment provision should be recorded to write down the carrying amount of such asset to its fair value. We review all real estate assets for potential impairment indicators whenever events or changes in circumstances indicate that the carrying amount may not be recoverable. Impairment indicators are assessed separately for each property and include, but are not limited to, significant decreases in real estate property net operating income and occupancy percentages, high loan to value ratio, and carrying values in excess of the fair values. Impairment indicators for pre-development costs, which are typically costs incurred during the beginning stages of a potential development and developments in progress, are assessed by project and include, but are not limited to, significant changes to our plans with respect to the project, significant changes in projected completion dates, revenues or cash flows, development costs, market factors and sustainability of development projects.
If an indicator of potential impairment exists, the asset is tested for recoverability by comparing its carrying amount to the estimated future undiscounted cash flows. The cash flow estimates used both for determining recoverability and estimating fair value are inherently judgmental and reflect current and projected trends in rental, occupancy and capitalization rates, and estimated holding periods for the applicable assets. Although the estimated fair value of certain assets may exceed the carrying amount, a real estate asset is only considered to be impaired when its carrying amount cannot be recovered through estimated future undiscounted cash flows. To the extent an impairment provision is determined to be necessary, the excess of the carrying amount of the asset over its estimated fair value is expensed to operations. In addition, the impairment provision is allocated proportionately to adjust the carrying amount of the asset group. The adjusted carrying amount, which represents the new cost basis of the asset, is depreciated over the remaining useful life of the asset.
Recoverable Amounts of Receivables
We make periodic assessments of the collectibility of receivables (including those resulting from the difference between rental revenue recognized and rents currently due from tenants) based on a specific review of the risk of loss on specific accounts or amounts. The receivable analysis places particular emphasis on past-due accounts and considers the nature and age of the receivables, the payment history and financial condition of the payee, the basis for any disputes or negotiations with the payee and other information which may impact collectibility. For straight-line rents receivable, the analysis considers the probability of collection of the unbilled deferred rent receivable given our experience regarding such amounts. The resulting estimates of any allowance or reserve related to the recovery of these items are subject to revision as these factors change and are sensitive to the effects of economic and market conditions on such payees.
Capitalization of Development and Leasing Costs
We capitalize the costs of development and leasing activities of our properties. The amount of capitalization depends, in part, on the identification and justifiable allocation of certain activities to specific projects and leases. Differences in methodologies of cost identification and documentation, as well as differing assumptions as to the time incurred on projects, can yield significant differences in the amounts capitalized and, as a result, the amount of depreciation which is recognized.
55
Revenue Recognition and Related Matters
Minimum rent revenues are recognized on a straight-line basis over the terms of the related leases. Minimum rent revenues also include amounts collected from tenants to allow the termination of their leases prior to their scheduled termination dates as well as the amortization related to above and below-market tenant leases on acquired properties and lease inducements. Minimum rent revenues also includes percentage rents in lieu of minimum rent from those leases where we receive a percentage of tenant revenues.
Economy and Inflation
Substantially all of our tenant leases contain provisions designed to partially mitigate the negative impact of inflation. Such provisions include clauses enabling us to receive overage rent based on tenants' gross sales, which generally increase as prices rise, and/or escalation clauses, which generally increase rental rates during the terms of the leases. In addition, many of the leases expire each year which may enable us to replace or renew such expiring leases with new leases at higher rents. Finally, many of the existing leases require the tenants to pay amounts related to all, or substantially all, of their share of certain operating expenses, including CAM, real estate taxes and insurance, thereby partially reducing our exposure to increases in costs and operating expenses resulting from inflation. In general, these amounts either vary annually based on actual expenditures or are set on an initial share of costs with provisions for annual increases. Inflation also poses a risk to us due to the probability of future increases in interest rates. Such increases would adversely impact us due to our outstanding variable-rate debt.
ITEM 7A. QUANTITATIVE AND QUALITATIVE DISCLOSURES ABOUT MARKET RISK
We are subject to market risk associated with changes in interest rates both in terms of variable-rate debt and the cost of new fixed-rate debt upon maturity of existing debt. As of December 31, 2015, we had consolidated debt of $1.71 billion, including $568.7 million of variable-rate debt. A 25 basis point movement in the interest rate on the variable-rate debt would result in a $1.4 million annualized increase or decrease in consolidated interest expense and operating cash flows.
ITEM 8. FINANCIAL STATEMENTS AND SUPPLEMENTARY DATA
Reference is made to the Consolidated Financial Statements and Consolidated Financial Statement Schedule beginning on page 64 for the required information.
ITEM 9. CHANGES IN AND DISAGREEMENTS WITH ACCOUNTANTS ON ACCOUNTING AND FINANCIAL DISCLOSURE
None.
ITEM 9A. CONTROLS AND PROCEDURES
Evaluation of Disclosure Controls and Procedures
Our Chief Executive Officer and Chief Financial Officer participated in an evaluation by our management of the effectiveness of our disclosure controls and procedures as of the end of our fiscal year ended December 31, 2015. Based on their participation in that evaluation, our CEO and CFO concluded that our disclosure controls and procedures were effective as of December 31, 2015 to ensure that information required to be disclosed in our reports filed or submitted under the Exchange Act is recorded, processed, summarized and reported within the time periods specified in the SEC's rules and forms, and to ensure that information required to be disclosed in our reports filed or furnished under the Exchange Act is accumulated and communicated to our management, including our CEO and CFO, as appropriate to allow timely decisions regarding required disclosures.
Our CEO and CFO also participated in an evaluation by our management of any changes in our internal control over financial reporting that occurred during the three month period ended December 31, 2015. That evaluation did not identify any changes that have materially affected, or are reasonably likely to materially affect, our internal control over financial reporting during the three month period ended December 31, 2015.
Management's Annual Report on Internal Control Over Financial Reporting
Our management is responsible for establishing and maintaining adequate internal control over financial reporting, as such term is defined in Exchange Act Rule 13a-15(f). Under the supervision and with the participation of our management, including our CEO and CFO, we conducted an evaluation of the effectiveness of our internal control over financial reporting based on the
56
framework in Internal Control-Integrated Framework (2013) issued by the Committee of Sponsoring Organizations of the Treadway Commission. Based on our evaluation under the framework in Internal Control-Integrated Framework (2013), our management concluded that our internal control over financial reporting was effective as of December 31, 2015. The effectiveness of our internal control over financial reporting as of December 31, 2015 has been audited by Deloitte & Touche LLP, an independent registered public accounting firm, as stated in their attestation report which is included herein.
57
REPORT OF INDEPENDENT REGISTERED PUBLIC ACCOUNTING FIRM
To the Board of Directors and Stockholders of
Rouse Properties, Inc.
New York, New York
We have audited the internal control over financial reporting of Rouse Properties, Inc. and subsidiaries (the "Company") as of December 31, 2015, based on criteria established in Internal Control - Integrated Framework (2013) issued by the Committee of Sponsoring Organizations of the Treadway Commission. The Company's management is responsible for maintaining effective internal control over financial reporting and for its assessment of the effectiveness of internal control over financial reporting, included in the accompanying Management’s Annual Report on Internal Control over Financial Reporting. Our responsibility is to express an opinion on the Company's internal control over financial reporting based on our audit.
We conducted our audit in accordance with the standards of the Public Company Accounting Oversight Board (United States). Those standards require that we plan and perform the audit to obtain reasonable assurance about whether effective internal control over financial reporting was maintained in all material respects. Our audit included obtaining an understanding of internal control over financial reporting, assessing the risk that a material weakness exists, testing and evaluating the design and operating effectiveness of internal control based on the assessed risk, and performing such other procedures as we considered necessary in the circumstances. We believe that our audit provides a reasonable basis for our opinion.
A company's internal control over financial reporting is a process designed by, or under the supervision of, the company's principal executive and principal financial officers, or persons performing similar functions, and effected by the company's board of directors, management, and other personnel to provide reasonable assurance regarding the reliability of financial reporting and the preparation of financial statements for external purposes in accordance with generally accepted accounting principles. A company's internal control over financial reporting includes those policies and procedures that (1) pertain to the maintenance of records that, in reasonable detail, accurately and fairly reflect the transactions and dispositions of the assets of the company; (2) provide reasonable assurance that transactions are recorded as necessary to permit preparation of financial statements in accordance with generally accepted accounting principles, and that receipts and expenditures of the company are being made only in accordance with authorizations of management and directors of the company; and (3) provide reasonable assurance regarding prevention or timely detection of unauthorized acquisition, use, or disposition of the company's assets that could have a material effect on the financial statements.
Because of the inherent limitations of internal control over financial reporting, including the possibility of collusion or improper management override of controls, material misstatements due to error or fraud may not be prevented or detected on a timely basis. Also, projections of any evaluation of the effectiveness of the internal control over financial reporting to future periods are subject to the risk that the controls may become inadequate because of changes in conditions, or that the degree of compliance with the policies or procedures may deteriorate.
In our opinion, the Company maintained, in all material respects, effective internal control over financial reporting as of December 31, 2015, based on the criteria established in Internal Control - Integrated Framework (2013) issued by the Committee of Sponsoring Organizations of the Treadway Commission.
We have also audited, in accordance with the standards of the Public Company Accounting Oversight Board (United States), the consolidated financial statements and financial statement schedule as of and for the year ended December 31, 2015 of the Company and our report dated March 7, 2016 expressed an unqualified opinion on those financial statements and financial statement schedule.
/s/ DELOITTE & TOUCHE LLP
New York, NY
March 7, 2016
58
ITEM 9B. OTHER INFORMATION
Not applicable
59
PART III
Except as provided below, the information required by this Part III (Items 10, 11, 12, 13 and 14) is included either in our definitive proxy statement in connection with our 2016 annual meeting of stockholders (the “2016 Proxy Statement”) or in an amendment to this Annual Report (the "Form 10-K/A"), as the case may be, to be filed with the SEC within 120 days of December 31, 2015, and is incorporated herein by reference.
ITEM 10. DIRECTORS, EXECUTIVE OFFICERS AND CORPORATE GOVERNANCE
Except as noted below, the information required by this Item is included either in the 2016 Proxy Statement or the Form 10-K/A, and is incorporated herein by reference.
Code of Business Conduct and Ethics
We have adopted a Code of Business Conduct and Ethics that applies to all of our directors, officers and employees. A copy of the Code of Business Conduct and Ethics is available on our website at www.rouseproperties.com. Any amendments to, or waivers under, our Code of Business Conduct and Ethics that are required to be disclosed by the rules promulgated by the SEC or the NYSE will be disclosed on our website at www.rouseproperties.com.
ITEM 11. EXECUTIVE COMPENSATION
The information required by this Item is included either in the 2016 Proxy Statement or the Form 10-K/A, and is incorporated herein by reference. However, the “Compensation Committee Report” shall not be deemed filed in this Annual Report.
ITEM 12. SECURITY OWNERSHIP OF CERTAIN BENEFICIAL OWNERS AND MANAGEMENT AND RELATED STOCKHOLDER MATTERS
The information required by this Item is included either in the 2016 Proxy Statement or the Form 10-K/A, and is incorporated herein by reference.
ITEM 13. CERTAIN RELATIONSHIPS AND RELATED PERSON TRANSACTIONS, AND DIRECTOR INDEPENDENCE
The information required by this Item is included either in the 2016 Proxy Statement or the Form 10-K/A, and is incorporated herein by reference.
ITEM 14. PRINCIPAL ACCOUNTING FEES AND SERVICES
The information required by this Item is included either in the 2016 Proxy Statement or the Form 10-K/A, and is incorporated herein by reference.
60
PART IV
ITEM 15. EXHIBITS AND FINANCIAL STATEMENT SCHEDULES
(1) | Consolidated Financial Statements and Consolidated Financial Statement Schedule. |
The Consolidated Financial Statements and Consolidated Financial Statement Schedule listed in the accompanying Index to the Consolidated Financial Statements and Consolidated Financial Statement Schedule are filed as part of this Annual Report.
(2) | Exhibits. |
See Exhibit Index on page 106.
(3) | Separate Financial Statements. |
Not applicable.
61
Index to Financial Statements and Schedules
Rouse Properties, Inc.
PAGE NUMBER | |
62
REPORT OF INDEPENDENT REGISTERED PUBLIC ACCOUNTING FIRM
To the Board of Directors and Stockholders of
Rouse Properties, Inc.
New York, New York
We have audited the accompanying consolidated balance sheets of Rouse Properties, Inc. and subsidiaries (the “Company”) as of December 31, 2015 and 2014, and the related consolidated statements of operations, equity, and cash flows for each of the three years in the period ended December 31, 2015. Our audits also included the financial statement schedule listed in the Index at Item 15. These financial statements and financial statement schedule are the responsibility of the Company’s management. Our responsibility is to express an opinion on the financial statements and financial statement schedule based on our audits.
We conducted our audits in accordance with the standards of the Public Company Accounting Oversight Board (United States). Those standards require that we plan and perform the audit to obtain reasonable assurance about whether the financial statements are free of material misstatement. An audit includes examining, on a test basis, evidence supporting the amounts and disclosures in the financial statements. An audit also includes assessing the accounting principles used and significant estimates made by management, as well as evaluating the overall financial statement presentation. We believe that our audits provide a reasonable basis for our opinion.
In our opinion, such consolidated financial statements present fairly, in all material respects, the financial position of Rouse Properties, Inc. and subsidiaries as of December 31, 2015 and 2014, and the results of their operations and their cash flows for each of the three years in the period ended December 31, 2015, in conformity with accounting principles generally accepted in the United States of America. Also, in our opinion, such financial statement schedule, when considered in relation to the basic consolidated financial statements taken as a whole, present fairly, in all material respects, the information set forth therein.
We have also audited, in accordance with the standards of the Public Company Accounting Oversight Board (United States), the Company’s internal control over financial reporting as of December 31, 2015, based on the criteria established in Internal Control- Integrated Framework (2013) issued by the Committee of Sponsoring Organizations of the Treadway Commission and our report dated March 7, 2016 expressed an unqualified opinion on the Company’s internal control over financial reporting.
/s/ DELOITTE & TOUCHE LLP
New York, NY
March 7, 2016
63
ROUSE PROPERTIES, INC.
CONSOLIDATED BALANCE SHEETS
December 31, | ||||||||
2015 | 2014 | |||||||
(In thousands) | ||||||||
Assets: | ||||||||
Investment in real estate: | ||||||||
Land | $ | 428,157 | $ | 371,363 | ||||
Buildings and equipment | 2,151,443 | 1,820,072 | ||||||
Less accumulated depreciation | (239,091 | ) | (189,838 | ) | ||||
Net investment in real estate | 2,340,509 | 2,001,597 | ||||||
Cash and cash equivalents | 5,420 | 14,308 | ||||||
Restricted cash | 34,568 | 48,055 | ||||||
Accounts receivable, net | 43,196 | 35,492 | ||||||
Deferred expenses, net | 56,531 | 52,611 | ||||||
Prepaid expenses and other assets, net | 49,034 | 62,690 | ||||||
Assets of property held for sale | — | 55,647 | ||||||
Total assets | $ | 2,529,258 | $ | 2,270,400 | ||||
Liabilities: | ||||||||
Mortgages, notes and loans payable | $ | 1,706,513 | $ | 1,584,499 | ||||
Accounts payable and accrued expenses, net | 147,288 | 113,976 | ||||||
Liabilities of property held for sale | — | 38,590 | ||||||
Total liabilities | 1,853,801 | 1,737,065 | ||||||
Commitments and contingencies | — | — | ||||||
Mezzanine Equity: | ||||||||
Non-controlling interest in Operating Partnership | 140,953 | — | ||||||
Equity: | ||||||||
Preferred stock: $0.01 par value; 50,000,000 shares authorized, 0 issued and outstanding at December 31, 2015 and 2014 | — | — | ||||||
Common stock: $0.01 par value; 500,000,000 shares authorized, 58,097,933 issued and 57,797,475 outstanding at December 31, 2015 and 57,748,141 issued and 57,743,981 outstanding at December 31, 2014 | 581 | 578 | ||||||
Additional paid-in capital | 643,828 | 679,275 | ||||||
Accumulated deficit | (121,182 | ) | (162,881 | ) | ||||
Accumulated other comprehensive loss | (65 | ) | (482 | ) | ||||
Treasury stock, at cost , $0.01 par value, 238,055 shares at December 31, 2015 and 0 shares at December 31, 2014 | (3,509 | ) | — | |||||
Total stockholders' equity | 519,653 | 516,490 | ||||||
Non-controlling interest | 14,851 | 16,845 | ||||||
Total equity | 534,504 | 533,335 | ||||||
Total liabilities, mezzanine equity and equity | $ | 2,529,258 | $ | 2,270,400 | ||||
The accompanying notes are an integral part of these consolidated financial statements.
64
ROUSE PROPERTIES, INC.
CONSOLIDATED STATEMENTS OF OPERATIONS AND COMPREHENSIVE INCOME (LOSS)
Years ended December 31, | ||||||||||||
2015 | 2014 | 2013 | ||||||||||
(In thousands, except per share amounts) | ||||||||||||
Revenues: | ||||||||||||
Minimum rents | $ | 212,072 | $ | 200,354 | $ | 165,097 | ||||||
Tenant recoveries | 78,287 | 77,580 | 66,061 | |||||||||
Overage rents | 7,372 | 6,470 | 5,943 | |||||||||
Other | 7,653 | 7,723 | 6,441 | |||||||||
Total revenues | 305,384 | 292,127 | 243,542 | |||||||||
Expenses: | ||||||||||||
Property operating costs | 68,770 | 70,269 | 60,288 | |||||||||
Real estate taxes | 27,075 | 26,571 | 22,089 | |||||||||
Property maintenance costs | 10,223 | 11,331 | 11,446 | |||||||||
Marketing | 2,146 | 3,257 | 3,734 | |||||||||
Provision for doubtful accounts | 1,746 | 1,228 | 887 | |||||||||
General and administrative | 25,817 | 26,329 | 21,971 | |||||||||
Provision for impairment | 2,900 | 15,965 | 15,159 | |||||||||
Depreciation and amortization | 107,941 | 100,302 | 66,497 | |||||||||
Other | 6,491 | 5,437 | 4,223 | |||||||||
Total operating expenses | 253,109 | 260,689 | 206,294 | |||||||||
Operating income | 52,275 | 31,438 | 37,248 | |||||||||
Interest income | 18 | 323 | 548 | |||||||||
Interest expense | (71,420 | ) | (82,909 | ) | (82,534 | ) | ||||||
Gain on extinguishment of debt | 26,558 | — | — | |||||||||
Income (loss) before income taxes, gain on sale of real estate assets, and discontinued operations | 7,431 | (51,148 | ) | (44,738 | ) | |||||||
Provision for income taxes | (604 | ) | (537 | ) | (844 | ) | ||||||
Income (loss) from continuing operations before gain on sale of real estate assets | 6,827 | (51,685 | ) | (45,582 | ) | |||||||
Gain on sale of real estate assets | 34,796 | — | — | |||||||||
Income (loss) from continuing operations | 41,623 | (51,685 | ) | (45,582 | ) | |||||||
Discontinued operations: | ||||||||||||
Loss from discontinued operations | — | — | (23,158 | ) | ||||||||
Gain on extinguishment of debt from discontinued operations | — | — | 13,995 | |||||||||
Discontinued operations, net | — | — | (9,163 | ) | ||||||||
Net income (loss) | 41,623 | (51,685 | ) | (54,745 | ) | |||||||
Net (income) loss attributable to non-controlling interests | 76 | (71 | ) | — | ||||||||
Net income (loss) attributable to Rouse Properties, Inc. | 41,699 | (51,756 | ) | (54,745 | ) | |||||||
Preferred distributions | (953 | ) | — | — | ||||||||
Net income (loss) allocable to common shareholders | $ | 40,746 | $ | (51,756 | ) | $ | (54,745 | ) | ||||
Per common share data: | ||||||||||||
Net income (loss) per share allocable to common shareholders | ||||||||||||
Basic | $ | 0.70 | $ | (0.90 | ) | $ | (1.11 | ) | ||||
Diluted | $ | 0.70 | $ | (0.90 | ) | $ | (1.11 | ) | ||||
Dividends declared per share | $ | 0.72 | $ | 0.68 | $ | 0.52 | ||||||
Other comprehensive income (loss): | ||||||||||||
Net income (loss) | $ | 41,623 | $ | (51,685 | ) | $ | (54,745 | ) | ||||
Other comprehensive income (loss): | ||||||||||||
Net unrealized gain (loss) on financial instrument | 417 | (482 | ) | — | ||||||||
Comprehensive income (loss) | $ | 42,040 | $ | (52,167 | ) | $ | (54,745 | ) | ||||
The accompanying notes are an integral part of these consolidated financial statements.
65
ROUSE PROPERTIES, INC.
CONSOLIDATED STATEMENTS OF EQUITY
Common Stock (shares) | Class B Common Stock (shares) | Common Stock | Class B Common Stock | Additional Paid-In Capital | Accumulated Deficit | Accumulated Other Comprehensive Loss | Treasury Stock, at cost | Non-controlling Interests | Total Equity | ||||||||||||||||||||||||||||||
(in thousands, except share amounts) | |||||||||||||||||||||||||||||||||||||||
Balance at December 31, 2012 | 49,235,528 | 359,056 | $ | 493 | $ | 4 | $ | 588,668 | $ | (56,380 | ) | $ | — | $ | — | $ | 111 | $ | 532,896 | ||||||||||||||||||||
Net loss | — | — | — | — | — | (54,745 | ) | — | — | — | (54,745 | ) | |||||||||||||||||||||||||||
Conversion of Class B share to common shares | 359,056 | (359,056 | ) | 4 | (4 | ) | — | — | — | — | — | — | |||||||||||||||||||||||||||
Offering costs | — | — | — | — | (417 | ) | — | — | — | — | (417 | ) | |||||||||||||||||||||||||||
Dividends to common shareholders ($0.52 per share) | — | — | — | — | (25,820 | ) | — | — | — | — | (25,820 | ) | |||||||||||||||||||||||||||
Issuance and amortization of stock compensation | 36,573 | — | — | — | 3,019 | — | — | — | — | 3,019 | |||||||||||||||||||||||||||||
Exercise of options | 10,880 | — | — | — | 161 | — | — | — | — | 161 | |||||||||||||||||||||||||||||
Forfeited restricted shares | (4,160 | ) | — | — | — | — | — | — | — | — | — | ||||||||||||||||||||||||||||
Sale of treasury stock | 10,559 | — | — | — | 187 | — | — | — | — | 187 | |||||||||||||||||||||||||||||
Balance at December 31, 2013 | 49,648,436 | — | $ | 497 | $ | — | $ | 565,798 | $ | (111,125 | ) | $ | — | $ | — | $ | 111 | $ | 455,281 | ||||||||||||||||||||
Balance at December 31, 2013 | 49,648,436 | — | $ | 497 | $ | — | $ | 565,798 | $ | (111,125 | ) | $ | — | $ | — | $ | 111 | $ | 455,281 | ||||||||||||||||||||
Net loss | — | — | — | — | — | (51,756 | ) | — | — | 71 | (51,685 | ) | |||||||||||||||||||||||||||
Comprehensive loss | — | — | — | — | — | — | (482 | ) | — | — | (482 | ) | |||||||||||||||||||||||||||
Issuance of 8,050,000 shares of common stock, net of underwriting discount | 8,050,000 | — | 81 | — | 150,616 | — | — | — | — | 150,697 | |||||||||||||||||||||||||||||
Offering costs | — | — | — | — | (467 | ) | — | — | — | — | (467 | ) | |||||||||||||||||||||||||||
Dividends to common shareholders ($0.13 per share for issuance of 8,050,000 shares and $0.68 per share for annual dividend) | — | — | — | — | (40,399 | ) | — | — | — | — | (40,399 | ) | |||||||||||||||||||||||||||
Issuance and amortization of stock compensation | 42,489 | — | — | — | 3,699 | — | — | — | — | 3,699 | |||||||||||||||||||||||||||||
Exercise of options | 1,680 | — | — | — | 28 | — | — | — | — | 28 | |||||||||||||||||||||||||||||
Net assets attributable to Non-controlling interest (as a result of Business Combinations) | — | — | — | — | — | — | — | — | 16,663 | 16,663 | |||||||||||||||||||||||||||||
Issuance of shares under Employee Stock Purchase Plan ("ESPP") | 1,376 | — | — | — | — | — | — | — | — | — | |||||||||||||||||||||||||||||
Balance at December 31, 2014 | 57,743,981 | — | $ | 578 | $ | — | $ | 679,275 | $ | (162,881 | ) | $ | (482 | ) | $ | — | $ | 16,845 | $ | 533,335 | |||||||||||||||||||
66
Balance at December 31, 2014 | 57,743,981 | — | $ | 578 | $ | — | $ | 679,275 | $ | (162,881 | ) | $ | (482 | ) | $ | — | $ | 16,845 | $ | 533,335 | |||||||||||||||||||
Net income (loss) | — | — | — | — | — | — | 41,699 | — | — | (76 | ) | 41,623 | |||||||||||||||||||||||||||
Comprehensive income | — | — | — | — | — | — | 417 | — | — | 417 | |||||||||||||||||||||||||||||
Dividends to common shareholders ($0.72 per share for annual dividend) | — | — | — | — | (41,710 | ) | — | — | — | — | (41,710 | ) | |||||||||||||||||||||||||||
Purchase of treasury stock | (238,055 | ) | — | — | — | — | — | — | (3,509 | ) | — | (3,509 | ) | ||||||||||||||||||||||||||
Preferred distributions | — | — | — | — | (953 | ) | — | — | — | — | (953 | ) | |||||||||||||||||||||||||||
Issuance and amortization of stock compensation | 53,550 | — | — | — | 2,899 | — | — | — | — | — | 2,899 | ||||||||||||||||||||||||||||
Exercise of options | 291,331 | — | 3 | — | 4,317 | — | — | — | — | 4,320 | |||||||||||||||||||||||||||||
Distributions to non-controlling interest | — | — | — | — | — | — | — | — | — | (1,421 | ) | (1,421 | ) | ||||||||||||||||||||||||||
Contributions to non-controlling interest | — | — | — | — | — | — | — | — | 49 | 49 | |||||||||||||||||||||||||||||
Purchase of non-controlling interest (1) | — | — | — | — | — | — | — | — | (591 | ) | (591 | ) | |||||||||||||||||||||||||||
Forfeited restricted shares | (58,242 | ) | — | — | — | — | — | — | — | — | — | ||||||||||||||||||||||||||||
Net assets attributable to Non-Controlling Interest (as a result of Business Combination) | — | — | — | — | — | — | — | — | 45 | 45 | |||||||||||||||||||||||||||||
Issuance of shares under ESPP | 4,910 | — | — | — | — | — | — | — | — | — | |||||||||||||||||||||||||||||
Balance at December 31, 2015 | 57,797,475 | — | $ | 581 | $ | — | $ | 643,828 | $ | (121,182 | ) | $ | (65 | ) | $ | (3,509 | ) | $ | 14,851 | $ | 534,504 | ||||||||||||||||||
Explanatory Note:
(1) During the year ended December 31, 2015, the Company acquired an additional 1.8% of the JV partnership's interest.
The accompanying notes are an integral part of these consolidated financial statements.
67
Years ended December 31, | |||||||||||
2015 | 2014 | 2013 | |||||||||
(In thousands) | |||||||||||
Cash Flows from Operating Activities: | |||||||||||
Net income (loss) | $ | 41,623 | $ | (51,685 | ) | $ | (54,745 | ) | |||
Adjustments to reconcile net income (loss) to net cash provided by operating activities: | |||||||||||
Provision for doubtful accounts | 1,746 | 1,228 | 888 | ||||||||
Depreciation | 97,185 | 91,248 | 60,557 | ||||||||
Amortization | 10,756 | 9,054 | 6,702 | ||||||||
Amortization/write-off of deferred financing costs | 3,984 | 4,209 | 12,519 | ||||||||
Amortization/write-off of debt market rate adjustments | (1,080 | ) | 8,572 | 8,278 | |||||||
Amortization of above/below market leases and tenant inducements | 6,650 | 13,101 | 16,973 | ||||||||
Straight-line rent amortization | (1,217 | ) | (1,785 | ) | (3,517 | ) | |||||
Provision for impairment | 2,900 | 15,965 | 36,821 | ||||||||
Gain on extinguishment of debt | (26,558 | ) | — | (14,324 | ) | ||||||
Gain on sale of assets | (34,796 | ) | — | — | |||||||
Stock based compensation | 2,899 | 3,699 | 3,019 | ||||||||
Net changes: | |||||||||||
Accounts receivable | (8,839 | ) | (4,491 | ) | (2,563 | ) | |||||
Prepaid expenses and other assets | 1,494 | 611 | 1,220 | ||||||||
Deferred expenses | (14,695 | ) | (14,998 | ) | (12,017 | ) | |||||
Restricted cash | (7 | ) | 2,258 | 39 | |||||||
Accounts payable and accrued expenses | (4,862 | ) | 5,315 | 2,752 | |||||||
Net cash provided by operating activities | 77,183 | 82,301 | 62,602 | ||||||||
Cash Flows from Investing Activities: | |||||||||||
Acquisitions of real estate properties | (179,213 | ) | (109,330 | ) | (81,203 | ) | |||||
Proceeds from sale of property, net | 90,438 | — | — | ||||||||
Development, building and tenant improvements | (154,882 | ) | (122,325 | ) | (63,032 | ) | |||||
Demand deposit from affiliate | — | — | 150,000 | ||||||||
Purchase of joint venture interest | (591 | ) | — | — | |||||||
Joint venture adjustment | 45 | — | — | ||||||||
Deposit for acquisition | — | (1,000 | ) | — | |||||||
Restricted cash | 14,216 | (3,477 | ) | (6,229 | ) | ||||||
Net cash used in investing activities | (229,987 | ) | (236,132 | ) | (464 | ) | |||||
Cash Flows from Financing Activities: | |||||||||||
Proceeds received from equity offering | — | 156,974 | — | ||||||||
Discount from equity offering | — | (6,278 | ) | — | |||||||
Proceeds received from stock option exercise | 4,320 | 28 | 161 | ||||||||
Payments for offering costs | — | (467 | ) | (417 | ) | ||||||
Purchase of treasury stock | (3,509 | ) | — | — | |||||||
Sale of treasury stock | — | — | 187 | ||||||||
Distributions to non-controlling interest, net | (1,372 | ) | — | — | |||||||
Proceeds from refinance/issuance of mortgages, notes and loans payable | 476,250 | 183,500 | 523,500 | ||||||||
Borrowing under revolving line of credit | 276,500 | 55,000 | 55,000 | ||||||||
Principal payments on mortgages, notes and loans payable | (334,403 | ) | (103,233 | ) | (594,389 | ) | |||||
Repayment under revolving credit line | (227,500 | ) | (93,000 | ) | (7,000 | ) | |||||
Dividends paid | (41,123 | ) | (36,968 | ) | (22,839 | ) | |||||
Deferred financing costs | (5,247 | ) | (1,641 | ) | (10,209 | ) | |||||
Net cash provided by (used in) financing activities | 143,916 | 153,915 | (56,006 | ) | |||||||
Net change in cash and cash equivalents | (8,888 | ) | 84 | 6,132 | |||||||
68
Years ended December 31, | |||||||||||
2015 | 2014 | 2013 | |||||||||
(In thousands) | |||||||||||
Cash and cash equivalents at beginning of period | 14,308 | 14,224 | 8,092 | ||||||||
Cash and cash equivalents at end of period | $ | 5,420 | $ | 14,308 | $ | 14,224 | |||||
Supplemental Disclosure of Cash Flow Information: | |||||||||||
Interest paid, net of capitalized interest | $ | 68,861 | $ | 71,855 | $ | 61,564 | |||||
Capitalized interest | (3,334 | ) | (2,548 | ) | (998 | ) | |||||
Non-Cash Transactions: | |||||||||||
Change in accrued capital expenditures included in accounts payable and accrued expenses | $ | 26,395 | $ | (439 | ) | $ | 12,237 | ||||
Dividends declared, not yet paid | 10,472 | 9,885 | 6,454 | ||||||||
Distributions on Series A Preferred Units accrued, not yet paid | 953 | — | — | ||||||||
Capitalized market rate adjustments and deferred financing amortization | 426 | 400 | — | ||||||||
Issuance of Series A Preferred Units in Operating Partnership | 140,000 | — | — | ||||||||
Supplemental non-cash information related to acquisition accounting: | |||||||||||
Land | $ | — | $ | 8,969 | $ | 51,055 | |||||
Buildings and equipment, net | — | 103,123 | 217,011 | ||||||||
Deferred expenses, net | — | 1,841 | 4,583 | ||||||||
Prepaid and other assets | — | 5,461 | 9,983 | ||||||||
Mortgages, notes and loans payable | — | (112,505 | ) | (266,641 | ) | ||||||
Accounts payable and accrued expenses | — | (6,889 | ) | (15,991 | ) | ||||||
Supplemental non-cash information related to gain on extinguishment of debt: | |||||||||||
Land | (18,384 | ) | — | (26,108 | ) | ||||||
Buildings and equipment, net | (52,317 | ) | — | (33,015 | ) | ||||||
Deferred expenses, net | (1,555 | ) | — | (1,676 | ) | ||||||
Prepaid and other assets | (5,492 | ) | — | (4,281 | ) | ||||||
Mortgages, notes and loans payable | 103,369 | — | 81,028 | ||||||||
Accounts payable and accrued expenses | 937 | — | 3,494 | ||||||||
The accompanying notes are an integral part of these consolidated financial statements.
69
NOTE 1 ORGANIZATION
General
Rouse Properties, Inc. is a Delaware corporation that was created to hold certain assets and liabilities of General Growth Properties, Inc. ("GGP"). Prior to January 12, 2012, Rouse Properties, Inc. and its subsidiaries ("Rouse" or the "Company") were a wholly-owned subsidiary of GGP Limited Partnership (“GGP LP”). GGP distributed the assets and liabilities of 30 of its wholly-owned properties (“RPI Businesses”) to Rouse on January 12, 2012 (the “Spin-Off Date”). Before the spin-off, the Company had not conducted any business as a separate company and had no material assets or liabilities. The operations, assets and liabilities of the business were transferred to the Company by GGP on the Spin-Off Date and are presented as if the transferred business was our business for all historical periods prior to the Spin-Off Date. As such, the Company's assets and liabilities on the Spin-Off Date were reflective of GGP's respective carrying values. Unless the context otherwise requires, references to “we”, “us” and “our” refer to Rouse from January 12, 2012 through December 31, 2015 and to RPI Businesses before the Spin-Off Date. Before the Spin-Off Date, RPI Businesses were operated as subsidiaries of GGP, which operates as a real estate investment trust (“REIT”). After the Spin-Off Date, the Company elected to continue to operate as a REIT.
The Company's assets are held by, and all of our operations are conducted through, Rouse Properties, L.P. (the "Operating Partnership"). The Company is the sole managing general partner of the Operating Partnership. As of December 31, 2015, a non-controlling investor held 5,600,000 Series A Preferred Units in the Operating Partnership which we also refer to as the non-controlling interest in Operating Partnership. See Note 10 for additional information regarding the Company's non-controlling interest in Operating Partnership.
Principles of Consolidation and Basis of Presentation
The accompanying Consolidated Financial Statements are prepared in accordance with accounting principles generally accepted in the United States of America (“GAAP”). The Consolidated Balance Sheets as of December 31, 2015 and 2014 include the accounts of Rouse, as well as all subsidiaries of Rouse. The accompanying Consolidated Statements of Operations for the years ended December 31, 2015, 2014 and 2013 include the consolidated accounts of Rouse and the Operating Partnership. The accompanying consolidated financial statements include the accounts of Rouse, as well as all subsidiaries of Rouse and all joint ventures in which the Company has a controlling interest. For consolidated joint ventures, the non-controlling partner's share of the assets, liabilities and operations of the joint ventures (generally computed as the joint venture partner's ownership percentage) is included in non-controlling interests as permanent equity of the Company. All intercompany transactions have been eliminated in consolidation as of and for the years ended December 31, 2015, 2014 and 2013.
The Company operates in a single reportable segment referred to as its retail segment, which includes the operation, development and management of regional malls. Each of the Company's operating properties is considered a separate operating segment, as each property earns revenues and incurs expenses, individual operating results are reviewed and discrete financial information is available. The Company does not distinguish its operations based on geography, size or type and all operations are within the United States. No customer or tenant comprises more than 10% of consolidated revenues, and the properties have similar economic characteristics.
70
NOTE 2 SUMMARY OF SIGNIFICANT ACCOUNTING POLICIES
Properties
Acquisition accounting was applied to real estate assets within the Rouse portfolio either when GGP emerged from bankruptcy in November 2010 or upon any subsequent acquisition. After acquisition accounting is applied, the real estate assets are carried at the cost basis less accumulated depreciation. Real estate taxes and interest costs incurred during development periods are capitalized. Capitalized interest costs are based on qualified expenditures and interest rates in place during the development period. Capitalized real estate taxes, interest and interest related costs are amortized over lives which are consistent with the developed assets.
Pre-development costs, which generally include legal and professional fees and other directly-related third party costs, are capitalized as part of the property being developed. In the event a development project is no longer deemed to be probable, the costs previously capitalized are expensed.
Tenant improvements, either paid directly or in the form of construction allowances paid to tenants, are capitalized and depreciated over the shorter of the useful life or applicable lease term. Maintenance and repair costs are expensed when incurred. Expenditures for significant betterments and improvements are capitalized. In leasing tenant space, the Company may provide funding to the lessee through a tenant allowance. In accounting for a tenant allowance, the Company determines whether the allowance represents funding for the construction of leasehold improvements and evaluates the ownership of such improvements. If the Company is considered the owner of the leasehold improvements for accounting purposes, it capitalizes the amount of the tenant allowance and depreciates it over the shorter of the useful life of the leasehold improvements or the related lease term. If the tenant allowance represents a payment for a purpose other than funding leasehold improvements, or in the event that the Company is not considered the owner of the improvements for accounting purposes, the allowance is capitalized as a lease incentive and is recognized over the lease term as a reduction of rental revenue on a straight-line basis.
Depreciation or amortization expense is computed using the straight-line method based upon the following estimated useful lives:
Years | |
Buildings and improvements | 40 |
Equipment and fixtures | 5 - 10 |
Tenant improvements | Shorter of useful life or applicable lease term |
The Company reviews depreciable lives of its properties periodically and makes adjustments when necessary to reflect a shorter economic life.
Impairment
Operating properties and intangible assets
Accounting for the impairment or disposal of long-lived assets requires that if impairment indicators exist and the undiscounted cash flows expected to be generated by an asset are less than its carrying amount, an impairment should be recorded to write down the carrying amount of such asset to its fair value. The Company reviews all real estate assets for potential impairment indicators whenever events or changes in circumstances indicate that the carrying amount may not be recoverable. Impairment indicators are assessed separately for each property and include, but are not limited to, significant decreases in real estate property net operating income and occupancy percentages, high loan to value ratios, and carrying values in excess of the fair values. Impairment indicators for pre-development costs, which are typically costs incurred during the beginning stages of a potential development and developments in progress, are assessed by project and include, but are not limited to, significant changes to the Company’s plans with respect to the project, significant changes in projected completion dates, revenues or cash flows, development costs, market factors and sustainability of development projects.
If an indicator of potential impairment exists, the asset is tested for recoverability by comparing its carrying amount to the estimated future undiscounted cash flows. The cash flow estimates used both for determining recoverability and estimating fair value are inherently judgmental and reflect current and projected trends in rental, occupancy and capitalization rates, and estimated holding periods for the applicable assets. Although the estimated fair value of certain assets may exceed the carrying amount, a real estate asset is only considered to be impaired when its carrying amount cannot be recovered through estimated future undiscounted cash
71
flows. To the extent a provision for impairment is determined to be necessary, the excess of the carrying amount of the asset over its estimated fair value is expensed to operations. The adjusted carrying amount, which represents the new cost basis of the asset, is depreciated over the remaining useful life of the asset.
Steeplegate Mall
During the year ended December 31, 2013, the Company was unable to advance prospective leases at Steeplegate Mall, which changed management's intended holding period of this asset. Furthermore, the mortgage debt balance on this asset was due in August 2014 and without having advanced the prospective leasing, the Company did not anticipate funding additional capital for this asset. Management determined that the carrying value of the property was not recoverable and therefore required an impairment charge of $15.2 million during the year ended December 31, 2013, as the aggregate carrying value was higher than the fair value of the property.
In August 2014, upon a maturity default on the Steeplegate Mall mortgage loan, the loan servicer appointed a receiver to take over operations of the property until the property could be conveyed to the lender or a third party purchaser. As a result, the Company revised its intended hold period of this property to less than one year. The change in the hold period resulted in a change to undiscounted cash flows utilized in the impairment analysis and the Company concluded that the carrying value of the property was not recoverable. The Company recorded impairment charges on the property of $10.9 million during the year ended December 31, 2014 as the aggregate carrying value was higher than the fair value of the property. Impairment charges are included in "Provision for impairment" on the Company's Consolidated Statements of Operations and Comprehensive Income (Loss). In March 2015, the property associated with Steeplegate Mall was conveyed to its lender in full satisfaction of the debt.
Collin Creek Mall
In September 2014, the Company determined there were events and circumstances which changed management's estimated holding period for Collin Creek Mall. Specifically, as a result of the continued decline in operating metrics and results of the property, management had shortened the estimated hold period of the property, and during the year ended December 31, 2014, the Company recorded an impairment charge of $5.1 million, to reduce the aggregate carrying value to the estimated fair value of the property. Subsequently, the lender placed the loan into special servicing status and communicated to the Company that it would be unwilling to extend the term and discount the loan. As a result of the continued decline in the operating results of the property, management concluded it was in the best interest of the Company to convey the property to its lender prior to maturity in full satisfaction of the debt. Therefore, the Company revised its intended hold period of this property to less than one year. The change in the hold period resulted in a change to undiscounted cash flows utilized in the impairment analysis and the Company concluded that the carrying value of the property was not recoverable. The Company recorded an additional impairment charge of $2.9 million during the year ended December 31, 2015, to reduce the aggregate carrying value to the estimated fair value of the property. Impairment charges are included in "Provision for impairment" on the Company's Consolidated Statements of Operations and Comprehensive Income (Loss). In April 2015, the property associated with Collin Creek Mall was conveyed to its lender in full satisfaction of the debt.
Boulevard Mall
During 2013, the servicer of the loan for Boulevard Mall placed the loan into special servicing status and communicated to the Company that they would be unwilling to extend the term and discount the loan. As a result of this and the continued decline in operating results of the property, management concluded that it was in the best interest of the Company to convey the property to the lender. As the Company intended on conveying the property to the lender during 2013, the Company revised its intended hold period of this property to less than one year. The change in the hold period adjusted the undiscounted cash flows utilized in the impairment analysis and the Company concluded that the property was not recoverable. The Company recorded an impairment charge on the property of $21.7 million during the year ended December 31, 2013, as the aggregate carrying value was higher than the fair value of the property. This impairment charge is included in "Loss from discontinued operations" on the Company's Consolidated Statements of Operations and Comprehensive Income (Loss). During the year ended December 31, 2013, the Company conveyed its interest in the property to the lender, which resulted in a gain on extinguishment of debt of $14.0 million, which is recorded in "Gain on extinguishment of debt from discontinued operations" on the Company's Consolidated Statements of Operations and Comprehensive Income (Loss).
72
Acquisitions of Operating Properties
Acquisitions of properties are accounted for utilizing the acquisition method of accounting and, accordingly, the results of operations of acquired properties have been included in the results of operations from the respective dates of acquisitions. Estimates of future cash flows and other valuation techniques have been used to allocate the purchase price of the acquired property between land, buildings and improvements, equipment, debt, liabilities assumed and identifiable intangible assets and liabilities such as amounts related to in-place tenant leases, acquired above and below-market tenant and ground leases, and tenant relationships. No significant value has been ascribed to tenant relationships (see Note 3).
Intangible Assets and Liabilities
The following table summarizes our intangible assets and liabilities as a result of the application of acquisition accounting:
Gross Asset (Liability) | Accumulated (Amortization)/ Accretion | Net Carrying Amount | |||||||||
(In thousands) | |||||||||||
December 31, 2015 | |||||||||||
Tenant leases: | |||||||||||
In-place value | $ | 96,301 | $ | (42,446 | ) | $ | 53,855 | ||||
Above-market | 97,421 | (57,241 | ) | 40,180 | |||||||
Below-market | (67,081 | ) | 24,489 | (42,592 | ) | ||||||
Ground leases: | |||||||||||
Below-market | 3,682 | (692 | ) | 2,990 | |||||||
December 31, 2014 | |||||||||||
Tenant leases: | |||||||||||
In-place value | $ | 97,745 | $ | (43,481 | ) | $ | 54,264 | ||||
Above-market | 109,862 | (58,866 | ) | 50,996 | |||||||
Below-market | (65,476 | ) | 22,184 | (43,292 | ) | ||||||
Ground leases: | |||||||||||
Below-market | 3,682 | (537 | ) | 3,145 | |||||||
The gross asset balances of the in-place value of tenant leases are included in "Buildings and Equipment" on the Company's Consolidated Balance Sheets. Acquired in-place tenant leases are amortized over periods that approximate the related lease terms. The above-market tenant leases and below-market ground leases are included in "Prepaid expenses and other assets, net", and below-market tenant leases are included in "Accounts payable and accrued expenses, net" as detailed in Notes 4 and 6, respectively.
Amortization of in-place intangible assets decreased the Company's net income by $22.5 million, $26.6 million, and $17.2 million for the years ended December 31, 2015, 2014 and 2013, respectively. Amortization of in-place intangibles is included in "Depreciation and amortization" on the Company's Consolidated Statements of Operations and Comprehensive Income (Loss).
Amortization of above-market and below-market lease intangibles decreased the Company's revenue by $6.6 million, $13.1 million, and $15.7 million for the years ended December 31, 2015, 2014, and 2013, respectively. Amortization of above-market and below-market leasing intangibles are included in "Minimum rents" on the Company's Consolidated Statements of Operations and Comprehensive Income (Loss).
The intangibles above are related to specific tenant leases. Should a termination occur earlier than the date indicated in the lease, the related intangible assets or liabilities, if any, related to the lease are written off to expense or income, as applicable. The net impact of intangible write-offs for the year ended December 31, 2015 was $32.3 million, which is included on the Company's Consolidated Statements of Operations and Comprehensive Income (Loss).
73
Future amortization/accretion of these intangibles is estimated to decrease the Company's net income as follows:
Year | In-place lease intangibles | Above/(below) market leases, net | ||||||
(In thousands) | ||||||||
2016 | $ | 17,136 | $ | 2,056 | ||||
2017 | $ | 9,291 | $ | 2,942 | ||||
2018 | $ | 6,502 | $ | 686 | ||||
2019 | $ | 4,680 | $ | (587 | ) | |||
2020 | $ | 3,686 | $ | (1,158 | ) | |||
Cash and Cash Equivalents
The Company considers all demand deposits with a maturity of three months or less, at the date of purchase, to be cash equivalents.
Restricted Cash
Restricted cash consists of security deposits and cash escrowed under loan agreements for debt service, real estate taxes, property insurance, tenant improvements, capital renovations and capital improvements.
Interest Rate Hedging Instruments
The Company recognizes its derivative financial instruments in either "Prepaid expenses and other assets, net" or "Accounts payable and accrued expenses, net", as applicable, in the Consolidated Balance Sheets and measures those instruments at fair value. The accounting for changes in fair value (i.e., gain or loss) of a derivative depends on whether it has been designated and qualifies as part of a hedging relationship, and further, on the type of hedging relationship. To qualify as a hedging instrument, a derivative must pass prescribed effectiveness tests, performed quarterly using both quantitative and qualitative methods. During the year ended December 31, 2015, the Company entered into four derivative agreements that qualify as hedging instruments and were designated, based upon the exposure of being hedged, as cash flow hedges. The fair value of the cash flow hedges as of December 31, 2015 was $0.6 million and $0.7 million and is included in "Prepaid expenses and other assets, net" and "Accounts payable and accrued expenses, net" in the Company's Consolidated Balance Sheets, respectively. The fair value of the Company's interest rate hedge is classified as Level 2 in the fair value measurement table. To the extent they are effective, changes in fair value of cash flow hedges are reported in "Accumulated other comprehensive income (loss)" ("AOCI/L") and reclassified into earnings in the same period or periods during which the hedged item affects earnings. The ineffective portion of the hedge, if any, is recognized in current earnings during the period of change in fair value. The gain or loss on the termination of an effective cash flow hedge is reported in AOCI/L and reclassified into earnings in the same period or periods during which the hedged item affects earnings. The Company also assesses the credit risk that the counterparty will not perform according to the terms of the contract.
Revenue Recognition and Related Matters
Minimum rent revenues are recognized on a straight-line basis over the terms of the related leases. Minimum rent revenues also include amounts collected from tenants to allow for the termination of their leases prior to their scheduled termination dates, amortization related to above and below-market tenant leases on acquired properties and tenant inducements, and percentage rents in lieu of minimum rent from those leases where the Company receives a percentage of tenant revenues.
74
The following is a summary of amortization of straight-line rent, lease termination income, net amortization related to above and below-market tenant leases, amortization of tenant inducements, and percentage rent in lieu of minimum rent for the years ended December 31, 2015, 2014 and 2013:
Years ended December 31, | ||||||||||||
2015 | 2014 | 2013 | ||||||||||
(In thousands) | ||||||||||||
Straight-line rent amortization | $ | 1,217 | $ | 1,785 | $ | 3,488 | ||||||
Lease termination income | 1,867 | 2,204 | 413 | |||||||||
Net amortization of above and below-market tenant leases | (6,578 | ) | (13,073 | ) | (15,672 | ) | ||||||
Amortization of tenant inducement | (72 | ) | (28 | ) | (1,000 | ) | ||||||
Percentage rents in lieu of minimum rent | 7,609 | 6,731 | 7,071 | |||||||||
Straight-line rent receivables represent the current net cumulative rents recognized prior to when billed and collectible, as provided by the terms of the leases. The following is a summary of straight-line rent receivables, which are included in "Accounts receivable, net," in the Company's Consolidated Balance Sheets and are reduced by an allowance for doubtful accounts:
December 31, 2015 | December 31, 2014 | ||||||
(In thousands) | |||||||
Straight-line rent receivables, net | $ | 14,856 | $ | 14,431 | |||
The Company provides an allowance for doubtful accounts against the portion of accounts receivable, including straight-line rents, which is estimated to be uncollectible. Such allowances are reviewed periodically based upon our recovery experience. The Company also evaluates the probability of collecting future rent which is recognized currently under a straight-line methodology. This analysis considers the long term nature of the Company's leases, as a certain portion of the straight-line rent currently recognizable will not be billed to the tenant until future periods. The Company's experience relative to unbilled straight-line rent receivable is that a certain portion of the amounts recorded as straight-line rental revenue are never collected from (or billed to) tenants due to early lease terminations. For that portion of the recognized deferred rent that is not deemed to be probable of collection, an allowance for doubtful accounts has been provided. Accounts receivable are shown net of an allowance for doubtful accounts of $3.4 million as of December 31, 2015 and 2014. The following table summarizes the changes in allowance for doubtful accounts for all receivables:
2015 | 2014 | 2013 | ||||||||||
(In thousands) | ||||||||||||
Balance at January 1, | $ | 3,353 | $ | 2,798 | $ | 2,545 | ||||||
Provision for doubtful accounts | 1,746 | 1,228 | 887 | |||||||||
Write-offs | (1,724 | ) | (673 | ) | (634 | ) | ||||||
Balance at December 31, | $ | 3,375 | $ | 3,353 | $ | 2,798 | ||||||
Tenant recoveries are amounts due from tenants that are established in the leases or computed based upon a formula related to real estate taxes, insurance and other property operating expenses and are generally recognized as revenues in the period the related costs are incurred. The Company makes certain assumptions and judgments in estimating the reimbursements at the end of each reporting period. The Company does not expect the actual results to materially differ from the estimated reimbursement.
Overage rent is paid by a tenant when its sales exceed an agreed-upon minimum amount. Overage rent is calculated by multiplying the sales in excess of the minimum amount by a percentage defined in the lease. Overage rent is recognized on an accrual basis once tenant sales exceed contractual tenant lease thresholds.
75
Other revenues generally consist of amounts earned by the Company for vending, advertising, and marketing revenues earned at the Company's malls and is recognized on an accrual basis over the related service period.
Income (Loss) Per Share
Basic net income (loss) per share is computed by dividing the net income (loss) applicable to common shareholders by the weighted-average number of shares of common stock outstanding for the period. Diluted net income per share is calculated similarly; however, it reflects potential dilution of securities by adding the incremental weighted average shares that would have been outstanding assuming all potentially dilutive securities were converted into common stock at the earliest date possible to the weighted-average number of shares of common stock outstanding for the period. For the years ended December 31, 2015, 2014 and 2013, there were 3,490,421, 3,313,869 and 2,579,171 stock options outstanding, respectively, that potentially could be converted into shares of common stock and 72,484, 205,731 and 278,617 shares of non-vested restricted stock outstanding, respectively. The impact of dilutive stock options and non-vested restricted stock have been considered in the calculation of diluted weighted average shares outstanding for the year ended December 31, 2015. These stock options and shares of restricted stock have been excluded from this computation for the years ended December 31, 2014 and 2013, as their effect is anti-dilutive.
Fair Value
The objective of fair value is to determine the price that would be received upon the sale of an asset or paid to transfer a liability in an orderly transaction between market participants at the measurement date (the exit price). GAAP establishes a fair value hierarchy that prioritizes observable and unobservable inputs used to measure fair value:
• | Level 1 — quoted prices (unadjusted) in active markets that are accessible at the measurement date for assets or liabilities; |
• | Level 2 — observable prices that are based on inputs not quoted in active markets, but corroborated by market data; and |
• | Level 3 — unobservable inputs that are used when little or no market data is available. |
The fair value hierarchy gives the highest priority to Level 1 inputs and the lowest priority to Level 3 inputs. In determining fair value, the Company utilizes valuation techniques that maximize the use of observable inputs and minimize the use of unobservable inputs to the extent possible, as well as considers counterparty credit risk in our assessment of fair value. Considerable judgment is necessary to interpret Level 2 and 3 inputs in determining the fair value of our financial and non-financial assets and liabilities. Accordingly, the Company's fair value estimates, which are made at the end of each reporting period, may be different than the amounts that may ultimately be realized upon the sale or disposition of these assets.
76
The following table sets forth information regarding the Company's financial and non-financial instruments that are measured at fair value on a recurring and non-recurring basis by the above categories:
Total Fair Value Measurement | Quoted Price in Active Markets for Identical Assets (Level 1) | Significant Other Observable Inputs (Level 2) | Significant Unobservable Inputs (Level 3) | |||||||||||||
(In thousands) | ||||||||||||||||
December 31, 2015 | ||||||||||||||||
Recurring basis: | ||||||||||||||||
Assets: | ||||||||||||||||
Interest rate cap | $ | 612 | $ | — | $ | 612 | $ | — | ||||||||
Liabilities: | ||||||||||||||||
Interest rate swap | $ | (677 | ) | $ | — | $ | (677 | ) | $ | — | ||||||
Non-recurring basis: | ||||||||||||||||
Investment in Real Estate | $ | — | $ | — | $ | — | $ | — | ||||||||
December 31, 2014 | ||||||||||||||||
Recurring basis: | ||||||||||||||||
Assets: | ||||||||||||||||
Interest rate cap | $ | 1 | $ | — | $ | 1 | $ | — | ||||||||
Liabilities: | ||||||||||||||||
Interest rate swap | $ | (482 | ) | $ | — | $ | (482 | ) | $ | — | ||||||
Non-recurring basis: | ||||||||||||||||
Investment in Real Estate (1) | $ | 74,237 | $ | — | $ | — | $ | 74,237 | ||||||||
Explanatory Note:
(1) The carrying value includes each mall's respective land, building, and in-place lease value.
The following is a reconciliation of the carrying value of properties that were impaired and disposed of during the years ended December 31, 2015 and 2014:
Collin Creek Mall (1)(3) | Steeplegate Mall (1)(4) | |||||||
Beginning carrying value, January 1, 2014 | $ | 60,120 | $ | 34,789 | ||||
Capital expenditures | 1,449 | 456 | ||||||
Depreciation and amortization expense | (4,723 | ) | (1,700 | ) | ||||
Loss on impairment of real estate | (5,079 | ) | (10,886 | ) | ||||
Disposition of real estate asset | — | — | ||||||
Ending carrying value, December 31, 2014 | $ | 51,767 | $ | 22,659 | ||||
Collin Creek Mall (1) | Steeplegate Mall (1) | |||||||
Beginning carrying value, January 1, 2015 | $ | 51,767 | $ | 22,659 | ||||
Capital expenditures | — | — | ||||||
Depreciation and amortization expense | (539 | ) | (219 | ) | ||||
Loss on impairment of real estate | (2,900 | ) | — | |||||
Disposition of real estate asset (2) | (48,328 | ) | (22,440 | ) | ||||
Ending carrying value, December 31, 2015 | $ | — | $ | — | ||||
Explanatory Note:
(1) The carrying value includes each mall's respective land, building, in-place lease value, and above and below market lease values.
(2) The property was conveyed to its mortgage lender during the year ended December 31, 2015.
77
(3) Valued using a Terminal Capitalization Rate as of December 31, 2014.
(4) Valued using a Discounted Cash Flow Analysis with Discount Rate and Terminal Capitalization Rates as of December 31, 2014 as reflected in the table below.
The Company estimates fair value relating to impairment assessments utilizing a direct capitalization rate on forecasted net operating income or discounted cash flows that include all projected cash inflows and outflows over a specific holding period. Such projected cash flows are comprised of contractual rental revenues and forecasted rental revenues and expenses based upon market conditions and expectations for growth. Capitalization rates and discount rates utilized in these models are based on a reasonable range of current market rates for each property analyzed. The determination of which method to use is based on expected market conditions specific to the property being assessed. Based upon these inputs, the Company determined that its valuation of a property using a discounted cash flow model was classified within Level 3 of the fair value hierarchy.
The following table sets forth quantitative information about the unobservable inputs of the Company's Level 3 Real Estate, which are recorded at fair values as of December 31, 2014:
As of December 31, | |||
Unobservable Quantitative Inputs | 2014 | ||
Discount Rate | 11.0 | % | |
Terminal Capitalization Rate | 9.5% - 10.0% | ||
The properties were conveyed to their lenders during the year ended December 31, 2015.
The Company uses interest rate swaps and caps to mitigate the effect of interest rate movements on its variable-rate debt. The Company had four interest rate swaps and one interest rate cap as of December 31, 2015 and one interest rate swap and one interest rate cap as of December 31, 2014, and the interest rate swaps qualified for hedge accounting. The interest rate swaps have met the effectiveness test criteria since inception and changes in their fair values are reported in "Other comprehensive income/(loss)" ("OCI/L") and are reclassified into earnings in the same period or periods during which the hedged item affects earnings. The interest rate cap did not qualify for hedge accounting and changes in its fair value are reported in earnings during the period incurred. The fair value of the Company's interest rate hedges, classified under Level 2, are determined based on prevailing market data for contracts with matching durations, current and anticipated LIBOR information, consideration of the Company's credit standing, credit risk of the counterparty, and reasonable estimates about relevant future market conditions. See Note 7 for additional information regarding the Company's interest rate hedging instruments.
The Company's financial instruments are short term in nature and as such their fair values approximate their carrying amount in our Consolidated Balance Sheets except for debt. As of December 31, 2015 and 2014, management’s estimates of fair value are presented below. The Company estimated the fair value of the debt using a future discounted cash flow analysis based on the use and weighting of multiple market inputs. As a result of the frequency and availability of market data, the inputs used to measure the estimated fair value of debt are Level 3 inputs. The primary sensitivity in these calculations is based on the selection of appropriate discount rates.
December 31, 2015 | December 31, 2014 | ||||||||||||||
Carrying Amount | Estimated Fair Value | Carrying Amount | Estimated Fair Value | ||||||||||||
(In thousands) | |||||||||||||||
Fixed-rate debt | $ | 1,137,818 | $ | 1,156,729 | $ | 1,249,195 | $ | 1,248,928 | |||||||
Variable-rate debt | 568,695 | 571,390 | 335,304 | 336,791 | |||||||||||
Total mortgages, notes and loans payable | $ | 1,706,513 | $ | 1,728,119 | $ | 1,584,499 | $ | 1,585,719 | |||||||
Offering Costs
Costs associated with the issuance of common stock and rights offering to the Company's stockholders were deferred and charged against the gross proceeds of the offering upon the sale of shares during the year ended December 31, 2014 (see Note 11).
78
Leases
Leases which transfer substantially all the risks and benefits of ownership to tenants are considered finance leases and the present values of the minimum lease payments and the estimated residual values of the leased properties, if any, are accounted for as receivables. Leases which transfer substantially all the risks and benefits of ownership to the Company are considered capital leases and the present values of the minimum lease payments are accounted for as assets and liabilities. All other leases are treated as operating leases. As of December 31, 2015 and 2014, all of the Company's leases are treated as operating leases.
Deferred Expenses
Deferred expenses are comprised of deferred lease costs incurred in connection with obtaining new tenants or renewals of lease agreements with current tenants, which are amortized on a straight-line basis over the terms of the related leases and included in "Depreciation and amortization" on the Company's Consolidated Statements of Operations and Comprehensive Income (Loss). Deferred financing costs are amortized on a straight-line basis (which approximates the effective interest method) over the lives of the related mortgages, notes, and loans payable and included in "Interest expense" on the Company's Consolidated Statements of Operations and Comprehensive Income (Loss). The following table summarizes our deferred lease and financing costs:
Gross Asset | Accumulated Amortization | Net Carrying Amount | |||||||||
(In thousands) | |||||||||||
December 31, 2015 | |||||||||||
Deferred lease costs | $ | 61,626 | $ | (16,990 | ) | $ | 44,636 | ||||
Deferred financing costs | 18,243 | (6,348 | ) | 11,895 | |||||||
Total | $ | 79,869 | $ | (23,338 | ) | $ | 56,531 | ||||
December 31, 2014 | |||||||||||
Deferred lease costs | $ | 55,647 | $ | (14,683 | ) | $ | 40,964 | ||||
Deferred financing costs | 19,151 | (7,504 | ) | 11,647 | |||||||
Total | $ | 74,798 | $ | (22,187 | ) | $ | 52,611 | ||||
Stock-Based Compensation
The Company recognizes all stock-based compensation to employees, including grants of employee stock options and restricted stock awards, in the financial statements as compensation cost. The compensation cost is amortized over the respective vesting period based on its fair value on the date of grant.
Asset Retirement Obligations
The Company evaluates any potential asset retirement obligations, including those related to disposal of asbestos containing materials and environmental remediation liabilities. The Company recognizes the fair value of such obligations in the period incurred if a reasonable estimate of fair value can be determined. As of December 31, 2015 and 2014, estimated costs of environmental remediation of approximately $6.1 million and $4.5 million, respectively, have been recorded as a liability in "Accounts payable and accrued expenses, net" on the Company's Consolidated Balance Sheets. The Company does not believe that actual remediation costs will be materially different than the estimates as of December 31, 2015.
Use of Estimates
The preparation of financial statements in conformity with GAAP requires management to make estimates and assumptions. These estimates and assumptions affect the reported amounts of assets and liabilities and the disclosure of contingent assets and liabilities at the date of the financial statements and the reported amounts of revenues and expenses during the reporting periods. For example, estimates and assumptions have been made with respect to fair values of assets and liabilities for purposes of applying the acquisition method of accounting, the useful lives of assets, capitalization of development and leasing costs, recoverable amounts of receivables, impairment of long-lived assets, valuation of hedging instruments and fair value of debt. Actual results could differ from these and other estimates.
79
Discontinued Operations
Prior to 2014, the Company reclassified to discontinued operations any material operations and gains or losses on disposal related to properties that were held for sale or disposed of during the relevant period, in accordance with the applicable accounting standards. In 2014, the Company early adopted Accounting Standards Update ("ASU") 2014-08, "Reporting Discontinued Operations and Disclosures of Disposals of Components of an Entity" issued by the Financial Accounting Standards Board ("FASB"). ASU 2014-08 changes the definition of a discontinued operation to include only those disposals of components of an entity that represent a strategic shift that has (or will have) a major effect on an entity's operations and financial results. The Company applied the revised definition to all disposals on a prospective basis beginning January 1, 2014.
Recent Accounting Pronouncements
In May 2014, the FASB issued ASU 2014-09, "Revenue from Contracts with Customers (Topic 606)". This topic provides for five principles which should be followed to determine the appropriate amount and timing of revenue recognition for the transfer of goods and services to customers. The principles in this ASU should be applied to all contracts with customers regardless of industry. The amendments in this ASU are effective for reporting periods beginning after December 15, 2017, with two transition methods of adoption allowed. Early adoption for reporting periods prior to December 15, 2017 is not permitted. The Company is evaluating the financial statement impact of the guidance in this ASU.
In August 2014, the FASB issued ASU 2014-15, "Disclosure of Uncertainties about an Entity's Ability to Continue as a Going Concern". This topic provides guidance on management's responsibility to evaluate whether there is substantial doubt about a company's ability to continue as a going concern and requires related footnote disclosures. The amendments in this ASU are effective for the annual period after December 15, 2016, and for annual and interim periods thereafter. The Company is currently evaluating the impact of the guidance in this ASU.
In February 2015, the FASB issued ASU 2015-02, “Consolidation (Topic 810): Amendments to the Consolidation Analysis”, which makes certain changes to both the variable interest model and the voting model, including changes to (1) the identification of variable interests (fees paid to a decision maker or service provider), (2) the variable interest entity characteristics for a limited partnership or similar entity and (3) the primary beneficiary determination. ASU 2015-02 is effective for the Company beginning January 1, 2016. Early adoption is permitted. The Company does not expect the adoption of this standard to have a significant impact on the Consolidated Financial Statements.
In April 2015, the FASB issued ASU 2015-03, "Simplifying the Presentation of Debt Issuance Costs", which requires that debt issuance costs related to a recognized debt liability be presented in the balance sheet as a direct deduction from the carrying amount of the related debt liability. For public business entities, this ASU is effective for financial statements issued for fiscal years beginning after December 15, 2015, and interim periods within those fiscal years. Entities should apply the new guidance on a retrospective basis, wherein the balance sheet of each individual period presented should be adjusted to reflect the period-specific effects of applying the new guidance. The Company had $11.9 million in debt issuance costs included in "Deferred Expenses, Net" on the Consolidated Balance Sheet as of December 31, 2015. The Company will adopt this ASU effective January 1, 2016.
In August 2015, the FASB issued an update ASU 2015-15, " Interest – Imputation of Interest" to ASC Topic 835, "Capitalization of Interest". For debt issuance costs related to line-of-credit arrangements, ASU 2015-15 allows entities to present debt issuance costs as an asset and subsequently amortize the deferred debt issuance costs ratably over the term of the line-of-credit arrangement, regardless of whether there are any outstanding borrowings on the line-of-credit arrangement. The Company will adopt this ASU effective January 1, 2016.
In January 2016, the FASB issued an update ASU 2016-01, "Recognition and Measurement of Financial Assets and Financial Liabilities" to ASC Topic 825, "Financial Instruments" (“ASC 825”). ASU 2016-01 amends certain aspects of recognition, measurement, presentation and disclosure of financial instruments, including the requirement to measure certain equity investments at fair value with changes in fair value recognized in net income. ASU 2016-01 is effective for interim and annual reporting periods in fiscal years beginning after December 15, 2017. We are currently evaluating the impact of the adoption of ASU 2016-01 on our Consolidated Financial Statements.
80
NOTE 3 ACQUISITIONS
The Company includes the results of operations of real estate assets acquired in the Company's Consolidated Statements of Operations and Comprehensive Income (Loss) from the date of the related transaction.
The following table presents the Company's acquisitions during the years ended December 31, 2015, 2014 and 2013:
Date Acquired | Property Name | Location | Square Footage Acquired | Purchase Price | ||||||||
2015 Acquisitions | (In thousands) | |||||||||||
1/28/2015 | Mt. Shasta Mall (1) (2) | Redding, CA | 521,000 | $ | 49,000 | |||||||
6/3/2015 | Fig Garden Village (1) (3) | Fresno, CA | 301,459 | 106,100 | ||||||||
11/12/2015 | The Shoppes at Carlsbad (1) (4) | Carlsbad, CA | 1,117,040 | 170,000 | ||||||||
2015 Acquisitions Total | 1,939,499 | $ | 325,100 | |||||||||
2014 Acquisitions | ||||||||||||
5/22/2014 | The Shoppes at Bel Air (1) (5) | Mobile, AL | 1,004,439 | $ | 131,917 | |||||||
8/29/2014 | The Mall at Barnes Crossing (6) | Tupelo, MS | 736,607 | 98,850 | ||||||||
2014 Acquisitions Total | 1,741,046 | $ | 230,767 | |||||||||
2013 Acquisitions | ||||||||||||
7/24/2013 | Greenville Mall (1) (7) | Greenville, NC | 413,759 | $ | 48,900 | |||||||
12/11/2013 | Chesterfield Towne Center (1) (8) | Richmond, VA | 1,016,258 | 165,500 | ||||||||
12/11/2013 | The Centre at Salisbury (1) (9) | Salisbury, MD | 721,396 | 127,000 | ||||||||
2013 Acquisitions Total | 2,151,413 | $ | 341,400 | |||||||||
Explanatory Notes:
(1) Rouse acquired a 100% interest in the mall.
(2) | The Company closed on a new $31.9 million non-recourse mortgage loan that bears interest at 4.19%, matures in March 2025, is interest only for the first three years and amortizes over 30 years thereafter. |
(3) The Company closed on a new $74.2 million non-recourse mortgage loan that bears interest at 4.14%, matures in June 2025, is interest only for the first five years and amortizes over 30 years thereafter.
(4) In conjunction with the closing of this transaction, the Operating Partnership issued $140.0 million of its Series A Preferred Units to the seller. Distributions on the Series A Preferred Units accumulate at an annual rate of 5% and are payable quarterly. The Series A Preferred Units may be redeemed by the Company after three years (subject to certain tax protection payments if the Company redeems the Series A Preferred Units prior to 2022) and by the holder after ten years, in either case at par plus accumulated and unpaid distributions and in the form of cash or common units of limited partnership ("Common Units") of the Operating Partnership as determined by us (See Note 10 for further details on our non-controlling interest in operating partnership.) In December 2015, The Shoppes at Carlsbad was added to the 2013 Senior Facility collateral pool (see Note 5 for further details on the 2013 Senior Facility).
(5) The Company assumed an existing $112.5 million non-recourse mortgage loan with the acquisition. The loan bears interest at a fixed rate of 5.30%, matured in December 2015, and amortizes on a 30 year schedule thereafter. In October 2015, the Company refinanced the loan with a new non-recourse mortgage loan for $120.0 million. The initial funding of $110.5 million was used to retire the outstanding mortgage loan of $109.5 million. The loan provides for an additional subsequent funding of $9.5 million upon achieving certain conditions. The loan has an initial maturity of November 2018 with a one year extension option. The loan bears interest at a floating rate of LIBOR (30 day) plus 235 basis points and is interest only for the first two years. (See Note 5 of Consolidated Financial Statements for further details).
(6) Rouse acquired a 51% controlling interest in the mall and related properties. In conjunction with the closing of this transaction, the Company closed on a new $67.0 million non-recourse mortgage loan that bears interest at 4.29%, matures in September 2024, is interest only for the first three years and amortizes over a 30 years thereafter. In November 2015, the Company purchased an additional 1.8% interest in the joint venture. As of December 31, 2015, the Company held 52.8% interest in the property. (See Note 13 for further details.)
(7) The Company assumed an existing $41.7 million non-recourse mortgage loan with the acquisition. The loan bears interest at a fixed rate of 5.29%, matured in December 2015, and amortizes on a 30 year schedule thereafter. A fair value adjustment of $0.2 million was recorded as a result of the mortgage assumption.. In October 2015, the Company refinanced the loan with a new non-recourse mortgage loan for $45.5 million, which bears interest at a fixed rate of 4.46%, matures in November 2025, and amortizes over 30 years thereafter. This loan replaced a $40.2 million non-recourse mortgage loan.
(8) The Company assumed an existing $109.7 million non-recourse mortgage loan with the acquisition. The loan bears interest at a fixed rate of 4.75%, matures in October 2022, and amortizes over 30 years. A fair value adjustment of $1.3 million was recorded as a result of the mortgage assumption.
(9) The Company assumed an existing $115.0 million partial recourse mortgage loan with the acquisition. The loan bears interest at a fixed rate of 5.79%, matures in May 2016, and is interest only. A fair value adjustment of $1.2 million was recorded as a result of the mortgage assumption.
The following table presents certain additional information regarding the Company's acquisitions during the years ended
81
December 31, 2015, 2014 and 2013:
Property Name | Land | Building and Improvements | Acquired Lease Intangibles | Acquired Above Market Lease Intangibles | Acquired Below Market Lease Intangibles | Other | |||||||||||||||||||
2015 Acquisitions | (In thousands) | ||||||||||||||||||||||||
Mt. Shasta Mall | $ | 7,809 | $ | 38,008 | $ | 3,779 | $ | 915 | $ | (1,813 | ) | $ | 302 | ||||||||||||
Fig Garden Village | 18,774 | 79,528 | 7,366 | 3,975 | (2,907 | ) | (636 | ) | |||||||||||||||||
The Shoppes at Carlsbad | 49,452 | 111,671 | 11,841 | 4,109 | (8,395 | ) | 1,322 | ||||||||||||||||||
Total | $ | 76,035 | $ | 229,207 | $ | 22,986 | $ | 8,999 | $ | (13,115 | ) | $ | 988 | ||||||||||||
2014 Acquisitions | |||||||||||||||||||||||||
The Shoppes at Bel Air | $ | 8,969 | $ | 111,206 | $ | 11,329 | $ | 3,952 | $ | (6,889 | ) | $ | 3,350 | ||||||||||||
The Mall at Barnes Crossing | 17,969 | 75,949 | 6,973 | 4,700 | (8,100 | ) | 1,359 | ||||||||||||||||||
Total | $ | 26,938 | $ | 187,155 | $ | 18,302 | $ | 8,652 | $ | (14,989 | ) | $ | 4,709 | ||||||||||||
2013 Acquisitions | |||||||||||||||||||||||||
Greenville Mall | $ | 9,088 | $ | 36,961 | $ | 5,076 | $ | 1,098 | $ | (4,521 | ) | $ | 1,430 | ||||||||||||
Chesterfield Towne Center | 19,387 | 135,825 | 8,755 | 4,843 | (6,741 | ) | 2,181 | ||||||||||||||||||
The Centre at Salisbury | 22,580 | 96,050 | 9,326 | 4,043 | (4,729 | ) | 972 | ||||||||||||||||||
Total | $ | 51,055 | $ | 268,836 | $ | 23,157 | $ | 9,984 | $ | (15,991 | ) | $ | 4,583 | ||||||||||||
The Company incurred acquisition and transaction related costs of $2.8 million, $1.0 million, and $2.1 million for the years ended December 31, 2015, 2014, and 2013, respectively. Acquisition and transaction related costs consist of due diligence costs such as legal fees, environmental studies, and closing costs. These costs are recorded in "Other" on the Company's Consolidated Statements of Operations and Comprehensive Income (Loss).
During the year ended December 31, 2015, the Company recorded approximately $15.3 million in revenues and $2.6 million in net loss related to the acquisitions of Mt. Shasta Mall, Fig Garden Village and The Shoppes at Carlsbad. During the year ended December 31, 2014, the Company recorded approximately $14.6 million in revenues and $1.6 million in net loss related to the acquisitions of The Shoppes at Bel Air and The Mall at Barnes Crossing. During the year ended December 31, 2013, the Company recorded approximately $4.8 million in revenues and $1.1 million in net loss related to the acquisitions of Greenville Mall, Chesterfield Towne Center and The Centre at Salisbury.
The following condensed pro forma financial information for the years ended December 31, 2015 and 2014 includes pro forma adjustments related to the 2015 acquisitions of Mt. Shasta Mall, Fig Garden Village and The Shoppes at Carlsbad, which are presented assuming the acquisitions had been consummated as of January 1, 2014. The pro forma financial information for the year ended December 31, 2014 includes pro forma adjustments related to the 2014 acquisitions of The Shoppes at Bel Air and The Mall at Barnes Crossing, which are presented assuming the acquisitions had been consummated as of January 1, 2013. The pro forma financial information for the year ended December 31, 2013 includes pro forma adjustments related to the 2013 acquisitions of Greenville Mall, Chesterfield Town Center and The Centre at Salisbury, which are presented assuming the acquisitions had been consummated as of January 1, 2013.
The following condensed pro forma financial information is not necessarily indicative of what the actual results of operations of the Company would have been assuming the acquisitions had been consummated as of January 1, 2015, 2014 and 2013, nor does it purport to represent the results of operations for future periods. Pro forma adjustments include above and below-market amortization, straight-line rent, interest expense, and depreciation and amortization.
82
For the Year Ended December 31, | ||||||||||||
2015 | 2014 | 2013 | ||||||||||
(In thousands, except per share amounts) | (Unaudited) | |||||||||||
Total revenues | $ | 326,883 | $ | 343,703 | $ | 307,790 | ||||||
Net income (loss) allocable to common shareholders | 40,465 | (53,858 | ) | (56,836 | ) | |||||||
Net income (loss) per share - basic | $ | 0.70 | $ | (0.94 | ) | $ | (1.15 | ) | ||||
Net income (loss) per share - dilutive | $ | 0.70 | $ | (0.94 | ) | $ | (1.15 | ) | ||||
Weighted average shares - basic | 57,874,772 | 57,203,196 | 49,344,927 | |||||||||
Weighted average shares - dilutive | 58,188,741 | 57,203,196 | 49,344,927 | |||||||||
NOTE 4 PREPAID EXPENSES AND OTHER ASSETS, NET
The following table summarizes the significant components of prepaid expenses and other assets, net:
December 31, | |||||||
2015 | 2014 | ||||||
(In thousands) | |||||||
Above-market tenant leases, net (Note 2) | $ | 40,180 | $ | 50,996 | |||
Prepaid expenses | 4,372 | 4,755 | |||||
Below-market ground leases, net (Note 2) | 2,990 | 3,145 | |||||
Deposits | 424 | 1,447 | |||||
Other | 1,068 | 2,347 | |||||
Total prepaid expenses and other assets, net | $ | 49,034 | $ | 62,690 | |||
83
NOTE 5 MORTGAGES, NOTES AND LOANS PAYABLE
Mortgages, notes and loans payable are summarized as follows:
December 31, | |||||||||||||
2015 | 2014 | Interest Rate at December 31, 2015 | Schedule Maturity Date | ||||||||||
Fixed-rate debt: | (In thousands) | ||||||||||||
Steeplegate Mall (1) | $ | — | $ | 45,858 | — | % | — | ||||||
Washington Park Mall (2) | — | 10,505 | — | — | |||||||||
Collin Creek Mall (1) | — | 58,128 | — | — | |||||||||
Grand Traverse Mall (2) | — | 59,479 | — | — | |||||||||
The Shoppes at Bel Air (3) | — | 111,276 | — | — | |||||||||
Vista Ridge Mall | 65,611 | 68,537 | 6.87 | April 2016 | |||||||||
The Centre at Salisbury (4) | 115,000 | 115,000 | 5.79 | May 2016 | |||||||||
The Mall at Turtle Creek | 76,615 | 77,648 | 6.54 | June 2016 | |||||||||
West Valley Mall (5) | 59,000 | 59,000 | 3.24 | September 2018 | |||||||||
The Shoppes at Gateway (3) | 75,000 | — | 3.64 | January 2020 | |||||||||
Pierre Bossier Mall | 45,875 | 46,654 | 4.94 | May 2022 | |||||||||
Pierre Bossier Anchor | 3,550 | 3,637 | 4.85 | May 2022 | |||||||||
Southland Center (MI) | 74,806 | 76,037 | 5.09 | July 2022 | |||||||||
Chesterfield Towne Center | 106,379 | 107,967 | 4.75 | October 2022 | |||||||||
Animas Valley Mall | 49,156 | 50,053 | 4.41 | November 2022 | |||||||||
Lakeland Square | 66,814 | 68,053 | 4.17 | April 2023 | |||||||||
Valley Hills Mall | 65,362 | 66,492 | 4.47 | July 2023 | |||||||||
Chula Vista Center (3) (6) | 70,000 | 70,000 | 4.18 | July 2024 | |||||||||
The Mall at Barnes Crossing (3) | 67,000 | 67,000 | 4.29 | September 2024 | |||||||||
Bayshore Mall (3) | 46,500 | 46,500 | 3.96 | November 2024 | |||||||||
Mt. Shasta Mall (3) | 31,850 | — | 4.19 | March 2025 | |||||||||
Fig Garden Village (3) | 74,200 | — | 4.14 | June 2025 | |||||||||
Greenville Mall (3) | 45,440 | 40,602 | 4.46 | November 2025 | |||||||||
Total Fixed-rate debt | $ | 1,138,158 | $ | 1,248,426 | |||||||||
Less: Market rate adjustments | (340 | ) | 769 | ||||||||||
$ | 1,137,818 | $ | 1,249,195 | ||||||||||
Variable- rate debt: | |||||||||||||
NewPark Mall (3) (7) | $ | 114,245 | $ | 65,304 | 2.53 | % | September 2018 | ||||||
The Shoppes at Bel Air (3) (8) | 110,450 | — | 2.78 | November 2018 | |||||||||
2013 Term Loan (9) (10) | 285,000 | 260,000 | 2.77 | November 2018 | |||||||||
2013 Revolver (9) (10) | 59,000 | 10,000 | 2.76 | November 2017 | |||||||||
Total Variable-rate debt | $ | 568,695 | $ | 335,304 | |||||||||
Total mortgages, notes and loan payable | $ | 1,706,513 | $ | 1,584,499 | |||||||||
84
Explanatory Notes:
(1) The Company conveyed the related property to its lender in full satisfaction of the debt during 2015.
(2) The Company repaid the mortgage debt balance during 2015.
(3) See the significant property loan refinancings and acquisitions table below, under "—Property-Level Debt" in this Note 5 for additional information regarding the debt related to each property.
(4) The Company guaranteed a maximum amount of $3.5 million until certain financial covenants are met for two consecutive years.
(5) During January 2014, the Company entered into an interest rate swap transaction which fixed the interest rate on the loan for this property at 3.24%, through June 2018. See Note 7 for further details.
(6) On July 1, 2014, the Company removed Chula Vista Center from the 2013 Senior Facility (as defined below) collateral pool and placed a new non-recourse mortgage loan on Chula Vista Center. The Sikes Senter mortgage loan was repaid on July 1, 2014 from proceeds from the Chula Vista Center refinancing and upon repayment, Sikes Senter was added to the 2013 Senior Facility collateral pool with no change to the outstanding 2013 Senior Facility collateral pool balance.
7) LIBOR (30 day) plus 210 basis points. The Company entered into an interest rate swap transaction which fixed the interest rate on the loan for this property at 3.26% beginning January 2016, through September 2018. See Note 7 for further details.
(8) LIBOR (30 day) plus 235 basis points. The Company entered into an interest rate swap transaction beginning January 2016, which fixed the interest rate at 3.34% through November 2018. See Note 7 for further details.
(9) LIBOR (30 day) plus 233 basis points.
(10) On June 30, 2015, the Company exercised a portion of its "accordion feature" on the 2013 Senior Facility, increasing the 2013 Term Loan (as defined below) from $260.0 million to $285.0 million and increasing the availability on the 2013 Revolver (as defined below) from $285.0 million to $310.0 million.
Property-Level Debt
The Company had individual property-level debt (the “Property-Level Debt”) on 19 of its 36 assets, totaling $1.36 billion (excluding $0.3 million of market rate adjustments) as of December 31, 2015. As of December 31, 2014, the Company had individual property-level debt on 20 of its 36 assets, representing $1.31 billion (excluding $0.8 million of market rate adjustments) as of December 31, 2014. As of December 31, 2015 and 2014, the Property-Level Debt had a weighted average interest rate of 4.4% and 5.0%, respectively, and an average remaining term of 5.2 years and 4.9 years, respectively. The Property-Level Debt is generally non-recourse to the Company and is stand-alone (i.e., not cross-collateralized) first mortgage debt with the exception of customary recourse guarantees.
The following is a summary of significant property loan refinancings and acquisitions that occurred during the years ended December 31, 2015 and 2014 ($ in thousands):
Property | Date | Balance at Date of Refinancing | Interest Rate | Balance of New Loan | New Interest Rate | Net Proceeds (1) | Maturity | |||||||||||||||
December 31, 2015 | ||||||||||||||||||||||
The Shoppes at Gateway (2) (3) | December 2015 | $ | — | — | % | $ | 75,000 | 3.64 | % | $ | — | January 2020 | ||||||||||
Greenville Mall (4) | October 2015 | 40,171 | 5.29 | % | 45,500 | 4.46 | % | 3,281 | November 2025 | |||||||||||||
The Shoppes at Bel Air (5) | October 2015 | 109,467 | 5.30 | % | 110,450 | 2.78 | % | — | November 2018 | |||||||||||||
NewPark Mall (6) (7) | September 2015 | 64,665 | 3.44 | % | 114,245 | 2.53 | % | 47,942 | September 2018 | |||||||||||||
Fig Garden Village (8) | June 2015 | — | — | % | 74,200 | 4.14 | % | — | June 2025 | |||||||||||||
Mt. Shasta Mall (7) | February 2015 | — | — | % | 31,850 | 4.19 | % | — | March 2025 | |||||||||||||
December 31, 2014 | ||||||||||||||||||||||
Bayshore Mall (7) | October 2014 | $ | — | — | % | $ | 46,500 | 3.96 | % | $ | 43,400 | November 2024 | ||||||||||
The Mall at Barnes Crossing (7) | August 2014 | — | — | % | 67,000 | 4.29 | % | — | September 2024 | |||||||||||||
Chula Vista Center (9) | July 2014 | — | — | % | 70,000 | 4.18 | % | 15,000 | July 2024 | |||||||||||||
Sikes Senter (9) | July 2014 | 54,618 | 5.20 | % | — | — | % | — | — | |||||||||||||
The Shoppes at Bel Air | May 2014 | — | — | % | 112,276 | 5.30 | % | — | December 2015 | |||||||||||||
Explanatory Notes:
(1) Net proceeds are net of closing costs.
(2) During 2015, the Company removed The Shoppes at Gateway from the 2013 Senior Facility (as defined below) collateral pool and placed a new $75.0 million non-recourse mortgage loan on the property. The loan bears interest at a floating rate of LIBOR (30 day) plus 220 basis points and has an initial maturity of January 2020 with a one year extension option. The Company entered into an interest swap on the loan which fixed the interest rate at 3.64% through January
85
2020. See Note 7 for further details. In connection, with the removal of The Shoppes at Gateway from the 2013 Senior Facility, The Shoppes at Carlsbad was added to the 2013 Senior Facility collateral pool with no change to the outstanding 2013 Senior Facility balance.
(3) The loan is interest-only for the first four years.
(4) On October 8, 2015, the loan associated with Greenville Mall was refinanced with a new non-recourse mortgage loan for $45.5 million, which bears interest at a fixed rate of 4.46%, matures in November 2025, and amortizes over 30 years. This loan replaced a $40.2 million non-recourse mortgage loan which had a fixed interest rate of 5.29%.
(5) On October 8, 2015, the loan associated with The Shoppes at Bel Air was refinanced with a new non-recourse mortgage loan for $120.0 million. The initial funding of $110.5 million was used to retire the outstanding mortgage loan of $109.5 million, which had a fixed interest rate of 5.30%. The loan provides for an additional subsequent funding of $9.5 million upon achieving certain conditions. The loans bears interest at a floating rate of LIBOR (30 day) plus 235 basis points and is interest only for the first two years. The Company entered into an interest rate swap on this loan commencing in January 2016, which fixed the interest rate at 3.34% through November 2018. See Note 7 for further details.
(6) In September 2015, the loan associated with NewPark Mall was refinanced for $135.0 million, with an initial funding of $114.3 million. The loan provides for an additional funding of up to $20.8 million upon achieving certain conditions. The loans bears interest at a floating rate of LIBOR (30 day) plus 210 basis points, has an initial maturity of September 2018 with a one year extension option and amortizes over 30 years thereafter. The Company entered into an interest rate swap on this loan beginning January 1, 2016, which fixed the interest rate at 3.26%, through September 2018. This loan replaced a $64.7 million non-recourse mortgage loan which had a floating rate of LIBOR (30 day) plus 235 basis points. See Note 7 for further details.
(7) The loan is interest-only for the first three years.
(8) The loan is interest-only for the first five years.
(9) On July 1, 2014, the Company removed Chula Vista Center, located in Chula Vista, CA, from the 2013 Senior Facility collateral pool and placed a new non-recourse mortgage loan on the property. Sikes Senter, located in Wichita Falls, TX, had an outstanding mortgage loan which was repaid on July 1, 2014 from proceeds from the Chula Vista Center refinancing. Upon repayment, Sikes Senter was added to the 2013 Senior Facility collateral pool with no change to the outstanding 2013 Senior Facility balance.
In January 2015, the loan associated with The Shoppes at Knollwood with a mortgage debt balance of $35.1 million was defeased simultaneously with the sale of the property. As of December 31, 2014, the loan was shown as a component of "Liabilities of property held for sale" on the Consolidated Balance Sheets.
In February 2015, the Company repaid the $10.4 million mortgage debt balance on Washington Park Mall, which had a fixed interest rate of 5.35%.
In February 2015, the loan associated with Vista Ridge Mall was transferred to special servicing.
In March 2015, the property associated with Steeplegate Mall was conveyed to its lender in full satisfaction of the debt. The loan had an outstanding balance of approximately $45.9 million.
In April 2015, the property associated with Collin Creek Mall was conveyed to its lender in full satisfaction of the debt. The loan had an outstanding balance of approximately $57.6 million.
On July 1, 2015, the Company repaid the $59.0 million mortgage debt balance on Grand Traverse Mall, which had a fixed interest rate of 5.02%. On July 29, 2015, Grand Traverse Mall was added to the 2013 Senior Facility collateral pool.
Corporate Facility
2013 Senior Facility
On November 22, 2013, the Company entered into a $510.0 million secured credit facility that provides borrowings on a revolving basis of up to $250.0 million (the "2013 Revolver") and a $260.0 million senior secured term loan (the "2013 Term Loan" and together with the 2013 Revolver, the "2013 Senior Facility"). Borrowings on the 2013 Senior Facility bear interest at LIBOR plus 185 to 300 basis points based on the Company's corporate leverage. The Company has the option, subject to the satisfaction of certain conditions precedent, to exercise an "accordion" feature to increase the commitments under the 2013 Revolver and/or incur additional term loans in the aggregate amount of $250.0 million such that the aggregate amount of the commitments and outstanding loans under the 2013 Secured Facility does not exceed $760.0 million. During the year ended December 31, 2014, through an amendment to the 2013 Senior Facility (the "2014 Amendment"), the Company exercised a portion of the "accordion" feature on the 2013 Senior Facility to increase the available borrowings of the 2013 Revolver thereunder from $250.0 million to $285.0 million. Then, during the year ended December 31, 2015, through an amendment to the 2013 Senior Facility, the Company exercised another portion of the "accordion" feature which increased the aggregate amount of commitments under the 2013 Senior Facility from $545.0 million to $595.0 million. The exercise increased availability on the 2013 Revolver from $285.0 million to
86
$310.0 million and increased the 2013 Term Loan from $260.0 million to $285.0 million. The term and rates of the Company's 2013 Senior Facility were otherwise unchanged.
The 2013 Revolver has an initial term of four years with a one year extension option and the 2013 Term Loan has a term of five years. As of December 31, 2015, the Company had drawn $59.0 million on the 2013 Revolver. The Company is required to pay an unused fee related to the 2013 Revolver equal to 0.20% per year if the aggregate unused amount is greater than or equal to 50% of the 2013 Revolver or 0.30% per year if the aggregate unused amount is less than 50% of the 2013 Revolver. During the years ended December 31, 2015 and 2014, the Company incurred $0.7 million and $0.8 million, respectively, of unused fees related to the 2013 Revolver. Under the 2013 Revolver, letters of credit totaling $5.6 million were outstanding as of December 31, 2015 in connection with three properties. Additionally, the Company had $0.1 million of letters of credit outstanding in relation to The Shoppes at Knollwood Mall. During each of the years ended December 31, 2015 and 2014, the Company incurred $0.1 million of letter of credit fees.
The 2013 Senior Facility contains representations and warranties, affirmative and negative covenants and defaults and cross-default provisions that are customary for such a real estate loan. In addition, the 2013 Senior Facility requires compliance with certain financial covenants, including borrowing base loan to value and debt yield, corporate maximum leverage ratio, minimum ratio of adjusted consolidated earnings before interest, tax, depreciation and amortization to fixed charges, minimum tangible net worth, minimum mortgaged property requirement, maximum unhedged variable rate debt and maximum recourse indebtedness. Failure to comply with the covenants in the 2013 Senior Facility would result in a default thereunder and, absent a waiver or an amendment from our lenders, cause the acceleration of all outstanding borrowings under the 2013 Senior Facility. The default interest rate following a payment event of default under the 2013 Senior Facility is 3.0% more than the then-applicable interest rate. No assurance can be given that the Company would be successful in obtaining such waiver or amendment, or that any accommodations that the Company was able to negotiate would be on terms as favorable as those in the 2013 Senior Facility. In connection with the 2014 Amendment, certain modifications were made to the financial covenant calculations in the 2013 Senior Facility. As of December 31, 2015, the Company was in compliance with all of the debt covenants related to the 2013 Senior Facility.
2012 Senior Facility
On January 12, 2012, the Company entered into a senior secured credit facility that provided borrowings on a revolving basis of up to $50.0 million (the “2012 Revolver”) and a senior secured term loan (the “2012 Term Loan” and together with the 2012 Revolver, the “2012 Senior Facility”). The interest rate during the year ended 2012 was renegotiated from LIBOR plus 5.0% (with a LIBOR floor of 1.0%) to LIBOR plus 4.5% (with no LIBOR floor). In January 2013, in order to maintain the same level of liquidity, the Company paid down an additional $100.0 million on the 2012 Term Loan and increased the 2012 Revolver from $50.0 million to $150.0 million. In conjunction with the Company's entrance into the 2013 Senior Facility, the 2012 Senior Facility was terminated.
The Company was required to pay an unused fee related to the 2012 Revolver equal to 0.30% per year if the aggregate unused amount was greater than or equal to 50% of the 2012 Revolver or 0.25% per year if the aggregate unused amount was less than 50% of the 2012 Revolver. During the year ended December 31, 2013, the Company incurred $0.4 million of unused fees related to the 2012 Revolver.
Total Mortgage and Corporate Debt
As of December 31, 2015, $2.41 billion of land, buildings and equipment (before accumulated depreciation) have been pledged as collateral for our mortgages, notes and loans payable. Certain mortgage notes payable may be prepaid but are generally subject to a prepayment penalty equal to a yield-maintenance premium, defeasance or a percentage of the loan balance.
The weighted-average interest rate on our collateralized mortgages, notes and loans payable was approximately 4.1% and 4.6% as of December 31, 2015 and December 31, 2014, respectively. The average remaining term was 4.7 years as of December 31, 2015 and December 31, 2014, respectively.
87
As of December 31, 2015, future scheduled maturities of outstanding long term debt obligations are as follows ($ in thousands):
Total | ||||
2016 | $ | 265,493 | ||
2017 | 69,814 | |||
2018 | 579,480 | |||
2019 | 13,109 | |||
2020 | 89,243 | |||
Thereafter | 689,714 | |||
$ | 1,706,853 | |||
Unamortized market rate adjustment | (340 | ) | ||
Total mortgages, notes and loans payable | $ | 1,706,513 | ||
NOTE 6 ACCOUNTS PAYABLE AND ACCRUED EXPENSES, NET
The following table summarizes the significant components of accounts payable and accrued expenses, net:
December 31, | |||||||
2015 | 2014 | ||||||
(In thousands) | |||||||
Construction payable | $ | 47,572 | $ | 16,272 | |||
Below-market tenant leases, net (Note 2) | 42,592 | 43,292 | |||||
Accrued dividend | 10,472 | 9,885 | |||||
Accrued real estate taxes | 8,773 | 9,028 | |||||
Accounts payable and accrued expenses | 8,096 | 9,901 | |||||
Accrued payroll and other employee liabilities | 7,778 | 9,352 | |||||
Accrued interest | 6,868 | 4,380 | |||||
Deferred income | 5,420 | 5,471 | |||||
Asset retirement obligation liability | 6,085 | 4,545 | |||||
Tenant and other deposits | 1,706 | 1,336 | |||||
Other | 1,926 | 514 | |||||
Total accounts payable and accrued expenses, net | $ | 147,288 | $ | 113,976 | |||
NOTE 7 DERIVATIVES
Cash Flow Hedges of Interest Rate Risk
The Company records its derivative instruments in its Consolidated Balance Sheets at fair value. The accounting for changes in the fair value of a derivative depends on the intended use of the derivative, whether the derivative has been designated as a hedge and, if so, whether the hedge has met the criteria necessary to apply hedge accounting.
The Company's objectives in using interest rate derivatives are to add stability to interest expense and to manage its exposure to interest rate movements. To accomplish these objectives, the Company primarily uses interest rate swaps and caps as part of its interest rate risk management strategy. Interest rate swaps designated as cash flow hedges involve the receipt of variable-rate amounts from the counterparty in exchange for the Company making fixed-rate payments over the life of the agreements without exchange of the underlying notional amount. Interest rate caps designated as cash flow hedges involve the receipt of variable-rate amounts from a counterparty if interest rates rise above the strike rate on the contract in exchange for an up-front premium.
88
The effective portion of changes in fair value of derivatives designated and that qualify as cash flow hedges is recorded in accumulated other comprehensive income (loss) ("AOCI/L") and is subsequently reclassified into earnings in the period in which the hedged forecasted transactions affect earnings. During the years ended December 31, 2015 and 2014, such derivatives were used to hedge the variable cash flows associated with existing variable-rate borrowings. The ineffective portion of the change in fair value of the derivatives is recognized in earnings. During the years ended December 31, 2015 and 2014, the Company recorded no hedge ineffectiveness for the interest rate swaps.
Amounts reported in AOCI/L related to derivatives are reclassified to interest expense as interest payments are made on the Company’s variable-rate debt. As of December 31, 2015, the Company expects that an additional $1.9 million will be reclassified as an increase to interest expense over the next 12 months.
Interest Rate Swaps
The Company entered into an interest rate swap to hedge the risk of changes in cash flows on borrowings related to the West Valley Mall in January 2014 through June 2018. The interest related to this loan was computed at a variable rate of LIBOR plus 1.75% and the Company swapped this for a fixed rate of 1.49% plus a spread of 1.75%.
In September 2015, the Company entered into an interest rate swap to hedge the risk of changes in cash flows on borrowings related to NewPark Mall through September 2018. The interest related to this loan was computed at a variable rate of LIBOR plus 2.10% with a forward starting swap, beginning on January 1, 2016 with a fixed interest rate of 1.16% plus a spread of 2.10%.
In October 2015, the Company entered into an interest rate swap to hedge the risk of changes in cash flows on borrowings related to The Shoppes at Bel Air through November 2018. The interest related to this loan was computed at a variable rate of LIBOR plus 2.35% with a forward starting swap, beginning on January 1, 2016 with a fixed interest rate of 0.99% plus a spread of 2.35%.
In December 2015, the Company entered into an interest rate swap to hedge the risk of changes in cash flows on borrowings related to The Shoppes at Gateway through January 2020. The interest related to this loan was computed at a variable rate of LIBOR plus 2.33% and the Company swapped this for a fixed rate of 1.44% plus a spread of 2.33%.
The interest rate swaps protect the Company from increases in the hedged cash flows attributable to increases in LIBOR.
As of December 31, 2015, the Company had the following outstanding interest rate derivatives that were designated as cash flow hedges of interest rate risk:
Interest Rate Derivative | Number of Instruments | Notional Amount | ||
(in thousands) | ||||
Interest rate swap | 4 | $358,700 | ||
Non-Designated Hedges - Interest Rate Cap
Derivatives not designated as hedges are not speculative and are used to manage the Company’s exposure to interest rate movements and other identified risks but do not meet the hedge accounting requirements. Changes in the fair value of the derivative not designated as hedges are recorded directly in earnings. For each of the years ended December 31, 2015 and 2014, such amounts equaled $578 and $0.04 million. As of December 31, 2015, the Company had the following outstanding derivative:
Interest Rate Derivative | Number of Instruments | Notional Amount | ||
(in thousands) | ||||
Interest rate cap | 1 | $64,445 | ||
89
The table below presents the fair value of the Company’s derivative financial instruments as well as their classification on the Company's Consolidated Balance Sheets as of December 31, 2015 and December 31, 2014:
Instrument Type | Location in consolidated balance sheets | Notional Amount | Designated Benchmark Interest Rate | Strike Rate | Fair Value at December 31, 2015 | Fair Value at December 31, 2014 | Maturity Date | ||||||||||||||
Derivative not designated as hedging instruments | (dollars in thousands) | ||||||||||||||||||||
Interest Rate Cap | Prepaid expenses and other assets, net | $ | 64,445 | One-month LIBOR | 4.5 | % | $ | — | $ | 1 | May 2016 | ||||||||||
Derivative designated as hedging instruments | |||||||||||||||||||||
Pay fixed / receive variable rate swap | Accounts payable and accrued expenses, net | $ | 59,000 | One-month LIBOR | 1.5 | % | $ | (577 | ) | $ | (482 | ) | June 2018 | ||||||||
Pay fixed / receive variable rate swap | Accounts payable and accrued expenses, net | $ | 114,250 | One-month LIBOR | 1.2 | % | $ | (24 | ) | $ | — | September 2018 | |||||||||
Pay fixed / receive variable rate swap | Prepaid expenses and other assets, net | $ | 110,450 | One-month LIBOR | 1.0 | % | $ | 612 | $ | — | November 2018 | ||||||||||
Pay fixed / receive variable rate swap | Accounts payable and accrued expenses, net | $ | 75,000 | One-month LIBOR | 1.4 | % | $ | (75 | ) | $ | — | January 2020 | |||||||||
The table below presents the effect of the Company’s derivative financial instruments on the Company's Consolidated Statements of Operations and Comprehensive Income (Loss) for the years ended December 31, 2015 and December 31, 2014.
Location of Losses Reclassified from OCI/L Into Earnings (Effective Portion) | Location of Gain (Loss) Recognized in Earnings (Ineffective Portion) | |||||||||||||||||||||||||||
Hedging Instrument | Gain (Loss) Recognized in OCI/L (Effective Portion) | Loss Recognized in Earnings (Effective Portion) | Gain Recognized in Earnings (Ineffective Portion) | |||||||||||||||||||||||||
(dollars in thousands) | ||||||||||||||||||||||||||||
Year Ended December 31, | 2015 | 2014 | 2015 | 2014 | 2015 | 2014 | ||||||||||||||||||||||
Pay fixed / receive variable rate swap | $ | (397 | ) | $ | (1,210 | ) | Interest expense | $ | 813 | $ | 728 | n.a. | $ | — | $ | — | ||||||||||||
Credit Risk-Related Contingent Features
The borrower (a special purpose entity) has an agreement with its derivative counterparty that contains a provision whereby if the borrower defaults on any of its indebtedness, including a default whereby repayment of such indebtedness has not been accelerated by the lender, the borrower could also be declared in default on its derivative obligations. The borrower has not posted any collateral related to this agreement. As of December 31, 2015, the fair value of the derivative liability, which includes accrued interest but excludes any adjustment for nonperformance risk, related to this agreement was $0.8 million. If the borrower had breached this provision as of December 31, 2015, it would have been required to settle its obligations under the agreement at its termination value of $0.8 million.
NOTE 8 DISPOSITIONS OF REAL ESTATE ASSETS
Boulevard Mall
In June 2013, the Company conveyed its interest in Boulevard Mall to the lender of the loan related to the property. The property had been transferred to special servicing in January 2013 and the Company conveyed its interest in the property for the full satisfaction of the debt. This resulted in a gain on extinguishment of debt of $14.0 million for the year ended December 31, 2013. The Company's disposition and gain on extinguishment of debt are included in "Loss from discontinued operations" on the Company's Consolidated Statements of Operations and Comprehensive Income (Loss). Additionally, the conveyance of the
90
property was structured as a reverse like-kind exchange transaction under Internal Revenue Code of 1986 ("the Code") Section 1031 for income tax purposes.
In June 2014, the Company reversed its value on an outstanding environmental liability on Boulevard Mall of $0.4 million which is included in "Other" on the Company's Consolidated Statements of Operations and Comprehensive Income (Loss).
The Company's disposition and gain on extinguishment of debt, for the period presented, are included in "Loss from discontinued operations" in the Company's Consolidated Statements of Operations and Comprehensive Income (Loss), the components of which are summarized below:
Year ended December 31, 2013 | |||||
(In thousands, except per share amounts) | |||||
Total revenues | 4,812 | ||||
Operating expenses including depreciation and amortization | 3,082 | ||||
Provision for impairment | 21,661 | ||||
Total expenses | 24,743 | ||||
Operating income (loss) | (19,931 | ) | |||
Interest expense | (3,227 | ) | |||
Net loss from discontinued operations | (23,158 | ) | |||
Gain on extinguishment of debt | 13,995 | ||||
Net loss from discontinued operations | $ | (9,163 | ) | ||
Net loss from discontinued operations per share- Basic and Diluted | $ | (0.19 | ) | ||
In 2014, the Company adopted ASU 2014-08, "Reporting Discontinued Operations and Disclosures of Disposals of Components of an Entity", which changed the definition and criteria of property dispositions classified as discontinued operations, on a prospective basis. Under terms of the new guidance, the dispositions described below were not considered to be discontinued operations.
The results of operations of the properties below, as well as any gain on extinguishment of debt and impairment losses related to the properties, are included in "Income from continuing operations" on the Company's Consolidated Statements of Operations and Comprehensive Income (Loss) for all periods presented, as applicable.
The Shoppes at Knollwood Mall
In January 2015, the Company sold The Shoppes at Knollwood Mall located in St. Louis Park, MN, for gross proceeds of $106.7 million. At closing, the Company entered into a development agreement with the buyer to complete the redevelopment of the property. The Company estimated $7.9 million of costs remained to complete the redevelopment project and escrowed the same amount of proceeds. The mortgage debt of $35.1 million was defeased simultaneously with the sale of the property. The Company recognized a gain of $34.8 million as a result of the disposition, which is reflected in "Gain on sale of real estate assets" on the Company's Consolidated Statements of Operations and Comprehensive Income (Loss) for the year ended December 31, 2015. The gain includes $2.3 million recognized upon completion of the redevelopment project for the new owner for the difference between actual costs to complete the project and the original estimated costs.
Steeplegate Mall
In March 2015, the Company conveyed Steeplegate Mall, located in Concord, NH, to its mortgage lender in full satisfaction of the debt. The loan had a net outstanding balance of approximately $45.9 million. The Company recognized a $22.8 million on
91
gain related to the debt extinguishment, which is reflected in "Gain on extinguishment of debt" on the Company's Consolidated Statements of Operations and Comprehensive Income (Loss) for the year ended December 31, 2015.
Collin Creek Mall
In April 2015, the Company conveyed Collin Creek Mall, located in Plano, TX, to its mortgage lender in full satisfaction of the debt. The loan had a net outstanding balance of approximately $57.6 million. The Company recognized a $3.8 million gain related to the debt extinguishment, which is reflected in "Gain on extinguishment of debt" on the Company's Consolidated Statements of Operations and Comprehensive Income (Loss) for the year ended December 31, 2015.
NOTE 9 INCOME TAXES
The Company elected to be taxed as a REIT beginning with the filing of its tax return for the 2011 fiscal year. As of December 31, 2015, the Company has met the requirements of a REIT and has filed its tax returns for the 2014 calendar year accordingly. Subject to its ability to meet the requirements of a REIT, the Company intends to maintain this status in future periods.
To qualify as a REIT, the Company must meet a number of organizational and operational requirements, including requirements to distribute at least 90% of its ordinary taxable income and to either distribute capital gains to stockholders, or pay corporate income tax on the undistributed capital gains. In addition, the Company is required to meet certain asset and income tests.
As a REIT, the Company will generally not be subject to corporate level federal income tax on taxable income that it distributes currently to its stockholders. If the Company fails to qualify as a REIT in any taxable year, it will be subject to federal income taxes at regular corporate rates, including any applicable alternative minimum tax, and may not be able to qualify as a REIT for four subsequent taxable years. Even if the Company qualifies for taxation as a REIT, it may be subject to certain state and local taxes on its income or property, and to federal income and excise taxes on its undistributed taxable income.
The Company has a subsidiary that it elected to treat as a taxable REIT subsidiary (TRS), which is subject to federal and state income taxes. For the years ended December 31, 2015, 2014 and 2013, the Company incurred approximately $0.06 million, $0.07 million and $0.08 million, respectively, in taxes associated with the TRS, which are recorded in "Provision for income taxes" on the Company's Consolidated Statements of Operations and Comprehensive Income (Loss).
NOTE 10 NON-CONTROLLING INTEREST IN OPERATING PARTNERSHIP
In November 2015, the Operating Partnership issued 5,600,000 in Series A Preferred Units with a liquidation preference of $25.00 per unit, to an affiliate of Westfield U.S. Holdings, LLC (the “Holder”) as a portion of the consideration for the Operating Partnership's acquisition of The Shoppes at Carlsbad. The Series A Preferred Units provide for a cumulative quarterly preferential cash distribution of 5% per annum of the Series A Liquidation Preference (i.e., $1.25 per unit). Subject to the obligations under the tax protection agreement described below, the Series A Preferred Units will be redeemable at the option of the Operating Partnership, in whole or in part, on or after November 12, 2018, at a redemption price equal to the Series A Liquidation Preference for the redeemed Series A Preferred Units plus accumulated and unpaid distributions to the redemption date (the "Redemption Price"). In addition, on or after November 12, 2025, the Holder will have the right to require the Operating Partnership to redeem all of the then-outstanding Series A Preferred Units at the Redemption Price. Further, if, at any time after January 1, 2022, the aggregate Series A Liquidation Preference exceeds 15% of the "equity base" (i.e., the value of the Operating Partnership's outstanding common units of limited partnership interest ("Common Units") (with such value to be determined pursuant to a formula set forth in the Operating Partnership’s partnership agreement) plus the liquidation preference of the Operating Partnership's outstanding preferred units of limited partnership interest) as of the end of a calendar quarter, then the Holder will have the right to require the Operating Partnership to redeem, at the Redemption Price, up to the amount of Series A Preferred Units necessary for the outstanding Series A Preferred Units to represent 15% of the equity base.
92
Except as noted below, any redemption of the Series A Preferred Units may be satisfied, at the Operating Partnership's option, in cash or Common Units, or a combination thereof. The value of any Common Units issued in connection with a redemption will equal 96% of the volume-weighted average price (VWAP) of the Company's shares of common stock over the 30 trading days prior to the applicable redemption date. Pursuant to the Operating Partnership’s partnership agreement, holders of Common Units have the right to cause the Operating Partnership to redeem their Common Units for cash or, at the Company's election, shares of common stock on a one-for-one basis, subject to adjustment as provided in the Operating Partnership’s partnership agreement. Notwithstanding the foregoing, the issuance by the Operating Partnership of Common Units, and the issuance by the Company of shares of common stock, as applicable, in connection with a redemption is subject to certain limitations, including that (i) a resale shelf registration statement with respect to such shares of common stock shall have been filed and become effective, in accordance with a registration rights agreement entered into between the Company and the Holder and (ii) as a result of the redemption, the Holder would not own more than 15% of the outstanding shares of the Company's common stock (assuming all Common Units issued in the redemption were immediately exchanged for common stock (the "As Exchanged Common Shares"). If the conditions of either (i) or (ii) in the prior sentence are not met, the redemption may only be satisfied in cash (in the case of (ii), only with respect to the number of Series A Preferred Units necessary such that the Holder would not own more than 15% of the As Exchanged Common Shares).
Also in connection with the acquisition of The Shoppes at Carlsbad, in November 2015, the Operating Partnership, the Company and the Holder entered into a tax protection agreement, pursuant to which the Operating Partnership agreed not to transfer the property for a period of six years (through December 31, 2021) (the "Tax Protection Period") if such transfer would result in the recognition of taxable income or gain to the Holder.
The tax protection agreement also requires the Company and the Operating Partnership to indemnify the Holder against certain tax liabilities (calculated pursuant to the tax protection agreement) resulting from specified events (all of which depend upon actions initiated by the Operating Partnership or the Company), including, among others: (i) a transfer of the property during the Tax Protection Period; (ii) the redemption of Series A Preferred Units for cash during the Tax Protection Period; (iii) the redemption of Common Units (previously received by the Holder in connection with an optional redemption of Series A Preferred Units) for cash or shares of common stock during the Tax Protection Period; and (iv) the sale by the Holder of shares of common stock to the extent such shares had been received pursuant to a redemption of Common Units (previously received by the Holder in connection with an optional redemption of Series A Preferred Units during the Tax Protection Period), subject to certain limitations.
The following table summarizes activity relating to the non-controlling interest in the Operating Partnership for the year ended December 31, 2015:
(In thousands) | 2015 | |||
Balance at January 1, | $ | — | ||
Issuance of Series A Preferred Units | 140,000 | |||
Preferred distribution accrued | 953 | |||
Balance at December 31, | $ | 140,953 | ||
NOTE 11 EQUITY
On January 13, 2014, the Company issued 8,050,000 shares of common stock in an underwritten public offering of its common stock at a public offering price of $19.50 per share. Net proceeds of the public offering were approximately $150.7 million after deducting the underwriting discount of $6.3 million but before deducting offering costs.
Brookfield Asset Management, Inc. ("Brookfield Asset Management) and, together with its affiliates ("Brookfield") owned approximately 33.5% of the Company as of December 31, 2015.
93
Common Stock Dividends
On February 26, 2015, the Company's Board of Directors declared a first quarter common stock dividend of $0.18 per share, which was paid on April 30, 2015 to stockholders of record on April 15, 2015.
On May 4, 2015, the Company's Board of Directors declared a second quarter common stock dividend of $0.18 per share, which was paid on July 31, 2015 to stockholders of record on July 15, 2015.
On July 30, 2015, the Company's Board of Directors declared a third quarter common stock dividend of $0.18 per share, which was paid on October 30, 2015 to stockholders of record on October 15, 2015.
On October 29, 2015, the Company's Board of Directors declared a fourth quarter common stock dividend of $0.18 per share, which was paid on January 29, 2016 to stockholders of record on January 15, 2016.
Distributions paid on our common stock and their tax status, as sent to our shareholders, is presented in the following tables. The tax status of Rouse distributions in 2015, 2014, and 2013 may not be indicative of future periods.
Year Ended December 31, | |||||||||||
2015 | 2014 | 2013 | |||||||||
Ordinary dividends | $ | 0.20 | $ | 0.26 | $ | 0.26 | |||||
Nontaxable distributions | 0.51 | 0.38 | 0.20 | ||||||||
Total | $ | 0.71 | 0.64 | 0.46 | |||||||
Dividend Reinvestment and Stock Purchase Plan
On May 12, 2014, the Company established a Dividend Reinvestment and Stock Purchase Plan ("DRIP"). Under the DRIP, the Company's stockholders may purchase additional shares of common stock by automatically reinvesting all or a portion of the cash dividends paid on their shares of common stock or by making optional cash payments, or both, at fees described in the DRIP prospectus. The DRIP commenced with the dividend paid on July 31, 2014 to stockholders of record on July 15, 2014. To date, the Company has purchased the shares needed to satisfy the DRIP elections in the open market. No additional shares have been issued.
Employee Stock Purchase Plan
On July 1, 2014, the Company commenced enrollment under its Employee Stock Purchase Plan (the "ESPP"). The ESPP was implemented to provide eligible employees of the Company and its participating subsidiaries with an opportunity to purchase common stock of the Company at a discount of 5%, through accumulated payroll deductions or other permitted contributions. The ESPP was adopted by the Company's Board of Directors on February 27, 2014 and approved by its stockholders on May 9, 2014. The maximum number of shares of common stock that may be issued under the ESPP is 500,000 subject to adjustments under certain circumstances. As of December 31, 2015, 6,286 shares were issued under the ESPP since its commencement.
Stock Repurchase Program
On October 29, 2015, the Board of Directors authorized management to implement a stock repurchase program in the maximum amount of $50.0 million over a period of up to two years. Purchases made pursuant to the stock repurchase program may be made in the open market from time to time as permitted by federal securities laws and other legal requirements. The timing, manner, price and amount of any repurchases will be determined by the Company in its discretion and will be subject to economic and market conditions, stock price, applicable legal requirements and other factors. The stock repurchase program may be suspended or discontinued at any time.
94
During the year ended December 31, 2015, the Company repurchased 238,055 shares of its outstanding Common Stock for approximately $3.5 million, at an average cost of $14.73 per share. As of December 31, 2015, the Company had $46.5 million of remaining capacity to repurchase common stock under the stock repurchase program.
NOTE 12 STOCK BASED COMPENSATION PLANS
Incentive Stock Plans
On January 12, 2012, the Company adopted the Rouse Properties, Inc. 2012 Equity Incentive Plan (the “Equity Plan”). The number of shares of common stock originally reserved for issuance under the Equity Plan was 4,887,997. The Equity Plan provides for grants of nonqualified stock options, incentive stock options, stock appreciation rights, restricted stock, other stock-based awards and performance-based compensation (collectively, the "Awards"). Directors, officers, other employees and consultants of Rouse and its subsidiaries and affiliates are eligible for Awards. No participant may be granted more than 2,500,000 shares in any year, subject to certain adjustments. On February 26, 2015, the Company's Board of Directors approved an amendment ("Plan Amendment") to the Equity Plan increasing the total number of shares available for issuance to 7,387,997. On May 8, 2015, the Plan Amendment was approved by the Company's stockholders.
Stock Options
Pursuant to the Equity Plan, the Company granted stock options to certain employees of the Company. The vesting terms of these grants are specific to the individual grant. In general, participating employees are required to remain employed for vesting to occur (subject to certain limited exceptions). In the event that a participating employee ceases to be employed by the Company, any options that have not vested will generally be forfeited. Stock options generally vest annually over a five year period.
The following tables summarize stock option activity for the Equity Plan for the years ended December 31, 2015 and 2014:
2015 | 2014 | ||||||||
Shares | Weighted Average Exercise Price | Shares | Weighted Average Exercise Price | ||||||
Stock options outstanding at January 1, | 3,313,869 | $15.89 | 2,579,171 | $15.14 | |||||
Granted | 1,057,000 | 17.67 | 778,498 | 18.36 | |||||
Exercised | (326,645 | ) | 15.06 | (1,680 | ) | 16.48 | |||
Forfeited | (527,763 | ) | 16.51 | (42,120 | ) | 15.34 | |||
Expired | (26,040 | ) | 18.40 | — | — | ||||
Stock options outstanding at December 31,(1) | 3,490,421 | $16.40 | 3,313,869 | $15.89 | |||||
Stock Options Outstanding (1) | |||||||
Issuance | Shares | Weighted Average Remaining Contractual Term (in years) | Weighted Average Exercise Price | ||||
March 2012 | 1,108,860 | 6.25 | $14.72 | ||||
August 2012 | 36,400 | 6.67 | 13.75 | ||||
October 2012 | 276,623 | 6.83 | 14.47 | ||||
February 2013 | 526,440 | 7.17 | 16.48 | ||||
February 2014 | 596,400 | 8.17 | 18.40 | ||||
July 2014 | 28,198 | 8.58 | 17.20 | ||||
February 2015 | 717,500 | 9.17 | 17.18 | ||||
March 2015 | 200,000 | 9.25 | 19.76 | ||||
Stock options outstanding at December 31, 2015 | 3,490,421 | 7.56 | $16.40 | ||||
95
Explanatory Note:
(1) As of December 31, 2015 and December 31, 2014, 1,181,330 and 878,288, respectively, stock options became fully vested and are currently exercisable. As of December 31, 2015 and December 31, 2014, the intrinsic value of these options was $(0.9) million and $3.2 million, respectively, and such stock options had a weighted average stock price of $15.35 and $14.93, respectively. The weighted average remaining contractual term as of December 31, 2015 and December 31, 2014 was 6.7 years and 7.5 years, respectively.
The Company recognized $2.0 million, $1.8 million and $1.4 million in compensation expense related to the stock options for the years ended December 31, 2015, 2014 and 2013, respectively, which is recorded in "General and administrative" on the Company's Consolidated Statements of Operations and Comprehensive Income (Loss).
Restricted Stock
Pursuant to the Equity Plan, the Company granted restricted stock to certain employees and non-employee directors. The vesting terms of these grants are specific to the individual grant, and are generally three to four year periods. In general, participating employees are required to remain employed for vesting to occur (subject to certain limited exceptions). In the event that a participating employee ceases to be employed by the Company, any shares that have not vested will generally be forfeited. Dividends are paid on restricted stock and are not returnable, even if the underlying stock does not ultimately vest.
The following table summarizes restricted stock activity for the years ended December 31, 2015 and 2014:
2015 | 2014 | ||||||||
Shares | Weighted Average Grant Date Fair Value | Shares | Weighted Average Grant Date Fair Value | ||||||
Nonvested restricted stock grants outstanding at January 1, | 205,731 | $15.45 | 278,617 | $14.85 | |||||
Granted | 53,550 | 17.18 | 42,489 | 18.40 | |||||
Forfeited | (58,242 | ) | 15.41 | — | — | ||||
Cancelled | — | — | — | — | |||||
Vested | (128,555 | ) | 15.33 | (115,375 | ) | 15.08 | |||
Nonvested restricted stock grants outstanding at December 31, | 72,484 | $16.97 | 205,731 | $15.45 | |||||
The 58,242 shares of restricted stock that were forfeited during the year ended December 31, 2015 will be held in treasury for future restricted stock or option issuances. As of December 31, 2015, a total of 62,403 shares of restricted stock were forfeited and are currently being held in treasury for future restricted stock or options issuances.
The weighted average remaining contractual term (in years) of granted, non-vested restricted stock awards as of December 31, 2015 was 0.9 years.
The Company recognized $0.9 million, $1.9 million and $1.6 million in compensation expense related to the restricted stock for the years ended December 31, 2015, 2014 and 2013, respectively, which is included in "General and administrative" on the Company's Consolidated Statements of Operations and Comprehensive Income (Loss).
Other Disclosures
The estimated values of options granted in the table above are based on the Black-Scholes pricing model using the assumptions in the table below. The estimate of the risk-free interest rate is based on the average of a 5- and 10-year U.S. Treasury note on the date the options were granted. The estimate of the dividend yield and expected volatility is based on a review of publicly-traded peer companies. The expected life is computed using the simplified method as the Company does not have historical share option data. The fair value of each option grant is estimated on the date of grant using the Black-Scholes pricing model with the following 2015 and 2014 weighted-average assumptions:
96
2015: | ||
Risk-free interest rate | 1.56 | % |
Dividend yield | 4.19 | % |
Expected volatility | 27.19 | % |
Expected life (in years) | 6.5 | |
2014: | ||
Risk-free interest rate | 1.83% - 1.95% | |
Dividend yield | 3.70% - 3.95% | |
Expected volatility | 27.75% - 28.27% | |
Expected life (in years) | 6.5 | |
As of December 31, 2015, total compensation expense, which had not yet been recognized, related to nonvested options and restricted stock grants was $6.1 million. Of this total, $2.6 million relates to 2016, $1.7 million relates to 2017, $1.1 million relates to 2018, $0.6 million relates to 2019, and $0.1 million relates to 2020, will be recognized, respectively, in "General and administrative" on the Company's Consolidated Statements of Operations and Comprehensive Income (Loss). These amounts may be impacted by future grants, changes in forfeiture estimates or vesting terms, and actual forfeiture rates differing from estimated forfeiture rates.
NOTE 13 NON-CONTROLLING INTEREST
The non-controlling interest on the Company's Consolidated Balance Sheets represents Series A Cumulative Non-Voting Preferred Stock ("Preferred Shares") of Rouse Holding, Inc. ("Holding"), a subsidiary of Rouse, and the interest in the Mall at Barnes Crossing entities.
Holding issued 111 Preferred Shares at a par value of $1,000 per share to third parties on June 29, 2012. The Preferred Shareholders are entitled to a cumulative preferential annual cash dividend of 12.5%. These Preferred Shares may only be redeemed at the option of Holding for $1,000 per share plus all accrued and unpaid dividends. Furthermore, in the event of a voluntary or involuntary liquidation of Holding, the Preferred Shareholders are entitled to a liquidation preference of $1,000 per share plus all accrued and unpaid dividends. The Preferred Shares are not convertible into or exchangeable for any property or securities of Holding.
On August 29, 2014, the Company purchased a 51% interest in three limited liability companies which together own and operate The Mall at Barnes Crossing, the Market Center, a strip shopping center located adjacent to the property, and various vacant land parcels associated with the development (collectively referred to as "The Mall at Barnes Crossing"). The Company determined it holds the controlling interest in the The Mall at Barnes Crossing. As a result, the joint venture is presented on the Company's Consolidated Financial Statements as of December 31, 2015 and December 31, 2014 and for the year ended December 31, 2015 and December 31, 2014, on a consolidated basis, with the interests of the third parties reflected as a non-controlling interest.
In connection with the acquisition, the Company formed a joint venture with other interest holders in the properties. Pursuant to the joint venture arrangements, the Company has the exclusive authority to manage the business of the joint venture, except for certain actions (e.g., disposing of the properties and incurring debt under certain circumstances) that would require the consent of a joint venture partner. At any time after August 29, 2017 (or earlier under certain circumstances), the Company will have the right to purchase its partners' interests in the joint venture at a purchase price generally equal to their fair market value (the "Call Price"). In addition, during the 30-day period beginning on August 29, 2017, a third-party partner will have a one-time option to cause us to purchase each third-party partner's respective interests in the joint venture at a purchase price calculated in the same manner as the Call Price. Consideration paid to our partners for their interests in the joint venture may, under certain circumstances, be in the form of shares of our common stock and/or Common Units of the Operating Partnership. If the consideration for the Call Price includes Common Units, the Company and a third-party partner will enter into a tax protection agreement that will provide for indemnification of such partner under certain circumstances against certain tax liabilities incurred by such partner, if such liabilities result from a transaction involving a taxable disposition of The Mall at Barnes Crossing or the failure to offer such partner the opportunity to guarantee certain indebtedness.
97
On November 4, 2015, the Company purchased a 1.8% interest from one of the interest holders for $0.6 million. As of December 31, 2015, the Company held a 52.8% interest in The Mall at Barnes Crossing.
NOTE 14 EARNINGS PER SHARE
Earnings per share ("EPS") is calculated using the two class method, which allocates earnings among common stock and participating securities to calculate EPS when an entity's capital structure includes either two or more classes of common stock or common stock and participating securities. Unvested share-based payment awards that contain non-forfeitable rights to dividends or dividend equivalents (whether paid or unpaid) are participating securities. As such, unvested restricted stock of the Company is considered a participating security. The dilutive effect of options and their equivalents (including fixed awards and nonvested stock issued under stock-based compensation plans), is computed using the “treasury” method.
The following table presents a reconciliation of net income (loss) used in basic and diluted EPS calculations (dollars in thousands, except per share data):
Years Ended December 31, | ||||||||||||
2015 | 2014 | 2013 | ||||||||||
Numerator for basic and diluted earnings per share | ||||||||||||
Income (loss) from continuing operations | $ | 41,623 | $ | (51,685 | ) | $ | (45,582 | ) | ||||
Net (income) loss attributable to non-controlling interests | 76 | (71 | ) | — | ||||||||
Preferred distributions | (953 | ) | — | — | ||||||||
Loss from discontinued operations | — | — | (9,163 | ) | ||||||||
Net income (loss) allocable to common shareholders | $ | 40,746 | $ | (51,756 | ) | $ | (54,745 | ) | ||||
Earnings allocated to unvested participating security holders | — | — | (150 | ) | ||||||||
Net income (loss) attributable to Rouse Properties, Inc. and allocable to common shareholders | $ | 40,746 | $ | (51,756 | ) | $ | (54,895 | ) | ||||
Denominator for basic and diluted earnings per share | ||||||||||||
Weighted average common shares outstanding - basic | 57,874,772 | 57,203,196 | 49,344,927 | |||||||||
Add: effect of assumed shares issued under treasury stock method for stock options and restricted shares | 313,969 | — | — | |||||||||
Weighted average common shares outstanding - diluted | 58,188,741 | 57,203,196 | 49,344,927 | |||||||||
Basic and Diluted earnings per share | ||||||||||||
Net income (loss) attributable to Rouse Properties, Inc. and allocable to common shareholders- basic | $ | 0.70 | $ | (0.90 | ) | $ | (1.11 | ) | ||||
Net income (loss) attributable to Rouse Properties, Inc. and allocable to common shareholders- diluted | $ | 0.70 | $ | (0.90 | ) | $ | (1.11 | ) | ||||
NOTE 15 RENTALS UNDER OPERATING LEASES
The Company receives rental income from the leasing of retail space under operating leases. The minimum future rentals based on operating leases of the Company's consolidated properties owned as of December 31, 2015 are as follows:
98
Year | Amount | |||
(In thousands) | ||||
2016 | $ | 193,423 | ||
2017 | 156,601 | |||
2018 | 128,947 | |||
2019 | 109,935 | |||
2020 | 93,902 | |||
Subsequent | 1,117,512 | |||
$ | 1,800,320 | |||
Minimum future rentals exclude amounts which are not fixed in accordance with the tenant's lease, but are based upon a percentage of their gross sales or reimbursement of actual operating expenses and amortization of above and below-market leases. Such operating leases are with a variety of tenants, the majority of which are national and regional retail chains and local retailers, and consequently, our credit risk is concentrated in the retail industry.
NOTE 16 RELATED PARTY TRANSACTIONS
Transition Services Agreement with GGP
The Company entered into a transition services agreement with GGP whereby GGP or its subsidiaries provided to us, on a transitional basis, certain specified services for various terms not exceeding 18 months following the spin-off. The services that GGP provided to the Company included, amongst others, payroll, human resources and employee benefits, financial systems management, treasury and cash management, accounts payable services, telecommunications services, information technology services, asset management services, legal and accounting services and various other corporate services. The charges for the transition services generally were intended to allow GGP to fully recover their costs directly associated with providing the services, plus a level of profit consistent with an arm’s length transaction together with all out-of-pocket costs and expenses. The charges of each of the transition services were generally based on an hourly fee arrangement and pass-through out-of-pocket costs. As of December 31, 2013, the transition services agreement with GGP was terminated. For the year ended December 31, 2013, the costs associated with the transition services agreement were $0.1 million.
Office Leases with Brookfield
Upon its spin-off from GGP, the Company assumed a 10-year lease agreement with Brookfield, as landlord, for office space for its corporate office in New York City. Costs associated with the office lease for each of the years ended December 31, 2015, 2014 and 2013 were $1.1 million. There are no outstanding amounts payable as of December 31, 2015.
During 2012, the Company entered into a 5-year lease agreement with Brookfield, as landlord, for office space for its regional office in Dallas, Texas. The lease commenced in October 2012 with no payments due for the first 12 months. During April 2013, the Company amended the lease and expanded its current space. Costs associated with the office lease for the year ended December 31, 2013 were $0.03 million, of which $0.01 million was payable as of December 31, 2013. Effective December 30, 2013, the Brookfield subsidiary sold the office building in which the office space is located to a third party.
99
The following table describes the Company's future rental expenses related to the office leases for the Company's New York office:
Year | Amount | |||
(In thousands) | ||||
2016 | $ | 1,086 | ||
2017 | 1,147 | |||
2018 | 1,147 | |||
2019 | 1,147 | |||
2020 | 1,147 | |||
Subsequent | 1,083 | |||
$ | 6,757 | |||
Subordinated Credit Facility with Brookfield
On the Spin-Off Date, the Company entered into a Subordinated Facility with a wholly-owned subsidiary of Brookfield, as lender, for a $100.0 million revolving credit facility. The Company paid a one time upfront fee of $0.5 million related to this facility in 2012. In addition, the Company was required to pay a semi-annual revolving credit fee of $0.3 million related to this facility. For the year ended December 31, 2013, costs associated with the revolving credit fee were $0.5 million. On November 22, 2013, in conjunction with the Company's entrance into the 2013 Senior Facility, the Subordinated Facility was terminated (see Note 5 for further details).
Business Information and Technology Costs
As part of the spin-off from GGP, the Company commenced the development of its initial information technology platform ("Brookfield Platform"). The development of the Brookfield Platform required the Company to purchase, design and create various information technology applications and infrastructure. Brookfield Corporate Operations, LLC ("BCO") had been engaged to assist in the project development and to procure the various applications and infrastructure of the Company. The Company incurred approximately $0.3 million and $2.8 million of infrastructure costs during the years ended December 31, 2014 and 2013, respectively. For the years ended December 31, 2014 and 2013, the Company had approximately $8.3 million and $8.0 million, respectively, of infrastructure costs which were capitalized in "Buildings and equipment" on the Company's Consolidated Balance Sheets. As of December 31, 2015, the Company had accelerated and written off any remaining infrastructure costs related to the Brookfield Platform.
The Company was also required to pay a monthly information technology services fee to BCO. Approximately $1.1 million, $3.1 million and $2.0 million in costs were incurred for the years ended December 31, 2015, 2014 and 2013, respectively. As of the years ended December 31, 2015 and 2014, $0.2 million and $0.3 million were outstanding and payable.
Financial Service Center
During 2013, the Company engaged BCO's financial service center to manage certain administrative services of Rouse, such as accounts payable and receivable, employee expenses, lease administration, and other similar types of services. The Company no longer engages BCO's financial service center to manage such administrative services. Approximately $0.1 million, $2.2 million and $1.2 million in costs were incurred for the years ended December 31, 2015, 2014 and 2013, respectively, and are recorded in "General and administrative" on the Company's Consolidated Statements of Operations and Comprehensive Income (Loss). As of the years ended December 31, 2015 and 2014, there were no costs and $0.2 million outstanding and payable, respectively.
Demand Deposit from Brookfield U.S. Holdings
In August 2012, the Company entered into an agreement with Brookfield U.S. Holdings ("U.S. Holdings") to place funds into an interest bearing account which earns interest at LIBOR plus 1.05% per annum. The demand deposit is secured by a note from U.S. Holdings and guaranteed by Brookfield Asset Management Inc. The demand deposit had an original maturity of February 14, 2013 and was extended to November 14, 2014. However, the Company may have demanded the funds earlier by providing U.S. Holdings with a three day notice. The Company earned approximately $0.3 million and $0.5 million in interest income for the years ended December 31, 2014 and 2013, respectively. As of the year ended December 31, 2014, the agreement was terminated.
100
NOTE 17 COMMITMENTS AND CONTINGENCIES
In the normal course of business, from time to time, the Company is involved in legal proceedings relating to the ownership and operations of the Company's properties. In management's opinion, the liabilities, if any, that may ultimately result from such legal actions are not expected to have a material effect on the Company's financial position, results of operations or liquidity.
In connection with the ownership and operation of real estate, the Company may be potentially liable for costs and damages related to environmental matters. In management's opinion, the liabilities, if any, that may ultimately result from such environmental matters are not expected to have a material effect on the Company's financial position, results of operations or liquidity.
In conjunction with the acquisition of The Centre at Salisbury, the Company guaranteed a maximum amount of $3.5 million until certain financial covenants are met for two consecutive years.
NOTE 18 QUARTERLY FINANCIAL INFORMATION (UNAUDITED)
The following table sets forth the selected quarterly financial data for the Company (dollars in thousands, except per share amounts).
For the Quarters Ended | ||||||||||||||||
March 31, (1) | June 30, | September 30, | December 31, | |||||||||||||
2015 | ||||||||||||||||
Total revenues | $ | 74,561 | $ | 72,409 | $ | 73,553 | $ | 84,861 | ||||||||
Operating income | 8,426 | 12,960 | 16,843 | 14,045 | ||||||||||||
Net income (loss) allocable to common shareholders | 44,407 | (688 | ) | (1,302 | ) | (1,680 | ) | |||||||||
Per common share data: | ||||||||||||||||
Net income (loss) per share allocable to common shareholders (2) | ||||||||||||||||
Basic | 0.77 | (0.01 | ) | (0.02 | ) | (0.03 | ) | |||||||||
Diluted | 0.76 | (0.01 | ) | (0.02 | ) | (0.03 | ) | |||||||||
Dividends declared per share | 0.18 | 0.18 | 0.18 | 0.18 | ||||||||||||
Weighted average shares outstanding - Basic | 57,603,340 | 57,726,603 | 57,930,453 | 57,939,535 | ||||||||||||
Weighted average shares outstanding - Diluted | 58,287,256 | 57,726,603 | 57,930,453 | 57,939,535 | ||||||||||||
2014 | ||||||||||||||||
Total revenues | $ | 67,839 | $ | 67,790 | $ | 74,783 | $ | 81,715 | ||||||||
Operating income | 13,340 | 10,677 | 322 | 7,100 | ||||||||||||
Net income (loss) allocable to common shareholders | (4,425 | ) | (8,175 | ) | (26,566 | ) | (12,589 | ) | ||||||||
Per common share data: | ||||||||||||||||
Net income (loss) per share allocable to common shareholders (2) | ||||||||||||||||
Basic | (0.08 | ) | (0.14 | ) | (0.46 | ) | (0.22 | ) | ||||||||
Diluted | (0.08 | ) | (0.14 | ) | (0.46 | ) | (0.22 | ) | ||||||||
Dividends declared per share | 0.17 | 0.17 | 0.17 | 0.17 | ||||||||||||
Weighted average shares outstanding - Basic | 56,129,522 | 57,519,079 | 57,519,412 | 57,531,859 | ||||||||||||
Weighted average shares outstanding - Diluted | 56,129,522 | 57,519,079 | 57,519,412 | 57,531,859 | ||||||||||||
Explanatory Note:
(1) During the three months ended March 31, 2015, net income increased due to the sale of The Shoppes at Knollwood and the conveyance of Steeplegate Mall to its mortgage lender.
(2) The total for the year may differ from the sum of the quarters as a result of weighting.
NOTE 19 SUBSEQUENT EVENTS
Subsequent to December 31, 2015, the Company repurchased 105,000 shares of its outstanding common stock for $1.6 million, at an average cost of $14.87 per share.
101
On January 16, 2016, the Company’s Board of Directors received a written, unsolicited, non-binding proposal from Brookfield Asset Management Inc. (“Brookfield Asset Management” and, together with its affiliates, “Brookfield”) on behalf of a real estate fund managed by Brookfield Asset Management, to acquire all the outstanding shares of the Company’s common stock, other than those shares currently held by Brookfield, collectively the beneficial owners of approximately 33.5% of the Company’s outstanding shares of common stock, for a purchase price of $17.00 per share in cash. The Company’s Board of Directors established a special committee of the Board (the “Special Committee”), comprised of all of the directors of the Board, other than those directors who are also representatives of Brookfield, to, among other matters, evaluate and negotiate the Brookfield proposal, solicit other proposals and/or evaluate alternatives to the Brookfield proposal, as determined by the Special Committee in its sole discretion.
In light of Brookfield’s unsolicited proposal, on January 29, 2016, the Special Committee approved a Retention Plan for the Company’s four named executive officers (Andrew Silberfein, Brian Harper, John Wain and Susan Elman) and certain other senior executives. The Retention Plan, which was developed with the advice of an independent compensation consultant, is intended to enhance retention of the Retention Plan participants. Under the terms of the Retention Plan, each participant will be eligible to receive an aggregate cash retention award based on a percentage of such participant’s 2015 base salary and 2015 target performance bonus. Awards under the Retention Plan are payable in two equal installments of 50% of the aggregate award payable to each participant. The first installment is payable on the earlier of (i) a determination by the Special Committee that it has terminated the process of considering and responding to Brookfield’s unsolicited offer and any related process to explore strategic alternatives thereto in which the Special Committee may decide to engage (a “Process Termination”) and (ii) the closing date of any merger, business combination or other similar transaction in respect of the Company. The second installment is payable on the earlier of (i) six months after any Process Termination and (ii) six months after the closing date of any merger, business combination or other similar transaction in respect of the Company.
A participant in the Retention Plan must be employed by the Company on a payment date in order to receive his or her award, unless the participant’s employment is terminated by the Company without cause, by the participant for good reason or due to the participant’s death or disability (as each such term is defined in the Retention Plan). If a participant’s employment is terminated under one of the foregoing circumstances prior to payment of the first retention award payment, such participant’s first and second installment will be paid when the first retention award installment is paid to the other participants (but in no event later than two months after the end of the year in which such termination occurs). If a participant’s employment is terminated under one of the foregoing circumstances after payment of the first installment but prior to payment of the second installment, such participant’s second installment will be paid at the time of such termination of the participant’s employment. The total retention awards that participants are eligible to receive under the Retention Plan, in the aggregate, is $7.5 million.
On February 25, 2016, the Company entered into a definitive merger agreement (and other related agreements) to be acquired by affiliates of Brookfield Asset Management for $18.25 per share in an all-cash transaction, a portion of which may be paid out as a special dividend. Under the terms of the merger agreement, Brookfield will acquire all of the outstanding shares of the Company’s common stock, other than those shares currently held by Brookfield Property Partners L.P. and its affiliates, in a transaction valued at approximately $2.8 billion, including the Company’s indebtedness. The merger agreement prohibits the payment of any further dividends by the Company, other than as necessary to maintain the Company's REIT status and a closing dividend as part of the $18.25 per share consideration payable in the transaction. The purchase price represents a premium of approximately 35% over the Company’s closing stock price on January 15, 2016, the last trading day prior to Brookfield’s announcement of the proposal to acquire the Company. The Special Committee unanimously approved the merger agreement. Completion of the transaction is expected to occur in the third quarter of 2016, and is contingent upon customary closing conditions, including the approval of the holders of a majority of the outstanding shares of the Company’s common stock and a majority of the outstanding shares of the Company's common stock not currently held by Brookfield Property Partners L.P. and its affiliates. The transaction is not subject to a financing contingency.
102
Table of ContentsROUSE PROPERTIES, INC.
Schedule III
Real Estate and Accumulated Depreciation
December 31, 2015
(Dollars in Thousands)
Initial Cost | Cost Capitalized Subsequent to Acquisition | Gross Amounts at Which Carried at Close of Period (2) | ||||||||||||||||||||||||||||||||||||||||
Name of Center | Location | Encumbrance (1) | Land | Building & Improvements | Land | Building & Improvements | Land | Building & Improvements | Total | Accumulated Depreciation | Date Acquired | Life Which Latest Income Statement is Computed | ||||||||||||||||||||||||||||||
Animas Valley Mall | Farmington, NM | $ | 49,156 | $ | 6,509 | $ | 32,270 | — | $ | (854 | ) | $ | 6,509 | $ | 31,416 | $ | 37,925 | $ | 5,054 | 2010 | (3) | |||||||||||||||||||||
Barnes Crossing, The Mall at | Tupelo, MS | 67,000 | 18,300 | 82,583 | (241 | ) | 1,038 | 18,059 | 83,621 | 101,680 | 5,535 | 2014 | (3) | |||||||||||||||||||||||||||||
Bayshore Mall | Eureka, CA | 46,500 | 4,770 | 33,306 | 780 | 18,943 | 5,550 | 52,249 | 57,799 | 6,193 | 2010 | (3) | ||||||||||||||||||||||||||||||
Bel Air, The Shoppes at | Mobile, AL | 110,450 | 8,969 | 122,537 | — | 4,216 | 8,969 | 126,753 | 135,722 | 10,978 | 2014 | (3) | ||||||||||||||||||||||||||||||
Birchwood Mall | Port Huron, MI | — | 8,316 | 44,884 | — | 267 | 8,316 | 45,151 | 53,467 | 6,334 | 2010 | (3) | ||||||||||||||||||||||||||||||
Cache Valley Mall | Logan, UT | — | 3,963 | 26,842 | (70 | ) | 7,536 | 3,893 | 34,378 | 38,271 | 5,381 | 2010 | (3) | |||||||||||||||||||||||||||||
Carlsbad, The Shoppes at | Carlsbad, CA | — | 49,452 | 123,530 | — | — | 49,452 | 123,530 | 172,982 | 1,942 | 2015 | (3) | ||||||||||||||||||||||||||||||
Chesterfield Towne Center | Richmond, VA | 105,429 | 19,546 | 146,148 | (159 | ) | 10,178 | 19,387 | 156,326 | 175,713 | 10,933 | 2013 | (3) | |||||||||||||||||||||||||||||
Chula Vista Center | Chula Vista, CA | 70,000 | 13,214 | 71,598 | 1,149 | 15,758 | 14,363 | 87,356 | 101,719 | 11,985 | 2010 | (3) | ||||||||||||||||||||||||||||||
Colony Square Mall | Zanesville, OH | — | 4,253 | 29,577 | — | 510 | 4,253 | 30,087 | 34,340 | 4,801 | 2010 | (3) | ||||||||||||||||||||||||||||||
Fig Garden Village | Fresno, CA | 74,200 | 18,774 | 86,894 | — | 386 | 18,774 | 87,280 | 106,054 | 2,964 | 2015 | (3) | ||||||||||||||||||||||||||||||
Gateway, The Shoppes at | Springfield, OR | 75,000 | 7,097 | 36,573 | — | 37,529 | 7,097 | 74,102 | 81,199 | 6,284 | 2010 | (3) | ||||||||||||||||||||||||||||||
Grand Traverse Mall | Traverse City, MI | — | 11,420 | 46,409 | — | 510 | 11,420 | 46,919 | 58,339 | 7,897 | 2012 | (3) | ||||||||||||||||||||||||||||||
Greenville Mall | Greenville, NC | 45,439 | 9,088 | 42,087 | — | (496 | ) | 9,088 | 41,591 | 50,679 | 4,282 | 2013 | (3) | |||||||||||||||||||||||||||||
Lakeland Square | Lakeland, FL | 66,814 | 10,938 | 56,867 | 1,308 | 16,383 | 12,246 | 73,250 | 85,496 | 10,819 | 2010 | (3) | ||||||||||||||||||||||||||||||
Lansing Mall | Lansing, MI | — | 9,615 | 49,220 | 350 | 17,667 | 9,965 | 66,887 | 76,852 | 9,180 | 2010 | (3) | ||||||||||||||||||||||||||||||
Mall St. Vincent | Shreveport, LA | — | 4,604 | 21,927 | — | 12,592 | 4,604 | 34,519 | 39,123 | 4,185 | 2010 | (3) | ||||||||||||||||||||||||||||||
Mt. Shasta Mall | Redding, CA | 31,850 | 7,809 | 41,788 | — | 1,488 | 7,809 | 43,276 | 51,085 | 2,956 | 2015 | (3) | ||||||||||||||||||||||||||||||
NewPark Mall | Newpark, CA | 114,245 | 17,847 | 58,384 | 2,867 | 65,010 | 20,714 | 123,394 | 144,108 | 8,993 | 2010 | (3) | ||||||||||||||||||||||||||||||
North Plains Mall | Clovis, NM | — | 2,217 | 11,768 | — | 1,124 | 2,217 | 12,892 | 15,109 | 1,969 | 2010 | (3) | ||||||||||||||||||||||||||||||
Pierre Bossier Mall | Bossier City, LA | 49,426 | 7,522 | 38,247 | 818 | 11,526 | 8,340 | 49,773 | 58,113 | 7,180 | 2010 | (3) | ||||||||||||||||||||||||||||||
Salisbury, The Centre at | Salisbury, MD | 115,214 | 22,580 | 105,376 | — | (805 | ) | 22,580 | 104,571 | 127,151 | 9,345 | 2013 | (3) | |||||||||||||||||||||||||||||
Sierra Vista, The Mall at | Sierra Vista, AZ | — | 7,078 | 36,441 | — | 197 | 7,078 | 36,638 | 43,716 | 5,899 | 2010 | (3) | ||||||||||||||||||||||||||||||
Sikes Senter | Wichita Falls, TX | — | 5,915 | 34,075 | — | 4,751 | 5,915 | 38,826 | 44,741 | 5,426 | 2010 | (3) | ||||||||||||||||||||||||||||||
Silver Lake Mall | Coeur d'Alene, ID | — | 3,237 | 12,914 | — | 3,356 | 3,237 | 16,270 | 19,507 | 2,778 | 2010 | (3) | ||||||||||||||||||||||||||||||
Southland Center | Taylor, MI | 74,806 | 13,697 | 51,860 | — | 21,305 | 13,697 | 73,165 | 86,862 | 9,155 | 2010 | (3) | ||||||||||||||||||||||||||||||
Southland Mall | Hayward, CA | — | 23,407 | 81,474 | — | 9,449 | 23,407 | 90,923 | 114,330 | 14,264 | 2010 | (3) | ||||||||||||||||||||||||||||||
Spring Hill Mall | West Dundee, IL | — | 8,219 | 23,679 | 1,206 | 7,391 | 9,425 | 31,070 | 40,495 | 3,722 | 2010 | (3) | ||||||||||||||||||||||||||||||
Three Rivers Mall | Kelso, WA | — | 2,079 | 11,142 | — | 18,535 | 2,079 | 29,677 | 31,756 | 2,531 | 2010 | (3) | ||||||||||||||||||||||||||||||
Turtle Creek, The Mall at | Jonesboro, AR | 77,194 | 22,254 | 79,579 | — | 1,563 | 22,254 | 81,142 | 103,396 | 11,581 | 2012 | (3) | ||||||||||||||||||||||||||||||
Valley Hills Mall | Hickory, NC | 65,362 | 10,047 | 61,817 | — | 1,439 | 10,047 | 63,256 | 73,303 | 10,083 | 2010 | (3) | ||||||||||||||||||||||||||||||
Vista Ridge Mall | Lewisville, TX | 65,428 | 15,965 | 46,560 | — | (107 | ) | 15,965 | 46,453 | 62,418 | 7,130 | 2010 | (3) | |||||||||||||||||||||||||||||
Washington Park Mall | Bartlesville, OK | — | 1,389 | 8,213 | — | 271 | 1,389 | 8,484 | 9,873 | 1,592 | 2010 | (3) | ||||||||||||||||||||||||||||||
West Valley Mall | Tracy, CA | 59,000 | 31,341 | 38,316 | — | 5,430 | 31,341 | 43,746 | 75,087 | 9,052 | 2010 | (3) | ||||||||||||||||||||||||||||||
Westwood Mall | Jackson, MI | — | 5,708 | 28,006 | — | 235 | 5,708 | 28,241 | 33,949 | 4,000 | 2010 | (3) | ||||||||||||||||||||||||||||||
White Mountain Mall | Rock Springs, WY | — | 3,010 | 11,419 | — | 4,664 | 3,010 | 16,083 | 19,093 | 2,517 | 2010 | (3) | ||||||||||||||||||||||||||||||
Total Held For Use Properties | 1,362,513 | 420,149 | 1,834,310 | 8,008 | 298,985 | 428,157 | 2,133,295 | 2,561,452 | 234,920 | |||||||||||||||||||||||||||||||||
Other | 344,000 | — | — | — | 18,148 | — | 18,148 | 18,148 | 4,171 | |||||||||||||||||||||||||||||||||
Total Portfolio | $ | 1,706,513 | $ | 420,149 | $ | 1,834,310 | $ | 8,008 | $ | 317,133 | $ | 428,157 | $ | 2,151,443 | $ | 2,579,600 | $ | 239,091 | ||||||||||||||||||||||||
Explanatory Notes:
(1) See description of mortgages, notes, and loans payable in Note 5 to the consolidated financial statements. |
(2) The aggregate cost of land, buildings, and improvements for federal income tax purposes was approximately $2.6 billion as of December 31, 2015.
103
Table of ContentsROUSE PROPERTIES, INC.
Schedule III
Real Estate and Accumulated Depreciation
December 31, 2015
(Dollars in Thousands)
(3) Depreciation is computed based upon the following estimated useful lives:
Years | ||
Buildings and improvements | 40 | |
Equipment and fixtures | 5-10 | |
Tenant improvements | Shorter of useful life or applicable lease term | |
1. Reconciliation of Real Estate:
The changes in real estate for the years ended December 31, 2015, 2014 and 2013 are as follows:
2015 | 2014 | 2013 | ||||||||||
(In thousands) | ||||||||||||
Balance at January 1, | $ | 2,251,956 | $ | 1,948,131 | $ | 1,652,755 | ||||||
Improvements and additions | 181,701 | 120,031 | 68,236 | |||||||||
Acquisitions | 328,229 | 238,510 | 349,269 | |||||||||
Dispositions and write-offs | (179,060 | ) | (31,752 | ) | (85,308 | ) | ||||||
Impairments | (3,226 | ) | (22,964 | ) | (36,821 | ) | ||||||
Balance at December 31, | $ | 2,579,600 | $ | 2,251,956 | $ | 1,948,131 | ||||||
2. Reconciliation of Accumulated Depreciation:
The changes in accumulated depreciation for the years ended December 31, 2015, 2014 and 2013 are as follows:
2015 | 2014 | 2013 | ||||||||||
(In thousands) | ||||||||||||
Balance at January 1, | $ | 194,712 | $ | 142,432 | $ | 116,336 | ||||||
Depreciation expense | 97,185 | 91,248 | 66,497 | |||||||||
Dispositions and write-offs | (52,480 | ) | (31,752 | ) | (32,015 | ) | ||||||
Impairments | (326 | ) | (7,216 | ) | (8,386 | ) | ||||||
Balance at December 31, | $ | 239,091 | $ | 194,712 | $ | 142,432 | ||||||
104
SIGNATURES
Pursuant to the requirements of Section 13 or 15(d) of the Securities Exchange Act of 1934, the registrant has duly caused this report to be signed on its behalf by the undersigned, thereunto duly authorized.
ROUSE PROPERTIES, INC. | ||
By: /s/ JOHN WAIN | ||
John Wain Chief Financial Officer | ||
(Principal Financial Officer) | March 7, 2016 | |
We, the undersigned officers and directors of Rouse Properties, Inc., hereby severally constitute Andrew Silberfein and John Wain, and each of them singly, our true and lawful attorneys with full power to them, and each of them singly, to sign for us and in our names in the capacities indicated below, any and all amendments to this Annual Report of Form 10-K and generally to do all such things in our name and behalf in such capacities to enable Rouse Properties, Inc. to comply with the applicable provisions of the Securities Exchange Act of 1934, and we hereby ratify and confirm our signatures as they may be signed by our said attorneys, or any of them, to any and all such amendments.
Pursuant to the requirements of the Securities Exchange Act of 1934, this report has been signed below by the following persons on behalf of the registrant and in the capacities and on the dates indicated.
Signature | Title | Date | ||
/s/ ANDREW SILBERFEIN | Director and Chief Executive Officer | |||
Andrew Silberfein | (Principal Executive Officer) | March 7, 2016 | ||
/s/ JOHN WAIN | Chief Financial Officer | |||
John Wain | (Principal Financial Officer) | March 7, 2016 | ||
/s/ MICHAEL GRANT | Chief Accounting Officer | |||
Michael Grant | (Principal Accounting Officer) | March 7, 2016 | ||
/s/ JEFFREY BLIDNER | ||||
Jeffrey Blidner | Director | March 7, 2016 | ||
/s/ RIC CLARK | ||||
Ric Clark | Director | March 7, 2016 | ||
/s/ CHRISTOPHER HALEY | ||||
Christopher Haley | Director | March 7, 2016 | ||
/s/ MICHAEL HEGARTY | ||||
Michael Hegarty | Director | March 7, 2016 | ||
/s/ BRIAN KINGSTON | ||||
Brian Kingston | Director | March 7, 2016 | ||
/s/ DAVID KRUTH | ||||
David Kruth | Director | March 7, 2016 | ||
/s/ MICHAEL MULLEN | ||||
Michael Mullen | Director | March 7, 2016 | ||
105
Exhibit Index
Exhibit Number | Exhibit Description | ||
3.1 | Amended and Restated Certificate of Incorporation of Rouse Properties, Inc. (incorporated by reference to Exhibit 3.1 to the Company's Current Report on Form 8-K, filed January 19, 2012). | ||
3.2 | Certificate of Amendment of Amended and Restated Certificate of Incorporation of Rouse Properties, Inc. (incorporated by reference to Exhibit 3.1 of the Company’s Quarterly Report on Form 10-Q, filed May 7, 2013). | ||
3.3 | Amended and Restated Bylaws of Rouse Properties, Inc. (incorporated by reference to Exhibit 3.2 to the Company's Current Report on Form 8-K, filed January 19, 2012). | ||
3.4 | Exchange Agreement, dated as of January 12, 2012, between Rouse Properties, Inc. and GGP Limited Partnership (incorporated by reference to Exhibit 3.1 to the Company's Current Report on Form 8-K, filed January 19, 2012). | ||
4.1 | Registration Rights Agreement, dated March 26, 2012, between Rouse Properties, Inc. and affiliates of Brookfield Asset Management Inc. (incorporated by reference to Exhibit 4.1 to the Company's Annual Report on Form 10-K, filed March 29, 2012). | ||
4.2 | Registration Rights Agreement, dated as of November 12, 2015, between Rouse Properties, Inc. and Plaza Camino Real (incorporated by reference to Exhibit 4.2 to the Company's Current Report on Form 8-K, filed November 13, 2015). | ||
10.1 | Form of Indemnification Agreement between Rouse Properties, Inc. and individual directors and officers (incorporated by reference to Exhibit 10.5 to the Company's Registration Statement on Form 10, filed December 14, 2011). | ||
10.2 | Secured Credit Agreement, dated as of November 22, 2013, among Rouse Properties, L.P. and the lenders party thereto, and Wells Fargo Bank, National Association, as administrative agent (incorporated by reference to Exhibit 10.1 to the Company's Current Report on Form 8-K, filed November 26, 2013) | ||
10.3 | Amendment Regarding Increase to Secured Credit Agreement, dated as of March 3, 2014, among Rouse Properties, L.P., as Borrower, and KeyBank National Association, as Administrative Agent, and the Other Lenders party thereto (incorporated by reference to Exhibit 10.1 to the Company's Annual Report on Form 10-K, filed March 9, 2015). | ||
10.4 | First Amendment to Secured Credit Agreement, dated as of December 29, 2014, among Rouse Properties, L.P., as Borrower, and KeyBank National Association, as Administrative Agent, and the Other Lenders party thereto (incorporated by reference to Exhibit 10.1 to the Company's Annual Report on Form 10-K, filed March 9, 2015). | ||
10.5 | Amendment Regarding Increase, dated as of June 29, 2015, among Rouse Properties, L.P., KeyBank National Association, as Administrative Agent, and the other agents and lenders named therein (incorporated by reference to Exhibit 10.1 to the Company's Current Report on Form 8-K, filed July 6, 2015). | ||
10.6 | Second Amendment to Secured Credit Agreement, dated as of July 6, 2015, among Rouse Properties, L.P., KeyBank National Association, as Administrative Agent, and the other agents and lenders named therein (incorporated by reference to Exhibit 10.2 to the Company's Current Report on Form 8-K, filed July 6, 2015). | ||
10.7 | 2012 Equity Incentive Plan for directors, employees and consultants (incorporated by reference to Exhibit 10.8 to the Company's Annual Report on Form 10-K, filed March 29, 2012). | ||
10.8 | First Amendment to the Rouse Properties, Inc. 2012 Equity Incentive Plan (incorporated by reference to Exhibit 10.1 to the Company's Current Report on Form 8-K, filed May 11, 2015). | ||
10.9 | Form of Non-Qualified Stock Option Agreement (incorporated by reference to Exhibit 10.9 to the Company's Annual Report on Form 10-K, filed March 29, 2012). | ||
10.10 | Form of Restricted Stock Award Agreement for employees (incorporated by reference to Exhibit 10.10 to the Company's Annual Report on Form 10-K, filed March 29, 2012). | ||
10.11 | Form of Restricted Stock Award Agreement for directors (incorporated by reference to Exhibit 10.11 to the Company's Annual Report on Form 10-K, filed March 29, 2012). | ||
10.12 | Non-Qualified Stock Option Agreement between Rouse Properties, Inc. and Andrew Silberfein, dated March 12, 2012 (incorporated by reference to Exhibit 10.12 to the Company's Annual Report on Form 10-K, filed March 29, 2012). | ||
10.13 | Restricted Stock Award Agreement between Rouse Properties, Inc. and Andrew Silberfein dated March 12, 2012 (incorporated by reference to Exhibit 10.13 to the Company's Annual Report on Form 10-K, filed March 29, 2012). | ||
106
10.14 | Rouse Properties, Inc. Management Incentive Plan (incorporated by reference to Exhibit 10.1 to the Company's Current Report on Form 8-K, filed May 8, 2013). | ||
10.15 | Employment Agreement between Andrew Silberfein and Rouse Properties, Inc., dated November 14, 2011 (incorporated by reference to Exhibit 10.12 to the Company's Registration Statement on Form 10-K, filed December 14, 2011). | ||
10.16 | Letter Agreement between Andrew Silberfein and Rouse Properties, Inc., dated November 14, 2011 (incorporated by reference to Exhibit 10.13 to the Company's Registration Statement on Form 10, filed December 14, 2011). | ||
10.17 | Employment Letter, effective as of September 25, 2012, between Rouse Properties, Inc. and John A. Wain (incorporated by reference to Exhibit 10.1 to the Company's Current Report on Form 8-K, filed September 28, 2012). | ||
10.18 | Purchase and Sale Agreement and Joint Escrow Instruction, dated as of October 18, 2013, between Rouse Properties, Inc. and certain affiliates of The Macerich Company (incorporated by reference to Exhibit 10.24 to the Company's Annual Report on Form 10-K, filed March 5, 2014). | ||
10.19 | Employment Letter, effective as of April 5, 2012, between Rouse Properties, Inc. and Susan Elman (incorporated by reference to Exhibit 10.25 to the Company's Annual Report on Form 10-K, filed March 5, 2014). | ||
10.20 | Severance Letter dated February 27, 2014 between Rouse Properties, Inc. and Brian Harper (incorporated by reference to Exhibit 10.1 to the Company's Current Report on Form 8-K filed on March 5, 2014). | ||
10.21 | Employment Letter, effective as of June 30, 2014, between Rouse Properties, Inc. and Michael Grant (incorporated by reference to Exhibit 10.1 to the Company's Quarterly Report on Form 10-Q, filed August 4, 2014). | ||
10.22 | Amended and Restated Agreement of Limited Partnership of Rouse Properties, L.P., dated as of January 8, 2015. | ||
10.23 | Limited Liability Company Agreement of TUP 130 Parent, LLC, effective as of August 29, 2014 (incorporated by reference to Exhibit 10.31 to the Company's Annual Report on Form 10-K, filed March 9, 2015). | ||
10.24 | Limited Liability Company Agreement of TUP 330 Company, LLC, effective as of August 29, 2014 (incorporated by reference to Exhibit 10.24 to the Company's Annual Report on Form 10-K, filed March 9, 2015). | ||
10.25 | Limited Liability Company Agreement of TUP 430 Parent, LLC, effective as of August 29, 2014 (incorporated by reference to Exhibit 10.25 to the Company's Annual Report on Form 10-K, filed March 9, 2015). | ||
10.26 | First Amendment, dated as of November 12, 2015, to the Amended and Restated Agreement of Limited Partnership of Rouse Properties, L.P. Establishing Series A Preferred Units of the Partnership (incorporated by reference to Exhibit 10.26 to the Company's Current Report on Form 8-K, filed November 13, 2015). | ||
10.27 | Tax Protection Agreement, dated as of November 12, 2015, among Rouse Properties, L.P, Rouse Properties, Inc. and Plaza Camino Real (incorporated by reference to Exhibit 10.27 to the Company's Current Report on Form 8-K, filed November 13, 2015. | ||
10.28 | Standby Purchase Agreement, dated as of December 16, 2011, by and among Rouse Properties, Inc., General Growth Properties, Inc., Brookfield US Corporation and Brookfield Asset Management Inc. (incorporated by reference to Exhibit 10.6 to the Company's Registration Statement on Form 10, filed December 20, 2011). | ||
21.1 | List of Subsidiaries of Rouse Properties, Inc. | ||
23.1 | Consent of Deloitte & Touche LLP, Independent Registered Public Accounting Firm. | ||
31.1 | Certification of Chief Executive Officer pursuant to Section 302 of the Sarbanes-Oxley Act of 2002. | ||
31.2 | Certification of Chief Financial Officer pursuant to Section 302 of the Sarbanes-Oxley Act of 2002. | ||
32.1 | Certification of Chief Executive Officer pursuant to Section 906 of the Sarbanes-Oxley Act of 2002. | ||
32.2 | Certification of Chief Financial Officer pursuant to Section 906 of the Sarbanes-Oxley Act of 2002. | ||
107
101 | The following financial information from Rouse Properties, Inc’s. Annual Report on Form 10-K for the year ended December 31, 2015 has been filed with the SEC on March 8, 2016, formatted in XBRL (Extensible Business Reporting Language): (1) Consolidated Balance Sheets, (2) Consolidated Statements of Operations and Comprehensive Income (Loss), (3) Consolidated Statements of Equity, (4) Consolidated Statements of Cash Flows and (5) Notes to Consolidated Financial Statements, tagged as blocks of text. | ||
108