Attached files
| file | filename |
|---|---|
| EX-23.1 - EXHIBIT 23.1 - Del Taco Restaurants, Inc. | tacoq42015231.htm |
| EX-32.2 - EXHIBIT 32.2 - Del Taco Restaurants, Inc. | tacoq42015322.htm |
| EX-31.1 - EXHIBIT 31.1 - Del Taco Restaurants, Inc. | tacoq42015311.htm |
| EX-10.17 - EXHIBIT 10.17 - Del Taco Restaurants, Inc. | tacoq420151017.htm |
| EX-10.16 - EXHIBIT 10.16 - Del Taco Restaurants, Inc. | tacoq420151016.htm |
| EX-32.1 - EXHIBIT 32.1 - Del Taco Restaurants, Inc. | tacoq42015321.htm |
| EX-31.2 - EXHIBIT 31.2 - Del Taco Restaurants, Inc. | tacoq42015312.htm |
UNITED STATES
SECURITIES AND EXCHANGE COMMISSION
Washington, D.C. 20549
FORM 10-K
(Mark one)
x | ANNUAL REPORT PURSUANT TO SECTION 13 OR 15(d) OF THE SECURITIES EXCHANGE ACT OF 1934 |
For the fiscal year ended December 29, 2015
OR
¨ | TRANSITION REPORT PURSUANT TO SECTION 13 OR 15(d) OF THE SECURITIES EXCHANGE ACT OF 1934 |
For the transition period from to
Commission File Number: 001-36197
DEL TACO RESTAURANTS, INC.
(f/k/a LEVY ACQUISITION CORP.)
(Exact name of registrant as specified in its charter)
Delaware | 46-3340980 | |
(State or other jurisdiction of incorporation or organization) | (I.R.S. Employer Identification Number) | |
25521 Commercentre Drive Lake Forest, California | 92630 | |
(Address of principal executive offices) | (Zip Code) | |
(949) 462-9300 | ||
(Registrant’s telephone number, including area code) | ||
Securities registered pursuant to Section 12(b) of the Act:
Title of each class | Name of each exchange on which registered | |
Class A Common Stock, $0.0001 Par Value | NASDAQ Global Market | |
Warrants, each warrant exercisable for one share of common stock | ||
Securities registered pursuant to Section 12(g) of the Act:
None
(Title of Each Class)
Indicate by check mark if the registrant is a well-known seasoned issuer, as defined in Rule 405 of the Securities Act. Yes ¨ No x
Indicate by check mark if the registrant is not required to file reports by Section 13 or Section 15(d) of the Act. Yes ¨ No x
Indicate by check mark whether the registrant (1) has filed all reports required to be filed by Section 13 or 15(d) of the Securities Exchange Act of 1934 during the preceding 12 months (or for such shorter period that the registrant was required to file such reports), and (2) has been subject to such filing requirements for the past 90 days. Yes x No ¨
Indicate by check mark whether the registrant has submitted electronically and posted on its corporate website, if any, every Interactive Data File required to be submitted and posted pursuant to Rule 405 of Regulation S-T (§232.405 of this chapter) during the preceding 12 months (or for such shorter period that the registrant was required to submit and post such files). Yes x No ¨
Indicate by check mark if disclosure of delinquent filers pursuant to Item 405 of Regulation S-K (Section 229.405 of this chapter) is not contained herein, and will not be contained, to the best of the registrant's knowledge, in definitive proxy or information statement incorporated by reference in Part III of this Form 10-K or any amendment to this Form 10-K. x
Indicate by check mark whether the registrant is a large accelerated filer, an accelerated filer, a non-accelerated filer, or a smaller reporting company. See the definitions of “large accelerated filer,” “accelerated filer” and “smaller reporting company” in Rule 12b-2 of the Exchange Act. (Check one):
Large accelerated filer | ¨ | Accelerated filer | x | |
Non-accelerated filer | ¨ | (Do not check if a smaller reporting company) | Smaller reporting company | ¨ |
Indicate by check mark whether the registrant is a shell company (as defined in Rule 12b-2 of the Exchange Act. Yes ¨ No x
The aggregate market value of the common stock held by non-affiliates of the registrant as of the last business day of the registrant's most recently completed second fiscal quarter, computed by reference to the closing price reported on the NASDAQ Capital Market as of June 16, 2015, was $150,000,000.
As of March 7, 2016, there were 38,802,425 shares of the registrant’s common stock issued and outstanding.
DOCUMENTS INCORPORATED BY REFERENCE
Portions of the registrant's definitive proxy statement relating to the registrant's 2015 Annual Meeting of Stockholders to be filed pursuant to Regulation 14A within 120 days after the registrant's fiscal year end of December 29, 2015, are incorporated by reference into Part III of this Annual Report on Form 10-K.
Del Taco Restaurants, Inc.
Index
PART I | |
PART II | |
PART III | |
PART IV | |
CAUTIONARY NOTE REGARDING FORWARD-LOOKING STATEMENTS
In addition to historical information, this Annual Report on Form 10-K may contain a number of “forward-looking statements” as defined in the Private Securities Litigation Reform Act of 1995. Forward-looking statements include, without limitation, information concerning Del Taco Restaurant, Inc.'s ("Del Taco") possible or assumed future results of operations, business strategies, competitive position, industry environment, potential growth opportunities and the effects of regulation. These statements are based Del Taco management’s current expectations and beliefs, as well as a number of assumptions concerning future events. When used in this Annual Report, the words “estimates,” “projected,” “expects,” “anticipates,” “forecasts,” “plans,” “intends,” “believes,” “seeks,” “may,” “will,” “should,” “future,” “propose,” “preliminary,” “guidance” and variations of these words or similar expressions (or the negative versions of such words or expressions) are intended to identify forward-looking statements. Such forward-looking statements are subject to known and unknown risks, uncertainties, assumptions and other important factors, many of which are outside Del Taco management’s control that could cause actual results to differ materially from the results discussed in the forward-looking statements. These risks include, without limitation, consumer demand, our inability to successfully open company-owned or franchised restaurants or establish new markets, competition in our markets, our inability to grow and manage growth profitably, adverse changes in food and supply costs, our inability to access additional capital, changes in applicable laws or regulations, food safety and foodborne illness concerns, our inability to manage existing and to obtain additional franchisees, our inability to attract and retain qualified personnel, our inability to profitably expand into new markets, and the possibility that we may be adversely affected by other economic, business, and/or competitive factors. Additional risks and uncertainties are identified and discussed in Item 1A. Risk Factors in this Annual Report on Form 10-K. All subsequent written or oral forward-looking statements attributable to us or persons acting on our behalf are expressly qualified in their entirety by these risk factors. Del Taco undertakes no obligation to update any of its forward-looking statements.
1
PART I
ITEM 1. Business
Company Overview
Del Taco Restaurants, Inc. ("Del Taco", f/k/a Levy Acquisition Corporation ("LAC")) was originally incorporated in Delaware on August 2, 2013 as a special purpose acquisition company, formed for the purpose of effecting a merger, capital stock exchange, asset acquisition, stock purchase, reorganization or other similar business combination with one or more businesses. On June 30, 2015 (the “Closing Date”), LAC consummated its business combination with Del Taco Holdings, Inc. (“DTH”) pursuant to the agreement and plan of merger dated as of March 12, 2015 by and among LAC, Levy Merger Sub, LLC (“Levy Merger Sub”), LAC’s wholly owned subsidiary, and DTH (the “Merger Agreement”). Under the Merger Agreement, Levy Merger Sub merged with and into DTH, with DTH surviving the merger as a wholly-owned subsidiary of LAC (the “Business Combination” or “Merger”). In connection with the closing of the Business Combination, LAC changed its name from Levy Acquisition Corp. to Del Taco Restaurants, Inc.
As a result of the Business Combination, we are the acquirer for accounting purposes, and DTH is the acquiree and accounting predecessor. Our financial statement presentation distinguishes a “Predecessor” for DTH for periods prior to the Closing Date. We are the “Successor” for periods after the Closing Date, which includes consolidation of DTH subsequent to the Business Combination on June 30, 2015.
Del Taco is a nationwide operator and franchisor of restaurants featuring fresh and fast made-to-order cuisine, including both Mexican inspired and American classic dishes. There are 544 Del Taco restaurants, a majority of these in the Pacific Southwest. We serve our customers high-quality food typical of fast casual restaurants but with the speed, convenience and value associated with traditional quick service restaurants ("QSRs"). With attributes of both a fast casual restaurant and a QSR—a combination we call QSR+—we occupy a place in the restaurant market distinct from our competitors. Our food is prepared in working kitchens where our customers see cooks grilling marinated chicken and steak, chopping tomatoes and cilantro for salsa, grating cheddar cheese, slicing avocados and slow cooking whole pinto beans. And we believe that we are poised for growth, operating within the fastest growing segment of the restaurant industry, the limited service restaurant (“LSR”) segment. With an average system check of $6.79, we offer a compelling value proposition relative to both QSR and fast casual peers.
Our distinctive menu offers a combination of Mexican-inspired food, such as tacos and burritos, and American classics, such as “Double Del” cheeseburgers, crinkle-cut fries and milkshakes. The dual menu offers something for everyone, helping us attract a broader customer base than other Mexican LSRs while eliminating the “veto vote.” Additionally, our menu features both premium items such as our Epic Burritos®, Handcrafted Ensaladas and Fresca Bowls as well as lower priced items on our Buck & Under Menu®. While the lower priced items appeal to a value-oriented customer, the Buck & Under Menu® is also designed to increase the average check by offering variety for customers wishing to supplement their order with an additional menu item. For the year ended December 29, 2015, approximately 22% of company-operated restaurant sales consisted of Buck & Under Menu® items. With our tiered pricing strategy, we appeal to customers from a wide variety of socio-economic backgrounds and price sensitivities.
We opened our first restaurant in Yermo, California in 1964. The original restaurant had a simple menu consisting of 19 cent tacos, tostadas and french fries and 24 cent cheeseburgers. Over the last nearly 52 years, located now in 16 states, we have grown to 297 company-operated and 247 franchised restaurants as of December 29, 2015.
Competitive Strengths
We believe the following strengths differentiate us from our competitors and serve as the foundation for our continued growth:
Meeting Many Needs, our Concept has Broad Appeal. We are able to appeal to a broad group of customers due to our diverse menu featuring both Mexican and American staples, our 24-hour service model, the range of options we offer for any time of day or night, the comfort of our dining room paired with the convenience of our drive-thru, and our carefully considered pricing strategy with items of exceptional quality and value at different price points. Our QSR+ positioning sources traffic from both QSR and fast casual dining segments and we believe our diversified sales mix creates a flexible business model with multiple levers to drive restaurant sales growth. Because we are able to meet the varied needs of a wide range of customers, we have appeal in a variety of urban, suburban and other settings and in many different parts of the United States.
Un freshing Believable® Food. We are committed to delivering made-to-order food, using fresh high quality ingredients in working kitchens. We emphasize both quality and speed and effectively market these strengths to customers both within the restaurants and beyond. The menu offers items that have been enjoyed by customers for decades in combination with newer
2
offering addressing market trends, such as tacos featuring the leaner alternative of ground turkey and handcrafted ensaladas as well as limited-time specials to drive traffic, such as Beer Battered Shrimp Tacos, Del Fuego Shrimp Tacos and the Epic® Surf and Turf Burrito. With our menu variety including tacos, burritos, quesadillas, bowls and handcrafted ensaladas, we are able to be highly responsive to customer demands and target underutilized day-parts with new menu initiatives. We prepare entrées to order, but are able to deliver the entrée to the customer, on average, in just over 2 minutes across all day-parts and service modes. Even with the addition of new products, the coordinated work of operational and marketing leadership helps ensure that a new item is only launched when operations are ready to deliver on our promises of speed, quality and value. We believe that the way we combine freshly prepared food in working kitchens with our speed of service model and the skill of our trained and certified team members provides a layer of competitive insulation.
Inviting Atmosphere. In order to enhance our competitive positioning, we implemented a new restaurant design that targets both QSR and fast casual dining occasions. In the new design, restaurant exteriors feature a signature Del Taco logo, color palette and artwork that reinforces the brand identity and restaurant interiors feature open kitchens and visual “freshness cues” to highlight our commitment to freshly prepared food. We have already implemented key elements of our new restaurant design across the chain as part of a system-wide re-image program. As of the date of this Form 10-K, 100% of company-operated restaurants and 92% of the restaurants in the entire Del Taco system have been re-imaged to include these new elements. In addition, our current new restaurant design includes a “freshness cooler” directly behind the point-of-order which showcases our fresh produce, 40 pound block of cheddar cheese and handmade pico de gallo. We are in the process of backcasting this element and expect it to be included in 250 or more restaurants by the end of 2016.
Promising Industry Segment. According to Technomic, a research and consulting firm servicing the foodservice industry, 2014 total sales increased 4.2% to $200.0 billion for Limited Service Restaurants (“LSRs”) in the Technomic Top 500. In 2014, the Mexican menu category for LSRs in the Technomic Top 500 grew 10.4%, outpacing the broader LSR category. We operate within the Mexican menu category of the broader LSR segment. With our QSR+ model, we believe that we offer QSR convenience and value with high quality fresh food associated with fast casual dining. According to the Technomic Top 500, the fast casual sub-segment grew 12.8% in 2014, to $30.1 billion in total sales and the total fast casual sub-segment is projected to grow to exceed $50 billion by 2018. We believe that our differentiated menu, enhanced restaurants, aligned service model and convenient locations position us to compete successfully against other LSR concepts, providing us with a large addressable market.
Positive Demographic Trends. We believe we are well positioned to benefit from a number of culinary and demographic trends in the United States. We expect that the improving macroeconomic environment will raise consumer demand for restaurant services, increasing sales. Furthermore, as indicated by recent growth in the Mexican restaurant segment, we expect to benefit from increased acceptance of and preference for Mexican food in the United States. Finally, we also anticipate benefits from the continued growth of the Hispanic population in the United States, which, according to the U.S. Census Bureau, has grown from 50.5 million people in 2009 to 55.4 million people in 2014, and is projected to reach 78.7 million in 2030. The growth of the Hispanic population is expected to outpace overall population growth, and the Hispanic population as a percentage of the total U.S. population is expected to increase from 16.3% in 2011 to 21.9% by 2030.
Data Driven Operations Culture. To deliver on our brand promise and ensure that “every guest leaves happy,” we utilize a balanced measurement system for all our restaurants. Elements included are customer surveys, internal audits, staffing metrics, speed of service metrics, sales metrics, and key controllable costs. This provides corporate and field management, as well as restaurant-level operators, insight into how they are performing both from the customer’s perspective but also through the lens of our internal standards, enabling operational initiatives to be tied to the needs of the customer. We take a disciplined approach to developing operational improvement initiatives; we evaluate results-driven behaviors in top performing restaurants using restaurant questing studies, general manager roundtables, and a formal Operations Advisory Committee comprised of both company and franchise operators. We believe our deep attention to research and customer feedback gives us a competitive advantage over restaurants less committed to understanding their customers and allows us to be proactive in our initiatives instead of merely responding to the competition.
Experienced Leadership. Our senior management team has extensive operating experience, with an average of 20 years of experience each in the restaurant industry. We are led by President and Chief Executive Officer, Paul Murphy, who joined Del Taco in 2009. Other key members of our senior leadership team include Steven Brake, Chief Financial Officer, John Cappasola, Chief Brand Officer, and David Pear, Senior Vice President of Operations. Under Paul’s leadership, the team has developed and executed a successful brand re-positioning, with data-driven menu innovation, a dramatically improved customer experience through both operations and restaurant design, and new messaging through the Unfreshing Believable® advertising campaign. We believe the proven ability of the senior officers to work as a team will play a critical role in our ability to continue to achieve success in the future. We believe the senior management team is a key driver of Del Taco’s success and has positioned it well for long-term growth.
3
Our Growth Strategy
We believe our differentiated QSR+ positioning within a growing market segment combined with a disciplined business model and strong unit economics, will lead to significant growth opportunities. Our plan to enhance the brand’s competitive positioning and generate earnings per share growth involves several distinct strategies, including: expanding our store count in established markets where brand recognition is strong, driving restaurant sales growth, improving margins, and over time taking advantage of the significant “white space” in the United States where the Del Taco brand is not yet established.
Growing the Restaurant Base. We believe we are in the early stages of our growth story with 544 current locations in 16 states (including one franchised restaurant in Guam) as of December 29, 2015. We estimate, based on internal analysis and a study prepared by a leading national consulting firm, a long-term total restaurant potential in the United States of at least 2,000 locations. For the year ended December 29, 2015, we opened six new company-operated and six new franchised restaurants, and in 2016 we intend to open 15 to 18 new system-wide restaurants across established and emerging markets including California, Georgia, Nevada, New Mexico, Oklahoma, South Carolina and Utah. We believe that after 2016, the pace of development will increase, with a particular acceleration for company-operated stores in markets where the brand is well established.
• | Within in-fill markets, which we define as the Western one-third, where there is strong brand awareness and a loyal following, we have identified an in-fill opportunity of an additional 300+ potential new trade areas for restaurant development. We believe this presents a lower risk, high return expansion strategy, leveraging brand awareness, infrastructure and efficiencies of scale. We are currently in the process of accelerating our pipeline of in-fill locations, particularly in the Western United States. |
• | As we continue to increase and strengthen our position in in-fill markets, we also intend to continue to expand our presence in key emerging markets such as Oklahoma and Georgia, where the brand has been well received and where demand for additional units is high. |
• | We view our franchise program as an important resource for expanding the brand. In many new markets, the knowledge of a strategically selected franchisee as to local real estate, customers, employees, and marketing may enhance each restaurant’s prospects for greater success more quickly. Where appropriate, we may consider opportunities to seed new territories with company-operated restaurants, but ultimately expect to have the majority of emerging market growth occur through franchisees. In both in-fill and emerging markets, we expect we will continue to strategically develop franchise relationships and grow our franchise restaurant base. We believe we are well positioned for growth in comparison to other national QSR concepts, many of which are heavily saturated in the United States and/or are highly limited by existing franchise commitments. |
Growing Same Store Sales. We have developed an integrated strategic approach that aligns restaurant operations initiatives with marketing and menu innovation. This is the foundation for our sales growth within our existing restaurants. We plan to drive continued same store sales growth by increasing customer frequency, attracting new customers and improving per transaction spend. To accomplish this, we aim to enhance our QSR+ positioning and customer perceptions with targeted capital investment in the restaurant experience, optimized marketing spend across traditional and non-traditional channels, and continued introduction of new products and packaging driven by customer demand, industry trends, and a focus on day-part opportunities. We also believe we are well positioned in the Mexican LSR segment to benefit from shifting culinary and demographic trends in the United States.
Menu Strategy and Innovation. We intend to continue to evolve our menu to create platforms that convey the differentiated QSR+ positioning and reinforce our “We Start with Fresh and Serve with Value” brand position. We believe we have opportunities for menu innovation as we look to provide customers more choices through quality/value platforms such as Epic Burritos®, Handcrafted Ensaladas and Fresca Bowls. In addition, we will continue to tap in to the need for price/value offerings by building on the success of our value/variety Buck & Under Menu® and mid-tier products. Our marketing and operations teams have demonstrated an ability to collaborate to ensure that the items developed in our test kitchen can be executed to high standards in the restaurants with the speed, value and quality that our customers expect.
Driving Brand Awareness and Consumer Engagement. We engage consumers through 8 to 9 annual promotional windows which feature seasonal favorites such as shrimp tacos, quality enhancing platforms such as Fresca Bowls and Handcrafted Salads, and strong value propositions showcased by the Buck & Under Menu® platform. The key points of differentiation are communicated through our “Un freshing Believable®" advertising campaign.
4
Restaurant Re-image Program. In 2012, we launched our restaurant re-image program, called Ambience Shake-Up, which was completed by all company-operated restaurants by mid-2013 at an average cost of approximately $45,000 per restaurant. The Ambience Shake-Up, together with the other elements of our integrated strategy, has contributed to the acceleration in same store sales by aligning the restaurant appearance with our brand image to support and drive our QSR + positioning. The re-imaged restaurants include revitalized exteriors and visual cues which highlight the quality and freshness of our ingredients, and provides a more modern feel and inviting experience in the dining areas. As of December 29, 2015, 100% of company-operated restaurants and 91% of total system restaurants feature the new image and we expect we will have re-imaged substantially all of our restaurant system by the end of 2016.
Leverage Our Infrastructure. Since 2012, we have increased our restaurant contribution margin by 280 basis points, to 20.0%. Over time we believe we can further improve our margins with effective menu pricing, by maintaining fiscal discipline, increasing fixed-cost leverage and enhancing our supply chain efforts. We currently have an infrastructure that allows us and our franchisees to grow and manage the productivity of each restaurant on a real-time basis. Additionally, we believe over time, as our restaurant base matures and AUVs increase, we will be able to leverage corporate costs and improve margins, as over time general and administrative expenses are expected to grow at a slower rate than revenues. As the restaurant base and sales expand, we will potentially have larger media budgets, allowing us to target specific opportunistic areas with incremental marketing campaigns.
Site Selection and Expansion
New Restaurant Development
We believe we are well positioned for growth with improving unit economics, desirable returns on invested capital, and a strong cash flow available for investment. For the year ended December 29, 2015, we opened six new company-operated restaurants and our franchisees opened six new restaurants, and in 2016 we intend to open between 15 and 18 new system-wide restaurants across our established and emerging markets. We believe that after 2016, the pace of development will increase, with a particular acceleration for company-operated stores in in-fill markets where the brand is well established.
The strategy for restaurant development is three fold. First, in the near term, with an identified in-fill opportunity of an additional 300+ potential new trade areas for restaurant development (company-operated and franchise), we are accelerating our pipeline of in-fill locations to leverage the brand awareness, infrastructure and efficiencies of scale through what we believe is a lower risk, higher return expansion opportunity. Second, we will continue to develop company-operated restaurants in emerging markets such as Atlanta and Oklahoma City, establishing operational expertise, while recruiting additional franchisees to enable us to embed and scale our brand more rapidly. In some markets, we may explore a re-franchising strategy if we believe it will enhance growth opportunities and longer term earnings per share. Finally, we will be entering emerging new markets, primarily with new franchise partners and where appropriate, with company-operated restaurants. With substantial growth opportunities in established and emerging markets, efforts to expand into new markets will be carefully vetted and researched before they are undertaken and we expect that expansion into new emerging markets will be limited for at least two to three years.
Site Selection Process
We consider the location of a restaurant to be a critical variable in our long-term success and as such, we devote significant effort to the investigation and evaluation of potential restaurant locations, utilizing quantitative and qualitative modeling. Our in-house development team has significant prior experience working at other limited and full service brands. For company-operated restaurants, we use a combination of our in-house development team and outside real estate brokers to locate, evaluate and negotiate leases for new sites, taking into account demographic characteristics, daytime population thresholds, traffic counts and traffic patterns, along with the potential visibility and accessibility of the restaurant. The process for selecting locations applies management’s experience and expertise to an extensive set of objective data. In addition, we use a third-party data analytics tool to assist in the site selection and obtain information from a separate third party to support the analysis. Because our restaurants perform well across a variety of neighborhoods and demographics, we have great flexibility in selecting new restaurant locations without taking on excessive operating risk.
We have primarily focused on developing freestanding or end-cap sites with drive-thrus. In the future, we may consider developing a prototype appropriate for other promising locations where a drive-thru is not feasible.
New company-operated and franchised restaurants are reviewed by our real estate site committee, which includes senior management. The committee monitors ongoing performance to inform future site selection decisions.
5
Restaurant Design
A typical Del Taco restaurant is a free-standing building with drive-thru service that ranges in size from 2,000 to 2,600 square feet. The design creates a colorful, bright and contemporary restaurant environment. The exterior of each restaurant features a signature Del Taco logo, color palette and artwork that reinforces the brand identify; the interior generally features an open kitchen and various visual “freshness cues” to highlight the commitment to freshly prepared food. The colorful and contemporary dining rooms, typically with seating for approximately 60 people, include a variety of comfortable booths and seating arrangements with contemporary surfaces, artwork, visual "freshness cues" and a color palette that reinforces brand identity. The typical design features large windows and soft lighting.
Our new company-operated restaurants are typically ground-up prototypes or conversions. We estimate that a restaurant will require an average total net cash investment of approximately $0.9 million, net of tenant allowances. On average, it takes approximately 18 months from identification of the specific site to the opening the restaurant. We have set processes and timelines to follow for all restaurant openings. Company-operated restaurants are constructed in approximately 13 weeks and the development and construction of new sites is the responsibility of the construction department. A conversion typically takes approximately 10 weeks to complete. The real estate department is responsible for locating and leasing potential restaurant sites and the construction department is then responsible for building the restaurants.
Underperforming Restaurants
During 2014, we identified 13 restaurants that generated atypically low sales volumes and negative restaurant contribution. These restaurants had been built before the current site selection criteria were established and many featured end-cap drive-thru facilities that current site selection criteria would suggest are not advisable. Further, these restaurants used an earlier iteration of the current prototype, which lacked certain design elements that are now included and that we believe contribute to higher sales volumes.
During the year ended December 30, 2014, we recorded impairment of long-lived assets charges totaling $9.6 million related to these 13 underperforming restaurants that generated negative restaurant contribution of approximately $1.6 million during the 52 weeks ended December 30, 2014. During the fourth quarter of fiscal 2015, we closed 12 of the 13 underperforming restaurants. Upon closure, we recorded restaurant closure charges totaling $4.5 million, offset by $2.7 million related to the reclassification of lease related liabilities, for a net charge of $1.8 million. The net charge of $1.8 million and additional charges of $0.2 million related to other prior restaurant closures or sublease income shortfalls are both included in restaurant closure charges, net on the consolidated statements of comprehensive income (loss) for the twenty-six weeks ended December 29, 2015. The charges for the 12 underperforming restaurants represent (1) the present value of the future lease obligations, net of estimated sublease income, (2) a lease termination payment, (3) brokerage commissions, (4) post closure rent, utilities, property tax and common area maintenance charges, (5) unused food and paper that could not be redeployed, (6) Worker Adjustment and Retraining Notification ("WARN") act and stay bonus payments to terminated employees, and (7) other direct costs associated with the closures. We believe the estimated sublease income will permit a substantial recovery of the future lease obligations, which helps mitigate the initial restaurant closure charge and future annual cash sublease shortfalls.
Restaurant Management and Operations
Operations
We utilize a balanced scorecard measurement system for all company-operated restaurants. Elements included in the scorecard are customer surveys, internal audits, staffing metrics, speed of service metrics, sales metrics, and key controllable costs. Each period, managers of company-operated stores who are top performers on the scorecard are eligible for bonuses to reinforce this balanced approach to the business. The scorecard is also used by the operations leadership team to mine best practices.
To ensure brand consistency and integrity across all system restaurants, we utilize an internal operations audit program. Each restaurant is audited two or more time per year, and each audit results in two scores – a customer experience score and a brand standards score. We also have food safety and quality assurance programs for all system restaurants. Our auditors are part of the operations support team and provide regular performance analysis to the leadership team.
Managers and Team Members
Each Del Taco restaurant typically has a general manager, four to six shift leaders, and two or three team leaders. There are also typically between 15 and 20 team members who prepare food and serve customers. Area Directors lead company-operated restaurants, with each typically responsible for approximately six to 13 restaurants. Overseeing the Area Directors are five Regional Directors, each responsible for approximately 10 to 80 restaurants. The franchise operations team utilizes 5 Franchise Business Consultants who each coach and oversee 40 to 70 franchised restaurants. The Franchise Business Consultants report to the Vice President of Franchise Operations. The Senior Vice President of Operations has full accountability for both
6
company-operated and franchise-operated restaurants, managing both sales and profitability targets and customer experience metrics.
Our hiring process is focused on identifying team members that are genuinely friendly, committed to preparing fresh food, and willing to ensure “every guest leaves happy”. We frequently cross-train our team members so they can fill any one of several positions to maximize labor efficiency. The investment in helping team members learn multiple skills and our internal promotion path has helped us build loyal teams that care about the success of their restaurant. Many team members and managers have been employed by us for longer than 5 years, and it is not rare to have team members with more than 10 years of seniority.
Training
Our senior management team fosters a culture of continuous learning and career growth at Del Taco. On the first day of employment, every team member receives the first of three training modules focused on helping the team member clearly understand the brand and their role. Subsequent modules focus on the specifics of how to provide a consistent customer experience. The current training program is a blended learning approach including self-paced reading, hands-on exercises and written knowledge validation tests. In 2015, we launched the next phase of our training program with the addition of tablet-based bilingual e-learning which includes interactive exercises, video tutorials and online testing.
A significant portion of the restaurant leadership is comprised of former team members who have advanced along the Del Taco career path. Top performing team members who display leadership qualities take the first step in the management development program and become team leaders. As team leader candidates enter the management development program, they receive additional training and are regularly tested on their knowledge and skills. Shift leader candidates will have completed the three modules, passed all of the required testing and have their knowledge validated during a practical evaluation of one of their shifts. An external candidate for a general manager role will complete six to seven weeks of intensive classroom and hands-on training in a certified training restaurant.
Franchise Program
Overview
We use a franchising strategy to augment new restaurant growth in new and established markets, allowing for brand expansion without significant capital investment. As of December 29, 2015 (Successor), there were a total of 247 franchise restaurants. Franchisees range in size from single restaurant operators to multi-unit operators, the largest of which owns 30 locations. As of December 29, 2015 (Successor) and December 30, 2014 (Predecessor), our top 12 franchisees operated over 50% and 49%, respectively, of our franchised restaurants and 20 franchisees operated approximately 64% and 63%, respectively, of our franchised restaurants. The existing franchise base consists of numerous successful, longstanding restaurant operators.
We believe that franchise revenue provides stable and recurring cash flows to us and, as such, we plan to continue expanding the base of franchised restaurants. In established markets, we will encourage continued growth from current franchisees and assist them in identifying and securing new locations. In emerging and new markets, we will source highly qualified and experienced new franchisees for multi-unit development opportunities. We generally seek franchisees from successful, non-competitive brands operating within the expansion markets. We market franchise opportunities through strategic networking, participation in select industry conferences, our existing website and printed materials.
We have several groups to enhance participation and engagement with the franchise community. The Franchise Marketing Advisory Team provides input and feedback on marketing strategy and initiatives. Our Operations Advisory Committee (“OAC”), comprised of experienced franchise and company operators, proposes and analyzes new equipment, training and procedures. The OAC has an ad hoc Design and Construction Advisory Team to advise on restaurant design standards.
Franchise Owner Support
We have structured our corporate staff, training programs, operational systems and communication systems to ensure we are delivering strong support to franchisees. We assist franchisees with the site selection process, and every new franchise location is scrutinized by our corporate real estate committee. We provide template plans franchisees may use for new restaurant construction and work with franchisees and their design and construction vendors to ensure compliance with brand specifications. A training program is required for all franchisees, operating partners and restaurant management staff. Training materials introduce new franchisees to our operational performance standards and the metrics that help maintain these high standards.
For the first two store openings in a market, we typically provide significant on-site support, with more modest support for subsequent locations. On an ongoing basis, we collect and disseminate customer experience feedback on a real time basis
7
through a third party vendor. We also conduct regular on-site audits at each franchise location. Our Franchise Business Consultants are dedicated to ongoing franchise support and oversight, regularly visiting each franchise territory. We also employ dedicated Franchise Field Marketing Managers to assist franchisees with local marketing programs. We typically communicate with franchisees through an operations newsletter and hold regular regional workshops to update franchise teams and conduct training. We also hold an annual conference for franchisees, vendors and company operations leaders to review overall performance, celebrate shared success, communicate best practices, and plan for the year ahead.
Marketing and Advertising
We run a highly coordinated marketing and advertising campaign to create customer awareness, engage fans, and maximize positive brand associations. We use multiple marketing channels, including television, radio, and direct mail to broadly drive brand awareness. We advertise on local TV/Cable and local radio in our primary markets, and utilize local radio, print, internet advertising, and billboards for some of the less developed markets. We complement this with email marketing to our Raving Fan E-Club, which allows us to reach more than 555,000 members, and via social media through Facebook, which allows us to reach nearly 600,000 followers. We use our Raving Fan e-Club database to invite sub-sets of members to the taste panel facility, located at our corporate office.
Through our public relations efforts, we engage notable food editors and bloggers on a range of topics to help promote products. In addition, we engage in one on one conversations using a portfolio of social media platforms which include Facebook, Twitter and Instagram. We also use social media as a research and customer service tool, and apply insight we gain to future marketing efforts.
Purchasing and Distribution
To ensure an adequate supply of high-quality ingredients and other necessary supplies, we carefully select our suppliers. Our quality assurance department performs comprehensive supplier audits on a regular schedule to ensure that products conform to company standards. To ensure that prices are competitive, we use forward, fixed and formula pricing protocols where possible. We monitor industry news, trade issues, weather, and world events that may affect supply prices and we proactively attempt to lock in favorable pricing.
We contract with a single primary foodservice distributor for substantially all of our food and supplies. Our relationship with our primary distributor has been in place since 1990, and we believe the long-term relationship yields benefits to us and our franchisees in terms of reliability and pricing. Franchisees are required to use the primary distributor and must purchase all food and supplies from approved suppliers. In our normal course of business, we evaluate bids from multiple suppliers for various products. Taco meat is the largest product cost item and represented approximately 12% of the total cost for food and paper for 2015. Fluctuations in supply and prices can significantly impact our restaurant profit performance. We actively manage cost volatility for our significant food and paper items by negotiating with multiple suppliers and entering into what we believe are the most favorable contract terms given existing market conditions. In the past, we have entered into contracts ranging from three months to two years depending on market conditions.
Intellectual Property
We have registered Del Taco®, Un freshing Believable®, Buck & Under Menu®, Epic Burritos®, and certain other names used by our restaurants as trademarks or service marks with the United States Patent and Trademark Office and in approximately nine foreign countries. Our current advertising campaign, Un freshing Believable®, has been approved for registration with the United States Patent and Trademark Office. In addition, the Del Taco logo, website name and domain name and the content on its Facebook and Twitter accounts are our intellectual property. We maintain the recipes for our taco meat, marinated grilled chicken and signature salsas, as well as certain proprietary standards, specifications and operating procedures, as trade secrets or confidential proprietary information.
We license the use of our registered trademarks to franchisees through franchise contracts. The franchise agreements restrict franchisees’ activities with respect to the use of the trademarks and impose quality control standards in connection with goods and services offered in connection with the trademarks. Our general policy is to pursue and maintain registration of the service marks, trademarks and other intellectual property rights we use for our business in those countries where business strategy requires us to do so and to oppose vigorously any infringement or dilution of the service marks or trademarks in such countries.
8
Competition
We operate in the restaurant industry, which is highly competitive and fragmented. The number, size and strength of competitors vary by region. Our competition includes a variety of locally owned restaurants and national and regional chains that may offer dine-in, carry-out and delivery services. The competition includes restaurants, convenience food stores, delicatessens, supermarkets and club stores. Based on our differentiated QSR+ positioning, we compete both with fast casual restaurants, including Chipotle, El Pollo Loco, Panera Bread, Qdoba, Rubio’s, and Habit, among others, and with traditional QSRs, such as Taco Bell, McDonald’s, Burger King and Jack In the Box. In addition, we compete with franchisors of other restaurant concepts for prospective franchisees.
Environmental Matters
Our operations are subject to federal, state and local laws and regulations relating to environmental protection, including regulation of discharges into the air and water, storage and disposal of waste and clean-up of contaminated soil and groundwater. Under these laws, an owner or operator of real estate may be liable for the costs of removal or remediation of hazardous or toxic substances.
Certain of our properties may be located on sites that have been used by prior owners or operators as retail gas stations or other historical uses with the potential for environmental impacts. It is possible that properties on which our restaurants are located or which we owned in the past may contain forms of environmentally hazardous materials. We are aware of contamination from a release of hazardous materials by a previous owner or operator at two of our leased properties. We do not believe that we contributed to the contamination at these properties. The appropriate state agencies have been notified and these issues are being handled without disruption to our business. Under applicable federal and state environmental laws, the current owner or operator of these sites may be jointly and severally liable for the costs of investigation and remediation of any contamination. Although we lease almost all of our properties, or when we own the property we obtain certain assurances from the prior owner or seek to obtain indemnity agreements from third parties, however, we cannot assure you that we will not be liable for environmental conditions relating to prior, existing or future restaurants or restaurant sites. If we are found liable for the costs of remediation of contamination at or emanating from any of our properties, operating expenses would likely increase and operating results could be materially adversely affected.
Regulation and Compliance
We are subject to extensive federal, state and local government regulation, including those relating to, among others, public health and safety, zoning and fire codes, and franchising. Although we have not experienced and do not anticipate any significant problems in obtaining required licenses, permits or approvals, any difficulties, delays or failures in this regard could delay or prevent the opening of a new restaurant or adversely impact the viability of an existing restaurant.
The development and construction of additional restaurants will be subject to compliance with applicable zoning, land use and environmental regulations. We believe existing laws and regulations in these areas has not had a material effect on us, but should such laws become more stringent or should we face different regulations in new territories, it could delay construction and increase development costs for new restaurants.
We are also subject to the Fair Labor Standards Act, the Americans with Disabilities Act, the Immigration Reform and Control Act of 1986 and various federal, state, and local laws governing such matters as minimum wages, overtime, unemployment tax rates, workers’ compensation rates, citizenship requirements and other working conditions. A significant portion of the hourly staff is paid at rates consistent with the applicable federal or state minimum wage and, accordingly, increases in the minimum wage will increase labor costs.
For a discussion of the various risks we may face from regulation and compliance matters, see Item 1A. “Risk Factors.”
Management Information Systems
All of our company-operated and most franchised restaurants use Aloha, a leading computerized point-of-sale system, which we believe is scalable to support our long-term growth plans. This point-of-sale system provides integrated, high speed credit card and gift card processing, specifically designed for the restaurant industry. The system collects daily transaction data, which generates information about daily sales, product mix and average transaction size that we actively analyze. It allows us to manage our products and pricing in every company-operated restaurant from the corporate office.
9
Our in-restaurant back office computer system assists in the management of our restaurants and provides labor and food cost management tools. The system provides corporate office and restaurant operations management quick access to detailed business data and reduces the time spent on administration. The system also provides sales, bank deposit and variance data to the accounting department on a daily basis. For company-operated restaurants, we use this data to generate daily sales information and weekly consolidated reports regarding sales and other key measures. Restaurant managers also have the ability to submit food and paper orders electronically to our primary distributor. During 2015, we successfully implemented a cloud-based information system which includes on-line recruiting tools, paperless employee files, and an on-line training system. Our systems and data are protected by advanced communication and data security systems.
Employees
As of December 29, 2015, we had approximately 6,690 employees, of whom approximately 6,225 were hourly restaurant employees comprised of 4,844 crewmembers, 1,302 shift leaders and 79 assistant managers, and 296 salaried general managers. The remaining 169 employees were corporate office personnel or above restaurant level management. None of the employees are part of a collective bargaining agreement.
Available Information
We maintain a website at www.deltaco.com, including an investor relations section at www.investor.deltaco.com in which we routinely post important information, such as webcasts of quarterly earnings calls and other investor events in which we participate or host, and any related materials. Our Code of Ethics is also available in this section of our website. You may access our annual reports on Form 10-K, quarterly reports on Form 10-Q, current reports on Form 8-K and amendments to those reports, as well as other reports relating to us that are filed with or furnished to the SEC, free of charge in the investor relations section of our website as soon as reasonably practicable after such material is electronically filed with or furnished to the SEC. The public may also read and copy materials we file with the SEC at the SEC’s Public Reference Room, which is located at 100 F Street, NE, Room 1580, Washington, DC 20549. You can obtain information on the operation of the Public Reference Room by calling the SEC at 1-800-SEC-0330. The SEC also maintains a website that contains reports, proxy and information statements and other information regarding issuers that file electronically with the SEC at www.sec.gov.
The contents of the websites mentioned above are not incorporated into and should not be considered a part of this report. The references to the URLs for these websites are intended to be inactive textual references only.
Executive Officers
The following table sets forth our current executive officers as of December 29, 2015:
Name | Age | Position | ||
Paul J.B. Murphy, III | 61 | President and Chief Executive Officer | ||
Steven L. Brake | 43 | Executive Vice President and Chief Financial Officer | ||
John D. Cappasola, Jr. | 42 | Executive Vice President and Chief Brand Officer | ||
David Pear | 52 | Senior Vice President of Operations | ||
Paul J.B. Murphy, III has been our President and Chief Executive Officer since February 2009. From 1996 to 2008, Mr. Murphy held various roles with Einstein Noah Restaurant Group, Inc. Mr. Murphy originally joined Einstein as Senior Vice President, Operations in 1997. He was promoted to Executive Vice President, Operations in 1998, and to Chief Operating Officer in 2002. In 2003, he was appointed President and Chief Executive Officer. Mr. Murphy holds a Bachelor’s Degree in Religious Studies from Washington & Lee University. Based on his extensive industry and management experience in the quick-service sector, his familiarity with us, his understanding of restaurant operations and his work at a franchisee organization, Mr. Murphy is well qualified to lead us and to serve on our board.
Steven L. Brake has been our Executive Vice President since July 2012. He is also the Chief Financial Officer and has held that position since April 2010 and previously served as Treasurer from March 2006 to April 2010 and as the Corporate Controller from September 2003 to March 2006. From December 1995 until September 2003 Mr. Brake was with Arthur Andersen and KPMG LLP. Mr. Brake is a licensed certified public accountant (inactive) and holds a Bachelor of Arts degree in Economics from the University of California, Irvine and a Masters in Business Administration from the Paul Merage School of Business at the University of California, Irvine.
John D. Cappasola, Jr. has been our Executive Vice President since July 2012. He is also our Chief Brand Officer and has held that position since February 2011. Prior to that, Mr. Cappasola served as Vice President of Marketing since being
10
appointed to that position in March 2009. From September 2008 to March 2009, he served as Vice President of Marketing Development. From August 2002 to September 2008, Mr. Cappasola held positions in marketing, strategic development, and operations at Blockbuster, Inc. of Dallas, Texas. Mr. Cappasola earned a Bachelor of Science degree in Business Management from California Coast University.
David Pear has been our Senior Vice President of Operations since January 2012. From January 2009 to January 2012, Mr. Pear served as Director of DMA Operations for Taco Bell of Yum Brands. From 1985 to January 2009, Mr. Pear held various positions with Domino’s Pizza, Inc., including Vice President Operations for Arizona from 2004 to 2008, and West Zone Vice President from 1994 to 2004. Mr. Pear has over 25 years of restaurant experience. Mr. Pear earned a Bachelor of Business Administration degree from Eastern Michigan University.
11
ITEM 1A. Risk Factors
You should carefully consider the following risk factors, together with all of the other information included in this annual report on Form 10-K. The risks described below are those which we believe are the material risks that we face. Additional risks not presently known to us or which we currently consider immaterial may also have an adverse effect on us. Any risk described below may have a material adverse impact on Del Taco's business or financial condition. Some statements in this annual report on Form 10-K, including such statements in the following risk factors, constitute forward-looking statements. These forward-looking statements are based on Del Taco management's current expectations, forecasts and assumption, and involve a number of risks and uncertainties. Accordingly, forward-looking statements should not be relied upon as representing our views as of any subsequent date, and we do not undertake any obligation to update forward-looking statements to reflect events or circumstances after the date they were made, whether as a result of new information, future events or otherwise, except as may be required under applicable securities laws.
Risks Related to Our Business and Industry
Our growth strategy depends in part on opening new restaurants in existing and new markets and expanding our franchise system. We may be unsuccessful in opening new company-operated or franchised restaurants or establishing new markets, which could materially adversely affect our growth.
One of the key means to achieving our growth strategy will be through opening new restaurants and operating those restaurants on a profitable basis. We opened six new company-operated restaurants and six new franchise restaurants in 2015 and plan to open an estimated 15 to 18 new system-wide restaurants in 2016. Our ability to open new restaurants is dependent upon a number of factors, many of which are beyond our control, including our or our franchisees’ ability to:
• | identify available and suitable restaurant sites; |
• | compete for restaurant sites; |
• | identify, hire and train employees; |
• | reach acceptable agreements regarding the lease or purchase of locations; |
• | obtain or have available the financing required to acquire and operate a restaurant, including construction and opening costs, and managing such costs; |
• | respond to unforeseen engineering or environmental problems with leased or purchased premises; |
• | avoid the impact of inclement weather, natural disasters and other calamities; |
• | hire, train and retain the skilled management and other employees necessary to meet staffing needs; |
• | obtain, in a timely manner and for an acceptable cost, required licenses, permits and regulatory approvals and respond effectively to any changes in local, state or federal law and regulations that adversely affect our and franchisees’ costs or ability to open new restaurants; and |
• | control construction and equipment cost increases for new restaurants. |
There is no guarantee that a sufficient number of suitable restaurant sites will be available in desirable areas or on terms that are acceptable to us or our franchisees in order to achieve our growth plans. If we are unable to open new restaurants or sign new franchisees, or if restaurant openings are significantly delayed, our earnings and revenue growth could be adversely affected and our business negatively affected as we expect a portion of our growth to come from new locations.
Due to brand recognition and logistical synergies, as part of our growth strategy, we intend to open new restaurants in areas where we have existing restaurants. The operating results and comparable restaurant sales for our existing restaurants could be adversely affected due to close proximity with our other restaurants and market saturation.
As part of our longer term growth strategy, we may also enter into geographic markets in which we have little or no prior operating or franchising experience through company-owned restaurant growth and through franchise development agreements. The challenges of entering new markets include: difficulties in hiring and training experienced personnel; unfamiliarity with local real estate markets and demographics; consumer unfamiliarity with our brand; and different competitive and economic conditions, consumer tastes and discretionary spending patterns that are more difficult to predict or satisfy than in our existing markets. Consumer recognition of our brand has been an important part of the success of company-operated and franchised restaurants in our existing markets. In addition, restaurants we open in new markets may take longer to reach expected sales and profit levels on a consistent basis and may have higher construction, occupancy or operating costs than restaurants we open in existing markets, thereby affecting our overall profitability. Any failure on our part to recognize or respond to these challenges may adversely affect the success of any new restaurants. Expanding our franchise system could require the
12
implementation, expense and successful management of enhanced business support systems, management information systems and financial controls as well as additional staffing, franchise support, capital expenditures and working capital.
Our progress in opening new restaurants from quarter to quarter may occur at an uneven rate. If we do not open new restaurants in the future according to our current plans, the delay could have a material adverse effect on our business, financial condition and results of operations.
We may not realize the anticipated benefits from opening new restaurants in existing and new markets or from expanding our franchise system. For example, in Fiscal 2014, we recorded an impairment charge of $9.6 million related to 13 underperforming restaurants that generated atypically low sales volumes and negative restaurant contribution, and in Fiscal 2015, we closed 12 of these restaurants. If opening new restaurants in existing and new markets or the expansion of our franchise system is not successful, our operating results could be materially adversely affected.
Opening new restaurants in existing markets may negatively impact sales at our existing restaurants.
The consumer target area of our restaurants varies by location, depending on a number of factors, including population density, other local retail and business attractions, area demographics and geography. In the near term, we are accelerating our pipeline of in-fill locations to leverage the brand awareness, infrastructure and efficiencies of scale. The opening of a new restaurant in or near markets in which we already have restaurants could adversely impact sales at these existing restaurants. Existing restaurants could also make it more difficult to build our consumer base for a new restaurant in the same market. Our core business strategy does not entail opening new restaurants that we believe will materially affect sales at our existing restaurants, but we may selectively open new restaurants in and around areas of existing restaurants that are operating at or near capacity to effectively serve our customers.
We may not be able to compete successfully with other quick service and fast casual restaurants. Intense competition in the restaurant industry could make it more difficult to expand our business and could also have a negative impact on our operating results if customers favor our competitors or we are forced to change our pricing and other marketing strategies.
We face significant competition from restaurants in the quick service and fast casual dining segments of the restaurant industry. In addition, the Southern California and Las Vegas regions, the primary markets in which we compete, consist of very competitive Mexican-inspired quick service and fast casual markets. We expect competition in these markets and each of our other markets to continue to be intense because consumer trends are favoring limited service restaurants that offer healthier menu items made with better quality products and many limited service restaurants are responding to these trends. Competition in our industry is primarily based on price, convenience, quality of service, brand recognition, restaurant location and type and quality of food. If our company-operated and franchised restaurants cannot compete successfully with other quick service and fast casual restaurants in new and existing markets, we could lose customers and our revenue could decline.
Our company-operated and franchised restaurants compete with national and regional quick service and fast casual restaurant chains for customers, restaurant locations and qualified management and other staff. Many of our competitors have existed longer and have a more established market presence with substantially greater financial, marketing, personnel and other resources than we do. Among our competitors are a number of multi-unit, multi-market, fast casual restaurant concepts, some of which are expanding nationally. As they expand, we will face competition from these restaurant concepts as well as new competitors that strive to compete within our market segments. These competitors may have, among other things, lower operating costs, better locations, better facilities, better management, more effective marketing and more efficient operations. Additionally, we face the risk that new or existing competitors will copy our business model, menu options, brand presentation or ambience, among other things.
Any inability to successfully compete with the restaurants in our markets will place downward pressure on our customer traffic and may prevent us from increasing or sustaining our revenue and profitability. Consumer tastes, nutritional and dietary trends, traffic patterns and the type, number and location of competing restaurants often affect the restaurant business, and our competitors may react more efficiently and effectively to those conditions. In addition, many of our traditional fast food restaurant competitors may offer lower-priced menu options or meal packages, or have loyalty programs. Our sales could decline due to changes in popular tastes, “fad” food regimens, such as low carbohydrate diets, and media attention on new restaurants. If we are unable to continue to compete effectively, our traffic, sales and restaurant contribution could decline which would have a material adverse effect on our business, financial condition and results of operations.
13
We may not be able to adequately protect our intellectual property, which could harm the value of our brand and have a material adverse effect on our business, financial condition and results of operations.
Our intellectual property is material to the conduct of our business. Our ability to implement our business plan successfully depends in part on our ability to further build brand recognition using our trademarks, service marks, trade dress and other proprietary intellectual property, including our name and logos and the unique ambience of our restaurants. While it is our policy to protect and defend vigorously our rights to our intellectual property, we cannot predict whether steps taken by us to protect our intellectual property rights will be adequate to prevent misappropriation of these rights or the use by others of restaurant features based upon, or otherwise similar to, our restaurant concept. It may be difficult for us to prevent others from copying elements of our concept and any litigation to enforce our rights will likely be costly and may not be successful. Although we believe that we have sufficient rights to all of our trademarks and service marks, we may face claims of infringement that could interfere with our ability to market our restaurants and promote our brand. Any such litigation may be costly and could divert resources from our business. Moreover, if we are unable to successfully defend against such claims, we may be prevented from using our trademarks or service marks in the future and may be liable for damages, which in turn could have a material adverse effect on our business, financial condition and results of operations.
In addition, we license certain of our proprietary intellectual property, including our name and logos, to third parties. For example, we grant our franchisees a right to use certain of our trademarks in connection with their operation of the applicable restaurant. If a franchisee fails to maintain the quality of the restaurant operations associated with the licensed trademarks, our rights to, and the value of, our trademarks could potentially be harmed. Negative publicity relating to the franchisee or licensee could also be incorrectly associated with Del Taco, which could harm our business. Failure to maintain, control and protect our trademarks and other proprietary intellectual property would likely have a material adverse effect on our business, financial condition and results of operations and on our ability to enter into new franchise agreements.
New restaurants, once opened, may not be profitable, and the increases in average restaurant revenue and comparable restaurant sales that we have experienced in the past may not be indicative of future results.
Some of our restaurants open with an initial start-up period of higher than normal sales volumes, which subsequently decrease to stabilized levels. Typically, our new restaurants have stabilized sales after approximately 26 to 52 weeks of operation, at which time the restaurant’s sales typically begin to grow on a consistent basis. However, we cannot assure you that this will occur for future restaurant openings. In new markets, the length of time before average sales for new restaurants stabilize is less predictable and can be longer as a result of our limited knowledge of these markets and consumers’ limited awareness of our brand. In addition, our average restaurant revenue and comparable restaurant sales may not increase at the rates achieved over the past several years, if at all. Our ability to operate new restaurants profitably and increase average restaurant revenue and comparable restaurant sales will depend on many factors, some of which are beyond our control, including:
• | consumer awareness and understanding of our brand; |
• | general economic conditions, which can affect restaurant traffic, local labor costs and prices we pay for the food products and other supplies we use; |
• | changes in consumer preferences and discretionary spending; |
• | difficulties obtaining or maintaining adequate relationships with distributors or suppliers in new markets; |
• | increases in prices for commodities, including beef and other proteins; |
• | inefficiency in our labor costs as our staff gains experience; |
• | competition, either from our competitors in the restaurant industry or our own restaurants; |
• | temporary and permanent site characteristics of new restaurants; |
• | changes in government regulation; and |
• | other unanticipated increases in costs, any of which could give rise to delays or cost overruns. |
If our new restaurants do not perform as planned, our business and future prospects could be harmed. In addition, an inability to achieve our expected average restaurant revenue would have a material adverse effect on our business, financial condition and results of operations.
Our sales growth and ability to achieve profitability could be adversely affected if comparable restaurant sales are less than we expect.
Our ability to increase the level of comparable restaurant sales, which reflect the change in year-over-year sales for restaurants in the accounting period following 18 months of operations, will affect our sales growth and will continue to be a critical factor
14
affecting our ability to generate profits because the restaurant contribution margin on comparable restaurant sales is generally higher than the restaurant contribution on new restaurant sales. Our ability to increase comparable restaurant sales depends in part on our ability to successfully implement our initiatives to increase sales. It is possible such initiatives will not be successful, that we will not achieve our target comparable restaurant sales growth or that the change in comparable restaurant sales could be negative, which may cause a decrease in sales growth and our ability to achieve profitability that would have a material adverse effect on our business, financial condition and results of operations. See the section entitled “Management’s Discussion and Analysis of Financial Condition and Results of Operations-Key Performance Indicators-Same Store Sales Growth.”
Our long-term success depends in part on our ability to effectively identify and secure appropriate sites for new restaurants.
We intend to develop new restaurants in our existing markets, expand our footprint into adjacent markets and selectively enter into new markets. In order to build new restaurants, we must first identify markets where we can enter or expand our footprint, taking into account numerous factors, including the location of our current restaurants, local economic trends, population density, area demographics and geography. Then we must secure appropriate restaurant sites, which is one of our biggest challenges. There are numerous factors involved in identifying and securing an appropriate restaurant site, including:
• | evaluating size of the site, traffic patterns, local retail, residential and business attractions and infrastructure that will drive high levels of customer traffic and sales; |
• | competition in new markets, including competition for restaurant sites; |
• | financial conditions affecting developers and potential landlords, such as the effects of macro-economic conditions and the credit market, which could lead to these parties delaying or canceling development projects (or renovations of existing projects), in turn reducing the number of appropriate restaurant sites available; |
• | developers and potential landlords obtaining licenses or permits for development projects on a timely basis; |
• | proximity of potential restaurant sites to existing restaurants; |
• | anticipated commercial, residential and infrastructure development near the potential restaurant site; and |
• | availability of acceptable lease terms and arrangements. |
Given the numerous factors involved, we may not be able to successfully identify and secure attractive restaurant sites in existing, adjacent or new markets, which could have a material adverse effect on our business, financial condition and results of operations.
Changes in food and supply costs or failure to receive frequent deliveries of food ingredients and other supplies could have an adverse effect on our business, financial condition and results of operations.
Our profitability depends in part on our ability to anticipate and react to changes in food and supply costs, and our ability to maintain our menu depends in part on our ability to acquire ingredients that meet specifications from reliable suppliers. Shortages or interruptions in the availability of certain supplies caused by unanticipated demand, problems in production or distribution, food contamination, inclement weather or other conditions could adversely affect the availability, quality and cost of our ingredients, which could harm our operations. Any increase in the prices of the food products most critical to our menu, such as beef, chicken, cheese, french fries, tortillas, taco shells, fresh produce, soybean oil and other proteins, could have a material adverse effect on our business, financial condition and results of operations. Particularly, the cost of ground beef, our largest commodity expenditure and the only commodity that accounts for more than 12% of our total food and paper costs, has increased significantly in recent years as a result of a reduction in the U.S. cattle supply, coupled with an increase in world demand for beef. We currently purchase beef with fixed pricing contracts to reduce our exposure to potential price fluctuations. The market for beef is particularly volatile and is subject to extreme price fluctuations due to seasonal shifts, climate conditions, the price of feed, industry demand, energy demand, relative strength of the U.S. dollar and other factors. Although we try to manage the impact that these fluctuations have on our operating results, we remain susceptible to increases in food costs as a result of factors beyond our control, such as general economic conditions, seasonal fluctuations, weather conditions, demand, food safety concerns, generalized infectious diseases, product recalls and government regulations. For instance, over the past year our cost of eggs increased materially due to the impact of the avian flu which infected much of the domestic egg laying flock and created a temporary but significant reduction in supply. Therefore, material increases in the prices of the ingredients most critical to our menu, particularly ground beef, could adversely affect our operating results or cause us to consider changes to our product delivery strategy and adjustments to our menu pricing.
We have contracts with a limited number of suppliers for the food and supplies of our restaurants. If any of our suppliers perform inadequately, or our supply relationships are disrupted for any reason, there could be a material adverse effect on our
15
business, financial condition, results of operations or cash flows. Although we often enter into contracts for the purchase of food products and supplies, we do not have long-term contracts for the purchase of all such food products and supplies. As a result, we may not be able to anticipate or react to changing food costs by adjusting our purchasing practices or menu prices, which could cause our operating results to deteriorate. If we cannot replace or engage distributors or suppliers who meet our specifications in a short period of time, that could increase our expenses and cause shortages of food and other items at our restaurants, which could cause a restaurant to remove items from our menu. If that were to happen, affected restaurants could experience significant reductions in sales during the shortage or thereafter, if customers change their dining habits as a result. In addition, although we provide modestly priced food, we may choose not to, or may be unable to, pass along commodity price increases to consumers, including price increases with respect to ground beef. These potential changes in food and supply costs could have a material adverse effect on our business, financial condition and results of operations.
We rely on only one company to distribute substantially all of our products to company-operated and franchised restaurants. Failure to receive timely deliveries of food or other supplies could result in a loss of revenue and materially and adversely impact our operations.
Our profitability depends in part on our and our franchisees’ ability to maintain consistent quality menu items and prices, which in turn significantly depends upon our ability to acquire food and paper products from reliable sources in accordance with our specifications on a timely basis. Shortages or interruptions in the supply of food and paper products caused by unanticipated demand, problems in production or distribution, contamination of food products, an outbreak of diseases impacting various proteins, inclement weather or other conditions could materially adversely affect the availability, quality and cost of ingredients, which would adversely affect our business, financial condition, results of operations and cash flows. We do not control the businesses of our vendors, suppliers and distributors and our efforts to specify and monitor the standards under which they perform may not be successful.
One company distributes substantially all of the products we receive from suppliers to company-operated and franchised restaurants. If that distributor or any supplier fails to perform as anticipated or seeks to terminate agreements with us, or if there is any disruption in any of our distribution relationships for any reason, our business, financial condition, results of operations and cash flows could be materially adversely affected. If we or our franchisees must temporarily close a restaurant or remove popular items from a restaurant’s menu, that restaurant may experience a significant reduction in revenue during the time affected by the shortage and thereafter if our customers change their dining habits as a result.
Additionally, any changes we may make to the services we obtain from our vendors, or new vendors we employ, may disrupt our operations. These disruptions could have a material adverse effect on our business, financial condition and results of operations.
Failure to manage our growth effectively could harm our business and operating results.
A portion of our growth plan includes opening new restaurants. If our expansion is accelerated greatly, our existing restaurant management systems, financial and management controls and information systems may be inadequate to support our planned expansion. Managing any such growth effectively will require us to continue to enhance these systems, procedures and controls and to hire, train and retain managers and team members. We may not respond quickly enough to the changing demands that our expansion will impose on our management, restaurant teams and existing infrastructure, which could harm our business, financial condition and results of operations.
Negative publicity relating to one of our restaurants, including one of our franchised restaurants, could reduce sales at some or all of our other restaurants.
Our success is dependent in part upon our ability to maintain and enhance the value of our brand, consumers’ connection to our brand and positive relationships with our franchisees. We may, from time to time, be faced with negative publicity relating to food quality, public health concerns, restaurant facilities, customer complaints or litigation alleging illness or injury, health inspection scores, integrity of our or our suppliers’ food processing, employee relationships or other matters, regardless of whether the allegations are valid or whether we are held to be responsible. The negative impact of adverse publicity relating to one restaurant may extend far beyond the restaurant or franchise involved to affect some or all of our other restaurants. The risk of negative publicity is particularly great with respect to our franchised restaurants because we are limited in the manner in which we can regulate them, especially on a real-time basis. The considerable expansion in the use of social media over recent years can further amplify any negative publicity that could be generated by such incidents.
Additionally, employee claims against us based on, among other things, wage and hour violations, discrimination, harassment or wrongful termination may also create negative publicity that could adversely affect us and divert our financial and
16
management resources that would otherwise be used to benefit the future performance of our operations. A significant increase in the number of these claims or an increase in the number of successful claims would have a material adverse effect on our business, financial condition and results of operations. See Note 16, Commitments and Contingencies, in the notes to the consolidated financial statements. Consumer demand for our products and our brand’s value could diminish significantly if any such incidents or other matters create negative publicity or otherwise erode consumer confidence in us or our products, which would likely result in lower sales and could have a material adverse effect on our business, financial condition and results of operations.
Our expansion into new markets may present increased risks.
We may open restaurants in markets where we have little or no operating experience. Restaurants we open in any new markets may take longer to reach expected sales and profit levels on a consistent basis and may have higher construction, occupancy or operating costs than restaurants we open in existing markets, thereby affecting our overall profitability. New markets may have competitive conditions, consumer tastes and discretionary spending patterns that are more difficult to predict or satisfy than our existing markets. We may need to make greater investments than we originally planned in advertising and promotional activity in new markets to build brand awareness. We may find it more difficult in new markets to hire, motivate and keep qualified employees who share our vision, passion and culture. We may also incur higher costs from entering new markets if, for example, we assign regional managers to manage comparatively fewer restaurants than in more developed markets. As a result, these new restaurants may be less successful or may achieve AUVs at a slower rate. We may not be able to successfully develop critical market presence for our brand in new geographical markets, as we may be unable to find and secure attractive locations, build name recognition or attract new customers. Inability to fully implement or failure to successfully execute our plans to enter new markets could have a material adverse effect on our business, financial condition and results of operations.
Governmental regulation may adversely affect our ability to open new restaurants or otherwise adversely affect our business, financial condition and results of operations.
We are subject to various federal, state and local regulations, including those relating to building and zoning requirements and those relating to the preparation and sale of food. The development and operation of restaurants depends to a significant extent on the selection and acquisition of suitable sites, which are subject to zoning, land use, environmental, traffic and other regulations and requirements. Our restaurants are also subject to state and local licensing and regulation by health, sanitation, food and occupational safety and other agencies. We may experience material difficulties or failures in obtaining the necessary licenses, approvals or permits for our restaurants, which could delay planned restaurant openings or affect the operations at our existing restaurants. In addition, stringent and varied requirements of local regulators with respect to zoning, land use and environmental factors could delay or prevent development of new restaurants in particular locations.
We are subject to the U.S. Americans with Disabilities Act (the “ADA”) and similar state laws that give civil rights protections to individuals with disabilities in the context of employment, public accommodations and other areas, including our restaurants. We may in the future have to modify restaurants by adding access ramps or redesigning certain architectural fixtures, for example, to provide service to or make reasonable accommodations for disabled persons. The expenses or capital outlays associated with these modifications could be material.
Our operations are also subject to the U.S. Occupational Safety and Health Act, which governs worker health and safety, the U.S. Fair Labor Standards Act, which governs such matters as minimum wages and overtime, and a variety of similar federal, state and local laws that govern these and other employment law matters. We and our franchisees may also be subject to lawsuits from employees, the U.S. Equal Employment Opportunity Commission or others alleging violations of federal and state laws regarding workplace and employment matters, discrimination and similar matters, and we have been a party to such matters in the past. In addition, federal, state and local proposals related to paid sick leave or similar matters could, if implemented, have a material adverse effect on our business, financial condition and results of operations.
There is also a potential for increased regulation of certain food establishments in the United States, where compliance with a Hazard Analysis and Critical Control Points (“HACCP”) approach would be required. HACCP refers to a management system in which food safety is addressed through the analysis and control of potential hazards from production, procurement and handling, to manufacturing, distribution and consumption of the finished product. Many states have required restaurants to develop and implement HACCP Systems, and the United States government continues to expand the sectors of the food industry that must adopt and implement HACCP programs. For example, the Food Safety Modernization Act (the “FSMA”), signed into law in January 2011, granted the U.S. Food and Drug Administration (the “FDA”) authority regarding the safety of the entire food system, including through increased inspections and mandatory food recalls. Although restaurants are specifically exempted from or not directly implicated by some of these relatively new requirements, we anticipate that the requirements may impact our industry. Additionally, our suppliers may initiate or otherwise be subject to food recalls that may
17
impact the availability of certain products, result in adverse publicity or require us to take actions that could be costly for us or otherwise impact our business.
The impact of current laws and regulations, the effect of future changes in laws or regulations that impose additional requirements and the consequences of litigation relating to current or future laws and regulations, or our inability to respond effectively to significant regulatory or public policy issues, could increase our compliance and other costs of doing business and, therefore, have an adverse effect on our results of operations. Failure to comply with the laws and regulatory requirements of federal, state and local authorities could result in, among other things, revocation of required licenses, administrative enforcement actions, fines and civil and criminal liability. In addition, certain laws, including the ADA, could require us to expend significant funds to make modifications to its restaurants if we fail to comply with applicable standards. Compliance with the aforementioned laws and regulations can be costly and can increase our exposure to litigation or governmental investigations or proceedings, which could have a material adverse effect on our business, financial condition and results of operations.
Food safety and foodborne illness concerns could have an adverse effect on our business.
We have a vigorous food safety program in our restaurants designed to meet local and state regulations that we continue to update, optimize and strengthen. We have established in our nearly 52 year history, systems and standards with our suppliers and in our restaurants to ensure the safety of our food for our guests.
We cannot guarantee that our internal controls and training will be fully effective in preventing all food safety issues at our restaurants, including any occurrences of foodborne illnesses such as salmonella, Norovirus, E. coli and hepatitis A. In addition, there is no guarantee that our franchise restaurants will maintain the high levels of internal controls and training we require at company-operated restaurants. New illnesses resistant to our current precautions may develop in the future, or diseases with long incubation periods could arise, that could give rise to claims or allegations on a retroactive basis.
Furthermore, we bulk source for the system and we and our franchisees rely on our third-party suppliers, making it difficult to monitor food safety compliance and increasing the risk that foodborne illness could affect multiple locations rather than a single restaurant. We do our best to vet out our sources, however, given this, some foodborne illness could be caused by third-party suppliers and transporters outside of our control.
One or more instances of foodborne illness in any of our restaurants or markets or related to food products we sell could negatively affect our restaurant revenue nationwide if highly publicized on national media outlets or through social media. This risk exists even if it were later determined that the illness was wrongly attributed to us. Additionally, new illnesses resistant to our current precautions may develop in the future, or diseases with long incubation periods could arise, that could give rise to claims or allegations on a retroactive basis. A number of other restaurant chains have experienced incidents related to foodborne illnesses that have had a material adverse effect on their operations. The occurrence of a similar incident at one or more of our restaurants and negative publicity or public speculation about an incident, could have a material adverse effect on our business, financial condition and results of operations.
We could be party to litigation that could distract management, increase our expenses or subject us to material monetary damages or other remedies.
Our customers from time to time file complaints or lawsuits against us alleging we caused an illness or injury they suffered at or after a visit to our restaurants, or that we have problems with food quality or operations. We also have been subject to a variety of other claims arising in the ordinary course of its business, including personal injury claims, contract claims and claims alleging violations of federal and state law regarding workplace and employment matters, equal opportunity, harassment, discrimination and similar matters, including administrative charges, single-plaintiff lawsuits, class actions, and other types of actions. We could become subject to class actions or other lawsuits related to any of these or from different types of matters in the future. Such claims may result in the payment of substantial damages by us. Regardless of whether any claims brought against us are valid, or whether we are ultimately held liable, claims may be expensive to defend and may divert time and resources away from our operations and hurt our performance. A judgment in excess of our insurance coverage for any claims could materially and adversely affect our financial condition and results of operations. Any adverse publicity resulting from the claims, or even from threatened claims, may also materially and adversely affect our reputation, which in turn could have a material adverse effect on our business, financial condition and results of operations.
In addition, the restaurant industry has been subject to a growing number of claims based on the nutritional content of food products sold and disclosure and advertising practices. We may also be subject to this type of proceeding in the future and, even if it is not, publicity about these matters (particularly directed at the fast casual or traditional quick service segments of the
18
industry) may harm our reputation and could have a material adverse effect on our business, financial condition and results of operations.
Compliance with environmental laws may negatively affect our business.
We are subject to federal, state and local laws and regulations concerning waste disposal, pollution, protection of the environment, and the presence, discharge, storage, handling, release and disposal of, and exposure to, hazardous or toxic substances. These environmental laws provide for significant fines and penalties for noncompliance and liabilities for remediation, sometimes without regard to whether the owner or operator of the property knew of, or was responsible for, the release or presence of hazardous toxic substances. Third parties may also make claims against owners or operators of properties for personal injuries and property damage associated with releases of, or actual or alleged exposure to, such hazardous or toxic substances at, on or from our restaurants. Environmental conditions relating to releases of hazardous substances at a prior, existing or future restaurant could have a material adverse effect on our business, financial condition and results of operations. Further, environmental laws, and the administration, interpretation and enforcement thereof, are subject to change and may become more stringent in the future, each of which could have a material adverse effect on our business, financial condition and results of operations.
Changes in economic conditions and other unforeseen conditions, particularly in the markets in which we operate, could have a material adverse effect on our business, financial condition and results of operations.
The restaurant industry depends on consumer discretionary spending. The United States in general or the specific markets in which we operate may suffer from depressed economic activity, recessionary economic cycles, higher fuel or energy costs, low consumer confidence, high levels of unemployment, reduced home values, increases in home foreclosures, investment losses, personal bankruptcies, reduced access to credit or other economic factors that may affect consumer discretionary spending. Average restaurant revenue could decline if consumers choose to dine out less frequently or reduce the amount they spend on meals while dining out. Negative economic conditions might cause consumers to make long-term changes to their discretionary spending behavior, including dining out less frequently on a permanent basis, which could have a material adverse effect on our business, financial condition and results of operations.
For example, the recession from late 2007 to mid-2009 reduced consumer confidence to historic lows, impacting the public’s ability and desire to spend discretionary dollars as a result of job losses, home foreclosures, significantly reduced home values, investment losses, bankruptcies and reduced access to credit. If the economy experiences another significant decline, our business, results of operations and ability to comply with the terms of our credit agreement could be materially adversely affected and may result in a deceleration of the number and timing of new restaurant openings by us and our franchisees, as well as a potential deterioration in customer traffic or a reduction in average check size which would negatively impact our revenues and our profitability and could result in reductions in staff levels, additional impairment charges and potential restaurant closures.
Adverse weather and natural or man-made disasters in the markets in which we operate could have a material adverse effect on our business, financial condition and results of operations.
Adverse weather conditions in states in which we operate, or in the future may operate, could have a disproportionate impact on our overall results of operations. In particular, our business is significantly concentrated in Southern California, and as a result, we could be disproportionately affected by adverse weather specific to this market. Adverse weather conditions and prolonged or severe inclement weather may also impact customer traffic at our restaurants, and, in more severe cases, cause temporary restaurant closures, sometimes for prolonged periods. Most of our restaurants have outdoor seating, and the effects of adverse weather may impact the use of these areas and may negatively impact our revenue. In addition, natural or man-made disasters occurring in the markets in which we operate, such as terrorist attacks, tornadoes, earthquakes, hurricanes, floods, droughts, fires or other natural or man-made disasters, could have a material adverse effect on our business, financial condition and results of operations, as such events could result in lower customer traffic at our restaurants. If restaurant revenue decreases, our profitability could decline as we spread fixed costs across a lower level of sales. Reductions in staff levels, asset impairment charges and potential restaurant closures could result from prolonged negative comparable restaurant sales, which would have a material adverse effect on our business, financial condition and results of operations.
Our business is geographically concentrated in Southern California, and we could be negatively affected by conditions specific to that region.
Our company-operated and franchised restaurants in Southern California generated, in the aggregate, approximately 77% of our revenue for both the years ended December 29, 2015 and December 30, 2014. During the recent economic crisis and recession,
19
our business was materially adversely affected by a decrease in revenues from these restaurants due to adverse economic conditions in Southern California, including increased unemployment, declining home prices and increased foreclosures as well as potentially catastrophic events such as local strikes, increases in energy prices, explosions or other natural or man-made disasters. The incidence and severity of catastrophes are inherently unpredictable and our losses from catastrophes could be substantial. Adverse changes in demographic, unemployment, economic or regulatory conditions in Southern California or the State of California as a whole, including but not limited to enforcement policies for and changes in immigration law, have had and may continue to have material adverse effects on our business. As of December 2015, unemployment in California was 5.8% compared to the U.S. unemployment rate of 5.0%. We believe increases in unemployment will have a negative impact on traffic in our restaurants. As a result of our concentration in this market, we have been disproportionately affected by these adverse economic conditions compared to other national chain restaurants.
The challenging economic environment may affect our franchisees, with adverse consequences to us.
We rely in part on our franchisees and the manner in which they operate their locations to develop and promote our business. Due to the continuing challenging economic environment it is possible that some franchisees could file for bankruptcy or become delinquent in their payments to us, which could have a material adverse effect on our business due to loss or delay in payments of royalties, information technology (“IT”) support service fees, contributions to our advertising funds, and other fees. Our top 12 franchisees accounted for approximately 52.5% and 52.7% of our total franchise revenue for the years ended December 29, 2015 and December 30, 2014, respectively, and the top 20 franchisees accounted for approximately 67.8% and 67.3% of total franchise revenue for the years ended December 29, 2015 and December 30, 2014, respectively. Bankruptcies by our franchisees could prevent us from terminating their franchise agreements so that we can offer their territories to other franchisees, thereby negatively impacting our market share and operating results as we may have fewer well-performing restaurants, and adversely impact our ability to attract new franchisees.
Franchisees may not have access to the financial or management resources that they need to open the restaurants contemplated by their agreements with us, or be able to find suitable sites on which to develop them. Franchisees may not be able to negotiate acceptable lease or purchase terms for restaurant sites, obtain the necessary permits and government approvals or meet construction schedules. Any of these problems could slow our growth and reduce our franchise revenue. Additionally, our franchisees typically depend on financing from banks and other financial institutions, which may not always be available to them, in order to construct and open new restaurants. For these reasons, franchisees operating under development agreements may not be able to meet the new restaurant opening dates required under those agreements. Also, we sublease certain restaurants to certain existing franchisees. If any such franchisees cannot meet their financial obligations under their subleases, or otherwise fail to honor or default under the terms of their subleases, we would be financially obligated under a master lease and could be materially adversely affected.
Although we have developed criteria to evaluate and screen prospective developers and franchisees, it cannot be certain that the developers and franchisees we select will have the business acumen or financial resources necessary to open and operate successful franchises in their franchise areas, and state franchise laws may limit our ability to terminate or modify these franchise arrangements. Moreover, franchisees may not successfully operate restaurants in a manner consistent with our standards and requirements, or may not hire and train qualified managers and other restaurant personnel. The failure of developers and franchisees to open and operate franchises successfully could have a material adverse effect on us, our reputation, our brand and our ability to attract prospective franchisees and could materially adversely affect our business, financial condition, results of operations and cash flows.
We have limited control with respect to the operations of our franchisees, which could have a negative impact on our business.
Franchisees are independent business operators and are not our employees and we do not exercise control over the day-to-day operations of their restaurants. We provide training and support to franchisees, and set and monitor operational standards, but the quality of franchised restaurants may be diminished by any number of factors beyond our control. Consequently, franchisees may not successfully operate restaurants in a manner consistent with our standards and requirements, or may not hire and train qualified managers and other restaurant personnel. If franchisees do not operate to our expectations, our image and reputation, and the image and reputation of other franchisees, may suffer materially and system-wide sales could decline significantly.
Franchisees, as independent business operators, may from time to time disagree with us and our strategies regarding the business or our interpretation of our respective rights and obligations under the franchise agreement. This may lead to disputes with our franchisees and we expect such disputes to occur from time to time in the future as we continue to offer franchises. To the extent we have such disputes, the attention, time and financial resources of our management and our franchisees will be
20
diverted from our restaurants, which could have a material adverse effect on our business, financial condition, results of operations and cash flows.
New information or attitudes regarding diet and health could result in changes in regulations and consumer consumption habits, which could have an adverse effect on our business, financial condition and results of operations.
Regulations and consumer eating habits may change as a result of new information or attitudes regarding diet and health. Such changes may include responses to scientific studies on the health effects of particular food items or federal, state and local regulations that impact the ingredients and nutritional content of the food and beverages we offer. The success of our restaurant operations is dependent, in part, upon our ability to effectively respond to changes in any consumer attitudes or health regulations and our ability to adapt our menu offerings to trends in food consumption, especially fast-moving trends. If consumer health regulations or consumer eating habits change significantly, we may choose or be required to modify or delete certain menu items, which may adversely affect the attractiveness of our restaurants to new or returning customers. While we generally find that changes in consumer eating habits occur slowly, providing us with sufficient time to adapt our restaurant concept accordingly, changes in consumer eating habits can occur rapidly, often in response to published research or study information, which puts additional pressure on us to adapt quickly. To the extent we are unwilling or unable to respond with appropriate changes to our menu offerings in an efficient manner, it could materially affect consumer demand and have an adverse impact on our business, financial condition and results of operations.
Government regulation and consumer eating habits may impact our business as a result of changes in attitudes regarding diet and health or new information regarding the adverse health effects of consuming certain menu offerings. These changes have resulted in, and may continue to result in, laws and regulations requiring us to disclose the nutritional content of our food offerings, and they have resulted, and may continue to result in, laws and regulations affecting permissible ingredients and menu offerings. A number of counties, cities and states, including California, have enacted menu labeling laws requiring multi-unit restaurant operators to disclose to consumers certain nutritional information, or have enacted legislation restricting the use of certain types of ingredients in restaurants, which laws may be different or inconsistent with requirements under the Patient Protection and Affordable Care Act of 2010 (the “PPACA”), which establishes a uniform, federal requirement for certain restaurants to post nutritional information on their menus. Specifically, the PPACA requires chain restaurants with 20 or more locations operating under the same name and offering substantially the same menus to publish the total number of calories of standard menu items on menus and menu boards, along with a statement that puts this calorie information in the context of a total daily calorie intake.
We may not be able to effectively respond to changes in consumer health perceptions, comply with further nutrient content disclosure requirements or adapt our menu offerings to align with trends in eating habits, which could have a material adverse effect on our business, financial condition and results of operations.
Failure to maintain our corporate culture and changes in consumer recognition of our brand as we grow could have a material adverse effect on our business, financial condition and results of operations.
We believe that a critical component to our success has been our corporate culture. We have invested substantial time and resources in building our team. As we continue to grow, we may find it difficult to maintain the innovation, teamwork, passion and focus on execution that we believe are important aspects of our corporate culture. Any failure to preserve our culture could negatively affect our future success, including our ability to retain and recruit personnel and to effectively focus on and pursue our corporate objectives. If we cannot maintain our corporate culture as we grow, it could have a material adverse effect on our business, financial condition and results of operations.
In addition, our future results depend on various factors, including local market acceptance of our restaurants and consumer recognition of the quality of our food and operations. Our failure to receive and sustain such local market acceptance and consumer recognition could have a material adverse effect on our business, financial condition and results of operations.
The effect of changes to healthcare laws in the United States may increase the number of employees who choose to participate in our healthcare plans, which may significantly increase our healthcare costs and negatively impact our financial results.
In 2010, the PPACA was signed into law in the United States to require health care coverage for many uninsured individuals and expand coverage to those already insured. The PPACA requires us to offer healthcare benefits to all full-time employees (including full-time hourly employees) that meet certain minimum requirements of coverage and affordability, or face penalties. We began to offer such benefits on January 1, 2015 to all eligible employees, and may incur substantial additional expense due to organizing and maintaining the plan which we anticipate will be more expensive on a per person basis and will
21
extend to an increased number of employees who we anticipate may elect to obtain coverage through this healthcare plan we subsidize in part. If we fail to offer such benefits, or the benefits we elect to offer do not meet the applicable requirements, we may incur penalties. Since the PPACA also requires individuals to obtain coverage or face individual penalties, employees who are currently eligible but elect not to participate in our healthcare plans may find it more advantageous to do so when such individual penalties increase in size. It is also possible that by making changes or failing to make changes in the healthcare plans offered by us, we will become less competitive in the market for our labor. Finally, maintaining the requirements of the PPACA may impose additional administrative costs. The continued costs and other effects of these healthcare requirements cannot be determined with certainty, but they may significantly increase our healthcare coverage costs and could have a material adverse effect on our business, financial condition and results of operations.
We depend on our senior management team and other key employees, and the loss of one or more key personnel or an inability to attract, hire, integrate and retain highly skilled personnel could have an adverse effect on our business, financial condition and results of operations.
Our success depends largely upon the continued services of our key executives. We also rely on our leadership team in setting our strategic direction, operating our business, identifying, recruiting and training key personnel, identifying expansion opportunities, arranging necessary financing and general and administrative functions. From time to time, there may be changes in our executive management team resulting from the hiring or departure of executives, which could disrupt our business. The loss of one or more of our executive officers or other key employees could have a serious adverse effect on our business. The replacement of one or more of our executive officers or other key employees would involve significant time and expense and may significantly delay or prevent the achievement of our business objectives.
To continue to execute our growth strategy, we also must identify, hire and retain highly skilled personnel. We might not be successful in maintaining our corporate culture and continuing to attract and retain qualified personnel. Failure to identify, hire and retain necessary key personnel could have a material adverse effect on our business, financial condition and results of operations.
If we or our franchisees face labor shortages, unionization activities, labor disputes or increased labor costs, it could negatively impact our growth and could have a material adverse effect on our business, financial condition and results of operations.
Labor is a primary component in the cost of operating our company-owned and franchised restaurants. If we face labor shortages or increased labor costs because of increased competition for employees, higher employee turnover rates, increases in the federal, state or local minimum wage or other employee benefits costs (including costs associated with health insurance coverage), our operating expenses could increase and our growth could be negatively impacted. In addition, our success depends in part upon our ability to attract, motivate and retain a sufficient number of well-qualified restaurant operators and management personnel, as well as a sufficient number of other qualified employees, including customer service and kitchen staff, to keep pace with our expansion schedule. In addition, restaurants have traditionally experienced relatively high employee turnover rates. Our inability to recruit or retain qualified employees, due to competition or lack of qualified applicants, may delay planned openings of new restaurants, result in higher labor costs or result in higher employee turnover in existing restaurants, which could have a material adverse effect on our business, financial condition and results of operations.
Although none of our employees are currently covered under collective bargaining agreements, if a significant number of our employees were to become unionized and collective bargaining agreement terms were significantly different from our current compensation arrangements, it could adversely affect our business, financial condition and results of operations. In addition, a labor dispute involving some or all of our employees may harm our reputation, disrupt our operations and reduce our revenue, and resolution of disputes may increase our costs.
The minimum wage, particularly in California, continues to increase and is subject to factors outside of our control.
We have a substantial number of hourly employees who are paid wage rates based on the applicable federal, state or local minimum wage, and increases in the minimum wage may increase our labor costs. Since July 1, 2014, the State of California (where most of our restaurants are located) has had a minimum wage of $9.00 per hour, and it increased to $10.00 per hour on January 1, 2016. In addition, in September 2015, the Los Angeles County Board of Supervisors approved increases to the minimum wage to $15.00 per hour by 2020 with the first phase of the wage increase to $10.50 effective on July 1, 2016. This ordinance is expected to impact 25 company-owned restaurants and 8 franchise-owned restaurants in the City of Los Angeles and in the unincorporated areas of the County of Los Angeles. Other municipalities may set minimum wages above the applicable state standards. The federal minimum wage has been $7.25 per hour since July 24, 2009. Either federally-mandated or state-mandated minimum wages may be raised in the future. Furthermore, on July 1, 2015, the Healthy Workplaces, Healthy
22
Families Act of 2014 went into effect for California employees, which provides up to three days of paid sick leave for employees who work more than 30 days within a year. We may be unable to increase our menu prices in order to pass future increased labor costs on to our customers, in which case our margins would be negatively affected, which could have a material adverse effect on our business, financial condition and results of operations. In addition, if our menu prices are increased to cover increased labor costs, the higher prices could adversely affect sales and thereby reduce our margins.
Changes in employment laws may adversely affect our business.
Various federal and state labor laws govern the relationship with our employees and impact operating costs. These laws include employee classification as exempt or non-exempt for overtime and other purposes, minimum wage requirements, unemployment tax rates, workers’ compensation rates, immigration status and other wage and benefit requirements. Significant additional government-imposed increases in the following areas could have a material adverse effect on our business, financial condition and results of operations:
• | minimum wages; |
• | mandatory health benefits; |
• | vacation accruals; |
• | paid leaves of absence, including paid sick leave; and |
• | tax reporting. |
In addition, various states in which we operate are considering or have already adopted new immigration laws or enforcement programs, and the U.S. Congress and Department of Homeland Security from time to time considers and may implement changes to federal immigration laws, regulations or enforcement programs as well. Some of these changes may increase our obligations for compliance and oversight, which could subject us to additional costs and make our hiring process more cumbersome, or reduce the availability of potential employees. Although we require all workers to provide us with government-specified documentation evidencing their employment eligibility, some of our employees may, without our knowledge, be unauthorized workers. We currently participate in the “E-Verify” program, an Internet-based, free program run by the United States government to verify employment eligibility in all locations. However, use of the “E-Verify” program does not guarantee that we will properly identify all applicants who are ineligible for employment. Unauthorized workers are subject to deportation and may subject us to fines or penalties, and if any of our workers are found to be unauthorized we could experience adverse publicity that negatively impacts our brand and may make it more difficult to hire and keep qualified employees. Termination of a significant number of employees who were unauthorized employees may disrupt our operations, cause temporary increases in our labor costs as we train new employees and result in additional adverse publicity. We could also become subject to fines, penalties and other costs related to claims that we did not fully comply with all recordkeeping obligations of federal and state immigration compliance laws. These factors could have a material adverse effect on our business, financial condition and results of operations.
Our insurance programs, including high deductible self-insurance programs, may expose us to significant and unexpected costs and losses.
Given the nature of our operating environment, we are subject to workers’ compensation and general liability claims. To mitigate a portion of these risks, we maintain insurance for individual claims in excess of deductibles per claim. We currently record a liability for our estimated cost of claims incurred and unpaid as of each balance sheet date. Our estimated liability is recorded on an undiscounted basis and includes a number of significant assumptions and factors, including historical trends, expected costs per claim, actuarial assumptions and current economic conditions. Our history of claims activity for all lines of coverage is closely monitored and liabilities are adjusted as warranted based on changing circumstances. It is possible, however, that our actual liabilities may exceed our estimates of loss. We may also experience an unexpectedly large number of claims that result in costs or liabilities in excess of our projections and therefore we may be required to record additional expenses. For these and other reasons, our self-insurance reserves could prove to be inadequate, resulting in liabilities in excess of our available insurance and self-insurance. If a successful claim is made against us and is not covered by our insurance or exceeds our policy limits, our business may be negatively and materially impacted.
We might require additional capital to support business growth, and this capital might not be available.
We intend to continue to make investments to support our business growth and might require additional funds to respond to business challenges or opportunities, including the need to open additional restaurants, develop new products and menu items or enhance our products and menu items, and enhance our operating infrastructure. Accordingly, we might need to engage in equity or debt financings to secure additional funds. If we raise additional funds through issuance of equity securities, our
23
existing stockholders could suffer significant dilution, and any new equity securities we issue could have rights, preferences and privileges superior to those of holders of our common stock. Any debt financing secured by us in the future could involve restrictive covenants relating to our capital-raising activities and other financial and operational matters, which might make it more difficult for us to obtain additional capital and to pursue business opportunities, including potential acquisitions. Moreover, if we issue new debt securities, the debt holders would have rights senior to common stockholders to make claims on our assets. In addition, we might not be able to obtain additional financing on terms favorable to us, if at all. If we are unable to obtain adequate financing or financing on terms satisfactory to us when we require, our ability to continue to support our business growth and to respond to business challenges could be significantly limited.
The failure to comply with our debt covenants or the volatile credit and capital markets could have a material adverse effect on our financial condition.
Our ability to manage our debt is dependent on our level of positive cash flow from company-operated and franchised restaurants, net of costs. The recent economic downturn negatively impacted our cash flows. Credit and capital markets can be volatile, which could make it more difficult for us to refinance existing debt or to obtain additional debt financings in the future. Such constraints could increase our costs of borrowing and could restrict our access to other potential sources of future liquidity. Our failure to comply with the debt covenants in our credit agreement or to have sufficient liquidity to make interest and other payments required by our debt could result in a default of such debt and acceleration of our borrowings which would have a material adverse effect on business and financial condition.
We have significant debt and if we are unable to repay our debt when it becomes due or comply with our obligations in the underlying credit agreement, our business, financial condition and results of operations could be materially harmed.
At December 29, 2015, we had total debt obligations of $171.5 million (excluding any debt discount and deferred financing costs, and including capital lease obligations and deemed landlord financing liabilities), and $76.7 million available for borrowings under our revolving credit facility. Our level of indebtedness could have significant effects on our business, such as:
• | limiting our ability to borrow additional amounts to fund working capital, capital expenditures, acquisitions, debt service requirements, execution of our growth strategy and other purposes; |
• | requiring us to dedicate a portion of our cash flow from operations to pay interest on our debt, which would reduce availability of our cash flow to fund working capital, capital expenditures, potential acquisitions, execution of our growth strategy and other general corporate purposes; |
• | making us more vulnerable to adverse changes in general economic, industry and competitive conditions, in government regulation and in our business by limiting our ability to plan for and react to changing conditions; |
• | placing us at a competitive disadvantage compared with our competitors that have less debt; and |
• | exposing us to risks inherent in interest rate fluctuations because our borrowings are at variable rates of interest, which could result in higher interest expense in the event of increases in interest rates. |
We may not be able to generate sufficient cash flow from our operations to repay our indebtedness when it becomes due and to meet our other cash needs. If we are not able to pay our debts as they become due, we will be required to pursue one or more alternative strategies, such as selling assets, refinancing or restructuring our indebtedness or selling additional debt or equity securities. We may not be able to refinance our debt or sell additional debt or equity securities or sell our assets on favorable terms, if at all, and if we must sell our assets, we may negatively affect our ability to generate revenue.
Our credit agreement contains restrictive covenants that, among others, limit our ability to (i) pay dividends and make distributions and repurchase stock; (ii) engage in transactions with affiliates; (iii) create liens; (iv) incur indebtedness not under the credit agreement; (iv) engage in sale-leaseback transactions; (v) make investments; and (vi) sell or dispose of all or substantially all of our assets and engage in specified mergers or consolidations. In addition, our credit agreement contains certain financial covenants, including the maintenance of a consolidated total lease adjusted leverage ratio and a consolidated fixed charge coverage ratio. Our ability to borrow under our revolving credit agreement depends on our compliance with these financial covenants. Events beyond our control, including changes in general economic and business conditions, may affect our ability to meet these financial covenants. We cannot assure you that we will meet these financial covenants in the future, or that the lenders will waive any failure to meet these financial covenants.
We are subject to all of the risks associated with leasing space subject to long-term non-cancelable leases.
24
As of December 29, 2015, we only own real property underlying one company-operated restaurant. During the first quarter of fiscal 2016, we opened two company-operated restaurants for which we own real property. Payments under our operating leases account for a significant portion of our operating expenses and we expect that substantially all of the new restaurants we open in the future will also be leased. We are obligated under non-cancelable leases for our restaurants and our corporate headquarters. Our restaurant leases generally have an initial term of 15 to 20 years with up to four renewal options of five years each. Our restaurant leases generally require us to pay a proportionate share of real estate taxes, insurance, common area maintenance charges and other operating costs. Additional sites that we lease are likely to be subject to similar long-term non-cancelable leases. If an existing or future restaurant is not profitable, and we decide to close it, we may nonetheless be committed to perform our obligations under the applicable lease including, among other things, paying the base rent and real estate taxes for the balance of the lease term. During the fourth quarter of fiscal 2015, we closed twelve company-operated restaurants as previously planned. We recorded restaurant closure charges totaling $4.5 million, offset by $2.7 million related to the reclassification of lease related liabilities, for a net charge of $1.8 million. The net charge of $1.8 million and additional charges of $0.2 million related to other prior restaurant closures or sublease income shortfalls are both included in restaurant closure charges, net on the consolidated statements of comprehensive income (loss) for the twenty-six weeks ended December 29, 2015. The charges for the 12 underperforming restaurants were based on (1) the estimated present value of the future lease obligations net of estimated sublease income, (2) a lease termination payment, (3) brokerage commissions, (4) post closure rent, utilities, property tax and common area maintenance charges, (5) unused food and paper that could not be redeployed, (6) WARN act and stay bonus payments to terminated employees, and (7) other direct costs associated with the closures. In addition, as each of our leases expire, we may fail to negotiate renewals, either on commercially acceptable terms or at all, which could cause us to pay increased occupancy costs or to close restaurants in desirable locations. These potential increased occupancy costs and closed restaurants could have a material adverse effect on our business, financial condition and results of operations.
We may incur costs resulting from breaches of security of confidential consumer information related to our electronic processing of credit and debit card transactions.
A significant amount of our restaurant sales are by credit or debit cards. Other restaurants and retailers have experienced security breaches in which credit and debit card information has been stolen. We may in the future become subject to claims for purportedly fraudulent transactions arising out of the actual or alleged theft of credit or debit card information, and we may also be subject to lawsuits or other proceedings relating to these types of incidents. In addition, most states have enacted legislation requiring notification of security breaches involving personal information, including credit and debit card information. Any such claim or proceeding could cause us to incur significant unplanned expenses, which could have a material adverse effect on our business, financial condition and results of operations. Further, adverse publicity resulting from these allegations may have a material adverse effect on our business and results of operations.
We rely heavily on information technology, and any material failure, weakness, interruption or breach of security could prevent us from effectively operating our business.
We rely heavily on information systems, including point-of-sale processing in our restaurants, for management of our supply chain, payment of obligations, collection of cash, credit and debit card transactions and other processes and procedures. Our ability to efficiently and effectively manage our business depends significantly on the reliability and capacity of these systems. Our operations depend upon our ability to protect our computer equipment and systems against damage from physical theft, fire, power loss, telecommunications failure or other catastrophic events, as well as from internal and external security breaches, viruses and other disruptive problems. The failure of these systems to operate effectively, maintenance problems, upgrading or transitioning to new platforms, or a breach in security of these systems could result in delays in customer service and reduce efficiency in our operations. Remediation of such problems could result in significant, unplanned expense or capital investments.
Our current insurance may not provide adequate levels of coverage against claims.
Our current insurance policies may not be adequate to protect us from liabilities that we incur in our business. Additionally, in the future, our insurance premiums may increase, and we may not be able to obtain similar levels of insurance on reasonable terms, or at all. Any substantial inadequacy of, or inability to obtain, insurance coverage could have a material adverse effect on our business, financial condition and results of operations.
There are types of losses we may incur that cannot be insured against or that we believe are not economically reasonable to insure. Such losses could have a material adverse effect on our business, financial condition and results of operations. We may not be able to maintain adequate directors' and officers' insurance. Failure to maintain adequate directors’ and officers’ insurance would likely adversely affect our ability to attract and retain qualified officers and directors.
25
Failure to obtain and maintain required licenses and permits or to comply with food control regulations could lead to the loss of our food service licenses and, thereby, harm our business.
The restaurant industry is subject to various federal, state and local government regulations, including those relating to the sale of food. Such regulations are subject to change from time to time. The failure to obtain and maintain these licenses, permits and approvals could have a material adverse effect on our results of operations. Typically, licenses must be renewed annually and may be revoked, suspended or denied renewal for cause at any time if governmental authorities determine that our conduct violates applicable regulations. Difficulties or failure to maintain or obtain the required licenses and approvals could adversely affect our existing restaurants and delay or result in our decision to cancel the opening of new restaurants, which would have a material adverse effect on our business.
Restaurant companies have been the target of class action lawsuits and other proceedings alleging, among other things, violations of federal and state workplace and employment laws. Proceedings of this nature are costly, divert management attention and, if successful, could result in our payment of substantial damages or settlement costs.
Our business is subject to the risk of litigation by employees, consumers, suppliers, franchisees, stockholders or others through private actions, class actions, administrative proceedings, regulatory actions or other litigation. The outcome of litigation, particularly class action and regulatory actions, is difficult to assess or quantify. In recent years, restaurant companies, including ours, have been subject to lawsuits, including class action lawsuits, alleging violations of federal and state laws regarding workplace and employment conditions, discrimination and similar matters. A number of these lawsuits have resulted in the payment of substantial damages by the defendants. Similar lawsuits have been instituted from time to time alleging violations of various federal and state wage and hour laws regarding, among other things, employee meal breaks, rest periods, overtime eligibility of managers and failure to pay for all hours worked. We have been a party to wage and hour class action lawsuits in the past, and we presently face two wage and hour putative class action lawsuits in California state court.
In addition, from time to time, our customers file complaints or lawsuits against us alleging that we are responsible for some illness or injury they suffered at or after a visit to one of our restaurants, including actions seeking damages resulting from alleged food-borne illness or accidents in our restaurants. We also have been subject to claims from a former franchisee. We are also subject to a variety of other claims from third parties arising in the ordinary course of our business, including contract claims. The restaurant industry has also been subject to a growing number of claims that the menus and actions of restaurant chains have led to the obesity of certain of their customers. We may also be subject to lawsuits from our employees, the U.S. Equal Employment Opportunity Commission or others alleging violations of federal and state laws regarding workplace and employment conditions, discrimination and similar matters.
Regardless of whether any claims against us are valid or whether we are liable, claims may be expensive to defend and may divert time and money away from our operations. In addition, they may generate negative publicity, which could reduce customer traffic and sales. Although we maintain what we believe to be adequate levels of insurance, insurance may not be available at all or in sufficient amounts to cover any liabilities with respect to these or other matters. A judgment or other liability in excess of our insurance coverage for any claims or any adverse publicity resulting from claims could adversely affect our business and results of operations.
We could face liability from or as a result of our franchisees.
Various state and federal laws govern our relationship with our franchisees and our potential sale of a franchise. If we fail to comply with these laws, we could be liable for damages to franchisees and fines or other penalties. A franchisee or government agency may bring legal action against us based on the franchisee/franchisor relationship. Also, under the franchise business model, we may face claims and liabilities based on vicarious liability, joint-employer liability, or other theories or liabilities. All such legal actions not only could result in changes to laws, making it more difficult to appropriately support our franchisees and, consequently, impacting our performance, but, also, such legal actions could result in expensive litigation with our franchisees or government agencies that could adversely affect both our profits and our important relations with our franchisees. In addition, other regulatory or legal developments may result in changes to laws or the franchisor/franchisee relationship that could negatively impact the franchise business model and, accordingly, our profits.
DTH has a history of net losses and we may incur losses in the future.
DTH incurred net losses for the fifty-two weeks ended December 30, 2014 (Predecessor) and fifty-two weeks ended December 31, 2013 (Predecessor) principally driven by its level of indebtedness, non-cash impairment of long-lived asset charges and transaction-related costs during 2014 (Predecessor) and debt modification costs during both 2014 (Predecessor) and 2013 (Predecessor). We may incur net losses in the future if our level of indebtedness and associated interest expense increases, if we
26
incur impairment of intangible assets or long-lived asset charges, transaction-related costs or debt modification costs or other non-operational charges or if our operational performance deteriorates. Accordingly, we cannot assure you that we will achieve or sustain profitability in future years.
Changes to accounting rules or regulations may adversely affect the reporting of our results of operations.
Changes to existing accounting rules, including the newly issued lease standard, or regulations may impact the reporting of our future results of operations or cause the perception that we are more highly leveraged. Other new accounting rules or regulations and varying interpretations of existing accounting rules or regulations have occurred and may occur in the future. For instance, accounting regulatory authorities have indicated that they may begin to require lessees to capitalize operating leases in their financial statements in the next few years. If adopted, such change would require us to record significant lease obligations on our balance sheet and make other changes to our financial statements. This and other future changes to accounting rules or regulations could have a material adverse effect on the reporting of our business, financial condition and results of operations.
Changes to estimates related to our property, fixtures and equipment or operating results that are lower than our current estimates at certain restaurant locations may cause us to incur impairment charges on certain long-lived assets, which may adversely affect our results of operations.
In accordance with accounting guidance as it relates to the impairment of long-lived assets, we make certain estimates and projections with regard to individual restaurant operations, as well as our overall performance, in connection with our impairment analyses for long-lived assets. When impairment triggers are deemed to exist for any location, the estimated undiscounted future cash flows are compared to our carrying value. If the carrying value exceeds the undiscounted cash flows, an impairment charge equal to the difference between the carrying value and the fair value is recorded. The projections of future cash flows used in these analyses require the use of judgment and a number of estimates and projections of future operating results. If actual results differ from our estimates, additional charges for asset impairments may be required in the future. If future impairment charges are significant, this could have a material adverse effect on our results of operations.
Warrants are exercisable for our common stock, which would increase the number of shares eligible for future resale in the public market and result in dilution to our stockholders.
Outstanding warrants to purchase an aggregate of 12,639,623 shares of our common stock are exercisable in accordance with the terms of the warrant agreement governing those securities. The exercise price of these warrants will be $11.50 per share, or $145.4 million in the aggregate for all shares underlying these warrants, assuming none of the warrants are exercised through “cashless” exercise. To the extent such warrants are exercised, additional shares of our common stock will be issued, which will result in dilution to the holders of our common stock and increase the number of shares eligible for resale in the public market. Sales of substantial numbers of such shares in the public market or the fact that such warrants may be exercised could adversely affect the market price of our common stock.
Unanticipated changes in effective tax rates or adverse outcomes resulting from examination of our income or other tax returns could adversely affect our financial condition and results of operations.
We will be subject to income taxes in the United States, and our domestic tax liabilities will be subject to the allocation of expenses in differing jurisdictions. Our future effective tax rates could be subject to volatility or adversely affected by a number of factors, including:
• | changes in the valuation of our deferred tax assets and liabilities; |
• | expected timing and amount of the release of any tax valuation allowances; |
• | tax effects of stock-based compensation; |
• | costs related to intercompany restructurings; |
• | changes in tax laws, regulations or interpretations thereof; |
• | lower than anticipated future earnings in jurisdictions where we have lower statutory tax rates and higher than anticipated future earnings in jurisdictions where we have higher statutory tax rates; or |
• | changes in the excess of the amount for financial reporting over the tax basis of an investment in a domestic subsidiary. |
In addition, we may be subject to audits of our income, sales and other transaction taxes by U.S. federal and state authorities. Outcomes from these audits could have an adverse effect on our financial condition and results of operations.
27
Our stock price has been and may continue to be extremely volatile, and, as a result, you may not be able to resell your shares at or above the price you paid for them.
In recent years the stock market in general has been highly volatile. As a result, the market price and trading volume of our common stock is likely to be similarly volatile, and investors in our common stock may experience a decrease, which could be substantial, in the value of their stock, including decreases unrelated to our results of operations or prospects, and could lose part or all of their investment. The price of our common stock has been and could in the future be subject to wide fluctuations in response to a number of factors, including those described elsewhere in this proxy statement and others such as:
• | variations in our operating performance and the performance of our competitors or restaurant companies in general; |
• | actual or anticipated fluctuations in our quarterly or annual operating results; |
• | publication of research reports by securities analysts about us or our competitors or our industry; |
• | the public’s reaction to our press releases, our other public announcements and our filings with the Securities and Exchange Commission (the “SEC”); |
• | our failure or the failure of our competitors to meet analysts’ projections or guidance that we or our competitors may give to the market; |
• | additions and departures of key personnel; |
• | strategic decisions by us or our competitors, such as acquisitions, divestitures, spin-offs, joint ventures, strategic investments or changes in business strategy; |
• | the passage of legislation or other regulatory developments affecting us or our industry; |
• | speculation in the press or investment community; |
• | changes in accounting principles; |
• | terrorist acts, acts of war or periods of widespread civil unrest; |
• | alleged or actual occurrences of food-borne illnesses; |
• | natural disasters and other calamities; and |
• | changes in general market and economic conditions. |
In the past, securities class action litigation has often been initiated against companies following periods of volatility in their stock price. This type of litigation could result in substantial costs and divert our management’s attention and resources, and could also require us to make substantial payments to satisfy judgments or to settle litigation.
Our quarterly operating results may fluctuate significantly and could fall below the expectations of securities analysts and investors due to seasonality and other factors, some of which are beyond our control, resulting in a decline in our stock price.
Our quarterly operating results may fluctuate significantly because of several factors, including:
• | the timing of new restaurant openings and related expense; |
• | restaurant operating costs for our newly-opened restaurants; |
• | labor availability and costs for hourly and management personnel; |
• | profitability of our restaurants, especially in new markets; |
• | changes in interest rates; |
• | increases and decreases in AUVs and comparable restaurant sales growth; |
• | impairment of long-lived assets and any loss on restaurant closures; |
• | macroeconomic conditions, both nationally and locally; |
• | negative publicity relating to products we serve; |
• | changes in consumer preferences and competitive conditions; |
• | expansion to new markets; |
• | increases in infrastructure costs; and |
• | fluctuations in commodity prices. |
Seasonal factors, weather patterns and the timing of holidays cause our revenue to fluctuate from quarter to quarter. Our revenue per restaurant is typically slightly lower in the first quarter. Adverse weather conditions may also affect customer
28
traffic. In addition, we have outdoor seating at most of our restaurants, and the effects of adverse weather may impact the use of these areas and may negatively impact our revenue.
The future issuance of additional common stock in connection with our incentive plan will dilute your stockholdings.
There are 3,300,000 shares of common stock reserved and authorized for issuance under our incentive plans. As of December 29, 2015, we had an aggregate of 2,129,506 shares of common stock available for grant for incentive plan issuance. We may issue all of these shares of common stock without any action or approval by our stockholders, subject to certain exceptions. Any common stock issued in connection with our incentive plan, the exercise of outstanding stock options, or otherwise would dilute the percentage ownership held by all other stockholders.
If securities or industry analysts do not publish research or reports about our business, or publish inaccurate or unfavorable research or reports about our business, our stock price and trading volume could decline.
The trading market for our common stock will, to some extent, depend on the research and reports that securities or industry analysts publish about us and our business. We do not have any control over these analysts. If one or more of the analysts who cover us downgrade our common stock or change their opinion of our common stock, our stock price would likely decline. If one or more of these analysts cease to cover us or fail to regularly publish reports on us, we could lose visibility in the financial markets, which could cause our stock price or trading volume to decline.
The small public float for our shares may make it difficult to sell your shares and if we or our existing investors sell additional shares of our common stock, the market price of our common stock could decline.
The market price of our common stock could decline as a result of sales of a large number of shares of common stock in the market, or the perception that such sales could occur. These sales, or the possibility that these sales may occur, also might make it more difficult for us to sell equity securities in the future at a time and at a price that we deem appropriate. The Company currently has in effect a resale shelf registration statement under which of 25,065,345 shares of common stock held by executive officers, directors and their related entities, and stockholders who received shares in the Business Combination may be sold. The shelf registration statement also includes the registration of 7,500,000 shares of our common stock that are issuable upon the exercise of warrants at an exercise price of $11.50 per share. As a result of the shelf registration statement, large amounts of our stock may be sold in the open market or in privately negotiated transactions, which could have the effect of increasing the volatility in our stock price or putting significant downward pressure on the price of our common stock. Of the shares registered under the resale shelf registration statement, 3,750,000 shares are “Founder Shares,” which are shares subject to restrictions on transfer until earlier of (i) June 30, 2016, (ii) the date the last sale price of the our common stock equals or exceeds $12.00 per share (as adjusted for stock splits, stock dividends, reorganizations and recapitalizations) for any 20 trading days within any 30-day trading day period commencing on or after November 27, 2015 or (iii) the date we consummate a liquidation, merger, stock exchange or other similar transaction which results in all of our stockholders having the right to exchange their shares of common stock for cash, securities or other property. When the Founder Shares’ transfer restrictions are released, a substantial amount of our shares of common stock will be eligible for sale in the open market. Sales of substantial amounts of our common stock in the public market, or the perception that such sales will occur, could materially adversely affect the market price of our common stock and make it difficult for us to raise funds through securities offerings in the future.
The Levy Family has significant influence over our company, and its control could delay or deter a change of control or other business combination or otherwise cause us to take actions with which you may disagree.
As of December 29, 2015, two of our directors, Ari Levy and Larry Levy, and their affiliates (collectively, the “Levy Family”), collectively beneficially owned 22.5% of our common stock (which includes common stock exercisable upon the issuance of warrants). As a result, the Levy Family has significant control and influence over the outcome of matters requiring a stockholder vote, including the election of directors and the approval of significant corporate matters, and their interests may not align with the interest of other stockholders. This concentration of voting power could have the effect of the Company taking actions with which you disagree and delaying, deterring or preventing a change of control or other business combination that might otherwise be beneficial to our stockholders.
We will incur significant increased expenses and administrative burdens as a public company, which could have a material adverse effect on our business, financial condition and results of operations.
We will face increased legal, accounting, administrative and other costs and expenses as a new public company that we did not incur as a private company. The Sarbanes-Oxley Act, including the requirements of Section 404, as well as rules and
29
regulations subsequently implemented by the SEC, the Dodd-Frank Wall Street Reform and Consumer Protection Act and the rules and regulations promulgated and to be promulgated thereunder, the Public Company Accounting Oversight Board and NASDAQ, impose additional reporting and other obligations on public companies. Compliance with public company requirements has increased our costs and made some activities more time-consuming. A number of those requirements have required us to carry out activities we have not done previously. For example, we have created new board committees and adopted new internal controls and disclosure controls and procedures. In addition, we have incurred and will continue to incur additional expenses associated with our SEC reporting requirements. Furthermore, if we identify any issues in complying with those requirements (for example, if we or our auditors identify a material weakness or significant deficiency in our internal control over financial reporting), we could incur additional costs rectifying those issues, and the existence of those issues could adversely affect us, our reputation or investor perceptions of us. It is also more expensive to obtain director and officer liability insurance. Risks associated with our status as a public company may make it more difficult for us to attract and retain qualified persons to serve on our board of directors or as executive officers. The additional reporting and other obligations imposed on us by these rules and regulations have and will continue to increase our legal and financial compliance costs. The annual estimated incremental cost of our related legal, accounting and administrative activities as a public company is approximately $2.3 million per year. These increased costs will require us to divert a significant amount of time and money that we could otherwise use to expand our business and achieve our strategic objectives. Advocacy efforts by stockholders and third parties may also prompt additional changes in governance and reporting requirements, which could further increase our costs.
Because we have no current plans to pay cash dividends on our common stock for the foreseeable future, you may not receive any return on investment unless you sell your common stock for a price greater than that which you paid for it.
We may retain future earnings, if any, for future operations, expansion and debt repayment and have no current plans to pay any cash dividends for the foreseeable future. Any decision to declare and pay dividends as a public company in the future will be made at the discretion of our board of directors and will depend on, among other things, our results of operations, financial condition, cash requirements, contractual restrictions and other factors that our board of directors may deem relevant. In addition, our ability to pay dividends may be limited by covenants of any existing and future outstanding indebtedness we or our subsidiaries incur, including our credit facility. As a result, you may not receive any return on an investment in our common stock unless you sell our common stock for a price greater than that which you paid for it.
The JOBS Act permits “emerging growth companies” like us to take advantage of certain exemptions from various reporting requirements applicable to other public companies that are not emerging growth companies.
We qualify as an “emerging growth company” as defined in Section 2(a)(19) of the Securities Act, as modified by the JOBS Act. As such, we are eligible for and intend to take advantage of certain exemptions from various reporting requirements applicable to other public companies that are not emerging growth companies for as long as we continue to be an emerging growth company, including (i) the exemption from the auditor attestation requirements with respect to internal control over financial reporting under Section 404 of the Sarbanes-Oxley Act, (ii) the exemptions from say-on-pay, say-on-frequency and say-on-golden parachute voting requirements and (iii) reduced disclosure obligations regarding executive compensation in our periodic reports and proxy statements. We will remain an emerging growth company until the earliest of (i) the last day of the fiscal year in which the market value of our common stock that is held by non-affiliates exceeds $700 million as of the second quarter of that fiscal year, (ii) the last day of the fiscal year in which we had total annual gross revenue of $1 billion or more during such fiscal year (as indexed for inflation), (iii) the date on which we have issued more than $1 billion in non-convertible debt in the prior three-year period or (iv) the last day of the fiscal year following the fifth anniversary of the date of the first sale of our common stock in our initial public offering.
In addition, Section 107 of the JOBS Act also provides that an emerging growth company can take advantage of the exemption from complying with new or revised accounting standards provided in Section 7(a)(2)(B) of the Securities Act as long as we are an emerging growth company. An emerging growth company can therefore delay the adoption of certain accounting standards until those standards would otherwise apply to private companies.
We cannot predict if investors will find our common stock less attractive because we will rely on these exemptions. If some investors find our common stock less attractive as a result, there may be a less active trading market for our common stock and our stock price may be more volatile.
Failure to establish and maintain effective internal controls in accordance with Section 404 of the Sarbanes-Oxley Act could have a material adverse effect on our business and stock price.
We are not currently required to comply with the rules of the SEC implementing Section 404 of the Sarbanes-Oxley Act and therefore are not required to make a formal assessment of the effectiveness of our internal control over financial reporting for
30
that purpose. As a publicly traded company, we are required to comply with the SEC’s rules implementing Section 302 and 404 of the Sarbanes-Oxley Act, which require management to certify financial and other information in our quarterly and annual reports and provide an annual management report on the effectiveness of controls over financial reporting. Pursuant to the JOBS Act, our independent registered public accounting firm will not be required to attest to the effectiveness of our internal control over financial reporting until the later of the year following our first annual report required to be filed with the SEC or the date we are no longer an emerging growth company, which may be up to five full fiscal years following LAC’s initial public offering.
To comply with the requirements of being a public company, we may need to undertake various actions, such as implementing new internal controls and procedures and hiring additional accounting or internal audit staff. In addition, we may identify material weaknesses in our internal control over financial reporting that we may not be able to remediate in time to meet the applicable deadline imposed upon us for compliance with the requirements of Section 404.
If we identify weaknesses in our internal control over financial reporting, are unable to comply with the requirements of Section 404 in a timely manner or assert that our internal control over financial reporting is effective, or if our independent registered public accounting firm is unable to express an opinion as to the effectiveness of our internal control over financial reporting, investors may lose confidence in the accuracy and completeness of our financial reports and the market price of our common stock could be negatively affected, and we could become subject to investigations by NASDAQ (the exchange on which our securities are listed), the SEC or other regulatory authorities, which could require additional financial and management resources.
Anti-takeover provisions contained in our certificate of incorporation and bylaws, as well as provisions of Delaware law, could impair a takeover attempt.
Our certificate of incorporation and bylaws contain provisions that could have the effect of delaying or preventing changes in control or changes in our management without the consent of our board of directors. These provisions include:
• | a classified board of directors with three-year staggered terms, which may delay the ability of stockholders to change the membership of a majority of our board of directors; |
• | no cumulative voting in the election of directors, which limits the ability of minority stockholders to elect director candidates; |
• | the exclusive right of our board of directors to elect a director to fill a vacancy created by the expansion of the board of directors or the resignation, death, or removal of a director, which prevents stockholders from being able to fill vacancies on our board of directors; |
• | the ability of our board of directors to determine whether to issue shares of preferred stock and to determine the price and other terms of those shares, including preferences and voting rights, without stockholder approval, which could be used to significantly dilute the ownership of a hostile acquirer; |
• | a prohibition on stockholder action by written consent, which forces stockholder action to be taken at a special meeting of our stockholders; |
• | the requirement that an annual meeting of stockholders may be called only by the chairman of the board of directors, the chief executive officer, or the board of directors, which may delay the ability of our stockholders to force consideration of a proposal or to take action, including the removal of directors; |
• | limiting the liability of, and providing indemnification to, our directors and officers; |
• | controlling the procedures for the conduct and scheduling of stockholder meetings; |
• | providing that directors may be removed prior to the expiration of their terms by stockholders only for cause; and |
• | advance notice procedures that stockholders must comply with in order to nominate candidates to our board of directors or to propose matters to be acted upon at a stockholders’ meeting, which may discourage or deter a potential acquirer from conducting a solicitation of proxies to elect the acquirer’s own slate of directors or otherwise attempting to obtain control of our board of directors. |
These provisions, alone or together, could delay hostile takeovers and changes in control of the Company or changes in our management.
31
As a Delaware corporation, we are also subject to provisions of Delaware law, including Section 203 of the DGCL, which prevents some stockholders holding more than 15% of our outstanding common stock from engaging in certain business combinations without approval of the holders of substantially all of our outstanding common stock. Any provision of our certificate of incorporation or bylaws or Delaware law that has the effect of delaying or deterring a change in control could limit the opportunity for our stockholders to receive a premium for their shares of our common stock, and could also affect the price that some investors are willing to pay for our common stock.
32
ITEM 1B. Unresolved Staff Comments
None.
ITEM 2. Properties
Our restaurants are primarily free-standing or, to a lesser extent, end-cap facilities. Ninety-nine percent of restaurants feature a drive-thru. As of December 29, 2015, for all but one of the company-operated restaurants, we lease the land on which our restaurants are built. Leases generally have initial terms of 20 years, with two or four renewal terms of five years each. Most restaurant leases provide for a specified annual rent, although some call for additional or contingent rent. Generally, leases are “net leases” that require the restaurant to pay a pro rata share of property taxes, insurance and common area maintenance costs. As of December 29, 2015, we own one property and currently operate the restaurant on this property. In addition, we lease 296 properties for company-operated restaurants. As of December 29, 2015, our restaurant system consisted of 544 restaurants comprised of 297 company-operated restaurants and 247 franchised restaurants located in 16 states throughout the United States, including one franchise located in Guam.
We lease our executive offices, consisting of approximately 32,000 square feet in Lake Forest, California, for a term expiring in 2026, with one option to extend the lease term for an additional five years. During the first quarter of fiscal 2016, we leased an additional 5,500 square feet at our executive offices. We believe our current office space is suitable and adequate for its intended purposes and provides opportunity for expansion. The following chart shows the number of restaurants in each of the states in which we operated as of December 29, 2015.
State | Company-Operated | Franchised | Total | ||||||
California | 245 | 123 | 368 | ||||||
Nevada | 41 | 1 | 42 | ||||||
Arizona | 3 | 33 | 36 | ||||||
Utah | — | 30 | 30 | ||||||
Colorado | — | 22 | 22 | ||||||
Oregon | — | 8 | 8 | ||||||
Idaho | — | 7 | 7 | ||||||
Georgia | 6 | 1 | 7 | ||||||
New Mexico | — | 6 | 6 | ||||||
Michigan | — | 6 | 6 | ||||||
Washington | — | 3 | 3 | ||||||
Alabama | — | 2 | 2 | ||||||
Florida | — | 2 | 2 | ||||||
Oklahoma | 2 | — | 2 | ||||||
Ohio | — | 1 | 1 | ||||||
Texas | — | 1 | 1 | ||||||
Guam | — | 1 | 1 | ||||||
Total | 297 | 247 | 544 | ||||||
ITEM 3. Legal Proceedings
We are currently involved in various claims and legal actions that arise in the ordinary course of business. Although the results of litigation and claims can never be predicted with certainty, we do not believe that the ultimate resolution of these actions will have a material adverse effect on our business, results of operations, or financial condition. Regardless of the outcome, litigation can have an adverse impact on us because of defense and settlement costs, diversion of management resources and other factors.
On April 23, 2015, a purported class action and derivative complaint, Jeffery Tomasulo, on behalf of himself and all others similarly situated v. Levy Acquisition Sponsor, LLC, Lawrence F. Levy, Howard B. Bernick, Marc S. Simon, Craig J. Duchossois, Ari B. Levy, Steven C. Florsheim, Gregory G. Flynn, Del Taco Holdings, Inc., and Levy Acquisition
33
Corp. (“Complaint”), was filed in the Circuit Court of Cook County, Illinois (the “Circuit Court”), relating to the then proposed Business Combination pursuant to the Merger Agreement. The Complaint, which purported to be brought as a class action on behalf of all of the holders of our common stock, generally alleged that the our pre-merger directors breached their fiduciary duties to stockholders by facilitating the then proposed Business Combination and in negotiating and approving the Merger Agreement. The Complaint also alleged that our preliminary proxy statement that was filed with the SEC on April 2, 2015 is materially misleading and/or incomplete. The Complaint further alleged that DTH and Levy Acquisition Sponsor LLC aided and abetted the alleged breaches by our pre-merger directors. The Complaint sought (a) a declaration that our pre-merger directors breached their fiduciary duties; (b) injunctive relief enjoining the Business Combination until corrective disclosures were made; (c) compensatory and/or rescissory damages; and (d) an award of costs and attorney’s fees.
We reached a settlement in principle of all claims asserted in the Complaint, subject to negotiation of a definitive settlement agreement and approval by the Circuit Court. The settlement in principle would resolve all causes of action asserted in the case. The settlement in principle does not provide for any monetary payment to the plaintiff or the putative plaintiff class, other than for attorneys’ fees and costs.
In July 2013, a former Del Taco employee filed a purported class action complaint alleging that Del Taco has failed to pay overtime wages and has not appropriately provided meal breaks to its California general managers. Discovery has been completed and the parties are preparing their motions for and opposition to class certification. Del Taco has several defenses to the action that it believes should prevent the certification of the class, as well as the potential assessment of any damages on a class basis. Legal proceedings are inherently unpredictable, and the Company is not able to predict the ultimate outcome or cost of the unresolved matter. However, based on management’s current understanding of the relevant facts and circumstances, the Company does not believe that these proceedings give rise to a probable or estimable loss and should not have a material adverse effect on the Company’s financial position, operations or cash flows.
In March 2014, a former Del Taco employee filed a purported class action complaint alleging that Del Taco has not appropriately provided meal breaks and failed to pay wages to its California hourly employees. Discovery is in process and Del Taco intends to assert all of its defenses to this threatened class action and the individual claims. Del Taco has several defenses to the action that it believes should prevent the certification of the class, as well as the potential assessment of any damages on a class basis. Legal proceedings are inherently unpredictable, and the Company is not able to predict the ultimate outcome or cost of the unresolved matter. However, based on management’s current understanding of the relevant facts and circumstances, the Company does not believe that these proceedings give rise to a probable or estimable loss and should not have a material adverse effect on the Company’s financial position, operations or cash flows.
ITEM 4. Mine Safety Disclosures
Not applicable.
34
PART II
ITEM 5. | Market for Registrant's Common Equity, Related Stockholder Matters and Issuer Purchases |
Our common stock and warrants are currently quoted on NASDAQ under the symbols "TACO" and "TACOW," respectively. Through April 28, 2015, our common stock, warrants and units were quoted under the symbols "LEVY," "LEVYW" and "LEVYU," respectively. Upon consummation of the Business Combination, we separated our units, which were sold in our IPO, into their component securities of one share of common stock and one-half of one warrant, and the units ceased public trading.
The following table sets forth the high and low sales prices for shares of our common stock and warrants for the quarterly periods indicated:
Common Stock (1) | Warrants (2) | |||||||||||||||
High | Low | High | Low | |||||||||||||
Fiscal 2015: | ||||||||||||||||
First Quarter | $ | 11.48 | $ | 9.69 | $ | 2.20 | $ | 0.35 | ||||||||
Second Quarter | $ | 17.25 | $ | 11.05 | $ | 6.88 | $ | 2.20 | ||||||||
Third Quarter | $ | 16.48 | $ | 12.26 | $ | 6.52 | $ | 3.42 | ||||||||
Fourth Quarter | $ | 15.18 | $ | 9.71 | $ | 5.41 | $ | 2.63 | ||||||||
Fiscal 2014: | ||||||||||||||||
First Quarter | $ | 10.49 | $ | 9.40 | $ | 5.00 | $ | 0.46 | ||||||||
Second Quarter | $ | 9.95 | $ | 9.62 | $ | 0.65 | $ | 0.46 | ||||||||
Third Quarter | $ | 9.80 | $ | 9.60 | $ | 0.55 | $ | 0.32 | ||||||||
Fourth Quarter | $ | 9.88 | $ | 9.62 | $ | 0.42 | $ | 0.35 | ||||||||
(1) Our common stock began separate trading on NASDAQ on January 8, 2014. As a result, the figures for the first quarter of 2014 are for the period from January 8, 2014 through March 25, 2014.
(2) Our warrants began separate trading on NASDAQ on January 6, 2014. As a result, the figures for the first quarter of 2014 are for the period from January 6, 2014 through March 25, 2014.
Holders
As of March 4, 2016, there were 73 holders of record of our common stock and 7 holders of record of our warrants. A substantially greater number of holders of our stock are held in “street name” and held of record by banks, brokers and other financial institutions.
Dividends
We have not paid any cash dividends on our common stock to date. The payment of cash dividends in the future will be dependent upon our revenues and earnings, if any, capital requirements and general financial condition. In addition, our board of directors is not currently contemplating and does not anticipate declaring any stock dividends in the foreseeable future. Further, if we incur any additional indebtedness, our ability to declare dividends may be limited by restrictive covenants that we may agree to in connection therewith, and our existing credit agreement currently limits our ability to pay dividends.
Recent Sales of Unregistered Securities
There were no sales of unregistered equity securities during the fourth quarter of Fiscal 2015.
In February 2016, the Board of Directors authorized a share repurchase program under which the Company may purchase up to $25.0 million in the aggregate of its common stock and warrants from time to time in open market or privately negotiated transactions. The amount and timing of purchases (if any) will depend upon a number of factors, including the price and availability of the Company's common stock and warrants and general market conditions.
35
Comparative Share Performance Graph
The following graph shows a comparison of cumulative total shareholder return, calculated on a dividend reinvested basis, for (1) the Company’s common stock, (2) the NASDAQ Composite, and (3) the S&P 600 Restaurants Index, for the period January 8, 2014 (the first day our common stock was traded following our initial public offering) through December 29, 2015. The graph assumes the value of the investment in our common stock and each index was $100.00 on January 8, 2014 and that all dividends were reinvested. We have not paid any cash dividends and, therefore, the cumulative total return calculation for us is based solely upon stock price appreciation and not upon reinvestment of cash dividends. Note that historic stock price performance is not necessarily indicative of future stock price performance.
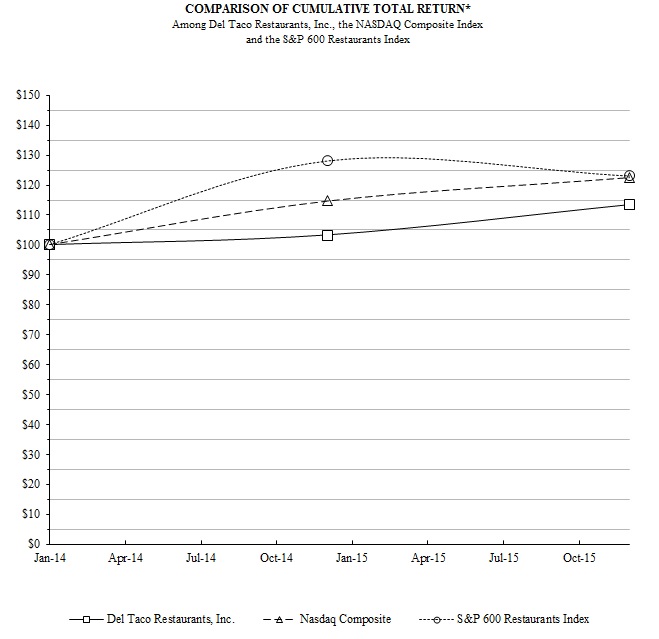
*$100 invested on January 8, 2014 in stock or index, including reinvestment of dividends
January 8, 2014 | December 30, 2014 | December 29, 2015 | ||||||||||
Del Taco Restaurants, Inc. | $ | 100.00 | $ | 103.29 | $ | 113.59 | ||||||
NASDAQ Composite | $ | 100.00 | $ | 114.69 | $ | 122.62 | ||||||
S&P 600 Restaurants Index | $ | 100.00 | $ | 128.13 | $ | 123.10 | ||||||
36
ITEM 6. Selected Financial Data
Successor (1) | Predecessor (1) | ||||||||||||||||||||
26 Weeks Ended | 26 Weeks Ended | 52 Weeks Ended (2) | |||||||||||||||||||
(Amounts in thousands) | December 29, 2015 | June 30, 2015 | December 30, 2014 | December 31, 2013 | January 1, 2013 | ||||||||||||||||
Statement of Operations Data: | |||||||||||||||||||||
Revenue: | |||||||||||||||||||||
Company restaurant sales | $ | 206,939 | $ | 200,676 | $ | 380,800 | $ | 356,306 | $ | 345,590 | |||||||||||
Franchise revenue | 7,328 | 6,693 | 12,973 | 12,515 | 12,409 | ||||||||||||||||
Franchise sublease income | 1,183 | 1,183 | 2,251 | 2,167 | 2,142 | ||||||||||||||||
Total revenue | 215,450 | 208,552 | 396,024 | 370,988 | 360,141 | ||||||||||||||||
Operating expenses: | |||||||||||||||||||||
Restaurant operating expenses: | |||||||||||||||||||||
Food and paper costs | 59,263 | 57,447 | 110,708 | 105,492 | 102,530 | ||||||||||||||||
Labor and related expenses | 61,448 | 61,120 | 116,920 | 108,788 | 109,534 | ||||||||||||||||
Occupancy and other operating expenses | 43,191 | 43,611 | 82,021 | 77,205 | 73,929 | ||||||||||||||||
General and administrative | 17,501 | 14,850 | 28,136 | 23,112 | 23,184 | ||||||||||||||||
Depreciation and amortization | 11,276 | 8,252 | 18,752 | 19,850 | 17,699 | ||||||||||||||||
Occupancy and other - franchise subleases | 1,140 | 1,109 | 2,145 | 2,073 | 2,060 | ||||||||||||||||
Pre-opening costs | 366 | 276 | 462 | 596 | 1,080 | ||||||||||||||||
Impairment of long-lived assets | — | — | 9,617 | — | — | ||||||||||||||||
Restaurant closure charges, net | 2,015 | 94 | 82 | 298 | 716 | ||||||||||||||||
Loss (gain) on disposal of assets | 3 | 99 | (151 | ) | 209 | 35 | |||||||||||||||
Total operating expenses | 196,203 | 186,858 | 368,692 | 337,623 | 330,767 | ||||||||||||||||
Income from operations | 19,247 | 21,694 | 27,332 | 33,365 | 29,374 | ||||||||||||||||
Other expense (income), net: | |||||||||||||||||||||
Interest expense | 3,652 | 11,491 | 30,895 | 35,613 | 38,291 | ||||||||||||||||
Other income | (220 | ) | — | — | — | — | |||||||||||||||
Transaction-related costs | 12,972 | 7,255 | 1,936 | — | — | ||||||||||||||||
Debt modification costs | 78 | 139 | 1,241 | 4,178 | — | ||||||||||||||||
Change in fair value of warrant liability | — | (35 | ) | 1,417 | 33 | (2,634 | ) | ||||||||||||||
Total other expense (income), net | 16,482 | 18,850 | 35,489 | 39,824 | 35,657 | ||||||||||||||||
Income (loss) from operations before provision for income taxes | 2,765 | 2,844 | (8,157 | ) | (6,459 | ) | (6,283 | ) | |||||||||||||
Provision for income taxes | 112 | 740 | 1,098 | 80 | 1,939 | ||||||||||||||||
Net income (loss) | $ | 2,653 | $ | 2,104 | $ | (9,255 | ) | $ | (6,539 | ) | $ | (8,222 | ) | ||||||||
Successor (1) | Predecessor (1) | ||||||||||||||||||||
26 Weeks Ended | 26 Weeks Ended | 52 Weeks Ended (2) | |||||||||||||||||||
(Amounts in thousands) | December 29, 2015 | June 30, 2015 | December 30, 2014 | December 31, 2013 | January 1, 2013 | ||||||||||||||||
Consolidated Statement of Cash Flows Data: | |||||||||||||||||||||
Net cash provided by operating activities | $ | 17,085 | $ | 10,083 | $ | 45,476 | $ | 41,325 | $ | 43,654 | |||||||||||
Net cash provided by (used in) investing activities | 42,566 | (15,284 | ) | (18,068 | ) | (19,997 | ) | (27,380 | ) | ||||||||||||
Net cash (used in) provided by financing activities | (49,457 | ) | 1,820 | (24,926 | ) | (19,527 | ) | (17,258 | ) | ||||||||||||
37
Successor (1) | Predecessor (1) | |||||||||||||
(Amounts in thousands) | December 29, 2015 | December 30, 2014 | December 31, 2013 | |||||||||||
Balance Sheet Data: | ||||||||||||||
Cash and cash equivalents | $ | 10,194 | $ | 8,553 | $ | 6,071 | ||||||||
Property and equipment, net (3) | 114,030 | 85,164 | 93,464 | |||||||||||
Total assets | 703,572 | 549,319 | (4) | 555,810 | (4) | |||||||||
Total debt, net (5) | 169,693 | 322,683 | (4) | 330,476 | (4) | |||||||||
Total shareholders' equity | 368,377 | 81,404 | 89,898 | |||||||||||
Successor (1) | Predecessor (1) | ||||||||||||||||||||
26 Weeks Ended | 26 Weeks Ended | 52 Weeks Ended (2) | |||||||||||||||||||
(Amounts in thousands) | December 29, 2015 | June 30, 2015 | December 30, 2014 | December 31, 2013 | January 1, 2013 | ||||||||||||||||
Other Operating Data (unaudited): | |||||||||||||||||||||
Restaurant Contribution (6) | $ | 43,037 | $ | 38,498 | $ | 71,151 | $ | 64,821 | $ | 59,597 | |||||||||||
As a % of Company Restaurants Sales | 20.8 | % | 19.2 | % | 18.7 | % | 18.2 | % | 17.2 | % | |||||||||||
EBITDA (7) | 17,693 | 22,584 | 41,346 | 48,626 | 49,090 | ||||||||||||||||
As a % of Total Revenue | 8.2 | % | 10.8 | % | 10.4 | % | 13.1 | % | 13.6 | % | |||||||||||
Adjusted EBITDA (7) | 34,041 | 30,947 | 58,848 | 55,608 | 51,991 | ||||||||||||||||
As a % of Total Revenue | 15.8 | % | 14.8 | % | 14.9 | % | 15.0 | % | 14.4 | % | |||||||||||
_________________________________________________________
(1) As a result of the Business Combination, we are the acquirer for accounting purposes, and DTH is the acquiree and accounting predecessor. Our financial statement presentation distinguishes a “Predecessor” for DTH for periods prior to the Closing Date. We were subsequently re-named as Del Taco Restaurants, Inc. and are the “Successor” for periods after the Closing Date, which includes consolidation of DTH subsequent to the Business Combination on June 30, 2015.
(2) | We use a 52- or 53-week fiscal year ending on the Tuesday closest to December 31. Fiscal year 2015, fiscal year 2014, fiscal year 2013 and fiscal year 2012 ended on December 29, 2015, December 30, 2014, December 31, 2013 and January 1, 2013, respectively. In a 52-week fiscal year, the first, second and third quarters each include 12 weeks of operations and the fourth quarter includes 16 weeks of operations; in a 53-week fiscal year, the first, second and third quarters each include 12 weeks of operations and the fourth quarter includes 17 weeks of operations. Approximately every six or seven years a 53-week fiscal year occurs. Fiscal year 2015, fiscal year 2014, fiscal year 2013 and fiscal year 2012 were 52-week fiscal years. |
(3) | Property and equipment, net consists of land, buildings, restaurant and other equipment, leasehold improvements, buildings under capital leases and construction-in-progress, net of accumulated depreciation and amortization. |
(4) | Deferred financing costs of $0.7 million and $0.9 million at December 30, 2014 and December 31, 2013, respectively, were reclassed from other assets to debt to conform to current year presentation. |
(5) | Total debt, net as of December 29, 2015, consists of borrowings under our revolving credit facility, as well as capital lease obligations and deemed landlord financing liabilities. Total debt as of December 30, 2014, December 31, 2013 and January 1, 2013, consists of borrowings under DTH's senior credit facility and subordinated notes, as well as capital lease obligations and deemed landlord financing liabilities. The December 30, 2014 outstanding balance of the subordinated notes of $111.2 million was paid in full on March 20, 2015. We refinanced our senior credit facility in August 2015. Refer to Note 7 in the notes to the consolidated financial statements for additional information. |
(6) | Restaurant contribution is neither required by, nor presented in accordance with, United States generally accepted accounting principles ("U.S. GAAP"), and is defined as company restaurants sales less restaurant operating expenses. Restaurant contribution is a supplemental measure of operating performance of our restaurants and the calculation thereof may not be comparable to that reported by other companies. |
Restaurant contribution has limitations as an analytical tool, and you should not consider it in isolation or as a substitute for analysis of our results as reported under U.S. GAAP. Management believes that restaurant contribution is an important
38
tool for investors because it is a widely-used metric within the restaurant industry to evaluate restaurant-level productivity, efficiency and performance. Management uses restaurant contribution as a key metric to evaluate the profitability of incremental sales at our restaurants, to evaluate restaurant performance across periods and to evaluate restaurant financial performance compared with competitors. See the Item 7. “Management’s Discussion and Analysis of Financial Condition and Results of Operations” included elsewhere in this annual report on Form 10-K for a discussion of restaurant contribution and other key performance indicators.
A reconciliation of restaurant contribution to company restaurant sales is provided below:
Successor | Predecessor | ||||||||||||||||||||
26 Weeks Ended | 26 Weeks Ended | 52 Weeks Ended | |||||||||||||||||||
(Amounts in thousands) | December 29, 2015 | June 30, 2015 | December 30, 2014 | December 31, 2013 | January 1, 2013 | ||||||||||||||||
Company restaurant sales | $ | 206,939 | $ | 200,676 | $ | 380,800 | $ | 356,306 | $ | 345,590 | |||||||||||
Restaurant operating expenses | 163,902 | 162,178 | 309,649 | 291,485 | 285,993 | ||||||||||||||||
Restaurant contribution | $ | 43,037 | $ | 38,498 | $ | 71,151 | $ | 64,821 | $ | 59,597 | |||||||||||
(7) | EBITDA and Adjusted EBITDA are neither required by, nor presented in accordance with GAAP, and are included in this annual report because they are key metrics used by management and our board of directors to assess financial performance. EBITDA and Adjusted EBITDA are frequently used by analysts, lenders and other interested parties to evaluate companies in our industry. |
EBITDA and Adjusted EBITDA are not U.S. GAAP measures of financial performance or liquidity and should not be considered as alternatives to net income (loss) as a measure of financial performance or cash flows from operations as measures of liquidity, or any other performance measure derived in accordance with U.S. GAAP. Adjusted EBITDA should not be construed as an inference that future results will be unaffected by unusual or non-recurring items. Additionally, EBITDA and Adjusted EBITDA are not intended to be measures of free cash flow for management’s discretionary use, as they do not reflect tax payments, debt service requirements, capital expenditures, company restaurant openings and certain other cash costs that may recur in the future, including, among other things, cash requirements for working capital needs and cash costs to replace assets being depreciated and amortized. Management compensates for these limitations by relying on U.S. GAAP results in addition to using EBITDA and Adjusted EBITDA supplementally. Our measures of EBITDA and Adjusted EBITDA are not necessarily comparable to similarly titled captions of other companies due to different methods of calculation.
A reconciliation of net income (loss) to EBITDA and Adjusted EBITDA is set forth below:
39
Successor | Predecessor | ||||||||||||||||||||
26 Weeks Ended | 26 Weeks Ended | 52 Weeks Ended | |||||||||||||||||||
December 29, 2015 | June 30, 2015 | December 30, 2014 | December 31, 2013 | January 1, 2013 | |||||||||||||||||
Net income (loss) | $ | 2,653 | $ | 2,104 | $ | (9,255 | ) | $ | (6,539 | ) | $ | (8,222 | ) | ||||||||
Non-GAAP adjustments: | |||||||||||||||||||||
Provision for income taxes | 112 | 740 | 1,098 | 80 | 1,939 | ||||||||||||||||
Interest expense | 3,652 | 11,491 | 30,895 | 35,613 | 38,291 | ||||||||||||||||
Depreciation and amortization | 11,276 | 8,249 | 18,608 | 19,472 | 17,082 | ||||||||||||||||
EBITDA | 17,693 | 22,584 | 41,346 | 48,626 | 49,090 | ||||||||||||||||
Stock-based compensation expense (a) | 1,498 | 532 | 954 | 1,290 | 3,087 | ||||||||||||||||
Loss (gain) on disposal of assets (b) | 3 | 99 | (151 | ) | 209 | 35 | |||||||||||||||
Impairment of long-lived assets (c) | — | — | 9,617 | — | — | ||||||||||||||||
Restaurant closure charges, net (d) | 2,015 | 94 | 82 | 298 | 716 | ||||||||||||||||
Amortization of favorable and unfavorable lease assets and liabilities, net (e) | (364 | ) | 3 | 144 | 378 | 617 | |||||||||||||||
Debt modification costs (f) | 78 | 139 | 1,241 | 4,178 | — | ||||||||||||||||
Transaction-related costs (g) | 12,972 | 7,255 | 1,936 | — | — | ||||||||||||||||
Change in fair value of warrant liability (h) | — | (35 | ) | 1,417 | 33 | (2,634 | ) | ||||||||||||||
Pre-opening costs (i) | 366 | 276 | 462 | 596 | 1,080 | ||||||||||||||||
Insurance reserves adjustment (j) | — | — | 1,800 | — | — | ||||||||||||||||
Other income (k) | (220 | ) | — | — | — | — | |||||||||||||||
Adjusted EBITDA | $ | 34,041 | $ | 30,947 | $ | 58,848 | $ | 55,608 | $ | 51,991 | |||||||||||
(a) | Includes non-cash, stock-based compensation. |
(b) | Loss (gain) on disposal of assets includes the loss or gain on disposal of assets related to retirements and replacement or write-off of leasehold improvements or equipment. |
(c) | Includes costs related to impairment of long-lived assets. |
(d) | Includes costs related to future obligations associated with the closure or net sublease shortfall of restaurants, including in Fiscal 2015, the closure of 12 restaurants. |
(e) | Includes amortization of favorable lease assets and unfavorable lease liabilities. |
(f) | Includes costs associated with debt refinancing transactions in April 2013, April 2014, March 2015 and August 2015. |
(g) | Includes costs related to the strategic sale process which commenced during 2014 and resulted in the Stock Purchase Agreement with the Levy Newco Parties and the Business Combination consummated pursuant to the Merger Agreement as well as the costs related to the secondary offering of common stock completed in October 2015. |
(h) | Relates to fair value adjustments to the warrants to purchase shares of common stock of DTH that had been issued to certain of DTH’s equity shareholders, all of which were exchanged for shares of common stock of DTH on March 20, 2015. |
(i) | Pre-opening costs consist of costs directly associated with the opening of new restaurants and incurred prior to opening, including restaurant labor, supplies, rent expense and other related pre-opening costs. These are generally incurred over the three to five months prior to opening. |
(j) | Includes a $1.8 million increase in fiscal 2014 in workers’ compensation expense due to higher payments and reserves related to underlying claims activity. |
(k) | Includes a gain of $0.2 million based on the amount of the liquidating distribution received in excess of our investment in four public partnerships. See Note 2, Basis of Presentation and Summary of Significant Accounting Policies, in the notes to the consolidated financial statements included elsewhere in this annual report on Form 10-K. |
40
ITEM 7. | Management's Discussion and Analysis of Financial Condition and Results of Operations |
The following discussion and analysis should be read in conjunction with the consolidated financial statements and related notes thereto included elsewhere in this Annual Report on Form 10-K. In addition to historical information, this discussion contains forward-looking statements that involve risks, uncertainties and assumptions that could cause actual results to differ materially from Del Taco management’s expectations. Factors that could cause such differences are discussed in “Cautionary Note Regarding Forward-Looking Statements” and Item 1A. Risk Factors included in this Annual Report on Form 10-K. We assume no obligation to update any of these forward-looking statements.
As a result of the Business Combination (as defined below in "Current Year Events"), we are the acquirer for accounting purposes, and Del Taco Holdings, Inc. ("DTH") is the acquiree and accounting predecessor. Our financial statement presentation distinguishes a "Predecessor" for DTH for periods prior to the Closing Date. We are the "Successor" for periods after the Closing Date, which includes consolidation of DTH subsequent to the Business Combination on June 30, 2015. The application of acquisition accounting for the Business Combination significantly affected certain assets, liabilities and expenses. As a result, financial information as of December 29, 2015 and for the fifty-two weeks ended December 29, 2015 may not be comparable to Del Taco’s Predecessor financial information for the fifty-two weeks ended December 30, 2014. Therefore, we did not combine certain financial information for the twenty-six weeks ended December 29, 2015 with Del Taco’s Predecessor financial information for the twenty-six weeks ended June 30, 2015 for comparison to prior periods. We have combined our same store sales, company restaurant sales, franchise revenue, franchise sublease income, food and paper costs, labor and related expenses, general and administrative expenses, occupancy and other – franchise subleases, pre-opening costs, impairment of long-lived assets, restaurant closure charges and loss on disposal of assets for the twenty-six weeks ended December 29, 2015 with Del Taco’s Predecessor same store sales, company restaurant sales, franchise revenue, franchise sublease income, food and paper costs, labor and related expenses, general and administrative expenses, occupancy and other – franchise subleases, pre-opening costs, impairment of long-lived assets, restaurant closure charges and loss on disposal of assets for the twenty-six weeks ended June 30, 2015. Same store sales, company restaurant sales, franchise revenue, franchise sublease income, food and paper costs, labor and related expenses, general and administrative expenses, occupancy and other – franchise subleases, pre-opening costs, restaurant closure and loss on disposal of assets were not affected by acquisition accounting. Refer to Notes 2 and 3 to the consolidated financial statements included elsewhere in this annual report on Form 10-K for additional information on the acquisition accounting for the Business Combination.
Fiscal Year
We operate on a 52- or 53-week fiscal year ending on the Tuesday closest to December 31 for financial reporting purposes. Fiscal year 2015 is the 52-week period ended December 29, 2015 ("Fiscal 2015"). Fiscal year 2014 is the 52-week period ended December 30, 2014 ("Fiscal 2014"). Fiscal year 2013 is the 52-week period ended December 31, 2013 ("Fiscal 2013"). For fiscal year 2015, the Company’s financial statements reflect the twenty-six weeks ended December 29, 2015 (Successor) and twenty-six weeks ended June 30, 2015 (Predecessor), and for fiscal years 2014 and 2013, the Company’s financial statements reflect the fifty-two weeks ended December 30, 2014 (Predecessor) and December 31, 2013 (Predecessor).
Overview
We are a nationwide operator and franchisor of restaurants featuring fresh and fast cuisine, including both Mexican inspired and American classic dishes. We have 544 Del Taco restaurants, a majority of these in the Pacific Southwest. In each of our restaurants, our food is made to order in working kitchens. We serve our customers fresh and high-quality food typical of fast casual restaurants but with the speed, convenience and value associated with traditional quick service restaurants (“QSRs”). With attributes of both a fast casual restaurant and a QSR — a combination we call QSR+ — we occupy a place in the restaurant market distinct from our competitors. With a menu designed to appeal to a wide variety of budgets and tastes and recently updated interior and exterior designs across most of our entire system, we believe that we are poised for growth, operating within the fastest growing segment of the restaurant industry, the limited service restaurant (“LSR”) segment. With an average system check of $6.79 during Fiscal 2015, we offer a compelling value proposition relative to both QSR and fast casual peers.
Highlights and Trends
Same Store Sales
Same store sales growth reflects the change in year-over-year sales for the same store base. We include a restaurant in the same store base in the accounting period following its 18th full month of operations and exclude restaurant closures. For the fifty-two
41
weeks ended December 29, 2015, December 30, 2014 and December 31, 2013, system-wide same store sales increased 6.3%, 5.2% and 1.1%, respectively. Same store sales at company-operated restaurants increased 6.4%, 5.3% and 1.8% for the fifty-two weeks ended December 29, 2015, December 30, 2014 and December 31, 2013, respectively. The increase in company-operated same store sales in the fifty-two weeks ended December 29, 2015 was driven by an increase in average check size of 4.8% and an increase in traffic of 1.6% compared to the fifty-two weeks ended December 30, 2014. The increase in company-operated same store sales in the fifty-two weeks ended December 30, 2014 was driven by an increase in average check size of 3.1% and an increase in traffic of 2.2% compared to the fifty-two weeks ended December 31, 2013. Same store sales at franchised restaurants increased 6.2%, 5.2% and 0.2% for the fifty-two weeks ended December 29, 2015, December 30, 2014 and December 31, 2013, respectively.
Restaurant Development
Del Taco restaurant counts at the end of the fifty-two weeks ended December 29, 2015, December 30, 2014 and December 31, 2013 are as follows:
52 Weeks Ended | |||||||||
December 29, 2015 | December 30, 2014 | December 31, 2013 | |||||||
Company-operated restaurant activity: | |||||||||
Beginning of period | 304 | 300 | 298 | ||||||
Openings | 6 | 5 | 5 | ||||||
Closures | (13 | ) | (1 | ) | (3 | ) | |||
Restaurants at end of period | 297 | 304 | 300 | ||||||
Franchised restaurant activity: | |||||||||
Beginning of period | 243 | 247 | 253 | ||||||
Openings | 6 | 6 | 6 | ||||||
Closures | (2 | ) | (10 | ) | (12 | ) | |||
Restaurants at end of period | 247 | 243 | 247 | ||||||
Total restaurant activity: | |||||||||
Beginning of period | 547 | 547 | 551 | ||||||
Openings | 12 | 11 | 11 | ||||||
Closures | (15 | ) | (11 | ) | (15 | ) | |||
Restaurants at end of period | 544 | 547 | 547 | ||||||
Since 2012, we have focused on repositioning our brand, increasing brand awareness, re-imaging our restaurants, strengthening operational capabilities and refinancing indebtedness to build a foundation for future organic and new unit growth. New restaurant development is expected to contribute to our growth strategy. We plan to open an estimated 15 to 18 system-wide restaurants in Fiscal 2016. From time to time we and our franchisees close restaurants and we closed 12 underperforming company-operated restaurants in Fiscal 2015, as discussed in Current Year Events below.
Restaurant Re-Imaging
We and our franchisees commenced the Ambience Shake Up (ASU) re-imaging program in 2012 and, as of December 29, 2015, 91% of our system restaurants feature our current image through a re-image or new prototype design, including all 297 restaurants that are company-operated. We expect substantially all of our restaurant system to feature the current image by the end of 2016. The ASU remodeling program involved a use of cash and impacted net property and depreciation line items on the consolidated balance sheets and statements of comprehensive income (loss), among others. The cost of the ASU restaurant remodels varied depending on the scope of work required, but on average the company-operated investment was $45,000 per restaurant. We believe the ASU remodeling program is an important element of our strategy that has led to higher system restaurant sales and a strengthened brand.
Current Year Events
Concurrent with the execution of the agreement and plan of merger dated as of March 12, 2015 (the "Merger Agreement"), Levy Epic Acquisition Company, LLC (“Levy Newco”), Levy Epic Acquisition Company II, LLC (“Levy Newco II” and with
42
Levy Newco, the “Levy Newco Parties”), Del Taco Holdings, Inc. ("DTH") and the DTH stockholders entered into a stock purchase agreement (the “Stock Purchase Agreement”). Pursuant to the Stock Purchase Agreement on March 20, 2015, Levy Newco Parties purchased 2,348,968 shares of DTH common stock from DTH for $91.2 million in cash and 740,564 shares of DTH common stock directly from existing DTH shareholders for $28.8 million in cash (the “Initial Investment”). As a result of this Initial Investment, an aggregate of 3,089,532 shares of DTH common stock were purchased by the Levy Newco Parties for total cash consideration of $120.0 million. Concurrent with the completion of the Initial Investment, DTH increased its borrowing capacity under its existing term loan ("2013 Term Loan") by $25.1 million. Proceeds from the increased borrowings under the 2013 Term Loan, a $10.0 million drawdown under DTH’s $40.0 million revolving credit facility, and the $91.2 million received by DTH from the sale of DTH common stock to the Levy Newco Parties was used to repay the outstanding balance of DTH’s subordinated notes of $111.2 million and pay transaction costs. As a result of the repayment of the subordinated notes, DTH expects an annual net interest savings of over $13.0 million. The transactions described in this paragraph are hereafter collectively referred to as “Step 1.”
Also concurrent with Step 1, we entered into common stock purchase agreements pursuant to which certain investors committed to acquire 3,500,000 shares of the Company’s common stock upon the closing of the Business Combination for total consideration of $35 million. The additional funds provided by these investors were used as additional cash consideration in the Business Combination.
On June 30, 2015, we consummated our business combination with DTH pursuant to the Merger Agreement, whereby our wholly-owned subsidiary, Levy Merger Sub, LLC, merged with and into DTH, with DTH surviving the merger as a wholly-owned subsidiary of the Company (the “Business Combination”). As a result of the merger, we acquired all of the common stock of DTH. Following the completion of the merger, we changed our name to Del Taco Restaurants, Inc. and remained a public company listed on NASDAQ. See Note 3 – “Business Combination” in the notes to consolidated financial statements included elsewhere in this annual report on Form 10-K. In addition, DTH used $68.6 million of the proceeds from the merger to reduce the term loan balance outstanding under its then existing senior credit facility (“2013 Senior Credit Facility”).
On August 4, 2015, we entered into a new senior secured credit agreement, which matures August 4, 2020 and provides for a $250 million revolving borrowing capacity (the "2015 Senior Credit Facility"). We borrowed $164 million under the 2015 Senior Credit Facility to pay all of our existing indebtedness under our 2013 Senior Credit Facility and to pay related costs associated with the financing (the "August 2015 Refinance"). At the time of termination, $162.5 million of term loan borrowings were outstanding under the 2013 Senior Credit Facility along with a $17.6 million revolver capacity that was utilized to support outstanding letters of credit. We capitalized lender costs and debt issuance costs of $1.4 million and $0.5 million, respectively, in connection with the August 2015 Refinance, which will be amortized into interest expense over the term of the 2015 Senior Credit Facility.
During the year ended December 30, 2014, DTH recorded impairment of long-lived assets charges totaling $9.6 million related to 13 underperforming restaurants that generated negative restaurant contribution of approximately $1.6 million during the 52 weeks ended December 30, 2014 (Predecessor). In the second quarter of 2015, DTH commenced a plan to close 12 of the 13 underperforming restaurants and enter into subleases with third parties. The closures occurred during the fourth fiscal quarter of 2015, at which time we recorded restaurant closure charges totaling $4.5 million, offset by $2.7 million related to the reclassification of lease related liabilities, for a net charge of $1.8 million. The net charge of $1.8 million and additional charges of $0.2 million related to other prior restaurant closures or sublease income shortfalls are both included in restaurant closure charges, net on the consolidated statements of comprehensive income (loss) for the twenty-six weeks ended December 29, 2015. The charges for the 12 underperforming restaurants include (1) the present value of the future lease obligations net of estimated sublease income, (2) a lease termination payment, (3) brokerage commissions, (4) post closure rent, utilities, property tax and common area maintenance charges, (5) unused food and paper that could not be redeployed, (6) WARN act and stay bonus payments to terminated employees, and (7) other direct costs associated with the closures. See Note 4 in the notes to consolidated financial statements included elsewhere in this annual report on Form 10-K for more information.
Key Performance Indicators
In assessing the performance of our business, management utilizes a variety of financial and performance measures. These key measures include company restaurant sales, same store sales, company-operated average unit volumes, restaurant contribution and restaurant contribution margin, number of new restaurant openings, EBITDA and Adjusted EBITDA.
Company Restaurant Sales
Company restaurant sales consists of sales of food and beverages in company-operated restaurants net of promotional allowances, employee meals and other discounts. Company restaurant sales in any period is directly influenced by the number of operating weeks in such period, the number of open restaurants, same store sales and per restaurant sales.
43
Seasonal factors and the timing of holidays cause revenue to fluctuate from quarter to quarter. Revenue per restaurant is typically lower in the first quarter due to reduced January traffic. As a result of seasonality, quarterly and annual results of operations and key performance indicators such as company restaurant sales and same store sales may fluctuate.
Same Store Sales
We regularly monitor company, franchise and total system same store sales. Same store sales growth reflects the change in year-over-year sales for the comparable company, franchise and total system restaurant base. We include a restaurant in the same store base in the accounting period following its 18th full month of operations and exclude restaurant closures. As of December 29, 2015, December 30, 2014, and December 31, 2013, there were 288, 296 and 288 restaurants, respectively, in the comparable company-operated restaurant base. As of December 29, 2015, December 30, 2014, and December 31, 2013, there were 237, 235 and 238 restaurants, respectively, in the comparable franchise-operated restaurant base. This measure highlights the performance of existing restaurants as the impact of new restaurant openings is excluded. Same store sales growth can be generated by an increase in the number of transactions and/or by increases in the average check resulting from a shift in menu mix and/or higher prices resulting from new products, promotions or menu price increases.
Company-Operated Average Unit Volumes
We measure company-operated average unit volumes ("AUVs") on both a weekly and an annual basis. Weekly AUVs are calculated by dividing the sales from comparable company-operated restaurants over a seven day period from Wednesday to Tuesday by the number of comparable restaurants. Annual AUVs are calculated by dividing sales for the trailing 52-week period for all company-operated restaurants that are in the comparable base by the total number of restaurants in the comparable base for such period. This measurement allows management to assess changes in consumer traffic and spending patterns at our company-operated restaurants and the overall performance of the restaurant base.
Restaurant Contribution and Restaurant Contribution Margin
Restaurant contribution and restaurant contribution margin are neither required by, nor presented in accordance with U.S GAAP. Restaurant contribution is defined as company restaurant sales less restaurant operating expenses, which are food and paper costs, labor and related expenses and occupancy and other operating expenses. Restaurant contribution margin is defined as restaurant contribution as a percentage of company restaurant sales. Restaurant contribution and restaurant contribution margin are supplemental measures of operating performance of restaurants and the calculations thereof may not be comparable to those reported by other companies. Restaurant contribution and restaurant contribution margin have limitations as analytical tools, and you should not consider them in isolation or as substitutes for analysis of results as reported under U.S. GAAP. Management believes that restaurant contribution and restaurant contribution margin are important tools for investors because they are widely-used metrics within the restaurant industry to evaluate restaurant-level productivity, efficiency and performance. Management uses restaurant contribution and restaurant contribution margin as key performance indicators to evaluate the profitability of incremental sales at Del Taco restaurants, to evaluate restaurant performance across periods and to evaluate restaurant financial performance compared with competitors.
A reconciliation of restaurant contribution to company restaurant sales is provided below (in thousands):
Successor | Predecessor | ||||||||||||||||
26 Weeks Ended December 29, 2015 | 26 Weeks Ended June 30, 2015 | 52 Weeks Ended December 30, 2014 | 52 Weeks Ended December 31, 2013 | ||||||||||||||
Company restaurant sales | $ | 206,939 | $ | 200,676 | $ | 380,800 | $ | 356,306 | |||||||||
Restaurant operating expenses | 163,902 | 162,178 | 309,649 | 291,485 | |||||||||||||
Restaurant contribution | $ | 43,037 | $ | 38,498 | $ | 71,151 | $ | 64,821 | |||||||||
Number of New Restaurant Openings
The number of restaurant openings reflects the number of new restaurants opened by us and our franchisees during a particular reporting period. Before a new restaurant opens, we and our franchisees incur pre-opening costs, as described below. Some new restaurants open with an initial start-up period of higher than normal sales volumes, which subsequently decrease to stabilized levels. Typically new restaurants experience normal inefficiencies in the form of higher food and paper, labor and other direct operating expenses and, as a result, restaurant contribution margins are generally lower during the start-up period of operation. Typically, the average start-up period after which new company restaurant sales and restaurant operating expenses normalize is
44
approximately 26 to 52 weeks. In new markets, the length of time before average company restaurant sales and restaurant operating expenses for new restaurants stabilize is less predictable and can be longer as a result of limited knowledge of these markets and consumers’ limited awareness of our brand. When we enter new markets, we may be exposed to start-up times that are longer and restaurant contribution margins that are lower than typical historical experience, and these new restaurants may not be profitable and their sales performance may not follow historical patterns.
EBITDA and Adjusted EBITDA
EBITDA represents net income (loss) before interest expense, provision for income taxes, depreciation and amortization. Adjusted EBITDA represents net income (loss) before interest expense, provision for income taxes, depreciation, amortization and items that we do not consider representative of ongoing operating performance, as identified in the reconciliation table below.
EBITDA and Adjusted EBITDA as presented in this quarterly statement are supplemental measures of performance that are neither required by, nor presented in accordance with U.S. GAAP. EBITDA and Adjusted EBITDA are not measurements of financial performance under U.S. GAAP and should not be considered as alternatives to net income (loss), income from operations or any other performance measures derived in accordance with U.S. GAAP or as alternatives to cash flow from operating activities as a measure of liquidity. In addition, in evaluating EBITDA and Adjusted EBITDA, you should be aware that in the future we may incur expenses or charges such as those added back to calculate EBITDA and Adjusted EBITDA. Our presentation of EBITDA and Adjusted EBITDA should not be construed as an inference that future results will be unaffected by unusual or nonrecurring items.
EBITDA and Adjusted EBITDA have limitations as analytical tools, and you should not consider them in isolation, or as substitutes for analysis of results as reported under U.S. GAAP. Some of these limitations include but are not limited to:
(i) | they do not reflect cash expenditures, or future requirements for capital expenditures or contractual commitments; |
(ii) | they do not reflect changes in, or cash requirements for, working capital needs; |
(iii) | they do not reflect the significant interest expense, or the cash requirements necessary to service interest or principal payments, on debt; |
(iv) | although depreciation and amortization are non-cash charges, the assets being depreciated and amortized will often have to be replaced in the future, and EBITDA and Adjusted EBITDA do not reflect any cash requirements for such replacements; |
(v) | they do not adjust for all non-cash income or expense items that are reflected in the statements of cash flows; |
(vi) | they do not reflect the impact of earnings or charges resulting from matters we consider not to be indicative of ongoing operations; and |
(vii) | other companies in the industry may calculate these measures differently than we do, limiting their usefulness as comparative measures. |
We compensate for these limitations by providing specific information regarding the U.S. GAAP amounts excluded from such non-GAAP financial measures. We further compensate for the limitations in the use of non-GAAP financial measures by presenting comparable U.S. GAAP measures more prominently.
We believe EBITDA and Adjusted EBITDA facilitate operating performance comparisons from period to period by isolating the effects of some items that vary from period to period without any correlation to core operating performance or that vary widely among similar companies. These potential differences may be caused by variations in capital structures (affecting interest expense), tax positions (such as the impact on periods or changes in effective tax rates or net operating losses) and the age and book depreciation of facilities and equipment (affecting relative depreciation expense). We also present EBITDA and Adjusted EBITDA because (i) we believe these measures are frequently used by securities analysts, investors and other interested parties to evaluate companies in their industry, (ii) we believe investors will find these measures useful in assessing our ability to service or incur indebtedness, and (iii) it uses EBITDA and Adjusted EBITDA internally as benchmarks to compare performance to that of competitors.
The following table sets forth reconciliations of EBITDA and Adjusted EBITDA to net income (loss) (in thousands):
45
Successor | Predecessor | ||||||||||||||||
26 Weeks Ended December 29, 2015 | 26 Weeks Ended June 30, 2015 | 52 Weeks Ended December 30, 2014 | 52 Weeks Ended December 31, 2013 | ||||||||||||||
Net income (loss) | $ | 2,653 | $ | 2,104 | $ | (9,255 | ) | $ | (6,539 | ) | |||||||
Non-GAAP adjustments: | |||||||||||||||||
Provision for income taxes | 112 | 740 | 1,098 | 80 | |||||||||||||
Interest expense | 3,652 | 11,491 | 30,895 | 35,613 | |||||||||||||
Depreciation and amortization | 11,276 | 8,249 | 18,608 | 19,472 | |||||||||||||
EBITDA | 17,693 | 22,584 | 41,346 | 48,626 | |||||||||||||
Stock-based compensation expense (a) | 1,498 | 532 | 954 | 1,290 | |||||||||||||
Loss (gain) on disposal of assets (b) | 3 | 99 | (151 | ) | 209 | ||||||||||||
Impairment of long-lived assets (c) | — | — | 9,617 | — | |||||||||||||
Restaurant closure charges, net (d) | 2,015 | 94 | 82 | 298 | |||||||||||||
Amortization of favorable and unfavorable lease assets and liabilities, net (e) | (364 | ) | 3 | 144 | 378 | ||||||||||||
Debt modification costs (f) | 78 | 139 | 1,241 | 4,178 | |||||||||||||
Transaction-related costs (g) | 12,972 | 7,255 | 1,936 | — | |||||||||||||
Change in fair value of warrant liability (h) | — | (35 | ) | 1,417 | 33 | ||||||||||||
Pre-opening costs (i) | 366 | 276 | 462 | 596 | |||||||||||||
Insurance reserves adjustment (j) | — | — | 1,800 | — | |||||||||||||
Other income (k) | (220 | ) | — | — | — | ||||||||||||
Adjusted EBITDA | $ | 34,041 | $ | 30,947 | $ | 58,848 | $ | 55,608 | |||||||||
(a) | Includes non-cash, stock-based compensation. |
(b) | Loss (gain) on disposal of assets includes the loss or gain on disposal of assets related to retirements and replacement or write-off of leasehold improvements or equipment. |
(c) | Includes costs related to impairment of long-lived assets. |
(d) | Includes costs related to future obligations associated with the closure or net sublease shortfall of restaurants, including in Fiscal 2015, the closure of 12 restaurants. |
(e) | Includes amortization of favorable lease assets and unfavorable lease liabilities. |
(f) | Includes costs associated with debt refinancing transactions in April 2014, March 2015 and August 2015. |
(g) | Includes costs related to the strategic sale process which commenced during 2014 and resulted in the Stock Purchase Agreement with the Levy Newco Parties and the Business Combination consummated pursuant to the Merger Agreement as well as the costs related to the secondary offering of common stock completed in October 2015. |
(h) | Relates to fair value adjustments to the warrants to purchase shares of common stock of DTH that had been issued to certain of DTH’s equity shareholders, all of which were exchanged for shares of common stock of DTH on March 20, 2015. |
(i) | Pre-opening costs consist of costs directly associated with the opening of new restaurants and incurred prior to opening, including restaurant labor, supplies, rent expense and other related pre-opening costs. These are generally incurred over the three to five months prior to opening. |
(j) | Includes a $1.8 million increase in fiscal 2014 in workers’ compensation expense due to higher payments and reserves related to underlying claims activity. |
(k) | We recorded a gain of $0.2 million based on the amount of the liquidating distribution received in excess of our investment in four public partnerships. See Note 2, Basis of Presentation and Summary of Significant Accounting Policies, in the notes to the consolidated financial statements included elsewhere in this annual report on Form 10-K for more information. |
Key Financial Definitions
Company Restaurant Sales
Company restaurant sales represents sale of food and beverages in company-operated restaurants, net of promotional allowances, employee meals and other discounts. Company restaurant sales in any period is directly influenced by the number of operating weeks in such period, the number of open restaurants, same store sales performance and per restaurant sales.
46
Franchise Revenue
Franchise revenue consists of franchise royalty income from the franchisee and, to a lesser extent, renewal fees and franchise fees from franchise owners for new franchise restaurant openings. Franchise fees are recognized when all material obligations have been performed and conditions have been satisfied, typically when operations of a new franchise restaurant have commenced. The fees we collect upon signing a franchise agreement are deferred until operations have commenced.
Franchise Sublease Income
Franchise sublease income consists of rental income received from franchisees related to properties where we have subleased a leasehold interest to the franchisee but remain primarily liable to the landlord.
Food and Paper Costs
Food and paper costs include the direct costs associated with food, beverage and packaging of menu items. The components of food and paper costs are variable in nature, change with sales volume and are impacted by menu mix and are subject to increases or decreases based on fluctuations in commodity costs. Other important factors causing fluctuations in food and paper costs include seasonality, promotional activity and restaurant level management of food and paper waste. Food and paper are a significant expense and can be expected to grow proportionally as company restaurant sales grows.
Labor and Related Expenses
Labor and related expenses include all restaurant-level management and hourly labor costs, including wages, benefits, bonuses, workers’ compensation expense, group health insurance, paid leave and payroll taxes. Like other expense items, we expect labor and related expenses to grow proportionately as company restaurant sales grows. Factors that influence fluctuations in labor and related expenses include minimum wage, paid sick leave and payroll tax legislation, health care costs and the performance of Del Taco restaurants.
Occupancy and Other Operating Expenses
Occupancy and other operating expenses include all other restaurant-level operating expenses, such as rent, utilities, restaurant supplies, repairs and maintenance, credit and debit card processing fees, advertising, insurance, common area maintenance, real estate taxes and other restaurant operating costs.
General and Administrative Expenses
General and administrative expenses are comprised of expenses associated with corporate and regional supervision functions that support the operations of existing restaurants and development of new restaurants, including compensation and benefits, travel expenses, stock-based compensation expenses, legal and professional fees, information systems, corporate office occupancy costs and other related corporate costs. Also included are expenses above the restaurant level, including salaries for field management, such as area and regional managers, and franchise operational support. General and administrative expenses are expected to grow as we grow, including incremental legal, accounting, insurance, investor relations and other expenses that will be incurred as a public company.
Depreciation and Amortization
Depreciation and amortization expenses are periodic non-cash charges that consist of depreciation of fixed assets, including leasehold improvements and equipment, and amortization of various intangible assets primarily including franchise rights.
Occupancy and Other – Franchise Subleases
Occupancy and other – franchise subleases includes rent and property taxes paid on properties subleased to franchisees where we remain primarily liable to the landlord.
Pre-opening Costs
Pre-opening costs are incurred in connection with opening of new restaurants and incurred prior to opening, including restaurant labor related to the hiring and training of restaurant employees, as well as supplies, occupancy and other operating expenses associated with the opening of new restaurants. Pre-opening costs are expensed as incurred.
47
Impairment of Long-Lived Assets
We review long-lived assets such as leasehold improvements, equipment and intangibles on a unit-by unit basis for impairment whenever events or circumstances indicate the value of the assets may not be recoverable and records an impairment charge when appropriate.
Restaurant Closure Charges, Net
Restaurant closure charges, net, consists primarily of the future obligations associated with the closure or net sublease shortfall of a restaurant, including the present value of future lease obligations net of estimated sublease income, if any, accretion of the liability during the reporting period and any positive or negative adjustments to the liability as more information becomes available as well as direct costs related to the restaurant closure.
Loss (Gain) on Disposal of Assets
Loss (gain) on disposal of assets includes the loss or gain on disposal of assets related to retirements and replacement or write-off of leasehold improvements, furniture, fixtures or equipment in the ordinary course of business, net of the amortization of gains on asset sales associated with sale-leaseback transactions that do not qualify for sale-leaseback accounting treatment and gains from disposal of assets related to eminent domain.
Interest Expense
Interest expense consists primarily of interest expense on outstanding debt. Deferred financing costs and debt discount are amortized at cost over the life of the related debt.
Other income
Other income consists of a gain based on the amount of the liquidating distribution received in excess of our investment in four public partnerships where we served as a general partner with a 1% ownership interest, following the dissolution of these partnerships in December 2015.
Transaction-Related Costs
Transaction-related costs consists of direct costs incurred in connection with the strategic sale process which commenced during 2014 and resulted in the Stock Purchase Agreement with the Levy Newco Parties and the Business Combination consummated pursuant to the Merger Agreement on June 30, 2015 as well as costs related to the secondary offering of common stock completed in October 2015.
Debt Modification Costs
In April 2013, DTH refinanced its existing debt (the "April 2013 Refinance") by entering into a new senior credit facility and incurred charges for a call premium, write-off of previous deferred financing costs and new lender and third party costs.
In April 2014, DTH refinanced its existing debt (the "April 2014 Refinance") by amending the 2013 Senior Credit Facility and incurred charges for a write-off of previous deferred financing costs and new lender and third party costs.
In March 2015, DTH refinanced its existing debt (the "March 2015 Refinance") by amending the 2013 Senior Credit Facility and incurred lender and third party costs which were capitalized on the balance sheet and certain third party costs were expensed.
In August 2015, we refinanced our existing debt by entering into a new senior credit facility and incurred lender and third party costs which were all capitalized on the balance sheet.
Change in Fair Value of Warrant Liability
Change in fair value of warrant liability represents the non-cash adjustment to record the warrant liability to its determined fair market value.
Provision for Income Taxes
Provision for income taxes consists of federal and state current and deferred income tax expense.
48
Results of Operations
Comparison of Results of Operations for the Twenty-Six Weeks Ended December 29, 2015 (Successor), Twenty-Six Weeks Ended June 30, 2015 (Predecessor), and Fifty-Two Weeks Ended December 30, 2014 (Predecessor)
The following table presents operating results for the twenty-six weeks ended December 29, 2015 (Successor), twenty-six weeks ended June 30, 2015 (Predecessor), and fifty-two weeks ended December 30, 2014 (Predecessor) in absolute terms and expressed as a percentage of total revenue (or company restaurant sales), as compared below:
Successor | Predecessor | ||||||||||||||||||||||
26 Weeks Ended December 29, 2015 | 26 Weeks Ended June 30, 2015 | 52 Weeks Ended December 30, 2014 | |||||||||||||||||||||
(Dollar amounts in thousands) | ($) | (%) | ($) | (%) | ($) | (%) | |||||||||||||||||
Statement of Operations Data: | |||||||||||||||||||||||
Revenue: | |||||||||||||||||||||||
Company restaurant sales | $ | 206,939 | 96.0 | % | $ | 200,676 | 96.2 | % | $ | 380,800 | 96.2 | % | |||||||||||
Franchise revenue | 7,328 | 3.4 | 6,693 | 3.2 | 12,973 | 3.3 | |||||||||||||||||
Franchise sublease income | 1,183 | 0.5 | 1,183 | 0.6 | 2,251 | 0.5 | |||||||||||||||||
Total Revenue | 215,450 | 100.0 | 208,552 | 100.0 | 396,024 | 100.0 | |||||||||||||||||
Operating expenses: | |||||||||||||||||||||||
Restaurant operating expenses: | |||||||||||||||||||||||
Food and paper costs | 59,263 | 28.6 | (1) | 57,447 | 28.6 | (1) | 110,708 | 29.1 | (1) | ||||||||||||||
Labor and related expenses | 61,448 | 29.7 | (1) | 61,120 | 30.5 | (1) | 116,920 | 30.7 | (1) | ||||||||||||||
Occupancy and other operating expenses | 43,191 | 20.9 | (1) | 43,611 | 21.7 | (1) | 82,021 | 21.5 | (1) | ||||||||||||||
Total restaurant operating expenses | 163,902 | 79.2 | 162,178 | 80.8 | 309,649 | 81.3 | |||||||||||||||||
General and administrative | 17,501 | 8.1 | 14,850 | 7.1 | 28,136 | 7.1 | |||||||||||||||||
Depreciation and amortization | 11,276 | 5.2 | 8,252 | 4.0 | 18,752 | 4.7 | |||||||||||||||||
Occupancy and other - franchise subleases | 1,140 | 0.5 | 1,109 | 0.5 | 2,145 | 0.5 | |||||||||||||||||
Pre-opening costs | 366 | 0.2 | 276 | 0.1 | 462 | 0.1 | |||||||||||||||||
Impairment of long-lived assets | — | — | — | — | 9,617 | 2.4 | |||||||||||||||||
Restaurant closure charges, net | 2,015 | 0.9 | 94 | * | 82 | * | |||||||||||||||||
Loss (gain) on disposal of assets | 3 | * | 99 | * | (151 | ) | * | ||||||||||||||||
Total operating expenses | 196,203 | 91.1 | 186,858 | 89.6 | 368,692 | 93.1 | |||||||||||||||||
Income from operations | 19,247 | 8.9 | 21,694 | 10.4 | 27,332 | 6.9 | |||||||||||||||||
Other expense (income), net: | |||||||||||||||||||||||
Interest expense | 3,652 | 1.7 | 11,491 | 5.5 | 30,895 | 7.7 | |||||||||||||||||
Other income | (220 | ) | (0.1 | ) | — | — | — | — | |||||||||||||||
Transaction-related costs | 12,972 | 6.0 | 7,255 | 3.5 | 1,936 | 0.5 | |||||||||||||||||
Debt modification costs | 78 | * | 139 | 0.1 | 1,241 | 0.3 | |||||||||||||||||
Change in fair value of warrant liability | — | — | (35 | ) | * | 1,417 | 0.4 | ||||||||||||||||
Total other expense (income), net | 16,482 | 7.7 | 18,850 | 9.0 | 35,489 | 8.9 | |||||||||||||||||
Income (loss) from operations before provision for income taxes | 2,765 | 1.3 | 2,844 | 1.4 | (8,157 | ) | (2.0 | ) | |||||||||||||||
Provision for income taxes | 112 | 0.1 | 740 | 0.4 | 1,098 | 0.3 | |||||||||||||||||
Net income (loss) | $ | 2,653 | 1.2 | % | $ | 2,104 | 1.0 | % | $ | (9,255 | ) | (2.3 | )% | ||||||||||
(1) | As a percentage of company restaurant sales. |
* | Immaterial/not meaningful |
49
Combined financial data:
Successor | Predecessor | Combined | Predecessor | |||||||||||||||||||||||||||
26 Weeks Ended December 29, 2015 | 26 Weeks Ended June 30, 2015 | 52 Weeks Ended December 29, 2015 | 52 Weeks Ended December 30, 2014 | Increase/ (Decrease) | ||||||||||||||||||||||||||
(Dollar amounts in thousands) | ($) | ($) | ($) | (%) | ($) | (%) | $ | % | ||||||||||||||||||||||
Company restaurant sales | $ | 206,939 | $ | 200,676 | $ | 407,615 | 96.1 | % | $ | 380,800 | 96.2 | % | $ | 26,815 | 7.0 | % | ||||||||||||||
Franchise revenues | 7,328 | 6,693 | 14,021 | 3.3 | 12,973 | 3.3 | 1,048 | 8.1 | ||||||||||||||||||||||
Franchise sublease income | 1,183 | 1,183 | 2,366 | 0.6 | 2,251 | 0.5 | 115 | 5.1 | ||||||||||||||||||||||
Total revenue | 215,450 | 208,552 | 424,002 | 100.0 | 396,024 | 100.0 | 27,978 | 7.1 | ||||||||||||||||||||||
Operating expense | ||||||||||||||||||||||||||||||
Restaurant operating expenses: | ||||||||||||||||||||||||||||||
Food and paper costs | 59,263 | 57,447 | 116,710 | 28.6 | (1) | 110,708 | 29.1 | (1) | 6,002 | 5.4 | (1) | |||||||||||||||||||
Labor and related expenses | 61,448 | 61,120 | 122,568 | 30.1 | (1) | 116,920 | 30.7 | (1) | 5,648 | 4.8 | (1) | |||||||||||||||||||
General and administrative | 17,501 | 14,850 | 32,351 | 7.6 | 28,136 | 7.1 | 4,215 | 15.0 | ||||||||||||||||||||||
Occupancy and other-franchise subleases | 1,140 | 1,109 | 2,249 | 0.5 | 2,145 | 0.5 | 104 | 4.8 | ||||||||||||||||||||||
Pre-opening costs | 366 | 276 | 642 | 0.2 | 462 | 0.1 | 180 | 39.0 | ||||||||||||||||||||||
Impairment of long-lived assets | — | — | — | — | 9,617 | 2.4 | (9,617 | ) | (100.0 | ) | ||||||||||||||||||||
Restaurant closure charges, net | 2,015 | 94 | 2,109 | 0.5 | 82 | * | 2,027 | * | ||||||||||||||||||||||
Loss (gain) on disposal of assets | 3 | 99 | 102 | * | (151 | ) | * | 253 | * | |||||||||||||||||||||
(1) | As a percentage of company restaurant sales. |
* | Immaterial/not meaningful |
Company Restaurant Sales
Company restaurant sales increased $26.8 million, or 7.0%, for the combined fifty-two weeks ended December 29, 2015, primarily due to an increase in company-operated same store sales of $23.2 million, or 6.4%. The growth in company-operated same store sales was primarily the result of an increase in average check size of 4.8% and an increase in traffic of 1.6% compared to the prior period. Company restaurant sales also increased by $6.7 million of additional sales from 11 new restaurants opened since the beginning of the first quarter of 2014 partially offset by a reduction of $3.1 million from the impact of 14 restaurant closures since the beginning of the first quarter of 2014.
Franchise Revenue
Franchise revenue increased $1.0 million, or 8.1%, for the combined fifty-two weeks ended December 29, 2015, primarily due to an increase in franchised same store sales of 6.2%.
Franchise Sublease Income
Franchise sublease income remained substantially the same for both the combined fifty-two week periods ended December 29, 2015 and December 30, 2014 (Predecessor).
50
Food and Paper Costs
Food and paper costs increased $6.0 million, or 5.4% for the combined fifty-two weeks ended December 29, 2015, consisting of a $5.1 million increase in food costs and a $0.9 million increase in paper costs. The increase in food and paper costs was primarily due to increased company restaurant sales and increased commodity costs, partially offset by reduced costs associated with the renewal of DTH’s beverage supply agreement which occurred mid-2014. As a percentage of company restaurant sales, food and paper costs were 28.6% for the combined fifty-two weeks ended December 29, 2015, compared to 29.1% for the fifty-two weeks ended December 30, 2014 (Predecessor). This percentage decrease resulted from modest menu price increases and reduced costs associated with DTH’s beverage supply contract discussed above, partially offset by increased commodity costs during the combined fifty-two weeks ended December 29, 2015.
Labor and Related Expenses
Labor and related expenses increased $5.6 million, or 4.8%, for the combined fifty-two weeks ended December 29, 2015, primarily due to increased labor costs resulting from higher company restaurant sales, the impact from a California minimum wage increase on July 1, 2014, the impact from new paid sick leave requirements that began July 1, 2015 in California, and new company restaurants opened since the beginning of 2014, partially offset by a decrease in workers compensation costs. As a percentage of company restaurant sales, labor and related expenses were 30.1% for the combined fifty-two weeks ended December 29, 2015, compared to 30.7% for the fifty-two weeks ended December 30, 2014 (Predecessor). This percentage decrease resulted primarily from modest menu price increases, the same store sales increase in traffic which helps to leverage the fixed components of labor costs, and decreased workers compensation costs discussed above, partially offset by the impact of the California minimum wage increase discussed above.
Occupancy and Other Operating Expenses
Occupancy and other operating expenses were $43.2 million for the twenty-six weeks ended December 29, 2015 (Successor) and $43.6 million for the twenty-six weeks ended June 30, 2015 (Predecessor) compared to $82.0 million for the fifty-two weeks ended December 30, 2014 (Predecessor). The increase during the twenty-six weeks ended December 29, 2015 (Successor) and twenty-six weeks ended June 30, 2015 (Predecessor) compared to the fifty-two weeks ended December 30, 2014 (Predecessor) was primarily due to an increase in operating expenses resulting from higher company restaurant sales, increased rent due to new stores, increased credit and debit card processing fees, advertising, supplies and uniforms and repairs and maintenance expense. As a percentage of company restaurant sales, occupancy and other operating expenses were 20.9% for the twenty-six weeks ended December 29, 2015 (Successor) and 21.7% for the twenty-six weeks ended June 30, 2015 (Predecessor), compared to 21.5% for the fifty-two weeks ended December 30, 2014 (Predecessor). This overall reduction as a percent of company restaurant sales was primarily due to modest menu price increases and the same store sales increase in traffic which helped to leverage the fixed components of occupancy and other operating expenses which all more than offset the impact of the increases discussed above.
General and Administrative Expenses
General and administrative expenses increased $4.2 million, or 15.0%, for the combined fifty-two weeks ended December 29, 2015, primarily due to an increase in performance-based incentive compensation, legal and professional fees, stock-based compensation and additional costs incurred as a public company. General and administrative expenses as a percentage of total revenue were 7.6% for the combined fifty-two weeks ended December 29, 2015, compared to 7.1% for the fifty-two weeks ended December 30, 2014 (Predecessor) and the increase as a percent of total revenue was due to the above mentioned cost increases partially offset by the increased revenues.
Depreciation and Amortization
Depreciation and amortization was $11.3 million for the twenty-six weeks ended December 29, 2015 (Successor) and $8.3 million for the twenty-six weeks ended June 30, 2015 (Predecessor), compared to $18.8 million for the fifty-two weeks ended December 30, 2014 (Predecessor). The twenty-six weeks ended December 29, 2015 (Successor) includes $2.2 million of incremental depreciation and amortization expense compared to the fifty-two weeks ended December 30, 2014 (Predecessor) resulting from adjusting property and equipment and identifiable intangible assets to fair value in acquisition accounting for the Business Combination. As a percentage of total revenue, depreciation and amortization expense was 5.2% for the twenty-six weeks ended December 29, 2015 (Successor) and 4.0% for the twenty-six weeks ended June 30, 2015 (Predecessor) compared to 4.7% for the fifty-two weeks ended December 30, 2014 (Predecessor). The decrease for the twenty-six weeks ended June 30, 2015 (Predecessor) is due to assets being fully depreciated and the increase for the twenty-six weeks ended December 29, 2015 is due to the step-up in value allocated to assets through the purchase price allocation.
51
Occupancy and Other – Franchise Sublease
Occupancy and other – franchise sublease was $2.2 million for the combined fifty-two weeks ended December 29, 2015 compared to $2.1 million for the fifty-two weeks ended December 30, 2014 (Predecessor). As a percentage of total revenue, occupancy and other – franchise sublease was 0.5% for both the combined fifty-two weeks ended December 29, 2015 and fifty-two weeks ended December 30, 2014 (Predecessor).
Pre-opening Costs
Pre-opening costs was $0.6 million for the combined fifty-two weeks ended December 29, 2015, compared to $0.5 million for the fifty-two weeks ended December 30, 2014 (Predecessor). The increase was due to an increased level of pre-opening activity compared to the prior year.
Impairment of long-lived assets
Impairment charges related to our evaluation of certain long-lived assets underlying 13 company-operated restaurants which had potential indicators of impairment based on operating performance resulted in a $9.6 million charge during the fifty-two weeks ended December 30, 2014. No such impairment charges were recorded during the twenty-six weeks December 29, 2015 (Successor) or twenty-six weeks ended June 30, 2015 (Predecessor).
Restaurant Closure Charges, net
Restaurant closure charges, net was $2.1 million for the combined fifty-two weeks ended December 29, 2015, compared to $82,000 for the fifty-two weeks ended December 30, 2014 (Predecessor). During the fourth quarter of fiscal 2015, we closed 12 underperforming restaurants. Upon closure, we recorded restaurant closure charges totaling $4.5 million, offset by $2.7 million related to the reclassification of lease related liabilities, for a net charge of $1.8 million. The net charge of $1.8 million and additional charges of $0.3 million related to other prior restaurant closures or sublease income shortfalls are both included in restaurant closure charges, net on the consolidated statements of comprehensive income (loss) for the combined fifty-two weeks ended December 29, 2015. Restaurant closure charges related to the closure of the 12 underperforming company-operated restaurants include (1) the present value of the future lease obligations net of estimated sublease income, (2) a lease termination payment, (3) brokerage commissions, (4) post closure rent, utilities, property tax and common area maintenance charges, (5) unused food and paper that could not be redeployed, (6) WARN act and stay bonus payments to terminated employees, and (7) other direct costs associated with the closures.
Loss (Gain) on Disposal of Assets
Loss (gain) on disposal of assets was $0.1 million for the combined fifty-two weeks ended December 29, 2015, compared to $(0.2) million for the fifty-two weeks ended December 30, 2014 (Predecessor). The loss of $0.1 million was related to the closure of one restaurant and the gain of $0.2 million primarily consisted of the closure of one restaurant, net of amortization of gains on asset sales associated with sale-leaseback transactions that do not qualify for sale-leaseback accounting treatment and a gain from eminent domain proceeds.
Interest Expense
Interest expense was $3.7 million for the twenty-six weeks ended December 29, 2015 (Successor) and $11.5 million for the twenty-six weeks ended June 30, 2015 (Predecessor), compared to $30.9 million for the fifty-two weeks ended December 30, 2014 (Predecessor). The decrease in interest expense for the twenty-six weeks ended December 29, 2015 (Successor) and twenty-six weeks ending June 30, 2015 (Predecessor) is primarily due to the reduced interest rate on the 2013 Senior Credit Facility as a result of a ratings upgrade in March 2015 and the repayment of DTH’s subordinated notes in March 2015 (collectively the “March 2015 Refinance”), the debt refinance in April 2014 (“April 2014 Refinance”) which resulted in reduced interest rates on the 2013 Senior Credit Facility and a lower proportion of subordinated note debt outstanding, the $68.6 million reduction to the 2013 Senior Credit Facility in June 2015, and the August 2015 Refinance which replaced the term loan with a revolving credit facility at a significantly lower interest rate, as discussed in the Current Year Events section.
52
Other income
Other income was $0.2 million for the twenty-six weeks ended December 29, 2015 (Successor). The Company held a 1% ownership interest in four public limited partnerships in which the Company served as general partner. The partnerships were liquidated and dissolved in December 2015 and the Company recorded a gain of $0.2 million based on the approximate $1.8 million distribution received in excess of the carrying value of the investment in the partnerships. See Note 2 of the notes to consolidated financial statements included elsewhere in this annual report on Form 10-K for more information.
Transaction-Related Costs
Transaction-related costs totaled $13.0 million for the twenty-six weeks ended December 29, 2015 (Successor), $7.3 million for the twenty-six weeks ended June 30, 2015 (Predecessor) and $1.9 million for the fifty-two weeks ended December 30, 2014 (Predecessor). All transaction-related costs consist of direct costs incurred in connection with the Business Combination which closed on June 30, 2015 as well as the costs related to the secondary offering of common stock completed in October 2015. See Note 3 of the notes to consolidated financial statements included elsewhere in this annual report on Form 10-K for more information.
Debt Modification Costs
Debt modification costs totaled $0.1 million for the twenty-six weeks ended December 29, 2015 (Successor) and related to the August 2015 Refinance. Debt modification costs totaled $0.1 million for the twenty-six weeks ended June 30, 2015 (Predecessor) and related to the March 2015 Refinance. Debt modification costs totaled $1.2 million during the fifty-two weeks ended December 30, 2014 (Predecessor) and related to the April 2014 Refinance whereby additional senior secured debt was raised through an amendment to DTH’s 2013 Senior Credit Facility and the proceeds were used to partially redeem the subordinated notes.
Change in Fair Value of Warrant Liability
Change in fair value of warrant liability required no adjustment for the twenty-six weeks ended December 29, 2015 (Successor). The warrant liability was reclassified to equity on March 20, 2015 in connection with the Step 1 of the Business Combination discussed in Note 3, Business Combination, in the notes to the consolidated financial statements included elsewhere in this annual report on Form 10-K. Change in fair value of warrant liability was $(35,000) for the twenty-six weeks ended June 30, 2015 (Predecessor) and $1.4 million for the fifty-two weeks ended December 30, 2014 (Predecessor).
Provision for Income Taxes
The effective income tax rates were 4.1% for the twenty-six weeks ended December 29, 2015 (Successor), 26.0% for the twenty-six weeks ended June 30, 2015 (Predecessor) and (13.5%) for the fifty-two weeks ended December 30, 2014 (Predecessor), respectively. The provision for income taxes consisted of income tax expense of $0.1 million for the twenty-six weeks ended December 29, 2015 (Successor), $0.7 million for the twenty-six weeks ended June 30, 2015 (Predecessor) and $1.1 million for the fifty-two weeks ended December 30, 2014 (Predecessor), respectively. As part of purchase accounting, the Company was required to record all of DTH’s acquired assets and liabilities at their acquisition date fair value, including deferred income taxes. The Company considered the weight of both positive and negative evidence and concluded that it is more likely than not that net deferred tax assets will be realized and that no valuation allowance on DTH's deferred tax asset was required as of the date of acquisition. As a result, the Company established deferred tax assets as well as deferred tax liabilities related to indefinite-lived intangibles through the purchase price allocation (see note 3 to the consolidated financial statements included elsewhere in this annual report on Form 10-K). In addition, after considering the Business Combination, the projected post-combination results and all available evidence, the Company released $1.9 million of valuation allowance that was previously provided against the Company's deferred tax assets. In accordance with ASC 805-740-30-3, the Company recorded this release through income tax benefit during the twenty-six week period ended December 29, 2015 (Successor).
53
Comparison of Results of Operations for the Fifty-Two Weeks Ended December 30, 2014 (Predecessor) and Fifty-Two Weeks Ended December 31, 2013 (Predecessor)
The following table presents operating results for the fifty-two weeks ended December 30, 2014 and December 31, 2013 in absolute terms and expressed as a percentage of total revenue (or company restaurant sales), as compared below:
Predecessor | |||||||||||||||||||||
52 Weeks Ended | |||||||||||||||||||||
December 30, 2014 | December 31, 2013 | Increase / (Decrease) | |||||||||||||||||||
(Dollar amounts in thousands) | ($) | (%) | ($) | (%) | $ | % | |||||||||||||||
Statement of Operations Data: | |||||||||||||||||||||
Revenue: | |||||||||||||||||||||
Company restaurant sales | $ | 380,800 | 96.2 | % | $ | 356,306 | 96.0 | % | $ | 24,494 | 6.9 | % | |||||||||
Franchise revenue | 12,973 | 3.3 | 12,515 | 3.4 | 458 | 3.7 | |||||||||||||||
Franchise sublease income | 2,251 | 0.5 | 2,167 | 0.6 | 84 | 3.9 | |||||||||||||||
Total Revenue | 396,024 | 100.0 | 370,988 | 100.0 | 25,036 | 6.7 | |||||||||||||||
Operating expenses: | |||||||||||||||||||||
Restaurant operating expenses: | |||||||||||||||||||||
Food and paper costs | 110,708 | 29.1 | (1) | 105,492 | 29.6 | (1) | 5,216 | 4.9 | |||||||||||||
Labor and related expenses | 116,920 | 30.7 | (1) | 108,788 | 30.5 | (1) | 8,132 | 7.5 | |||||||||||||
Occupancy and other operating expenses | 82,021 | 21.5 | (1) | 77,205 | 21.7 | (1) | 4,816 | 6.2 | |||||||||||||
Total restaurant operating expenses | 309,649 | 81.3 | 291,485 | 81.8 | 18,164 | 6.2 | |||||||||||||||
General and administrative | 28,136 | 7.1 | 23,112 | 6.2 | 5,024 | 21.7 | |||||||||||||||
Depreciation and amortization | 18,752 | 4.7 | 19,850 | 5.4 | (1,098 | ) | (5.5 | ) | |||||||||||||
Occupancy and other - franchise subleases | 2,145 | 0.5 | 2,073 | 0.6 | 72 | 3.5 | |||||||||||||||
Pre-opening costs | 462 | 0.1 | 596 | 0.2 | (134 | ) | (22.5 | ) | |||||||||||||
Impairment of long-lived assets | 9,617 | 2.4 | — | — | 9,617 | — | |||||||||||||||
Restaurant closure charges, net | 82 | * | 298 | 0.1 | (216 | ) | (72.5 | ) | |||||||||||||
(Gain) loss on disposal of assets | (151 | ) | * | 209 | 0.1 | (360 | ) | (172.2 | ) | ||||||||||||
Total operating expenses | 368,692 | 93.1 | 337,623 | 91.0 | 31,069 | 9.2 | |||||||||||||||
Income from operations | 27,332 | 6.9 | 33,365 | 9.0 | (6,033 | ) | (18.1 | ) | |||||||||||||
Other expenses: | |||||||||||||||||||||
Interest expense | 30,895 | 7.7 | 35,613 | 9.7 | (4,718 | ) | (13.2 | ) | |||||||||||||
Transaction-related costs | 1,936 | 0.5 | — | — | 1,936 | — | |||||||||||||||
Debt modification costs | 1,241 | 0.3 | 4,178 | 1.1 | (2,937 | ) | (70.3 | ) | |||||||||||||
Change in fair value of warrant liability | 1,417 | 0.4 | 33 | * | 1,384 | * | |||||||||||||||
Total other expenses | 35,489 | 8.9 | 39,824 | 10.8 | (4,335 | ) | (10.9 | ) | |||||||||||||
Loss from operations before provision for income taxes | (8,157 | ) | (2.0 | ) | (6,459 | ) | (1.8 | ) | (1,698 | ) | 26.3 | ||||||||||
Provision for income taxes | 1,098 | 0.3 | 80 | * | 1,018 | * | |||||||||||||||
Net loss | $ | (9,255 | ) | (2.3 | )% | $ | (6,539 | ) | (1.8 | )% | $ | (2,716 | ) | 41.5 | % | ||||||
(1) | As a percentage of company restaurant sales. |
* | Immaterial/not meaningful |
54
Company Restaurant Sales
Company restaurant sales increased $24.5 million, or 6.9%, for the fifty-two weeks ended December 30, 2014, primarily due to an increase in company-operated same store sales of $18.3 million, or 5.3%. The growth in company-operated same store sales was primarily the result of an increase in average check size of 3.1% and an increase in traffic of 2.2% compared to the prior year. Company restaurant sales also increased by $6.9 million of additional sales from restaurants not in the comparable restaurant base. This increase was partially offset by $0.7 million from restaurant closures.
Franchise Revenue
Franchise revenue increased $0.5 million, or 3.7%, for the fifty-two weeks ended December 30, 2014, primarily due to an increase in franchised same store sales of 5.2%, partially offset by the impact of the closure of 12 franchised restaurants during the fifty-two weeks ended December 31, 2013 and of 10 closures during the fifty-two weeks ended December 30, 2014.
Franchise Sublease Income
Franchise sublease income increased $0.1 million, or 3.9%, for the fifty-two weeks ended December 30, 2014, primarily due to an increase in franchised same store sales of 5.2% to which rental income is tied.
Food and Paper Costs
Food and paper costs increased $5.2 million, or 4.9%, during the fifty-two weeks ended December 30, 2014, consisting of a $5.1 million increase in food costs and a $0.1 million increase in paper costs. The increase in food and paper costs was primarily due to increased company restaurant sales and to a lesser extent higher commodity costs related to cheddar cheese, ground beef and shrimp, partially offset by reduction in costs related to chicken, french fries and cooking oil. Food and paper costs as a percentage of company restaurant sales were 29.1% for the fifty-two weeks ended December 30, 2014 compared to 29.6% for the fifty-two weeks ended December 31, 2013. The percentage decrease resulted primarily from modest menu price increases, partially offset by food and paper inflation.
Labor and Related Expenses
Labor and related expenses increased $8.1 million, or 7.5%, for the fifty-two weeks ended December 30, 2014, primarily due to increased labor costs resulting from higher company restaurant sales, the impact from a California minimum wage increase on July 1, 2014, a $1.8 million increase in workers’ compensation expense due to higher payments and reserves related to underlying claims activity and additional labor needs arising from the opening of five new restaurants during the fifty-two weeks ended December 30, 2014 and five new restaurants during the fifty-two weeks ended December 31, 2013. This increase was partially offset by decreased labor needs relating to one restaurant that closed during the fifty-two weeks ended December 30, 2014 and three restaurants that closed during the fifty-two weeks ended December 31, 2013. Labor and related expenses as a percentage of company restaurant sales were 30.7% for the fifty-two weeks ended December 30, 2014 compared to 30.5% for the fifty-two weeks ended December 31, 2013. This percentage increase resulted primarily from the impact of the California minimum wage and the increase in workers’ compensation expense discussed above, partially offset by menu price increases and the same store sales increase in traffic which helps to leverage the fixed components of labor costs.
Occupancy and Other Operating Expenses
Occupancy and other operating expenses increased $4.8 million, or 6.2%, during the fifty-two weeks ended December 30, 2014, primarily due to an increase in operating expenses resulting primarily from higher company restaurant sales, increased utilities expense, credit and debit card processing fees, advertising, rent, and repairs and maintenance expense. These increases were partially offset by a reduction in general insurance expenses. Occupancy and other operating expenses as a percentage of company restaurant sales were 21.5% for the fifty-two weeks ended December 30, 2014 compared to 21.7% for the fifty-two weeks ended December 31, 2013. This reduction was primarily due to modest menu price increases and the same store sales increase in traffic which helps to leverage the fixed components of occupancy and other operating expenses, partially offset by increases in costs discussed above.
General and Administrative Expenses
General and administrative expenses increased $5.0 million, or 21.7%, for the fifty-two weeks ended December 30, 2014, primarily due to a $2.8 million increase in incentive compensation based on performance, increased compensation, consulting expense related to the renewal of a beverage agreement and increased legal fees. These increases were partially offset by a
55
decrease in stock-based compensation due to the use of an accelerated grade vesting accounting method. General and administrative expense as a percentage of total revenue was 7.1% for the fifty-two weeks ended December 30, 2014 compared to 6.2% for the fifty-two weeks ended December 31, 2013. This increase was primarily due to the increase in general and administrative expense discussed above partially offset by the impact from increased total revenues.
Depreciation and Amortization
Depreciation and amortization decreased $1.1 million, or 5.5%, for the fifty-two weeks ended December 30, 2014, primarily due to a reduction in leasehold interest amortization and certain assets which became fully depreciated during the fifty-two weeks ended December 30, 2014. Depreciation and amortization as a percentage of total revenue decreased to 4.7% for the fifty-two weeks ended December 30, 2014 compared to 5.4% for the fifty-two weeks ended December 31, 2013.
Occupancy and Other—Franchise Sublease
Occupancy and other—franchise sublease increased $0.1 million, or 3.5%, for the fifty-two weeks December 30, 2014, primarily due to an increase in the restaurant revenues to which the rent expense is tied.
Pre-opening Costs
Pre-opening costs decreased by $0.1 million, or 22.5%, for the fifty-two weeks ended December 30, 2014, with five company-operated restaurants opening in both 2014 and 2013 and a higher proportion of new company-operated restaurants opening in established markets during 2014 which required lower pre-opening costs in the fifty-two weeks ended December 30, 2014 compared to the fifty-two weeks ended December 31, 2013. As a percentage of total revenue, pre-opening costs decreased from 0.2% during the fifty-two weeks ended December 31, 2013 to 0.1% during the fifty-two weeks ended December 30, 2014.
Impairment of Long-Lived Assets
Impairment charges related to Del Taco’s evaluation of certain long-lived assets underlying 13 company-operated restaurants which had potential indicators of impairment based on operating performance resulted in a $9.6 million charge for the fifty-two weeks ended December 30, 2014. No such impairment charges were recorded during the fifty-two weeks ended December 31, 2013.
Restaurant Closure Charges, net
Restaurant closure charges, net, decreased by $0.2 million from $0.3 million for the fifty-two weeks ended December 31, 2013 to $0.1 million for the fifty-two weeks ended December 30, 2014, due to Fiscal 2014 primarily consisting of accretion expense while Fiscal 2013 included accretion expense and an adjustment to increase the lease termination liability for two closed restaurants partially offset by a decrease to the lease termination liability for one closed restaurant.
(Gain) loss on Disposal of Assets
(Gain) loss on disposal of assets decreased by $0.4 million from a $0.2 million loss for the fifty-two weeks ended December 31, 2013 to $0.2 million gain for the fifty-two weeks ended December 30, 2014, due to Fiscal 2014 primarily consisting of the closure of one restaurant, net of the amortization of gains on asset sales associated with sale-leaseback transactions that do not qualify for sale-leaseback accounting treatment and gain from eminent domain proceeds. The fifty-two weeks ended December 31, 2013 included the closure of three restaurants, net of the amortization of gains on asset sales associated with sale-leaseback transactions that do not qualify for sale-leaseback accounting treatment.
Interest Expense, Net
Interest expense, net, decreased $4.7 million, or 13.2%, for fifty-two weeks ended December 30, 2014, primarily due to benefits from the April 2014 Refinance and April 2013 Refinance both including reduced interest rates on the senior secured credit facility and a lower proportion of subordinated note debt outstanding.
Transaction-Related Costs
Transaction-related costs totaling $1.9 million for the fifty-two weeks ended December 30, 2014 consists of direct costs incurred in connection with the strategic sale process which commenced during 2014.
56
Debt Modification Costs
Debt modification costs totaled $1.2 million for the fifty-two weeks ended December 30, 2014 and related to the April 2014 Refinance whereby additional senior secured debt was raised through an amendment to DTH's senior secured credit facility and the proceeds were used to partially redeem the subordinated notes. Debt modification costs totaled $4.2 million during the fifty-two weeks ended December 31, 2013 and related to the April 2013 Refinance whereby additional senior secured debt was raised through a new senior secured credit facility and the proceeds were used to partially redeem the subordinated note debt outstanding.
Change in Fair Value of Warrant Liability
Change in fair value of warrant liability represents the non-cash adjustment to record the warrant liability to its determined fair market value and totaled a charge of $1.4 million for the fifty-two weeks ended December 30, 2014 and a charge of $0.03 million for the fifty-two weeks ended December 31, 2013.
Provision for Income Taxes
The provision for income taxes consisted of income tax expense of $1.1 million for the fifty-two weeks ended December 30, 2014 and $0.1 million for the fifty-two weeks ended December 31, 2013. Income tax expense for the fifty-two weeks ended December 30, 2014 consisted of an income tax expense of $1.1 million primarily related to the effect of changes in deferred taxes and the related effect of maintaining a full valuation allowance against certain of deferred tax assets as of the end of Fiscal 2014. During the fifty-two weeks ended December 31, 2013, despite having a net loss, the provision for income taxes consisted of an income tax expense of $0.1 million, primarily related state minimum taxes. The tax provision for the fifty-two weeks ended December 31, 2013 did include income tax expense of $0.9 million related to the effect of changes in deferred taxes which was offset by a decrease in uncertain tax positions of $0.9 million related to state tax positions that had the statute of limitations lapse during the year.
Liquidity and Capital Resources
Potential Impacts of Market Conditions on Capital Resources
We have experienced positive trends in consumer traffic and increases in same store sales and restaurant contribution margin. However, the restaurant industry continues to be challenged and uncertainty exists as to the sustainability of these favorable trends.
We believe that expected cash flow from operations, available cash of $10.2 million at December 29, 2015 and available borrowing capacity of $76.7 million at December 29, 2015 will be adequate to fund debt service requirements, operating lease obligations, capital expenditures and working capital obligations for at least the next 12 months. However, the ability to continue to meet these requirements and obligations will depend on, among other things, the ability to achieve anticipated levels of revenue and cash flow and the ability to manage costs and working capital successfully.
Summary of Cash Flows
Our primary sources of liquidity and capital resources have been cash provided from operations, cash and cash equivalents, and our senior secured credit facilities. The Company’s primary requirements for liquidity and capital are new restaurants, existing restaurant capital investments (primarily maintenance and roll-out of equipment related to our strategy to emphasize freshness and speed), investments in infrastructure and information technology, interest payments on debt, lease obligations, income tax payments and working capital and general corporate needs. The working capital requirements are not significant since customers pay for their purchases in cash or by payment card (credit or debit) at the time of sale. Thus, the Company is able to sell many inventory items before it has to pay suppliers for such items since it typically has payment terms for its food and paper suppliers. The Company restaurants do not require significant inventories.
57
The following table presents summary cash flow information for the periods indicated (in thousands).
Successor | Predecessor | ||||||||||||||||
26 Weeks Ended December 29, 2015 | 26 Weeks Ended June 30, 2015 | 52 Weeks Ended December 30, 2014 | 52 Weeks Ended December 31, 2013 | ||||||||||||||
Net cash provided by (used in) | |||||||||||||||||
Operating activities | $ | 17,085 | $ | 10,083 | $ | 45,476 | $ | 41,325 | |||||||||
Investing activities | 42,566 | (15,284 | ) | (18,068 | ) | (19,997 | ) | ||||||||||
Financing activities | (49,457 | ) | 1,820 | (24,926 | ) | (19,527 | ) | ||||||||||
Net increase (decrease) in cash | $ | 10,194 | $ | (3,381 | ) | $ | 2,482 | $ | 1,801 | ||||||||
Cash Flows Provided by Operating Activities
In the twenty-six weeks ended December 29, 2015 (Successor), cash flows provided by operating activities were $17.1 million. The cash flows provided by operating activities resulted from net income of $2.7 million, non-cash adjustment for asset depreciation and amortization of $11.1 million, stock-based compensation of $1.5 million, debt modification costs of $0.1 million, and the changes in net working capital requirements totaling $1.7 million, which includes cash outflows of $4.3 million related to transaction expenses previously expensed by LAC and not reported with DTH’s Predecessor consolidated statements of comprehensive income (loss).
In the twenty-six weeks ended June 30, 2015 (Predecessor), cash flows provided by operating activities were $10.1 million. The cash flows provided by operating activities results from net income of $2.1 million, non-cash adjustment for asset depreciation and amortization of $9.2 million, stock-based compensation of $0.5 million, deferred income taxes of $0.6 million, debt modification costs of $0.1 million, and loss on disposal of assets of $0.1 million, partially offset by the changes in net working capital requirements totaling $2.5 million
For the fifty-two weeks ended December 30, 2014 (Predecessor), net cash provided by operating activities increased by $4.2 million as compared to the fifty-two weeks ended December 31, 2013 (Predecessor), as the larger net loss was offset by non-cash charges related to the impairment of long-lived assets and the change in fair value of the warrant liability partially offset by the increase in the outstanding balances at year end of accounts payable, accrued liabilities and deferred income taxes and the reduced non-cash paid-in-kind interest for the subordinated notes.
Cash Flows Provided by (Used in) Investing Activities
In the twenty-six weeks ended December 29, 2015 (Successor), cash flows provided by investing activities were $42.6 million. The cash flows used in investing activities were primarily the result of proceeds from the Company’s trust account of $150.0 million and proceeds of $1.6 million from dissolution of investments in partnerships, partially offset by $89.8 million for the Business Combination with DTH and purchase of property and equipment and other assets totaling $19.2 million. For the combined fifty-two weeks ended December 29, 2015, purchase of property and equipment was $33.4 million, including $11.3 million for new unit construction, $11.8 million for capitalized maintenance and $10.3 million for discretionary investment in equipment and technology.
In the twenty-six weeks ended June 30, 2015 (Predecessor), cash flows used in investing activities were $15.3 million primarily due to the purchase of property and equipment and other assets.
Cash used in investing activities decreased by $1.9 million in the fifty-two weeks ended December 30, 2014 (Predecessor) as compared to the fifty-two weeks ended December 31, 2013 (Predecessor) primarily due to a decrease in purchases of property and equipment due to completion of the ASU re-imaging program during Fiscal 2013, partially offset by a decrease in proceeds received from the disposal of property and equipment.
Cash Flows Provided by (Used in) Financing Activities
In the twenty-six weeks ended December 29, 2015 (Successor), cash flows used in financing activities were $49.5 million. The cash flows used in financing activities were primarily the result of the full repayment of the 2013 Term Loan of $227.1 million, payments on revolving credit facilities, capital lease and deemed landlord financing and debt issue costs in aggregate of $15.3
58
million as well as repayment of note payable of $0.5 million and payment of deferred underwriter compensation of $5.3 million both of which were accrued on LAC’s balance sheet at June 16, 2015, partially offset by net proceeds from the 2015 Revolving Credit Facility of $162.6 million, proceeds of $35.0 million from the issuance of common stock and proceeds from deemed landlord financing liabilities of $1.2 million.
In the twenty-six weeks ended June 30, 2015 (Predecessor), cash flows provided by financing activities were $1.8 million. The cash flows provided by financing activities were primarily the result of proceeds from the issuance of common stock of $91.2 million and proceeds from the term loan and revolving credit facilities of $33.7 million, partially offset by the full repayment of the subordinate notes of $108.1 million, payment of tax withholding related to option of exercises and distribution of restricted stock units of $7.5 million and payments on revolving credit facilities, capital lease obligations, deemed landlord financing and debt issue costs of $7.5 million.
Cash used in financing activities increased by $5.4 million in in the fifty-two weeks ended December 30, 2014 (Predecessor) as compared to the fifty-two weeks ended December 31, 2013 (Predecessor) primarily due to a net increase in overall principal payments related to the term loans, partially offset by a reduction in payments for debt issue costs.
Debt and Other Obligations
Senior Credit Facility
On April 1, 2013, DTH entered into the 2013 Senior Credit Facility in the amount of $215 million consisting of a $175.0 million term loan and $40.0 million revolving credit facility with maturity dates of October 1, 2018 and April 1, 2018, respectively. On April 21, 2014, DTH amended the 2013 Senior Credit Facility whereby the then outstanding balance of the term loan was increased by $62.0 million to $220.0 million and the revolving credit facility remained at $40 million. The amended term loan bore interest at LIBOR (not to be less than 1.00%) plus a margin of 4.50%. DTH made mandatory and voluntary prepayments on the term loan in the aggregate of $22.5 million during Fiscal 2014. On March 20, 2015, DTH increased the borrowings on its 2013 Senior Credit Facility by $25.1 million and borrowed $10.0 million under the revolving credit facility. In addition, on March 12, 2015, DTH satisfied the rating condition on its 2013 Senior Credit Facility resulting in a decrease in interest rates to LIBOR (not to be less than 1.00%) plus a margin of 4.25% as of March 25, 2015. On June 30, 2015, DTH used $68.6 million of the proceeds from the Business Combination to pay down borrowings under the 2013 Senior Credit Facility.
On August 4, 2015, we refinanced our existing 2013 Senior Credit Facility and entered into a new credit agreement (the "2015 Senior Credit Facility") which matures on August 4, 2020 and provides for a $250 million revolving credit facility. We borrowed $164 million under the 2015 Senior Credit Facility to repay all of existing indebtedness under our existing 2013 Senior Credit Facility and to pay related costs associated with the financing. At the time of termination, $162.5 million of term loan borrowings were outstanding under the 2013 Senior Credit Facility and $17.6 million revolver capacity that was utilized to support outstanding letters of credit.
At the Company’s option, loans under the 2015 Senior Credit Facility may bear interest at a base rate or LIBOR, plus a margin determined in accordance with a consolidated total lease adjusted leverage ratio-based pricing grid. The base rate is calculated as the highest of (a) the Federal Funds Rate plus 1/2 of 1%, (b) the prime rate of Bank of America, and (c) LIBOR plus 1.00%. For LIBOR loans, the margin is in the range of 1.50% to 2.50%, and for base rate loans the margin is in the range of 0.50% and 1.50%. The margin is initially set at 2.00% for LIBOR loans and at 1.00% for base rate loans until delivery of financial statements and a compliance certificate for the fourth fiscal quarter ending after the closing date of the Credit Agreement.
The 2015 Senior Credit Facility contains certain financial covenants, including the maintenance of a consolidated total lease adjusted leverage ratio and a consolidated fixed charge coverage ratio. The Company was in compliance with the financial covenants as of December 29, 2015.
At December 29, 2015, the weighted average interest rate on the outstanding balance of the 2015 Senior Credit Facility was 2.3%. As of December 29, 2015 there were $154.0 million of borrowings under the 2015 Senior Credit Facility and letters of credit outstanding of $19.3 million. Unused borrowing capacity at December 29, 2015 was $76.7 million.
Subordinated Notes
In connection with the DTH's May 2010 restructuring, wholly owned subsidiaries of DTH issued subordinated notes in the aggregate principal amount of $150.0 million which had an interest rate of 13.0%, with interest accrued to principal. The outstanding balance of $111.2 million on these subordinated notes was paid in full on March 20, 2015 as discussed in Current Year Events above.
59
Hedging Arrangements
Effective June 30, 2013, DTH entered into an interest rate cap agreement with a three-year term with a fixed notional amount of $87.5 million of the then existing term loan that effectively converted that portion of the loan outstanding under the 2013 Senior Credit Facility from variable rate debt to capped variable rate debt, resulting in a change in the applicable interest rate from an interest rate of three-month LIBOR plus the applicable percentage (as provided by the 2013 Senior Credit Facility) to a capped interest rate of 1.00% to 2.25% plus the applicable percentage.
DTH was hedging forecasted transactions expected to occur through June 30, 2016. As of the July 1, 2015 reset date, however, DTH elected the one-month LIBOR rate option for its variable rate interest payments on term balances equal to or in excess of the applicable notional amount of the interest rate cap agreement, and as a result, this hedge became ineffective. Therefore, after July 1, 2015, any changes in fair value will be recorded through interest expense.
Contractual Obligations
The following table represents the Company’s contractual commitments (which include expected interest expense, calculated based on current interest rates) to make future payments pursuant to debt and other obligations disclosed above and pursuant to restaurant operating leases outstanding as of December 29, 2015 (Successor) (in thousands):
Payments Due by Period | ||||||||||||||||||||
Total | 2016 | 2017-2018 | 2019-2020 | 2021 and thereafter | ||||||||||||||||
Operating leases, net (1) | $ | 250,045 | $ | 26,283 | $ | 49,445 | $ | 41,330 | $ | 132,987 | ||||||||||
Capital leases and deemed landlord financing | 30,978 | 3,365 | 5,789 | 4,230 | 17,594 | |||||||||||||||
Long-term debt | 154,000 | — | — | 154,000 | — | |||||||||||||||
Interest on long-term debt (2) | 18,818 | 4,032 | 8,065 | 6,721 | — | |||||||||||||||
Purchase commitments (3) | 81,280 | 15,707 | 29,594 | 29,349 | 6,630 | |||||||||||||||
Total (4) | $ | 535,121 | $ | 49,387 | $ | 92,893 | $ | 235,630 | $ | 157,211 | ||||||||||
(1) | Includes amounts for restaurant operating leases related to the 12 restaurants closed in the fourth fiscal quarter of 2015 and related subleases both of which have been included in our restaurant closure liability on our consolidated balance sheets as of December 29, 2015 (Successor) on a present value basis. |
(2) | Interest on long-term debt includes monthly interest due on the drawn portion of the revolver at interest rates of 2.3%, a fee of 2.0% on the outstanding letters of credit and a 0.25% unused commitment fee on the unused balance of the revolver. |
(3) | Purchase commitments included in the table above are for commitments in excess of one year related to both Company-operated and franchised restaurants for food purchases and supplies, information technology service agreements and a long-term beverage supply agreement. |
(4) | The above table excludes purchase commitments related to certain vendors that supply food products, construction, marketing and other service-related arrangements which occur in the normal course of business and are typically short-term in nature. Other obligations excluded from the above table include contingent rent payments, property taxes, insurance payments and common area maintenance costs. |
Off-Balance Sheet and Other Arrangements
At December 29, 2015, the Company had a $250.0 million revolving credit facility of which $19.3 million was reserved for outstanding letters of credit and $76.7 million was unused and available for borrowings under the 2015 Senior Credit Facility. The Company did not have any other material off-balance sheet arrangements, except for restaurant operating leases entered into in the normal course of business.
Stock Repurchase Program
In February 2016, the Board of Directors authorized a share repurchase program under which the Company may purchase up to $25.0 million in the aggregate of its common stock and warrants from time to time in open market or privately negotiated transactions. The amount and timing of purchases (if any) will depend upon a number of factors, including the price and availability of the Company's common stock and warrants and general market conditions.
60
Critical Accounting Policies and Use of Estimates
The preparation of the consolidated financial statements in conformity with U.S. GAAP requires us to make estimates and assumptions that affect the amounts reported in the consolidated financial statements and accompanying notes. We believe that such estimates have been based on reasonable and supportable assumptions and the resulting estimates are reasonable for use in the preparation of the consolidated financial statements. Actual results could differ from these estimates. Our significant estimates include estimates for impairment of goodwill, intangible assets and property and equipment, insurance reserves, restaurant closure reserves, stock-based compensation, contingent liabilities and income tax valuation allowances.
Accounting policies are an integral part of our financial statements. A thorough understanding of these accounting policies is essential when reviewing our reported results of operations and financial position. Management believes that the critical accounting policies and estimates involve the most difficult management judgments due to the sensitivity of the methods and assumptions used. Our significant accounting policies are described in Note 2 in the accompanying consolidated financial statements in Item 8 of this Annual Report on Form 10-K.
Business Combinations
We account for acquisitions using the purchase method of accounting. Accordingly, assets acquired and liabilities assumed are recorded at their estimated fair values at the acquisition date. The excess of purchase price over fair value of net assets acquired, including the amount assigned to identifiable intangible assets, is recorded as goodwill. Given the time it takes to obtain pertinent information to finalize the acquired company's balance sheet, it may be several quarters before we are able to finalize those initial fair value estimates. Accordingly, it is not uncommon for the initial estimates to be subsequently revised. The results of operations of acquired businesses are included in the consolidated financial statements, included elsewhere in this annual report on Form 10-K, from the acquisition date.
Revenue Recognition
Restaurant sales from the operation of company-operated restaurants are recognized when food and service is delivered to customers. Franchise revenue comprise (i) development fees, (ii) franchise fees, (iii) on-going royalties and (iv) renewal fees. Development and franchise fees, a portion of which are collected in advance and are non-refundable, received pursuant to individual development agreements, grant the right to develop franchised restaurants in future periods in specific geographic areas. Both development and franchise fees are deferred and recognized as revenue when we have substantially fulfilled our obligations pursuant to the development agreement. Development fees and franchise fees are generally recognized as revenue upon the opening of a franchise restaurant or upon termination of the development agreement with the franchisee. Deferred development fees and deferred franchise fees are included in other non-current liabilities on the consolidated balance sheets. Royalties from franchised restaurants are based on a percentage of franchise restaurant sales and are recognized in the period the related franchise restaurant sales occur. Renewal fees are recognized when a renewal agreement becomes effective. We report revenue net of sales taxes collected from customers and remitted to governmental taxing authorities and promotional allowances. Franchise sublease income is composed of rental income associated with properties leased or subleased to franchisees. We sell gift cards to customers in our restaurants. The gift cards sold to customers have no stated expiration dates and are recorded in other non-current liabilities on the consolidated balance sheets. We recognize revenue from gift cards: (i) when the gift card is redeemed by the customer; or (ii) under the delayed recognition method, when the likelihood of the gift card being redeemed by the customer is remote (gift card breakage) and we determine that there is not a legal obligation to remit the unredeemed gift cards to the relevant jurisdiction. The determination of the gift card breakage rate is based upon our specific historical redemption patterns. Recognized breakage revenue was not significant to any period presented in the consolidated statements of comprehensive income (loss). Any future revisions to the estimated breakage rate may result in changes in the amount of breakage revenue recognized in future periods.
Goodwill and Indefinite-Lived Intangible Assets, Net
Indefinite-lived intangible assets consist of goodwill and trademarks.
Our goodwill and trademarks are not amortized, but tested annually for impairment and tested more frequently for impairment if events and circumstances indicate that the asset might be impaired. We conduct annual goodwill and trademark impairment tests in the fourth quarter of each fiscal year or whenever an indicator of impairment exists.
In assessing potential goodwill impairment, we have the option to first assess the qualitative factors to determine whether the existence of events or circumstances leads to a determination that the fair value of net assets, including goodwill, is less than its carrying amount. Our qualitative assessment of the recoverability of goodwill considers various macro-economic, industry-specific and company-specific factors. These factors include: (i) severe adverse industry or economic trends; (ii) significant
61
company-specific actions, including exiting an activity in conjunction with restructuring of operations; (iii) current, historical or projected deterioration of the Company’s financial performance; or (iv) a sustained decrease in the Company’s market capitalization below its net book value. If, after assessing the totality of events or circumstances, we determine it is unlikely that the fair value of net assets, including goodwill, is less than its carrying amount, then performing the two-step impairment test is unnecessary. However, if we conclude otherwise, then we are required to perform the first step of the two-step impairment test by comparing the fair value of net assets, including goodwill, with its carrying amount. If the fair value of net assets, including goodwill, exceeds its carrying amount, goodwill is not considered impaired; otherwise, goodwill is considered impaired and the loss is measured by performing step two. Under step two, the impairment loss is measured by comparing the implied fair value of goodwill with the carrying amount of goodwill. We also have the option to bypass the qualitative assessment and proceed directly to performing the first step of the two-step goodwill impairment test. We may continue performing the qualitative assessment in any subsequent period.
The methods we use to estimate fair value include discounted future cash flows analysis and market valuation based on similar companies. Key assumptions included in the cash flow model include future revenues, operating costs, working capital changes, capital expenditures and a discount rate that approximates our weighted average cost of capital.
In assessing potential impairment of our indefinite-lived trademark, we use a quantitative impairment analysis, which compares the fair value of the indefinite-lived trademark, based on discounted future cash flows using a relief from royalty methodology. If the carrying amount of the indefinite-lived trademark exceeds its fair value, an impairment loss is measured as the difference between the implied fair value of the trademark and its carrying amount.
Long-Lived Assets
Long-lived assets, including property and equipment and definite lived intangible assets (other than goodwill and indefinite-lived intangible assets), are reviewed by us for impairment whenever events or changes in circumstances indicate that the carrying amount may not be recoverable. Long-lived assets are grouped and evaluated for impairment at the lowest level for which there are identifiable cash flows that are independent of the cash flows of other groups of assets. We evaluate such cash flows for individual restaurants and franchise agreements on an undiscounted basis. If it is determined that the carrying amounts of such long-lived assets are not recoverable, the assets are written down to their estimated fair values. We generally estimate fair value using either the land and building real estate value for the respective restaurant or the discounted value of the estimated cash flows associated with the respective restaurant or agreement.
Insurance Reserves
Given the nature of our operating environment, we are subject to workers’ compensation and general liability claims. To mitigate a portion of these risks, we maintain insurance for individual claims in excess of deductibles per claim (insurance deductibles range from $0.25 million to $0.50 million per occurrence for workers’ compensation and are $0.35 million per occurrence for general liability). The amount of self-insurance loss reserves and loss adjustment expenses is determined based on an estimation process that uses information obtained from both specific and industry data, as well as general economic information. Self-insurance loss reserves are based on estimates of expected losses for determining reported claims and as the basis for estimating claims incurred but not reported. The estimation process for self-insurance loss exposure requires us to continuously monitor and evaluate the life cycle of claims. We also monitors the reasonableness of the judgments made in the prior year’s estimation process (referred to as a hindsight analysis) and adjust current year assumptions based on the hindsight analysis. We utilize actuarial methods to evaluate open claims and estimate the ongoing development exposure related to workers’ compensation and general liability.
Rent Expense and Deferred Rent Liability
We lease a substantial number of restaurant properties. At inception, each lease is evaluated to determine whether it will be classified as an operating or capital lease. Rent expense on operating leases with scheduled or minimum rent increases is recorded on the straight-line basis over the lease term, which includes the period of time from when we take possession of the leased space until the restaurant opening date (the rent holiday period). Deferred rent liability represents the excess of rent charged to expense over the rent obligations under the lease agreement, as well as leasehold improvements funded by lessor incentives which are amortized as reductions to rent expense over the expected lease term.
Restaurant Closure Charges, Net
We make decisions to close restaurants based on their cash flows, anticipated future profitability and leasing arrangements. We determine if discontinued operations treatment is appropriate and estimate the future obligations, if any, associated with the
62
closure of restaurants and records the corresponding liability at the time the restaurant is closed. These restaurant closure obligations primarily consist of the liability for the present value of future lease obligations, net of estimated sublease income. Restaurant closure charges, net are comprised of direct costs related to the restaurant closure and initial charges associated with the recording of the liability at fair value, accretion of the liability during the period, and any positive or negative adjustments to the liability in subsequent periods as more information becomes available. Changes to the estimated liability for future lease obligations based on new facts and circumstances are considered to be a change in estimate and are recorded prospectively. Accretion expense is recorded in order to appropriately reflect the present value of the lease obligations as of the end of a reporting period. Lease payments made net of sublease income received related to these obligations reduce the overall liability. To the extent that the disposal or abandonment of related property and equipment results in gains or losses, such gains or losses are included in loss (gain) on disposal of assets in the consolidated statements of comprehensive income (loss), except for gains or losses on the disposal of property and equipment related to the 12 underperforming restaurants, which is included in restaurant closure charges, net on the consolidated statements of comprehensive income (loss).
Income Taxes
We use the liability method of accounting for income taxes. Deferred income taxes are provided for temporary differences between financial statement and income tax reporting, using tax rates scheduled to be in effect at the time the items giving rise to the deferred tax reserves. We recognize the impact of a tax position in the financial statements if that position is more likely than not of being sustained by the taxing authority. Accordingly, we report a liability for unrecognized tax benefits resulting from uncertain tax positions taken or expected to be taken in a tax return. We recognize interest and penalties, if any, related to unrecognized tax benefits in income tax expense.
We maintain deferred tax liabilities related to trademarks and other indefinite lived assets that are not netted against the deferred tax assets as reversal of the taxable temporary difference cannot serve as a source for realization of the deferred tax assets, because the deferred tax liability will not reverse until some indefinite future period when the assets are either sold or written down due to an impairment. Federal and state net operating loss carryforwards begin to expire in 2034 and 2027, respectively. We have determined that we do meet the “more likely than not” threshold that all net operating losses, tax credits and other deferred tax assets will be realized. We considered the weight of both positive and negative evidence and concluded that it is more likely than not that the net deferred tax assets will be realized and that no valuation allowance was required as of the date of acquisition. Accordingly, a valuation allowance is not required.
Stock-Based Compensation
We measure and recognize compensation expense for all share-based payment awards made to employees based on their estimated grant date fair values using the Black-Scholes option pricing model for stock option grants and the closing price of the underlying common stock on the date of the grant for restricted stock awards. Stock-based compensation expense for our share-based compensation awards is recognized ratably over the vesting period on a straight-line vesting schedule.
In order to calculate stock options’ fair values and the associated compensation costs for share-based awards, we utilize the Black-Scholes option pricing model, and we have developed estimates of various inputs including forfeiture rate, expected term, expected volatility and risk-free interest rate. These assumptions generally require significant judgment. The forfeiture rate is based on historical rates and reduces the compensation expense recognized. The expected life of options granted is derived from the average of the contractual term of the option and the vesting period. Expected volatility is estimated using historical data from selected peer public company restaurants. These are selected based on similarities of size and other financial and operational characteristics. Volatility is calculated with reference to the historical daily closing equity prices of peer companies, prior to the grant date, over a period equal to the expected term. We calculate the risk-free interest rate using published U.S. Treasury rates in effect at the time of the grant with similar duration of the expected life of the options. We have not paid any dividends to date and we do not anticipate paying any cash dividends for the foreseeable future and therefore use an expected dividend yield of zero for option valuation purposes.
If in the future we determine that another method is more reasonable, or if another method for calculating these input assumptions is prescribed by authoritative guidance, and, therefore, should be used to estimate volatility or expected life, the fair value calculated for stock options could change significantly. Higher volatility and longer expected lives result in an increase to stock-based compensation expense determined at the date of grant. Stock-based compensation expense is included within general and administrative expense.
We estimates forfeiture rates based on an analysis of actual forfeitures and will continue to evaluate the appropriateness of the forfeiture rate based on actual forfeiture experience, analysis of employee turnover behavior and other factors. Changes in the estimated forfeiture rate can have a significant effect on reported stock-based compensation expense, as the cumulative effect
63
of adjusting the rate for all expense amortization is recognized in the period the forfeiture estimate is changed. If a revised forfeiture rate is higher than the previously estimated forfeiture rate, an adjustment is made that will result in a decrease to the stock-based compensation expense recognized in the financial statements. If a revised forfeiture rate is lower than the previously estimated forfeiture rate, an adjustment is made that will result in an increase to the stock-based compensation expense recognized in the financial statements. We will continue to use significant judgment in evaluating the expected term, volatility and forfeiture rate related to stock-based compensation.
Recently Adopted and Recently Issued Accounting Standards
See Note 2, Basis of Presentation and Summary of Significant Accounting Policies, in the notes to the accompanying consolidated financial statements, included elsewhere in this annual report on Form 10-K, for a description of the recently adopted and recently issued accounting standards.
ITEM 7A. Quantitative and Qualitative Disclosures About Market Risk
Interest Rate Risk
We are exposed to market risk from changes in interest rates on our senior credit facility debt, which currently bears interest at variable rates. As of December 29, 2015, we had outstanding variable rate borrowings of $154.0 million. A 1.00% increase in the effective interest rate applied to this borrowing would result in a pre-tax interest expense increase of $1.5 million on an annualized basis.
Commodity Price Risk
We purchase certain products that are affected by commodity prices and are, therefore, subject to price volatility caused by weather, market conditions and other factors which are not considered predictable or within our control. Although these products are subject to changes in commodity prices, certain purchasing contracts or pricing arrangements used contain risk management techniques designed to minimize price volatility. In many cases, we believe we will be able to address material commodity cost increases by adjusting menu pricing or making other operational adjustments that increase productivity. However, increases in commodity prices, without adjustments to menu prices, could increase restaurant operating costs as a percentage of restaurant sales.
Inflation
Inflation has an impact on food, paper, construction, utility, labor and benefits, rent, general and administrative and other costs, all of which can materially impact operations. We have a substantial number of hourly employees who are paid wage rates at or based on the applicable federal, state or local minimum wage and increases in the minimum wage will increase labor costs. From July 1, 2014 to December 31, 2015, the State of California (where a majority of company-operated restaurants are located) has had a minimum wage of $9.00 per hour. From January 1, 2008 to June 30, 2014, California minimum wage had been $8.00 per hour. The California minimum wage increased to $10.00 per hour on January 1, 2016.
In addition, in September 2015, the Los Angeles County Board of Supervisors approved increases to the minimum wage to $15.00 per hour by 2020 with the first phase of the wage increase to $10.50 effective on July 1, 2016. This ordinance is expected to impact 25 company-operated restaurants and 8 franchise-owned restaurants in the City of Los Angeles and in the unincorporated areas of the County of Los Angeles. On July 1, 2015, the Healthy Workplaces, Healthy Families Act of 2014 went into effect for California employees, which provides up to three days of paid sick leave for employees who work more than 30 days within a year. In general, we have been able to substantially offset cost increases resulting from inflation by increasing menu prices, managing menu mix, improving productivity or through other adjustments. We may or may not be able to offset cost increases in the future.
64
ITEM 8. Financial Statements and Supplementary Data
INDEX TO CONSOLIDATED FINANCIAL STATEMENTS
65
Report of Independent Registered Public Accounting Firm
The Board of Directors and Shareholders of
Del Taco Restaurants, Inc. and
Del Taco Holdings, Inc.
We have audited the accompanying consolidated balance sheet of Del Taco Restaurants, Inc. as of December 29, 2015, and the related consolidated statements of comprehensive income (loss), shareholders’ equity and cash flows for the 26 week period ended December 29, 2015. We have also audited the accompanying consolidated balance sheet of Del Taco Holdings, Inc. as of December 30, 2014, and the related consolidated statements of comprehensive income (loss), shareholders’ equity and cash flows for the 26 week period ended June 30, 2015 and the 52 week periods ended December 30, 2014 and December 31, 2013. These financial statements are the responsibility of the Company’s management. Our responsibility is to express an opinion on these financial statements based on our audits.
We conducted our audits in accordance with the standards of the Public Company Accounting Oversight Board (United States). Those standards require that we plan and perform the audit to obtain reasonable assurance about whether the financial statements are free of material misstatement. We were not engaged to perform an audit of the Company’s internal control over financial reporting. Our audits included consideration of internal control over financial reporting as a basis for designing audit procedures that are appropriate in the circumstances, but not for the purpose of expressing an opinion on the effectiveness of the Company’s internal control over financial reporting. Accordingly, we express no such opinion. An audit also includes examining, on a test basis, evidence supporting the amounts and disclosures in the financial statements, assessing the accounting principles used and significant estimates made by management, and evaluating the overall financial statement presentation. We believe that our audits provide a reasonable basis for our opinion.
In our opinion, the financial statements referred to above present fairly, in all material respects, the consolidated financial position of Del Taco Restaurants, Inc. at December 29, 2015, and the consolidated results of its operations and its cash flows for the 26 week period ended December 29, 2015, in conformity with U.S. generally accepted accounting principles. It is also our opinion that the financial statements referred to above present fairly, in all material respects, the consolidated financial position of Del Taco Holdings, Inc. at December 30, 2014, and the consolidated results of its operations and its cash flows for the 26 week period ended June 30, 2015 and the 52 week periods ended December 30, 2014 and December 31, 2013, in conformity with U.S. generally accepted accounting principles.
/s/ Ernst & Young, LLP
Irvine, California
March 7, 2016
66
Del Taco Restaurants, Inc. | |||||||||
Consolidated Balance Sheets | |||||||||
(In thousands, except share and per share data) | |||||||||
Successor | Predecessor | ||||||||
December 29, 2015 | December 30, 2014 | ||||||||
Assets | |||||||||
Current assets: | |||||||||
Cash and cash equivalents | $ | 10,194 | $ | 8,553 | |||||
Accounts and other receivables, net | 3,220 | 3,383 | |||||||
Inventories | 2,806 | 2,687 | |||||||
Prepaid expenses and other current assets | 3,545 | 3,816 | |||||||
Total current assets | 19,765 | 18,439 | |||||||
Property and equipment, net | 114,030 | 85,164 | |||||||
Goodwill | 318,275 | 281,200 | |||||||
Trademarks | 220,300 | 144,000 | |||||||
Intangible assets, net | 28,373 | 17,683 | |||||||
Other assets, net | 2,829 | 2,833 | |||||||
Total assets | $ | 703,572 | $ | 549,319 | |||||
Liabilities and shareholders’ equity | |||||||||
Current liabilities: | |||||||||
Accounts payable | $ | 16,831 | $ | 14,645 | |||||
Other accrued liabilities | 32,897 | 31,906 | |||||||
Current portion of capital lease obligations and deemed landlord financing liabilities | 1,725 | 1,634 | |||||||
Total current liabilities | 51,453 | 48,185 | |||||||
Long-term debt, capital lease obligations and deemed landlord financing liabilities, excluding current portion, net | 167,968 | 321,049 | |||||||
Deferred income taxes | 79,523 | 64,918 | |||||||
Warrant liability | — | 8,309 | |||||||
Other non-current liabilities | 36,251 | 25,454 | |||||||
Total liabilities | 335,195 | 467,915 | |||||||
Commitments and contingencies (Note 16) | |||||||||
Shareholders’ equity: | |||||||||
Del Taco Holdings, Inc. (Predecessor) preferred stock, $0.01 par value; 200,000 shares authorized; no shares issued and outstanding | — | — | |||||||
Del Taco Restaurants, Inc. (Successor) preferred stock, $0.0001 par value; 1,000,000 shares authorized; no shares issued and outstanding | — | — | |||||||
Del Taco Holdings, Inc. (Predecessor) common stock, $0.01 par value; 5,800,000 shares authorized; 3,907,835 shares issued and outstanding at December 30, 2014 | — | 39 | |||||||
Del Taco Restaurants, Inc. (Successor) common stock, $0.0001 par value; 400,000,000 shares authorized; 38,802,425 shares issued and outstanding at December 29, 2015 | 4 | — | |||||||
Additional paid-in capital | 372,260 | 110,941 | |||||||
Accumulated other comprehensive loss | — | (409 | ) | ||||||
Retained earnings (accumulated deficit) | (3,887 | ) | (29,167 | ) | |||||
Total shareholders’ equity | 368,377 | 81,404 | |||||||
Total liabilities and shareholders’ equity | $ | 703,572 | $ | 549,319 | |||||
See accompanying notes to consolidated financial statements.
67
Del Taco Restaurants, Inc. | |||||||||||||||||
Consolidated Statements of Comprehensive Income (Loss) | |||||||||||||||||
(In thousands, except share and per share data) | |||||||||||||||||
Successor | Predecessor | ||||||||||||||||
26 Weeks Ended December 29, 2015 | 26 Weeks Ended June 30, 2015 | 52 Weeks Ended December 30, 2014 | 52 Weeks Ended December 31, 2013 | ||||||||||||||
Revenue: | |||||||||||||||||
Company restaurant sales | $ | 206,939 | $ | 200,676 | $ | 380,800 | $ | 356,306 | |||||||||
Franchise revenue | 7,328 | 6,693 | 12,973 | 12,515 | |||||||||||||
Franchise sublease income | 1,183 | 1,183 | 2,251 | 2,167 | |||||||||||||
Total revenue | 215,450 | 208,552 | 396,024 | 370,988 | |||||||||||||
Operating expenses: | |||||||||||||||||
Restaurant operating expenses: | |||||||||||||||||
Food and paper costs | 59,263 | 57,447 | 110,708 | 105,492 | |||||||||||||
Labor and related expenses | 61,448 | 61,120 | 116,920 | 108,788 | |||||||||||||
Occupancy and other operating expenses | 43,191 | 43,611 | 82,021 | 77,205 | |||||||||||||
General and administrative | 17,501 | 14,850 | 28,136 | 23,112 | |||||||||||||
Depreciation and amortization | 11,276 | 8,252 | 18,752 | 19,850 | |||||||||||||
Occupancy and other - franchise subleases | 1,140 | 1,109 | 2,145 | 2,073 | |||||||||||||
Pre-opening costs | 366 | 276 | 462 | 596 | |||||||||||||
Impairment of long-lived assets | — | — | 9,617 | — | |||||||||||||
Restaurant closure charges, net | 2,015 | 94 | 82 | 298 | |||||||||||||
Loss (gain) on disposal of assets | 3 | 99 | (151 | ) | 209 | ||||||||||||
Total operating expenses | 196,203 | 186,858 | 368,692 | 337,623 | |||||||||||||
Income from operations | 19,247 | 21,694 | 27,332 | 33,365 | |||||||||||||
Other expense (income), net: | |||||||||||||||||
Interest expense | 3,652 | 11,491 | 30,895 | 35,613 | |||||||||||||
Other income | (220 | ) | — | — | — | ||||||||||||
Transaction-related costs | 12,972 | 7,255 | 1,936 | — | |||||||||||||
Debt modification costs | 78 | 139 | 1,241 | 4,178 | |||||||||||||
Change in fair value of warrant liability | — | (35 | ) | 1,417 | 33 | ||||||||||||
Total other expense (income), net | 16,482 | 18,850 | 35,489 | 39,824 | |||||||||||||
Income (loss) from operations before provision for income taxes | 2,765 | 2,844 | (8,157 | ) | (6,459 | ) | |||||||||||
Provision for income taxes | 112 | 740 | 1,098 | 80 | |||||||||||||
Net income (loss) | 2,653 | 2,104 | (9,255 | ) | (6,539 | ) | |||||||||||
Other comprehensive income (loss): | |||||||||||||||||
Change in fair value of interest rate cap | — | (24 | ) | (125 | ) | (303 | ) | ||||||||||
Reclassification of interest rate cap amortization included in net income (loss) | — | 58 | 19 | 156 | |||||||||||||
Total other comprehensive income (loss), net | — | 34 | (106 | ) | (147 | ) | |||||||||||
Comprehensive income (loss) | $ | 2,653 | $ | 2,138 | $ | (9,361 | ) | $ | (6,686 | ) | |||||||
Earnings (loss) per share: | |||||||||||||||||
Basic | $ | 0.07 | $ | 0.38 | $ | (2.37 | ) | $ | (1.67 | ) | |||||||
Diluted | $ | 0.07 | $ | 0.37 | $ | (2.37 | ) | $ | (1.67 | ) | |||||||
Weighted-average shares outstanding: | |||||||||||||||||
Basic | 38,802,425 | 5,492,417 | 3,907,835 | 3,907,835 | |||||||||||||
Diluted | 40,249,993 | 5,610,859 | 3,907,835 | 3,907,835 | |||||||||||||
See accompanying notes to consolidated financial statements.
68
Del Taco Restaurants, Inc. | |||||||||||||||||||||||||||
Consolidated Statements of Shareholders’ Equity | |||||||||||||||||||||||||||
(In thousands, except share data) | |||||||||||||||||||||||||||
Del Taco Holdings, Inc. (Predecessor) | |||||||||||||||||||||||||||
Additional | Accumulated Other | Total | |||||||||||||||||||||||||
Preferred | Common Stock | Paid-in | Comprehensive | Accumulated | Shareholders’ | ||||||||||||||||||||||
Stock | Shares | Amount | Capital | Loss | Deficit | Equity | |||||||||||||||||||||
Balance at January 1, 2013 Predecessor | $ | — | 3,907,835 | $ | 39 | $ | 109,069 | $ | (156 | ) | $ | (13,373 | ) | $ | 95,579 | ||||||||||||
Net loss | — | — | — | — | — | (6,539 | ) | (6,539 | ) | ||||||||||||||||||
Other comprehensive loss, net of tax | — | — | — | — | (147 | ) | — | (147 | ) | ||||||||||||||||||
Comprehensive loss | (6,686 | ) | |||||||||||||||||||||||||
Stock-based compensation | — | — | — | 1,290 | — | — | 1,290 | ||||||||||||||||||||
Settlement of vested restricted stock units | — | — | — | (285 | ) | — | — | (285 | ) | ||||||||||||||||||
Balance at December 31, 2013 Predecessor | — | 3,907,835 | 39 | 110,074 | (303 | ) | (19,912 | ) | 89,898 | ||||||||||||||||||
Net loss | — | — | — | — | — | (9,255 | ) | (9,255 | ) | ||||||||||||||||||
Other comprehensive loss, net of tax | — | — | — | — | (106 | ) | — | (106 | ) | ||||||||||||||||||
Comprehensive loss | (9,361 | ) | |||||||||||||||||||||||||
Stock-based compensation | — | — | — | 954 | — | — | 954 | ||||||||||||||||||||
Settlement of vested restricted stock units | — | — | — | (87 | ) | — | — | (87 | ) | ||||||||||||||||||
Balance at December 30, 2014 Predecessor | — | 3,907,835 | 39 | 110,941 | (409 | ) | (29,167 | ) | 81,404 | ||||||||||||||||||
Net income | — | — | — | — | — | 2,104 | 2,104 | ||||||||||||||||||||
Other comprehensive income, net of tax | — | — | — | — | 34 | — | 34 | ||||||||||||||||||||
Comprehensive income | 2,138 | ||||||||||||||||||||||||||
Stock-based compensation | — | — | — | 532 | — | — | 532 | ||||||||||||||||||||
Exercise and settlement of warrants | — | 213,025 | 2 | 8,272 | — | — | 8,274 | ||||||||||||||||||||
Exercise of options and distribution of restricted stock units, net of tax withholding | — | 237,948 | 2 | (7,535 | ) | — | — | (7,533 | ) | ||||||||||||||||||
Issuance of common stock | — | 2,348,968 | 24 | 91,212 | — | — | 91,236 | ||||||||||||||||||||
Balance at June 30, 2015 Predecessor | $ | — | 6,707,776 | $ | 67 | $ | 203,422 | $ | (375 | ) | $ | (27,063 | ) | $ | 176,051 | ||||||||||||
Del Taco Restaurants, Inc. (Successor) | |||||||||||||||||||||||||||
Additional | Accumulated Other | Retained Earnings | Total | ||||||||||||||||||||||||
Preferred | Common Stock | Paid-in | Comprehensive | (Accumulated | Shareholders’ | ||||||||||||||||||||||
Stock | Shares | Amount | Capital | Loss | Deficit) | Equity | |||||||||||||||||||||
Balance at June 30, 2015 Successor | $ | — | 5,127,606 | $ | 1 | $ | 9,857 | $ | — | $ | (6,540 | ) | $ | 3,318 | |||||||||||||
Net income | — | — | — | — | — | 2,653 | 2,653 | ||||||||||||||||||||
Other comprehensive income, net of tax | — | — | — | — | — | — | — | ||||||||||||||||||||
Comprehensive income | 2,653 | ||||||||||||||||||||||||||
Common stock of Del Taco Restaurants, Inc. released from possible redemption | — | 13,621,279 | 1 | 136,212 | — | — | 136,213 | ||||||||||||||||||||
Issuance of common stock | — | 20,053,540 | 2 | 224,304 | — | — | 224,306 | ||||||||||||||||||||
Issuance of warrants | — | — | — | 389 | — | — | 389 | ||||||||||||||||||||
Stock-based compensation | — | — | — | 1,498 | — | — | 1,498 | ||||||||||||||||||||
Balance at December 29, 2015 Successor | $ | — | 38,802,425 | $ | 4 | $ | 372,260 | $ | — | $ | (3,887 | ) | $ | 368,377 | |||||||||||||
See accompanying notes to consolidated financial statements.
69
Del Taco Restaurants, Inc. | |||||||||||||||||
Consolidated Statements of Cash Flows | |||||||||||||||||
(In thousands) | |||||||||||||||||
Successor | Predecessor | ||||||||||||||||
26 Weeks Ended December 29, 2015 | 26 Weeks Ended June 30, 2015 | 52 Weeks Ended December 30, 2014 | 52 Weeks Ended December 31, 2013 | ||||||||||||||
Operating activities | |||||||||||||||||
Net income (loss) | $ | 2,653 | $ | 2,104 | $ | (9,255 | ) | $ | (6,539 | ) | |||||||
Adjustments to reconcile net income (loss) to net cash provided by operating activities: | |||||||||||||||||
Allowance for (recovery of) doubtful accounts | — | — | (10 | ) | 114 | ||||||||||||
Depreciation and amortization | 11,276 | 8,249 | 18,608 | 19,472 | |||||||||||||
Amortization of favorable and unfavorable lease assets and liabilities, net | (364 | ) | 3 | 144 | 378 | ||||||||||||
Amortization of deferred financing costs | 155 | 908 | 1,418 | 1,460 | |||||||||||||
Subordinated note interest paid-in-kind | — | 37 | 14,897 | 20,935 | |||||||||||||
Debt modification costs | 78 | 139 | 1,241 | 4,178 | |||||||||||||
Payment for interest rate cap | — | — | — | (453 | ) | ||||||||||||
Stock-based compensation | 1,498 | 532 | 954 | 1,290 | |||||||||||||
Change in fair value of warrant liability | — | (35 | ) | 1,417 | 33 | ||||||||||||
Impairment of long-lived assets | — | — | 9,617 | — | |||||||||||||
Deferred income taxes | 88 | 551 | 1,165 | 848 | |||||||||||||
Loss (gain) on disposal of assets | 3 | 99 | (151 | ) | 209 | ||||||||||||
Changes in operating assets and liabilities: | |||||||||||||||||
Accounts and other receivables, net | 8 | 154 | (1,355 | ) | (308 | ) | |||||||||||
Inventories | (265 | ) | 145 | (96 | ) | (320 | ) | ||||||||||
Prepaid expenses and other current assets | 653 | (426 | ) | (598 | ) | 189 | |||||||||||
Accounts payable | (3,309 | ) | 4,222 | 1,662 | (1,633 | ) | |||||||||||
Other accrued liabilities | 3,434 | (5,026 | ) | 4,468 | 3,510 | ||||||||||||
Other non-current liabilities | 1,177 | (1,573 | ) | 1,350 | (2,038 | ) | |||||||||||
Net cash provided by operating activities | 17,085 | 10,083 | 45,476 | 41,325 | |||||||||||||
Investing activities | |||||||||||||||||
Purchases of property and equipment | (18,593 | ) | (14,813 | ) | (17,416 | ) | (22,292 | ) | |||||||||
Proceeds from disposal of property and equipment | — | 42 | 212 | 2,931 | |||||||||||||
Proceeds from the Company’s trust account (see Note 3) | 149,989 | — | — | — | |||||||||||||
Purchases of other assets | (589 | ) | (513 | ) | (864 | ) | (636 | ) | |||||||||
Proceeds from dissolution of investments in partnerships | 1,586 | — | — | — | |||||||||||||
Acquisition of Del Taco Holdings, net of cash acquired | (89,827 | ) | — | — | — | ||||||||||||
Net cash provided by (used in) investing activities | 42,566 | (15,284 | ) | (18,068 | ) | (19,997 | ) | ||||||||||
Financing activities | |||||||||||||||||
Proceeds from term loan, net of debt discount | — | 23,654 | 60,388 | 170,648 | |||||||||||||
Proceeds from deemed landlord financing liabilities | 1,208 | — | 1,450 | 1,500 | |||||||||||||
Proceeds from issuance of common stock | 35,000 | 91,236 | — | — | |||||||||||||
Payment of tax withholding related to option exercises and distribution of restricted stock units | — | (7,533 | ) | — | — | ||||||||||||
Payments on term loans | (227,100 | ) | — | (22,500 | ) | (112,000 | ) | ||||||||||
Payments on capital leases and deemed landlord financing | (864 | ) | (831 | ) | (1,785 | ) | (1,562 | ) | |||||||||
Payment on subordinated notes | — | (108,113 | ) | (62,000 | ) | (75,500 | ) | ||||||||||
Proceeds from revolving credit facility, net of debt discount | 162,556 | 10,000 | — | 6,000 | |||||||||||||
Payments on revolving credit facility | (14,000 | ) | (6,000 | ) | — | (6,000 | ) | ||||||||||
Payments for debt issue costs | (484 | ) | (593 | ) | (392 | ) | (2,328 | ) | |||||||||
Repayment of note payable | (523 | ) | — | — | — | ||||||||||||
Payment of deferred underwriter compensation | (5,250 | ) | — | — | — | ||||||||||||
Settlement of vested restricted stock units | — | — | (87 | ) | (285 | ) | |||||||||||
Net cash (used in) provided by financing activities | (49,457 | ) | 1,820 | (24,926 | ) | (19,527 | ) | ||||||||||
Increase (decrease) in cash and cash equivalents | 10,194 | (3,381 | ) | 2,482 | 1,801 | ||||||||||||
Cash and cash equivalents at beginning of period | — | 8,553 | 6,071 | 4,270 | |||||||||||||
Cash and cash equivalents at end of period | $ | 10,194 | $ | 5,172 | $ | 8,553 | $ | 6,071 | |||||||||
Supplemental cash flow information: | |||||||||||||||||
Cash paid during the period for interest | $ | 3,216 | $ | 13,548 | $ | 12,500 | $ | 13,196 | |||||||||
Cash paid during the period for income taxes | 161 | 46 | 37 | 60 | |||||||||||||
Supplemental schedule of non-cash activities: | |||||||||||||||||
Accrued property and equipment purchases | $ | 2,766 | $ | 2,460 | $ | 911 | $ | 712 | |||||||||
70
Del Taco Restaurants, Inc. | |||||||||||||||||
Consolidated Statements of Cash Flows | |||||||||||||||||
(In thousands) | |||||||||||||||||
Successor | Predecessor | ||||||||||||||||
Write-offs against bad debt reserves | — | — | 33 | 5 | |||||||||||||
Amortization of interest rate cap into net income (loss), net of tax | — | 58 | 19 | 156 | |||||||||||||
Change in other asset for fair value of interest rate cap recorded to other comprehensive income (loss), net | — | (24 | ) | (125 | ) | (303 | ) | ||||||||||
Warrant liability reclassified to equity upon exercise of warrants | — | 8,274 | — | — | |||||||||||||
Issuance of shares for consideration in the acquisition of Del Taco Holdings, Inc. | 189,306 | — | — | — | |||||||||||||
Issuance of warrants as payment for working capital loans | 389 | — | — | — | |||||||||||||
Common stock of Del Taco Restaurants, Inc. reclassified to equity upon release from possible redemption | 136,213 | — | — | — | |||||||||||||
See accompanying notes to consolidated financial statements
71
Del Taco Restaurants, Inc.
Notes to Consolidated Financial Statements
December 29, 2015
1. Description of Business
Del Taco Restaurants, Inc. (f/k/a Levy Acquisition Corp. (“LAC”)) is a Delaware corporation headquartered in Lake Forest, California. The consolidated financial statements include the accounts of Del Taco Restaurants, Inc. and its wholly owned subsidiaries (collectively, the “Company” or “Del Taco”). The Company develops, franchises, owns, and operates Del Taco quick-service Mexican-American restaurants. At December 29, 2015, there were 297 company-operated and 247 franchised Del Taco restaurants located in 16 states, including one franchised unit in Guam. At December 30, 2014, there were 304 company-operated and 243 franchised Del Taco restaurants located in 16 states, including one franchised unit in Guam.
The Company was originally incorporated in Delaware on August 2, 2013 as a special purpose acquisition company, formed for the purpose of effecting a merger, capital stock exchange, asset acquisition, stock purchase, reorganization or other similar business combination with one or more businesses. On June 30, 2015 (the “Closing Date”), the Company consummated its business combination with Del Taco Holdings, Inc. (“DTH”) pursuant to the agreement and plan of merger dated as of March 12, 2015 by and among LAC, Levy Merger Sub, LLC (“Levy Merger Sub”), LAC’s wholly owned subsidiary, and DTH (the “Merger Agreement”). Under the Merger Agreement, Levy Merger Sub merged with and into DTH, with DTH surviving the merger as a wholly-owned subsidiary of the Company (the “Business Combination” or “Merger”). In connection with the closing of the Business Combination, the Company changed its name from Levy Acquisition Corp. to Del Taco Restaurants, Inc. See Note 3 for further discussion of the Business Combination.
DTH has no material assets or operations. DTH's direct subsidiary, F&C Restaurant Holding Co. ("F&C RHC") also has no material assets or operations, but was the issuer of subordinated notes in May 2010. F&C RHCs' direct subsidiary, Sagittarius Restaurants LLC ("SAG Restaurants"), also has no material assets or operations and was also an issuer of subordinated notes in May 2010. The outstanding balances for the F&C RHC and SAG Restaurants subordinated notes were fully redeemed in March 2015. See Note 7 for additional discussion on the F&C RHC and SAG Restaurants subordinated notes.
2. Basis of Presentation and Summary of Significant Accounting Policies
Basis of Presentation
As a result of the Business Combination, the Company is the acquirer for accounting purposes, and DTH is the acquiree and accounting predecessor. The Company’s financial statement presentation distinguishes a “Predecessor” for DTH for periods prior to the Closing Date. The Company is the “Successor” for periods after the Closing Date, which includes consolidation of DTH subsequent to the Business Combination on June 30, 2015. The Merger was accounted for as a business combination using the acquisition method of accounting, and the Successor financial statements reflect a new basis of accounting that is based on the fair value of the net assets acquired. See Note 3 for further discussion of the Business Combination. As a result of the application of the acquisition method of accounting as of the Closing Date, the financial statements for the Predecessor period and for the Successor period are presented on a different basis of accounting and are therefore, not comparable. The historical financial information of Del Taco, formerly LAC, prior to the Business Combination has not been reflected in the financial statements as those amounts have been considered de-minimus.
For the Consolidated Statements of Shareholders’ Equity, the Predecessor results reflect the equity balances and activities of DTH at January 1, 2013 through June 30, 2015 prior to the closing of the Business Combination and the Successor results reflect the LAC equity balances at June 30, 2015 prior to the closing of the Business Combination and the activities for Del Taco through December 29, 2015.
The Company’s fiscal year ends on the Tuesday closest to December 31. Fiscal years 2015, 2014 and 2013 are all fifty-two week periods. In a fifty-two week fiscal year, the first, second and third quarters each include twelve weeks of operations and the fourth quarter includes sixteen weeks of operations. For fiscal year 2015, the Company’s financial statements reflect the twenty-six weeks ended December 29, 2015 (Successor) and twenty-six weeks ended June 30, 2015 (Predecessor). For fiscal year 2014 and 2013, the Company’s financial statements reflect the fifty-two weeks ended December 30, 2014 (Predecessor) and December 31, 2013, respectively (Predecessor).
72
Reclassifications
Certain prior year amounts in the consolidated balance sheets, Note 7 and Note 14, related to debt issuance costs and the current portion of deferred tax assets and liabilities, have been reclassified to conform to the current year presentation related to the adoption of two accounting standard updates. See "Recently Adopted Accounting Standards" policy below for more discussion.
Principles of Consolidation
The consolidated financial statements included herein have been prepared in accordance with generally accepted accounting principles in the United States of America (“U.S. GAAP”) and the rules and regulations of Securities and Exchange Commission (“SEC”). The accompanying consolidated financial statements include the accounts of the Company and its wholly and majority owned subsidiaries. All intercompany balances and transactions have been eliminated in consolidation.
Use of Estimates
The preparation of the consolidated financial statements in conformity with U.S. GAAP requires management to make estimates and assumptions that affect the amounts reported in the consolidated financial statements and accompanying notes. Management believes that such estimates have been based on reasonable and supportable assumptions and the resulting estimates are reasonable for use in the preparation of the consolidated financial statements. Actual results could differ from these estimates. The Company’s significant estimates include estimates for impairment of goodwill, intangible assets and property and equipment, valuations provided in business combinations, insurance reserves, restaurant closure reserves, stock-based compensation, contingent liabilities, certain leasing activities and income tax valuation allowances.
SUMMARY OF SIGNIFICANT ACCOUNTING POLICIES
Variable Interest Entities
In accordance with Accounting Standards Codification ("ASC") 810, Consolidation, the Company applies the guidance related to variable interest entities ("VIE"), which defines the process for how an enterprise determines which party consolidates a VIE as primarily a qualitative analysis. The enterprise that consolidates the VIE (the primary beneficiary) is defined as the enterprise with (1) the power to direct activities of the VIE that most significantly affect the VIEs economic performance and (2) the obligation to absorb losses of the VIE or the right to receive benefits from the VIE. The Company franchises its operations through franchise agreements entered into with franchisees and therefore, the Company does not possess any ownership interests in franchise entities or other affiliates. The franchise agreements are designed to provide the franchisee with key decision-making ability to enable it to oversee its operations and to have a significant impact on the success of the franchise, while the Company’s decision-making rights are related to protecting the Company’s brand. Additionally, the Company held a 1% ownership interest in four public limited partnerships in which the Company served as general partner. The limited partners had substantive kick-out rights over the general partner giving the limited partners power to direct the activities of the limited partnerships. The partnerships were liquidated and dissolved in December 2015. See the Related Party Transactions policy below for more information. Based upon the Company’s analysis of all the relevant facts and considerations of the franchise entities and the four public limited partnerships, the Company has concluded that the franchise agreements are not variable interest entities and the four public limited partnerships were not variable interest entities.
Revenue Recognition
Company restaurant sales from the operation of company-operated restaurants are recognized when food and service is delivered to customers. Franchise revenue comprise (i) development fees, (ii) franchise fees, (iii) on-going royalties and (iv) renewal fees. Development and franchise fees, portions of which are collected in advance and are non-refundable, received pursuant to individual development agreements, grant the right to develop franchised restaurants in future periods in specific geographic areas. Both development fees and franchise fees are deferred and recognized as revenue when the Company has substantially fulfilled its obligation pursuant to the development agreement. Development fees and franchise fees are generally recognized as revenue upon the opening of a franchise restaurant or upon termination of the development agreement with the franchisee. Deferred development fees and deferred franchise fees, which are included in other non-current liabilities on the consolidated balance sheets totaled $1.9 million and $1.7 million as of December 29, 2015 (Successor) and December 30, 2014
73
(Predecessor), respectively. Royalties from franchised restaurants are based on a percentage of franchise restaurant sales and are recognized in the period the related franchise restaurant sales occur. Renewal fees are recognized when a renewal agreement becomes effective. The Company reports revenue net of sales taxes collected from customers and remitted to governmental taxing authorities. Promotional allowances totaled approximately $5.8 million and $5.4 million during the twenty-six weeks ended December 29, 2015 (Successor) and June 30, 2015 (Predecessor), respectively, and $11.0 million and $9.6 million during the fifty-two weeks ended December 30, 2014 (Predecessor) and December 31, 2013 (Predecessor), respectively. Franchise sublease income is comprised of rental income associated with properties leased or subleased to franchisees and is recognized as revenue on an accrual basis.
Gift Cards
The Company sells gift cards to customers in its restaurants. The gift cards sold to customers have no stated expiration dates and are subject to potential escheatment laws in the various jurisdictions in which the Company operates. Deferred gift card income of $2.2 million and $2.0 million is recorded in other non-current liabilities on the consolidated balance sheets as of December 29, 2015 (Successor) and December 30, 2014 (Predecessor), respectively. The Company recognizes revenue from gift cards: (i) when the gift card is redeemed by the customer; or (ii) under the delayed recognition method, when the likelihood of the gift card being redeemed by the customer is remote (gift card breakage) and the Company determines that there is not a legal obligation to remit the unredeemed gift cards to the relevant jurisdiction. The determination of the gift card breakage rate is based upon Company specific historical redemption patterns. Recognized breakage revenue was not significant to any period presented in the consolidated statements of comprehensive income (loss). Any future revisions to the estimated breakage rate may result in changes in the amount of breakage revenue recognized in future periods but is not expected to be significant.
Cash and Cash Equivalents
The Company considers short-term, highly liquid investments with original maturities of three months or less when purchased to be cash equivalents. Amounts receivable from credit card issuers are typically converted to cash within 2 to 4 days of the original sales transaction and are considered to be cash equivalents.
Accounts and Other Receivables, Net
Accounts and other receivables, net consist primarily of receivables from franchisees, sublease tenants, a vendor and landlords. Receivables from franchisees include sublease rents, royalties, services and contractual marketing fees associated with the franchise agreements. Sublease rent receivables relate to subleased properties where the Company is a party and obligated on the primary lease agreement. The vendor receivable is for earned reimbursements from a vendor and the landlord receivable is for earned landlord reimbursement related to restaurants opened. The Company recorded an insurance claim receivable for $0.3 million as of December 29, 2015 for reimbursement it received in 2016 from its insurance company for legal defense costs it paid in excess of the deductible, as described in detail in Note 16. The allowance for doubtful accounts is based on historical experience and a review on a specific identification basis of the collectability of existing receivables and totaled $0.1 million as of both December 29, 2015 (Successor) and December 30, 2014 (Predecessor).
Vendor Allowances
The Company receives support from one of its vendors in the form of reimbursements. The reimbursements are agreed upon with the vendor, but do not represent specific, incremental, identifiable costs incurred by the Company in selling the vendor’s products. Such reimbursements are recorded as a reduction of the costs of purchasing the vendor’s products. The non-current portion of reimbursements received by the Company in advance is included in other non-current liabilities on the consolidated balance sheets and totaled $2.0 million and $2.4 million as of December 29, 2015 (Successor) and December 30, 2014 (Predecessor), respectively. The current portion of these reimbursements is included in other accrued liabilities on the consolidated balance sheets and totaled $0.4 million as of both December 29, 2015 (Successor) and December 30, 2014 (Predecessor).
74
Inventories
Inventories, consisting of food items, packaging and beverages, are valued at the lower of cost (first-in, first-out method) or market.
Property and Equipment
Property and equipment includes land, buildings, leasehold improvements, restaurant and other equipment, and buildings under capital leases. Land, leasehold improvements, property and equipment acquired in business combinations are initially recorded at their estimated fair value. Land, leasehold improvements, property and equipment acquired or constructed in the normal course of business are initially recorded at cost. The Company provides for depreciation and amortization based on the estimated useful lives of assets using the straight-line method.
Estimated useful lives for property and equipment are as follows:
Buildings | 20–35 years | |
Leasehold improvements | Shorter of useful life (typically 20 years) or lease term | |
Buildings under capital leases | Shorter of useful life (typically 20 years) or lease term | |
Restaurant and other equipment | 3–15 years | |
The estimated useful lives for leasehold improvements are based on the shorter of the estimated useful lives of the assets or the related lease term, which generally includes reasonably assured option periods expected to be exercised by the Company when the Company would suffer an economic penalty if not exercised. Depreciation and amortization expense associated with property and equipment totaled $10.1 million and $7.1 million for the twenty-six weeks ended December 29, 2015 (Successor) and June 30, 2015 (Predecessor), respectively and $16.0 million, and $16.9 million for the fifty-two weeks ended December 30, 2014 (Predecessor) and December 31, 2013 (Predecessor), respectively. These amounts include $0.8 million and $0.3 million for the twenty-six weeks ended December 29, 2015 (Successor) and June 30, 2015 (Predecessor), respectively, and $0.7 million and $0.8 million for the fifty-two weeks ended December 30, 2014 (Predecessor) and December 31, 2013 (Predecessor), respectively, related to buildings under capital leases. Accumulated depreciation and amortization associated with property and equipment includes $0.8 million and $4.1 million related to buildings under capital leases as of December 29, 2015 (Successor) and December 30, 2014 (Predecessor), respectively.
Gains and losses on the disposal of assets are recorded as the difference between the net proceeds received and net carrying values of the assets disposed and are included in loss (gain) on disposal of assets in the consolidated statements of comprehensive income (loss).
Deferred Financing Costs
Deferred financing costs represent third-party debt costs that are capitalized and amortized to interest expense over the associated term using the effective interest method. Deferred financing costs, along with lender debt discount, are presented net of the related debt balances on the consolidated balance sheets.
Goodwill and Trademarks
The Company’s goodwill and trademarks are not amortized, but tested annually for impairment and tested more frequently for impairment if events and circumstances indicate that the asset might be impaired. The Company conducts annual goodwill and trademark impairment tests in the fourth quarter of each fiscal year or whenever an indicator of impairment exists.
In assessing potential goodwill impairment, the Company has the option to first assess the qualitative factors to determine whether events or circumstances indicate that it is more likely than not that the fair value of net assets, including goodwill, is less than its carrying amount. If the qualitative factors indicate that it is more likely than not that the fair value of net assets, including goodwill, is less than its carrying amount, the Company performs a two-step impairment test of goodwill. In the first step, the Company estimates the fair value of net assets, including goodwill, and compare it to the carrying value of net assets,
75
including goodwill. If the carrying value exceeds the estimated fair value of net assets, including goodwill, the second step is performed to measure the amount of the impairment loss, if any. In the second step, the amount of the impairment loss is the excess of the carrying amount of the goodwill over its implied fair value.
The methods the Company uses to estimate fair value include discounted future cash flows analysis and market valuation based on similar companies. Key assumptions included in the cash flow model include future revenues, operating costs, working capital changes, capital expenditures and a discount rate that approximates our weighted average cost of capital.
In assessing potential impairment of the Company’s indefinite-lived trademark, the Company uses a quantitative impairment analysis, which compares the fair value of the indefinite-lived trademark, based on discounted future cash flows using a relief from royalty methodology. If the carrying amount of the indefinite-lived trademark exceeds its fair value, an impairment loss is measured as the difference between the implied fair value of the trademark and its carrying amount.
Intangible Assets, Net
Intangible assets primarily include favorable lease assets and franchise rights. Favorable lease assets represent the fair values of acquired lease contracts having contractual rents that are favorable compared to fair market rents as of the acquisition date, and are amortized on the straight-line basis over the remaining lease term to expense in the consolidated statements of comprehensive income (loss). Franchise rights, which represent the fair value of franchise agreements based on the projected royalty revenue stream, are amortized on the straight-line basis to depreciation and amortization expense in the consolidated statements of comprehensive income (loss) over the term of the franchise agreements.
Other Assets, Net
Other assets, net consist of security deposits and other capitalized costs. The Company capitalizes certain computer software and software development costs incurred in connection with developing or obtaining computer software for internal use when both the preliminary project stage is completed and it is probable that the software will be used as intended. Capitalized software costs include only (i) external direct costs of materials and services utilized in developing or obtaining computer software, and (ii) compensation and related benefits for employees who are directly associated with the software project. Capitalized software costs are amortized over the estimated useful life, typically 3 years. The net carrying value of capitalized software costs for the Company totaled $1.7 million and $1.4 million as of December 29, 2015 (Successor) and December 30, 2014 (Predecessor), respectively, and is included in other assets, net in the consolidated balance sheets. Capitalized software costs totaled $0.6 million and $0.5 million for the twenty-six weeks ended December 29, 2015 (Successor) and June 30, 2015 (Predecessor), respectively and $1.0 million and $0.7 million for the fifty-two weeks ended December 30, 2014 (Predecessor) and December 31, 2013 (Predecessor), respectively. Amortization expenses totaled $0.4 million for both the twenty-six weeks ended December 29, 2015 (Successor) and June 30, 2015 (Predecessor), and $0.7 million for both the fifty-two weeks ended December 30, 2014 (Predecessor) and December 31, 2013 (Predecessor).
The Company has elected to account for construction costs in a manner such that costs with a future benefit for the projects are capitalized. Capitalized construction costs totaled $0.5 million for both the twenty-six weeks ended December 29, 2015 (Successor) and June 30, 2015 (Predecessor), and $1.0 million and $1.1 million for the fifty-two weeks ended December 30, 2014 (Predecessor) and December 31, 2013 (Predecessor), respectively. If the Company subsequently makes a determination that a site for which development costs have been capitalized will not be acquired or developed, any previously capitalized development costs are expensed and included in occupancy and other operating expenses in the consolidated statements of comprehensive income (loss). The Company capitalizes interest in connection with the construction of its restaurants. Interest capitalized totaled approximately $25,000 and $40,000 for the twenty-six weeks ended December 29, 2015 (Successor) and June 30, 2015 (Predecessor), respectively, and $0.1 million for both the fifty-two weeks ended December 30, 2014 (Predecessor) and December 31, 2013 (Predecessor).
Long-Lived Assets
Long-lived assets, including property and equipment and definite lived intangible assets (other than goodwill and indefinite-lived intangible assets), are reviewed by the Company for impairment whenever events or changes in circumstances indicate that the carrying amount may not be recoverable. Long-lived assets are grouped and evaluated for impairment at the lowest
76
level for which there are identifiable cash flows that are independent of the cash flows of other groups of assets. The Company evaluates such cash flows for individual restaurants and franchise agreements on an undiscounted basis. If it is determined that the carrying amounts of such long-lived assets are not recoverable, the assets are written down to their estimated fair values. The Company generally estimates fair value using either the land and building real estate value for the respective restaurant or the discounted value of the estimated cash flows associated with the respective restaurant or agreement.
Rent Expense and Deferred Rent Liability
The Company has non-cancelable lease agreements for certain restaurant land and buildings under terms ranging up to 35 years, with one to four options to extend the lease generally for five to ten years per option period. At inception, each lease is evaluated to determine whether it will be classified as an operating or capital lease. Certain leases provide for contingent rentals based on percentages of net sales or have other provisions obligating the Company to pay related property taxes and certain other expenses. Contingent rentals are generally based on sales levels in excess of stipulated amounts as defined in the lease agreement, and thus are not considered minimum lease payments and are included in rent expense as incurred. Certain leases contain fixed and determinable escalation clauses for which the Company recognizes rental expense under these leases on the straight-line basis over the lease terms, which includes the period of time from when the Company takes possession of the leased space until the restaurant opening date (the rent holiday period), and the cumulative expense recognized on the straight-line basis in excess of the cumulative payments is included in other non-current liabilities. In addition, the Company subleases certain buildings and equipment to franchisees and other unrelated third parties, which are classified as direct financing leases and/or operating leases.
In some cases, the land and building the Company will lease requires construction to ready the space for its intended use, and in certain cases, the Company has involvement with the construction of leased assets. The construction period begins when the Company executes the lease agreement with the landlord and continues until the space is substantially complete and ready for its intended use. In accordance with ASC 840, Leases, the Company must consider the nature and extent of its involvement during the construction period.
The Company may expend cash for structural additions on leased premises that may be reimbursed in whole or in part by landlords as construction contributions pursuant to agreed-upon terms in the leases. Depending on the specifics of the leased space and the lease agreement, the amounts paid for structural components will be recorded during the construction period as construction-in-progress and the landlord construction contributions will be recorded as a deferred rent liability. Upon completion of construction for those leases that meet certain criteria, the lease may qualify for sale-leaseback treatment. For these leases, the deferred rent liability and the associated construction-in-progress will be removed and any gain on sale will be recorded as deferred income and amortized over the lease term to gain on disposal of assets and any loss on sale will be expensed immediately to loss on disposal of assets. If the lease does not qualify for sale-leaseback treatment, the deferred rent liability will be reclassified to a deemed landlord financing liability and will be amortized over the lease term based on the rent payments designated in the lease agreement with rent payments applied to deemed landlord financing liability and interest expense.
Unfavorable lease liabilities are amortized on a straight-line basis over the expected lease term to expense in the consolidated statements of comprehensive income (loss). As of December 29, 2015 (Successor) and December 30, 2014 (Predecessor), unfavorable lease liabilities had a gross carrying value of $21.0 million and $8.4 million, respectively, with accumulated amortization of $1.3 million and $3.1 million, respectively. The Company reclassified $2.6 million of unfavorable lease liabilities during the fourth quarter of fiscal 2015 related to the 12 closed underperforming locations and re-characterized the amount as restaurant closure liability, as described in Note 4. Amortization credits recorded for unfavorable lease liabilities were $1.3 million and $0.3 million during the twenty-six weeks ended December 29, 2015 (Successor) and June 30, 2015 (Predecessor), respectively, and $0.7 million during both the fifty-two weeks ended December 30, 2014 (Predecessor) and December 31, 2013 (Predecessor). The weighted-average amortization period as of December 29, 2015 (Successor) for unfavorable lease liabilities equaled 9.7 years. The estimated future amortization for unfavorable lease liabilities for the next five fiscal years is as follows (in thousands):
77
Unfavorable Lease Liabilities | ||||
2016 | $ | 2,613 | ||
2017 | 2,514 | |||
2018 | 2,325 | |||
2019 | 2,107 | |||
2020 | 1,952 | |||
Insurance Reserves
Given the nature of the Company’s operating environment, the Company is subject to workers’ compensation and general liability claims. To mitigate a portion of these risks, the Company maintains insurance for individual claims in excess of deductibles per claim (the Company’s insurance deductibles range from $0.25 million to $0.50 million per occurrence for workers’ compensation and are $0.35 million per occurrence for general liability). The amount of self-insurance loss reserves and loss adjustment expenses is determined based on an estimation process that uses information obtained from both Company-specific and industry data, as well as general economic information. Self-insurance loss reserves are based on estimates of expected losses for determining reported claims and as the basis for estimating claims incurred but not reported. The estimation process for self-insurance loss exposure requires management to continuously monitor and evaluate the life cycle of claims. Management also monitors the reasonableness of the judgments made in the prior year’s estimation process (referred to as a hindsight analysis) and adjusts current year assumptions based on the hindsight analysis. The Company utilizes actuarial methods to evaluate open claims and estimate the ongoing development exposure related to workers’ compensation and general liability.
Advertising Costs
Franchisees pay a monthly fee to the Company of 4% of their restaurants’ net sales as reimbursement for advertising and promotional services that the Company provides. Fees received in advance of payment for provided services are included in other accrued liabilities and were $0.4 million and $0.9 million at December 29, 2015 (Successor) and December 30, 2014 (Predecessor), respectively. Company-operated restaurants contribute to the advertising fund on the same basis as franchised restaurants. At December 29, 2015 (Successor) and December 30, 2014 (Predecessor), the Company had an additional $0.6 million and $1.2 million, respectively, accrued for this requirement.
Production costs for radio and television advertising are expensed when the commercials are initially aired. Costs of distribution of advertising are charged to expense on the date the advertising is aired or distributed. These costs, as well as other marketing-related expenses for advertising are included in occupancy and other operating expenses in the consolidated statements of comprehensive income (loss). Advertising expenses for the Company were $7.6 million and $8.7 million for the twenty-six weeks ended December 29, 2015 (Successor) and June 30, 2015 (Predecessor), respectively, and $15.2 million and $14.3 million for the fifty-two weeks ended December 30, 2014 (Predecessor) and December 31, 2013 (Predecessor), respectively.
Pre-opening Costs
Pre-opening costs, which include restaurant labor, supplies, rent expense and other costs incurred prior to the opening of a new restaurant are expensed as incurred. Pre-opening costs were $0.4 million and $0.3 million for the twenty-six weeks ended December 29, 2015 (Successor) and June 30, 2015 (Predecessor), respectively, and $0.5 million and $0.6 million for the fifty-two weeks ended December 30, 2014 (Predecessor) and December 31, 2013 (Predecessor), respectively.
Restaurant Closure Charges, Net
The Company makes decisions to close restaurants based on their cash flows, anticipated future profitability and leasing arrangements. The Company determines if discontinued operations treatment is appropriate and estimates the future obligations, if any, associated with the closure of restaurants and records the corresponding restaurant closure liability at the time the restaurant is closed. These restaurant closure obligations primarily consist of the liability for the present value of future
78
lease obligations, net of estimated sublease income. Restaurant closure charges, net are comprised of direct costs related to the restaurant closure and initial charges associated with the recording of the liability at fair value, accretion of the restaurant closure liability during the period, and any positive or negative adjustments to the restaurant closure liability in subsequent periods as more information becomes available. Changes to the estimated liability for future lease obligations based on new facts and circumstances are considered to be a change in estimate and are recorded prospectively. Accretion expense is recorded in order to appropriately reflect the present value of the lease obligations as of the end of a reporting period. Lease payments made net of sublease income received related to these obligations reduce the overall liability. To the extent that the disposal or abandonment of related property and equipment results in gains or losses, such gains or losses are included in loss (gain) on disposal of assets in the consolidated statements of comprehensive income (loss), except for gains or losses on the disposal of property and equipment related to the 12 underperforming restaurants, which is included in restaurant closure charges, net on the consolidated statements of comprehensive income (loss).
Stock-Based Compensation Expense
The Company measures and recognizes compensation expense for all share-based payment awards made to employees based on their estimated grant date fair values using the Black-Scholes option pricing model for option grants and the closing price of the underlying common stock on the date of the grant for restricted stock awards. Stock-based compensation expense for the Company’s stock-based compensation awards is recognized ratably over the vesting period on a straight-line basis.
Income Taxes
The Company uses the liability method of accounting for income taxes. Deferred income taxes are provided for temporary differences between financial statement and income tax reporting, using tax rates scheduled to be in effect at the time the items giving rise to the deferred taxes reverse. The Company recognizes the impact of a tax position in the financial statements if that position is more likely than not of being sustained by the taxing authority. Accordingly, the Company reports a liability for unrecognized tax benefits resulting from uncertain tax positions taken or expected to be taken in a tax return. The Company recognizes interest and penalties, if any, related to unrecognized tax benefits in income tax expense.
Derivative Instruments and Hedging Activities
The Company is exposed to variability in future cash flows resulting from fluctuations in interest rates related to its variable rate debt. As part of its overall strategy to manage the level of exposure to the risk of fluctuations in interest rates, the Company has used various interest rate contracts including interest rate caps. The Company recognizes all derivative instruments as either assets or liabilities at fair value in the consolidated balance sheets. When they qualify as hedging instruments, the Company designates interest rate caps as cash flow hedges of forecasted variable rate interest payments on certain debt principal balances.
For derivative instruments that are designated and qualify as cash flow hedges, the effective portion of the gain or loss on the derivative is reported as a component of other comprehensive income (loss) and reclassified into earnings in the same period or periods during which the hedged transaction affects earnings. Gains and losses on the derivative representing hedge ineffectiveness are recognized in current earnings.
The Company enters into interest rate derivative contracts with major banks and is exposed to losses in the event of nonperformance by these banks. The Company anticipates, however, that these banks will be able to fully satisfy their obligations under the contracts. Accordingly, the Company does not obtain collateral or other security to support the contracts.
Contingencies
The Company recognizes liabilities for contingencies when an exposure that indicates it is probable that an asset has been impaired or that a liability has been incurred and the amount of impairment or loss can be reasonably estimated. The Company’s ultimate legal and financial liability with respect to such matters cannot be estimated with certainty and requires the use of estimates. When the reasonable estimate is a range, the recorded loss will be the best estimate within the range. The Company records legal settlement costs when those costs are probable and reasonably estimable.
79
Comprehensive Income (Loss)
Comprehensive income (loss) includes changes in equity from transactions and other events and circumstances from nonoperational sources, including, among other things, the Company’s unrealized gains and losses on effective interest rate caps which are included in other comprehensive income (loss), net of tax.
Segment Information
An operating segment is defined as a component of an enterprise that engages in business activities from which it may earn revenues and incur expenses, and about which separate financial information is regularly evaluated by the Company’s chief operating decision makers in deciding how to allocate resources. Similar operating segments can be aggregated into a single operating segment if the businesses are similar. Management has determined that the Company has one operating segment, and therefore one reportable segment. The Company’s chief operating decision maker (CODM) is its Chief Executive Officer; its CODM reviews financial performance and allocates resources at a consolidated level on a recurring basis.
Related Party Transactions
The Company previously entered into long-term leases for 22 Del Taco restaurants whereby the lessor is one of four public partnerships where the Company serves as general partner with a 1% ownership interest. The leases required monthly rent payments in an amount equal to 12% of gross sales which were recorded within occupancy and other operating expenses in the consolidated statements of comprehensive income (loss) and totaled $1.4 million for both the twenty-six weeks ended December 29, 2015 (Successor) and June 30, 2015 (Predecessor), and $2.9 million for both the fifty-two weeks ended December 30, 2014 (Predecessor) and December 31, 2013 (Predecessor), respectively.
The Company recorded a fair value adjustment through the initial purchase price allocation, as described in Note 3, of $1.5 million for the estimated fair value of its investment in the four public partnerships.
On July 24, 2015, the four public partnerships entered into an agreement to sell all of the properties, subject to the approval by a majority in interest of the limited partners in each of the public partnerships, to a third party that is not affiliated with the Company. The sale of the properties included new long-term leases between the Company and the third party buyer and was approved by the respective limited partners on November 23, 2015. On December 14, 2015, the four public partnerships consummated the sale, and were subsequently liquidated and dissolved and the assets of the respective partnerships were distributed pursuant to the terms of their respective partnership agreements. During the twenty-six weeks ended December 29, 2015, the Company recorded a gain of $0.2 million, included in other income in the consolidated statements of comprehensive income (loss), based on the approximate $1.8 million distribution received in excess of the $1.6 million carrying value of its investment in the partnerships.
At December 30, 2014 (Predecessor), DTH had $108.1 million of subordinated notes outstanding due to its three largest shareholders that bore interest at 13.0%. On March 20, 2015, DTH used proceeds from the Step 1 of the Business Combination, as described in Note 3, a $10.0 million revolver borrowing and amended term loan proceeds of $25.1 million to fully redeem the then outstanding balance of $111.2 million of subordinated notes. Interest expense related to subordinated notes was $3.1 million for the twenty-six weeks ended June 30, 2015 (Predecessor) and $15.4 million (of which $0.5 million was paid in cash in connection with the debt refinancing in April 2014) and $20.9 million for the fifty-two weeks ended December 30, 2014 (Predecessor) and December 31, 2013 (Predecessor), respectively. See Note 7 for further discussion regarding the subordinated notes.
Fair Value of Financial Instruments
The Company measures fair value using the exchange price that would be received for an asset or paid to transfer a liability (an exit price) in the principal or most advantageous market for the asset or liability in an orderly transaction between market participants on the measurement date. The Company uses valuation techniques that maximize the use of observable inputs and minimize the use of unobservable inputs. Based on the underlying inputs, each fair value measurement in its entirety is reported in one of the three tiers in the fair value hierarchy, which prioritizes the inputs used in measuring fair value. These tiers include:
80
• | Level 1, defined as observable inputs such as quoted prices in active markets; |
• | Level 2, defined as inputs other than quoted prices in active markets that are either directly or indirectly observable; and |
• | Level 3, defined as unobservable inputs which reflect the Company’s own estimates of assumptions that market participants would use in pricing the asset or liability. Valuation techniques may include the use of third-party pricing services, option pricing models, discounted cash flow models and similar techniques. |
Concentration of Risks
Financial instruments that potentially subject the Company to a concentration of credit risk are cash and cash equivalents. The Company maintains its day-to-day operating cash balances in non-interest-bearing accounts. Although the Company at times maintains balances that exceed amounts insured by the Federal Deposit Insurance Corporation, it has not experienced any losses related to these balances and management believes the credit risk to be minimal.
The Company extends credit to franchisees for franchise and advertising fees on customary credit terms, which generally do not require collateral or other security. In addition, management believes there is no concentration of risk with any single franchisee or small group of franchisees whose failure or nonperformance would materially affect the Company’s results of operations.
The Company has entered into a long-term purchase agreement with a distributor for delivery of essentially all food and paper supplies to all company-operated and franchised restaurants except for one location in Guam. Disruption in shipments from this distributor could have a material adverse effect on the results of operations and financial condition of the Company. However, management of the Company believes it would be able to negotiate a similarly priced contract with another distributor.
As of December 29, 2015, Del Taco operated a total of 368 restaurants in California (245 company-owned and 123 franchised locations). As a result, the Company is particularly susceptible to adverse trends and economic conditions in California. In addition, given this geographic concentration, negative publicity regarding any of the restaurants in California could have a material adverse effect on the Company’s business and operations, as could other regional occurrences such as local strikes, earthquakes or other natural disasters.
Recently Issued Accounting Standards
In February 2016, the Financial Accounting Standards Board ("FASB") issued Accounting Standard Update ("ASU") No. 2016-02, Leases (Topic 842). This guidance will result in key changes to lease accounting and will aim to bring leases onto balance sheets to give investors, lenders, and other financial statement users a more comprehensive view of a company's long-term financial obligations as well as the assets it owns versus leases. The new leasing standard will be effective for fiscal years beginning after December 15, 2018, and for interim periods within those fiscal years. The Company is currently evaluating the impact this guidance will have on our consolidated financial statements as well as the expected adoption method.
In August 2014, FASB issued ASU No. 2014-15, Presentation of Financial Statements - Going Concern (Subtopic 205-40): Disclosure of Uncertainties about an Entity’s Ability to Continue as a Going Concern. This update requires management of the Company to evaluate whether there is substantial doubt about the Company’s ability to continue as a going concern. This update is effective for the annual period ending after December 15, 2016, and for annual and interim periods thereafter. Early adoption is permitted. The Company does not expect this standard to have an impact on the Company’s consolidated financial position or results of operations.
In May 2014, the FASB issued ASU No. 2014-09, Revenue from Contracts with Customers (Topic 606), which provides a comprehensive new revenue recognition model that requires a company to recognize revenue in an amount that reflects the consideration it expects to receive for the transfer of promised goods or services to its customers. The standard also requires additional disclosure regarding the nature, amount, timing and uncertainty of revenue and cash flows arising from contracts with customers. This ASU is effective for annual periods and interim periods beginning after December 15, 2017. The ASU is to be applied retrospectively or using a cumulative effect transition method and early adoption is not permitted. The Company is currently evaluating which transition method to use and the effect that this pronouncement will have on our consolidated financial statements and related disclosures.
81
Recently Adopted Accounting Standards
In November 2015, the FASB issued ASU No. 2015-17, Income Taxes which requires that deferred tax liabilities and assets be classified as non-current in a classified balance sheet. Prior to the issuance of the standard, deferred tax liabilities and assets were required to be separately classified into a current amount and a non-current amount in the balance sheet. The new accounting guidance represents a change in accounting principle and the standard is required to be adopted in annual periods beginning after December 15, 2016, with early adoption permitted. The Company early adopted ASU No. 2015-17 during the fourth fiscal quarter ended December 29, 2015 and applied the guidance retrospectively to all periods presented. Accordingly, the Company reclassified the prior period amount of $0.2 million related to its deferred tax liability from current deferred income taxes to non-current deferred income taxes for the same amount for that period. Because the application of this guidance affects classification only, such reclassifications did not have a material effect on the Company’s consolidated financial position or results of operations.
In April 2015, the FASB issued ASU No. 2015-3, Simplifying the Presentation of Debt Issuance Costs. To simplify presentation of debt financing costs, the standard requires that debt financing costs be presented in the balance sheet as a direct deduction from the carrying amount of debt liability, consistent with debt discounts or premiums. The recognition and measurement guidance for debt financing costs would not be affected by the amendments in this update. ASU No. 2015-3 applies to all entities and is effective for annual reporting periods beginning after December 15, 2015, with early adoption permitted. The standard is to be applied retrospectively. The Company early adopted ASU No. 2015-03 during the fourth fiscal quarter ended December 29, 2015 and upon adoption reclassified its debt financing costs net with its debt liability. Accordingly, the Company reclassified the prior period amount of $0.7 million related to its deferred financing costs from other assets, net to long-term debt, capital lease obligations and deemed landlord financing liabilities, excluding current portion, net on the consolidated balance sheets.
3. Business Combination
On June 30, 2015, the Company and DTH completed the Business Combination pursuant to the Merger Agreement under which the Company’s wholly-owned subsidiary, Levy Merger Sub, merged with and into DTH, with DTH surviving the merger as a wholly-owned subsidiary of the Company.
Concurrent with the execution of the Merger Agreement, Levy Epic Acquisition Company, LLC (“Levy Newco”), Levy Epic Acquisition Company II, LLC (“Levy Newco II” and with Levy Newco, the “Levy Newco Parties”), DTH and the DTH stockholders entered into a stock purchase agreement (the “Stock Purchase Agreement”). Pursuant to the Stock Purchase Agreement, the Levy Newco Parties agreed to purchase 2,348,968 shares of DTH common stock from DTH for $91.2 million in cash, and to purchase 740,564 shares of DTH common stock directly from existing DTH shareholders for $28.8 million in cash (the “Initial Investment”). As a result of this Initial Investment, an aggregate of 3,089,532 shares of DTH common stock was purchased by the Levy Newco Parties for total cash consideration of $120.0 million. Concurrent with the consummation of the Initial Investment, DTH increased its borrowing capacity under its existing term loan credit facility by $25.1 million. Proceeds from the increased borrowings under the term loan, a $10.0 million revolver borrowing and the $91.2 million received by DTH from the sale of DTH common stock to the Levy Newco Parties was used to fully repay the outstanding balance of DTH’s subordinated notes (see Note 7), and pay approximately $15.7 million of transaction costs, which included $7.5 million of employee withholding taxes resulting from the acceleration of outstanding stock options and restricted stock units due to the change in control triggered by the Initial Investment. Employee equity redemptions were exchanged for such withholding taxes. The transactions described in this paragraph are hereafter collectively referred to as “Step 1.”
Also concurrent with Step 1, the Company entered into common stock purchase agreements pursuant to which certain investors committed to acquire 3,500,000 shares of the Company’s common stock upon the closing of the Business Combination for total consideration of $35 million (the “Step 2 Investment”). The additional funds provided by these investors were used as additional cash consideration in the Business Combination.
The consideration for the Business Combination was provided by (1) the funds remaining in the Company’s trust account of $150 million after Delaware franchise taxes, stockholder redemptions, and $10.2 million of expenses paid for by the Company, (2) the $35 million provided by the Step 2 Investment, and (3) shares of the Company’s common stock. The Levy Newco Parties received only stock merger consideration in the Business Combination. The common stock purchase agreements entered
82
into in connection with the Step 1 Investment and the closing of the Business Combination is hereafter referred to as “Step 2.” Step 1 and Step 2 are collectively referred to herein as the “Transactions.”
Step 2 is accounted for as a business combination under the scope of the FASB’s ASC 805, Business Combinations, or ASC 805. Pursuant to ASC 805, the Company has been determined to be the accounting acquirer based on the evaluation of the following facts and circumstances:
• | The Company paid cash and equity consideration for all of the equity in DTH; |
• | Investments by the Company and Levy Newco Parties were considered multiple arrangements that should be treated as a single transaction for accounting purposes; and |
• | The existing stockholders of the Company and the Levy Newco Parties retain relatively more voting rights in the combined company than the historical DTH stockholders. |
DTH constitutes a business, with inputs, processes, and outputs. Accordingly, the acquisition of DTH constitutes the acquisition of a business for purposes of ASC 805, and due to the change in control from the merger, is accounted for using the acquisition method.
The following summarizes the merger consideration paid to DTH stockholders (except for the Levy Newco Parties) (in thousands):
Calculation of Purchase Price | |||
Cash consideration paid (1) | $ | 105,164 | |
Value of share consideration issued (2) | 69,305 | ||
Fair value of equity interests acquired in Step 1 (3) | 120,000 | ||
Less: Transaction expenses paid by the Company (1) | (10,164 | ) | |
Total purchase price | $ | 284,305 | |
(1) | Each issued and outstanding share of DTH stock held by DTH stockholders other than the Levy Newco Parties was converted into the right to receive the per share merger consideration, which equaled $38.84 per DTH share, payable in cash and the Company’s common stock. Cash consideration was paid with respect to all common stock of DTH except for shares held by the Levy Newco Parties. The aggregate amount of cash consideration paid directly to DTH stockholders was $95 million. Total cash consideration paid also included $10.2 million of expenses paid by the Company for the closing of Step 2. |
(2) | The stock merger consideration consisted of the Company’s common stock issued to DTH stockholders as part of the merger consideration in exchange for shares of DTH common stock. Company shares exchanged for the DTH shares held by the Levy Newco Parties are discussed in (3) below. The following summarizes the number of shares of the Company’s common stock issued to DTH stockholders other than the Levy Newco Parties: |
(in thousands, except share and per share data) | Calculation of Share Consideration | ||
Number of shares issued | 4,553,540 | ||
Value per share as of June 30, 2015 | $ | 15.22 | |
Value of share consideration transferred | $ | 69,305 | |
(3) | The Company exchanged its common stock for DTH shares held by the Levy Newco Parties acquired in Step 1. The Transactions were accounted for as related events transferring control of DTH to the Company through a minority investment in Step 1 and a controlling interest in Step 2. The Levy Newco Parties’ shares of DTH common stock were exchanged for shares of the Company’s common stock in the Business Combination, but represent a previously held equity interest in an acquired company. The previously held equity interest had the same value as its $120 million purchase price. |
83
The Company recorded a preliminary allocation of the purchase price to DTH’s tangible and identifiable intangible assets acquired and liabilities assumed based on their fair value as of the Closing Date. The preliminary purchase price allocation is as follows (in thousands):
Preliminary Purchase Price Allocation | |||
Cash and cash equivalents | $ | 5,173 | |
Accounts receivable and other receivables | 3,228 | ||
Inventories | 2,541 | ||
Prepaid expenses and other current assets | 4,266 | ||
Total current assets | 15,208 | ||
Property and equipment | 105,524 | ||
Intangible assets | 250,490 | ||
Other assets | 4,194 | ||
Total identifiable assets acquired | 375,416 | ||
Accounts payable | (18,866 | ) | |
Other accrued liabilities | (26,607 | ) | |
Current portion of capital lease obligations and deemed landlord financing liabilities | (1,670 | ) | |
Long-term debt, capital lease obligations and deemed landlord financing liabilities | (246,562 | ) | |
Deferred income taxes | (79,473 | ) | |
Other long-term liabilities | (36,208 | ) | |
Net identifiable liabilities assumed | (33,970 | ) | |
Goodwill | 318,275 | ||
Total gross consideration | $ | 284,305 | |
The preliminary values allocated to intangible assets and the useful lives are as follows (in thousands):
Fair Value | Useful life | |||||
Favorable lease assets and other intangible assets | $ | 14,290 | 0.6 to 19 years | |||
Trademarks | 220,300 | Indefinite | ||||
Franchise agreements | 15,900 | 0.1 to 40 years | ||||
Total intangible assets | $ | 250,490 | ||||
Unfavorable lease liabilities (1) | $ | (23,652 | ) | 1.5 to 19 years | ||
Weighted average life of definite-lived intangibles | 11 years | |||||
(1) | Included in other non-current liabilities on the consolidated balance sheets. |
The preliminary allocation of the purchase price is based on preliminary valuations performed to determine the fair value of the net assets as of the Closing Date. During the fourth fiscal quarter ended December 29, 2015, the Company recorded a net $1.1 million adjustment to goodwill primarily due to a change in estimate for the valuation of property and equipment and the liability for uncertain tax positions. This allocation is subject to revision as the assessment of tax matters are based on preliminary information and subject to refinement. The Company is subject to tax regulatory requirements in each of the jurisdictions in which it operates. The Company has conducted a preliminary assessment of liabilities arising from these tax matters in each of these jurisdictions, and has recognized provisional amounts in its preliminary allocation for the identified assets and liabilities. However, the Company is continuing its procedures to identify information pertaining to these matters during the measurement period. The Company has not obtained all necessary information to finalize its provisional amounts pertaining to income taxes. If new information is obtained about facts and circumstances that existed at the Closing Date, the
84
Company will either adjust its measurement of provisional amounts or recognize and measure assets and liabilities not previously identified. The final valuation of the assets and liabilities could have a material impact on the preliminary purchase price allocation disclosed above.
The goodwill of $318.3 million arising from the Business Combination is primarily attributable to the market position and future growth potential of DTH for both company-operated and franchised restaurants. Approximately $0.6 million of goodwill is expected to be deductible for income tax purposes.
For the twenty-six weeks ended December 29, 2015 (Successor) and June 30, 2015 (Predecessor), the Company incurred approximately $12.3 million and $7.3 million, respectively, of transaction related expenses directly related to Step 1 and Step 2 of the Business Combination. Also included in transaction related costs on the consolidated statements of comprehensive income (loss) for the twenty-six weeks ended December 29, 2015 (Successor) is $0.7 million of costs related to the secondary offering, as described in Note 12.
LAC incurred $4.5 million of transaction related expenses not reported with DTH’s Predecessor consolidated statements of comprehensive income (loss) that were directly related to the Business Combination for the twenty-six weeks ended June 30, 2015 (Predecessor). Transaction related expenses, which were $2.9 million through the second fiscal quarter ended June 16, 2015 and $0.5 million for the fiscal year 2014, were reported by LAC in prior 10-Q and 10-K filings which are also not reported with DTH’s Predecessor consolidated statements of comprehensive income (loss). Cash outflows of $4.3 million related to transaction expenses previously expensed by LAC are reported as a cash outflows for operating activities for the twenty-six weeks ended December 29, 2015 (Successor). In addition, in connection with the Business Combination, the Company paid deferred underwriter compensation of $5.3 million in connection with the Company’s initial public offering in November 2013 as well as repaid working capital loans of $0.5 million to the Company’s sponsor, Levy Acquisition Sponsor LLC, both of which were accrued on LAC’s balance sheet at June 16, 2015, and not included with DTH’s Predecessor consolidated balance sheet. Both of these payments are included as cash outflows for financing activities for the twenty-six weeks ended December 29, 2015 (Successor).
The following unaudited pro forma combined financial information presents the Company’s results as though DTH and the Company had combined at January 1, 2014. The unaudited pro forma consolidated financial information has been prepared using the acquisition method of accounting in accordance with U.S. GAAP (in thousands):
52 Weeks Ended December 29, 2015 (pro forma) | 52 Weeks Ended December 30, 2014 (pro forma) | |||||||
(unaudited) | ||||||||
Total Revenue | $ | 424,002 | $ | 396,024 | ||||
Net loss | $ | (137 | ) | $ | (10,780 | ) | ||
4. Restaurant Closure and Other Related Charges
At December 29, 2015 (Successor) and December 30, 2014 (Predecessor), the restaurant closure liability is $4.8 million and $1.1 million, respectively. The current portion of the restaurant closure liability is $1.6 million and $0.3 million at December 29, 2015 (Successor) and December 30, 2014 (Predecessor), respectively, and is included in other accrued liabilities in the consolidated balance sheets. The non-current portion of the restaurant closure liability is $3.2 million and $0.8 million at December 29, 2015 (Successor) and December 30, 2014 (Predecessor), respectively, and is included in other non-current liabilities on the consolidated balance sheets. The details of the restaurant closure activities are discussed below.
Restaurant Closures and Lease Reserves
The following table presents other restaurant closure liability activity for each period related to prior restaurant closures and sublease income shortfalls (dollars in thousands):
85
Successor | Predecessor | ||||||||||||||||
26 Weeks Ended December 29, 2015 | 26 Weeks Ended June 30, 2015 | 52 Weeks Ended December 30, 2014 | 52 Weeks Ended December 31, 2013 | ||||||||||||||
Closure liability at beginning of period | $ | 1,037 | $ | 1,143 | $ | 1,396 | $ | 1,495 | |||||||||
Adjustments to prior period activity | 129 | 54 | (5 | ) | 186 | ||||||||||||
Charges for accretion in current period | 41 | 40 | 87 | 112 | |||||||||||||
Cash payments made | (184 | ) | (200 | ) | (335 | ) | (397 | ) | |||||||||
Closure liability at end of period | $ | 1,023 | $ | 1,037 | $ | 1,143 | $ | 1,396 | |||||||||
The current portion of the restaurant closure liability is $0.1 million and $0.3 million at December 29, 2015 (Successor) and December 30, 2014 (Predecessor), respectively, and is included in other accrued liabilities in the consolidated balance sheets. The non-current portion of the restaurant closure liability is $0.9 million and $0.8 million at December 29, 2015 (Successor) and December 30, 2014 (Predecessor), respectively, and is included in other non-current liabilities in the consolidated balance sheets.
Restaurant Closure and Other Related Charges for 12 Underperforming Restaurants
During the fourth fiscal quarter of 2015, the Company closed 12 company-operated restaurants as previously announced. No discontinued operations treatment was required for any of these closures. The Company recorded restaurant closure and other related charges of $4.5 million, offset by $2.7 million related to the re-characterization and reclassification of lease related liabilities, for a net charge of $1.8 million, which is included in restaurant closure charges, net on the consolidated statements of comprehensive income (loss). The charges include (1) the present value of the future lease obligations, net of estimated sublease income, (2) a lease termination payment, (3) brokerage commission, (4) post closure rent, utilities, property tax and common area maintenance charges, (5) unused food and paper that could not be redeployed, (6) Worker Adjustment and Retraining Notification ("WARN") act and stay bonus payments to terminated employees, and (7) other direct costs associated with the closures.
A summary of the restaurant closure liability activity for these 12 closed restaurants consisted of the following (in thousands):
One-time employee termination benefits | Contract termination costs | Other associated costs | Total | |||||||||||||
Balance at June 30, 2015 (Predecessor) | $ | — | $ | — | $ | — | $ | — | ||||||||
Charges | 168 | 1,289 | 388 | 1,845 | ||||||||||||
Payments | (168 | ) | (324 | ) | (225 | ) | (717 | ) | ||||||||
Reclassification of lease related liabilities (1) | — | 2,672 | — | 2,672 | ||||||||||||
Balance at December 29, 2015 (Successor) | $ | — | $ | 3,637 | $ | 163 | $ | 3,800 | ||||||||
(1) Fair value of lease related liabilities assumed in the purchase price allocation for these 12 restaurants reclassified as restaurant closure liability.
The current portion of the restaurant closure liability is $1.5 million at December 29, 2015 (Successor) and is included in other accrued liabilities in the consolidated balance sheets. The non-current portion of the restaurant closure liability is $2.3 million at December 29, 2015 (Successor) and is included in other non-current liabilities in the consolidated balance sheets.
86
5. Property and Equipment, Net
Property and equipment, net at December 29, 2015 (Successor) and December 30, 2014 (Predecessor) consisted of the following (in thousands):
Successor | Predecessor | ||||||||
December 29, 2015 | December 30, 2014 | ||||||||
Land | $ | 1,924 | $ | 1,399 | |||||
Buildings | 276 | 1,887 | |||||||
Restaurant and other equipment | 43,470 | 70,947 | |||||||
Leasehold improvements | 64,188 | 71,642 | |||||||
Buildings under capital leases | 5,452 | 6,396 | |||||||
Construction-in-progress | 8,813 | 2,836 | |||||||
124,123 | 155,107 | ||||||||
Less: Accumulated depreciation | (10,093 | ) | (69,943 | ) | |||||
Property and Equipment, Net | $ | 114,030 | $ | 85,164 | |||||
Impairment of long-lived assets (Predecessor)
DTH evaluated long-lived assets for indicators of impairment on a periodic basis or whenever events or changes in circumstances indicate that the carrying amount may not be recoverable. During Fiscal 2014, DTH evaluated certain restaurants that had indicators of impairment based on operating performance and recorded an impairment charge totaling $9.6 million. DTH wrote-off the value of leasehold improvements for those restaurants and wrote-off the value of restaurant and other equipment based on the estimate of future recoverable cash flows of the restaurant and other equipment assets. No impairment charges were recorded in continuing operations in the accompanying consolidated statements of comprehensive income (loss) for any of the other periods presented.
6. Goodwill and Other Intangible Assets
Changes in the carrying amount of goodwill for the fifty-two weeks ended December 29, 2015 (Successor) are as follows (in thousands):
Goodwill | |||
Balance as of December 30, 2014 (Predecessor) | $ | 281,200 | |
Elimination of Predecessor goodwill | (281,200 | ) | |
Acquisition of business | 318,275 | ||
Balance as of December 29, 2015 (Successor) | $ | 318,275 | |
The carrying value of trademarks was $220.3 million and $144.0 million at December 29, 2015 (Successor) and December 30, 2014 (Predecessor), respectively. The change in the carrying value of the trademarks from the prior year is due to fair value adjustments recorded through the purchase price allocation as described in Note 3.
The Company’s other intangible assets at December 29, 2015 (Successor) and December 30, 2014 (Predecessor) consisted of the following (in thousands):
87
Successor | Predecessor | ||||||||||||||||||||||||
December 29, 2015 | December 30, 2014 | ||||||||||||||||||||||||
Gross Carrying Amount | Accumulated Amortization | Net | Gross Carrying Amount | Accumulated Amortization | Net | ||||||||||||||||||||
Favorable lease assets | $ | 14,207 | $ | (1,020 | ) | $ | 13,187 | $ | 6,788 | $ | (3,282 | ) | $ | 3,506 | |||||||||||
Franchise rights | 15,897 | (711 | ) | 15,186 | 20,882 | (6,828 | ) | 14,054 | |||||||||||||||||
Other | — | — | — | 263 | (140 | ) | 123 | ||||||||||||||||||
Total amortized other intangible assets | $ | 30,104 | $ | (1,731 | ) | $ | 28,373 | $ | 27,933 | $ | (10,250 | ) | $ | 17,683 | |||||||||||
Goodwill and intangible assets at December 29, 2015 (Successor) are based on the preliminary purchase price allocation of DTH, which is based on preliminary valuations performed to determine the fair value of the acquired assets as of the acquisition date. The amount allocated to goodwill and other intangible assets are subject to final adjustment to reflect the final valuations. These final valuations could have a material impact on goodwill and other intangible assets. See Note 3 for further discussion of the acquisition of DTH. Two franchise locations closed during the fourth quarter of fiscal 2015 and accordingly, the Company wrote-off $3,000 of franchise rights during the twenty-six weeks ended December 29, 2015 (Successor). Additionally, the Company recorded the fair value of other intangible assets as part of the purchase price allocation related to its investment in four public partnerships, which were liquidated and dissolved in December 2015, as discussed in Note 2. Accordingly, the Company wrote-off the net carrying value of the intangible assets of $0.1 million at December 29, 2015 (Successor).
Favorable lease assets are related to below-market leasing arrangements. Favorable lease assets are amortized on a lease-by-lease basis using the straight-line method over the remaining lease terms of the underlying leases. Franchise rights are amortized using the straight-line method over the remaining life of the franchise agreements or 40 years, whichever is less. The weighted-average amortization periods as of December 29, 2015 (Successor) for favorable lease assets and franchise rights equaled 9.0 years and 14.8 years, respectively.
Amortization expense for amortizable intangible assets totaled $1.7 million, $1.0 million, $2.7 million and $2.9 million for the twenty-six weeks ended December 29, 2015 (Successor), twenty-six weeks ended June 30, 2015 (Predecessor), fifty-two weeks ended December 30, 2014 (Predecessor), and fifty-two weeks ended December 31, 2013 (Predecessor), respectively, and includes amortization of favorable lease assets of $1.0 million, $0.3 million, $0.8 million and $1.1 million for the twenty-six weeks ended December 29, 2015 (Successor), twenty-six weeks ended June 30, 2015 (Predecessor), fifty-two weeks ended December 30, 2014 (Predecessor) and fifty-two weeks ended December 31, 2013 (Predecessor), respectively, and amortization of franchise rights of $0.7 million, $0.7 million, $1.9 million and $1.8 million for the twenty-six weeks ended December 29, 2015 (Successor), twenty-six weeks ended June 30, 2015 (Predecessor), fifty-two weeks ended December 30, 2014 (Predecessor) and fifty-two weeks ended December 31 2013 (Predecessor), respectively. The estimated future amortization for favorable lease assets and franchise rights for the next five fiscal years is as follows (in thousands):
Favorable Lease Assets | Franchise Rights | |||||||
2016 | $ | 2,007 | $ | 1,420 | ||||
2017 | 1,878 | 1,400 | ||||||
2018 | 1,722 | 1,360 | ||||||
2019 | 1,447 | 1,311 | ||||||
2020 | 1,171 | 1,229 | ||||||
88
7. Debt, Obligations Under Capital Leases and Deemed Landlord Financing Liabilities
The Company’s debt, obligations under capital leases and deemed landlord financing liabilities at December 29, 2015 (Successor) and December 30, 2014 (Predecessor) consisted of the following (in thousands):
Successor | Predecessor | ||||||||
December 29, 2015 | December 30, 2014 | ||||||||
2015 Senior Credit Facility, net of debt discount of $1,328 and deferred financing costs of $448 at December 29, 2015 | $ | 152,224 | $ | — | |||||
2013 Term Loan, net of debt discount of $4,559 and deferred financing costs of $715 at December 30, 2014 | — | 196,726 | |||||||
SAG Restaurants subordinated notes | — | 35,887 | |||||||
F&C RHC subordinated notes | — | 72,189 | |||||||
2013 Revolver | — | — | |||||||
Total outstanding indebtedness | 152,224 | 304,802 | |||||||
Obligations under capital leases and deemed landlord financing liabilities | 17,469 | 17,881 | |||||||
Total debt, net | 169,693 | 322,683 | |||||||
Less: amounts due within one year | 1,725 | 1,634 | |||||||
Total amounts due after one year, net | $ | 167,968 | $ | 321,049 | |||||
At December 29, 2015 (Successor), the Company assessed the amounts recorded under the 2015 Senior Credit Facility and determined that such amounts approximated fair value. At December 30, 2014 (Predecessor), the estimated fair value of long-term debt instruments was based on quoted inactive market prices and is therefore classified as Level 2 within the valuation hierarchy, as described in Note 9.
2015 Revolving Credit Facility (Successor)
On August 4, 2015, the Company refinanced its existing senior credit facility (“2013 Senior Credit Facility”) and entered into a new credit agreement (the “Credit Agreement”). The Credit Agreement, which matures on August 4, 2020, provides for a $250 million revolving credit facility (the “2015 Senior Credit Facility”). The Company utilized $164 million of proceeds from the Credit Agreement to refinance in total its 2013 Senior Credit Facility and pay costs associated with the refinancing. The 2013 Senior Credit Facility, as amended March 20, 2015, totaled $267.1 million, consisting of an initial $227.1 million term loan (“2013 Term Loan”) and a $40 million revolver (“2013 Revolver”). At the time of the refinance, a $162.5 million term loan balance was outstanding and $17.6 million of revolver capacity was utilized to support outstanding letters of credit under the 2013 Senior Credit Facility.
At the Company’s option, loans under the 2015 Senior Credit Facility may bear interest at a base rate or LIBOR, plus an applicable margin determined in accordance with a consolidated total lease adjusted leverage ratio-based pricing grid. The base rate is calculated as the highest of (a) the Federal Funds Rate plus 1⁄2 of 1%, (b) the prime rate of Bank of America, and (c) LIBOR plus 1.00%. For LIBOR loans, the applicable margin is in the range of 1.50% to 2.50%, and for base rate loans the applicable margin is in the range of 0.50% and 1.50%. The applicable margin is initially set at 2.00% for LIBOR loans and at 1.00% for base rate loans until delivery of financial statements and a compliance certificate for the fourth fiscal quarter ending after the closing date of the Credit Agreement. The 2015 Senior Credit Facility capacity used to support letters of credit currently incurs fees equal to the applicable margin of 2.0%. The 2015 Senior Credit Facility unused commitment currently incurs a 0.25% fee.
The Credit Agreement contains certain financial covenants, including the maintenance of a consolidated total lease adjusted leverage ratio and a consolidated fixed charge coverage ratio. The Company was in compliance with the financial covenants as of December 29, 2015 (Successor). Substantially all of the assets of the Company are pledged as collateral under the 2015 Senior Credit Facility.
89
The Company capitalized lender debt discount costs and deferred financing costs of $1.4 million and $0.5 million, respectively, in connection with the refinancing. Lender debt discount costs and deferred financing costs associated with the 2015 Senior Credit Facility are presented net of the 2015 Senior Credit Facility balance on the consolidated balance sheets and will be amortized to interest expense over the term of the 2015 Senior Credit Facility. Amortization of deferred financing costs and debt discount related to the 2015 Senior Credit Facility totaled $0.2 million during the twenty-six weeks ended December 29, 2015 (Successor).
At December 29, 2015 (Successor), the weighted average interest rate on the outstanding balance of the 2015 Senior Credit Facility was 2.3%. At December 29, 2015 (Successor), the Company had a total of $76.7 million of availability for additional borrowings under the 2015 Senior Credit Facility as the Company had $154.0 million of outstanding borrowings and $19.3 million of letters of credit outstanding which reduce availability under the 2015 Senior Credit Facility.
DTH 2013 Senior Credit Facility
On April 1, 2013, DTH entered into the 2013 Senior Credit Facility totaling $215 million consisting of a $175.0 million term loan (the "2013 Term Loan") and $40.0 million revolving credit facility (the "2013 Revolver") with maturity dates of October 1, 2018 and April 1, 2018, respectively. Proceeds from the 2013 Senior Credit Facility were used to pay off the outstanding balance of $99.5 million on the then existing term loan and for a partial redemption of $75.5 million of SAG Restaurants subordinated notes (the "April 2013 Debt Refinance").
DTH determined that the April 2013 Debt Refinance did not result in a troubled debt restructuring or significant debt modification. DTH incurred lender and third-party costs associated with the April 2013 Debt Refinance of $6.7 million of which $0.4 million was capitalized as deferred financing costs, $4.4 million was capitalized as lender debt discount and $1.9 million was expensed as debt modification costs in the consolidated statements of comprehensive income (loss) for the fifty-two weeks ended December 31, 2013 (Predecessor). The $1.9 million consisted of direct costs of $0.6 million associated with the April 2013 Debt Refinance and a prepayment premium of $1.3 million that DTH paid in connection with the partial redemption of the SAG Restaurants subordinated notes. Debt modification costs also includes $0.1 million expense associated with an interest rate cap agreement related to the previously existing senior credit facility and deferred financing costs and debt discount associated with the lenders from the previously existing senior credit facility who did not participate in the 2013 Senior Credit Facility totaling $1.3 million and $0.9 million, respectively. The remaining deferred financing costs and debt discount associated with the previously existing senior credit facility related to lenders who also participated in the 2013 Senior Credit Facility totaling $0.6 million and $1.0 million, respectively, were carried over as deferred financing costs and lender debt discount under the 2013 Senior Credit Facility.
On April 21, 2014, DTH amended its 2013 Senior Credit Facility whereby the term loan was increased by $62.0 million to $220.0 million and the 2013 Revolver remained at $40 million, the proceeds of which were used for a $62.0 million partial redemption of SAG Restaurants subordinated notes (the "April 2014 Debt Refinance").
DTH determined that the April 2014 Debt Refinance did not result in a troubled debt restructuring or significant debt modification. DTH incurred lender and third-party costs associated with the April 2014 Debt Refinance of $2.5 million of which $0.2 million was capitalized as deferred financing costs, $1.6 million was capitalized as lender debt discount and $0.7 million was expensed as debt modification costs in the consolidated statements of comprehensive income (loss) for the fifty-two weeks ended December 30, 2014 (Predecessor). Deferred financing costs and debt discount associated with the 2013 Senior Credit Facility lenders who did not participate in the amendment of the 2013 Senior Credit Facility totaling $0.1 million and $0.4 million, respectively, were expensed as debt modification costs in the consolidated statements of comprehensive income (loss) for the fifty-two weeks ended December 30, 2014. The remaining deferred financing costs and debt discount associated with the 2013 Senior Credit Facility related to lenders who also participated in the amendment of the 2013 Senior Credit Facility totaling $0.7 million and $2.3 million, respectively, were carried over as deferred financing costs and lender debt discount under the 2013 Senior Credit Facility.
In March 2015, DTH amended its 2013 Senior Credit Facility to increase the 2013 Term Loan by $25.1 million to $227.1 million (the “March 2015 Debt Refinance”). A portion of the proceeds from Step 1 of the Business Combination, described in Note 3, proceeds of $10 million from the 2013 Revolver and the March 2015 Debt Refinance proceeds were used to fully redeem the then outstanding balance of subordinated notes of $111.2 million.
90
On March 12, 2015, DTH satisfied the rating condition in its 2013 Senior Credit Facility resulting in a decrease in interest rate to LIBOR (not to be less than 1.00%) plus a margin of 4.25%.
The Company incurred lender costs and third-party costs associated with the March 2015 Debt Refinance of $1.6 million of which $1.5 million was capitalized as lender debt discount and $0.1 million was expensed as debt modification costs in the consolidated statements of comprehensive income (loss) for the twenty-six weeks ended June 30, 2015 (Predecessor).
Lender debt discount costs and deferred financing costs associated with the 2013 Senior Credit Facility are presented net of the 2013 Term Loan in the consolidated balance sheets and were amortized to interest expense over the term of the 2013 Term Loan using the effective interest method. As of December 30, 2014 (Predecessor), the Company reclassified $0.7 million related to its deferred financing costs from other assets, net to long-term debt, capital lease obligations and deemed landlord financing liabilities, excluding current portion, net on the consolidated balance sheets upon adoption of ASU 2013-03 as discussed in Note 2. Amortization of deferred financing costs and debt discount totaled $0.9 million, $1.4 million and $1.5 million during the twenty-six weeks ended June 30, 2015 (Predecessor), fifty-two weeks ended December 30, 2014 (Predecessor) and fifty-two weeks ended December 31, 2013 (Predecessor), respectively. The Company determined the fair value of the 2013 Senior Credit Facility was equal to its carrying value at June 30, 2015 (Predecessor) and therefore the fair value of lender debt discount costs and deferred financing costs associated with the 2013 Senior Credit Facility was zero at June 30, 2015 (Predecessor). The Company recorded the fair value adjustment for the lender debt discount costs and deferred financing costs through the purchase price allocation, as described in Note 3.
Subordinated Notes (Predecessor)
In May 2010, SAG Restaurants and F&C RHC issued subordinated notes in the aggregate principal amount of $110.0 million ("SAG Restaurants Sub Notes") and $40.0 million ("F&C RHC Sub Notes"), respectively.
The balance of SAG Restaurants Sub Notes and F&C RHC Sub Notes was an aggregate of $108.1 million on December 30, 2014 (Predecessor). For the twenty-six weeks ended June 30, 2015 (Predecessor), fifty-two weeks ended December 30, 2014 (Predecessor) and fifty-two weeks ended December 31, 2013 (Predecessor), interest expense was $3.1 million, $15.4 million (of which $0.5 million was paid in cash in connection with the April 2014 Debt Refinance) and $20.9 million, respectively.
In connection with Step 1 of the Business Combination and the March 2015 Debt Refinance discussed above, DTH fully redeemed the outstanding balance of the SAG Restaurants Sub Notes and F&C RHC Sub Notes on March 20, 2015 of $111.2 million.
Other Debt Information
Based on debt agreements and leases in place as of December 29, 2015 (Successor), future maturities of debt, obligations under capital leases and deemed landlord financing liabilities were as follows (in thousands):
2016 | $ | 1,725 | ||
2017 | 1,440 | |||
2018 | 1,212 | |||
2019 | 833 | |||
2020 | 154,676 | |||
Thereafter | 11,583 | |||
Total maturities | 171,469 | |||
Less: debt discount and deferred financing costs | (1,776 | ) | ||
Total debt, net | $ | 169,693 | ||
91
8. Derivative Instruments
As of December 29, 2015 (Successor) and December 30, 2014 (Predecessor), the Company had an interest rate cap agreement to hedge cash flows associated with interest rate fluctuations on variable rate debt. This agreement had a notional amount of $87.5 million as of December 29, 2015 (Successor) and December 30, 2014 (Predecessor). The individual caplet contracts within the remaining interest rate cap agreement expire at various dates through June 30, 2016.
Interest Rate Cap Agreement
To ensure the effectiveness of the interest rate cap agreement through June 30, 2015 (Predecessor), the Company elected the three-month LIBOR rate option for its variable rate interest payments on term balances equal to or in excess of the applicable notional amount of the interest rate cap agreement as of each reset date. The reset dates and other critical terms on the term loans perfectly match with the interest rate cap reset dates and other critical terms during the twenty-six weeks ended June 30, 2015 (Predecessor) and the fifty-two weeks ended December 30, 2014 (Predecessor).
As of the July 1, 2015 interest reset date, the Company elected the one-month LIBOR rate option for its variable rate interest payments on term balances equal to or in excess of the applicable notional amount of the interest rate cap agreement, and as a result, this hedge became ineffective. Therefore, after July 1, 2015, any changes in fair value will be recorded through interest expense.
The effective portion of the interest rate cap agreement through June 30, 2015 (Predecessor) was included in accumulated other comprehensive income and included as a fair value adjustment through the purchase price allocation as described in Note 3.
Warrant Liability (Predecessor)
On March 20, 2015, warrants to purchase 597,802 shares of DTH common stock held by Goldman Sachs Mezzanine Partners (GSMP) were exercised at a strike price of $25.00 per share based on a fair value of $8.3 million determined based on the common stock price of Step 1 of the Business Combination discussed above in Note 3. GSMP redeemed 384,777 shares of DTH common stock upon exercise as payment for the strike price resulting in 213,025 shares of DTH common stock being issued. DTH recorded a mark-to-market adjustment of $35,000 to reduce the liability during the twenty-six weeks ended June 30, 2015 (Predecessor) and then reclassified the balance of the warrant liability of $8.3 million to shareholders’ equity.
9. Fair Value Measurements
The fair values of cash and cash equivalents, accounts receivable, accounts payable and other accrued liabilities approximate their carrying amounts due to their short maturities. The carrying value of the 2015 Senior Credit Facility approximated fair value. The fair value of the Company’s other long-term debt instruments was determined using a market valuation approach, using market-corroborated data such as applicable interest rates for similarly rated companies’ instruments as of the balance sheet dates (Level 2). The interest rate cap agreement and the warrant liability were recorded at fair value in the Company’s consolidated balance sheets.
As of December 29, 2015 (Successor) and December 30, 2014 (Predecessor), the Company held certain assets and liabilities that are required to be measured at fair value on a recurring basis. For both periods, these included derivative instruments related to interest rates and at December 30, 2014 (Predecessor), these included warrants to purchase DTH common stock, which were not traded on a public exchange. The Company determined the fair values of the interest rate cap contracts based on counterparty quotes, with appropriate adjustments for any significant impact of nonperformance risk of the parties to the interest rate cap contracts. Therefore, the Company has categorized these interest rate cap contracts as Level 2 fair value measurements. The fair value of the interest rate cap agreement was zero at December 29, 2015 (Successor).
The warrant liability represented warrants to purchase shares of DTH common stock, which had limited marketability. As of December 30, 2014 (Predecessor), management took into consideration the enterprise value of DTH as it relates to Step 1 of the Business Combination (see Note 3) when recording its warrant liability as of December 30, 2014 (Predecessor) (i.e., the computed value of the warrants was based on their relative fair value as part of the overall transaction discussed above). As a result of certain unobservable inputs, DTH had categorized the warrant liability as of December 30, 2014 (Predecessor) as a Level 3 fair value measurement. On March 20, 2015, GSMP exercised all of its outstanding warrants and purchased shares of
92
DTH common stock at $25.00 per share based on a fair value of $8.3 million derived from the Step 1 of the Business Combination discussed above in Note 3. The Company recorded a mark-to-market adjustment of $35,000 to reduce the liability during the twenty-six weeks ended June 30, 2015 (Predecessor) and then reclassified the balance of the warrant liability of $8.3 million to shareholders' equity.
The SAG Restaurants Sub Notes and F&C RHC Sub Notes were paid in entirety on March 20, 2015 and thus no balance was outstanding as of December 29, 2015 (Successor). The following is a summary of the estimated fair values for the long-term debt instruments, warrant liability and interest rate cap agreement (in thousands):
Successor | Predecessor | ||||||||||||||||
December 29, 2015 | December 30, 2014 | ||||||||||||||||
Estimated Fair Value | Book Value | Estimated Fair Value | Book Value | ||||||||||||||
2015 Senior Credit Facility | $ | 152,224 | $ | 152,224 | $ | — | $ | — | |||||||||
2013 Term Loan | — | — | 199,172 | 196,726 | |||||||||||||
2013 Revolver | — | — | — | — | |||||||||||||
SAG Restaurants Sub Notes | — | — | 34,846 | 35,887 | |||||||||||||
F&C RHC Sub Notes | — | — | 70,962 | 72,189 | |||||||||||||
Warrant liability | — | — | 8,309 | 8,309 | |||||||||||||
Interest rate cap agreement | — | — | 25 | 25 | |||||||||||||
The Company’s assets and liabilities measured at fair value on a recurring basis as of December 30, 2014 (Predecessor) were as follows (in thousands):
Predecessor | ||||||||||||||||
December 30, 2014 | Markets for Identical Assets (Level 1) | Observable Inputs (Level 2) | Unobservable Inputs (Level 3) | |||||||||||||
Warrant liability | $ | (8,309 | ) | $ | — | $ | — | $ | (8,309 | ) | ||||||
Interest rate cap | 25 | — | 25 | — | ||||||||||||
Total (liabilities) assets measured at fair value | $ | (8,284 | ) | $ | — | $ | 25 | $ | (8,309 | ) | ||||||
10. Other Accrued Liabilities and Other Non-Current Liabilities
A summary of other accrued liabilities follows (in thousands):
Successor | Predecessor | ||||||||
December 29, 2015 | December 30, 2014 | ||||||||
Employee compensation and related items | $ | 7,818 | $ | 7,395 | |||||
Accrued insurance | 7,168 | 6,198 | |||||||
Accrued bonus | 5,352 | 4,563 | |||||||
Accrued sales tax | 3,604 | 3,161 | |||||||
Restaurant closure liability | 1,617 | 325 | |||||||
Accrued real property tax | 1,378 | 1,301 | |||||||
Accrued advertising | 999 | 2,129 | |||||||
Accrued interest payable | 436 | 2,056 | |||||||
Accrued transaction-related costs | 151 | 1,374 | |||||||
Other | 4,374 | 3,404 | |||||||
$ | 32,897 | $ | 31,906 | ||||||
93
A summary of other non-current liabilities follows (in thousands):
Successor | Predecessor | ||||||||
December 29, 2015 | December 30, 2014 | ||||||||
Unfavorable lease liabilities | $ | 19,685 | $ | 5,308 | |||||
Insurance reserves | 5,963 | 7,289 | |||||||
Restaurant closure liabilities | 3,206 | 818 | |||||||
Deferred gift card income | 2,217 | 1,994 | |||||||
Unearned trade discount, non-current | 2,028 | 2,445 | |||||||
Deferred development and initial franchise fees | 1,920 | 1,685 | |||||||
Deferred rent liability | 731 | 4,956 | |||||||
Other | 501 | 959 | |||||||
$ | 36,251 | $ | 25,454 | ||||||
The Company recorded fair value adjustments to the deferred rent liability and unfavorable lease liabilities through the purchase price allocation, as described in Note 3.
11. Stock-Based Compensation
The Company recognizes compensation expense based on estimated grant date fair values for all stock-based awards issued to employees and directors. The Company estimates the fair value of stock-based awards based on assumptions as of the grant date. The Company recognizes these compensation costs for only those awards expected to vest, on a straight-line basis over the requisite service period of the award. The Company estimates the number of awards expected to vest based, in part, on historical forfeiture rates and also based on management’s expectations of employee turnover within the specific employee groups receiving the awards. Forfeitures are estimated at the time of grant and revised, if necessary, in subsequent periods, if actual forfeitures differ from those estimates.
2015 Omnibus Incentive Plan
In connection with the approval of the Business Combination, the Del Taco Restaurants, Inc. 2015 Omnibus Incentive Plan (the “2015 Plan”) was approved by shareholders to offer eligible employees, directors and consultants cash and stock-based incentive awards. Awards under the 2015 Plan are generally not restricted to any specific form or structure and could include, without limitation, stock options, stock appreciation rights, restricted stock, other stock-based awards, other cash-based compensation and performance awards. Under the 2015 Plan, there are 3,300,000 shares of common stock reserved and authorized. At December 29, 2015, there were 2,129,506 shares of common stock available for grant under the 2015 Plan.
Stock-Based Compensation Expense (Successor)
The total compensation expense related to the 2015 Plan was $1.5 million for the twenty-six weeks ended December 29, 2015 (Successor). As of December 29, 2015 (Successor), $9.8 million of total unrecognized expense, net of estimated forfeitures, related to share-based compensation plans is expected to be recognized over a weighted-average remaining period of 3.4 years.
Restricted Stock Awards (Successor)
The Company’s Board of Directors approved an initial grant of 150,000 shares of restricted stock under the 2015 Plan to certain officers upon completion of the Business Combination. These restricted stock awards vest on a straight-line basis over three years from June 30, 2015.
During the fourth quarter of fiscal 2015, an additional 796,494 shares of restricted stock was granted to certain officers and employees of the Company under the 2015 Plan. These restricted stock awards vest on a straight-line basis over four years from June 30, 2015.
94
A summary of outstanding and unvested restricted stock activity as of December 29, 2015 (Successor) and changes during the period from June 30, 2015 (Predecessor) through December 29, 2015 (Successor) are as follows:
Shares | Weighted-Average Grant Date Fair Value | ||||||
Nonvested at June 30, 2015 (Predecessor) | — | $ | — | ||||
Granted | 946,494 | 11.16 | |||||
Vested | — | — | |||||
Forfeited | — | — | |||||
Nonvested at December 29, 2015 (Successor) | 946,494 | $ | 11.16 | ||||
As of December 29, 2015 (Successor), there was $9.1 million of unrecognized compensation expense, net of estimated forfeitures, related to restricted stock, which is expected to be recognized over a weighted-average period of 3.3 years.
Stock Options
During the fourth quarter of fiscal 2015, 224,000 stock options were granted to certain employees of the Company under the 2015 Plan. The stock options vest on a straight-line basis over 4 years from June 30, 2015.
A summary of stock option activity as of December 29, 2015 (Successor) and changes during the period June 30, 2015 (Predecessor) through December 29, 2015 (Successor) are as follows:
Shares | Weighted Average Exercise Price | Weighted Average Remaining Contractual Term (in Years) | Aggregate Intrinsic Value (in thousands) | |||||||||||
Options outstanding at June 30, 2015 (Predecessor) | — | $ | — | — | $ | — | ||||||||
Granted | 224,000 | 10.40 | 4.0 | — | ||||||||||
Exercised | — | — | — | — | ||||||||||
Forfeited | — | — | — | — | ||||||||||
Options outstanding at December 29, 2015 (Successor) | 224,000 | $ | 10.40 | 3.5 | $ | 67 | ||||||||
Options exercisable at December 29, 2015 (Successor) | — | $ | — | — | $ | — | ||||||||
Options exercisable and expected to vest at December 29, 2015 (Successor) | 208,930 | $ | 10.40 | 3.5 | $ | 63 | ||||||||
The aggregated intrinsic value in the table above is the amount by which the current market price of the Company's stock on December 29, 2015 exceeds the exercise price.
The following table reflects the assumptions used in the Black-Scholes option-pricing model to value the stock options granted in the twenty-six weeks ended December 29, 2015 (Successor):
Expected volatility | 38.01 | % | ||
Risk-free rate of return | 1.84 | % | ||
Expected life (in years) | 5.5 | |||
Dividend yield | — | |||
Fair value per share at date of grant | $ | 3.93 | ||
Since the Company does not have a history of traded common stock activity, expected volatility was based on historical data from selected peer public company restaurants. The risk-free rate is based on published U.S. Treasury rates in effect at the time
95
of grant with a similar duration of the expected life of the options. The expected life of options granted is derived from the average of the contractual term of the option and the vesting periods. The Company has not paid any dividends to date and does not plan to pay dividends in the near future.
As of December 29, 2015 (Successor), there was $0.7 million of total unrecognized compensation expense, net of estimated forfeitures, related to stock options grants which is expected to be recognized over a weighted-average remaining period of 3.5 years.
Stock-Based Compensation Expense (Predecessor)
In connection with Step 1 of the Business Combination consummated on March 20, 2015, all unvested restricted stock units (“RSUs”) under the Predecessor plan became fully vested and all vested RSUs were then immediately settled for shares of DTH common stock, net of shares withheld for minimum statutory employee tax withholding obligations and all unvested stock options under the Predecessor plan became fully vested and all vested stock options were also exercised and shares were issued, net of shares withheld for the applicable option strike price and employee tax withholding obligations. An aggregate of 237,948 shares of DTH common stock were issued and 247,552 shares of DTH common stock were redeemed for applicable option strike price and employee tax withholding obligations. In exchange for the shares withheld, DTH made payments of $7.5 million related to employee tax withholding obligations.
No RSUs or stock options remained outstanding under the Predecessor plan after March 20, 2015 or as of December 29, 2015. DTH recorded stock-based compensation expense of $0.5 million, which included all remaining unrecognized compensation expense related to the accelerated vesting on RSUs and stock options on March 20, 2015, for the twenty-six weeks ended June 30, 2015 (Predecessor) and DTH recorded stock-based compensation expense totaling $1.0 million and $1.3 million during the fifty-two weeks ended December 30, 2014 (Predecessor) and fifty-two weeks ended December 31, 2013 (Predecessor), respectively.
A summary of RSUs activity as of June 30, 2015 (Predecessor) and changes during the period from January 1, 2013 (Predecessor) to June 30, 2015 (Predecessor) are as follows:
Shares | Weighted-Average Grant Date Fair Value | ||||||
Nonvested at January 1, 2013 (Predecessor) | 280,000 | $ | 25.00 | ||||
Granted | — | — | |||||
Vested | (81,300 | ) | 25.00 | ||||
Forfeited | (25,500 | ) | 25.00 | ||||
Nonvested at December 31, 2013 (Predecessor) | 173,200 | 25.00 | |||||
Granted | — | — | |||||
Vested | (79,100 | ) | 25.00 | ||||
Forfeited | — | — | |||||
Nonvested at December 30, 2014 (Predecessor) | 94,100 | 25.00 | |||||
Granted | — | — | |||||
Vested | (94,100 | ) | 25.00 | ||||
Forfeited | — | — | |||||
Nonvested at June 30, 2015 (Predecessor) | — | $ | — | ||||
96
A summary of stock option activity as of June 30, 2015 (Predecessor) and changes during the period from January 1, 2013 (Predecessor) to June 30, 2015 (Predecessor) are as follows:
Shares | Weighted Average Exercise Price | Weighted Average Remaining Contractual Term (in Years) | Aggregate Intrinsic Value (in thousands) | |||||||||||
Options outstanding at January 1, 2013 (Predecessor) | 20,000 | $ | 25.00 | 8.7 | $ | — | ||||||||
Granted | — | — | — | — | ||||||||||
Exercised | — | — | — | — | ||||||||||
Forfeited | — | — | — | — | ||||||||||
Options outstanding at December 31, 2013 (Predecessor) | 20,000 | 25.00 | 7.7 | — | ||||||||||
Granted | 70,000 | 22.60 | 9.3 | — | ||||||||||
Exercised | — | — | — | — | ||||||||||
Forfeited | — | — | — | — | ||||||||||
Options outstanding at December 30, 2014 (Predecessor) | 90,000 | 23.10 | 8.7 | 1,400 | ||||||||||
Granted | — | — | — | — | ||||||||||
Exercised | (90,000 | ) | 23.10 | — | — | |||||||||
Forfeited | — | — | — | — | ||||||||||
Options outstanding at June 30, 2015 (Predecessor) | — | $ | — | — | $ | — | ||||||||
Options exercisable at June 30, 2015 (Predecessor) | — | $ | — | — | $ | — | ||||||||
Options exercisable and expected to vest at June 30, 2015 (Predecessor) | — | $ | — | — | $ | — | ||||||||
12. Shareholders’ Equity
The authorized common stock of the Company consists of 400,000,000 shares. Holders of the Company’s common stock are entitled to one vote for each share of common stock. As of December 29, 2015 (Successor), there were 38,802,425 shares of common stock issued and outstanding and warrants to purchase 12,639,623 shares of the Company’s common stock outstanding at a strike price of $11.50. Of the 12,639,623 warrants, 7,500,000 were issued in the Company’s initial public offering in November 2013 and 4,750,000 warrants were issued in a private sale not involving a public offering in November 2013 (“Private Placement Warrants”). On June 30, 2015, the Company issued 389,623 additional Private Placement Warrants to Levy Acquisition Sponsor LLC (the “Sponsor”), the Company’s sponsor, to satisfy outstanding working capital loans owed to the Sponsor by the Company. The warrants became exercisable on July 30, 2015, 30 days after the completion of the Business Combination.
The Company previously had 15,000,000 common shares that were sold as part of the Company’s initial public offering in November 2013 which each contained a redemption feature that allows for the redemption of the common shares. The amount of the common shares subject to possible redemption was recorded as a liability on LAC’s consolidated balance sheet and as of June 16, 2015, 13,622,394 shares were classified outside of permanent equity at its redemption value of $136.2 million. On June 30, 2015, in connection with the Business Combination, 1,115 shares were redeemed at $10 per share and the remaining shares with a value of $136.2 million were reclassified into equity.
The Company is authorized to issue 1,000,000 preferred shares with designations, voting and other rights and preferences as may be determined from time to time by the Board of Directors. As of December 29, 2015 (Successor), there were no preferred shares issued or outstanding.
97
As described in Note 3, on March 20, 2015, the Levy Newco Parties made a $120 million minority equity investment in DTH in connection with a stock purchase agreement dated March 12, 2015. Proceeds of $91.2 million from Step 1 of the Business Combination were used to purchase 2,348,968 shares of DTH common stock.
Also on March 20, 2015, warrants to purchase 597,802 shares of DTH common stock held by GSMP were exercised at a strike price of $25.00 per share based on a fair value of $8.3 million determined from Step 1 of the Business Combination. GSMP redeemed 384,777 DTH shares upon exercise as payment for the strike price resulting in 213,025 shares of DTH common stock issued. The Company recorded a mark-to-market adjustment of $35,000 to reduce the warrant liability during the twenty-six weeks ended June 30, 2015 (Predecessor) and then reclassified the balance of the warrant liability of $8.3 million to shareholders’ equity on March 20, 2015.
In October 2015, the Company launched a secondary offering of 3,372,016 shares of its common stock held by entities affiliated with Goldman Sachs Mezzanine Partners, Leonard Green & Partners and Charlesbank Capital Partners (the “Selling Stockholders”). The underwriters exercised an option to purchase an additional 505,802 shares of common stock held by the Selling Stockholders. The Company did not sell any shares in this offering and did not receive any proceeds from the sale of the shares of common stock offered by the Selling Stockholders. In connection with the offering, the Company incurred costs of $0.7 million, included in transaction-related costs on the consolidated statements of comprehensive income (loss), during the twenty-six weeks ended December 29, 2015 (Successor).
13. Earnings per Share
Basic income (loss) per share is calculated by dividing net income (loss) attributable to Del Taco’s common shareholders for the Successor period and DTH’s common shareholders for the Predecessor period by the weighted average number of common shares outstanding for the period. In computing dilutive income (loss) per share, basic income (loss) per share is adjusted for the assumed issuance of all applicable potentially dilutive share-based awards, including warrants, restricted stock units, common stock options, and restricted stock.
Below are basic and diluted net income (loss) per share for the periods indicated (amounts in thousands except share and per share data):
Successor | Predecessor | ||||||||||||||||
26 Weeks Ended | 26 Weeks Ended | 52 Weeks Ended | |||||||||||||||
December 29, 2015 | June 30, 2015 | December 30, 2014 | December 31, 2013 | ||||||||||||||
Numerator: | |||||||||||||||||
Net income (loss) | $ | 2,653 | $ | 2,104 | $ | (9,255 | ) | $ | (6,539 | ) | |||||||
Denominator: | |||||||||||||||||
Weighted-average shares outstanding - basic | 38,802,425 | 5,492,417 | 3,907,835 | 3,907,835 | |||||||||||||
Dilutive effect of restricted shares and RSUs | 744 | 13,972 | — | — | |||||||||||||
Dilutive effect of stock options | — | 93,634 | — | — | |||||||||||||
Dilutive effect of warrants | 1,446,824 | 10,836 | — | — | |||||||||||||
Weighted-average shares outstanding - diluted | 40,249,993 | 5,610,859 | 3,907,835 | 3,907,835 | |||||||||||||
Net income (loss) per share - basic | $ | 0.07 | $ | 0.38 | $ | (2.37 | ) | $ | (1.67 | ) | |||||||
Net income (loss) per share - diluted | $ | 0.07 | $ | 0.37 | $ | (2.37 | ) | $ | (1.67 | ) | |||||||
Antidilutive options, unvested restricted stock awards, unvested RSUs and warrants excluded from the computations | 5,365 | — | 28,831 | — | |||||||||||||
Antidilutive stock options and unvested stock were excluded from the computation of diluted net (loss) income per share due to the assumed proceeds from the award’s exercise or vesting being greater than the average market price of the common shares or due to the Company incurring net losses for certain periods presented.
98
14. Income Taxes
The component of the provision for income taxes are as follows (in thousands):
Successor | Predecessor | ||||||||||||||||
26 Weeks Ended | 26 Weeks Ended | 52 Weeks Ended | |||||||||||||||
December 29, 2015 | June 30, 2015 | December 30, 2014 | December 31, 2013 | ||||||||||||||
Current: | |||||||||||||||||
Federal | $ | — | $ | 110 | $ | — | $ | — | |||||||||
State | 24 | 79 | (67 | ) | (806 | ) | |||||||||||
24 | 189 | (67 | ) | (806 | ) | ||||||||||||
Deferred: | |||||||||||||||||
Federal | (90 | ) | 15 | (128 | ) | 241 | |||||||||||
State | 178 | 536 | 1,293 | 645 | |||||||||||||
88 | 551 | 1,165 | 886 | ||||||||||||||
Income tax provision | $ | 112 | $ | 740 | $ | 1,098 | $ | 80 | |||||||||
The effective tax rates for the twenty-six weeks ended December 29, 2015 (Successor), twenty-six weeks ended June 30, 2015 (Predecessor), fifty-two weeks ended December 30, 2014 (Predecessor) and fifty-two weeks ended December 31, 2013 (Predecessor) were 4.1%, 26.0%, (13.5)% and (1.2)%, respectively. The difference between the effective rates and the statutory federal income tax rate is composed of the following items (dollars in thousands):
Successor | Predecessor | ||||||||||||||||||||||||||||
26 Weeks Ended | 26 Weeks Ended | 52 Weeks Ended | |||||||||||||||||||||||||||
December 29, 2015 | June 30, 2015 | December 30, 2014 | December 31, 2013 | ||||||||||||||||||||||||||
Federal income taxes | $ | 968 | 35.0 | % | $ | 995 | 35.0 | % | $ | (2,855 | ) | 35.0 | % | $ | (2,261 | ) | 35.0 | % | |||||||||||
State and local income taxes, net of federal tax benefit | 280 | 10.1 | % | 435 | 15.3 | % | (348 | ) | 4.2 | % | (245 | ) | 3.8 | % | |||||||||||||||
Targeted job credits | (512 | ) | (18.5 | )% | (34 | ) | (1.2 | )% | (289 | ) | 3.5 | % | (1,050 | ) | 16.3 | % | |||||||||||||
Warrant liability | — | — | % | (12 | ) | (0.4 | )% | 496 | (6.1 | )% | 12 | (0.2 | )% | ||||||||||||||||
Investment in subsidiary | 83 | 3.0 | % | 383 | 13.5 | % | 560 | (6.9 | )% | 744 | (11.5 | )% | |||||||||||||||||
Change in deferred tax rate | — | — | % | — | — | % | 31 | (0.4 | )% | (326 | ) | 5.0 | % | ||||||||||||||||
Change in valuation allowance | (1,927 | ) | (69.7 | )% | (2,805 | ) | (98.6 | )% | 3,097 | (38.0 | )% | 4,018 | (62.2 | )% | |||||||||||||||
Uncertain tax position adjustment | — | — | % | — | — | % | — | — | % | (460 | ) | 7.1 | % | ||||||||||||||||
Transaction costs | 1,194 | 43.2 | % | 2,255 | 79.3 | % | — | — | % | — | — | % | |||||||||||||||||
Permanent tax differences and other | 26 | 1.0 | % | (477 | ) | (16.9 | )% | 406 | (4.8 | )% | (352 | ) | 5.5 | % | |||||||||||||||
Income tax provision | $ | 112 | 4.1 | % | $ | 740 | 26.0 | % | $ | 1,098 | (13.5 | )% | $ | 80 | (1.2 | )% | |||||||||||||
99
Significant components of the Company's deferred tax assets and liabilities are as follows (in thousands):
Successor | Predecessor | ||||||||
December 29, 2015 | December 30, 2014 | ||||||||
Deferred tax assets: | |||||||||
Deferred rent | $ | 291 | $ | 2,170 | |||||
Accrued insurance | 5,094 | 5,335 | |||||||
Reserve for restructuring and closed restaurants | 1,922 | 455 | |||||||
Net operating loss carryforwards and tax credits | 9,755 | 6,640 | |||||||
Deferred income | 2,259 | 2,174 | |||||||
Stock-based compensation | 597 | 3,921 | |||||||
Other, net | 3,248 | 2,408 | |||||||
Deferred tax assets | 23,166 | 23,103 | |||||||
Less valuation allowance | — | (20,217 | ) | ||||||
Net deferred tax assets | 23,166 | 2,886 | |||||||
Deferred tax liabilities: | |||||||||
Property, equipment and intangibles | (95,996 | ) | (60,161 | ) | |||||
Investment in subsidiary | (4,639 | ) | (4,853 | ) | |||||
Prepaid expenses | (2,054 | ) | (2,790 | ) | |||||
Deferred tax liabilities | (102,689 | ) | (67,804 | ) | |||||
Net deferred tax liabilities | $ | (79,523 | ) | $ | (64,918 | ) | |||
In November 2015, the FASB issued ASU 2015-17, Balance Sheet Classification of Deferred Taxes, an update to ASC 740, Income Taxes (the "Update"). Current U.S. GAAP requires an entity to separate deferred income tax liabilities and assets into current and non-current amounts in a classified statement of financial position. To simplify the presentation of deferred income taxes, the amendments in this Update require that deferred tax liabilities and assets be classified as non-current in a classified statement of financial position. The current requirement that deferred tax liabilities and assets of a tax-paying component of an entity be offset and presented in a single amount is not affected by the amendments in this Update.
For public business entities, the amendments in the Update are effective for financial statements issued for annual periods beginning after December 15, 2016, and interim periods within those annual periods. The FASB also decided to permit early application by all entities as of the beginning of any interim or annual reporting period. The FASB further provided that the Update may be applied to all deferred tax liabilities and assets retrospectively to all periods presented. The Company chose to adopt the Update in fiscal year ended December 29, 2015 (Successor) and apply this Update on a retrospective basis. Accordingly, as of December 30, 2014 (Predecessor), the Company reclassified $0.2 million related to its deferred tax liability from current deferred tax liabilities to non-current deferred tax liabilities.
The Company maintains deferred tax liabilities related to trademarks and other indefinite lived assets that are not netted against the deferred tax assets as reversal of the taxable temporary difference cannot serve as a source for realization of the deferred tax assets, because the deferred tax liability will not reverse until some indefinite future period when the assets are either sold or written down due to an impairment. As of December 29, 2015 (Successor) and December 30, 2014 (Predecessor), a valuation allowance of zero and $20.2 million, respectively, has been provided for certain deferred tax assets that management believes may not be realized.
As part of purchase accounting, the Company was required to record all of DTH’s acquired assets and liabilities at their acquisition date fair value, including deferred income taxes. The Company considered the weight of both positive and negative evidence and concluded that it is more likely than not that DTH's deferred tax assets will be realized and that no valuation allowance on DTH's deferred tax asset was required as of the date of acquisition.
100
As a result, the Company established deferred tax assets as well as deferred tax liabilities related to indefinite-lived intangibles through the purchase price allocation (see Note 3). In addition, after considering the Business Combination, the projected post-combination results and all available evidence, the Company released $1.9 million of valuation allowance that was previously provided against the Company's deferred tax assets. In accordance with ASC 805-740-30-3, the Company recorded this release through income tax benefit during the twenty-six week period ended December 29, 2015 (Successor).
Federal and state net operating loss carryforwards as of December 29, 2015 (Successor) totaled $9.8 million and $41.1 million, respectively, and begin to expire in 2034 and 2027, respectively. Federal tax credit carryforwards as of December 29, 2015 (Successor) totaled $3.7 million and begin to expire in 2031. State tax credit carryforwards as of December 29, 2015 (Successor) totaled $0.4 million and begin to expire in 2024.
As of December 29, 2015 (Successor) and December 30, 2014 (Predecessor), the liability for unrecognized tax positions was $0.2 million and zero, and is included other non-current liabilities in the consolidated balance sheets. The Company recognizes interest and penalties related to uncertain tax positions in income tax expense. As of December 29, 2015 (Successor), the Company did not have any accrued interest and penalties related to uncertain tax positions. The Company does not expect any significant increases or decreases within the next twelve months to its unrecognized tax positions. The total amount of net unrecognized tax positions that would impact the Company's effective tax rate, if ever recognized, is $0.2 million.
The following table summarizes the changes to unrecognized tax positions (in thousands):
Successor | Predecessor | ||||||||||||||||
26 Weeks Ended | 26 Weeks Ended | 52 Weeks Ended | |||||||||||||||
December 29, 2015 | June 30, 2015 | December 30, 2014 | December 31, 2013 | ||||||||||||||
Balance at beginning of period | $ | 212 | $ | — | $ | — | $ | — | |||||||||
Increases (decreases) related to prior year tax positions | — | — | — | — | |||||||||||||
Increases (decreases) related to current year tax positions | — | 212 | — | — | |||||||||||||
Expiration of the statute of limitations for the assessment of taxes | — | — | — | — | |||||||||||||
Settlements | — | — | — | — | |||||||||||||
Balance at end of period | $ | 212 | $ | 212 | $ | — | $ | — | |||||||||
The Company is subject to U.S. and state income taxes. The Company is no longer subject to federal and state income tax examinations for years before 2012 and 2011, respectively.
The Company received net tax refunds of approximately $2,500, zero, zero, and $0.2 million during the twenty-six weeks ended December 29, 2015 (Successor), twenty-six weeks ended June 30, 2015 (Predecessor), fifty-two weeks ended December 30, 2014 (Predecessor) and fifty-two weeks ended December 31, 2013 (Predecessor), respectively.
The Protecting Americans From Tax Hikes (PATH) Act was enacted on December 21, 2015. Included within this legislation was the work opportunity credit, and extension of the fifty percent first year bonus depreciation, both of which had previously expired on December 31, 2014. As the legislation was enacted during the fourth quarter of the current year, the impact was not previously accounted for in the Company's effective tax rate or income tax payable calculations. The impact to the effective tax rate during the twenty-six weeks ended December 29, 2015 (Successor) was approximately (18.5)%.
15. Leases
As of December 29, 2015 (Successor) and December 30, 2014 (Predecessor), deferred rent liability was $20.4 million and $10.3 million, respectively, which includes unfavorable lease liabilities of $19.7 million and $5.3 million, respectively, net of accumulated amortization of $1.3 million and $3.1 million, respectively.
101
Franchise sublease expenses which include minimum rent, percentage rent and real estate taxes are classified separately under occupancy and other – franchise subleases on the consolidated statements of comprehensive income (loss) and totaled $1.1 million for both the twenty-six weeks ended December 29, 2015 (Successor) and June 30, 2015 (Predecessor), respectively, and $2.1 million for both the fifty-two weeks ended December 30, 2014 (Predecessor) and December 31, 2013 (Predecessor).
Total rent expense for the Company for all non-cancelable operating leases and third party subleases comprise the following (in thousands):
Successor | Predecessor | ||||||||||||||||
26 Weeks Ended | 26 Weeks Ended | 52 Weeks Ended | |||||||||||||||
December 29, 2015 | June 30, 2015 | December 30, 2014 | December 31, 2013 | ||||||||||||||
Minimum rental expense | $ | 12,384 | $ | 12,405 | $ | 23,819 | $ | 22,404 | |||||||||
Favorable and unfavorable lease assets and liabilities amortization, net | (364 | ) | 3 | 144 | 378 | ||||||||||||
Straight-line rent expense | 518 | 277 | 648 | 863 | |||||||||||||
Contingent rent expense | 2,033 | 2,063 | 3,912 | 3,735 | |||||||||||||
Sublease rent income | (1,100 | ) | (1,100 | ) | (2,087 | ) | (2,019 | ) | |||||||||
$ | 13,471 | $ | 13,648 | $ | 26,436 | $ | 25,361 | ||||||||||
Sublease rent income includes contingent rentals based on sales totaling $0.3 million during both the twenty-six weeks ended December 29, 2015 (Successor) and June 30, 2015 (Predecessor), and $0.5 million during both the fifty-two weeks ended December 30, 2014 (Predecessor) and December 31, 2013 (Predecessor). As of December 29, 2015 (Successor), the Company is obligated under various capital leases having interest rates that average approximately 8%.
Minimum rental commitments and sublease minimum rental receipts as of December 29, 2015 (Successor), under capital and operating leases having an initial non-cancelable term of one year or more are shown in the following table (in thousands):
Rental Payments | Rental Receipts | |||||||||||||||
Capital Lease and Deemed Landlord Financing Liabilities | Operating Leases | Operating Subleases | Net Lease Commitments | |||||||||||||
2016 | $ | 3,365 | $ | 28,053 | $ | (1,770 | ) | $ | 29,648 | |||||||
2017 | 3,054 | 27,199 | (1,762 | ) | 28,491 | |||||||||||
2018 | 2,735 | 25,700 | (1,692 | ) | 26,743 | |||||||||||
2019 | 2,237 | 23,276 | (1,694 | ) | 23,819 | |||||||||||
2020 | 1,993 | 21,376 | (1,628 | ) | 21,741 | |||||||||||
Thereafter | 17,594 | 146,381 | (13,394 | ) | 150,581 | |||||||||||
Total minimum lease payments | $ | 30,978 | $ | 271,985 | $ | (21,940 | ) | $ | 281,023 | |||||||
Imputed interest | (13,509 | ) | ||||||||||||||
Present value of payments | $ | 17,469 | ||||||||||||||
The Company has subleased 17 properties to other third parties where the Company remains primarily liable to the landlord for the performance of all obligations in the event that the sub-lessee does not perform its obligations under the lease. As a result of the sublease arrangements, future minimum rental commitments under operating leases will be offset by sublease amounts to be paid by the sub-lessee. The total of minimum sublease amounts to be received in the future under non-cancelable subleases is $21.9 million as of December 29, 2015 (Successor).
The amounts in operating lease and operating subleases in the table above include amounts for restaurant operating leases related to the 12 restaurants closed in the fourth fiscal quarter of 2015 and related subleases both of which have been included
102
in our restaurant closure liability on our consolidated balance sheets as of December 29, 2015 (Successor) on a present value basis.
During Fiscal 2013, the Company had assigned its unfavorable lease liabilities with respect to one property to another third party where the Company remained secondarily liable to the landlord for the performance of all obligations in the event that the assignee did not perform its obligations under the lease. The Company did not incur any expenses under this arrangement for any of the periods presented.
During Fiscal 2013, the Company entered into two sale-leaseback arrangements with third party private investors. These sale-leaseback transactions do not provide for any continuing involvement by the Company other than normal leases where the Company intends to use the properties during the lease terms. The leases have been accounted for as operating leases. The net proceeds from these transactions were $2.9 million. Under one of these arrangements, the Company sold the land and building of an existing restaurant in Gardena, California and leased it back for a term of 20 years. The sale of this property resulted in a deferred gain of $0.5 million which was classified in deferred income on the consolidated balance sheet and amortized in proportion to the related rent expense recognized over the lease term of 20 years. The fair value of this deferred gain was zero at June 30, 2015, therefore, a fair value adjustment was recorded through the purchase price allocation, as described in Note 3. During the twenty-six weeks ended June 30, 2015 (Predecessor) and the fifty-two weeks ended December 30, 2014 (Predecessor), the Company recognized gains of approximately $13,000 and $26,000, respectively, for the related amortization of deferred gain which is included in (gain) loss on disposal of assets in the consolidated statements of comprehensive income (loss). Under the other sale-leaseback transaction, the Company acquired land and constructed the building, sold the property and simultaneously leased the property back for a term of 20 years. The Company realized a net loss of approximately $20,000 during the fifty-two weeks ended December 31, 2013 (Predecessor) for the sale of this property which is included in (gain) loss on disposal of assets in the consolidated statements of comprehensive income (loss).
During 2010, the Company entered into a sale-leaseback arrangement with a third party private investor that contained a form of continuing involvement. Accordingly, the arrangement was not accounted for as a sale-leaseback, but as a financing transaction whereby the sold property remained as an asset to the Company and the proceeds from the sale were recorded as a deemed landlord financing liability with a balance of $2.1 million as of December 30, 2014 (Predecessor). The fair value of this deemed landlord financing liability was zero at June 30, 2015 (Predecessor), therefore, a fair value adjustment was recorded through the purchase price allocation, as described in Note 3.
16. Commitments and Contingencies
The primary claims in the Company’s business are workers’ compensation and general liabilities. These insurance programs are self-insured or high deductible programs with excess coverage that management believes is sufficient to adequately protect the Company. In the opinion of management, adequate provision has been made for all incurred claims up to the self-insured or high deductible limits, including provision for estimated claims incurred but not reported. Because of the uncertainty of the ultimate resolution of outstanding claims, as well as the uncertainty regarding claims incurred but not reported, it is possible that management’s provision for these losses could change materially. However, no estimate can currently be made of the range of additional losses.
Purchasing Commitments
The Company enters into various purchase obligations in the ordinary course of business, generally of short term nature. Those that are binding primarily relate to commitments for food purchases and supplies, amounts owed under contractor and subcontractor agreements, orders submitted for equipment for restaurants under construction, information technology service agreements and marketing initiatives, some of which are related to both Company-operated and franchised locations. The Company also has a long-term beverage supply agreement with a major beverage vendor whereby marketing rebates are provided to the Company and its franchisees based upon the volumes of purchases for system-wide restaurants which vary according to demand for beverage syrup. This contract has terms extending into 2021. The Company’s future estimated cash payments under existing contractual purchase obligations for goods and services as of December 29, 2015 (Successor), are approximately $81.3 million. The Company has excluded agreements that are cancelable without penalty.
103
Severance and Executive Employment Agreements
The Company has Severance Agreements and Executive Employment Agreements with certain key officers of the Company, which provide for payment of one year base salary and bonus incentive plan payments, in the event that the officers are terminated without cause. As of December 29, 2015 (Successor) and December 30, 2014 (Predecessor) the Company’s total contingent liability with respect to the aforementioned agreements is $3.7 million and $3.3 million, respectively, which was not recorded in the consolidated financial statements.
Litigation
On April 23, 2015, a purported class action and derivative complaint, Jeffery Tomasulo, on behalf of himself and all others similarly situated v. Levy Acquisition Sponsor, LLC, Lawrence F. Levy, Howard B. Bernick, Marc S. Simon, Craig J. Duchossois, Ari B. Levy, Steven C. Florsheim, Gregory G. Flynn, Del Taco Holdings, Inc., and Levy Acquisition Corp. (“Complaint”), was filed in the Circuit Court of Cook County, Illinois (the “Circuit Court”), relating to the then proposed Business Combination pursuant to the Merger Agreement. The Complaint, which purported to be brought as a class action on behalf of all of the holders of the Company’s common stock, generally alleged that the Company’s pre-merger directors breached their fiduciary duties to stockholders by facilitating the then proposed Business Combination and in negotiating and approving the Merger Agreement. The Complaint also alleged that the Company’s preliminary proxy statement that was filed with the SEC on April 2, 2015 is materially misleading and/or incomplete. The Complaint further alleged that DTH and Levy Acquisition Sponsor LLC aided and abetted the alleged breaches by the Company’s pre-merger directors. The Complaint sought (a) a declaration that the Company’s pre-merger directors breached their fiduciary duties; (b) injunctive relief enjoining the Business Combination until corrective disclosures were made; (c) compensatory and/or rescissory damages; and (d) an award of costs and attorney’s fees.
The Company reached a settlement in principle of all claims asserted in the Complaint, subject to negotiation of a definitive settlement agreement and approval by the Circuit Court. The settlement in principle would resolve all causes of action asserted in the case. The settlement in principle would not provide for any monetary payment to the plaintiff or the putative plaintiff class, other than an amount for plaintiff's attorneys’ fees and costs. The amount of attorney’s fees and costs that the Court might award is not currently estimable.
The Company has a directors and officers liability insurance policy to cover legal defense costs, judgments and settlements stemming from covered claims, subject to an insurance deductible of $0.25 million per claim. The Company's insurance company has acknowledged coverage for claims asserted in the Complaint against covered persons, subject to a reservation of rights. The Company has incurred $0.1 million and $0.7 million in legal defense fees during the twenty-six weeks ended December 29, 2015 (Successor) and June 30, 2015 (Predecessor), respectively. The legal defense fees incurred are reported in transaction-related costs on the accompanying consolidated statements of comprehensive income (loss). The Company has received reimbursement of $0.3 million from the insurance company for legal defense costs it paid in excess of the deductible. The Company anticipates that any attorney's fees or expenses awarded by the Court in connection with the proposed settlement will be paid in full by the insurance company, together with all or substantially all of any additional legal fees that may be incurred in connection with the settlement of action.
In July 2013, a former Del Taco employee filed a purported class action complaint alleging that Del Taco has failed to pay overtime wages and has not appropriately provided meal breaks to its California general managers. Discovery has been completed and the parties are preparing their motions for and opposition to class certification. Del Taco has several defenses to the action that it believes should prevent the certification of the class, as well as the potential assessment of any damages on a class basis. Legal proceedings are inherently unpredictable, and the Company is not able to predict the ultimate outcome or cost of the unresolved matter. However, based on management’s current understanding of the relevant facts and circumstances, the Company does not believe that these proceedings give rise to a probable or estimable loss and should not have a material adverse effect on the Company’s financial position, operations or cash flows. Therefore, Del Taco has not recorded any amount for the claim as of December 29, 2015 (Successor).
In March 2014, a former Del Taco employee filed a purported class action complaint alleging that Del Taco has not appropriately provided meal breaks and failed to pay wages to its California hourly employees. Discovery is in process and Del Taco intends to assert all of its defenses to this threatened class action and the individual claims. Del Taco has several defenses
104
to the action that it believes should prevent the certification of the class, as well as the potential assessment of any damages on a class basis. Legal proceedings are inherently unpredictable, and the Company is not able to predict the ultimate outcome or cost of the unresolved matter. However, based on management’s current understanding of the relevant facts and circumstances, the Company does not believe that these proceedings give rise to a probable or estimable loss and should not have a material adverse effect on the Company’s financial position, operations or cash flows. Therefore, Del Taco has not recorded any amount for the claim as of December 29, 2015 (Successor).
The Company and its subsidiaries are parties to other legal proceedings incidental to their businesses, including claims alleging the Company’s restaurants do not comply with the Americans with Disabilities Act of 1990. In the opinion of management, based upon information currently available, the ultimate liability with respect to those other actions will not have a material effect on the operating results, cash flows or the financial position of the Company.
17. Retirement Plans
The Company has a 401(k) retirement plan which covers all employees who meet certain age and minimum service hour requirements who elect to participate and provided for matching contributions totaling approximately $40,000 during both the twenty-six weeks ended December 29, 2015 (Successor) and June 30, 2015 (Predecessor), and approximately $60,000 and $50,000 (consisting of approximately $10,000 from forfeitures and approximately $40,000 of cash), during the fifty-two weeks ended December 30, 2014 (Predecessor) and December 31, 2013 (Predecessor), respectively.
18. Quarterly Financial Data (Unaudited)
Summarized unaudited quarterly financial data (amounts in thousands except share and per share data):
Successor | Predecessor | ||||||||||||||||||||||||||
16 Weeks Ended | 10 Weeks Ended | 2 Weeks Ended | 12 Weeks Ended | ||||||||||||||||||||||||
Fiscal Year 2015 | December 29, 2015 | September 8, 2015 | June 30, 2015 | June 16, 2015 | March 24, 2015 | ||||||||||||||||||||||
Total revenue | $ | 133,415 | $ | 82,035 | $ | 16,532 | $ | 97,603 | $ | 94,418 | |||||||||||||||||
Income from operations | 10,784 | 8,463 | 1,693 | 11,256 | 8,745 | ||||||||||||||||||||||
Net income (loss) | 4,839 | (1 | ) | (2,186 | ) | (2 | ) | 2,416 | (3 | ) | 4,628 | (4 | ) | (4,940 | ) | (5 | ) | ||||||||||
Earnings (loss) per share: | |||||||||||||||||||||||||||
Basic | $ | 0.12 | $ | (0.06 | ) | $ | 0.36 | $ | 0.69 | $ | (1.21 | ) | |||||||||||||||
Diluted | $ | 0.12 | $ | (0.06 | ) | $ | 0.36 | $ | 0.69 | $ | (1.21 | ) | |||||||||||||||
Predecessor | ||||||||||||||||||
16 Weeks Ended | 12 Weeks Ended | |||||||||||||||||
Fiscal Year 2014 | December 30, 2014 | September 9, 2014 | June 17, 2014 | March 25, 2014 | ||||||||||||||
Total revenue | $ | 125,717 | $ | 92,393 | $ | 91,244 | $ | 86,670 | ||||||||||
Income from operations | 3,458 | 8,682 | 8,646 | 6,546 | ||||||||||||||
Net (loss) income | (8,117 | ) | (6 | ) | 889 | (140 | ) | (1,887 | ) | |||||||||
(Loss) earnings per share: | ||||||||||||||||||
Basic | $ | (2.08 | ) | $ | 0.23 | $ | (0.04 | ) | $ | (0.48 | ) | |||||||
Diluted | $ | (2.08 | ) | $ | 0.23 | $ | (0.04 | ) | $ | (0.48 | ) | |||||||
_______________________________________________
(1) Includes transaction-related costs of $1.0 million.
(2) Includes transaction-related costs of $12.0 million.
(3) Includes transaction-related costs of $0.1 million.
105
(4) Includes transaction related costs of $0.9 million.
(5) Includes transaction-related costs of $6.3 million.
(6) Includes transaction-related costs of $1.7 million and impairment of long-lived asset charge of $9.6 million.
19. Subsequent Events
The Company evaluated subsequent events through the date the financial statements were available for issuance. On February 26, 2016, the Company's Board of Directors authorized a share repurchase program covering up to $25.0 million of the Company's common stock and warrants. The authorization is effective immediately, and will expire upon completion of the repurchase program, unless terminated earlier by the Board of Directors. Purchases under the program may be made in open market or privately negotiated transactions. The Company has no obligations to repurchase shares under this authorization, and the timing and value of shares purchased will depend on the Company's stock price, market conditions and other factors.
106
ITEM 9. | Changes in and Disagreements with Accountants on Accounting and Financial Disclosure |
None.
ITEM 9A. Controls and Procedures
Conclusion Regarding the Effectiveness of Disclosure Controls and Procedures
Under the supervision and with the participation of our senior management, consisting of our chief executive officer and our chief financial officer, we conducted an evaluation of the effectiveness of the design and operation of our disclosure controls and procedures (as defined in Rules 13a-15(e) and 15d-15(e) under the Securities Exchange Act of 1934, as amended (the “Exchange Act”), as of the end of the period covered by this report (the “Evaluation Date”). Based on that evaluation, the Company’s management, including our chief executive officer and chief financial officer, concluded that as of the Evaluation Date our disclosure controls and procedures were effective.
Our controls and procedures are based on assumptions. Additionally, even effective controls and procedures only provide reasonable assurance of achieving their objectives. Accordingly, we cannot guarantee that our controls and procedures will succeed or be adhered to in all circumstances.
We have evaluated our disclosure controls and procedures with the participation, and under the supervision, of our management, including our chief executive and chief financial officer. Based on this evaluation, our chief executive officer and chief financial officer have concluded that our disclosure controls and procedures were effective as of the end of the period covered by this report.
Our management is responsible for establishing and maintaining adequate internal control over our financial reporting. As discussed elsewhere in this Annual Report on Form 10-K, we completed the Business Combination on June 30, 2015. Prior to the Business Combination, DTH was a privately held company and therefore its controls were not required to be designed or maintained in accordance with Exchange Act Rule 13a-15. The design of public company internal controls over financial reporting for Del Taco following the Business Combination has required and will continue to require significant time and resources from our management and other personnel. As a result, management was unable, without incurring unreasonable effort or expense, to conduct an assessment of our internal control over financial reporting as of December 29, 2015. Therefore, we are excluding management’s report on internal control over financial reporting pursuant to Section 215.02 of the SEC’s Compliance and Disclosure Interpretations. In the future, management’s assessment of our internal control over financial reporting will include an evaluation of such elements as the design and operating effectiveness of key financial reporting controls, process documentation, accounting policies and our overall control environment. This assessment will be supported by testing and monitoring performed by our finance organization. In making this assessment, management will use the criteria set forth by the Committee of Sponsoring Organizations of the Treadway Commission (COSO) in Internal Control -- Integrated Framework Scope of the Controls Evaluation (2013 Framework).
This annual report on Form 10-K does not include an attestation report of our independent registered public accounting firm, because as an "emerging growth company" under the JOBS Act our independent registered public accounting firm is not required to issue such an attestation report.
Changes in Internal Control over Financial Reporting
No changes in our internal control over financial reporting (as defined in Rules 13a-15(f) and 15d-15(f) under the Exchange Act) occurred during the period covered by this report that have materially affected or are reasonably likely to affect materially our internal control over financial reporting.
107
ITEM 9B. Other Information
None.
PART III
ITEM 10. Directors, Executive Officers, and Corporate Governance
Information with respect to the Company’s Executive Officers is set forth in Item 1 of Part I of this Annual Report under the heading “Executive Officers of the Registrant.” pursuant to General Instruction G of Form 10-K. The information required to be furnished pursuant to this item with respect to Directors of the Company will be set forth under the caption “Election of Directors” in the Company’s proxy statement (the “2015 Proxy Statement”) to be furnished to stockholders in connection with the solicitation of proxies by the Company’s Board of Directors for use at the 2015 Annual Meeting of Stockholders, and is incorporated herein by reference.
The information required to be furnished pursuant to this item with respect to compliance with Section 16(a) of the Exchange Act will be set forth under the caption “Section 16(a) Beneficial Ownership Reporting Compliance” in the 2015 Proxy Statement, and is incorporated herein by reference.
The information required to be furnished pursuant to this item with respect to the Audit Committee and the Audit Committee financial expert will be set forth under the caption “Committees of the Board of Directors” in the 2015 Proxy Statement, and is incorporated herein by reference.
Information required to be furnished pursuant to this item with respect to and any material changes to the process by which security holders may recommend nominees to the Board of Directors will be set forth under the caption “Stockholder Proposals for the 2016 Annual Meeting and Nominations of Directors” in the 2015 Proxy Statement, and is incorporated herein by reference.
The Company has adopted a Code of Ethics that applies to all of our employees. These documents, along with charters of our Audit, Compensation, and Corporate Governance and Nominating Committees, are posted on the Company’s website at www.investor.deltaco.com. Disclosures of amendments to or waivers with regard to the provisions of the Code of Ethics also will be posted on the Company’s website.
ITEM 11. Executive Compensation
The information required to be furnished pursuant to this item will be set forth under the caption “Executive Compensation”, “Corporate Governance” and in the Director Compensation Table and its accompanying narrative in the 2015 Proxy Statement, and is incorporated herein by reference.
ITEM 12. | Security Ownership of Certain Beneficial Owners and Management and Related Stockholder Matters |
The following table presents information regarding the Company’s common stock authorized for issuance under the Company’s equity compensation plans.
(a) | (b) | (c) | |||||||
Number of Securities to be Issued Upon Exercise of Outstanding Options and Rights | Weighted-Average Exercise Price of Outstanding Options and Rights (1) | Number of Securities Remaining Available for Future Issuance Under Equity Compensation Plans (excluding securities reflected in column (a)) | |||||||
Equity Compensation Plans Approved by Security Holders: | 1,170,494 | $ | 10.40 | 2,129,506 | |||||
Equity Compensation Plans Not Approved by Securities Holders | None | N/A | None | ||||||
Total | 1,170,494 | $ | 10.40 | 2,129,506 | |||||
(1) The weighted-average exercise price in column (b) includes the weighted-average exercise price of stock options only.
108
Other information required to be furnished pursuant to this will be set forth under the caption “Stock Ownership” in the 2015 Proxy Statement, and is incorporated herein by reference.
ITEM 13. Certain Relationships and Related Transaction and Director Independence
The information required to be furnished pursuant to this item will be set forth under the captions “Certain Relationships and Related Party Transactions” and “Corporate Governance” in the 2015 Proxy Statement, and is incorporated herein by reference.
ITEM 14. Principal Accounting Fees and Services
The information required to be furnished pursuant to this item will be set forth under the caption “Principal Accounting Firm Fees” in the 2015 Proxy Statement, and is incorporated herein by reference.
109
PART IV
ITEM 15. Exhibits, Financial Statement Schedules
1. All Financial statements
Consolidated financial statements filed as part of this report are listed under Item 8. “Financial Statements and Supplementary Data.”
2. Financial statement schedules
Schedule II. Valuation and Qualifying Accounts - Twenty-six weeks ended December 29, 2015 (Successor), twenty-six weeks ended June 30, 2015 (Predecessor), fifty-two weeks ended December 30, 2014, and fifty-two weeks ended December 31, 2013 (Predecessor).
All other schedules are omitted as the required information is inapplicable, or the information required is included in the consolidated financial statements or the notes thereto.
3. Exhibits
The exhibits listed on the accompanying Exhibit Index are filed or incorporated by reference as part of this report.
110
Del Taco Restaurants, Inc.
Schedule II - Valuation and Qualifying Accounts
Valuation Allowance for Deferred Tax Assets
(in thousands)
Additions | |||||||||||||||||||||
Description | Balance at beginning of period | Charged to costs and expenses | Charge to other accounts | Deductions | Balance at end of period | ||||||||||||||||
Twenty-Six Weeks Ended December 29, 2015 (Successor) | $ | 1,926 | (A) | $ | — | $ | — | $ | (1,926 | ) | $ | — | |||||||||
Twenty-Six Weeks Ended June 30, 2015 (Predecessor) | 20,217 | — | — | (2,819 | ) | $ | 17,398 | (B) | |||||||||||||
Fifty-Two Weeks Ended December 30, 2014 (Predecessor) | 17,077 | 3,098 | 42 | — | $ | 20,217 | |||||||||||||||
Fifty-Two Weeks Ended December 31, 2013 (Predecessor) | 13,026 | 4,015 | 36 | — | $ | 17,077 | |||||||||||||||
(A) Del Taco Restaurants, Inc. had a full valuation allowance on its deferred taxes assets of $1.9 million as of June 30, 2015 which was not presented with Del Taco Holdings, Inc.'s (DTH) predecessor financial results.
(B) As part of purchase accounting, Del Taco Restaurants, Inc. (the "Company") was required to record all of DTH's acquired assets and liabilities at their acquisition date fair value, including deferred income taxes. The Company considered the weight of both positive and negative evidence and concluded that it is more likely than not that DTH's deferred tax assets will be realized and that no valuation allowance on DTH's deferred tax asset was required as of the date of acquisition. As a result, the Company established deferred tax assets as well as deferred tax liabilities related to indefinite-lived intangibles through the purchase price allocation and the $17.4 million valuation allowance as of June 30, 2015 (Predecessor) was not established through purchase accounting.
111
SIGNATURES
Pursuant to the requirements of the Securities Exchange Act of 1934, the registrant has duly caused this report to be signed on its behalf by the undersigned, thereunto duly authorized.
DEL TACO RESTAURANTS, INC. |
Date: March 7, 2016 |
/s/ PAUL J.B. MURPHY III |
Paul J.B. Murphy, III |
President and Chief Executive Officer |
Pursuant to the requirements of the Securities and Exchange Act of 1934, this report has been signed below by the following persons on behalf of the Registrant and in the capacities indicated on March 7, 2016.
Signature | Title | |
/s/ PAUL J.B. MURPHY, III | President and Chief Executive Officer | |
(Paul J.B. Murphy, III) | (principal executive officer) | |
/s/ STEVEN L. BRAKE | Executive Vice President and Chief Financial Officer | |
(Steven L. Brake) | (principal financial and accounting officer) | |
/s/ EILEEN A. APTMAN | Director | |
(Eileen A. Aptman) | ||
/s/ ARI B. LEVY | Director | |
(Ari B. Levy) | ||
/s/ LAWRENCE F. LEVY | Director | |
(Lawrence F. Levy) | ||
/s/ R.J. MELMAN | Director | |
(R.J. Melman) | ||
/s/ JOSEPH STEIN | Director | |
(Joseph Stein) | ||
/s/ PATRICK D. WALSH | Director | |
(Patrick D. Walsh) | ||
112
EXHIBIT INDEX
Exhibit No. | Description | |
2.1^ | Agreement and Plan of Merger, dated as of March 12, 2015, by and among Del Taco Restaurants, Inc. (formerly known as Levy Acquisition Corp.), Levy Merger Sub, LLC and Del Taco Holdings, Inc. (incorporated by reference to Exhibit 2.1 to Del Taco Restaurant Inc.’s Current Report on Form 8-K (File No. 001-36197) filed with the SEC on March 12, 2015). | |
3.1 | Second Amended and Restated Certificate of Incorporation (incorporated by reference to Exhibit 3.1 to the Company’s Current Report on Form 8-K (File No. 001-36197) filed with the Securities and Exchange Commission on July 2, 2015). | |
3.2 | Bylaws (incorporated by reference to Exhibit 3.3 to Del Taco Restaurant, Inc.'s Registration Statement on Form S-1 (File No. 333-191587), filed with the Securities and Exchange Commission on October 7, 2013). | |
4.1 | Specimen Common Stock Certificate (incorporated by reference to Exhibit 4.1 to the Company’s Current Report on Form 8-K (File No. 001-36197) filed with the Securities and Exchange Commission on July 2, 2015). | |
4.2 | Specimen Warrant Certificate (incorporated by reference to Exhibit 4.3 to the Company’s Current Report on Form 8-K (File No. 001-36197) filed with the Securities and Exchange Commission on July 2, 2015). | |
4.3 | Warrant Agreement, dated as of November 13, 2013, between Del Taco Restaurant, Inc. (formerly known as Levy Acquisition Corp.) and Continental Stock Transfer and Trust Company (incorporated by reference to Exhibit 4.2 to Levy Acquisition Corp.’s Current Report on Form 8-K (File No. 001-36197), filed with the Securities and Exchange Commission on November 19, 2013). | |
10.1 | Credit Agreement, dated as of August 4, 2015, among Sagittarius Restaurants LLC, as Borrower, Del Taco Holdings, Inc., as Holdings, certain other subsidiaries of Holdings party thereto, Bank of America, N.A., as Administrative Agent, Swing Line Lender and L/C Issuer, and the other lenders party thereto (incorporated by reference to the Company’s Form 8-k filed with the Securities and Exchange Commission on August 7, 2015). | |
10.2* | Stockholders Agreement, dated as of March 12, 2015, by and among Del Taco Restaurant Inc. (formerly known as Levy Acquisition Corp.) and certain holders of common stock of Del Taco Restaurant Inc. and certain other persons (incorporated by reference to Exhibit 10.1 to Del Taco Restaurant Inc.’s Current Report on Form 8-K (File No. 001-36197), filed with the Securities and Exchange Commission on March 12, 2015). | |
10.3 | Management Rights Letter Agreement, dated June 30, 2015, between Del Taco Restaurant Inc. (formerly known as Levy Acquisition Corp.) and GS Mezzanine Partners 2006 Institutional, L.P. (incorporated by reference to Exhibit 10.2 to Del Taco Restaurant Inc.’s Current Report on Form 8-K (File No. 001-36197) filed with the SEC on July 2, 2015). | |
10.4* | Employment Letter Agreement, dated January 15, 2009, between Paul J.B. Murphy, III and Del Taco Holdings, Inc. (as amended on December 15, 2014) (incorporated by reference to Exhibit 10.3 to Del Taco Restaurant Inc.’s Current Report on Form 8-K (File No. 001-36197) filed with the SEC on July 2, 2015). | |
10.5* | Employment Letter Agreement, dated July 17, 2008, between John Cappasola, Jr. and Del Taco Holdings, Inc. (as amended on May 3, 2011 and December 15, 2014) (incorporated by reference to Exhibit 10.4 to Del Taco Restaurant Inc.’s Current Report on Form 8-K (File No. 001-36197) filed with the SEC on July 2, 2015). | |
10.6* | Severance Agreement, dated July 21, 2009, between Steven L. Brake and Del Taco Holdings, Inc. (as amended on December 15, 2014) (incorporated by reference to Exhibit 10.5 to Del Taco Restaurant Inc.’s Current Report on Form 8-K (File No. 001-36197) filed with the SEC on July 2, 2015). | |
10.7 | Senior Credit Facility, as amended, dated April 1, 2013 between F&C Restaurant Holding Co., Sagittarius Restaurants LLC and General Electric Capital Corporation (incorporated by reference to Exhibit 10.6 to Del Taco Restaurant Inc.’s Current Report on Form 8-K (File No. 001-36197) filed with the SEC on July 2, 2015). | |
10.8* | Del Taco Restaurants, Inc. Omnibus Incentive Plan (incorporated by reference to Annex C to Del Taco Restaurant Inc. ‘s (formerly known as Levy Acquisition Corp.) definitive proxy statement (File No. 001-36197) filed with the Securities and Exchange Commission on June 11, 2015). | |
113
10.9 | Form of Development Agreement (incorporated by reference to Exhibit 10.8 to Del Taco Restaurant Inc.’s Current Report on Form 8-K (File No. 001-36197) filed with the SEC on July 2, 2015). | |
10.10* | Letter Agreement among the Company; Levy Acquisition Sponsor, LLC; Lawrence F. Levy; Ari B. Levy; Steven C. Florsheim; Levy Family Partners, LLC; Claire P. Murphy, as trustee of the Steven Florsheim 2003 Investment Trust; Claire P. Murphy, as trustee of the Ari Levy 2003 Investment Trust; Claire P. Murphy, as trustee of the Andrew Florsheim 2003 Investment Trust; Claire P. Murphy, as trustee of the Robert Florsheim 2003 Investment Trust; Michael Wallach; Sophia Stratton; Claire Murphy; Tim Won; Adam Cummis; and Andrew Feldman, dated as of November 13, 2013 (incorporated by reference to Exhibit 10.1(a) to the Company’s Current Report on Form 8-K (File No. 001-36197), filed with the Securities and Exchange Commission on November 19, 2013). | |
10.11* | Letter Agreement between the Company and Howard B. Bernick, dated as of November 13, 2013 (incorporated by reference to Exhibit 10.1(b) to the Company’s Current Report on Form 8-K (File No. 001-36197), filed with the Securities and Exchange Commission on November 19, 2013). | |
10.12* | Letter Agreement between the Company and Craig J. Duchossois, dated as of November 13, 2013 (incorporated by reference to Exhibit 10.1€ to the Company’s Current Report on Form 8-K (File No. 001-36197), filed with the Securities and Exchange Commission on November 19, 2013). | |
10.13* | Letter Agreement between the Company and Greg Flynn, dated as of November 13, 2013 (incorporated by reference to Exhibit 10.1(d) to the Company’s Current Report on Form 8-K (File No. 001-36197), filed with the Securities and Exchange Commission on November 19, 2013). | |
10.14* | Letter Agreement between the Company and Marc S. Simon, dated as of November 13, 2013 (incorporated by reference to Exhibit 10.1€ to the Company’s Current Report on Form 8-K (File No. 001-36197), filed with the Securities and Exchange Commission on November 19, 2013). | |
10.15 | Private Placement Warrants Purchase Agreement, dated August 5, 2013, between the Company and Levy Acquisition Sponsor, LLC (incorporated by reference to Exhibit 10.6 to the Company’s Registration Statement on Form S-1 (File No. 333-191587), filed with the Securities and Exchange Commission on October 7, 2013.) | |
10.16* | Form of Restricted Stock Award Agreement. | |
10.17* | Form of Stock Option Agreement. | |
21.1 | Subsidiaries of the registrant (incorporated by reference to Exhibit 21.1 to Del Taco Restaurant Inc.’s Current Report on Form 8-K (File No. 001-36197) filed with the SEC on July 2, 2015). | |
23.1 | Consent of Ernst & Young LLP | |
31.1 | Certification of the Chief Executive Officer required by Rule 13a-14(a) or Rule 15d-14(a). | |
31.2 | Certification of the Chief Financial Officer required by Rule 13a-14(a) or Rule 15d-14(a). | |
32.1 | Certification of the Chief Executive Officer required by Rule 13a-14(b) or Rule 15d-14(b) and 18 U.S.C. 1350. | |
32.2 | Certification of the Chief Financial Officer required by Rule 13a-14(b) or Rule 15d-14(b) and 18 U.S.C. 1350. | |
101.INS | XBRL Instance Document. | |
101.SCH | XBRL Taxonomy Extension Schema Document. | |
101.CAL | XBRL Taxonomy Extension Calculation Linkbase Document. | |
101.LAB | XBRL Taxonomy Extension Label Linkbase Document. | |
101.PRE | XBRL Taxonomy Extension Presentation Linkbase Document. | |
101.DEF | XBRL Taxonomy Extension Definition Document. | |
* Management contract or compensatory plan or arrangement.
^ The exhibits and schedules to this Exhibit have been omitted in accordance with Regulation S-K Item 601(b)(2). The Registrant agrees to furnish supplementally a copy of all omitted exhibits and schedules to the Securities and Exchange Commission upon its request.
114