Attached files
| file | filename |
|---|---|
| EX-23.1 - EX-23.1 - Marketo, Inc. | a2227487zex-23_1.htm |
| EX-32.2 - EX-32.2 - Marketo, Inc. | a2227487zex-32_2.htm |
| EX-31.1 - EX-31.1 - Marketo, Inc. | a2227487zex-31_1.htm |
| EX-31.2 - EX-31.2 - Marketo, Inc. | a2227487zex-31_2.htm |
| EX-32.1 - EX-32.1 - Marketo, Inc. | a2227487zex-32_1.htm |
| EX-21.1 - EX-21.1 - Marketo, Inc. | a2227487zex-21_1.htm |
Use these links to rapidly review the document
TABLE OF CONTENTS
Item 8. Financial Statements and Supplementary Data
UNITED STATES
SECURITIES AND EXCHANGE COMMISSION
Washington, D.C. 20549
FORM 10-K
| (MARK ONE) | ||
ý |
ANNUAL REPORT PURSUANT TO SECTION 13 OR 15(d) OF THE SECURITIES EXCHANGE ACT OF 1934 |
|
FOR THE FISCAL YEAR ENDED DECEMBER 31, 2015 |
||
OR |
||
o |
TRANSITION REPORT PURSUANT TO SECTION 13 OR 15(d) OF THE SECURITIES EXCHANGE ACT OF 1934 |
|
FOR THE TRANSITION PERIOD FROM TO |
||
Commission File Number 001-35909
MARKETO, INC.
(Exact name of registrant as specified in its charter)
| Delaware (State or other jurisdiction of incorporation or organization) |
56-2558241 (I.R.S. Employer Identification No.) |
901 Mariners Island Boulevard, Suite 500
San Mateo, California 94404
(Address of principal executive offices)
(650) 376-2300
(Registrant's telephone number, including area code)
Securities registered pursuant to Section 12(b) of the Act:
| Title of each class | Name of each exchange on which registered | |
|---|---|---|
| Common Stock, par value $0.0001 per share | Nasdaq Stock Market LLC (Nasdaq Global Select Market) |
Securities registered pursuant to Section 12(g) of the Act: None.
Indicate by check mark if the registrant is a well-known seasoned issuer, as defined in Rule 405 of the Securities Act. YES o NO ý
Indicate by check mark whether the registrant is not required to file reports pursuant to Section 13 or Section 15(d) of the Act. YES o NO ý
Indicate by check mark whether the registrant (1) has filed all reports required to be filed by Section 13 or 15(d) of the Securities Exchange Act of 1934 during the preceding 12 months (or for such shorter period that the registrant was required to file such reports), and (2) has been subject to such filing requirements for the past 90 days. YES ý NO o
Indicate by check mark whether the registrant has submitted electronically and posted on its corporate Web site, if any, every Interactive Data file required to be submitted and posted pursuant to Rule 405 of Regulation S-T (§232.405 of this chapter) during the preceding 12 months (or for such shorter period that the registrant was required to submit and post such files). YES ý NO o
Indicate by check mark if disclosure of delinquent filers pursuant to Item 405 of Regulation S-K is not contained herein, and will not be contained, to the best of registrant's knowledge, in definitive proxy or information statements incorporated by reference in Part III of this Form 10-K or any amendment to this Form 10-K. o
Indicate by check mark whether the registrant is a large accelerated filer, an accelerated filer, a non-accelerated filer, or a smaller reporting company. See the definitions of "large accelerated filer," "accelerated filer," and "smaller reporting company" in Rule 12b-2 of the Exchange Act. (Check one):
| Large accelerated filer o | Accelerated filer ý | Non-accelerated filer o (Do not check if a smaller reporting company) |
Smaller reporting company o |
Indicate by check mark whether the registrant is a shell company (as defined in Rule 12b-2 of the Exchange Act). YES o NO ý
The aggregate market value of common stock held by non-affiliates of the registrant, computed by reference to the closing price at which the common stock was sold on June 30, 2015, the last business day of the registrant's most recently completed second fiscal quarter, as reported on the NASDAQ, was approximately $467.5 million. Shares of common stock held by each executive officer, director and holder of 5% or more of the outstanding common stock have been excluded in that such persons may be deemed to be affiliates. This determination of affiliate status does not reflect a determination that such persons are affiliates of the registrant for any other purpose.
On February 26, 2016, the registrant had 44,384,855 shares of common stock outstanding.
DOCUMENTS INCORPORATED BY REFERENCE
Portions of the registrant's definitive Proxy Statement for its 2016 Annual Meeting of Stockholders are incorporated by reference in Part III of this Annual Report on Form 10-K. Such Proxy Statement will be filed with the U.S. Securities and Exchange Commission within 120 days after the end of the fiscal year to which this report relates. Except with respect to information specifically incorporated by reference in this Form 10-K, the Proxy Statement is not deemed to be filed as part of this Form 10-K.
MARKETO, INC.
Table of Contents
2
SPECIAL NOTE REGARDING FORWARD-LOOKING STATEMENTS
This Annual Report on Form 10-K contains forward-looking statements that are based on our management's beliefs and assumptions and on information currently available to our management. The forward-looking statements are contained principally in, but not limited to, the sections titled "Business," "Risk Factors," and "Management's Discussion and Analysis of Financial Condition and Results of Operations." Forward-looking statements include all statements that are not historical facts and can be identified by terms such as "anticipates," "believes," "could," "seeks," "estimates," "expects," "intends," "may," "plans," "potential," "predicts," "projects," "should," "will," "would" or similar expressions and the negatives of those terms. Forward-looking statements include, but are not limited to, statements about:
- •
- our future financial performance, including our expectations regarding our revenue, cost of revenue, gross profit or gross margin,
operating expenses, ability to generate cash flow, and ability to achieve, and maintain, future profitability;
- •
- our anticipated growth and growth strategies and our ability to effectively manage that growth and effect these strategies;
- •
- anticipated trends, growth rates, relative growth rates, areas of investment and challenges in our business and in the markets in
which we operate;
- •
- future economic conditions;
- •
- our ability to anticipate market needs and develop new and enhanced products and services to meet those needs, and our ability to
successfully monetize them;
- •
- maintaining and expanding our customer base and our relationships with other companies;
- •
- the impact of competition in our industry and innovation by our competitors;
- •
- the impact of any failure to anticipate and adapt to future changes in our industry;
- •
- the evolution of technology affecting our products, services and markets;
- •
- our ability to sell our products and expand internationally;
- •
- our ability to hire and retain necessary qualified employees to expand and scale our operations;
- •
- the impact of any failure of our solutions or solution innovations;
- •
- our reliance on our third-party service providers;
- •
- our ability to adequately protect our brand and other intellectual property;
- •
- our ability to integrate businesses that we have acquired or may acquire;
- •
- the impact of seasonality on our business;
- •
- our ability to successfully execute our R&D program and to continue to develop and innovate product offerings at the same pace;
- •
- the anticipated effect on our business of litigation to which we are or may become a party;
- •
- our ability to stay abreast of new or modified laws, standards and regulations that currently apply or become applicable to our
business both in the United States and internationally;
- •
- the effects of security breaches, catastrophic events or failures in our or our customers' products and services on our business;
- •
- the effect of changing privacy laws and privacy-related expectations of customers on our business;
3
- •
- the expense and administrative workload associated with being a public company;
- •
- our ability to maintain an effective system of internal controls necessary to accurately report our financial results and prevent
fraud;
- •
- our liquidity and working capital requirements;
- •
- the estimates and estimate methodologies used in preparing our consolidated financial statements; and
- •
- the future trading prices of our common stock and the impact of securities analysts' reports on these prices.
Forward-looking statements involve known and unknown risks, uncertainties and other factors that may cause our actual results, performance or achievements to be materially different from any future results, performance or achievements expressed or implied by the forward-looking statements. We discuss these risks in greater detail in the section entitled "Risk Factors" and elsewhere in this Annual Report on Form 10-K. Given these uncertainties, you should not place undue reliance on these forward-looking statements. Also, forward-looking statements represent our management's beliefs and assumptions only as of the date of this Annual Report on Form 10-K. You should read this Annual Report on Form 10-K completely and with the understanding that our actual future results may be materially different from what we expect.
Except as required by law, we assume no obligation to update these forward-looking statements publicly, or to update the reasons actual results could differ materially from those anticipated in these forward looking statements, even if new information becomes available in the future.
4
Overview
Marketo serves as a strategic marketing partner to more than 4,500 large and medium enterprises and small companies across a wide variety of industries.
Our applications are complemented by the Marketo Marketing Nation®, a thriving network of more than 550 third-party solutions through our LaunchPoint® ecosystem and over 60,000 marketers who share and learn from each other to grow their collective marketing expertise.
Our Engagement Marketing Platform offers a unique blend of power and speed that is appealing to business to business (B2B) and business to consumer (B2C) customers across both large enterprises and Small and Medium Businesses (SMBs). Our client base is diverse, with 4,549 customers as of December 31, 2015 across a wide range of industries including business services, consumer, financial services, healthcare, manufacturing, media, technology and telecommunications. For the year ended December 31, 2015, our 20 largest customers accounted for approximately 12% of our total revenue.
We provide our solutions on a subscription basis and generated revenue of $209.9 million, $150.0 million and $95.9 million in 2015, 2014 and 2013, respectively, representing year-over-year increases of 40% and 56%, respectively. We had net losses attributable to Marketo of $71.5 million, $54.3 million and $47.4 million in 2015, 2014 and 2013, respectively, due to increased investments in our growth. As of December 31, 2015, we had an accumulated deficit of $251.3 million.
Our leading cloud-based Engagement Marketing Platform is purpose-built to enable organizations ranging from SMBs to the world's largest enterprises to engage in modern relationship marketing. Our platform enables the effective execution, management and analytical measurement of online, social, mobile and offline marketing activities and customer interactions in today's data-centric, multi-channel business environment.
Many of the strategies and business processes that our solution supports are new and rapidly evolving, and there is relatively little accumulated experience in many of our prospective customers about how best to take advantage of modern relationship marketing. We therefore complement our products with an extensive network of resources to assist our customers with the strategic and practical use of our solutions. Among these resources are expert consulting services, peer-to-peer discussion communities, a library of pre-built marketing programs and templates, rich content on marketing best practices and an integrated ecosystem of partner products. We collectively refer to this extended set of resources as the Marketo Marketing Nation.
We were incorporated in the state of California on January 20, 2006. We were reincorporated in the state of Delaware in 2009. We operate from our headquarters in San Mateo, California and have operating subsidiaries in Ireland, Australia, Israel, Japan and the United Kingdom. Additional information about us is available on our website at http://www.marketo.com. The information on our website is not incorporated herein by reference and is not a part of this Annual Report on Form 10-K.
Our Products
We design, build, and market the Engagement Marketing Platform along with a set of integrated applications to broadly address the needs of modern marketing professionals. Our customers use these applications individually and in combination to streamline and automate marketing processes; develop, retain and extend customer relationships; and measure the positive impact on revenue of marketing programs.
5
These applications are built upon a common platform and database system of record called the Audience Hub. The Audience Hub enables marketers to form deep insights about customers based on their online and offline behavior across multiple channels, driving real-time interactions that speak directly to each individual. The Engagement Marketing Platform also supports an ecosystem of complementary partner applications that we call LaunchPoint. Our Engagement Marketing Platform and suite of applications is hosted and delivered over the web using a cloud-based, or Software as a Service (SaaS), model, and is built using modern multi-tenant architecture.
We have built a rich set of applications across ten categories that run on the Engagement Marketing Platform, as follows:
- •
- Marketing Automation provides a complete set of capabilities for marketers to
orchestrate personalized multi-channel marketing campaigns and workflows. It includes functionality for marketers to create personalized marketing messages that are triggered in real-time based on
customer behaviors; generate custom web pages without any programming knowledge; streamline the entire process of running online (e.g., webinar) and offline (e.g., trade show) marketing
events; and execute sophisticated nurturing campaigns that can automatically engage customers in a highly-relevant way over a period of days, weeks, or months.
- •
- Email Marketing provides marketers the ability to tap the rich insights captured in
the Audience Hub to dynamically send the right email message to the right person, at the right time—at scale. A visual editor and fully responsive templates make creating emails that look
great on any device fast and easy. Using a simple drag and drop interface, marketers can setup emails that are triggered automatically in real time based on activity—or lack of
activity—in any customer channel.
- •
- Mobile Engagement provides marketers with the ability to engage customers on their
mobile devices as part of a seamless customer journey. It extends the platform's cross-channel listening capabilities to the mobile app environment. Customer behaviors within mobile apps can be used
to personalize engagement across the web, social, email, and advertising channels. Behaviors across these channels can also be used to deliver personalized push notifications and in-app messages in
mobile apps, creating a consistent experience as consumers hop seamlessly between channels and devices.
- •
- Social Marketing lets marketers run dedicated social media marketing campaigns, as
well as augment traditional marketing campaigns with social marketing, to amplify marketing messages across leading social networks. Our solution lets marketers add intelligent social sharing buttons
to existing web content and videos; publish new Facebook pages with the touch of a button; build social engagement applications such as polls, sweepstakes, and referral offers to engage their audience
and promote social cross posting; and augment existing customer and prospect information with social profiles and sharing behavior.
- •
- Digital Ads allows marketers to leverage the rich behavioral data captured in the
Audience Hub to drive more personalized digital ads. Marketo Ad Bridge is our application that connects online advertising efforts to an overall engagement marketing strategy, so marketers can find
and attract the right customers and move them quickly through the buyer journey. By bringing together Marketo's marketing insights with ad tech solutions, marketers can effectively target audience
members based on who they are and what they do, as well as track, measure, and optimize their digital advertising programs.
- •
- Web Personalization helps marketers make the most of web visits by personalizing experiences to engage people more deeply. It provides marketers the ability to personalize web and mobile interactions for both known and anonymous web visitors based on who they are and how they've behaved across the web and other channels. Additionally, B2B companies can personalize
6
- •
- Marketing Analytics takes advantage of our database system of record and time-series
analytics engine to help organizations answer sophisticated questions about their marketing performance over time. This application enables organizations to prove—and
improve—the revenue impact that marketing has on every stage of the buying journey, and includes: a library of operational reports detailing email and landing page performance, web
activity, and lead performance; intuitive analyzers that show the influence of marketing on individual customer outcomes; analytics that compute and illustrate the impact, effectiveness, and return on
investment of marketing programs individually and in aggregate; and an ad- hoc report builder for completely customized reports and dashboards.
- •
- Predictive Content automatically discovers website assets such as videos, e-books,
case studies, and blog posts and learns which content works best for each person based on visitor profiles, content consumption, and other behavioral patterns. Marketo Predictive Content leverages
machine learning and predictive analytics to present real-time content recommendations to targeted individuals browsing a company's website, continuously optimizing engagement rates.
- •
- Marketing Calendar helps marketing teams plan and coordinate their activities across
functions and regions. It gives marketers the ability to create and modify their campaigns directly through a calendar built specifically for marketers, which saves time and reduces errors. Leveraging
the rich underlying program data available through the Engagement Marketing Platform, marketers can create specialized calendar views by channel, audience, region, and more to streamline plans. The
Calendar HD function lets marketers display their plans, programs, and goals on wall-mounted HDTV displays, improving team coordination and communication.
- •
- Sales Insight enables customers to improve the effectiveness of their salespeople by helping them focus their time on the prospects most likely to purchase. Sold on a per-seat basis, it provides sales reps with an automated "Best Bets" view that highlights their best leads and opportunities; easy-to-read lead scoring that identifies both lead quality and urgency; online behavior tracking that highlights key activities that indicate buying interest; and the ability for salespeople to turn insight into action by sending tracked emails or entire campaigns directly within the customer relationship management (CRM) system, Microsoft Outlook and/or Google Mail.
website messages for visitors coming from specific target accounts or groups of accounts, or based on the visitor's industry or company size, even if they're anonymous.
In 2016, we strategically integrated our Real-time Personalization and AdBridge application capabilities into our new Web Personalization, Predictive Content, and Digital Ads applications. We also added a new discrete Email application to serve the needs of marketers who need to move up to a more modern generation of email marketing. We have historically introduced a new application for the Engagement Marketing Platform approximately once every twelve to eighteen months, and we intend to continue this pace of innovation in the future.
These applications are built upon the Engagement Marketing Platform and all work together, so that when our customers purchase and deploy more than one, they operate as a single cohesive offering. In particular, this means they share a common user interface and one underlying database system of record, and that the combination of applications yields synergy that would not be practical with multiple independent tools.
Packaging by Solutions and Market Segment
We market and sell our solutions to both large global enterprises, which we currently define as businesses with 1,500 or more employees, and SMBs, which we currently define as businesses with fewer than 1,500 employees. For our SMB customers, in fiscal year 2015, we primarily packaged and
7
priced applications and engagement marketing platform in four different editions. Each edition combined our platform with selected features and functions from each of our application categories to suit the varied needs of smaller businesses:
- •
- Spark Edition, which was optimized for small businesses and first-time marketing
automation users. Spark Edition provides complete email marketing functionality, plus CRM integration and relationship marketing campaigns, and includes entry level lead nurturing, scoring, landing
pages, social campaigns, event management, and reporting.
- •
- Standard Edition, which included all Spark Edition features, with additional features
including more advanced lead scoring and CRM integration, dynamic content in emails and landing pages, A/B testing, social engagement applications, and revenue analysis dashboards.
- •
- Select Edition, which was built for companies with more sophisticated marketing
requirements. It includes all Standard Edition features along with additional features including time-series revenue analytics, more sophisticated social promotion tools, and permission-based access
controls to support extended teams.
- •
- Dialog Edition, which was designed to help consumer businesses move beyond point-in-time email blasts to automated, individual, behavior- based conversations that drive customer engagement.
For our enterprise customers in 2015, we packaged and priced our products on an individual application basis. Our enterprise customers could select one or more of our existing applications that ran on top of the Engagement Marketing Platform, and could add additional applications later as their needs evolved.
Our customers have expressed the need to address an expanding set of marketing challenges from acquisition to advocacy across their businesses. To help both consumer and business marketers address these needs, in 2016, we have packaged our applications and engagement marketing platform into five business solutions. These solutions are preconfigured to provide exactly the right set of application and platform capabilities for the each unique business need:
- •
- Email Marketing: Marketo's Email Marketing solution provides a sophisticated
alternative to batch and blast emailing, allowing marketers to communicate with their customers in a personalized and relevant way, automatically and at scale.
- •
- Lead Management: With this all-encompassing solution marketers can attract the right
buyers and nurture them with personalized campaigns, deliver win-ready leads to sales, and measure marketing's impact on revenue.
- •
- Consumer Marketing: B2C marketers are obsessed with acquiring and retaining consumers.
Marketo's Consumer Marketing solution helps B2C marketers target and acquire the right consumers, engage them seamlessly across all channels, and deliver relevant messages to build loyalty.
- •
- Customer Base Marketing: Some customers aren't just focused on growing their database,
they're focused on marketing to their existing customers. Marketo's Customer Base Marketing solution allows these marketers to expand their relationship with their customers by identifying the right
complementary products to market to them to drive growth.
- •
- Mobile Marketing: Many companies use mobile applications as a primary channel. Marketo's Mobile Marketing solution lets marketers listen and dynamically respond to mobile app user activity, location, and behaviors to deliver relevant, cross-channel experiences from a single, unified platform.
8
Customers
Our client base is diverse with customers across a wide range of industries including business services, consumer, financial services, healthcare, manufacturing, media, technology and telecommunications. Geographically, the United States continues to represent our primary market, with international sales representing 15.3%, 16.1% and 14.5% of our total revenue in 2015, 2014 and 2013, respectively. As of December 31, 2015, we had 4,549 customers.
Sales and Marketing
We sell subscriptions to our cloud-based solutions and services primarily through our direct sales force, whose primary sales operations are in San Mateo, California; Atlanta, Georgia; Dublin, Ireland; Tokyo, Japan; Sydney, Australia and Farnborough, United Kingdom. Our direct sales force is also responsible for selling to existing customers, who may renew their subscriptions, increase the usage of our products over time, add new products from our solution suite, and expand the deployment of our solutions across their organizations. In addition, we sell to distributors, agencies, resellers, and OEMs who in turn resell our solution to their end customers, or use our solution to provide a variety of managed services offerings to their customers.
Our marketing activities are designed to build broad brand awareness, generate thought leadership and create demand and leads for our sales organizations within our target markets. Our marketing programs target influencers and decision-makers participating in a buying cycle, including the chief marketing officer, the chief information officer, the chief financial officer, the functional heads of marketing and other key technology managers. Additionally, we conduct marketing programs to engage with industry analysts, consulting firms, marketing service providers, marketing agencies, business and trade press, and other industry pundits who exert considerable influence in our market.
Research and Development
We devote a substantial portion of our resources to developing new solutions and enhancing existing solutions, conducting quality assurance testing and improving our core technology. We continually enhance our Engagement Marketing Platform and existing applications, as well as develop new applications to meet our customers' evolving relationship marketing needs.
We monitor and test our solutions on a regular basis, and maintain regular release processes to refine and update our solutions. We have historically deployed new releases and updates ten or more times per year.
Our research and development expenses were $39.1 million, $30.3 million and $23.3 million for the years ended December 31, 2015, 2014 and 2013, respectively.
Technology Infrastructure and Operations
We have designed our technology infrastructure to provide a highly available and secure multi-tenant cloud-based platform for marketing solutions. We utilize leading hardware and software components and modern systems architecture, which enable us to incrementally increase computing capacity as our customer base grows and adoption of our solution increases. Our solutions use a single code base for all customers and are globally available via standard web browsers. Our multi-tenant model uses a common data model for all customers but provides data isolation with separate tables and schemas for each customer.
We host our solutions at several rented facilities in the United States, the European Union ("EU") and Australia. Each facility provides physical security including staffed security 24 hours per day, seven days a week, biometric access controls, and redundant power, environmental controls and Internet connection points. We continuously monitor our services for availability, performance and security.
9
In 2012, to improve the responsiveness and cost efficiency of our data center operations, we began to transition from a managed hosting service provider to co-location data center facilities for which we began purchasing and managing our own computer equipment and systems that are located in rented facilities. We began to serve customers with our first wholly self-managed data center in the third quarter of 2012, and completed the first and largest phase of this long term program to migrate our customers to our self-managed data centers during the fourth quarter of 2013, covering all of our U.S. based data centers.
Competition
The market for cloud-based marketing solutions and related solutions is evolving, highly competitive and fragmented. We face intense competition from other software companies that develop marketing solutions. Some of these competitors include:
- •
- cloud-based marketing automation providers such as Act-On, Eloqua (acquired by Oracle in 2012), ExactTarget (acquired by
salesforce.com in 2013) and HubSpot;
- •
- traditional database marketing software vendors such as Aprimo (a division of Teradata), SAS Institute and Unica (a division of IBM);
- •
- email marketing software vendors, such as Responsys (acquired by Oracle in 2014) and Silverpop (acquired by IBM in 2014); and
- •
- large-scale enterprise suites such as Oracle and SAP.
Our current and potential competitors may have significantly more financial, technical, marketing and other resources than we have, may be able to devote greater resources to the development, promotion, sale and support of their products and services, may have more extensive customer bases and broader customer relationships than we have, and may have longer operating histories and greater name recognition than we have.
If one or more of our competitors were to merge or partner with another of our competitors, the change in the competitive landscape could adversely affect our ability to compete effectively. For example, Oracle acquired our competitor Eloqua in 2012, ExactTarget acquired our competitor Pardot in 2012 and salesforce.com subsequently acquired ExactTarget in 2013. Other companies such as Adobe and IBM have also acquired companies in the marketing automation and/or social marketing and related spaces. These acquisitions have resulted in fewer but larger companies with whom we compete for customers.
We also expect that new competitors, such as enterprise software vendors that have traditionally focused on enterprise resource planning or back office applications, will continue to enter the marketing software market with competing products, which could have an adverse effect on our business, operating results and financial condition. In addition, sales force automation and customer relationship management system vendors, such as Microsoft, NetSuite and SAP could acquire or develop solutions that compete with our offerings.
We believe that we compete effectively in terms of the most predominant competitive differentiators, which include ease of use, product features and fit for purpose, domain expertise and brand in relationship marketing, price of products and services, integration with third-party applications and data sources, pace of innovation and product roadmap, breadth and expertise of sales organization, strength of professional services organization and platform scalability, reliability and availability.
10
Seasonality
See Part II, Item 7. "Management's Discussion and Analysis of Financial Condition and Results of Operations—Seasonality, Cyclicality and Quarterly Trends" for information regarding seasonality of our business.
Intellectual Property
We rely on a combination of patents, copyrights, trademarks, trade secrets, confidentiality procedures and contractual restrictions to establish and protect our proprietary rights in our products and services. As of December 31, 2015, we had three issued patents and nine pending U.S. patent applications. We intend to pursue additional patent protection to the extent we believe it would be beneficial and cost effective.
We registered MARKETO, MARKETING NATION, MARKETING FIRST, LAUNCHPOINT, the Marketo logo and certain other marks as trademarks in the United States and several other jurisdictions. We also have filed trademark applications for other marks in the United States and certain other jurisdictions, and will pursue additional trademark registrations to the extent we believe it would be beneficial and cost effective.
We are the registered holder of a variety of domestic and international domain names that include "marketo.com" and similar variations.
All of our employees and independent contractors are required to sign agreements acknowledging that all inventions, trade secrets, works of authorship, developments and other processes generated by them on our behalf are our property and they agree to assign to us any ownership that they may claim in those works. In addition, we generally enter into confidentiality agreements with our employees, consultants, vendors and customers, and generally limit access to and distribution of our proprietary information.
We expect that marketing solutions in our industry may be increasingly the subject of third-party claims of intellectual property infringement as the number of competitors grows and the functionality of products in different industry segments overlaps. Moreover, many of our competitors and other industry participants have been issued patents and/or have filed patent applications, and have asserted claims and related litigation regarding patent and other intellectual property rights. From time to time, third parties, including certain of these leading companies, have asserted patent, copyright, trademark, trade secret and other intellectual property rights within the industry. Any of these third parties might make a claim of infringement against us at any time.
Employees
As of December 31, 2015, we had 949 employees. None of our U.S. employees are covered by collective bargaining agreements. Outside of the United States, certain of our subsidiaries enter into employment contracts and agreements containing standard collective bargaining contractual terms in those countries in which such relationships are required. We believe our employee relations are good, and we have not experienced any work stoppages.
Available Information
Our website is located at http://www.marketo.com, and our investor relations website is located at http://www.investors.marketo.com. Our Annual Reports on Form 10-K, Quarterly Reports on Form 10-Q, Current Reports on Form 8-K and amendments to reports filed or furnished pursuant to Sections 13(a) and 15(d) of the Securities Exchange Act of 1934, as amended (Exchange Act), are available free of charge on our investor relations website as soon as reasonably practicable after we electronically file such material with, or furnish it to, the Securities and Exchange Commission (SEC).
11
We also provide a link to the section of the SEC's website at www.sec.gov that has all of our public filings, including Annual Reports on Form 10-K, Quarterly Reports on Form 10-Q, Current Reports on Form 8-K, all amendments to those reports, our Proxy Statements, and other ownership related filings. Further, a copy of this Annual Report on Form 10-K is located at the SEC's Public Reference Room at 100 F Street, NE, Washington, D.C. 20549. Information on the operation of the Public Reference Room can be obtained by calling the SEC at 1-800-SEC-0330.
Webcasts of our earnings calls and certain events we participate in or host with members of the investment community are on our investor relations website. Additionally, we announce investor information, including news and commentary about our business and financial performance, SEC filings, notices of investor events, and our press and earnings releases, on our investor relations website. Investors and others can receive notifications of new information posted on our investor relations website in real time by signing up for email alerts and RSS feeds. Further corporate governance information, including our corporate governance guidelines and board committee charters, is also available on our investor relations website under the heading "Corporate Governance." The information on our website is not incorporated herein by reference and is not a part of this Annual Report on Form 10-K.
A description of the risks and uncertainties associated with our business is set forth below. You should carefully consider such risks and uncertainties, together with the other information contained in this report, and in our other public filings. If any of such risks and uncertainties actually occurs, our business, financial condition or operating results could differ materially from the plans, projections and other forward-looking statements included in the section titled "Management's Discussion and Analysis of Financial Condition and Results of Operations" and elsewhere in this report and in our other public filings. In addition, if any of the following risks and uncertainties, or if any other risks and uncertainties, actually occurs, our business, financial condition or operating results could be harmed substantially, which could cause the market price of our stock to decline, perhaps significantly.
We have a history of losses and may not achieve consistent profitability in the future.
We generated net losses attributable to Marketo of $71.5 million, $54.3 million, and $47.4 million in 2015, 2014, and 2013, respectively. As of December 31, 2015, we had an accumulated deficit of $251.3 million. We will need to generate and sustain increased revenue levels in future periods in order to become consistently profitable, and, even if we do, we may not be able to maintain or increase our level of profitability. We intend to continue to expend significant funds to expand our marketing and sales operations, develop and enhance our solutions, meet the increased compliance requirements associated with our operation as a public company, expand our data center infrastructure and services capabilities and expand into new markets. Historically, we also have experienced negative gross margins on our professional services, which are expected to continue to be negative. Our efforts to grow our business may be more costly than we expect, and we may not be able to increase our revenue enough to offset our higher operating expenses. We may incur significant losses in the future for a number of reasons, including the other risks described in this report, and unforeseen expenses, difficulties, complications and delays and other unknown events. If we are unable to achieve and sustain profitability, the market price of our common stock may significantly decrease.
If we are unable to attract new customers or sell additional services and functionality to our existing customers, our revenue growth will be adversely affected.
To increase our revenue, we must add new customers, encourage existing customers to renew their subscriptions on terms favorable to us, increase their usage of our solutions, and sell additional functionality and services to existing customers. As our industry matures, as interactive channels
12
develop further, or as competitors introduce lower cost and/or differentiated products or services that are perceived to compete with ours, our ability to sell and renew based on pricing, technology and functionality could be impaired. In addition, attracting, retaining and growing our relationship with enterprise customers may require us to effectively employ different strategies than we have historically used with SMB customers, and we may face challenges in doing so. As a result, we may be unable to renew our agreements with existing customers or attract new customers or new business from existing customers on terms that would be favorable or comparable to prior periods, which could have an adverse effect on our revenue and growth.
We face significant competition from both established and new companies offering marketing solutions and other related applications, as well as internally developed solutions, which may harm our ability to add new customers, retain existing customers and grow our business.
The market for cloud-based marketing solutions is evolving, highly competitive and fragmented. We expect competition to continue to increase in the future. With the introduction of new technologies and the potential entry of new competitors into the market, we expect competition to persist and intensify in the future, which could harm our ability to increase sales, maintain or increase renewals and maintain our prices.
We face intense competition from other software companies that develop marketing software and from marketing services companies that provide interactive marketing services. Competition could adversely affect our ability to sell our marketing solutions on terms favorable to us. Our current and potential competitors may develop and market new technologies that render our existing or future products less competitive, unmarketable or obsolete. In addition, if these competitors develop products with similar or superior functionality to our solutions, we may need to decrease the prices for our solutions in order to remain competitive. If we are unable to maintain our current pricing due to competitive pressures, our margins will be reduced and our operating results will be negatively affected.
Our competitors offer various solutions that compete with us. Some of these competitors include:
- •
- cloud-based marketing automation providers such as Act-On, Eloqua (acquired by Oracle in 2012), ExactTarget (acquired by
salesforce.com in 2013) and HubSpot;
- •
- traditional database marketing software vendors such as Aprimo (a division of Teradata), SAS Institute and Unica (a division of IBM);
- •
- email marketing software vendors, such as Responsys (acquired by Oracle in 2014) and Silverpop (acquired by IBM in 2014); and
- •
- large-scale enterprise suites such as Oracle and SAP.
We also expect that new competitors, such as enterprise software vendors that have traditionally focused on enterprise resource planning or back office applications, will continue to enter the marketing software market with competing products, which could have an adverse effect on our business, operating results and financial condition. For example, due to the growing awareness of the importance of technology solutions to modern engagement marketing, we expect to face additional competition from new entrants to our markets. In addition to salesforce.com's acquisition of ExactTarget, other sales force automation and CRM system vendors, such as Microsoft, NetSuite and SAP, could acquire or develop solutions that compete with our offerings. Some of these companies have acquired social media marketing and other marketing software providers to integrate with their broader offerings.
Our current and potential competitors may have significantly more financial, technical, marketing and other resources than we have, may be able to devote greater resources to the development, promotion, sale and support of their products and services, may have more extensive customer bases
13
and broader customer relationships than we have, and may have longer operating histories and greater name recognition than we have. As a result, these competitors may be better able to respond quickly to new technologies and to undertake more extensive marketing campaigns. To the extent any of our competitors have existing relationships with potential customers for either marketing software or other solutions, those customers may be unwilling to purchase our solutions because of those existing relationships with that competitor. If we are unable to compete with such companies, the demand for our marketing solutions could substantially decline.
The competition we face in the sales of our solutions can put pressure on us to reduce our prices. Certain of our competitors, including large software vendors, sometimes offer marketing software at a discount or bundled together with their existing suite of solutions at little or no additional cost to customers. Our competitors' financial resources may allow them to execute these pricing strategies even though they may have a negative impact on their financial results. To the extent that these competitors continue to implement these pricing strategies, we may need to lower prices or offer other favorable terms in order to compete successfully. This could reduce our margins and could adversely affect operating results.
In addition, if one or more of our competitors were to merge or partner with another of our competitors, the change in the competitive landscape could adversely affect our ability to compete effectively. For example, Oracle acquired our competitor Eloqua in 2012 and ExactTarget acquired our competitor Pardot in 2012 and salesforce.com subsequently acquired ExactTarget in July 2013. Other companies such as Adobe and IBM have also acquired companies in the marketing automation and/or social marketing and related spaces. These acquisitions have resulted in fewer but larger companies with whom we compete for customers. Our competitors may also establish or strengthen cooperative relationships with our current or future strategic distribution and technology partners or other parties with whom we have relationships, thereby limiting our ability to promote and implement our solutions. We may not be able to compete successfully against current or future competitors, and competitive pressures may harm our business, operating results and financial condition.
Economic uncertainties or downturns in the general economy or the industries in which our customers operate could disproportionately affect the demand for our marketing solutions and negatively impact our operating results.
General worldwide economic conditions have experienced a significant downturn and fluctuations in recent years, and market volatility and uncertainty remain widespread. As a result, we and our customers find it extremely difficult to accurately forecast and plan future business activities. In addition, these conditions could cause our customers or prospective customers to reduce their marketing and sales budgets, which could decrease corporate spending on our marketing solutions, resulting in delayed and lengthened sales cycles, a decrease in new customer acquisition and/or loss of customers. Furthermore, during challenging economic times, our customers may face issues with their cash flows and in gaining timely access to sufficient credit or obtaining credit on reasonable terms, which could impair their ability to make timely payments to us, impact customer renewal rates and adversely affect our revenue. If such conditions occur, we may be required to increase our reserves, allowances for doubtful accounts and write-offs of accounts receivable, and our operating results would be harmed. In addition, a downturn in the technology sector may disproportionately affect us because a significant portion of our customers are technology companies. We cannot predict the timing, strength or duration of any economic slowdown or recovery, whether global, regional or within specific markets. If the conditions of the general economy or markets in which we operate worsen, our business could be harmed. In addition, even if the overall economy does not worsen or improves, the market for marketing software may not experience growth or we may not experience growth.
14
If subscription renewal rates decrease, or we do not accurately predict subscription renewal rates, our future revenue and operating results may be harmed.
Our customers have no obligation to renew their subscriptions for our solutions after the expiration of their subscription period, which is typically one year, but generally ranges from one to three years. In addition, our customers may renew for lower subscription amounts or for shorter contract lengths. We may not accurately predict renewal rates for our customers. Our renewal rates may decline or fluctuate as a result of a number of factors, including customer usage, pricing changes, number of applications used by our customers, customer satisfaction with our service, increased competition, the acquisition of our customers by other companies and deteriorating general economic conditions. If our customers do not renew their subscriptions for our solutions or decrease the amount they spend with us, our revenue will decline and our business will suffer.
If our current relationship with salesforce.com changes or we are unable to maintain, develop and grow our relationships with other platform and service providers, our business will suffer.
As of December 31, 2015, a significant percentage of our customers continued to integrate our solutions with certain capabilities of salesforce.com using publicly available application programming interfaces (APIs). In general, we rely on the fact that salesforce.com continues to allow us access to its APIs to enable these customer integrations. Certain of our services that integrate with salesforce.com are subject to the standard terms and conditions for application developers of salesforce.com, which govern the distribution, operation and fees of applications on the salesforce.com platform, and which are subject to change by salesforce.com from time to time. In addition, certain of our services that integrate with salesforce.com are subject to a negotiated contract that automatically renews each year unless terminated by either party. If, in the future, we are unable to integrate our services with salesforce.com or the pricing or other business or technical terms of the integrations changes, our business and results of operations could suffer.
While we expect the majority of our revenue to continue to come from customers who also use the salesforce.com platform, we also integrate our solutions with various other platforms and third-party providers of applications, including CRM, event management, e-commerce, call center, and social media sites that our customers use and from which they obtain data. Any deterioration in our relationship with these platforms or service providers could harm our business and adversely affect our operating results.
Our business may be harmed if any platform or service provider:
- •
- discontinues or limits our access to its APIs;
- •
- terminates or does not allow us to renew or replace our contractual relationship;
- •
- modifies its terms of service or other policies, including fees charged to, or other restrictions on, us, other application
developers, or changes how customer information is accessed by us or our customers;
- •
- establishes more favorable relationships with one or more of our competitors, or acquires one or more of our competitors and offers
competing services to us; or
- •
- otherwise develops its own competitive offerings.
In addition, we have benefited from these providers' brand recognition, reputations and customer bases. Any losses or shifts in the market position of these providers in general, in relation to one another or to new competitors or new technologies could lead to losses in our relationships or customers, or our need to identify or transition to alternative channels for marketing our solutions. These factors could consume substantial resources and may not be effective. Any such changes in the
15
future could negatively impact our ability to reach our prospective customers, which would harm our business.
Our historical growth rates may not be indicative of our future growth and, if we continue to grow, we may not be able to manage our growth effectively.
From 2013 to 2015, our annual revenue grew from $95.9 million to $209.9 million. We expect that even if our revenue continues to increase in the future, our revenue growth rate will decline. We believe growth of our revenue depends on a number of factors, including our ability to:
- •
- price our marketing solutions and services effectively so that we are able to attract and retain customers without compromising our
profitability or experiencing significant customer churn in response to price and other competitive pressures;
- •
- attract new customers, increase our existing customers' use of our services and provide our customers with excellent professional
services and customer support;
- •
- introduce our marketing solutions to new markets outside of the United States; and
- •
- increase awareness of our brand on a global basis.
We may not successfully accomplish any of these objectives. We plan to continue our investment in future growth. We expect to continue to expend substantial financial and other resources on:
- •
- sales and marketing, including a significant expansion of our sales organization;
- •
- professional services to support implementing our solutions for customers and ongoing customer support;
- •
- our technology infrastructure, including systems architecture, management tools, scalability, availability, performance and security,
as well as disaster recovery measures;
- •
- product development, including investments in our product development team and the development of new products and new features for
existing products;
- •
- international expansion; and
- •
- general administration, including legal and accounting expenses related to being a public company.
In addition, our historical growth has placed and may continue to place significant demands on our management and our operational and financial resources. We have also experienced significant growth in database size, the number of users and transactions and the amount of data that our hosting infrastructure supports. As we continue to grow, we will likely open new offices in the United States and internationally, and hire additional personnel for those offices. Finally, our organizational structure is becoming more complex as we integrate acquired companies as well as add additional employees. We will need to continue to improve our operational, financial and management controls as well as our reporting systems and procedures as our operations become increasingly complex. We will continue to require significant capital expenditures and the allocation of valuable management resources to grow and change in these areas without undermining our corporate culture of rapid innovation, teamwork and attention to customer success that has been central to our growth so far.
If our or our customers' security measures are compromised or unauthorized access to customer data is otherwise obtained, our marketing platform may be perceived as not being secure, customers may curtail or cease their use of our solutions, our reputation may be harmed, and we may incur significant liabilities.
Our operations involve the storage and transmission of customer data, including personally identifiable information, and security incidents could result in unauthorized access to, loss of or
16
unauthorized disclosure of this information, litigation, indemnity obligations and other possible liabilities, as well as negative publicity, which could damage our reputation, impair our sales and harm our business. Cyber attacks and other malicious Internet-based activity continue to increase in frequency, magnitude, and sophistication and cloud-based platform providers of marketing services have been targeted. If our security measures are compromised as a result of third-party action, employee or customer error, malfeasance, stolen or fraudulently obtained log-in credentials, successful phishing or social engineering attempts, or otherwise, our reputation could be damaged, our business may be harmed and we could incur significant liability. In addition, if the security measures of our customers are compromised, even without any actual compromise of our own systems, we may face negative publicity or reputational harm if our customers or anyone else incorrectly attributes the blame for such security breaches on us or our systems. We may be unable to anticipate or prevent techniques used to obtain unauthorized access or to sabotage systems because they change frequently and generally are not detected until after an incident has occurred. As we increase our customer base and our brand becomes more widely known and recognized, we may become more of a target for third parties seeking to compromise our security systems or gain unauthorized access to our customers' data.
Many governments have enacted laws requiring companies to notify individuals of data security incidents involving certain types of personal data. In addition, some of our customers contractually require notification of any data security compromise or suspected compromise. Security compromises experienced by our competitors, by our customers or by us may lead to public disclosures, which may lead to widespread negative publicity. Any security compromise in our industry, whether actual or perceived, could harm our reputation, erode customer confidence in the effectiveness of our security measures, negatively impact our ability to attract new customers, cause existing customers to elect not to renew their subscriptions or subject us to third-party lawsuits, regulatory fines or other action or liability, which could materially and adversely affect our business and operating results.
There can be no assurance that any limitations of liability provisions in our contracts would be enforceable or adequate with respect to a security breach or would otherwise protect us from any such liabilities or damages with respect to any particular claim. We also cannot be sure that our existing general liability insurance coverage and coverage for errors or omissions will continue to be available on acceptable terms or will be available in sufficient amounts to cover one or more large claims, or that the insurer will not deny coverage as to any future claim. The successful assertion of one or more large claims against us that are not covered by or that exceed available insurance coverage, or the occurrence of changes in our insurance policies, including premium increases or the imposition of large deductible or co-insurance requirements, could have a material adverse effect on our business, financial condition and operating results.
Interruptions to or degraded performance of our service could result in customer dissatisfaction, damage to our reputation, loss of customers, limited growth and reduction in revenue.
We currently host our solutions at facilities located in the United States, the European Union and Australia. The continuous availability of our solutions depends on the operations of those facilities, on a variety of network service providers, on third-party vendors and on our own data center operations staff. In addition, we depend on our third-party facility providers' abilities to protect these facilities against damage or interruption from natural disasters, power or telecommunications failures, criminal acts and similar events. If there are any lapses of service or damage to a facility or our computer equipment or systems, we could experience lengthy interruptions in our service as well as delays and additional expenses in arranging new facilities, services, computer equipment or systems. Even with current and planned disaster recovery arrangements, which, to date, have not been tested in an actual crisis, our business could be harmed.
We designed our system infrastructure and procure and own or lease the computer hardware used for our services. Design and mechanical errors, spikes in usage volume and failure to follow operations
17
protocols and procedures could cause our systems to fail, resulting in interruptions in our solutions. Any interruptions or delays in our service, whether as a result of third-party error, our own error, natural disasters or security breaches, whether accidental or willful, could harm our relationships with customers and cause our revenue to decrease and/or our expenses to increase. Also, in the event of damage or interruption, our insurance policies may not adequately compensate us for any losses that we may incur. These factors, in turn, could further reduce our revenue, subject us to liability and cause us to issue credits or cause customers not to renew their subscriptions, any of which could have a material adverse effect on our business.
The failure to attract and retain qualified personnel could prevent us from executing our business strategy.
To execute our business strategy, we must attract and retain highly qualified personnel, and we may not be successful in attracting and retaining the professionals we need. In particular, we compete with many other companies for software developers with high levels of experience in designing, developing and managing cloud-based software, as well as for skilled marketing and operations professionals. Sales professionals are also very important to our success and are particularly difficult to hire, train and retain in the current environment. We have from time to time experienced, and expect to continue to experience in the future, difficulty in hiring and retaining highly skilled employees with appropriate qualifications. In particular, we have experienced a highly competitive hiring environment in the San Francisco Bay Area, where we are headquartered. Many of the companies with which we compete for experienced personnel have greater resources than we do. In addition, in making employment decisions, particularly in the software industry, job candidates often consider the value of the stock awards or other equity incentives they are to receive in connection with their employment. If the price of our stock declines, or experiences significant volatility, our ability to attract or retain key employees will be adversely affected. If we continue to experience difficulty in hiring and retaining qualified personnel, if hiring and retaining qualified personnel becomes more difficult, or if we experience higher than expected employee turnover, especially with respect to experienced and trained enterprise sales professionals and software developers in each case, we may be unable to meet our growth targets and our business could be significantly harmed.
A significant percentage of our sales force is new to our company and therefore less productive than our more tenured sales personnel. We expect that new employees will continue to make up a significant percentage of our sales force in the near future. New hires require significant training and may take significant time before they achieve full productivity. We estimate based on past experience that sales team members typically do not fully ramp and are not fully productive during the first several months to quarters of employment with us, depending on the role. Our recent hires and planned hires may not become productive as quickly as we expect. Furthermore, hiring sales personnel in new international territories requires additional set up and upfront costs that we may not recover if the sales personnel fail to achieve full productivity. If we are unable to hire and train sufficient numbers of effective sales personnel, or the sales personnel are not successful in obtaining new customers or increasing sales to our existing customer base, our financial results may suffer.
We may not be able to scale our business quickly enough to meet our customers' growing needs, and if we are not able to grow efficiently, our operating results could be harmed.
As our customer base grows and as customers use our solutions for more advanced engagement marketing programs, we will need to devote additional resources to improving our application architecture, integrating with third-party systems, and maintaining infrastructure performance. In addition, we will need to appropriately scale our internal business systems and our services organization, including customer support and professional services, to serve our growing customer base, particularly as our customer demographics expand over time. Any failure of or delay in these efforts could impair system performance and reduce customer satisfaction. These issues could reduce the
18
attractiveness of our marketing solutions to customers, resulting in decreased sales to new customers, lower renewal rates by existing customers, the issuance of service credits, or requested refunds, which could adversely affect our revenue growth and harm our reputation. Even if we are able to upgrade our systems and expand our staff, any such expansion will be expensive and complex, requiring management time and attention. We could also face inefficiencies or operational failures as a result of our efforts to scale our infrastructure. Moreover, there are inherent risks associated with upgrading, improving and expanding our information technology systems. We cannot be sure that the expansion and improvements to our infrastructure and systems will be fully or effectively implemented on a timely basis, if at all. These efforts may reduce revenue and our margins and adversely affect our financial results.
We rely on third-party technology that may be difficult to replace or potentially cause errors or failures of our services.
We rely on technology licensed from third parties in order to offer certain of our services. For example, our Advanced Analytics application embeds big data analytics software that we license from a third party. Third-party technology may not continue to be available or on commercially reasonable terms, or at all, or use of such technology may be limited by privacy laws. Any loss of the right to use third-party technology could limit the functionality of our services, increase our expenses and otherwise result in delays in the provisioning of our services until equivalent technology is either developed by us, or, is identified, obtained and integrated by us, if available. In addition, we have limited control over the functionality of third-party technology. Any changes, errors or defects in such technology could result in errors or a failure of our service, which could expose us to liability or result in customer dissatisfaction, loss of customers, damage to our reputation, or a reduction in revenue.
If we are unable to further penetrate the B2C market and additional vertical industries, our revenue may not grow and our operating results may be harmed.
Currently, a significant majority of our revenue is derived from companies in the B2B market and a significant portion is derived from customers in the technology industry. An important part of our strategy, however, is to further penetrate the B2C market and vertical industries outside of the technology industry, such as healthcare and financial services. We have less experience in this market and these industries, and expanding into them may require us to develop additional features for our products, expand our expertise in certain areas, and add sales and support personnel possessing familiarity with this market and the relevant vertical industries. In addition, B2C customers may have greater usage requirements during their peak selling seasons which could put pressure on our systems and infrastructure and require us to expand these systems and infrastructure to meet increased demand. As a result of these and other factors, our efforts to expand further into the B2C market and into additional vertical industries may be expensive, may not succeed and may harm our revenue growth and operating results.
We may experience quarterly fluctuations in our operating results due to a number of factors, which makes our future results difficult to predict and could cause our operating results to fall below expectations or our guidance.
Our quarterly operating results have fluctuated in the past and are expected to fluctuate in the future due to a variety of factors, many of which are outside of our control. As a result, our past results may not be indicative of our future performance, and comparing our operating results on a period-to-period basis may not be meaningful. In addition to the other risks described in this report, factors that may affect our quarterly operating results include the following:
- •
- changes in spending on marketing solutions by our current or prospective customers;
19
- •
- pricing of our marketing solutions so that we are able to attract and retain customers;
- •
- acquisition of new customers and increases of our existing customers' use of our services;
- •
- customer renewal rates and the amounts for which agreements are renewed;
- •
- customer delays in purchasing decisions in anticipation of new products or product enhancements by us or our competitors;
- •
- budgeting cycles of our customers;
- •
- changes in the competitive dynamics of our market, including consolidation among competitors or customers;
- •
- the amount and timing of payment for operating expenses, particularly research and development and sales and marketing expenses
(including marketing events and commissions and bonuses associated with performance), and employee benefit expenses;
- •
- the amount and timing of non-cash expenses, including stock-based compensation, goodwill impairments and other non-cash charges;
- •
- the amount and timing of costs associated with recruiting, training and integrating new employees;
- •
- the amount and timing of cash collections from our customers and the mix of quarterly and annual billings;
- •
- introduction and adoption of our marketing solutions in markets outside of the United States;
- •
- unforeseen costs and expenses related to the expansion of our business, operations and infrastructure;
- •
- awareness of our thought leadership and brand on a global basis;
- •
- changes in the levels of our capital expenditures;
- •
- foreign currency exchange rate fluctuations; and
- •
- general economic and political conditions in our domestic and international markets.
We may not be able to accurately forecast the amount and mix of future subscriptions, revenue and expenses, and, as a result, our operating results may fall below our estimates or the expectations of public market analysts and investors. If our revenue or operating results fall below the expectations of investors or securities analysts, or below any guidance we may provide, the price of our common stock could decline.
If we fail to adapt and respond effectively to rapidly changing technology, evolving industry standards or changing customer needs or requirements, our marketing solutions may become less competitive.
Our future success depends on our ability to adapt and to innovate our marketing solutions. To attract new customers and increase revenue from existing customers, we need to continually enhance and improve our offerings to meet customer needs at prices that our customers are willing to pay. Such efforts will require adding new functionality and responding to technological advancements, which will increase our research and development costs. If we are unable to develop new solutions that address our customers' needs, or to enhance and improve our solutions in a timely manner, we may not be able to achieve or maintain adequate market acceptance of our solutions. Our ability to grow is also subject to the risk of future disruptive technologies. Access and use of our marketing solutions is provided via the cloud, which, itself, was disruptive to the previous enterprise software model. If new technologies emerge that are able to deliver marketing solutions and related applications at lower prices, more
20
efficiently, more conveniently or more securely, such technologies could adversely affect our ability to compete.
Because we recognize revenue from subscriptions over the term of the relevant contract, downturns or upturns in sales are not immediately reflected in full in our operating results.
As a subscription-based business, we recognize revenue over the term of each of our contracts, which is typically one year, but ranges from one to three years. As a result, much of the revenue we report each quarter results from contracts entered into during previous quarters. Consequently, a shortfall in demand for our solutions and professional services or a decline in new or renewed contracts in any one quarter may not significantly reduce our revenue for that quarter but could negatively affect our revenue in the future. Accordingly, the effect of significant downturns in new sales or renewals of our marketing solutions will not be reflected in full in our operating results until future periods. Our revenue recognition model also makes it difficult for us to rapidly increase our revenue through additional sales in any period, as revenue from new customers must be recognized over the applicable term of the contracts.
Because our long-term growth strategy involves further expansion of our sales to customers outside the United States, our business will be susceptible to risks associated with international operations.
A component of our growth strategy involves the further expansion of our operations and customer base internationally. In 2015, 2014 and 2013 revenue generated outside of the United States was 15.3%, 16.1% and 14.5%, respectively, of our total revenue. We currently have international offices outside of North America in Europe, Australia, and Japan which focus primarily on selling and implementing our solutions in those regions and an office in Israel which focuses primarily on research and development. We have data centers in the United States, the European Union, and Australia and, in the future, we may expand to other international locations. Our current international operations and future initiatives will involve a variety of risks, including:
- •
- changes in a specific country's or region's political or economic conditions;
- •
- unexpected changes in regulatory requirements, taxes or trade laws;
- •
- more stringent or changing regulations relating to data protection, the international transfer of personal information and the
unauthorized use of, or access to, commercial and personal information;
- •
- differing labor regulations, especially in the European Union, where labor laws are generally more advantageous to employees as
compared to the United States, including deemed hourly wage and overtime regulations in these locations;
- •
- challenges inherent in efficiently managing an increased number of employees over large geographic distances, including the need to
implement appropriate systems, policies, benefits and compliance programs;
- •
- difficulties in managing a business in new markets with diverse cultures, languages, customs, legal systems, alternative dispute
systems and regulatory systems;
- •
- increased travel, real estate, infrastructure and legal compliance costs associated with international operations;
- •
- currency exchange rate fluctuations and the resulting effect on our revenue and expenses, and the cost and risk of entering into
hedging transactions if we choose to do so in the future;
- •
- limitations on our ability to reinvest earnings from operations in one country to fund the capital needs of our operations in other countries;
21
- •
- laws and business practices favoring local competitors or general preferences for local vendors;
- •
- limited or insufficient intellectual property protection;
- •
- political instability, international conflict or terrorist activities;
- •
- exposure to liabilities under anti-corruption and anti-money laundering laws, including the U.S. Foreign Corrupt Practices Act and
similar laws and regulations in other jurisdictions; and
- •
- adverse tax burdens and foreign exchange controls that could make it difficult to repatriate earnings and cash.
We opened our first international office in 2011, and our relatively limited experience in operating our business internationally increases the risk that our international expansion efforts may not be successful. If we invest substantial time and resources to expand our international operations and are unable to do so successfully and in a timely manner, our business and operating results will suffer.
Failure to effectively develop and expand our capabilities could harm our ability to increase our customer base and achieve broader market acceptance of our solutions.
Our ability to increase our customer base and achieve broader market acceptance of our marketing solutions will depend to a significant extent on our ability to expand our operations. We plan to continue expanding our sales force and third-party channel partners, both domestically and internationally. We also plan to dedicate significant resources to sales and marketing programs, including Internet and other online advertising. The effectiveness of our online advertising has varied over time and may vary in the future due to competition for key search terms, changes in search engine use and changes in the search algorithms used by major search engines. All of these efforts will require us to invest significant financial and other resources. In addition, the cost to acquire customers is high due to these marketing and sales efforts. Our business will be seriously harmed if our efforts do not generate a correspondingly significant increase in revenue. We may not achieve anticipated revenue growth from expanding our sales force if we are unable to hire, develop and retain talented sales personnel, if our new sales personnel are unable to achieve desired productivity levels in a reasonable period of time or if our sales and marketing programs are not effective.
If we fail to maintain and enhance our brand, our ability to expand our customer base will be impaired and our financial condition may suffer.
We believe that our development of the Marketo brand is critical to achieving widespread awareness of our existing and future engagement marketing solutions, and, as a result, is important to attracting new customers and maintaining existing customers. We also believe that the importance of brand recognition will increase as competition in our market increases. Successful promotion of our brand will depend largely on the effectiveness of our marketing efforts and on our ability to provide reliable and useful marketing solutions at competitive prices. In the past, our efforts to build our brand have involved significant expenses. Brand promotion activities may not yield increased revenue, and even if they do, any increased revenue may not offset the expenses we incurred in building our brand. Our brand could be negatively affected if we fail to achieve these objectives or if our public image or reputation were to be tarnished by negative publicity. For example, to sell to and service our customers we utilize a combination of internal personnel and third-party service providers, as well as indirect sales partners that pursue additional channel, agency and OEM distribution partnerships. These third-party service providers and indirect sales partners, who are not in our control, may harm our reputation and damage our brand perception in the marketplace. If we fail to successfully promote and maintain our brand, our business could suffer.
22
Future acquisitions, strategic investments, partnerships or alliances could be difficult to identify and integrate, divert the attention of management, disrupt our business, dilute stockholder value and adversely affect our operating results and financial condition.
We have in the past acquired, and we may in the future acquire businesses and technologies. For example, we acquired a small private company in December 2014, Insightera in December 2013 and Crowd Factory in April 2012. Acquisitions we make may divert the attention of management and cause us to incur various expenses in identifying, investigating and pursuing suitable acquisitions, whether or not the acquisitions are completed. We have limited experience in acquiring other businesses, and if we acquire additional businesses, we may not be able to successfully integrate the acquired personnel, operations and technologies, or effectively manage the combined business following the acquisition. We may not be able to find and identify desirable acquisition targets or be successful in entering into an agreement with any particular target. Acquisitions could also result in dilutive issuances of equity securities or the incurrence of debt, which could adversely affect our operating results. In addition, if an acquired business fails to meet our expectations or if we are unable to successfully integrate it, our operating results, business and financial condition may suffer.
Our quarterly results reflect seasonality in the sale of our marketing solution, which can make it difficult to achieve sequential revenue growth or could result in sequential revenue declines.
We have historically experienced seasonal variations in our signing of customer contracts and renewals. We sign a significantly higher percentage of agreements with new customers as well as renewal agreements with existing customers in the fourth quarter of each year as compared to any of the prior quarters. The first quarter and third quarter are typically the slowest in this regard. We expect this seasonality to continue in the future, which may cause fluctuations in certain of our operating results and financial metrics, and thus limit our ability to predict future results. This seasonality is reflected to a much lesser extent, and sometimes is not immediately apparent, in our revenue, because we recognize subscription revenue over the term of the contract, which is typically one year, but ranges from one to three years. As a result, a slowdown in our ability to enter into customer agreements may not be apparent in our revenue for the quarter, as the revenue recognized in any quarter is primarily from customer agreements entered into in prior quarters. Historical patterns should not be considered indicative of our future sales activity or performance.
If we fail to forecast our revenue accurately, or if we fail to match our expenditures with corresponding revenue, our operating results could be adversely affected.
Because our recent growth has resulted in the rapid expansion of our business, we do not have a long history upon which to base forecasts of future revenue. In addition, for our enterprise customers, the lengthy sales cycle for the evaluation and implementation of our solutions, which typically extends for several months, may also cause us to experience a delay between increasing operating expenses for such sales efforts, and, upon successful sales, the generation of corresponding revenue. Accordingly, we may be unable to prepare accurate internal financial forecasts or replace anticipated revenue that we do not receive as a result of delays arising from these factors. As a result, our operating results in future reporting periods may be significantly below the expectations of the public market, equity research analysts or investors, which could harm the price of our common stock.
We rely on our management team and other key employees, and the loss of one or more key employees could harm our business.
Our success and future growth depend upon the continued services of our management team, including Phillip M. Fernandez, our Chairman and Chief Executive Officer, and other key employees in the areas of research and development, marketing, sales, services and general and administrative functions. From time to time, there may be changes in our management team resulting from the hiring
23
or departure of executives, which could disrupt our business. We also are dependent on the continued service of our existing software engineers because of the complexity of our solutions. In the United States, we may generally terminate any employee's employment at any time, with or without cause, and globally, any employee may resign at any time, with or without cause. In addition, our executive officers and certain other management-level employees benefit from management retention agreements and/or a change in control acceleration policy in which an involuntary termination by us without cause or a voluntary termination by the employee for good reason, as such terms are defined in the agreements and policy, in connection with or one year after a change of control transaction, will result in severance pay and/or acceleration of equity vesting for the individual, which would increase the cost to us of any such departure. We do not maintain key man life insurance on any of our employees. The loss of one or more of our key employees could harm our business.
If our marketing solution fails due to defects or similar problems, and if we do not correct any defect or other problems, we could lose customers, become subject to service performance or warranty claims or incur significant costs.
Our solutions and the systems infrastructure underlying our marketing platform are inherently complex and may contain material defects or errors. We have from time to time found defects in our solutions and may discover additional defects in the future. We may not be able to detect and correct defects or errors before customers begin to use our solutions. Consequently, we or our customers may discover defects or errors after our solutions have been implemented. These defects or errors could also cause inaccuracies in the data we collect and process for our customers, or even the loss, damage or inadvertent release of customer data. We implement bug fixes and upgrades as part of our regularly scheduled system maintenance, which may lead to system downtime. Even if we are able to implement the bug fixes and upgrades in a timely manner, any history of defects or inaccuracies in the data we collect for our customers, or the loss, damage or inadvertent release of customer data could cause our reputation to be harmed, and customers may elect not to purchase or renew their agreements with us and subject us to service performance credits, warranty claims or increased insurance costs. The costs associated with any material defects or errors in our solutions or other performance problems may be substantial and could materially adversely affect our operating results.
The standards and practices that entities use to regulate the use of email have in the past interfered with, and may in the future interfere with, the effectiveness of our solutions and our ability to conduct business.
Our customers rely in part on email to communicate with their existing or prospective customers. Various entities, such as commercial email, antivirus and network security providers, attempt to regulate the use of email for commercial solicitation. These entities often advocate standards of conduct or practice that significantly exceed current legal requirements and classify certain email solicitations that comply with current legal requirements as spam. Some of these entities maintain "blacklists" of companies and individuals, and the websites, Internet service providers and Internet protocol addresses associated with those entities or individuals that do not adhere to those standards of conduct or practices for commercial email solicitations that the blacklisting entity believes are appropriate. If Internet protocol addresses are listed by a blacklisting entity, emails sent from those addresses may be blocked if they are sent to any Internet domain or Internet address that subscribes to the blacklisting entity's service or purchases its blacklist. Customers may use a shared Internet protocol address when sending email through our platform, and if one such customer is blacklisted, then other customers sharing that address may experience email deliverability issues. Any of the foregoing restrictions or limitation on emails or internet addresses impacting our customers could lead to diminishing effectiveness of our marketing solutions, and, in turn, result in service problems and ultimately a reduction in renewals or loss of customers for us.
24
If we fail to offer high-quality education and customer support, our business and reputation may suffer.
High-quality education and customer support are important for the successful marketing and sale of our solutions and for the renewal of existing customers. Providing this education and support requires that our customer support personnel have specific marketing domain knowledge and expertise, making it more difficult for us to hire qualified personnel and to scale up our support operations due to the extensive training required. The importance of high-quality customer support will increase as we expand our business and pursue new customers. If we do not help our customers quickly resolve post-deployment issues and provide effective ongoing support, our ability to sell additional functionality and services to existing customers may suffer and our reputation with existing or potential customers may be harmed.
Future product development is dependent on adequate research and development resources. If we do not adequately fund our research and development efforts, we may not be able to compete effectively and our business and operating results may be harmed.
In order to remain competitive, we must continue to develop new product offerings, applications and enhancements to our existing cloud-based marketing solutions. Maintaining adequate research and development personnel and resources to meet the demands of the market is essential. If we are unable to develop solutions internally due to certain constraints, such as high employee turnover, lack of management ability or a lack of other research and development resources, we may miss market opportunities. Further, many of our competitors expend a considerably greater amount of funds on their research and development programs, and those that do not may be acquired by larger companies that would allocate greater resources to our competitors' research and development programs. Our failure to maintain adequate research and development resources or to compete effectively with the research and development programs of our competitors could materially adversely affect our business.
Shifts over time in the mix of sizes or types of organizations that purchase our solutions or changes in the components of our solutions purchased by our customers could negatively affect our operating results.
Our strategy is to sell our marketing solutions to organizations of broadly different sizes, from SMBs to large enterprises. Our gross margins can vary depending on numerous factors related to the implementation and use of our marketing solutions, including the sophistication and intensity of our customers' use of our solutions and the level of professional services and support required by a customer. For example, our enterprise customers typically require more professional services and because our professional services offerings typically have a higher cost of revenue than subscriptions to our solutions, any increase in sales of professional services would have an adverse effect on our overall gross margin and operating results. Providing professional services to enterprises allows us to utilize our staff more efficiently than is the case in providing professional services to other customers or in other contexts; consequently, while an increase in providing professional services to enterprises typically hurts our overall gross margin, it may improve our professional services and other gross margin. Sales to enterprise customers may also entail longer sales cycles and more significant selling efforts. Selling to SMB customers may involve smaller contract size, higher relative selling costs and greater credit risk and uncertainty. In addition, our smallest customers have historically renewed at a lower rate than our largest customers. If the mix of organizations that purchase our solutions changes, or the mix of solution components purchased by our customers changes, our gross margins could decrease and our operating results could be adversely affected.
If we fail to maintain our thought leadership position in modern engagement marketing, our business may suffer.
We believe that maintaining our thought leadership position in modern engagement marketing is an important element in attracting new customers. We devote significant resources to develop and
25
maintain our thought leadership position, with a focus on identifying and interpreting emerging trends in engagement marketing, shaping and guiding industry dialog, and creating and sharing the best marketing practices. Our activities related to developing and maintaining our thought leadership may not yield increased revenue, and even if they do, any increased revenue may not offset the expenses we incurred in such effort. We rely upon the continued services of our management and employees with domain expertise in modern engagement marketing to maintain our leadership position, and the loss of any key management or employees in this area could harm our competitive position and reputation. If we fail to successfully grow and maintain our thought leadership position, we may not attract new customers or retain our existing customers, and our business could suffer. In addition, we may incur expenses in our attempts to maintain our thought leadership position, which could affect our profitability and business.
If we fail to adequately protect our proprietary rights, our competitive position could be impaired and we may lose valuable assets, experience reduced revenue and incur costly litigation to protect our rights.
Our success is dependent, in part, upon protecting our proprietary technology. We rely on a combination of patents, copyrights, trademarks, service marks, trade secret laws and contractual restrictions to establish and protect our proprietary rights in our products and services. However, the steps we take to protect our intellectual property may be inadequate. We will not be able to protect our intellectual property if we are unable to perfect our rights, enforce our rights or if we do not detect unauthorized use of our intellectual property. Any of our patents, copyrights, trademarks or other intellectual property rights may be challenged by others or invalidated through administrative process or litigation. We have three issued patents and nine patent applications pending in the United States. However, our issued patents may not provide us with competitive advantages, or may be successfully challenged by third parties. In addition, we may be unable to obtain patent protection for the technology covered in our patent applications. Furthermore, legal standards relating to the validity, enforceability and scope of protection of intellectual property rights are uncertain. Despite our precautions, it may be possible for unauthorized third parties to copy our products and use information that we regard as proprietary to create products and services that compete with ours. Some contract provisions protecting against unauthorized use, copying, transfer and disclosure of our products may be unenforceable under the laws of certain jurisdictions and foreign countries. In addition, the laws of some countries do not protect proprietary rights to the same extent as the laws of the United States. To the extent we expand our international activities, our exposure to unauthorized copying and use of our products and proprietary information may increase.
We enter into confidentiality and invention assignment agreements with our employees and consultants and enter into confidentiality agreements with the parties with whom we have strategic relationships and business alliances. No assurance can be given that these agreements will be effective in controlling access to and distribution of our products and proprietary information. Further, these agreements may not prevent our competitors from independently developing technologies that are substantially equivalent or superior to our solutions.
In order to protect our intellectual property rights, we may be required to spend significant resources to monitor and protect these rights. Litigation may be necessary in the future to enforce our intellectual property rights and to protect our trade secrets. Litigation brought to protect and enforce our intellectual property rights could be costly, time consuming and distracting to management and could result in the impairment or loss of portions of our intellectual property. Furthermore, our efforts to enforce our intellectual property rights may be met with defenses, counterclaims and countersuits attacking the validity and enforceability of our intellectual property rights. Our inability to protect our proprietary technology against unauthorized copying, sales, or use, as well as any costly litigation or diversion of our management's attention and resources, could delay further sales or the implementation
26
of our solutions, impair the functionality of our solutions, delay introductions of new solutions, result in our substituting inferior or more costly technologies into our solutions, or injure our reputation.
Our business may suffer if it is alleged or determined that our technology infringes the intellectual property rights of others.
The software industry is characterized by the existence of a large number of patents, copyrights, trademarks, trade secrets and other intellectual and proprietary rights. Companies in the software industry, including in marketing software, are often required to defend against litigation claims based on allegations of infringement or other violations of intellectual property rights. Many of our competitors and other industry participants have been issued patents and/or have filed patent applications and may assert patent or other intellectual property rights within the industry. Moreover, in recent years, individuals and groups that are non-practicing entities have purchased patents and other intellectual property assets for the purpose of making claims of infringement in order to extract settlements. From time to time, we may receive threatening letters or notices or may be the subject of claims that our solutions and underlying technology infringe or violate the intellectual property rights of others. Responding to claims, regardless of their merit, can be time consuming, costly to defend in litigation, divert management's attention and resources, damage our reputation and brand, and cause us to incur significant expenses. Our technologies may not be able to withstand any third-party claims or rights against their use. Claims of intellectual property infringement might require us to redesign our applications, delay releases, enter into costly settlement or license agreements or pay costly damage awards, indemnify customers, or face a temporary or permanent injunction prohibiting us from marketing or selling our solutions. If we cannot or do not license the infringed technology on reasonable terms or at all, or substitute similar technology from another source, our revenue and operating results could be adversely impacted. Additionally, our customers may not purchase our marketing solutions if they are concerned that they may infringe third-party intellectual property rights. The occurrence of any of these events may have a material adverse effect on our business.
In our subscription agreements with our customers, we agree to indemnify our customers against losses or costs incurred in connection with claims by a third party alleging that a customer's use of our services infringes the intellectual property rights of the third party. There can be no assurance that any existing limitations of liability provisions in our contracts would be enforceable or adequate, or would otherwise protect us from any such liabilities or damages with respect to any particular claim. Our customers who are accused of intellectual property infringement may in the future seek indemnification from us under the terms of our contracts. If such claims are successful, or if we are required to indemnify or defend our customers from these or other claims, these matters could be disruptive to our business and management and have a material adverse effect on our business, operating results and financial condition.
We are dependent on the continued participation and level of service of our third-party professional service providers and our indirect sales partners.
We rely on third-party service providers to provide certain services to us and/or our customers, as well as indirect sales partners to pursue additional channel, agency and OEM distribution partnerships. If any of these third-party service providers stop supporting our solution or if our network of providers does not expand, we will likely have to expand our internal team to meet the needs of our customers, which could increase our operating costs and result in lower gross margins. To the extent that we are unable to recruit alternative partners, or to expand our internal team, our revenue and operating results would be harmed.
27
We use open source software in our products, which could subject us to litigation or other actions.
We use open source software in our marketing solutions and may use more open source software in the future. From time to time, there have been claims challenging the ownership of open source software against companies that incorporate open source software into their products. As a result, we could be subject to lawsuits by parties claiming ownership of what we believe to be open source software. We could also be subject to lawsuits by authors or other third parties that distribute open source software alleging that we had not complied with the conditions of one or more of these licenses. Litigation could be costly for us to defend, have a negative effect on our operating results and financial condition or require us to devote additional research and development resources to change our products. In addition, if we were to combine our proprietary software products with open source software in a certain manner, we could, under certain of the open source licenses, be required to release the source code of our proprietary software products. If we inappropriately use open source software, we may be required to re-engineer our products, discontinue the sale of our products or take other remedial actions.
Existing federal, state and foreign laws that regulate privacy rights, including online tracking, the sending of commercial emails and text messages, and other activities, could impact the use of our marketing solution and potentially subject us to regulatory enforcement or private litigation.
Certain aspects of how we operate and how our customers utilize our solution are subject to legislation and regulations in the United States, the European Union and elsewhere. These regulations and legislation seek, among other things, to allow consumers to have greater control over the collection, use and disclosure of personal information collected online and could therefore have a significant impact on the operation of our marketing solutions and could impair our attractiveness to customers, which would harm our business.
Many of our customers and potential customers in the healthcare, financial services and other industries are subject to substantial regulation regarding their collection, use and protection of data and may be the subject of further regulation in the future. These regulations may change the way these customers do business and may require us to implement additional features or offer additional contractual terms to satisfy customer and regulatory requirements, or could cause the demand for and sales of our marketing solutions to decrease and adversely impact our financial results.
In addition, the Controlling the Assault of Non-Solicited Pornography and Marketing Act of 2003 establishes certain requirements for senders of commercial email messages, such as providing recipients with the ability to opt out of receiving future commercial emails from the sender. The ability of our customers' message recipients to opt out of receiving commercial emails may minimize the effectiveness of the email components of our marketing solutions. The Telephone Consumer Protection Act allows companies to send some types of commercial text messages only when the recipient has opted into the receipt of such text messages. In addition, certain states and foreign jurisdictions, such as Australia, Canada and the European Union, have enacted laws that regulate sending email, and some of these laws are more restrictive than U.S. laws. For example, Canada's Anti-Spam Legislation prohibits sending unsolicited email unless the recipient has provided the sender advance consent to receipt of such email, or in other words has "opted-in" to receiving it. A requirement that recipients opt into, or the ability of recipients to opt out of, receiving commercial emails and texts may minimize the effectiveness of our solutions.
With regard to data transfers of personal data from our European employees and customers to the United States, we have historically relied primarily on our adherence to the U.S. Department of Commerce's Safe Harbor Privacy Principles and compliance with the U.S.-EU and U.S.-Swiss Safe Harbor Frameworks as agreed to and set forth by the U.S. Department of Commerce, and the European Union and Switzerland, which established means for legitimizing the transfer of personal
28
data by U.S. companies doing business in Europe from the European Economic Area, or EEA, to the U.S. As a result of the October 6, 2015 European Union Court of Justice, or ECJ, opinion in Case C-362/14 (Schrems v. Data Protection Commissioner) (the "ECJ Ruling"), the U.S.-EU Safe Harbor Framework was deemed an invalid method of compliance with restrictions set forth in EU Directive 95/46/EC (and member states' implementations thereof) regarding the transfer of personal data outside of the EEA. In light of the ECJ Ruling, we have provided alternative solutions to legitimize our transfers of personal data from the EEA to the United States. However, these alternative solutions may be challenged or deemed insufficient, whether as a result of future ECJ rulings, changes in EU Directive 95/46/EC (and member states' implementations thereof), successor EU data protection regulations, or otherwise, and we may experience reluctance or refusal by European customers to use our solutions due to potential risk exposure as a result of the ECJ Ruling. We and our customers may face a risk of enforcement actions taken by EU data protection authorities until the time, if any, that personal data transfers to us and by us from the EEA are legitimized under an alternative government-sponsored alternative to the U.S.-EU Safe Harbor Framework. The EU and U.S. reached political agreement on February 2, 2016, regarding the U.S.-EU Privacy Shield, a potential means to legitimize data transfers from the EU to the U.S., but it is unclear whether or when it will go into effect, and there can be no assurance that we will be able to implement the U.S.-EU Privacy Shield or that it will be appropriate for our purposes.
The foregoing legislation and regulations are dynamic and change frequently, with new legislation and regulations proposed and adopted frequently, and legislation and regulations subject to invalidation or new or changed interpretation. For example, the European Commission is considering adoption of a general data protection regulation that would supersede current EU data protection legislation, impose more stringent EU data protection requirements, and provide for greater penalties for noncompliance. In addition, U.S., state and foreign jurisdictions are considering and may in the future enact legislation or laws restricting marketing activities in mobile, social and web channels. Any of the foregoing existing or future restrictions could require us to change one or more aspects of the way we operate our business, which could impair our ability to attract and retain customers, or increase our operating costs or otherwise harm our business. We may be unable to pass along those costs to our clients in the form of increased subscription fees.
While these laws and regulations generally govern our customers' use of our solution, we may face liability or reputational harm as a result of the activities of our customers, and we may be directly subject to certain laws as a data processor on behalf of, or as a business associate of, our customers. In addition, customers may engage in prohibited activities or upload or store content with us in violation of applicable law or the customers' own policies, which could subject us to liability or harm our reputation. If we were found to be in violation of any of these laws or regulations as a result of government enforcement or private litigation, we could be subjected to civil and criminal sanctions, including both monetary fines and injunctive action that could force us to change our business practices, all of which could adversely affect our financial performance and significantly harm our reputation and our business.
Privacy concerns and consumers' acceptance of Internet behavior tracking may limit the applicability, use and adoption of our marketing solutions.
Privacy concerns may cause consumers to resist providing the personal data necessary to allow our customers to use our service effectively. We have implemented various features intended to enable our customers to better protect consumer privacy, but these measures may not alleviate all potential privacy concerns and threats. For example, the ECJ Ruling had the effect of invalidating the Safe Harbor framework discussed above. As a result, the framework no longer provides a valid legal basis for companies to transfer personal data from the European Union to the United States. Companies, including our customers, must comply with relevant aspects of European Union data protection laws
29
using alternate mechanisms, and our customers may not implement the alternate mechanisms that we offer. Additionally, our alternative measures may be challenged or deemed insufficient. Even the perception of privacy concerns, whether or not valid, may inhibit market adoption of our service in certain industries. In addition to government activity, privacy advocacy groups and the marketing and other industries are considering various new, additional or different self-regulatory standards that may place additional burdens on us. The costs of compliance with, and other burdens imposed by, the foregoing laws, regulations, policies and actions may limit the use and adoption of our cloud-based marketing solutions and reduce overall demand for it, or lead to significant fines, penalties or liabilities for any noncompliance or loss of any such action.
We may be subject to additional obligations to collect and remit sales tax and other taxes, and we may be subject to tax liability for past sales, which could harm our business.
State, local and foreign jurisdictions have differing rules and regulations governing sales, use, value added and other taxes, and these rules and regulations are subject to varying interpretations that may change over time. In particular, the applicability of such taxes to our subscription cloud-based marketing solutions in various jurisdictions is unclear, and we may be subject to additional local jurisdictional taxes in the future. Further, these jurisdictions' rules regarding tax nexus are complex and vary significantly. As a result, we could face the possibility of tax assessments and audits, and our liability for these taxes and associated penalties could exceed our original estimates. A successful assertion that we should be collecting additional sales, use, value added or other taxes in those jurisdictions where we have not historically done so and do not accrue for such taxes could result in substantial tax liabilities and related penalties for past sales, discourage customers from purchasing our application or otherwise harm our business and operating results.
Changes in tax laws or regulations that are applied adversely to us or our customers could increase the costs of our cloud-based marketing solutions and adversely impact our business.
New income, sales, use or other tax laws, statutes, rules, regulations or ordinances could be enacted at any time. Any new taxes could adversely affect our domestic and international business operations, and our business and financial performance. Further, existing tax laws, statutes, rules, regulations or ordinances could be interpreted, changed, modified or applied adversely to us. These events could require us or our customers to pay additional tax amounts on a prospective or retroactive basis, as well as require us or our customers to pay fines and/or penalties and interest for past amounts deemed to be due. If we raise our prices to offset the costs of these changes, existing and potential future customers may elect not to continue or purchase our marketing solutions in the future. Additionally, new, changed, modified or newly interpreted or applied tax laws could increase our customers' and our compliance, operating and other costs, as well as the costs of our solutions. Any or all of these events could adversely impact our business and financial performance.
We are a multinational organization faced with increasingly complex tax issues in many jurisdictions, and we could be obligated to pay additional taxes in various jurisdictions.
As a multinational organization, we may be subject to taxation in several jurisdictions around the world with increasingly complex tax laws, the application of which can be uncertain. The amount of taxes we pay in these jurisdictions could increase substantially as a result of changes in the applicable tax principles, including increased tax rates, new tax laws or revised interpretations of existing tax laws and precedents, which could have a material adverse effect on our liquidity and operating results. In addition, the authorities in these jurisdictions could review our tax returns and impose additional tax, interest and penalties, and the authorities could claim that various withholding requirements apply to us or our subsidiaries or assert that benefits of tax treaties are not available to us or our subsidiaries, any of which could have a material impact on us and the results of our operations.
30
The investment of our cash and cash equivalents including money market funds are subject to risks which may cause losses and affect the liquidity of these investments.
Our investments include various money market funds which invest in securities such as United States Treasury securities, U.S. government agency securities, bank certificates of deposit and commercial paper. Weakened financial markets have at times adversely impacted the general credit, liquidity, market prices and interest rates for these and other types of debt securities. Additionally, changes in monetary policy by the Federal Open Market Committee and concerns about the rising U.S. government debt level may cause a decrease in the purchasing power of the United States dollar and adversely affect our investment portfolio. Furthermore, if there is a default or downgrade of U.S. government or agency debt securities, our investment portfolio may be adversely impacted, requiring impairment charges that could adversely affect our liquidity, financial position, results of operations or cash flows. The financial market and monetary risks associated with our investment portfolio may have a material adverse effect on our financial condition, liquidity, results of operations or cash flows.
Failure to comply with laws and regulations could harm our business.
Our business is subject to regulation by various federal, state, local and foreign governmental agencies, including agencies responsible for monitoring and enforcing employment and labor laws, workplace safety, environmental laws, consumer protection laws, anti-bribery laws, import/export controls, data privacy, federal securities laws and tax laws and regulations. In certain jurisdictions, these regulatory requirements may be more stringent than those in the United States. Noncompliance with applicable regulations or requirements could subject us to investigations, sanctions, mandatory recalls, enforcement actions, disgorgement of profits, fines, damages, civil and criminal penalties or injunctions. If any governmental sanctions are imposed, or if we do not prevail in any possible civil or criminal litigation, our business, operating results and financial condition could be harmed. In addition, responding to any action will likely result in a significant diversion of management's attention and resources and an increase in professional fees. Enforcement actions and sanctions could further harm our business, operating results and financial condition.
Catastrophic events may disrupt our business.
We rely heavily on our data centers, network infrastructure and information technology systems for our business operations. A disruption or failure of these systems in the event of online attack, earthquake, fire, terrorist attack, power loss, telecommunications failure or other similar catastrophic event could cause system interruptions, delays in accessing our service, reputational harm and loss of critical data or could prevent us from providing our solutions to our customers. We host our solutions at several facilities in the United States, the European Union, and Australia. We are headquartered and most of our employees reside in the San Francisco Bay Area, an area particularly susceptible to earthquakes, and a major earthquake or other catastrophic event could affect our employees, who may not be able to access our systems or otherwise continue to provide our solutions to our customers. We maintain a facility in Israel, and our operations there may be adversely affected by political instability or international conflict in that region. A catastrophic event that results in the destruction or disruption of our data centers, or our network infrastructure or information technology systems, or access to our systems, could affect our ability to conduct normal business operations and adversely affect our operating results.
The requirements of being a public company may strain our systems and resources, divert management's attention and be costly.
As a public company, we are subject to the reporting requirements of the Securities Exchange Act of 1934, as amended (Exchange Act) the Sarbanes-Oxley Act of 2002 (Sarbanes-Oxley Act), the Dodd-Frank Wall Street Reform and Consumer Protection Act (Dodd-Frank Act), and the rules and
31
regulations of The NASDAQ Stock Market. The requirements of these rules and regulations increase our legal, accounting and financial compliance costs, make some activities more difficult, time-consuming and costly and may also place undue strain on our personnel, systems and resources.
The Exchange Act requires, among other things, that we file annual, quarterly and current reports with respect to our business and operating results. The Sarbanes-Oxley Act requires, among other things, that we maintain effective disclosure controls and procedures and internal control over financial reporting. We are continuing the costly process of implementing and testing our systems to report our results as a public company, to continue to manage our growth and to implement internal controls. We are and will continue to be required to implement and maintain various other control and business systems related to our equity, finance, treasury, information technology, other recordkeeping systems and other operations. As a result of this implementation and maintenance, management's attention may be diverted from other business concerns, which could adversely affect our business. Furthermore, we rely on third-party software and system providers for meeting our reporting obligations and ensuring effective internal controls, and to the extent these third parties fail to provide adequate service including as a result of any inability to scale to handle our growth and the imposition of these increased reporting and internal controls and procedures, we could incur material costs for upgrading or switching systems and our business could be materially affected.
As a result of being a public company, our business and financial condition have become more visible, which may result in threatened or actual litigation, including by competitors and other third parties. If such claims are successful, our business and operating results could be adversely affected, and even if the claims do not result in litigation or are resolved in our favor, these claims, and the time and resources necessary to resolve them, could divert the time and resources of our management and adversely affect our business and operating results.
As a public company, we are obligated to develop and maintain proper and effective internal control over financial reporting. We may not complete our analysis of our internal control over financial reporting in a timely manner, or these internal controls may not be determined to be effective, which may adversely affect investor confidence in our company and, as a result, the value of our common stock.
We are required, pursuant to Section 404 of the Sarbanes-Oxley Act, to furnish a report by management on, among other things, the effectiveness of our internal control over financial reporting. This assessment must include disclosure of any material weaknesses identified by our management in our internal control over financial reporting. We may experience difficulty in meeting these reporting requirements in a timely manner, particularly if material weaknesses or significant deficiencies persist. In the past certain significant deficiencies have been identified in our internal financial and accounting controls and procedures. In addition, our independent registered public accounting firm will not be required to formally attest to the effectiveness of our internal control over financial reporting pursuant to Section 404 until the date we are no longer an "emerging growth company" as defined in the Jumpstart Our Business Startups Act of 2012 (JOBS Act). If we are unable to comply with the requirements of Section 404 in a timely manner, the market price of our stock could decline and we could be subject to sanctions or investigations by the NASDAQ Stock Market, the SEC or other regulatory authorities, which would require additional financial and management resources.
Any failure to develop or maintain effective controls, or any difficulties encountered in their implementation or improvement, could harm our operating results or cause us to fail to meet our reporting obligations. Any failure to implement and maintain effective internal controls also could adversely affect the results of periodic management evaluations regarding the effectiveness of our internal control over financial reporting. Ineffective disclosure controls and procedures or internal control over financial reporting could also cause investors to lose confidence in our reported financial and other information, which would likely have a negative effect on the trading price of our common stock.
32
Implementing any appropriate changes to our internal controls may require specific compliance training of our directors, officers and employees, entail substantial costs in order to modify our existing accounting systems, and take a significant period of time to complete. Such changes may not, however, be effective in maintaining the adequacy of our internal controls, and any failure to maintain that adequacy, or consequent inability to produce accurate financial statements on a timely basis, could increase our operating costs and could materially impair our ability to operate our business. In the event that we are not able to demonstrate compliance with Section 404 of the Sarbanes-Oxley Act in a timely manner, that our internal controls are perceived as inadequate or that we are unable to produce timely or accurate financial statements, investors may lose confidence in our operating results and our stock price could decline.
Changes in financial accounting standards or practices may cause adverse, unexpected financial reporting fluctuations and affect our reported operating results.
Generally accepted accounting principles ("GAAP") in the United States are subject to interpretation by the Financial Accounting Standards Board ("FASB"), the SEC and various bodies formed to promulgate and interpret appropriate accounting principles. A change in accounting standards or practices can have a significant effect on our reported results and may even affect our reporting of transactions completed before the change is effective. New accounting pronouncements and varying interpretations of accounting pronouncements have occurred and may occur in the future. Changes to existing rules or the questioning of current practices may adversely affect our reported financial results or the way we conduct our business. Accounting for revenue from sales of subscriptions to software is particularly complex, is often the subject of intense scrutiny by the SEC, and will evolve as FASB continues to consider applicable accounting standards in this area.
For example, the FASB is currently working together with the International Accounting Standards Board to converge certain accounting principles and facilitate more comparable financial reporting between companies that are required to follow U.S. GAAP and those that are required to follow International Financial Reporting Standards. In connection with this initiative, the FASB issued a new accounting standard for revenue recognition in May 2014—Accounting Standards Update ("ASU") 2014-09, "Revenue from Contracts with Customers (Topic 606)"—that supersedes nearly all existing U.S. GAAP revenue recognition guidance. Although we are currently in the process of evaluating the impact of ASU 2014-09 on our consolidated financial statements, it could change the way we account for the costs to obtain or fulfill a contract with a customer or for certain of our sales transactions. Adoption of the standard could have a significant impact on our financial statements and may retroactively affect the accounting treatment of transactions completed before adoption.
In addition, certain factors have in the past and may in the future cause us to defer recognition for subscription fees. For example, the inclusion in our customer contracts of material non-standard terms, such as acceptance criteria, could require the deferral of subscription revenue. To the extent that such contracts become more prevalent in the future our revenue may be adversely affected.
Because of these factors and other specific requirements under accounting principles generally accepted in the United States for revenue recognition, we must have very precise terms in our arrangements in order to recognize revenue when we initially deliver our hosting services or perform our professional services. Negotiation of mutually acceptable terms and conditions can extend our sales cycle, and we may accept terms and conditions that do not permit revenue recognition at the time of delivery.
33
Our stock price may be volatile and may decline regardless of our operating performance resulting in substantial losses for investors purchasing shares of our stock.
The trading prices of the securities of technology companies, including providers of software via the cloud-based model, have been highly volatile. The market price of our common stock may fluctuate significantly in response to numerous factors, many of which are beyond our control, including:
- •
- actual or anticipated fluctuations in our revenue and other operating results, including as a result of the addition or loss of any
number of customers;
- •
- announcements by us, our strategic partners or our competitors of significant technical innovations, acquisitions, strategic
partnerships, joint ventures or capital commitments;
- •
- the financial projections we may provide to the public, any changes in these projections or our failure to meet these projections;
- •
- failure of securities analysts to initiate or maintain coverage of us, changes in ratings and financial estimates and the publication
of other news by any securities analysts who follow our company, or our failure to meet these estimates or the expectations of investors;
- •
- changes in operating performance and stock market valuations of cloud-based software or other technology companies, or those in our
industry in particular;
- •
- changes in the competitive environment in which we operate and its effect on our revenue and other operating results;
- •
- price and volume fluctuations in the trading of our common stock and in the overall stock market, including as a result of trends in
the economy as a whole;
- •
- announcements by us with regard to the effectiveness of our internal controls and our ability to accurately report financial results;
- •
- new laws or regulations or new interpretations of existing laws or regulations applicable to our business our industry;
- •
- lawsuits threatened or filed against us;
- •
- changes in key personnel; and
- •
- other events or factors, including those resulting from war, incidents of terrorism or responses to these events.
In addition, the stock markets have experienced extreme price and volume fluctuations that have affected and continue to affect the market prices of equity securities of many technology companies. Stock prices of many technology companies have fluctuated in a manner unrelated or disproportionate to the operating performance of those companies.
In the past, stockholders have instituted securities class action litigation following periods of market volatility. If we were to become involved in securities litigation, it could subject us to substantial costs, divert resources and the attention of management from our business and adversely affect our business.
If securities or industry analysts do not continue to publish research or publish incorrect or unfavorable research about our business, our stock price and trading volume could decline.
The trading market for our common stock depends in part on the research and reports that securities or industry analysts publish about us or our business, our market and our competitors. If no or few securities or industry analysts cover our company, the trading price for our stock could be negatively impacted. If one or more of the analysts who covers us downgrades our stock or publishes
34
incorrect or unfavorable research about our business, our stock price would likely decline. If one or more of these analysts ceases coverage of our company or fails to publish reports on us regularly, demand for our stock could decrease, which could cause our stock price or trading volume to decline.
The concentration of our capital stock ownership with insiders will likely limit your ability to influence corporate matters including the ability to influence the outcome of director elections and other matters requiring stockholder approval.
Our executive officers, directors, current five percent or greater stockholders and affiliated entities together beneficially own a significant portion of our common stock outstanding as of December 31, 2015. As a result, these stockholders, acting together, have significant influence over all matters that require approval by our stockholders, including the election of directors and approval of significant corporate transactions. Corporate action might be taken even if other stockholders oppose them. This concentration of ownership might also have the effect of delaying or preventing a change of control of our company that other stockholders may view as beneficial.
Our ability to raise capital in the future may be limited, and our failure to raise capital when needed could prevent us from growing.
Our business and operations may consume resources faster than we anticipate. In the future, we may need to raise additional funds to invest in future growth opportunities. Additional financing may not be available on favorable terms, if at all. If adequate funds are not available on acceptable terms, we may be unable to invest in future growth opportunities, which could seriously harm our business and operating results. If we incur debt, the debt holders would have rights senior to common stockholders to make claims on our assets, and the terms of any debt could restrict our operations, including our ability to pay dividends on our common stock. Furthermore, if we issue additional equity securities, stockholders will experience dilution, and the new equity securities could have rights senior to those of our common stock. Because our decision to issue securities in any future offering will depend on market conditions and other factors beyond our control, we cannot predict or estimate the amount, timing or nature of our future offerings. As a result, our stockholders bear the risk of our future securities offerings reducing the market price of our common stock and diluting their interest.
Substantial future sales of shares of our common stock by existing stockholders could depress the market price of our common stock.
The market price for our common stock could decline as a result of the sale of substantial amounts of our common stock, particularly sales by our directors, executive officers and significant stockholders, a large number of shares of our common stock becoming available for sale or the perception in the market that holders of a large number of shares intend to sell their shares.
In addition, certain holders of our common stock as of December 31, 2015 have rights, subject to some conditions, to require us to file registration statements covering their shares or to include their shares in registration statements that we may file for ourselves or our stockholders.
In addition, the shares of common stock subject to outstanding options under our equity incentive plans and the shares reserved for future issuance under our equity incentive plans have become eligible for sale in the public, subject to certain legal and contractual limitations.
Anti-takeover provisions in our charter documents and Delaware law may delay or prevent an acquisition of our company.
Our amended and restated certificate of incorporation, amended and restated bylaws and Delaware law contain provisions that may have the effect of delaying or preventing a change in control
35
of us or changes in our management. Our amended and restated certificate of incorporation and bylaws include provisions that:
- •
- authorize "blank check" preferred stock, which could be issued by the board without stockholder approval and may contain voting,
liquidation, dividend and other rights superior to our common stock;
- •
- provide for a classified board of directors whose members serve staggered three-year terms;
- •
- specify that special meetings of our stockholders can be called only by our board of directors, the chairperson of the board, the
chief executive officer or the president;
- •
- prohibit stockholder action by written consent;
- •
- establish an advance notice procedure for stockholder approvals to be brought before an annual meeting of our stockholders, including
proposed nominations of persons for election to our board of directors;
- •
- provide that our directors may be removed only for cause;
- •
- provide that vacancies on our board of directors may be filled only by a majority of directors then in office, even though less than a
quorum;
- •
- specify that no stockholder is permitted to cumulate votes at any election of directors;
- •
- authorize our board of directors to modify, alter or repeal our amended and restated bylaws; and
- •
- require supermajority votes of the holders of our common stock to amend specified provisions of our charter documents.
These provisions, alone or together, could delay or prevent hostile takeovers and changes in control or changes in our management.
In addition, because we are incorporated in Delaware, we are governed by the provisions of Section 203 of the Delaware General Corporation Law, which limits the ability of stockholders owning in excess of 15% of our outstanding voting stock to merge or combine with us in certain circumstances.
Any provision of our amended and restated certificate of incorporation or amended and restated bylaws or Delaware law that has the effect of delaying or deterring a change in control could limit the opportunity for our stockholders to receive a premium for their shares of our common stock, and could also affect the price that some investors are willing to pay for our common stock.
We do not currently intend to pay dividends on our common stock and, consequently, your ability to achieve a return on your investment will depend on appreciation in the price of our common stock.
We have never declared or paid any cash dividends on our common stock and do not currently intend to do so for the foreseeable future. In addition, any future financing or credit agreements may prohibit us from paying any type of dividends. We currently intend to invest our future earnings, if any, to fund our growth. Therefore, you are not likely to receive any dividends on your common stock for the foreseeable future and the success of an investment in shares of our common stock will depend upon any future appreciation in its value. Consequently, investors may need to sell all or part of their holdings of our common stock after price appreciation, which may never occur, as the only way to realize any future gains on their investment. There is no guarantee that shares of our common stock will appreciate in value or even maintain the price at which our stockholders have purchased their shares. Investors seeking cash dividends should not purchase our common stock.
36
We are an "emerging growth company" and the reduced disclosure requirements applicable to emerging growth companies may make our common stock less attractive to investors.
We are an "emerging growth company," as defined in the JOBS Act, and we are able to take advantage of certain exemptions from various reporting requirements that are applicable to other public companies that are not "emerging growth companies" including, but not limited to, not being required to comply with the auditor attestation requirements of Section 404 of the Sarbanes-Oxley Act, reduced financial disclosure obligations, reduced disclosure obligations regarding executive compensation in our periodic reports and proxy statements, and exemptions from the requirements of holding a nonbinding advisory vote on executive compensation and any golden parachute payments not previously approved. We may take advantage of these provisions for up to five years or such earlier time that we are no longer an "emerging growth company." We would cease to be an "emerging growth company" upon the earliest to occur of: the last day of the fiscal year in which we have more than $1.0 billion in annual revenue; the date we qualify as a "large accelerated filer," with at least $700 million of equity securities held by non-affiliates; the issuance, in any three-year period, by us of more than $1.0 billion in non-convertible debt securities; and the last day of the fiscal year ending after the fifth anniversary of our initial public offering. We may choose to take advantage of some but not all of these reduced reporting burdens. Because we take advantage of some of these reduced reporting requirements, the information that we provide our security holders in future filings may be different than you might get from other public companies in which you hold equity interests.
Item 1B. Unresolved Staff Comments
None.
Our corporate headquarters and executive offices are located in San Mateo, California, where we occupy approximately 102,670 square feet of office space under a lease that expires in August 2018. We maintain additional offices in Portland, Oregon; Atlanta, Georgia; Dublin, Ireland; Sydney, Australia; Farnborough, United Kingdom; Tokyo, Japan and Tel Aviv, Israel.
We lease all of our facilities, and we do not own any real property. We believe that our existing facilities are adequate for our current needs and that we will be able to lease suitable additional or alternative space on commercially reasonable terms if and when we need it.
From time to time we may become involved in legal proceedings or be subject to claims arising in the ordinary course of our business. Although the results of litigation and claims cannot be predicted with certainty, we currently believe that the final outcome of these ordinary course matters will not have a material adverse effect on our business, operating results, financial condition or cash flows. Regardless of the outcome, litigation can have an adverse impact on us because of defense and settlement costs, diversion of management resources and other factors.
Item 4. Mine Safety Disclosures
Not applicable.
37
Item 5. Market for Registrant's Common Equity, Related Stockholder Matters and Issuer Purchases of Equity Securities
Market Information for Common Stock
The table below summarizes the range of high and low reported sales prices on the NASDAQ Stock Market for our common stock for the periods presented.
Fiscal 2015
|
High | Low | |||||
|---|---|---|---|---|---|---|---|
First Quarter |
$ | 35.63 | $ | 24.82 | |||
Second Quarter |
$ | 30.84 | $ | 24.70 | |||
Third Quarter |
$ | 31.69 | $ | 23.17 | |||
Fourth Quarter |
$ | 33.99 | $ | 25.13 | |||
Fiscal 2014
|
High | Low | |||||
|---|---|---|---|---|---|---|---|
First Quarter |
$ | 45.00 | $ | 31.71 | |||
Second Quarter |
$ | 35.22 | $ | 22.02 | |||
Third Quarter |
$ | 34.59 | $ | 24.56 | |||
Fourth Quarter |
$ | 34.71 | $ | 28.19 | |||
Stockholders
As of February 26, 2016, there were approximately 61 holders of record of our common stock. However, because many of our shares of common stock are held by brokers and other institutions on behalf of stockholders, we are unable to accurately estimate the total number of stockholders represented by these record holders.
Dividends
We have never declared or paid any cash dividends on our common stock. We currently anticipate that we will retain future earnings to fund development and growth of our business and to repurchase our common stock, and do not anticipate paying cash dividends in the foreseeable future.
Performance Graph
This performance graph shall not be deemed "soliciting material" or to be "filed" with the Securities and Exchange Commission for purposes of Section 18 of the Exchange Act or otherwise subject to the liabilities under that Section, and shall not be deemed to be incorporated by reference into any filing of ours under the Securities Act of 1933, as amended (the "Securities Act") or the Exchange Act.
The following graph shows a comparison from May 17, 2013 (the date our common stock commenced trading on the NASDAQ) through December 31, 2015 of the cumulative total return for our common stock, the NASDAQ Internet Index and the S&P 500 Index. The graph assumes that $100 was invested in Marketo common stock on May 17, 2013 and in each of the indexes and that all dividends were reinvested. No cash dividends were declared on our common stock during such time. The stock price performance of the following graph is not necessarily indicative of future stock price performance.
38
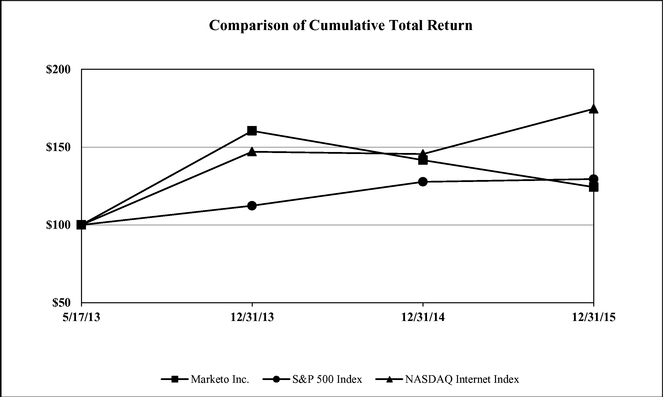
Recent Sales of Unregistered Securities
On December 22, 2014 we issued an aggregate 141,074 shares of our common stock in connection with an acquisition to an acquired company's former security holders. The offer and sale of the securities were effected without registration in reliance upon the exemptions from the registration requirements of the Securities Act of 1933, as amended, provided by Section 3(a)(10) thereof, or on Section 4(a)(2) thereof or Regulation D promulgated thereunder.
Purchases of Equity Securities by the Issuer and Affiliated Purchasers
None
Securities Authorized for Issuance Under Equity Compensation Plans
Information regarding securities authorized for issuance under equity compensation plans is incorporated by reference to our Proxy Statement for the 2016 Annual Meeting of Stockholders to be filed with the Securities and Exchange Commission within 120 days of the fiscal year ended December 31, 2015.
39
Item 6. Selected Financial Data
The following selected financial data are derived from our consolidated financial statements. This data should be read in conjunction with the consolidated financial statements and notes thereto included in Part II, Item 8. "Financial Statements and Supplementary Data," and Part II, Item 7, "Management's Discussion and Analysis of Financial Condition and Results of Operations" of this Annual Report on Form 10-K.
| |
Year Ended December 31, | |||||||||||||||
|---|---|---|---|---|---|---|---|---|---|---|---|---|---|---|---|---|
| Consolidated Statements of Operations Data: |
2015 | 2014 | 2013 | 2012 | 2011 | |||||||||||
| |
(in thousands, except per share data) |
|||||||||||||||
Total revenue |
$ | 209,869 | $ | 149,954 | $ | 95,918 | $ | 58,413 | $ | 32,392 | ||||||
Total gross profit |
137,753 | 99,153 | 57,939 | 33,755 | 17,456 | |||||||||||
Total operating expenses |
206,205 | 154,763 | 104,745 | 67,963 | 39,919 | |||||||||||
Loss from operations |
(68,452 | ) | (55,610 | ) | (46,806 | ) | (34,208 | ) | (22,463 | ) | ||||||
Loss before provision (benefit) for income taxes |
(68,371 | ) | (55,432 | ) | (47,332 | ) | (34,366 | ) | (22,600 | ) | ||||||
Net loss |
(69,079 | ) | (54,955 | ) | (47,360 | ) | (34,385 | ) | (22,606 | ) | ||||||
Net loss and adjustment attributable to redeemable non-controlling interests(1) |
(2,418 | ) | 618 | — | — | — | ||||||||||
Net loss attributable to Marketo |
(71,497 | ) | (54,337 | ) | (47,360 | ) | (34,385 | ) | (22,606 | ) | ||||||
| | | | | | | | | | | | | | | | | |
| | | | | | | | | | | | | | | | | |
| | | | | | | | | | | | | | | | | |
Net loss per share of common stock, basic and diluted |
$ | (1.68 | ) | $ | (1.35 | ) | $ | (1.92 | ) | $ | (12.26 | ) | $ | (9.94 | ) | |
| | | | | | | | | | | | | | | | | |
| | | | | | | | | | | | | | | | | |
| | | | | | | | | | | | | | | | | |
Shares used in computing net loss per share of common stock, basic and diluted |
42,504 | 40,385 | 24,709 | 2,806 | 2,274 | |||||||||||
| | | | | | | | | | | | | | | | | |
| | | | | | | | | | | | | | | | | |
| | | | | | | | | | | | | | | | | |
- (1)
- For the year ended December 31, 2015, we recorded an adjustment to redeemable non-controlling interests of $(4.0) million, which is included in this line item.
| |
As of December 31, | |||||||||||||||
|---|---|---|---|---|---|---|---|---|---|---|---|---|---|---|---|---|
| Consolidated Balance Sheet Data: |
2015 | 2014 | 2013 | 2012 | 2011 | |||||||||||
| |
(in thousands) |
|||||||||||||||
Cash and cash equivalents |
$ | 107,218 | $ | 112,644 | $ | 128,299 | $ | 44,247 | $ | 67,400 | ||||||
Working capital |
43,089 | 66,011 | 88,338 | 28,346 | 59,651 | |||||||||||
Total assets |
225,078 | 210,411 | 205,839 | 79,156 | 79,738 | |||||||||||
Total indebtedness |
2,652 | 5,372 | 7,559 | 3,640 | — | |||||||||||
Deferred revenue |
91,965 | 62,945 | 41,356 | 20,642 | 10,968 | |||||||||||
Total liabilities |
127,310 | 96,435 | 77,397 | 35,592 | 18,430 | |||||||||||
Redeemable non-controlling interests |
4,643 | 800 | — | — | — | |||||||||||
Convertible preferred stock |
— | — | — | 119,121 | 106,821 | |||||||||||
Total stockholders' equity |
93,125 | 113,176 | 128,442 | 43,564 | 61,308 | |||||||||||
40
Item 7. Management's Discussion and Analysis of Financial Condition and Results of Operations
The following discussion and analysis of our financial condition and results of operations should be read in conjunction with our consolidated financial statements and related notes included under Part II, Item 8, "Financial Statements and Supplementary Data" of this Annual Report on Form 10-K. The following discussion contains forward-looking statements including, but not limited to, statements referencing our expectations relating to future revenue, expenses, operating margins, relative growth rates and planned investments. Our forward-looking statements and factors that might cause future actual results to differ materially from our recent results or those projected in the forward-looking statements include, but are not limited to those discussed in the section titled "Special Note Regarding Forward-Looking Statements" and Part I, Item 1A, "Risk Factors" of this Annual Report on Form 10-K. Except as required by law, we assume no obligation to update the forward-looking statements or our risk factors for any reason.
Overview
We are the provider of a leading cloud-based marketing solutions platform that is purpose-built to enable organizations ranging from Small and Medium Businesses ("SMBs") to the world's largest enterprises to engage in modern relationship marketing. Our platform enables the effective execution, management and analytical measurement of online, social, mobile and offline marketing activities and customer interactions in today's data-centric, multi-channel business environment. On our platform, we deliver an easy to use, integrated suite of advanced applications, which today include Marketing Automation, Email Marketing, Mobile Engagement, Social Marketing, Digital Ads, Web Personalization, Marketing Analytics, Predictive Content, Marketing Calendar, and Sales Insight. To enable our customers to obtain maximum value from our platform, we complement our solutions with an extensive network of resources to assist our customers with the strategic and practical use of our solutions. Among these resources are expert consulting services, peer-to-peer discussion communities, a library of pre-built marketing programs and templates, rich content on marketing best practices and an integrated ecosystem of partner products.
We designed our platform to be valuable across large enterprises and SMBs that sell to both businesses and consumers in virtually any industry. We market and sell our products directly and through a network of distribution partners. Our client base is diverse, with 4,549 customers as of December 31, 2015 across a wide range of industries including business services, consumer, financial services, healthcare, manufacturing, media, technology and telecommunications. For the years ended December 31, 2015 and 2014, our 20 largest customers accounted for 12% and 11% of our total revenue, respectively. For the year ended December 31, 2013, our 20 largest customers accounted for less than 10% of our total revenue. Our subscription dollar retention rate was approximately 105%, 109%, and 100% for 2015, 2014 and 2013, respectively.
We deliver our solutions entirely through a multi-tenant cloud-based, or Software as a Service ("SaaS"), architecture which customers can configure to their specific needs. We focus our selling efforts on both the SMB market, which we define as companies with fewer than 1,500 employees, and the enterprise market, which we define as companies with 1,500 or more employees. The percentage of our subscription and support revenue from enterprise customers was 30%, 28% and 26% for the years ended December 31, 2015, 2014 and 2013, respectively.
Our direct sales force has separate sales teams for the enterprise market and for the SMB market. Within our direct sales force, we also have a team that is responsible for selling to existing customers, who may renew their subscriptions, increase their usage of our platform and applications, acquire additional applications from our product family, or broaden the deployment of our solutions across their organizations. In addition, we sell to distributors, agencies, resellers and OEMs, who in turn resell or use our platform to provide managed marketing services to their end customers. To date, substantially all of our revenue has been derived from direct sales.
41
We provide our solutions on a subscription basis, and we generated revenue of $209.9 million, $150.0 million and $95.9 million for the years ended December 31, 2015, 2014 and 2013, respectively, representing year-over-year increases of 40% and 56%, respectively. We derive most of our revenue from subscriptions to our cloud-based solutions and related customer support services. Subscription and support revenue accounted for 88%, 87% and 89% of our total revenue for the years ended December 31, 2015, 2014 and 2013, respectively. We price our products based on various customer usage measures, including the number of records in each customer's database and the number of user seats authorized to access our service. Our subscription contracts are typically one year in length, but we are increasingly selling contracts of longer duration, which range from two to three years in length.
Professional services revenue accounted for 12%, 13% and 11% of our total revenue for the years ended December 31, 2015, 2014 and 2013, respectively. Our solutions are designed to be ready to use immediately upon provisioning of a new customer subscription. However, we believe that our customers' success is enhanced by the effective use of marketing strategies performed with our software, which we foster primarily through the sale and delivery of expert services that educate our customers on the best use of our solutions. In addition, some of our customers require services to support integrating their existing systems with our solutions. Enterprise customers typically exhibit a higher demand for all of these services. We also partner with third party consulting organizations that provide similar services to our customers in connection with their use of our platform solutions. Our strategy is to increase the amount of services delivered by such third party consulting organizations, and we have had notable success growing the capabilities of our third party partners. As a result, we expect to see our professional services business grow in line with our subscription revenue growth, but not increase significantly as a percentage of total revenue.
Our customer base has grown from over 200 at the end of 2009 to 4,549 at the end of 2015, which has resulted in rapid revenue growth. We generate the majority of our revenue in the United States; however, we are focused on growing our international business. Revenue generated from our international customers was 15.3%, 16.1% and 14.5% of our total revenue in 2015, 2014 and 2013, respectively.
We have focused on rapidly growing our business and plan to continue to invest in growth. We expect our cost of revenue and operating expenses to continue to increase in absolute dollars in future periods. Marketing and sales expenses are expected to increase as we continue to expand our sales teams, increase our marketing activities and grow our international operations. Research and development expenses are expected to increase in absolute dollars to support the enhancement of our existing products and the development of new products. We also intend to invest in maintaining a high level of customer service and support which we consider critical for our continued success. We plan to continue investing in our data center infrastructure and services capabilities in order to support continued future customer growth. We also expect to incur additional general and administrative expenses as a result of both our growth and the infrastructure required to be a public company. Considering our plans for investment, we do not expect to be profitable in the near term and, in order to achieve profitability, we will need to grow revenue at a rate faster than our investments in cost of revenue and operating expenses.
We had net losses attributable to Marketo of $71.5 million, $54.3 million and $47.4 million for the years ended December 31, 2015, 2014 and 2013, respectively, primarily due to increased investments in our past and projected future growth.
Since our inception, we financed our operations through cash collected from customers through the sale of our products and solutions as well as preferred equity financings, our initial public offering and concurrent private placement completed in May 2013, and our follow-on public offering completed in September 2013. We also maintain a credit facility. As of December 31, 2015, we had outstanding borrowings of $2.7 million under this facility.
42
Key Business Metrics
We use the following key metrics to evaluate our business, measure our performance, identify trends affecting our business, formulate financial projections and make strategic decisions.
- •
- Number of
Customers. Since we launched our first product we have made the expansion of our customer base a priority. We believe that our ability
to expand our customer base especially in the enterprise segment is an indicator of our market penetration, the growth of our business and our potential future business opportunities. We define the
number of customers at the end of any particular period as the number of customers with paid subscriptions to our platform at the end of the period. Multiple companies or divisions within a single
consolidated enterprise that each have a separate paid subscription to our platform are each treated as a separate customer. In cases where our customers have subscriptions to our platform obtained
through resellers or other distributors, each end customer is counted separately. As of December 31, 2015, we had 4,549 customers.
- •
- Subscription Dollar Retention
Rate. We believe that our subscription dollar retention rate provides insight into our ability to retain and grow revenue from our
customers, as well as their potential long-term value to us. Accordingly, we compare the aggregate monthly subscription revenue of our customer base in the last month of the prior year fiscal quarter,
which we refer to as Retention Base Revenue, to aggregate monthly subscription revenue generated from the same group in the last month of the current quarter, which we refer to as Retained
Subscription Revenue. Our Subscription Dollar Retention Rate is calculated on an annual basis by first dividing Retained Subscription Revenue by Retention Base Revenue, and then using the weighted
average Subscription Dollar Retention Rate of the four fiscal quarters within the year. Our Subscription Dollar Retention Rate was approximately 105%, and 109% and 100% for 2015, 2014 and 2013,
respectively.
- •
- Calculated Billings. We believe calculated billings offers useful information regarding the performance of our business and provides a better understanding of the sales volumes. Calculated billings is calculated as revenue plus the change in total deferred revenue as presented on the balance sheet. Calculated billings were $238.9 million and $171.5 million for the years ended December 31, 2015 and 2014, respectively.
Seasonality, Cyclicality and Quarterly Trends
We have historically experienced seasonality in terms of when we enter into new customer agreements for our solutions. We sign a significantly higher percentage of agreements with new customers as well as renewal agreements with existing customers in the fourth quarter of each year as compared to any of the prior quarters. The first quarter and third quarter are typically the slowest in this regard. Furthermore, we usually sign a significant portion of these agreements during the last month, and often the last two weeks, of each quarter. This seasonality is reflected to a much lesser extent, and sometimes is not immediately apparent, in our revenue, because we recognize subscription revenue over the term of the contract, which is typically one year, but ranges from one to three years. Historical patterns should not be considered a reliable indicator of our future sales activity or performance.
Our revenue has increased over the periods presented due to increased sales to new customers, as well as increased usage of existing and new products by existing customers. Our operating expenses generally have increased sequentially in every quarter primarily due to increases in headcount and other related expenses to support our growth. We anticipate our operating expenses will continue to increase in absolute dollars in future periods as we invest in the long term growth of our business.
43
We may experience variances in the number of our customers over a particular quarter for a variety of reasons, and the extent to which we gain or lose customers over a particular quarter will not necessarily correlate to the changes in revenue in that quarter or in future periods. A slowdown in our ability to enter into customer agreements or to renew customer agreements may not be apparent in our revenue for the quarter, as the revenue recognized in any quarter is primarily from customer agreements entered into in prior quarters. In addition, each year we typically participate in several key industry trade shows, including our own annual user conference, which typically occurs in the second quarter of the fiscal year. The timing of these events can vary from year to year, and the costs associated with these events typically have a significant effect on our sales and marketing expenses for the applicable quarter and cause our quarterly results to fluctuate.
Key Components of Consolidated Statements of Operations
Revenue
We generate revenue principally from fixed commitment subscription contracts under which we provide customers with various services, principally access to our cloud-based platform as well as related customer support. We sell these services under contractual agreements that are typically one year in length, but can range from one to three years based upon the needs of the individual customer. We believe this flexibility in contract duration is important to meet the needs of customers of differing sizes and circumstances. A customer typically commits to fixed fees for the service term, which may be adjusted upward based on expanded usage volumes. Revenue from these agreements is recognized ratably over the period of service and any revenue that does not meet recognition criteria is recorded as deferred revenue on our balance sheet.
We invoice customers on varying billing cycles, primarily quarterly and annually; therefore, our deferred revenue balance represents the billed portion of our customer contracts. The customer mix that is billed quarterly or annually fluctuates from quarter to quarter and, therefore, billing frequency and deferred revenue is not fully predictable. In the fourth quarter of 2013, we changed our billing policy to invoice upon contract signature rather than on subscription start date. This change resulted in a $4.1 million increase in deferred revenue at December 31, 2013. Consequently, changes in deferred revenue may not be indicative of revenue growth in any given future period. Fees payable under our subscription contracts are generally due in full and non-refundable regardless of the actual use of the service.
Professional services revenue consists of fees associated with providing expert services that educate and assist our customers on the best use of our solutions as well as assist in the implementation of our solution. We charge a separate fixed fee for implementation and initial education for users of a new subscription. Most of our professional services contracts for our SMB customers are recognized over three to six months. Professional services for our enterprise customers are typically priced on a time-and-materials basis. We recognize revenue for these contracts as the work is performed, and the customer is billed. Our time-and-materials professional services are generally billed monthly in arrears based on actual hours of work delivered and expenses incurred.
Cost of Revenue
Cost of subscription and support revenue primarily consists of expenses related to hosting our service and providing support to our customers. These expenses are comprised of data center operations costs and personnel and related costs directly associated with our cloud infrastructure, customer support and customer success organizations, including salaries, benefits, bonuses and stock-based compensation, as well as allocated overhead. Overhead associated with facilities, information technology and depreciation, excluding depreciation related to our data center infrastructure, is allocated to our cost of revenue and operating expenses based on headcount.
44
Cost of professional services and other revenue consists primarily of personnel and related costs directly associated with our professional services and education organizations, including salaries, benefits, bonuses and stock-based compensation, the costs of sub-contracted third-party vendors, as well as allocated overhead.
Research and Development Expenses
Research and development expenses consist primarily of personnel costs for our product development employees and executives. Also included are non-personnel costs such as professional fees payable to third-party development services, license and subscription fees for software development tools, and an allocation of our general overhead expenses. A substantial portion of our research and development efforts are focused on enhancing our solution architecture and adding new features and functionality to our platform and we anticipate continuing to invest in innovation and technology development.
Sales and Marketing Expenses
Sales and marketing expenses consist primarily of personnel costs for our sales, marketing and business development employees and executives, including commissions earned by our sales and marketing personnel, which are expensed when a customer contract is executed. Also included are the costs of our lead generation marketing and brand awareness programs. Our marketing programs include a broad mix of paid marketing activities, such as digital content marketing, search engine marketing and social media marketing campaigns, including the use of our own marketing applications, as well as traditional offline advertising, direct mail and public relations. We also incur other non-personnel costs such as professional fees and an allocation of our general overhead expenses. In addition, we invest in several key industry events offered by our partners, as well as our own annual user conference.
General and Administrative Expenses
General and administrative expenses consist primarily of personnel costs for our administrative, legal, human resources, finance and accounting employees. Also included are non-personnel costs, such as legal and other professional fees and other corporate expenses, along with an allocation of our general overhead expenses. We expect to incur incremental costs associated with supporting the growth of our business, both in terms of size and geographical diversity, and to meet the increased compliance requirements associated with operating as a public company. Those costs include increases in our accounting, human resources, IT and legal personnel, additional consulting, legal and audit fees, insurance costs, board members' compensation and the costs of achieving and maintaining compliance with Section 404 of the Sarbanes-Oxley Act.
Other Income (Expense), Net
Other income (expense), net consists primarily of interest expense, interest income and foreign exchange gains and losses. Interest expense represents interest paid on debt from our credit facility and interest income represents interest received on our cash and investments. Foreign exchange gains and losses consist primarily of foreign exchange gains and losses due to remeasurement of monetary assets and liabilities denominated in non-functional currencies as well as realized gains and losses on foreign currency transactions.
Critical Accounting Policies and Significant Judgments and Estimates
Our management's discussion and analysis of financial condition and results of operations is based on our consolidated financial statements, which have been prepared in accordance with U.S. GAAP.
45
The preparation of these consolidated financial statements requires us to make estimates and assumptions that affect the reported amounts of assets and liabilities and the disclosure of contingent assets and liabilities at the date of the consolidated financial statements, as well as the reported revenue and expenses during the reporting periods. We evaluate our estimates and assumptions on an ongoing basis. Our estimates are based on historical experience and on various other factors that we believe are reasonable under the circumstances, the results of which form the basis for making judgments about the carrying value of assets and liabilities that are not readily apparent from other sources. Changes in estimates are reflected in reported results for the period in which they become known. Actual results may differ from these estimates.
Revenue Recognition
Revenue recognition commences when all of the following conditions are met:
- •
- Persuasive evidence of an arrangement exists;
- •
- Delivery or performance has occurred;
- •
- Fees are fixed or determinable; and
- •
- Collectability is reasonably assured.
In the majority of instances, revenue from new customers is generated under sales agreements with multiple elements, comprised of subscription and support fees from customers accessing our cloud-based application suite and professional consultation services. We evaluate each element in a multiple-element arrangement to determine whether it represents a separate unit of accounting. An element constitutes a separate unit of accounting when the delivered item has standalone value and delivery of the undelivered element is probable and within our control. Subscription and support have standalone value because they are routinely sold separately by us. Most of the professional services have standalone value because we have sold professional services separately, and there are several third party vendors that routinely provide similar professional services to our customers on a standalone basis. For professional services that do not have standalone value, revenue is recognized ratably over the related subscription period.
We allocate revenue to each element in an arrangement based on the selling price hierarchy. The selling price for a deliverable is based on the following: Selling price for a deliverable is based on its 1) vendor specific objective evidence ("VSOE"), if available, 2) third party evidence ("TPE"), if VSOE is not available, or 3) estimated selling price ("ESP"), if neither VSOE nor TPE is available. Because we have been unable to establish VSOE or TPE for the elements of our arrangements, we establish the ESP for each element primarily by considering the median of actual sales prices of each type of subscription and support sold and the weighted average of actual sales prices of professional services sold. For subscription and support arrangements, management considered other factors such as database sizes, pricing practices and market considerations.
Subscription and support revenue is recognized commencing upon delivery of our cloud-based services, which is the date a new subscription is provisioned and made available to a new customer, or new or expanded capabilities are provisioned and added to an existing subscription, provided that all of the other revenue recognition criteria are first met, referred to as the "Commencement Date". Subscription and support revenue is recognized from the Commencement Date ratably thereafter over the remaining contractual term. Amounts that have been invoiced are recorded in accounts receivable and in deferred revenue or revenue, depending on whether the revenue recognition criteria have been met.
Professional services and other have standalone value apart from the related subscription services. The majority of our professional services contracts are offered on a time and material basis. When
46
these services are not combined with subscription and support revenue in a multiple-element arrangement, services revenue is recognized as the services are rendered. Certain standard and non-standard professional service arrangements include customer acceptance provisions. Services provided under arrangements that include customer acceptance provisions are typically provided on a time and material basis, and the revenue is deferred and recognized upon customer acceptance of the service deliverable.
Our professional services also consist of short-term implementation services, which are offered at a flat fee. The enablement services teams assist customers with standard adoption procedures for our platform. Most such enablement services consist of short-term (usually spanning 120 days) "use it or lose it" services to assist customers with standard implementation and to implement the customer's first marketing campaign, which are offered at a flat fee. The flat fees are recognized over the 120 day period.
Sales and other taxes collected from customers to be remitted to government authorities are primarily reported on a net basis, where taxes collected are excluded from revenue.
Allowance for Doubtful Accounts
Trade accounts receivable are carried at the original invoiced amount less an allowance made for doubtful accounts. We maintain an allowance for doubtful accounts based on the probability of future collection. When we become aware of circumstances that may decrease the likelihood of collection, we record a specific allowance against amounts due which reduces the net receivable to the amount that management reasonably believes will be collected. For all other customers, we determine the adequacy of the allowance based on historical loss patterns, the number of days that billings are past due and an evaluation of the potential risk of loss associated with specific accounts. We review the allowance for doubtful accounts monthly and write off receivable balances which are deemed to be uncollectible. Increases in the allowance are recorded in general and administrative to expense in the period incurred. We do not have any off balance sheet credit exposure related to our customers.
Business Combinations
When we acquire businesses, we allocate the purchase price to tangible assets and liabilities, and identifiable intangible assets acquired. Any residual purchase price is recorded as goodwill. The allocation of the purchase price requires management to make significant estimates in determining the fair values of assets acquired and liabilities assumed, especially with respect to intangible assets. These estimates are based on historical experience and information obtained from the management of the acquired companies. These estimates can include, but are not limited to, the cash flows that an asset is expected to generate in the future, the appropriate weighted-average cost of capital, and the cost savings expected to be derived from acquiring an asset. These estimates are inherently uncertain and unpredictable. In addition, unanticipated events and circumstances may occur which may affect the accuracy or validity of such estimates. During the measurement period, which can be up to one year from the acquisition date, we may record adjustments to the assets acquired and liabilities assumed with the corresponding offset to goodwill. Upon the conclusion of the measurement period, any subsequent adjustments are recorded to earnings.
Goodwill and Other Intangible Assets
We review the carrying value of goodwill for impairment annually and whenever events or changes in circumstances indicate that the carrying value of goodwill may exceed its fair value. Conditions that could trigger a more frequent impairment assessment include, but are not limited to, a significant adverse change in certain agreements, significant underperformance relative to historical or projected future operating results, an economic downturn in customers' industries, increased competition, a
47
significant reduction in our stock price for a sustained period or a reduction of our market capitalization relative to the carrying value. Additionally, we are required to test our goodwill for impairment at the reporting unit level. Currently, our goodwill is evaluated at the entity level as there is only one reporting unit.
We have elected to bypass the qualitative assessment to determine whether it is more likely than not that the fair value of our single reporting unit is less than its carrying amount and proceed directly to perform the first step of the goodwill impairment test. The goodwill impairment test is a two-step process. The first step compares the fair value of each reporting unit with its respective carrying amount, including goodwill. If the fair value of the reporting unit exceeds its carrying amount, goodwill of the reporting unit is not considered to be impaired, and the second step of the impairment test is unnecessary. The second step in the goodwill impairment test compares the implied fair value of each reporting unit's goodwill with the respective carrying amount of that goodwill. If the carrying amount of the reporting unit goodwill exceeds the implied fair value of that goodwill, an impairment loss would be recognized in an amount equal to any such excess.
Determining the fair value of a reporting unit is subjective and requires judgment at many points during the test. Actual results may differ materially from these estimates. The estimates we make in determining the fair value of our reporting unit involve the application of judgment, which could affect the timing and size of any future impairment charges. Impairment of our goodwill could significantly affect our operating results and financial position. We have not recorded any such goodwill impairment charge for the years presented.
Finite-lived intangible assets are amortized over their estimated useful lives. We evaluate the recoverability of our intangible assets for possible impairment whenever events or circumstances indicate that the carrying amount of such assets may not be recoverable. Recoverability of these assets is measured by a comparison of the carrying amount to the future undiscounted cash flow the assets are expected to generate. If such review indicates that the carrying amount of the intangible asset is not recoverable, the carrying amount of such asset is reduced to fair value. Any write-downs are treated as permanent reductions in the carrying amount of the assets.
We also routinely review the remaining estimated useful lives of our finite-lived intangible assets. If we reduce the estimated useful life for an asset, the remaining unamortized balance would be amortized over the revised estimated useful life. We use judgment in evaluating whether events or circumstances indicate that useful lives should change or that the carrying value of assets has been impaired. Any resulting revision in the useful life or the amount of an impairment also requires judgment. Any of these judgments could affect the timing or size of any future impairment charges. Revision of useful lives or impairment charges could significantly affect our operating results and financial position. We have not recorded any such impairment charge for the years presented.
Income Taxes
As part of the process of preparing our consolidated financial statements we are required to estimate our taxes in each of the jurisdictions in which we operate. We account for income taxes in accordance with the asset and liability method. Under this method, deferred tax assets and liabilities are recognized based on temporary differences between the financial reporting and income tax bases of assets and liabilities and the tax effects of operating loss and credit carryforwards using the enacted tax rates expected to apply in the periods of expected settlement. In addition, this method requires a valuation allowance against net deferred tax assets if, based upon the available evidence, it is more likely than not that some or all of the deferred tax assets will not be realized.
48
Stock-Based Compensation
We account for stock-based compensation expense under the fair value recognition and measurement provision in accordance with the applicable standards which require all stock-based awards granted to employees to be measured based on the grant date fair value and amortized over the respective period during which the employee is required to provide service.
We measure compensation expense related to our stock options granted to employees and consultants and stock purchase rights provided under the Employee Stock Purchase Plan based upon the fair market value as of the grant date of the award using the Black-Scholes option-pricing model which require inputs of judgmental assumptions including the expected term of the award and stock price volatility. If any of the assumptions used in the fair value determination change significantly, stock-based compensation expense may differ materially. We recognize stock-based compensation cost as an expense ratably on a straight-line basis over the requisite service period which is generally the vesting period of the respective award.
We measure compensation expense related to our restricted stock units ("RSU") granted to employees based on the value of our common stock on the date of grants. RSUs granted prior to the IPO were subject to time-based vesting, which generally occurs over a period of four years, and a performance-based condition, which was satisfied upon our initial public offering. RSUs granted subsequent to the IPO are generally subject to time-based vesting, which generally occurs over a period of two or four years. In addition, we issued performance-based RSUs that vest upon the achievement of various milestones. We recognize the compensation cost for RSUs which contain performance conditions based upon the probability of that performance condition being met, over the respective time-based vesting period.
We measure compensation expense related to our market-performance based RSUs ("MSU") granted to certain of our executives based upon the fair market value as of the grant date of the award using the Monte Carlo valuation methodology. We recognize the stock-based compensation expense for each MSU award using the graded vesting method. Stock-based compensation expense associated with participants who fulfil their requisite service period is not reversed even if the performance conditions are not met. However, stock-based compensation expense is reversed for participants who forfeit their MSU awards prior to fulfilling their requisite service period.
We are required to recognize stock-based compensation expense for only awards that we expect to vest. We estimate forfeiture based on historical forfeitures of our stock-based awards and adjust our rate to reflect changes in facts and circumstances, if any. While the forfeiture rate used represent our best estimates, this estimates involves inherent uncertainties. To the extent the actual forfeitures differ from our estimates, stock-based compensation expense will be adjusted accordingly and may have a significant effect on our stock-based compensation expense.
Recently Adopted Accounting Standards
For recent accounting pronouncements, see Note 1 of our accompanying Notes to Consolidated Financial Statements included in Part II, Item 8, "Financial Statements and Supplementary Data" of this Annual Report on Form 10-K.
49
Results of Operations for 2015, 2014 and 2013
The following tables set forth our results of operations for the periods presented and as a percentage of our total revenue for those periods. The period-to-period comparison of financial results is not necessarily indicative of financial results to be achieved in future periods.
| |
Year Ended December 31, | |||||||||
|---|---|---|---|---|---|---|---|---|---|---|
| |
2015 | 2014 | 2013 | |||||||
Consolidated Statements of Operations Data: |
||||||||||
Revenue: |
||||||||||
Subscription and support |
87.5 | % | 87.4 | % | 88.7 | % | ||||
Professional services and other |
12.5 | 12.6 | 11.3 | |||||||
| | | | | | | | | | | |
Total revenue |
100.0 | 100.0 | 100.0 | |||||||
| | | | | | | | | | | |
Cost of revenue: |
||||||||||
Subscription and support |
19.4 | 19.2 | 25.7 | |||||||
Professional services and other |
15.0 | 14.7 | 13.9 | |||||||
| | | | | | | | | | | |
Total cost of revenue |
34.4 | 33.9 | 39.6 | |||||||
| | | | | | | | | | | |
Gross profit: |
||||||||||
Subscription and support |
68.2 | 68.2 | 63.0 | |||||||
Professional services and other |
–2.5 | –2.1 | –2.6 | |||||||
| | | | | | | | | | | |
Total gross profit |
65.6 | 66.1 | 60.4 | |||||||
| | | | | | | | | | | |
Operating expenses: |
||||||||||
Research and development |
18.6 | 20.2 | 24.3 | |||||||
Sales and marketing |
61.5 | 65.9 | 65.4 | |||||||
General and administrative |
18.1 | 17.1 | 19.4 | |||||||
| | | | | | | | | | | |
Total operating expenses |
98.3 | 103.2 | 109.2 | |||||||
| | | | | | | | | | | |
Loss from operations |
–32.6 | –37.1 | –48.8 | |||||||
Other income (expense), net |
0.0 | 0.1 | –0.5 | |||||||
| | | | | | | | | | | |
Loss before provision (benefit) for income taxes |
–32.6 | –37.0 | –49.3 | |||||||
Provision (benefit) for income taxes |
0.3 | –0.3 | 0.0 | |||||||
| | | | | | | | | | | |
Net loss |
–32.9 | –36.6 | –49.4 | |||||||
Net loss and adjustment attributable to redeemable non-controlling interests |
–1.2 | 0.4 | 0.0 | |||||||
| | | | | | | | | | | |
Net loss attributable to Marketo |
–34.1 | % | –36.2 | % | –49.4 | % | ||||
| | | | | | | | | | | |
| | | | | | | | | | | |
| | | | | | | | | | | |
Percentages are based on actual values. Totals may not sum due to rounding.
Year Ended December 31, 2015 Compared to Year Ended December 31, 2014
Revenue
| |
2015 | 2014 | $ Change | % Change | |||||||||
|---|---|---|---|---|---|---|---|---|---|---|---|---|---|
| |
(in thousands, except percentages) |
||||||||||||
Subscription and support |
$ | 183,658 | $ | 131,060 | $ | 52,598 | 40.1 | % | |||||
Professional services and other |
26,211 | 18,894 | 7,317 | 38.7 | % | ||||||||
| | | | | | | | | | | | | | |
Total revenue |
$ | 209,869 | $ | 149,954 | $ | 59,915 | 40.0 | % | |||||
| | | | | | | | | | | | | | |
| | | | | | | | | | | | | | |
| | | | | | | | | | | | | | |
Percentage of revenues: |
|||||||||||||
Subscription and support |
87.5 | % | 87.4 | % | |||||||||
Professional services and other |
12.5 | % | 12.6 | % | |||||||||
| | | | | | | | | | | | | | |
Total |
100.0 | % | 100.0 | % | |||||||||
| | | | | | | | | | | | | | |
| | | | | | | | | | | | | | |
| | | | | | | | | | | | | | |
50
| | | | | | | | | | | | | | | | | | |
|
|
Category |
|
Impact (in thousands) |
|
Key Drivers |
|
|||||||||||
|---|---|---|---|---|---|---|---|---|---|---|---|---|---|---|---|---|---|
| | | | | | | | | | | | | | | | | | |
|
Subscription and support |
á | $ | 52,598 | Increase in subscription and support revenue was primarily attributable to (1) growth in our total customer count and (2) growth in both usage rights (driven by higher use, consumption and/or database size of our products used by existing customers) and cross selling of additional products either during the term of their subscription or at the point of renewal of their subscription. Of the total increase in subscription and support revenue for the year ended December 31, 2015, 37% was attributable to revenue from new customers acquired after December 31, 2014, and 63% was attributable to revenue from customers existing on or before December 31, 2014. | ||||||||||||
| | | | | | | | | | | | | | | | | | |
|
Professional services and other |
á | 7,317 | Increase in professional services revenue resulted from increased demand for services across our customer base, particularly enterprise customers who typically have a higher demand for our services. | |||||||||||||
| | | | | | | | | | | | | | | | | | |
Cost of Revenue and Gross Margin
| |
2015 | 2014 | $ Change | % Change | |||||||||
|---|---|---|---|---|---|---|---|---|---|---|---|---|---|
| |
(in thousands, except percentages) |
||||||||||||
Cost of revenue: |
|||||||||||||
Subscription and support |
$ | 40,632 | $ | 28,742 | $ | 11,890 | 41.4 | % | |||||
Professional services and other |
31,484 | 22,059 | 9,425 | 42.7 | % | ||||||||
| | | | | | | | | | | | | | |
Total cost of revenue |
$ | 72,116 | $ | 50,801 | $ | 21,315 | 42.0 | % | |||||
| | | | | | | | | | | | | | |
| | | | | | | | | | | | | | |
| | | | | | | | | | | | | | |
Gross margin: |
|||||||||||||
Subscription and support |
77.9 | % | 78.1 | % | |||||||||
Professional services and other |
–20.1 | % | –16.8 | % | |||||||||
Total gross margin |
65.6 | % | 66.1 | % | |||||||||
51
Cost of subscription and support increased due to the following:
| | | | | | | | | | | | | | | | | | |
|
|
Category |
|
Impact (in thousands) |
|
Key Drivers |
|
|||||||||||
|---|---|---|---|---|---|---|---|---|---|---|---|---|---|---|---|---|---|
| | | | | | | | | | | | | | | | | | |
|
Personnel-related costs |
á | $ | 5,159 | Increase in salary and benefits costs resulting from an increase in headcount directly associated with our cloud infrastructure, customer support and customer success organizations to support our existing and new customers and an increase in stock-based compensation expense from additional equity awards to new and existing employees. | ||||||||||||
| | | | | | | | | | | | | | | | | | |
|
Depreciation and amortization |
á | 2,917 | Increase in depreciation and amortization expense primarily reflects the expansion of network capacity at our U.S. based co-location data center facilities and amortization of capitalized software costs. | |||||||||||||
| | | | | | | | | | | | | | | | | | |
|
Equipment maintenance |
á | 932 | Increase in equipment maintenance costs primarily relates to the increase in asset additions in our co-location data center facilities | |||||||||||||
| | | | | | | | | | | | | | | | | | |
|
Facilities and IT allocations |
á | 825 | Increase in the allocation of facilities and IT expenses was due principally to headcount growth in the subscription and support department and overall higher IT and facilities expenses. | |||||||||||||
| | | | | | | | | | | | | | | | | | |
|
Hosting costs |
á | 821 | Increase in hosting costs as a result of our increased use of our international managed hosting service provider. | |||||||||||||
| | | | | | | | | | | | | | | | | | |
|
Various other items |
á | 1,236 | Increase is due to various other insignificant items. | |||||||||||||
| | | | | | | | | | | | | | | | | | |
Our subscription and support gross margin was 77.9% and 78.1% for 2015 and 2014, respectively. Subscription and support gross margin remained relatively flat for 2015 as compared to 2014 primarily due to increased cost of subscription and support being substantially offset by increased subscription and support revenue.
We expect subscription and support gross margins to remain relatively flat in the future.
52
Cost of professional services and other increased due to the following:
| | | | | | | | | | | | | | | | | | |
|
|
Category |
|
Impact (in thousands) |
|
Key Drivers |
|
|||||||||||
|---|---|---|---|---|---|---|---|---|---|---|---|---|---|---|---|---|---|
| | | | | | | | | | | | | | | | | | |
|
Personnel-related costs |
á | $ | 7,883 | Increase in salary and benefit cost resulted from an increase in headcount as we continue to grow our professional services organization to support the increasing demand from our enterprise customers and an increase in stock-based compensation expenses from additional equity awards to new and existing employees. | ||||||||||||
| | | | | | | | | | | | | | | | | | |
|
Facilities and IT allocations |
á | 1,303 | Increase in the allocation of facilities and IT expenses was due principally to headcount growth in the professional services and other department and overall higher IT and facilities expenses. | |||||||||||||
| | | | | | | | | | | | | | | | | | |
|
Consulting |
â | (694 | ) | Decrease in consulting costs resulted from a decrease in use of outside contractors. | ||||||||||||
| | | | | | | | | | | | | | | | | | |
|
Various other items |
á | 933 | The increase was due to various other insignificant items. | |||||||||||||
| | | | | | | | | | | | | | | | | | |
Our professional services and other gross margin was (20.1)% and (16.8)% for 2015 and 2014, respectively. The decrease in gross margin for 2015 as compared to 2014 primarily reflects an increase in personnel-related costs to scale with the growth of our business.
We expect that cost of revenue for professional services as a percentage of total revenue could fluctuate from period to period depending on growth of our professional services business and any associated costs relating to the delivery of professional services, the timing of sales of products that have royalties associated with them and the timing of significant expenditures.
Research and Development
| |
2015 | 2014 | $ Change | % Change | |||||||||
|---|---|---|---|---|---|---|---|---|---|---|---|---|---|
| |
(in thousands, except percentages) |
||||||||||||
Research and development |
$ | 39,077 | $ | 30,337 | $ | 8,740 | 28.8 | % | |||||
Percentage of total revenue |
18.6 | % | 20.2 | % | |||||||||
53
Research and development expenses increased due to the following:
| | | | | | | | | | | | | | | | | | |
|
|
Category |
|
Impact (in thousands) |
|
Key Drivers |
|
|||||||||||
|---|---|---|---|---|---|---|---|---|---|---|---|---|---|---|---|---|---|
| | | | | | | | | | | | | | | | | | |
|
Personnel-related costs |
á | $ | 7,800 | Increase in salary and benefits costs was primarily driven by the increase in headcount to support the enhancement of our existing products and the development of new products and an increase in stock-based compensation expenses from additional equity awards to new and existing employees. | ||||||||||||
| | | | | | | | | | | | | | | | | | |
|
Depreciation and amortization |
á | 555 | Increase in depreciation and amortization expense primarily reflected the expansion of network capacity at our U.S. based co-location data center facilities and amortization of capitalized software costs. A portion of the depreciation expense was allocated to the research and development department as it uses server space related to its internal projects. | |||||||||||||
| | | | | | | | | | | | | | | | | | |
|
Facilities and IT allocations |
á | 968 | Increase in the allocation of facilities and IT expenses was due principally to headcount growth in the research and development department and overall higher IT and facilities expenses. | |||||||||||||
| | | | | | | | | | | | | | | | | | |
|
Capitalized software |
â | (1,250 | ) | Increase in capitalized costs was due to larger capitalizable projects undertaken in 2015, particularly projects relating to our acquisition in December 2014 | ||||||||||||
| | | | | | | | | | | | | | | | | | |
|
Various other items |
á | 667 | Increase was due to various other insignificant items. | |||||||||||||
| | | | | | | | | | | | | | | | | | |
We believe that continued investment in our technology is important for our future growth, and, as a result, we expect research and development expenses to increase in absolute dollars, and to decrease slightly, as a percentage of total revenue.
Sales and Marketing
| |
2015 | 2014 | $ Change | % Change | |||||||||
|---|---|---|---|---|---|---|---|---|---|---|---|---|---|
| |
(in thousands, except percentages) |
||||||||||||
Sales and marketing |
$ | 129,072 | $ | 98,843 | $ | 30,229 | 30.6 | % | |||||
Percentage of total revenue |
61.5 | % | 65.9 | % | |||||||||
54
Sales and marketing expenses increased due to the following:
| | | | | | | | | | | | | | | | | | |
|
|
Category |
|
Impact (in thousands) |
|
Key Drivers |
|
|||||||||||
|---|---|---|---|---|---|---|---|---|---|---|---|---|---|---|---|---|---|
| | | | | | | | | | | | | | | | | | |
|
Personnel-related costs |
á | $ | 18,597 | Increase in salary, benefit, and recruiting costs was primarily driven by an increase in headcount among our sales, marketing and business development employees and executives and an increase in stock-based compensation expenses from additional equity awards to new and existing employees. | ||||||||||||
| | | | | | | | | | | | | | | | | | |
|
Commissions |
á | 2,298 | Increase in commission expense primarily reflected an increase in new customer acquisitions and increased subscription services to existing customers. | |||||||||||||
| | | | | | | | | | | | | | | | | | |
|
Marketing programs |
á | 3,051 | Increase in marketing program costs reflected increased activity to support growth in our business. | |||||||||||||
| | | | | | | | | | | | | | | | | | |
|
Facilities and IT allocations |
á | 3,638 | Increase in the allocation of facilities and IT expenses was due principally to headcount growth in the sales and marketing department and overall higher IT and facilities expenses. | |||||||||||||
| | | | | | | | | | | | | | | | | | |
|
Travel and entertainment |
á | 1,555 | Increase in travel costs reflected the expansion of our enterprise sales efforts and increased international sales and marketing efforts. | |||||||||||||
| | | | | | | | | | | | | | | | | | |
|
Various other items |
á | 1,090 | Increase was due to various other insignificant items. | |||||||||||||
| | | | | | | | | | | | | | | | | | |
We expect sales and marketing expenses to increase in absolute dollars and remain our largest expense in absolute dollars, but may fluctuate as a percentage of revenue.
General and Administrative
| |
2015 | 2014 | $ Change | % Change | |||||||||
|---|---|---|---|---|---|---|---|---|---|---|---|---|---|
| |
(in thousands, except percentages) |
||||||||||||
General and administrative |
$ | 38,056 | $ | 25,583 | $ | 12,473 | 48.8 | % | |||||
Percentage of total revenue |
18.1 | % | 17.1 | % | |||||||||
55
General and administrative expenses increased due to the following:
| | | | | | | | | | | | | | | | | | |
|
|
Category |
|
Impact (in thousands) |
|
Key Drivers |
|
|||||||||||
|---|---|---|---|---|---|---|---|---|---|---|---|---|---|---|---|---|---|
| | | | | | | | | | | | | | | | | | |
|
Personnel-related costs |
á | $ | 10,638 | Increase in salary, benefit and recruiting costs was primarily driven by an increase in headcount among our administrative, legal, human resources, finance and accounting departments and an increase in stock-based compensation reflects grants of additional equity awards to new and existing employees. | ||||||||||||
| | | | | | | | | | | | | | | | | | |
|
Consulting |
á | 1,036 | Increase in consulting costs reflected an overall increase in the usage of outside contractors. | |||||||||||||
| | | | | | | | | | | | | | | | | | |
|
Various other items |
á | 799 | Increase was due to various other insignificant items. | |||||||||||||
| | | | | | | | | | | | | | | | | | |
We expect that our general and administrative expenses will increase in absolute dollars as we continue to expand our business and infrastructure to support being a public company, but may fluctuate as a percentage of revenue in the future.
Other Income (Expense), net
| |
2015 | 2014 | $ Change | % Change | |||||||||
|---|---|---|---|---|---|---|---|---|---|---|---|---|---|
Other income (expense), net |
$ | 81 | $ | 178 | $ | (97 | ) | –54.5 | % | ||||
Percentage of total revenue |
0.0 | % | 0.1 | % | |||||||||
Other income (expense), net fluctuated due to the following:
| | | | | | | | | | | | | | | | | | |
|
|
Category |
|
Impact (in thousands) |
|
Key Drivers |
|
|||||||||||
|---|---|---|---|---|---|---|---|---|---|---|---|---|---|---|---|---|---|
| | | | | | | | | | | | | | | | | | |
|
Foreign exchange gain |
â | $(236 | ) | Decrease in foreign exchange gains was due to smaller fluctuations in currency exchange rates between the Euro, US dollar, Australian dollar and the British pound as compared to the prior year | ||||||||||||
| | | | | | | | | | | | | | | | | | |
|
Various other items |
á | 139 | Increase was due to various other insignificant items. | |||||||||||||
| | | | | | | | | | | | | | | | | | |
Provision (Benefit) for Income Taxes
| |
2015 | 2014 | $ Change | % Change | |||||||||
|---|---|---|---|---|---|---|---|---|---|---|---|---|---|
| |
(in thousands, except percentages) |
||||||||||||
Provision (benefit) for income taxes |
$ | 708 | $ | (477 | ) | $ | 1,185 | 248.4 | % | ||||
Percentage of total revenue |
0.3 | % | 0.3 | % | |||||||||
We recognized an expense for income taxes of $0.7 million during 2015 as compared to a benefit of $0.5 million during 2014. We recognized an expense for income taxes during 2015 primarily related to our provision for foreign income taxes. Our provision for income taxes during 2014 was primarily related to the partial release of our valuation allowance related to acquisitions, partially offset by our provision for foreign income taxes.
56
Net Loss and Adjustment Attributable to Redeemable Non-Controlling Interests
| |
2015 | 2014 | $ Change | % Change | |||||||||
|---|---|---|---|---|---|---|---|---|---|---|---|---|---|
| |
(in thousands, except percentages) |
||||||||||||
Net loss and adjustment attributable to redeemable non-controlling interests |
$ | (2,418 | ) | $ | 618 | $ | (3,036 | ) | 491.3 | % | |||
Percentage of total revenue |
1.2 | % | 0.4 | % | |||||||||
Net loss attributable to redeemable non-controlling interests fluctuated due to the following:
| | | | | | | | | | | | | | | | | | |
|
|
Category |
|
Impact (in thousands) |
|
Key Drivers |
|
|||||||||||
|---|---|---|---|---|---|---|---|---|---|---|---|---|---|---|---|---|---|
| | | | | | | | | | | | | | | | | | |
|
Net loss attributable to non-controlling interests |
á | $ | 1,027 | Increase in net loss attributable to redeemable non-controlling interests primarily reflects an increase in losses in our joint venture Marketo KK. | ||||||||||||
| | | | | | | | | | | | | | | | | | |
|
Adjustment to non-controlling interests |
â | (4,063 | ) | Increase in adjustment to non-controlling interests for increase in the estimated redemption value. | ||||||||||||
| | | | | | | | | | | | | | | | | | |
Year Ended December 31, 2014 Compared to Year Ended December 31, 2013
Revenue
| |
2014 | 2013 | $ Change | % Change | |||||||||
|---|---|---|---|---|---|---|---|---|---|---|---|---|---|
| |
(in thousands, except percentages) |
||||||||||||
Subscription and support |
$ | 131,060 | $ | 85,095 | $ | 45,965 | 54.0 | % | |||||
Professional services and other |
18,894 | 10,823 | 8,071 | 74.6 | % | ||||||||
| | | | | | | | | | | | | | |
Total revenue |
$ | 149,954 | $ | 95,918 | $ | 54,036 | 56.3 | % | |||||
| | | | | | | | | | | | | | |
| | | | | | | | | | | | | | |
| | | | | | | | | | | | | | |
Percentage of revenues: |
|||||||||||||
Subscription and support |
87.4 | % | 88.7 | % | |||||||||
Professional services and other |
12.6 | % | 11.3 | % | |||||||||
| | | | | | | | | | | | | | |
Total |
100.0 | % | 100.0 | % | |||||||||
| | | | | | | | | | | | | | |
| | | | | | | | | | | | | | |
| | | | | | | | | | | | | | |
57
| | | | | | | | | | | | | | | | | | |
|
|
Category |
|
Impact (in thousands) |
|
Key Drivers |
|
|||||||||||
|---|---|---|---|---|---|---|---|---|---|---|---|---|---|---|---|---|---|
| | | | | | | | | | | | | | | | | | |
|
Subscription and support |
á | $ | 45,965 | Increase in subscription and support revenue was primarily attributable to (1) growth in our total customer count primarily from the SMB market, (2) growth in both usage rights (driven by higher use, consumption and/or database size of our products used by existing customers) and cross sell of additional products either during the term of their subscription or at the point of renewal of their subscription and (3) higher customer retention rates. Of the total increase in subscription and support revenue for 2014, 32% was attributable to revenue from new customers acquired after December 31, 2013, and 68% was attributable to revenue from customers existing on or before December 31, 2013. | ||||||||||||
| | | | | | | | | | | | | | | | | | |
|
Professional services and other |
á | 8,071 | Increase in professional services revenue resulted from increased demand for services across our customer base. | |||||||||||||
| | | | | | | | | | | | | | | | | | |
Cost of Revenue and Gross Margin
| |
2014 | 2013 | $ Change | % Change | |||||||||
|---|---|---|---|---|---|---|---|---|---|---|---|---|---|
| |
(in thousands, except percentages) |
||||||||||||
Cost of revenue: |
|||||||||||||
Subscription and support |
$ | 28,742 | $ | 24,681 | $ | 4,061 | 16.5 | % | |||||
Professional services and other |
22,059 | 13,298 | 8,761 | 65.9 | % | ||||||||
| | | | | | | | | | | | | | |
Total cost of revenue |
$ | 50,801 | $ | 37,979 | $ | 12,822 | 33.8 | % | |||||
| | | | | | | | | | | | | | |
| | | | | | | | | | | | | | |
| | | | | | | | | | | | | | |
Gross margin: |
|||||||||||||
Subscription and support |
78.1 | % | 71.0 | % | |||||||||
Professional services and other |
–16.8 | % | –22.9 | % | |||||||||
Total gross margin |
66.1 | % | 60.4 | % | |||||||||
58
Cost of subscription and support increased due to the following:
| | | | | | | | | | | | | | | | | | |
|
|
Category |
|
Impact (in thousands) |
|
Key Drivers |
|
|||||||||||
|---|---|---|---|---|---|---|---|---|---|---|---|---|---|---|---|---|---|
| | | | | | | | | | | | | | | | | | |
|
Personnel-related costs |
á | $ | 2,740 | Increase in salary and benefits costs resulted from an increase in headcount directly associated with our cloud infrastructure, customer support and customer success organizations to support our customer growth and an increase in stock-based compensation, which reflects grants of additional equity awards to existing employees and of equity awards to new employees. | ||||||||||||
| | | | | | | | | | | | | | | | | | |
|
Depreciation and amortization |
á | 2,725 | Increase in depreciation and amortization expense, software subscription expense and | |||||||||||||
| | | | | | | | | | | | | | | | | | |
|
Software subscriptions |
á | 514 | equipment maintenance reflects the completion of our transition to our U.S. based co-location data | |||||||||||||
| | | | | | | | | | | | | | | | | | |
|
Equipment maintenance |
á | 508 | center facilities at the end of fiscal 2013, where we now manage our own computer equipment and systems. | |||||||||||||
| | | | | | | | | | | | | | | | | | |
|
Facilities and IT allocations |
á | 549 | Increase in the allocation of facility and IT expenses was due principally to headcount growth in the subscription and support department and overall higher IT and facilities expenses. | |||||||||||||
| | | | | | | | | | | | | | | | | | |
|
Hosting costs |
â | (3,724 | ) | Decrease in hosting costs as a result of our decreased use of a managed hosting service provider due to the completion of the transition to our own U.S. based co-location data center facilities. | ||||||||||||
| | | | | | | | | | | | | | | | | | |
|
Various other items |
á | 749 | Increase was due to various other insignificant items. | |||||||||||||
| | | | | | | | | | | | | | | | | | |
Our subscription and support gross margin was 78.1% and 71.0% for 2014 and 2013, respectively. The increase in subscription and support gross margin primarily reflects the transition to our own co-location data center facilities from a managed hosting service provider which we completed at the end of fiscal 2013.
59
Cost of professional services and other increased due to the following:
| | | | | | | | | | | | | | | | | | |
|
|
Category |
|
Impact (in thousands) |
|
Key Drivers |
|
|||||||||||
|---|---|---|---|---|---|---|---|---|---|---|---|---|---|---|---|---|---|
| | | | | | | | | | | | | | | | | | |
|
Personnel-related costs |
á | $ | 6,190 | Increase in salary and benefit cost resulted from an increase in headcount as we continue to grow our professional services organization to support demand for expert marketing services and an increase in stock-based compensation which reflects grants of additional equity awards to existing employees and of equity awards to new employees. | ||||||||||||
| | | | | | | | | | | | | | | | | | |
|
Consulting |
á | 786 | Increase in consulting costs reflected an overall increase in the usage of outside contractors. | |||||||||||||
| | | | | | | | | | | | | | | | | | |
|
Travel and entertainment |
á | 860 | Increase in travel expense reflected increased travel associated with providing client support services. | |||||||||||||
| | | | | | | | | | | | | | | | | | |
|
Facilities and IT allocations |
á | 681 | Increase in the allocation of facilities and IT expenses was due principally to headcount growth in the professional services and other department and overall higher IT and facilities expenses. | |||||||||||||
| | | | | | | | | | | | | | | | | | |
|
Various other items |
á | 244 | The increase was due to various other insignificant items. | |||||||||||||
| | | | | | | | | | | | | | | | | | |
Our professional services and other gross margin was (16.8)% and (22.9)% for 2014 and 2013, respectively. The improvement in gross margin was primarily due to improved staff utilization resulting primarily from higher demand for professional services from our customers.
Research and Development
| |
2014 | 2013 | $ Change | % Change | |||||||||
|---|---|---|---|---|---|---|---|---|---|---|---|---|---|
| |
(in thousands, except percentages) |
||||||||||||
Research and development |
$ | 30,337 | $ | 23,321 | $ | 7,016 | 30.1 | % | |||||
Percentage of total revenue |
20.2 | % | 24.3 | % | |||||||||
60
Research and development expenses increased due to the following:
| | | | | | | | | | | | | | | | | | |
|
|
Category |
|
Impact (in thousands) |
|
Key Drivers |
|
|||||||||||
|---|---|---|---|---|---|---|---|---|---|---|---|---|---|---|---|---|---|
| | | | | | | | | | | | | | | | | | |
|
Personnel-related costs |
á | $ | 5,154 | Increase in salary and benefits costs resulting from the increase in headcount to help continue the enhancement of our existing product suite and to a lesser extent, an increase in headcount from our acquisition of Insightera in December 2013 and an increase in stock-based compensation, which reflects grants of additional equity awards to existing employees and of equity awards to new employees. | ||||||||||||
| | | | | | | | | | | | | | | | | | |
|
Depreciation and amortization |
á | 1,128 | Increase in depreciation and amortization expense reflects the completion of our transition to our U.S. based co-location data center facilities at the end of fiscal 2013, where we now manage our own computer equipment and systems. A portion of the depreciation expense is allocated to the research and development department as it uses server space related to its internal projects. | |||||||||||||
| | | | | | | | | | | | | | | | | | |
|
Facilities and IT allocations |
á | 420 | Increase in the allocation of facilities and IT expenses was due principally to headcount growth in the research and development department overall higher IT and facilities expenses. | |||||||||||||
| | | | | | | | | | | | | | | | | | |
|
Consulting |
á | 338 | Increase in consulting fees, mostly related to sub-contracted development, reflects the use of more outside contractors. | |||||||||||||
| | | | | | | | | | | | | | | | | | |
|
Various other items |
â | (24 | ) | Decrease was due to various other insignificant items. | ||||||||||||
| | | | | | | | | | | | | | | | | | |
Sales and Marketing
| |
2014 | 2013 | $ Change | % Change | |||||||||
|---|---|---|---|---|---|---|---|---|---|---|---|---|---|
| |
(in thousands, except percentages) |
||||||||||||
Sales and marketing |
$ | 98,843 | $ | 62,769 | $ | 36,074 | 57.5 | % | |||||
Percentage of total revenue |
65.9 | % | 65.4 | % | |||||||||
61
Sales and marketing expenses increased due to the following:
| | | | | | | | | | | | | | | | | | |
|
|
Category |
|
Impact (in thousands) |
|
Key Drivers |
|
|||||||||||
|---|---|---|---|---|---|---|---|---|---|---|---|---|---|---|---|---|---|
| | | | | | | | | | | | | | | | | | |
|
Personnel-related costs |
á | $ | 21,207 | Increase in salary and benefit costs was primarily driven by an increase in headcount among our sales, marketing and business development employees and executives and an increase in stock-based compensation reflects grants of additional equity awards to existing employees and of equity awards to new employees. | ||||||||||||
| | | | | | | | | | | | | | | | | | |
|
Commissions |
á | 2,934 | Increase in commission expense primarily reflects an increase in new customer acquisitions. | |||||||||||||
| | | | | | | | | | | | | | | | | | |
|
Marketing programs |
á | 5,506 | Increase in marketing program costs reflects increased activity to support growth in our business. | |||||||||||||
| | | | | | | | | | | | | | | | | | |
|
Facilities and IT allocations |
á | 2,331 | Increase in the allocation of facilities and IT expenses was due principally to headcount growth in the sales and marketing department and overall higher IT and facilities expenses. | |||||||||||||
| | | | | | | | | | | | | | | | | | |
|
Travel and entertainment |
á | 1,929 | Increase in travel costs reflects the expansion of our enterprise sales efforts and increased international sales and marketing efforts. | |||||||||||||
| | | | | | | | | | | | | | | | | | |
|
Depreciation and amortization |
á | 739 | Increase in depreciation and amortization in part reflects an increase in the allocation of depreciation expense driven by headcount growth in the sales and marketing department. | |||||||||||||
| | | | | | | | | | | | | | | | | | |
|
Consulting |
á | 676 | Increase in consulting fees reflects increased use of outside consultants to support growth in our business. | |||||||||||||
| | | | | | | | | | | | | | | | | | |
|
Various other items |
á | 752 | Increase is due to various other insignificant items. | |||||||||||||
| | | | | | | | | | | | | | | | | | |
General and Administrative
| |
2014 | 2013 | $ Change | % Change | |||||||||
|---|---|---|---|---|---|---|---|---|---|---|---|---|---|
| |
(in thousands, except percentages) |
||||||||||||
General and administrative |
$ | 25,583 | $ | 18,655 | $ | 6,928 | 37.1 | % | |||||
Percentage of total revenue |
17.1 | % | 19.4 | % | |||||||||
General and administrative expenses increased due to the following:
| | | | | | | | | | | | | | | | | | |
|
|
Category |
|
Impact (in thousands) |
|
Key Drivers |
|
|||||||||||
|---|---|---|---|---|---|---|---|---|---|---|---|---|---|---|---|---|---|
| | | | | | | | | | | | | | | | | | |
|
Personnel-related costs |
á | $ | 6,029 | Increase in salary and benefit costs was primarily driven by an increase in headcount for our administrative, legal, human resources, finance and accounting departments and an increase in stock-based compensation reflects grants of additional equity awards to existing employees and of equity awards to new employees. | ||||||||||||
| | | | | | | | | | | | | | | | | | |
|
Recruiting |
á | 675 | Increase in recruiting costs reflected a higher usage of outside recruiters. | |||||||||||||
| | | | | | | | | | | | | | | | | | |
|
Various other items |
á | 224 | Increase was due to various other insignificant items. | |||||||||||||
| | | | | | | | | | | | | | | | | | |
62
Other Income (Expense), net
| |
2014 | 2013 | $ Change | % Change | |||||||||
|---|---|---|---|---|---|---|---|---|---|---|---|---|---|
| |
(in thousands, except percentages) |
||||||||||||
Other income (expense), net |
$ | 178 | $ | (526 | ) | $ | 704 | 133.8 | % | ||||
Percentage of total revenue |
0.1 | % | 0.5 | % | |||||||||
Other income (expense), net fluctuated due to the following:
| | | | | | | | | | | | | | | | | | |
|
|
Category |
|
Impact (in thousands) |
|
Key Drivers |
|
|||||||||||
|---|---|---|---|---|---|---|---|---|---|---|---|---|---|---|---|---|---|
| | | | | | | | | | | | | | | | | | |
|
Foreign exchange gain (loss) |
á | $725 | We recognized foreign exchange gains as the US dollar strengthened against the Euro, Shekel and other foreign currencies in 2014. | |||||||||||||
| | | | | | | | | | | | | | | | | | |
|
Various other items |
â | (21 | ) | Increase was due to various other insignificant items. | ||||||||||||
| | | | | | | | | | | | | | | | | | |
Provision (Benefit) for Income Taxes
| |
2014 | 2013 | $ Change | % Change | |||||||||
|---|---|---|---|---|---|---|---|---|---|---|---|---|---|
| |
(in thousands, except percentages) |
||||||||||||
Provision (benefit) for income taxes |
$ | (477 | ) | $ | 28 | $ | (505 | ) | 1803.6 | % | |||
Percentage of total revenue |
0.3 | % | 0.0 | % | |||||||||
We recognized a benefit for income taxes of $(477,000) during 2014 as compared to a provision for income taxes of $28,000 during 2013. We recognized a benefit for income taxes during 2014 primarily related to the partial release of our valuation allowance related to acquisitions, partially offset by our provision for foreign income taxes. Our provision for income taxes during 2013 was primarily related to state minimum taxes and foreign income taxes.
Net Loss and Adjustment Attributable to Redeemable Non-Controlling Interests
| |
2014 | 2013 | $ Change | % Change | |||||||||
|---|---|---|---|---|---|---|---|---|---|---|---|---|---|
| |
(in thousands, except percentages) |
||||||||||||
Net loss and adjustment attributable to redeemable non-controlling interests |
$ | 618 | $ | — | $ | 618 | N/A | ||||||
Percentage of total revenue |
0.4 | % | 0.0 | % | |||||||||
Increase in net loss attributable to redeemable non-controlling interest is related to the redeemable non-controlling interests' share of losses associated with our joint venture in Marketo KK.
Liquidity and Capital Resources
To date, we have financed our operations through cash collected from customers as well as preferred equity financings, our initial public offering ("IPO") and concurrent private placement completed in May 2013, and our follow-on public offering completed in September 2013. We also maintain a credit facility. As of December 31, 2015 and 2014, we had $107.2 million and $112.6 million, respectively, of cash and cash equivalents, most of which was held in money market accounts.
63
The table below, for the periods presented, provides selected cash flow information:
| |
Year Ended December 31, | |||||||||
|---|---|---|---|---|---|---|---|---|---|---|
| |
2015 | 2014 | 2013 | |||||||
| |
(in thousands) |
|||||||||
Net cash provided by (used in) operating activities |
$ | 2,250 | $ | (14,023 | ) | $ | (12,369 | ) | ||
Net cash used in investing activities |
(17,081 | ) | (8,697 | ) | (18,076 | ) | ||||
Net cash provided by financing activities |
9,809 | 8,339 | 114,427 | |||||||
Net (decrease) increase in cash and cash equivalents, net of impact of foreign exchange rates on cash |
(5,426 | ) | (15,655 | ) | 84,052 | |||||
Net cash provided by (used in) operating activities.
Cash provided by (used in) operating activities is significantly influenced by the amount of cash we invest in personnel and infrastructure to support the anticipated growth of our business, the increase in the number of customers using our cloud-based solutions and services, and the amount and timing of customer receipts and vendor payments. Cash used in operating activities has historically come from a net loss driven by sales of subscriptions to our solutions and adjusted for non-cash expenses items, such as depreciation of property and equipment, and amortization of stock-based compensation and acquired intangible assets. The percentage of customers that pay quarterly rather than annually changes every quarter. The percentage of customers who pay us quarterly has a material impact on our net cash provided by (used in) operating activities.
64
2015
| | | | | | | | | | | | | | | | | | |
|
|
Factor |
|
Impact (in millions) |
|
Key Drivers |
|
|||||||||||
|---|---|---|---|---|---|---|---|---|---|---|---|---|---|---|---|---|---|
| | | | | | | | | | | | | | | | | | |
|
Net loss |
â | $ | (69.1 | ) | Cash used in operating activities during 2015 primarily reflected our net loss. | |||||||||||
| | | | | | | | | | | | | | | | | | |
|
Depreciation and amortization |
á | 13.9 | Add back of non-cash depreciation and amortization expense. | |||||||||||||
| | | | | | | | | | | | | | | | | | |
|
Stock-based compensation |
á | 39.2 | Add back of non-cash stock based compensation expense. | |||||||||||||
| | | | | | | | | | | | | | | | | | |
|
Deferred revenue |
á | 29.7 | Increase in deferred revenue, resulting primarily from the addition of new customers invoiced during the period, cross selling of additional products and increased usage of existing products to existing customers and customer mix of more annual versus quarterly billing invoiced during the period. | |||||||||||||
| | | | | | | | | | | | | | | | | | |
|
Accounts receivable |
â | (14.0 | ) | Increase in accounts receivable primarily reflects the timing of billings and higher level of sales, which was partially offset by an improvement in days sales outstanding from 81 days sales outstanding during the fourth quarter of 2014 to 79 days sales outstanding in the fourth quarter of 2015. | ||||||||||||
| | | | | | | | | | | | | | | | | | |
|
Prepaid and other current assets |
â | (4.5 | ) | Increase in prepaid expenses and other current assets primarily reflected prepaid costs related to amounts paid for annual subscription software services, prepaid maintenance contracts and prepaid insurance. | ||||||||||||
| | | | | | | | | | | | | | | | | | |
|
Accounts payable |
á | 1.6 | Increase in accounts payable reflects the timing of payment of vendor invoices. | |||||||||||||
| | | | | | | | | | | | | | | | | | |
|
Accrued expenses and other current liabilities |
á | 5.2 | Increase in accrued expenses and other current liabilities primarily reflects an increase in accrued bonuses and vacation payable. | |||||||||||||
| | | | | | | | | | | | | | | | | | |
|
Various other items |
á | 0.3 | Increase is due to various other insignificant items. | |||||||||||||
| | | | | | | | | | | | | | | | | | |
65
2014
| | | | | | | | | | | | | | | | | | |
|
|
Factor |
|
Impact (in millions) |
|
Key Drivers |
|
|||||||||||
|---|---|---|---|---|---|---|---|---|---|---|---|---|---|---|---|---|---|
| | | | | | | | | | | | | | | | | | |
|
Net loss |
â | $ | (55.0 | ) | Cash used in operating activities during 2014 primarily reflected our net loss. | |||||||||||
| | | | | | | | | | | | | | | | | | |
|
Depreciation and amortization |
á | 9.5 | Add back of non-cash depreciation and amortization expense. | |||||||||||||
| | | | | | | | | | | | | | | | | | |
|
Stock-based compensation |
á | 25.1 | Add back of non-cash stock based compensation expense. | |||||||||||||
| | | | | | | | | | | | | | | | | | |
|
Deferred revenue |
á | 22.4 | Increase in deferred revenue, resulting primarily from the addition of new customers invoiced during the period and to a lesser extent, cross sell of additional products to existing customers. | |||||||||||||
| | | | | | | | | | | | | | | | | | |
|
Accounts receivable |
â | (11.8 | ) | Increase in accounts receivable due to higher customer billings related to the increase in the number of customers during the year, which was partially offset by an improvement in days sales outstanding from 87 days sales outstanding during the fourth quarter of 2013 to 81 days sales outstanding in the fourth quarter of 2014. | ||||||||||||
| | | | | | | | | | | | | | | | | | |
|
Prepaid and other current assets |
â | (1.4 | ) | Increase to prepaid expenses and other current assets, in part related to an increase of prepayments made for subscription software services which are amortized over contracted service period and increase in prepayments towards insurance premiums. | ||||||||||||
| | | | | | | | | | | | | | | | | | |
|
Accrued expenses and other current liabilities |
â | (1.6 | ) | Decrease in accrued expenses and other current liabilities primarily related to a decrease in accrued payroll-related costs which includes accrued bonus. | ||||||||||||
| | | | | | | | | | | | | | | | | | |
|
Various other items |
â | (1.2 | ) | Decrease is due to various other insignificant items. | ||||||||||||
| | | | | | | | | | | | | | | | | | |
66
2013
| | | | | | | | | | | | | | | | | | |
|
|
Factor |
|
Impact (in millions) |
|
Key Drivers |
|
|||||||||||
|---|---|---|---|---|---|---|---|---|---|---|---|---|---|---|---|---|---|
| | | | | | | | | | | | | | | | | | |
|
Net loss |
â | $ | (47.4 | ) | Cash used in operating activities during 2013 primarily reflected our net loss | |||||||||||
| | | | | | | | | | | | | | | | | | |
|
Depreciation and amortization |
á | 4.6 | Add back of non-cash depreciation and amortization expense | |||||||||||||
| | | | | | | | | | | | | | | | | | |
|
Stock-based compensation |
á | 8.1 | Add back of non-cash stock based compensation expense | |||||||||||||
| | | | | | | | | | | | | | | | | | |
|
Deferred revenue |
á | 20.4 | Increase in deferred revenue, resulting primarily from the addition of new customers invoiced during the period (including a $4.1 million increase from a change in billing policy to invoice upon contract signature rather than subscription start date) and an increase in customers opting for annual payment terms | |||||||||||||
| | | | | | | | | | | | | | | | | | |
|
Accounts receivable |
â | 13.2 | Increase in accounts receivable due to higher customer billings related to the increase in the number of customers during the year (including a $4.1 million increase from a change in billing policy to invoice upon contract signature rather than subscription start date), coupled with an increase in days sales outstanding from 76 days during the fourth quarter of 2012 to 87 days during the fourth quarter of 2013. | |||||||||||||
| | | | | | | | | | | | | | | | | | |
|
Accounts payable |
á | 2.1 | Increase in accounts payable and accrued expenses and other current | |||||||||||||
| | | | | | | | | | | | | | | | | | |
|
Accrued expenses and other current liabilities |
á | 13.2 | liabilities primarily related to increase accruals associated with commissions, bonuses and accrued vacation payable after the end of the year, as well as increases in the liability for employee stock purchase plan and accrued marketing programs. | |||||||||||||
| | | | | | | | | | | | | | | | | | |
|
Various other items |
â | (26.6 | ) | Decrease is due to various other insignificant items. | ||||||||||||
| | | | | | | | | | | | | | | | | | |
67
Net cash used in investing activities.
2015
| | | | | | | | | | | | | | | | | | |
|
|
Factor |
|
Impact (in millions) |
|
Key Drivers |
|
|||||||||||
|---|---|---|---|---|---|---|---|---|---|---|---|---|---|---|---|---|---|
| | | | | | | | | | | | | | | | | | |
|
Purchases of property and equipment |
â | $ | (15.9 | ) | Our increase in property and equipment was primarily associated with an increase in network equipment in our co-location data center facilities as we continue to expand capacity, as well as computer equipment and software, leasehold improvements and furniture and fixtures for supporting activities related to general growth in our business. | |||||||||||
| | | | | | | | | | | | | | | | | | |
|
Capitalized software development |
â | (1.0 | ) | Cash outflows for software development projects. | ||||||||||||
| | | | | | | | | | | | | | | | | | |
|
Restricted cash |
â | (0.2 | ) | Decrease is due to restricted cash in relation to an Australia lease agreement. | ||||||||||||
| | | | | | | | | | | | | | | | | | |
2014
| | | | | | | | | | | | | | | | | | |
|
|
Factor |
|
Impact (in millions) |
|
Key Drivers |
|
|||||||||||
|---|---|---|---|---|---|---|---|---|---|---|---|---|---|---|---|---|---|
| | | | | | | | | | | | | | | | | | |
|
Purchases of property and equipment |
â | $ | (8.4 | ) | Our increase in property and equipment was associated with an increase in network equipment in our co-location data center facilities as we continue to expand capacity, as well as computer equipment, furniture and fixtures and leasehold improvements for supporting activities related to growth in headcount and general growth in our business. | |||||||||||
| | | | | | | | | | | | | | | | | | |
|
Net cash acquired in acquisition |
á | 0.3 | Net cash acquired from our acquisition in December 2014. | |||||||||||||
| | | | | | | | | | | | | | | | | | |
|
Capitalized software development |
â | (0.6 | ) | Cash outflows for software development projects. | ||||||||||||
| | | | | | | | | | | | | | | | | | |
68
2013
| | | | | | | | | | | | | | | | | | |
|
|
Factor |
|
Impact (in millions) |
|
Key Drivers |
|
|||||||||||
|---|---|---|---|---|---|---|---|---|---|---|---|---|---|---|---|---|---|
| | | | | | | | | | | | | | | | | | |
|
Purchases of property and equipment |
â | $ | (11.4 | ) | Our increase in property and equipment was associated with an increase in network equipment in our co-location data center facilities as we continue to expand capacity, as well as computer equipment, furniture and fixtures and leasehold improvements for supporting activities related to growth in headcount and general growth in our business. | |||||||||||
| | | | | | | | | | | | | | | | | | |
|
Net cash used in acquisition |
â | (6.2 | ) | Net cash used in connection with our acquisition of Insightera. | ||||||||||||
| | | | | | | | | | | | | | | | | | |
|
Capitalized software development |
â | (0.5 | ) | Cash outflows for software development projects. | ||||||||||||
| | | | | | | | | | | | | | | | | | |
Net cash provided by financing activities.
2015
| | | | | | | | | | | | | | | | | | |
|
|
Factor |
|
Impact (in millions) |
|
Key Drivers |
|
|||||||||||
|---|---|---|---|---|---|---|---|---|---|---|---|---|---|---|---|---|---|
| | | | | | | | | | | | | | | | | | |
|
Stock option exercises |
á | $ | 6.0 | Cash proceeds received from the issuance of common stock upon the exercise of stock options. | ||||||||||||
| | | | | | | | | | | | | | | | | | |
|
Employee stock purchase plan |
á | 5.6 | Cash proceeds from the issuance of common stock under our employee stock purchase plan. | |||||||||||||
| | | | | | | | | | | | | | | | | | |
|
Withholding taxes |
â | (0.7 | ) | Cash outflows to satisfy withholding taxes on equity awards that are net share settled. | ||||||||||||
| | | | | | | | | | | | | | | | | | |
|
Joint venture proceeds |
á | 1.7 | Cash inflows from investment proceeds received from our redeemable non-controlling interest holders in our Japan joint venture. | |||||||||||||
| | | | | | | | | | | | | | | | | | |
|
Debt repayments |
â | (2.7 | ) | Cash outflows related to principal repayments under our credit facility. | ||||||||||||
| | | | | | | | | | | | | | | | | | |
|
Various other items |
â | (0.1 | ) | Decrease is due to various other insignificant items. | ||||||||||||
| | | | | | | | | | | | | | | | | | |
69
2014
| | | | | | | | | | | | | | | | | | |
|
|
Factor |
|
Impact (in millions) |
|
Key Drivers |
|
|||||||||||
|---|---|---|---|---|---|---|---|---|---|---|---|---|---|---|---|---|---|
| | | | | | | | | | | | | | | | | | |
|
Employee stock purchase plan |
á | $ | 6.1 | Cash proceeds from the issuance of common stock under our employee stock purchase plan. | ||||||||||||
| | | | | | | | | | | | | | | | | | |
|
Stock option exercises |
á | 5.5 | Cash proceeds received from the issuance of common stock upon the exercise of stock options. | |||||||||||||
| | | | | | | | | | | | | | | | | | |
|
Withholding taxes |
â | (2.6 | ) | Cash outflows to satisfy withholding taxes on equity awards that are net share settled. | ||||||||||||
| | | | | | | | | | | | | | | | | | |
|
Join venture proceeds |
á | 2.0 | Cash inflows from investment proceeds received from our redeemable non-controlling interest holders in our Japan joint venture. | |||||||||||||
| | | | | | | | | | | | | | | | | | |
|
Debt repayments |
â | (2.2 | ) | Cash outflows related to principal repayments under our credit facility. | ||||||||||||
| | | | | | | | | | | | | | | | | | |
|
Equity registration costs and follow-on offering costs |
â | (0.4 | ) | Cash payments related to costs associated with our follow-on offering and the registration of common stock issued in connection with our acquisition of Insightera during the fourth quarter of 2013. | ||||||||||||
| | | | | | | | | | | | | | | | | | |
|
Various other items |
â | (0.1 | ) | Decrease is due to various other insignificant items. | ||||||||||||
| | | | | | | | | | | | | | | | | | |
2013
| | | | | | | | | | | | | | | | | | |
|
|
Factor |
|
Impact (in millions) |
|
Key Drivers |
|
|||||||||||
|---|---|---|---|---|---|---|---|---|---|---|---|---|---|---|---|---|---|
| | | | | | | | | | | | | | | | | | |
|
IPO proceeds |
á | $ | 80.5 | Cash proceeds from our IPO net of underwriter discounts. | ||||||||||||
| | | | | | | | | | | | | | | | | | |
|
Follow-on proceeds |
á | 22.5 | Cash proceeds from follow on offering net of underwriter discounts. | |||||||||||||
| | | | | | | | | | | | | | | | | | |
|
Private placement offering |
á | 6.5 | Cash proceeds from the completion of our private placement offering. | |||||||||||||
| | | | | | | | | | | | | | | | | | |
|
Credit facility borrowings |
á | 4.5 | Cash proceeds from borrowings under the credit facility. | |||||||||||||
| | | | | | | | | | | | | | | | | | |
|
Stock option exercises |
á | 5.0 | Cash proceeds received from the issuance of common stock upon the exercise of stock options. | |||||||||||||
| | | | | | | | | | | | | | | | | | |
|
Debt repayments |
â | (0.6 | ) | Cash outflows related to principal repayments under our credit facility. | ||||||||||||
| | | | | | | | | | | | | | | | | | |
|
IPO and follow-on offering costs |
â | (3.8 | ) | Cash payments related to costs associated with our IPO and follow-on offering. | ||||||||||||
| | | | | | | | | | | | | | | | | | |
|
Various other items |
â | (0.2 | ) | Decrease is due to various other insignificant items. | ||||||||||||
| | | | | | | | | | | | | | | | | | |
70
Credit Facility
In May 2012, we entered into a loan and security agreement with a bank related to a credit facility providing us with an equipment line of up to $4.0 million. In June 2013, we entered into a first amendment to the loan and security agreement, which provided an additional line of credit for advances of up to $4.5 million. The interest rate associated with both lines of credit is the greater of 4% or three-quarters of a percentage point above the bank's prime rate, as determined on the applicable funding date. For each equipment loan advance, we paid interest only for approximately nine months. Subsequently, we make thirty-six equal monthly payments of principal and interest. In May 2014 we entered into a second amendment to revise the existing covenants associated with this facility. As of December 31, 2015, we were in compliance with these revised covenants. As of December 31, 2015 and December 31, 2014, the outstanding loan balance was $2.7 million and $5.4 million, respectively. See Note 7—Credit Facility to our Consolidated Financial Statements for a discussion of our credit facility.
Working Capital
A substantial source of our cash provided by operating activities is from changes in our deferred revenue balance, which is included on our consolidated balance sheet as a liability. Deferred revenue consists of the unearned portion of billed fees for our subscriptions and professional services, which is amortized into revenue in accordance with our revenue recognition policy. As of December 31, 2015 and 2014, we had working capital of $43.1 million and $66.0 million, respectively, which included $91.7 million and $62.9 million of deferred revenue recorded as a current liability, respectively. The decrease in our working capital at December 31, 2015 is primarily due to our net cash used in operating activities, total capital expenditures, and repayment of debt, partially offset by proceeds received for common stock issued upon exercise of stock options and under our employee stock purchase plan, and the investment we received from the redeemable non-controlling interests holders in our Japan joint venture.
Other Liquidity and Capital Resources Considerations
We assess our liquidity primarily through our cash on hand as well as the projected timing of billings under contract with our customers and related collection cycles. We believe our current cash and cash equivalents, cash to be received from existing and new customers will be sufficient to meet our working capital and capital expenditure requirements for at least the next 12 months.
As of December 31, 2015, we held an aggregate of $97.1 million in cash and cash equivalents in the United States and an aggregate of $10.1 million in our foreign subsidiaries. At present, such foreign funds are considered to be indefinitely reinvested in foreign countries. In the event funds from foreign operations are needed to fund cash needs in the United States and if United State taxes have not already been previously accrued, we would be required to accrue and pay additional taxes in order to repatriate these funds.
Our future capital requirements will depend on many factors, including equipment required in connection with expanding capacity in our co-location data center facilities, revenue growth and costs incurred to support customer growth, international expansion, research and development and increased general and administrative expenses to support the anticipated growth in our operations. Our capital expenditures in future periods are expected to grow in line with our business. To the extent that existing cash and cash from operations are not sufficient to fund our future operations, we may need to raise additional funds through public or private equity or additional debt financing. Although we currently are not a party to any agreement and do not have any understanding with any third parties with respect to potential investments in, or acquisitions of, businesses or technologies, we may enter
71
into these types of arrangements in the future, which could also require us to seek additional equity or debt financing. Additional funds may not be available on terms favorable to us or at all.
Contractual Obligations and Commitments
Our principal commitments consist of obligations under our outstanding credit facility, operating leases for our office space, and contractual commitments for hosting and other support services. The following table summarizes our credit facility, including interest, operating lease obligations and other contractual commitments at December 31, 2015:
| |
Payments Due by Period | ||||||||||||
|---|---|---|---|---|---|---|---|---|---|---|---|---|---|
| |
Total | Less than 1 Year |
1 - 3 Years | 3 - 5 Years | |||||||||
| |
(in thousands) |
||||||||||||
Credit facility, including interest |
$ | 2,718 | $ | 2,236 | $ | 482 | $ | — | |||||
Operating lease obligations |
19,798 | 6,816 | 12,278 | 704 | |||||||||
Contractual commitments |
7,786 | 4,443 | 3,343 | — | |||||||||
| | | | | | | | | | | | | | |
Total |
$ | 30,302 | $ | 13,495 | $ | 16,103 | $ | 704 | |||||
| | | | | | | | | | | | | | |
| | | | | | | | | | | | | | |
| | | | | | | | | | | | | | |
Off-Balance Sheet Arrangements
During 2015, 2014 and 2013, we did not have any relationships with unconsolidated entities or financial partnerships, such as entities often referred to as structured finance or special purpose entities, which would have been established for the purpose of facilitating off-balance sheet arrangements or other contractually narrow or limited purposes. As such, we are not exposed to any financing, liquidity, market or credit risk that could arise if we had engaged in those types of relationships.
72
Item 7A. Quantitative and Qualitative Disclosures About Market Risk
Foreign Currency Exchange Risk
We have foreign currency risks related to our revenue and operating expenses denominated in currencies other than the U.S. dollar, primarily the Euro, British Pound Sterling, Australian dollar, Japanese Yen, and Israeli Shekel. Decreases in the relative value of the U.S. dollar to other currencies may negatively affect our revenue and other operating results as expressed in U.S. dollars.
We have experienced and will continue to experience fluctuations in our net losses a result of transaction gains or losses related to revaluing certain monetary current asset and current liability balances that are denominated in currencies other than the functional currency of the entities in which they are recorded. We recognized net foreign exchange currency gains of approximately $0.2 million and $0.4 million for the years ended December 31, 2015 and 2014, respectively and foreign exchange currency losses of approximately $0.3 million for the year ended December 31, 2013.While we have not engaged in the hedging of our foreign currency transactions to date, we may in the future hedge selected significant transactions denominated in currencies other than the U.S. dollar. A 10% increase or decrease in the U.S. dollar exchange rate relative to any other currency would not have a material impact on our revenue or operating results.
Interest Rate Sensitivity
We hold cash and cash equivalents for working capital purposes. We do not have material exposure to market risk with respect to investments, as any investments we enter into are primarily highly liquid investments.
We have a credit facility with equipment advances of approximately $2.7 million and $5.4 million as of December 31, 2015 and 2014, respectively. The interest rate associated with this facility is the greater of 4% or three-quarters of a percentage point above the prime rate. A one percent increase in the prime rate would not have an impact on our operating results as the greater of the two rates is 4%, and we would still pay interest of 4%. A 10% increase or decrease in interest rates would not result in a material change in either our obligations under this facility or in the returns on our cash and cash equivalents.
Inflation Risk
We do not believe that inflation has had a material effect on our business. However, if our costs, in particular personnel, sales and marketing and cloud-based infrastructure costs, were to become subject to significant inflationary pressures, we may not be able to fully offset such higher costs through price increases. Our inability or failure to do so could harm our business, operating results and financial condition.
73
Item 8. Financial Statements and Supplementary Data
MARKETO, INC.
Index to Consolidated Financial Statements
74
Report of Independent Registered Public Accounting Firm
The
Board of Directors and Stockholders
Marketo, Inc.:
We have audited the accompanying consolidated balance sheets of Marketo, Inc. and subsidiaries ("the Company") as of December 31, 2015 and 2014, and the related consolidated statements of operations, comprehensive loss, stockholders' equity, and cash flows for each of the years in the three-year period ended December 31, 2015. These consolidated financial statements are the responsibility of the Company's management. Our responsibility is to express an opinion on these consolidated financial statements based on our audits.
We conducted our audits in accordance with the standards of the Public Company Accounting Oversight Board (United States). Those standards require that we plan and perform the audit to obtain reasonable assurance about whether the financial statements are free of material misstatement. An audit includes examining, on a test basis, evidence supporting the amounts and disclosures in the financial statements. An audit also includes assessing the accounting principles used and significant estimates made by management, as well as evaluating the overall financial statement presentation. We believe that our audits provide a reasonable basis for our opinion.
In our opinion, the consolidated financial statements referred to above present fairly, in all material respects, the financial position of Marketo, Inc. and subsidiaries as of December 31, 2015 and 2014, and the results of their operations and their cash flows for each of the years in the three-year period ended December 31, 2015, in conformity with U.S. generally accepted accounting principles.
/s/ KPMG LLP
Santa
Clara, California
March 4, 2016
75
MARKETO, INC.
Consolidated Balance Sheets
(in thousands, except per share data)
| |
December 31, | ||||||
|---|---|---|---|---|---|---|---|
| |
2015 | 2014 | |||||
ASSETS |
|||||||
Current assets: |
|||||||
Cash and cash equivalents |
$ | 107,218 | $ | 112,644 | |||
Accounts receivable, net of allowances of $557 and $393 for 2015 and 2014, respectively |
50,678 | 37,867 | |||||
Prepaid expenses and other current assets |
9,073 | 5,756 | |||||
| | | | | | | | |
Total current assets |
166,969 | 156,267 | |||||
Property and equipment, net |
21,323 | 16,832 | |||||
Goodwill |
29,201 | 29,201 | |||||
Intangible assets, net |
5,455 | 7,076 | |||||
Other assets |
2,130 | 1,035 | |||||
| | | | | | | | |
Total Assets |
$ | 225,078 | $ | 210,411 | |||
| | | | | | | | |
| | | | | | | | |
| | | | | | | | |
LIABILITIES, REDEEMABLE NON-CONTROLLING INTERESTS AND STOCKHOLDERS' EQUITY |
|||||||
Current liabilities: |
|||||||
Accounts payable |
$ | 4,265 | $ | 3,901 | |||
Accrued expenses and other current liabilities |
25,706 | 20,691 | |||||
Deferred revenue |
91,735 | 62,945 | |||||
Current portion of credit facility |
2,174 | 2,719 | |||||
| | | | | | | | |
Total current liabilities |
123,880 | 90,256 | |||||
Credit facility, net of current portion |
478 | 2,653 | |||||
Deferred revenue, long-term |
230 | — | |||||
Other liabilities |
2,722 | 3,526 | |||||
| | | | | | | | |
Total liabilities |
127,310 | 96,435 | |||||
| | | | | | | | |
Commitments and contingencies (Note 8) |
|||||||
Redeemable non-controlling interests |
4,643 | 800 | |||||
Stockholders' equity: |
|||||||
Common stock, par value $0.0001 per share—1,000,000 shares authorized as of December 31, 2015 and 2014; 43,606 and 41,481 shares issued and outstanding as of December 31, 2015 and 2014, respectively |
4 | 4 | |||||
Additional paid-in capital |
344,727 | 297,420 | |||||
Accumulated other comprehensive loss |
(274 | ) | (350 | ) | |||
Accumulated deficit |
(251,332 | ) | (183,898 | ) | |||
| | | | | | | | |
Total stockholders' equity |
93,125 | 113,176 | |||||
| | | | | | | | |
Total liabilities, redeemable non-controlling interests and stockholders' equity |
$ | 225,078 | $ | 210,411 | |||
| | | | | | | | |
| | | | | | | | |
| | | | | | | | |
The accompanying notes are an integral part of these consolidated financial statements.
76
MARKETO, INC.
Consolidated Statements of Operations
(in thousands, except per share data)
| |
Year Ended December 31, | |||||||||
|---|---|---|---|---|---|---|---|---|---|---|
| |
2015 | 2014 | 2013 | |||||||
Revenue: |
||||||||||
Subscription and support |
$ | 183,658 | $ | 131,060 | $ | 85,095 | ||||
Professional services and other |
26,211 | 18,894 | 10,823 | |||||||
| | | | | | | | | | | |
Total revenue |
209,869 | 149,954 | 95,918 | |||||||
| | | | | | | | | | | |
Cost of revenue: |
||||||||||
Subscription and support |
40,632 | 28,742 | 24,681 | |||||||
Professional services and other |
31,484 | 22,059 | 13,298 | |||||||
| | | | | | | | | | | |
Total cost of revenue |
72,116 | 50,801 | 37,979 | |||||||
| | | | | | | | | | | |
Gross profit: |
||||||||||
Subscription and support |
143,026 | 102,318 | 60,414 | |||||||
Professional services and other |
(5,273 | ) | (3,165 | ) | (2,475 | ) | ||||
| | | | | | | | | | | |
Total gross profit |
137,753 | 99,153 | 57,939 | |||||||
| | | | | | | | | | | |
Operating expenses: |
||||||||||
Research and development |
39,077 | 30,337 | 23,321 | |||||||
Sales and marketing |
129,072 | 98,843 | 62,769 | |||||||
General and administrative |
38,056 | 25,583 | 18,655 | |||||||
| | | | | | | | | | | |
Total operating expenses |
206,205 | 154,763 | 104,745 | |||||||
| | | | | | | | | | | |
Loss from operations |
(68,452 | ) | (55,610 | ) | (46,806 | ) | ||||
Other income (expense), net |
81 | 178 | (526 | ) | ||||||
| | | | | | | | | | | |
Loss before provision (benefit) for income taxes |
(68,371 | ) | (55,432 | ) | (47,332 | ) | ||||
Provision (benefit) for income taxes |
708 | (477 | ) | 28 | ||||||
| | | | | | | | | | | |
Net loss |
(69,079 | ) | (54,955 | ) | (47,360 | ) | ||||
Net loss and adjustment attributable to redeemable non-controlling interests (Note 3) |
(2,418 | ) | 618 | — | ||||||
| | | | | | | | | | | |
Net loss attributable to Marketo |
$ | (71,497 | ) | $ | (54,337 | ) | $ | (47,360 | ) | |
| | | | | | | | | | | |
| | | | | | | | | | | |
| | | | | | | | | | | |
Net loss per share of common stock, basic and diluted |
$ | (1.68 | ) | $ | (1.35 | ) | $ | (1.92 | ) | |
| | | | | | | | | | | |
| | | | | | | | | | | |
| | | | | | | | | | | |
Shares used in computing net loss per share of common stock, basic and diluted |
42,504 | 40,385 | 24,709 | |||||||
| | | | | | | | | | | |
| | | | | | | | | | | |
| | | | | | | | | | | |
The accompanying notes are an integral part of these consolidated financial statements.
77
MARKETO, INC.
Consolidated Statements of Comprehensive Loss
(in thousands)
| |
Year Ended December 31, | |||||||||
|---|---|---|---|---|---|---|---|---|---|---|
| |
2015 | 2014 | 2013 | |||||||
Net loss |
$ | (69,079 | ) | $ | (54,955 | ) | $ | (47,360 | ) | |
Other comprehensive gain (loss): |
||||||||||
Foreign currency gain (loss) |
56 | (715 | ) | 53 | ||||||
| | | | | | | | | | | |
Total comprehensive loss |
(69,023 | ) | (55,670 | ) | (47,307 | ) | ||||
Net loss attributable to redeemable non-controlling interests (excluding adjustment to redeemable non-controlling interests) |
1,645 | 618 | — | |||||||
Other comprehensive loss attributable to redeemable non-controlling interests |
20 | 167 | — | |||||||
| | | | | | | | | | | |
Comprehensive loss attributable to Marketo |
$ | (67,358 | ) | $ | (54,885 | ) | $ | (47,307 | ) | |
| | | | | | | | | | | |
| | | | | | | | | | | |
| | | | | | | | | | | |
The accompanying notes are an integral part of these consolidated financial statements.
78
MARKETO, INC.
Consolidated Statements of Stockholders' Equity
(in thousands)
| |
Convertible Preferred Stock |
|
|
|
|
|
|
||||||||||||||||||
|---|---|---|---|---|---|---|---|---|---|---|---|---|---|---|---|---|---|---|---|---|---|---|---|---|---|
| |
Common Stock | |
Accumulated Other Comprehensive Income (Loss) |
|
|
||||||||||||||||||||
| |
Additional Paid-in Capital |
Accumulated Deficit |
Total Stockholders' Equity |
||||||||||||||||||||||
| |
Shares | Amount | Shares | Amount | |||||||||||||||||||||
Balance as of December 31, 2012 |
25,876 | $ | 119,121 | 3,195 | $ | — | $ | 6,499 | $ | 145 | $ | (82,201 | ) | $ | 43,564 | ||||||||||
Issuance of common stock in connection with initial public offering, net of underwriting discounts |
— | — | 6,659 | 1 | 80,505 | — | — | 80,506 | |||||||||||||||||
Issuance of common stock in connection with private placement |
— | — | 500 | — | 6,500 | — | — | 6,500 | |||||||||||||||||
Issuance of common stock in connection with follow-on offering, net of underwriting discounts |
— | — | 662 | — | 22,519 | — | — | 22,519 | |||||||||||||||||
Issuance of common stock to acquire Insightera Ltd. |
— | — | 428 | — | 14,069 | — | — | 14,069 | |||||||||||||||||
Cost incurred with registration of common stock issued in connection with acquisition of Insightera |
— | — | — | — | (226 | ) | — | — | (226 | ) | |||||||||||||||
Costs incurred with initial public offering and follow-on offering |
— | — | — | — | (4,079 | ) | — | — | (4,079 | ) | |||||||||||||||
Conversion of preferred stock to common stock |
(25,876 | ) | (119,121 | ) | 25,876 | 3 | 119,118 | — | — | — | |||||||||||||||
Issuance of common stock upon exercise and early exercise of stock options |
— | — | 1,778 | — | 4,278 | — | — | 4,278 | |||||||||||||||||
Vesting of restricted stock units |
— | — | 169 | — | — | — | — | — | |||||||||||||||||
Withholding taxes for the net share settlement of an equity award |
— | — | (5 | ) | — | (124 | ) | — | — | (124 | ) | ||||||||||||||
Repurchase of common stock |
— | — | (12 | ) | — | — | — | — | — | ||||||||||||||||
Vesting of early exercised options |
— | — | — | — | 655 | — | — | 655 | |||||||||||||||||
Stock-based compensation expense |
— | — | — | — | 8,087 | — | — | 8,087 | |||||||||||||||||
Net loss |
— | — | — | — | — | — | (47,360 | ) | (47,360 | ) | |||||||||||||||
Foreign currency translation adjustments |
— | — | — | — | — | 53 | — | 53 | |||||||||||||||||
| | | | | | | | | | | | | | | | | | | | | | | | | | |
Balance as of December 31, 2013 |
— | — | 39,250 | 4 | 257,801 | 198 | (129,561 | ) | 128,442 | ||||||||||||||||
Costs incurred with follow-on offering |
— | — | — | — | 62 | — | — | 62 | |||||||||||||||||
Issuance of common stock for acquisition |
— | — | 141 | — | 4,756 | — | — | 4,756 | |||||||||||||||||
Issuance of common stock upon exercise and early exercise of stock options |
— | — | 1,534 | — | 5,508 | — | — | 5,508 | |||||||||||||||||
Issuance of common stock under employee stock purchase plan |
— | — | 422 | — | 6,143 | — | — | 6,143 | |||||||||||||||||
Investment by redeemable non-controlling interests |
— | — | — | — | 369 | — | — | 369 | |||||||||||||||||
Vesting of restricted stock units |
— | — | 234 | — | — | — | — | — | |||||||||||||||||
Withholding taxes for the net share settlement of equity awards |
— | — | (87 | ) | — | (2,641 | ) | — | — | (2,641 | ) | ||||||||||||||
Repurchase of common stock |
— | — | (13 | ) | — | — | — | — | — | ||||||||||||||||
Vesting of early exercised options |
— | — | — | — | 279 | — | — | 279 | |||||||||||||||||
Stock-based compensation expense |
— | — | — | — | 25,143 | — | — | 25,143 | |||||||||||||||||
Net loss attributable to Marketo |
— | — | — | — | — | — | (54,337 | ) | (54,337 | ) | |||||||||||||||
Foreign currency translation adjustments attributable to Marketo |
— | — | — | — | — | (548 | ) | — | (548 | ) | |||||||||||||||
| | | | | | | | | | | | | | | | | | | | | | | | | | |
Balance as of December 31, 2014 |
— | — | 41,481 | 4 | 297,420 | (350 | ) | (183,898 | ) | 113,176 | |||||||||||||||
Issuance of common stock upon exercise and early exercise of stock options |
— | — | 1,292 | — | 5,999 | — | — | 5,999 | |||||||||||||||||
Issuance of common stock under employee stock purchase plan |
— | — | 235 | — | 5,629 | — | — | 5,629 | |||||||||||||||||
Investment by redeemable non-controlling interests |
— | — | — | — | 233 | — | — | 233 | |||||||||||||||||
Vesting of restricted stock units |
— | — | 633 | — | — | — | — | — | |||||||||||||||||
Withholding taxes for the net share settlement of equity awards |
— | — | (27 | ) | — | (740 | ) | — | — | (740 | ) | ||||||||||||||
Repurchase of common stock |
— | — | (8 | ) | — | — | — | — | — | ||||||||||||||||
Vesting of early exercised options |
— | — | — | — | 140 | — | — | 140 | |||||||||||||||||
Stock-based compensation expense |
— | — | — | — | 40,109 | — | — | 40,109 | |||||||||||||||||
Net loss attributable to Marketo including adjustment to redeemable non-controlling interests |
— | — | — | — | (4,063 | ) | (67,434 | ) | (71,497 | ) | |||||||||||||||
Foreign currency translation adjustments attributable to Marketo |
— | — | — | — | — | 76 | — | 76 | |||||||||||||||||
| | | | | | | | | | | | | | | | | | | | | | | | | | |
Balance as of December 31, 2015 |
— | $ | — | 43,606 | $ | 4 | $ | 344,727 | $ | (274 | ) | $ | (251,332 | ) | $ | 93,125 | |||||||||
| | | | | | | | | | | | | | | | | | | | | | | | | | |
| | | | | | | | | | | | | | | | | | | | | | | | | | |
| | | | | | | | | | | | | | | | | | | | | | | | | | |
The accompanying notes are an integral part of these consolidated financial statements.
79
MARKETO, INC.
Consolidated Statements of Cash Flows
(in thousands)
| |
Year Ended December 31, | |||||||||
|---|---|---|---|---|---|---|---|---|---|---|
| |
2015 | 2014 | 2013 | |||||||
Cash flows from operating activities: |
||||||||||
Net loss : |
||||||||||
Net loss attributable to Marketo |
$ | (71,497 | ) | $ | (54,337 | ) | $ | (47,360 | ) | |
Net loss and adjustment attributable to redeemable non-controlling interests (Note 3) |
2,418 | (618 | ) | — | ||||||
| | | | | | | | | | | |
Net loss |
(69,079 | ) | (54,955 | ) | (47,360 | ) | ||||
Adjustments to reconcile net loss to net cash provided by (used in) operating activities: |
||||||||||
Depreciation and amortization |
13,937 | 9,475 | 4,621 | |||||||
Stock-based compensation expense |
39,182 | 25,120 | 8,075 | |||||||
Deferred income taxes |
568 | (672 | ) | (65 | ) | |||||
Provision for doubtful accounts |
738 | 417 | 452 | |||||||
Loss in disposal of assets |
7 | 1 | — | |||||||
Changes in operating assets and liabilities: |
||||||||||
Accounts receivable |
(13,952 | ) | (11,779 | ) | (13,154 | ) | ||||
Prepaid expenses and other current assets |
(4,489 | ) | (1,388 | ) | (698 | ) | ||||
Other assets |
(834 | ) | (709 | ) | (46 | ) | ||||
Accounts payable |
1,628 | (342 | ) | 2,050 | ||||||
Accrued expenses and other current liabilities |
5,213 | (1,599 | ) | 13,177 | ||||||
Deferred revenue |
29,686 | 22,371 | 20,438 | |||||||
Deferred rent |
(355 | ) | 37 | 141 | ||||||
| | | | | | | | | | | |
Net cash provided by (used in) operating activities |
2,250 | (14,023 | ) | (12,369 | ) | |||||
| | | | | | | | | | | |
Cash flows from investing activities: |
||||||||||
Increase in restricted cash |
(215 | ) | — | — | ||||||
Purchase of property and equipment |
(15,849 | ) | (8,378 | ) | (11,401 | ) | ||||
Cash provided by (used in) acquisition, net of cash acquired |
— | 326 | (6,216 | ) | ||||||
Capitalized software development |
(1,017 | ) | (645 | ) | (459 | ) | ||||
| | | | | | | | | | | |
Net cash used in investing activities |
(17,081 | ) | (8,697 | ) | (18,076 | ) | ||||
| | | | | | | | | | | |
Cash flows from financing activities: |
||||||||||
Proceeds from initial public offering, net of underwriting discount |
— | — | 80,506 | |||||||
Proceeds from private placement |
— | — | 6,500 | |||||||
Proceeds from follow-on offering, net of underwriting discount |
— | — | 22,519 | |||||||
Proceeds from issuance of common stock upon exercise of stock options |
5,999 | 5,540 | 4,985 | |||||||
Proceeds from employee stock purchase plan |
5,629 | 6,143 | — | |||||||
Repurchase of unvested common stock from terminated employees |
(38 | ) | (49 | ) | (22 | ) | ||||
Withholding taxes remitted for the net share settlement of an equity award |
(740 | ) | (2,638 | ) | (124 | ) | ||||
Proceeds from issuance of debt |
— | — | 4,500 | |||||||
Repayment of debt |
(2,719 | ) | (2,187 | ) | (582 | ) | ||||
Investment from non-controlling interests |
1,678 | 1,953 | — | |||||||
Payment incurred for common stock registration related to acquisition |
— | (319 | ) | (35 | ) | |||||
Payment of initial public offering costs and follow-on offering costs |
— | (104 | ) | (3,820 | ) | |||||
| | | | | | | | | | | |
Net cash provided by financing activities |
9,809 | 8,339 | 114,427 | |||||||
| | | | | | | | | | | |
Effect of foreign exchange rate changes on cash and cash equivalents |
(404 | ) | (1,274 | ) | 70 | |||||
| | | | | | | | | | | |
Net increase (decrease) in cash and cash equivalents |
(5,426 | ) | (15,655 | ) | 84,052 | |||||
Cash and cash equivalents—beginning of period |
112,644 | 128,299 | 44,247 | |||||||
| | | | | | | | | | | |
Cash and cash equivalents—end of period |
$ | 107,218 | $ | 112,644 | $ | 128,299 | ||||
| | | | | | | | | | | |
| | | | | | | | | | | |
| | | | | | | | | | | |
Supplemental disclosures of cash flow information: |
||||||||||
Cash paid for interest |
$ | 168 | $ | 272 | $ | 211 | ||||
Cash paid for income taxes |
394 | 80 | 33 | |||||||
Supplemental disclosure of noncash investing and financing activities |
||||||||||
Conversion of convertible preferred stock into common stock upon initial public offering |
— | — | 119,121 | |||||||
Convertible preferred stock and common stock issued in connection with acquisitions, including options assumed |
— | 4,756 | 14,069 | |||||||
Vesting of early exercise options |
140 | 279 | 655 | |||||||
Unpaid and accrued fixed assets |
115 | 1,330 | 376 | |||||||
Property and equipment acquired through tenant improvement allowance |
211 | 973 | 1,262 | |||||||
The accompanying notes are an integral part of these consolidated financial statements.
80
MARKETO, INC.
Notes to Consolidated Financial Statements
1. The Company and Summary of Significant Accounting Policies and Estimates
Business
Marketo, Inc. (Marketo or the Company) was incorporated in the state of California on January 20, 2006. The Company was reincorporated in the state of Delaware on December 17, 2009. The Company operates from its headquarters in San Mateo, California and has operating subsidiaries in Ireland, Australia, Israel, Japan and United Kingdom.
Marketo is a provider of a cloud-based Engagement Marketing software platform that is purpose-built to enable organizations to engage in modern engagement marketing. The Company's platform is designed to enable the effective management, optimization and analytical measurement of marketing activities, enabling organizations to acquire new customers more efficiently, build stronger relationships with existing customers, improve sales effectiveness and drive faster revenue growth. On this platform, the Company delivers an easy to use, integrated suite of advanced applications. The Company generally offers its services on an annual subscription basis with quarterly or annual payment terms.
Initial Public Offering and Follow-On Offering
On May 17, 2013, the Company closed its initial public offering (IPO) where it sold 6,968,435 shares of common stock to the public, including the underwriters' overallotment option of 908,926 shares of common stock and 309,509 shares of common stock sold by selling stockholders, at a price of $13.00 per share. In addition, the Company sold 500,000 shares of common stock to funds affiliated with Battery Ventures in a concurrent private placement, at a price of $13.00 per share. The Company received aggregate proceeds of approximately $87.0 million from the IPO and concurrent private placement, net of underwriters' discounts and commissions, but before deduction of offering expenses of approximately $3.4 million. Upon the closing of the IPO, all shares of the Company's outstanding convertible preferred stock automatically converted into 25,876,142 shares of common stock.
On September 13, 2013, the Company closed its follow-on public offering of 6,000,000 shares of its common stock, which included 662,498 shares of common stock sold by the Company and 5,337,502 shares of common stock sold by selling stockholders. The public offering price of the shares sold in the follow-on offering was $35.50 per share. The Company received aggregate proceeds of approximately $22.5 million from the follow-on offering, net of underwriters' discounts and commissions applicable to the sale of shares by the Company, but before deduction of offering costs of approximately $0.7 million payable by the Company.
The Company did not receive any proceeds from the sale of shares by the selling stockholders.
Basis of Presentation
The consolidated financial statements are prepared in accordance with generally accepted accounting principles in the U.S. (U.S. GAAP) and include the consolidated accounts of the Company and its wholly-owned and majority-owned subsidiaries. All intercompany transactions and balances have been eliminated.
Certain immaterial amounts in the prior period consolidated statement of cash flows within the cash provided by (used in) operating activities have been reclassified to conform to the current period presentation.
81
MARKETO, INC.
Notes to Consolidated Financial Statements (Continued)
1. The Company and Summary of Significant Accounting Policies and Estimates (Continued)
Redeemable Non-controlling Interests
The Company's Japanese subsidiary (Marketo KK) is not wholly owned. The agreements with the minority investors of Marketo KK contain redemption features whereby the interests held by the minority investors are redeemable either (i) at the option of the minority investors or (ii) at the option of the Company beginning on the seventh anniversary of the initial capital contribution. If the interests of the minority investors were to be redeemed under these agreements, the Company would be required to redeem the interest based on a prescribed formula derived from the relative revenue of Marketo KK and the Company. The balance of the redeemable non-controlling interests is reported at the greater of the initial carrying amount adjusted for the redeemable non-controlling interest's share of earnings or losses and other comprehensive income or loss, or its estimated redemption value. The resulting changes in the estimated redemption amount (increases or decreases) are recorded with corresponding adjustments against retained earnings or, in the absence of retained earnings, additional paid-in-capital. These interests are presented on the balance sheet outside of equity under the caption "Redeemable non-controlling interests."
Use of Estimates
The preparation of financial statements in conformity with U.S. GAAP requires management to make estimates and assumptions that affect the reported amounts of assets, liabilities and disclosure of contingent assets and liabilities at the date of the financial statements and the reported amounts of revenue and expenses during the reporting periods. Such management estimates and assumptions include the estimated selling price for the various elements in the Company's customer contracts, the allowance for doubtful accounts, stock-based compensation expense, useful lives of intangible assets, redemption value of redeemable non-controlling interests and the valuation of deferred tax assets and acquired intangible assets. Actual results could differ materially from those estimates, and such differences could be material to the financial statements and affect the results of operations reported in future periods.
Foreign Currency
The functional currency of the Company's foreign subsidiaries is their respective local currency. Assets and liabilities denominated in currencies other than the U.S. dollar are translated into U.S. dollars at the exchange rates in effect at the balance sheet dates, with the resulting translation adjustments directly recorded to a separate component of accumulated other comprehensive loss. Income and expense accounts are translated at average exchange rates during the year. Foreign currency remeasurement and transaction gains and losses are recorded in other income (expense), net. The Company recognized net foreign exchange currency gains of approximately $0.2 million and $0.4 million for the years ended December 31, 2015 and 2014, respectively and net foreign exchange currency losses of $0.3 million for the year ended December 31, 2013.
Segments
The Company's chief operating decision maker is its Chief Executive Officer, who reviews financial information presented on a consolidated basis, accompanied by information about revenue by geographic region. Accordingly, the Company has determined that it has a single operating segment.
82
MARKETO, INC.
Notes to Consolidated Financial Statements (Continued)
1. The Company and Summary of Significant Accounting Policies and Estimates (Continued)
Cash and Cash Equivalents
The Company considers all highly liquid investments purchased with original maturity of three months or less to be cash equivalents. Cash and cash equivalents primarily consist of cash on deposit with banks and investments in money market funds.
Allowance for Doubtful Accounts
Accounts receivable are carried at the original invoiced amount less an allowance made for doubtful accounts. The Company maintains an allowance for doubtful accounts based on the probability of future collection. When management becomes aware of circumstances that may decrease the likelihood of collection, it records a specific allowance against amounts due, which reduces the net receivable to the amount that management reasonably believes will be collected. For all other customers, management determines the adequacy of the allowance based on historical loss patterns, the number of days that billings are past due and an evaluation of the potential risk of loss associated with specific accounts. The Company reviews its allowance for doubtful accounts monthly and writes off receivable balances that are deemed to be uncollectible. Increases in the allowance are recorded in general and administrative expense in the period incurred. The Company does not have any off balance sheet credit exposure related to its customers.
Below is a summary of the changes in allowance for doubtful accounts for the periods presented:
| |
Balance at Beginning of Period |
Provision, net of Recoveries |
Write-offs | Balance at End of Period |
|||||||||
|---|---|---|---|---|---|---|---|---|---|---|---|---|---|
| |
(in thousands) |
||||||||||||
Year ended December 31, 2013 |
$ | 336 | $ | 452 | $ | (459 | ) | $ | 329 | ||||
Year ended December 31, 2014 |
329 | 417 | (353 | ) | 393 | ||||||||
Year ended December 31, 2015 |
393 | 738 | (574 | ) | 557 | ||||||||
Property and Equipment, Net
Property and equipment are stated at cost, less accumulated depreciation and amortization. Depreciation is computed using the straight-line method over the estimated useful lives of the asset, which is generally two to three years. Amortization of leasehold improvements is computed using the straight-line method over the shorter of the lease term or the estimated useful life of the asset or improvement. Depreciation and amortization begins when the asset is ready for its intended use. Assets held within construction in progress ("CIP") are not depreciated. CIP is related to the construction or development of property and equipment that have not yet been placed in service for their intended use. Cost of maintenance and repairs that do not improve or extend the lives of the respective assets are expensed as incurred.
When assets are retired or otherwise disposed of, the cost and related accumulated depreciation are removed from their respective accounts, and any gain or loss on such sale or disposal is reflected in the statement of operations.
83
MARKETO, INC.
Notes to Consolidated Financial Statements (Continued)
1. The Company and Summary of Significant Accounting Policies and Estimates (Continued)
Capitalized Software Development Costs
Costs incurred to develop the Company's cloud-based platform and applications consist of (a) certain external direct costs of materials and services incurred in developing or obtaining internal-use computer software and (b) payroll and payroll-related costs for employees who are directly associated with, and who devote time to, a given project. These costs generally consist of internal labor during configuration, coding and testing activities. Research and development costs incurred during the preliminary project stage or costs incurred for data conversion activities, training, maintenance and general and administrative or overhead costs are expensed as incurred. Capitalization begins when the preliminary project stage is complete, management with the relevant authority authorizes and commits to the funding of the software project, it is probable the project will be completed, and the software will be used to perform the functions intended and certain functional and quality standards have been met. Additionally, the Company also capitalizes costs related to specific upgrades and enhancements when it is probable the expenditures will result in additional functionality. Capitalized software development costs are amortized on a straight-line basis over the estimated useful life, which is generally eighteen months to two years. Amortization expense for the years ended December 31, 2015, 2014 and 2013 was $1.2 million, $0.3 million and $0.2 million, respectively.
Business Combinations
When the Company acquires businesses, it allocates the purchase price to tangible assets and liabilities, and identifiable intangible assets acquired. Any residual purchase price is recorded as goodwill. The allocation of the purchase price requires management to make significant estimates in determining the fair values of assets acquired and liabilities assumed, especially with respect to intangible assets. These estimates are based on historical experience and information obtained from the management of the acquired companies. These estimates can include, but are not limited to, the cash flows that an asset is expected to generate in the future, the appropriate weighted-average cost of capital, and the cost savings expected to be derived from acquiring an asset. These estimates are inherently uncertain and unpredictable. In addition, unanticipated events and circumstances may occur which may affect the accuracy or validity of such estimates. During the measurement period, which can be up to one year from the acquisition date, the Company may record adjustments to the assets acquired and liabilities assumed with the corresponding offset to goodwill. Upon the conclusion of the measurement period, any subsequent adjustments are recorded to earnings.
Goodwill and Other Intangible Assets
The Company records goodwill when the consideration paid in a purchase acquisition exceeds the fair value of the net tangible assets and the identified intangible assets acquired. Goodwill is not amortized, but rather is tested for impairment. The Company performs testing for impairment of goodwill on an annual basis, or as events occur or circumstances change that would more likely than not reduce the fair value of a reporting unit below its carrying amount. The Company has elected to bypass the qualitative assessments and proceed directly to the two-step test for impairment of goodwill. The first step of the test for goodwill impairment compares the fair value of the applicable reporting unit with its carrying value. If the fair value of a reporting unit is less than the reporting unit's carrying value, the Company will then perform the second step of the test for impairment of goodwill. During the second step of the test for impairment of goodwill, the Company compares the implied fair value of the reporting unit's goodwill with the carrying value of that goodwill. If the carrying value of the
84
MARKETO, INC.
Notes to Consolidated Financial Statements (Continued)
1. The Company and Summary of Significant Accounting Policies and Estimates (Continued)
goodwill exceeds the calculated implied fair value, the excess amount will be recognized as an impairment loss. The Company has determined that there is a single reporting unit for the purpose of goodwill impairment tests. The Company did not recognize any impairment charges on its goodwill during any of the periods presented.
Other intangible assets with definite lives, consisting of capitalized software development costs, developed technology, domain names, customer relationships and non-compete agreements, are stated at cost less accumulated amortization and are amortized on a straight-line basis over their estimated remaining economic lives, ranging from one to seven years. Amortization expense related to capitalized software development costs and developed technology is included in cost of revenues. Amortization expense related to customer relationships and non-compete agreements is included in sales and marketing expense. Amortization expense related to domain names is included in general and administrative expense. The Company also routinely reviews the remaining estimated useful lives of its finite-lived intangible assets. If the estimated useful life for an asset is reduced, the remaining unamortized balance would be amortized over the revised estimated useful life
Long-Lived Assets
The Company continually monitors events and changes in circumstances that could indicate that carrying amounts of its long-lived assets, including property and equipment and identifiable intangible assets, may not be recoverable. When such events or changes in circumstances occur, the Company assesses the recoverability of long-lived assets by determining whether the carrying value of such assets will be recovered through their undiscounted expected future cash flow. If the future undiscounted cash flow is less than the carrying amount of these assets, the Company recognizes an impairment loss based on the excess of the carrying amount over the fair value of the assets. The Company did not recognize impairment charges on its long-lived assets during any of the periods presented.
Concentration of Credit Risk and Significant Customers
The Company's financial instruments that are exposed to concentrations of credit risk consist primarily of cash and cash equivalents and trade accounts receivable. Although the Company deposits its cash with multiple financial institutions, its deposits exceed federally insured limits. The Company generally does not require collateral from its customers and generally requires payment 30 days from the invoice date. The Company's accounts receivable are derived from revenue earned from customers located primarily in North America and Europe. The Company periodically evaluates the collectability of its accounts receivable and provides an allowance for potential credit losses as necessary, based on the age of the receivable and collection experience.
No single customer accounted for more than 10% of accounts receivable as of December 31, 2015 and 2014. No single customer accounted for 10% or more of total revenue for each of the years ended December 31, 2015, 2014 and 2013.
85
MARKETO, INC.
Notes to Consolidated Financial Statements (Continued)
1. The Company and Summary of Significant Accounting Policies and Estimates (Continued)
Revenue Recognition
The Company derives its revenue from two sources:
(1) Subscription and support revenue. Subscription and support revenue consists of subscription fees from customers accessing the Company's cloud-based solutions platform and applications, as well as related customer support services; and
(2) Professional services and other revenue. Professional services and other revenue consists of fees associated with providing expert services that educate and assist the Company's customers on the best use of the Company's solutions as well as assist in the implementation of the Company's solution.
Revenue recognition commences when all of the following conditions are met:
- •
- Persuasive evidence of an arrangement exists;
- •
- Delivery or performance has occurred;
- •
- Fees are fixed or determinable; and
- •
- Collectability is reasonably assured.
In the majority of instances, revenue from new customers is generated under sales agreements with multiple elements, comprised of subscription and support fees from customers accessing the Company's cloud-based platform and applications and professional consultation services. The Company evaluates each element in a multiple-element arrangement to determine whether it represents a separate unit of accounting. An element constitutes a separate unit of accounting when the delivered item has standalone value and delivery of the undelivered element is probable and within the Company's control. Subscription and support have standalone value because they are routinely sold separately by the Company. Most of the professional services have standalone value because the Company has sold professional services separately, and there are several third party vendors that routinely provide similar professional services to the Company's customers on a standalone basis.
The Company allocates total arrangement fees to each element in a multiple-element arrangement based on the relative selling price hierarchy of each element. The amount of arrangement fee allocated to each element is limited by contingent revenue, if any.
The relative selling price hierarchy consists of the following: Selling price for a deliverable is based on its 1) vendor-specific objective evidence ("VSOE"), if available, 2) third-party evidence ("TPE"), if VSOE is not available, or 3) estimated selling price ("ESP"), if neither VSOE nor TPE is available. Because the Company has been unable to establish VSOE or TPE for the elements of its arrangements, the Company establishes the ESP for each element primarily by considering the median of actual sales prices of each type of subscription and support sold and the weighted average of actual sales prices of professional services sold. For subscription and support arrangements, management considered other factors such as database sizes, pricing practices and market considerations.
Subscription and support revenue is recognized commencing upon delivery of the Company's cloud-based services, which is the date a new subscription is provisioned and made available to a new customer, or new or expanded capabilities are provisioned and added to an existing subscription, provided that all of the other revenue recognition criteria are first met, referred to as the
86
MARKETO, INC.
Notes to Consolidated Financial Statements (Continued)
1. The Company and Summary of Significant Accounting Policies and Estimates (Continued)
"Commencement Date". Subscription and support revenue is recognized from the Commencement Date ratably thereafter over the remaining contractual term, which is generally three to 36 months. Amounts that have been invoiced are recorded in accounts receivable and in deferred revenue or revenue, depending on whether the revenue recognition criteria have been met.
Professional services and other have standalone value from the related subscription services. The majority of the Company's professional services contracts are offered on a time and material basis. When these services are not combined with subscription and support revenue in a multiple-element arrangement, services revenue is recognized as the services are rendered. Certain standard and non-standard professional service arrangements include customer acceptance provisions. Services provided under arrangements that include customer acceptance provisions are typically provided on a time and material basis, and the revenue is deferred and recognized upon customer acceptance of the service deliverable.
The Company's professional services also consist of short-term enablement and implementation services, which are offered at a flat fee. The enablement services teams assist customers with standard adoption procedures for the Company's platform. Because such enablement services typically are completed within a short period (usually one to ten days), the Company recognizes revenue from this service upon completion. The implementation services consist of short-term "use it or lose it" services to assist customers with standard implementation and to implement the customer's first marketing campaign which are offered at a flat fee. Such flat fees are recognized ratably over the 120 day period.
The Company's time and material and fixed price professional service contracts are generally delivered within one year from the date of the arrangement.
Sales and other taxes collected from customers to be remitted to government authorities are primarily reported on a net basis, where taxes collected are excluded from revenue.
Cost of Revenue
Cost of subscriptions, support, professional services and other revenue are expensed as incurred. Cost of subscription and support revenue primarily consists of expenses related to hosting the Company's service and providing support to the Company's customers. These expenses are comprised of data center operations costs and personnel and related costs directly associated with the Company's cloud infrastructure, customer support and customer success organizations, including salaries, benefits, bonuses and stock-based compensation, as well as allocated overhead. Overhead associated with facilities and depreciation, excluding depreciation related to the Company's data center infrastructure, is allocated to cost of revenue and operating expenses based on headcount. Cost of professional services and other revenue consists primarily of personnel and related costs directly associated with the Company's professional services and training organizations, including salaries, benefits, bonuses and stock-based compensation, the costs of sub-contracted third-party vendors, as well as allocated overhead.
Deferred Revenue
Deferred revenue consists of billings or payments received in advance of revenue recognition and are recognized as the revenue recognition criteria are met. The Company generally invoices its customers annually or in quarterly installments payable in advance. Accordingly, the deferred revenue
87
MARKETO, INC.
Notes to Consolidated Financial Statements (Continued)
1. The Company and Summary of Significant Accounting Policies and Estimates (Continued)
balance does not represent the total contract value of annual or multi-year, non-cancelable arrangements. The current portion of deferred revenue represents the amount that is expected to be recognized as revenue within one year from the balance sheet date.
Commissions
Sales and marketing commissions are recognized as an expense generally at the time the customer order is signed. Substantially all of the effort by the sales and marketing organization is expended through the time of closing the sale with limited or no involvement thereafter. Commissions paid are subject to clawback by the Company in the event the customer fails to make payment on the agreement.
Warranties and Indemnification
The Company's cloud-based solutions platform and applications are typically warranted to perform in a manner consistent with general industry standards that are reasonably applicable and materially in accordance with the Company's on-line help documentation under normal use and circumstances.
The Company includes service level commitments to its customers warranting certain levels of uptime reliability and performance and permitting those customers to receive credits in the event that the Company fails to meet those levels. To date, the Company has not incurred any material costs as a result of such commitments and has not accrued any liabilities related to such obligations in the accompanying consolidated financial statements.
The Company's arrangements include provisions indemnifying customers against liabilities if the Company's products infringe a third-party's intellectual property rights. The Company also enters into arrangements that include provisions indemnifying customers for other liabilities from time to time. The Company has not incurred any costs as a result of such indemnification and has not accrued any liabilities related to such obligations in the accompanying consolidated financial statements.
The Company has also agreed to indemnify its directors and executive officers for costs associated with any fees, expenses, judgments, fines and settlement amounts incurred by any of those persons in any action or proceeding to which any of those persons is, or is threatened to be, made a party by reason of the person's service as a director or officer, including any action by the Company, arising out of that person's services as the Company's director or officer or that person's services provided to any other company or enterprise at the Company's request. The Company maintains director and officer insurance coverage that may enable the Company to recover a portion of any future indemnification amounts paid.
Advertising Costs
Advertising costs are expensed as incurred. For the years ended December 31, 2015, 2014 and 2013 advertising expenses were $2.5 million, $1.9 million and $1.5 million, respectively.
Stock-Based Compensation
The Company uses the fair value method for recording stock-based compensation. Stock-based compensation cost for stock options and stock purchase rights provided under the Employee Stock Purchase Plan (ESPP) is estimated at the grant date based on each option's fair-value as calculated by
88
MARKETO, INC.
Notes to Consolidated Financial Statements (Continued)
1. The Company and Summary of Significant Accounting Policies and Estimates (Continued)
the Black-Scholes option-pricing model. The Company recognizes compensation cost for stock option grants and ESPP on a straight-line basis over the requisite service period for the entire award.
Stock-based compensation cost for restricted stock units (RSUs) is measured based on the fair value of the underlying shares on the date of grant. All RSUs are subject to a time-based vesting condition and some are also subject to a performance-based vesting condition, both of which must be satisfied before the RSUs are vested and settled for shares of common stock. The time-based vesting condition is generally 4 years. The Company recognizes the compensation cost for RSUs which contain performance conditions based upon the probability of that performance condition being met, over the respective time-based vesting period. RSUs that do not satisfy the time-based vesting condition as of termination of employment are automatically forfeited. All RSUs will expire 7 years from the grant date if not previously settled for shares of common stock.
Stock-based compensation expense related to market-performance based RSUs (MSUs) granted to certain of our executives is measured based upon the fair market value as of the date of the award using the Monte Carlo valuation methodology. The stock-based compensation expense for each MSU award is recognized using the graded vesting method. Stock-based compensation expense associated with participants who fulfil their requisite service period is not reversed even if the performance conditions are not met. However, stock-based compensation expense is reversed for participants who forfeit their MSU awards prior to fulfilling their requisite service period.
Stock-based compensation expenses are only recognized for awards that are expected to vest. The Company estimates its forfeiture based on historical forfeitures of its stock-based awards and adjusts the rate to reflect changes in facts and circumstances, if any.
Income Taxes
The provision for income taxes is computed using the asset and liability method, under which deferred tax assets and liabilities are recognized for the expected future tax consequences of temporary differences between the financial reporting and tax bases of assets and liabilities, and for operating losses and tax credit carryforwards. Deferred tax assets and liabilities are measured using the currently enacted tax rates that apply to taxable income in effect for the years in which those tax assets are expected to be realized or settled. The Company records a valuation allowance to reduce deferred tax assets to the amount that is believed more likely than not to be realized.
Compliance with income tax regulations requires the Company to make decisions relating to the transfer pricing of revenue and expenses between each of its legal entities that are located in several countries. The Company's determinations include many decisions based on management's knowledge of the underlying assets of the business, the legal ownership of these assets, and the ultimate transactions conducted with customers and other third parties. The calculation of the Company's tax liabilities involves dealing with uncertainties in the application of complex tax regulations in multiple tax jurisdictions. The Company may be periodically reviewed by domestic and foreign tax authorities regarding the amount of taxes due. These reviews may include questions regarding the timing and amount of deductions and the allocation of income among various tax jurisdictions. In evaluating the exposure associated with various filing positions, the Company records estimated reserves when it is more likely than not that an uncertain tax position will not be sustained upon examination by a taxing authority. Such estimates are subject to change. See Note 11, "Income Taxes".
89
MARKETO, INC.
Notes to Consolidated Financial Statements (Continued)
1. The Company and Summary of Significant Accounting Policies and Estimates (Continued)
Net Loss per Share Attributable to Common Stockholders
Basic and diluted net loss per share of common stock is presented in conformity with the two-class method required for participating securities for 2015, 2014 and 2013. The Company considers the shares issued upon the early exercise of stock options subject to repurchase to be participating securities, because holders of such shares have dividend rights in the event a dividend is paid on common stock. Prior to its conversation to common stock, holders of Series A, B, C, D, E, F and G convertible preferred stock were each entitled to receive noncumulative dividends out of any funds legally available, when, as and if declared by the board of directors, payable prior and in preference to any dividends on any shares of the Company's common stock. The dividend rates for Series A, B, C, D, E, F and G convertible preferred stock were $0.08, $0.12, $0.20, $0.379, $0.5326, $1.056 and $1.168 per share, respectively. In the event a dividend is paid to common stockholders, the holders of the Series A, B, C, D, E, F and G convertible preferred stock were entitled to a proportionate share of any such dividends as if they were holders of common stock (on an as-if converted basis).
Under the two-class method, net income (loss) attributable to common stockholders is determined by allocating undistributed earnings, calculated as net income less current period convertible preferred stock non-cumulative dividends, between common stock and preferred stock. In computing diluted net income (loss) attributable to common stockholders, undistributed earnings are re-allocated to reflect the potential impact of dilutive securities. Basic net income (loss) per share of common stock is computed by dividing the net income (loss) attributable to common stockholders by the weighted average number of common shares outstanding during the period. Unvested common shares resulting from the early exercises of stock options are excluded from the calculation of the weighted average common shares until they vest as they are subject to repurchase until they are vested. Those shares are added to the calculation of the weighted average common shares outstanding as they vest. Diluted net income per share attributable to common stockholders is computed by dividing net income attributable to common stockholders by the weighted average number of common shares outstanding, including potential dilutive common shares assuming the dilutive effect of potential common shares for the period determined using the treasury stock method. For purposes of this calculation, convertible preferred stock, options to purchase common stock and restricted stock units are considered to be potential dilutive common shares, but have been excluded from the calculation of diluted net loss per share of common stock as their effect is antidilutive for all periods presented. Holders of convertible preferred stock and holders of stock subject to repurchase did not have a contractual obligation to share in the losses of the Company.
Given the Company is in a loss position for all periods presented, the Company has not allocated losses to early exercise shares subject to repurchase or series of convertible preferred stock.
Recently Issued Accounting Pronouncements
In February 2016, the Financial Accounting Standards Board ("FASB") issued Accounting Standards Update ("ASU") 2016-02, "Leases." ASU 2016-02 requires that lease arrangements longer than 12 months result in an entity recognizing an asset and liability. The updated guidance is effective for interim and annual periods beginning after December 15, 2018, and early adoption is permitted. We have not evaluated the impact of the updated guidance on our consolidated financial statements.
In November 2015, the FASB issued ASU 2015-17, Balance Sheet Classification of Deferred Taxes, related to balance sheet classification of deferred taxes. The ASU requires that deferred tax assets and
90
MARKETO, INC.
Notes to Consolidated Financial Statements (Continued)
1. The Company and Summary of Significant Accounting Policies and Estimates (Continued)
liabilities be classified as noncurrent in the statement of financial position, thereby simplifying the current guidance that requires an entity to separate deferred assets and liabilities into current and noncurrent amounts. The ASU will be effective for the Company beginning in the first quarter of fiscal year 2017 though early adoption is permitted. The Company has early-adopted the ASU as of December 31, 2015. The Company has adopted this accounting standard prospectively; accordingly, the prior period amounts in the Company's Consolidated Balance Sheet as of December 31, 2014 were not adjusted to conform to the new accounting standard.
In September 2015, the FASB issued ASU 2015-16, Business Combinations (Topic 805): Simplifying the Accounting for Measurement-Period Adjustments. The pronouncement eliminates the requirement for an acquirer to retrospectively adjust the financial statements for measurement-period adjustments that occur in periods after a business combination is consummated. The pronouncement is effective for fiscal years beginning after December 15, 2015, and interim periods within those fiscal years. Early adoption is permitted. The Company has elected not to early adopt. The adoption of ASU 2015-16 is not expected to have a material impact on the Company's consolidated financial statements.
In August 2015, subsequent to the issuance of ASU 2015-3, FASB issued ASU 2015-15, Interest—Imputation of Interest (Subtopic 835-30): Presentation and Subsequent Measurement of Debt Issuance Costs Associated with Line-of-Credit Arrangements—Amendments to SEC Paragraphs pursuant to Staff Announcement at June 18, 2015 EITF Meeting. The pronouncement included the SEC staff guidance section indicating that the SEC staff would not object to deferring and presenting debt issuance costs as an asset and subsequently amortizing the deferred costs ratably over the term of the line-of-credit arrangement, regardless of whether there are any outstanding balances on the arrangement. The pronouncement is effective upon adoption of ASU 2015-3. The adoption of ASU 2015-15 is not expected to have a material impact on the Company's consolidated financial statements.
In April 2015, the FASB issued ASU 2015-3, Interest—Imputation of Interest (Subtopic 835-30): Simplifying the Presentation of Debt Issuance Costs. The pronouncement requires that debt issuance costs related to a recognized debt liability be presented in the balance sheet as a direct deduction from the carrying amount of that debt liability, consistent with debt discounts. The pronouncement is effective for fiscal years beginning after December 15, 2015, and interim periods within those fiscal years. Early adoption is permitted. The Company has elected not to early adopt. The adoption of ASU 2015-3 is not expected to have a material impact on the Company's consolidated financial statements.
In April 2015, the FASB issued ASU No. 2015-05, Intangibles—Goodwill and Other—Internal-Use Software (Subtopic 350-40). The pronouncement was issued to provide guidance concerning accounting for fees in a cloud computing arrangement. The pronouncement is effective for fiscal years beginning after December 15, 2015, and interim periods within those fiscal years. The adoption of ASU 2015-05 is not expected to have a material impact on the Company's consolidated financial statements.
In May 2014, the FASB issued ASU No. 2014-09, Revenue from Contracts with Customers (Topic 606), which requires an entity to recognize the amount of revenue to which it expects to be entitled for the transfer of promised goods or services to customers. The ASU will replace most existing revenue recognition guidance in U.S. GAAP when it becomes effective. ASU 2014-09 also specifies the accounting for some costs to obtain or fulfill a contract with a customer. In July 2015, the FASB approved a one year deferral of the effective date for the new revenue reporting standard for
91
MARKETO, INC.
Notes to Consolidated Financial Statements (Continued)
1. The Company and Summary of Significant Accounting Policies and Estimates (Continued)
entities reporting under U.S. GAAP. In accordance with the deferral, this guidance will be effective for the Company, beginning January 1, 2018, and can be applied either retrospectively to each period presented or as a cumulative effect adjustment as of the date of adoption. Early adoption is permitted beginning January 1, 2017. The Company has elected not to early adopt. The standard permits the use of either the retrospective or cumulative effect transition method. The Company is evaluating the effect that ASU 2014-09 will have on its consolidated financial statements and related disclosures. The Company has not yet selected a transition method nor has it determined the effect of the standard on its consolidated financial statements.
2. Business Combinations
Fiscal 2014
On December 22, 2014 the Company completed an acquisition. Consideration totaled approximately $5.0 million and consisted of 141,074 shares of common stock of the Company valued at the closing market price of $33.71 and $0.2 million of cash. The Company has included the financial results of this company in its consolidated financial statements from the closing date of the acquisition. The Company has accounted for this transaction as a business combination. Based on the purchase price allocation, the Company recorded $1.6 million of acquired intangible assets with a useful life of three years, $3.2 million in goodwill, $0.5 million in net tangible assets including cash and $0.3 million of deferred tax liabilities. Additionally, the Company granted 146,762 time-based RSUs and 42,932 performance-based RSUs, which were valued at approximately $6.4 million on the grant date. See Note 9, "Stockholder's Equity and Stock Based Compensation" for more details regarding the performance-based RSUs.
Fiscal 2013
Insightera
On December 19, 2013, the Company completed its acquisition of Insightera Ltd. (Insightera), a company organized under the laws of the State of Israel. Insightera, a SaaS company, provides a platform that allows its customers to track and compile data about users visiting their internet websites with the purpose of displaying the website information which is personalized in response to the data.
As a result of the acquisition, the Company acquired all of the issued and outstanding shares of Insightera, and Insightera became a wholly owned subsidiary of the Company. Consideration consisted of $9.8 million of cash and 427,761 shares of common stock of the Company valued at the closing market price of $32.89. Of the issuable shares, 137,252 shares of the Company's common stock are held in escrow and are expected to be released from escrow no later than 18 months from the closing of the acquisition. Additionally, these employees were also granted 139,464 RSUs valued at approximately $6.1 million in January 2014.
The acquisition was accounted for using the acquisition method of accounting under which assets and liabilities of Insightera were recorded at their respective fair values including an amount for goodwill representing the difference between the acquisition consideration and the fair value of the identifiable net assets.
92
MARKETO, INC.
Notes to Consolidated Financial Statements (Continued)
2. Business Combinations (Continued)
During fiscal 2013, the Company incurred $0.7 million in transaction costs related to the acquisition, which primarily consisted of legal, accounting and valuation-related expenses. These expenses were recorded in general and administrative expense in the accompanying Consolidated Statements of Operations and Comprehensive Loss. Additionally, the Company incurred approximately $0.2 million in costs associated with registering the common stock issued in connection with the acquisition. These costs have been recorded as a reduction in additional paid in capital.
The total purchase price was allocated to the tangible and identified intangible assets acquired and liabilities assumed as of the closing date of the acquisition based upon their respective fair values. The purchase price allocation is as follows:
| |
Purchase Price Allocation |
|||
|---|---|---|---|---|
| |
(in thousands) |
|||
Tangible assets: |
||||
Cash and cash equivalents |
$ | 3,624 | ||
Accounts receivable |
46 | |||
Other current assets |
60 | |||
Property and equipment |
71 | |||
Other assets |
13 | |||
| | | | | |
Total tangible assets |
3,814 | |||
| | | | | |
Liabilities assumed: |
||||
Accounts payable and accrued liabilities |
(391 | ) | ||
Deferred revenues |
(116 | ) | ||
Other long-term liabilities |
(27 | ) | ||
| | | | | |
Total liabilities assumed |
(534 | ) | ||
| | | | | |
Deferred tax liability |
(374 | ) | ||
Intangible assets |
4,600 | |||
Goodwill |
16,404 | |||
| | | | | |
Total purchase price |
$ | 23,910 | ||
| | | | | |
| | | | | |
| | | | | |
Each component of identifiable intangible assets acquired in connection with the above acquisition is as follows:
| |
Estimated Useful Life |
Amount | |||||
|---|---|---|---|---|---|---|---|
| |
(in years) |
(in thousands) |
|||||
Developed technology |
4 | $ | 3,650 | ||||
Domain names |
3 | 250 | |||||
Customer relationships |
3 | 700 | |||||
| | | | | | | | |
Total intangible assets |
$ | 4,600 | |||||
| | | | | | | | |
| | | | | | | | |
| | | | | | | | |
Pro forma results of operations have not been presented because the effect of this acquisition was not material to the consolidated financial statements.
93
MARKETO, INC.
Notes to Consolidated Financial Statements (Continued)
3. Joint Venture
In February 2014, the Company entered into an agreement with SunBridge Corporation and Dentsu eMarketing One K.K. (collectively, the Investors) to engage in the investment, organization, management and operation of a Japanese subsidiary (Marketo KK) of the Company that is focused on the sale of the Company's products and services in Japan. The Investors initially contributed approximately $2.0 million (200,000,000 Japanese Yen) in cash in exchange for 35.4% of the outstanding common stock of Marketo KK. Furthermore, under the agreement, the Company and the Investors agreed to subscribe to additional shares by contributing additional funding of approximately $2.0 million (237,480,955 Japanese Yen) and approximately $1.7 million (200,000,000 Japanese Yen), respectively, which occurred in March 2015. As of December 31, 2015, the Company and the Investors owned approximately 60.1% and 39.9% of the outstanding common stock in Marketo KK, respectively.
Twenty percent of the common stock held by the Investors may be callable by the Company or puttable by the Investors beginning on the seventh anniversary of the initial capital contribution by the Investors. This percentage increases to forty percent and one hundred percent on the eighth and tenth anniversary, respectively. Should the call or put option be exercised, the redemption value would be determined based on a prescribed formula derived from the relative revenue of Marketo KK and the Company and may be settled, at the Company's discretion, with Company stock (with no limit on the shares that may be issued) or cash. Additionally, the common stock held by the Investors may be callable or puttable following a change of control of the Company. The redeemable non-controlling interests in Marketo KK are classified outside of permanent equity in the Company's consolidated balance sheet as of December 31, 2015, primarily due to the put right available to the redeemable non-controlling interest holders in the future which may be settled in cash or common stock of the Company. The balance of the redeemable non-controlling interests is reported at the greater of the initial carrying amount adjusted for the redeemable non-controlling interest's share of earnings, or its estimated redemption value. Accordingly, as of December 31, 2015 the Company adjusted the redeemable non-controlling interests to its expected redemption value, resulting in a $4.1 million reduction to additional paid-in-capital for the year ended December 31, 2015.
94
MARKETO, INC.
Notes to Consolidated Financial Statements (Continued)
3. Joint Venture (Continued)
The following table reconciles net loss and adjustment attributable to redeemable non-controlling interests for periods indicated below (in thousands):
| |
Redeemable Non-controlling Interests |
|||
|---|---|---|---|---|
Balance as of December 31, 2013 |
$ | — | ||
Investment by redeemable non-controlling interests |
1,585 | |||
Net loss attributable to redeemable non-controlling interests (before adjustment to redeemable non-controlling interests) |
(618 | ) | ||
Foreign currency translation adjustments |
(167 | ) | ||
| | | | | |
Balance as of December 31, 2014 |
800 | |||
Investment by redeemable non-controlling interests |
1,445 | |||
Net loss attributable to redeemable non-controlling interests (before adjustment to redeemable non-controlling interests) |
(1,645 | ) | ||
Foreign currency translation adjustments |
(20 | ) | ||
Adjustment to redeemable non-controlling interests |
4,063 | |||
| | | | | |
Balance as of December 31, 2015 |
$ | 4,643 | ||
| | | | | |
| | | | | |
| | | | | |
4. Fair Value of Financial Instruments
The Company measures certain financial assets at fair value on a recurring basis based on a fair value hierarchy that requires the Company to maximize the use of observable inputs and minimize the use of unobservable inputs. Inputs used in the valuation techniques to derive fair values are classified based on a three-level hierarchy, as follows:
- •
- Level 1—Quoted prices in active markets for identical assets or liabilities.
- •
- Level 2—Observable inputs other than Level 1 prices such as quoted prices for similar assets or liabilities;
quoted prices in markets with insufficient volume or infrequent transactions (less active markets); or model-derived valuations in which all significant inputs are observable or can be derived
principally from or corroborated by observable market data for substantially the full term of the assets or liabilities.
- •
- Level 3—Unobservable inputs to the valuation methodology that are significant to the measurement of fair value of assets or liabilities.
The Company considers all highly liquid investments purchased with a remaining maturity of three months or less to be cash equivalents.
For certain other financial instruments, including accounts receivable, accounts payable, other current liabilities and credit facility, the carrying amounts approximate their fair value due to the relatively short maturity of these balances.
As of December 31, 2015 and 2014, financial assets stated at fair value on a recurring basis were comprised of money market funds and certificates of deposit included within cash and equivalents. In general, and where applicable, the Company uses quoted prices in active markets for identical assets or liabilities to determine fair value. The Company applied this valuation technique to measure the fair
95
MARKETO, INC.
Notes to Consolidated Financial Statements (Continued)
4. Fair Value of Financial Instruments (Continued)
value of the Company's Level 1 investments, such as money market funds. The fair value of the Company's investments in certain money market funds is their carrying value.
If quoted prices in active markets for identical assets or liabilities are not available to determine fair value, then the Company uses quoted prices for similar assets and liabilities or inputs other than the quoted prices that are observable either directly or indirectly. The Company classifies its certificates of deposit as having Level 2 inputs. The Company obtains the fair value of Level 2 financial instruments from its bank, which uses pricing data which may include quoted market prices for identical or comparable instruments, or inputs other than quoted prices that are observable either directly or indirectly. The bank then analyzes gathered pricing inputs and applies proprietary valuation techniques, such as weighted average pricing or pricing models such as discounted cash flow techniques to provide the Company with a fair valuation of each security.
The fair value of these financial assets was determined using the following inputs for the periods presented:
| |
December 31, 2015 | December 31, 2014 | |||||||||||||||||
|---|---|---|---|---|---|---|---|---|---|---|---|---|---|---|---|---|---|---|---|
| |
Level 1 | Level 2 | Level 3 | Level 1 | Level 2 | Level 3 | |||||||||||||
| |
(in thousands) |
||||||||||||||||||
Money market funds |
$ | 93,108 | $ | — | $ | — | $ | 104,021 | $ | — | $ | — | |||||||
Certificates of deposit |
— | 25 | — | — | 25 | ||||||||||||||
| | | | | | | | | | | | | | | | | | | | |
Total |
$ | 93,108 | $ | 25 | $ | — | $ | 104,021 | $ | 25 | $ | — | |||||||
| | | | | | | | | | | | | | | | | | | | |
| | | | | | | | | | | | | | | | | | | | |
| | | | | | | | | | | | | | | | | | | | |
5. Balance Sheet Components
Cash and Cash Equivalents
Cash and cash equivalents consist of the following:
| |
December 31, | ||||||
|---|---|---|---|---|---|---|---|
| |
2015 | 2014 | |||||
| |
(in thousands) |
||||||
Cash |
$ | 14,085 | $ | 8,598 | |||
Cash equivalents |
|||||||
Money market funds |
93,108 | 104,021 | |||||
Certificates of deposit |
25 | 25 | |||||
| | | | | | | | |
Total cash equivalents |
93,133 | 104,046 | |||||
| | | | | | | | |
Total |
107,218 | $ | 112,644 | ||||
| | | | | | | | |
| | | | | | | | |
| | | | | | | | |
96
MARKETO, INC.
Notes to Consolidated Financial Statements (Continued)
5. Balance Sheet Components (Continued)
Property and Equipment, Net
Property and equipment, net consists of the following:
| |
December 31, | ||||||
|---|---|---|---|---|---|---|---|
| |
2015 | 2014 | |||||
| |
(in thousands) |
||||||
Computer equipment |
$ | 28,159 | $ | 18,384 | |||
Software |
3,498 | 2,417 | |||||
Office furniture |
2,952 | 2,071 | |||||
Leasehold improvements |
7,120 | 5,123 | |||||
Construction in progress |
2,808 | 1,745 | |||||
| | | | | | | | |
Total property and equipment |
44,537 | 29,740 | |||||
Less accumulated depreciation |
(23,214 | ) | (12,908 | ) | |||
| | | | | | | | |
Property and equipment, net |
$ | 21,323 | $ | 16,832 | |||
| | | | | | | | |
| | | | | | | | |
| | | | | | | | |
Construction in progress includes costs primarily related to network equipment infrastructure to support the Company's data center.
Depreciation expense was $10.4 million, $7.2 million and $3.9 million for 2015, 2014 and 2013, respectively.
Accrued Expenses and Other Current Liabilities
Accrued expenses and other current liabilities are as follows:
| |
December 31, | ||||||
|---|---|---|---|---|---|---|---|
| |
2015 | 2014 | |||||
| |
(in thousands) |
||||||
Accrued bonuses, commissions and wages |
$ | 12,343 | $ | 10,553 | |||
Accrued ESPP |
2,387 | 2,324 | |||||
Accrued vacation |
3,739 | 2,972 | |||||
Accrued marketing expenses |
1,289 | 1,313 | |||||
Accrued other |
5,948 | 3,529 | |||||
| | | | | | | | |
Total |
$ | 25,706 | $ | 20,691 | |||
| | | | | | | | |
| | | | | | | | |
| | | | | | | | |
97
MARKETO, INC.
Notes to Consolidated Financial Statements (Continued)
6. Goodwill and Intangible Assets, Net
Goodwill and intangible assets, net consisted of the following for the periods presented below:
| |
December 31, 2015 | Weighted Average Remaining Useful Life |
December 31, 2014 | Weighted Average Remaining Useful Life |
|||||||||
|---|---|---|---|---|---|---|---|---|---|---|---|---|---|
| |
(in thousands) |
(in years) |
(in thousands) |
(in years) |
|||||||||
Developed technology |
$ | 6,050 | 1.9 | $ | 6,050 | 2.9 | |||||||
Domain names |
950 | 2.8 | 950 | 3.6 | |||||||||
Customer relationships |
1,600 | 0.8 | 1,600 | 1.6 | |||||||||
Non-compete agreements |
580 | 2.0 | 580 | 3.0 | |||||||||
Capitalized software development costs |
3,980 | 1.2 | 2,042 | 1.2 | |||||||||
| | | | | | | | | | | | | | |
|
13,160 | 11,222 | |||||||||||
Less accumulated amortization |
(7,705 | ) | (4,146 | ) | |||||||||
| | | | | | | | | | | | | | |
Intangible assets, net |
5,455 | 7,076 | |||||||||||
Goodwill |
29,201 | 29,201 | |||||||||||
| | | | | | | | | | | | | | |
Goodwill and intangible assets, net |
$ | 34,656 | $ | 36,277 | |||||||||
| | | | | | | | | | | | | | |
| | | | | | | | | | | | | | |
| | | | | | | | | | | | | | |
The Company capitalized approximately $1.9 million and $0.7 million of software development costs in 2015 and 2014 and, respectively.
Amortization expense for the periods presented below was as follows:
| |
Year Ended December 31, | |||||||||
|---|---|---|---|---|---|---|---|---|---|---|
| |
2015 | 2014 | 2013 | |||||||
| |
(in thousands) |
|||||||||
Amortization expense |
$ | 3,559 | $ | 2,256 | $ | 717 | ||||
Based on the carrying amount of intangible assets as of December 31, 2015, the estimated future amortization is as follows (in thousands):
| |
Year Ended December 31, | |
||||||||||||||
|---|---|---|---|---|---|---|---|---|---|---|---|---|---|---|---|---|
| |
2016 | 2017 | 2018 | 2019 | Total | |||||||||||
Developed Technology |
$ | 1,508 | $ | 1,407 | $ | — | $ | — | $ | 2,915 | ||||||
Domain Names |
180 | 100 | 100 | 29 | 409 | |||||||||||
Customer Relationships |
315 | — | — | — | 315 | |||||||||||
Non-compete Agreements |
150 | 144 | — | — | 294 | |||||||||||
Capitalized Software Development Costs |
1,230 | 292 | — | — | 1,522 | |||||||||||
| | | | | | | | | | | | | | | | | |
Total |
$ | 3,383 | $ | 1,943 | $ | 100 | $ | 29 | $ | 5,455 | ||||||
| | | | | | | | | | | | | | | | | |
| | | | | | | | | | | | | | | | | |
| | | | | | | | | | | | | | | | | |
98
MARKETO, INC.
Notes to Consolidated Financial Statements (Continued)
7. Credit Facility
In May 2012, the Company entered into a loan and security agreement with a bank related to an equipment facility providing the Company with an equipment line of up to $4.0 million. In June 2013, the Company entered into a first amendment to the loan and security agreement, which provided an additional line of credit for advances of up to an aggregate of $4.5 million. The interest rate associated with both lines of credit is the greater of 4% or three quarters of a percentage points above the prime rate, as determined on the applicable funding date. For each equipment advance, the Company will pay interest only for approximately nine months. Subsequently, the Company is obligated to make thirty-six equal monthly payments of principal and interest. The loan is secured by a security interest on substantially all of the Company's assets, including the equipment purchased with the advances, and excludes the Company's intellectual property. The loan and security agreement also contains customary events of default including, among other things, that during the existence of an event of default, interest on the obligations could be increased by 5%.
In May 2014, the Company entered into a second amendment to the loan and security agreement to amend various covenants. Under the second amendment the Company is required to maintain compliance with certain financial covenants, which include maintaining a minimum cash balance with the bank and various reporting covenants. As of December 31, 2015, the Company was in compliance with these covenants.
As of December 31, 2015, the outstanding loan balance was $2.7 million.
Contractual future repayments in relation to the above credit facility are as follows for the years ending December 31:
| |
Principal | Interest | Total | |||||||
|---|---|---|---|---|---|---|---|---|---|---|
| |
(in thousands) |
|||||||||
2016 |
$ | 2,174 | $ | 62 | $ | 2,236 | ||||
2017 |
478 | 4 | 482 | |||||||
| | | | | | | | | | | |
Total |
$ | 2,652 | $ | 66 | $ | 2,718 | ||||
| | | | | | | | | | | |
| | | | | | | | | | | |
| | | | | | | | | | | |
8. Commitments and Contingencies
Leases
The Company leases its office facilities in San Mateo, California; Portland, Oregon; Atlanta, Georgia; Dublin, Ireland; Sydney, Australia; Farnborough, United Kingdom; Tokyo, Japan and Tel Aviv, Israel under operating lease agreements expiring in 2019. Under terms of the leases, the Company is responsible for certain insurance, property taxes, and maintenance expenses. Rent expense for non-cancellable operating leases with scheduled rent increases is recognized on a straight line basis
99
MARKETO, INC.
Notes to Consolidated Financial Statements (Continued)
8. Commitments and Contingencies (Continued)
over the terms of the leases. The difference between required lease payments and rent expense has been recorded as deferred rent. Deferred rent as of December 31, 2015 and 2014 is as follows:
| |
December 31, | ||||||
|---|---|---|---|---|---|---|---|
| |
2015 | 2014 | |||||
| |
(in thousands) |
||||||
Current portion of deferred rent |
$ | 406 | $ | — | |||
Long-term portion of deferred rent |
2,201 | 2,562 | |||||
| | | | | | | | |
Total |
$ | 2,607 | $ | 2,562 | |||
| | | | | | | | |
| | | | | | | | |
| | | | | | | | |
Rent expense under these operating leases was approximately $5.7 million, $4.2 million and $2.7 million for the years ended December 31, 2015, 2014 and 2013, respectively.
As of December 31, 2015, the Company had no capital leases. As of December 31, 2015, future minimum operating lease payments are as follows for the years ending December 31:
| |
Minimum Lease Payment |
|||
|---|---|---|---|---|
| |
(in thousands) |
|||
2016 |
$ | 6,816 | ||
2017 |
7,175 | |||
2018 |
5,103 | |||
2019 |
704 | |||
| | | | | |
Total |
$ | 19,798 | ||
| | | | | |
| | | | | |
| | | | | |
Contractual Obligations and Commitments
Contractual agreements with third parties consist of co-location hosting services, software licenses, maintenance and support for the Company's operations. As of December 31, 2015, future payments for non-cancellable contractual agreements are $4.4 million, $3.1 million and $0.2 million in 2016, 2017 and 2018, respectively.
9. Stockholder's Equity and Stock Based Compensation
Convertible Preferred Stock
Upon the closing of the IPO on May 17, 2013, all outstanding convertible preferred stock was converted into 25,876,142 shares of common stock on a one-to-one basis. No remaining convertible preferred stock was outstanding as of December 31, 2015.
Stock Option Plans
2006 Plan
The Company's Board of Directors (Board) and the Company's stockholders adopted the 2006 Stock Plan (2006 Plan) in October 2006. The 2006 Plan was amended in May 2013. The 2006 Plan was terminated in connection with the IPO, and accordingly, no shares will be available for issuance under this plan. The 2006 Plan will continue to govern outstanding awards granted thereunder. The 2006 Plan
100
MARKETO, INC.
Notes to Consolidated Financial Statements (Continued)
9. Stockholder's Equity and Stock Based Compensation (Continued)
provided for the grant of incentive stock options and nonqualified stock options. As of December 31, 2015, 2.8 million awards remained outstanding under the 2006 Plan.
2013 Equity Incentive Plan
The Board adopted, and the Company's stockholders approved, a 2013 Equity Incentive Plan (2013 Plan). The 2013 Plan was effective May 16, 2013. The 2013 Plan provides for the grant of incentive stock options, to the Company's employees and any parent and subsidiary corporations' employees, and for the grant of nonstatutory stock options, restricted stock, restricted stock units, stock appreciation rights, performance units and performance shares to the Company's employees, directors and consultants and the Company's subsidiary corporations' employees and consultants. In addition, the shares reserved for issuance under the 2013 Plan also include (a) those shares reserved but unissued under the 2006 Stock Plan (2006 Plan), and (b) shares returned to the 2006 Plan as the result of expiration or termination of awards (provided that the maximum number of shares that may be added to the 2013 Plan pursuant to (a) and (b) is 9,119,341 shares). The number of shares available for issuance under the 2013 Plan will also include an annual increase on the first day of each fiscal year beginning in 2014, equal to the least of:
- •
- 3,250,000 shares;
- •
- 5% of the outstanding shares of common stock as of the last day of the Company's immediately preceding fiscal year; or
- •
- such other amount as the Company's Board of Directors may determine.
If an award expires or becomes unexercisable without having been exercised in full, is surrendered pursuant to an exchange program, or, with respect to restricted stock, restricted stock units, performance units or performance shares, is forfeited to or repurchased due to failure to vest, the unpurchased shares (or for awards other than stock options or stock appreciation rights, the forfeited or repurchased shares) will become available for future grant or sale under the 2013 Plan. With respect to stock appreciation rights, the net shares issued will cease to be available under the 2013 Plan and all remaining shares will remain available for future grant or sale under the 2013 Plan. Shares used to pay the exercise price of an award or satisfy the tax withholding obligations related to an award will become available for future grant or sale under the 2013 Plan. To the extent an award is paid out in cash rather than shares, such cash payment will not result in reducing the number of shares available for issuance under the 2013 Plan. Options under the 2013 Plan may be exercised for periods of up to ten years from the grant date. As of December 31, 2015, 3.9 million shares remained available for future grants under the 2013 Plan.
101
MARKETO, INC.
Notes to Consolidated Financial Statements (Continued)
9. Stockholder's Equity and Stock Based Compensation (Continued)
Summary of Stock Option Activity
A summary of the Company's stock option activity for all stock option plans for fiscal 2015 is as follows:
| |
Number of Stock Options Outstanding (in thousands) |
Weighted- Average Exercise Price |
Weighted- Average Remaining Contractual Life (in years) |
Aggregate Intrinsic Value (in thousands) |
|||||||||
|---|---|---|---|---|---|---|---|---|---|---|---|---|---|
Balance as of December 31, 2014 |
5,404 | $ | 11.55 | ||||||||||
Granted |
65 | 29.12 | |||||||||||
Exercised |
(1,292 | ) | 4.64 | ||||||||||
Options Cancelled/Forfeited |
(400 | ) | 17.81 | ||||||||||
| | | | | | | | | | | | | | |
Balance as of December 31, 2015 |
3,777 | $ | 13.55 | 6.61 | $ | 65,915 | |||||||
| | | | | | | | | | | | | | |
| | | | | | | | | | | | | | |
| | | | | | | | | | | | | | |
Exercisable as of December 31, 2015 |
3,234 | $ | 9.77 | 6.34 | $ | 65,435 | |||||||
| | | | | | | | | | | | | | |
| | | | | | | | | | | | | | |
| | | | | | | | | | | | | | |
Vested and expected to vest as of December 31, 2015 |
3,655 | $ | 13.20 | 6.57 | $ | 64,761 | |||||||
| | | | | | | | | | | | | | |
| | | | | | | | | | | | | | |
| | | | | | | | | | | | | | |
The aggregate intrinsic value is calculated as the difference between the exercise price of the underlying awards and the Company's closing price of $28.71 as of December 31, 2015.
Option awards generally vest over a four year period, with 25% vesting after one year from date of grant and monthly thereafter. Stock options granted under the Company's 2006 Plan provided employee option holders with an early exercise provision, where in the event of termination any unvested shares purchased are subject to repurchase by the Company at the original purchase price. This right of repurchase lapses as the option vests. Options exercisable as of December 31, 2015 include options that are exercisable prior to vesting.
The weighted average grant date fair value of options granted and the total intrinsic value of options exercised during the periods presented were as follows:
| |
Year Ended December 31, | |||||||||
|---|---|---|---|---|---|---|---|---|---|---|
| |
2015 | 2014 | 2013 | |||||||
Weighted average grant date fair value |
$ | 12.44 | $ | 20.72 | $ | 5.08 | ||||
Total intrinsic value of options exercised (in thousands) |
$ | 31,938 | $ | 47,273 | $ | 38,241 | ||||
The total estimated grant date fair value of options vested during the years ended December 31, 2015, 2014 and 2013 was $13.9 million, $5.2 million and $4.2 million, respectively.
102
MARKETO, INC.
Notes to Consolidated Financial Statements (Continued)
9. Stockholder's Equity and Stock Based Compensation (Continued)
Additional information regarding options outstanding as of December 31, 2015 is as follows:
| |
|
|
Options Outstanding | |
|
|||||||||||||||
|---|---|---|---|---|---|---|---|---|---|---|---|---|---|---|---|---|---|---|---|---|
| |
|
|
Options Exercisable | |||||||||||||||||
| |
|
|
Weighted Average Remaining Contractual Term (in years) |
|
||||||||||||||||
| Range of Exercise Prices |
Number of Shares Outstanding (in thousands) |
Weighted Average Exercise Price |
Shares Exercisable (in thousands) |
Weighted Average Exercise Price |
||||||||||||||||
| $ | 0.12 | $ | 1.50 | 460 | 4.11 | $ | 1.17 | 460 | $ | 1.17 | ||||||||||
| 2.38 | 4.24 | 390 | 5.36 | 2.74 | 390 | 2.74 | ||||||||||||||
| 4.56 | 4.56 | 626 | 6.29 | 4.56 | 611 | 4.56 | ||||||||||||||
| 4.74 | 5.44 | 142 | 6.49 | 4.79 | 142 | 4.79 | ||||||||||||||
| 7.42 | 7.42 | 1,011 | 6.97 | 7.42 | 1,011 | 7.42 | ||||||||||||||
| 9.24 | 31.67 | 463 | 8.25 | 23.05 | 273 | 18.32 | ||||||||||||||
| 32.65 | 32.99 | 45 | 3.79 | 32.83 | 35 | 32.88 | ||||||||||||||
| 40.50 | 40.50 | 255 | 8.07 | 40.50 | 122 | 40.50 | ||||||||||||||
| 41.40 | 41.40 | 158 | 8.08 | 41.40 | 76 | 41.40 | ||||||||||||||
| 41.91 | 41.91 | 227 | 7.73 | 41.91 | 114 | 41.91 | ||||||||||||||
| | | | | | | | | | | | | | | | | | | | | |
| $ | 0.12 | $ | 41.91 | 3,777 | 6.61 | $ | 13.55 | 3,234 | $ | 9.77 | ||||||||||
| | | | | | | | | | | | | | | | | | | | | |
| | | | | | | | | | | | | | | | | | | | | |
| | | | | | | | | | | | | | | | | | | | | |
Determining Fair Value of Stock Options
The fair value of each option grant is estimated on the date of grant using the Black-Scholes option valuation model. The following assumptions were used to estimate the fair value of options granted to employees:
| |
Year Ended December 31, | |||||
|---|---|---|---|---|---|---|
| |
2015 | 2014 | 2013 | |||
Expected term (in years) |
6 | 6 | 6 | |||
Risk-free interest rate |
1.55% - 1.87% | 1.80% - 1.97% | 0.86% - 1.78% | |||
Expected volatility |
43% - 45% | 49% - 56% | 57% - 58% | |||
Expected dividend rate |
0% | 0% | 0% | |||
The assumptions are based on the following for each of the periods presented:
Expected Term—The Company estimates the expected term consistent with the simplified method identified by the SEC. The Company elected to use the simplified method because of its limited history of stock option exercise activity and its stock options meet the criteria of the "plain-vanilla" options as defined by the SEC. The simplified method calculates the expected term as the average of the vesting and contractual terms of the award.
Volatility—Since the Company has limited trading history by which to determine the volatility of its own common stock price, the expected volatility being used is derived from the historical stock volatilities of a representative industry peer group of comparable publicly listed companies over a period approximately equal to the expected term of the options.
103
MARKETO, INC.
Notes to Consolidated Financial Statements (Continued)
9. Stockholder's Equity and Stock Based Compensation (Continued)
Risk Free Interest Rate—The risk free interest rate is based on U.S. Treasury zero coupon issues with remaining terms similar to the expected term on the options.
Expected Dividend—The Company has never declared or paid any cash dividends and does not plan to pay cash dividends in the foreseeable future, and, therefore, used an expected dividend yield of zero in the valuation model.
Forfeiture—The Company estimates forfeitures at the time of grant and revises those estimates in subsequent periods if actual forfeitures differ from those estimates. The Company uses historical data to estimate pre-vesting forfeitures and records stock-based compensation expense only for those awards that are expected to vest. All service based stock-based payment awards are amortized on a straight-line basis over the requisite service periods of the awards, which are generally the vesting periods.
Restricted Stock Units
A summary of the Company's RSU activity and related information for fiscal 2015 is as follows:
| |
Number of RSUs (in thousands) |
Weighted Average Grant Date Fair Value |
|||||
|---|---|---|---|---|---|---|---|
Balance as of December 31, 2014 |
2,360 | $ | 33.30 | ||||
RSUs Granted |
2,017 | 31.99 | |||||
RSUs Vested |
(633 | ) | 33.18 | ||||
RSUs Cancelled/Forfeited |
(707 | ) | 31.65 | ||||
| | | | | | | | |
Balance as of December 31, 2015 |
3,037 | $ | 32.84 | ||||
| | | | | | | | |
| | | | | | | | |
| | | | | | | | |
RSUs are generally subject to a time-based vesting condition that ranges from three to four years, except for performance-based RSUs discussed in subsequent paragraphs.
During 2013 and 2012 the Company granted performance-based RSUs to certain employees. These RSUs were subject to a time-based vesting condition and a performance-based vesting condition, both of which must be satisfied before the RSUs are vested and settled for shares of common stock. The time-based vesting condition generally ranges from 2 to 4 years. The performance-based vesting condition was satisfied upon the completion of the Company's IPO, which occurred during the second quarter of 2013.
During 2014, in connection with an acquisition, the Company issued 42,932 performance-based RSUs to certain employees. These performance-based RSUs will vest based on the achievement against two product milestones. Of the total performance-based RSUs granted, 40% of the total RSUs granted was subject to the first milestone (which occurred in the second quarter of 2015) and 60% of the total RSUs granted was subject to the second milestone (which occurred in the fourth quarter of 2015). The RSUs had an estimated value of $1.4 million on the date of grant. During 2015, these RSUs were fully vested.
104
MARKETO, INC.
Notes to Consolidated Financial Statements (Continued)
9. Stockholder's Equity and Stock Based Compensation (Continued)
The weighted average grant date fair value of RSUs granted and the total intrinsic value of RSUs that vested during the periods presented were as follows:
| |
Year Ended December 31, | |||||||||
|---|---|---|---|---|---|---|---|---|---|---|
| |
2015 | 2014 | 2013 | |||||||
Weighted average grant date fair value |
$ | 31.99 | $ | 34.27 | $ | 28.69 | ||||
Total intrinsic value of vested RSUs (in thousands) |
$ | 18,172 | $ | 7,117 | $ | 2,479 | ||||
The aggregate grant date fair value of RSUs vested during fiscal 2015 was approximately $21.0 million.
Market Stock Units
In February 2015, the Compensation and Leadership Development Committee of the Company's Board of Directors granted market-performance based restricted stock units (MSUs) to its executive officers. The MSU awards were granted under the Company's 2013 Equity Incentive Plan.
Each MSU award granted in the first quarter of fiscal 2015 contains three separate tranches. The actual number of MSUs eligible to vest in each tranche is based on the performance of the Company's stock price relative to the performance of the NASDAQ Composite Index over the vesting period of each tranche, which ranges from one to three years. MSU participants have the ability to receive up to 100% of the target number of shares in tranche 1 and 2 and up to 150% of the target number of shares in tranche 3.
A summary of the Company's MSU activity and related information for the year ended December 31, 2015 is as follows:
| |
Number of Shares Underlying MSUs |
Weighted Average Grant Date Fair Value |
|||||
|---|---|---|---|---|---|---|---|
| |
(in thousands) |
|
|||||
Balance as of December 31, 2014 |
— | $ | — | ||||
MSUs Granted |
240 | 37.53 | |||||
MSUs Cancelled/Forfeited |
(47 | ) | 37.53 | ||||
| | | | | | | | |
Balance as of December 31, 2015 |
193 | $ | 37.53 | ||||
| | | | | | | | |
| | | | | | | | |
| | | | | | | | |
The fair value of each MSU award is determined by multiplying the fair value per share by the underlying number of shares. The fair value per share was determined on the grant date using the Monte Carlo valuation methodology and the assumptions described in the table below. The fair value per share for tranche 1, tranche 2, and tranche 3 is $9.10, $8.68 and $19.75, respectively. The Company amortizes the fair value of each MSU award using the graded-vesting method, adjusted for estimated forfeitures. Stock-based compensation expense associated with participants who fulfill their requisite service period is not reversed even if the performance conditions are not met. However, stock-based compensation expense is reversed for participants who forfeit their MSU awards prior to fulfilling their requisite service period.
105
MARKETO, INC.
Notes to Consolidated Financial Statements (Continued)
9. Stockholder's Equity and Stock Based Compensation (Continued)
The fair value of the MSUs granted during fiscal 2015 was estimated using the following weighted-average assumptions:
| |
For the Year Ended December 31, 2015 |
|||
|---|---|---|---|---|
Expected term (in years) |
3 | |||
Risk-free interest rate |
0.99 | % | ||
Expected volatility |
39 | % | ||
Expected dividend rate |
0 | % | ||
Employee Stock Purchase Plan
The Board adopted, and the Company's stockholders approved, a 2013 Employee Stock Purchase Plan (ESPP). The ESPP became effective on May 1, 2013. The ESPP provides for annual increases in the number of shares available for issuance under the ESPP on the first day of each fiscal year beginning in fiscal 2014, equal to the lesser of:
- •
- 1% of the outstanding shares of the Company's common stock on the first day of such fiscal year;
- •
- 650,000 shares; or
- •
- such other amount as may be determined by the Company's board of directors
The ESPP allows eligible employees to purchase shares of the Company's common stock at a discount through payroll deductions of up to 15% of their eligible compensation, at not less than 85% of the fair market value, as defined in the ESPP, subject to any plan limitations. A participant may purchase a maximum of 1,250 shares during an offering period. The offering period generally starts on the first trading day on or after February 15th and August 15th of each year, except that the first offering period commenced on the first trading day following the effective date of the Company's registration statement. During 2015, the Company issued approximately 0.2 million shares of common stock under the ESPP with an average purchase price of $23.88 per share. At December 31, 2015, a total of 1.5 million shares of common stock have been reserved for issuance and there were 0.9 million shares available for issuance under the ESPP.
Determining Fair Value of Employee Stock Plan Purchase Rights
The assumptions used to value employee stock purchase rights under the Black-Scholes model for the periods presented were as follows:
| |
Year Ended December 31, | |||||
|---|---|---|---|---|---|---|
| |
2015 | 2014 | 2013 | |||
Expected term (in months) |
6 | 6 - 9 | 9 | |||
Risk-free interest rate |
0.05% - 0.24% | 0.05% - 0.11% | 0.11% | |||
Expected volatility |
31% - 43% | 41% - 43% | 42% | |||
Expected dividend rate |
0% | 0% | 0% | |||
106
MARKETO, INC.
Notes to Consolidated Financial Statements (Continued)
9. Stockholder's Equity and Stock Based Compensation (Continued)
Stock Compensation Expense
The stock-based compensation expense included in operating results was allocated as follows:
| |
Year Ended December 31, | |||||||||
|---|---|---|---|---|---|---|---|---|---|---|
| |
2015 | 2014 | 2013 | |||||||
| |
(in thousands) |
|||||||||
Cost of subscription and support revenue |
$ | 2,691 | $ | 1,626 | $ | 496 | ||||
Cost of professional services and other revenue |
4,320 | 2,363 | 690 | |||||||
Research and development |
7,637 | 5,353 | 2,084 | |||||||
Sales and marketing |
12,655 | 8,860 | 2,293 | |||||||
General and administrative |
11,879 | 6,918 | 2,512 | |||||||
| | | | | | | | | | | |
Total stock-based compensation expense |
$ | 39,182 | $ | 25,120 | $ | 8,075 | ||||
| | | | | | | | | | | |
| | | | | | | | | | | |
| | | | | | | | | | | |
For the year ended December 31, 2015, the Company incurred expenses of $8.4 million for options, $26.4 million for RSUs, $3.6 million for MSUs and $1.7 million for ESPP, of which $1.3 million, related to performance-based RSUs that are tied to product milestones issued in connection with an acquisition that occurred in December 2014. The Company capitalized $0.9 million associated with the Company's internal use software projects.
As of December 31, 2015, total unrecognized compensation cost related to unvested awards not yet recognized under all equity compensation plans, adjusted for estimate forfeitures, was as follows:
| |
December 31, 2015 | ||||||
|---|---|---|---|---|---|---|---|
| |
Unrecognized Expense |
Weighted Average Expected Recognition Period |
|||||
| |
(in thousands) |
(in years) |
|||||
Stock options |
$ | 10,550 | 1.36 | ||||
Restricted stock units and market stock units |
66,546 | 2.79 | |||||
Employee stock purchase plan |
209 | 0.13 | |||||
| | | | | | | | |
Total unrecognized stock-based compensation expense |
$ | 77,305 | 2.59 | ||||
| | | | | | | | |
| | | | | | | | |
| | | | | | | | |
10. Net Loss per Share
Basic net loss per share is computed by dividing the net loss by the weighted-average number of shares of common stock outstanding during the period, less the weighted-average unvested common stock subject to repurchase or forfeiture as they are not deemed to be issued for accounting purposes. Diluted net loss per share is computed by giving effect to all potential shares of common stock, including preferred stock, stock options, RSUs and employee stock purchase plan, to the extent they are dilutive.
107
MARKETO, INC.
Notes to Consolidated Financial Statements (Continued)
10. Net Loss per Share (Continued)
The following table sets forth the computation of the Company's basic and diluted net loss per share of common stock under the two-class method attributable to common stockholders for the periods presented:
| |
Year Ended December 31, | |||||||||
|---|---|---|---|---|---|---|---|---|---|---|
| |
2015 | 2014 | 2013 | |||||||
| |
(in thousands, except per share data) |
|||||||||
Numerator: |
||||||||||
Net loss attributable to Marketo |
$ | (71,497 | ) | $ | (54,337 | ) | $ | (47,360 | ) | |
Denominator: |
||||||||||
Weighted-average common shares outstanding |
42,616 | 40,602 | 24,881 | |||||||
Less: Weighted-average unvested common shares subject to repurchase or forfeiture and shares held in escrow |
(112 | ) | (217 | ) | (172 | ) | ||||
| | | | | | | | | | | |
Weighted-average shares used in computing net loss per share of common stock, basic and diluted |
42,504 | 40,385 | 24,709 | |||||||
| | | | | | | | | | | |
| | | | | | | | | | | |
| | | | | | | | | | | |
Net loss per share of common stock, basic and diluted |
$ | (1.68 | ) | $ | (1.35 | ) | $ | (1.92 | ) | |
| | | | | | | | | | | |
| | | | | | | | | | | |
| | | | | | | | | | | |
The Company applied the two-class method to calculate its basic and diluted net loss per share of common stock, as its convertible preferred stock and common stock subject to repurchase are participating securities. The two-class method is an earnings allocation formula that treats a participating security as having rights to earnings that otherwise would have been available to common shareholders. However, the two-class method does not impact the net loss per share of common stock as the Company was in a loss position for each of the periods presented and preferred shareholders and holders of common stock subject to repurchase do not have to participate in losses.
Additionally, since the Company was in a loss position for each of the periods presented, diluted net loss per share is the same as basic net loss per share for each periods as the inclusion of all potential common shares outstanding would have been anti-dilutive. Potentially dilutive securities that were excluded from the diluted per share calculation because they would have been antidilutive were as follows:
| |
Year Ended December 31, | |||||||||
|---|---|---|---|---|---|---|---|---|---|---|
| |
2015 | 2014 | 2013 | |||||||
| |
(in thousands) |
|||||||||
Stock options to purchase common stock |
3,777 | 5,404 | 6,343 | |||||||
Common stock held in escrow |
22 | 159 | 137 | |||||||
Common stock subject to repurchase |
12 | 50 | 127 | |||||||
Employee stock purchase plan |
127 | 125 | 304 | |||||||
Restricted stock units and market stock units |
3,230 | 2,360 | 582 | |||||||
| | | | | | | | | | | |
|
7,168 | 8,098 | 7,493 | |||||||
| | | | | | | | | | | |
| | | | | | | | | | | |
| | | | | | | | | | | |
108
MARKETO, INC.
Notes to Consolidated Financial Statements (Continued)
11. Income Taxes
Income Tax Provision:
Pretax loss was as follows:
| |
Year Ended December 31, | |||||||||
|---|---|---|---|---|---|---|---|---|---|---|
| |
2015 | 2014 | 2013 | |||||||
| |
(in thousands) |
|||||||||
Loss before provision (benefit) for income taxes: |
||||||||||
Domestic |
$ | (57,513 | ) | $ | (46,908 | ) | $ | (37,481 | ) | |
Foreign |
(10,858 | ) | (8,524 | ) | (9,851 | ) | ||||
| | | | | | | | | | | |
Total |
$ | (68,371 | ) | $ | (55,432 | ) | $ | (47,332 | ) | |
| | | | | | | | | | | |
| | | | | | | | | | | |
| | | | | | | | | | | |
The provision (benefit) for income taxes consists of the following:
| |
Year Ended December 31, |
|||||||||
|---|---|---|---|---|---|---|---|---|---|---|
| |
2015 | 2014 | 2013 | |||||||
| |
(in thousands) |
|||||||||
Current tax provision: |
||||||||||
Federal |
$ | 1 | $ | 1 | $ | — | ||||
State |
24 | 15 | 10 | |||||||
Foreign |
353 | 164 | 83 | |||||||
| | | | | | | | | | | |
Total current tax provision |
378 | 180 | 93 | |||||||
Federal |
— | (286 | ) | — | ||||||
State |
— | (45 | ) | — | ||||||
Foreign |
330 | (326 | ) | (65 | ) | |||||
| | | | | | | | | | | |
Total deferred tax benefit |
330 | (657 | ) | (65 | ) | |||||
| | | | | | | | | | | |
Total provision (benefit) for income taxes |
$ | 708 | $ | (477 | ) | $ | 28 | |||
| | | | | | | | | | | |
| | | | | | | | | | | |
| | | | | | | | | | | |
The items accounting for the difference between income taxes computed at the federal statutory rate and the provision for income taxes consist of the following:
| |
Year Ended December 31, | |||||||||
|---|---|---|---|---|---|---|---|---|---|---|
| |
2015 | 2014 | 2013 | |||||||
Federal statutory rate |
34.00 | % | 34.00 | % | 34.00 | % | ||||
Stock-based compensation |
(1.15 | ) | (0.74 | ) | (1.59 | ) | ||||
Valuation allowance |
(36.51 | ) | (34.38 | ) | (28.31 | ) | ||||
Foreign rate differential |
(3.11 | ) | (2.52 | ) | (5.00 | ) | ||||
Federal research and development credit |
3.28 | 2.48 | 1.19 | |||||||
Other |
2.42 | 2.03 | (0.35 | ) | ||||||
| | | | | | | | | | | |
Effective income tax rate |
(1.06 | )% | 0.87 | % | (0.06 | )% | ||||
| | | | | | | | | | | |
| | | | | | | | | | | |
| | | | | | | | | | | |
109
MARKETO, INC.
Notes to Consolidated Financial Statements (Continued)
11. Income Taxes (Continued)
Deferred tax assets and liabilities:
The components of deferred tax assets and liabilities are as follows:
| |
Year Ended December 31, | |||||||||
|---|---|---|---|---|---|---|---|---|---|---|
| |
2015 | 2014 | 2013 | |||||||
| |
(in thousands) |
|||||||||
Deferred tax assets: |
||||||||||
Accounts receivable principally due to allowance for doubtful accounts |
$ | 166 | $ | 130 | $ | 92 | ||||
Compensated absences, principally due to accruals for financial reporting purposes |
2,880 | 1,867 | 2,993 | |||||||
Net operating loss carryforwards |
69,369 | 54,949 | 42,704 | |||||||
Federal tax credits |
3,657 | 2,437 | 1,766 | |||||||
State tax credits net of federal benefit |
2,010 | 1,521 | 1,166 | |||||||
Other deductible temporary differences |
2,234 | 1,311 | 964 | |||||||
Stock-based compensation |
12,106 | 7,289 | 1,508 | |||||||
Foreign Credit |
22 | 24 | 25 | |||||||
| | | | | | | | | | | |
Total deferred tax assets |
$ | 92,444 | $ | 69,528 | 51,218 | |||||
Deferred tax liabilities: |
||||||||||
Capitalized software development |
(566 | ) | (278 | ) | (149 | ) | ||||
Acquired intangible assets |
(1,208 | ) | (1,983 | ) | (1,979 | ) | ||||
| | | | | | | | | | | |
Total deferred tax liability |
(1,774 | ) | (2,261 | ) | (2,128 | ) | ||||
Valuation allowance |
(90,892 | ) | (67,159 | ) | (49,388 | ) | ||||
| | | | | | | | | | | |
Net deferred taxes |
$ | (222 | ) | $ | 108 | $ | (298 | ) | ||
| | | | | | | | | | | |
| | | | | | | | | | | |
| | | | | | | | | | | |
The net valuation allowance increased by $23.7 million and $17.8 million for the years ended December 31, 2015 and 2014, respectively.
As of December 31, 2015, the Company's deferred tax assets consist primarily of the federal and state net operating loss and research and development credit. In assessing the realizability of deferred tax assets, management determined that it is more likely than not that none of the deferred tax assets will be realized. Therefore, the Company has provided a full valuation allowance against the U.S. federal and state deferred tax assets at December 31, 2015.
The Company has not provided for withholding taxes on the undistributed earnings of its foreign subsidiaries because the Company intends to reinvest such earnings indefinitely. As of December 31, 2015, the amount of undistributed earnings considered indefinitely reinvested was not material.
110
MARKETO, INC.
Notes to Consolidated Financial Statements (Continued)
11. Income Taxes (Continued)
The Company had net operating loss carryforwards as follows:
| |
Year Ended December 31, | |||||||||
|---|---|---|---|---|---|---|---|---|---|---|
| |
2015 | 2014 | 2013 | |||||||
| |
(in thousands) |
|||||||||
Federal |
$ | 258,566 | $ | 204,361 | $ | 130,797 | ||||
State |
186,450 | 146,399 | 102,606 | |||||||
Foreign |
31,015 | 24,780 | 17,673 | |||||||
| | | | | | | | | | | |
Total |
$ | 476,031 | $ | 375,540 | $ | 251,076 | ||||
| | | | | | | | | | | |
| | | | | | | | | | | |
| | | | | | | | | | | |
The federal and state net operating losses include $91.1 million and $51.9 million of excess stock based compensation that will result in increases to additional paid in capital, when realized.
Net operating loss carryforwards are available to offset future federal, California and foreign taxable income. Federal and California net operating loss carryforwards begin to expire in 2026 and 2016, respectively. Ireland net operating loss carryforwards do not expire. Japan net operating loss carryforwards begin to expire in 2022.
The Company had research and development credit carryforwards as follows:
| |
Year Ended December 31, | |||||||||
|---|---|---|---|---|---|---|---|---|---|---|
| |
2015 | 2014 | 2013 | |||||||
| |
(in thousands) |
|||||||||
Federal |
$ | 3,657 | $ | 2,437 | $ | 1,766 | ||||
California |
3,045 | 2,305 | 1,767 | |||||||
International |
22 | 24 | 25 | |||||||
| | | | | | | | | | | |
Total |
$ | 6,724 | $ | 4,766 | $ | 3,558 | ||||
| | | | | | | | | | | |
| | | | | | | | | | | |
| | | | | | | | | | | |
Federal and California and the foreign research and development tax credit carryforwards are available to reduce future regular income taxes. Federal research and development credit carryforwards begin to expire in 2026. California research and development tax credit carryforwards do not expire.
On December 18, 2015, The Consolidated Appropriations Act of 2014 was signed into law, which retroactively reinstated and made permanent the federal research tax credit provisions from January 1, 2015 through December 31, 2015. The benefit of the reinstated credit did not impact the income statement in the period of enactment, which was the fourth quarter of 2015, as the research and development credit carryforwards are offset by a full valuation allowance.
Federal and California laws impose restrictions on the utilization of net operating loss carryforwards and R&D credit carryforwards in the event of a change in ownership of the Company, which constitutes an 'ownership change' as defined by Internal Revenue Code Sections 382 and 383. The Company experienced an ownership change in the past that does not materially impact the availability of its net operating losses and tax credits. The amounts indicated in the above tables reflect reduction of approximately $1.1 million of net operating losses and $8,000 of research and development credits as a result of previous ownership changes that the Company experienced. Nevertheless, should there be an ownership change in the future, the Company's ability to utilize existing carryforwards could be substantially restricted.
111
MARKETO, INC.
Notes to Consolidated Financial Statements (Continued)
11. Income Taxes (Continued)
The Company files tax returns in the US, certain states, Israel, Ireland, Australia and Japan. All of the tax years, from the date of inception, are open for examination.
Uncertain Tax Positions
The Company accounts for uncertainty in income taxes in accordance with ASC 740. Tax positions are evaluated in a two-step process. The Company first determines whether it is more likely than not that a tax position will be sustained upon examination by the tax authority, including resolutions of any related appeals or litigation processes, based on technical merit. If a tax position meets the more-likely-than-not recognition threshold it is then measured to determine the amount of benefit to recognized in the financial statements. The tax position is measured as the largest amount of benefit that is greater than 50% likely of being realized upon ultimate settlement.
The following table summarizes the activity related to unrecognized tax benefits:
| |
Year Ended December 31, |
|||||||||
|---|---|---|---|---|---|---|---|---|---|---|
| |
2015 | 2014 | 2013 | |||||||
| |
(in thousands) |
|||||||||
Unrecognized benefit—beginning of period |
$ | 991 | $ | 472 | $ | — | ||||
Gross increases (decreases)—prior period tax positions |
75 | 34 | — | |||||||
Gross increases (decreases)—current period tax positions |
765 | 485 | 472 | |||||||
| | | | | | | | | | | |
Unrecognized benefit—end of period |
$ | 1,831 | $ | 991 | $ | 472 | ||||
| | | | | | | | | | | |
| | | | | | | | | | | |
| | | | | | | | | | | |
All of the unrecognized tax benefits as of December 31, 2015 are accounted for as a reduction in the Company's deferred tax assets. Due to the Company's valuation allowance, none of the $1.8 million of unrecognized tax benefits would affect the Company's effective tax rate, if recognized.
The Company recognizes interest and penalties related to unrecognized tax benefits as income tax expense. There is no interest or penalties accrued related to unrecognized tax benefits for the 2015, 2014 and 2013 and no liability for accrued interest and penalties related to unrecognized tax benefits as of December 31, 2015.
The Company does not expect any significant change in its unrecognized tax benefits during the next twelve months.
12. Employee 401(k) Plan
The Company's employee savings and retirement plan is qualified under Section 401 of the Internal Revenue Code. The plan is available to all regular employees on the Company's U.S. payroll and provides employees with tax-deferred salary deductions and alternative investment options. Employees may contribute up to 90% of their salary up to the statutory prescribed annual limit. In the calendar year 2015, the Company match for employees' contributions to the plan was 25% of the first 6% deferred. The Company's matching contributions to the plan totaled $1.1 million in 2015.
112
MARKETO, INC.
Notes to Consolidated Financial Statements (Continued)
13. Segment Information and Information about Geographic Areas
The accounting principles guiding disclosures about segments of an enterprise and related information establishes standards for the reporting by business enterprises of information about operating segments, products and services, geographic areas, and major customers. The method of determining which information is reported is based on the way that management organizes the operating segments within the Company for making operational decisions and assessments of financial performance. The Company's chief operating decision maker (the CODM) is considered to be the Company's chief executive officer (CEO). The CODM reviews financial information presented on a consolidated basis for purposes of making operating decisions and assessing financial performance. As such, the Company is determined to be operating in one business segment.
All of the Company's principal operations and decision-making functions are located in the United States.
Revenue
Revenue by geography is based on the shipping address of the customer. The following table presents the Company's revenue by geographic region for the periods presented:
| |
Year Ended December 31, | |||||||||
|---|---|---|---|---|---|---|---|---|---|---|
| |
2015 | 2014 | 2013 | |||||||
| |
(in thousands) |
|||||||||
United States |
$ | 177,730 | $ | 125,737 | $ | 82,019 | ||||
EMEA |
14,438 | 12,772 | 6,989 | |||||||
Other |
17,701 | 11,445 | 6,910 | |||||||
| | | | | | | | | | | |
Total |
$ | 209,869 | $ | 149,954 | $ | 95,918 | ||||
| | | | | | | | | | | |
| | | | | | | | | | | |
| | | | | | | | | | | |
No single customer accounted for more than 10% of the Company's total revenue in 2015, 2014 and 2013. No single customer accounted for more than 10% of accounts receivable as of December 31, 2015 and 2014.
Long-lived Assets
The following table sets forth the Company's long-lived assets by geographic areas as of the periods presented:
| |
Year Ended December 31, |
||||||
|---|---|---|---|---|---|---|---|
| |
2015 | 2014 | |||||
| |
(in thousands) |
||||||
United States |
$ | 19,508 | $ | 16,265 | |||
EMEA |
327 | 209 | |||||
Other |
1,488 | 358 | |||||
| | | | | | | | |
Total |
21,323 | 16,832 | |||||
| | | | | | | | |
| | | | | | | | |
| | | | | | | | |
113
MARKETO, INC.
Notes to Consolidated Financial Statements (Continued)
14. Subsequent Events
Subsequent to December 31, 2015, the Company entered into an amendment to extend and expand its current lease facilities in San Mateo, CA, which extends its operating lease commitments through August 2022. In conjunction with the amendment to the San Mateo lease agreement, the Company is required to enter into a standby letter of credit of approximately $0.7 million with a bank as security for the amended lease agreement. These lease agreements have the following impact on lease commitments presented in Note 8 Commitments and Contingencies:
| |
Incremental Minimum Lease Payments |
|||
|---|---|---|---|---|
| |
(in thousands) |
|||
2016 |
195 | |||
2017 |
1,418 | |||
2018 |
3,985 | |||
2019 |
8,154 | |||
2020 |
8,400 | |||
Thereafter |
14,535 | |||
| | | | | |
Total |
$ | 36,687 | ||
| | | | | |
| | | | | |
| | | | | |
114
SUPPLEMENTARY QUARTERLY FINANCIAL DATA (UNAUDITED)
| |
First Quarter | Second Quarter | Third Quarter | Fourth Quarter | |||||||||
|---|---|---|---|---|---|---|---|---|---|---|---|---|---|
| |
(in thousands, except per share data) |
||||||||||||
Fiscal Year 2015 |
|||||||||||||
Total revenue |
$ | 46,000 | $ | 50,680 | $ | 54,922 | $ | 58,267 | |||||
Total gross profit |
29,589 | 32,733 | 36,261 | 39,170 | |||||||||
Net loss |
(18,612 | ) | (17,453 | ) | (16,975 | ) | (16,039 | ) | |||||
Net loss and adjustment attributable to redeemable non-controlling interests |
454 | (497 | ) | (1,263 | ) | (1,112 | ) | ||||||
Net loss attributable to Marketo |
(18,158 | ) | (17,950 | ) | (18,238 | ) | (17,151 | ) | |||||
Net loss per share of common stock, basic and diluted |
$ | (0.44 | ) | $ | (0.43 | ) | $ | (0.43 | ) | $ | (0.40 | ) | |
Fiscal Year 2014 |
|||||||||||||
Total revenue |
$ | 32,292 | $ | 36,030 | $ | 39,287 | $ | 42,345 | |||||
Total gross profit |
21,216 | 23,614 | 26,062 | 28,261 | |||||||||
Net loss |
(12,520 | ) | (13,271 | ) | (13,009 | ) | (16,155 | ) | |||||
Net loss attributable to redeemable non-controlling interests |
11 | 159 | 206 | 242 | |||||||||
Net loss attributable to Marketo |
(12,509 | ) | (13,112 | ) | (12,803 | ) | (15,913 | ) | |||||
Net loss per share of common stock, basic and diluted |
$ | (0.32 | ) | $ | (0.33 | ) | $ | (0.31 | ) | $ | (0.39 | ) | |
Net loss per share of common stock for the four quarters of each year in the table above may not sum to the total for each year because of the different number of weighted-average shares outstanding in each respective period.
115
Item 9. Changes in and Disagreements with Accountants on Accounting and Financial Disclosure
Not Applicable
Item 9A. Controls and Procedures
Evaluation of Disclosure Controls and Procedures
Our management, with the participation of our Chief Executive Officer ("CEO") and Chief Financial Officer ("CFO"), has evaluated the effectiveness of our disclosure controls and procedures (as defined in Rules 13a-15(e) and 15d- 15(e) under the Securities Exchange Act of 1934, as amended (the Exchange Act), as of the end of the period covered by this Annual Report on Form 10-K. Based on such evaluation, our CEO and CFO have concluded that as of such date, our disclosure controls and procedures were effective.
Management's Report on Internal Control Over Financial Reporting
Our management is responsible for establishing and maintaining adequate internal control over financial reporting (as defined in Rule 13a-15(f) under the Exchange Act). Our management conducted an assessment of the effectiveness of our internal control over financial reporting based on the criteria set forth in Internal Control—Integrated Framework issued by the Committee of Sponsoring Organizations of the Treadway Commission (2013 Framework). Our internal control system is designed to provide reasonable assurance regarding the preparation and fair presentation of financial statements for external purposes in accordance with generally accepted accounting principles. All internal control systems, no matter how well designed, have inherent limitations and can only provide reasonable assurance that the objectives of the internal control systems are met. Based on the assessment, management has concluded that our internal control over financial reporting was effective as of December 31, 2015. This Annual Report on Form 10-K does not include an attestation report of our registered public accounting firm on our internal control over financial reporting due to an exemption established by the JOBS Act for "emerging growth companies."
Changes in Internal Control over Financial Reporting
There were no changes in our internal control over financial reporting during our most recently completed fiscal quarter that have materially affected, or are reasonably likely to materially affect, our internal control over financial reporting.
None.
116
Item 10. Directors, Executive Officers and Corporate Governance
The information required by this item will be included under the caption "Directors, Executive Officers and Corporate Governance" in our Proxy Statement for the 2015 Annual Meeting of Stockholders to be filed with the SEC on or before April 30, 2016 (the 2016 Proxy Statement) and is incorporated herein by reference.
We have a code of business ethics and conduct that applies to all of our employees, including our Principal Executive Officer, Principal Financial Officer and our board of directors. A copy of this code, "Code of Business Ethics and Conduct," is available on our website at http://investors.marketo.com. We intend to satisfy the disclosure requirement under Item 5.05 of Form 8-K regarding amendment to, or waiver from, a provision of our Global Code of Business Conduct and Ethics by posting such information on our investor relations website under the heading "Corporate Governance" at http://investors.marketo.com/.
Item 11. Executive Compensation
The information required by this item will be included under the captions "Executive Compensation" and under the subheadings "Board's Role in Risk Oversight," "Non-Employee Director Compensation, "Outside Director Compensation Policy," and "Compensation Committee Interlocks and Insider Participation" under the heading "Directors, Executive Officers and Corporate Governance" in the 2016 Proxy Statement and is incorporated herein by reference.
Item 12. Security Ownership of Certain Beneficial Owners and Management and Related Stockholder Matters
The information required by this item will be included under the captions "Security Ownership of Certain Beneficial Owners and Management" and under the subheading "Equity Benefit and Stock Plans" under the heading "Executive Compensation" in the 2016 Proxy Statement and is incorporated herein by reference.
Item 13. Certain Relationships and Related Transactions, and Director Independence
The information required by this item will be included under the captions "Certain Relationships and Related Transactions" and "Directors, Executive Officers and Corporate Governance—Director Independence" in the 2016 Proxy Statement and is incorporated herein by reference.
Item 14. Principal Accountant Fees and Services
The information required by this item will be included under the caption "Proposal Two: Ratification of Selection of Independent Registered Public Accountants" in the 2016 Proxy Statement and is incorporated herein by reference.
117
Item 15. Exhibits, Financial Statement Schedules
(a) The following documents are filed as part of this report:
1. Consolidated Financial Statements
See Index to Consolidated Financial Statements at Item 8 herein.
2. Financial Statement Schedules
Schedules not listed above have been omitted because the information required to be set forth therein is not applicable or is shown in the financial statements or notes herein.
3. Exhibits
The documents listed in the Exhibit Index of this report are incorporated by reference or are filed with this report, in each case as indicated therein (numbered in accordance with Item 601 of Regulation S-K).
118
Pursuant to the requirements of Section 13 or 15(d) of the Securities Exchange Act of 1934, the registrant has duly caused this report to be signed on its behalf by the undersigned thereunto duly authorized.
|
MARKETO, INC. | |||
Date: March 4, 2016 |
By: |
/s/ FREDERICK A. BALL |
||
POWER OF ATTORNEY
KNOW ALL THESE PERSONS BY THESE PRESENTS, that each person whose signature appears below constitutes and appoints Phillip M. Fernandez and Frederick A. Ball, and each of them, his attorneys-in-fact, each with full power of substitution, for him in any and all capacities, to sign any and all amendments to this Annual Report on Form 10-K, and to file the same, with exhibits thereto and other documents in connection therewith, with the Securities and Exchange Commission, hereby ratifying and confirming all that each said attorneys-in-fact or his substitute or substitutes, may do or cause to be done by virtue hereof.
Pursuant to the requirements of the Securities Exchange Act of 1934, this Annual Report on Form 10-K has been signed below by the following persons on behalf of the registrant and in the capacities and on the dates indicated.
Signature
|
Title
|
Date
|
||
|---|---|---|---|---|
| /s/ PHILLIP M. FERNANDEZ Phillip M. Fernandez |
President, Chief Executive Officer and Director (Principal Executive Officer) | March 4, 2016 | ||
/s/ FREDERICK A. BALL Frederick A. Ball |
Senior Vice President and Chief Financial Officer (Principal Financial and Accounting Officer) |
March 4, 2016 |
||
/s/ NEERAJ AGRAWAL Neeraj Agrawal |
Director |
March 4, 2016 |
||
/s/ LYNNE BIGGAR Lynne Biggar |
Director |
March 4, 2016 |
||
/s/ SUSAN L. BOSTROM Susan L. Bostrom |
Director |
March 4, 2016 |
119
Signature
|
Title
|
Date
|
||
|---|---|---|---|---|
| /s/ CAMBRIA W. DUNAWAY Cambria W. Dunaway |
Director | March 4, 2016 | ||
/s/ TAE HEA NAHM Tae Hea Nahm |
Director |
March 4, 2016 |
||
/s/ ROGER S. SIBONI Roger S. Siboni |
Director |
March 4, 2016 |
||
/s/ WESLEY R. WASSON Wesley R. Wasson |
Director |
March 4, 2016 |
120
| Exhibit Number |
Description | Incorporated by Reference From Form |
Incorporated by Reference From Exhibit Number |
Date Filed | ||||||
|---|---|---|---|---|---|---|---|---|---|---|
| 3.1 | Amended and Restated Certificate of Incorporation | 10-Q | 3.1 | August 9, 2013 | ||||||
| 3.2 | Bylaws of the Company dated May 22, 2013 | 10-Q | 3.2 | August 9, 2013 | ||||||
| 4.1 | Amended and Restated Investor Rights Agreement, dated November 15, 2011, by and among the Registrant and certain of its stockholders, as amended on April 17, 2012. | S-1 | 4.1 | April 2, 2013 | ||||||
| 4.2 | Second Amendment to Amended and Restated Investor Rights Agreement, dated May 22, 2013, by and among the Company and certain of its stockholders | 10-Q | 4.1 | August 9, 2013 | ||||||
| 10.1 | Form of Indemnification Agreement between the Registrant and each of its directors and executive officers. | S-1 | 10.1 | April 2, 2013 | ||||||
| 10.2 | 2006 Stock Plan, as amended, and forms of agreements thereunder. | S-1 | 10.2 | April 2, 2013 | ||||||
| 10.3 | 2013 Equity Incentive Plan | 10-K | 10.3 | March 3, 2014 | ||||||
| 10.3.1 | 2013 Equity Incentive Plan—Form of stock option agreement | 10-K | 10.3.1 | March 3, 2014 | ||||||
| 10.3.2 | 2013 Equity Incentive Plan—Form of restricted stock unit agreement | 10-K | 10.3.2 | March 3, 2014 | ||||||
| 10.3.3 | 2013 Equity Incentive Plan—Form of performance share agreement | 8-K | 10.1 | February 11, 2015 | ||||||
| 10.4 | 2013 Employee Stock Purchase Plan and form of agreement thereunder | S-1/A | 10.4 | May 6, 2013 | ||||||
| 10.5 | Compensation Summary Sheet for Phillip M. Fernandez. | 10-K | 10.5 | March 3, 2014 | ||||||
| 10.6 | Management Retention Agreement, effective as of July 24, 2012, by and between the Registrant and Phillip M. Fernandez. | S-1 | 10.6 | April 2, 2013 | ||||||
| 10.7 | Offer Letter, dated April 5, 2011, by and between the Registrant and Frederick A. Ball. | S-1 | 10.7 | April 2, 2013 | ||||||
| Exhibit Number |
Description | Incorporated by Reference From Form |
Incorporated by Reference From Exhibit Number |
Date Filed | ||||||
|---|---|---|---|---|---|---|---|---|---|---|
| 10.8 | Management Retention Agreement, effective as of July 24, 2012, by and between the Registrant and Frederick A. Ball. | S-1 | 10.8 | April 2, 2013 | ||||||
| 10.9 | Offer Letter, dated January 13, 2012, by and between the Registrant and Jason L. Holmes. | S-1 | 10.14 | April 2, 2013 | ||||||
| 10.10 | Management Retention Agreement, effective as of July 24, 2012, by and between the Registrant and Jason L. Holmes. | S-1 | 10.15 | April 2, 2013 | ||||||
| 10.11 | Change in Control Acceleration Policy. | S-1 | 10.20 | April 2, 2013 | ||||||
| 10.12 | Loan and Security Agreement, dated May 21, 2012, by and between the Registrant and Silicon Valley Bank. | S-1 | 10.22 | April 2, 2013 | ||||||
| 10.12.1 | First Amendment to Loan and Security Agreement, dated June 6, 2013, between the Company and Silicon Valley Bank. | 10-Q | 10.3 | August 9, 2013 | ||||||
| 10.12.2 | Second Amendment to Loan and Security Agreement, dated May 5, 2014, between the Company and Silicon Valley Bank | 10-Q | 10.1 | August 11, 2014 | ||||||
| 10.13 | Amendment to Management Retention Agreement, effective as of November 13, 2013, by and between the Registrant and Philip M. Fernandez. | S-1 | 10.13 | December 23, 2013 | ||||||
| 10.14 | Amendment to Management Retention Agreement, effective as of November 13, 2013, by and between the Registrant and Frederick A. Ball. | S-1 | 10.14 | December 23, 2013 | ||||||
| 10.15 | Offer Letter, dated August 14, 2014, by and between the Registrant and Steve Winter. | 10-K | 10.24 | March 12, 2015 | ||||||
| 10.16 | Management Retention Agreement, effective as of October 30, 2014, by and between the Registrant and Steve Winter. | 10-K | 10.25 | March 12, 2015 | ||||||
| 21.1 | List of subsidiaries of the Registrant. | Filed herewith | ||||||||
| 23.1 | Consent of KPMG LLP, Independent Registered Public Accounting Firm. | Filed herewith | ||||||||
| Exhibit Number |
Description | Incorporated by Reference From Form |
Incorporated by Reference From Exhibit Number |
Date Filed | ||||||
|---|---|---|---|---|---|---|---|---|---|---|
| 31.1 | Certification of the Chief Executive Officer pursuant to Section 302 of the Sarbanes-Oxley Act. | Filed herewith | ||||||||
| 31.2 | Certification of the Chief Financial Officer pursuant to Section 302 of the Sarbanes-Oxley Act. | Filed herewith | ||||||||
| 32.1 | * | Certification of the Chief Executive Officer pursuant to Section 906 of the Sarbanes-Oxley Act. | Furnished herewith | |||||||
| 32.2 | * | Certification of the Chief Financial Officer pursuant to Section 906 of the Sarbanes-Oxley Act. | Furnished herewith | |||||||
| 101 | The following materials from the Marketo, Inc. Form 10-K for the year ended December 31, 2015 formatted in Extensible Business Reporting Language (XBRL): (i)the Consolidated Balance Sheets, (ii) the Consolidated Statements of Operations and Comprehensive Loss, (iii) Consolidated Statements of Stockholders' Equity, (iv) Consolidated Statements of Cash Flows and (v) Notes to the Consolidated Financial Statements. | Filed herewith | ||||||||
- *
- The certifications furnished in Exhibits 32.1 and 32.2 hereto are deemed to accompany this Annual Report on Form 10-K and will not be deemed "filed" for purposes of Section 18 of the Securities Exchange Act of 1934, as amended. Such certifications will not be deemed to be incorporated by reference into any filings under the Securities Act of 1933, as amended, or the Securities Exchange Act of 1934, as amended, except to the extent that the registrant specifically incorporates them by reference.