Attached files
| file | filename |
|---|---|
| EX-32.1 - EX-32.1 - Imprivata Inc | impr-ex321_9.htm |
| EX-31.1 - EX-31.1 - Imprivata Inc | impr-ex311_7.htm |
| EX-31.2 - EX-31.2 - Imprivata Inc | impr-ex312_8.htm |
| EX-21.1 - EX-21.1 - Imprivata Inc | impr-ex211_296.htm |
| EX-10.9 - EX-10.9 - Imprivata Inc | impr-ex109_815.htm |
| EX-23.1 - EX-23.1 - Imprivata Inc | impr-ex231_503.htm |
UNITED STATES
SECURITIES AND EXCHANGE COMMISSION
WASHINGTON, D.C. 20549
FORM 10-K
(Mark one)
|
x |
ANNUAL REPORT PURSUANT TO SECTION 13 OR 15(d) OF THE SECURITIES EXCHANGE ACT OF 1934 |
For the fiscal year ended December 31, 2015
or
|
o |
TRANSITION REPORT PURSUANT TO SECTION 13 OR 15(d) OF THE SECURITIES EXCHANGE ACT OF 1934 |
For the transition period from to
Commission file number 001-36516
IMPRIVATA, INC.
(Exact name of Registrant as specified in its charter)
|
Delaware |
04-3560178 |
|
(State or other jurisdiction of incorporation or organization) |
(IRS Employer Identification No.) |
|
|
|
|
10 Maguire Road Lexington, Massachusetts |
02421 |
|
(Address of principal executive offices) |
(Zip Code) |
Registrant’s telephone number, including area code: (781) 674-2700
Securities registered pursuant to Section 12(b) of the Act:
|
Title of Each Class: |
Name of Each Exchange on which Registered |
|
Common Stock, par value $0.001 per share |
The New York Stock Exchange |
Securities registered pursuant to Section 12(g) of the Act: None
Indicate by check mark if the registrant is a well-known seasoned issuer, as defined in Rule 405 of the Securities Act. o Yes x No
Indicate by check mark if the registrant is not required to file reports pursuant to Section 13 or Section 15(d) of the Act o Yes x No
Indicate by check mark whether the registrant (1) has filed all reports required to be filed by Section 13 or 15(d) of the Securities Exchange Act of 1934 during the preceding 12 months (or for such shorter period that the registrant was required to file such reports), and (2) has been subject to such filing requirements for the past 90 days. x Yes o No
Indicate by check mark whether the registrant has submitted electronically and posted on its corporate Web site, if any, every Interactive Data File required to be submitted and posted pursuant to Rule 405 of Regulation S-T (§232.405 of this chapter) during the preceding 12 months (or for such shorter period that the registrant was required to submit and post such files). x Yes o No
Indicate by check mark if disclosure of delinquent filers pursuant to Item 405 of Regulation S-K is not contained herein, and will not be contained to the best of registrant’s knowledge, in definitive proxy or information statements incorporated by reference in Part III of this Form 10-K or any amendment to this Form 10-K. x
Indicate by check mark whether the registrant is a large accelerated filer, an accelerated filer, a non-accelerated filer, or a smaller reporting company. See definitions of “large accelerated filer,” “accelerated filer” and “smaller reporting company” in Rule 12b-2 of the Exchange Act.
|
Large accelerated filer |
o |
|
Accelerated filer |
x |
|
Non-accelerated filer |
o (Do not check if a smaller reporting company) |
Smaller reporting company |
o |
|
Indicate by check mark whether the registrant is a shell company (as defined in Rule 12b-2 of the Exchange Act). o Yes x No
Aggregate market value of registrant’s common stock held by non-affiliates of the registrant, based upon the closing price of a share of the registrant’s common stock on June 30, 2015 as reported by the New York Stock Exchange on that date: $137.1 million
Number of shares of the registrant’s common stock outstanding as of February 23, 2016: 25,110,044
DOCUMENTS INCORPORATED BY REFERENCE
Portions of the registrant’s Proxy Statement relating to the registrant’s 2016 Annual Meeting of Shareholders are incorporated by reference into Part III of this Annual Report on Form 10-K where indicated.
|
|
||
|
Item 1. |
4 |
|
|
|
|
|
|
Item 1A. |
11 |
|
|
|
|
|
|
Item 1B. |
29 |
|
|
|
|
|
|
Item 2. |
29 |
|
|
|
|
|
|
Item 3. |
29 |
|
|
|
|
|
|
Item 4. |
29 |
|
|
|
|
|
|
|
||
|
|
||
|
Item 5. |
30 |
|
|
|
|
|
|
Item 6. |
32 |
|
|
|
|
|
|
Item 7. |
Management’s Discussion and Analysis of Financial Condition and Results of Operations |
33 |
|
|
|
|
|
Item 7A. |
48 |
|
|
|
|
|
|
Item 8. |
50 |
|
|
|
|
|
|
Item 9. |
Changes in and Disagreements with Accountants on Accounting and Financial Disclosure |
84 |
|
|
|
|
|
Item 9A. |
84 |
|
|
|
|
|
|
Item 9B. |
84 |
|
|
|
|
|
|
|
||
|
|
||
|
Item 10. |
85 |
|
|
|
|
|
|
Item 11. |
85 |
|
|
|
|
|
|
Item 12. |
Security Ownership of Certain Beneficial Owners and Management and Related Stockholder Matters |
85 |
|
|
|
|
|
Item 13. |
Certain Relationships and Related Transactions, and Director Independence |
85 |
|
|
|
|
|
Item 14. |
85 |
|
|
|
|
|
|
|
||
|
|
||
|
Item 15. |
85 |
|
|
|
|
|
|
|
86 |
|
2
Special note regarding forward-looking statements and industry data
This Annual Report on Form 10-K, including the information incorporated by reference herein, contains, in addition to historical information, forward-looking statements within the meaning of Section 27A of the Securities Act of 1933 and Section 21E of the Securities Exchange Act of 1934.
These forward-looking statements are based on our current expectations, assumptions, estimates and projections regarding our business and industry, and we do not undertake an obligation to update our forward-looking statements to reflect future events or circumstances. We may, in some cases, use words such as “anticipate,” “believe,” “contemplate,” “continue,” “could,” “estimate,” “expect,” “intend,” “may,” “plan,” “potential,” “predict,” “project,” “seek,” “should,” “target,” “will,” “would,” or the negative of these words or other comparable terminology. These forward-looking statements include, but are not limited to, statements about:
|
|
• |
the size and growth of the potential markets for our products and our ability to serve those markets; |
|
|
• |
the rate and degree of market acceptance of our products; |
|
|
• |
our expectations regarding our products’ performance; |
|
|
• |
the accuracy of our estimates regarding expenses, revenues and capital requirements; |
|
|
• |
regulatory developments in the United States and foreign countries; |
|
|
• |
the success of our sales and marketing capabilities; |
|
|
• |
the success of competing products that are or become available; |
|
|
• |
our ability to obtain additional financing if needed; |
|
|
• |
our ability to obtain and maintain intellectual property protection for our proprietary assets; and |
|
|
• |
the loss of key technology or management personnel. |
Any forward-looking statements in this Annual Report on Form 10-K reflect our current views with respect to future events or to our future financial performance and involve known and unknown risks, uncertainties and other factors that may cause our actual results, performance or achievements to be materially different from any future results, performance or achievements expressed or implied by these forward-looking statements. Factors that may cause actual results to differ materially from current expectations include, among other things, those listed under “Part I, Item 1A. Risk factors” and elsewhere in this Annual Report on Form 10-K. Given these uncertainties, you should not place undue reliance on these forward-looking statements. Except as required by law, we assume no obligation to update or revise these forward-looking statements for any reason, even if new information becomes available in the future.
3
Overview
We are a leading provider of IT security and identity solutions to the healthcare industry that help providers securely and efficiently access, communicate and transact patient health information. Our security and identity platform provides authentication management, fast access to patient information, secure communications and positive patient identification products to address critical security and compliance challenges faced by healthcare organizations, while improving provider productivity and the patient experience. We believe our solutions save clinicians significant time and effort, allowing them to focus on patient care, improve both provider and patient satisfaction, and enable compliance with complex privacy and security regulations. Our solutions can be installed on workstations and other application access points throughout an organization and, once deployed, become a critical part of our customer’s security and identity infrastructure. As a result, we believe that our security and identity products are some of the most widely-used technology solutions deployed by our customers.
With the widespread adoption of healthcare information technology systems and increasing security and privacy regulations, demand for our solutions has grown. Our revenue growth is derived from both sales to new customers as well as add-on sales to our existing customer base. Consistent with our healthcare focused strategy, our customers, including large integrated healthcare systems, academic medical centers and small- and medium-sized independent healthcare facilities, accounted for the majority of the growth in sales to new customers. Many of our customers continue to add licensed users and purchase additional products and services from us after the initial sale.
Our flagship solution, Imprivata OneSign, is a comprehensive enterprise single sign-on and access management platform for healthcare. Imprivata OneSign is used by our customers to solve three critical IT security problems in their organizations. First, Imprivata OneSign allows our customers to replace username and password-based authentication with a stronger and more efficient form of authentication technology, such as fingerprint biometrics, proximity cards, and smartcards, which we refer to collectively as authentication management. Second, Imprivata OneSign also allows our customers to eliminate multiple log-ons to different applications by using a single log-on, which we refer to as enterprise single sign-on. Third, using authentication management, single sign-on, and our other offerings, including integration with leading electronic health record systems and virtual desktop infrastructure, Imprivata OneSign allows our customers to strengthen security while optimizing clinical workflows, which we refer to as workflow automation. All of our solutions, which consist of Imprivata Cortext, Imprivata Confirm ID and Imprivata PatientSecure in addition to Imprivata OneSign, have been designed to be easy to implement, use and manage in complex healthcare environments and may be purchased together or separately.
We believe that healthcare organizations that rely on information technology are potential customers for our solutions, including large integrated healthcare systems, academic medical centers, and small- and medium-sized independent healthcare facilities. Following the initial sale, many of our healthcare customers continue to add licensed users and purchase additional products and services from us. Although healthcare is our primary focus, we also sell to non-healthcare organizations, including financial services, the public sector and other industries. We sell our solutions through our direct sales force and sales partners in the United States and internationally.
We are focused on growing our business to pursue the significant market opportunity we see for our products and services, and we plan to continue to invest in the growth of our business. As a result, we expect to incur significant operating costs relating to the research and development initiatives for our new and existing solutions and products, and for the expansion of our sales and marketing operations as we hire additional sales personnel, and to increase our marketing efforts and expand into new geographical markets. We also expect to maintain our general and administrative expenses to continue to comply with the requirements of being a public company.
Benefits of our solutions
We believe our solutions provide the following key benefits:
|
|
• |
Help healthcare organizations comply with security and privacy regulations: By securing access to workstations in the healthcare organization, our solutions help reduce the risk of breaching security or privacy regulations. For example, Imprivata OneSign, as a critical part of our customers’ security and identity infrastructure, can be deployed at every application access point in the healthcare organization, thereby limiting the risk of a privacy breach. For example, HIPAA requires specific policies, procedures and security controls for access to protected health information, or PHI, wherever it is located or accessed. |
4
|
|
• |
Improve clinician satisfaction by optimizing workflows: Imprivata OneSign optimizes clinical workflows, through authentication management, enterprise single sign-on and workflow enhancements. Our solutions address clinical workflow challenges such as switching users rapidly on a shared workstation, keeping a session active as a clinician moves throughout the hospital in providing care, and automating navigation between applications based on individual clinician preferences. We believe that these and other workflow enhancements increase clinician satisfaction. |
|
|
• |
Improve financial performance: We believe that our solutions improve the financial performance of healthcare organizations by enhancing clinician productivity and increasing utilization of investments in electronic health record, or EHR, systems and other healthcare information technologies. In the United States, we help our customers achieve meaningful use and qualify for the financial incentives available through the Health Information Technology for Economic and Clinical Health, or HITECH Act. In addition, we believe that our solutions reduce the number of help desk calls and costs associated with forgotten passwords. |
Our strengths
We believe that the following strengths will enable us to maintain and extend our leadership position as a provider of IT security and identity solutions in the healthcare industry:
|
|
• |
Compelling feature set and ease of implementation, use and management: We provide our customers with compelling features that differentiate Imprivata OneSign as an enterprise-wide authentication and access management solution, including finger biometric identification, integrated authentication and enterprise single sign-on, application programming interfaces for independent software vendors, virtual desktop support with multiple vendors, including zero- and thin-client devices, and new solutions. Our Imprivata OneSign solution is designed to be easy to implement throughout the enterprise by information technology personnel, easy to use by clinicians, and easy to manage by IT administrators. |
|
|
• |
Our healthcare customers view us as fundamental to their security and compliance solutions: We believe our healthcare customers view us as a strategic partner to help them optimize clinical workflow, improve clinician satisfaction and comply with changing regulatory requirements. Our customers routinely identify specific challenges in the clinical setting and request that we develop innovative solutions to address them. Recent product developments, such as virtual desktop automation, fade-to-lock and authentication for electronic prescribing resulted from these customer interactions. |
|
|
• |
Stable customer base with significant additional sales opportunities: Many of our customers continue to add licensed users and purchase additional products and services from us after the initial sale. For example, add-on sales to existing customers accounted for over half of our new product revenues in the years ended December 31, 2015, 2014, and 2013. In the years ended December 31, 2015, 2014, and 2013, we derived 43%, 38%, and 38%, respectively, of our revenue from sales to existing customers, 22%, 26%, and 30%, respectively, of our total revenue from sales to new customers, with the remaining revenue in each of those periods from software maintenance renewals and professional services. In addition, in the year ended December 31, 2015, we retained greater than 90% of the aggregate dollar value of maintenance contracts up for renewal by all customers and the aggregate dollar value of maintenance contracts up for renewal by healthcare customers. The consistency of add-on sales to existing customers and the recurring nature of our maintenance revenues provide visibility into our future performance. |
|
|
• |
Global distribution network and strong selling relationships: We access our customers through multiple channels, including a global direct sales force and a network of sales partners, to sell our solutions worldwide. As of December 31, 2015, our direct sales force consisted of 105 people in the United States and internationally. Our sales partners consist of value-added resellers and electronic health record, or EHR systems vendors that resell our Imprivata OneSign solution on a standalone basis or as part of an integrated solution. We also have country- and region-specific sales partners targeting selected international markets. In each of the years ended December 31, 2015, 2014, and 2013, we generated approximately 57%, 57%, and 59%, respectively, of our revenue through our relationships with sales partners. |
|
|
• |
Our partner ecosystem: We have strategic relationships with leading EHR systems, virtual desktop infrastructure platforms and device vendors that provide the ability to integrate our solutions with their products and services. Integration with EHR systems, such as EpicCare and Cerner Millennium, allows us to streamline clinical workflow and improve clinician experience. Integration with virtual desktop infrastructure computing environments, such as VMware Horizon View, Citrix XenApp and Citrix XenDesktop, allows us to streamline the authentication process and control and improve the visual experience. Integration with chip and protocol suppliers, such as Teradici, allow us to incorporate our authentication functionality directly into thin and zero client devices. |
5
Our strategy
Our goal is to extend our leadership position as a provider of IT security and identity solutions to the healthcare industry that help providers securely and efficiently access, communicate and transact patient health information.
Key elements of our strategy include:
|
|
• |
Acquire new healthcare customers: We believe our Imprivata OneSign solution can provide significant value to both large and small hospitals and other healthcare organizations that do not currently license our solutions. |
|
|
• |
Drive further penetration into our installed base of customers: Our customers’ initial purchases rarely include all of our solutions for all of their users. As a result, many of our customers continue to add licensed users and purchase additional products and services from us after the initial sale. For example, these add-on sales accounted for over half of our new product revenues in the years ended December 31, 2015, 2014, and 2013. In the years ended December 31, 2015, 2014, and 2013, we derived 43%, 38%, and 38%, respectively, of our revenue from sales to existing customers, 22%, 26%, and 30%, respectively, of our revenue from sales to new customers, with the remaining revenue in each of those periods from software maintenance renewals and professional services. We plan to add sales and customer experience personnel in order to grow our revenue from our installed base. |
|
|
• |
Extend our security and identity technology leadership, develop innovative products and address additional workflow challenges: We intend to continue our investment in research and development to further differentiate and enhance the functionality of our solutions. We plan to also invest in developing new products and solutions that expand the range of security, productivity and workflow optimization solutions we offer to healthcare organizations. For example, with our Imprivata Cortext solution, we are beginning to provide a secure communication solution for healthcare organizations. In addition, with our Imprivata Confirm ID solution, we are beginning to provide a secure e-prescribing solution for healthcare organizations, and with our Imprivata PatientSecure solution we are beginning to provide a positive patient identification solution to the healthcare industry. |
|
|
• |
Grow our international healthcare presence: In addition to our core market in the United States, we offer our solutions in more than 20 countries, including Australia, Belgium, Canada, Denmark, France, Germany, the Netherlands, the United Arab Emirates and the United Kingdom. We plan to utilize both our direct sales force and local sales partners to expand our presence in countries throughout Europe and develop new markets in Latin America, Middle East and Asia Pacific regions. |
|
|
• |
Expand our solutions into new healthcare settings: Our solutions today are primarily sold to hospitals and other inpatient healthcare facilities, but there is an opportunity for us to sell our solutions into other healthcare settings as well. For example, we believe there are growth opportunities for our software platform in outpatient or ambulatory facilities in the United States. |
|
|
• |
Acquire complementary businesses, technologies and assets: Since 2010, we have completed three technology-based acquisitions to expand our solutions offering. We may pursue acquisitions that complement our existing business, represent a strategic fit and are consistent with our overall growth strategy. We may also target future acquisitions that reinforce our presence in markets we currently serve or that help us to access new markets, or that add functionality and capabilities to our solutions. |
Our solutions
Our solutions consist of Imprivata OneSign, Imprivata Cortext, Imprivata Confirm ID and Imprivata PatientSecure. We also provide professional services and support capabilities to help our customers realize the full benefits of our solutions.
Imprivata OneSign
Imprivata OneSign is a comprehensive enterprise single sign-on and access management platform for healthcare, comprised of a suite of products that can be delivered either pre-loaded on a hardware server or as a software only solution with all components required to make the solution operational “out-of-the-box.” Imprivata OneSign enables fast, secure access and workflow optimization to workstations and applications. We derive substantially all of our revenue from sales of Imprivata OneSign and its related products and
6
services. Imprivata OneSign consists of three main offerings: Authentication Management, Enterprise Single Sign-On, and Workflow Automation.
Authentication Management is software used to replace the act of manually entering a user’s log-on name and password with a stronger and more convenient form of authentication technology, such as fingerprint biometrics, proximity cards, smartcards or token. This simplifies and secures the user’s access to physical and virtual desktops.
Additional Authentication Management software and hardware products include the following:
|
|
• |
Virtual Desktop Access software enables authentication to virtual desktops for all of the three major virtualization environments: VMware Horizon View, Citrix XenApp, and Citrix XenDesktop. With Virtual Desktop Access, clinicians can quickly and securely “roam” their desktop across locations while preserving their application state. |
|
|
• |
Fingerprint Biometric Identification software enables clinicians to verify their identity and access their desktop and applications with just a touch of a finger. |
|
|
• |
Proximity Card and Fingerprint Readers are authentication devices that connect to workstations. Proximity Card Readers support a broad range of card types and are able to support multiple card types on a single card reader. When used in conjunction with Authentication Management, clinicians no longer need to type in their usernames and passwords multiple times to access applications and workstations. Instead, they simply tap their badge or touch their finger to a reader to gain instant access, delivering significant time savings for clinicians. |
|
|
• |
Self-Service Password Management enables clinicians to securely retrieve or change a lost password, minimizing frustration, interruption and costly user support. |
|
|
• |
Secure Walk-Away enables healthcare organizations to address problems associated with unattended workstations. The solution utilizes facial recognition and motion detection software integrated with commercially available desktop cameras to automatically lock a screen when an authenticated user walks away from the workstation. |
|
|
• |
Enterprise Single Sign-On software simplifies application log-on, automating username and password entry for authenticated users. A licensed user simply completes the initial authentication transaction and subsequent log-ons and log-offs are automated, eliminating the need to separately log-on when accessing workstations or applications. Our Imprivata OneSign solution enables the user to automatically access each application without otherwise modifying it. |
|
|
• |
Imprivata OneSign Anywhere provides remote single sign-on access for enterprise and web-based applications from a web-based browser on home computers and tablet devices. |
|
|
• |
Workflow Automation enables healthcare organizations to automate certain access workflows, such as auto-launching specific applications at the point of a clinician’s authentication to the desktop, roaming a clinician’s desktop as they move from one workstation to another, and enabling users to log into and out of their desktop without going through its log-on and log-off process, which is known as fast user switching. |
|
|
• |
OneSign ProveID API is an application programming interface, which allows for integration with various other healthcare information technologies. Other solution vendors, such as secure print management, medication dispensing units and virtual desktop infrastructure device manufacturers use our OneSign ProveID API to provide access and authentication management capabilities. |
Imprivata Confirm ID
Imprivata Confirm ID is a two factor authentication platform for healthcare. It is a software solution that simplifies the regulatory requirements adopted by the United States Drug Enforcement Administration (the “DEA”) for EPCS helping care providers address the workflow inefficiencies and potential for fraud caused by paper-based prescriptions. The solution helps simplify provider identity proofing, enable supervised enrollment, and enforce two factor authentication requirements while maintaining a comprehensive audit throughout the entire process. Imprivata Confirm ID also integrates with leading EHR systems and offers multiple DEA-approved two-factor authentication options for prescription signing, giving providers a single, consistent e-prescribing experience for all medications, and helping healthcare organizations achieve e-prescribing criteria for meaningful use and qualify for the financial incentives available through the HITECH Act.
Imprivata Confirm ID supports fingerprint biometric identification, hands free one-time-password tokens and traditional passwords, giving providers the option to use the two-factor authentication modalities that best fit their prescribing workflows. Imprivata Confirm ID automates the presentation of the authentication modality, prompting prescribers with only the options available and allowed for EPCS. The solution can operate as part of an integrated Imprivata authentication platform or as a stand-alone solution. This solution was launched in February 2015 and is licensed to our customers on perpetual and on an annual subscription basis.
7
In June 2015, Imprivata ID was launched to deliver secure and efficient two factor authentication, leveraging Bluetooth technology to enable hands free token authentication between a healthcare provider’s smart phone and Imprivata Confirm ID.
Imprivata Cortext
Imprivata Cortext is a cloud-supported secure communications platform that provides healthcare organizations with secure messaging capabilities in compliance with applicable data privacy and security regulations. Imprivata Cortext is offered as a software subscription for iPhone, Android and Blackberry devices as well as desktop and other workstation endpoints. Clinicians use Imprivata Cortext to securely transmit messages and images that may contain PHI in the course of providing patient care, helping healthcare organizations comply with HIPAA regulations while improving and streamlining clinical communication processes for clinicians, decreasing response time by clinicians by up to 88%. Among Imprivata Cortext’s features are multi-device real-time synchronization, persistent alerts and Imprivata OneSign integration.
|
|
• |
Multi-device real-time synchronization—Enables healthcare providers to use Imprivata Cortext across their smartphones, tablets and workstations. All alerts, messages, photos, groups, favorites, contacts and directories sync in real-time across all devices, regardless of which device providers are logged into. |
|
|
• |
Persistent alerts—Similar to pager functionality, Imprivata Cortext allows providers to set persistent alerts to help ensure they don’t miss messages. The length and frequency of the alert can be customized based on user preference. |
|
|
• |
Imprivata OneSign integration—Imprivata Cortext integrates with Imprivata OneSign, to enable single sign-on and re-authentication to the Imprivata Cortext desktop and browser applications. The integration of Imprivata Cortext with Imprivata OneSign streamlines clinical workflow efficiency by giving providers instant access to the secure communications platform from any mobile device or workstation. |
This solution was introduced in October 2012 and the enterprise version of Imprivata Cortext was launched in February 2014. It is offered as a subscription-based service.
Imprivata PatientSecure
Imprivata PatientSecure is a software-based positive patient identification solution that uses palm vein biometrics to accurately and securely identify patients and retrieve their digital health record across multiple clinical systems at the point of care by integrating with existing EHRs as well as admission, discharge and transfer systems that track a patient through care in a healthcare organization, and patient database systems. The Imprivata PatientSecure solution helps improve patient safety, revenue cycle efficiency, and patient experience by reducing duplicate medical records and overlays and helps reduce the risk of identity theft and insurance fraud. On April 30, 2015, we acquired HT Systems, LLC, the developer of Imprivata PatientSecure, and we are currently licensing Imprivata PatientSecure to our customers on a perpetual basis.
Customer experience
We believe that it is important for our customers to realize the full benefits of their investments in our solutions. When our solution is deployed, it is critical to ensure a high degree of uptime for all users because our Imprivata OneSign solution is the access point to all their clinical applications. Although our solutions are easy to use, install and deploy, our customer experience team further works with our customers to ensure successful deployments and utilization of our solutions within existing clinical workflows without disrupting the delivery of patient care.
We provide the following customer services:
|
|
• |
Professional Services provides implementation and deployment services combined with clinical workflow expertise and deployment best practices gained from working with healthcare customers in the United States and globally. These services range across every phase of the deployment lifecycle from workflow analysis, solution readiness, implementation, and ongoing workflow optimization. |
|
|
• |
Customer Support provides technical product support for all of our customers, including those customers who purchase our solutions through our sales partners. All of our customers receive live phone support during business hours and 24-hour access to our online customer support center where they can download new software releases, gain access to our solution knowledge base and manage their support cases. We offer two levels of support: standard and premium. During the years ended December 31, 2015, 2014, and 2013, 65%, 64%, and 61%, respectively, of our customers purchasing customer support purchased premium support, which, as compared to standard customer support, includes 24-by-7 year-round support for critical support cases. |
8
|
|
• |
Customer Education provides online learning, system administration, system implementation and ongoing maintenance training to the customer personnel involved in a deployment of our solutions. |
|
|
• |
Customer Advocacy works with our customers as a single point of contact to help them realize the full benefits of our solutions by understanding their technology roadmap, proactively planning software upgrades and monitoring customer deployment progress. Customer advocates coordinate between professional services, technical support and customer education to deliver services and assist our efforts to respond to customer requests and feedback. |
Sales and marketing
Sales. We use a direct and indirect sales model to reach our customers. In the United States, our regional sales representatives sell primarily to larger healthcare organizations, including new and existing customers. Our inside sales team sells primarily to smaller healthcare organizations, including both new and existing customers. Internationally, our territory representatives are assigned by geography and target both small and large customers. We also employ product sales specialists to assist our regional sales representatives in selling our new product offerings. We extend our sales coverage by utilizing authorized sales partners in the United States and internationally. Our sales partners include EHR vendors, system integrators and value-added resellers. Our agreements with our sales partners and value-added resellers are generally non-exclusive, may be terminated with 60 to 90 days’ notice and do not contain any obligations for renewal. Our sales force is supported by sales engineers.
Marketing. Our marketing efforts are focused on building our brand reputation, increasing market awareness and generating demand for our solutions. This team focuses on product marketing and management, communications, events, international marketing, and public relations functions. Our marketing activities include inbound and outbound lead generation programs, digital media programs such as our website and online advertising, customer advisory boards, industry trade shows and conferences, and press and industry analyst relations.
Customers
Consistent with our healthcare-focused strategy, approximately 87%, 88%, and 84% of our revenue from new sales were attributable to sales to healthcare organizations during the years ended December 31, 2015, 2014 and 2013, respectively.
No single end-customer accounted for more than 4% of our revenue in the years ended December 31, 2015, 2014, and 2013.
We sell our products to healthcare organizations internationally, including organizations in Australia, Belgium, Canada, Denmark, France, Germany, the Netherlands, the United Arab Emirates and the United Kingdom. During the years ended December 31, 2015, 2014 and 2013, markets outside of the United States represented 22%, 21%, and 21% of our revenue, respectively. We expect to continue to derive a substantial portion of our international revenues from foreign government-operated healthcare organizations. Sales to governmental entities present risks in addition to those involved in sales to commercial customers, including potential disruption due to changes in appropriation and spending patterns, delays in budget approvals and exposure to penalties in the event of violations of the Foreign Corrupt Practices Act.
Research and development
Our continued investment in research and development is critical to building innovative solutions and our business. We employ engineers with expertise in various fields, including software and firmware development, database design, user experience, networking, biometrics and mobile communication. We have research and development personnel in Lexington, Massachusetts, Santa Cruz, California, San Francisco, California, Tampa, Florida, and third-party development providers in Lviv, Ukraine and Buenos Aires, Argentina who assist us with quality assurance testing and targeted development projects. The third-party development providers perform services pursuant to statements of work under a master services agreement, which may be terminated by us without cause with 60 days’ notice or by the development provider without cause with 60 days’ notice, unless a statement of work is in progress. As of December 31, 2015, we employed 130 full-time research and development employees and we utilized 59 additional personnel employed by our third-party development providers in Lviv, Ukraine and Buenos Aires, Argentina. Our research and development expenditures were $31.6 million, $25.8 million, and $19.6 million in the years ended December 31, 2015, 2014, and 2013, respectively.
Intellectual property
Our success depends, in part, upon our ability to protect our core technology and intellectual property. To accomplish this, we rely on a combination of intellectual property rights, including patents, trade secrets, copyrights and trademarks, as well as customary contractual provisions to protect our proprietary technology and our brand.
9
We own 28 U.S. patents. The expiration dates of these patents range from November 7, 2016 through July 1, 2034 (not accounting for any patent term extension). Currently we have 14 utility patent applications and 1 provisional patent applications pending in the United States.
We conduct business under Imprivata OneSign, Imprivata Cortext, Imprivata Confirm ID and PatientSecure trademarks, among others. We believe that having distinctive marks may be an important factor in marketing our products. We have registered trademarks in the United States and in selected other jurisdictions. We actively monitor use of our trademarks, and enforce our rights as necessary.
We rely on trade secrets to protect substantial portions of our technology. We generally seek to protect these trade secrets by entering into non-disclosure agreements with our employees and customers and third parties and by restricting access and use of our proprietary software and other confidential information.
Our software is also protected by U.S. and international copyright laws. We also license software from third parties for integration into our Imprivata OneSign solution, including open source software and other software available on commercially reasonable terms.
Competition
Our primary competitor in the healthcare market is Caradigm USA, LLC, a joint venture of General Electric Company and Microsoft Corporation. We also compete with several smaller providers of security and identity solutions focused on the healthcare market, as well as several large security and identity vendors that are not specifically focused on the healthcare market.
We believe that we compete effectively on the basis of the following factors:
|
|
• |
security expertise in the healthcare domain; |
|
|
• |
brand awareness and reputation; |
|
|
• |
breadth of our solutions set and ease of implementation, use and management; |
|
|
• |
breadth of product distribution; |
|
|
• |
strategic relationships and ability to integrate with software and device vendors; and |
|
|
• |
product innovation and ability to meet customer needs. |
Imprivata Cortext, Imprivata Confirm ID and Imprivata PatientSecure each competes in highly fragmented markets, consisting of large numbers of rapidly changing vendors. We may face increased competition in the future, including competition from large, multinational companies with significant resources. Potential competitors may have existing relationships with purchasers of other products and services within the healthcare organization, which may enhance their ability to gain a foothold in our market.
Government regulation
Substantially all of our revenue is derived from the healthcare industry. The healthcare industry is highly regulated and is subject to changing political, legislative, regulatory and other influences which affect the purchasing practices and operations of our customers, as well as the behavior and attitudes of our licensed users. These laws and regulations are broad in scope and they are subject to evolving interpretations. We devote significant efforts to establish and maintain compliance with all regulatory requirements that we believe are applicable to our business and the services we offer. The principal laws and regulations that affect our operations and contractual relationships include:
HIPAA
HIPAA contains substantial restrictions and health data privacy, security and breach notification requirements with respect to the use and disclosure of PHI. HIPAA applies to covered entities, such as healthcare providers that conduct electronic health transactions and health plans. In 2009, the HITECH Act made certain HIPAA privacy and security standards directly applicable to “business associates,” defined as entities that receive or obtain PHI in connection with performing functions on behalf of or providing services to covered entities. Most of our customers are covered entities under HIPAA, and they rely on our solutions to facilitate their compliance with their HIPAA requirements. We are also subject to direct liability under HIPAA as a business associate when we handle and have access to our customers’ PHI, such as through our Imprivata Cortext solution. Accordingly, in the United States, we are subject to HIPAA and its implementing regulations, as well as comparable state privacy and security laws. The HITECH Act increased the penalties for HIPAA violations, which can result in fines of up to $1.5 million per violation (since enactment of the HITECH Act, the average fine per incident has been $1.1 million). For knowing HIPAA violations, criminal penalties include fines of up to $250,000 or 10 years imprisonment. The penalty amount for a violation is determined by the level of neglect or willful behavior exhibited by the
10
business associate. In addition, the HITECH Act gave state attorneys general new authority to file civil actions for damages or injunctions in federal courts on behalf of any resident of their state against business associates to enforce HIPAA and seek attorney’s fees and costs associated with pursuing federal civil action.
Other laws
In addition to HIPAA, most states have enacted confidentiality laws that protect against the unauthorized disclosure of PHI, and many states have adopted or are considering further legislation in this area, including privacy safeguards, security standards and data security breach notification requirements. Such state laws, if more stringent than HIPAA requirements, are not preempted by the federal requirements, and we must comply with them even though they may be subject to different interpretations by various courts and other governmental authorities.
In addition to complying with applicable U.S. law, the use and disclosure of PHI is subject to regulation in other jurisdictions in which we do business or expect to do business in the future. Those jurisdictions may attempt to apply such laws extraterritorially or through treaties or other arrangements with U.S. governmental entities. We might unintentionally violate such laws, such laws may be modified and new laws may be enacted in the future which may increase the chance that we violate them. Any such developments, or developments stemming from enactment or modification of other laws, or the failure by us to comply with their requirements or to accurately anticipate the application or interpretation of these laws, could discourage us from offering certain of our solutions, such as Imprivata Cortext, to customers outside of the United States.
Our solutions utilize encryption technologies that are subject to multilateral export control laws and regulations. Such regulations require us to maintain an encryption registration with the U.S. Department of Commerce and to submit annual reports that identify the encryption-enabled items that we export. Each encryption-enabled product, component or technology that we export is subject to pre-export classification requirement that may in some cases include mandatory pre-export submissions to the U.S. government, and certain encryption-related technical information is subject to case-by-case export licensing to some destinations in which operate or make disclosures to contractors, such as the Ukraine.
The DEA in its Interim Final Rule regarding EPCS, allows providers to send prescriptions for controlled substances to retail pharmacies provided certain identity-proofing requirements of the provider are met and provided further that approved two-factor authentication is used within the electronic prescribing system at the time the prescription is generated. We believe Imprivata Confirm ID will allow EHR vendors that have integrated with the Imprivata Confirm ID application programming interface to meet these requirements.
In New York, the Internet System for Tracking Over-Prescribing (“I-STOP”) law mandates that all patient medications be prescribed electronically by March 27, 2016 in accordance with the DEA regulations referenced above. We believe Imprivata Confirm ID will assist providers in New York to comply with I-STOP, and we anticipate that other states may consider enacting similar laws requiring electronic transmission of prescriptions.
Suppliers
We purchase hardware components that are incorporated into our solutions from various suppliers and manufacturers. For example, we purchase our fingerprint readers from Avnet, Inc., our proximity card readers from RF IDeas, Inc., our palm vein readers from Fujitsu Computer Products of America, Inc., and appliances (servers) from our contract manufacturer Unicom, Inc. according to our specifications including branding. In the event we are unable to procure certain components for our solutions from our suppliers or manufacturers, we may be required to redesign some of our solutions in order to incorporate technology from alternative sources. Some of these components are off-the-shelf while others are components sourced exclusively for us.
Employees
As of December 31, 2015, we had 452 employees, consisting of 130 in research and development, 153 in sales and marketing, 109 in customer experience and support, 44 in general and administrative, and 16 in information technology. None of our employees is covered by a collective bargaining agreement or is represented by a labor union. We consider current employee relations to be good.
These are risks and uncertainties that could cause actual results to differ materially from the results contemplated by the forward-looking statements contained in this Annual Report on Form 10-K. Because of these factors, as well as other variables affecting our operating results, past financial performance should not be considered as a reliable indicator of future performance and investors should not use historical trends to anticipate results or trends in future periods. These risks are not the only ones facing us. Please
11
also see “SPECIAL NOTE REGARDING FORWARD-LOOKING STATEMENTS AND INDUSTRY DATA” earlier in this Annual Report on Form 10-K. The following discussion highlights certain risks which may affect future operating results. These are the risks and uncertainties we believe are most important for our existing and potential stockholders to consider. Additional risks and uncertainties not presently known to us, which we currently deem immaterial or which are similar to those faced by other companies in our industry or business in general, may also impair our business operations. If any of the following risks or uncertainties actually occurs, our business, financial condition, and operating results would likely suffer.
Risks related to our business and industry
We have a history of losses, we expect to continue to incur losses and we may not be profitable in the future.
We incurred a $23.1 million net loss for the year ended December 31, 2015. As of December 31, 2015, we had an accumulated deficit of $130.6 million and we expect to continue to incur operating and net losses for the foreseeable future. Our ability to be profitable in the future depends upon continued demand for our authentication, access management and secure communication solutions for the healthcare industry. In addition, our profitability will be affected by, among other things, our ability to develop and commercialize new solutions and products for those solutions, and our ability to enhance existing solutions and products. Further market adoption of our solutions, including increased penetration within our existing customers, depends upon our ability to address security concerns in the healthcare setting, improve clinical workflows related to the utilization of healthcare information technology systems, and increase clinician productivity. We expect to incur significant operating costs relating to our research and development initiatives for our new and existing solutions and products, and for our expansion of our sales and marketing operations as we add additional sales personnel and increase our marketing efforts. Furthermore, we may incur significant losses in the future for a number of reasons, including the other risks described in this Annual Report on Form 10-K, and we may encounter unforeseen expenses, difficulties, complications, delays and other unknown events. As a result, we cannot assure you that we will be able achieve or sustain profitability in the future.
We depend on sales of our Imprivata OneSign solution in the healthcare industry for a substantial portion of our revenue, and any decrease in its sales would have a material adverse effect on our business, financial condition and results of operations.
A substantial portion of our revenue to date has been derived from sales to the healthcare industry of Imprivata OneSign, our authentication and access solution. We anticipate that sales of our Imprivata OneSign solution to the healthcare industry will continue to represent a substantial portion of our revenue for the foreseeable future. Any decrease in revenue from sales of this solution would have a material adverse effect on our business. Healthcare organizations are currently facing significant budget constraints, increasing demands resulting from a growing number of patients, and impediments to obtaining third-party reimbursements and patient payments for their services. Although healthcare organizations are currently allocating funds for capital and infrastructure improvements to benefit from governmental initiatives, they may not choose to prioritize or implement authentication or access management solutions as part of those efforts at this time, or at all, due to financial and resource constraints. Even if clinicians determine that our Imprivata OneSign solution provides benefits over their existing authentication and access management solutions, their healthcare organizations may not have, or may not be willing to spend, the resources necessary to purchase, install and maintain information technology systems, adopt our Imprivata OneSign solution, add licensed users in other departments or purchase additional products and services from us.
In addition, our healthcare customers have been experiencing consolidation in response to developments generally affecting the healthcare industry. As a result, we may lose existing or potential healthcare customers for our solutions. If our existing customers combine with other healthcare organizations that are not our customers, they may reduce or discontinue their purchases of our solutions. In addition, the combined organizations may have greater leverage in negotiating terms with us, and we may be forced to accept terms that are less favorable to us.
We do not anticipate that sales of our solutions, including Imprivata OneSign, in non-healthcare industries will represent a significant portion of our revenue for the foreseeable future. Additionally, while we expect our Imprivata Confirm ID, Imprivata Cortext and Imprivata PatientSecure solutions will begin contributing to our results in the near future, we will continue to rely on sales of Imprivata OneSign for a substantial portion of our revenue. As a result, decreased revenue from sales of our Imprivata OneSign solution in the healthcare industry would have a material adverse effect on our business, financial condition and results of operations.
We may not be able to attract new customers and retain and increase sales to our existing customers, which could have a material adverse effect on our business, financial condition and results of operations.
Our success and growth strategy depends in part upon the purchase of our authentication, access management and secure communication solutions by new customers. Our sales and marketing efforts seek to demonstrate to potential new customers that our solutions improve security, streamline clinician workflow and increase productivity, enhance the value of existing investments in healthcare information technology, and help ensure compliance with complex privacy and security regulations. If we are not able to persuade new customers that our solutions provide these benefits, or if we fail to generate sufficient sales leads through our marketing
12
programs, then we will not be able to attract new customers, which would have a material adverse effect on our business, financial condition and results of operations.
In most cases, our customers initially license our solutions for a limited number of departments within a healthcare organization. After the initial sale, our customers frequently add licensed users in other departments, functional groups and sites and buy additional products and services over time. Factors that may affect our ability to retain and increase sales to our existing customers include the quality of our customer service, training and technology, as well as our ability to successfully develop and introduce new solutions and products. Additionally, our customers may stop using our solutions or may not renew agreements for services, including software maintenance, for reasons entirely out of our control, such as a reduction in their budgets. If our efforts to satisfy our existing customers are not successful, we may not be able to retain them or sell additional functionality to them, which could have a material adverse effect on our business, financial condition and results of operations.
If we fail to successfully develop and introduce new solutions and products for existing solutions, our business, financial condition and results of operations could be adversely affected.
Our success depends, in part, upon our ability to anticipate industry evolution and introduce or acquire new solutions and products to keep pace with technological developments and market requirements both within our industry and in related industries. However, we may not be able to develop, introduce, acquire and integrate new solutions and products in response to our customers’ changing requirements in a timely manner or on a cost-effective basis, or that sufficiently differentiate us from competing solutions such that customers choose to purchase our solutions. For example, healthcare organizations may shift their existing information technology infrastructure from on-site services to cloud-based services, which may not be compatible with our solutions, requiring us to develop new products or to re-engineer our existing products. In addition, healthcare organizations may adopt mobile applications more quickly than we have anticipated, requiring us to accelerate the development of mobile versions of our solutions. If any of our competitors implement new technologies before we are able to implement them or better anticipates the innovation opportunities in related industries, those competitors may be able to provide more effective or more cost-effective solutions than ours. In addition, we may experience technical problems and additional costs as we introduce new solutions, deploy future iterations of our solutions and integrate new solutions with existing customer systems and workflows. If any of these problems were to arise, our business, financial condition and results of operations could be adversely affected.
Developments in the healthcare industry or regulatory environment could adversely affect our business.
Our growth strategy is focused on the healthcare industry and a substantial portion of our revenue is derived from the healthcare industry. This industry is highly regulated and is subject to changing political, legislative, regulatory and other influences. Developments generally affecting the healthcare industry, including new regulations or new interpretations of existing regulations, such as reductions in funding, changes in pricing for healthcare services or impediments to third-party reimbursement for healthcare costs, may cause deterioration in the financial or business condition of our customers and cause them to reduce their spending on information technology. As a result, these developments could adversely affect our business.
In March 2010, comprehensive healthcare reform legislation was enacted in the United States through the Patient Protection and Affordable Health Care for America Act and the Health Care and Education Reconciliation Act. This law has increased health insurance coverage through individual and employer mandates, subsidies offered to lower income individuals, tax credits available to smaller employers and broadening of Medicaid eligibility, and to affect third-party reimbursement levels for healthcare organizations. We cannot predict what effect federal healthcare reform or any future legislation or regulation, or healthcare initiatives, if any, implemented at the state level, will have on us or our healthcare customers.
In addition, our healthcare customers’ expectations regarding pending or potential industry developments may also affect their budgeting processes and spending plans with respect to our solutions. The healthcare industry has changed significantly in recent years and we expect that significant changes will continue to occur. However, the timing and impact of developments in the healthcare industry are difficult to predict. For instance, our healthcare customers were required to transition to using ICD-10 diagnosis and billing codes, which were time consuming and costly to implement. As our healthcare customers assess the impact of implementing ICD-10, some of our healthcare customers, particularly those at smaller hospitals, have delayed their other IT spending plans. We cannot assure you that the markets for our solutions will continue to exist at current levels or that we will have adequate technical, financial and marketing resources to react to changes in those markets.
Seasonal variations in the purchasing patterns of our customers may lead to fluctuations in our operating results and financial condition.
We have experienced and expect to continue to experience seasonal variations in the timing of customers’ purchases of our solutions. Many customers make purchasing decisions based on their fiscal year budgets, which typically coincide with the calendar year and result in increased purchasing in the fourth quarter of the year. Because many of our expenses remain relatively fixed throughout the
13
year, the seasonality of our business requires us to manage our working capital carefully over the course of the year. If we fail to manage our working capital effectively or do not accurately predict customer demand in the fourth quarter of the year, our operating results and financial condition may fluctuate.
Our sales cycles for new customers can be lengthy and unpredictable, which may cause our revenue and operating results to fluctuate significantly.
Our sales cycles for new customers can be lengthy and unpredictable. Our sales efforts involve educating our customers about the use and benefits of our authentication, access management and secure communication solutions, including demonstrating the potential of our solutions in improving security, streamlining clinician workflow and increasing productivity. Potential customers may undertake a significant evaluation process to assess their existing healthcare information technology infrastructure, as well as our solutions. This assessment can result in a lengthy and unpredictable sales cycle. In addition, purchases of our solutions are frequently subject to budget constraints, multiple approvals, and unplanned administrative, processing and other delays. We spend substantial time, effort and money in our sales efforts without any assurance that our efforts will produce any sales. In addition, cancellation of any implementation after it has begun might result in lost time, effort, and expenses invested in the cancelled implementation process and lost opportunity for implementing paying customers in that same period of time. These factors may contribute to significant fluctuations in our revenue and operating results.
Our revenue and operating results have fluctuated, and are likely to continue to fluctuate, which may make our quarterly results difficult to predict, cause us to miss analyst expectations and cause the price of our common stock to decline.
Our revenue and operating results may be difficult to predict, even in the near term, and are likely to fluctuate as a result of a variety of factors, many of which are outside of our control. Comparisons of our revenue and operating results on a period-to-period basis may not be meaningful. You should not rely on our past results as an indication of our future performance. Each of the following factors, among others, could cause our revenue and operating results to fluctuate from quarter to quarter:
|
|
• |
the financial health of our healthcare customers and budgetary constraints on their ability to purchase security and productivity information technology solutions; |
|
|
• |
changes in the regulatory environment affecting our healthcare customers, including impediments to their ability to obtain third-party reimbursement for their services; |
|
|
• |
our ability to develop and introduce new solutions and products and enhance existing solutions that achieve market acceptance; |
|
|
• |
the procurement and deployment cycles of our healthcare customers and the length of our sales cycles; |
|
|
• |
our ability to forecast demand and manage lead times for the manufacture of hardware used in our solutions; |
|
|
• |
the mix of our product and service revenue and pricing, including discounts by us or our competitors; and |
|
|
• |
the timing of when orders are received, fulfilled and revenue is recognized. |
The resulting variability and unpredictability could result in our failure to meet our operating plan or the expectations of investors or analysts for any period. If we fail to meet such expectations for these or other reasons, the market price of our common stock may decline.
If we are unable to maintain successful relationships with our channel partners and technology alliance partners, our ability to market, sell and distribute our solutions will be limited and our business, financial condition and results of operations could be adversely affected.
In addition to our direct sales force, we rely on our sales partners, consisting of our channel partners and technology alliance partners, to sell our solutions. We derive a substantial portion of our revenue from sales of our products and services through our sales partners, and we expect that sales through sales partners will continue to be a significant percentage of our revenue. For the years ended December 31, 2015, 2014, and 2013, 9%, 8%, and 10%, respectively, of our total revenues were derived from our largest sales partner.
Our agreements with our sales partners are generally non-exclusive, meaning our sales partners may offer their customers products and services from several different companies, including products and services that compete with ours. We depend on channel partners to supplement our direct sales organization within the United States and internationally. If our channel partners do not effectively market and sell our products and services, choose to use greater efforts to market and sell their own products and services or those of our competitors, or fail to meet the needs of our customers, our ability to grow our business and sell our products and services may be adversely affected. Our channel partners may cease marketing our products and services with limited or no notice and with little or no penalty, and they have no obligation to renew their agreements with us on commercially reasonable terms, or at all.
14
The loss of a substantial number of our channel partners, our possible inability to replace them, or the failure to recruit additional channel partners could materially and adversely affect our results of operations. New channel partners require extensive training and may take several months or more to achieve productivity for us. Our channel partner structure could also subject us to lawsuits or reputational harm if, for example, a channel partner misrepresents the functionality of our platform to customers or violates applicable laws or our corporate policies applicable to the partner. We work with our technology alliance partners to design go-to-market strategies that combine our solutions with products or services provided by our technology alliance partners. The loss of a technology alliance partner may mean that certain of our solutions that were designed to interoperate with the products or services provided by the technology alliance partner may no longer function as intended and require substantial re-engineering or the development of new solutions and products.
Our ability to generate revenue in the future will depend in part on our success in maintaining effective working relationships with our sales partners, in expanding our indirect sales channel, in training our channel partners to independently sell and deploy our solutions and in continuing to integrate our solutions with the products and services offered by our technology alliance partners. If we are unable to maintain our relationships with these sales partners, our business, financial condition and results of operations could be adversely affected.
We depend on sole source suppliers and a contract manufacturer for hardware components of our solutions. If we are unable to source our components from them or effectively forecast our customer demand to properly manage our inventory, our business and operating results could be adversely affected.
We depend on sole source suppliers for hardware components of our solutions. We rely upon Cross Match Technologies, Inc. (formerly DigitalPersona, Inc.) as the only provider of our fingerprint readers used in our Imprivata OneSign solution, which we purchase from Avnet, Inc. on a purchase order basis. We do not have the benefit of a long-term supply agreement or supply commitment. We currently purchase all of our proximity cards used in our Imprivata OneSign solution from RF IDeas, Inc., or RF IDeas. We believe alternative sources of proximity cards are available. We rely on Fujitsu Computer Products of America, Inc., or Fujitsu, as the only provider of our palm vein readers used in our Imprivata PatientSecure solution. In addition, we depend on a contract manufacturer to produce certain other hardware components for our solutions. Our agreements with RF IDeas, Fujitsu and our contract manufacturer renew automatically on an annual basis. These agreements do not contain supply commitments. As a result, we cannot assure you that our suppliers and contract manufacturer will be able to meet our requirements, which could adversely affect our business and operating results.
Any of these suppliers or contract manufacturer could cease production of our components, experience capacity constraints, material shortages, work stoppages, financial difficulties, cost increases or other reductions or disruptions in output, cease operations or be acquired by, or enter into exclusive arrangements with, a competitor. These suppliers and contract manufacturer typically rely on purchase orders rather than long-term contracts with their suppliers. As a result, even if available, an affected supplier or contract manufacturer may not be able to secure sufficient materials at reasonable prices or of acceptable quality to build our components in a timely manner, forcing us to seek components from alternative sources, which may not have the required specifications, or be available in time to meet demand or on commercially reasonable terms, if at all.
We also place orders with our suppliers and contract manufacturer for our inventory based on forecasts of customer demand. Our forecasts are based on multiple assumptions, each of which may introduce errors into our estimates affecting our ability to meet our customers’ demands for our solutions or manage our inventory effectively. We may also be forced to redesign our solutions if a component becomes unavailable in order to incorporate a component from an alternative source, which may increase the cost of providing our solutions. Any of these circumstances could cause interruptions or delays in the delivery of our solutions to our customers, and could adversely affect our business and operating results.
Our use of third-party off-shore development providers could have a material adverse effect on our business, financial condition and results of operations.
Since 2006, we have relied upon a third-party development provider in Lviv, Ukraine to assist with software development, quality assurance, testing and automation to reduce costs and to meet our customers’ needs in a timely manner. These services are performed pursuant to statements of work under a master services agreement. The development provider may terminate its agreement with us without cause with 60 days’ notice, unless a statement of work is in progress. While they have been dependable in the past, we have less control over the development provider’s performance than if it was comprised of our employees or if the development provider was located in the United States. As a result, we are subject to the risk that the development provider will not perform as anticipated. Furthermore, in recent periods, Ukraine has experienced military action, civil unrest and political and economic uncertainties. The evolving economic, political and social developments in Ukraine may materially and adversely affect the operations of the development provider in ways beyond their control and may constrain our ability to assert or defend our contractual or other legal rights relating to our relationship with the development provider and its handling of our intellectual property.
15
Since June of 2014, we have also relied upon a third-party developer in Buenos Aires, Argentina to assist with software development, quality assurance, testing and automation to reduce costs and to meet our customers’ needs in a timely manner. These services are performed pursuant to statements of work under a master services agreement. The development provider may terminate its agreement with us without cause with 30 days’ notice, unless a statement of work is in progress. We have less control over the development provider’s performance than if it was comprised of our employees or if the development provider were located in the United States.
If we are unable to rely upon either of these development providers for the reasons stated above or for other reasons, we may be required to shift development projects to our employees or to one or more other independent contractors. As a result, we may face increased costs and delays in our ability to introduce new solutions or products or provide services. These risks could have a material adverse effect on our business, financial condition and results of operations.
If we are not able to manage our growth effectively, or if our business does not grow as we expect, our operating results will be adversely affected.
We have experienced significant revenue growth in recent periods. For example, our revenue increased from $22.0 million for the year ended December 31, 2009 to $119.1 million for the year ended December 31, 2015. During this period, we significantly expanded our operations and increased the number of our employees from 105 at December 31, 2008 to 452 at December 31, 2015. Our rapid growth has placed, and will continue to place, a significant strain on our management systems, infrastructure and other resources. We plan to hire additional direct sales and marketing personnel domestically and internationally, increase our investment in research and development and acquire complementary businesses, technologies or assets. Our future operating results depend to a large extent on our ability to successfully implement these plans and manage our anticipated expansion. To do so successfully we must, among other things:
|
|
• |
manage our expenses in line with our operating plans and current business environment; |
|
|
• |
maintain and enhance our operational, financial and management controls, reporting systems and procedures; |
|
|
• |
develop and deliver new solutions and enhancements to existing solutions efficiently and reliably; |
|
|
• |
manage operations in multiple locations and time zones; and |
|
|
• |
integrate acquired businesses, technologies or assets. |
We expect to incur costs associated with the investments made to support our growth before the anticipated benefits or the returns are realized, if at all. If we are unable to manage our growth effectively, we may not be able to take advantage of market opportunities or develop new solutions or enhancements to existing solutions. We may also fail to satisfy customer requirements, maintain quality, execute our business plan or respond to competitive pressures, which could adversely affect our operating results.
Changes in renewal rates in our software maintenance contracts may not be immediately reflected in our operating results.
We generally recognize revenue from our software maintenance contracts ratably over the contract term. A portion of the maintenance revenue we report in each year is derived from the recognition of deferred revenue relating to software maintenance contracts entered into during previous years. In each of the years ended December 31, 2015, 2014, and 2013, we retained greater than 90% of the aggregate dollar amount of our software maintenance contracts up for renewal. Consequently, a decline in renewed software maintenance by our customers in any one quarter may not be immediately reflected in our revenue for that quarter. Such a decline, however, will adversely affect our revenue in future quarters. Accordingly, the effect of significant downturns in our rate of renewals may not be fully reflected in our operating results until future periods.
We primarily operate in the rapidly evolving and highly competitive healthcare market, and if we fail to effectively respond to competitive pressures, our business, financial condition and operating results could be adversely affected.
The market for security and productivity information technology solutions within the healthcare market is highly fragmented, consisting of a significant number of vendors that is rapidly changing. Competition in our market is primarily based on:
|
|
• |
brand awareness and reputation; |
|
|
• |
breadth of our solutions set and ease of implementation, use and management; |
|
|
• |
breadth of product distribution; |
|
|
• |
strategic relationships and ability to integrate with software and device vendors; and |
|
|
• |
product innovation and ability to meet customer needs. |
16
We believe our primary competitor in the healthcare industry in which our Imprivata OneSign solution competes is Caradigm USA LLC, a joint venture of General Electric Company and Microsoft Corporation. We expect competition to intensify in the future with existing competitors and market entrants. Our competitors in the healthcare market for authentication and access management solutions include large, multinational companies with significantly more resources to dedicate to product development and sales and marketing. These companies may have existing relationships within healthcare organizations, which may enhance their ability to gain a foothold in our market. Customers may prefer to purchase a more highly integrated or bundled solution from a single provider or an existing supplier rather than a separate supplier, regardless of performance or features. Increased competition may result in additional pricing pressure, reduced profit margins, higher sales and marketing expenses, lower revenue and the loss of market share, which could adversely affect our business, financial condition and operating results.
Our Imprivata Cortext solution competes in the market for secure communications in the healthcare market. Our Imprivata Confirm ID solution competes in the market for electronic prescribing of controlled substances. Our Imprivata PatientSecure solution competes in the market for biometric positive patient identification in the healthcare market. These markets are highly fragmented, consisting of a large number of rapidly changing vendors. We believe our primary competitor in secure communications in the healthcare market is TigerText. We expect competition to intensify in the future with existing competitors and market entrants in each of the markets in which our Imprivata Cortext, Imprivata Confirm ID and Imprivata PatientSecure solutions compete. As in the healthcare market for authentication and access management solutions, competitors in these markets include large, multinational companies with significantly more resources to dedicate to product development and sales and marketing.
Industry consolidation or new market entrants may result in increased competitive pressure, which could result in the loss of customers or a reduction in revenue.
Some of our competitors have made or may make acquisitions or may enter into partnerships or other strategic relationships to offer more comprehensive services than they individually had offered or achieve greater economies of scale. We expect these trends to continue as companies attempt to strengthen or maintain their market positions. For example, potential entrants not currently considered to be our competitors, such as providers of electronic health record systems, may enter our market by acquiring or developing their own access or authentication management solutions. In addition, providers of authentication and access management solutions, such as CA, Inc., International Business Machines Corporation, Oracle Corporation and Novell, Inc., may enter the healthcare market. Such potential entrants, if they enter the healthcare market for authentication and access management solutions, may have competitive advantages over us, such as greater name recognition, longer operating histories, more varied services and larger marketing budgets, as well as greater financial, technical and other resources. The companies resulting from combinations or that expand or vertically integrate their business to include the authentication and access management market that we address may create more compelling service offerings and may offer greater pricing flexibility than we can or may engage in business practices that make it more difficult for us to compete effectively, including on the basis of price, sales and marketing programs, technology or service functionality. These pressures could result in a substantial loss of our customers, which may have a material adverse effect on our business, financial condition and operating results.
Our success depends upon our ability to attract, integrate and retain key personnel, and our failure to do so could adversely affect our ability to grow our business.
Our success depends, in part, on the services of our senior management and other key personnel, and our ability to continue to attract, integrate and retain highly skilled personnel, particularly in engineering, sales and marketing. Competition for highly skilled personnel is intense. If we fail to attract, integrate and retain key personnel, our ability to grow our business could be adversely affected.
The members of our senior management and other key personnel are at-will employees, and may terminate their employment at any time without notice. If they terminate their employment, we may not be able to find qualified individuals to replace them on a timely basis or at all and our senior management may need to divert their attention from other aspects of our business. Former employees may also become employees of a competitor. We may also have to pay additional compensation to attract and retain key personnel. We also anticipate hiring additional engineering, marketing and sales, and services personnel to grow our business. Often, significant amounts of time and resources are required to recruit and train these personnel. We may incur significant costs to attract, integrate and retain them, and we may lose them to a competitor or another company before we realize the benefit of our investments in them.
If we do not achieve the anticipated strategic or financial benefits from our acquisitions, or if we cannot successfully integrate them, our business and operating results could be adversely affected.
On April 30, 2015, we acquired our Imprivata PatientSecure solution when we consummated the acquisition of HT Systems, LLC. In the future we may acquire additional businesses, technologies or assets that we believe to be complementary or strategic. We may not achieve the anticipated strategic or financial benefits, or be successful in integrating HT Systems, LLC or other acquired businesses, technologies or assets. If we cannot effectively integrate newly-acquired technologies and solutions and successfully market and sell
17
these new product offerings, we may not achieve market acceptance for, or significant revenue from, these new technologies and solutions.
Integrating newly-acquired businesses, technologies and assets could strain our resources, could be expensive and time consuming, and might not be successful. If we acquire or invest in additional businesses, technologies or assets, we will be further exposed, to a number of risks, including that we may:
|
|
• |
experience technical issues as we integrate acquired businesses, technologies or assets into our existing solutions; |
|
|
• |
encounter difficulties leveraging our existing sales and marketing organizations, and sales channels, to increase our revenue from acquired businesses, technologies or assets; |
|
|
• |
find that the acquiree’s customers choose not to do business with us; |
|
|
• |
find that the acquisition does not further our business strategy, that we overpaid for the acquisition or that the economic conditions underlying our acquisition decision have changed; |
|
|
• |
have difficulty retaining the key personnel of acquired businesses; |
|
|
• |
suffer disruption to our ongoing business and diversion of our management’s attention as a result of the negotiation of any acquisition as well as related transition or integration issues and the challenges of managing geographically or culturally diverse enterprises; and |
|
|
• |
experience unforeseen and significant problems or liabilities associated with quality, technology and legal contingencies relating to the acquisition, such as intellectual property or employment matters. |
In addition, from time to time we may enter into negotiations for acquisitions that are not ultimately consummated. These negotiations could result in significant diversion of management time, as well as substantial out-of-pocket costs. If we were to proceed with one or more significant acquisitions in which the consideration included cash, we could be required to use a substantial portion of our available cash. To the extent we issue shares of capital stock or other rights to purchase capital stock, including options and warrants, the ownership of existing stockholders would be diluted. In addition, acquisitions may result in the incurrence of debt, contingent liabilities, write-offs or other unanticipated costs, events or circumstances, any of which adversely affect our business and operating results.
The software and hardware contained in our solutions are complex and may contain undetected errors that could have a material adverse effect on our business, financial condition and operating results.
Our solutions incorporate complex technology, are used in a variety of healthcare settings and must interoperate with many different types of complex devices and information technology systems. While we test our solutions for defects and errors prior to release, we or our customers may not discover a defect or error until after we have deployed our solutions and our customers have commenced general use of the solution. If we cannot successfully integrate our authentication, access management and secure communication solutions with health information systems as needed or if any hardware or software of these health information systems contains any defect or error, then our solutions may not perform as designed, or may exhibit a defect or error.
Any defects or errors in, or which are attributed to, our solutions, could result in:
|
|
• |
delayed market acceptance of our affected solutions; |
|
|
• |
loss of customers or inability to attract new customers; |
|
|
• |
diversion of engineering or other resources for remedying the defect or error; |
|
|
• |
damage to our brand and reputation; |
|
|
• |
increased service and warranty costs; |
|
|
• |
legal actions by our customers or third parties, including product liability claims; and |
|
|
• |
penalties imposed by regulatory authorities. |
Our solutions are utilized by clinicians in the course of providing patient care. It is possible that our healthcare customers may allege we are responsible for harm to patients or clinicians due to defects in, the malfunction of, the characteristics of, or the use of, our solutions. In addition, because our customers rely on our solutions to access health records and to prevent unauthorized access to protected health information, or PHI, a malfunction or design defect in one or more of our products could result in legal or warranty claims against us for damages resulting from security breaches. Although our customer agreements contain disclaimers of liability that are intended to reduce or eliminate our potential liability, we could be required to spend significant amounts of management time and
18
resources to defend ourselves against product liability, tort, warranty or other claims. Additionally, the possible publicity associated with any such claim, whether or not decided against us, could adversely affect our reputation. If any such claims were to prevail, we could be forced to pay damages or stop distributing our solutions. Even if potential claims do not result in liability to us, investigating and defending against these claims could be expensive and time consuming and could divert management’s attention away from our business. We maintain general liability insurance coverage, including coverage for errors and omissions; however, this coverage may not be sufficient to cover large claims against us or otherwise continue to be available on acceptable terms. Further, the insurer could attempt to disclaim coverage as to any particular claim. Such circumstances could have a material adverse effect on our business, financial condition and results of operations.
The market for biometric technology is still developing. There can be no assurance that Imprivata PatientSecure solution will be successful.
The market for Imprivata PatientSecure, our positive patient identification solution using biometric technology, is still developing. The evolution of this market may result in the development of different technologies and industry standards that are not compatible with our current solutions, products or technologies. Several organizations set standards for biometrics to be used in identification and documentation. Although we believe that our biometric technologies comply with existing standards, these standards may change and any standards adopted could prove disadvantageous to or incompatible with our business model and current or future solutions, products and services. If the biometrics industry adopts standards or a platform different from the one we use in our solution, then our competitive position would be adversely affected.
Although the recent appearance of biometric readers on popular consumer products, such as smartphones, has increased interest in biometrics as a means of identifying individuals, the market for biometric technology remains a developing and evolving market. Acceptance of biometrics as an alternative to traditional methods of identifying patients depends upon a number of factors including: the performance and reliability of biometric solutions; costs involved in adopting and integrating biometric solutions; public perception regarding privacy concerns; and potential privacy legislation. For these reasons, we are uncertain whether our biometric technology will gain widespread acceptance in the healthcare market. Even if there is significant demand, there can be no assurance that our solution will achieve market acceptance or be successful.
Our international operations subject us, and may increasingly subject us in the future, to operational, financial, economic and political risks abroad, which could have a material adverse effect on our business, financial condition and results of operations.
Although we currently derive a relatively small portion of our revenue from customers outside of the United States, a key element of our growth strategy is to expand internationally. Our international expansion efforts might not be successful in creating demand for our products and services or in effectively selling our solutions in the international markets we enter. In addition, we will face risks in doing business internationally that could adversely affect our business, including:
|
|
• |
difficulties integrating our solutions with information technology systems and processes with which we do not have experience; |
|
|
• |
political and economic instability in, or foreign conflicts that involve or affect, the countries where we operate and sell our solutions; |
|
|
• |
difficulties in staffing and managing personnel and sales partners; |
|
|
• |
the need to comply with a wide variety of foreign laws and regulations, including privacy and security regulations, requirements for export controls for encryption technology, employment laws, changes in tax laws and tax audits by government agencies; |
|
|
• |
competitors who are more familiar with local markets; |
|
|
• |
challenges associated with delivering services, training and documentation in foreign languages; |
|
|
• |
difficulties in collecting accounts receivable and longer accounts receivable payment cycles; and |
|
|
• |
limited or unfavorable intellectual property protection in some countries. |
In addition, as we continue to expand our international operations, we have become more exposed to the effects of fluctuations in currency exchange rates. We incur expenses for employee compensation and other operating expenses at our international locations and accept payment from customers in the local currency. Since we conduct business in currencies other than the U.S. dollar but report our operating results in U.S. dollars, we have exposure to fluctuations in currency exchange rates. We do not currently hedge against the risks associated with currency fluctuations but may do so in the future.
19
Any of these factors could harm our existing international business and operations, and have a material adverse effect on our business, financial condition and results of operations.
Risks posed by sales to foreign government-operated healthcare organizations could have a material adverse effect on our revenues and operating results.
We expect to continue to derive a substantial portion of our international revenues from foreign government-operated healthcare organizations. Sales to governmental entities present risks in addition to those involved in sales to commercial customers, including potential disruption due to changes in appropriation and spending patterns, delays in budget approvals and exposure to penalties in the event of violations of the Foreign Corrupt Practices Act or other anti-bribery laws. General political and economic conditions, which we cannot accurately predict, directly and indirectly may affect the quantity and allocation of expenditures by governmental entities. In addition, obtaining government contracts may involve long purchase and payment cycles, competitive bidding, qualification requirements, delays or changes in funding, budgetary constraints, political agendas, extensive specification development and price negotiations and milestone requirements. In general, each governmental entity also maintains its own rules and regulations with which we must comply and which can vary significantly among departments. These factors may result in cutbacks or re-allocations in the budget or losses of government sales, which could have a material adverse effect on our revenues and operating results.
If we fail to offer services that are satisfactory to our customers, our ability to sell our solutions will be adversely affected.
Our ability to sell our solutions is dependent upon our ability to provide high-quality services and support. Our services team assists our customers with their clinical workflow design, authentication and access management solution configuration, training and project management during the pre-deployment and deployment stages. Once our solutions are deployed within a customer’s facility, the customer typically depends on our services team to help resolve technical issues, assist in optimizing the use of our solutions and facilitate adoption of new functionality. For instance, a substantial proportion of our customers in the United States rely on our Imprivata OneSign solution as a means to access their electronic health record, or EHR, systems that they implement to meet regulatory standards for adoption, or “meaningful use,” of EHR technologies. If our solutions do not adequately facilitate our customers’ attainment of meaningful use requirements as defined by the relevant regulatory authorities and interpreted by our customers, or if deployment of our solutions is unsatisfactory, we may incur significant costs to attain and sustain customer satisfaction. As we hire new services personnel, we may inadvertently hire underperforming people who will have to be replaced, or fail to effectively train such employees. If we do not effectively assist our customers in deploying our solutions, succeed in helping our customers resolve technical and other post-deployment issues, or provide effective ongoing services, our ability to expand the use of our solutions with existing customers and to sell our solutions to new customers will be harmed. In addition, the failure of channel partners to provide high-quality services in markets outside of the United States could adversely affect sales of our solutions internationally.
We face potential liability related to the privacy and security of protected health information accessed or collected through our solutions.
Our customers who use our Imprivata OneSign solution handle, access or store PHI, in the ordinary course of their business. In the United States, the manner in which these customers manage PHI is subject to the Health Insurance Portability and Accountability Act of 1996, or HIPAA, the Health Information Technology for Economic and Clinical Health Act of 2009, or HITECH Act, the health data privacy, security and breach notification regulations issued pursuant to these statutes, in addition to state privacy, security and breach notification laws and regulations applicable to such health information. These customers rely on our Imprivata OneSign solution as a tool to facilitate their compliance with applicable health data privacy and security standards. Specifically, HIPAA-covered health care providers are required to implement technical data security safeguards, certain of which are supported by Imprivata OneSign. The failure of our Imprivata OneSign solution to perform an essential function for which it was designed could result in a breach of our obligations under our customer contracts, which could result in monetary damages, adverse publicity, and have an adverse impact on our business.
We also directly handle, access or store PHI in connection with our commercial solutions, such as our Imprivata Cortext solution, which is a secure, cloud-based communication platform that provides healthcare organizations and healthcare providers with secure SMS texting and messaging capabilities. Although we are transmitting and storing PHI in encrypted format for such customers, and do not, in the ordinary course of our business, require access to such PHI, we are deemed to be a “business associate” of such customers and as such are directly subject to certain HIPAA and HITECH Act requirements as well as contractual obligations that may be imposed by our customers pursuant to their HIPAA and HITECH Act requirements. These statutes, regulations and contractual obligations impose numerous requirements regarding the use and disclosure of PHI. Our failure to effectively implement the required or addressable health data privacy and security safeguards and breach notification procedures, our failure to accurately anticipate the application or interpretation of these statutes, regulations and contractual obligations as we develop our solutions or an allegation that defects in our products have resulted in noncompliance by our customers could result in a breach of our contractual obligations to our
20
customers, or create material civil and/or criminal liability for us, which could result in adverse publicity and have a material adverse effect on our business.
In addition to complying with applicable U.S. law, the use and disclosure of PHI is subject to regulation in other jurisdictions in which we do business or may do business in the future. Those jurisdictions may attempt to apply such laws extraterritorially or through treaties or other arrangements with U.S. governmental entities. For instance, we have self-certified adherence to the U.S. Department of Commerce’s Safe Harbor Privacy Principles and compliance with the U.S.-EU and U.S.-Swiss Safe Harbor Frameworks as agreed to and set forth by the U.S. Department of Commerce, and the European Union and Switzerland, or the Data Privacy Safe Harbor. The Data Privacy Safe Harbor, which established a means for legitimating the transfer of PHI by U.S. companies doing business in Europe from the European Economic Area to the U.S, is no longer deemed to be a valid method of compliance with restrictions regarding the transfer of data outside of the European Economic Area, as a result of an opinion by the European Union Court of Justice on October 6, 2015. We are monitoring the evolution of the requirements for compliance, which may impact our ability to offer certain of our solutions to customers outside of the United States in the future.
Although we work to comply with the federal, state and foreign laws and regulations, industry standards and other legal obligations that apply to us, we might unintentionally violate such laws, such laws may be modified and new laws may be enacted in the future which may increase the chance that we violate them. Any such developments, or developments stemming from enactment or modification of other laws, or the failure by us to comply with their requirements or to accurately anticipate the application or interpretation of these laws, could discourage us from offering certain of our solutions, such as Imprivata Cortext, to customers outside of the United States, and could create material liability to us, result in adverse publicity and adversely affect our business. A finding that we have failed to comply with applicable laws and regulations regarding the collection, use and disclosure of PHI could create liability for us, result in adverse publicity and materially adversely affect our business.
In addition, the costs of compliance with, and the other burdens imposed by, these and other laws or regulatory actions may prevent us from selling our solutions or increase the costs associated with selling our solutions, and may affect our ability to invest in or jointly develop solutions in the United States and in foreign jurisdictions. Further, we cannot assure you that our privacy and security policies and practices will be found sufficient to protect us from liability or adverse publicity relating to the privacy and security of PHI.
Fluctuating economic conditions could have a material adverse effect on our business, financial condition and results of operations.
Our revenue depends significantly on general economic conditions and the demand for our authentication, access management and secure communication solutions in the healthcare market. Our healthcare customers may experience declining revenues from the decreased utilization of healthcare services and diminishing margins due to impediments in obtaining third-party reimbursement and patient payments. These factors may result in constrained spending on such solutions. General economic weakness may also lead to longer collection cycles for payments due from our customers, an increase in customer bad debt, restructuring initiatives and associated expenses, and impairment of investments. Uncertainty about future economic conditions also makes it difficult to forecast operating results and to make decisions about future investments. Such factors could make it difficult to accurately forecast our sales and operating results and could adversely affect our ability to provide accurate forecasts to our suppliers and contract manufacturer and manage our supplier and contract manufacturer relationships and other expenses. Economic weakness faced by us or our customers, failure of our customers and markets to recover from such weakness, customer financial difficulties, and reductions in spending on information technology products and services could have a material adverse effect on demand for our solutions and consequently on our business, financial condition and results of operations.
The market size estimates we have provided publicly may prove to be inaccurate and may not be indicative of our future growth.
Because of rapid and significant technological changes in the market for security and productivity IT in the healthcare industry, it is difficult to predict the size of the market and the rate at which the market for our solutions and services will grow or be accepted. While the estimates of the total available market we have provided publicly are made in good faith and are based on assumptions and estimates we believe to be reasonable, these estimates may not prove to be accurate. This is particularly the case with respect to estimating the size of the international component of the market.
Our Imprivata Cortext solution uses a third-party data service provider for web hosting services. Any operational delay or failure of our Imprivata Cortext solution could expose us to litigation, harm our relationships with customers and have a material adverse effect on our brand and our business.
Our Imprivata Cortext solution utilizes a cloud-based third-party data service provider for web hosting services. We exercise limited control over this third-party data service provider, which increases our vulnerability with respect to the technology and information services it provides. In addition, if we are unable to renew the agreement with the third-party data service provider on commercially reasonable terms, we may be required to transfer our services to new data service providers and we may incur significant costs and
21
possible service interruption in connection with doing so. Our Imprivata Cortext solution provides communication and information to assist healthcare organizations. Any operational delay or failure of our Imprivata Cortext solution might result in the disruption of patient care and could harm our relationships with customers, expose us to litigation or have a material adverse effect on our brand and our business.
We anticipate that sales of our Imprivata Confirm ID solution will be driven primarily by legislation requiring that prescriptions be sent electronically. Failure or delay in the enactment of such laws could cause sales of our Imprivata Confirm ID to be adversely affected.
Our Imprivata Confirm ID solution simplifies healthcare providers’ compliance with laws requiring electronic prescriptions of controlled substances, or EPCS, and helps healthcare providers address workflow inefficiencies and the potential for fraud associated with paper-based prescriptions. Consequently, we anticipate that sales of Imprivata Confirm ID will be driven primarily by state and federal mandates requiring that prescriptions be sent electronically. For example, New York’s I-STOP law mandates that all patient medications be prescribed electronically. The deadline for prescribers to comply with I-STOP is March 27, 2016. If other states fail to enact legislation requiring that prescriptions be sent electronically or if existing requirements for electronic prescriptions are scaled-back, our ability to sell Imprivata Confirm ID solution may be adversely affected.
The mix of revenue from sales of our subscription-based products and our perpetual software products may result in revenue fluctuations, which may make our quarterly results difficult to predict, cause us to miss analyst expectations, and cause the price of our common stock to decline.
The timing of revenue recognition for our products licensed on a perpetual basis will differ in the event our customers elect to purchase both perpetual and subscription-based products together. Revenue for our perpetual software products is generally recognized upon shipment. If our perpetual software products are sold in a multiple element arrangement with subscription-based products, the revenue associated with the perpetual license will likely be recognized over the period of the subscription to the extent we are unable to determine the vendor specific objective evidence of fair value of undelivered software products. As a result, our revenue and operating results may be difficult to predict, and are likely to fluctuate based on factors, many of which are outside of our control. The resulting variability and unpredictability could result in our failure to meet the expectations of investors or analysts for any period, which could cause the price of our common stock to decline.
If we are required to collect sales and use or similar foreign taxes in additional jurisdictions, we might be subject to liability for past sales and our future sales may decrease.
We might lose sales or incur significant expenses if states or foreign jurisdictions successfully impose broader guidelines on state sales and use or similar foreign taxes. A successful assertion by one or more states or foreign jurisdictions requiring us to collect sales or other taxes on the licensing of our solutions or sale of our services could result in substantial tax liabilities for past transactions and otherwise harm our business. Each state or foreign jurisdiction has different rules and regulations governing sales and use or similar foreign taxes, and these rules and regulations are subject to varying complex interpretations that change over time. We review these rules and regulations periodically and, when we believe we are subject to sales and use or similar foreign taxes in a particular state or foreign jurisdiction, engage tax authorities in order to determine how to comply with their rules and regulations. We cannot assure you that we will not be subject to sales and use or similar taxes or related penalties for past sales in states or foreign jurisdictions where we currently believe no such taxes are required.
Vendors of solutions and services, like us, are typically held responsible by taxing authorities for the collection and payment of any applicable sales and similar taxes. If one or more taxing authorities determines that taxes should have, but have not, been paid with respect to our services, we might be liable for past taxes in addition to taxes going forward. Liability for past taxes might also include substantial interest and penalty charges. Our customer contracts typically provide that our customers must pay all applicable sales and similar taxes. Nevertheless, our customers might be reluctant to pay back taxes and might refuse responsibility for interest or penalties associated with those taxes. If we are required to collect and pay back taxes and the associated interest and penalties, and if our clients fail or refuse to reimburse us for all or a portion of these amounts, we will incur unplanned expenses that may be substantial.
Moreover, imposition of such taxes on us going forward will effectively increase the cost of our solutions and services to our customers and might adversely affect our ability to retain existing customers or to gain new customers in the areas in which such taxes are imposed.
Our ability to use our net operating losses to offset future taxable income may be subject to certain limitations.
In general, under Section 382 of the Internal Revenue Code of 1986, as amended, or the Code, a corporation that undergoes an “ownership change” is subject to limitations on its ability to utilize its pre-change net operating losses, or NOLs, to offset future
22
taxable income. If we undergo an ownership change, our ability to utilize NOLs could be further limited by Section 382 of the Code. Future changes in our stock ownership, some of which are outside of our control, could result in an ownership change under Section 382 of the Code. Furthermore, our ability to utilize NOLs of companies that we may acquire in the future may be subject to limitations. There is also a risk that due to regulatory changes, such as suspensions on the use of NOLs, or other unforeseen reasons, our existing NOLs could expire or otherwise be unavailable to offset future income tax liabilities. For these reasons, we may not be able to utilize a material portion of the NOLs reflected on our balance sheet, even if we attain profitability.
Our business is subject to the risks of earthquakes, fire, floods and other natural catastrophic events, and to interruption by man-made problems such as power disruptions or terrorism.
A significant natural disaster, such as an earthquake, fire or a flood, occurring at our headquarters, our other facilities or where our contract manufacturer or its suppliers are located, could harm our business, operating results and financial condition. In addition, acts of terrorism could cause disruptions in our business, the businesses of our customers and suppliers, or the economy as a whole. We also rely on information technology systems to communicate among our workforce located worldwide, and in particular, our senior management, general and administrative, and research and development activities, which are coordinated with our corporate headquarters in the Boston, Massachusetts area and our Santa Cruz, California, San Francisco, California, Tampa, Florida and Uxbridge, United Kingdom offices. Any disruption to our internal communications, whether caused by a natural disaster or by man-made problems, such as power disruptions, could delay our research and development efforts, cause delays or cancellations of customer orders or delay deployment of our solutions, which could have a material adverse effect on our business, operating results and financial condition.
Our loan agreement contains operating and financial covenants that may restrict our business and financing activities.
We are party to a loan and security agreement relating to a revolving line of credit facility with Silicon Valley Bank. Borrowings under this loan and security agreement are secured by substantially all of our assets. Our loan and security agreement restricts our ability to:
|
|
• |
incur additional indebtedness; |
|
|
• |
redeem subordinated indebtedness; |
|
|
• |
create liens on our assets; |
|
|
• |
enter into transactions with affiliates; |
|
|
• |
make investments; |
|
|
• |
sell assets; |
|
|
• |
make material changes in our business or management; |
|
|
• |
pay dividends, other than dividends paid solely in shares of our common stock, or make distributions on and, in certain cases, repurchase our stock; or |
|
|
• |
consolidate or merge with other entities. |
In addition, our revolving line of credit requires us to maintain specified adjusted quick ratio tests. The operating and financial restrictions and covenants in the loan and security agreement governing our revolving line of credit, as well as any future financing agreements that we may enter into, may restrict our ability to finance our operations, engage in business activities or expand or fully pursue our business strategies. Our ability to comply with these covenants may be affected by events beyond our control, and we may not be able to meet those covenants. A breach of any of these covenants could result in a default under the loan and security agreement, which could cause all of the outstanding indebtedness under the facility to become immediately due and payable and terminate all commitments to extend further credit.
If we are unable to generate sufficient cash available to repay our debt obligations when they become due and payable, either when they mature or in the event of a default, we may not be able to obtain additional debt or equity financing on favorable terms, if at all, which may negatively impact our ability to continue as a going concern.
23
Risks related to our intellectual property
If we are unable to protect our intellectual property rights, our competitive position could be harmed or we could be required to incur significant expenses to enforce our rights.
Our success depends, in part, on our ability to protect our proprietary technology. We seek to protect our proprietary technology through patent, copyright, trade secret and trademark laws in the United States and similar laws in other countries. We also seek to protect our proprietary technology through licensing agreements, nondisclosure agreements and other contractual provisions. These protections may not be available in all cases or may be inadequate to prevent our competitors from copying, reverse engineering or otherwise obtaining and using our technology, proprietary rights or solutions in an unauthorized manner. The laws of some foreign countries may not be as protective of intellectual property rights as those in the United States, and mechanisms for enforcement of intellectual property rights may be inadequate. In addition, third parties may seek to challenge, invalidate or circumvent our patents, trademarks, copyrights and trade secrets, or applications for any of the foregoing. Our competitors may independently develop technologies that are substantially equivalent, or superior, to our technology or design around our proprietary rights. In each case, our ability to compete could be significantly impaired.
To prevent unauthorized use of our intellectual property rights, it may be necessary to prosecute actions for infringement or misappropriation of our proprietary rights. Any such action could result in significant costs and diversion of our resources and management’s attention, and there can be no assurance that we will be successful in such action. Furthermore, many of our current and potential competitors have the ability to dedicate substantially greater resources to enforce their intellectual property rights than we do. Accordingly, despite our efforts, we may not be able to prevent third parties from infringing or misappropriating our intellectual property. While we plan to continue to seek to protect our intellectual property with, among other things, patent protection, there can be no assurance that:
|
|
• |
current or future U.S. or foreign patent applications will be approved; |
|
|
• |
our issued patents will adequately protect our intellectual property and not be held invalid or unenforceable if challenged by third parties; |
|
|
• |
we will succeed in protecting our technology adequately in all key jurisdictions in which we or our competitors operate; and |
|
|
• |
others will not design around any patents that may be issued to us. |
Our failure to obtain patents sufficiently broad to cover our technology and possible workarounds, or the invalidation of our patents, or our inability adequately to protect our intellectual property, may weaken our competitive position and harm our business and operating results. We might be required to spend significant resources to monitor and protect our intellectual property rights. We may initiate claims or litigation against third parties for infringement of our proprietary rights or to establish the validity of our proprietary rights. Any litigation, whether or not it is resolved in our favor, could result in significant expense to us and divert the efforts of our technical and management personnel, which may harm our business, operating results and financial condition.
Agreements we have with our employees, consultants and independent contractors may not afford adequate protection for our trade secrets, confidential information and other proprietary information.
In addition to patent protection, we also rely on copyright and trademark protection, trade secrets, know-how, continuing technological innovation and licensing opportunities. In an effort to maintain the confidentiality and ownership of our trade secrets and proprietary information, we require our employees, consultants and independent contractors to execute confidentiality and proprietary information agreements. However, these agreements may not provide us with adequate protection against improper use or disclosure of confidential information and available remedies in the event of unauthorized use or disclosure may not be adequate. The failure by employees, consultants or independent contractors to maintain the secrecy of our confidential information may compromise or prevent our ability to maintain trade secrets or obtain needed or meaningful patent protection. In some situations, our confidentiality and proprietary information agreements may conflict with, or be subject to, the rights of third parties with whom our employees, consultants or independent contractors have prior employment or consulting relationships. Although we require our employees, consultants and independent contractors to maintain the confidentiality of all proprietary information of their previous employers, these individuals, or we, may be subject to allegations of trade secret misappropriation or other similar claims as a result of their prior affiliations. Finally, others may independently develop substantially equivalent proprietary information and techniques or gain access to our trade secrets. Our failure or inability to protect our proprietary information and techniques may inhibit or limit our ability to compete effectively, or exclude certain competitors from the market.
We may not be able to obtain or maintain necessary licenses of third-party technology on commercially reasonable terms, or at all, which could delay product sales and development and have a material adverse effect on product quality and our ability to compete.
We have incorporated third-party licensed technology into certain of our solutions. We anticipate that we are also likely to need to license additional technology from third parties in connection with the development of new solutions or enhancements in the future.
24
Third-party licenses may not be available to us on commercially reasonable terms, or at all. The inability to retain any third-party licenses required in our current solutions or to obtain any new third-party licenses to develop new solutions and products could require us to obtain substitute technology of lower quality or performance standards or at greater cost, and delay or prevent us from introducing these solutions or products, any of which could have a material adverse effect on product quality and our ability to compete.
Claims of intellectual property infringement could harm our business.
Vigorous protection and pursuit of intellectual property rights has resulted in protracted and expensive litigation for many companies in our industry. Although claims of this kind have not materially affected our business to date, there can be no assurance such claims will not arise in the future. Any claims or proceedings against us, whether meritorious or not, could be time consuming, result in costly litigation, require significant amounts of management time, result in the diversion of significant operational resources, or require us to enter into royalty or licensing agreements, any of which could harm our business and operating results.
Intellectual property lawsuits are subject to inherent uncertainties due to the complexity of the technical issues involved, and we cannot be certain that we will be successful in defending ourselves against intellectual property claims. In addition, we may not be able to effectively utilize our intellectual property portfolio to assert defenses or counterclaims in response to patent infringement claims or litigation brought against us by third parties. Further, litigation may involve patent holding companies or other adverse patent owners who have no relevant products and against whom our potential patents may provide little or no deterrence.
Many potential litigants have the capability to dedicate substantially greater resources to enforce their intellectual property rights and to defend claims that may be brought against them. Furthermore, a successful claimant could secure a judgment that requires us to pay substantial damages or prevents us from distributing certain solutions or performing certain services. We might also be required to seek a license and pay royalties for the use of such intellectual property, which may not be available on commercially acceptable terms or at all. Alternatively, we may be required to develop non-infringing technology, which could require significant effort and expense and may ultimately not be successful.
Our use of open source and non-commercial software components could impose risks and limitations on our ability to commercialize our solutions.
Our solutions contain software modules licensed under open source and other types of non-commercial licenses. We also may incorporate open source and other licensed software into our solutions in the future. Use and distribution of such software may entail greater risks than use of third-party commercial software, as licenses of these types generally do not provide warranties or other contractual protections regarding infringement claims or the quality of the code. Some of these licenses require the release of our proprietary source code to the public if we combine our proprietary software with open source software in certain manners. This could allow competitors to create similar products with lower development effort and time and ultimately result in a loss of sales for us.
The terms of many open source and other non-commercial licenses have not been interpreted by U.S. courts, and there is a risk that such licenses could be construed in a manner that could impose unanticipated conditions or restrictions on our ability to commercialize our solutions. In such event, in order to continue offering our solutions, we could be required to seek licenses from alternative licensors, which may not be available on a commercially reasonable basis or at all, to re-engineer our solutions or to discontinue the sale of our solutions in the event we cannot obtain a license or re-engineer our solutions on a timely basis, any of which could harm our business and operating results. In addition, if an owner of licensed software were to allege that we had not complied with the conditions of the corresponding license agreement, we could incur significant legal costs defending ourselves against such allegations. In the event such claims were successful, we could be subject to significant damages, be required to disclose our source code, or be enjoined from the distribution of our solutions.
Risks related to our common stock
We and certain of our executive officers and directors have been named as defendants in a purported securities class action lawsuit, which could cause us to incur substantial costs and divert management's attention, financial resources and other company assets.
In the past, securities class action litigation has often been brought against a company following periods of volatility in the market price of its securities. This risk is especially relevant for us because technology companies have experienced significant stock price volatility in recent years. On February 2, 2016, we and certain of our executive officers and directors were named as defendants in a purported securities class action lawsuit. The complaint, brought on behalf of all persons who purchased our common stock between July 30, 2015 and November 2, 2015, generally alleges that we and such executive officers made false and/or misleading statements about the demand for our IT security solutions and sales trends and failed to disclose facts about our business, operations and performance. Although we believe this action has no merit and intend to defend it vigorously, this lawsuit and any future lawsuits to
25
which we may become a party are subject to inherent uncertainties and may be expensive and time-consuming to investigate, defend and resolve, and it may divert our management's attention and financial and other resources. The outcome of any litigation is necessarily uncertain, and we could be forced to expend significant resources in the defense of this and other suits, and we may not prevail. Any litigation to which we are a party may result in an onerous or unfavorable judgment that may not be reversed upon appeal or in payments of substantial monetary damages or fines, or we may decide to settle this or other lawsuits on similarly unfavorable terms, any of which could adversely affect our business, financial condition, results of operations or stock price. See Item 3. "Legal Proceedings" below for additional information regarding the class action.
We do not currently intend to pay dividends on our common stock and, consequently, your ability to achieve a return on your investment will depend on appreciation in the price of our common stock.
We have never declared or paid any cash dividends on our common stock and do not currently intend to do so for the foreseeable future. We currently intend to invest our future earnings, if any, to fund our growth. Therefore, you are not likely to receive any dividends on your common stock for the foreseeable future, and the success of an investment in shares of our common stock will depend upon future appreciation in its value, if any. There is no guarantee that shares of our common stock will appreciate in value or even maintain the price at which our stockholders purchased their shares.
Our stock price has been and may continue to be volatile, which may affect the value of your investment.
The market price of shares of our common stock has been, and may continue to be, volatile. From June 25, 2014 through February 23, 2016, our stock price has traded at prices as low as $ 9.00 per share and as high as $21.63 per share. The market price of our common stock could continue to fluctuate as a result of many risks listed in this section, and others beyond our control, including:
|
|
• |
our operating performance and the operating performance of similar companies; |
|
|
• |
the overall performance of the equity markets; |
|
|
• |
announcements by us or our competitors of new products, commercial relationships or acquisitions; |
|
|
• |
threatened or actual litigation; |
|
|
• |
changes in laws or regulations relating to the healthcare industry; |
|
|
• |
any major change in our board of directors or management; |
|
|
• |
publication of research reports or news stories about us, our competitors, or our industry, or positive or negative recommendations or withdrawal of research coverage by securities analysts; |
|
|
• |
large volumes of sales of our shares of common stock by existing stockholders; and |
|
|
• |
general political and economic conditions. |
In addition, the stock market in general, and the market for technology companies serving the healthcare industry in particular, has at times experienced extreme price and volume fluctuations that have often been unrelated or disproportionate to the operating performance of those companies. While we cannot predict the individual effect that these factors may have on the market price of our common stock, these factors, either individually or in the aggregate, could result in significant volatility in our stock price during any given period of time, and this may make it difficult for you to resell the common stock when you want or at prices you find attractive.
Moreover, securities class action litigation has often been instituted against companies following periods of volatility in the overall market and in the market price of a company’s securities. This litigation, if instituted against us, could result in substantial costs, divert our management’s attention and resources, and harm our business, operating results and financial condition.
Future sales of shares of our common stock by existing stockholders could depress the market price of our common stock.
There are 25,041,643 shares of our common stock outstanding, based on the number of shares outstanding as of December 31, 2015. An aggregate of 1,913,020 shares of our common stock are reserved for future issuance under our stock option plans, and 581,064 shares of our common stock are reserved for future issuance under our ESPP. These shares can be freely sold in the public market upon issuance. In addition, on July 1, 2015, we filed a shelf registration statement on Form S-3 to register the sale of up to 13,395,230 shares of our common stock held by our existing stockholders. If a large number of these shares are sold in the public market, the sales could reduce the trading price of our common stock.
26
The concentration of our capital stock ownership with insiders will likely limit your ability to influence corporate matters.
Our executive officers, directors, current 5% or greater stockholders and entities affiliated with any of them, together beneficially own 40.3% of our common stock outstanding, based on the number of shares outstanding as of December 31, 2015. These stockholders, if they act together, will have significant influence over all matters requiring stockholder approval, including the election of directors and approval of significant corporate transactions, and may take actions that may not be in the best interests of our other stockholders. This concentration of ownership could also limit stockholders’ ability to influence corporate matters. Accordingly, corporate actions might be taken even if other stockholders oppose them, or may not be taken even if other stockholders view them as in the best interests of our stockholders. This concentration of ownership may have the effect of delaying or preventing a change of control of our company, may make the approval of certain transactions difficult or impossible without the support of these stockholders and might adversely affect the market price of our common stock.
We are an “emerging growth company” and we cannot be certain if the reduced disclosure requirements applicable to emerging growth companies will make our common stock less attractive to investors.
We are an “emerging growth company.” We will remain an emerging growth company until the earliest of: the end of the fiscal year in which the market value of our common stock that is held by non-affiliates exceeds $700 million as of June 30 of that fiscal year, the end of the fiscal year in which we have total annual gross revenue of $1 billion or more during such fiscal year, the date on which we issue more than $1 billion in non-convertible debt securities in a three-year period, or the last day of the fiscal year following the fifth anniversary of our initial public offering.
Under the JOBS Act, emerging growth companies can delay adopting new or revised accounting standards until such time as those standards apply to private companies. We have irrevocably elected not to avail ourselves of this exemption from new or revised accounting standards and, therefore, we will be subject to the same new or revised accounting standards as other public companies that are not emerging growth companies.
We are taking advantage of exemptions from various other requirements that are available to emerging growth companies, including, but not limited to, reduced disclosure obligations regarding executive compensation in our periodic reports and proxy statements, exemptions from the requirements of holding a nonbinding advisory vote on executive compensation and stockholder approval of any golden parachute payments not previously approved, and exemptions from the requirements of auditor attestation reports on the effectiveness of our internal control over financial reporting. We cannot predict whether investors will find our common stock less attractive to the extent we will rely on these exemptions. If some investors find our common stock less attractive as a result, there may be a less active trading market for our common stock and our stock price may be more volatile.
We are subject to financial and other reporting and corporate governance requirements that may be difficult for us to satisfy. Corporate governance and public disclosure regulations may result in additional expenses and continuing uncertainty.
As a public company, we are subject to the reporting requirements of the Exchange Act, the Sarbanes-Oxley Act of 2002, the Dodd-Frank Wall Street Reform and Consumer Protection Act, and the rules and regulations of the New York Stock Exchange, which will impose significant compliance obligations upon us, particularly after we are no longer an emerging growth company. These obligations will require a commitment of additional resources and divert our senior management’s time and attention from our day-to-day operations. We may not be successful in complying with these obligations, and compliance with these obligations will be time-consuming and expensive.
The Exchange Act requires, among other things, that we file annual, quarterly and current reports with respect to our business and operating results. The Sarbanes-Oxley Act requires, among other things, that we maintain effective disclosure controls and procedures and internal control over financial reporting. We are continuing the costly process of implementing and testing our systems to report our results as a public company, to continue to manage our growth and to implement internal controls. We are and will continue to be required to implement and maintain various other control and business systems related to our equity, finance, treasury, information technology, other recordkeeping systems and other operations. As a result of this implementation and maintenance, management’s attention may be diverted from other business concerns, which could adversely affect our business.
Beginning with our Annual Report on Form 10-K for the year ended December 31, 2015, we must comply with Section 404 of the Sarbanes-Oxley Act of 2002, or Section 404. Pursuant to Section 404, we are required to furnish a report by our management on our internal control over financial reporting. To achieve compliance with Section 404 within the prescribed period, we will conduct a process each year to document and evaluate our internal control over financial reporting, which is both costly and challenging. In this regard, we dedicate internal resources, engage outside consultants and adopt a detailed work plan to assess and document the adequacy of internal control over financial reporting, continue steps to improve control processes as appropriate, validate through testing that controls are functioning as documented and implement a continuous reporting and improvement process for internal control over financial reporting. Despite our efforts, there is a risk that we will not be able to conclude that our internal control over
27
financial reporting is effective as required by Section 404. This could result in an adverse reaction in the financial markets due to a loss of confidence in the reliability of our consolidated financial statements.
In addition, changing laws, regulations and standards relating to corporate governance and public disclosure are creating uncertainty for public companies, increasing legal and financial compliance costs and making some activities more time consuming. These laws, regulations and standards are subject to varying interpretations, in many cases due to their lack of specificity, and, as a result, their application in practice may evolve over time as new guidance is provided by regulatory and governing bodies. This could result in continuing uncertainty regarding compliance matters and higher costs necessitated by ongoing revisions to disclosure and governance practices. We intend to invest resources to comply with evolving laws, regulations and standards, and this investment may result in increased general and administrative expenses and a diversion of management’s time and attention from revenue-generating activities to compliance activities. If our efforts to comply with new laws, regulations and standards differ from the activities intended by regulatory or governing bodies due to ambiguities related to their application and practice, regulatory authorities may initiate legal proceedings against us and our business may be adversely affected.
If securities or industry analysts do not publish research or reports about our business, or publish inaccurate or unfavorable research or reports about our business, our stock price and trading volume could decline.
The trading market for our common stock depends, to some extent, on the research and reports that securities or industry analysts publish about us and our business. We do not have any control over these analysts. If one or more of the analysts who cover us downgrade our common stock or change their opinion of our common stock, our stock price would likely decline. If one or more of these analysts cease coverage of our company or fail to regularly publish reports on us, we could lose visibility in the financial markets, which could cause our stock price or trading volume to decline.
Our charter documents and Delaware law could discourage, delay or prevent a change of control of our company or change in our management that stockholders consider favorable and cause our stock price to decline.
Certain provisions of our amended and restated certificate of incorporation and amended and restated bylaws and Delaware law could discourage, delay or prevent a change of control of our company or change in our management that the stockholders of our company consider favorable. These provisions:
|
|
• |
authorize the issuance of “blank check” preferred stock that our board of directors could issue to increase the number of outstanding shares and to discourage a takeover attempt; |
|
|
• |
prohibit stockholder action by written consent, requiring all stockholder actions to be taken at a meeting of stockholders; |
|
|
• |
establish advance notice procedures for nominating candidates to our board of directors or proposing matters that can be acted upon by stockholders at stockholder meetings; |
|
|
• |
limit the ability of our stockholders to call special meetings of stockholders; |
|
|
• |
prohibit stockholders from cumulating their votes for the election of directors; |
|
|
• |
permit newly-created directorships resulting from an increase in the authorized number of directors or vacancies on our board of directors to be filled only by majority vote of our remaining directors, even if less than a quorum is then in office; |
|
|
• |
provide that our board of directors is expressly authorized to make, alter or repeal our amended and restated bylaws; |
|
|
• |
establish a classified board of directors so that not all members of our board are elected at one time; |
|
|
• |
provide that our directors may be removed only for “cause” and only with the approval of the holders of at least 75% of our outstanding stock; and |
|
|
• |
require super-majority voting to amend certain provisions in our amended and restated certificate of incorporation and amended and restated bylaws. |
Section 203 of the Delaware General Corporation Law, which will apply to us, may also discourage, delay or prevent a change of control of our company.
28
We may not be able to obtain capital when desired on favorable terms, if at all, or without dilution to our stockholders.
We may need additional financing to execute on our current or future business strategies, including to:
|
|
• |
hire additional personnel; |
|
|
• |
develop new or enhance existing products and services; |
|
|
• |
expand our operating infrastructure; |
|
|
• |
acquire businesses or technologies; or |
|
|
• |
otherwise respond to competitive pressures. |
If we incur additional funds through debt financing, a substantial portion of our operating cash flow may be dedicated to the payment of principal and interest on such indebtedness, thus limiting funds available for our business activities. We cannot assure you that additional financing will be available on terms favorable to us, or at all. If adequate funds are not available or are not available on acceptable terms when we desire them, our ability to fund our operations, take advantage of unanticipated opportunities, develop or enhance our products and services, or otherwise respond to competitive pressures would be significantly limited. If we raise additional funds through the issuance of equity or convertible debt securities, the percentage ownership of our stockholders could be significantly diluted, and these newly-issued securities may have rights, preferences or privileges senior to those of existing stockholders.
Not applicable.
Our principal headquarter offices consist of approximately 99,000 square feet of office space in Lexington, Massachusetts under a lease expiring in 2021. In November 2015, we amended the lease agreement of our principal headquarter office to lease additional 6,338 square feet beginning January 2017. In Santa Cruz, California, we currently have approximately 8,500 square feet for research and development under a lease expiring in 2018. In San Francisco, California, we currently lease two offices for support and research and development under short-term leases expiring in 2016. In Tampa Florida, we currently lease approximately 3,500 square feet under a lease expiring in 2017. In Uxbridge, United Kingdom, we have approximately 4,200 square feet of office space under an agreement expiring in 2017 for sales, marketing, services and support for our European operations. We have additional office locations throughout the United States and in various international locations.
We intend to add new facilities and expand our existing facilities as we add employees and grow our business, and we believe that suitable additional or substitute space will be available on commercially reasonable terms to meet our future needs.
On February 2, 2016, a complaint was filed in the United States District Court for the District of Massachusetts captioned Coyer v. Imprivata, Inc., et al, Case 1:16-cv-10160-LTS (D. Mass.), on behalf of a putative class of our stockholders, naming us as a defendant as well as Mr. Omar Hussain, our President and Chief Executive Officer, and Mr. Jeffrey Kalowski, our Chief Financial Officer, as well as certain investors who sold shares of our common stock in an offering in August 2015. The complaint, brought on behalf of all persons who purchased our common stock between July 30, 2015 and November 2, 2015, generally alleges that we and the named officers made false and/or misleading statements about the demand for our IT security solutions and sales trends and failed to disclose facts about our business, operations and performance. The complaint brings causes of action for violations of Section 10(b) and Rule 10b-5 of the Securities Exchange Act of 1934 against us and the two named officers, as well as for “control person” liability under Section 20(a) of the Securities Exchange Act against the officers and the non-Company defendants. The complaint seeks unspecified monetary damages and unspecified costs and fees.
We believe that the likelihood of an unfavorable judgment arising from this matter is remote based on the information currently available. We do not believe the ultimate resolution of the legal matter referred to above will have a material adverse effect on our net income, financial condition or liquidity in a future period. However, given the inherent unpredictability of litigation and the fact that this litigation is still in its early stages, the Company is unable to predict with certainty the outcome of this litigation or reasonably estimate a possible loss or range of loss associated with this litigation at this time.
Item 4.Mine Safety Disclosures.
Not Applicable.
29
|
Item 5. |
Market for Registrant’s Common Equity, Related Stockholder Matters and Issuer Purchases of Equity Securities. |
Market Information for Common Stock
Our common stock commenced trading on the New York Stock Exchange (“NYSE”) under the symbol “IMPR” on June 25, 2014. The following table sets forth, for the periods indicated, the high and low reported sales prices of our common stock as reported on the NYSE for each quarter during the last two fiscal years:
|
|
|
Price Range |
|
|||||
|
|
|
High |
|
|
Low |
|
||
|
2015: |
|
|
|
|
|
|
|
|
|
Fourth Quarter |
|
$ |
18.14 |
|
|
$ |
9.00 |
|
|
Third Quarter |
|
|
21.63 |
|
|
|
14.35 |
|
|
Second Quarter |
|
|
16.83 |
|
|
|
12.78 |
|
|
First Quarter |
|
|
16.54 |
|
|
|
12.14 |
|
|
2014: |
|
|
|
|
|
|
|
|
|
Fourth Quarter |
|
$ |
15.71 |
|
|
$ |
12.11 |
|
|
Third Quarter |
|
|
16.58 |
|
|
|
12.70 |
|
|
Second Quarter (from June 25, 2014) |
|
|
16.38 |
|
|
|
15.50 |
|
On February 23, 2016, the last sale price of our common stock as reported on the NYSE, was $10.99.
Holders of record
As of February 23, 2016, there were approximately 84 holders of record of our common stock. Because many of our shares of common stock are held of record by brokers and other institutions on behalf of stockholders, we are unable to estimate the total number of stockholders represented by such record holders.
Dividend Policy
We have never declared or paid any dividends on our capital stock. We currently intend to retain all available funds and any future earnings, if any, to finance the development and expansion of our business and we do not anticipate paying any cash dividends in the foreseeable future. Any future determination to pay dividends will be made at the discretion of our board of directors.
Stock Performance Graph
The following performance graph and related information shall not be deemed “soliciting material” or “filed” for purposes of Section 18 of the Securities Exchange Act of 1934, as amended, or the Exchange Act, or incorporated by reference into any filing of Imprivata, Inc. under the Securities Act of 1933, as amended, or the Exchange Act, except to the extent we specifically incorporate it by reference in such filing.
30
The following comparative stock performance graph compares (i) the cumulative total stockholder return on our common stock from June 25, 2014 through December 31, 2015 with (ii) the cumulative total return of the Russell 2000 Index and the NASDAQ Computer, Data Processing Index and S&P Healthcare Technology Index over the same period, assuming the investment of $100 in our common stock and in both of the other indices on June 25, 2014 and the reinvestment of all dividends, if any. The stock price performance reflected on the graph below is not necessarily indicative of future price performance. See the disclosure in “Part I, Item 1A. Risk Factors.”
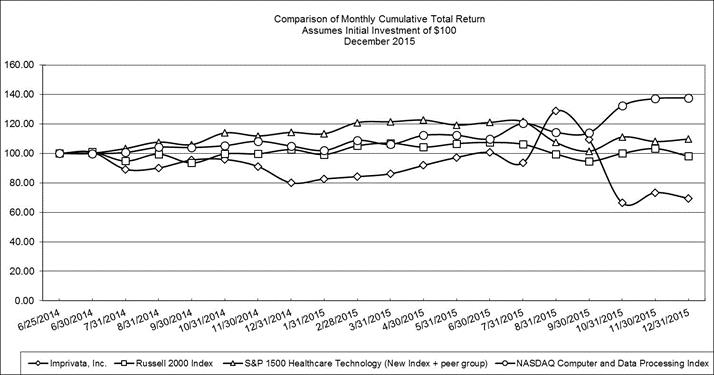
Equity Compensation Information
Information regarding our equity compensation plans and the securities authorized for issuance thereunder is set forth in Part III, Item 12 below.
Recent Sales of unregistered securities
None.
Use of proceeds
On June 30, 2014, we closed our initial public offering (“IPO”) of 5,750,000 shares of common stock, including 750,000 shares of common stock sold pursuant to the underwriters’ option to purchase additional shares, at a public offering price of $15.00 per share, for aggregate gross proceeds to us of $86.3 million. All of the shares issued and sold in the IPO were registered under the Securities Act of 1933 pursuant to a registration statement on Form S-1 (File No.333-194921), which was declared effective by the SEC on June 24, 2014. Following the sale of the shares in connection with the closing of our IPO, the offering terminated. The managing underwriters for the offering were J.P. Morgan and Piper Jaffray.
The net offering proceeds to us, after deducting underwriting discounts totaling approximately $6.0 million and offering expenses totaling approximately $3.4 million, were approximately $76.8 million. No offering expenses were paid directly or indirectly to any of our directors or officers (or their associates) or persons owning ten percent or more of any class of our equity securities or to any other affiliates. At December 31, 2014, all expenses incurred in connection with the offering have been paid.
There has been no material change in the use of proceeds from our initial public offering as described in our final prospectus filed with the SEC pursuant to Rule 424(b).
31
During the year ended December 31, 2015, we used a total of $25.1 million of our offering proceeds, of which $19.7 million related to our acquisition of HT Systems completed on April 30, 2015, $437,000 related to our purchase of patents, $1.1 million related to expenditures for internally developed software and $3.9 million was used for working capital purposes. There has been no material change in the use of proceeds from our IPO as described in our prospectus filed with the SEC pursuant to Rule 424(b)(4).
You should read the selected consolidated financial data below in conjunction with “Management’s discussion and analysis of financial condition and results of operations” and the consolidated financial statements, related notes and other financial information included elsewhere in this Annual Report. The selected consolidated financial data in this section are not intended to replace the consolidated financial statements and are qualified in their entirety by the consolidated financial statements and related notes included elsewhere in this Annual Report.
The following table presents selected consolidated financial data. We derived the statement of operations data for the years ended December 31, 2015, 2014, and 2013 and the balance sheet data as of December 31, 2015 and 2014 from our audited consolidated financial statements included elsewhere in this Annual Report. We derived the statement of operations data for the years ended December 31, 2012 and 2011 and the balance sheet data as of December 31, 2013, 2012, and 2011 from our audited financial statements which are not included in this Annual Report.
Our historical results for any prior period are not necessarily indicative of the results to be expected for any future period.
|
|
|
Year Ended December 31, |
|
|||||||||||||||||
|
(in thousands, except per share data) |
|
2015 |
|
|
2014 |
|
|
2013 |
|
|
2012 |
|
|
2011 |
|
|||||
|
Revenue |
|
|
|
|
|
|
|
|
|
|
|
|
|
|
|
|
|
|
|
|
|
Product |
|
$ |
64,937 |
|
|
$ |
52,164 |
|
|
$ |
39,124 |
|
|
$ |
29,992 |
|
|
$ |
22,958 |
|
|
Maintenance and services |
|
|
54,183 |
|
|
|
44,815 |
|
|
|
31,987 |
|
|
|
24,032 |
|
|
|
18,462 |
|
|
Total revenue |
|
|
119,120 |
|
|
|
96,979 |
|
|
|
71,111 |
|
|
|
54,024 |
|
|
|
41,420 |
|
|
Cost of revenue |
|
|
|
|
|
|
|
|
|
|
|
|
|
|
|
|
|
|
|
|
|
Product |
|
|
16,876 |
|
|
|
12,310 |
|
|
|
7,849 |
|
|
|
6,855 |
|
|
|
4,381 |
|
|
Maintenance and services |
|
|
21,181 |
|
|
|
17,678 |
|
|
|
11,020 |
|
|
|
6,563 |
|
|
|
4,443 |
|
|
Total cost of revenue |
|
|
38,057 |
|
|
|
29,988 |
|
|
|
18,869 |
|
|
|
13,418 |
|
|
|
8,824 |
|
|
Gross profit |
|
|
81,063 |
|
|
|
66,991 |
|
|
|
52,242 |
|
|
|
40,606 |
|
|
|
32,596 |
|
|
Operating expenses |
|
|
|
|
|
|
|
|
|
|
|
|
|
|
|
|
|
|
|
|
|
Research and development |
|
|
31,600 |
|
|
|
25,781 |
|
|
|
19,609 |
|
|
|
12,322 |
|
|
|
7,890 |
|
|
Sales and marketing |
|
|
52,400 |
|
|
|
45,003 |
|
|
|
30,538 |
|
|
|
22,473 |
|
|
|
17,728 |
|
|
General and administrative |
|
|
18,725 |
|
|
|
12,052 |
|
|
|
7,619 |
|
|
|
4,564 |
|
|
|
4,195 |
|
|
Total operating expenses |
|
|
102,725 |
|
|
|
82,836 |
|
|
|
57,766 |
|
|
|
39,359 |
|
|
|
29,813 |
|
|
(Loss) income from operations |
|
|
(21,662 |
) |
|
|
(15,845 |
) |
|
|
(5,524 |
) |
|
|
1,247 |
|
|
|
2,783 |
|
|
Other income (expense) |
|
|
|
|
|
|
|
|
|
|
|
|
|
|
|
|
|
|
|
|
|
Foreign currency exchange gain (loss) |
|
|
(527 |
) |
|
|
(576 |
) |
|
|
229 |
|
|
|
(77 |
) |
|
|
107 |
|
|
Interest and other income (expense), net |
|
|
(40 |
) |
|
|
(146 |
) |
|
|
(120 |
) |
|
|
(13 |
) |
|
|
(39 |
) |
|
(Loss) income before income taxes |
|
|
(22,229 |
) |
|
|
(16,567 |
) |
|
|
(5,415 |
) |
|
|
1,157 |
|
|
|
2,851 |
|
|
Income taxes |
|
|
838 |
|
|
|
169 |
|
|
|
108 |
|
|
|
109 |
|
|
|
129 |
|
|
Net (loss) income |
|
|
(23,067 |
) |
|
|
(16,736 |
) |
|
|
(5,523 |
) |
|
|
1,048 |
|
|
|
2,722 |
|
|
Accretion of redeemable convertible preferred stock |
|
|
— |
|
|
|
(2,442 |
) |
|
|
(4,952 |
) |
|
|
(4,957 |
) |
|
|
(4,973 |
) |
|
Net loss attributable to common stockholders |
|
$ |
(23,067 |
) |
|
$ |
(19,178 |
) |
|
$ |
(10,475 |
) |
|
$ |
(3,909 |
) |
|
$ |
(2,251 |
) |
|
Net loss per share attributable to common stockholders |
|
|
|
|
|
|
|
|
|
|
|
|
|
|
|
|
|
|
|
|
|
Basic and diluted |
|
$ |
(0.94 |
) |
|
$ |
(1.37 |
) |
|
$ |
(3.12 |
) |
|
$ |
(1.36 |
) |
|
$ |
(1.03 |
) |
|
Weighted average common shares outstanding used in computing net loss per share attributable to common stockholders |
|
|
|
|
|
|
|
|
|
|
|
|
|
|
|
|
|
|
|
|
|
Basic and diluted |
|
|
24,419 |
|
|
|
13,950 |
|
|
|
3,359 |
|
|
|
2,868 |
|
|
|
2,188 |
|
32
|
|
As of December 31, |
|
||||||||||||||||||
|
(in thousands) |
|
2015 |
|
|
2014 |
|
|
2013 |
|
|
2012 |
|
|
2011 |
|
|||||
|
Consolidated balance sheet data: |
|
|
|
|
|
|
|
|
|
|
|
|
|
|
|
|
|
|
|
|
|
Cash and cash equivalents |
|
$ |
51,712 |
|
|
$ |
78,524 |
|
|
$ |
13,284 |
|
|
$ |
15,410 |
|
|
$ |
12,678 |
|
|
Total assets |
|
|
120,757 |
|
|
|
118,179 |
|
|
|
46,470 |
|
|
|
43,824 |
|
|
|
30,193 |
|
|
Deferred revenue |
|
|
49,359 |
|
|
|
37,141 |
|
|
|
28,574 |
|
|
|
21,756 |
|
|
|
16,041 |
|
|
Redeemable preferred stock |
|
|
— |
|
|
|
— |
|
|
|
91,607 |
|
|
|
86,655 |
|
|
|
81,698 |
|
|
Total stockholders' equity (deficit) |
|
$ |
48,613 |
|
|
$ |
64,276 |
|
|
$ |
(89,607 |
) |
|
$ |
(80,310 |
) |
|
$ |
(77,431 |
) |
The following discussion and analysis of our financial condition and results of operations should be read together with our consolidated financial statements, the related notes, and other financial information included elsewhere in this Annual Report. Some of the information contained in this discussion and analysis or set forth elsewhere in this Annual Report, including information with respect to our plans and strategy for our business, includes forward-looking statements that involve risks and uncertainties. The “Part I, Item 1A. Risk factors” section of this Annual Report should be reviewed for a discussion of important factors that could cause actual results to differ materially from the results described in or implied by the forward-looking statements contained in the following discussion and analysis. We do not undertake, and specifically disclaim, any obligation to update any forward-looking statements to reflect the occurrence of events or circumstances after the date of such statements except as required by law.
Overview
We are a leading provider of IT security and identity solutions to the healthcare industry that help providers securely and efficiently access, communicate and transact patient information. Our security and identity solutions provide authentication management, fast access to patient information, secure communications and positive patient identification to address critical security and compliance challenges faced by hospitals and other healthcare organizations, while improving provider productivity and the patient experience. We believe our solutions save clinicians significant time to focus on patient care, increase their productivity and satisfaction, and help healthcare organizations comply with complex privacy and security regulations. Our solutions can be installed on workstations and other application access points throughout a healthcare organization and once deployed become a critical part of the customer’s security and identity infrastructure. As a result, we believe that our security and identity products are some of the most widely-used technology solutions by our customers’ physicians, nurses, and other clinicians.
With the widespread adoption of healthcare information technology systems and increasing security and privacy regulations, demand for our solutions has grown, which has driven growth in our revenue. Our revenue growth is derived from both sales to new customers as well as add-on sales to our existing customer base. Consistent with our healthcare focused strategy, our healthcare customers, including large integrated healthcare systems, academic medical centers and small- and medium-sized independent healthcare facilities, accounted for the growth in sales to new customers. Many of our customers continue to add licensed users and purchase additional products and services from us after the initial sale.
Many other industries face security and productivity challenges similar to those in healthcare. Although healthcare is our primary focus, we sell to non-healthcare organizations, including financial services, the public sector and other industries. Sales to non-healthcare customers may vary from quarter to quarter as a result of our focus on healthcare customers; however, we anticipate that sales to non-healthcare customers will comprise a smaller portion of our business in the future as sales to healthcare customers increase.
We have focused on growing our business to pursue the significant market opportunity we see for our products and services, and we plan to continue to invest in building for growth. As a result, we expect to incur significant operating costs relating to our research and development initiatives for our new and existing solutions and products, and for expansion of our sales and marketing operations as we add additional sales personnel, increase our marketing efforts and expand into new geographical markets. We also expect to increase our general and administrative expenses to support our growth.
Initial Public Offering
On June 30, 2014, we completed our IPO, in which we sold 5,750,000 shares of common stock, including 750,000 shares sold pursuant to the underwriters’ option to purchase additional shares, at an offering price of $15.00 per share. All outstanding shares of redeemable convertible preferred stock converted to 13,970,934 shares of common stock at the closing of the IPO. Our shares are traded on the NYSE under the symbol “IMPR.” We received proceeds from the IPO of $80.2 million, net of underwriting discounts and commissions, but before offering expenses of approximately $3.4 million. Offering expenses at December 31, 2013 of $0.5
33
million were recorded as other noncurrent assets. These offering expenses, and additional expenses incurred from January 2014 through the closing of the IPO of approximately $2.9 million, have been recorded as a reduction of the proceeds received.
Shelf Registration
On July 1, 2015, we filed an S-3 registration statement as part of a “shelf” registration process, the Resale Registration Statement. Under the Resale Registration Statement, certain of our stockholders, who we refer to as the selling stockholders, may, from time to time, offer and sell up to 13,395,230 shares of our common stock that were issued and outstanding prior to the date of the registration statement. The selling stockholders are former holders of our preferred stock originally acquired through several private placements prior to its initial public offering. All of such shares of preferred stock were converted into shares of our common stock in connection with our initial public offering.
On August 11, 2015, the selling stockholders sold an aggregate of 5.3 million shares of common stock pursuant to the Resale Registration Statement. We did not receive any of the proceeds from the sale of the shares. We incurred $490,000 of costs associated with the offering during the year ended December 31, 2015.
Acquisitions
On April 30, 2015, we acquired 100% of the equity of HT Systems, a provider of palm-vein based biometric patient identification systems, to enter into the positive patient identification market for a purchase price of $19.1 million net of $120,000 of working capital adjustments, for total cash consideration of $19.0 million, plus up to $5.0 million based on achieving certain sales targets over the two-year period following the transaction.
During the year ended December 31, 2015, $709,000 of acquisition-related costs were incurred due to the HT Systems acquisition, which are included in general and administrative expenses.
During the last four years, we completed two small acquisitions, one acquiring certain assets of Validus Medical Systems (“Validus”) and the other acquiring certain assets of Viion Systems, Inc. The total consideration for these two transactions was $650,000 in cash, plus future earn-outs. The Validus earn-out was classified as a contingent liability. During the quarter ended December 31, 2015, we made a payment of $11,000 related to this contingent liability. These acquisitions have not contributed significantly to our revenue in any year. The assets acquired enhanced our solutions by contributing technology to our Imprivata Cortext solution and the Secure Walk-Away product in our Imprivata OneSign solution.
Adjusted EBITDA
We believe that the presentation of Adjusted EBITDA provides investors with additional information about our financial results. Adjusted EBITDA is an important supplemental measure used by our board of directors and management to evaluate our operating performance from period to period on a consistent basis and as a measure for planning and forecasting overall expectations and for evaluating actual results against such expectations.
We define Adjusted EBITDA as earnings before interest, taxes, depreciation and amortization adjusted for foreign currency gains (losses), stock based-compensation, as well as adjustments such as acquisition costs, shelf registration costs, and the impact of the fair value revaluation on our contingent liability.
Adjusted EBITDA is not in accordance with, or an alternative to, measures prepared in accordance with United States generally accepted accounting principles (“U.S. GAAP”). In addition, this non-GAAP measure is not based on any comprehensive set of accounting rules or principles. As a non-GAAP measure, Adjusted EBITDA has limitations in that it does not reflect all of the amounts associated with our results of operations as determined in accordance with U.S. GAAP. In particular:
|
|
• |
Adjusted EBITDA does not reflect the amounts we paid in taxes or other components of our tax provision; |
|
|
• |
Adjusted EBITDA does not include depreciation expense from fixed assets or amortization expense from acquired intangible assets; |
|
|
• |
Adjusted EBITDA does not reflect other (expense) income which include interest income we earn on cash and cash equivalents; interest expense, or the cash requirements necessary to service interest or principal payments, on our debt and capital leases; and the gains or losses on foreign currency transactions; |
|
|
• |
Adjusted EBITDA does not include the impact of stock-based compensation; |
|
|
• |
Adjusted EBITDA does not include the change in value of our contingent liability related to the acquisition of assets from Validus Medical Systems, as described in the Notes to consolidated financial statements; |
34
|
|
• |
Adjusted EBITDA does not include transaction costs associated with business acquisitions; and |
|
|
• |
Others may calculate Adjusted EBITDA differently than we do and these calculations may not be comparable to our Adjusted EBITDA metric. Because of these limitations, you should consider Adjusted EBITDA alongside other financial performance measures, including net income (loss) and our financial results presented in accordance with U.S. GAAP. |
The following table provides a reconciliation of net loss to Adjusted EBITDA for each of the periods indicated:
|
|
|
Year Ended December 31, |
|
|||||||||||||||||
|
(in thousands, except per share amounts) |
|
2015 |
|
|
2014 |
|
|
2013 |
|
|
2012 |
|
|
2011 |
|
|||||
|
GAAP net (loss) income |
|
$ |
(23,067 |
) |
|
$ |
(16,736 |
) |
|
$ |
(5,523 |
) |
|
$ |
1,048 |
|
|
$ |
2,722 |
|
|
Adjustments to reconcile to Adjusted EBITDA: |
|
|
|
|
|
|
|
|
|
|
|
|
|
|
|
|
|
|
|
|
|
Income tax expense |
|
|
838 |
|
|
|
169 |
|
|
|
108 |
|
|
|
109 |
|
|
|
129 |
|
|
Depreciation and amortization |
|
|
3,761 |
|
|
|
3,075 |
|
|
|
2,397 |
|
|
|
1,082 |
|
|
|
842 |
|
|
Other (expense) income, net |
|
|
567 |
|
|
|
722 |
|
|
|
(109 |
) |
|
|
90 |
|
|
|
(68 |
) |
|
Stock-based compensation |
|
|
4,155 |
|
|
|
1,612 |
|
|
|
640 |
|
|
|
450 |
|
|
|
347 |
|
|
Change in fair value of contingent liability |
|
|
197 |
|
|
|
(376 |
) |
|
|
(877 |
) |
|
|
(431 |
) |
|
|
227 |
|
|
Acquisition costs |
|
|
709 |
|
|
|
— |
|
|
|
— |
|
|
|
— |
|
|
|
— |
|
|
Shelf registration and offering costs |
|
|
490 |
|
|
|
— |
|
|
|
— |
|
|
|
— |
|
|
|
— |
|
|
Adjusted EBITDA |
|
$ |
(12,350 |
) |
|
$ |
(11,534 |
) |
|
$ |
(3,364 |
) |
|
$ |
2,348 |
|
|
$ |
4,199 |
|
Backlog
Our backlog consists of the total future value of our committed customer purchases, whether billed or unbilled. Backlog includes products, software maintenance and professional services which we have billed or been paid for in advance, and are included in deferred revenue on our balance sheet, as well as committed customer purchases where we have not invoiced or fulfilled the order as of the last day of the applicable period and which are not reflected on our balance sheet. We generally complete the unfulfilled committed customer product purchases by shipment in the next fiscal quarter and recognize revenue upon such shipment. We recognize any maintenance and services revenue related to unfulfilled committed customer purchases in subsequent periods in accordance with our revenue recognition policies. As of December 31, 2015 and 2014, we had backlog of $51.8 million and $39.3 million, respectively. Of the $51.8 million in backlog as of December 31, 2015, approximately $45.6 million, which includes approximately $30.5 million of maintenance, is expected to be recognized as revenue during the year ended December 31, 2016. Additionally, $4.2 million of maintenance revenue is expected to be recognized over the five year period subsequent to the year ended December 31, 2016. Revenue in any period is a function of new purchases during the period, the timing of fulfillment of customer orders, maintenance renewals and revenue recognized from backlog. Therefore, backlog viewed in isolation may not be indicative of future performance. Our presentation of backlog may differ from that of other companies in our industry.
Critical accounting estimates
Our financial statements are prepared in conformity with U.S. GAAP. The preparation of these financial statements requires management to make estimates and assumptions that affect the reported amounts of assets and liabilities and disclosure of contingent assets and liabilities at the date of the financial statements and the reported amounts of revenue and expenses during the reporting period. Actual results could differ from those estimates. To the extent that there are material differences between our estimates and our actual results, our future financial statement presentation, financial condition, results of operations and cash flows will be affected. See “Note 2. Summary of significant accounting policies” included elsewhere in this Annual Report for information about these critical accounting policies.
Revenue recognition and deferred revenue
We derive our revenue primarily from the licensing of software, as well as devices, maintenance and services. Revenue is recognized when persuasive evidence of an arrangement exists, delivery has occurred, the fee is fixed or determinable, and collection is considered probable. Product revenue is recognized upon shipment, assuming all other revenue recognition criteria have been met. Services are considered delivered as the work is performed and maintenance is considered delivered ratably over the contractual maintenance term. We have a limited number of customers who purchase our software on a term basis and we recognize these sales ratably over the term.
35
Sales of our software that are sold through resellers are recognized as revenue based on the same criteria as direct sales and upon identification of the end user. For sales through resellers, the reseller assumes the risk of collection from the end user and we do not offer a right of return or price protection to any of our resellers.
When arrangements contain software and non-software elements, we allocate the arrangement consideration to the software and non-software elements. The fair value of the elements is determined utilizing vendor-specific objective evidence of fair value, or VSOE, when available, third party evidence or the best estimate of selling price when VSOE of fair value is not determinable. We are currently unable to establish VSOE of fair value or third party evidence for our software elements as a group. Therefore the best estimate of selling price for the software elements is determined by considering various factors including but not limited to our standard software maintenance rates, the historical selling price of these deliverables in similar transactions, and our standard pricing practices along with geographies and customer class. After determining fair value for each deliverable, the arrangement consideration is allocated between the software elements, as a group, and the non-software elements using the relative selling price method. The non-software elements are then recognized upon delivery and when all other revenue recognition criteria are met.
For software arrangements that contain multiple deliverables where VSOE of fair value exists for all undelivered elements such as maintenance and services, we recognize revenue for the delivered elements using the residual method. VSOE of fair value is determined based upon the price charged when the same element is sold separately. VSOE of fair value of maintenance on user based licenses is based on the price customers are charged when they purchase maintenance separately from other products. Separate sales of maintenance occur when customers make the decision to renew their contracts in years subsequent to the initial maintenance term. We analyze our separate sales based on the “bell-shaped” curve method to ensure that the separate sales are sufficiently concentrated around a specific point and within a narrow enough range to enable a reasonable estimate of fair value. VSOE of fair value of maintenance on enterprise licenses is based on separately stated renewal rates in the arrangement that are substantive.
For software elements or arrangements containing multiple deliverables where VSOE of fair value does not exist for all undelivered elements, we defer revenue for the delivered and undelivered elements until VSOE of fair value is established for all of the undelivered element or all of the elements have been delivered, unless the only undelivered element is delivered over time (e.g., maintenance) where we record revenue ratably over the delivery period.
We recognize maintenance ratably over the term of the maintenance contract, generally 12 months. We recognize revenue allocated to professional service elements, such as installation and training, as the services are performed based on VSOE of fair value for each service performed.
Accounting for stock-based compensation
We record compensation expense for stock awards granted based on the awards estimated fair value. The measurement date for stock awards granted to employees is generally the date of grant. The measurement date for nonemployee awards is the date services are completed or the award is earned. Stock-based compensation is recognized on a straight-line basis over the requisite service period, which generally is the vesting period. The estimation of stock awards that will ultimately vest requires judgment and to the extent that actual results or updated estimates differ from current estimates, such amounts will be recorded as a cumulative adjustment in the period during which estimates are revised. Actual results and future changes in estimates may differ substantially from current estimates.
We utilize the Black-Scholes option-pricing model to estimate the fair value of stock options awarded to employees, which requires several key assumptions to be made. In determining the fair value of our stock-based awards, the risk-free interest rate for each award was based on the rate for United States Treasury zero-coupon bonds with maturities similar to the expected term of the award being valued. The expected life was based on a review of the period that our stock option awards are expected to be outstanding and is calculated using the simplified method, which represents the average of the contractual term of the options and the weighted-average vesting period of the options. We use the simplified method because we do not have sufficient historical option exercise data to provide a reasonable basis upon which to estimate the expected term. The expected dividend yield is zero as we have not declared dividends and our expectation is not to pay dividends in the foreseeable future. We do not have relevant historical data to develop our volatility assumptions and as a result we use the volatility of several public peer companies to determine our expected volatility.
Significant factors, assumptions and methodologies used in determining fair value of common stock
For all stock options grants made on or after June 25, 2014, we used the closing price of our common stock on the grant date.
Because our common stock was not publically traded prior to our initial public offering on June 25, 2014, our board of directors estimated the fair value of our common stock at the time of each grant. The board of directors based their estimate on both objective
36
and subjective factors along with valuation analyses prepared by an independent third-party valuation firm. Factors considered by our board of directors included:
|
|
• |
independent third-party valuations; |
|
|
• |
the nature and historical performance of our business; |
|
|
• |
our operating performance and financial condition; |
|
|
• |
general economic conditions and the specific outlook for our industry; |
|
|
• |
the lack of liquidity for our stock; |
|
|
• |
the expected timing and likelihood of achieving different liquidity events or remaining a private company. |
We obtained independent third-party valuations of our common stock in accordance with the guidelines outlined in the American Institute of Certified Public Accountants Practice Aid, “Valuation of Privately-Held-Company Equity Securities Issued as Compensation.” The valuation approach selected for these valuations includes both the market approach and the income approach and we used the probability-weighted expected return method to allocate the equity value among the preferred and common classes of stock.
The market approach is a general way of determining a value indication of a business, business ownership interest, security, or intangible asset by using one or more methods that compare the subject to similar businesses, business ownership interests, securities, or intangible assets that have been sold. Our market approach relied on comparisons to publicly traded stocks or to sales of similar companies. When choosing the comparable companies to be used for the market approach, we focused on companies which provide information technology security or healthcare information technology solutions. Our list of guideline public companies has changed over time due to factors such as acquisitions and initial public offerings. The income approach is a general way of determining a value indication of a business, business ownership interest, security, or intangible asset using one or more methods that convert anticipated economic benefits into a present single amount. Our income approach utilized the discounted cash flow method.
After estimating our enterprise value, we allocated the equity between the preferred and common stock using the probability-weighted expected return method. Under the probability-weighted expected return method, the value of an enterprise’s common stock is estimated based upon an analysis of our future values assuming various possible future liquidity events, including the likelihood of an initial public offering and other scenarios, such as a sale of our company. Share value is based upon the probability-weighted present value of expected future net cash flows, considering each of the possible future events, as well as the rights and preferences of each share class.
Goodwill and intangible assets
We allocate the purchase price of any acquisitions to tangible assets and liabilities and identifiable intangible assets acquired. Any residual purchase price is recorded as goodwill. The allocation of the purchase price requires management to make significant estimates in determining the fair values of assets acquired and liabilities assumed, especially with respect to intangible assets. These estimates are based on information obtained from management of the acquired companies and historical experience. These estimates can include, but are not limited to, the cash flows that an asset is expected to generate in the future, and the cost savings expected to be derived from acquiring an asset. These estimates are inherently uncertain and unpredictable, and if different estimates were used the purchase price for the acquisition could be allocated to the acquired assets and liabilities differently from the allocation that we have made. In addition, unanticipated events and circumstances may occur which affect the accuracy or validity of such estimates, and if such events occur we may be required to record a charge against the value ascribed to an acquired asset or an increase in the amounts recorded for assumed liabilities.
Goodwill
Goodwill is tested for impairment at the reporting unit level at least annually or more often if events or changes in circumstances indicate the carrying value may not be recoverable. Significant judgments required in assessing the impairment of goodwill include the identification of reporting units, identifying whether events or changes in circumstances require an impairment assessment, estimating future cash flows, determining appropriate discount and growth rates and other assumptions. Changes in these estimates and assumptions could materially affect the determination of fair value as to whether an impairment exists and, if so, the amount of that impairment.
A reporting unit can be either an operating segment or a component of an operating segment depending on the circumstances. The determination of an operating segment or component is based on the availability of discrete financial information and whether or not that information is reviewed and used by the chief operating decision maker or decision making group. Our chief operating decision
37
maker is our Chief Executive Officer. Our chief operating decision maker reviews consolidated operating results to assess the performance of the entire Company and does not review results on a segment or component basis. Accordingly, we have determined that there is one reporting unit.
No impairment of goodwill was recorded during the years ended December 31, 2015, 2014, or 2013.
Intangible assets
In connection with an asset acquisition we made in 2011 and acquisition of HT Systems in 2015, we recorded intangible assets. We applied an income approach to determine the value of these intangible assets; the income approach measures the value of an asset based on the future cash flows it is expected to generate over its remaining life. The application of the income approach requires estimates of future cash flows based upon, among other things, certain assumptions about expected future operating performance and an appropriate discount rate determined by our management. In applying the income approach, we used the multi-period excess earnings method to value our in-process research and development intangible assets and the relief from royalty method to value our trade name intangible assets. The cash flows expected to be generated by each intangible asset were discounted to their present value equivalent using discount rates consistent with market participant assumptions.
We also acquired patents and other intellectual property in 2009, 2010, and 2015 and recorded intangible assets related to these purchases. These intangible assets were purchased outside of a business combination and were initially recognized and measured based on their cost to us.
Costs incurred during the application development stage of internal-use software projects, such as those used in our product offerings, are capitalized in accordance with the accounting guidance for costs of computer software developed for internal use. Capitalized costs include external consulting fees and payroll and payroll-related costs for employees in our research and development groups who are directly associated with, and who devote time to, our internal-use software projects during the application development stage. Capitalization begins when the planning stage is complete and we commit resources to software development. Capitalization ceases when the software has been developed, tested and is ready for its intended use. Amortization of the asset commences when the software is placed into service. We assess the useful life of internal-use software once the development is complete and amortizes the completed costs on a straight line basis. Costs incurred during the planning, training and post-implementation stages of the software development life-cycle are expensed as incurred. Costs related to upgrades and enhancements of existing internal-use software that increase the functionality of the software are also capitalized. At December 31, 2015, we had $1.2 million in capitalized software development costs related to the internal-use software currently being developed. The capitalized software development costs have been recorded in intangible assets.
Intangible assets are amortized over their estimated useful lives. Upon completion of development, acquired in-process research and development assets are generally considered amortizable, finite-lived assets and are amortized over their estimated useful lives. We evaluate intangible assets for impairment by assessing the recoverability of these assets whenever adverse events or changes in circumstances or business climate indicate that expected undiscounted future cash flows related to such intangible assets may not be sufficient to support the net book value of such assets. An impairment is recognized in the period of identification to the extent the carrying amount of an asset exceeds the fair value of such asset. No impairment of intangible assets was recorded in the years ended December 31, 2015, 2014, or 2013.
Recent accounting guidance
Recently adopted accounting updates
In September 2015, the Financial Accounting Standards Board (“FASB”) issued Accounting Standards Update (“ASU”) No. 2015-16 “Business Combinations (Topic 805): Simplifying the Accounting for Measurement-Period Adjustments.” The ASU eliminates the requirement for an acquirer in a business combination to account for measurement-period adjustments retrospectively. The new guidance requires that the cumulative impact of a measurement-period adjustment (including the impact on prior periods) be recognized in the reporting period in which the adjustment is identified. The guidance is effective for fiscal years beginning after December 15, 2015, and interim periods within those fiscal years. Early adoption is permitted for any interim and annual financial statements that have not yet been made available for issuance. We have elected early adoption of this guidance, effective in the third quarter ended September 30, 2015. During the year ended December 31, 2015, we recorded a measurement period adjustment which resulted in an immaterial impact. See “Note 3. Business combination” for additional information.
In November 2015, the FASB issued ASU No. 2015-17 “Income Taxes (Topic 740): Balance Sheet Classification of Deferred Taxes.” The ASU requires companies to classify all deferred tax assets and liabilities as noncurrent on the balance sheet instead of separating deferred taxes into current and noncurrent amounts. The guidance is effective for financial statements issued for annual periods beginning after December 15, 2016 and interim periods within those annual periods. The guidance may be adopted on either a
38
prospective or retrospective basis. Early adoption is permitted for any interim and annual financial statements that have not yet been issued. We have elected early adoption of this guidance, effective in the fourth quarter and the year ended December 31, 2015. The adoption of this guidance had an immaterial impact on our balance sheet. See “Note 18. Income taxes” for additional information.
Accounting standards or updates not yet effective
In May 2014, the FASB issued ASU No. 2014-09, “Revenue from Contracts with Customers” (Topic 606) (ASU 2014-09). ASU 2014-09 outlines a single comprehensive model for entities to use in accounting for revenue arising from contracts with customers and supersedes most current revenue recognition guidance, including industry-specific guidance. In August 2015, the FASB issued ASU 2015-14, “Revenue from Contracts with Customers—Deferral of the Effective Date,” that defers by one year the effective date of ASU 2014-09, “Revenue from Contracts with Customers.” The guidance is effective for public companies with annual reporting periods beginning after December 15, 2017, including interim periods within that reporting period. Earlier adoption is permitted only as of annual reporting periods beginning after December 15, 2016, including interim reporting periods within that reporting period. Entities have the option of using either a full retrospective or a modified approach to adopt the guidance. This guidance could impact the timing and amounts of revenue recognized. In 2015, the FASB proposed amendments and clarifications to various aspects of the guidance. These amendments were proposed in three FASB exposure drafts. We are currently evaluating the effect that implementation of this guidance and any amendments will have on our consolidated financial statements upon adoption. Any changes to the guidance resulting from the proposed amendments could change our assessment of the impact that adoption might have on our consolidated financial statements and could impact our decision on whether or not to early adopt.
In August 2014, the FASB issued ASU 2014-15, “Presentation of Financial Statements — Going Concern (Subtopic 205-40): Disclosure of Uncertainties about an Entity’s Ability to Continue as a Going Concern.” This guidance requires management to evaluate whether there are conditions and events that raise substantial doubt about an entity’s ability to continue as a going concern. ASU 2014-15 is effective for the annual periods ending after December 15, 2016 and for interim periods in fiscal years beginning after December 15, 2016, the first quarter of 2017. Early adoption is permitted. We do not believe the adoption of this guidance will have a material impact on our consolidated financial statements.
In April 2015, the FASB issued an ASU No. 2015-03, “Interest—Imputation of Interest (Subtopic 835-30): Simplifying the Presentation of Debt Issuance Costs,” requiring debt issuance costs related to a recognized debt liability to be presented in the balance sheet as a direct deduction from the carrying amount of that debt, consistent with debt discounts. The accounting standard update will be effective for us for fiscal years beginning after December 15, 2015, and interim periods within those fiscal years on a retrospective basis, with early adoption permitted. As of December 31, 2015, we had not early adopted this guidance. The accounting standard update is a change in balance sheet presentation only and is not expected to have a material impact on our consolidated financial statements.
In April 2015, the FASB issued ASU 2015-05, “Intangibles – Goodwill and Other Internal-Use Software (Subtopic 350-40): Customer’s Accounting for Fees Paid in a Cloud Computing Arrangement.” This ASU provides guidance to customers about whether a cloud computing arrangement includes a software license. If a cloud computing arrangement includes a software license, the customer should account for the software license element of the arrangement consistent with the acquisition of other software licenses. If a cloud computing arrangement does not include a software license, the customer should account for the arrangement as a service contract. The new guidance does not change the accounting for a customer’s accounting for service contracts. ASU 2015-05 is effective for interim and annual reporting periods beginning after December 15, 2015. We anticipate that the adoption of this ASU will not have a material impact on our consolidated financial statements.
In July 2015, the FASB issued ASU 2015-11, “Simplifying the Measurement of Inventory,” (Topic 330). ASU 2015-11 requires that inventory within the scope of the guidance be measured at the lower of cost and net realizable value. Inventory measured using last-in, first-out and the retail inventory method are not impacted by the new guidance. This guidance will be effective for public business entities in fiscal years beginning after December 15, 2016, including interim periods within those years. Prospective application is required. Early adoption is permitted as of the beginning of an interim or annual reporting period. We measure inventory using first-in, first out method and anticipate adopting this guidance. We do not believe the adoption of this guidance will have a material impact on our consolidated financial statements.
39
The following table sets forth our consolidated statements of operations data for each of the periods presented.
|
|
|
Year Ended December 31, |
|
|||||||||
|
(in thousands, except per share data) |
|
2015 |
|
|
2014 |
|
|
2013 |
|
|||
|
Revenue |
|
|
|
|
|
|
|
|
|
|
|
|
|
Product |
|
$ |
64,937 |
|
|
$ |
52,164 |
|
|
$ |
39,124 |
|
|
Maintenance and services |
|
|
54,183 |
|
|
|
44,815 |
|
|
|
31,987 |
|
|
Total revenue |
|
|
119,120 |
|
|
|
96,979 |
|
|
|
71,111 |
|
|
Cost of revenue |
|
|
|
|
|
|
|
|
|
|
|
|
|
Product |
|
|
16,876 |
|
|
|
12,310 |
|
|
|
7,849 |
|
|
Maintenance and services |
|
|
21,181 |
|
|
|
17,678 |
|
|
|
11,020 |
|
|
Total cost of revenue |
|
|
38,057 |
|
|
|
29,988 |
|
|
|
18,869 |
|
|
Gross profit |
|
|
81,063 |
|
|
|
66,991 |
|
|
|
52,242 |
|
|
Operating expenses |
|
|
|
|
|
|
|
|
|
|
|
|
|
Research and development |
|
|
31,600 |
|
|
|
25,781 |
|
|
|
19,609 |
|
|
Sales and marketing |
|
|
52,400 |
|
|
|
45,003 |
|
|
|
30,538 |
|
|
General and administrative |
|
|
18,725 |
|
|
|
12,052 |
|
|
|
7,619 |
|
|
Total operating expenses |
|
|
102,725 |
|
|
|
82,836 |
|
|
|
57,766 |
|
|
Loss from operations |
|
|
(21,662 |
) |
|
|
(15,845 |
) |
|
|
(5,524 |
) |
|
Other income (expense) |
|
|
|
|
|
|
|
|
|
|
|
|
|
Foreign currency exchange loss |
|
|
(527 |
) |
|
|
(576 |
) |
|
|
229 |
|
|
Interest and other income expense (net) |
|
|
(40 |
) |
|
|
(146 |
) |
|
|
(120 |
) |
|
Loss before income taxes |
|
|
(22,229 |
) |
|
|
(16,567 |
) |
|
|
(5,415 |
) |
|
Income taxes |
|
|
838 |
|
|
|
169 |
|
|
|
108 |
|
|
Net loss |
|
$ |
(23,067 |
) |
|
$ |
(16,736 |
) |
|
$ |
(5,523 |
) |
Revenue
Product revenue is generally recognized upon shipment of the software license key or hardware. Software, subscription and maintenance revenues are recognized ratably over their respective subscription and maintenance period. Revenue from our professional service arrangements is recognized as the services are performed. Training revenue is recognized when the training is completed. See “Summary of significant accounting policies—Revenue recognition” for more information.
The following table sets forth our revenues for each of the periods presented.
|
|
|
Year Ended |
|
|
|
|
|
|
|
|
|
|
Year Ended |
|
|
|
|
|
|
|
|
|
||||||||||
|
|
|
December 31, |
|
|
Period-to-Period |
|
|
December 31, |
|
|
Period-to-Period |
|
||||||||||||||||||||
|
|
|
2015 |
|
|
2014 |
|
|
Change |
|
|
2014 |
|
|
2013 |
|
|
Change |
|
||||||||||||||
|
(dollars in thousands) |
|
Amount |
|
|
Amount |
|
|
$ |
|
|
% |
|
|
Amount |
|
|
Amount |
|
|
$ |
|
|
% |
|
||||||||
|
Revenue |
|
|
|
|
|
|
|
|
|
|
|
|
|
|
|
|
|
|
|
|
|
|
|
|
|
|
|
|
|
|
|
|
|
Product revenue |
|
$ |
64,937 |
|
|
$ |
52,164 |
|
|
$ |
12,773 |
|
|
|
24.5 |
% |
|
$ |
52,164 |
|
|
$ |
39,124 |
|
|
$ |
13,040 |
|
|
|
33.3 |
% |
|
Percentage of revenue |
|
|
54.5 |
% |
|
|
53.8 |
% |
|
|
|
|
|
|
|
|
|
|
53.8 |
% |
|
|
55.0 |
% |
|
|
|
|
|
|
|
|
|
Maintenance and service revenue |
|
|
54,183 |
|
|
|
44,815 |
|
|
|
9,368 |
|
|
|
20.9 |
% |
|
|
44,815 |
|
|
|
31,987 |
|
|
|
12,828 |
|
|
|
40.1 |
% |
|
Percentage of revenue |
|
|
45.5 |
% |
|
|
46.2 |
% |
|
|
|
|
|
|
|
|
|
|
46.2 |
% |
|
|
45.0 |
% |
|
|
|
|
|
|
|
|
|
Total Revenue |
|
$ |
119,120 |
|
|
$ |
96,979 |
|
|
$ |
22,141 |
|
|
|
22.8 |
% |
|
$ |
96,979 |
|
|
$ |
71,111 |
|
|
$ |
25,868 |
|
|
|
36.4 |
% |
Product revenue
We derive our product revenue from the sales of both software and hardware. We derive substantially all of our software revenue from the sale of perpetual licenses for our Imprivata OneSign solution. Our license sales are generally priced on a per user basis, but are sometimes licensed on an enterprise-wide basis with an unlimited number of users. From time to time, we also derive software revenue from licenses sold on a term license basis. The software is delivered pre-loaded on a hardware server or as a software only solution that provides the same functionality as the software delivered on the pre-loaded server. Hardware sales also include the sale of devices such as proximity card readers, fingerprint readers and palm vein biometric readers.
40
Comparison of years ended December 31, 2015 and 2014
Product revenue increased by $12.8 million, or 25%, during the year ended December 31, 2015, as compared to the year ended December 31, 2014. The increase was driven primarily by an increase of $12.8 million in sales of additional products into our existing customer base, $13.3 million of which relate to healthcare customers, which was offset by a $741,000 decrease in sales to non-healthcare customers. Sales to new customers increased by approximately $209,000 primarily due to increase in sales to new non-healthcare customers during the twelve months ended December 31, 2015 as compared to the twelve months ended December 31, 2014. Although our sales to non-healthcare customers increased during the twelve months ended December 31, 2015, product sales to non-healthcare customers represent a smaller portion of our business. We categorize revenue from new customers based on the initial purchase order value which does not include any follow-on orders that may occur within the same fiscal year; those follow-on orders would be classified as revenue to our installed base. As our installed base grows, we expect product revenues to be a greater percentage of total revenues. Trends in the value of new customer sales are affected by average value of the initial order and number of customers, which may vary based on which products are purchased on the initial order. As a percentage of product revenue, sales to non-healthcare customers were 4% for the years ended December 31, 2015 and 2014. We expect sales to non-healthcare customers to decline as a percentage of our total product revenue in future periods.
Comparison of years ended December 31, 2014 and 2013
Product revenue increased by $13.0 million, or 33%, during the year ended December 31, 2014, as compared to the year ended December 31, 2013. The increase was driven primarily by an increase of $9.6 million in sales of additional products into our existing customer base, $8.8 million of which were related to healthcare customers. Sales to new customers increased by approximately $3.6 million over the same period. Sales to new healthcare customers increased by $3.9 million for the year ended December 31, 2014 as compared to the year ended December 31, 2013, which was offset by a $300,000 decrease in sales to new non-healthcare customers. Although our sales to new non-healthcare customers is decreasing due to our focus on the healthcare industry, we believe the composition of new customers may vary on a quarterly basis and is not indicative of any additional trend.
Maintenance and service revenue
Maintenance and services revenue is generated from maintenance and technical support associated with our software as well as professional services, which include implementation and training. Maintenance is typically invoiced annually in advance, recorded as deferred revenue and recognized ratably over the maintenance period. Professional services revenue consists primarily of fees associated with the implementation of our software and training services, and represented between 9% and 11% of our revenues for the years ended December 31, 2015, 2014, and 2013. Our professional service arrangements are generally billed on a time and materials basis and revenue is recognized as the services are performed. Training is generally billed as a fixed fee and revenue is recognized when the training is completed.
Comparison of years ended December 31, 2015 and 2014
Maintenance and service revenue increased by $9.4 million, or 21%, during the year ended December 31, 2015, as compared to the year ended December 31, 2014. The increase was driven by increased maintenance revenue of $7.7 million resulting from our larger installed base of users. In addition, professional services increased by $1.7 million over the same period due to the increased sales of our products, which resulted in new professional services related to implementation and training.
Comparison of years ended December 31, 2014 and 2013
Maintenance and service revenue increased by $12.8 million, or 40%, during the year ended December 31, 2014, as compared to the year ended December 31, 2013. The increase was driven by increased maintenance revenue of $8.1 million resulting from our larger installed base of users. In addition, professional services increased by $4.7 million over the same period due to the increased sales of our products, which resulted in new professional services related to implementation and training.
41
The following table sets forth our cost of revenues for each of the periods presented.
|
|
|
Year Ended |
|
|
|
|
|
|
|
|
|
|
Year Ended |
|
|
|
|
|
|
|
|
|
||||||||||
|
|
|
December 31, |
|
|
Period-to-Period |
|
|
December 31, |
|
|
Period-to-Period |
|
||||||||||||||||||||
|
|
|
2015 |
|
|
2014 |
|
|
Change |
|
|
2014 |
|
|
2013 |
|
|
Change |
|
||||||||||||||
|
(dollars in thousands) |
|
Amount |
|
|
Amount |
|
|
$ / # |
|
|
% |
|
|
Amount |
|
|
Amount |
|
|
$ / # |
|
|
% |
|
||||||||
|
Cost of revenue |
|
|
|
|
|
|
|
|
|
|
|
|
|
|
|
|
|
|
|
|
|
|
|
|
|
|
|
|
|
|
|
|
|
Product |
|
$ |
16,876 |
|
|
$ |
12,310 |
|
|
$ |
4,566 |
|
|
|
37.1 |
% |
|
$ |
12,310 |
|
|
$ |
7,849 |
|
|
$ |
4,461 |
|
|
|
56.8 |
% |
|
Product gross margin |
|
|
74.0 |
% |
|
|
76.4 |
% |
|
|
|
|
|
|
|
|
|
|
76.4 |
% |
|
|
79.9 |
% |
|
|
|
|
|
|
|
|
|
Maintenance and services |
|
|
21,181 |
|
|
|
17,678 |
|
|
|
3,503 |
|
|
|
19.8 |
% |
|
|
17,678 |
|
|
|
11,020 |
|
|
|
6,658 |
|
|
|
60.4 |
% |
|
Maintenance and service gross margin |
|
|
60.9 |
% |
|
|
60.6 |
% |
|
|
|
|
|
|
|
|
|
|
60.6 |
% |
|
|
65.5 |
% |
|
|
|
|
|
|
|
|
|
Total cost of revenue |
|
$ |
38,057 |
|
|
$ |
29,988 |
|
|
$ |
8,069 |
|
|
|
26.9 |
% |
|
$ |
29,988 |
|
|
$ |
18,869 |
|
|
$ |
11,119 |
|
|
|
58.9 |
% |
|
Total gross margin |
|
|
68.1 |
% |
|
|
69.1 |
% |
|
|
|
|
|
|
|
|
|
|
69.1 |
% |
|
|
73.5 |
% |
|
|
|
|
|
|
|
|
|
Headcount |
|
|
109 |
|
|
|
94 |
|
|
|
15 |
|
|
|
16.0 |
% |
|
94 |
|
|
|
69 |
|
|
|
25 |
|
|
|
36.2 |
% |
|
Cost of product revenue
Cost of product consists primarily of costs of physical appliances, palm vein biometric readers, proximity cards and fingerprint readers. Additional product costs include third party software license costs, duties and freight, and amortization expense related to intangible assets acquired.
Comparison of years ended December 31, 2015 and 2014
Cost of product revenue increased by $4.6 million, or 37%, during the year ended December 31, 2015, as compared to the year ended December 31, 2014. The increase was primarily attributable to the increase in sales of proximity cards and fingerprint devices during the year ended December 31, 2015, as compared to the year ended December 31, 2014. Product gross margin decreased as a result of the mix between higher-margin software and lower-margin device sales. Device revenues as a percentage of total product revenues can fluctuate and, as a result, we expect product gross margins to vary depending on the mix of device revenues to total product revenues.
Comparison of years ended December 31, 2014 and 2013
Cost of product revenue increased by $4.5 million, or 57%, during the year ended December 31, 2014, as compared to the year ended December 31, 2013. The increase was primarily attributable to the increase in product sales related to proximity card and fingerprint devices. Product gross margin decreased due to unfavorable changes in the mix between higher-margin software and device sales. Device sales have lower margins than software sales and device sales increased as a percentage of total product revenue during the year ended 2014 as compared to the year ended 2013 which resulted in the decrease in product gross margin. Device revenues as a percentage of total product revenues can fluctuate and, as a result, we expect product gross margins to vary depending on the mix of device revenues to total product revenues.
Cost of maintenance and service revenue
Cost of maintenance and services consists primarily of costs related to our support and professional services personnel, including employee wages and benefits, bonuses, stock compensation and travel expense. These costs also include depreciation and overhead related to facilities and information technology used to provide these services.
Comparison of years ended December 31, 2015 and 2014
Cost of maintenance and services revenue increased by $3.5 million, or 20%, during the year ended December 31, 2015, as compared to the year ended December 31, 2014. The increase was primarily attributable to an increase of $3.3 million in payroll and related costs as a result of increased investment in our support and services personnel. In addition, the increase in the number of employees hired also resulted in an increase in travel-related costs of $555,000. These increases were partially offset by a $577,000 decrease in consulting expense as we reduce our use of third party consultants for support and services. The timing of the recognition of expenses for new hires may vary within the periods presented and is not indicative of any trend.
42
Comparison of years ended December 31, 2014 and 2013
Cost of maintenance and services revenue increased by $6.7 million, or 60%, during the year ended December 31, 2014, as compared to the year ended December 31, 2013. The increase was primarily attributable to $4.1 million in payroll-related costs as a result of increased investment in our support and service personnel. In addition, the increase in employees hired also caused an increase in information technology costs of $482,000, travel-related costs of $827,000 and third-party recruiting fees of $117,000. In addition we incurred an increase of $426,000 for depreciation expense primarily due to our expansion of our facilities and increased purchases of information technology equipment and an increase of $179,000 for consulting and outside services. The decrease in gross margin from the year ended December 31, 2013 to the year ended December 31, 2014 related to maintenance and services was due to our investments in support and service personnel to support our anticipated future growth.
Operating expenses
Our operating expenses consist primarily of personnel costs, including salaries, commissions, bonuses, share-based compensation and related benefits and taxes, costs related to the design and development of new products and enhancement of existing products, marketing programs, consulting, travel, and depreciation expenses. Personnel costs are our largest expense, representing $66.2 million, or 64% of our total operating expenses for the year ended December 31, 2015; $53.5 million, or 65% of our total operating expenses for the year ended December 31, 2014; and $35.3 million, or 61% of our total operating expenses for the year ended December 31, 2013. We allocate overhead such as our information technology expenses, including personnel costs, and facility expenses based on headcount. Due to our headcount growth, we have increased the leased square footage for our corporate headquarters in Lexington, Massachusetts and our capital expenditures for leasehold improvements and information technology equipment.
The following table sets forth our operating expenses.
|
|
|
Year Ended |
|
|
|
|
|
|
|
|
|
|
Year Ended |
|
|
|
|
|
|
|
|
|
||||||||||
|
|
|
December 31, |
|
|
Period-to-Period |
|
|
December 31, |
|
|
Period-to-Period |
|
||||||||||||||||||||
|
|
|
2015 |
|
|
2014 |
|
|
Change |
|
|
2014 |
|
|
2013 |
|
|
Change |
|
||||||||||||||
|
(dollars in thousands) |
|
Amount |
|
|
Amount |
|
|
$ / # |
|
|
% |
|
|
Amount |
|
|
Amount |
|
|
$ / # |
|
|
% |
|
||||||||
|
Operating expenses |
|
|
|
|
|
|
|
|
|
|
|
|
|
|
|
|
|
|
|
|
|
|
|
|
|
|
|
|
|
|
|
|
|
Research and development |
|
$ |
31,600 |
|
|
$ |
25,781 |
|
|
$ |
5,819 |
|
|
|
22.6 |
% |
|
$ |
25,781 |
|
|
$ |
19,609 |
|
|
$ |
6,172 |
|
|
|
31.5 |
% |
|
Percentage of revenue |
|
|
26.5 |
% |
|
|
26.6 |
% |
|
|
|
|
|
|
|
|
|
|
26.6 |
% |
|
|
27.6 |
% |
|
|
|
|
|
|
|
|
|
Sales and marketing |
|
|
52,400 |
|
|
|
45,003 |
|
|
|
7,397 |
|
|
|
16.4 |
% |
|
|
45,003 |
|
|
|
30,538 |
|
|
|
14,465 |
|
|
|
47.4 |
% |
|
Percentage of revenue |
|
|
44.0 |
% |
|
|
46.4 |
% |
|
|
|
|
|
|
|
|
|
|
46.4 |
% |
|
|
42.9 |
% |
|
|
|
|
|
|
|
|
|
General and administrative |
|
|
18,725 |
|
|
|
12,052 |
|
|
|
6,673 |
|
|
|
55.4 |
% |
|
|
12,052 |
|
|
|
7,619 |
|
|
|
4,433 |
|
|
|
58.2 |
% |
|
Percentage of revenue |
|
|
15.7 |
% |
|
|
12.4 |
% |
|
|
|
|
|
|
|
|
|
|
12.4 |
% |
|
|
10.7 |
% |
|
|
|
|
|
|
|
|
|
Total operating expenses |
|
$ |
102,725 |
|
|
$ |
82,836 |
|
|
$ |
19,889 |
|
|
|
24.0 |
% |
|
$ |
82,836 |
|
|
$ |
57,766 |
|
|
$ |
25,070 |
|
|
|
43.4 |
% |
|
Percentage of revenue |
|
|
86.2 |
% |
|
|
85.4 |
% |
|
|
|
|
|
|
|
|
|
|
85.4 |
% |
|
|
81.2 |
% |
|
|
|
|
|
|
|
|
|
Headcount |
|
|
|
|
|
|
|
|
|
|
|
|
|
|
|
|
|
|
|
|
|
|
|
|
|
|
|
|
|
|
|
|
|
Research and development |
|
|
130 |
|
|
|
97 |
|
|
|
33 |
|
|
|
34.0 |
% |
|
|
97 |
|
|
|
89 |
|
|
|
8 |
|
|
|
9.0 |
% |
|
Sales and marketing |
|
|
153 |
|
|
|
137 |
|
|
|
16 |
|
|
|
11.7 |
% |
|
|
137 |
|
|
|
103 |
|
|
|
34 |
|
|
|
33.0 |
% |
|
General and administrative |
|
|
44 |
|
|
|
37 |
|
|
|
7 |
|
|
|
18.9 |
% |
|
|
37 |
|
|
|
28 |
|
|
|
9 |
|
|
|
32.1 |
% |
|
Information technology |
|
|
16 |
|
|
|
13 |
|
|
|
3 |
|
|
|
23.1 |
% |
|
|
13 |
|
|
|
12 |
|
|
|
1 |
|
|
|
8.3 |
% |
|
Total |
|
|
343 |
|
|
|
284 |
|
|
|
59 |
|
|
|
20.8 |
% |
|
|
284 |
|
|
|
232 |
|
|
|
52 |
|
|
|
22.4 |
% |
Research and development
Research and development expenses consist of costs for our research and development personnel, including salaries, benefits, bonuses and stock-based compensation, the cost of certain third-party contractors, including off-shore development, travel expense and allocated overhead. Research and development costs are expensed as they are incurred.
We intend to continue to develop additional products and functionality for our existing solutions as well as develop new solutions for the healthcare market and expect research and development costs to continue to increase in absolute dollars, although they may fluctuate as a percentage of revenue.
Comparison of years ended December 31, 2015 and 2014
Research and development expenses increased by $5.8 million, or 23%, during the year ended December 31, 2015, as compared to the year ended December 31, 2014. The increase was primarily driven by increased payroll and related costs of $5.1 million for the year ended December 31, 2015, as compared to the year ended December 31, 2014. The increase in payroll and related costs was primarily
43
due to a large increase in the number of employees during the year ended December 31, 2015, as compared to the same period in 2014. Included in the increase in payroll and related costs are costs of $1.4 million incurred for the addition of employees added as a result HT Systems acquisition. The timing of the recognition of expenses for new hires may vary within the periods presented and is not indicative of any trend. In addition, hiring costs increased by $173,000, facility costs, which are allocated based on headcount, increased by $545,000. The increases were partially offset by decrease in a consulting expenses of $154,000 for our third-party developers located in Ukraine and Argentina as a result of the timing of our projects related to our product development and release cycle.
Comparison of years ended December 31, 2014 and 2013
Research and development expenses increased by $6.2 million, or 32%, during the year ended December 31, 2014, as compared to the year ended December 31, 2013. The increase was driven by increased payroll and related costs of $4.1 million for the year ended December 31, 2014, as compared to the year-ended December 31, 2013. The increase in payroll and related costs was primarily due to our increase in employees during 2014, as well as the timing effect of when our 2013 headcount additions were hired, as most of the 2013 employee additions came in the second half of the year. The larger employee base also contributed to increase of $446,000 for information technology-related expenses and $645,000 for depreciation expense. Consulting expenses for our third-party developers located in Ukraine and Argentina increased by $823,000. All of these increases are the result of our continued investment in the development of our existing and new solutions and are expected to continue in the future.
Sales and marketing
Sales and marketing expenses consist of costs for our sales and marketing personnel, including salaries, benefits, bonuses, stock-based compensation and sales commissions, costs of marketing and promotional events, corporate communications, online marketing, product marketing and management and other brand-building activities, travel expense and allocated overhead. Sales commissions are generally earned and recorded as expense when the customer order has been received, which may precede recognition of the associated revenue. We expect sales and marketing expenses to increase in absolute dollars as we expand our business both domestically and internationally, although they may fluctuate as a percentage of revenue.
Comparison of years ended December 31, 2015 and 2014
Sales and marketing expenses increased by $7.4 million, or 16%, during the year ended December 31, 2015, as compared to the year ended December 31, 2014. The increase was primarily attributable to an increase in spending on sales related costs of $4.8 million and marketing and business-development related costs of $2.6 million as we continued to invest in building our brand as well as our sales force. The resulting increase in sales-related costs was primarily due to increased payroll and related costs of $3.6 million, which includes commissions due to our increased headcount, increase of $463,000 related to the our sales events, increased consulting costs of $464,000 and increased hiring costs of $101,000. The increase in marketing and business-development related costs were primarily due to increased payroll and related expenses of $1.8 million and increased marketing and promotion expenses of $992,000.
Comparison of years ended December 31, 2014 and 2013
Sales and marketing expenses increased by $14.5 million, or 47%, during the year ended December 31, 2014 as compared to the year ended December 31, 2013. The increase was attributable to an increase in spending on sales related costs of $7.5 million and marketing and business-development related costs of $6.9 million as we continued to invest in building our brand as well as our sales force. The increase in sales-related costs was due to an increase in payroll-related expenses, including commissions, of $5.8 million due to our increased headcount in 2014 and an increase of $237,000 related to company sales events. The increase in employees hired also caused an increase in travel expense of $865,000, information technology costs of $466,000 and depreciation expense of $381,000 primarily due to the increases in leasehold improvements, furniture and fixtures and computer equipment to support our increasing headcount. These increases were partially offset by a decrease in third-party recruiting fees of $474,000. The marketing increases were due primarily to an increase of $4.0 million in payroll related expenses, travel and entertainment of $549,000, hiring and related costs of $451,000 and $274,000 for information technology expenditures increased by, as a result of an increase of 19 marketing employees. We also increased $317,000 related to spending on consulting and outside services and $328,000 of depreciation expense.
General and administrative
General and administrative expenses consist primarily of costs for administrative, finance, legal and human resource personnel, including salaries, benefits, bonuses and stock-based compensation, professional fees associated with legal matters and costs required to comply with the regulatory requirements of the SEC, as well as costs associated with enhancing our internal controls and accounting systems, insurance premiums, other corporate expenses and allocated overhead. General and administrative expenses also
44
include costs associated with business acquisitions, transaction costs associated with offerings of our common stock and the re-valuing of our contingent liability associated with any earn-out we may be required to pay in connection with the Validus acquisition. We measure the liability at each balance sheet date based on revenue earned to date from the acquired Validus product (now our Imprivata Cortext solution) and our projections of revenues from sales of Imprivata Cortext. We expect our general and administrative expenses to remain consistent with the current year presented.
Comparison of years ended December 31, 2015 and 2014
General and administrative expenses increased by $6.7 million, or 55%, during the year ended December 31, 2015, as compared to the year ended December 31, 2014. The increase was driven primarily by increased payroll and related costs of $2.3 million as a result of our increased headcount. Professional fees and consulting services increased $3.0 million, primarily due to $709,000 transaction costs related to our acquisition of HT Systems, $490,000 of costs associated with shelf registration and stock offering of secondary shares of our common stock during the three months ended September 30, 2015, increase of $664,000 in our audit fees primarily related to Sarbanes-Oxley compliance beginning in 2015, and increase of $582,000 related to charges incurred for consultants to implement an ERP project. The remaining increase in professional fees and consulting services increase was due to use of consultants for general purpose during the year. In addition, insurance expense increased by $356,000 as a result of changes in our insurance coverage due to becoming a public company in June 2014 and expenses for corporate events increased $501,000. We recorded a fair value revaluation expense of $197,000 of our contingent liability as compared to a reduction of expense of $376,000 during the year ended December 31, 2014.
Comparison of years ended December 31, 2014 and 2013
General and administrative expenses increased by $4.4 million, or 58%, during the year ended December 31, 2014, as compared to the year ended December 31, 2013. The increase was driven by $2.8 million in headcount and related expenses related as a result of our increased headcount. In addition, we incurred an increase of $430,000 for consulting services, $340,000 for increases in insurance expense as a result of changes in our insurance coverage due to our becoming a public company. These increases were partially offset by the reduction in our contingent consideration liability expense of $501,000, as the result of revised estimates related to the earn-out associated with our Validus acquisition.
Other income (expense)
Other income (expense) primarily consists of foreign exchange gains (losses), interest income and interest expense. Foreign exchange gains (losses) relate to transactions denominated in currencies other than the functional currency. Interest income represents interest received on our cash and cash equivalents. Interest expense is associated with our capital leases and term loans.
|
|
|
Year Ended |
|
|
|
|
|
|
|
|
|
|
Year Ended |
|
|
|
|
|
|
|
|
|
||||||||||
|
|
|
December 31, |
|
|
Period-to-Period |
|
|
December 31, |
|
|
Period-to-Period |
|
||||||||||||||||||||
|
|
|
2015 |
|
|
2014 |
|
|
Change |
|
|
2014 |
|
|
2013 |
|
|
Change |
|
||||||||||||||
|
(dollars in thousands) |
|
Amount |
|
|
Amount |
|
|
$ |
|
|
% |
|
|
Amount |
|
|
Amount |
|
|
$ |
|
|
% |
|
||||||||
|
Foreign currency exchange gain (loss) |
|
$ |
(527 |
) |
|
$ |
(576 |
) |
|
$ |
49 |
|
|
|
(8.5 |
)% |
|
$ |
(576 |
) |
|
$ |
229 |
|
|
$ |
(805 |
) |
|
|
(351.5 |
)% |
|
Percentage of revenue |
|
|
(0.4 |
)% |
|
|
(0.6 |
)% |
|
|
|
|
|
|
|
|
|
|
(0.6 |
)% |
|
|
0.3 |
% |
|
|
|
|
|
|
|
|
|
Interest and other income (expense), net |
|
|
(40 |
) |
|
|
(146 |
) |
|
|
106 |
|
|
|
(72.6 |
)% |
|
|
(146 |
) |
|
|
(120 |
) |
|
|
(26 |
) |
|
|
21.7 |
% |
|
Percentage of revenue |
|
|
0.0 |
% |
|
|
(0.2 |
)% |
|
|
|
|
|
|
|
|
|
|
(0.2 |
)% |
|
|
(0.2 |
)% |
|
|
|
|
|
|
|
|
|
Total other income (expense) |
|
$ |
(567 |
) |
|
$ |
(722 |
) |
|
$ |
155 |
|
|
|
(21.5 |
)% |
|
$ |
(722 |
) |
|
$ |
109 |
|
|
$ |
(831 |
) |
|
|
(762.4 |
)% |
Comparison of years ended December 31, 2015 and 2014
Other expense decreased by $155,000 during the year ended December 31, 2015, as compared to the year ended December 31, 2014 primarily due to a decrease in foreign exchange losses, a reduction in costs related to the disposal of assets and reduced interest expenses related to our capital lease and debt obligations, as well as an increase in our interest income earned.
Comparison of years ended December 31, 2014 and 2013
The increase in other expense for the year ended December 31, 2014 was primarily driven by the strengthening of the U.S. dollar against the Euro and Pound Sterling during the second half of 2014. We have cash and accounts receivable denominated in those currencies as a result of our European operations.
45
|
|
|
Year Ended |
|
|
|
|
|
|
|
|
|
|
Year Ended |
|
|
|
|
|
|
|
|
|
||||||||||
|
|
|
December 31, |
|
|
Period-to-Period |
|
|
December 31, |
|
|
Period-to-Period |
|
||||||||||||||||||||
|
|
|
2015 |
|
|
2014 |
|
|
Change |
|
|
2014 |
|
|
2013 |
|
|
Change |
|
||||||||||||||
|
(dollars in thousands) |
|
Amount |
|
|
Amount |
|
|
$ |
|
|
% |
|
|
Amount |
|
|
Amount |
|
|
$ |
|
|
% |
|
||||||||
|
Income taxes |
|
$ |
838 |
|
|
$ |
169 |
|
|
$ |
669 |
|
|
|
395.9 |
% |
|
|
169 |
|
|
|
108 |
|
|
$ |
61 |
|
|
|
56.5 |
% |
|
Percentage of revenue |
|
|
0.7 |
% |
|
|
0.2 |
% |
|
|
|
|
|
|
|
|
|
|
0.2 |
% |
|
|
0.2 |
% |
|
|
|
|
|
|
|
|
Comparison of years ended December 31, 2015 and 2014
We operate in several tax jurisdictions and are subject to taxes in each country or jurisdiction in which we conduct business. Earnings from our activities outside of the United States are subject to local country income tax and in some circumstances are subject to U.S. income tax. To date, we have incurred cumulative U.S. operating losses and maintain a full valuation allowance on our net deferred tax assets. Therefore, we have not recorded any U.S. tax provision associated with income from operations and our effective tax rate differs from the U.S. statutory rate. Our tax expense recorded primarily relates to $662,000 of deferred tax expense associated with long term deferred tax liabilities related to tax basis in acquired goodwill and a tax expense of $176,000 on earnings of certain foreign subsidiaries and to a lesser extent state income taxes. In addition, tax expense was reduced by $72,000 related to the Validus contingent consideration during the fourth quarter of 2015.
During the three months ended June 30, 2015, we corrected an error by recording a $535,000 out of period adjustment for the cumulative amount of deferred tax expense associated with post-acquisition adjustments made to our Validus contingent consideration. See Note 18 “Income Taxes” for additional details on this adjustment.
Comparison of years ended December 31, 2014 and 2013
Income tax expense increased $61,000 during the year ended December 31, 2014 as compared to the same period in 2013. The increase in income tax expense is due to our increased operations in Europe and income taxes owed in certain states that we sell our products into as a result of our presence in those jurisdictions.
Liquidity and capital resources
Resources
To date, we have financed our operations primarily through the sale of equity securities, including private placements of preferred stock, and net cash proceeds from our IPO, as well as cash from operating activities.
Cash and cash equivalents
As of December 31, 2015, we had $51.7 million of cash and cash equivalents, of which $417,000 was held in our foreign subsidiaries. Our cash is invested in money market funds or in cash deposit accounts, and is held for working capital purposes. We do not enter into investments for trading or speculative purposes.
On June 30, 2014, we completed our IPO, in which we sold 5,750,000 shares of common stock, including 750,000 shares sold pursuant to the underwriters’ option to purchase additional shares, at an offering price of $15.00 per share. We received proceeds from the IPO of $80.2 million, net of underwriting discounts and commissions, but before offering expenses of approximately $3.4 million. As of December 31, 2014, all expenses incurred in connection with the IPO have been paid.
On April 30, 2015, we used approximately $19.0 million in cash to acquire HT Systems, a provider of palm-vein based biometric patient identification systems, in order to enter into the positive patient identification market.
On August 11, 2015, the selling stockholders sold an aggregate of 5.3 million shares of common stock pursuant to the Resale Registration Statement. We did not receive any of the proceeds from the sale of the shares. We incurred $490,000 of costs associated with the offering during the year ended December 31, 2015.
We believe our cash and cash equivalents, $15.0 million revolving credit agreement and cash flows from operations will be sufficient to meet our working capital and capital expenditure requirements for at least 12 months.
46
Our net cash flows from operating, investing and financing activities for the years indicated in the table below were as follows:
|
|
|
Year Ended December 31, |
|
|||||||||
|
(in thousands) |
|
2015 |
|
|
2014 |
|
|
2013 |
|
|||
|
Net cash (used in) provided by operating activities |
|
$ |
(5,970 |
) |
|
$ |
(8,100 |
) |
|
$ |
748 |
|
|
Net cash used in investing activities |
|
|
(23,340 |
) |
|
|
(3,187 |
) |
|
|
(3,316 |
) |
|
Net cash provided by financing activities |
|
|
2,587 |
|
|
|
76,610 |
|
|
|
579 |
|
|
Effect of exchange rates on cash and cash equivalents |
|
|
(89 |
) |
|
|
(83 |
) |
|
|
(137 |
) |
|
Net (decrease) increase in cash and cash equivalents |
|
$ |
(26,812 |
) |
|
$ |
65,240 |
|
|
$ |
(2,126 |
) |
Net cash (used in) provided by operating activities
Cash provided by operating activities consists of significant components of the statement of operations adjusted for changes in various working capital items including accounts receivable, prepaid expenses, accounts payable, and deferred revenue. Cash provided by operating activities is influenced by the investment we make in personnel and infrastructure costs necessary to support the anticipated growth of the business, the increase in the sales of software licenses and renewal of software maintenance contracts as well as the timing of customer payments.
Our cash used in operating activities during the year ended December 31, 2015 was primarily due to a net loss of $23.1 million adjusted for $8.8 million of non-cash expenses that included $3.8 million of depreciation and amortization, $4.1 million in stock-based compensation, deferred income taxes of $662,000, a loss on disposal of fixed assets of $19,000, and an increase of $197,000 due to increase in the fair value of the contingent purchase price liability. Net increase in working capital amounted to $8.3 million attributable to an increase in deferred revenue of $9.7 million, an increase in accounts payable of $4.5 million, increase in accrued expenses of $635,000 and an increase in other liabilities of $267,000. These increases were partially offset by an increase in accounts receivables of $6.0 million and an increase in prepaid expenses and other current assets of $821,000.
Our cash used in operating activities during the year ended December 31, 2014 was primarily due to our net loss of $16.7 million adjusted for $4.5 million of non-cash expenses that included $3.1 million of depreciation and amortization, $1.6 million in stock-based compensation, $99,000 in provision for doubtful accounts, a loss on disposal of fixed assets of $75,000 and an decrease of $376,000 due to the reduction to the fair value of the contingent purchase price liability. Net increases in working capital amounted to $4.2 million attributable an increases in deferred revenue of $8.6 million and accounts payable and accrued liabilities of $1.7 million. These increases were partially offset by an increase of $5.7 million of accounts receivable, an increase in prepaid expenses and other current assets of $593,000 and an increase of $185,000 for other liabilities.
Our cash provided by operating activities during the year ended December 31, 2013 was primarily due to our net loss of $5.5 million adjusted for $2.3 million of non-cash expenses that included $2.4 million of depreciation and amortization, $640,000 in stock-based compensation, $80,000 loss on disposal of fixed assets, and an increase on our provision for doubtful accounts of $61,000, which was offset by $877,000 in change to the value of the contingent purchase price liability. Net increases in working capital amounted to $4.2 million attributable primarily to an increase of $6.8 million of deferred revenue and a $1.9 million increase in accounts payable and accrued expenses offset by, a $1.1 million increase in prepaid expenses and other current assets, a $3.2 million increase in accounts receivable and a $353,000 decrease in deferred rent.
Net cash used in investing activities
Our primary investing activities have consisted of capital expenditures to purchase computer equipment and furniture and fixtures as well as leasehold improvements to our company headquarters necessary to support the expansion of our infrastructure and workforce. As our business grows, we expect our capital expenditures and our investment activity to continue to increase.
During the year ended December 31, 2015, our cash expenditures related to investing activities were the acquisition of HT Systems for $19.0 million, purchase of three patents for an aggregate of $437,000, expenditures for internally developed software of $1.1 million, and purchase of property and equipment for $2.9 million, which was primarily driven by the increase in leasehold improvements and furnishings for our corporate headquarters, as well as increases in computer equipment for our increased headcount.
For the year ended December 31, 2014, cash used in investing activities consisted of purchases of $3.2 million of property and equipment, which was primarily driven by the increase in leasehold improvements, computer equipment and furnishings for our corporate headquarters, as well as increases in computer equipment for our increased headcount.
For the year ended December 31, 2013, cash used in investing activities consisted of purchases of $3.4 million of property and equipment and a decrease of $97,000 attributable to the release of the restriction on a cash account.
47
Net cash provided by financing activities
Our primary financing activities have consisted of proceeds from the exercise of stock options as well as proceeds from and payments on equipment debt obligations entered into to finance equipment leases and purchased software costs.
For the year ended December 31, 2015, cash provided by financing activities primarily consisted of $1.2 million of proceeds from our employee stock purchase plan and $2.0 million of proceeds from the exercise of stock options, partially offset by $620,000 in payments in connection with our debt, capital leases, and royalty obligations.
For the year ended December 31, 2014, cash provided by financing activities primarily consisted of $80.2 million of proceeds from our IPO, net of underwriting discounts and commissions but before offering expenses. In addition, cash provided by financing activities consisted of $476,000 in proceeds from the exercise of stock options, partially offset by $674,000 in payments in connection with our debt, capital leases and royalty obligations, as well as $3.4 million in offering costs associated with the filing of our Annual Report.
For the year ended December 31, 2013, cash provided by financing activities was primarily consisted of $916,000 of proceeds related to the exercise of stock options which was offset by cash used to pay down $317,000 in debt and capital lease obligations.
Requirements
Capital expenditures
We have made capital expenditures primarily for leasehold improvements and furniture and fixtures related to the expansion of our corporate headquarters, as well as information technology equipment to support our increased headcount, product enhancement and development and our overall growth. Our capital expenditures totaled $2.9 million, $3.2 million, and $3.4 million for the years ended December 31, 2015, 2014, and 2013, respectively.
We expect our 2016 capital expenditures to be consistent with previous periods presented, with expenditures primarily related to, equipment to support product development, facility expansions and other general purposes to support our growth.
Contractual obligations and commitments
Our principal commitments consist of obligations under leases for our office space, capital leases and long term debt, and non-cancellable purchase obligations with our contract manufacturers and purchase obligations related to the purchase of computer equipment, furniture and fixtures and services. During 2015, we amended our lease agreement for our corporate headquarters to lease approximately 27,000 of additional square footage. The amendment increased the total square footage leased to approximately 99,000 and extended the term through December 2021. The additional rent expense is approximately $8.8 million over the revised extended term and the landlord has agreed to contribute approximately $735,000 towards leasehold improvements.
|
|
|
Payment due by period |
|
|||||||||||||||||
|
|
|
|
|
|
|
Less than |
|
|
1-2 |
|
|
3-5 |
|
|
More than |
|
||||
|
(in thousands) |
|
Total |
|
|
1 year |
|
|
years |
|
|
years |
|
|
5 years |
|
|||||
|
Operating lease obligations |
|
$ |
16,222 |
|
|
$ |
2,300 |
|
|
$ |
5,365 |
|
|
$ |
5,576 |
|
|
$ |
2,981 |
|
|
Capital leases and long-term debt |
|
|
672 |
|
|
|
453 |
|
|
|
219 |
|
|
|
— |
|
|
|
— |
|
|
Non-cancelable purchase commitments |
|
|
843 |
|
|
|
843 |
|
|
|
— |
|
|
|
— |
|
|
|
— |
|
|
Total |
|
$ |
17,737 |
|
|
$ |
3,596 |
|
|
$ |
5,584 |
|
|
$ |
5,576 |
|
|
$ |
2,981 |
|
Off-balance sheet arrangements
During the periods presented, we did not have any relationships with unconsolidated entities or financial partnerships, such as entities often referred to as structured finance or special purpose entities, which would have been established for the purpose of facilitating off-balance sheet arrangements or other contractually narrow or limited purposes.
We have operations both within the United States and internationally which expose us to market risk. These risks are primarily the result of fluctuation in foreign exchange rates and interest rates, as well as risks relating to changes in the general economic conditions in the countries where we conduct business. We do not use derivative instruments to mitigate the impact of our market risk exposures.
48
Foreign currency exchange risk
We have foreign currency risks related to our cash, accounts receivable, revenue and operating expenses denominated in currencies other than the U.S. dollar.
We maintain foreign cash accounts denominated in the Euro and British Pound Sterling, to fund our foreign operations and collect foreign accounts receivables. We generally invoice our customers in the currencies of the countries in which the customer is located. At December 31, 2015, our foreign accounts receivable balances were primarily denominated in the Euro, British Pound Sterling and the Australian Dollar.
Our customer contracts are generally denominated in the currencies of the countries in which the customer is located which exposes us to risk associated with sales made in foreign currencies. Our historical revenue has been denominated in U.S. dollars, the Euro and British Pound Sterling. The functional currency for our foreign operations is denominated in the local currency and as a result operating expenses related to our foreign locations are impacted by fluctuations in foreign currency exchange rates. Increases and decreases in our foreign denominated revenue due to fluctuations in foreign currency exchange rates are somewhat offset by the currency fluctuations in our operating expenses that are denominated in foreign currencies.
If the foreign currency exchange rates fluctuated by 10% as of December 31, 2015, our foreign currency exchange gain or loss would have fluctuated by $885,000.
Interest rate risk
At December 31, 2015, we had cash and cash equivalents of $51.7 million. We maintain substantially all of our cash equivalents in an institutional money market mutual fund. The fund provides daily liquidity and invests in a portfolio of short-term money market instruments issued by the U.S. government. We do not enter into investments for trading or speculative purposes. Due to the short-term nature of these investments, we believe that we do not have any material exposure to changes in the fair value of our investment portfolio as a result of changes in interest rates.
At December 31, 2015, we had a 2.5 year term loan with a fixed interest rate of 6.5%, associated with the purchase of licenses and associated maintenance with an outstanding balance of $82,000. Changes in interest rates would not have a significant impact on our outstanding borrowing.
49
Imprivata, Inc.
Index to consolidated financial statements
50
REPORT OF INDEPENDENT REGISTERED PUBLIC ACCOUNTING FIRM
To the Board of Directors and Stockholders of Imprivata, Inc.
Lexington, Massachusetts
We have audited the accompanying consolidated balance sheets of Imprivata, Inc. and subsidiaries (the “Company”) as of December 31, 2015 and 2014, and the related consolidated statements of operations, comprehensive loss, stockholders’ equity (deficit), and cash flows for each of the three years in the period ended December 31, 2015. These financial statements are the responsibility of the Company’s management. Our responsibility is to express an opinion on these financial statements based on our audits.
We conducted our audits in accordance with the standards of the Public Company Accounting Oversight Board (United States). Those standards require that we plan and perform the audit to obtain reasonable assurance about whether the financial statements are free of material misstatement. The Company is not required to have, nor were we engaged to perform, an audit of its internal control over financial reporting. Our audits included consideration of internal control over financial reporting as a basis for designing audit procedures that are appropriate in the circumstances, but not for the purpose of expressing an opinion on the effectiveness of the Company’s internal control over financial reporting. Accordingly, we express no such opinion. An audit also includes examining, on a test basis, evidence supporting the amounts and disclosures in the financial statements, assessing the accounting principles used and significant estimates made by management, as well as evaluating the overall financial statement presentation. We believe that our audits provide a reasonable basis for our opinion.
In our opinion, such consolidated financial statements present fairly, in all material respects, the financial position of Imprivata, Inc. and subsidiaries at December 31, 2015 and 2014, and the results of their operations and their cash flows for each of the three years in the period ended December 31, 2015, in conformity with accounting principles generally accepted in the United States of America.
/s/ Deloitte & Touche LLP
Boston, Massachusetts
March 1, 2016
51
|
|
|
As of December 31, |
|
|||||
|
(in thousands, except share amounts) |
|
2015 |
|
|
2014 |
|
||
|
Assets |
|
|
|
|
|
|
|
|
|
Current assets: |
|
|
|
|
|
|
|
|
|
Cash and cash equivalents |
|
$ |
51,712 |
|
|
$ |
78,524 |
|
|
Accounts receivable, net of allowances |
|
|
36,629 |
|
|
|
25,335 |
|
|
Prepaid expenses and other current assets |
|
|
4,431 |
|
|
|
3,516 |
|
|
Total current assets |
|
|
92,772 |
|
|
|
107,375 |
|
|
Property and equipment, net |
|
|
7,901 |
|
|
|
7,640 |
|
|
Goodwill |
|
|
14,380 |
|
|
|
1,560 |
|
|
Intangible assets, net |
|
|
5,681 |
|
|
|
1,499 |
|
|
Other assets |
|
|
23 |
|
|
|
105 |
|
|
Total assets |
|
$ |
120,757 |
|
|
$ |
118,179 |
|
|
Liabilities and stockholders’ equity |
|
|
|
|
|
|
|
|
|
Current liabilities: |
|
|
|
|
|
|
|
|
|
Accounts payable |
|
$ |
6,997 |
|
|
$ |
2,498 |
|
|
Accrued expenses and other current liabilities |
|
|
11,567 |
|
|
|
10,565 |
|
|
Current portion of capital lease obligations and long-term debt |
|
|
442 |
|
|
|
625 |
|
|
Current portion of other long-term liabilities |
|
|
240 |
|
|
|
288 |
|
|
Current portion of deferred revenue |
|
|
43,929 |
|
|
|
33,120 |
|
|
Current portion of contingent purchase price liability |
|
|
818 |
|
|
|
152 |
|
|
Total current liabilities |
|
|
63,993 |
|
|
|
47,248 |
|
|
Deferred revenue, net of current portion |
|
|
5,430 |
|
|
|
4,021 |
|
|
Deferred tax liability |
|
|
662 |
|
|
|
— |
|
|
Capital lease obligations, long-term debt and royalty obligations, net of current portion |
|
|
209 |
|
|
|
619 |
|
|
Other long-term liabilities, net of current portion |
|
|
1,850 |
|
|
|
1,535 |
|
|
Contingent purchase price liability, net of current portion |
|
|
— |
|
|
|
480 |
|
|
Total liabilities |
|
|
72,144 |
|
|
|
53,903 |
|
|
Commitments and contingencies (Note 13) |
|
|
|
|
|
|
|
|
|
Stockholders' equity: |
|
|
|
|
|
|
|
|
|
Undesignated preferred stock, $0.001 par value, 20,000,000 shares authorized; none issued at December 31, 2015 and 2014 |
|
|
— |
|
|
|
— |
|
|
Common stock, $0.001 par value, 250,000,000 shares authorized at December 31, 2015 and 2014; 25,041,643 and 23,742,467 shares issued and outstanding at December 31, 2015 and 2014, respectively |
|
|
25 |
|
|
|
24 |
|
|
Additional paid-in capital |
|
|
179,357 |
|
|
|
171,903 |
|
|
Accumulated other comprehensive loss |
|
|
(151 |
) |
|
|
(100 |
) |
|
Accumulated deficit |
|
|
(130,618 |
) |
|
|
(107,551 |
) |
|
Total stockholders’ equity |
|
|
48,613 |
|
|
|
64,276 |
|
|
Total liabilities and stockholders’ equity |
|
$ |
120,757 |
|
|
$ |
118,179 |
|
The accompanying notes are an integral part of these consolidated financial statements.
52
Consolidated Statements of Operations
|
|
|
Year Ended December 31, |
|
|||||||||
|
(in thousands, except per share data) |
|
2015 |
|
|
2014 |
|
|
2013 |
|
|||
|
Revenue |
|
|
|
|
|
|
|
|
|
|
|
|
|
Product |
|
$ |
64,937 |
|
|
$ |
52,164 |
|
|
$ |
39,124 |
|
|
Maintenance and services |
|
|
54,183 |
|
|
|
44,815 |
|
|
|
31,987 |
|
|
Total revenue |
|
|
119,120 |
|
|
|
96,979 |
|
|
|
71,111 |
|
|
Cost of revenue |
|
|
|
|
|
|
|
|
|
|
|
|
|
Product |
|
|
16,876 |
|
|
|
12,310 |
|
|
|
7,849 |
|
|
Maintenance and services |
|
|
21,181 |
|
|
|
17,678 |
|
|
|
11,020 |
|
|
Total cost of revenue |
|
|
38,057 |
|
|
|
29,988 |
|
|
|
18,869 |
|
|
Gross profit |
|
|
81,063 |
|
|
|
66,991 |
|
|
|
52,242 |
|
|
Operating expenses |
|
|
|
|
|
|
|
|
|
|
|
|
|
Research and development |
|
|
31,600 |
|
|
|
25,781 |
|
|
|
19,609 |
|
|
Sales and marketing |
|
|
52,400 |
|
|
|
45,003 |
|
|
|
30,538 |
|
|
General and administrative |
|
|
18,725 |
|
|
|
12,052 |
|
|
|
7,619 |
|
|
Total operating expenses |
|
|
102,725 |
|
|
|
82,836 |
|
|
|
57,766 |
|
|
Loss from operations |
|
|
(21,662 |
) |
|
|
(15,845 |
) |
|
|
(5,524 |
) |
|
Other income (expense) |
|
|
|
|
|
|
|
|
|
|
|
|
|
Foreign currency exchange (loss) gain |
|
|
(527 |
) |
|
|
(576 |
) |
|
|
229 |
|
|
Interest and other income (expense), net |
|
|
(40 |
) |
|
|
(146 |
) |
|
|
(120 |
) |
|
Loss before income taxes |
|
|
(22,229 |
) |
|
|
(16,567 |
) |
|
|
(5,415 |
) |
|
Income taxes |
|
|
838 |
|
|
|
169 |
|
|
|
108 |
|
|
Net loss |
|
|
(23,067 |
) |
|
|
(16,736 |
) |
|
|
(5,523 |
) |
|
Accretion of redeemable convertible preferred stock |
|
|
— |
|
|
|
(2,442 |
) |
|
|
(4,952 |
) |
|
Net loss attributable to common stockholders |
|
$ |
(23,067 |
) |
|
$ |
(19,178 |
) |
|
$ |
(10,475 |
) |
|
Net loss per share attributable to common stockholders |
|
|
|
|
|
|
|
|
|
|
|
|
|
Basic and diluted |
|
$ |
(0.94 |
) |
|
$ |
(1.37 |
) |
|
$ |
(3.12 |
) |
|
Weighted average common shares outstanding used in computing net loss per share attributable to common stockholders |
|
|
|
|
|
|
|
|
|
|
|
|
|
Basic and diluted |
|
|
24,419 |
|
|
|
13,950 |
|
|
|
3,359 |
|
The accompanying notes are an integral part of these consolidated financial statements.
53
Consolidated statements of comprehensive loss
|
|
|
Year Ended December 31, |
|
|||||||||
|
(in thousands) |
|
2015 |
|
|
2014 |
|
|
2013 |
|
|||
|
Net loss |
|
$ |
(23,067 |
) |
|
$ |
(16,736 |
) |
|
$ |
(5,523 |
) |
|
Other comprehensive loss: |
|
|
|
|
|
|
|
|
|
|
|
|
|
Foreign currency translation adjustments |
|
|
(51 |
) |
|
|
45 |
|
|
|
(103 |
) |
|
Comprehensive loss |
|
$ |
(23,118 |
) |
|
$ |
(16,691 |
) |
|
$ |
(5,626 |
) |
The accompanying notes are an integral part of these consolidated financial statements.
54
Consolidated Statements of Stockholders’ Equity (Deficit)
|
|
|
Common stock |
|
|
|
|
|
|
Accumulated |
|
|
|
|
|
|
|
|
|
||||||
|
|
|
par value |
|
|
Additional |
|
|
other |
|
|
|
|
|
|
|
|
|
|||||||
|
|
|
$0.001 |
|
|
paid-in |
|
|
comprehensive |
|
|
Accumulated |
|
|
|
|
|
||||||||
|
(in thousands) |
|
Shares |
|
|
Amount |
|
|
capital |
|
|
loss |
|
|
deficit |
|
|
Total |
|
||||||
|
Balance as of January 1, 2013 |
|
|
3,120 |
|
|
$ |
3 |
|
|
$ |
— |
|
|
$ |
(42 |
) |
|
$ |
(80,271 |
) |
|
$ |
(80,310 |
) |
|
Accretion of redeemable convertible preferred stock to redemption value |
|
|
|
|
|
|
|
|
|
|
(1,280 |
) |
|
|
|
|
|
|
(3,672 |
) |
|
|
(4,952 |
) |
|
Exercise of common stock options |
|
|
468 |
|
|
|
1 |
|
|
|
640 |
|
|
|
|
|
|
|
— |
|
|
|
641 |
|
|
Stock-based compensation expense |
|
|
|
|
|
|
|
|
|
|
640 |
|
|
|
|
|
|
|
|
|
|
|
640 |
|
|
Net loss |
|
|
|
|
|
|
|
|
|
|
|
|
|
|
|
|
|
|
(5,523 |
) |
|
|
(5,523 |
) |
|
Other comprehensive income (loss) |
|
|
|
|
|
|
|
|
|
|
|
|
|
|
(103 |
) |
|
|
|
|
|
|
(103 |
) |
|
Balance as of December 31, 2013 |
|
|
3,588 |
|
|
|
4 |
|
|
|
— |
|
|
|
(145 |
) |
|
|
(89,466 |
) |
|
|
(89,607 |
) |
|
Accretion of redeemable convertible preferred stock to redemption value |
|
|
|
|
|
|
|
|
|
|
(1,093 |
) |
|
|
|
|
|
|
(1,349 |
) |
|
|
(2,442 |
) |
|
Exercise of common stock options |
|
|
324 |
|
|
|
|
|
|
|
567 |
|
|
|
|
|
|
|
— |
|
|
|
567 |
|
|
Exercise of warrants, net |
|
|
109 |
|
|
|
|
|
|
|
— |
|
|
|
|
|
|
|
|
|
|
|
— |
|
|
Stock-based compensation expense |
|
|
|
|
|
|
|
|
|
|
1,612 |
|
|
|
|
|
|
|
|
|
|
|
1,612 |
|
|
Issuance of common stock in connection with initial public offering, net of issuance costs of $3,425 |
|
|
5,750 |
|
|
|
6 |
|
|
|
76,782 |
|
|
|
|
|
|
|
|
|
|
|
76,788 |
|
|
Conversion of redeemable convertible preferred stock into common stock |
|
|
13,971 |
|
|
|
14 |
|
|
|
94,035 |
|
|
|
|
|
|
|
|
|
|
|
94,049 |
|
|
Net loss |
|
|
|
|
|
|
|
|
|
|
|
|
|
|
|
|
|
|
(16,736 |
) |
|
|
(16,736 |
) |
|
Other comprehensive income (loss) |
|
|
|
|
|
|
|
|
|
|
|
|
|
|
45 |
|
|
|
|
|
|
|
45 |
|
|
Balance as of December 31, 2014 |
|
|
23,742 |
|
|
|
24 |
|
|
|
171,903 |
|
|
|
(100 |
) |
|
|
(107,551 |
) |
|
|
64,276 |
|
|
Exercise of common stock options |
|
|
1,195 |
|
|
|
1 |
|
|
|
2,080 |
|
|
|
|
|
|
|
|
|
|
|
2,081 |
|
|
Stock-based compensation expense |
|
|
|
|
|
|
|
|
|
|
4,155 |
|
|
|
|
|
|
|
|
|
|
|
4,155 |
|
|
Employee stock purchase plan |
|
|
105 |
|
|
|
— |
|
|
|
1,219 |
|
|
|
|
|
|
|
|
|
|
|
1,219 |
|
|
Net loss |
|
|
|
|
|
|
|
|
|
|
|
|
|
|
|
|
|
|
(23,067 |
) |
|
|
(23,067 |
) |
|
Other comprehensive loss |
|
|
|
|
|
|
|
|
|
|
|
|
|
|
(51 |
) |
|
|
|
|
|
|
(51 |
) |
|
Balance as of December 31, 2015 |
|
|
25,042 |
|
|
$ |
25 |
|
|
$ |
179,357 |
|
|
$ |
(151 |
) |
|
$ |
(130,618 |
) |
|
$ |
48,613 |
|
The accompanying notes are an integral part of these consolidated financial statements.
55
Consolidated Statements of Cash Flows
|
|
|
Year Ended December 31, |
|
|||||||||
|
(in thousands) |
|
2015 |
|
|
2014 |
|
|
2013 |
|
|||
|
Cash flows from operating activities: |
|
|
|
|
|
|
|
|
|
|
|
|
|
Net loss |
|
$ |
(23,067 |
) |
|
$ |
(16,736 |
) |
|
$ |
(5,523 |
) |
|
Adjustments to reconcile net loss to net cash used in operating activities: |
|
|
|
|
|
|
|
|
|
|
|
|
|
Depreciation and amortization expense |
|
|
3,761 |
|
|
|
3,075 |
|
|
|
2,397 |
|
|
Provision for doubtful accounts |
|
|
17 |
|
|
|
99 |
|
|
|
61 |
|
|
Stock-based compensation |
|
|
4,155 |
|
|
|
1,612 |
|
|
|
640 |
|
|
Loss on disposal of fixed assets |
|
|
19 |
|
|
|
75 |
|
|
|
80 |
|
|
Change in value of contingent purchase price liability |
|
|
197 |
|
|
|
(376 |
) |
|
|
(877 |
) |
|
Deferred income taxes |
|
|
662 |
|
|
|
— |
|
|
|
— |
|
|
Changes in operating assets and liabilities: |
|
|
|
|
|
|
|
|
|
|
|
|
|
Accounts receivable |
|
|
(6,015 |
) |
|
|
(5,680 |
) |
|
|
(3,248 |
) |
|
Prepaid expenses and other current assets |
|
|
(821 |
) |
|
|
(600 |
) |
|
|
(1,130 |
) |
|
Deferred revenue |
|
|
9,759 |
|
|
|
8,567 |
|
|
|
6,818 |
|
|
Accounts payable |
|
|
4,461 |
|
|
|
(1,010 |
) |
|
|
47 |
|
|
Accrued expenses and other current liabilities |
|
|
635 |
|
|
|
2,689 |
|
|
|
1,836 |
|
|
Other liabilities |
|
|
267 |
|
|
|
185 |
|
|
|
(353 |
) |
|
Net cash (used in) provided by operating activities |
|
|
(5,970 |
) |
|
|
(8,100 |
) |
|
|
748 |
|
|
Cash flows from investing activities: |
|
|
|
|
|
|
|
|
|
|
|
|
|
Purchases of property and equipment |
|
|
(2,866 |
) |
|
|
(3,187 |
) |
|
|
(3,413 |
) |
|
Purchases of intangible assets |
|
|
(1,519 |
) |
|
|
— |
|
|
|
— |
|
|
Acquisition of business |
|
|
(18,955 |
) |
|
|
— |
|
|
|
— |
|
|
Restricted cash |
|
|
— |
|
|
|
— |
|
|
|
97 |
|
|
Net cash used in investing activities |
|
|
(23,340 |
) |
|
|
(3,187 |
) |
|
|
(3,316 |
) |
|
Cash flows from financing activities: |
|
|
|
|
|
|
|
|
|
|
|
|
|
Proceeds from initial public offering, net of underwriting discounts and commissions |
|
|
— |
|
|
|
80,213 |
|
|
|
— |
|
|
Deferred offering costs |
|
|
— |
|
|
|
(3,405 |
) |
|
|
(20 |
) |
|
Payment of contingent liability |
|
|
(11 |
) |
|
|
— |
|
|
|
— |
|
|
Repayments for capital lease obligations, long-term debt and other |
|
|
(620 |
) |
|
|
(674 |
) |
|
|
(317 |
) |
|
Proceeds from employee stock purchase plan |
|
|
1,219 |
|
|
|
— |
|
|
|
— |
|
|
Proceeds from exercise of stock options |
|
|
1,999 |
|
|
|
476 |
|
|
|
916 |
|
|
Net cash provided by financing activities |
|
|
2,587 |
|
|
|
76,610 |
|
|
|
579 |
|
|
Effect of exchange rates on cash and cash equivalents |
|
|
(89 |
) |
|
|
(83 |
) |
|
|
(137 |
) |
|
Net (decrease) increase in cash and cash equivalents |
|
|
(26,812 |
) |
|
|
65,240 |
|
|
|
(2,126 |
) |
|
Cash and cash equivalents, beginning of year |
|
|
78,524 |
|
|
|
13,284 |
|
|
|
15,410 |
|
|
Cash and cash equivalents, end of year |
|
$ |
51,712 |
|
|
$ |
78,524 |
|
|
$ |
13,284 |
|
|
Supplemental cash flow data: |
|
|
|
|
|
|
|
|
|
|
|
|
|
Interest paid in cash |
|
$ |
88 |
|
|
$ |
107 |
|
|
$ |
51 |
|
|
Taxes paid in cash |
|
$ |
34 |
|
|
$ |
106 |
|
|
$ |
156 |
|
|
Supplemental disclosures of non-cash investing and financing activities: |
|
|
|
|
|
|
|
|
|
|
|
|
|
Equipment purchases under capital leases |
|
$ |
29 |
|
|
$ |
714 |
|
|
$ |
114 |
|
|
Property and equipment purchases included in accounts Payable and accrued expenses |
|
$ |
346 |
|
|
$ |
120 |
|
|
$ |
56 |
|
|
Intangible asset purchases included in accrued expenses |
|
$ |
118 |
|
|
$ |
— |
|
|
$ |
— |
|
|
Accretion of preferred stock |
|
$ |
— |
|
|
$ |
2,442 |
|
|
$ |
4,952 |
|
The accompanying notes are an integral part of these consolidated financial statements.
56
Notes to consolidated financial statements
1. Organization and business
(a) Description of business
Imprivata, Inc. (the “Company”) is a leading provider of IT security and identity solutions to the healthcare industry that help providers securely and efficiently access, communicate and transact patient health information. The Company’s security and identity platform provides authentication management, fast access to patient information, secure communications and positive patient identification products to address critical security and compliance challenges faced by healthcare organizations, while improving provider productivity and the patient experience. The Company believes that its solutions save clinicians significant time and effort to focus on patient care, improve both provider and patient satisfaction, and enable compliance with complex privacy and security regulations. The Company’s solutions can be installed on workstations and other application access points throughout an organization and, once deployed, become a critical part of its customer’s security and identity infrastructure.
The Company was incorporated in the State of Delaware in May 2001.
On June 30, 2014, the Company completed its initial public offering (“IPO”) and is listed on the New York Stock Exchange (“NYSE”) under the ticker symbol “IMPR.”
(b) Basis of presentation and principles of consolidation
The accompanying consolidated financial statements have been prepared in accordance with accounting principles generally accepted in the United States of America (“U.S. GAAP”) for financial reporting and as required under the rules and regulations of the United States Securities and Exchange Commission (“SEC”).
The consolidated financial statements include the accounts of the Company and its wholly owned subsidiaries, Imprivata Securities Corporation and Imprivata International, Inc., and its wholly owned subsidiaries Imprivata UK Limited and Imprivata Australia Pty. Ltd., as well as two branch offices. All intercompany balances and transactions have been eliminated in consolidation.
Management believes the Company has sufficient cash and availability under its line of credit to sustain operations through at least the next 12 months.
(c) Use of estimates
The preparation of the Company’s consolidated financial statements in conformity with U.S. GAAP requires management to make estimates and assumptions that affect the reported amounts of assets and liabilities and disclosure of contingent assets and liabilities at the date of the financial statements and the reported amounts of revenue and expenses during the reporting period. Actual results could differ materially from the Company’s estimates. To the extent that there are material differences between these estimates and actual results, the Company’s financial condition or operating results will be affected. The Company bases its estimates on past experience and other assumptions that the Company believes are reasonable under the circumstances, and the Company evaluates these estimates on an ongoing basis. The most significant estimates relate to the timing and amounts of revenue recognized, deferred tax valuation allowances, valuation of contingent consideration, warranty obligations, uncollectible accounts and stock-based compensation.
(d) Foreign currency
The foreign subsidiaries and branches use the local currency as the functional currency. The Company translates the assets and liabilities of its foreign operations into U.S. dollars based on the rates of exchange in effect as of the balance sheet date. Revenues and expenses are translated into U.S. dollars using average exchange rates for each period. The resulting adjustments from the translation process are included in accumulated other comprehensive loss in the accompanying consolidated balance sheets.
Certain transactions of the Company are settled in foreign currency, and are thus translated to U.S. dollars at the rate of exchange in effect at the end of each month. Gains (losses) resulting from the translation are included in foreign exchange gains (losses) in the accompanying consolidated statements of operations.
2. Summary of significant accounting policies
The accompanying consolidated financial statements reflect the application of certain significant accounting policies as described in this note and elsewhere in the footnotes.
57
(a) Cash, cash equivalents and restricted cash
Cash and cash equivalents
The Company considers all highly liquid investments with a remaining maturity of 90 days or less at the date of purchase to be cash and cash equivalents. Cash and cash equivalents consist principally of deposit accounts and money market accounts at December 31, 2015 and 2014.
(b) Reserve accounts
Allowance for doubtful accounts and sales returns
The allowance for doubtful accounts and sales returns is the Company’s best estimate of the amount of probable credit losses and returns in the Company’s existing accounts receivable. The Company determines the allowance for doubtful accounts and sales returns based on analysis of historical bad debts, customer concentrations, customer creditworthiness, credit history, return history and current economic trends. The Company reviews its allowances for doubtful accounts and sales returns quarterly. Past due balances over 90 days and specified other balances are reviewed individually for collectability. All other balances are reviewed on an aggregate basis. Account balances are written off against the allowance after all means of collection have been exhausted and the potential for recovery is considered remote. The Company does not sell its software with a right of return; however, the Company allows returns of hardware products in limited circumstances, primarily related to changes in configuration requirements. Significant judgments and estimates are made and used in connection with establishing allowances for doubtful accounts and sales returns in any accounting period and actual results may differ from these judgments and estimates. No significant differences from estimates have been experienced. The Company records adjustments to the allowance for doubtful accounts to general and administrative expense and adjustments to the allowance for sales returns as a reduction of revenue.
Warranty reserves
The Company maintains an allowance for warranty obligations that may be incurred under its limited warranty, which includes a hardware warranties ranging from one to three years. Factors that affect the Company’s allowance for warranty obligations include the number of installed units currently under warranty, historical and anticipated rates of warranty claims on those units, and the cost per claim to satisfy the Company’s warranty obligation.
Excess and obsolete inventory reserves
The Company establishes inventory reserves when conditions exist that indicate inventory may be in excess of anticipated demand or is obsolete based upon assumptions about future demand for the Company’s products or market conditions. The Company regularly evaluates the ability to realize the value of inventories based on combination of factors which may include forecasted sales or usage, estimated product end of life dates, estimated current and future market value and new product introductions. When recorded, inventory reserves are intended to reduce the carrying value of inventories to their net realizable value. The Company recorded immaterial charges for excess and obsolete inventories during the years ended December 31, 2015, 2014 or 2013.
(c) Property and equipment
Property and equipment are recorded at cost. Depreciation and amortization are computed using the straight-line method over the estimated useful lives of the assets, which are three years. Leasehold improvements are amortized over the lesser of the term of the lease or the useful life of the asset. Repairs and maintenance costs are expensed as incurred, whereas major improvements are capitalized as additions to property and equipment.
(d) Business combinations
The Company allocates the fair value of the purchase consideration of its acquisitions to the tangible assets, liabilities, and intangible assets acquired, including in-process research and development (“IPR&D”), based on their estimated fair values. The excess of the fair value of purchase consideration over the fair values of these identifiable assets and liabilities is recorded as goodwill. IPR&D is initially capitalized at fair value as an intangible asset with an indefinite life and assessed for impairment thereafter. When a project underlying reported IPR&D is completed, the corresponding amount of IPR&D is reclassified as an amortizable purchased intangible asset and is amortized over the asset’s estimated useful life. Acquisition-related expenses are expensed as incurred.
The allocation of the purchase price requires management to make significant estimates in determining the fair values of assets acquired and liabilities assumed, especially with respect to intangible assets. These estimates are based on information obtained from management of the acquired companies and historical experience. These estimates can include, but are not limited to, the cash flows that an asset is expected to generate in the future, and the cost savings expected to be derived from acquiring an asset. These estimates
58
are inherently uncertain and unpredictable, and if different estimates were used, the purchase price for the acquisition could be allocated to the acquired assets and liabilities differently from the allocation that the Company has made.
(e) Goodwill and purchased intangible assets
Goodwill and purchased intangible assets with indefinite lives are not amortized, but tested for impairment on an annual basis in the fourth quarter and more frequently if events or changes in circumstances indicate that the asset may be impaired. The Company’s impairment tests are based on a single operating segment and reporting unit structure.
In order to determine if goodwill is impaired, a test is performed. The test involves a two-step process. The first step involves comparing the fair value of the Company’s reporting unit to its carrying value, including goodwill. If the carrying value of the reporting unit exceeds its fair value, the second step of the test is performed by comparing the carrying value of the goodwill in the reporting unit to its implied fair value. An impairment charge is recognized for the excess of the carrying value of goodwill over its implied fair value. There have been no impairment charges recorded.
In order to determine if indefinite-lived intangible assets are impaired, the Company first performs a qualitative assessment to determine whether it is more likely than not that the asset may be impaired. If the qualitative assessment determines that it is more likely than not that an indefinite-lived intangible asset may be impaired, the quantitative impairment test is performed. The quantitative impairment test for an indefinite-lived intangible asset compares the fair value of the asset with its carrying amount. If the carrying amount of an intangible asset exceeds its fair value, an impairment loss is recognized for the excess. After an impairment loss is recognized, the carrying amount of the intangible asset is adjusted.
Finite-lived intangible assets are carried at cost and amortized on a straight-line basis over their estimated useful lives, which is four to ten years. The Company evaluates finite lived intangible assets for impairment by assessing the recoverability of these assets whenever adverse events or changes in circumstances or business climate indicate that expected undiscounted future cash flows related to such intangible assets may not be sufficient to support the net book value of such assets. An impairment charge is recognized in the period of identification to the extent the carrying amount of an asset exceeds the fair value of such asset.
Significant judgments required in assessing the impairment of goodwill and intangible assets include the identification of reporting units, identifying whether events or changes in circumstances require an impairment assessment, estimating future cash flows, determining appropriate discount and growth rates and other assumptions. Changes in these estimates and assumptions could materially affect the determination of fair value as to whether an impairment exists and, if so, the amount of that impairment.
(f) Long-lived assets
Long-lived assets that are held and used by the Company are reviewed for impairment whenever events or changes in circumstances indicate that the carrying amount of the asset may not be recoverable. When such events occur, the Company compares the carrying amounts of the assets to their undiscounted expected future cash flows. If this comparison indicates that there is impairment, the amount of the impairment is determined as the difference between the carrying value and fair value.
(g) Deferred offering costs
The Company incurred approximately $3.4 million in costs related to its initial public offering. These offering expenses have been recorded as a reduction of the proceeds received on June 30, 2014, the closing of the Company’s IPO. There are no deferred offering costs included in Other assets in the accompanying balance sheet as of December 31, 2015 and 2014.
(h) Revenue recognition
The Company derives its revenue primarily from the licensing of software, devices, maintenance and services. Revenue is recognized when persuasive evidence of an arrangement exists, delivery has occurred, the fee is fixed or determinable, and collection is considered probable. Product revenue is recognized upon shipment, assuming all other revenue recognition criteria have been met. Services are considered delivered as the work is performed and maintenance is considered delivered over the contractual maintenance term. The Company has a limited number of customers who purchase its software on a term basis and recognizes these sales ratably over the term.
Sales of the Company’s software that are sold through resellers are recognized as revenue based on the same criteria as direct sales and upon identification of the end user. For sales through resellers, the reseller assumes the risk of collection from the end user and the Company does not offer a right of return or price protection to any of its resellers.
59
When arrangements contain software and non-software elements, the Company allocates the arrangement consideration to the software and non-software elements. The fair value of the elements is determined utilizing vendor-specific objective evidence of fair value, or VSOE, when available, third party evidence or the best estimate of selling price when VSOE of fair value is not determinable. The Company is currently unable to establish VSOE of fair value or third party evidence for its software elements as a group. Therefore the best estimate of selling price for the software elements is determined by considering various factors including but not limited to the Company’s standard software maintenance rates, the historical selling price of these deliverables in similar transactions, and its standard pricing practices along with geographies and customer class. After determining fair value for each deliverable, the arrangement consideration is allocated between the software elements, as a group, and the non-software elements using the relative selling price method. The non-software elements are then recognized upon delivery and when all other revenue recognition criteria are met.
For software arrangements or elements that contain multiple deliverables where VSOE of fair value exists for all undelivered elements such as maintenance and services, the Company recognizes revenue for the delivered elements using the residual method. VSOE of fair value is determined based upon the price charged when the same element is sold separately. VSOE of fair value of maintenance on user based licenses is based on the price customers are charged when they purchase maintenance separately from other products. Separate sales of maintenance occur when customers make the decision to renew their contracts in years subsequent to the initial maintenance term. The Company analyzes its separate sales based on the “bell-shaped” curve method to ensure that the separate sales are sufficiently concentrated around a specific point and within a narrow enough range to enable a reasonable estimate of fair value. VSOE of fair value of maintenance on enterprise licenses is based on separately stated renewal rates in the arrangement that are substantive.
For software arrangements containing multiple deliverables where VSOE of fair value does not exist for all undelivered elements, the Company defers revenue for the delivered and undelivered elements until VSOE of fair value is established for the entire undelivered element or all of the elements have been delivered, unless the only undelivered element is delivered over time (e.g., maintenance) where it would record revenue ratably over the delivery period. The Company recognizes maintenance ratably over the term of the maintenance contract, generally 12 months. The Company recognizes revenue allocated to professional service elements, such as installation and training, as the services are performed based on VSOE of fair value for each service performed.
(i) Deferred cost of goods sold
Deferred costs of goods sold consist primarily of costs associated with physical appliances and devices that were shipped during the period for which the revenue recognition criteria have not yet been met. Deferred cost of goods sold were $37,000 and $78,000 for the years ended December 31, 2015 and 2014, respectively. The costs will be amortized to expense in conjunction with the recognition of the related deferred revenue. These costs are included in prepaid expenses and other current assets on the accompanying balance sheet.
(j) Research and development and software development costs
Research and development expenses consist primarily of salary and related expenses for the Company’s research and development staff, including benefits, bonuses and stock-based compensation; the cost of certain third-party contractor costs; and allocated overhead. Expenditures for research and development are expensed as incurred.
Costs associated with the development of computer software for external sale are expensed prior to the establishment of technological feasibility of the software and capitalized thereafter until commercial release of the software. The Company has not historically incurred significant development costs after the establishment of technological feasibility, and as a result, no software development costs have been capitalized to date for external use software.
Costs incurred during the application development stage of internal-use software projects, such as those used in the Company’s product offerings, are capitalized in accordance with the accounting guidance for costs of computer software developed for internal use. Capitalized costs include external consulting fees and payroll and payroll-related costs for employees in the Company’s research and development groups who are directly associated with, and who devote time to, the Company’s internal-use software projects during the application development stage. Capitalization begins when the planning stage is complete and the Company commits resources to software development. Capitalization ceases when the software has been developed, tested and is ready for its intended use. Amortization of the asset commences when the software is placed into service. The Company assesses the useful life of internal-use software once the development is complete and amortizes the completed costs on a straight line basis. Costs incurred during the planning, training and post-implementation stages of the software development life-cycle are expensed as incurred. Costs related to upgrades and enhancements of existing internal-use software that increase the functionality of the software are also capitalized. At December 31, 2015, the Company had $1.2 million in capitalized software development costs related to the internal-use software currently being developed. The capitalized software development costs have been recorded in intangible assets.
60
(k) Shipping and handling costs
Shipping and handling costs charged to customers are included in revenue and the associated expense is recorded in cost of products sold in the statements of operations for all periods presented.
(l) Advertising costs
Advertising costs are included in sales and marketing expense and are expensed as incurred. Advertising expenses were $317,000, $194,000, and $170,000 for the years ended December 31, 2015, 2014, and 2013, respectively.
(m) Income taxes
The Company uses the asset and liability method for accounting for income taxes. Under this method, deferred tax assets and liabilities are recorded based on differences between the financial reporting and tax bases of assets and liabilities and for loss and credit carryforwards. The Company measures deferred tax asset and liabilities using the enacted tax rates and laws that will be in effect when the Company expects the differences to reverse. The Company records a valuation allowance to reduce its deferred tax assets to the amount that is more likely than not to be realized. The Company reviews its deferred tax assets for recoverability with consideration for such factors as historical losses, projected future taxable income, prudent and feasible tax planning strategies and the expected timing of the reversals of existing temporary differences. The Company maintains a full valuation allowance against its U.S. net deferred tax assets as a result of the uncertainty regarding the realization of these assets in the future.
The Company accounts for uncertain tax positions recognized in the consolidated financial statements by prescribing a more-likely-than-not threshold for financial statement recognition and measurement. Interest and penalties associated with such uncertain tax positions are classified as a component of income tax expense. The Company did not have any material unrecognized tax benefits or accrued interest and penalties at December 31, 2015, 2014, or 2013.
(n) Stock-based compensation
The Company measures compensation cost for equity awards at their fair value. The measurement date for stock awards granted to employees is generally the date of grant. The measurement date for nonemployee awards is the date services are completed or the award is earned. Stock-based compensation is recognized on a straight-line basis over the requisite service period, which generally is the vesting period. The estimation of stock awards that will ultimately vest requires judgment and to the extent that actual results or updated estimates differ from current estimates, such amounts will be recorded as a cumulative adjustment in the period during which estimates are revised. Actual results and future changes in estimates may differ substantially from current estimates. See “Note 17. Stock award plans and stock-based compensation” for discussion of the Company’s key assumptions included in determining the fair value of its equity awards at grant date.
(o) Recent accounting guidance
Recently adopted accounting updates
In September 2015, the Financial Accounting Standards Board (“FASB”) issued Accounting Standards Update (“ASU”) No. 2015-16 “Business Combinations (Topic 805): Simplifying the Accounting for Measurement-Period Adjustments.” The ASU eliminates the requirement for an acquirer in a business combination to account for measurement-period adjustments retrospectively. The new guidance requires that the cumulative impact of a measurement-period adjustment (including the impact on prior periods) be recognized in the reporting period in which the adjustment is identified. The guidance is effective for fiscal years beginning after December 15, 2015, and interim periods within those fiscal years. Early adoption is permitted for any interim and annual financial statements that have not yet been made available for issuance. The Company has elected early adoption of this guidance, effective in the third quarter ended September 30, 2015. During the year ended December 31, 2015, the Company recorded a measurement period adjustment which resulted in an immaterial impact. See “Note 3. Business combination” for additional information.
In November 2015, the FASB issued ASU No. 2015-17 “Income Taxes (Topic 740): Balance Sheet Classification of Deferred Taxes.” The ASU requires companies to classify all deferred tax assets and liabilities as noncurrent on the balance sheet instead of separating deferred taxes into current and noncurrent amounts. The guidance is effective for financial statements issued for annual periods beginning after December 15, 2016 and interim periods within those annual periods. The guidance may be adopted on either a prospective or retrospective basis. Early adoption is permitted for any interim and annual financial statements that have not yet been issued. The Company has elected early adoption of this guidance on a prospective basis, effective in the fourth quarter and year ended December 31, 2015. The Company has elected early adoption of this guidance, effective in the fourth quarter and the year ended December 31, 2015. The adoption of this guidance had an immaterial impact on the Company’s balance sheet. See “Note 18. Income taxes” for additional information.
61
Accounting standards or updates not yet effective
In May 2014, the FASB issued ASU No. 2014-09, “Revenue from Contracts with Customers” (Topic 606) (ASU 2014-09). ASU 2014-09 outlines a single comprehensive model for entities to use in accounting for revenue arising from contracts with customers and supersedes most current revenue recognition guidance, including industry-specific guidance. In August 2015, the FASB issued ASU 2015-14, “Revenue from Contracts with Customers—Deferral of the Effective Date,” that defers by one year the effective date of ASU 2014-09, “Revenue from Contracts with Customers.” The guidance is effective for public companies with annual reporting periods beginning after December 15, 2017, including interim periods within that reporting period. Earlier adoption is permitted only as of annual reporting periods beginning after December 15, 2016, including interim reporting periods within that reporting period. Entities have the option of using either a full retrospective or a modified approach to adopt the guidance. This guidance could impact the timing and amounts of revenue recognized. In 2015, the FASB proposed amendments and clarifications to various aspects of the guidance. These amendments were proposed in three FASB exposure drafts. The Company is currently evaluating the effect that implementation of this guidance and any amendments will have on the Company’s consolidated financial statements upon adoption. Any changes to the guidance resulting from the proposed amendments could change the Company’s assessment of the impact that adoption might have on the Company’s consolidated financial statements and could impact the Company’s decision on whether or not to early adopt.
In August 2014, the FASB issued ASU 2014-15, “Presentation of Financial Statements — Going Concern (Subtopic 205-40): Disclosure of Uncertainties about an Entity’s Ability to Continue as a Going Concern.” This guidance requires management to evaluate whether there are conditions and events that raise substantial doubt about an entity’s ability to continue as a going concern. ASU 2014-15 is effective for the annual periods ending after December 15, 2016 and for interim periods in fiscal years beginning after December 15, 2016, the first quarter of 2017. Early adoption is permitted. The Company does not believe the adoption of this guidance will have a material impact on the Company’s consolidated financial statements.
In April 2015, the FASB issued an ASU No. 2015-03, “Interest—Imputation of Interest (Subtopic 835-30): Simplifying the Presentation of Debt Issuance Costs,” requiring debt issuance costs related to a recognized debt liability to be presented in the balance sheet as a direct deduction from the carrying amount of that debt, consistent with debt discounts. The accounting standard update will be effective for the Company for fiscal years beginning after December 15, 2015, and interim periods within those fiscal years on a retrospective basis, with early adoption permitted. As of December 31, 2015, the Company has not early adopted this guidance. The accounting standard update is a change in balance sheet presentation only and is not expected to have a material impact on the Company’s consolidated financial statements.
In April 2015, the FASB issued ASU 2015-05, “Intangibles – Goodwill and Other Internal-Use Software (Subtopic 350-40): Customer’s Accounting for Fees Paid in a Cloud Computing Arrangement.” This ASU provides guidance to customers about whether a cloud computing arrangement includes a software license. If a cloud computing arrangement includes a software license, the customer should account for the software license element of the arrangement consistent with the acquisition of other software licenses. If a cloud computing arrangement does not include a software license, the customer should account for the arrangement as a service contract. The new guidance does not change the accounting for a customer’s accounting for service contracts. ASU 2015-05 is effective for interim and annual reporting periods beginning after December 15, 2015. The Company anticipates that the adoption of this ASU will not have a material impact on its consolidated financial statements.
In July 2015, the FASB issued ASU 2015-11, “Simplifying the Measurement of Inventory,” (Topic 330). ASU 2015-11 requires that inventory within the scope of the guidance be measured at the lower of cost and net realizable value. Inventory measured using last-in, first-out and the retail inventory method are not impacted by the new guidance. This guidance will be effective for public business entities in fiscal years beginning after December 15, 2016, including interim periods within those years. Prospective application is required. Early adoption is permitted as of the beginning of an interim or annual reporting period. The Company measures inventory using first-in, first out method and anticipates adopting this guidance. The Company does not believe the adoption of this guidance will have a material impact on the Company’s consolidated financial statements.
3. Business combination
HT Systems, LLC Acquisition
On April 30, 2015, the Company acquired 100% of the equity of HT Systems, LLC (“HT Systems”), a provider of palm-vein based biometric patient identification systems, to enter into the positive patient identification market for a purchase price of $19.1 million less $120,000 of working capital adjustments, for total cash consideration paid of $19.0 million.
The acquisition of HT Systems and its PatientSecure biometric patient identification technology supports the Company’s long-term vision to be the leading provider of healthcare IT security solutions that increase provider productivity, enable patient engagement, and improve patient safety.
62
The Company may pay up to $5.0 million of potential additional earn-out consideration to the selling equity-holders, which will be determined based upon the achievement of certain sales targets over the two-year period following the transaction, provided, that the selling equity-holders remain employees of the Company when the earn-out consideration becomes payable. The earn-out consideration will be recognized in the Company’s consolidated financial statements as compensation expense as earned. For the year ended December 31, 2015, the Company has not recorded compensation expense associated with the earn-out consideration based on the probability of achieving sales targets.
In addition, the Company will pay up to $1.9 million in retention-based payments to the selling equity-holders payable in cash two years from the closing date of April 30, 2015, contingent upon continued employment as of the payment date. Additional retention-based payments of $341,000, payable in cash, are payable to other employees 8 to 20 months following the date of acquisition, contingent upon their continued employment on the payment dates. The retention-based payments will be recognized in the Company’s consolidated statements of operations as compensation expense over the employment period.
During the year ended December 31, 2015, $709,000 of acquisition-related costs were incurred due to the HT Systems acquisition, which are included in general and administrative expenses in the consolidated statement of operations.
Purchase Price Allocation
Under the acquisition method of accounting, the Company allocated the purchase price to the identifiable assets and liabilities based on their estimated fair value, which was determined by management using the best information available as of the date of the acquisition (Level 3 inputs). The allocation of the HT Systems purchase consideration to the identifiable assets acquired and liabilities assumed was as follows:
|
|
|
|
|
|
|
Useful lives |
|
(dollars in thousands) |
|
Amount |
|
|
(in years) |
|
|
Assets: |
|
|
|
|
|
|
|
Accounts receivable |
|
$ |
5,296 |
|
|
|
|
Prepaid expenses and other current assets |
|
|
34 |
|
|
|
|
Property and equipment |
|
|
59 |
|
|
3 |
|
Intangible assets |
|
|
3,291 |
|
|
4 to 7 |
|
Liabilities assumed: |
|
|
|
|
|
|
|
Accrued expenses |
|
|
(85 |
) |
|
|
|
Deferred revenue |
|
|
(2,460 |
) |
|
|
|
Net assets acquired |
|
|
6,135 |
|
|
|
|
Goodwill |
|
|
12,820 |
|
|
|
|
Total fair value consideration |
|
$ |
18,955 |
|
|
|
Methodologies used in valuing the intangible assets include, but are not limited to the relief from royalty method and multi-period excess earnings method. The excess of the purchase price over the total net identifiable assets has been recorded as goodwill, which includes synergies expected from the expanded service capabilities and the value of the assembled work force in accordance with GAAP. The Company made an election under Internal Revenue Code section 338 to treat the acquisition of the stock as an asset purchase. As a result, the Company will be entitled to corporate level tax deductions associated with the fair market value of net tangible assets, intangible assets, and goodwill.
During the three months ended September 30, 2015, the Company recorded the following measurement period adjustments:
|
|
• |
a $69,000 working capital adjustment to the opening balance sheet for pre-acquisition royalty receivables from a third party reseller not previously recorded in the HT Systems’ opening balance sheet; and |
|
|
• |
an increase in the fair value of deferred revenue acquired by $106,000, due to the refinement of the valuation estimates for deferred revenue as well as a $1.1 million increase to unbilled receivables as a result of reviewing the contractual billing obligations of the acquired customers for goods and services delivered in pre-acquisition periods. |
These measurement period adjustments resulted in a $947,000 decrease in the amount of goodwill in the consolidated balance sheet at September 30, 2015.
63
During the three months ended December 31, 2015, the Company recorded the following measurement period adjustments:
|
|
• |
a $60,000 increase to trade accounts receivable adjustment to the opening balance sheet; and |
|
|
• |
an increase in the fair value of deferred revenue acquired by $407,000, due to the refinement of the valuation estimates for deferred revenue and a $213,000 decrease to unbilled receivables as a result of reviewing the contractual billing obligations of the acquired customers for goods and services delivered in pre-acquisition periods. |
These measurement period adjustments resulted in a $561,000 increase in the amount of goodwill reported in the consolidated balance sheet at December 31, 2015.
The fair value estimates for the assets acquired and liabilities assumed were based upon preliminary calculations and valuations, and the Company’s estimates and assumptions for the acquisition are subject to change as the Company obtains additional information during the measurement periods, up to one year from the acquisition date. As of December 31, 2015, the purchase accounting adjustments are preliminary and not yet finalized as the Company continues to evaluate the HT Systems’ contractual obligations related to deferred revenues and unbilled receivables.
Pro Forma Results of Operations (unaudited)
The consolidated financial statements include the operating results of HT Systems from the date of acquisition. The following unaudited pro forma results of operations have been presented as if the HT Systems acquisition occurred on January 1, 2014:
|
|
|
Year Ended December 31, |
|
|||||
|
(dollars in thousands, except per share data) |
|
2015 |
|
|
2014 |
|
||
|
Pro forma revenue (1) |
|
$ |
120,307 |
|
|
$ |
103,049 |
|
|
Pro forma operating expenses |
|
|
104,220 |
|
|
|
86,563 |
|
|
Pro forma net loss |
|
|
(23,610 |
) |
|
|
(15,230 |
) |
|
Pro forma net loss per share basic and diluted |
|
$ |
(0.97 |
) |
|
$ |
(1.09 |
) |
|
|
(1) |
HT Systems defers all revenue related to a customer engagement until PatientSecure is fully implemented and in production. The revenue patterns can fluctuate between periods due to customers delaying the start of implementation. Consequently, comparisons between the interim periods may not be indicative of future revenue patterns. |
This information is based on historical results of operations, adjusted for the allocations of purchase price and other acquisition accounting adjustments, and is not necessarily indicative of what the Company’s results would have been had it operated the businesses since January 1, 2014.
For the year ended December 31, 2015, the Company’s consolidated revenue includes revenues from HT Systems of $1.2 million. Due to the integration of the combined business, it is impractical to determine the earnings of HT Systems beyond the measure of revenue.
4. Fair value measurements
Fair value is defined as the exchange price that would be received for an asset or paid to transfer a liability (an exit price) in the principal or most advantageous market for the asset or liability in an orderly transaction between market participants on the measurement date.
(a) Fair value hierarchy
The accounting guidance for fair value measurement requires an entity to maximize the use of observable inputs and minimize the use of unobservable inputs when measuring fair value. The standard establishes a fair value hierarchy based on the level of independent, objective evidence surrounding the inputs used to measure fair value. A financial instrument’s categorization within the fair value hierarchy is based upon the lowest level of input that is significant to the fair value measurement. The fair value hierarchy is as follows:
Level 1 applies to assets or liabilities for which there are quoted prices in active markets for identical assets or liabilities.
Level 2 applies to assets or liabilities for which there are inputs other than quoted prices that are observable for the asset or liability, such as quoted prices for similar assets or liabilities in active markets; quoted prices for identical assets or liabilities in markets with insufficient volume or infrequent transactions (less active markets); or model-derived valuations in which significant inputs are observable or can be derived principally from, or corroborated by, observable market data.
64
Level 3 applies to assets or liabilities for which there are unobservable inputs to the valuation methodology that are significant to the measurement of the fair value of the assets or liabilities.
(b) Assets and liabilities measured at fair value on a recurring basis
The Company’s cash equivalents primarily consist of money market funds recorded at cost, which approximates fair value based on quoted prices for assets traded in active markets. The contingent consideration liabilities are recorded at fair value determined using a probability weighted discounted cash flow model primarily based upon future revenue and sales projections.
The following table sets forth the Company’s assets and liabilities which are measured at fair value on a recurring basis by level within the fair value hierarchy:
|
|
|
Fair value measurements at December 31, 2015 |
|
|||||||||||||
|
|
|
|
|
|
|
|
|
|
|
|
|
|
|
Total |
|
|
|
(in thousands) |
|
Level 1 |
|
|
Level 2 |
|
|
Level 3 |
|
|
carrying value |
|
||||
|
Assets |
|
|
|
|
|
|
|
|
|
|
|
|
|
|
|
|
|
Cash equivalents: |
|
|
|
|
|
|
|
|
|
|
|
|
|
|
|
|
|
Money market funds |
|
$ |
2,689 |
|
|
$ |
— |
|
|
$ |
— |
|
|
$ |
2,689 |
|
|
Certificates of deposit |
|
|
— |
|
|
|
97 |
|
|
|
— |
|
|
|
97 |
|
|
Liabilities |
|
|
|
|
|
|
|
|
|
|
|
|
|
|
|
|
|
Contingent consideration |
|
|
— |
|
|
|
— |
|
|
|
818 |
|
|
|
818 |
|
|
|
|
Fair value measurements at December 31, 2014 |
|
|||||||||||||
|
|
|
|
|
|
|
|
|
|
|
|
|
|
|
Total |
|
|
|
(in thousands) |
|
Level 1 |
|
|
Level 2 |
|
|
Level 3 |
|
|
carrying value |
|
||||
|
Assets |
|
|
|
|
|
|
|
|
|
|
|
|
|
|
|
|
|
Cash equivalents: |
|
|
|
|
|
|
|
|
|
|
|
|
|
|
|
|
|
Money market funds |
|
$ |
33,184 |
|
|
$ |
— |
|
|
$ |
— |
|
|
$ |
33,184 |
|
|
Certificates of deposit |
|
|
— |
|
|
|
97 |
|
|
|
— |
|
|
|
97 |
|
|
Liabilities |
|
|
|
|
|
|
|
|
|
|
|
|
|
|
|
|
|
Contingent consideration |
|
|
— |
|
|
|
— |
|
|
|
632 |
|
|
|
632 |
|
(c) Assets and liabilities measured on a non-recurring basis
There were no fair value measurements on a non-recurring basis as of December 31, 2014. In April 2015, the Company completed an acquisition of HT Systems. Under the Acquisition method of accounting, the Company allocated the purchase price to the identifiable assets and liabilities based on their estimated fair values which are level 3 inputs. Refer to “Note 3. Business combination” for additional information.
(d) Level 3 fair value measurements
Contingent consideration
The contingent liability associated with the acquisition of Validus is based on an earn-out capped at $9.8 million to be paid based on revenue generated using the purchased intellectual properties.
The Company re-measures the fair value of the contingent liability at each balance sheet date based on the present value of forecasted revenues through December 31, 2016. The changes in the fair value are primarily due to the difference in actual revenue earned to date versus the initial projections and revisions to the timing and amount of forecasted future revenues.
The resulting forecasted revenues are then discounted using a rate that reflects the uncertainty surrounding the expected outcomes, which the Company believes is appropriate and representative of a market participant assumption.
65
The following table presents a reconciliation of the contingent liability measured at fair value using significant unobservable inputs, and the revaluation amount recorded in the Company’s consolidated statements of operations as a result of the change in fair value:
|
|
|
As of December 31, |
|
|||||
|
(in thousands) |
|
2015 |
|
|
2014 |
|
||
|
Beginning balance as of January 1st |
|
$ |
632 |
|
|
$ |
1,008 |
|
|
Revaluation recognized in general and administrative expenses in the corresponding statements of operations |
|
|
197 |
|
|
|
(376 |
) |
|
Cash payment on the contingent liability |
|
|
(11 |
) |
|
|
- |
|
|
Ending balance |
|
$ |
818 |
|
|
$ |
632 |
|
This following table presents the significant unobservable inputs used in the valuation of the contingent liability:
|
|
|
Year Ended December 31, |
|
|||||
|
|
|
2015 |
|
|
2014 |
|
||
|
Discount Rate |
|
|
17 |
% |
|
|
17 |
% |
(e) Other financial instruments
The carrying amounts reflected in the consolidated balance sheets for cash and cash equivalents (which are comprised primarily of deposit accounts), accounts receivable, prepaid expenses, other current assets, accounts payable, and accrued expenses approximate fair value due to their short-term maturities.
5. Trade accounts receivable, net of allowances
The following table presents the Company’s trade accounts receivable, net:
|
|
|
Year Ended December 31, |
|
|||||
|
(in thousands) |
|
2015 |
|
|
2014 |
|
||
|
Trade accounts receivable(1) |
|
$ |
35,815 |
|
|
$ |
25,615 |
|
|
Unbilled receivables(2) |
|
|
1,171 |
|
|
|
80 |
|
|
Total trade accounts receivable |
|
|
36,986 |
|
|
|
25,695 |
|
|
Allowance for doubtful accounts |
|
|
(158 |
) |
|
|
(161 |
) |
|
Allowance for sales returns |
|
|
(199 |
) |
|
|
(199 |
) |
|
Total allowance |
|
|
(357 |
) |
|
|
(360 |
) |
|
Trade accounts receivable, net |
|
$ |
36,629 |
|
|
$ |
25,335 |
|
|
|
(1) |
Trade accounts receivables represent amounts due from customers when the Company has invoiced for product, maintenance and/or professional services and it has not yet received payment. |
|
|
(2) |
Unbilled receivables represent amounts due from customers when the Company has delivered the goods and services, but the Company has not invoiced the customer due to the contractual terms of the arrangement. |
As of December 31, 2015, the Company has $1.2 million of unbilled receivables. The unbilled receivables are primarily related to contracts acquired in the acquisition of HT Systems.
The allowances for doubtful accounts and credit memos are summarized as follows:
|
|
|
Balance at |
|
|
|
|
|
|
|
|
|
|
|
|
|
|
|
|
|
beginning |
|
|
Increases |
|
|
Write-off / |
|
|
Balance at |
|
||||
|
(in thousands) |
|
of period |
|
|
in reserves |
|
|
adjustments |
|
|
end of period |
|
||||
|
Allowance for doubtful accounts: |
|
|
|
|
|
|
|
|
|
|
|
|
|
|
|
|
|
Year Ended December 31, 2015 |
|
$ |
161 |
|
|
|
17 |
|
|
|
(20 |
) |
|
$ |
158 |
|
|
Year Ended December 31, 2014 |
|
$ |
161 |
|
|
|
— |
|
|
|
— |
|
|
$ |
161 |
|
|
Year Ended December 31, 2013 |
|
$ |
100 |
|
|
|
61 |
|
|
|
— |
|
|
$ |
161 |
|
66
|
|
Balance at |
|
|
|
|
|
|
|
|
|
|
|
|
|
||
|
|
|
beginning |
|
|
Increase |
|
|
Write-off / |
|
|
Balance at |
|
||||
|
(in thousands) |
|
of period |
|
|
in reserves |
|
|
adjustments |
|
|
end of period |
|
||||
|
Allowance for sales returns: |
|
|
|
|
|
|
|
|
|
|
|
|
|
|
|
|
|
Year Ended December 31, 2015 |
|
$ |
199 |
|
|
|
— |
|
|
|
— |
|
|
$ |
199 |
|
|
Year Ended December 31, 2014 |
|
$ |
100 |
|
|
|
99 |
|
|
|
— |
|
|
$ |
199 |
|
|
Year Ended December 31, 2013 |
|
$ |
100 |
|
|
|
53 |
|
|
|
(53 |
) |
|
$ |
100 |
|
6. Inventory
Inventories are stated at the lower of cost or market and consist principally of purchased materials consisting of appliances and devices and included in other current assets. Cost is determined using the first-in, first-out method for devices, with the specific identification method used for appliances.
The components of inventories are as follows:
|
|
|
As of December 31, |
|
|||||
|
(in thousands) |
|
2015 |
|
|
2014 |
|
||
|
Finished goods |
|
$ |
1,051 |
|
|
$ |
268 |
|
|
Raw materials |
|
|
146 |
|
|
|
- |
|
|
Total |
|
$ |
1,197 |
|
|
$ |
268 |
|
When recorded, inventory reserves are intended to reduce the carrying value of inventories to their net realizable value. The Company establishes inventory reserves when conditions exist that indicate inventory may be in excess of anticipated demand or is obsolete based upon assumptions about future demand for the Company’s products or market conditions. The Company regularly evaluates the ability to realize the value of inventories based on a combination of factors including the following: forecasted sales or usage, estimated product end of life dates, estimated current and future market value and new product introductions. The Company recorded immaterial charges for excess and obsolete inventories during the years ended December 31, 2015, 2014 or 2013.
7. Property and equipment
Property and equipment are stated at cost and depreciated using the straight-line method over the estimated useful lives of the related assets or in case of leasehold improvements the shorter of the asset life or lease term. Expenditures for maintenance and repairs are charged to expense as incurred, whereas major improvements are capitalized as additions to property and equipment.
Property and equipment consisted of the following:
|
|
|
Estimated |
|
December 31, |
|
|||||
|
(in thousands) |
|
useful life (in years) |
|
2015 |
|
|
2014 |
|
||
|
Computer equipment and purchased software |
|
3 |
|
$ |
6,191 |
|
|
$ |
4,397 |
|
|
Furniture and fixtures |
|
3 |
|
|
2,971 |
|
|
|
2,440 |
|
|
Leasehold improvements |
|
Shorter of useful life or lease term |
|
|
5,848 |
|
|
|
5,357 |
|
|
Construction in progress |
|
|
|
|
118 |
|
|
|
— |
|
|
Total |
|
|
|
|
15,128 |
|
|
|
12,194 |
|
|
Less: accumulated depreciation |
|
|
|
|
(7,227 |
) |
|
|
(4,554 |
) |
|
Property and equipment, net |
|
|
|
$ |
7,901 |
|
|
$ |
7,640 |
|
Depreciation expense for the years ended December 31, 2015, 2014, and 2013 was $3.0 million, $2.6 million, and $1.9 million, respectively.
8. Goodwill
The Company had $14.4 million and $1.6 million of goodwill at December 31, 2015 and 2014, respectively. Goodwill of $12.8 million is associated with acquisition of HT Systems in April 2015. Goodwill of $1.6 million is associated with acquisition of Validus in 2011.
67
The Company did not record any impairment charges for goodwill during the years ended December 31, 2015, 2014, or 2013.
9. Intangible assets
The following table present details of the Company’s intangible assets which includes purchased intangible assets, intangible assets acquired through business combinations, and internally-developed software costs:
|
|
|
|
|
|
|
Accumulated |
|
|
|
|
|
|
|
(in thousands) |
|
Gross |
|
|
amortization |
|
|
Net |
|
|||
|
As of December 31, 2015 |
|
|
|
|
|
|
|
|
|
|
|
|
|
Purchased intangible assets with finite lives: |
|
|
|
|
|
|
|
|
|
|
|
|
|
Intellectual property |
|
$ |
6,490 |
|
|
$ |
(2,979 |
) |
|
$ |
3,511 |
|
|
Trade name |
|
|
279 |
|
|
|
(53 |
) |
|
|
226 |
|
|
Non-compete agreement |
|
|
437 |
|
|
|
(58 |
) |
|
|
379 |
|
|
Customer contracts and relationships |
|
|
403 |
|
|
|
(38 |
) |
|
|
365 |
|
|
Total purchased intangible assets with finite lives |
|
|
7,609 |
|
|
|
(3,128 |
) |
|
|
4,481 |
|
|
Internally-developed software costs |
|
|
1,200 |
|
|
|
- |
|
|
|
1,200 |
|
|
Total |
|
$ |
8,809 |
|
|
$ |
(3,128 |
) |
|
$ |
5,681 |
|
|
As of December 31, 2014 |
|
|
|
|
|
|
|
|
|
|
|
|
|
Purchased intangible assets with finite lives: |
|
|
|
|
|
|
|
|
|
|
|
|
|
Intellectual property |
|
$ |
3,854 |
|
|
$ |
(2,374 |
) |
|
$ |
1,480 |
|
|
Trade name |
|
|
27 |
|
|
|
(8 |
) |
|
|
19 |
|
|
Total |
|
$ |
3,881 |
|
|
$ |
(2,382 |
) |
|
$ |
1,499 |
|
The following table presents the amortization expense of purchased intangible assets:
|
|
|
Year Ended December 31, |
|
|||||||||
|
(in thousands) |
|
2015 |
|
|
2014 |
|
|
2013 |
|
|||
|
Amortization of purchased intangible assets: |
|
|
|
|
|
|
|
|
|
|
|
|
|
Cost of sales |
|
$ |
424 |
|
|
$ |
223 |
|
|
$ |
242 |
|
|
Operating expenses: |
|
|
|
|
|
|
|
|
|
|
|
|
|
General and administrative |
|
|
322 |
|
|
|
278 |
|
|
|
279 |
|
|
Total |
|
$ |
746 |
|
|
$ |
501 |
|
|
$ |
521 |
|
The estimated future amortization expense of purchased intangible assets with finite lives as of December 31, 2015 is as follows:
|
(in thousands) |
|
Amount |
|
|
|
2016 |
|
$ |
940 |
|
|
2017 |
|
|
940 |
|
|
2018 |
|
|
801 |
|
|
2019 |
|
|
620 |
|
|
2020 |
|
|
518 |
|
|
Thereafter |
|
|
662 |
|
|
Total |
|
$ |
4,481 |
|
The costs associated with the internally developed software project are not included in the tables above, as the project is currently in development. As such, the Company has not determined the useful life of the software, nor have all of the costs associated with the project been incurred. See internally-developed software costs in this footnote below for additional details.
68
On April 30, 2015, the Company acquired the following intangible assets as a result of its acquisition of HT Systems that are included in purchased intangibles above:
|
|
|
|
|
|
Useful lives |
|
(in thousands) |
Amount |
|
(in years) |
||
|
Technology |
$ |
2,199 |
|
7 |
|
|
Trade name |
|
252 |
|
4 |
|
|
Non-compete agreement |
|
437 |
|
5 |
|
|
Customer contracts and relationships |
|
403 |
|
7 |
|
|
|
$ |
3,291 |
|
|
|
During the year ended December 31, 2015, the Company recorded $348,000 of amortization expense for purchased intangible assets. Amortization expense of $304,000 was recorded in the cost of revenues for the year ended December 31, 2015. Amortization expense of $44,000 was recorded in general and administrative expenses for the year ended December 31, 2015.
No impairment charges for finite-lived purchased intangible assets were recorded during the years ended December 31, 2015, 2014 or 2013.
Patents
On June 3, 2015, the Company acquired three patents with an aggregate purchase price of $437,000, which includes $37,000 of legal fees and $36,364 of brokers fees associated with the procurement of the patents. The patents will be amortized on a straight-line basis over 9 years. During the year ended December 31, 2015, the Company recorded $28,000 of amortization expense to general and administrative expenses in the consolidated statement of operations.
Internally-developed software costs
During the year ended December 31, 2015, the Company recorded $1.2 million of costs associated with an internally developed software project for one of its existing product offerings. The costs, which consist of third party developer expenses and payroll and payroll related costs for employees working on internal-use software development, are included in Intangible assets in the consolidated balance sheets. The product is currently being developed and as of December 31, 2015, no amortization has been recorded. For additional information regarding the Company’s accounting policy for capitalizing internally developed software costs, see “Note 2. Summary of significant accounting policies.”
10. Accrued expenses and other current liabilities
The following table presents the details of the Company’s accrued expenses and other current liabilities:
|
|
|
Year Ended December 31, |
|
|||||
|
(in thousands) |
|
2015 |
|
|
2014 |
|
||
|
Accrued payroll and related |
|
$ |
8,212 |
|
|
$ |
7,839 |
|
|
Accrued taxes(1) |
|
|
933 |
|
|
|
1,144 |
|
|
Other accrued expenses |
|
|
2,422 |
|
|
|
1,582 |
|
|
|
|
$ |
11,567 |
|
|
$ |
10,565 |
|
|
|
(1) |
Accrued taxes consist of accruals for foreign and state taxes, sales and use taxes, value added taxes due in foreign jurisdictions and franchise taxes. |
11. Warranty obligations
The Company maintains an allowance for warranty obligations that may be incurred under its limited warranty. Factors that affect the Company’s allowance for warranty obligations include the number of installed units currently under warranty, historical and anticipated rates of warranty claims on those units, and the cost per claim to satisfy the Company’s warranty obligation.
69
The following table presents the details of the Company’s allowance for warranty obligations:
|
|
|
As of December 31, |
|
|||||
|
(in thousands) |
|
2015 |
|
|
2014 |
|
||
|
Beginning balance |
|
$ |
40 |
|
|
$ |
93 |
|
|
Provision for estimated claims |
|
|
44 |
|
|
|
5 |
|
|
Adjustment to estimate |
|
|
— |
|
|
|
(51 |
) |
|
Settlement of claims |
|
|
(44 |
) |
|
|
(7 |
) |
|
Ending balance |
|
$ |
40 |
|
|
$ |
40 |
|
The warranty obligations are included in accrued expenses and other current liabilities in the consolidated balance sheets presented.
12. Debt
(a) Bank credit facility
The Company has a revolving credit facility with a bank pursuant to a Loan and Security Agreement dated January 30, 2009 (the “Revolving Credit Facility”). In February 2014, the Company modified the agreement governing the Revolving Credit Facility that had expired in October 2013 and extended the maturity date to February 2015. In February 2015, the Company amended its Revolving Credit Facility to extend the maturity through April 2015. In April 2015, the Company further amended its revolving credit facility to extend the maturity through April 2016 and increased the borrowing limit from $10.0 million to $15.0 million based primarily on accounts receivable, and is subject to certain financial covenants requiring the Company to maintain minimum levels of liquidity. Outstanding borrowings accrue interest at the Wall Street Journal published prime rate plus 0.75%. Substantially all of the assets of the Company are pledged as collateral.
At December 31, 2015 and 2014, there was no outstanding balance under the revolving credit facility.
(b) Capital leases
The Company is leasing certain equipment under capital leases payable through 2018. The capital lease arrangements bear interest at interest rates ranging between 1.5% and 8.4%. Assets under capital lease obligations totaled $1.5 million as of December 31, 2015 and 2014.
Accumulated depreciation of leased assets was $1.2 million and $721,000 for the years ended December 31, 2015 and 2014, respectively. Depreciation expense associated with capital leases totaled $ 487,000, $443,000, and $258,000 for the years ended December 31, 2015, 2014, and 2013, respectively.
The future principal and interest payments under the capital lease obligations as of December 31, 2015 are as follows:
|
(in thousands) |
|
Amount |
|
|
|
2016 |
|
$ |
369 |
|
|
2017 |
|
|
203 |
|
|
2018 |
|
|
16 |
|
|
Total |
|
|
588 |
|
|
Less: interest |
|
|
(19 |
) |
|
Total principal payments |
|
|
569 |
|
|
Less: current portion |
|
|
(360 |
) |
|
Long-term portion |
|
$ |
209 |
|
|
Interest paid during the period |
|
$ |
30 |
|
70
The Company purchases prepaid licenses and associated maintenance and finances these purchases with term loans. The following table outlines the Company’s term loans associated with the licenses and maintenance:
|
|
|
Term |
|
Interest |
|
|
As of December 31, |
|
||||||
|
(in thousands) |
|
(in years) |
|
Rate |
|
|
2015 |
|
|
2014 |
|
|||
|
Balance - Beginning of Period |
|
|
|
|
|
|
|
$ |
267 |
|
|
$ |
142 |
|
|
Borrowings: |
|
|
|
|
|
|
|
|
|
|
|
|
|
|
|
January 2014 |
|
2.5 |
|
|
6.5% |
|
|
|
|
|
|
|
387 |
|
|
Principal Payments |
|
|
|
|
|
|
|
|
(185 |
) |
|
|
(262 |
) |
|
Balance - End of Period |
|
|
|
|
|
|
|
$ |
82 |
|
|
$ |
267 |
|
|
|
|
|
|
|
|
|
|
|
|
|
|
|
|
|
|
Reported as: |
|
|
|
|
|
|
|
|
|
|
|
|
|
|
|
Current |
|
|
|
|
|
|
|
|
82 |
|
|
|
185 |
|
|
Long-term |
|
|
|
|
|
|
|
|
— |
|
|
|
82 |
|
|
Total |
|
|
|
|
|
|
|
$ |
82 |
|
|
$ |
267 |
|
|
Interest paid during the period |
|
|
|
|
|
|
|
$ |
12 |
|
|
$ |
24 |
|
The future principal and interest payments under the term loan as of December 31, 2015 are as follows:
|
(in thousands) |
|
Amount |
|
|
|
2016 |
|
$ |
84 |
|
|
Total |
|
|
84 |
|
|
Less: interest |
|
|
(2 |
) |
|
Total principal payments |
|
$ |
82 |
|
13. Commitments and contingencies
(a) Operating lease obligations
Lexington, Massachusetts
On March 2, 2012, the Company amended the lease for its corporate headquarters in Lexington, Massachusetts. The amended lease provides for expansion and relocation of the office to another building in the same office complex and was effective in September 2012; the Company began occupying the new office space in November 2012. The termination date specified in the amended lease is seven years after the relocation date. The lease may be terminated early, 60 months after the relocation date, subject to payment of a termination fee. The Company has amended its lease on multiple occasions to increase its leased space within the same office building. In April 2014, the Company amended its lease agreement and increased its leased space from 60,000 square feet to 72,000 square feet.
On January 16, 2015, the Company amended its lease agreement for its corporate headquarters, to lease approximately 21,000 of additional square footage. The amendment increased the total square footage leased to approximately 93,000 and extended the term through December 2021. The additional rent expense is approximately $7.9 million and the landlord has agreed to contribute approximately $735,000 towards leasehold improvements.
On November 9, 2015, the Company further amended its lease agreement for its corporate headquarters to lease 6,338 of additional square footage. This increased the total square footage to 99,355 through December 2021. The additional rent expense is approximately $887,000 beginning in January 2017.
The Company received tenant improvement reimbursements totaling $1.9 million from the landlord for improvements made to its leased premises, of which $1.5 million was received in the fourth quarter of 2012, $198,000 was received in the first quarter of 2013 and $218,000 was received during the second quarter of 2014. The Company amortizes the tenant improvement liability over the remaining term of the lease as a reduction of rent expense. The tenant improvement liability is classified as other current and long-term liabilities in the consolidated balance sheets.
71
In September 2013, the Company entered into a lease for approximately 8,500 square feet of office space for its West Coast engineering office in Santa Cruz, California. The lease terminates in 2018. The lease may be terminated early, 36 months after the relocation date, subject to payment of a termination fee.
San Francisco, California
The Company leases offices for research and development in San Francisco, California on a short-term basis. The lease terminates in March 2016.
Tampa, Florida
On April 30, 2015, the Company assumed a lease for approximately 3,500 square feet with a term expiring in March 2017 as a result of its acquisition of HT Systems. The leased property is located in Tampa, Florida and is between HT Systems and a separate entity owned by the selling equity-holders of HT Systems.
Uxbridge, England
The Company leases approximately 4,200 square feet for its European headquarters, located in Uxbridge, England. The Company conducts sales, marketing, services and support activities for its European operations at this location. The lease terminates in January 2017.
Other operating leases
The Company enters into operating lease agreements primarily for information technology equipment and short-term virtual offices in foreign locations.
The future minimum lease payments under all operating lease agreements at December 31, 2015 are as follows:
|
(in thousands) |
|
Amount |
|
|
|
2016 |
|
$ |
2,300 |
|
|
2017 |
|
|
2,654 |
|
|
2018 |
|
|
2,711 |
|
|
2019 |
|
|
2,695 |
|
|
2020 |
|
|
2,881 |
|
|
Thereafter |
|
|
2,981 |
|
|
Total |
|
$ |
16,222 |
|
Total rent expense for the years ended December 31, 2015, 2014, and 2013 was $2.6 million, $2.1 million, and $1.4 million, respectively.
The Company recorded $322,000, $278,000, and $249,000 of amortization expense related to the tenant improvement liability during the years ended December 31, 2015, 2014, and 2013, respectively. The amortization expense is recorded as a reduction of rent expense.
(b) Litigation
On February 2, 2016, a complaint was filed in the United States District Court for the District of Massachusetts captioned Coyer v. Imprivata, Inc., et al, Case 1:16-cv-10160-LTS (D. Mass.), on behalf of a putative class of Imprivata stockholders, naming as defendants the Company, Mr. Omar Hussain, the Company’s President and Chief Executive Officer, and Mr. Jeffrey Kalowski, the Company’s Chief Financial Officer, as well as certain investors who sold shares of the Company’s common stock in an offering in August 2015. The complaint, brought on behalf of all persons who purchased the Company’s common stock between July 30, 2015 and November 2, 2015, generally alleges that the Company and the named officers made false and/or misleading statements about the demand for the Company’s IT security solutions and sales trends and failed to disclose facts about its business, operations and performance. The complaint brings causes of action for violations of Section 10(b) and Rule 10b-5 of the Securities Exchange Act of 1934 against the Company and the two named officers, as well as for “control person” liability under Section 20(a) of the Securities Exchange Act against the officers and the non-Company defendants. The complaint seeks unspecified monetary damages and unspecified costs and fees.
72
The Company believes that the likelihood of an unfavorable judgment arising from this matter is remote based on the information currently available. The Company does not believe the ultimate resolution of the legal matter referred to above will have a material adverse effect on the Company’s net income, financial condition or liquidity in a future period. However, given the inherent unpredictability of litigation and the fact that this litigation is still in its early stages, the Company is unable to predict with certainty the outcome of this litigation or reasonably estimate a possible loss or range of loss associated with this litigation at this time.
(c) Indemnifications
As permitted under Delaware law, the Company’s Certificate of Incorporation and By Laws provide that the Company indemnify its stockholders, officers, directors, and partners, and each person controlling the stock held for certain events or occurrences that happen by reason of the relationship with or position held at the Company. The Company’s agreements with customers generally require the Company to indemnify the customer against claims in which the Company’s products infringe third-party patents, copyrights, or trademarks, and indemnify against product liability matters.
As of December 31, 2015 and 2014, the Company had not experienced any material losses related to these indemnification obligations and no material claims with respect thereto were outstanding. The Company does not expect significant claims related to these indemnification obligations and, consequently, concluded that the fair value of these obligations is negligible, and no related reserves were established.
14. Redeemable convertible preferred stock and stockholders’ equity (deficit)
(a) Authorized and reserved capital
At December 31, 2015, the Company is authorized to issue up to 270,000,000 shares of stock, consisting of 250,000,000 shares of common stock and 20,000,000 shares of Undesignated Preferred Stock. Of the 250,000,000 authorized shares of common stock, 4,124,140 shares are reserved for issuance upon the exercise of stock options.
(b) Redeemable convertible preferred stock
On June 30, 2014, upon the closing of the IPO, 20,956,426 outstanding shares of redeemable convertible preferred stock were automatically converted into 13,970,934 shares of common stock.
The changes in redeemable convertible preferred stock were as follows:
|
|
|
Series A |
|
|
|
|
|
|
Series B |
|
|
|
|
|
|
Series C |
|
|
|
|
|
|
Total |
|
|
|
|
|
||||
|
(in thousands) |
|
Shares |
|
|
Amount |
|
|
Shares |
|
|
Amount |
|
|
Shares |
|
|
Amount |
|
|
Shares |
|
|
Amount |
|
||||||||
|
Balance at January 1, 2014 |
|
|
11,200 |
|
|
$ |
46,056 |
|
|
|
5,438 |
|
|
$ |
21,500 |
|
|
|
4,318 |
|
|
$ |
24,051 |
|
|
|
20,956 |
|
|
$ |
91,607 |
|
|
Accretion of redeemable convertible preferred stock to redemption value |
|
|
|
|
|
|
1,109 |
|
|
|
|
|
|
|
592 |
|
|
|
|
|
|
|
741 |
|
|
|
|
|
|
|
2,442 |
|
|
Conversion of preferred stock into common stock |
|
|
(11,200 |
) |
|
|
(47,165 |
) |
|
|
(5,438 |
) |
|
|
(22,092 |
) |
|
|
(4,318 |
) |
|
|
(24,792 |
) |
|
|
(20,956 |
) |
|
|
(94,049 |
) |
|
Balance at December 31, 2014 |
|
|
— |
|
|
$ |
— |
|
|
|
— |
|
|
$ |
— |
|
|
|
— |
|
|
$ |
— |
|
|
|
— |
|
|
$ |
— |
|
(c) Stock split
In May 2014, the Company’s Board of Directors approved a 1-for-1.5 reverse stock split of the Company’s common stock. The reverse stock split became effective on May 30, 2014. Upon the effectiveness of the reverse stock split, (i) every 1.5 shares of outstanding common stock was combined into one share of common stock, (ii) the number of shares of common stock into which each outstanding warrant or option to purchase common stock is exercisable was proportionally decreased, (iii) the exercise price of each outstanding warrant or option to purchase common stock was proportionately increased, and (iv) the conversion ratio for each share of preferred stock outstanding was proportionately reduced. Unless otherwise indicated, all of the share numbers, share prices and exercise prices in these financial statements have been adjusted, on a retroactive basis, to reflect this 1-for-1.5 reverse stock split.
73
In May 2014, the Company issued 108,853 shares of common stock upon the net exercise of warrants which were exercisable for 120,000 shares of common stock with the exercise price of $1.10 per share. The remaining 11,147 shares of common stock issuable upon exercise of the warrants were forfeited by the holders of such warrants as part of the net exercise.
15. Accumulated other comprehensive loss
The following table presents the changes in accumulated other comprehensive loss before taxes, as the tax effect is not material to the consolidated financial statements:
|
|
|
Foreign Currency |
|
|
Affected line item in the |
|
|
|
|
Translation |
|
|
statement where net |
|
|
(in thousands) |
|
Adjustments |
|
|
income is presented |
|
|
Balance as of January 1, 2014 |
|
$ |
(145 |
) |
|
|
|
Other comprehensive loss |
|
|
(100 |
) |
|
|
|
Amounts reclassified from accumulated other comprehensive income: |
|
|
|
|
|
|
|
Closure of foreign branch |
|
|
145 |
|
|
Other income (expense) |
|
Net current-period other comprehensive loss |
|
|
45 |
|
|
|
|
Balance as of December 31, 2014 |
|
|
(100 |
) |
|
|
|
Other comprehensive income |
|
|
(17 |
) |
|
|
|
Amounts reclassified from accumulated other comprehensive income: |
|
|
|
|
|
|
|
Closure of foreign branch |
|
|
(34 |
) |
|
Other income (expense) |
|
Net current-period other comprehensive loss |
|
|
(51 |
) |
|
|
|
Balance as of December 31, 2015 |
|
$ |
(151 |
) |
|
|
16. Employee benefit plans
(a) Defined contribution plan
United States
The Company has a 401(k) plan whereby participating employees may defer a portion of their pretax earnings, not to exceed 50% of their total earnings. Employees must reach the age of 21 to be eligible to participate in the 401(k) plan. The Company may, at its discretion, make profit sharing or matching contributions. The Company made a $273,000 matching contribution to the 401(k) plan for the year-ended December 31, 2013 to the eligible employee’s accounts during the first quarter of 2014. Effective January 1, 2014, the Company increased the matching contribution to 50% of the contributions each employee makes to the plan, up to 6% of such employee’s compensation, per payroll period. Employer contributions vest over a four-year period commensurate with the employee’s hire date and years of service. The Company contributed $1.1 million and $954,000 to the eligible employee’s accounts during the year ended December 31, 2015 and 2014 payroll periods, respectively.
International
The Company has elected to make matching contributions of 3% to each eligible employee’s defined contribution pension plan in certain countries in which it operates. The Company contributed $167,000 and $61,000 to the eligible employee’s accounts during the year ended December 31, 2015 and 2014, respectively.
17. Stock award plans and stock based compensation
(a) Equity incentive plan
In May 2014, the Company’s 2014 Stock Option and Incentive Plan (“2014 Plan”), was adopted by the Company’s board of directors and approved by its stockholders and became effective in June 2014. The 2014 Plan replaces the Amended and Restated 2002 Stock Option and Incentive Plan (“2002 Plan”) as the Company’s board of directors has determined not to make additional awards under the 2002 Plan. The 2014 Plan allows the compensation committee to make equity-based incentive awards to the Company’s officers, employees, directors and other key persons (including consultants).
74
Stock options expire no later than 10 years from the date of grant and generally vest over a period of four years. At the discretion of the Board of Directors, certain option grants may be immediately exercisable but subject to a right to repurchase, at cost, pursuant to the vesting schedule of the individual grant.
During the year ended December 31, 2015, the Company granted 1,708,050 options to purchase common stock at a weighted average exercise price of $13.77.
During the year ended December 31, 2015, the Company granted 15,306 restricted stock awards at a fair market value of $14.70. The restricted stock awards vest quarterly over a one-year period.
At December 31, 2015, there were 1,913,020 shares available for future grant under the 2014 Plan.
(b) Employee stock purchase plan
In May 2014, the Company’s board of directors adopted and its stockholders approved the Employee Stock Purchase Plan (“ESPP”). Each employee who is a participant in the ESPP may purchase shares by authorizing payroll deductions of his or her base compensation during an offering period. Unless the participating employee has previously withdrawn from the offering, his or her accumulated payroll deductions will be used to purchase ordinary shares on the last business day of the offering period at a price equal to 85% of the fair market value of the common stock on the first business day or the last business day of the offering period, whichever is lower. All offering periods will be for six months and begin on March 1st and September 1st of each year.
At February 27, 2015, the Company issued 58,793 shares of common stock at a purchase price of $11.64. At August 31, 2015, the Company issued 45,969 shares of common stock at a purchase price of $11.63.
At December 31, 2015, there were 581,064 shares available for future grant under the ESPP.
(c) Early exercise of stock options
The Company issues stock option agreements to Company executives and members of the Board of Directors, which may permit options to be exercised at any time. The Company may also include an early exercise provision for incentive stock option agreements at its discretion. The unvested shares of common stock exercised are subject to the Company’s right to repurchase at the original exercise price upon termination of employment or other relationship.
At December 31, 2015 and 2014, a total of 21,875 and 40,202 shares of unvested stock options exercised were subject to repurchase at an aggregate price of $102,000 and $184,000, respectively. These amounts are recorded as accrued and other current liabilities in the Company’s consolidated balance sheets and will be reclassified to equity as the Company’s repurchase right lapses.
During the year ended December 31, 2015 and 2014, 18,327 and 22,504 stock options associated with the early exercise vested, respectively.
(d) Valuation of share-based compensation
The Company utilizes the Black-Scholes option-pricing model to estimate the fair value of stock options awarded to employees and rights to acquire stock under the ESPP, which requires several key assumptions to be made.
Weighted average assumptions related to stock options used to apply this model were as follows:
|
|
|
Year Ended December 31, |
|
|||||||||
|
|
|
2015 |
|
|
2014 |
|
|
2013 |
|
|||
|
Risk-free interest rate(1) |
|
1.74% - 1.77% |
|
|
|
1.88 |
% |
|
|
1.49 |
% |
|
|
Expected life (years)(2) |
|
|
6.02 |
|
|
|
6.04 |
|
|
|
6.03 |
|
|
Expected dividend yield(3) |
|
|
— |
% |
|
|
— |
% |
|
|
— |
% |
|
Expected volatility of underlying stock(4) |
|
45% - 47% |
|
|
|
54 |
% |
|
|
52 |
% |
|
75
The assumptions used to estimate the fair value of the rights to acquire stock under the ESPP during the initial offering period ending on February 28, 2015 were as follows:
|
Risk-free interest rate(1) |
|
|
0.08 |
% |
|
Expected life (years)(2) |
|
|
0.68 |
|
|
Expected dividend yield(3) |
|
|
— |
% |
|
Expected volatility of underlying stock(4) |
|
|
40 |
% |
The assumptions used to estimate the fair value of the rights to acquire stock under the ESPP during the offering beginning on March 1, 2015 were as follows:
|
Risk-free interest rate(1) |
|
|
0.07 |
% |
|
Expected life (years)(2) |
|
|
0.50 |
|
|
Expected dividend yield(3) |
|
|
— |
% |
|
Expected volatility of underlying stock(4) |
|
|
55 |
% |
|
|
(1) |
Risk-free interest rate—the yield on zero-coupon U.S. Treasury securities with maturities similar to the expected term of the award being valued is used as the risk-free interest rate. |
|
|
(2) |
Expected term—the expected term for stock options granted based on a review of the period that the Company’s stock option awards are expected to be outstanding and is calculated using the simplified method, which represents the average of the contractual term of the options and the weighted-average vesting period of the options. The Company uses the simplified method because it does not have sufficient historical option exercise data to provide a reasonable basis upon which to estimate the expected term. |
|
|
(3) |
Expected dividend yield—the expected dividend yield was not considered in the option pricing formula since the Company has not declared dividends and does not expect to pay dividends in the foreseeable future. |
|
|
(4) |
Expected volatility—the Company is responsible for estimating volatility. The Company has limited trading history as a public company and does not have relevant historical data to develop its volatility assumptions. Therefore, the Company used a weighted average of its volatility and analyzed the volatility of several public peer companies to support the assumptions used in its calculations for the year ended December 31, 2015. |
The amount of stock-based compensation recognized is based on the value of the portion of the awards that are ultimately expected to vest. The Company estimates forfeitures at the time of grant and revises them, if necessary, in subsequent periods if actual forfeitures differ from those estimates. The term “forfeitures” is distinct from “cancellations” or “expirations” and represents only the unvested portion of the surrendered stock-based award. Based on a historical analysis, a forfeiture rate of 9% to 9.5%, 9%, and 13% per year, including executive officer awards, was applied to stock-based awards for the years ended December 31, 2015, 2014, and 2013, respectively.
(e) Summary of share-based compensation expense
The Company uses the straight-line attribution method to recognize expense for stock-based awards such that the expense associated with awards is evenly recognized throughout the period.
Stock-based compensation included in costs and operating expenses related to the awards of stock options and the employee stock purchase plan are as follows:
|
|
|
Year Ended December 31, |
|
|||||||||
|
(in thousands) |
|
2015 |
|
|
2014 |
|
|
2013 |
|
|||
|
Cost of maintenance and professional services |
|
$ |
386 |
|
|
$ |
138 |
|
|
$ |
50 |
|
|
Research and development |
|
|
1,216 |
|
|
|
500 |
|
|
|
263 |
|
|
Sales and marketing |
|
|
1,069 |
|
|
|
532 |
|
|
|
137 |
|
|
General and administrative |
|
|
1,484 |
|
|
|
442 |
|
|
|
190 |
|
|
Total |
|
$ |
4,155 |
|
|
$ |
1,612 |
|
|
$ |
640 |
|
At December 31, 2015, there was $9.2 million of unrecognized compensation expense related to non-vested employee stock awards that is expected to be recognized over a weighted-average amortization period of 2.8 years.
76
Stock option activity is as follows:
|
|
|
|
|
|
|
|
|
|
|
Weighted average |
|
|
|
|
|
|
|
|
|
Number |
|
|
Weighted |
|
|
remaining |
|
|
Aggregate |
|
||||
|
|
|
of |
|
|
average |
|
|
contractual |
|
|
intrinsic |
|
||||
|
(in thousands, except per share data) |
|
shares |
|
|
exercise price |
|
|
life (in years) |
|
|
value |
|
||||
|
Outstanding as of January 1, 2015 |
|
|
3,709 |
|
|
$ |
3.84 |
|
|
|
6.04 |
|
|
$ |
34,206 |
|
|
Granted |
|
|
1,708 |
|
|
|
13.77 |
|
|
|
|
|
|
|
|
|
|
Exercised |
|
|
(1,168 |
) |
|
|
1.71 |
|
|
|
|
|
|
|
|
|
|
Forfeited |
|
|
(122 |
) |
|
|
12.05 |
|
|
|
|
|
|
|
|
|
|
Expired |
|
|
(3 |
) |
|
|
12.97 |
|
|
|
|
|
|
|
|
|
|
Outstanding as of December 31, 2015 |
|
|
4,124 |
|
|
$ |
8.30 |
|
|
|
7.11 |
|
|
$ |
16,907 |
|
|
Exercisable as of December 31, 2015 |
|
|
2,155 |
|
|
$ |
4.62 |
|
|
|
5.72 |
|
|
$ |
15,085 |
|
|
Vested and expected to vest as of December 31, 2015 |
|
|
3,880 |
|
|
$ |
8.03 |
|
|
|
7.01 |
|
|
$ |
16,736 |
|
The following table summarizes information relating to options granted and exercised:
|
|
|
Year Ended December 31, |
|
|||||||||
|
(in thousands, except per share data) |
|
2015 |
|
|
2014 |
|
|
2013 |
|
|||
|
Weighted average fair value per share of options granted |
|
$ |
6.42 |
|
|
$ |
6.75 |
|
|
$ |
3.43 |
|
|
Aggregate intrinsic value of options exercised |
|
$ |
1,707 |
|
|
$ |
2,989 |
|
|
$ |
1,685 |
|
|
Cash proceeds received upon exercise |
|
$ |
1,999 |
|
|
$ |
476 |
|
|
$ |
916 |
|
The aggregate intrinsic value is calculated as the difference, if any, between the fair values of the underlying stock on the date the award is exercised and the per-share price an employee paid to exercise the award.
(g) Restricted common stock
During 2007, the Company issued 45,724 shares of restricted common stock to an officer at a purchase price of $1.10 per share in exchange for a nominal cash payment and a promissory note of $50,000. The note bears no interest and has partial recourse to employee assets for up to 50% of the value of the note. The promissory note is collateralized by the underlying shares of common stock and due within 10 days of sale of the shares or five years from the date of issuance. As of December 31 2013, there were no unvested shares that were purchased pursuant to this promissory note, and no repayments had occurred. During the three months ended March 31, 2014 the note was repaid.
(h) Restricted stock units (“RSU”)
On May 12, 2015, the Company granted 15,306 RSUs to its three independent board members as part of their annual board compensation. The RSUs vest quarterly over one year.
The Company recorded $144,000 in compensation expense during the year ended December 31, 2015 in connection with the grant of the RSUs.
RSU activity is summarized below:
|
|
|
|
|
|
|
Weighted |
|
|
Weighted average |
|
|
|
|
|
||
|
|
|
Number |
|
|
average |
|
|
remaining |
|
|
Aggregate |
|
||||
|
|
|
of |
|
|
grant date |
|
|
contractual |
|
|
intrinsic |
|
||||
|
(in thousands, except per share data) |
|
shares |
|
|
fair value |
|
|
life (in years) |
|
|
value |
|
||||
|
Outstanding as of January 1, 2015 |
|
|
— |
|
|
$ |
— |
|
|
|
— |
|
|
$ |
— |
|
|
Awarded |
|
|
15 |
|
|
|
14.70 |
|
|
|
|
|
|
|
|
|
|
Released |
|
|
(7 |
) |
|
|
14.70 |
|
|
|
|
|
|
|
|
|
|
Outstanding as of December 31, 2015 |
|
|
8 |
|
|
$ |
14.70 |
|
|
|
0.24 |
|
|
$ |
86 |
|
77
The Company operates in several tax jurisdictions and are subject to taxes in each country or jurisdiction in which it conducts business. Earnings from its activities outside of the United States are subject to local country income tax and may be subject to U.S. income tax. To date, the Company has incurred cumulative net losses and maintain a full valuation allowance on its net deferred tax assets. Therefore, the Company has not recorded any U.S. federal tax provisions for its earnings to date and its effective tax rate differs from statutory rates. The Company’s tax expense for earnings primarily relates to foreign income taxes, mainly from its international operations, and to a lesser extent, state income tax provisions.
As of December 31, 2015, the Company’s valuation allowance related to income taxes was approximately $36.0 million. The Company is in a three year cumulative loss position in the United States. As a result, the Company maintains a full valuation allowance to reduce the carrying value of the related deferred tax assets to zero. The Company will continue to maintain a full valuation allowance for such tax assets until sustainable future levels of profitability are evident. The Company does not consider deferred tax liabilities related to indefinite lived assets to be sources of income, which can support the realizability of deferred tax assets, and has provided for tax expense and a corresponding deferred tax liability associated with these naked credits.
Loss before the provision for income taxes consists of the following:
|
|
|
Year Ended December 31, |
|
|||||||||
|
(in thousands) |
|
2015 |
|
|
2014 |
|
|
2013 |
|
|||
|
United States |
|
$ |
(22,759 |
) |
|
$ |
(16,913 |
) |
|
$ |
(5,838 |
) |
|
Foreign |
|
|
530 |
|
|
|
346 |
|
|
|
423 |
|
|
Total |
|
$ |
(22,229 |
) |
|
$ |
(16,567 |
) |
|
$ |
(5,415 |
) |
The provision for income taxes in the accompanying consolidated financial statements consists of the following:
|
|
|
Year Ended December 31, |
|
|||||||||
|
(in thousands) |
|
2015 |
|
|
2014 |
|
|
2013 |
|
|||
|
Current income tax provision: |
|
|
|
|
|
|
|
|
|
|
|
|
|
Federal |
|
$ |
— |
|
|
$ |
— |
|
|
$ |
— |
|
|
State |
|
|
5 |
|
|
|
40 |
|
|
|
— |
|
|
Foreign |
|
|
171 |
|
|
|
129 |
|
|
|
108 |
|
|
Total current income tax provision |
|
$ |
176 |
|
|
$ |
169 |
|
|
$ |
108 |
|
|
Deferred income tax provision: |
|
|
|
|
|
|
|
|
|
|
|
|
|
Federal |
|
$ |
613 |
|
|
$ |
— |
|
|
$ |
— |
|
|
State |
|
|
49 |
|
|
|
— |
|
|
|
— |
|
|
Foreign |
|
|
— |
|
|
|
— |
|
|
|
— |
|
|
Total deferred income tax provision |
|
|
662 |
|
|
|
— |
|
|
|
— |
|
|
Total income tax provision |
|
$ |
838 |
|
|
$ |
169 |
|
|
$ |
108 |
|
A reconciliation of the U.S. statutory tax rate to the Company’s effective tax rate is as follows:
|
|
|
Year Ended December 31, |
|
|||||||||
|
|
|
2015 |
|
|
2014 |
|
|
2013 |
|
|||
|
Tax due at statutory rate |
|
|
34.0 |
% |
|
|
34.0 |
% |
|
|
34.0 |
% |
|
State income taxes, net of federal tax benefit |
|
|
— |
% |
|
|
(0.2 |
%) |
|
|
— |
% |
|
Foreign income taxes |
|
|
0.2 |
% |
|
|
0.3 |
% |
|
|
(0.9 |
%) |
|
Meals & entertainment |
|
|
(0.6 |
%) |
|
|
(0.4 |
%) |
|
|
(1.1 |
%) |
|
Stock compensation |
|
|
(3.5 |
%) |
|
|
(2.1 |
%) |
|
|
(1.9 |
%) |
|
Indefinite lived, deferred tax liability |
|
|
(3.0 |
%) |
|
|
— |
% |
|
|
— |
% |
|
Fines & penalties |
|
|
(0.3 |
%) |
|
|
— |
% |
|
|
(0.3 |
%) |
|
Other |
|
|
(0.1 |
%) |
|
|
— |
% |
|
|
— |
% |
|
Tax credits |
|
|
2.9 |
% |
|
|
7.3 |
% |
|
|
26.8 |
% |
|
Change in valuation allowance |
|
|
(33.4 |
%) |
|
|
(39.9 |
%) |
|
|
(58.5 |
%) |
|
Effective tax rate |
|
|
(3.8 |
%) |
|
|
(1.0 |
%) |
|
|
(1.9 |
%) |
The Company’s effective tax rate differs from the statutory rate each year primarily due to the jurisdictional mix of earnings (profits are earned in foreign jurisdictions and taxed at rates different than the U.S. statutory tax rate), the valuation allowance maintained
78
against the net U.S. deferred tax assets and the impact of permanent differences (primarily related to non-deductible expenses and U.S. research and development credits). Most of the Company’s foreign operations are treated as branches for US tax filings. As a result, their income is included in the parent Company’s US federal income tax return and is also taxed in their local jurisdictions. Included in the foreign income taxes reconciling item in the above table is the rate differential from the U.S. federal statutory rate of 34% for the non-branch subsidiaries as well as foreign income also subject to U.S. tax, less the foreign tax credit, if any, allowed in the current year.
Net deferred tax assets (liabilities) consisted of the following:
|
|
|
As of December 31, |
|
|||||
|
(in thousands) |
|
2015 |
|
|
2014 |
|
||
|
Net operating loss carryforwards |
|
$ |
24,320 |
|
|
$ |
18,235 |
|
|
Tax credit carryforwards |
|
|
5,773 |
|
|
|
5,134 |
|
|
Start-up and research and development capitalized expenditures |
|
|
1,184 |
|
|
|
1,806 |
|
|
Deferred revenue |
|
|
1,391 |
|
|
|
1,325 |
|
|
Other temporary differences |
|
|
3,418 |
|
|
|
1,858 |
|
|
Gross deferred assets |
|
|
36,086 |
|
|
|
28,358 |
|
|
Valuation allowance |
|
|
(36,026 |
) |
|
|
(27,490 |
) |
|
Deferred tax assets, net |
|
|
60 |
|
|
|
868 |
|
|
Depreciation |
|
|
(60 |
) |
|
|
(333 |
) |
|
Other temporary differences |
|
|
(662 |
) |
|
|
(535 |
) |
|
Gross deferred tax liabilities |
|
|
(722 |
) |
|
|
(868 |
) |
|
Net deferred tax asset (liability) |
|
$ |
(662 |
) |
|
$ |
— |
|
In assessing the ability to realize the net deferred tax assets, management considers various factors including taxable income in carryback years, future reversals of existing taxable temporary differences, tax planning strategies and projections of future taxable income, to determine whether it is more likely than not that some portion or all of the net deferred tax assets will not be realized. Based upon the Company’s historical and forecasted future U.S. losses, the Company has determined that the uncertainty regarding the realization of these assets is sufficient to warrant the need for a full valuation allowance against its net deferred tax assets. The net increases in the valuation allowance were approximately $8.6 million and $6.1 million from 2014 to 2015 and 2013 to 2014, respectively, principally related to an increase in the Company’s U.S. net operating loss and tax credit carryforward deferred tax assets against which a full valuation allowance is maintained.
As of December 31, 2015 and 2014, the Company had U.S. federal net operating loss carryforwards of approximately $86.3 million and $54.4 million, respectively and U.S. state net operating loss carryforwards of approximately $73.2 million and $42.1 million, respectively. These net operating loss carryforwards expire at various dates through 2035. As of December 31, 2015 and 2014, the Company had U.S. federal and state tax credit carryforwards available of approximately $5.8 million and $6.0 million, respectively. These tax credit carryforwards expire at various dates through 2035.
Included in the net operating losses, the Company has U.S. federal and state net operating losses of approximately $19.1 million and $3.8 million at December 31, 2015 and 2014, respectively, resulting from the exercise of employee stock options. These net operating losses have been excluded from the above deferred tax table. In accordance with ASC Topic 740, Income Taxes, and ASC Topic 718, “Compensation—Stock Compensation,” recognition of these assets would occur upon utilization of these deferred tax assets to reduce taxes payable and would result in a credit to additional paid-in capital within stockholders’ equity rather than the provision for income taxes.
Under Sections 382 and 383 of the Internal Revenue Code of 1986, as amended, or the Code, if a corporation undergoes an ‘‘ownership change,’’ the corporation’s ability to use its pre-change net operating loss carryforwards and other pre-change tax attributes, such as research tax credits, to offset its post-change income and taxes may be limited. In general, an ‘‘ownership change’’ generally occurs if there is a cumulative change in the Company’s ownership by ‘‘5-percent shareholders’’ that exceeds 50 percentage points over a rolling three-year period. Similar rules may apply under state tax laws. The Company may have experienced an ownership change in the past and may experience ownership changes in the future as a result of this issuance or future transactions in the Company’s stock, some of which may be outside the Company’s control. As a result, if the Company earns net taxable income, the Company’s ability to use the Company’s pre-change net operating loss carryforwards, or other pre-change tax attributes, to offset U.S. federal and state taxable income and taxes may be subject to significant limitations.
As of December 31, 2015, 2014 and 2013, the Company had no recorded liabilities for uncertain tax positions.
79
During the fourth quarter of 2015, the Company adopted ASU 2015-17 “Income Taxes (Topic 740): Balance Sheet Classification of Deferred Taxes” issued by FASB in November 2015. The Company had no current deferred taxes recorded in 2015 and the adoption of this guidance did not have an impact on the Company’s balance sheet. The guidance was adopted on a prospective basis and the Company did not make any adjustments to the prior periods.
Interest and penalty charges, if any, related to uncertain tax positions would be classified as income tax expense in the accompanying consolidated statements of operations. As of December 31, 2015 and 2014, the Company had no accrued interest or penalties related to uncertain tax positions.
The Company is subject to taxation in the United States, Belgium, the United Kingdom, Italy, and Australia. At December 31, 2015, domestic tax years from 2012 through 2015 and foreign tax years from 2007 through 2015 remain open to examination by the taxing authorities. In addition, all of the Company’s U.S. net operating loss carryforwards may be subject to adjustments by taxing authorities in future years in which they are utilized.
Income taxes have not been provided on certain undistributed earnings of foreign subsidiaries of approximately $986,000 because such earnings are considered to be indefinitely reinvested in the business. The undistributed earnings are primarily utilized to fund working capital requirements. The amount of income taxes payable on the earnings that are indefinitely reinvested in foreign operations are immaterial.
Income tax expense related to the fair value of contingent consideration and tax-deductible goodwill
During the preparation of the Company’s financial statements for the three months ended June 30, 2015, the Company identified an error in its accounting for deferred income taxes in prior periods related to the Company’s deferred income tax accounting for its 2011 acquisition of Validus. Specifically, the Company should have, but did not, record deferred income tax expense in connection with post acquisition adjustments made to the contingent consideration recorded in connection with the acquisition. The Company has corrected this error by recording an out of period adjustment for the cumulative amount of deferred tax expense associated with these adjustments totaling $535,000, in its quarter ended June 30, 2015 financial statements.
During the year ended December 31, 2015, the Company recorded U.S. tax expense of $662,000 which is primarily related to the tax expense associated with indefinite lived deferred tax liabilities related to tax basis in acquired goodwill. The Company does not consider deferred tax liabilities related to indefinite lived assets to be sources of income which can support the realizability of deferred tax assets, and has provided for tax expense and a corresponding deferred tax liability associated with these indefinite lived deferred tax liabilities.
Interest and penalty charges, if any, related to uncertain tax positions would be classified as income tax expense in the accompanying consolidated statements of operations. As of December 31, 2015 and 2014, the Company had no accrued interest or penalties related to uncertain tax positions.
19. Computation of net loss per share
The Company calculates basic and diluted net loss per common share by dividing the net loss adjusted for the accretion on the redeemable convertible preferred stock by the weighted average number of common shares outstanding during the period. The Company has excluded all potentially dilutive shares, which include redeemable convertible preferred stock, warrant for common stock, common stock subject to repurchase and outstanding common stock options, from the weighted average number of common shares outstanding as their inclusion in the computation for all periods would be anti-dilutive due to net losses. The Company’s redeemable convertible preferred stock are participating securities as defined under the authoritative guidance, but are excluded from the earnings per share calculation as they do not have an obligation to share or fund in the Company’s net losses.
80
The components of net loss per share are as follows:
|
|
|
Year Ended December 31, |
|
|||||||||
|
(in thousands, except per share data) |
|
2015 |
|
|
2014 |
|
|
2013 |
|
|||
|
Numerator: |
|
|
|
|
|
|
|
|
|
|
|
|
|
Net loss |
|
$ |
(23,067 |
) |
|
$ |
(16,736 |
) |
|
$ |
(5,523 |
) |
|
Accretion of preferred stock |
|
|
— |
|
|
|
(2,442 |
) |
|
|
(4,952 |
) |
|
Net loss attributable to common stockholders |
|
$ |
(23,067 |
) |
|
$ |
(19,178 |
) |
|
$ |
(10,475 |
) |
|
Denominator: |
|
|
|
|
|
|
|
|
|
|
|
|
|
Weighted average common shares outstanding used in computing basic and diluted net loss per common share |
|
|
24,419 |
|
|
|
13,950 |
|
|
|
3,359 |
|
|
Net loss per share, basic and diluted |
|
$ |
(0.94 |
) |
|
$ |
(1.37 |
) |
|
$ |
(3.12 |
) |
The following common stock equivalents were excluded from the computation of diluted net loss per share attributable to common stockholders because they had an antidilutive impact:
|
|
|
Year Ended December 31, |
|
|||||||||
|
(in thousands) |
|
2015 |
|
|
2014 |
|
|
2013 |
|
|||
|
Options to purchase common stock |
|
|
4,124 |
|
|
|
3,709 |
|
|
|
3,777 |
|
|
Common stock subject to repurchase |
|
|
30 |
|
|
|
40 |
|
|
|
63 |
|
|
Warrants |
|
|
— |
|
|
|
— |
|
|
|
120 |
|
|
Convertible preferred stock |
|
|
— |
|
|
|
— |
|
|
|
13,971 |
|
|
Total |
|
|
4,154 |
|
|
|
3,749 |
|
|
|
17,931 |
|
20. Segment and geographic information
Operating segments are defined as components of an enterprise about which separate financial information is available that is evaluated regularly by the chief operating decision maker (“CODM”) in deciding how to allocate resources and in assessing performance.
The Company develops healthcare information technology security solutions and provides professional services, maintenance, and training related to its licensed software delivered on appliances. The Company derives substantially all of its revenue from the sale and support of one group of similar products and services—licensed software on delivered appliances for authentication and access management in the healthcare market. The Company’s CODM is its Chief Executive Officer. To assess performance, the Company’s CODM reviews financial information on a consolidated basis.
The Company views its operations and manages its business as one operating segment—healthcare information technology solutions. The Company derived its revenues from the following geographic areas:
|
|
|
Year ended December 31, |
|
|||||||||
|
(in thousands) |
|
2015 |
|
|
2014 |
|
|
2013 |
|
|||
|
United States |
|
$ |
93,011 |
|
|
$ |
76,159 |
|
|
$ |
56,371 |
|
|
United Kingdom |
|
|
7,872 |
|
|
|
5,241 |
|
|
|
4,093 |
|
|
Rest of world |
|
|
18,237 |
|
|
|
15,579 |
|
|
|
10,647 |
|
|
Total |
|
$ |
119,120 |
|
|
$ |
96,979 |
|
|
$ |
71,111 |
|
Long-lived assets related to the Company’s U.S. and international operations were as follows:
|
|
|
As of December 31, |
|
|||||
|
(in thousands) |
|
2015 |
|
|
2014 |
|
||
|
United States |
|
$ |
7,807 |
|
|
$ |
7,562 |
|
|
United Kingdom |
|
|
94 |
|
|
|
78 |
|
|
Rest of world |
|
|
— |
|
|
|
— |
|
|
Total |
|
$ |
7,901 |
|
|
$ |
7,640 |
|
81
21. Concentration of risk and off-balance sheet risk
Financial instruments that subject the Company to significant concentrations of credit risk consist primarily of cash and cash equivalents and accounts receivable. The Company maintains substantially all of its cash and cash equivalents in institutional money market mutual funds. The fund provides daily liquidity and invests in a portfolio of short-term money market instruments. To manage accounts receivable credit risk, the Company continuously evaluates the creditworthiness of its customers and resellers and maintains allowances for potential credit losses.
No customers or resellers accounted for 10% or more of revenues for the year ended December 31, 2015 and 2014. One reseller accounted for 10% or more of revenues in 2013.
One reseller accounted for more than 10% of accounts receivable at December 31, 2015. No customers or resellers accounted for 10% or more of accounts receivable at December 31, 2014.
The Company does not have any off-balance sheet arrangements and did not have any such arrangements during the year ended December 31, 2015 and 2014.
22. Related Party Transactions
The Company completed its acquisition of HT Systems on April 30, 2015. The Company may pay up to $5.0 million of potential additional earn-out consideration to the selling equity-holders, which will be determined based upon the achievement of certain sales targets over the two-year period following the transaction. The earn-out consideration will be paid to each of the selling equity-holders of HT Systems, based on their equity ownership of HT Systems prior to the acquisition, provided that such selling equity-holder remains an employee of the Company at the time the earn-out becomes payable. Each of the selling equity-holder has become employees of the Company effective upon close of the acquisition. One selling equity-holder is a member of the Company’s executive management team, but is not a director, executive officer or five percent holder of the Company’s equity securities. No payments associated with the earn-out have been made during the year ended December 31, 2015.
The Company leases office space, located in Florida, under an operating lease agreement with a separate entity owned by the selling equity-holders of HT Systems. The lease is at a market rate with a one year term expiring on March 31, 2016. In October 2015, the Company extended the lease agreement for an additional 12 months, through March 31, 2017. The Company made rental payments totaling $40,000 during the year ended December 31, 2015.
23. Quarterly financial information (unaudited)
|
|
|
Three Months Ended |
|
|||||||||||||||
|
|
|
Dec. 31, |
|
|
|
|
Sept. 30, |
|
|
June 30, |
|
|
Mar. 31, |
|
||||
|
(in thousands) |
|
2015 |
|
|
|
|
2015 |
|
|
2015 |
|
|
2015 |
|
||||
|
Revenues |
|
$ |
34,234 |
|
|
|
|
$ |
29,282 |
|
|
$ |
29,968 |
|
|
$ |
25,636 |
|
|
Gross profit |
|
|
23,811 |
|
|
|
|
|
19,382 |
|
|
|
20,584 |
|
|
|
17,286 |
|
|
Net loss |
|
|
(3,728 |
) |
|
|
|
|
(7,214 |
) |
|
|
(5,426 |
) |
|
|
(6,699 |
) |
|
Net loss attributable to common shareholders, basic and diluted (2) |
|
$ |
(0.15 |
) |
|
|
|
$ |
(0.29 |
) |
|
$ |
(0.22 |
) |
|
$ |
(0.28 |
) |
|
|
|
Three Months Ended |
|
|||||||||||||
|
|
|
Dec. 31, |
|
|
Sept. 30, |
|
|
June 30, |
|
|
Mar. 31, |
|
||||
|
(in thousands) |
|
2014 |
|
|
2014 |
|
|
2014 |
|
|
2014 |
|
||||
|
Revenues |
|
$ |
29,028 |
|
|
$ |
25,278 |
|
|
$ |
23,233 |
|
|
$ |
19,440 |
|
|
Gross profit |
|
|
20,908 |
|
|
|
16,638 |
|
|
|
16,358 |
|
|
|
13,087 |
|
|
Net loss |
|
|
(1,663 |
) |
|
|
(4,454 |
) |
|
|
(3,552 |
) |
|
|
(7,067 |
) |
|
Net loss attributable to common shareholders, basic and diluted (1)(2) |
|
$ |
(0.07 |
) |
|
$ |
(0.19 |
) |
|
$ |
(1.08 |
) |
|
$ |
(2.29 |
) |
|
|
(1) |
Net loss attributable to common shareholders includes accretion of preferred stock for all periods presented through the IPO closing date of June 30, 2014. |
|
|
(2) |
Net loss per share for the four quarters of each fiscal year may not sum to the total for the fiscal year due to the different number of shares outstanding during each period. |
82
On February 23, 2016, pursuant to an annual evergreen provision contained in the 2014 Plan, the number of shares reserved for future grants was increased by 2,442,692 shares. The Company increased the reserve for future grants by 1,189,133 and 1,253,559 for the automatic annual increase on January 1, 2015 and January 1, 2016, respectively. As of February 23, 2016, the 2014 Plan had a total of 3,198,226 shares available for future grants.
The number of shares of Common Stock reserved and available for issuance under the 2014 Plan is subject to an automatic annual increase on each January 1, beginning in 2015, by an amount equal to five percent of the number of shares of Common Stock issued and outstanding on the immediately preceding December 31.
On February 23, 2016, pursuant to an annual evergreen provision contained in the ESPP the number of shares reserved for future grants was increased by 488,537 shares. The Company increased the reserve for future grants by 237,826 and 250,711 for the automatic annual increase on January 1, 2015 and January 1, 2016, respectively. As of February 23, 2016, the ESPP had a total of 831,775 shares available for future grants.
The number of shares of Common Stock reserved and available for issuance under the ESPP is subject to an automatic annual increase on each January 1, beginning in 2015, by an amount equal to the lesser of 500,000 shares of Common Stock, one percent of the number of shares of Common Stock issued and outstanding on the immediately preceding December 31 or such lesser number of shares of Common Stock determined by the Administrator (as defined in the ESPP).
83
None.
Evaluation of Disclosure Controls and Procedures
The term “disclosure controls and procedures,” as defined in Rules 13a-15(e) and 15d-15(e) under the Securities Exchange Act of 1934, as amended (the “Exchange Act”), refers to controls and procedures that are designed to ensure that information required to be disclosed by a company in the reports that it files or submits under the Exchange Act is recorded, processed, summarized and reported, within the time periods specified in the SEC’s rules and forms. Disclosure controls and procedures include, without limitation, controls and procedures designed to ensure that such information is accumulated and communicated to a company’s management, including its principal executive and principal financial officers, as appropriate to allow timely decisions regarding required disclosure.
As of December 31, 2015, we have carried out an evaluation under the supervision of, and with the participation of our management, including our Chief Executive Officer and Chief Financial Officer, of the effectiveness of the design and operation of our disclosure controls and procedures as defined in Rules 13a-15(e) and 15d-15(e) of the Exchange Act. Based on our evaluation, our Chief Executive Officer and Chief Financial Officer concluded that our disclosure controls and procedures were effective as of December 31, 2015 and 2014.
Management’s Report on Internal Control over Financial Reporting
Our management is responsible for establishing and maintaining adequate internal control over financial reporting, as such term is defined in Exchange Act Rule 13a-15(f). Because of its inherent limitations, internal control over financial reporting may not prevent or detect misstatements. Our internal control system was designed to provide reasonable assurance to our management and board of directors regarding the preparation and fair presentation of published financial statements.
Our management assessed the effectiveness of our internal control over financial reporting as of December 31, 2015. In making this assessment, we used the criteria set forth by the Committee of Sponsoring Organizations of the Treadway Commission (COSO) in Internal Control - Integrated Framework (2013). Based on our assessment we believe that as of December 31, 2015, our internal control over financial reporting is effective based on those criteria.
Our management, with the participation of our principal executive and principal financial officer, assessed the effectiveness of our internal control over financial reporting as of December 31, 2015. Based on its assessment, management concluded that our internal control over financial reporting was effective as of December 31, 2015 based on those criteria.
Changes in Internal Control over Financial Reporting
There were no changes in our internal control over financial reporting during our most recently completed fiscal quarter that have materially affected, or are reasonably likely to materially affect, our internal control over financial reporting.
During the preparation of our consolidated financial statements for the three months ended June 30, 2015, we identified an error in our accounting for deferred income taxes in prior periods related to our deferred income tax accounting for our 2011 acquisition of Validus. Specifically, we should have, but did not, record deferred income tax expense in connection with post acquisition adjustments made to the contingent consideration recorded in connection with the acquisition. We have corrected this error by recording an out of period adjustment for the cumulative amount of deferred tax expense associated with these adjustments totaling $535,000 in its three months ended June 30, 2015 financial results.
84
Except as set forth below, information required by this item is contained in our 2016 proxy statement and is incorporated herein by reference.
We have adopted a written code of business conduct and ethics that applies to all employees, including our principal executive officer, principal financial officer, principal accounting officer, or persons performing similar functions and have posted it in the Investors—Corporate Governance section of our website which is located at www.imprivata.com. We intend to satisfy any disclosure requirement under Item 5.05 of Form 8-K regarding any amendments to, or waivers from, our code of business conduct and ethics by posting such information on our website which is located at www.imprivata.com.
Information required by this item is contained in our 2016 proxy statement and is incorporated herein by reference.
Information required by this item is contained in our 2016 proxy statement and is incorporated herein by reference.
Information required by this item is contained in our 2016 proxy statement and is incorporated herein by reference.
Information required by this item is contained in our 2016 proxy statement and is incorporated herein by reference.
|
(a) |
1. Financial Statements |
See the “Index to Consolidated Financial Statements” on page 50 of this report.
2. Exhibits
See the “Index to Exhibits” immediately following the signature page of this report.
85
Pursuant to the requirements of Section 13 or 15(d) of the Securities Exchange Act of 1934, the registrant has duly caused this Report on Form 10-K to be signed on its behalf by the undersigned, thereunto duly authorized.
|
By: |
|
/s/ Omar Hussain |
|
|
|
Omar Hussain |
|
|
|
President, Chief Executive Officer and Director |
Pursuant to the requirements of the Securities Exchange Act of 1934, this Report on Form 10-K has been signed below by the following persons on behalf of the registrant and in the capacities and on the dates indicated.
|
Name |
Title |
Date |
|
/s/ Omar Hussain |
President, Chief Executive Officer and Director |
March 1, 2016 |
|
Omar Hussain |
|
|
|
|
|
|
|
/s/ Jeff Kalowski |
Chief Financial Officer |
March 1, 2016 |
|
Jeff Kalowski |
(principal financial and accounting officer) |
|
|
|
|
|
|
/s/ David Barrett |
Director and Lead Director |
March 1, 2016 |
|
David Barrett |
|
|
|
|
|
|
|
/s/ John Blaeser |
Director |
March 1, 2016 |
|
John Blaeser |
|
|
|
|
|
|
|
/s/ John Halamka |
Director |
March 1, 2016 |
|
John Halamka |
|
|
|
|
|
|
|
/s/ Paul Maeder |
Director |
March 1, 2016 |
|
Paul Maeder |
|
|
|
|
|
|
|
|
Director |
March 1, 2016 |
|
Kathleen Walsh |
|
|
|
|
|
|
|
/s/ David Ting |
Director |
March 1, 2016 |
|
David Ting |
|
|
|
|
|
|
|
/s/ Rodger Weismann |
Director |
March 1, 2016 |
|
Rodger Weismann |
|
|
86
|
Exhibit No |
|
Description |
|
|
||
|
3.1 |
|
Amended and Restated Certificate of Incorporation of the Company, effective June 30, 2014 (incorporated by reference to Exhibit 3.2 of the Company’s Amendment No. 1 to Registration Statement on Form S-1, filed on June 11, 2014). |
|
|
||
|
3.2 |
|
Amended and Restated Bylaws of the Company, effective June 30, 2014 (incorporated by reference to Exhibit 3.4 to the Company’s Amendment No. 1 to Registration Statement on Form S-1, filed on June 11, 2014).
|
|
|
||
|
4.1 |
|
Form of Common Stock Certificate of the Company (incorporated by reference to Exhibit 4.1 to the Company’s Amendment No. 1 to Registration Statement on Form S-1, filed on June 11, 2014.
|
|
|
||
|
4.2 |
|
Fourth Amended and Restated Investor Rights Agreement by and between the Registrant and certain of its stockholders dated December 11, 2007 (incorporated by reference to Exhibit 4.4 to the Company’s Registration Statement on Form S-1, filed on March 31, 2014).
|
|
|
||
|
10.1+ |
|
Amended and Restated 2002 Stock Option and Incentive Plan and forms of agreements thereunder (incorporated by reference to Exhibit 10.1 to the Company’s Registration Statement on Form S-1, filed on March 31, 2014).
|
|
|
||
|
10.2+ |
|
2014 Stock Option and Incentive Plan and forms of agreements thereunder (incorporated by reference to Exhibit 10.2 to the Company’s Amendment No. 1 to Registration Statement on Form S-1, filed on June 11, 2014).
|
|
|
||
|
10.3+ |
|
Senior Executive Cash Incentive Bonus Plan (incorporated by reference to Exhibit 10.3 to the Company’s Amendment No. 1 to Registration Statement on Form S-1, filed on June 11, 2014).
|
|
|
||
|
10.4+
|
|
Form of Indemnification Agreement, between the Registrant and its officers (incorporated by reference to Exhibit 10.4 to the Company’s Amendment No. 1 to Registration Statement on Form S-1, filed on June 11, 2014).
|
|
|
||
|
10.5+ |
|
Form of Indemnification Agreement, between the Registrant and its directors (incorporated by reference to Exhibit 10.5 to the Company’s Amendment No. 1 to Registration Statement on Form S-1, filed on June 11, 2014).
|
|
|
||
|
10.6 |
|
Promissory Note by and between the Registrant and Jeffrey Kalowski dated October 19, 2007, as amended and restated on October 19, 2012 (incorporated by reference to Exhibit 10.6 to the Company’s Amendment No. 1 to Registration Statement on Form S-1, filed on June 11, 2014).
|
|
|
||
|
10.7 |
|
Office Lease Agreement by and between the Registrant and Normandy Lexington Acquisition, LLC dated April 24, 2007, as amended on January 14, 2009, as further amended on April 16, 2010, as further amended on March 2, 2012, as further amended on December 28, 2012, as further amended on August 13, 2013, as further amended on January 14, 2014, and as further amended on March 31, 2014 (incorporated by reference to Exhibit 10.7 to the Company’s Amendment No. 1 to Registration Statement on Form S-1, filed on June 11, 2014).
|
|
|
||
|
10.8 |
|
Eighth Amendment to the Office Lease Agreement by and between the Registrant and Normandy Lexington Acquisition, LLC on January16, 2015 (incorporated by reference to Exhibit 10.7 to the Company’s Quarterly Report on Form 10-K, filed on May 8, 2015).
|
|
|
||
|
10.9* |
|
Ninth Amendment to the Office Lease Agreement by and between the Registrant and Normandy Lexington Acquisition, LLC on November 19, 2015.1
|
|
|
||
|
10.11
|
|
Triple Net Space Lease by and between the Registrant and Cooper House LLC dated September 3, 2013 (incorporated by reference to Exhibit 10.9 to the Company’s Registration Statement on Form S-1, filed on March 31, 2014).
|
|
|
||
|
10.12 |
|
Office Services Agreement by and between the Registrant and Regus Management (UK) Limited dated August 28, 2013, with an addendum dated August 28, 2013 (incorporated by reference to Exhibit 10.10 to the Company’s Registration Statement on Form S-1, filed on March 31, 2014).
|
|
|
||
|
87
88
|
** |
The certifications furnished in Exhibit 32.1 hereto are deemed to accompany this Annual Report on Form 10-K and will not be deemed “filed” for purposes of Section 18 of the Securities Exchange Act of 1934, as amended, except to the extent that the Registrant specifically incorporates it by reference. |
+ Indicates a management contract or compensatory plan.
89
90