Attached files
| file | filename |
|---|---|
| 8-K - FORM 8-K - Mahwah Bergen Retail Group, Inc. | v433170_8k.htm |
Exhibit 99.1
George Goldfarb | President and CEO DRAFT 12 - 23 - 16 AJ 1

This presentation contains forward - looking statements within the meaning of the Private Securities Litigation Reform Act of 1995. Forward - looking statements are based on current expectations and are indicated by words or phrases such as “anticipate, “estimate,” “expect,” “project,” “plan,” “we believe,” “will,” “would” and similar words or phrases, and involve known and unknown risks, uncertainties and other factors which may cause actual results, performance or achievements to be materially different from the future results, performance or achievements expressed in or implied by such forward - looking statements. Detailed information concerning those risks and uncertainties are readily available in our Annual Report on Form 10 - K for the Fiscal Year Ended July 25, 2015 (“Fiscal 2015 10 - K”) which has been filed with the U.S. Securities and Exchange Commission. We undertake no obligation to publicly update or revise any forward - looking statements, whether as a result of new information, future events or otherwise. Where indicated, certain financial information herein has been presented on a non - GAAP basis. This basis adjusts for non - recurring items that management believes are not indicative of the Company’s underlying operating performance. In addition, we present the financial performance measure of earnings before interest, taxes, depreciation and amortization (“EBITDA”), which has also been adjusted for these non - recurring items. These measures may not be directly comparable to similar measures used by other companies and should not be considered a substitute for performance measures in accordance with GAAP such as operating income and net income. Reference should be made to the Company’s annual earnings releases for all periods and the Fiscal 2015 10 - K for the nature of such adjustments and for a reconciliation of such non - GAAP measures to the Company’s financial results prepared in accordance with GAAP. Safe Harbor 2

George Goldfarb is president and CEO of maurices, a position he has held since 2011. He has strong tenure with maurices and has led the company in a variety of roles, including EVP, chief operating officer and SVP, chief financial officer. Erin Stern joined maurices in 2013 as executive vice president and chief merchandising officer . Erin brings to her position more than two decades of retail experience. Prior to joining maurices , Erin was Chief Merchant Officer for Juicy Couture and before that, President of bebe Sport. Erin spent the majority of her career with GAP Inc., in the Old Navy division, where she held senior leadership roles across multiple product categories. leadership 3

▪ Welcome /Lunch ▪ Store video ▪ Presentation ▪ Tour office/Review Spring assortment ▪ Wrap up/Questions a genda 4 4
VIDEO

5

▪ Advantages of the maurices model ▪ Sustainability of the maurices model ▪ Our continued growth story overview 6 6

fiscal fall 2016 results $ Millions Q1 Q2 Fall Sales $282.7M $291.6M $574.3M Comp % 7.2% 0.5% 3.7% 2 - Year Comp % 7.3% 8.5% 7.8% EBITDA $51.3M $39.0M $90.3M EBITDA % to Sales 18.1% 13.4% 15.7% 7

▪ Top - tier industry profits and strong sales growth ▪ Unique niche ▪ Hybrid sourcing model ▪ Favorable expense structure ▪ Culture/ Top talent a dvantages of the maurices model 8

9 10 year sales growth $400 $500 $600 $700 $800 $900 $1,000 $1,100 $1,200 2006 2007 2008 2009 2010 2011 2012 2013 2014 2015 424 492 557 588 681 777 853 918 971 1,061 $ Millions
9 10 year sales growth $400 $500 $600 $700 $800 $900 $1,000 $1,100 $1,200 2006 2007 2008 2009 2010 2011 2012 2013 2014 2015 424 492 557 588 681 777 853 918 971 1,051 $ Millions
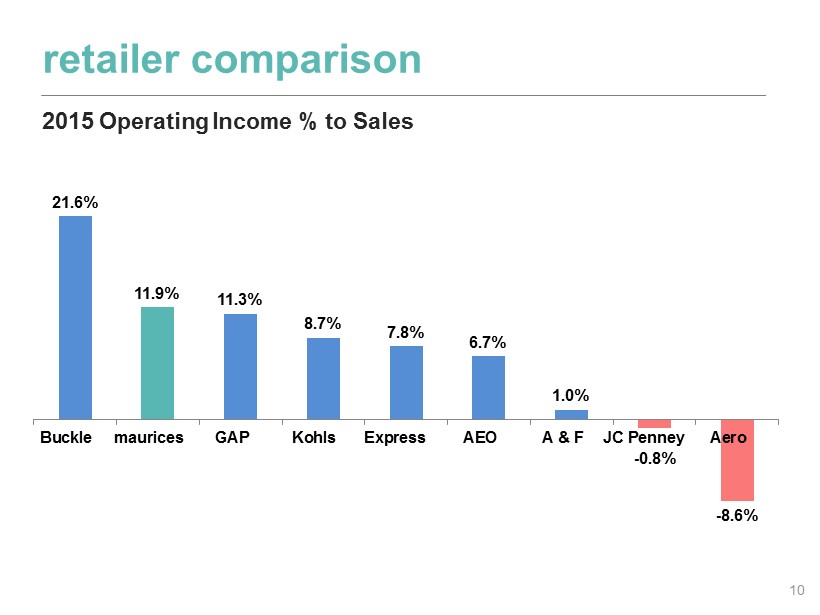
21.6% 11.9% 11.3% 8.7% 7.8% 6.7% 1.0% - 0.8% - 8.6% Buckle maurices GAP Kohls Express AEO A & F JC Penney Aero 10 retailer c omparison 2015 Operating I ncome % to Sales
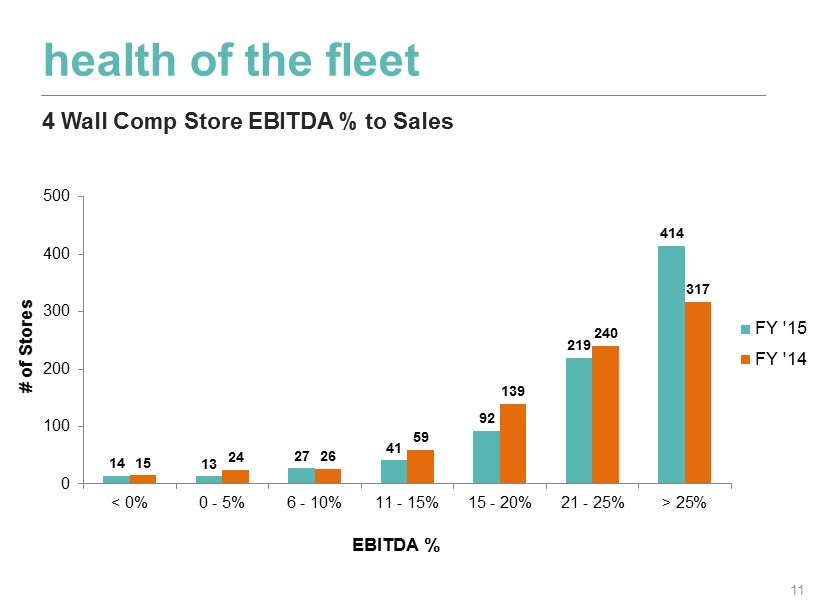
11 h ealth of the fleet 14 13 27 41 92 219 414 15 24 26 59 139 240 317 0 100 200 300 400 500 < 0% 0 - 5% 6 - 10% 11 - 15% 15 - 20% 21 - 25% > 25% # of Stores EBITDA % FY '15 FY '14 4 Wall Comp Store EBITDA % to Sales

High Price Low Price More Fashionable Less Fashionable Resources: Quarterly Brand Performance Measure of consumers – Nov 2015 NPD Customer Panel Data – Nov 2015 B&M c ompetitive p ositioning Our Unique Niche 12

High Price Low Price More Fashionable Less Fashionable B&M c ompetitive p ositioning Small Markets 13

breadth of assortment 14 Casual 65% Wear @ Work 20% Active 3% Accessories 12% Lifestyle Mix Plus is 20% of total business and on par with core items in terms of lifestyle penetration

15 f avorable expense s tructure ▪ Favorable occupancy costs ▪ Leverage SSG functions ▪ B&M distribution – Etna , OH ▪ Ecommerce fulfillment – Greencastle, IN ▪ IT platforms ▪ Other Shared Services back office functions 15

16 culture: engagement survey results 2 15 32 51 22 35 30 13 24 38 27 11 0 10 20 30 40 50 60 70 Disengaged Under Engaged Moderately Engaged Fully Engaged maurices Extraordinary Companies Retail

▪ Dominant market position ▪ Hybrid sourcing ▪ Fashion & breadth of assortment ▪ Operating as an Omni - retailer ▪ Stability and experience of management ▪ Expense structure sustainability of the maurices model 17

o ur continued growth story 18 Revenue growth ▪ Product ▪ Direct channel ▪ Marketing ▪ New store expansion Gross margin rate improvement 18

r evenue growth: product 19 Speed & Innovation ▪ NYC Design & Trend Studio ▪ Leveraging factory design capability 19

Assortment Expansion ▪ PLUS ▪ Online extensions ▪ Accessories r evenue growth: product 20 20

r evenue growth: direct c hannel 21 ▪ New loyalty program ▪ New platform and mobile site ▪ Digital attribution / enterprise analytics ▪ Expansion of online exclusives 21

r evenue growth: marketing 22 ▪ Drive new - to - file acquisition and expand reactivation initiatives ▪ Leverage personalization and segmentation capabilities ▪ Drive omni - customer traffic 22

National and Local Digital, Social Programmatic Video/Devices Local Cinema Local Radio revenue growth: brand expansion campaign 23
VIDEO

24

r evenue growth: new store expansion 25 ▪ 1,200+ store potential Strips 58 % Malls 36 % Outlets 5 %

revenue growth: annual opportunity 26 26

gross margin rate improvement 27 ▪ Increased internal sourcing penetration ▪ Higher regular price sell - through ▪ Faster inventory turn 27

operating margin roadmap 28 28

closing comments 29 ▪ Unique niche and strong economic model ▪ C ontinued operating margin growth ▪ Strength of team and culture 29