Attached files
| file | filename |
|---|---|
| EX-31.1 - EXHIBIT 31.1 - NBT BANCORP INC | ex31_1.htm |
| EX-31.2 - EXHIBIT 31.2 - NBT BANCORP INC | ex31_2.htm |
| EX-32.1 - EXHIBIT 32.1 - NBT BANCORP INC | ex32_1.htm |
| EX-23 - EXHIBIT 23 - NBT BANCORP INC | ex23.htm |
| EX-21 - EXHIBIT 21 - NBT BANCORP INC | ex21.htm |
| EX-10.5 - EXHIBIT 10.5 - NBT BANCORP INC | ex10_5.htm |
| EX-32.2 - EXHIBIT 32.2 - NBT BANCORP INC | ex32_2.htm |
| XML - IDEA: XBRL DOCUMENT - NBT BANCORP INC | R9999.htm |
UNITED STATES
SECURITIES AND EXCHANGE COMMISSION
WASHINGTON, DC 20549
FORM 10-K
☒ ANNUAL REPORT PURSUANT TO SECTION 13 OR 15(d) OF THE
SECURITIES EXCHANGE ACT OF 1934
FOR THE FISCAL YEAR ENDED DECEMBER 31, 2015
COMMISSION FILE NUMBER: 0-14703
NBT BANCORP INC.
(Exact name of registrant as specified in its charter)
|
Delaware
|
|
16-1268674
|
|
(State or other jurisdiction of incorporation or organization)
|
|
(IRS Employer Identification No.)
|
52 SOUTH BROAD STREET
NORWICH, NEW YORK 13815
(Address of principal executive office) (Zip Code)
(607) 337-2265 (Registrant's telephone number, including area code)
Securities registered pursuant to section 12(b) of the Act:
|
Title of each class:
|
|
Name of each exchange on which registered:
|
|
Common Stock, par value $0.01 per share
|
|
The NASDAQ Stock Market LLC
|
Securities registered pursuant to section 12(g) of the Act: None
Indicate by check mark if the registrant is a well-known seasoned issuer, as defined in Rule 405 of the Securities Act. Yes ☒ No ☐
Indicate by check mark if the registrant is not required to file reports pursuant to Section 13 or Section 15 (d) of the Act. Yes ☐ No ☒
Indicate by check mark whether the registrant (1) has filed all reports required to be filed by Section 13 or 15(d) of the Securities Exchange Act of 1934 during the preceding 12 months (or for such shorter period that the registrant was required to file such reports) and (2) has been subject to such filing requirements for the past 90 days. Yes ☒ No ☐
Indicate by check mark whether the registrant has submitted electronically and posted on its corporate Web site, if any, every Interactive Data File required to be submitted and posted pursuant to Rule 405 of Regulation S-T (§ 232.405 of this chapter) during the preceding 12 months (or for such shorter period that the registrant was required to submit and post such files). Yes ☒ No ☐
Indicate by check mark if disclosure of delinquent filers pursuant to Item 405 of Regulation S-K (Section 229.405 of this chapter) is not contained herein, and will not be contained, to the best of the registrant's knowledge, in definitive proxy or information statements incorporated by reference in Part III of this Form 10-K or any amendment to this Form 10-K. ☐
Indicate by check mark whether the registrant is a large accelerated filer, an accelerated filer, a non-accelerated filer, or a smaller reporting company. See the definitions of "large accelerated filer," "accelerated filer," and "smaller reporting company" in Rule 12b-2 of the Exchange Act.
|
Large accelerated filer ☒
|
Accelerated filer ☐
|
Non-accelerated filer ☐
|
Smaller reporting company ☐
|
Indicate by check mark whether the registrant is a shell company (as defined in Rule 12b-2 of the Act). ☐ Yes ☒ No
Based on the closing price of the registrant's common stock as of June 30, 2015, the aggregate market value of the voting stock, common stock, par value, $0.01 per share, held by non-affiliates of the registrant is $1,107,379,951.
The number of shares of common stock outstanding as of February 12, 2016, was 43,126,156.
DOCUMENTS INCORPORATED BY REFERENCE
Portions of the registrant's definitive Proxy Statement for its Annual Meeting of Stockholders to be held on May 3, 2016 are incorporated by reference into Part III, Items 10, 11, 12, 13 and 14 of this Form 10-K.
FORM 10-K – Year Ended December 31, 2015
TABLE OF CONTENTS
|
PART I
|
||
|
ITEM 1
|
4
|
|
|
ITEM 1A
|
15
|
|
|
ITEM 1B
|
21
|
|
|
ITEM 2
|
22
|
|
|
ITEM 3
|
23
|
|
|
ITEM 4
|
23
|
|
|
PART II
|
||
|
ITEM 5
|
23
|
|
|
ITEM 6
|
26
|
|
|
ITEM 7
|
28
|
|
|
ITEM 7A
|
50
|
|
|
ITEM 8
|
51
|
|
|
51
|
||
|
52
|
||
|
53
|
||
|
54
|
||
|
55
|
||
|
56
|
||
|
58
|
||
|
ITEM 9
|
95
|
|
|
ITEM 9A
|
95
|
|
|
ITEM 9B
|
98
|
|
|
PART III
|
||
|
ITEM 10
|
98
|
|
|
ITEM 11
|
98
|
|
|
ITEM 12
|
98
|
|
|
ITEM 13
|
98
|
|
|
ITEM 14
|
98
|
|
|
PART IV
|
||
|
ITEM 15
|
99
|
|
|
102
|
ITEM 1. Business
NBT Bancorp Inc. (the "Registrant" or the "Company") is a registered financial holding company incorporated in the state of Delaware in 1986, with its principal headquarters located in Norwich, New York. The Company, on a consolidated basis, at December 31, 2015 had assets of $8.3 billion and stockholders' equity of $882.0 million.
The principal assets of the Registrant consist of all of the outstanding shares of common stock of its subsidiaries, including: NBT Bank, National Association (the "Bank"), NBT Financial Services, Inc. ("NBT Financial"), NBT Holdings, Inc. ("NBT Holdings"), Hathaway Agency, Inc., and CNBF Capital Trust I, NBT Statutory Trust I and NBT Statutory Trust II (collectively, the "Trusts"). The Company's principal sources of revenue are the management fees and dividends it receives from the Bank, NBT Financial and NBT Holdings.
The Company's business, primarily conducted through the Bank but also through its other subsidiaries, consists of providing commercial banking and financial services to customers in its market area, which includes central and upstate New York, northeastern Pennsylvania, southern New Hampshire, western Massachusetts, Vermont, and the greater Portland, Maine area. The Company has been, and intends to continue to be, a community-oriented financial institution offering a variety of financial services. The Company's business philosophy is to operate as a community bank with local decision-making, principally in non-metropolitan markets, providing a broad array of banking and financial services to retail, commercial, and municipal customers. The financial condition and operating results of the Company are dependent on its net interest income which is the difference between the interest and dividend income earned on its earning assets, primarily loans and investments, and the interest expense paid on its interest bearing liabilities, primarily consisting of deposits and borrowings. Among other factors, net income is also affected by provisions for loan losses and noninterest income, such as service charges on deposit accounts, insurance and other financial services fees, trust revenue, and gains/losses on securities sales, bank owned life insurance income, ATM and debit card fees, and retirement plan administration fees as well as noninterest expense, such as salaries and employee benefits, occupancy, equipment, data processing and communications, professional fees and outside services, office supplies and postage, amortization, loan collection and other real estate owned expenses, advertising, FDIC expenses, and other expenses.
Substantially all of the Company's business activities are with customers located in the United States. Percentage of revenue and loan composition by state is summarized below:
|
|
Interest and Fee Income
|
Noninterest Income
|
Total Revenue
|
|||||||||
|
New York
|
54
|
%
|
30
|
%
|
84
|
%
|
||||||
|
Pennsylvania
|
6
|
%
|
1
|
%
|
7
|
%
|
||||||
|
New Hampshire
|
3
|
%
|
0
|
%
|
3
|
%
|
||||||
|
Vermont
|
4
|
%
|
0
|
%
|
4
|
%
|
||||||
|
Massachusetts
|
1
|
%
|
1
|
%
|
2
|
%
|
||||||
|
68
|
%
|
32
|
%
|
100
|
%
|
|||||||
|
|
Commercial
|
Consumer
|
Residential Real Estate
|
Total Loan Portfolio
|
||||||||||||
|
New York
|
32
|
%
|
27
|
%
|
16
|
%
|
75
|
%
|
||||||||
|
Pennsylvania
|
3
|
%
|
4
|
%
|
3
|
%
|
10
|
%
|
||||||||
|
New Hampshire
|
4
|
%
|
1
|
%
|
1
|
%
|
6
|
%
|
||||||||
|
Vermont
|
4
|
%
|
2
|
%
|
1
|
%
|
7
|
%
|
||||||||
|
Massachusetts
|
1
|
%
|
0
|
%
|
0
|
%
|
1
|
%
|
||||||||
|
Maine
|
1
|
%
|
0
|
%
|
0
|
%
|
1
|
%
|
||||||||
|
45
|
%
|
34
|
%
|
21
|
%
|
100
|
%
|
|||||||||
Percentage of total loan portfolio secured by real estate is summarized below:
|
|
Secured By Real Estate
|
Not Secured By Real Estate
|
||||||
|
New York
|
58
|
%
|
42
|
%
|
||||
|
Pennsylvania
|
68
|
%
|
32
|
%
|
||||
|
New Hampshire
|
71
|
%
|
29
|
%
|
||||
|
Vermont
|
56
|
%
|
44
|
%
|
||||
|
Massachusetts
|
74
|
%
|
26
|
%
|
||||
|
Maine
|
100
|
%
|
0
|
%
|
||||
Like much of the nation, the market areas that the Company serves are still experiencing economic challenges and volatility. A variety of factors (e.g., any substantial rise in inflation or rise in unemployment rates, decrease in consumer confidence, adverse international economic conditions, natural disasters, war, or political instability) may affect both the Company's markets and the national market. The Company will continue to emphasize managing its funding costs and lending and investment rates to effectively maintain profitability. In addition, the Company will continue to seek and maintain relationships that can generate noninterest income. We anticipate that this approach should help mitigate profit fluctuations that are caused by movements in interest rates, business and consumer loan cycles, and local economic factors.
NBT Bank, N.A.
The Bank is a full service commercial bank formed in 1856, which provides a broad range of financial products to individuals, corporations and municipalities throughout the central and upstate New York, northeastern Pennsylvania, western Massachusetts, southern New Hampshire, Vermont, and the greater Portland, Maine market areas.
Through its network of branch locations, the Bank offers a wide range of products and services tailored to individuals, businesses, and municipalities. Deposit products offered by the Bank include demand deposit accounts, savings accounts, negotiable order of withdrawal ("NOW") accounts, money market deposit accounts ("MMDA"), and certificate of deposit ("CD") accounts. The Bank offers various types of each deposit account to accommodate the needs of its customers with varying rates, terms, and features. Loan products offered by the Bank include consumer loans, home equity loans, mortgages, small business loans and commercial loans, with varying rates, terms and features to accommodate the needs of its customers. The Bank also offers various other products and services through its branch network such as trust and investment services and financial planning and life insurance services. In addition to its branch network, the Bank also offers access to certain products and services electronically enabling customers to check balances, transfer funds, pay bills, view statements, apply for loans and access various other product and service information. The Bank provides 24-hour access to an automated telephone line whereby customers can check balances, obtain account information, transfer funds, request statements, and perform various other activities.
NBT Financial Services, Inc.
Through NBT Financial Services, the Company operates EPIC Advisors, Inc. ("EPIC"), a retirement plan administrator. Through EPIC, the Company offers services including retirement plan consulting and recordkeeping services. EPIC's headquarters are located in Rochester, New York.
NBT Holdings, Inc.
Through NBT Holdings, the Company operates NBT-Mang Insurance Agency, LLC ("Mang"), a full-service insurance agency acquired by the Company on September 1, 2008. Mang's headquarters are in Norwich, New York. Through Mang, the Company offers a full array of insurance products, including personal property and casualty, business liability and commercial insurance, tailored to serve the specific insurance needs of individuals as well as businesses in a range of industries operating in the markets served by the Company.
The Trusts
The Trusts were organized to raise additional regulatory capital and to provide funding for certain acquisitions. CNBF Capital Trust I ("Trust I") and NBT Statutory Trust I are Delaware statutory business trusts formed in 1999 and 2005, respectively, for the purpose of issuing trust preferred securities and lending the proceeds to the Company. In connection with the acquisition of CNB Bancorp, Inc., the Company formed NBT Statutory Trust II ("Trust II") in February 2006 to fund the cash portion of the acquisition as well as to provide regulatory capital. The Company raised $51.5 million through Trust II in February 2006. The Company guarantees, on a limited basis, payments of distributions on the trust preferred securities and payments on redemption of the trust preferred securities. The Trusts are variable interest entities (VIEs) for which the Company is not the primary beneficiary, as defined by Financial Accounting Standards Board Accounting Standards Codification ("FASB ASC"). In accordance with FASB ASC, the accounts of the Trusts are not included in the Company's consolidated financial statements.
Operating Subsidiaries of the Bank
The Bank has six operating subsidiaries, NBT Capital Corp., Broad Street Property Associates, Inc., NBT Services, Inc., CNB Realty Trust, Alliance Preferred Funding Corp., and Alliance Leasing, Inc. NBT Capital Corp., formed in 1998, is a venture capital corporation formed to assist young businesses to develop and grow primarily in the markets they serve. Broad Street Property Associates, Inc., formed in 2004, is a property management company. NBT Services, Inc., formed in 2004, has a 44% ownership interest in Land Record Services, LLC. Land Record Services, LLC, a title insurance agency, offers mortgagee and owner's title insurance coverage to both retail and commercial customers. CNB Realty Trust, formed in 1998, is a real estate investment trust. Alliance Preferred Funding Corp., formed in 1999, is a real estate investment trust. Alliance Leasing, Inc. was formed in 2002 to provide equipment leasing services.
Competition
The financial services industry, including commercial banking, is highly competitive, and we encounter strong competition for deposits, loans and other financial products and services in our market area. The increasingly competitive environment is the result of the continued low rate environment, changes in regulation, changes in technology and product delivery systems, additional financial service providers, and the accelerating pace of consolidation among financial services providers. The Company competes for loans, deposits, and customers with other commercial banks, savings and loan associations, securities and brokerage companies, mortgage companies, insurance companies, finance companies, money market funds, credit unions, and other nonbank financial service providers.
The financial services industry could become even more competitive as a result of legislative, regulatory and technological changes and continued consolidation. Banks, securities firms and insurance companies can merge under the umbrella of a financial holding company, which can offer virtually any type of financial service, including banking, securities underwriting, insurance (both agency and underwriting) and merchant banking. Also, technology has lowered barriers to entry and made it possible for non-banks to offer products and services traditionally provided by banks, such as automatic transfer and automatic payment systems.
Some of the Company's nonbanking competitors have fewer regulatory constraints and may have lower cost structures. In addition, some of the Company's competitors have assets, capital and lending limits greater than that of the Company, have greater access to capital markets and offer a broader range of products and services than the Company. These institutions may have the ability to finance wide-ranging advertising campaigns and may also be able to offer lower rates on loans and higher rates on deposits than the Company can offer. Some of these institutions offer services, such as credit cards and international banking, which the Company does not directly offer.
Various in-state market competitors and out-of-state banks continue to enter or have announced plans to enter or expand their presence in the market areas in which the Company currently operates. With the addition of new banking presences within our market, the Company expects increased competition for loans, deposits, and other financial products and services.
In order to compete with other financial services providers, the Company stresses the community nature of its banking operations and principally relies upon local promotional activities, personal relationships established by officers, directors, and employees with their customers, and specialized services tailored to meet the needs of the communities served. We also offer certain customer services, such as agricultural lending, that many of our larger competitors do not offer. While the Company's position varies by market, the Company's management believes that it can compete effectively as a result of local market knowledge, local decision making, and awareness of customer needs.
The table below summarizes the Bank's deposits and market share by the thirty-eight counties of New York, Pennsylvania, New Hampshire, Vermont, Massachusetts, and Maine in which it had customer facilities as of June 30, 2015. Market share is based on deposits of all commercial banks, credit unions, savings and loans associations, and savings banks.
|
County
|
State
|
Deposits
(in thousands)
|
Market Share
|
Market
Rank |
Number
of Branches* |
Number of ATMs*
|
||||||||||||||||
|
Chenango
|
NY
|
$
|
863,452
|
90.39
|
%
|
1
|
11
|
13
|
||||||||||||||
|
Fulton
|
NY
|
415,323
|
60.81
|
%
|
1
|
5
|
6
|
|||||||||||||||
|
Schoharie
|
NY
|
191,126
|
46.89
|
%
|
1
|
4
|
4
|
|||||||||||||||
|
Hamilton
|
NY
|
41,699
|
44.44
|
%
|
2
|
1
|
1
|
|||||||||||||||
|
Cortland
|
NY
|
268,435
|
40.55
|
%
|
1
|
5
|
7
|
|||||||||||||||
|
Montgomery
|
NY
|
234,727
|
35.02
|
%
|
2
|
5
|
4
|
|||||||||||||||
|
Otsego
|
NY
|
323,695
|
33.50
|
%
|
2
|
8
|
12
|
|||||||||||||||
|
Delaware
|
NY
|
301,749
|
31.56
|
%
|
1
|
5
|
4
|
|||||||||||||||
|
Essex
|
NY
|
161,200
|
25.72
|
%
|
2
|
3
|
5
|
|||||||||||||||
|
Susquehanna
|
PA
|
164,428
|
21.87
|
%
|
2
|
5
|
7
|
|||||||||||||||
|
Madison
|
NY
|
207,536
|
17.05
|
%
|
2
|
4
|
6
|
|||||||||||||||
|
Oneida
|
NY
|
399,069
|
12.43
|
%
|
5
|
7
|
11
|
|||||||||||||||
|
Pike
|
PA
|
77,814
|
12.03
|
%
|
5
|
2
|
2
|
|||||||||||||||
|
Saint Lawrence
|
NY
|
133,194
|
11.89
|
%
|
3
|
5
|
5
|
|||||||||||||||
|
Broome
|
NY
|
303,702
|
11.65
|
%
|
3
|
8
|
10
|
|||||||||||||||
|
Herkimer
|
NY
|
55,313
|
9.22
|
%
|
4
|
2
|
1
|
|||||||||||||||
|
Wayne
|
PA
|
111,218
|
9.01
|
%
|
4
|
3
|
4
|
|||||||||||||||
|
Tioga
|
NY
|
32,787
|
8.00
|
%
|
5
|
1
|
1
|
|||||||||||||||
|
Clinton
|
NY
|
99,791
|
7.84
|
%
|
5
|
3
|
2
|
|||||||||||||||
|
Oswego
|
NY
|
131,705
|
7.67
|
%
|
5
|
4
|
6
|
|||||||||||||||
|
Lackawanna
|
PA
|
388,887
|
7.66
|
%
|
7
|
13
|
16
|
|||||||||||||||
|
Franklin
|
NY
|
28,354
|
6.15
|
%
|
5
|
1
|
1
|
|||||||||||||||
|
Schenectady
|
NY
|
156,115
|
6.08
|
%
|
6
|
2
|
2
|
|||||||||||||||
|
Onondaga
|
NY
|
388,339
|
4.24
|
%
|
8
|
11
|
13
|
|||||||||||||||
|
Saratoga
|
NY
|
144,106
|
3.60
|
%
|
9
|
4
|
4
|
|||||||||||||||
|
Greene
|
NY
|
36,868
|
3.36
|
%
|
6
|
2
|
2
|
|||||||||||||||
|
Monroe
|
PA
|
79,664
|
3.11
|
%
|
8
|
4
|
5
|
|||||||||||||||
|
Berkshire
|
MA
|
109,907
|
3.07
|
%
|
7
|
6
|
6
|
|||||||||||||||
|
Warren
|
NY
|
47,138
|
3.02
|
%
|
6
|
2
|
3
|
|||||||||||||||
|
Cheshire
|
NH
|
31,361
|
2.33
|
%
|
7
|
1
|
0
|
|||||||||||||||
|
Chittenden
|
VT
|
84,565
|
2.10
|
%
|
7
|
3
|
3
|
|||||||||||||||
|
Albany
|
NY
|
199,318
|
1.66
|
%
|
10
|
4
|
5
|
|||||||||||||||
|
Luzerne
|
PA
|
91,977
|
1.62
|
%
|
13
|
4
|
6
|
|||||||||||||||
|
Rensselaer
|
NY
|
15,559
|
0.81
|
%
|
12
|
1
|
1
|
|||||||||||||||
|
Hillsborough
|
NH
|
65,945
|
0.54
|
%
|
11
|
2
|
2
|
|||||||||||||||
|
Rockingham
|
NH
|
18,828
|
0.30
|
%
|
19
|
2
|
2
|
|||||||||||||||
|
Rutland
|
VT
|
2,185
|
0.23
|
%
|
9
|
1
|
1
|
|||||||||||||||
|
Cumberland
|
ME
|
905
|
0.01
|
%
|
16
|
1
|
0
|
|||||||||||||||
|
$
|
6,407,984
|
155
|
183
|
|||||||||||||||||||
Deposit market share data is based on the most recent data available (as of June 30, 2015). Source: SNL Financial LLC
* Branch and ATM data is as of December 31, 2015.
Supervision and Regulation
The Company, the Bank and certain of its non-banking subsidiaries are subject to extensive regulation under federal and state laws. The regulatory framework applicable to bank holding companies and their subsidiary banks is intended to protect depositors, federal deposit insurance funds, and the stability of the U.S. banking system. This system is not designed to protect equity investors in bank holding companies, such as the Company. Statutes, regulations and policies are subject to ongoing review by Congress, state legislatures and federal and state agencies. A change in any statute, regulation or policy applicable to the Company may have a material effect on the results of the Company and its subsidiaries.
Overview
The Company is a registered bank holding company and financial holding company under the Bank Holding Company Act of 1956 (the "BHC Act"), as amended, and is subject to the supervision of and regular examination by the Board of Governors of the Federal Reserve System (the "Federal Reserve Board" or "FRB") as its primary federal regulator. The Company is also subject to the jurisdiction of the Securities and Exchange Commission ("SEC") and is subject to the disclosure and other regulatory requirements of the Securities Act of 1933, as amended, and the Securities Exchange Act of 1934, as amended, as administered by the SEC. The Company is traded on the NASDAQ under the ticker symbol, "NBTB," and is subject to the NASDAQ stock market rules.
The Bank is organized as a national banking association under the National Bank Act. The Bank is subject to the supervision of, and to regular examination by, the Office of the Comptroller of the Currency ("OCC") as its chartering authority and primary federal regulator. The Bank is also subject to the supervision and regulation of the Federal Deposit Insurance Corporation ("FDIC") as its deposit insurer. Financial products and services offered by the Company and the Bank are subject to federal consumer protection laws and implementing regulations promulgated by the Consumer Financial Protection Bureau ("CFPB"). The Company and the Bank are also subject to oversight by state attorneys general for compliance with state consumer protection laws. The Bank's deposits are insured by the FDIC up to the applicable deposit insurance limits in accordance with FDIC laws and regulations. The non-bank subsidiaries of the Company and the Bank are subject to federal and state laws and regulations, including regulations of the FRB and the OCC, respectively.
The Dodd-Frank Wall Street Reform and Consumer Protection Act of 2010 (the "Dodd-Frank Act") has significantly changed the financial regulatory landscape in the U.S. Several provisions of the Dodd-Frank Act are subject to further rulemaking, guidance and interpretation by the federal banking agencies. As a result, management cannot predict the ultimate impact of the Dodd-Frank Act or the extent to which it could affect operations of the Company and the Bank.
Set forth below is a summary of the significant laws and regulations applicable to the Company and its subsidiaries. The description that follows is qualified in its entirety by reference to the full text of the statutes, regulations, and policies that are described. Such statutes, regulations, and policies are subject to ongoing review by Congress and state legislatures and federal and state regulatory agencies. A change in any of the statutes, regulations, or regulatory policies applicable to the Company and its subsidiaries could have a material effect on the results of the Company.
Federal Bank Holding Company Regulation
The Company is a bank holding company as defined by the BHCA. The BHCA generally limits the business of the Company to banking, managing or controlling banks, and other activities that the FRB has determined to be so closely related to banking "as to be a proper incident thereto." The Company has also qualified for and elected to be a financial holding company. Financial holding companies may engage in any activity, or acquire and retain the shares of a company engaged in any activity that is either (i) financial in nature or incidental to such financial activity (as determined by the FRB in consultation with the Secretary of the Treasury), or (ii) complementary to a financial activity, and that does not pose a substantial risk to the safety and soundness of depository institutions or the financial system (as solely determined by the FRB). If a bank holding company seeks to engage in the broader range of activities permitted under the BHC Act for financial holding companies, (i) the bank holding company and all of its depository institution subsidiaries must be "well capitalized" and "well managed," as defined in the FRB's Regulation Y, and (ii) it must file a declaration with the FRB that it elects to be a "financial holding company." In order for a financial holding company to commence any activity that is financial in nature, incidental thereto, or complementary to a financial activity, or to acquire a company engaged in any such activity permitted by the BHC Act, each insured depository institution subsidiary of the financial holding company must have received a rating of at least "satisfactory" in its most recent examination under the Community Reinvestment Act of 1977 (the "CRA"). See the section titled "Community Reinvestment Act of 1977" for further information relating to the CRA.
Regulation of Mergers and Acquisitions
The BHC Act, the Bank Merger Act, and other federal and state statutes regulate acquisitions of depository institutions and their holding companies. The BHC Act requires prior FRB approval for the direct or indirect acquisition of 5% or more of the voting shares of a bank or its parent holding company. Under the Bank Merger Act, prior approval of the OCC is required for a national bank to merge with another bank where the national bank is the resulting bank or to purchase the assets or assume the deposits of another bank. In reviewing applications seeking approval of merger and acquisition transactions, the federal banking agencies will consider, among other criteria, the competitive effect and public benefits of the transactions, the capital position of the combined banking organization, the applicant's performance record under the CRA, and the effectiveness of the subject organizations in combating money laundering activities.
As a financial holding company, the Company is permitted to acquire control of non-depository institution companies engaged in activities that are financial in nature and in activities that are incidental and complementary to financial activities without prior FRB approval. However, the BHC Act, as amended by the Dodd-Frank Act, requires prior written approval from the FRB or prior written notice to the FRB before a financial holding company may acquire control of a company with consolidated assets of $10 billion or more.
Capital Contributions
The principal source of the Company's liquidity is dividends from the Bank. The OCC oversees the ability of the Bank to make capital contributions, including dividends. The OCC generally prohibits a depository institution from making any capital distributions (including payment of a dividend) or paying any management fee to its parent holding company if the bank would thereafter be undercapitalized. The federal banking agencies have indicated that paying dividends that deplete a bank's capital base to an inadequate level would be an unsafe and unsound banking practice and that banking organizations should generally pay dividends only out of current operating earnings. The appropriate federal regulatory authority is authorized to determine, based on the financial condition of a bank holding company or a bank, that the payment of dividends would be an unsafe or unsound practice and to prohibit such payment.
The OCC's prior approval is required if the total of all dividends declared by a national bank in any calendar year would exceed the sum of the bank's net income for that year and its undistributed net income for the preceding two calendar years, less any required transfers to surplus. The National Bank Act also prohibits national banks from paying dividends that would be greater than the bank's undivided profits after deducting statutory bad debt in excess of the bank's allowance for loan and lease losses.
Affiliate and Insider Transactions
Transactions between the Bank and its affiliates, including the Company, are governed by sections 23A and 23B of the Federal Reserve Act (the "FRA") and the FRB's implementing Regulation W. An "affiliate" of a bank includes any company or entity that controls, is controlled by, or is under common control with the Bank. Generally, sections 23A and 23B of the FRA are intended to protect insured depository institutions from losses in transactions with affiliates. These sections place quantitative and qualitative limitations on covered transactions between the Bank and its affiliates, and require that all transactions between a bank and its affiliates occur on market terms that are consistent with safe and sound banking practices.
Section 22(h) of the FRA and its implementing Regulation O restricts loans to directors, executive officers, and principal stockholders ("Insiders"). Under Section 22(h), loans to Insiders and their related interests may not exceed, together with all other outstanding loans to such persons and affiliated entities, the institution's total capital and surplus. Loans to Insiders above specified amounts must receive the prior approval of the Bank's board of directors. Further, under Section 22(h) of the FRA, loans to directors, executive officers, and principal stockholders must be made on terms substantially the same as offered in comparable transactions to other persons, except that such insiders may receive preferential loans made under a benefit or compensation program that is widely available to the Bank's employees and does not give preference to the insider over the employees. Section 22(g) of the FRA places additional limitations on loans to executive officers.
Federal Deposit Insurance and Brokered Deposits
The Dodd-Frank Act increased the maximum amount of deposit insurance for banks, savings institutions and credit unions to $250,000 per depositor per insured institution. The Bank's deposit accounts are fully insured by the FDIC Deposit Insurance Fund (the "DIF") up to the deposit insurance limits in accordance with applicable laws and regulations.
The FDIC uses a risk-based assessment system that imposes insurance premiums based upon a risk matrix that takes into account a bank's capital level and supervisory rating ("CAMELS rating"). The risk matrix uses different risk categories distinguished by capital levels and supervisory ratings. As a result of the Dodd-Frank Act, the base for deposit insurance assessments is now consolidated average assets less average tangible equity. Assessment rates are calculated using formulas that take into account the risk of the institution being assessed. In addition to deposit insurance assessments, the Federal Deposit Insurance Act ("FDIA") provides for additional assessments to be imposed on insured depository institutions to pay for the cost of Financing Corporation ("FICO") funding. The FICO assessments are adjusted quarterly to reflect changes in the assessment base of the DIF and do not vary depending upon a depository institution's capitalization or supervisory evaluation.
Under FDIC laws and regulations, no FDIC-insured depository institution can accept brokered deposits unless it is well capitalized, or unless it is adequately capitalized and receives a waiver from the FDIC. Applicable laws and regulations also prohibit any depository institution that is not well capitalized from paying an interest rate on brokered deposits in excess of three-quarters of one percentage point over certain prevailing market rates.
Federal Home Loan Bank System
The Bank is also a member of the Federal Home Loan Bank ("FHLB") of New York, which provides a central credit facility primarily for member institutions for home mortgage and neighborhood lending. The Bank is subject to the rules and requirements of the FHLB, including the requirement to acquire and hold shares of capital stock in the FHLB in an amount at least equal to the sum of 0.35% of the aggregate principal amount of its unpaid residential mortgage loans and similar obligations at the beginning of each year, up to a maximum of $25.0 million. The Bank was in compliance with FHLB rules and requirements as of December 31, 2015.
Debit Card Interchange Fees
The Dodd-Frank Act requires that any interchange transaction fee charged for a debit transaction be reasonable and proportional to the cost incurred by the issuer for the transaction. FRB regulations mandated by the Dodd-Frank Act limit interchange fees on debit cards to a maximum of 21 cents per transaction plus 5 basis points of the transaction amount. Issuers that, together with their affiliates, have less than $10 billion of assets, such as the Company, are exempt from the debit card interchange fee standards. However, FRB regulations prohibit all issuers, including the Company and the Bank, from restricting the number of networks over which electronic debit transactions may be processed to less than two unaffiliated networks.
Source of Strength Doctrine
FRB policy requires bank holding companies to act as a source of financial and managerial strength to their subsidiary banks. Section 616 of the Dodd-Frank Act codifies the requirement that bank holding companies serve as a source of financial strength to their subsidiary depository institutions. As a result, the Company is expected to commit resources to support the Bank, including at times when the Company may not be in a financial position to provide such resources. Any capital loan by the Company to the Bank is subordinate in right of payment to deposits and to certain other indebtedness of such subsidiary banks. The U.S. bankruptcy code provides that, in the event of a bank holding company's bankruptcy, any commitment by the bank holding company to a federal bank regulatory agency to maintain the capital of a subsidiary bank will be assumed by the bankruptcy trustee and entitled to priority of payment.
In addition, under the National Bank Act, if the Bank's capital stock is impaired by losses or otherwise, the OCC is authorized to require payment of the deficiency by assessment upon the Company. If the assessment is not paid within three months, the OCC could order a sale of the Bank to cover any deficiency.
Capital Adequacy and Prompt Corrective Action
In July 2013, the FRB, the OCC and the FDIC approved final rules (the "Capital Rules") that established a new capital framework for U.S. banking organizations. The Capital Rules generally implement the Basel Committee on Banking Supervision's (the "Basel Committee") December 2010 final capital framework referred to as "Basel III" for strengthening international capital standards. In addition, the Capital Rules implement certain provisions of the Dodd-Frank Act, including the requirements of Section 939A to remove references to credit ratings from the federal banking agencies' rules.
The Capital Rules substantially revised the risk-based capital requirements applicable to bank holding companies and their depository institution subsidiaries, including the Company and the Bank, as compared to prior U.S. general risk-based capital rules. The Capital Rules revised the definitions and the components of regulatory capital and impacted the calculation of the numerator in banking institutions' regulatory capital ratios. The Capital Rules became effective for the Company on January 1, 2015, subject to phase-in periods for certain components and other provisions.
The Capital Rules: (i) require a capital measure called "Common Equity Tier 1" ("CET1") and related regulatory capital ratio of CET1 to risk-weighted assets; (ii) specify that Tier 1 capital consists of CET1 and "Additional Tier 1 capital" instruments meeting certain revised requirements; (iii) mandate that most deductions/adjustments to regulatory capital measures be made to CET1 and not to the other components of capital; and (iv) expand the scope of the deductions from and adjustments to capital as compared to existing regulations. Under the Capital Rules, for most banking organizations, the most common form of Additional Tier 1 capital is non-cumulative perpetual preferred stock and the most common forms of Tier 2 capital are subordinated notes and a portion of the allocation for loan losses, in each case, subject to the Capital Rules' specific requirements.
Pursuant to the Capital Rules, the minimum capital ratios as of January 1, 2015 are:
| ● | 4.5% CET1 to risk-weighted assets; |
| ● | 6.0% Tier 1 capital (CET1 plus Additional Tier 1 capital) to risk-weighted assets; |
| ● | 8.0% Total capital (Tier 1 capital plus Tier 2 capital) to risk-weighted assets; and |
| ● | 4.0% Tier 1 capital to average consolidated assets as reported on consolidated financial statements (known as the "leverage ratio"). |
The Capital Rules also require a "capital conservation buffer," composed entirely of CET1, on top of these minimum risk-weighted asset ratios. The capital conservation buffer is designed to absorb losses during periods of economic stress. Banking institutions with a ratio of CET1 to risk-weighted assets above the minimum but below the capital conservation buffer will face constraints on dividends, equity and other capital instrument repurchases and compensation based on the amount of the shortfall. When fully phased-in on January 1, 2019, the capital standards applicable to the Company will include an additional capital conservation buffer of 2.5% of CET1, effectively resulting in minimum ratios inclusive of the capital conservation buffer of (i) CET1 to risk-weighted assets of at least 7%, (ii) Tier 1 capital to risk-weighted assets of at least 8.5%, and (iii) Total capital to risk-weighted assets of at least 10.5%.
The Capital Rules provide for a number of deductions from and adjustments to CET1. These include, for example, the requirement that mortgage servicing rights, deferred tax assets arising from temporary differences that could not be realized through net operating loss carrybacks and significant investments in non-consolidated financial entities be deducted from CET1 to the extent that any one such category exceeds 10% of CET1 or all such items, in the aggregate, exceed 15% of CET1.
In addition, under the prior general risk-based capital rules, the effects of accumulated other comprehensive income or loss ("AOCI") items included in shareholders' equity (for example, marks-to-market of securities held in the available-for-sale portfolio) under U.S. GAAP are reversed for the purposes of determining regulatory capital ratios. Under the Capital Rules, the effects of certain AOCI items are not excluded; however, banking organizations not using the advanced approaches, including the Company were permitted to make a one-time permanent election to continue to exclude these items in January 2015. The Capital Rules also preclude certain hybrid securities, such as trust preferred securities issued after May 19, 2010, from inclusion in bank holding companies' Tier 1 capital.
Implementation of the deductions and other adjustments to CET1 began on January 1, 2015, are phased-in over a 4-year period (beginning at 40% on January 1, 2015 and an additional 20% per year thereafter). The implementation of the capital conservation buffer will begin on January 1, 2016 at the 0.625% level and increase by 0.625% on each subsequent January 1, until it reaches 2.5% on January 1, 2019.
With respect to the Bank, the Capital Rules revised the "prompt corrective action" ("PCA") regulations adopted pursuant to Section 38 of the FDIA, by: (i) introducing a CET1 ratio requirement at each PCA category (other than critically undercapitalized), with the required CET1 ratio being 6.5% for well-capitalized status; (ii) increasing the minimum Tier 1 capital ratio requirement for each category, with the minimum Tier 1 capital ratio for well-capitalized status being 8% (as compared to 6%); and (iii) eliminating the provision that permitted a bank with a composite supervisory rating of 1 and a 3% leverage ratio to be considered adequately capitalized. The Capital Rules did not change the total risk-based capital requirement for any PCA category.
The Capital Rules prescribe a standardized approach for risk weightings that expand the risk-weighting categories from the four Basel I-derived categories (0%, 20%, 50% and 100%) to a larger and more risk-sensitive number of categories, depending on the nature of the assets, generally ranging from 0% for U.S. government and agency securities, to 600% for certain equity exposures, and resulting in higher risk weights for a variety of asset classes.
Management believes that the Company is in compliance, and will continue to be in compliance, with the targeted capital ratios as such requirements are phased in.
Volcker Rule
Section 619 of the Dodd-Frank Act, commonly known as the Volcker Rule, restricts the ability of banking entities, such as the Company, from: (i) engaging in "proprietary trading" and (ii) investing in or sponsoring certain types of funds ("Covered Funds"), subject to certain limited exceptions. The implementing regulation defines a Covered Fund to include certain investments such as collateralized loan obligation ("CLO") and collateralized debt obligation securities. The regulation also provides an exemption for CLOs meeting certain requirements. Compliance with the Volcker Rule is generally required by July 21, 2017. Given the Company's size and the scope of its activities, the Company does not believe the implementation of the Volcker Rule will have a significant effect on its financial statements.
Depositor Preference
The FDIA provides that, in the event of the "liquidation or other resolution" of an insured depository institution, the claims of depositors of the institution, including the claims of the FDIC as subrogee of insured depositors, and certain claims for administrative expenses of the FDIC as a receiver, will have priority over other general unsecured claims against the institution. If an insured depository institution fails, insured and uninsured depositors, along with the FDIC, will have priority in payment ahead of unsecured, non-deposit creditors, including the parent bank holding company, with respect to any extensions of credit they have made to such insured depository institution.
Consumer Protection and CFPB Supervision
The Dodd-Frank Act centralized responsibility for consumer financial protection by creating the CFPB, an independent agency charged with responsibility for implementing, enforcing, and examining compliance with federal consumer financial laws. The CFPB has examination authority over all banks and savings institutions with more than $10 billion in assets. As the Company is below this threshold, the OCC continues to exercise primary examination authority over the Bank with regard to compliance with federal consumer financial laws and regulations. Under the Dodd-Frank Act state attorneys general are empowered to enforce rules issued by the CFPB.
The Company is subject to federal consumer financial statutes and the regulations promulgated thereunder including, but not limited to:
|
●
|
the Truth-In-Lending Act, governing disclosures of credit terms to consumer borrowers;
|
|
●
|
the Equal Credit Opportunity Act ("ECOA"), prohibiting discrimination in connection with the extension of credit;
|
|
●
|
the Home Mortgage Disclosure Act ("HMDA"), requiring home mortgage lenders, including the Bank, to make available to the public expanded information regarding the pricing of home mortgage loans, including the "rate spread" between the annual percentage rate and the average prime offer rate for mortgage loans of a comparable type;
|
|
●
|
the Fair Credit Reporting Act ("FCRA"), governing the provision of consumer information to credit reporting agencies and the use of consumer information; and
|
|
●
|
the Fair Debt Collection Practices Act, governing the manner in which consumer debts may be collected by collection agencies.
|
On January 10, 2013, the CFPB issued a final rule implementing the ability-to-repay and qualified mortgage ("QM") provisions of the Truth in Lending Act, as amended by the Dodd-Frank Act (the "QM Rule"). The ability-to-repay provision requires creditors to make reasonable, good faith determinations that borrowers are able to repay their mortgages before extending the credit based on a number of factors and consideration of financial information about the borrower from reasonably reliable third-party documents. Under the Dodd-Frank Act and the QM Rule, loans meeting the definition of "qualified mortgage" are entitled to a presumption that the lender satisfied the ability-to-repay requirements. The presumption is a conclusive presumption/safe harbor for prime loans meeting the QM Rule requirements, and a rebuttable presumption for higher-priced/subprime loans meeting the QM Rule requirements. The definition of a "qualified mortgage" incorporates the statutory requirements, such as not allowing negative amortization or terms longer than 30 years. The QM Rule also adds an explicit maximum 43% debt-to-income ratio for borrowers if the loan is to meet the QM Rule definition, though some mortgages that meet GSE, FHA and VA underwriting guidelines may, for a period not to exceed seven years, meet the QM definition without being subject to the 43% debt-to-income limits. The QM Rule became effective January 10, 2014.
The Bank's failure to comply with any of the consumer financial laws can result in civil actions, regulatory enforcement action by the federal banking agencies and the U.S. Department of Justice.
USA PATRIOT Act
The Bank Secrecy Act ("BSA"), as amended by the Uniting and Strengthening America by Providing Appropriate Tools Required to Intercept and Obstruct Terrorism Act of 2001 ("USA PATRIOT Act"), imposes obligations on U.S. financial institutions, including banks and broker-dealer subsidiaries, to implement policies, procedures and controls which are reasonably designed to detect and report instances of money laundering and the financing of terrorism. The USA PATRIOT Act requires all financial institutions, including the Company and the Bank, to identify their customers, adopt formal and comprehensive anti-money laundering programs, scrutinize or prohibit altogether certain transactions of special concern, and be prepared to respond to inquiries from U.S. law enforcement agencies concerning their customers and their transactions. The USA PATRIOT Act also encourages information-sharing among financial institutions, regulators, and law enforcement authorities by providing an exemption from the privacy provisions of the GLB Act for financial institutions that comply with this provision. The effectiveness of a financial institution in combating money laundering activities is a factor to be considered in any application submitted by the financial institution under the Bank Merger Act, which applies to the Bank, or the BHC Act, which applies to the Company. Failure of a financial institution to maintain and implement adequate programs to combat money laundering and terrorist financing, or to comply with all of the relevant laws or regulations, could have serious legal, financial and reputational consequences. As of December 31, 2015, the Company and the Bank believe that they are in compliance with the BSA and the USA PATRIOT Act, and implementing regulations thereunder.
Office of Foreign Assets Control Regulation
The United States has imposed economic sanctions that affect transactions with designated foreign countries, nationals, and others. These are typically known as the "OFAC" rules based on their administration by the U.S. Treasury Department Office of Foreign Assets Control ("OFAC"). The OFAC-administered sanctions targeting countries take many different forms. Generally, they contain one or more of the following elements: (i) restrictions on trade with or investment in a sanctioned country, including prohibitions against direct or indirect imports from and exports to a sanctioned country and prohibitions on "U.S. persons" engaging in financial transactions relating to making investments in, or providing investment-related advice or assistance to, a sanctioned country; and (ii) a blocking of assets in which the government or specially designated nationals of the sanctioned country have an interest, by prohibiting transfers of property subject to U.S. jurisdiction (including property in the possession or control of U.S. persons). Blocked assets (property and bank deposits) cannot be paid out, withdrawn, set off, or transferred in any manner without a license from OFAC. Failure to comply with these sanctions could have serious legal and reputational consequences.
Financial Privacy
Section V of the Gramm-Leach-Bliley Act and its implementing regulations require all financial institutions, including the Company and the Bank, to adopt privacy policies, restrict the sharing of nonpublic customer data with nonaffiliated parties at the customer's request, and establish procedures and practices to protect customer data from unauthorized access. In addition, FCRA, as amended by the Fair and Accurate Credit Transactions Act of 2003 ("FACT Act"), includes many provisions affecting the Company, Bank, and/or their affiliates, including provisions concerning obtaining consumer reports, furnishing information to consumer reporting agencies, maintaining a program to prevent identity theft, sharing of certain information among affiliated companies, and other provisions. The FACT Act requires persons subject to FCRA to notify their customers if they report negative information about them to a credit bureau or if they are granted credit on terms less favorable than those generally available. The CFPB and the Federal Trade Commission ("FTC") have extensive rulemaking authority under the FACT Act, and the Company and the Bank are subject to the rules that have been promulgated under the FACT Act, including rules regarding limitations on affiliate marketing and implementation of programs to identify, detect and mitigate certain identity theft red flags. The Company has developed policies and procedures for itself and its subsidiaries, including the Bank, and believes it is in compliance with all privacy, information sharing, and notification provisions of the GLB Act and the FACT Act. The Bank is also subject to data security standards, privacy and data breach notice requirements, primarily those issued by the OCC.
Community Reinvestment Act of 1977
The Bank has a responsibility under the CRA, as implemented by OCC regulations, to help meet the credit needs of its communities, including low- and moderate-income neighborhoods. The CRA does not establish specific lending requirements or programs for financial institutions nor does it limit an institution's discretion to develop the types of products and services that it believes are best suited to its particular community, consistent with the CRA. Regulators periodically assess the Bank's record of compliance with the CRA. In addition, the ECOA and the Fair Housing Act prohibit discrimination in lending practices on the basis of characteristics specified in those statutes. The Bank's failure to comply with the CRA could, at a minimum, result in regulatory restrictions on its activities and the activities of the Company. The Bank's latest CRA rating was "Satisfactory."
Employees
At December 31, 2015, the Company had 1,721 full-time equivalent employees. The Company's employees are not presently represented by any collective bargaining group.
Available Information
The Company's website is http://www.nbtbancorp.com. The Company makes available free of charge through its website its annual reports on Form 10-K, quarterly reports on Form 10-Q, current reports on Form 8-K, and any amendments to those reports as soon as reasonably practicable after such material is electronically filed or furnished with the SEC pursuant to Section 13(a) or 15(d) of the Exchange Act. We also make available through our website other reports filed with or furnished to the SEC under the Exchange Act, including our proxy statements and reports filed by officers and directors under Section 16(a) of that Act, as well as our Code of Business Conduct and Ethics and other codes/committee charters. The references to our website do not constitute incorporation by reference of the information contained in the website and such information should not be considered part of this document.
Any materials we file with the SEC may be read and copied at the SEC's Public Reference Room at 100 F Street, N.E., Washington, DC, 20549. Information on the operation of the Public Reference Room may be obtained by calling the SEC at 1-800-SEC-0330. The SEC maintains an Internet site (http://www.sec.gov) that contains reports, proxy and information statements, and other information regarding issuers that file electronically with the SEC.
There are risks inherent to the Company's business. The material risks and uncertainties that management believes affect the Company are described below. Any of the following risks could affect the Company's financial condition and results of operations and could be material and/or adverse in nature. You should consider all of the following risks together with all of the other information in this Annual Report on Form 10-K.
Deterioration in local economic conditions may negatively impact our financial performance.
The Company's success depends primarily on the general economic conditions in central and upstate New York, northeastern Pennsylvania, southern New Hampshire, western Massachusetts, Vermont and the specific local markets in which the Company operates. Unlike larger national or other regional banks that are more geographically diversified, the Company provides banking and financial services to customers primarily in the upstate New York areas of Norwich, Syracuse, Oneonta, Amsterdam-Gloversville, Albany, Binghamton, Utica-Rome, Plattsburgh, Glens Falls and Ogdensburg-Massena, the northeastern Pennsylvania areas of Scranton, Wilkes-Barre and East Stroudsburg, Berkshire County, Massachusetts, southern New Hampshire, Vermont, and the greater Portland, Maine area. The local economic conditions in these areas have a significant impact on the demand for the Company's products and services as well as the ability of the Company's customers to repay loans, the value of the collateral securing loans and the stability of the Company's deposit funding sources.
As a lender with the majority of our loans secured by real estate or made to businesses in New York, Pennsylvania, Massachusetts, New Hampshire, Vermont, and Maine, a downturn in these local economies could cause significant increases in nonperforming loans, which could negatively impact our earnings. Declines in real estate values in our market areas could cause any of our loans to become inadequately collateralized, which would expose us to greater risk of loss. Additionally, a decline in real estate values could result in the decline of originations of such loans, as most of our loans, and the collateral securing our loans, are located in those areas.
Variations in interest rates may negatively affect our financial performance.
The Company's earnings and financial condition are largely dependent upon net interest income, which is the difference between interest earned from loans and investments and interest paid on deposits and borrowings. The narrowing of interest rate spreads could adversely affect the Company's earnings and financial condition. The Company cannot predict with certainty, or control, changes in interest rates. Regional and local economic conditions and the policies of regulatory authorities, including monetary policies of the FRB, affect interest income and interest expense. High interest rates could also affect the amount of loans that the Company can originate because higher rates could cause customers to apply for fewer mortgages or cause depositors to shift funds from accounts that have a comparatively lower cost to accounts with a higher cost. The Company may also experience customer attrition due to competitor pricing. If the cost of interest-bearing deposits increases at a rate greater than the yields on interest-earning assets increase, net interest income will be negatively affected. Changes in the asset and liability mix may also affect net interest income. Similarly, lower interest rates cause higher yielding assets to prepay and floating or adjustable rate assets to reset to lower rates. If the Company is not able to reduce its funding costs sufficiently, due to either competitive factors or the maturity schedule of existing liabilities, then the Company's net interest margin will decline.
Although management believes it has implemented effective asset and liability management strategies to mitigate the potential adverse effects of changes in interest rates on the Company's results of operations, any substantial or unexpected change in, or prolonged change in market interest rates could have a material adverse effect on the Company's financial condition and results of operations. See the section captioned "Net Interest Income" in Item 7. Management's Discussion and Analysis of Financial Condition and Results of Operations and Item 7A. Quantitative and Qualitative Disclosure About Market Risk located elsewhere in this report for further discussion related to the Company's management of interest rate risk.
Changes in the equity markets could materially affect the level of assets under management and the demand for other fee-based services.
Economic downturns could affect the volume of income from and demand for fee-based services. Revenues from the trust and benefit plan administration businesses depend in large part on the level of assets under management and administration. Market volatility that leads customers to liquidate investments, as well as lower asset values, can reduce our level of assets under management and administration and thereby decrease our investment management and administration revenues.
Our lending, and particularly our emphasis on commercial lending, exposes us to the risk of losses upon borrower default.
As of December 31, 2015, approximately 44% of the Company's loan portfolio consisted of commercial and industrial, agricultural, commercial construction and commercial real estate loans. These types of loans generally expose a lender to greater risk of non-payment and loss than residential real estate loans because repayment of the loans often depends on the successful operation of the property, the income stream of the borrowers and, for construction loans, the accuracy of the estimate of the property's value at completion of construction and the estimated cost of construction. Such loans typically involve larger loan balances to single borrowers or groups of related borrowers compared to residential real estate loans. Because the Company's loan portfolio contains a significant number of commercial and industrial, agricultural, construction and commercial real estate loans with relatively large balances, the deterioration of one or a few of these loans could cause a significant increase in nonperforming loans. An increase in nonperforming loans could result in a net loss of earnings from these loans, an increase in the provision for loan losses and/or an increase in loan charge-offs, all of which could have a material adverse effect on the Company's financial condition and results of operations. See the section captioned "Loans" in Item 7. Management's Discussion and Analysis of Financial Condition and Results of Operations located elsewhere in this report for further discussion related to commercial and industrial, agricultural, construction and commercial real estate loans.
If our allowance for loan losses is not sufficient to cover actual loan losses, our earnings will decrease.
The Company maintains an allowance for loan losses, which is an allowance established through a provision for loan losses charged to expense, that represents management's best estimate of probable losses that could be incurred within the existing portfolio of loans. The allowance, in the judgment of management, is necessary to reserve for estimated loan losses and risks inherent in the loan portfolio. The level of the allowance reflects management's continuing evaluation of industry concentrations; specific credit risks; loan loss experience; current loan portfolio quality; present economic, political, environmental, and regulatory conditions and unidentified losses inherent in the current loan portfolio. The determination of the appropriate level of the allowance for loan losses inherently involves a high degree of subjectivity and requires the Company to make significant estimates of current credit risks and future trends, all of which may undergo material changes. Changes in economic conditions affecting borrowers, new information regarding existing loans, identification of additional problem loans and other factors, both within and outside of the Company's control, may require an increase in the allowance for loan losses. In addition, bank regulatory agencies periodically review the Company's allowance for loan losses and may require an increase in the provision for loan losses or the recognition of further loan charge-offs, based on judgments different than those of management. In addition, if charge-offs in future periods exceed the allowance for loan losses, the Company will need additional provisions to increase the allowance for loan losses. These potential increases in the allowance for loan losses would result in a decrease in net income and, possibly, capital, and may have a material adverse effect on the Company's financial condition and results of operations. See the section captioned "Risk Management – Credit Risk" in Item 7. Management's Discussion and Analysis of Financial Condition and Results of Operations located elsewhere in this report for further discussion related to the Company's process for determining the appropriate level of the allowance for loan losses.
Strong competition within our industry and market area could hurt our performance and slow our growth.
The Company faces substantial competition in all areas of its operations from a variety of different competitors, many of which are larger and may have more financial resources. Such competitors primarily include national, regional, and community banks within the various markets in which the Company operates. Additionally, various banks continue to enter or have announced plans to enter the market areas in which the Company currently operates. The Company also faces competition from many other types of financial institutions, including, without limitation, savings and loans, credit unions, finance companies, brokerage firms, insurance companies, and other financial intermediaries. The financial services industry could become even more competitive as a result of legislative, regulatory and technological changes and continued consolidation. Technology has lowered barriers to entry and made it possible for non-banks to offer products and services traditionally provided by banks, such as automatic transfer and automatic payment systems. Many of the Company's competitors have fewer regulatory constraints and may have lower cost structures. Additionally, due to their size, many competitors may be able to achieve economies of scale and, as a result, may offer a broader range of products and services as well as better pricing for those products and services than the Company can.
The Company's ability to compete successfully depends on a number of factors, including, among other things:
| ● | the ability to develop, maintain and build upon long-term customer relationships based on top quality service, high ethical standards and safe, sound assets; |
| ● | the ability to expand the Company's market position; |
| ● | the scope, relevance and pricing of products and services offered to meet customer needs and demands; |
| ● | the rate at which the Company introduces new products and services relative to its competitors; |
| ● | customer satisfaction with the Company's level of service; |
| ● | industry and general economic trends; and |
| ● | the ability to attract and retain talented employees. |
Failure to perform in any of these areas could significantly weaken the Company's competitive position, which could adversely affect the Company's growth and profitability, which, in turn, could have a material adverse effect on the Company's financial condition and results of operations.
We are subject to extensive government regulation and supervision, which may interfere with our ability to conduct our business and may negatively impact our financial results.
We, primarily through the Bank and certain non-bank subsidiaries, are subject to extensive federal and state regulation and supervision. Banking regulations are primarily intended to protect depositors' funds, the Federal Deposit Insurance Fund and the safety and soundness of the banking system as a whole, not shareholders. These regulations affect the Company's lending practices, capital structure, investment practices, dividend policy and growth, among other things. Congress and federal regulatory agencies continually review banking laws, regulations and policies for possible changes. Changes to statutes, regulations or regulatory policies, including changes in interpretation or implementation of statutes, regulations or policies, could affect the Company in substantial and unpredictable ways. Such changes could subject the Company to additional costs, limit the types of financial services and products the Company may offer, and/or limit the pricing the Company may charge on certain banking services, among other things. Since the global financial crisis, financial institutions generally have been subject to increased scrutiny from regulatory authorities. Recent changes to the legal and regulatory framework governing our operations, including the passage and continued implementation of the Dodd-Frank Wall Street Reform and Consumer Protection Act of 2010 (the "Dodd-Frank Act"), have drastically revised the laws and regulations under which we operate. In general, bank regulatory agencies have increased their focus on risk management and customer compliance, and we expect this focus to continue. Additional compliance requirements are likely and can be costly to implement. Compliance personnel and resources may increase our costs of operations and adversely impact our earnings.
Failure to comply with laws, regulations or policies could result in sanctions by regulatory agencies, civil money penalties and/or reputation damage, which could have a material adverse effect on our business, financial condition and results of operations. While the Company has policies and procedures designed to prevent any such violations, there can be no assurance that such violations will not occur. See the section captioned "Supervision and Regulation" in Item 1. Business of this report for further information.
We will be subject to heightened regulatory requirements if we exceed $10 billion in total consolidated assets.
Based on our historical growth rates and current size, it is possible that our total assets could exceed $10 billion dollars in the near future. The Dodd-Frank Act and its implementing regulations impose enhanced supervisory requirements on bank holding companies with more than $10 billion in total consolidated assets. For bank holding companies with more than $10 billion but less than $50 billion in total consolidated assets such requirements include, among other things:
|
●
|
compliance with the FRB's annual stress testing requirements;
|
| ● |
increased capital, leverage, liquidity and risk management standards;
|
| ● |
examinations by the CFPB for compliance with federal consumer financial protection laws and regulations;
|
|
●
|
limits on interchange fees on debit cards; and
|
| ● |
changes to the FDIC deposit insurance assessments calculation that would increase our insurance premium costs.
|
Federal financial regulators may require us to take actions to prepare for compliance before we exceed $10 billion in total consolidated assets. Our regulators may consider our preparation for compliance with these regulatory requirements when examining our operations or considering any request for regulatory approval. We may, therefore, incur compliance costs before we reach $10 billion in total consolidated assets and may be required to maintain the additional compliance procedures even if we do not grow at the anticipated rate or at all.
Failure to comply with these new requirements may negatively impact the results of our operations and financial condition. To ensure compliance, we will be required to investment significant resources, which may necessitate hiring additional personnel and implementing additional internal controls. These additional compliance costs may have a material adverse effect on our business, results of operations and financial condition.
The Company is subject to liquidity risk which could adversely affect net interest income and earnings
The purpose of the Company's liquidity management is to meet the cash flow obligations of its customers for both deposits and loans. The primary liquidity measurement the Company utilizes is called basic surplus, which captures the adequacy of the Company's access to reliable sources of cash relative to the stability of its funding mix of average liabilities. This approach recognizes the importance of balancing levels of cash flow liquidity from short and long-term securities with the availability of dependable borrowing sources which can be accessed when necessary. However, competitive pressure on deposit pricing could result in a decrease in the Company's deposit base or an increase in funding costs. In addition, liquidity will come under additional pressure if loan growth exceeds deposit growth. These scenarios could lead to a decrease in the Company's basic surplus measure below the minimum policy level of 5%. To manage this risk, the Company has the ability to purchase brokered time deposits, borrow against established borrowing facilities with other banks (Federal funds), and enter into repurchase agreements with investment companies. Depending on the level of interest rates, the Company's net interest income, and therefore earnings, could be adversely affected. See the section captioned "Liquidity Risk" in Item 7.
Our ability to service our debt, pay dividends and otherwise pay our obligations as they come due is substantially dependent on capital distributions from our subsidiaries.
The Company is a separate and distinct legal entity from its subsidiaries. It receives substantially all of its revenue from dividends from its subsidiaries. These dividends are the principal source of funds to pay dividends on the Company's common stock and interest and principal on the Company's debt. Various federal and/or state laws and regulations limit the amount of dividends that the Bank may pay to the Company. Also, the Company's right to participate in a distribution of assets upon a subsidiary's liquidation or reorganization is subject to the prior claims of the subsidiary's creditors. In the event the Bank is unable to pay dividends to the Company, the Company may not be able to service debt, pay obligations or pay dividends on the Company's common stock. The inability to receive dividends from the Bank could have a material adverse effect on the Company's business, financial condition and results of operations.
A breach of information security, including as a result of cyber attacks, could disrupt our business and impact our earnings.
We depend upon data processing, communication and information exchange on a variety of computing platforms and networks, and over the internet. In addition, we rely on the services of a variety of vendors to meet our data processing and communication needs. Despite existing safeguards, we cannot be certain that all of our systems are free from vulnerability to attack or other technological difficulties or failures. If information security is breached or difficulties or failures occur, despite the controls we and our third party vendors have instituted, information can be lost or misappropriated, resulting in financial loss or costs to us, reputational harm or damages to others. Such costs or losses could exceed the amount of insurance coverage, if any, which would adversely affect our earnings.
We continually encounter technological change and the failure to understand and adapt to these changes could hurt our business.
The financial services industry is continually undergoing rapid technological change with frequent introductions of new technology-driven products and services. The effective use of technology increases efficiency and enables financial institutions to better serve customers and to reduce costs. The Company's future success depends, in part, upon its ability to address the needs of its customers by using technology to provide products and services that will satisfy customer demands, as well as to create additional efficiencies in the Company's operations. Many of the Company's competitors have substantially greater resources to invest in technological improvements. The Company may not be able to effectively implement new technology-driven products and services or be successful in marketing these products and services to its customers. Failure to successfully keep pace with technological changes affecting the financial services industry could have a material adverse impact on the Company's business and, in turn, the Company's financial condition and results of operations.
The possibility of the economy's return to recessionary conditions and the possibility of further turmoil or volatility in the financial markets would likely have an adverse effect on our business, financial position and results of operations.
The economy in the United States and globally as experienced volatility in recent years and may continue to do so for the foreseeable future. There can be no assurance that economic conditions will not worsen. Unfavorable or uncertain economic conditions can be caused by declines in economic growth, business activity, or investor or business confidence, limitations on the availability or increases in the cost of credit and capital, increases in inflation or interest rates, the timing and impact of changing governmental policies, natural disasters, terrorist attacks, acts of war, or a combination of these or other factors. A worsening of business and economic conditions recovery could have adverse effects on our business, including the following:
| ● | investors may have less confidence in the equity markets in general and in financial services industry stocks in particular, which could place downward pressure on the Company's stock price and resulting market valuation; |
| ● | economic and market developments may further affect consumer and business confidence levels and may cause declines in credit usage and adverse changes in payment patterns, causing increases in delinquencies and default rates; |
| ● | the Company's ability to assess the creditworthiness of its customers may be impaired if the models and approaches the Company uses to select, manage, and underwrite its customers become less predictive of future behaviors; |
| ● | the Company could suffer decreases in demand for loans or other financial products and services or decreased deposits or other investments in accounts with the Company; |
| ● | competition in the financial services industry could intensify as a result of the increasing consolidation of financial services companies in connection with current market conditions, or otherwise; and; |
| ● | the value of loans and other assets, or collateral securing loans may decrease. |
We are subject to other-than-temporary impairment risk which could negatively impact our financial performance.
The Company recognizes an impairment charge when the decline in the fair value of equity, debt securities and cost-method investments below their cost basis are judged to be other-than-temporary. Significant judgment is used to identify events or circumstances that would likely have a significant adverse effect on the future use of the investment. The Company considers various factors in determining whether an impairment is other-than-temporary, including the severity and duration of the impairment, forecasted recovery, the financial condition and near-term prospects of the investee, and whether the Company has the intent to sell and whether it is more likely than not it will be forced to sell the security in question. Information about unrealized gains and losses is subject to changing conditions. The values of securities with unrealized gains and losses will fluctuate, as will the values of securities that we identify as potentially distressed. Our current evaluation of other-than-temporary impairments reflects our intent to hold securities for a reasonable period of time sufficient for a forecasted recovery of fair value. However, our intent to hold certain of these securities may change in future periods as a result of facts and circumstances impacting a specific security. If our intent to hold a security with an unrealized loss changes, and we do not expect the security to fully recover prior to the expected time of disposition, we will write down the security to its fair value in the period that our intent to hold the security changes.
The process of evaluating the potential impairment of goodwill and other intangibles is highly subjective and requires significant judgment. The Company estimates the expected future cash flows of its various businesses and determines the carrying value of these businesses. The Company exercises judgment in assigning and allocating certain assets and liabilities to these businesses. The Company then compares the carrying value, including goodwill and other intangibles, to the discounted future cash flows. If the total of future cash flows is less than the carrying amount of the assets, an impairment loss is recognized based on the excess of the carrying amount over the fair value of the assets. Estimates of the future cash flows associated with the assets are critical to these assessments. Changes in these estimates based on changed economic conditions or business strategies could result in material impairment charges and therefore have a material adverse impact on the Company's financial condition and performance.
The risks presented by acquisitions could adversely affect our financial condition and results of operations.
The business strategy of the Company has included and may continue to include growth through acquisition. Any future acquisitions will be accompanied by the risks commonly encountered in acquisitions. These risks may include, among other things:
|
●
|
our ability to realize anticipated cost savings;
|
|
●
|
the difficulty of integrating operations and personnel, the loss of key employees;
|
| ● |
the potential disruption of our or the acquired company's ongoing business in such a way that could result in decreased revenues, the inability of our management to maximize our financial and strategic position;
|
| ● |
the inability to maintain uniform standards, controls, procedures and policies; and
|
| ● |
the impairment of relationships with the acquired company's employees and customers as a result of changes in ownership and management.
|
We cannot provide any assurance that we will be successful in overcoming these risks or any other problems encountered in connection with acquisitions. Our inability to overcome these risks could have an adverse effect on the achievement of our business strategy and results of operations.
Our controls and procedures may fail or be circumvented, which may result in a material adverse effect on our business.
Management regularly reviews and updates our internal controls, disclosure controls and procedures, and corporate governance policies and procedures. Any system of controls, however well designed and operated, is based in part on certain assumptions and can provide only reasonable, not absolute, assurances that the objectives of the system are met. Any failure or circumvention of the controls and procedures or failure to comply with regulations related to controls and procedures could have a material adverse effect on our business, results of operations and financial condition.
We are exposed to risk of environmental liabilities with respect to properties to which we obtain title.
A significant portion of our loan portfolio at December 31, 2015 was secured by real estate. In the course of our business, we may foreclose and take title to real estate, and could be subject to environmental liabilities with respect to these properties. We may be held liable to a government entity or to third parties for property damage, personal injury, investigation and clean-up costs incurred by these parties in connection with environmental contamination, or may be required to clean up hazardous or toxic substances, or chemical releases at a property. The costs associated with investigation and remediation activities could be substantial. In addition, if we are the owner or former owner of a contaminated site, we may be subject to common law claims by third parties based on damages and costs resulting from environmental contamination emanating from the property. These costs and claims could adversely affect our business, results of operations and prospects.
We may be adversely affected by the soundness of other financial institutions including the FHLB of New York.
Our ability to engage in routine funding transactions could be adversely affected by the actions and commercial soundness of other financial institutions. Financial services companies are interrelated as a result of trading, clearing, counterparty or other relationships. We have exposure to many different industries and counterparties, and we routinely execute transactions with counterparties in the financial services industry, including brokers and dealers, commercial banks, investment banks, mutual and hedge funds, and other institutional clients. As a result, defaults by, or even rumors or questions about, one or more financial services companies, or the financial services industry generally, have led to market-wide liquidity problems and could lead to losses or defaults by us or by other institutions. Many of these transactions expose us to credit risk in the event of default of our counterparty or client. In addition, our credit risk may be exacerbated if the collateral held by us cannot be realized or is liquidated at prices not sufficient to recover the full amount of the loan or derivative exposure due us. There is no assurance that any such losses would not materially and adversely affect our business, financial condition or results of operations.
The Company owns common stock of FHLB of New York in order to qualify for membership in the FHLB system, which enables it to borrow funds under the FHLB of New York's advance program. The carrying value and fair market value of our FHLB of New York common stock was $21.5 million as of December 31, 2015. There are 11 branches of the FHLB, including New York, which are jointly liable for the consolidated obligations of the FHLB system. To the extent that one FHLB branch cannot meet its obligations to pay its share of the system's debt, other FHLB branches can be called upon to make the payment. Any adverse effects on the FHLB of New York could adversely affect the value of our investment in its common stock and negatively impact our results of operations.
Provisions of our certificate of incorporation and bylaws, as well as Delaware law and certain banking laws, could delay or prevent a takeover of us by a third party.
Provisions of the Company's certificate of incorporation and bylaws, the corporate law of the State of Delaware and state and federal banking laws, including regulatory approval requirements, could delay, defer or prevent a third party from acquiring the Company, despite the possible benefit to the Company's stockholders, or otherwise adversely affect the market price of the Company's common stock. These provisions include: supermajority voting requirements for certain business combinations and advance notice requirements for nominations for election to the Company's board of directors and for proposing matters that stockholders may act on at stockholder meetings. In addition, the Company is subject to Delaware law, which among other things prohibits the Company from engaging in a business combination with any interested stockholder for a period of three years from the date the person became an interested stockholder unless certain conditions are met. These provisions may discourage potential takeover attempts, discouraging bids for the Company's common stock at a premium over market price or adversely affect the market price of, and the voting and other rights of the holders of the Company's common stock. These provisions could also discourage proxy contests and make it more difficult for you and other stockholders to elect directors other than candidates nominated by the Board.
Trading activity in the Company's common stock could result in material price fluctuations.
The market price of the Company's common stock may fluctuate significantly in response to a number of factors including, but not limited to:
| ● | Changes in securities analysts' expectations of financial performance; |
| ● | Volatility of stock market prices and volumes; |
| ● | Incorrect information or speculation; |
| ● | Changes in industry valuations; |
| ● | Variations in operating results from general expectations; |
| ● | Actions taken against the Company by various regulatory agencies; |
| ● | Changes in authoritative accounting guidance by the Financial Accounting Standards Board or other regulatory agencies; |
| ● | Changes in general domestic economic conditions such as inflation rates, tax rates, unemployment rates, labor and healthcare cost trend rates, recessions, and changing government policies, laws and regulations; and |
| ● | Severe weather, natural disasters, acts of war or terrorism and other external events |
None.
The Company owns its headquarters located at 52 South Broad Street, Norwich, New York 13815. The Company operated the following community banking branches and ATMs as of December 31, 2015:
|
County
|
Branches
|
ATMs
|
County
|
Branches
|
ATMs
|
||||||||||||
|
New York
|
Pennsylvania
|
||||||||||||||||
|
Albany
|
4
|
5
|
Lackawanna
|
13
|
16
|
||||||||||||
|
Broome
|
8
|
10
|
Luzerne
|
4
|
6
|
||||||||||||
|
Chenango
|
11
|
13
|
Monroe
|
4
|
5
|
||||||||||||
|
Clinton
|
3
|
2
|
Pike
|
2
|
2
|
||||||||||||
|
Cortland
|
5
|
7
|
Susquehanna
|
5
|
7
|
||||||||||||
|
Delaware
|
5
|
4
|
Wayne
|
3
|
4
|
||||||||||||
|
Essex
|
3
|
5
|
|||||||||||||||
|
Franklin
|
1
|
1
|
New Hampshire
|
||||||||||||||
|
Fulton
|
5
|
6
|
Cheshire
|
1
|
0
|
||||||||||||
|
Greene
|
2
|
2
|
Hillsborough
|
2
|
2
|
||||||||||||
|
Hamilton
|
1
|
1
|
Rockingham
|
2
|
2
|
||||||||||||
|
Herkimer
|
2
|
1
|
|||||||||||||||
|
Madison
|
4
|
6
|
Vermont
|
||||||||||||||
|
Montgomery
|
5
|
4
|
Chittenden
|
3
|
3
|
||||||||||||
|
Oneida
|
7
|
11
|
Rutland
|
1
|
1
|
||||||||||||
|
Onondaga
|
11
|
13
|
|||||||||||||||
|
Oswego
|
4
|
6
|
Massachusetts
|
||||||||||||||
|
Otsego
|
8
|
12
|
Berkshire
|
6
|
6
|
||||||||||||
|
Rensselaer
|
1
|
1
|
|||||||||||||||
|
Saratoga
|
4
|
4
|
Maine
|
||||||||||||||
|
Schenectady
|
2
|
2
|
Cumberland
|
1
|
0
|
||||||||||||
|
Schoharie
|
4
|
4
|
|||||||||||||||
|
Saint Lawrence
|
5
|
5
|
|||||||||||||||
|
Tioga
|
1
|
1
|
|||||||||||||||
|
Warren
|
2
|
3
|
|||||||||||||||
|
Total
|
155
|
183
|
|||||||||||||||
The Company leases 74 of the above listed branches from third parties. The Company owns all other banking premises. The Company believes that its offices are sufficient for its present operations. All of the above ATMs are owned by the Company.
There are no material legal proceedings, other than ordinary routine litigation incidental to the business, to which the Company or any of its subsidiaries is a party or of which any of their property is subject.
None.
PART II
ITEM 5. Market for Registrant's Common Equity, Related Stockholder matters and Issuer Purchases of Equity Securities
Market Information
The common stock of the Company, par value $0.01 per share (the "Common Stock"), is quoted on the Nasdaq Global Select Market under the symbol "NBTB." The following table sets forth the high and low sales prices and dividends declared for the Common Stock for the periods indicated:
|
|
High
|
Low
|
Dividend
|
|||||||||
|
2015
|
||||||||||||
|
1st quarter
|
$
|
26.46
|
$
|
22.97
|
$
|
0.21
|
||||||
|
2nd quarter
|
26.89
|
23.75
|
0.22
|
|||||||||
|
3rd quarter
|
27.72
|
24.91
|
0.22
|
|||||||||
|
4th quarter
|
30.52
|
25.58
|
0.22
|
|||||||||
|
2014
|
||||||||||||
|
1st quarter
|
$
|
25.81
|
$
|
22.35
|
$
|
0.21
|
||||||
|
2nd quarter
|
25.18
|
21.67
|
0.21
|
|||||||||
|
3rd quarter
|
24.81
|
22.50
|
0.21
|
|||||||||
|
4th quarter
|
26.88
|
22.22
|
0.21
|
|||||||||
The closing price of the Common Stock on February 12, 2016 was $25.79.
As of February 12, 2016, there were 6,728 shareholders of record of Common Stock. No unregistered securities were sold by the Company during the year ended December 31, 2015.
Stock Performance Graph
The following stock performance graph compares the cumulative total stockholder return (i.e., price change, reinvestment of cash dividends and stock dividends received) on our Common Stock against the cumulative total return of the NASDAQ Stock Market (U.S. Companies) Index and the KBW Regional Bank Index (Peer Group). The stock performance graph assumes that $100 was invested on December 31, 2010. The graph further assumes the reinvestment of dividends into additional shares of the same class of equity securities at the frequency with which dividends are paid on such securities during the relevant fiscal year. The yearly points marked on the horizontal axis correspond to December 31 of that year. We calculate each of the referenced indices in the same manner. All are market-capitalization-weighted indices, so companies judged by the market to be more important (i.e., more valuable) count for more in all indices.
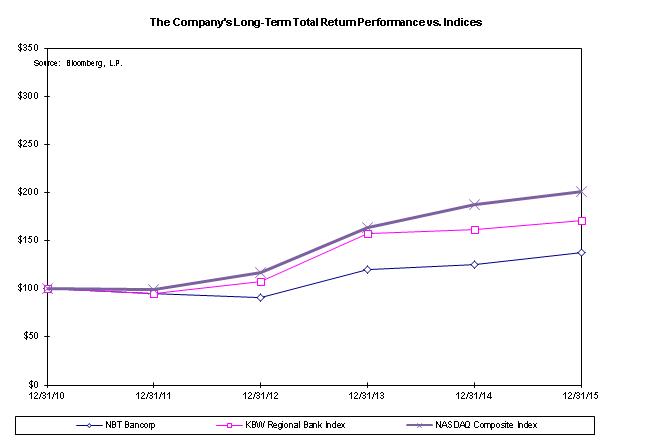
|
|
Period Ending
|
|||||||||||||||||||||||
|
Index
|
12/31/10
|
12/31/11
|
12/31/12
|
12/31/13
|
12/31/14
|
12/31/15
|
||||||||||||||||||
|
NBT Bancorp
|
$
|
100.00
|
$
|
95.13
|
$
|
90.42
|
$
|
119.67
|
$
|
125.64
|
$
|
137.78
|
||||||||||||
|
KBW Regional Bank Index
|
$
|
100.00
|
$
|
94.87
|
$
|
107.38
|
$
|
157.54
|
$
|
161.29
|
$
|
170.94
|
||||||||||||
|
NASDAQ Composite Index
|
$
|
100.00
|
$
|
99.23
|
$
|
116.79
|
$
|
163.64
|
$
|
187.85
|
$
|
201.24
|
||||||||||||
Source: Bloomberg, L.P.
Dividends
We depend primarily upon dividends from our subsidiaries for a substantial part of our revenue. Accordingly, our ability to pay dividends to our shareholders depends primarily upon the receipt of dividends or other capital distributions from our subsidiaries. Payment of dividends to the Company from the Bank is subject to certain regulatory and other restrictions. Under OCC regulations, the Bank may pay dividends to the Company without prior regulatory approval so long as it meets its applicable regulatory capital requirements before and after payment of such dividends and its total dividends do not exceed its net income to date over the calendar year plus retained net income over the preceding two years. At December 31, 2015, the Bank was in compliance with all applicable minimum capital requirements and had the ability to pay dividends of $81.9 million to the Company without the prior approval of the OCC.
If the capital of the Company is diminished by depreciation in the value of its property or by losses, or otherwise, to an amount less than the aggregate amount of the capital represented by the issued and outstanding stock of all classes having a preference upon the distribution of assets, no dividends may be paid out of net profits until the deficiency in the amount of capital represented by the issued and outstanding stock of all classes having a preference upon the distribution of assets has been repaired. See the section captioned "Supervision and Regulation" in Item 1. Business and Note 15 – Stockholders' Equity in the notes to consolidated financial statements is included in Item 8. Financial Statements and Supplementary Data, which are located elsewhere in this report.
Stock Repurchase
The Company purchased 1,047,152 shares of its common stock during the year ended December 31, 2015 at an average price of $25.59 per share under previously announced plans. As of December 31, 2015, there were 952,848 shares available for repurchase under the repurchase plan that was announced on July 27, 2015, which expires on December 31, 2016. The Company did not purchase any shares of its common stock during the fourth quarter of 2015.
The following summary of financial and other information about the Company is derived from the Company's audited consolidated financial statements for each of the last five fiscal years ended December 31 and should be read in conjunction with Item 7. and the Company's consolidated financial statements and accompanying notes, included elsewhere in this report:
|
Year ended December 31,
|
||||||||||||||||||||
|
(In thousands, except share and per share data)
|
2015
|
2014
|
2013 (1)
|
2012 (2)
|
2011
|
|||||||||||||||
|
Interest, fee and dividend income
|
$
|
273,224
|
$
|
275,081
|
$
|
268,723
|
$
|
239,397
|
$
|
239,997
|
||||||||||
|
Interest expense
|
20,616
|
23,203
|
30,644
|
35,194
|
39,721
|
|||||||||||||||
|
Net interest income
|
252,608
|
251,878
|
238,079
|
204,203
|
200,276
|
|||||||||||||||
|
Provision for loan and lease losses
|
18,285
|
19,539
|
22,424
|
20,269
|
20,737
|
|||||||||||||||
|
Noninterest income excluding securities
|
||||||||||||||||||||
|
gains
|
115,394
|
125,935
|
101,789
|
86,728
|
80,161
|
|||||||||||||||
|
Securities gains, net
|
3,087
|
92
|
1,426
|
599
|
150
|
|||||||||||||||
|
Noninterest expense
|
236,176
|
246,063
|
228,927
|
193,887
|
180,676
|
|||||||||||||||
|
Income before income taxes
|
116,628
|
112,303
|
89,943
|
77,374
|
79,174
|
|||||||||||||||
|
Net income
|
76,425
|
75,074
|
61,747
|
54,558
|
57,901
|
|||||||||||||||
|
Per common share
|
||||||||||||||||||||
|
Basic earnings
|
$
|
1.74
|
$
|
1.71
|
$
|
1.47
|
$
|
1.63
|
$
|
1.72
|
||||||||||
|
Diluted earnings
|
1.72
|
1.69
|
1.46
|
1.62
|
1.71
|
|||||||||||||||
|
Cash dividends paid
|
0.87
|
0.84
|
0.81
|
0.80
|
0.80
|
|||||||||||||||
|
Book value at year-end
|
20.31
|
19.69
|
18.77
|
17.24
|
16.23
|
|||||||||||||||
|
Tangible book value at year-end (3)
|
13.79
|
13.22
|
12.09
|
12.23
|
11.70
|
|||||||||||||||
|
Average diluted common shares outstanding
|
44,389
|
44,395
|
42,351
|
33,719
|
33,924
|
|||||||||||||||
|
Securities available for sale, at fair value
|
$
|
1,174,544
|
$
|
1,013,171
|
$
|
1,364,881
|
$
|
1,147,999
|
$
|
1,244,619
|
||||||||||
|
Securities held to maturity, at amortized cost
|
471,031
|
454,361
|
117,283
|
60,563
|
70,811
|
|||||||||||||||
|
Loans and leases
|
5,883,133
|
5,595,271
|
5,406,795
|
4,277,616
|
3,800,203
|
|||||||||||||||
|
Allowance for loan and lease losses
|
63,018
|
66,359
|
69,434
|
69,334
|
71,334
|
|||||||||||||||
|
Assets
|
8,262,646
|
7,807,340
|
7,652,175
|
6,042,259
|
5,598,406
|
|||||||||||||||
|
Deposits
|
6,604,843
|
6,299,605
|
5,890,224
|
4,784,349
|
4,367,149
|
|||||||||||||||
|
Borrowings
|
674,124
|
548,943
|
866,061
|
605,855
|
627,358
|
|||||||||||||||
|
Stockholders' equity
|
882,004
|
864,181
|
816,569
|
582,273
|
538,110
|
|||||||||||||||
|
Key ratios
|
||||||||||||||||||||
|
Return on average assets
|
0.96
|
%
|
0.97
|
%
|
0.85
|
%
|
0.93
|
%
|
1.06
|
%
|
||||||||||
|
Return on average equity
|
8.70
|
8.84
|
8.09
|
9.72
|
10.73
|
|||||||||||||||
|
Average equity to average assets
|
10.98
|
10.95
|
10.50
|
9.55
|
9.90
|
|||||||||||||||
|
Net interest margin
|
3.50
|
3.61
|
3.66
|
3.86
|
4.09
|
|||||||||||||||
|
Dividend payout ratio
|
49.92
|
49.16
|
55.48
|
49.38
|
46.78
|
|||||||||||||||
|
Tier 1 leverage
|
9.44
|
9.39
|
8.93
|
8.54
|
8.74
|
|||||||||||||||
|
Common equity tier 1 capital ratio
|
||||||||||||||||||||
|
Tier 1 risk-based capital
|
11.73
|
12.32
|
11.74
|
11.00
|
11.56
|
|||||||||||||||
|
Total risk-based capital
|
12.74
|
13.50
|
12.99
|
12.25
|
12.81
|
|||||||||||||||
| (1) | Includes the impact of the acquisition of Alliance Financial Corporation ("Alliance") on March 8, 2013. |
| (2) | Includes the impact of the acquisition of Hampshire First Bank on June 8, 2012. |
|
(3)
|
Tangible book value calculation:
|
|
Year ended December 31,
|
||||||||||||||||||||
|
(In thousands, except per share data)
|
2015
|
2014
|
2013
|
2012
|
2011
|
|||||||||||||||
|
Stockholders' equity
|
$
|
882,004
|
$
|
864,181
|
$
|
816,569
|
$
|
582,273
|
$
|
538,110
|
||||||||||
|
Intangibles
|
283,222
|
283,951
|
290,554
|
169,335
|
150,222
|
|||||||||||||||
|
Tangible equity
|
598,782
|
580,229
|
526,015
|
412,938
|
387,888
|
|||||||||||||||
|
Diluted common shares outstanding
|
43,431
|
43,896
|
43,513
|
33,775
|
33,157
|
|||||||||||||||
|
Tangible book value
|
$
|
13.79
|
$
|
13.22
|
$
|
12.09
|
$
|
12.23
|
$
|
11.70
|
||||||||||
|
Selected Quarterly Financial Data
|
|
|
|
|
|
|
|
|
||||||||||||||||||||||||
|
2015
|
2014
|
|||||||||||||||||||||||||||||||
|
(Dollars in thousands, except share and per share data)
|
Fourth
|
Third
|
Second
|
First
|
Fourth
|
Third
|
Second
|
First
|
||||||||||||||||||||||||
|
Interest, fee and dividend income
|
$
|
68,771
|
$
|
69,500
|
$
|
67,727
|
$
|
67,226
|
$
|
69,414
|
$
|
69,134
|
$
|
68,456
|
$
|
68,077
|
||||||||||||||||
|
Interest expense
|
5,259
|
5,255
|
5,042
|
5,060
|
5,390
|
5,371
|
5,882
|
6,560
|
||||||||||||||||||||||||
|
Net interest income
|
63,512
|
64,245
|
62,685
|
62,166
|
64,024
|
63,763
|
62,574
|
61,517
|
||||||||||||||||||||||||
|
Provision for loan and lease losses
|
5,779
|
4,966
|
3,898
|
3,642
|
6,892
|
4,885
|
4,166
|
3,596
|
||||||||||||||||||||||||
|
Noninterest income excluding net securities gains
|
29,427
|
31,258
|
28,189
|
26,520
|
27,013
|
26,639
|
46,013
|
26,270
|
||||||||||||||||||||||||
|
Net securities gains
|
3,044
|
3
|
26
|
14
|
33
|
38
|
14
|
7
|
||||||||||||||||||||||||
|
Noninterest expense
|
60,619
|
59,891
|
57,964
|
57,702
|
56,743
|
69,067
|
62,736
|
57,517
|
||||||||||||||||||||||||
|
Net income
|
19,127
|
19,851
|
19,281
|
18,166
|
18,513
|
10,912
|
27,640
|
18,009
|
||||||||||||||||||||||||
|
Basic earnings per share
|
$
|
0.44
|
$
|
0.45
|
$
|
0.44
|
$
|
0.41
|
$
|
0.42
|
$
|
0.25
|
$
|
0.63
|
$
|
0.41
|
||||||||||||||||
|
Diluted earnings per share
|
$
|
0.43
|
$
|
0.45
|
$
|
0.43
|
$
|
0.41
|
$
|
0.42
|
$
|
0.25
|
$
|
0.62
|
$
|
0.41
|
||||||||||||||||
|
Annualized net interest margin
|
3.42
|
%
|
3.48
|
%
|
3.51
|
%
|
3.60
|
%
|
3.61
|
%
|
3.61
|
%
|
3.60
|
%
|
3.63
|
%
|
||||||||||||||||
|
Annualized return on average assets
|
0.93
|
%
|
0.97
|
%
|
0.97
|
%
|
0.94
|
%
|
0.94
|
%
|
0.55
|
%
|
1.43
|
%
|
0.95
|
%
|
||||||||||||||||
|
Annualized return on average equity
|
8.58
|
%
|
8.97
|
%
|
8.81
|
%
|
8.46
|
%
|
8.46
|
%
|
5.06
|
%
|
13.12
|
%
|
8.81
|
%
|
||||||||||||||||
|
Average diluted common shares outstanding
|
44,072
|
44,262
|
44,530
|
44,642
|
44,535
|
44,405
|
44,364
|
44,296
|
||||||||||||||||||||||||
Forward Looking Statements
Certain statements in this filing and future filings by the Company with the SEC, in the Company’s press releases or other public or shareholder communications, or in oral statements made with the approval of an authorized executive officer, contain forward-looking statements, as defined in the Private Securities Litigation Reform Act. These statements may be identified by the use of phrases such as “anticipate,” “believe,” “expect,” “forecasts,” “projects,” “will,” “can,” “would,” “should,” “could,” “may,” or other similar terms. There are a number of factors, many of which are beyond the Company’s control that could cause actual results to differ materially from those contemplated by the forward looking statements. Factors that may cause actual results to differ materially from those contemplated by such forward-looking statements include, among others, the following possibilities: (1) local, regional, national and international economic conditions and the impact they may have on the Company and its customers and the Company’s assessment of that impact; (2) changes in the level of non-performing assets and charge-offs; (3) changes in estimates of future reserve requirements based upon the periodic review thereof under relevant regulatory and accounting requirements; (4) the effects of and changes in trade and monetary and fiscal policies and laws, including the interest rate policies of the Federal Reserve Board; (5) inflation, interest rate, securities market and monetary fluctuations; (6) political instability; (7) acts of war or terrorism; (8) the timely development and acceptance of new products and services and perceived overall value of these products and services by users; (9) changes in consumer spending, borrowings and savings habits; (10) changes in the financial performance and/or condition of the Company’s borrowers; (11) technological changes; (12) acquisitions and integration of acquired businesses; (13) the ability to increase market share and control expenses; (14) changes in the competitive environment among financial holding companies; (15) the effect of changes in laws and regulations (including laws and regulations concerning taxes, banking, securities and insurance) with which the Company and its subsidiaries must comply including those under the Dodd-Frank Act; (16) the effect of changes in accounting policies and practices, as may be adopted by the regulatory agencies, as well as the Public Company Accounting Oversight Board, the Financial Accounting Standards Board and other accounting standard setters; (17) changes in the Company’s organization, compensation and benefit plans; (18) the costs and effects of legal and regulatory developments including the resolution of legal proceedings or regulatory or other governmental inquiries and the results of regulatory examinations or reviews; (19) greater than expected costs or difficulties related to the integration of new products and lines of business; and (20) the Company’s success at managing the risks involved in the foregoing items.
The Company cautions readers not to place undue reliance on any forward-looking statements, which speak only as of the date made, and advises readers that various factors including, but not limited to, those described above, could affect the Company’s financial performance and could cause the Company’s actual results or circumstances for future periods to differ materially from those anticipated or projected.
Except as required by law, the Company does not undertake, and specifically disclaims any obligations to, publicly release any revisions that may be made to any forward-looking statements to reflect the occurrence of anticipated or unanticipated events or circumstances after the date of such statements.
General
The financial review which follows focuses on the factors affecting the consolidated financial condition and results of operations of the Company and its wholly owned subsidiaries, the Bank, NBT Financial Services and NBT Holdings during 2015 and, in summary form, the preceding two years. Collectively, the Registrant and its subsidiaries are referred to herein as “the Company.” Net interest margin is presented in this discussion on a fully taxable equivalent (FTE) basis. Average balances discussed are daily averages unless otherwise described. The audited consolidated financial statements and related notes as of December 31, 2015 and 2014 and for each of the years in the three-year period ended December 31, 2015 should be read in conjunction with this review. Amounts in prior period consolidated financial statements are reclassified whenever necessary to conform to the 2015 presentation.
Critical Accounting Policies
The Company has identified policies as being critical because they require management to make particularly difficult, subjective and/or complex judgments about matters that are inherently uncertain and because of the likelihood that materially different amounts would be reported under different conditions or using different assumptions. These policies relate to the allowance for loan losses, pension accounting, provision for income taxes and impairment of goodwill and intangible assets.
Management of the Company considers the accounting policy relating to the allowance for loan losses to be a critical accounting policy given the uncertainty in evaluating the level of the allowance required to cover credit losses inherent in the loan portfolio and the material effect that such judgments can have on the results of operations. While management’s current evaluation of the allowance for loan losses indicates that the allowance is adequate, under adversely different conditions or assumptions, the allowance may need to be increased. For example, if historical loan loss experience significantly worsened or if current economic conditions significantly deteriorated, additional provision for loan losses would be required to increase the allowance. In addition, the assumptions and estimates used in the internal reviews of the Company’s nonperforming loans and potential problem loans have a significant impact on the overall analysis of the adequacy of the allowance for loan losses. While management has concluded that the current evaluation of collateral values is reasonable under the circumstances, if collateral values were significantly lower, the Company’s allowance for loan loss policy would also require additional provision for loan losses.
Management is required to make various assumptions in valuing its pension assets and liabilities. These assumptions include the expected rate of return on plan assets, the discount rate, and the rate of increase in future compensation levels. Changes to these assumptions could impact earnings in future periods. The Company takes into account the plan asset mix, funding obligations, and expert opinions in determining the various rates used to estimate pension expense. The Company also considers the Citigroup Pension Liability Index, market interest rates and discounted cash flows in setting the appropriate discount rate. In addition, the Company reviews expected inflationary and merit increases to compensation in determining the rate of increase in future compensation levels.
The Company is subject to examinations from various taxing authorities. Such examinations may result in challenges to the tax return treatment applied by the Company to specific transactions. Management believes that the assumptions and judgments used to record tax-related assets or liabilities have been appropriate. Should tax laws change or the taxing authorities determine that management’s assumptions were inappropriate, an adjustment may be required which could have a material effect on the Company’s results of operations.
As a result of acquisitions, the Company has acquired goodwill and identifiable intangible assets. Goodwill represents the cost of acquired companies in excess of the fair value of net assets at the acquisition date. Goodwill is evaluated at least annually or when business conditions suggest that an impairment may have occurred. Goodwill will be reduced to its carrying value through a charge to earnings if impairment exists. Core deposits and other identifiable intangible assets are amortized to expense over their estimated useful lives. The determination of whether or not impairment exists is based upon discounted cash flow modeling techniques that require management to make estimates regarding the amount and timing of expected future cash flows. It also requires them to select a discount rate that reflects the current return requirements of the market in relation to present risk-free interest rates, required equity market premiums and Company-specific risk indicators, all of which are susceptible to change based on changes in economic conditions and other factors. Future events or changes in the estimates used to determine the carrying value of goodwill and identifiable intangible assets could have a material impact on the Company’s results of operations.
The Company’s policies on the allowance for loan losses, pension accounting, provision for income taxes, goodwill and intangible assets are disclosed in Note 1 to the consolidated financial statements. A more detailed description of the allowance for loan losses is included in the section captioned “Risk Management – Credit Risk” in Item 7. Management’s Discussion and Analysis of Financial Condition and Results of Operations of this Form 10-K. All significant pension accounting assumptions, income tax assumptions, and intangible asset assumptions and detail are disclosed in Notes 13, 12 and 7 to the consolidated financial statements, respectively. All accounting policies are important, and as such, the Company encourages the reader to review each of the policies included in Note 1 to obtain a better understanding of how the Company’s financial performance is reported.
Non-GAAP Measures
This Annual Report on Form 10-K contains financial information determined by methods other than in accordance with accounting principles generally accepted in the United States of America (GAAP). These measures adjust GAAP measures to exclude the effects of acquisition related intangible amortization expense on earnings and equity as well as providing a fully taxable equivalent yield on securities and loans. Where non-GAAP disclosures are used in this Annual Report on Form 10-K, the comparable GAAP measure, as well as a reconciliation to the comparable GAAP measure, is provided in the accompanying tables. Management believes that these non-GAAP measures provide useful information that is important to an understanding of the operating results of the Company’s core business as well as provide information standard in the financial institution industry. Non-GAAP measures should not be considered a substitute for financial measures determined in accordance with GAAP and investors should consider the Company’s performance and financial condition as reported under GAAP and all other relevant information when assessing the performance or financial condition of the Company.
Overview
Significant factors management reviews to evaluate the Company’s operating results and financial condition include, but are not limited to: net income and earnings per share, return on assets and equity, net interest margin, noninterest income, operating expenses, asset quality indicators, loan and deposit growth, capital management, liquidity and interest rate sensitivity, enhancements to customer products and services, technology advancements, market share and peer comparisons. The following information should be considered in connection with the Company's results for the fiscal year ended December 31, 2015:
| ● | Reported net income for 2015 was $76.4 million, the highest in the Company's history, and up from $75.1 million in 2014. |
| ● | Net interest margin for 2015 declined 11 basis points as a result of the continued low rate environment on loans and investments. |
| ● | Asset quality indicators showed stability or improvement from last year: |
| ▪ | Nonperforming loans to total loans improved to 0.64% at December 31, 2015 from 0.82% at December 31, 2014; |
| ▪ | Past due loans to total loans improved to 0.62% at December 31, 2015 from 0.69% at December 31, 2014; |
| ▪ | Net charge-offs to average loans improved to 0.38% for 2015 from 0.41% in 2014. |
| ● | Noninterest income was down 6.0% from last year driven primarily by the $19.4 million gain on the sale of our ownership interest in Springstone, LLC ("Springstone") recorded in 2014 as compared to the $4.2 million gain recorded in 2015 from the same. |
| ● | Continued the sale of conforming residential real estate mortgages, taking advantage of favorable interest rate conditions when possible; |
| ● | Increased efforts to grow noninterest income with focus on organic growth of our wealth management businesses; and |
| ● | Continued demand deposit growth strategies resulting in 8.7% growth from 2014 to 2015. |
The Company reported net income of $76.4 million or $1.72 per diluted share for 2015, up 1.8% from net income of $75.1 million or $1.69 per diluted share for 2014. The provision for loan losses totaled $18.3 million for the year ended December 31, 2015, down $1.3 million, or 6.4%, from $19.5 million for the year ended December 31, 2014. The Company continued to experience pressure on net interest income in 2015 as low rates continued to have the effect of causing many assets to prepay or to be redeemed. Net interest income was $252.6 million for the year ended December 31, 2015, up $0.7 million from 2014. Fully taxable equivalent (“FTE”) net interest margin was 3.50% for the year ended December 31, 2015, down from 3.61% for the year ended December 31, 2014.
2016 Outlook
The Company’s 2015 earnings reflected the Company’s continued ability to manage through the existing and near future economic conditions and challenges in the financial services industry, while investing in the Company’s future. The Company believes effects of the economic crisis still exist and, as a result, there will be certain challenges faced in 2016. Significant items that may have an impact on 2016 results include:
| ● | The Company expects that it will experience some additional margin compression from the 2015 fourth quarter net interest margin of 3.42%. We expect that payments representing interest and principal on currently outstanding loans and investments will continue to be reinvested at rates that are lower than the rates currently outstanding on those loans and investments. In addition, deposit and borrowing rates are historically low and there are minimal opportunities for them to be lowered. Furthermore, the industry as a whole must focus on asset growth to increase interest income, thereby creating general pricing pressure in the entire industry. |
| ● | Compliance with regulatory mandates could continue to negatively impact certain fee generating products as well as increase costs to comply, which could negatively impact noninterest income, noninterest expense and earnings. |
| ● | Competitive pressure on deposits could result in an increase in interest expense if interest rates begin to rise. |
| ● | The Company’s 2016 outlook is subject to factors in addition to those identified above and those risks and uncertainties that could impact the Company’s future results are explained in ITEM 1A. RISK FACTORS. |
Asset/Liability Management
The Company attempts to maximize net interest income and net income, while actively managing its liquidity and interest rate sensitivity through the mix of various core deposit products and other sources of funds, which in turn fund an appropriate mix of earning assets. The changes in the Company’s asset mix and sources of funds, and the resulting impact on net interest income, on a fully tax equivalent basis, are discussed below. The following table includes the condensed consolidated average balance sheet, an analysis of interest income/expense and average yield/rate for each major category of earning assets and interest bearing liabilities on a taxable equivalent basis. Interest income for tax-exempt securities and loans has been adjusted to a taxable-equivalent basis using the statutory Federal income tax rate of 35%.
|
Average Balances and Net Interest Income
|
||||||||||||||||||||||||||||||||||||
|
2015
|
2014
|
2013
|
||||||||||||||||||||||||||||||||||
|
(Dollars in thousands)
|
Average
Balance
|
Interest |
Yield/
Rate
|
Average
Balance
|
Interest |
Yield/
Rate
|
Average
Balance
|
Interest |
Yield/
Rate
|
|||||||||||||||||||||||||||
|
ASSETS
|
||||||||||||||||||||||||||||||||||||
|
Short-term interest bearing accounts
|
$
|
10,157
|
$
|
33
|
0.33
|
%
|
$
|
4,344
|
$
|
28
|
0.65
|
%
|
$
|
30,522
|
$
|
116
|
0.38
|
%
|
||||||||||||||||||
|
Securities available for sale (1)
|
1,059,284
|
20,888
|
1.97
|
%
|
1,258,999
|
25,760
|
2.05
|
%
|
1,349,887
|
27,357
|
2.03
|
%
|
||||||||||||||||||||||||
|
Securities held to maturity (1)
|
459,589
|
11,296
|
2.46
|
%
|
233,465
|
6,558
|
2.81
|
%
|
88,193
|
3,692
|
4.19
|
%
|
||||||||||||||||||||||||
|
Investment in FRB and FHLB Banks
|
33,044
|
1,712
|
5.18
|
%
|
39,290
|
2,005
|
5.10
|
%
|
37,998
|
1,771
|
4.66
|
%
|
||||||||||||||||||||||||
|
Loans and leases (2)
|
5,743,860
|
242,587
|
4.22
|
%
|
5,528,015
|
244,162
|
4.42
|
%
|
5,106,607
|
239,572
|
4.69
|
%
|
||||||||||||||||||||||||
|
Total interest earning assets
|
$
|
7,305,934
|
$
|
276,516
|
3.78
|
%
|
$
|
7,064,113
|
$
|
278,513
|
3.94
|
%
|
$
|
6,613,207
|
$
|
272,508
|
4.12
|
%
|
||||||||||||||||||
|
Other assets
|
691,583
|
691,934
|
653,432
|
|||||||||||||||||||||||||||||||||
|
Total assets
|
$
|
7,997,517
|
$
|
7,756,047
|
$
|
7,266,639
|
||||||||||||||||||||||||||||||
|
LIABILITIES AND STOCKHOLDERS' EQUITY
|
||||||||||||||||||||||||||||||||||||
|
Money market deposit accounts
|
$
|
1,582,078
|
$
|
3,351
|
0.21
|
%
|
$
|
1,457,770
|
$
|
2,532
|
0.17
|
%
|
$
|
1,343,801
|
$
|
2,004
|
0.15
|
%
|
||||||||||||||||||
|
NOW deposit accounts
|
987,638
|
515
|
0.05
|
%
|
949,759
|
509
|
0.05
|
%
|
882,629
|
1,468
|
0.17
|
%
|
||||||||||||||||||||||||
|
Savings deposits
|
1,071,753
|
651
|
0.06
|
%
|
1,020,974
|
760
|
0.07
|
%
|
929,226
|
789
|
0.08
|
%
|
||||||||||||||||||||||||
|
Time deposits
|
960,188
|
9,740
|
1.01
|
%
|
1,015,748
|
9,837
|
0.97
|
%
|
1,069,228
|
12,029
|
1.13
|
%
|
||||||||||||||||||||||||
|
Total interest bearing deposits
|
$
|
4,601,657
|
$
|
14,257
|
0.31
|
%
|
$
|
4,444,251
|
$
|
13,638
|
0.31
|
%
|
$
|
4,224,884
|
$
|
16,290
|
0.39
|
%
|
||||||||||||||||||
|
Short-term borrowings
|
339,885
|
783
|
0.23
|
%
|
382,451
|
845
|
0.22
|
%
|
280,848
|
515
|
0.18
|
%
|
||||||||||||||||||||||||
|
Trust preferred debentures
|
101,196
|
2,221
|
2.19
|
%
|
101,196
|
2,165
|
2.14
|
%
|
96,536
|
2,084
|
2.16
|
%
|
||||||||||||||||||||||||
|
Long-term debt
|
130,705
|
3,355
|
2.57
|
%
|
224,556
|
6,555
|
2.92
|
%
|
338,697
|
11,755
|
3.47
|
%
|
||||||||||||||||||||||||
|
Total interest bearing liabilities
|
$
|
5,173,443
|
$
|
20,616
|
0.40
|
%
|
$
|
5,152,454
|
$
|
23,203
|
0.45
|
%
|
$
|
4,940,965
|
$
|
30,644
|
0.62
|
%
|
||||||||||||||||||
|
Demand deposits
|
1,857,027
|
1,670,188
|
1,484,193
|
|||||||||||||||||||||||||||||||||
|
Other liabilities
|
88,937
|
83,940
|
78,455
|
|||||||||||||||||||||||||||||||||
|
Stockholders' equity
|
878,110
|
849,465
|
763,026
|
|||||||||||||||||||||||||||||||||
|
Total liabilities and stockholders' equity
|
$
|
7,997,517
|
$
|
7,756,047
|
$
|
7,266,639
|
||||||||||||||||||||||||||||||
|
Net interest income (FTE)
|
255,900
|
255,310
|
241,864
|
|||||||||||||||||||||||||||||||||
|
Interest rate spread
|
3.38
|
%
|
3.49
|
%
|
3.50
|
%
|
||||||||||||||||||||||||||||||
|
Net interest margin
|
3.50
|
%
|
3.61
|
%
|
3.66
|
%
|
||||||||||||||||||||||||||||||
|
Taxable equivalent adjustment
|
3,292
|
3,432
|
3,785
|
|||||||||||||||||||||||||||||||||
|
Net interest income
|
$
|
252,608
|
$
|
251,878
|
$
|
238,079
|
||||||||||||||||||||||||||||||
|
1.
|
Securities are shown at average amortized cost.
|
|
2.
|
For purposes of these computations, nonaccrual loans are included in the average loan balances outstanding. The interest collected thereon is included in interest income based upon the characteristics of the related loans.
|
2015 OPERATING RESULTS AS COMPARED TO 2014 OPERATING RESULTS
Net Interest Income
Net interest income was $252.6 million for the year ended December 31, 2015, up $0.7 million from 2014. Fully taxable equivalent (“FTE”) net interest margin was 3.50% for the year ended December 31, 2015, down from 3.61% for the year ended December 31, 2014. Average interest earning assets were up $241.8 million, or 3.4%, for the year ended December 31, 2015 as compared to 2014. This increase from last year was driven primarily by organic loan growth. Yields on earning assets decreased from 3.94% during 2014 to 3.78% for 2015, more than offsetting the growth in earning assets, resulting in a 0.7% decrease in interest income for the year ended December 31, 2015 as compared to the year ended December 31, 2014. The yield compression was driven by a 20 basis-point decrease in loan yields from 2014 to 2015. Average interest bearing liabilities increased $21.0 million, or 0.4%, from the year ended December 31, 2014 to the year ended December 31, 2015. Total average deposits increased $344.2 million, or 5.6%, for the year ended December 31, 2015 as compared to last year driven primarily by an 11.2% increase in non-interest bearing demand deposits, as well as increases in money market deposit accounts and savings deposits in 2015. This increase was partially offset by a decrease in average long-term borrowings of $93.9 million for the year ended December 31, 2015 as compared to last year due to the debt restructuring completed during the third quarter of 2014, which resulted in the prepayment of $165.0 million of long-term debt. In addition, average short-term borrowings decreased $42.6 million for the year ended December 31, 2015 as compared to last year driven by deposit growth. The rates paid on interest bearing liabilities decreased by 5 basis-points for the year ended December 31, 2015 as compared to 2014. This decrease resulted primarily from a shift in deposits into lower cost core deposits as well as the aforementioned debt restructuring. The following table presents changes in interest income, on a FTE basis, and interest expense attributable to changes in volume (change in average balance multiplied by prior year rate), changes in rate (change in rate multiplied by prior year volume), and the net change in net interest income. The net change attributable to the combined impact of volume and rate has been allocated to each in proportion to the absolute dollar amounts of change.
|
Analysis of Changes in Taxable Equivalent Net Interest Income
|
||||||||||||||||||||||||
|
Increase (Decrease)
|
Increase (Decrease)
|
|||||||||||||||||||||||
|
2015 over 2014
|
2014 over 2013
|
|||||||||||||||||||||||
|
(In thousands)
|
Volume
|
Rate
|
Total
|
Volume
|
Rate
|
Total
|
||||||||||||||||||
|
Short-term interest-bearing accounts
|
$
|
24
|
$
|
(19
|
)
|
$
|
5
|
$
|
(138
|
)
|
$
|
50
|
$
|
(88
|
)
|
|||||||||
|
Securities available for sale
|
(3,966
|
)
|
(906
|
)
|
(4,872
|
)
|
(1,857
|
)
|
260
|
(1,597
|
)
|
|||||||||||||
|
Securities held to maturity
|
5,649
|
(911
|
)
|
4,738
|
4,414
|
(1,548
|
)
|
2,866
|
||||||||||||||||
|
Investment in FRB and FHLB Banks
|
(323
|
)
|
30
|
(293
|
)
|
63
|
171
|
234
|
||||||||||||||||
|
Loans and leases
|
9,337
|
(10,912
|
)
|
(1,575
|
)
|
19,093
|
(14,503
|
)
|
4,590
|
|||||||||||||||
|
Total interest income
|
10,721
|
(12,718
|
)
|
(1,997
|
)
|
21,575
|
(15,570
|
)
|
6,005
|
|||||||||||||||
|
Money market deposit accounts
|
229
|
590
|
819
|
179
|
349
|
528
|
||||||||||||||||||
|
NOW deposit accounts
|
20
|
(14
|
)
|
6
|
104
|
(1,063
|
)
|
(959
|
)
|
|||||||||||||||
|
Savings deposits
|
36
|
(145
|
)
|
(109
|
)
|
74
|
(103
|
)
|
(29
|
)
|
||||||||||||||
|
Time deposits
|
(552
|
)
|
455
|
(97
|
)
|
(580
|
)
|
(1,612
|
)
|
(2,192
|
)
|
|||||||||||||
|
Short-term borrowings
|
(97
|
)
|
35
|
(62
|
)
|
211
|
119
|
330
|
||||||||||||||||
|
Junior subordinated debt
|
-
|
56
|
56
|
100
|
(19
|
)
|
81
|
|||||||||||||||||
|
Long-term debt
|
(2,483
|
)
|
(717
|
)
|
(3,200
|
)
|
(3,534
|
)
|
(1,666
|
)
|
(5,200
|
)
|
||||||||||||
|
Total interest expense
|
(2,847
|
)
|
260
|
(2,587
|
)
|
(3,446
|
)
|
(3,995
|
)
|
(7,441
|
)
|
|||||||||||||
|
Change in FTE net interest income
|
$
|
13,568
|
$
|
(12,978
|
)
|
$
|
590
|
$
|
25,021
|
$
|
(11,575
|
)
|
$
|
13,446
|
||||||||||
Loans and Corresponding Interest and Fees on Loans
The average balance of loans increased by approximately $215.8 million, or 3.9%, from 2014 to 2015. The yield on average loans decreased from 4.42% in 2014 to 4.22% in 2015, as loan rates declined due to the continued low rate environment in 2015. Interest income from loans decreased 0.6%, from $244.2 million in 2014 to $242.6 million in 2015. This decrease was due to the decrease in yields, partially offset by the increase in average loan balances.
Total loans increased $287.9 million, or 5.1%, from December 31, 2014 to December 31, 2015. Increases in residential real estate mortgages, commercial real estate loans, and consumer loans were the primary drivers of the increase in total loans from 2014 as the Company experienced strong originations in 2015 in the upstate New York and Vermont markets.
The following table reflects the loan portfolio by major categories as of December 31 for the years indicated:
|
Composition of Loan and Lease Portfolio
|
||||||||||||||||||||
|
December 31,
|
||||||||||||||||||||
|
(In thousands)
|
2015
|
2014
|
2013
|
2012
|
2011
|
|||||||||||||||
|
Residential real estate mortgages
|
$
|
1,196,780
|
$
|
1,115,715
|
$
|
1,041,502
|
$
|
651,105
|
$
|
581,502
|
||||||||||
|
Commercial
|
1,159,089
|
1,144,761
|
1,180,995
|
964,297
|
847,059
|
|||||||||||||||
|
Commercial real estate
|
1,430,618
|
1,334,984
|
1,218,988
|
1,040,600
|
863,594
|
|||||||||||||||
|
Consumer
|
1,568,204
|
1,430,216
|
1,345,395
|
1,046,333
|
938,412
|
|||||||||||||||
|
Home equity
|
528,442
|
569,595
|
619,915
|
575,281
|
569,636
|
|||||||||||||||
|
Total loans and leases
|
$
|
5,883,133
|
$
|
5,595,271
|
$
|
5,406,795
|
$
|
4,277,616
|
$
|
3,800,203
|
||||||||||
Residential real estate mortgages consist primarily of loans secured by first or second deeds of trust on primary residences. Loans in the commercial and agricultural categories, including commercial and agricultural real estate mortgages, consist primarily of short-term and/or floating rate loans made to small and medium-sized entities. Consumer loans consist primarily of indirect installment credit to individuals, of which approximately 75% is secured by automobiles and other personal property including marine, recreational vehicles and manufactured housing. Consumer loans also consist of direct installment loans to individuals secured by similar collateral. Indirect installment loans represent $1.4 billion of total consumer loans at December 31, 2015, or 91%. Installment credit for automobiles accounts for approximately 75% of total consumer loans. Although automobile loans have generally been originated through dealers, all applications submitted through dealers are subject to the Company’s normal underwriting and loan approval procedures. Real estate construction and development loans include commercial construction and development and residential construction loans. Commercial construction loans are for small and medium sized office buildings and other commercial properties and residential construction loans are primarily for projects located in upstate New York and northeastern Pennsylvania.
Risks associated with the commercial real estate portfolio include the ability of borrowers to pay interest and principal during the loan’s term, as well as the ability of the borrowers to refinance at the end of the loan term.
The following table, Maturities and Sensitivities of Certain Loans to Changes in Interest Rates, summarizes the maturities of the commercial and agricultural and real estate construction and development loan portfolios and the sensitivity of those loans to interest rate fluctuations at December 31, 2015. Scheduled repayments are reported in the maturity category in which the contractual payment is due.
|
Maturities and Sensitivities of Certain Loans to Changes in Interest Rates
|
||||||||||||||||
|
Remaining maturity at December 31, 2015
|
||||||||||||||||
|
(In thousands)
|
Within One Year
|
After One Year But Within Five Years
|
After Five Years
|
Total
|
||||||||||||
|
Floating/adjustable rate
|
||||||||||||||||
|
Commercial, commercial real estate, agricultural, and agricultural real estate
|
$
|
414,391
|
$
|
390,063
|
$
|
956,839
|
$
|
1,761,293
|
||||||||
|
Fixed rate
|
||||||||||||||||
|
Commercial, commercial real estate, agricultural, and agricultural real estate
|
70,854
|
387,427
|
370,133
|
828,414
|
||||||||||||
|
Total
|
$
|
485,245
|
$
|
777,490
|
$
|
1,326,972
|
$
|
2,589,707
|
||||||||
Securities and Corresponding Interest and Dividend Income
The average balance of securities available for sale decreased $199.7 million, or 15.9%, from 2014 to 2015. The yield on average securities available for sale was 1.97% for 2015 compared to 2.05% in 2014.
The average balance of securities held to maturity increased from $233.5 million in 2014 to $459.6 million in 2015. At December 31, 2015, securities held to maturity were comprised primarily of tax-exempt municipal securities. The yield on securities held to maturity decreased from 2.81% in 2014 to 2.46% in 2015.
During the third quarter of 2014, the Company transferred approximately $340 million in securities from the available for sale portfolio to the held to maturity portfolio to mitigate the impact of volatility of interest rate changes on tangible book value.
The average balance of FRB and FHLB stock decreased to $33.0 million in 2015 from $39.3 million in 2014. The yield from investments in FRB and FHLB banks increased from 5.10% in 2014 to 5.18% in 2015.
|
Securities Portfolio
|
||||||||||||||||||||||||
|
As of December 31,
|
||||||||||||||||||||||||
|
2015
|
2014
|
2013
|
||||||||||||||||||||||
|
Amortized
|
Fair
|
Amortized
|
Fair
|
Amortized
|
Fair
|
|||||||||||||||||||
|
(In thousands)
|
Cost
|
Value
|
Cost
|
Value
|
Cost
|
Value
|
||||||||||||||||||
|
Securities available for sale
|
||||||||||||||||||||||||
|
U.S. Treasury
|
$
|
-
|
$
|
-
|
$
|
23,041
|
$
|
23,111
|
$
|
43,279
|
$
|
43,616
|
||||||||||||
|
Federal Agency
|
312,580
|
311,272
|
332,193
|
329,914
|
285,880
|
278,915
|
||||||||||||||||||
|
State & Municipal
|
31,208
|
31,637
|
37,035
|
37,570
|
113,435
|
113,665
|
||||||||||||||||||
|
Mortgage-backed
|
406,277
|
409,896
|
356,557
|
364,727
|
359,590
|
364,164
|
||||||||||||||||||
|
Collateralized mortgage obligations
|
405,635
|
404,971
|
240,074
|
242,129
|
565,200
|
549,528
|
||||||||||||||||||
|
Other securities
|
13,637
|
16,768
|
12,818
|
15,720
|
12,367
|
14,993
|
||||||||||||||||||
|
Total securities available for sale
|
$
|
1,169,337
|
$
|
1,174,544
|
$
|
1,001,718
|
$
|
1,013,171
|
$
|
1,379,751
|
$
|
1,364,881
|
||||||||||||
|
Securities held to maturity
|
||||||||||||||||||||||||
|
Mortgage-backed
|
$
|
10,043
|
$
|
10,031
|
$
|
755
|
$
|
868
|
$
|
953
|
$
|
1,081
|
||||||||||||
|
Collateralized mortgage obligations
|
272,550
|
272,401
|
317,628
|
317,597
|
62,025
|
57,456
|
||||||||||||||||||
|
State & Municipal
|
188,438
|
190,708
|
135,978
|
136,529
|
54,305
|
54,739
|
||||||||||||||||||
|
Total securities held to maturity
|
$
|
471,031
|
$
|
473,140
|
$
|
454,361
|
$
|
454,994
|
$
|
117,283
|
$
|
113,276
|
||||||||||||
Our mortgage backed securities, U.S. agency notes, and CMOs are all “prime/conforming” and are guaranteed by Fannie Mae, Freddie Mac, the FHLB, the Federal Farm Credit Banks, or Ginnie Mae (“GNMA”). GNMA securities are considered equivalent to U.S. Treasury securities, as they are backed by the full faith and credit of the U.S. government. Currently, there are no securities backed by subprime mortgages in our investment portfolio.
The following tables set forth information with regard to contractual maturities of debt securities at December 31, 2015:
|
(In thousands)
|
Amortized cost
|
Estimated fair value
|
Weighted Average Yield
|
|||||||||
|
Debt securities classified as available for sale
|
||||||||||||
|
Within one year
|
$
|
3,462
|
$
|
3,502
|
3.83
|
%
|
||||||
|
From one to five years
|
348,921
|
348,512
|
1.70
|
%
|
||||||||
|
From five to ten years
|
147,139
|
149,185
|
2.66
|
%
|
||||||||
|
After ten years
|
656,178
|
656,577
|
2.57
|
%
|
||||||||
|
$
|
1,155,700
|
$
|
1,157,776
|
|||||||||
|
Debt securities classified as held to maturity
|
||||||||||||
|
Within one year
|
$
|
43,624
|
$
|
43,641
|
1.53
|
%
|
||||||
|
From one to five years
|
14,179
|
14,226
|
3.94
|
%
|
||||||||
|
From five to ten years
|
113,799
|
115,691
|
2.98
|
%
|
||||||||
|
After ten years
|
299,429
|
299,582
|
1.74
|
%
|
||||||||
|
$
|
471,031
|
$
|
473,140
|
|||||||||
Funding Sources and Corresponding Interest Expense
The Company utilizes traditional deposit products such as time, savings, NOW, money market, and demand deposits as its primary source for funding. Other sources, such as short-term FHLB advances, federal funds purchased, securities sold under agreements to repurchase, brokered time deposits, and long-term FHLB borrowings are utilized as necessary to support the Company’s growth in assets and to achieve interest rate sensitivity objectives. The average balance of interest-bearing liabilities increased $21.0 million from 2014, and totaled $5.2 billion in 2015. The rate paid on interest-bearing liabilities decreased from 0.45% in 2014 to 0.40% in 2015. This decrease in rates, partially offset by an increase in average balances, caused a decrease in interest expense of $2.6 million, or 11.1%, from $23.2 million in 2014 to $20.6 million in 2015.
Deposits
Average interest bearing deposits increased $157.4 million, or 3.5%, from 2014 to 2015, due primarily to organic deposit growth. Average money market deposits increased $124.3 million or 8.5% during 2015 when compared to 2014. Average NOW accounts increased $37.9 million or 4.0% during 2015 as compared to 2014. The average balance of savings accounts increased $50.8 million or 5.0% during 2015 when compared to 2014. These increases were partially offset by a decrease in average time deposits, which decreased $55.6 million, or 5.5%, from 2014 to 2015. The average balance of demand deposits increased $186.8 million, or 11.2%, during 2015 when compared to 2014. This growth in demand deposits was driven principally by increases in accounts from retail, municipal, and commercial customers.
The rate paid on average interest-bearing deposits was 0.31% for 2015 and 2014. The rate paid for money market deposit accounts increased from 0.17% during 2014 to 0.21% during 2015. The rate paid for time deposits increased from 0.97% during 2014 to 1.01% during 2015. The rate paid for savings deposits decreased from 0.07% during 2014 to 0.06% during 2015.
The following table presents the maturity distribution of time deposits of $100,000 or more at December 31:
|
Maturity Distribution of Time Deposits of $100,000 or More
|
||||||||
|
|
December 31,
|
|||||||
|
(In thousands)
|
2015
|
2014
|
||||||
|
Within three months
|
$
|
46,570
|
$
|
57,811
|
||||
|
After three but within twelve months
|
80,674
|
86,553
|
||||||
|
After one but within three years
|
58,834
|
71,938
|
||||||
|
Over three years
|
55,425
|
53,543
|
||||||
|
Total
|
$
|
241,503
|
$
|
269,845
|
||||
Borrowings
Average short-term borrowings decreased to $339.9 million in 2015 from $382.5 million in 2014. The average rate paid on short-term borrowings increased from 0.22% in 2014 to 0.23% in 2015. Average long-term debt decreased from $224.6 million in 2014 to $130.7 million in 2015. This decrease was due to the long-term debt restructure completed in the third quarter of 2014 which resulted in the prepayment of $165.0 million of long-term debt.
The average balance of junior subordinated debt remained at $101.2 million in 2015. The average rate paid for junior subordinated debt in 2015 was 2.19%, up slightly from 2.14% in 2014.
Short-term borrowings consist of Federal funds purchased and securities sold under repurchase agreements, which generally represent overnight borrowing transactions, and other short-term borrowings, primarily FHLB advances, with original maturities of one year or less. The Company has unused lines of credit and access to brokered deposits available for short-term financing of approximately $2.0 billion and $1.8 billion at December 31, 2015 and 2014, respectively. Securities collateralizing repurchase agreements are held in safekeeping by non-affiliated financial institutions and are under the Company’s control. Long-term debt, which is comprised primarily of FHLB advances, are collateralized by the FHLB stock owned by the Company, certain of its mortgage-backed securities and a blanket lien on its residential real estate mortgage loans.
Noninterest Income
Noninterest income is a significant source of revenue for the Company and an important factor in the Company’s results of operations. The following table sets forth information by category of noninterest income for the years indicated:
|
Years ended December 31,
|
||||||||||||
|
(In thousands)
|
2015
|
2014
|
2013
|
|||||||||
|
Insurance and other financial services revenue
|
$
|
24,211
|
$
|
24,517
|
$
|
24,447
|
||||||
|
Service charges on deposit accounts
|
17,056
|
17,941
|
19,307
|
|||||||||
|
ATM and debit card fees
|
18,248
|
17,135
|
15,558
|
|||||||||
|
Retirement plan administration fees
|
14,146
|
12,129
|
11,497
|
|||||||||
|
Trust
|
19,026
|
18,950
|
16,682
|
|||||||||
|
Bank owned life insurance income
|
4,334
|
5,349
|
3,793
|
|||||||||
|
Net securities gains
|
3,087
|
92
|
1,426
|
|||||||||
|
Gain on the sale of Springstone investment
|
4,179
|
19,401
|
-
|
|||||||||
|
Other
|
14,194
|
10,513
|
10,505
|
|||||||||
|
Total noninterest income
|
$
|
118,481
|
$
|
126,027
|
$
|
103,215
|
||||||
Noninterest income for the year ended December 31, 2015 was $118.5 million, down $7.5 million, or 6.0%, from the year ended December 31, 2014. The decrease from 2014 was primarily driven by a $19.4 million gain recognized in 2014 from the previously disclosed sale of our ownership interest in Springstone as compared with the $4.2 million gain recognized in 2015. Excluding the gains recognized from the sale of Springstone, noninterest income was up $7.7 milliion, or 7.2%, from 2014 to 2015. This increase was driven in part to a gain on the sale of an equity investment totaling $3.0 million in the fourth quarter of 2015. In addition, retirement plan administration fees were up $2.0 million, or 16.6%, from 2014 to 2015 due to new business generation as well as the 2015 acquisition of Third Party Administrators, Inc. (“TPA, Inc.”). ATM and debit card fees were up $1.1 million, or 6.5%, in 2015 as compared to 2014 due to an increase in debit card activity. Other noninterest income was up $3.7 million in 2015 as compared with 2014 due primarily to charge-off recoveries on acquired loans of $1.5 million and a favorable settlement of a prior accrual of $1.6 million in 2015.
Noninterest Expense
Noninterest expenses are also an important factor in the Company’s results of operations. The following table sets forth the major components of noninterest expense for the years indicated:
|
Years ended December 31,
|
||||||||||||
|
(In thousands)
|
2015
|
2014
|
2013
|
|||||||||
|
Salaries and employee benefits
|
$
|
124,318
|
$
|
119,667
|
$
|
113,580
|
||||||
|
Occupancy
|
22,095
|
22,128
|
20,720
|
|||||||||
|
Data processing and communications
|
16,588
|
16,137
|
15,353
|
|||||||||
|
Professional fees and outside services
|
13,407
|
14,426
|
13,309
|
|||||||||
|
Equipment
|
13,408
|
12,658
|
11,493
|
|||||||||
|
Office supplies and postage
|
6,367
|
6,983
|
6,563
|
|||||||||
|
FDIC expenses
|
5,145
|
4,944
|
4,960
|
|||||||||
|
Advertising
|
2,654
|
2,831
|
3,204
|
|||||||||
|
Amortization of intangible assets
|
4,864
|
5,047
|
4,872
|
|||||||||
|
Loan collection and other real estate owned
|
2,620
|
3,248
|
2,619
|
|||||||||
|
Merger expenses
|
-
|
-
|
12,364
|
|||||||||
|
Prepayment penalties on long-term debt
|
-
|
17,902
|
-
|
|||||||||
|
Other
|
24,710
|
20,092
|
19,890
|
|||||||||
|
Total noninterest expense
|
$
|
236,176
|
$
|
246,063
|
$
|
228,927
|
||||||
Noninterest expense for the year ended December 31, 2015 was $236.2 million, down $9.9 million from 2014. This decrease was driven primarily by $17.9 million in prepayment penalties resulting from the debt restructuring in 2014. Excluding these prepayment penalties, noninterest expense was up $8.0 million, or 3.5%, from 2014 to 2015. This increase was due primarily to an increase in salaries and employee benefits of $4.7 million, or 3.9%, from 2014 to 2015. This increase was driven primarily by a $2.4 million increase in post retirement expenses as well as contract termination costs totaling $1.6 million accrued in the fourth quarter of 2015. In addition, other operating expenses were up $4.6 million in 2015 as compared with 2014. This increase was driven primarily by branch reorganization expenses totaling $3.8 million in 2015.
Income Taxes
Income tax expense for the year ended December 31, 2015 was $40.2 million, up from $37.2 million for the same period in 2014. The effective tax rate was 34.5% for the year ended December 31, 2015, compared to 33.2% for the same period in 2014.
The income tax expense on the Company’s income was different than the income tax expense at the Federal statutory rate of 35% due primarily to tax exempt income and, to a lesser extent, the effect of state income taxes and Federal low income housing tax credits.
We calculate our current and deferred tax provision based on estimates and assumptions that could differ from the actual results reflected in income tax returns filed during the subsequent year. Adjustments based on filed returns are recorded when identified, which is generally in the third quarter of the subsequent year for U.S. federal and state provisions.
The amount of income taxes the Company pays is subject at times to ongoing audits by federal and state tax authorities, which may result in proposed assessments. Future results may include favorable or unfavorable adjustments to the estimated tax liabilities in the period the assessments are proposed or resolved or when statutes of limitation on potential assessments expire. As a result, the Company’s effective tax rate may fluctuate significantly on a quarterly or annual basis.
Risk Management – Credit Risk
Credit risk is managed through a network of loan officers, credit committees, loan policies, and oversight from the senior credit officers and Board of Directors. Management follows a policy of continually identifying, analyzing, and grading credit risk inherent in each loan portfolio. An ongoing independent review, subsequent to management’s review, of individual credits in the commercial loan portfolio is performed by the independent loan review function. These components of the Company’s underwriting and monitoring functions are critical to the timely identification, classification, and resolution of problem credits.
|
Nonperforming Assets
|
||||||||||||||||||||||||||||||||||||||||
|
As of December 31,
|
||||||||||||||||||||||||||||||||||||||||
|
(Dollars in thousands)
|
2015
|
%
|
2014
|
%
|
2013
|
%
|
2012
|
%
|
2011
|
%
|
||||||||||||||||||||||||||||||
|
Nonaccrual loans
|
||||||||||||||||||||||||||||||||||||||||
|
Commercial and agricultural loans and real estate
|
$
|
14,655
|
43
|
%
|
$
|
18,226
|
45
|
%
|
$
|
27,033
|
54
|
%
|
$
|
20,923
|
53
|
%
|
$
|
17,506
|
46
|
%
|
||||||||||||||||||||
|
Real estate mortgages
|
8,625
|
26
|
%
|
10,867
|
26
|
%
|
10,296
|
21
|
%
|
8,083
|
20
|
%
|
8,090
|
21
|
%
|
|||||||||||||||||||||||||
|
Consumer
|
6,009
|
18
|
%
|
8,086
|
20
|
%
|
7,213
|
14
|
%
|
8,440
|
21
|
%
|
8,724
|
23
|
%
|
|||||||||||||||||||||||||
|
Troubled debt restructured loans
|
4,455
|
13
|
%
|
3,895
|
9
|
%
|
5,423
|
11
|
%
|
2,230
|
6
|
%
|
3,970
|
10
|
%
|
|||||||||||||||||||||||||
|
Total nonaccrual loans
|
33,744
|
100
|
%
|
41,074
|
100
|
%
|
49,965
|
100
|
%
|
39,676
|
100
|
%
|
38,290
|
100
|
%
|
|||||||||||||||||||||||||
|
Loans 90 days or more past due and still accruing
|
||||||||||||||||||||||||||||||||||||||||
|
Commercial and agricultural loans and real estate
|
-
|
0
|
%
|
84
|
2
|
%
|
105
|
3
|
%
|
148
|
6
|
%
|
50
|
2
|
%
|
|||||||||||||||||||||||||
|
Real estate mortgages
|
1,022
|
28
|
%
|
1,927
|
39
|
%
|
808
|
22
|
%
|
330
|
13
|
%
|
763
|
24
|
%
|
|||||||||||||||||||||||||
|
Consumer
|
2,640
|
72
|
%
|
2,930
|
59
|
%
|
2,824
|
75
|
%
|
1,970
|
81
|
%
|
2,377
|
74
|
%
|
|||||||||||||||||||||||||
|
Total loans 90 days or more past due and still accruing
|
3,662
|
100
|
%
|
4,941
|
100
|
%
|
3,737
|
100
|
%
|
2,448
|
100
|
%
|
3,190
|
100
|
%
|
|||||||||||||||||||||||||
|
Total nonperforming loans
|
37,406
|
46,015
|
53,702
|
42,124
|
41,480
|
|||||||||||||||||||||||||||||||||||
|
Other real estate owned
|
4,666
|
3,964
|
2,904
|
2,276
|
2,160
|
|||||||||||||||||||||||||||||||||||
|
Total nonperforming assets
|
$
|
42,072
|
$
|
49,979
|
$
|
56,606
|
$
|
44,400
|
$
|
43,640
|
||||||||||||||||||||||||||||||
|
Total nonperforming loans to loans
|
0.64
|
%
|
0.82
|
%
|
0.99
|
%
|
0.98
|
%
|
1.09
|
%
|
||||||||||||||||||||||||||||||
|
Total nonperforming assets to total assets
|
0.51
|
%
|
0.64
|
%
|
0.74
|
%
|
0.73
|
%
|
0.78
|
%
|
||||||||||||||||||||||||||||||
|
Total allowance for loan losses to nonperforming loans
|
168.47
|
%
|
144.21
|
%
|
129.29
|
%
|
164.60
|
%
|
171.97
|
%
|
||||||||||||||||||||||||||||||
Total nonperforming assets were $42.1 million at December 31, 2015, compared to $50.0 million at December 31, 2014. Nonperforming loans at December 31, 2015 were $37.4 million or 0.64% of total loans compared with $46.0 million or 0.82% at December 31, 2014. Included in nonperforming loans are $4.8 million of nonaccrual loans in the acquired loan portfolio. Excluding nonaccrual acquired loans, originated nonperforming loans to originated loans was 0.61% at December 31, 2015. The Company recorded a provision for loan losses of $18.3 million for the year ended December 31, 2015 compared with $19.5 million for the year ended December 31, 2014. Net charge-offs to average loans for the year ended December 31, 2015 were 0.38%, compared with 0.41% for the year ended December 31, 2014. The allowance for loan losses was 168.47% of nonperforming loans at December 31, 2015 as compared to 144.21% at December 31, 2014. Excluding acquired loans, the allowance for loan losses as a percentage of total originated loans was 1.18% at December 31, 2015 compared to 1.36% at December 31, 2014.
Impaired loans, which primarily consist of nonaccruing commercial, commercial real estate, agricultural, and agricultural real estate loans, as well as loans that have been modified in a troubled debt restructuring (“TDR”), increased to $27.2 million at December 31, 2015 as compared to $25.8 million at December 31, 2014. At December 31, 2015, $5.9 million of the total impaired loans had a specific reserve allocation of $2.0 million compared to $5.8 million of impaired loans at December 31, 2014 which had a specific reserve allocation of $1.1 million.
The allowance for loan losses is maintained at a level estimated by management to provide adequately for risk of probable losses inherent in the current loan portfolio. The adequacy of the allowance for loan losses is continuously monitored. It is assessed for adequacy using a methodology designed to ensure the level of the allowance reasonably reflects the loan portfolio’s risk profile. It is evaluated to ensure that it is sufficient to absorb all reasonably estimable credit losses inherent in the current loan portfolio.
Management considers the accounting policy relating to the allowance for loan losses to be a critical accounting policy given the inherent uncertainty in evaluating the levels of the allowance required to cover credit losses in the portfolio and the material effect that such judgments can have on the consolidated results of operations.
For purposes of evaluating the adequacy of the allowance, the Company considers a number of significant factors that affect the collectability of the portfolio. For individually analyzed loans, these include estimates of loss exposure, which reflect the facts and circumstances that affect the likelihood of repayment of such loans as of the evaluation date. For homogeneous pools of loans, estimates of the Company’s exposure to credit loss reflect a current assessment of a number of factors, which could affect collectability. These factors include: past loss experience; size, trend, composition, and nature of loans; changes in lending policies and procedures, including underwriting standards and collection, charge-offs and recoveries; trends experienced in nonperforming and delinquent loans; current economic conditions in the Company’s market; portfolio concentrations that may affect loss experienced across one or more components of the portfolio; the effect of external factors such as competition, legal and regulatory requirements; and the experience, ability, and depth of lending management and staff. In addition, various regulatory agencies, as an integral component of their examination process, periodically review the Company’s allowance for loan losses. Such agencies may require the Company to recognize additions to the allowance based on their examinations.
After a thorough consideration of the factors discussed above, any required additions to the allowance for loan losses are made periodically by charges to the provision for loan losses. These charges are necessary to maintain the allowance at a level which management believes is reasonably reflective of overall inherent risk of probable loss in the portfolio. While management uses available information to recognize losses on loans, additions to the allowance may fluctuate from one reporting period to another. These fluctuations are reflective of changes in risk associated with portfolio content and/or changes in management’s assessment of any or all of the determining factors discussed above.
Total net charge-offs for 2015 were $21.6 million, down slightly from $22.6 million in 2014. Net charge-offs to average loans was 0.38% for 2015 as compared with 0.41% for 2014. For the originated portfolio, net charge-offs to average loans for the year ended December 31, 2014 was 0.38%, compared to 0.51% for last year. Gross charge-offs were down slightly to $26.1 million for 2015 from $27.4 million for 2014. Recoveries decreased from $4.8 million for the year ended December 31, 2014 to $4.5 million for the year ended December 31, 2015.
|
Allowance for Loan Losses
|
||||||||||||||||||||
|
(Dollars in thousands)
|
2015
|
2014
|
2013
|
2012
|
2011
|
|||||||||||||||
|
Balance at January 1
|
$
|
66,359
|
$
|
69,434
|
$
|
69,334
|
$
|
71,334
|
$
|
71,234
|
||||||||||
|
Loans charged-off
|
||||||||||||||||||||
|
Commercial and agricultural
|
5,718
|
9,414
|
10,459
|
8,750
|
8,969
|
|||||||||||||||
|
Residential real estate mortgages
|
2,229
|
1,417
|
1,771
|
1,906
|
1,310
|
|||||||||||||||
|
Consumer*
|
18,140
|
16,642
|
15,459
|
15,848
|
14,209
|
|||||||||||||||
|
Total loans charged-off
|
26,087
|
27,473
|
27,689
|
26,504
|
24,488
|
|||||||||||||||
|
Recoveries
|
||||||||||||||||||||
|
Commercial and agricultural
|
1,014
|
1,774
|
1,956
|
1,641
|
1,438
|
|||||||||||||||
|
Residential real estate mortgages
|
320
|
285
|
272
|
38
|
7
|
|||||||||||||||
|
Consumer*
|
3,127
|
2,800
|
3,137
|
2,556
|
2,406
|
|||||||||||||||
|
Total recoveries
|
4,461
|
4,859
|
5,365
|
4,235
|
3,851
|
|||||||||||||||
|
Net loans charged-off
|
21,626
|
22,614
|
22,324
|
22,269
|
20,637
|
|||||||||||||||
|
Provision for loan losses
|
18,285
|
19,539
|
22,424
|
20,269
|
20,737
|
|||||||||||||||
|
Balance at December 31
|
$
|
63,018
|
$
|
66,359
|
$
|
69,434
|
$
|
69,334
|
$
|
71,334
|
||||||||||
|
Allowance for loan losses to loans outstanding at end of year
|
1.07
|
%
|
1.19
|
%
|
1.28
|
%
|
1.62
|
%
|
1.88
|
%
|
||||||||||
|
Net charge-offs to average loans outstanding
|
0.38
|
%
|
0.41
|
%
|
0.44
|
%
|
0.55
|
%
|
0.56
|
%
|
||||||||||
* Consumer charge-off and recoveries include consumer and home equity.
In addition to the nonperforming loans discussed above, the Company has also identified approximately $73.8 million in potential problem loans at December 31, 2015 as compared to $93.6 million at December 31, 2014. Potential problem loans are loans that are currently performing, with a possibility of loss if weaknesses are not corrected. Such loans may need to be disclosed as nonperforming at some time in the future. Potential problem loans are classified by the Company’s loan rating system as “substandard.” At December 31, 2015, there were 13 potential problem loans exceeding $1.0 million, totaling $25.0 million in aggregate, compared to 18 potential problem loans exceeding $1.0 million, totaling $40.8 million at December 31, 2014. Management cannot predict the extent to which economic conditions may worsen or other factors which may impact borrowers and the potential problem loans. Accordingly, there can be no assurance that other loans will not become 90 days or more past due, be placed on nonaccrual, become restructured, or require increased allowance coverage and provision for loan losses. To mitigate this risk, the Company maintains a diversified loan portfolio, has no significant concentration in any particular industry, and originates loans primarily within its footprint.
The following table sets forth the allocation of the allowance for loan losses by category, as well as the percentage of loans in each category to total loans, as prepared by the Company. This allocation is based on management’s assessment of the risk characteristics of each of the component parts of the total loan portfolio as of a given point in time and is subject to changes as and when the risk factors of each such component part change. The allocation is not indicative of either the specific amounts of the loan categories in which future charge-offs may be taken, nor should it be taken as an indicator of future loss trends. The allocation of the allowance to each category does not restrict the use of the allowance to absorb losses in any category.
|
Allocation of the Allowance for Loan and Lease Losses
|
||||||||||||||||||||||||||||||||||||||||
|
December 31,
|
||||||||||||||||||||||||||||||||||||||||
|
2015
|
2014
|
2013
|
2012
|
2011
|
||||||||||||||||||||||||||||||||||||
|
Category
|
Category
|
Category
|
Category
|
Category
|
||||||||||||||||||||||||||||||||||||
|
Percent of
|
Percent of
|
Percent of
|
Percent of
|
Percent of
|
||||||||||||||||||||||||||||||||||||
|
(Dollars in thousands)
|
Allowance
|
Loans
|
Allowance
|
Loans
|
Allowance
|
Loans
|
Allowance
|
Loans
|
Allowance
|
of Loans
|
||||||||||||||||||||||||||||||
|
Commercial and agricultural
|
$
|
25,545
|
44
|
%
|
$
|
32,433
|
44
|
%
|
$
|
35,090
|
44
|
%
|
$
|
35,624
|
47
|
%
|
$
|
38,831
|
45
|
%
|
||||||||||||||||||||
|
Real estate mortgages
|
7,960
|
20
|
%
|
7,130
|
20
|
%
|
6,520
|
19
|
%
|
6,252
|
15
|
%
|
6,249
|
15
|
%
|
|||||||||||||||||||||||||
|
Consumer
|
29,253
|
36
|
%
|
26,720
|
36
|
%
|
27,694
|
37
|
%
|
27,162
|
38
|
%
|
26,049
|
40
|
%
|
|||||||||||||||||||||||||
|
Unallocated
|
260
|
0
|
%
|
76
|
0
|
%
|
130
|
0
|
%
|
296
|
0
|
%
|
205
|
0
|
%
|
|||||||||||||||||||||||||
|
Total
|
$
|
63,018
|
100
|
%
|
$
|
66,359
|
100
|
%
|
$
|
69,434
|
100
|
%
|
$
|
69,334
|
100
|
%
|
$
|
71,334
|
100
|
%
|
||||||||||||||||||||
The Company’s accounting policy relating to the allowance for loan losses requires a review of each significant loan type within the loan portfolio, considering asset quality trends for each type, including, but not limited to, delinquencies, nonaccruals, historical charge-off experience, and specific economic factors (e.g. milk prices are considered when reviewing agricultural loans). Based on this review, management believes the reserve allocations are adequate to address any trends in asset quality indicators. As a result of the general improvement and stabilization of asset quality indicators in 2015, as well as the aforementioned review of the loan portfolio, the allowance for loan losses as a percentage of originated loans decreased from 1.36% as of December 31, 2014 to 1.18% as of December 31, 2015. The most significant improvement was evidenced in the originated commercial and agricultural portfolio. Net charge-offs in the originated commercial and agricultural portfolio decreased $0.8 million from 2014 to 2015. In addition, nonaccrual commercial and agricultural loans decreased $3.6 million from 2014 to 2015. Acquired loans were recorded at fair value on the date of acquisition, with no carryover of the related allowance for loan losses. Generally, the fair value discount represents expected credit losses, net of market interest rate adjustments. The discount on loans receivable will be amortized to interest income over the estimated remaining life of the acquired loans using the level yield method.
At December 31, 2015, approximately 59% of the Company’s loans were secured by real estate located in central and northern New York, northeastern Pennsylvania, western Massachusetts, southern New Hampshire, Vermont, and Maine. Accordingly, the ultimate collectability of a substantial portion of the Company’s portfolio is susceptible to changes in market conditions of those areas. Management is not aware of any material concentrations of credit to any industry or individual borrowers.
Subprime mortgage lending, which has been the riskiest sector of the residential housing market, is not a market that the Company has ever actively pursued. The market does not apply a uniform definition of what constitutes “subprime” lending. Our reference to subprime lending relies upon the “Statement on Subprime Mortgage Lending” issued by the OTS and the other federal bank regulatory agencies (the “Agencies”), on June 29, 2007, which further referenced the “Expanded Guidance for Subprime Lending Programs,” or the Expanded Guidance, issued by the Agencies by press release dated January 31, 2001. In the Expanded Guidance, the Agencies indicated that subprime lending does not refer to individual subprime loans originated and managed, in the ordinary course of business, as exceptions to prime risk selection standards. The Agencies recognize that many prime loan portfolios will contain such accounts. The Agencies also excluded prime loans that develop credit problems after acquisition and community development loans from the subprime arena. According to the Expanded Guidance, subprime loans are other loans to borrowers which display one or more characteristics of reduced payment capacity. Five specific criteria, which are not intended to be exhaustive and are not meant to define specific parameters for all subprime borrowers and may not match all markets or institutions’ specific subprime definitions, are set forth, including having a FICO score of 660 or below. Based upon the definition and exclusions described above, the Company is a prime lender. Within the loan portfolio, there are loans that, at the time of origination, had FICO scores of 660 or below. However, since the Company is a portfolio lender, it reviews all data contained in borrower credit reports and does not base underwriting decisions solely on FICO scores. We believe the aforementioned loans, when made, were amply collateralized and otherwise conformed to our prime lending standards.
For acquired loans that are not deemed to be impaired at acquisition, credit discounts representing the principal losses expected over the life of the loan are a component of the initial fair value and amortized over the life of the asset.
As a result of the application of this accounting methodology, certain credit-related ratios may not necessarily be directly comparable with periods prior to acquisitions, or comparable with other institutions. The credit metrics most impacted by our acquisition of loans related to the acquisition of Alliance Financial Corporation ("Alliance") were the allowance for loans losses to total loans, and total allowance for loan losses to nonperforming loans. As of December 31, 2015, the allowance for loan losses to total originated loans and the total allowance for loan losses to originated nonperforming loans were 1.18% and 193.00%, respectively.
Loans acquired from Alliance that were not deemed to be impaired at acquisition and were classified as non-accrual and greater than 90 days past due and still accruing prior to acquisition, continued to be classified as non-accrual and 90 days past due and still accruing immediately after the acquisition. Loans acquired from Alliance that were classified as troubled debt restructurings prior to acquisition are no longer classified as such immediately following the acquisition. Acquired credit impaired loans from the Alliance acquisition were not classified non-accrual, even though they may be contractually past due, because we expect to fully collect the recorded investment of such loans.
Liquidity Risk
Liquidity involves the ability to meet the cash flow requirements of customers who may be depositors wanting to withdraw funds or borrowers needing assurance that sufficient funds will be available to meet their credit needs. The Asset Liability Committee (ALCO) is responsible for liquidity management and has developed guidelines which cover all assets and liabilities, as well as off balance sheet items that are potential sources or uses of liquidity. Liquidity policies must also provide the flexibility to implement appropriate strategies. Requirements change as loans grow, deposits and securities mature, and payments on borrowings are made. Liquidity management includes a focus on interest rate sensitivity management with a goal of avoiding widely fluctuating net interest margins through periods of changing economic conditions.
The primary liquidity measurement the Company utilizes is called “Basic Surplus,” which captures the adequacy of its access to reliable sources of cash relative to the stability of its funding mix of average liabilities. This approach recognizes the importance of balancing levels of cash flow liquidity from short and long-term securities with the availability of dependable borrowing sources which can be accessed when necessary. At December 31, 2015, the Company’s Basic Surplus measurement was 18.6% of total assets, or $1.5 billion, which was above the Company’s minimum of 5% (calculated at $413 million of period end total assets at December 31, 2015) set forth in its liquidity policies.
This Basic Surplus approach enables the Company to adequately manage liquidity from both operational and contingency perspectives. By tempering the need for cash flow liquidity with reliable borrowing facilities, the Company is able to operate with a more fully invested and, therefore, higher interest income generating securities portfolio. The makeup and term structure of the securities portfolio is, in part, impacted by the overall interest rate sensitivity of the balance sheet. Investment decisions and deposit pricing strategies are impacted by the liquidity position. At December 31, 2015, the Company considered its Basic Surplus position to be strong. However, certain events may adversely impact the Company’s liquidity position in 2016. Improvement in the economy may increase demand for equity related products or increase competitive pressure on deposit pricing, which, in turn, could result in a decrease in the Company’s deposit base or increase funding costs. Additionally, liquidity will come under additional pressure if loan growth exceeds deposit growth in 2016. These scenarios could lead to a decrease in the Company’s Basic Surplus measure below the minimum policy level of 5%. To manage this risk, the Company has the ability to purchase brokered time deposits, borrow against established borrowing facilities with other banks (Federal funds), and enter into repurchase agreements with investment companies. The additional liquidity that could be provided by these measures was $1.6 billion at December 31, 2015. In addition, the Bank has enhanced its “Borrower-in-Custody” program with the FRB with the addition of the ability to pledge automobile loans. At December 31, 2015, the Bank had the capacity to borrow $823 million from this program.
At December 31, 2015 and 2014, FHLB advances outstanding totaled $432 million and $352 million, respectively. The Bank is a member of the FHLB system and had additional borrowing capacity from the FHLB of approximately $1.1 billion at December 31, 2015 and $958 million at December 31, 2014. In addition, unpledged securities could have been used to increase borrowing capacity at the FHLB by an additional $772 million at December 31, 2015 or used to collateralize other borrowings, such as repurchase agreements.
At December 31, 2015, a portion of the Company’s loans and securities were pledged as collateral on borrowings. Therefore, future growth of earning assets will depend upon the Company’s ability to obtain additional funding, through growth of core deposits and collateral management, and may require further use of brokered time deposits, or other higher cost borrowing arrangements.
Net cash flows provided by operating activities totaled $124.5 million in 2015 and $87.8 million in 2014. The critical elements of net operating cash flows include net income, adjusted for non-cash income and expense items such as the provision for loan losses, deferred income tax expense, depreciation and amortization, and cash flows generated through changes in other assets and liabilities.
Net cash flows used by investing activities totaled $504.0 million and $143.7 million in 2015 and 2014, respectively. Critical elements of investing activities are loan and investment securities transactions.
Net cash flows provided by financing activities totaled $373.1 million in 2015 as compared to $43.6 million in 2014. The critical elements of financing activities are proceeds from deposits, borrowings, and stock issuances. In addition, financing activities are impacted by dividends and treasury stock transactions.
In connection with its financing and operating activities, the Company has entered into certain contractual obligations. The Company’s future minimum cash payments, excluding interest, associated with its contractual obligations pursuant to its borrowing agreements, operating leases, and other obligations at December 31, 2015 are as follows:
|
Contractual Obligations
|
||||||||||||||||||||||||||||
|
(In thousands)
|
||||||||||||||||||||||||||||
|
Payments Due by Period
|
||||||||||||||||||||||||||||
|
|
2016
|
2017
|
2018
|
2019
|
2020
|
Thereafter
|
Total
|
|||||||||||||||||||||
|
Long-term debt obligations
|
$
|
50,360
|
$
|
40,000
|
$
|
40,000
|
$
|
-
|
$
|
-
|
$
|
87
|
$
|
130,447
|
||||||||||||||
|
Junior subordinated debt
|
-
|
-
|
-
|
-
|
-
|
101,196
|
101,196
|
|||||||||||||||||||||
|
Operating lease obligations
|
7,518
|
7,141
|
6,356
|
5,803
|
4,977
|
21,628
|
53,423
|
|||||||||||||||||||||
|
Capital lease obligations
|
161
|
87
|
60
|
47
|
8
|
-
|
363
|
|||||||||||||||||||||
|
IT/Software obligations
|
5,601
|
4,159
|
1,087
|
41
|
-
|
-
|
10,888
|
|||||||||||||||||||||
|
Data processing commitments
|
6,027
|
5,815
|
4,754
|
4,754
|
4,754
|
-
|
26,104
|
|||||||||||||||||||||
|
Total contractual obligations
|
$
|
69,667
|
$
|
57,202
|
$
|
52,257
|
$
|
10,645
|
$
|
9,739
|
$
|
122,911
|
$
|
322,421
|
||||||||||||||
We have obligations under our pension, post-retirement plan, directors’ retirement and supplemental executive retirement plans as described in Note 13 to the consolidated financial statements. The supplemental executive retirement, pension and postretirement benefit and directors’ retirement payments represent actuarially determined future benefit payments to eligible plan participants.
Commitments to Extend Credit
The Company makes contractual commitments to extend credit, which include unused lines of credit, which are subject to the Company’s credit approval and monitoring procedures. At December 31, 2015 and 2014, commitments to extend credit in the form of loans, including unused lines of credit, amounted to $1.3 billion and $1.2 billion, respectively. In the opinion of management, there are no material commitments to extend credit, including unused lines of credit that represent unusual risks. All commitments to extend credit in the form of loans, including unused lines of credit, expire within one year.
Standby Letters of Credit
The Company does not issue any guarantees that would require liability-recognition or disclosure, other than its standby letters of credit. The Company guarantees the obligations or performance of customers by issuing stand-by letters of credit to third parties. These standby letters of credit are frequently issued in support of third party debt, such as corporate debt issuances, industrial revenue bonds, and municipal securities. The risk involved in issuing standby letters of credit is essentially the same as the credit risk involved in extending loan facilities to customers, and they are subject to the same credit origination, portfolio maintenance and management procedures in effect to monitor other credit and off-balance sheet products. Typically, these instruments have terms of five years or less and expire unused; therefore, the total amounts do not necessarily represent future cash requirements. At December 31, 2015 and 2014, outstanding standby letters of credit were approximately $31.5 million and $35.2 million, respectively. The fair value of the Company’s standby letters of credit at December 31, 2015 and 2014 was not significant. The following table sets forth the commitment expiration period for standby letters of credit at December 31, 2015:
|
Commitment Expiration of Standby Letters of Credit
|
||||
|
Within one year
|
$
|
24,314
|
||
|
After one but within three years
|
4,355
|
|||
|
After three but within five years
|
1,933
|
|||
|
After five years
|
901
|
|||
|
Total
|
$
|
31,503
|
||
Interest Rate Swaps
The Bank offers interest rate swap agreements to its customers. These agreements allow the Bank’s customers to effectively fix the interest rate on a variable rate loan by entering into a separate agreement. Simultaneous with the execution of such an agreement with a customer, the Bank enters into a matching interest rate swap agreement with an unrelated third party provider, which allows the Bank to continue to receive the historical variable rate under the loan agreement with the customer. The agreement with the third party is not a hedge contract therefore changes in fair value are recorded through earnings. Assets and liabilities associated with the agreements are recorded in other assets and other liabilities on the balance sheet. Gains and losses are recorded as other noninterest income. The Bank is not subject to any fee or penalty should the customer elect to terminate the interest rate swap agreement prior to maturity. The Bank is exposed to credit loss equal to the fair value of the derivatives (not the notional amount of the derivatives) in the event of nonperformance by the counterparty to the interest rate swap agreements. Additionally, the Bank receives a fee from the customer that is recognized when the Bank has fulfilled its obligations under each agreement, which is generally upon execution of the agreement with the Bank’s customer. Since the terms of the two interest rate swap agreements are identical, the income statement impact to the Bank is limited to the fees it receives from the customer. The Bank recognized approximately $0.7 million in swap fee income in 2015. At December 31, 2015, the Bank maintained a $8.0 million deposit with the counterparty to collateralize the swap agreements.
Loans Serviced for Others and Loans Sold with Recourse
The total amount of loans serviced by the Company for unrelated third parties was approximately $616.1 million and $624.4 million at December 31, 2015 and 2014, respectively. At December 31, 2015 and 2014, the Company had approximately $1.1 million and $1.5 million, respectively, of mortgage servicing rights. At December 31, 2015 and 2014, the Company serviced $25.1 million and $23.4 million, respectively, of agricultural loans sold with recourse. Due to sufficient collateral on these loans, no reserve is considered necessary at December 31, 2015 and 2014.
Capital Resources
Consistent with its goal to operate a sound and profitable financial institution, the Company actively seeks to maintain a “well-capitalized” institution in accordance with regulatory standards. The principal source of capital to the Company is earnings retention. The Company’s capital measurements are in excess of both regulatory minimum guidelines and meet the requirements to be considered well-capitalized.
The Company’s principal source of funds to pay interest on trust preferred debentures and pay cash dividends to its shareholders are dividends from its subsidiaries. Various laws and regulations restrict the ability of banks to pay dividends to their shareholders. Generally, the payment of dividends by the Company in the future as well as the payment of interest on the capital securities will require the generation of sufficient future earnings by its subsidiaries.
The Bank also is subject to substantial regulatory restrictions on its ability to pay dividends to the Company. Under OCC regulations, the Bank may not pay a dividend, without prior OCC approval, if the total amount of all dividends declared during the calendar year, including the proposed dividend, exceeds the sum of its retained net income to date during the calendar year and its retained net income over the preceding two years. At December 31, 2015, approximately $81.9 million of the total stockholders’ equity of the Bank was available for payment of dividends to the Company without approval by the OCC. The Bank’s ability to pay dividends also is subject to the Bank being in compliance with regulatory capital requirements. The Bank is currently in compliance with these requirements.
Stock Repurchase Plan
The Company purchased 1,047,152 shares of its common stock during the year ended December 31, 2015 at an average price of $25.59 per share under previously announced plans. As of December 31, 2015, there were 952,848 shares available for repurchase under the repurchase plan that was announced on July 27, 2015, which expires on December 31, 2016.
2014 OPERATING RESULTS AS COMPARED TO 2013 OPERATING RESULTS
Net Interest Income
Net interest income was $251.9 million for the year ended December 31, 2014, up 5.8% from 2013. Fully taxable equivalent (“FTE”) net interest margin was 3.61% for the year ended December 31, 2014, down from 3.66% for 2013. Average interest earning assets were up $450.9 million, or 6.8%, for the year ended December 31, 2014 as compared to the same period in 2013. This increase was driven primarily by the acquisition of Alliance in March 2013 as well as organic loan production during the past several quarters. The net interest impact from the increase in average interest earning assets was partially offset by rate compression on earning assets, as their yield decreased from 4.12% during the year ended December 31, 2013 to 3.94% for 2014. This rate compression was driven primarily by decreasing loan yields from 4.69% in 2013 to 4.42% for 2014. As a result of the increase in average earning assets, interest income was up 2.4% for the year ended December 31, 2014 as compared to 2013. Average interest bearing liabilities increased $211.5 million, or 4.3%, for the year ended December 31, 2014 as compared to 2013. This increase was due primarily to an increase in deposits resulting from organic deposit growth as well as the aforementioned acquisition of Alliance. The rates paid on interest bearing liabilities for 2014 decreased by 17 basis points from 2013. This decrease was primarily driven by a decrease of 8 basis points in rates paid on deposits from improved funding mix as well as a 55 basis point decrease in the rate paid on long-term debt due primarily to maturity of long-term debt in the prior year, as well as the debt restructuring completed in the third quarter of 2014. The following table presents changes in interest income, on a FTE basis, and interest expense attributable to changes in volume (change in average balance multiplied by prior year rate), changes in rate (change in rate multiplied by prior year volume), and the net change in net interest income. The net change attributable to the combined impact of volume and rate has been allocated to each in proportion to the absolute dollar amounts of change.
Loans and Corresponding Interest and Fees on Loans
The average balance of loans increased by approximately $421.4 million, or 8.3%, from 2013 to 2014. The yield on average loans decreased from 4.69% in 2013 to 4.42% in 2014, as loan rates declined due to the continued low rate environment in 2014. Interest income from loans on a FTE basis increased 1.9%, from $239.6 million in 2013 to $244.2 million in 2014. This increase was due to the increase in average loan balances noted above, partially offset by the decrease in yields.
Total loans increased $188.5 million, or 3.5%, from December 31, 2013 to December 31, 2014. Increases in residential real estate mortgages, commercial real estate loans, and consumer loans were the primary drivers of the increase in total loans from 2013 as the Company experienced strong originations in 2014 in the upstate New York and Vermont markets. Residential real estate mortgages consist primarily of loans secured by first or second deeds of trust on primary residences. Loans in the commercial and agricultural categories, including commercial and agricultural real estate mortgages, consist primarily of short-term and/or floating rate loans made to small and medium-sized entities. Consumer loans consist primarily of indirect installment credit to individuals, of which approximately 75% is secured by automobiles and other personal property including marine, recreational vehicles and manufactured housing. Consumer loans also consist of direct installment loans to individuals secured by similar collateral. Indirect installment loans represent $1.3 billion of total consumer loans at December 31, 2014, or 92%. Installment credit for automobiles accounts for approximately 74% of total consumer loans. Although automobile loans have generally been originated through dealers, all applications submitted through dealers are subject to the Company’s normal underwriting and loan approval procedures. Real estate construction and development loans include commercial construction and development and residential construction loans. Commercial construction loans are for small and medium sized office buildings and other commercial properties and residential construction loans are primarily for projects located in upstate New York and northeastern Pennsylvania.
Risks associated with the commercial real estate portfolio include the ability of borrowers to pay interest and principal during the loan’s term, as well as the ability of the borrowers to refinance at the end of the loan term.
Securities and Corresponding Interest and Dividend Income
The average balance of securities available for sale decreased $90.9 million, or 6.7%, from 2013 to 2014. The yield on average securities available for sale was 2.05% for 2014 compared to 2.03% in 2013.
The average balance of securities held to maturity increased from $88.2 million in 2013 to $233.5 million in 2014. At December 31, 2014, securities held to maturity were comprised primarily of tax-exempt municipal securities. The yield on securities held to maturity decreased from 4.19% in 2013 to 2.81% in 2014.
During the third quarter of 2014, the Company transferred approximately $340 million in securities from the available for sale portfolio to the held to maturity portfolio to mitigate the impact of volatility of interest rate changes on tangible book value.
The average balance of FRB and FHLB stock increased to $39.3 million in 2014 from $38.0 million in 2013. The yield from investments in FRB and FHLB banks increased from 4.66% in 2013 to 5.10% in 2014.
Funding Sources and Corresponding Interest Expense
The Company utilizes traditional deposit products such as time, savings, NOW, money market, and demand deposits as its primary source for funding. Other sources, such as short-term FHLB advances, federal funds purchased, securities sold under agreements to repurchase, brokered time deposits, and long-term FHLB borrowings are utilized as necessary to support the Company’s growth in assets and to achieve interest rate sensitivity objectives. The average balance of interest-bearing liabilities increased $211.5 million from 2013 primarily due to the acquisition of Alliance in March 2013 as well as organic deposit growth, and totaled $5.2 billion in 2014. The rate paid on interest-bearing liabilities decreased from 0.62% in 2013 to 0.45% in 2014. This decrease in rates, partially offset by an increase in average balances, caused a decrease in interest expense of $7.4 million, or 24.3%, from $30.6 million in 2013 to $23.2 million in 2014.
Deposits
Average interest bearing deposits increased $219.4 million, or 5.2%, from 2013 to 2014, due primarily to the acquisition of Alliance in March 2013 as well as organic deposit growth. Average money market deposits increased $114.0 million or 8.5% during 2014 when compared to 2013. Average NOW accounts increased $67.1 million or 7.6% during 2014 as compared to 2013. The average balance of savings accounts increased $91.7 million or 9.9% during 2014 when compared to 2013. These increases were partially offset by a decrease in average time deposits, which decreased $53.5 million, or 5.0%, from 2013 to 2014. The average balance of demand deposits increased $186.0 million, or 12.5%, during 2014 when compared to 2013. This growth in demand deposits was driven principally by increases in accounts from retail, municipal, and commercial customers spurred by strategic expansion into new markets as well as the aforementioned acquisition of Alliance in March 2013.
The rate paid on average interest-bearing deposits decreased from 0.39% during 2013 to 0.31% in 2014. The decrease in the rate on interest-bearing deposits was driven primarily by pricing decreases from NOW accounts and time deposits, which are sensitive to interest rate changes. The pricing decreases for these products resulted from the FRB maintaining a historic low Fed Funds target rate as well as an overall decrease in all interest rates. The rate paid for NOW accounts decreased from 0.17% during 2013 to 0.05% during 2014. The rate paid for time deposits decreased from 1.13% during 2013 to 0.97% during 2014.
Borrowings
Average short-term borrowings increased to $382.5 million in 2014 from $280.8 million in 2013. The average rate paid on short-term borrowings increased from 0.18% in 2013 to 0.22% in 2014. Average long-term debt decreased from $338.7 million in 2013 to $224.6 million in 2014. This decrease was due to the long-term debt restructure completed in the third quarter of 2014 which resulted in the prepayment of $165.0 million of long-term debt.
The average balance of junior subordinated debt increased to $101.2 million in 2014 compared to $96.5 million in 2013 due to the acquisition of Alliance. The average rate paid for junior subordinated debt in 2014 was 2.14%, down slightly from 2.16% in 2013.
Short-term borrowings consist of Federal funds purchased and securities sold under repurchase agreements, which generally represent overnight borrowing transactions, and other short-term borrowings, primarily FHLB advances, with original maturities of one year or less. The Company has unused lines of credit and access to brokered deposits available for short-term financing of approximately $1.8 billion and $1.7 billion at December 31, 2014 and 2013, respectively. Securities collateralizing repurchase agreements are held in safekeeping by non-affiliated financial institutions and are under the Company’s control. Long-term debt, which is comprised primarily of FHLB advances, are collateralized by the FHLB stock owned by the Company, certain of its mortgage-backed securities and a blanket lien on its residential real estate mortgage loans.
Noninterest Income
Noninterest income for the year ended December 31, 2014 was $126.0 million, up $22.8 million, or 22.1%, from the year ended December 31, 2013. The increase from 2013 was primarily driven by the previously disclosed sale of our ownership interest in Springstone recorded in the second quarter of 2014. Excluding this non-core gain, noninterest income for the year ended December 31, 2014 was $106.6 million, up $3.4 million, or 3.3%, from 2013. This increase from 2013 was due primarily to increases in trust and ATM and debit card fees, due in large part to the full year impact from the acquisition of Alliance in 2014. In addition, bank owned life insurance income was up approximately $1.6 million over 2013 due to death benefits recorded in 2014. These increases were partially offset by a $1.4 million decrease in service charges on deposit accounts from 2013 and net securities gains totaling $1.4 million in 2013 as compared to only $0.1 million in 2014. The decrease in service charges on deposit accounts from the prior year was primarily the result of lower nonsufficient funds fees recorded during 2014 due to changes in customer behavior, improving macroeconomic conditions, and continued customer outreach and education.
Noninterest Expense
Noninterest expense for the year ended December 31, 2014 was $246.1 million, up $17.1 million from 2013. Excluding the non-core $17.9 million prepayment penalties in 2014 and the non-core merger related expenses totaling $12.4 million in 2013, noninterest expense for the year ended December 31, 2014 was $228.2 million, up $11.6 million, or 5.4% from 2013. This increase from 2013 was due primarily to the full twelve months of Alliance occupancy, salaries and employee benefits, data processing, professional fees, and equipment expenses. In addition, the increase in salaries and benefits in 2014 included incremental incentive compensation related to the Springstone transaction, partially offset by lower retirement plan expenses due mainly to plan asset performance and a previous plan amendment.
Income Taxes
Income tax expense for the year ended December 31, 2014 was $37.2 million, up from $28.2 million for the same period in 2013. The effective tax rate was 33.2% for the year ended December 31, 2014, compared to 31.3% for the same period in 2013. The increase in the effective tax rate was due to a higher level of taxable income primarily due to the full year impact of Alliance in 2014, no merger costs in 2014, a lower level of tax exempt municipal interest income as a percentage of total income in 2014, and an increase in the value of bank owned life.
Recent Accounting Updates
In January 2016, the Financial Accounting Standards Board (“FASB”) issued Accounting Standards Update (“ASU”) No. 2016-01 – Financial Instruments - Overall (Subtopic 825-10) – Recognition and measurement of Financial Assets and Financial Liabilities. The amendments in ASU 2016-01 address certain aspects of recognition, measurement, presentation, and disclosure of financial instruments. The amendments in this Update make targeted improvements to generally accepted accounting principles (GAAP) as follows:
1. Require equity investments (except those accounted for under the equity method of accounting or those that result in consolidation of the investee) to be measured at fair value with changes in fair value recognized in net income. However, an entity may choose to measure equity investments that do not have readily determinable fair values at cost minus impairment, if any, plus or minus changes resulting from observable price changes in orderly transactions for the identical or a similar investment of the same issuer.
2. Simplify the impairment assessment of equity investments without readily determinable fair values by requiring a qualitative assessment to identify impairment. When a qualitative assessment indicates that impairment exists, an entity is required to measure the investment at fair value.
3. Eliminate the requirement to disclose the fair value of financial instruments measured at amortized cost for entities that are not public business entities.
4. Eliminate the requirement for public business entities to disclose the method(s) and significant assumptions used to estimate the fair value that is required to be disclosed for financial instruments measured at amortized cost on the balance sheet.
5. Require public business entities to use the exit price notion when measuring the fair value of financial instruments for disclosure purposes.
6. Require an entity to present separately in other comprehensive income the portion of the total change in the fair value of a liability resulting from a change in the instrument-specific credit risk when the entity has elected to measure the liability at fair value in accordance with the fair value
option for financial instruments.
7. Require separate presentation of financial assets and financial liabilities by measurement category and form of financial asset (that is, securities or loans and receivables) on the balance sheet or the accompanying notes to the financial statements.
8. Clarify that an entity should evaluate the need for a valuation allowance on a deferred tax asset related to available-for-sale securities in combination with the entity’s other deferred tax assets.
The guidance becomes effective for us on January 1, 2018 and is not expected to have a material impact on our financial statements.
In September 2015, the FASB issued ASU No. 2015-16, Business Combinations - Simplifying the Accounting for Measurement-Period Adjustments (Topic 805). The amendments in ASU 2015-16 The amendments in this Update require that an acquirer recognize adjustments to provisional amounts that are identified during the measurement period in the reporting period in which the adjustment amounts are determined. The amendments in this Update require that the acquirer record, in the same period’s financial statements, the effect on earnings of changes in depreciation, amortization, or other income effects, if any, as a result of the change to the provisional amounts, calculated as if the accounting had been completed at the acquisition date. The amendments in this Update require an entity to present separately on the face of the income statement or disclose in the notes the portion of the amount recorded in current-period earnings by line item that would have been recorded in previous reporting periods if the adjustment to the provisional amounts had been recognized as of the acquisition date. The guidance becomes effective for us on January 1, 2016 and is not expected to have a material impact on our financial statements.
In April 2015, the FASB issued ASU No. 2015-03, Interest – Imputation of Interest (Subtopic 835-30). The amendments in ASU 2015-03 are intended to simplify the presentation of debt issuance costs. These amendments require that debt issuance costs related to a recognized debt liability be presented in the balance sheet as a direct deduction from the carrying amount of that debt liability, consistent with debt discounts. The recognition and measurement guidance for debt issuance costs are not affected by the amendments in this ASU. The guidance becomes effective for us on January 1, 2016 and is not expected to have a material impact on our financial statements.
In February 2015, the FASB issued ASU No. 2015-02 —Consolidation (Topic 810), Amendments to the Consolidation Analysis. The update amends existing standards regarding the evaluation of certain legal entities and their consolidation in the financial statements. The amendments modify the evaluation of whether limited partnerships and similar legal entities are variable interest entities or voting interest entities and eliminate the presumption that a general partner should consolidate a limited partnership. The amendments also affect the consolidation analysis of reporting entities that are involved with variable interest entities and provide a scope exception from consolidation guidance for reporting entities with interests in legal entities that are required to comply with or operate in accordance with requirements that are similar to those in Rule 2a-7 of the Investment Company Act of 1940 for registered money market funds. The guidance becomes effective for us on January 1, 2016 and we are evaluating the impact of this guidance on our financial statements.
In May 2014, the FASB issued ASU No. 2014-09, Revenue from Contracts with Customers (Topic 606). This new guidance supersedes the revenue recognition requirements in ASC 605, Revenue Recognition, and is based on the principle that revenue is recognized to depict the transfer of goods or services to customers in an amount that reflects consideration to which the entity expects to be entitled in exchange for those goods and services. The ASU also requires additional disclosure about the nature, amount, timing and uncertainty of revenue and cash flows arising from customer contracts, including significant judgments and changes in judgments and assets recognized from costs incurred to obtain or fulfill a contract. In April 2015, the FASB approved deferral of the effective date of this guidance, which is now effective prospectively for the Company for annual and interim periods beginning after December 15, 2017. The Company is currently evaluating the effect the guidance will have on the Company’s consolidated financial statements.
The FASB currently has two projects underway that could have a meaningful impact on bank financial statements, capital levels and regulatory capital ratios. The first project, which addresses the amount and timing of loss recognition for loans and investment securities, would generally result in an increase in overall allowance levels and lower capital levels. This project has been exposed for public comment three times since 2010. A final standard is expected to be issued in the first half of 2016 with an effective date of January 1, 2019 for calendar year entities.
The second project relates to leases and requires an operating lease to be recognized on the balance sheet as a "right to use" asset and as a corresponding liability representing the obligation to pay rent. This project would result in an increase to assets and liabilities recognized and therefore increase risk-weighted assets for regulatory capital purposes. This project has been exposed for public comment twice since 2010. A final standard is expected to be issued in 2016 with an effective date of January 1, 2019 for calendar year entities.
We are evaluating the projects as proposed and the possible range of impacts and will determine any impact of these projects to capital or future earnings once the final rules are issued.
Interest rate risk is the most significant market risk affecting the Company. Other types of market risk, such as foreign currency exchange rate risk and commodity price risk, do not arise in the normal course of the Company's business activities or are immaterial to the results of operations.
Interest rate risk is defined as an exposure to a movement in interest rates that could have an adverse effect on the Company's net interest income. Net interest income is susceptible to interest rate risk to the degree that interest-bearing liabilities mature or reprice on a different basis than earning assets. When interest-bearing liabilities mature or reprice more quickly than earning assets in a given period, a significant increase in market rates of interest could adversely affect net interest income. Similarly, when earning assets mature or reprice more quickly than interest-bearing liabilities, falling interest rates could result in a decrease in net interest income.
In an attempt to manage the Company's exposure to changes in interest rates, management monitors the Company's interest rate risk. Management's asset/liability committee (ALCO) meets monthly to review the Company's interest rate risk position and profitability, and to recommend strategies for consideration by the Board of Directors. Management also reviews loan and deposit pricing, and the Company's securities portfolio, formulates investment and funding strategies, and oversees the timing and implementation of transactions to assure attainment of the Board's objectives in the most effective manner. Notwithstanding the Company's interest rate risk management activities, the potential for changing interest rates is an uncertainty that can have an adverse effect on net income.
In adjusting the Company's asset/liability position, the Board and management attempt to manage the Company's interest rate risk while minimizing the net interest margin compression. At times, depending on the level of general interest rates, the relationship between long and short-term interest rates, market conditions and competitive factors, the Board and management may determine to increase the Company's interest rate risk position somewhat in order to increase its net interest margin. The Company's results of operations and net portfolio values remain vulnerable to changes in interest rates and fluctuations in the difference between long and short-term interest rates.
The primary tool utilized by ALCO to manage interest rate risk is a balance sheet/income statement simulation model (interest rate sensitivity analysis). Information such as principal balance, interest rate, maturity date, cash flows, next repricing date (if needed), and current rates is uploaded into the model to create an ending balance sheet. In addition, ALCO makes certain assumptions regarding prepayment speeds for loans and mortgage related investment securities along with any optionality within the deposits and borrowings. The model is first run under an assumption of a flat rate scenario (i.e. no change in current interest rates) with a static balance sheet over a 12-month period. Two additional models are run in which a gradual increase of 200 bps and a gradual decrease of 100 bps takes place over a 12 month period with a static balance sheet. Under these scenarios, assets subject to prepayments are adjusted to account for faster or slower prepayment assumptions. Any investment securities or borrowings that have callable options embedded into them are handled accordingly based on the interest rate scenario. The resultant changes in net interest income are then measured against the flat rate scenario.
In the declining rate scenario, net interest income is projected to decrease slightly when compared to the forecasted net interest income in the flat rate scenario through the simulation period. The decrease in net interest income is a result of earning assets repricing downward, given potential higher prepayments and lower reinvestment rates, slightly faster than the interest bearing liabilities that are at or near their floors. In the rising rate scenarios, net interest income is projected to experience a decline from the flat rate scenario; however, the potential impact on earnings is dependent on the ability to lag deposit repricing on NOW, savings, MMDA, and CD accounts. Net interest income for the next twelve months in the +200/-100 bp scenarios, as described above, is within the internal policy risk limits of not more than a 7.5% change in net interest income. The following table summarizes the percentage change in net interest income in the rising and declining rate scenarios over a 12-month period from the forecasted net interest income in the flat rate scenario using the December 31, 2015 balance sheet position:
|
Interest Rate Sensitivity Analysis
|
||||||
|
Change in interest rates
|
Percent change
|
|||||
|
(In basis points)
|
in net interest income
|
|||||
|
+200
|
(3.27
|
%)
|
||||
|
-100
|
(1.88
|
%)
|
||||
The Company anticipates that under the current low rate environment, on a monthly basis, interest income is expected to decrease at a faster rate than interest expense given the potential higher prepayments and reinvestment into lower rates as deposit rates are at or near their respective floors. In order to protect net interest income from anticipated net interest margin compression in 2016, the Company will continue to focus on increasing earning assets through loan growth, asset mix of loans and investments, and leverage opportunities.
Another tool used by ALCO to manage interest rate risk is financial modeling of net portfolio values (discounted present value of assets minus discounted present value of liabilities). The table below represents the percent change in net portfolio values from base case (flat rates) for +200/-100 instantaneous rate shocks:
|
Net Portfolio Value Sensitivity Analysis
|
||||||
|
Change in interest rates
|
Percent change
|
|||||
|
(In basis points)
|
in net portfolio value
|
|||||
|
+200
|
(7.96
|
%)
|
||||
|
-100
|
1.78
|
%
|
||||
The Board of Directors and Stockholders
NBT Bancorp Inc.:
We have audited the accompanying consolidated balance sheets of NBT Bancorp Inc. and subsidiaries (the Company) as of December 31, 2015 and 2014, and the related consolidated statements of income, comprehensive income, changes in stockholders' equity and cash flows for each of the years in the three-year period ended December 31, 2015. These consolidated financial statements are the responsibility of the Company's management. Our responsibility is to express an opinion on these consolidated financial statements based on our audits.
We conducted our audits in accordance with the standards of the Public Company Accounting Oversight Board (United States). Those standards require that we plan and perform the audit to obtain reasonable assurance about whether the financial statements are free of material misstatement. An audit includes examining, on a test basis, evidence supporting the amounts and disclosures in the financial statements. An audit also includes assessing the accounting principles used and significant estimates made by management, as well as evaluating the overall financial statement presentation. We believe that our audits provide a reasonable basis for our opinion.
In our opinion, the consolidated financial statements referred to above present fairly, in all material respects, the financial position of NBT Bancorp Inc. and subsidiaries as of December 31, 2015 and 2014, and the results of their operations and their cash flows for each of the years in the three-year period ended December 31, 2015, in conformity with U.S. generally accepted accounting principles.
We also have audited, in accordance with the standards of the Public Company Accounting Oversight Board (United States), the Company's internal control over financial reporting as of December 31, 2015, based on criteria established in Internal Control — Integrated Framework (2013) issued by the Committee of Sponsoring Organizations of the Treadway Commission, and our report dated February 29, 2016 expressed an unqualified opinion on the effectiveness of the Company's internal control over financial reporting.
/S/ KPMG LLP
Albany, New York
February 29, 2016
|
|
As of December 31,
|
|||||||
|
(In thousands, except share and per share data)
|
2015
|
2014
|
||||||
|
Assets
|
||||||||
|
Cash and due from banks
|
$
|
130,593
|
$
|
139,635
|
||||
|
Short-term interest bearing accounts
|
9,704
|
7,001
|
||||||
|
Securities available for sale, at fair value
|
1,174,544
|
1,013,171
|
||||||
|
Securities held to maturity (fair value $473,140 and $454,994)
|
471,031
|
454,361
|
||||||
|
Trading securities
|
8,377
|
7,793
|
||||||
|
Federal Reserve and Federal Home Loan Bank stock
|
36,673
|
32,626
|
||||||
|
Loans
|
5,883,133
|
5,595,271
|
||||||
|
Less allowance for loan losses
|
63,018
|
66,359
|
||||||
|
Net loans
|
5,820,115
|
5,528,912
|
||||||
|
Premises and equipment, net
|
88,826
|
89,258
|
||||||
|
Goodwill
|
265,957
|
263,634
|
||||||
|
Intangible assets, net
|
17,265
|
20,317
|
||||||
|
Bank owned life insurance
|
117,044
|
114,251
|
||||||
|
Other assets
|
122,517
|
136,381
|
||||||
|
Total assets
|
$
|
8,262,646
|
$
|
7,807,340
|
||||
|
Liabilities
|
||||||||
|
Demand (noninterest bearing)
|
$
|
1,998,165
|
$
|
1,838,622
|
||||
|
Savings, NOW, and money market
|
3,697,851
|
3,417,160
|
||||||
|
Time
|
908,827
|
1,043,823
|
||||||
|
Total deposits
|
6,604,843
|
6,299,605
|
||||||
|
Short-term borrowings
|
442,481
|
316,802
|
||||||
|
Long-term debt
|
130,447
|
130,945
|
||||||
|
Junior subordinated debt
|
101,196
|
101,196
|
||||||
|
Other liabilities
|
101,675
|
94,611
|
||||||
|
Total liabilities
|
7,380,642
|
6,943,159
|
||||||
|
Stockholders' equity
|
||||||||
|
Preferred stock, $0.01 par value; authorized 2,500,000 shares at December 31, 2015 and 2014
|
-
|
-
|
||||||
|
Common stock, $0.01 par value; authorized 100,000,000 shares at December 31, 2015 and December 31, 2014; issued 49,651,494 at December 31, 2015 and 2014
|
497
|
497
|
||||||
|
Additional paid-in-capital
|
576,726
|
576,504
|
||||||
|
Retained earnings
|
462,232
|
423,956
|
||||||
|
Accumulated other comprehensive loss
|
(22,418
|
)
|
(17,027
|
)
|
||||
|
Common stock in treasury, at cost, 6,220,792 and 5,755,040 shares at December 31, 2015 and 2014, respectively
|
(135,033
|
)
|
(119,749
|
)
|
||||
|
Total stockholders' equity
|
882,004
|
864,181
|
||||||
|
Total liabilities and stockholders' equity
|
$
|
8,262,646
|
$
|
7,807,340
|
||||
See accompanying notes to consolidated financial statements.
|
|
Years ended December 31,
|
|||||||||||
|
(In thousands, except per share data)
|
2015
|
2014
|
2013
|
|||||||||
|
Interest, fee, and dividend income
|
||||||||||||
|
Interest and fees on loans
|
$
|
241,828
|
$
|
243,324
|
$
|
238,672
|
||||||
|
Securities available for sale
|
20,418
|
24,464
|
25,510
|
|||||||||
|
Securities held to maturity
|
9,233
|
5,261
|
2,660
|
|||||||||
|
Other
|
1,745
|
2,032
|
1,881
|
|||||||||
|
Total interest, fee, and dividend income
|
273,224
|
275,081
|
268,723
|
|||||||||
|
Interest expense
|
||||||||||||
|
Deposits
|
14,257
|
13,638
|
16,290
|
|||||||||
|
Short-term borrowings
|
783
|
845
|
515
|
|||||||||
|
Long-term debt
|
3,355
|
6,555
|
11,755
|
|||||||||
|
Junior subordinated debt
|
2,221
|
2,165
|
2,084
|
|||||||||
|
Total interest expense
|
20,616
|
23,203
|
30,644
|
|||||||||
|
Net interest income
|
252,608
|
251,878
|
238,079
|
|||||||||
|
Provision for loan losses
|
18,285
|
19,539
|
22,424
|
|||||||||
|
Net interest income after provision for loan losses
|
234,323
|
232,339
|
215,655
|
|||||||||
|
Noninterest income
|
||||||||||||
|
Insurance and other financial services revenue
|
24,211
|
24,517
|
24,447
|
|||||||||
|
Service charges on deposit accounts
|
17,056
|
17,941
|
19,307
|
|||||||||
|
ATM and debit card fees
|
18,248
|
17,135
|
15,558
|
|||||||||
|
Retirement plan administration fees
|
14,146
|
12,129
|
11,497
|
|||||||||
|
Trust
|
19,026
|
18,950
|
16,682
|
|||||||||
|
Bank owned life insurance income
|
4,334
|
5,349
|
3,793
|
|||||||||
|
Net securities gains
|
3,087
|
92
|
1,426
|
|||||||||
|
Gain on the sale of Springtone investment
|
4,179
|
19,401
|
-
|
|||||||||
|
Other
|
14,194
|
10,513
|
10,505
|
|||||||||
|
Total noninterest income
|
118,481
|
126,027
|
103,215
|
|||||||||
|
Noninterest expense
|
||||||||||||
|
Salaries and employee benefits
|
124,318
|
119,667
|
113,580
|
|||||||||
|
Occupancy
|
22,095
|
22,128
|
20,720
|
|||||||||
|
Data processing and communications
|
16,588
|
16,137
|
15,353
|
|||||||||
|
Professional fees and outside services
|
13,407
|
14,426
|
13,309
|
|||||||||
|
Equipment
|
13,408
|
12,658
|
11,493
|
|||||||||
|
Office supplies and postage
|
6,367
|
6,983
|
6,563
|
|||||||||
|
FDIC expenses
|
5,145
|
4,944
|
4,960
|
|||||||||
|
Advertising
|
2,654
|
2,831
|
3,204
|
|||||||||
|
Amortization of intangible assets
|
4,864
|
5,047
|
4,872
|
|||||||||
|
Loan collection and other real estate owned
|
2,620
|
3,248
|
2,619
|
|||||||||
|
Merger expenses
|
-
|
-
|
12,364
|
|||||||||
|
Prepayment penalties on long term debt
|
-
|
17,902
|
-
|
|||||||||
|
Other
|
24,710
|
20,092
|
19,890
|
|||||||||
|
Total noninterest expense
|
236,176
|
246,063
|
228,927
|
|||||||||
|
Income before income tax expense
|
116,628
|
112,303
|
89,943
|
|||||||||
|
Income tax expense
|
40,203
|
37,229
|
28,196
|
|||||||||
|
Net income
|
$
|
76,425
|
$
|
75,074
|
$
|
61,747
|
||||||
|
Earnings per share
|
||||||||||||
|
Basic
|
$
|
1.74
|
$
|
1.71
|
$
|
1.47
|
||||||
|
Diluted
|
1.72
|
1.69
|
1.46
|
|||||||||
See accompanying notes to consolidated financial statements.
|
|
Years ended December 31,
|
|||||||||||
|
(In thousands)
|
2015
|
2014
|
2013
|
|||||||||
|
Net income
|
$
|
76,425
|
$
|
75,074
|
$
|
61,747
|
||||||
|
Other comprehensive (loss) income, net of tax
|
||||||||||||
|
Unrealized net holding gains (losses) arising during the year (pre-tax amounts of $(3,159), $18,069, and $(41,059))
|
(1,930
|
)
|
10,933
|
(24,794
|
)
|
|||||||
|
Reclassification adjustment for net gains related to securities available for sale included in net income (pre-tax amounts of $3,087, $92, and $1,426)
|
(1,886
|
)
|
(56
|
)
|
(861
|
)
|
||||||
|
Amortization of unrealized net gains and losses related to the reclassification of available for sale investment securities to held to maturity (pre-tax amounts of $(1,311), $(421), and $0)
|
801
|
257
|
-
|
|||||||||
|
Pension and other benefits:
|
||||||||||||
|
Amortization of prior service cost and actuarial gains (pre-tax amounts of $2,239, $75, and $2,790)
|
1,371
|
46
|
1,601
|
|||||||||
|
(Increase) decrease in prior service costs and unrecognized actuarial loss (pre-tax amounts of $(6,144), $(19,245) , and $21,923)
|
(3,747
|
)
|
(11,442
|
)
|
13,169
|
|||||||
|
Total other comprehensive (loss) income
|
(5,391
|
)
|
(262
|
)
|
(10,885
|
)
|
||||||
|
Comprehensive income
|
$
|
71,034
|
$
|
74,812
|
$
|
50,862
|
||||||
See accompanying notes to consolidated financial statements.
|
(In thousands except share and per share data)
|
Common
stock
|
Additional
paid-in-
capital
|
Retained
earnings
|
Accumulated
other
comprehensive
(loss) income
|
Common
stock in
treasury
|
Total
|
||||||||||||||||||
|
Balance at December 31, 2012
|
$
|
393
|
$
|
346,692
|
$
|
357,558
|
$
|
(5,880
|
)
|
$
|
(116,490
|
)
|
$
|
582,273
|
||||||||||
|
Net income
|
-
|
-
|
61,747
|
-
|
-
|
61,747
|
||||||||||||||||||
|
Cash dividends - $0.81 per share
|
-
|
-
|
(33,518
|
)
|
-
|
-
|
(33,518
|
)
|
||||||||||||||||
|
Purchase of 584,925 treasury shares
|
-
|
-
|
-
|
-
|
(12,459
|
)
|
(12,459
|
)
|
||||||||||||||||
|
Net issuance of 10,346,363 shares for acquisition
|
104
|
225,447
|
-
|
-
|
(5,779
|
)
|
219,772
|
|||||||||||||||||
|
Net issuance of 385,219 shares to employee stock plans, including tax benefit
|
-
|
(2,292
|
)
|
-
|
-
|
7,626
|
5,334
|
|||||||||||||||||
|
Stock-based compensation
|
-
|
4,305
|
-
|
-
|
-
|
4,305
|
||||||||||||||||||
|
Other comprehensive loss
|
-
|
-
|
-
|
(10,885
|
)
|
-
|
(10,885
|
)
|
||||||||||||||||
|
Balance at December 31, 2013
|
$
|
497
|
$
|
574,152
|
$
|
385,787
|
$
|
(16,765
|
)
|
$
|
(127,102
|
)
|
$
|
816,569
|
||||||||||
|
Net income
|
-
|
-
|
75,074
|
-
|
-
|
75,074
|
||||||||||||||||||
|
Cash dividends - $0.84 per share
|
-
|
-
|
(36,905
|
)
|
-
|
-
|
(36,905
|
)
|
||||||||||||||||
|
Purchase of 3,288 treasury shares
|
-
|
-
|
-
|
-
|
(72
|
)
|
(72
|
)
|
||||||||||||||||
|
Net issuance of 386,692 shares to employee stock plans, including tax benefit
|
-
|
(1,169
|
)
|
-
|
-
|
7,425
|
6,256
|
|||||||||||||||||
|
Stock-based compensation
|
-
|
3,521
|
-
|
-
|
-
|
3,521
|
||||||||||||||||||
|
Other comprehensive loss
|
-
|
-
|
-
|
(262
|
)
|
-
|
(262
|
)
|
||||||||||||||||
|
Balance at December 31, 2014
|
$
|
497
|
$
|
576,504
|
$
|
423,956
|
$
|
(17,027
|
)
|
$
|
(119,749
|
)
|
$
|
864,181
|
||||||||||
|
Net income
|
-
|
-
|
76,425
|
-
|
-
|
76,425
|
||||||||||||||||||
|
Cash dividends - $0.87 per share
|
-
|
-
|
(38,149
|
)
|
-
|
-
|
(38,149
|
)
|
||||||||||||||||
|
Purchase of 1,047,152 treasury shares
|
-
|
-
|
-
|
-
|
(26,797
|
)
|
(26,797
|
)
|
||||||||||||||||
|
Net issuance of 581,400 shares to employee stock plans, including tax benefit
|
-
|
(3,864
|
)
|
-
|
-
|
11,513
|
7,649
|
|||||||||||||||||
|
Stock-based compensation
|
-
|
4,086
|
-
|
-
|
-
|
4,086
|
||||||||||||||||||
|
Other comprehensive loss
|
-
|
-
|
-
|
(5,391
|
)
|
-
|
(5,391
|
)
|
||||||||||||||||
|
Balance at December 31, 2015
|
$
|
497
|
$
|
576,726
|
$
|
462,232
|
$
|
(22,418
|
)
|
$
|
(135,033
|
)
|
$
|
882,004
|
||||||||||
See accompanying notes to consolidated financial statements.
|
|
Years ended December 31,
|
|||||||||||
|
(In thousands)
|
2015
|
2014
|
2013
|
|||||||||
|
Operating activities
|
||||||||||||
|
Net income
|
$
|
76,425
|
$
|
75,074
|
$
|
61,747
|
||||||
|
Adjustments to reconcile net income to net cash provided by operating activities
|
||||||||||||
|
Provision for loan losses
|
18,285
|
19,539
|
22,424
|
|||||||||
|
Depreciation and amortization of premises and equipment
|
8,646
|
8,324
|
7,948
|
|||||||||
|
Net accretion on securities
|
2,554
|
3,216
|
5,058
|
|||||||||
|
Amortization of intangible assets
|
4,864
|
5,047
|
4,872
|
|||||||||
|
Stock based compensation
|
4,086
|
3,521
|
4,305
|
|||||||||
|
Bank owned life insurance income
|
(4,334
|
)
|
(5,349
|
)
|
(3,793
|
)
|
||||||
|
Trading security purchases
|
(810
|
)
|
(1,626
|
)
|
(1,085
|
)
|
||||||
|
(Gains) losses in trading securities
|
226
|
(388
|
)
|
(776
|
)
|
|||||||
|
Proceeds from sale of loans held for sale
|
72,498
|
7,050
|
71,342
|
|||||||||
|
Originations and purchases of loans held for sale
|
(69,677
|
)
|
(10,215
|
)
|
(66,512
|
)
|
||||||
|
Net gains on sales of loans held for sale
|
(239
|
)
|
(17
|
)
|
(1,288
|
)
|
||||||
|
Net security gains
|
(3,087
|
)
|
(92
|
)
|
(1,426
|
)
|
||||||
|
Net gains on sales of other real estate owned
|
(1,337
|
)
|
(459
|
)
|
(1,106
|
)
|
||||||
|
Gain on sale of equity investment
|
(4,179
|
)
|
(19,401
|
)
|
-
|
|||||||
|
Prepayment penalties on long-term debt
|
-
|
17,902
|
-
|
|||||||||
|
Net decrease (increase) in other assets
|
15,386
|
(19,601
|
)
|
22,807
|
||||||||
|
Net increase (decrease) in other liabilities
|
5,236
|
5,286
|
(5,219
|
)
|
||||||||
|
Net cash provided by operating activities
|
124,543
|
87,811
|
119,298
|
|||||||||
|
Investing activities
|
||||||||||||
|
Net cash (used in) provided by acquisitions
|
(3,100
|
)
|
-
|
80,883
|
||||||||
|
Securities available for sale:
|
||||||||||||
|
Proceeds from maturities, calls, and principal paydowns
|
299,302
|
236,133
|
376,509
|
|||||||||
|
Proceeds from sales
|
15,091
|
189
|
27,593
|
|||||||||
|
Purchases
|
(481,262
|
)
|
(197,652
|
)
|
(353,714
|
)
|
||||||
|
Securities held to maturity:
|
||||||||||||
|
Proceeds from maturities, calls, and principal paydowns
|
79,212
|
44,756
|
34,413
|
|||||||||
|
Purchases
|
(95,272
|
)
|
(49,479
|
)
|
(84,621
|
)
|
||||||
|
Other:
|
||||||||||||
|
Net increase in loans
|
(315,363
|
)
|
(212,238
|
)
|
(255,318
|
)
|
||||||
|
Proceeds from FHLB stock redemption
|
60,852
|
78,441
|
27,409
|
|||||||||
|
Purchases of Federal Reserve and FHLB stock
|
(64,899
|
)
|
(64,203
|
)
|
(36,366
|
)
|
||||||
|
Proceeds from settlement of bank owned life insurance
|
1,541
|
6,064
|
-
|
|||||||||
|
Purchases of premises and equipment, net
|
(8,193
|
)
|
(9,003
|
)
|
(5,766
|
)
|
||||||
|
Proceeds from sale of equity investment
|
4,179
|
19,639
|
-
|
|||||||||
|
Proceeds from sales of other real estate owned
|
3,908
|
3,612
|
5,224
|
|||||||||
|
Net cash used in investing activities
|
(504,004
|
)
|
(143,741
|
)
|
(183,754
|
)
|
||||||
|
Financing activities
|
||||||||||||
|
Net increase (decrease) in deposits
|
305,238
|
409,381
|
(7,545
|
)
|
||||||||
|
Net increase (decrease) in short-term borrowings
|
125,679
|
(139,240
|
)
|
271,497
|
||||||||
|
Proceeds from issuance of long-term debt
|
-
|
120,051
|
-
|
|||||||||
|
Repayments of long-term debt
|
(498
|
)
|
(315,831
|
)
|
(163,595
|
)
|
||||||
|
Proceeds from the issuance of shares to employee benefit plans and other stock plans
|
7,649
|
6,256
|
5,334
|
|||||||||
|
Purchase of treasury stock
|
(26,797
|
)
|
(72
|
)
|
(12,459
|
)
|
||||||
|
Cash dividends and payments for fractional shares
|
(38,149
|
)
|
(36,905
|
)
|
(33,518
|
)
|
||||||
|
Net cash provided by financing activities
|
373,122
|
43,640
|
59,714
|
|||||||||
|
Net (decrease) increase in cash and cash equivalents
|
(6,339
|
)
|
(12,290
|
)
|
(4,742
|
)
|
||||||
|
Cash and cash equivalents at beginning of year
|
146,636
|
158,926
|
163,668
|
|||||||||
|
Cash and cash equivalents at end of year
|
$
|
140,297
|
$
|
146,636
|
$
|
158,926
|
||||||
|
Supplemental disclosure of cash flow information
|
Years ended December 31,
|
|||||||||||
|
Cash paid during the year for:
|
2015
|
2014
|
2013
|
|||||||||
|
Interest
|
$
|
20,908
|
$
|
23,387
|
$
|
31,307
|
||||||
|
Income taxes, net of refund
|
28,684
|
38,912
|
20,848
|
|||||||||
|
Noncash investing activities:
|
||||||||||||
|
Loans transferred to other real estate owned
|
$
|
3,293
|
$
|
4,330
|
$
|
4,746
|
||||||
|
Preferred stock acquired from sale of equity investment
|
-
|
2,762
|
-
|
|||||||||
|
Transfer of available for sale securities to held to maturity portfolio
|
-
|
332,115
|
-
|
|||||||||
|
Acquisitions:
|
||||||||||||
|
Fair value of assets acquired
|
$
|
4,100
|
$
|
-
|
$
|
1,505,490
|
||||||
|
Fair value of liabilities assumed
|
-
|
-
|
1,285,718
|
|||||||||
See accompanying notes to consolidated financial statements.
Notes to Consolidated Financial Statements
December 31, 2015 and 2014
(1) Summary of Significant Accounting Policies
The accounting and reporting policies of NBT Bancorp Inc. ("NBT Bancorp") and its subsidiaries, NBT Bank, National Association ("NBT Bank"), NBT Holdings, Inc., and NBT Financial Services, Inc., conform, in all material respects, to U.S. generally accepted accounting principles ("GAAP") and to general practices within the banking industry. Collectively, NBT Bancorp and its subsidiaries are referred to herein as "the Company."
The preparation of financial statements in conformity with GAAP requires management to make estimates and assumptions that affect the reported amounts of assets and liabilities and disclosure of contingent assets and liabilities at the date of the financial statements and the reported amounts of revenues and expenses during the reporting period. Actual results could differ from these estimates.
Estimates associated with the allowance for loan losses, income taxes, pension expense, fair values of financial instruments, status of contingencies and other-than-temporary impairment on investments are particularly susceptible to material change in the near term.
The following is a description of significant policies and practices:
Consolidation
The accompanying consolidated financial statements include the accounts of NBT Bancorp and its wholly owned subsidiaries mentioned above. All material intercompany transactions have been eliminated in consolidation. Amounts previously reported in the consolidated financial statements are reclassified whenever necessary to conform to the current year's presentation. In the "Parent Company Financial Information," the investment in subsidiaries is recorded using the equity method of accounting.
The Company determines whether it has a controlling financial interest in an entity by first evaluating whether the entity is a voting interest entity or a variable interest entity under GAAP. Voting interest entities are entities in which the total equity investment at risk is sufficient to enable the entity to finance itself independently and provides the equity holders with the obligation to absorb losses, the right to receive residual returns and the right to make decisions about the entity's activities. The Company consolidates voting interest entities in which it has all, or at least a majority of, the voting interest. As defined in applicable accounting standards, variable interest entities ("VIEs") are entities that lack one or more of the characteristics of a voting interest entity. A controlling financial interest in a VIE is present when the Company has both the power and ability to direct the activities of the VIE that most significantly impact the VIE's economic performance and an obligation to absorb losses or the right to receive benefits that could potentially be significant to the VIE. The Company's wholly owned subsidiaries CNBF Capital Trust I, NBT Statutory Trust I, NBT Statutory Trust II, Alliance Financial Capital Trust I and Alliance Financial Capital Trust II are VIEs for which the Company is not the primary beneficiary. Accordingly, the accounts of these entities are not included in the Company's consolidated financial statements.
Segment Report
The Company's operations are primarily in the community banking industry and include the provision of traditional banking services. The Company also provides other services through its subsidiaries such as insurance, retirement plan administration, and trust administration. The Company operates solely in the geographical regions of central and upstate New York, northeastern Pennsylvania, western Massachusetts, southern New Hampshire, Vermont, and the greater Portland, Maine area. The Company has no reportable operating segments.
Cash Equivalents
The Company considers amounts due from correspondent banks, cash items in process of collection, and institutional money market mutual funds to be cash equivalents for purposes of the consolidated statements of cash flows.
Securities
The Company classifies its securities at date of purchase as either available for sale, held to maturity or trading. Held to maturity debt securities are those that the Company has the ability and intent to hold until maturity. Trading securities are securities purchased with the intent to sell within a short period of time. Available for sale securities are securities that are not classified as a held to maturity or trading securities. Available for sale securities are recorded at fair value. Unrealized holding gains and losses, net of the related tax effect, on available for sale securities are excluded from earnings and are reported in stockholders' equity and the statement of comprehensive income as a component of accumulated other comprehensive income or loss. Held to maturity securities are recorded at amortized cost. Trading securities are recorded at fair value, with net unrealized gains and losses recognized in income. Transfers of securities between categories are recorded at fair value at the date of transfer. Declines in the fair value of held-to-maturity and available-for-sale securities below their cost that are deemed to be other than temporary are reflected in earnings as realized losses or in other comprehensive income, depending on whether the Company intends to sell the security or more likely than not will be required to sell the security before recovery of its amortized cost basis less any current-period credit loss. If the Company intends to sell the security or more likely than not will be required to sell the security before recovery of its amortized cost basis less any current-period credit loss, the other-than-temporary impairment shall be recognized in earnings equal to the entire difference between the investment's amortized cost basis and its fair value at the balance sheet date. If the Company does not intend to sell the security and it is not more likely than not that the entity will be required to sell the security before recovery of its amortized cost basis less any current-period credit loss, the other-than-temporary impairment shall be separated into (a) the amount representing the credit loss and (b) the amount related to all other factors. The amount of the total other-than-temporary impairment related to the credit loss shall be recognized in earnings. The amount of the total other-than-temporary impairment related to other factors shall be recognized in other comprehensive income, net of applicable taxes.
In estimating other-than-temporary impairment losses, management considers, among other things, (i) the length of time and the extent to which the fair value has been less than cost, (ii) the financial condition and near-term prospects of the issuer, and (iii) the historical and implied volatility of the fair value of the security.
Non-marketable equity securities are carried at cost.
Premiums and discounts are amortized or accreted over the life of the related security as an adjustment to yield using the interest method. Dividend and interest income are recognized when earned. Realized gains and losses on securities sold are derived using the specific identification method for determining the cost of securities sold.
Investments in Federal Reserve Bank ("FRB") and Federal Home Loan Bank ("FHLB") stock are required for membership in those organizations and are carried at cost since there is no market value available. The FHLB New York continues to pay dividends and repurchase stock. As such, the Company has not recognized any impairment on its holdings of FHLB stock.
Loans
Loans are recorded at their current unpaid principal balance, net of unearned income and unamortized loan fees and expenses, which are amortized under the effective interest method over the estimated lives of the loans. Interest income on loans is accrued based on the principal amount outstanding.
For all loan classes within the Company's loan portfolio, loans are placed on nonaccrual status when timely collection of principal and interest in accordance with contractual terms is doubtful. Loans are transferred to nonaccrual status generally when principal or interest payments become ninety days delinquent, unless the loan is well secured and in the process of collection, or sooner when management concludes circumstances indicate that borrowers may be unable to meet contractual principal or interest payments. When a loan is transferred to a nonaccrual status, all interest previously accrued in the current period but not collected is reversed against interest income in that period. Interest accrued in a prior period and not collected is charged-off against the allowance for loan losses.
If ultimate repayment of a nonaccrual loan is expected, any payments received are applied in accordance with contractual terms. If ultimate repayment of principal is not expected, any payment received on a nonaccrual loan is applied to principal until ultimate repayment becomes expected. For all loan classes within the Company's loan portfolio, nonaccrual loans are returned to accrual status when they become current as to principal and interest and demonstrate a period of performance under the contractual terms and, in the opinion of management, are fully collectible as to principal and interest. For loans in all portfolios, the principal amount is charged off in full or in part as soon as management determines, based on available facts, that the collection of principal in full is improbable. For commercial loans, management considers specific facts and circumstances relative to individual credits in making such a determination. For consumer and residential loan classes, management uses specific guidance and thresholds from the Federal Financial Institutions Examination Council's Uniform Retail Credit Classification and Account Management Policy.
Commercial type loans are considered impaired when it is probable that the borrower will not repay the loan according to the original contractual terms of the loan agreement, and all loan types are considered impaired if the loan is restructured in a troubled debt restructuring ("TDR"). In determining that we will be unable to collect all principal and interest payments due in accordance with the contractual terms of the loan agreements, we consider factors such as payment history and changes in the financial condition of individual borrowers, local economic conditions, historical loss experience and the conditions of the various markets in which the collateral may be liquidated.
A loan is considered to be a TDR when the Company grants a concession to the borrower because of the borrower's financial condition that the Company would not otherwise consider. Such concessions include the reduction of interest rates, forgiveness of all or a portion of principal or interest, or other modifications at interest rates that are less than the current market rate for new obligations with similar risk. TDR loans are nonaccrual loans; however, they can be returned to accrual status after a period of performance, generally evidenced by six months of compliance with their modified terms.
When the Company modifies a loan, management evaluates any possible impairment based on the present value of the expected future cash flows, discounted at the contractual interest rate of the original loan agreement, except when the sole (remaining) source of repayment for the loan is the operation or liquidation of the collateral. In these cases, management uses the current fair value of the collateral, less selling costs, instead of discounted cash flows. If management determines that the value of the modified loan is less than the recorded investment in the loan (net of previous charge-offs, deferred loan fees or costs and unamortized premium or discount), impairment is recognized.
Acquired Loans
Acquired loans are initially measured at fair value as of the acquisition date without carryover of historical allowance for loan losses.
For loans that meet the criteria stipulated in ASC 310-30, the Company shall recognize the accretable yield, which is defined as the excess of all cash flows expected at acquisition over the initial fair value of the loan, as interest income on a level-yield basis over the expected remaining life of the loan. The excess of the loan's contractually required payments over the cash flows expected to be collected is the nonaccretable difference. The nonaccretable difference shall not be recognized as an adjustment of yield, a loss accrual, or a valuation allowance. Decreases in the expected cash flows in subsequent periods require the establishment of an allowance for loan losses. Improvements in expected cash flows in future periods result in a reduction of the nonaccretable discount, with such amount reclassified as part of the accretable yield and subsequently recognized in interest income over the remaining lives of the acquired loans on a level-yield basis if the amount and timing of future cash flows is reasonably estimable.
Acquired loans that met the criteria for nonaccrual of interest prior to the acquisition are considered performing upon acquisition, regardless of whether the customer is contractually delinquent, if the Company can reasonably estimate the timing and amount of the expected cash flows on such loans and if the Company expects to fully collect the new carrying value of the loans. As such, the Company may no longer consider the loan to be nonaccrual or nonperforming and may accrue interest on these loans, including the impact of any accretable yield. As such, charge-offs on acquired loans are first applied to the nonaccretable difference and then to any allowance for loan losses recognized subsequent to acquisition.
For loans that meet the criteria stipulated in ASC 310-20, the Company shall amortize/accrete into interest income the premium/discount determined at the date of purchase on a level-yield basis over the life of the loan. Subsequent to the acquisition date, the methods utilized to estimate the required allowance for loan losses are similar to originated loans. Loans accounted for under ASC 310-20 are placed on nonaccrual status when past due in accordance with the Company's nonaccrual policy.
An acquired loan may be resolved either through receipt of payment (in full or in part) from the borrower, the sale of the loan to a third party, or foreclosure of the collateral. In the event of a sale of the loan, a gain or loss on sale is recognized and reported within noninterest income based on the difference between the sales proceeds and the carrying amount of the loan. In other cases, individual loans are removed from the pool based on comparing the amount received from its resolution (fair value of the underlying collateral less costs to sell in the case of a foreclosure) with its outstanding balance. Any difference between these amounts is recorded as a charge-off through the allowance for loan losses. Acquired loans subject to modification are not removed from the pool even if those loans would otherwise be deemed troubled debt restructurings as the pool, and not the individual loan, represents the unit of account.
Allowance for Loan Losses
The allowance for loan losses is the amount which, in the opinion of management, is necessary to absorb probable losses inherent in the loan portfolio. The allowance is determined based upon numerous considerations, including local and regional conditions, the growth and composition of the loan portfolio with respect to the mix between the various types of loans and their related risk characteristics, a review of the value of collateral supporting the loans, comprehensive reviews of the loan portfolio by the independent loan review staff and management, as well as consideration of volume and trends of delinquencies, nonperforming loans, and loan charge-offs. Loan losses are charged off against the allowance, while recoveries of amounts previously charged off are credited to the allowance. As a result of tests of adequacy, required additions to the allowance for loan losses are made periodically by charges to the provision for loan losses.
The allowance for loan losses related to impaired loans specifically allocated for impairment is based on discounted expected cash flows using the loan's initial effective interest rate or the fair value of the collateral for certain loans where repayment of the loan is expected to be provided solely by the underlying collateral (collateral dependent loans). The Company's impaired loans are generally collateral dependent. The Company considers the estimated cost to sell, on a discounted basis, when determining the fair value of collateral in the measurement of impairment if those costs are expected to reduce the cash flows available to repay or otherwise satisfy the loans.
The allowance for loan losses for homogeneous non impaired loans is calculated using a systematic methodology with both a quantitative and a qualitative analysis that is applied on a quarterly basis. For purposes of our allowance methodology, the loan portfolio is segmented as described in Note 5, Allowance for Loan Loss and Credit Quality of Loans. Each segment has a distinct set of risk characteristics monitored by management. We further assess and monitor risk and performance at a more disaggregated level which includes our internal risk grading system for the commercial segments.
We first apply historical loss rates to pools of loans with similar risk characteristics. Loss rates are calculated by historical charge-offs that have occurred within each pool of loans over the loss emergence period, or LEP. The LEP is an estimate of the average amount of time from the point at which a loss is incurred on a loan to the point at which the loss is confirmed. In general, the LEP will be shorter in an economic slowdown or recession and longer during times of economic stability or growth, as customers are better able to delay loss confirmation after a potential loss event has occurred. In conjunction with our annual review of the ALL assumptions, we update our study of LEPs for each portfolio segment using our loan charge-off history. Another key assumption is the look-back period, or LBP, which represents the historical data period utilized to calculate loss rates.
After consideration of the historic loss analysis, management applies additional qualitative adjustments so that the allowance for loan losses is reflective of the inherent losses that exist in the loan portfolio at the balance sheet date. Qualitative adjustments are made based upon size, trend, composition, and nature of loans; changes in lending policies and procedures, including underwriting standards and collection, charge-offs and recoveries; trends experienced in nonperforming and delinquent loans; current economic conditions in the Company's market; portfolio concentrations that may affect loss experience across one of more components of the portfolio; the effect of external factors such as competition, legal and regulatory requirements; and the experience, ability, and depth of lending management and staff. The evaluation of the various components of the allowance for loan losses requires considerable judgment in order to estimate inherent loss exposures. In addition, various regulatory agencies, as an integral component of their examination process, periodically review the Company's allowance for loan losses. Such agencies may require the Company to make loan grade changes as well as recognize additions to the allowance based on their examinations.
Management believes that the allowance for loan losses is adequate. While management uses available information to recognize loan losses, future additions to the allowance for loan losses may be necessary based on changes in economic conditions or changes in the values of properties securing loans in the process of foreclosure. In addition, various regulatory agencies, as an integral part of their examination process, periodically review the Company's allowance for loan losses. Such agencies may require the Company to recognize additions to the allowance for loan losses based on their judgments about information available to them at the time of their examination which may not be currently available to management.
Premises and Equipment
Premises and equipment are stated at cost, less accumulated depreciation. Depreciation of premises and equipment is determined using the straight-line method over the estimated useful lives of the respective assets. Expenditures for maintenance, repairs, and minor replacements are charged to expense as incurred.
Other Real Estate Owned
OREO consists of properties acquired through foreclosure or by acceptance of a deed in lieu of foreclosure. These assets are recorded at the lower of fair value of the asset acquired less estimated costs to sell or "cost" (defined as the fair value at initial foreclosure). At the time of foreclosure, or when foreclosure occurs in-substance, the excess, if any, of the loan over the fair market value of the assets received, less estimated selling costs, is charged to the allowance for loan losses and any subsequent valuation write-downs are charged to other expense. In connection with the determination of the allowance for loan losses and the valuation of other real estate owned, management obtains appraisals for properties. Operating costs associated with the properties are charged to expense as incurred. Gains on the sale of OREO are included in income when title has passed and the sale has met the minimum down payment requirements prescribed by GAAP. The balance of OREO at December 31, 2015 and 2014 was approximately $4.7 million and $4.0 million, respectively, and is recorded in Other Assets on the Consolidated Balance Sheet.
Goodwill and Other Intangible Assets
Goodwill and intangible assets that have indefinite useful lives are not amortized, but are tested at least annually for impairment. Intangible assets that have finite useful lives are amortized over their useful lives. Core deposit intangibles and trust intangibles at the Company are amortized using the sum-of-the-years'-digits method. Covenants not to compete are amortized on a straight-line basis. Customer lists are amortized using an accelerated method.
When facts and circumstances indicate potential impairment of amortizable intangible assets, the Company evaluates the recoverability of the asset carrying value, using estimates of undiscounted future cash flows over the remaining asset life. Any impairment loss is measured by the excess of carrying value over fair value. Goodwill impairment tests are performed on an annual basis or when events or circumstances dictate. In these tests, the fair values of each reporting unit, or segment, is compared to the carrying amount of that reporting unit in order to determine if impairment is indicated. If so, the implied fair value of the reporting unit's goodwill is compared to its carrying amount and the impairment loss is measured by the excess of the carrying value over fair value.
Bank-Owned Life Insurance
The Bank has purchased life insurance policies on certain employees, key executives and directors. Bank-owned life insurance is recorded at the amount that can be realized under the insurance contract at the balance sheet date, which is the cash surrender value adjusted for other charges or other amounts due that are probable at settlement.
Treasury Stock
Treasury stock acquisitions are recorded at cost. Subsequent sales of treasury stock are recorded on an average cost basis. Gains on the sale of treasury stock are credited to additional paid-in-capital. Losses on the sale of treasury stock are charged to additional paid-in-capital to the extent of previous gains, otherwise charged to retained earnings.
Income Taxes
Income taxes are accounted for under the asset and liability method. Deferred income taxes are recognized for the future tax consequences attributable to differences between the financial statement carrying amounts of existing assets and liabilities and their respective tax bases. Deferred tax assets and liabilities are measured using enacted tax rates expected to apply to taxable income in the years in which those temporary differences are expected to be recovered or settled. The effect on deferred taxes of a change in tax rates is recognized in income in the period that includes the enactment date. The Company recognizes interest accrued and penalties related to unrecognized tax benefits in income tax expense.
Tax positions are recognized as a benefit only if it is "more likely than not" that the tax position would be sustained in a tax examination, with a tax examination being presumed to occur. The amount recognized is the largest amount of tax benefit that is greater than 50 percent likely of being realized on examination. For tax positions not meeting the "more likely than not" test, no tax benefit is recorded.
Stock-Based Compensation
We maintain various long-term incentive stock benefit plans under which we grant stock options, restricted stock awards, and restricted stock units to certain directors and key employees. We recognize compensation expense in our income statement over the requisite service period, based on the grant-date fair value of the award. For restricted stock awards and units, we recognize compensation expense ratably over the vesting period for the fair value of the award, measured at the grant date. The fair values of options are estimated using the Black-Scholes option pricing model.
The Company's stock-based employee compensation plan is described in Note 14 "Stock-Based Compensation," of this Report.
Interest Rate Swaps
The Bank offers interest rate swap agreements to its customers. These agreements allow the Bank's customers to effectively fix the interest rate on a variable rate loan by entering into a separate agreement. Simultaneous with the execution of such an agreement with a customer, the Bank enters into a matching interest rate swap agreement with an unrelated third party provider, which allows the Bank to continue to receive the historical variable rate under the loan agreement with the customer. The agreement with the third party is not a hedge contract therefore changes in fair value are recorded through earnings. Assets and liabilities associated with the agreements are recorded in other assets and other liabilities on the balance sheet. Gains and losses are recorded as other noninterest income. The Bank is not subject to any fee or penalty should the customer elect to terminate the interest rate swap agreement prior to maturity. The Bank is exposed to credit loss equal to the fair value of the derivatives (not the notional amount of the derivatives) in the event of nonperformance by the counterparty to the interest rate swap agreements. Additionally, the Bank receives a fee from the customer that is recognized when the Bank has fulfilled its obligations under each agreement, which is generally upon execution of the agreement with the Bank's customer. Since the terms of the forty one interest rate swap agreements with the customers are identical to the related swaps with the third party, the income statement impact to the Bank is generally limited to the fees it receives from the customer.
Other Financial Instruments
The Company is a party to certain other financial instruments with off-balance-sheet risk such as commitments to extend credit, unused lines of credit, as well as certain mortgage loans sold to investors with recourse. The Company's policy is to record such instruments when funded.
Standby letters of credit are conditional commitments issued to guarantee the performance of a customer to a third party. The credit risk involved in issuing letters of credit is essentially the same as that involved in extending loan facilities to customers. Under the standby letters of credit, the Company is required to make payments to the beneficiary of the letters of credit upon request by the beneficiary contingent upon the customer's failure to perform under the terms of the underlying contract with the beneficiary. Standby letters of credit typically have one year expirations with an option to renew upon annual review. The Company typically receives a fee for these transactions. The fair value of stand-by letters of credit is recorded upon inception.
Loan Sales and Loan Servicing
Loan sales are recorded when the sales are funded. Mortgage servicing rights are recorded at fair value upon sale of the loan. Loans held for sale are recorded at the lower of cost or market.
Repurchase Agreements
Repurchase agreements are accounted for as secured financing transactions since the Company maintains effective control over the transferred securities and the transfer meets the other criteria for such accounting. Obligations to repurchase securities sold are reflected as a liability in the Consolidated Balance Sheets. The securities underlying the agreements are delivered to a custodial account for the benefit of the dealer or bank with whom each transaction is executed. The dealers or banks, who may sell, loan or otherwise dispose of such securities to other parties in the normal course of their operations, agree to resell to the Company the same securities at the maturities of the agreements.
Earnings Per Share
Basic earnings per share (EPS) excludes dilution and is computed by dividing income available to common stockholders by the weighted average number of common shares outstanding for the period. Diluted EPS reflects the potential dilution that could occur if securities or other contracts to issue common stock were exercised or converted into common stock or resulted in the issuance of common stock that then shared in the earnings of the entity (such as the Company's dilutive stock options and restricted stock).
Subsequent Events
The Company has evaluated subsequent events for potential recognition and/or disclosure and there were none identified.
Comprehensive Income
At the Company, comprehensive income represents net income plus other comprehensive income (loss), which consists primarily of the net change in unrealized gains or losses on securities available for sale for the period and changes in the funded status of employee benefit plans. Accumulated other comprehensive (loss) income represents the net unrealized gains or losses on securities available for sale and the previously unrecognized portion of the funded status of employee benefit plans, net of income taxes, as of the consolidated balance sheet dates.
Pension Costs
The Company maintains a noncontributory, defined benefit pension plan covering substantially all employees, as well as supplemental employee retirement plans covering certain executives and a defined benefit postretirement healthcare plan that covers certain employees. Costs associated with these plans, based on actuarial computations of current and future benefits for employees, are charged to current operating expenses.
Trust Operations
Assets held by the Company in a fiduciary or agency capacity for its customers are not included in the accompanying consolidated balance sheets, since such assets are not assets of the Company. Trust income is recognized on the accrual method based on contractual rates applied to the balances of trust accounts.
Fair Value Measurements
Fair value is an exit price, representing the amount that would be received to sell an asset or paid to transfer a liability in an orderly transaction between market participants. Fair value measurements are not adjusted for transaction costs. A fair value hierarchy prioritizes the inputs to valuation techniques used to measure fair value. The hierarchy gives the highest priority to unadjusted quoted prices in active markets for identical assets or liabilities (level 1 measurements) and the lowest priority to unobservable inputs (level 3 measurements). The three levels of the fair value hierarchy are described below:
Level 1 - Unadjusted quoted prices in active markets that are accessible at the measurement date for identical, unrestricted assets or liabilities;
Level 2 - Quoted prices for similar assets or liabilities in active markets, quoted prices in markets that are not active, or inputs that are observable, either directly or indirectly, for substantially the full term of the asset or liability;
Level 3 - Prices or valuation techniques that require inputs that are both significant to the fair value measurement and unobservable (i.e., supported by little or no market activity).
A financial instrument's level within the fair value hierarchy is based on the lowest level of input that is significant to the fair value measurement.
The types of instruments valued based on quoted market prices in active markets include most U.S. government and agency securities, many other sovereign government obligations, liquid mortgage products, active listed equities and most money market securities. Such instruments are generally classified within level 1 or level 2 of the fair value hierarchy. The Company does not adjust the quoted price for such instruments.
The types of instruments valued based on quoted prices in markets that are not active, broker or dealer quotations, or alternative pricing sources with reasonable levels of price transparency include most investment-grade and high-yield corporate bonds, less liquid mortgage products, less liquid agency securities, less liquid listed equities, state, municipal and provincial obligations, and certain physical commodities. Such instruments are generally classified within level 2 of the fair value hierarchy.
Level 3 is for positions that are not traded in active markets or are subject to transfer restrictions, valuations are adjusted to reflect illiquidity and/or non-transferability, and such adjustments are generally based on available market evidence. In the absence of such evidence, management's best estimate will be used. Management's best estimate consists of both internal and external support on certain Level 3 investments. Subsequent to inception, management only changes Level 3 inputs and assumptions when corroborated by evidence such as transactions in similar instruments, completed or pending third-party transactions in the underlying investment or comparable entities, subsequent rounds of financing, recapitalizations and other transactions across the capital structure, offerings in the equity or debt markets, and changes in financial ratios or cash flows.
(2) Acquisitions
Acquisition of Alliance Financial Corporation
On March 8, 2013, the Company acquired Alliance Financial Corporation ("Alliance"), the parent company of Alliance Bank, N.A., for total consideration of $226 million. As part of the acquisition, Alliance was merged with and into the Company and Alliance Bank, with 26 branch locations in the central New York counties of Onondaga, Cortland, Madison, Oneida and Oswego, was merged with and into the Bank. The merger with Alliance enabled the Company to expand its footprint into demographically attractive and contiguous markets located in the aforementioned New York counties. Alliance operations were integrated into the Company and were included in the Consolidated Statements of Income from the date of acquisition.
In 2015, the Company acquired Third Party Administrators, Inc. ("TPA"), a retirement plan administration company for total consideration of $4.1 million. As part of the acquisition, the Company recorded goodwill of approximately $2.3 million.
Other Goodwill Adjustments
During the twelve months ended December 31, 2014, the Company recorded deferred tax adjustments totaling approximately ($1.0) million and valuation adjustments totaling ($0.4) related to the 2013 acquisition of Alliance resulting in a decrease in goodwill of approximately ($1.4) million in 2014.
(3) Securities
The amortized cost, estimated fair value, and unrealized gains and losses of securities available for sale are as follows:
|
(In thousands)
|
Amortized cost
|
Unrealized gains
|
Unrealized losses
|
Estimated fair value
|
||||||||||||
|
December 31, 2015
|
||||||||||||||||
|
Federal agency
|
$
|
312,580
|
$
|
203
|
$
|
1,511
|
$
|
311,272
|
||||||||
|
State & municipal
|
31,208
|
446
|
17
|
31,637
|
||||||||||||
|
Mortgage-backed:
|
||||||||||||||||
|
Government-sponsored enterprises
|
398,086
|
4,141
|
1,068
|
401,159
|
||||||||||||
|
U.S. government agency securities
|
8,191
|
560
|
14
|
8,737
|
||||||||||||
|
Collateralized mortgage obligations:
|
||||||||||||||||
|
Government-sponsored enterprises
|
364,936
|
931
|
1,828
|
364,039
|
||||||||||||
|
U.S. government agency securities
|
40,699
|
348
|
115
|
40,932
|
||||||||||||
|
Other securities
|
13,637
|
3,249
|
118
|
16,768
|
||||||||||||
|
Total securities available for sale
|
$
|
1,169,337
|
$
|
9,878
|
$
|
4,671
|
$
|
1,174,544
|
||||||||
|
December 31, 2014
|
||||||||||||||||
|
U.S. Treasury
|
$
|
23,041
|
$
|
70
|
$
|
-
|
$
|
23,111
|
||||||||
|
Federal agency
|
332,193
|
327
|
2,606
|
329,914
|
||||||||||||
|
State & municipal
|
37,035
|
587
|
52
|
37,570
|
||||||||||||
|
Mortgage-backed:
|
||||||||||||||||
|
Government-sponsored enterprises
|
339,190
|
7,597
|
224
|
346,563
|
||||||||||||
|
U.S. government securities
|
17,367
|
863
|
66
|
18,164
|
||||||||||||
|
Collateralized mortgage obligations:
|
||||||||||||||||
|
Government-sponsored enterprises
|
199,837
|
1,828
|
234
|
201,431
|
||||||||||||
|
U.S. government securities
|
40,237
|
497
|
36
|
40,698
|
||||||||||||
|
Other securities
|
12,818
|
3,054
|
152
|
15,720
|
||||||||||||
|
Total securities available for sale
|
$
|
1,001,718
|
$
|
14,823
|
$
|
3,370
|
$
|
1,013,171
|
||||||||
The following table sets forth information with regard to sales transactions of securities available for sale:
|
|
Years ended December 31
|
|||||||||||
|
(In thousands)
|
2015
|
2014
|
2013
|
|||||||||
|
Proceeds from sales
|
$
|
15,091
|
$
|
189
|
$
|
27,593
|
||||||
|
Gross realized gains
|
3,034
|
49
|
1,283
|
|||||||||
|
Net securities gains
|
$
|
3,034
|
$
|
49
|
$
|
1,283
|
||||||
In addition to gains (losses) from sales transactions, the Company also recorded gains from calls on securities available for sale of approximately $0.1 million for the year ended December 31, 2015, $0.1 million for the year ended December 31, 2014, and $0.1 million for the year ended December 31, 2013.
At December 31, 2015 and 2014, securities available for sale and held to maturity with amortized costs totaling $1.4 billion and $1.4 billion, respectively, were pledged to secure public deposits and for other purposes required or permitted by law. Additionally, at December 31, 2015, securities available for sale and held to maturity with an amortized cost of $205.9 million were pledged as collateral for securities sold under the repurchase agreements.
The amortized cost, estimated fair value, and unrealized gains and losses of securities held to maturity are as follows:
|
(In thousands)
|
Amortized
cost
|
Unrealized
gains
|
Unrealized
losses
|
Estimated
fair value
|
||||||||||||
|
December 31, 2015
|
||||||||||||||||
|
Mortgage-backed
|
||||||||||||||||
|
Government-sponsored enterprises
|
$
|
9,432
|
-
|
$
|
107
|
$
|
9,325
|
|||||||||
|
U.S. government agency securities
|
611
|
95
|
-
|
706
|
||||||||||||
|
Collateralized mortgage obligations
|
||||||||||||||||
|
Government-sponsored enterprises
|
272,550
|
1,411
|
1,560
|
272,401
|
||||||||||||
|
State & municipal
|
188,438
|
2,288
|
18
|
190,708
|
||||||||||||
|
Total securities held to maturity
|
$
|
471,031
|
$
|
3,794
|
$
|
1,685
|
$
|
473,140
|
||||||||
|
December 31, 2014
|
||||||||||||||||
|
Mortgage-backed
|
||||||||||||||||
|
U.S. government agency securities
|
$
|
755
|
$
|
113
|
$
|
-
|
$
|
868
|
||||||||
|
Collateralized mortgage obligations
|
||||||||||||||||
|
Government-sponsored enterprises
|
317,628
|
1,934
|
1,965
|
317,597
|
||||||||||||
|
State & municipal
|
135,978
|
674
|
123
|
136,529
|
||||||||||||
|
Total securities held to maturity
|
$
|
454,361
|
$
|
2,721
|
$
|
2,088
|
$
|
454,994
|
||||||||
At December 31, 2015 and 2014, all of the mortgaged-backed securities held to maturity were comprised of U.S. government agency securities.
The following table sets forth information with regard to investment securities with unrealized losses at December 31, 2015 and 2014, segregated according to the length of time the securities had been in a continuous unrealized loss position:
|
|
Less than 12 months
|
12 months or longer
|
Total
|
|||||||||||||||||||||||||||||||||
|
Security Type:
|
Fair
Value
|
Unrealized
losses
|
Number
of
Positions
|
Fair
Value
|
Unrealized
losses
|
Number
of
Positions
|
Fair
Value
|
Unrealized
losses
|
Number
of
Positions
|
|||||||||||||||||||||||||||
|
|
||||||||||||||||||||||||||||||||||||
|
December 31, 2015
|
||||||||||||||||||||||||||||||||||||
|
Investment securities available for sale:
|
||||||||||||||||||||||||||||||||||||
|
Federal agency
|
$
|
186,685
|
$
|
(1,312
|
)
|
15
|
$
|
19,801
|
$
|
(199
|
)
|
2
|
$
|
206,486
|
$
|
(1,511
|
)
|
17
|
||||||||||||||||||
|
State & municipal
|
4,599
|
(14
|
)
|
7
|
502
|
(3
|
)
|
1
|
5,101
|
(17
|
)
|
8
|
||||||||||||||||||||||||
|
Mortgage-backed
|
177,270
|
(1,068
|
)
|
33
|
1,066
|
(14
|
)
|
5
|
178,336
|
(1,082
|
)
|
38
|
||||||||||||||||||||||||
|
Collateralized mortgage obligations
|
256,265
|
(1,889
|
)
|
24
|
5,218
|
(54
|
)
|
2
|
261,483
|
(1,943
|
)
|
26
|
||||||||||||||||||||||||
|
Other securities
|
-
|
-
|
-
|
3,235
|
(118
|
)
|
2
|
3,235
|
(118
|
)
|
2
|
|||||||||||||||||||||||||
|
Total securities with unrealized losses
|
$
|
624,819
|
$
|
(4,283
|
)
|
79
|
$
|
29,822
|
$
|
(388
|
)
|
12
|
$
|
654,641
|
$
|
(4,671
|
)
|
91
|
||||||||||||||||||
|
|
||||||||||||||||||||||||||||||||||||
|
December 31, 2015
|
||||||||||||||||||||||||||||||||||||
|
Investment securities held to maturity:
|
||||||||||||||||||||||||||||||||||||
|
Mortgage-backed
|
$
|
9,325
|
$
|
(107
|
)
|
1
|
$
|
-
|
$
|
-
|
-
|
$
|
9,325
|
$
|
(107
|
)
|
1
|
|||||||||||||||||||
|
Collateralized mortgage obligations
|
105,604
|
(281
|
)
|
12
|
41,523
|
(1,279
|
)
|
4
|
147,127
|
(1,560
|
)
|
16
|
||||||||||||||||||||||||
|
State & municipal
|
2,200
|
(18
|
)
|
3
|
-
|
-
|
-
|
2,200
|
(18
|
)
|
3
|
|||||||||||||||||||||||||
|
Total securities with unrealized losses
|
$
|
117,129
|
$
|
(406
|
)
|
16
|
$
|
41,523
|
$
|
(1,279
|
)
|
4
|
$
|
158,652
|
$
|
(1,685
|
)
|
20
|
||||||||||||||||||
|
|
||||||||||||||||||||||||||||||||||||
|
December 31, 2014
|
||||||||||||||||||||||||||||||||||||
|
Investment securities available for sale:
|
||||||||||||||||||||||||||||||||||||
|
Federal agency
|
$
|
66,528
|
$
|
(226
|
)
|
8
|
$
|
198,151
|
$
|
(2,380
|
)
|
16
|
$
|
264,679
|
$
|
(2,606
|
)
|
24
|
||||||||||||||||||
|
State & municipal
|
8,818
|
(42
|
)
|
33
|
1,321
|
(10
|
)
|
5
|
10,139
|
(52
|
)
|
38
|
||||||||||||||||||||||||
|
Mortgage-backed
|
10,400
|
(36
|
)
|
10
|
35,565
|
(254
|
)
|
31
|
45,965
|
(290
|
)
|
41
|
||||||||||||||||||||||||
|
Collateralized mortgage obligations
|
57,682
|
(196
|
)
|
8
|
6,598
|
(74
|
)
|
4
|
64,280
|
(270
|
)
|
12
|
||||||||||||||||||||||||
|
Other securities
|
-
|
-
|
-
|
3,201
|
(152
|
)
|
2
|
3,201
|
(152
|
)
|
2
|
|||||||||||||||||||||||||
|
Total securities with unrealized losses
|
$
|
143,428
|
$
|
(500
|
)
|
59
|
$
|
244,836
|
$
|
(2,870
|
)
|
58
|
$
|
388,264
|
$
|
(3,370
|
)
|
117
|
||||||||||||||||||
|
December 31, 2014
|
||||||||||||||||||||||||||||||||||||
|
Investment securities held to maturity:
|
||||||||||||||||||||||||||||||||||||
|
Collateralized mortgage obligations
|
$
|
26,052
|
$
|
(49
|
)
|
2
|
$
|
46,415
|
$
|
(1,916
|
)
|
4
|
$
|
72,467
|
$
|
(1,965
|
)
|
6
|
||||||||||||||||||
|
State & municipal
|
43,514
|
(116
|
)
|
110
|
1,619
|
(7
|
)
|
6
|
45,133
|
(123
|
)
|
116
|
||||||||||||||||||||||||
|
Total securities with unrealized losses
|
$
|
69,566
|
$
|
(165
|
)
|
112
|
$
|
48,034
|
$
|
(1,923
|
)
|
10
|
$
|
117,600
|
$
|
(2,088
|
)
|
122
|
||||||||||||||||||
Management has the intent to hold the securities classified as held to maturity until they mature, at which time it is believed the Company will receive full value for the securities. Furthermore, as of December 31, 2015, management also had intent to hold, and will not be required to sell, the securities classified as available for sale for a period of time sufficient for a recovery of cost, which may be until maturity. The unrealized losses are due to increases in market interest rates over the yields available at the time the underlying securities were purchased. When necessary, the Company has performed a discounted cash flow analysis to determine whether or not it will receive the contractual principal and interest on certain securities. The fair value is expected to recover as the bonds approach their maturity date or repricing date or if market yields for such investments decline. As of December 31, 2015, management believes the impairments detailed in the table above are temporary and no other-than-temporary impairment losses have been realized in the Company's consolidated statements of income.
During 2014, the Company transferred approximately $340 million in securities from the available for sale portfolio to the held to maturity portfolio, which had unrealized losses at the time of transfer of approximately $8.3 million. This unrealized loss is amortized into interest income over the lives of the transferred securities.
The following tables set forth information with regard to contractual maturities of debt securities at December 31, 2015:
|
(In thousands)
|
Amortized
cost
|
Estimated fair
value
|
||||||
|
Debt securities classified as available for sale
|
||||||||
|
Within one year
|
$
|
3,462
|
$
|
3,502
|
||||
|
From one to five years
|
348,921
|
348,512
|
||||||
|
From five to ten years
|
147,139
|
149,185
|
||||||
|
After ten years
|
656,178
|
656,577
|
||||||
|
|
$
|
1,155,700
|
$
|
1,157,776
|
||||
|
Debt securities classified as held to maturity
|
||||||||
|
Within one year
|
$
|
43,624
|
$
|
43,641
|
||||
|
From one to five years
|
14,179
|
14,226
|
||||||
|
From five to ten years
|
113,799
|
115,691
|
||||||
|
After ten years
|
299,429
|
299,582
|
||||||
|
|
$
|
471,031
|
$
|
473,140
|
||||
Maturities of mortgage-backed, CMOs and asset-backed securities are stated based on their estimated average lives. Actual maturities may differ from estimated average lives or contractual maturities because, in certain cases, borrowers have the right to call or prepay obligations with or without call or prepayment penalties.
Except for U.S. Government securities, there were no holdings, when taken in the aggregate, of any single issuer that exceeded 10% of consolidated stockholders' equity at December 31, 2015 and December 31, 2014.
(4) Loans
A summary of loans, net of deferred fees and origination costs, by category is as follows:
|
|
At December 31,
|
|||||||
|
(In thousands)
|
2015
|
2014
|
||||||
|
Residential real estate mortgages
|
$
|
1,196,780
|
$
|
1,115,715
|
||||
|
Commercial
|
1,159,089
|
1,144,761
|
||||||
|
Commercial real estate
|
1,430,618
|
1,334,984
|
||||||
|
Consumer
|
1,568,204
|
1,430,216
|
||||||
|
Home equity
|
528,442
|
569,595
|
||||||
|
Total loans
|
$
|
5,883,133
|
$
|
5,595,271
|
||||
Included in the above loans are net deferred loan origination costs totaling $38.7 million and $35.6 million at December 31, 2015 and 2014, respectively. The Company had no residential loans held for sale as of December 31, 2015 and $3.2 million as of December 31, 2014.
At December 31, 2015 and 2014, the Company serviced $25.1 million and $23.4 million, respectively, of agricultural loans sold with recourse. Due to sufficient collateral on these loans, no reserve is considered necessary at December 31, 2015 and 2014.
FHLB advances are collateralized by a blanket lien on the Company's residential real estate mortgages.
In the ordinary course of business, the Company has made loans at prevailing rates and terms to directors, officers, and other related parties. Such loans, in management's opinion, do not present more than the normal risk of collectability or incorporate other unfavorable features. The aggregate amount of loans outstanding to qualifying related parties and changes during the years are summarized as follows:
|
(In thousands)
|
2015
|
2014
|
||||||
|
Balance at January 1
|
$
|
3,576
|
$
|
3,372
|
||||
|
New loans
|
390
|
522
|
||||||
|
Adjustment due to change in composition of related parties
|
(265
|
)
|
253
|
|||||
|
Repayments
|
(1,355
|
)
|
(571
|
)
|
||||
|
Balance at December 31
|
$
|
2,346
|
$
|
3,576
|
||||
(5) Allowance for Loan Losses and Credit Quality of Loans
Allowance for Loan Losses
The allowance for loan losses is maintained at a level estimated by management to provide adequately for risk of probable losses inherent in the current loan portfolio. The adequacy of the allowance for loan losses is continuously monitored. It is assessed for adequacy using a methodology designed to ensure the level of the allowance reasonably reflects the loan portfolio's risk profile. It is evaluated to ensure that it is sufficient to absorb all reasonably estimable credit losses inherent in the current loan portfolio.
To develop and document a systematic methodology for determining the allowance for loan losses, the Company has divided the loan portfolio into three segments, each with different risk characteristics and methodologies for assessing risk. Those segments are further segregated between our loans accounted for under the amortized cost method (referred to as "originated" loans) and loans acquired in a business combination (referred to as "acquired" loans). Each portfolio segment is broken down into class segments where appropriate. Class segments contain unique measurement attributes, risk characteristics and methods for monitoring and assessing risk that are necessary to develop the allowance for loan losses. Unique characteristics such as borrower type, loan type, collateral type, and risk characteristics define each class segment. The following table illustrates the portfolio and class segments for the Company's loan portfolio:
|
Portfolio
|
Class
|
|
|
Commercial Loans
|
Commercial
|
|
|
|
Commercial Real Estate
|
|
|
|
Agricultural
|
|
|
|
Agricultural Real Estate
|
|
|
|
Business Banking
|
|
|
|
|
|
|
Consumer Loans
|
Indirect
|
|
|
|
Home Equity
|
|
|
|
Direct
|
|
|
|
|
|
|
Residential Real Estate Mortgages
|
|
COMMERCIAL LOANS
Commercial – The Company offers a variety of loan options to meet the specific needs of our commercial customers including term loans, time notes and lines of credit. Such loans are made available to businesses for working capital such as inventory and receivables, business expansion and equipment purchases. Generally, a collateral lien is placed on equipment or other assets owned by the borrower. These loans carry a higher risk than commercial real estate loans by the nature of the underlying collateral, which can be business assets such as equipment and accounts receivable and is generally less liquid than real estate. To reduce the risk, management also attempts to secure real estate as collateral and obtain personal guarantees of the borrowers.
Commercial Real Estate – The Company offers commercial real estate loans to finance real estate purchases, refinancings, expansions and improvements to commercial properties. Commercial real estate loans are made to finance the purchases of real property which generally consists of real estate with completed structures. These commercial real estate loans are secured by first liens on the real estate, which may include apartments, commercial structures, housing businesses, healthcare facilities, and other non owner-occupied facilities. These loans are typically less risky than commercial loans, since they are secured by real estate and buildings. The Company's underwriting analysis includes credit verification, independent appraisals, a review of the borrower's financial condition, and a detailed analysis of the borrower's underlying cash flows. These loans are typically originated in amounts of no more than 80% of the appraised value of the property.
Agricultural – The Company offers a variety of agricultural loans to meet the needs of our agricultural customers including term loans, time notes, and lines of credit. These loans are made to purchase livestock, purchase and modernize equipment, and finance seasonal crop expenses. Generally, a collateral lien is placed on the livestock, equipment, produce inventories, and/or receivables owned by the borrower. These loans may carry a higher risk than commercial and agricultural real estate loans due to the industry price volatility and the perishable nature of the underlying collateral. To reduce these risks, management may attempt to secure these loans with additional real estate collateral, obtain personal guarantees of the borrowers, or obtain government loan guarantees to provide further support.
Agricultural Real Estate – The Company offers real estate loans to our agricultural customers to finance farm related real estate purchases, refinancings, expansions, and improvements to agricultural properties. Agricultural real estate loans are made to finance the purchases and improvements of farm properties that generally consist of barns, production facilities, and land. The agricultural real estate loans are secured by first liens on the farm real estate. Because they are secured by land and buildings, these loans may be less risky than agricultural loans. The Company's underwriting analysis includes credit verification, independent appraisals, a review of the borrower's financial condition, and a detailed analysis of the borrower's underlying cash flows. These loans are typically originated in amounts of no more than 75% of the appraised value of the property. Government loan guarantees may be obtained to provide further support.
Business Banking - The Company offers a variety of loan options to meet the specific needs of our small business customers including term loans, small business mortgages and lines of credit. Such loans are generally less than $500 thousand and are made available to businesses for working capital such as inventory and receivables, business expansion, equipment purchases, and agricultural needs. Generally, a collateral lien is placed on equipment or other assets owned by the borrower such as inventory and/or receivables. These loans carry a higher risk than commercial loans due to the smaller size of the borrower and lower levels of capital. To reduce the risk, the Company obtains personal guarantees of the owners for a majority of the loans.
CONSUMER LOANS
Indirect – The Company maintains relationships with many dealers primarily in the communities that we serve. Through these relationships, the company finances the purchases of automobiles and recreational vehicles (such as campers, boats, etc.) indirectly through dealer relationships. Approximately 70% of the indirect relationships represent automobile financing. Most of these loans carry a fixed rate of interest with principal repayment terms typically ranging from three to six years, based upon the nature of the collateral and the size of the loan. The majority of indirect consumer loans are underwritten on a secured basis using the underlying collateral being financed.
Home Equity – The Company offers fixed home equity loans as well as home equity lines of credit to consumers to finance home improvements, debt consolidation, education and other uses. Consumers are able to borrower up to 85% of the equity in their homes. The Company originates home equity lines of credit and second mortgage loans (loans secured by a second lien position on one-to-four-family residential real estate). These loans carry a higher risk than first mortgage residential loans as they are in a second position with respect to collateral. Risk is reduced through underwriting criteria, which include credit verification, appraisals, a review of the borrower's financial condition, and personal cash flows. A security interest, with title insurance when necessary, is taken in the underlying real estate.
Direct – The Company offers a variety of consumer installment loans to finance vehicle purchases, mobile home purchases and personal expenditures. Most of these loans carry a fixed rate of interest with principal repayment terms typically ranging from one to ten years, based upon the nature of the collateral and the size of the loan. The majority of consumer loans are underwritten on a secured basis using the underlying collateral being financed or a customer's deposit account. In addition to installment loans, the Company also offers personal lines of credit and overdraft protection. A minimal amount of loans are unsecured, which carry a higher risk of loss.
RESIDENTIAL REAL ESTATE LOANS
Residential real estate loans consist primarily of loans secured by first or second deeds of trust on primary residences. We originate adjustable-rate and fixed-rate, one-to-four-family residential real estate loans for the construction, purchase or refinancing of a mortgage. These loans are collateralized by owner-occupied properties located in the Company's market area. When market conditions are favorable, for longer term, fixed-rate residential mortgages without escrow, the Company retains the servicing, but sells the right to receive principal and interest to Freddie Mac when market conditions are favorable. This practice allows the Company to manage interest rate risk, liquidity risk, and credit risk. Loans on one-to-four-family residential real estate are generally originated in amounts of no more than 85% of the purchase price or appraised value (whichever is lower), or have private mortgage insurance. Mortgage title insurance and hazard insurance are normally required. Construction loans have a unique risk, because they are secured by an incomplete dwelling. This risk is reduced through periodic site inspections, including one at each loan draw period.
Allowance for Loan Loss Calculation
Management considers the accounting policy relating to the allowance for loan losses to be a critical accounting policy given the inherent uncertainty in evaluating the levels of the allowance required to cover credit losses in the portfolio and the material effect that such judgments can have on the consolidated results of operations.
In addition, various regulatory agencies, as an integral component of their examination process, periodically review the Company's allowance for loan losses. Such agencies may require the Company to make loan grade changes as well as recognize additions to the allowance based on their examinations.
After a thorough consideration of the factors discussed above, any required additions to the allowance for loan losses are made periodically by charges to the provision for loan losses. These charges are necessary to maintain the allowance at a level which management believes is reasonably reflective of overall inherent risk of probable loss in the portfolio. While management uses available information to recognize losses on loans, additions to the allowance may fluctuate from one reporting period to another. These fluctuations are reflective of changes in risk associated with portfolio content and/or changes in management's assessment of any or all of the determining factors discussed above.
The following table illustrates the changes in the allowance for loan losses by portfolio segment for the years ended December 31, 2015, 2014 and 2013:
|
Allowance for Loan Losses
(in thousands)
|
||||||||||||||||||||
|
|
||||||||||||||||||||
|
Commercial
Loans
|
Consumer
Loans
|
Residential
Real Estate
Mortgages
|
Unallocated
|
Total
|
||||||||||||||||
|
Balance as of December 31, 2014
|
$
|
32,433
|
$
|
26,720
|
$
|
7,130
|
$
|
76
|
$
|
66,359
|
||||||||||
|
Charge-offs
|
(5,718
|
)
|
(18,140
|
)
|
(2,229
|
)
|
-
|
(26,087
|
)
|
|||||||||||
|
Recoveries
|
1,014
|
3,127
|
320
|
-
|
4,461
|
|||||||||||||||
|
Provision
|
(2,184
|
)
|
17,546
|
2,739
|
184
|
18,285
|
||||||||||||||
|
Ending Balance as of December 31, 2015
|
$
|
25,545
|
$
|
29,253
|
$
|
7,960
|
$
|
260
|
$
|
63,018
|
||||||||||
|
|
||||||||||||||||||||
|
Balance as of December 31, 2013
|
$
|
35,090
|
$
|
27,694
|
$
|
6,520
|
$
|
130
|
$
|
69,434
|
||||||||||
|
Charge-offs
|
(9,414
|
)
|
(16,642
|
)
|
(1,417
|
)
|
-
|
(27,473
|
)
|
|||||||||||
|
Recoveries
|
1,774
|
2,800
|
285
|
-
|
4,859
|
|||||||||||||||
|
Provision
|
4,983
|
12,868
|
1,742
|
(54
|
)
|
19,539
|
||||||||||||||
|
Ending Balance as of December 31, 2014
|
$
|
32,433
|
$
|
26,720
|
$
|
7,130
|
$
|
76
|
$
|
66,359
|
||||||||||
|
|
||||||||||||||||||||
|
Balance as of December 31, 2012
|
$
|
35,624
|
$
|
27,162
|
$
|
6,252
|
$
|
296
|
$
|
69,334
|
||||||||||
|
Charge-offs
|
(10,459
|
)
|
(15,459
|
)
|
(1,771
|
)
|
-
|
(27,689
|
)
|
|||||||||||
|
Recoveries
|
1,957
|
3,136
|
272
|
-
|
5,365
|
|||||||||||||||
|
Provision
|
7,968
|
12,855
|
1,767
|
(166
|
)
|
22,424
|
||||||||||||||
|
Ending Balance as of December 31, 2013
|
$
|
35,090
|
$
|
27,694
|
$
|
6,520
|
$
|
130
|
$
|
69,434
|
||||||||||
For acquired loans, to the extent that we experience deterioration in borrower credit quality resulting in a decrease in our expected cash flows subsequent to acquisition of the loans, an allowance for loan losses would be established based on our estimate of future credit losses over the remaining life of the loans. The allowance for loan losses for the acquired loan portfolio totaled $0.7 million and $0.5 as of December 31, 2015 and December 31, 2014, respectively. Net charge-offs related to acquired loans totaled approximately $2.7 million and $4.8 million during the years ended December 31, 2015 and December 31, 2014, respectively, and are included in the table above.
The following table illustrates the allowance for loan losses and the recorded investment by portfolio segment as of December 31, 2015 and 2014:
|
Allowance for Loan Losses and Recorded Investment in Loans
(in thousands)
|
||||||||||||||||||||
|
|
Commercial
Loans
|
Consumer
Loans
|
Residential
Real Estate
Mortgages
|
Unallocated
|
Total
|
|||||||||||||||
|
As of December 31, 2015
|
||||||||||||||||||||
|
Allowance for loan losses
|
$
|
25,545
|
$
|
29,253
|
$
|
7,960
|
$
|
260
|
$
|
63,018
|
||||||||||
|
|
||||||||||||||||||||
|
Allowance for loans individually evaluated for impairment
|
2,005
|
-
|
-
|
2,005
|
||||||||||||||||
|
|
||||||||||||||||||||
|
Allowance for loans collectively evaluated for impairment
|
$
|
23,540
|
$
|
29,253
|
$
|
7,960
|
$
|
260
|
$
|
61,013
|
||||||||||
|
|
||||||||||||||||||||
|
|
||||||||||||||||||||
|
Ending balance of loans
|
$
|
2,589,707
|
$
|
2,096,646
|
$
|
1,196,780
|
$
|
5,883,133
|
||||||||||||
|
|
||||||||||||||||||||
|
Ending balance of originated loans individually evaluated for impairment
|
12,253
|
7,693
|
6,017
|
25,963
|
||||||||||||||||
|
Ending balance of acquired loans individually evaluated for impairment
|
1,205
|
-
|
-
|
1,205
|
||||||||||||||||
|
Ending balance of acquired loans collectively evaluated for impairment
|
284,524
|
95,427
|
230,358
|
610,309
|
||||||||||||||||
|
Ending balance of originated loans collectively evaluated for impairment
|
$
|
2,291,725
|
$
|
1,993,526
|
$
|
960,405
|
$
|
5,245,656
|
||||||||||||
|
|
||||||||||||||||||||
|
|
||||||||||||||||||||
|
As of December 31, 2014
|
||||||||||||||||||||
|
Allowance for loan losses
|
$
|
32,433
|
$
|
26,720
|
$
|
7,130
|
$
|
76
|
$
|
66,359
|
||||||||||
|
|
||||||||||||||||||||
|
Allowance for loans individually evaluated for impairment
|
1,100
|
-
|
-
|
1,100
|
||||||||||||||||
|
|
||||||||||||||||||||
|
Allowance for loans collectively evaluated for impairment
|
$
|
31,333
|
$
|
26,720
|
$
|
7,130
|
$
|
76
|
$
|
65,259
|
||||||||||
|
|
||||||||||||||||||||
|
|
||||||||||||||||||||
|
Ending balance of loans
|
$
|
2,479,745
|
$
|
1,999,811
|
$
|
1,115,715
|
$
|
5,595,271
|
||||||||||||
|
|
||||||||||||||||||||
|
Ending balance of originated loans individually evaluated for impairment
|
11,079
|
5,498
|
3,544
|
20,121
|
||||||||||||||||
|
Ending balance of acquired loans individually evaluated for impairment
|
5,675
|
-
|
-
|
5,675
|
||||||||||||||||
|
Ending balance of acquired loans collectively evaluated for impairment
|
327,656
|
147,256
|
266,747
|
741,659
|
||||||||||||||||
|
Ending balance of originated loans collectively evaluated for impairment
|
$
|
2,135,335
|
$
|
1,847,057
|
$
|
845,424
|
$
|
4,827,816
|
||||||||||||
The following table sets forth information with regard to past due and nonperforming loans by loan class:
|
Age Analysis of Past Due Financing Receivables
As of December 31, 2015
(in thousands)
|
||||||||||||||||||||||||||||
|
|
31-60 Days
Past Due
Accruing
|
61-90 Days
Past Due
Accruing
|
Greater
Than
90 Days
Past Due
Accruing
|
Total
Past Due
Accruing
|
Non-Accrual
|
Current
|
Recorded Total
Loans
|
|||||||||||||||||||||
|
ORIGINATED
|
||||||||||||||||||||||||||||
|
Commercial Loans
|
||||||||||||||||||||||||||||
|
Commercial
|
$
|
782
|
$
|
23
|
$
|
-
|
$
|
805
|
$
|
2,817
|
$
|
640,696
|
$
|
644,318
|
||||||||||||||
|
Commercial Real Estate
|
39
|
32
|
-
|
71
|
5,546
|
1,189,280
|
1,194,897
|
|||||||||||||||||||||
|
Agricultural
|
94
|
-
|
-
|
94
|
897
|
33,633
|
34,624
|
|||||||||||||||||||||
|
Agricultural Real Estate
|
-
|
-
|
-
|
-
|
1,046
|
28,172
|
29,218
|
|||||||||||||||||||||
|
Business Banking
|
912
|
394
|
-
|
1,306
|
4,247
|
395,368
|
400,921
|
|||||||||||||||||||||
|
|
1,827
|
449
|
-
|
2,276
|
14,553
|
2,287,149
|
2,303,978
|
|||||||||||||||||||||
|
|
||||||||||||||||||||||||||||
|
Consumer Loans
|
||||||||||||||||||||||||||||
|
Indirect
|
15,731
|
2,963
|
2,271
|
20,965
|
1,786
|
1,454,499
|
1,477,250
|
|||||||||||||||||||||
|
Home Equity
|
3,396
|
1,671
|
340
|
5,407
|
4,835
|
454,473
|
464,715
|
|||||||||||||||||||||
|
Direct
|
425
|
201
|
28
|
654
|
49
|
58,551
|
59,254
|
|||||||||||||||||||||
|
|
19,552
|
4,835
|
2,639
|
27,026
|
6,670
|
1,967,523
|
2,001,219
|
|||||||||||||||||||||
|
Residential Real Estate Mortgages
|
3,301
|
365
|
696
|
4,362
|
7,713
|
954,347
|
966,422
|
|||||||||||||||||||||
|
|
$
|
24,680
|
$
|
5,649
|
$
|
3,335
|
$
|
33,664
|
$
|
28,936
|
$
|
5,209,019
|
$
|
5,271,619
|
||||||||||||||
|
|
||||||||||||||||||||||||||||
|
|
||||||||||||||||||||||||||||
|
ACQUIRED
|
||||||||||||||||||||||||||||
|
Commercial Loans
|
||||||||||||||||||||||||||||
|
Commercial
|
$
|
-
|
$
|
-
|
$
|
-
|
$
|
-
|
$
|
-
|
$
|
68,991
|
$
|
68,991
|
||||||||||||||
|
Commercial Real Estate
|
-
|
-
|
-
|
-
|
1,313
|
165,630
|
166,943
|
|||||||||||||||||||||
|
Business Banking
|
288
|
-
|
-
|
288
|
307
|
49,200
|
49,795
|
|||||||||||||||||||||
|
|
288
|
-
|
-
|
288
|
1,620
|
283,821
|
285,729
|
|||||||||||||||||||||
|
|
||||||||||||||||||||||||||||
|
Consumer Loans
|
||||||||||||||||||||||||||||
|
Indirect
|
143
|
11
|
1
|
155
|
104
|
27,516
|
27,775
|
|||||||||||||||||||||
|
Home Equity
|
327
|
132
|
-
|
459
|
457
|
62,811
|
63,727
|
|||||||||||||||||||||
|
Direct
|
76
|
20
|
-
|
96
|
43
|
3,786
|
3,925
|
|||||||||||||||||||||
|
|
546
|
163
|
1
|
710
|
604
|
94,113
|
95,427
|
|||||||||||||||||||||
|
Residential Real Estate Mortgages
|
1,443
|
293
|
326
|
2,062
|
2,584
|
225,712
|
230,358
|
|||||||||||||||||||||
|
|
$
|
2,277
|
$
|
456
|
$
|
327
|
$
|
3,060
|
$
|
4,808
|
$
|
603,646
|
$
|
611,514
|
||||||||||||||
|
Total Loans
|
$
|
26,957
|
$
|
6,105
|
$
|
3,662
|
$
|
36,724
|
$
|
33,744
|
$
|
5,812,665
|
$
|
5,883,133
|
||||||||||||||
|
Age Analysis of Past Due Financing Receivables
As of December 31, 2014
(in thousands)
|
||||||||||||||||||||||||||||
|
|
31-60 Days
Past Due
Accruing
|
61-90 Days
Past Due
Accruing
|
Greater
Than
90 Days
Past Due
Accruing
|
Total
Past Due
Accruing
|
Non-Accrual
|
Current
|
Recorded Total
Loans
|
|||||||||||||||||||||
|
ORIGINATED
|
||||||||||||||||||||||||||||
|
Commercial Loans
|
||||||||||||||||||||||||||||
|
Commercial
|
$
|
-
|
$
|
735
|
$
|
-
|
$
|
735
|
$
|
1,012
|
$
|
613,400
|
$
|
615,147
|
||||||||||||||
|
Commercial Real Estate
|
192
|
-
|
-
|
192
|
4,127
|
1,064,549
|
1,068,868
|
|||||||||||||||||||||
|
Agricultural
|
-
|
-
|
-
|
-
|
817
|
32,130
|
32,947
|
|||||||||||||||||||||
|
Agricultural Real Estate
|
19
|
-
|
-
|
19
|
565
|
24,390
|
24,974
|
|||||||||||||||||||||
|
Business Banking
|
799
|
235
|
84
|
1,118
|
6,910
|
390,407
|
398,435
|
|||||||||||||||||||||
|
|
1,010
|
970
|
84
|
2,064
|
13,431
|
2,124,876
|
2,140,371
|
|||||||||||||||||||||
|
|
||||||||||||||||||||||||||||
|
Consumer Loans
|
||||||||||||||||||||||||||||
|
Indirect
|
16,434
|
3,154
|
1,991
|
21,579
|
1,964
|
1,286,507
|
1,310,050
|
|||||||||||||||||||||
|
Home Equity
|
4,591
|
1,428
|
821
|
6,840
|
6,596
|
479,444
|
492,880
|
|||||||||||||||||||||
|
Direct
|
560
|
157
|
52
|
769
|
84
|
54,941
|
55,794
|
|||||||||||||||||||||
|
|
21,585
|
4,739
|
2,864
|
29,188
|
8,644
|
1,820,892
|
1,858,724
|
|||||||||||||||||||||
|
Residential Real Estate Mortgages
|
2,901
|
96
|
1,256
|
4,253
|
8,770
|
835,819
|
848,842
|
|||||||||||||||||||||
|
|
$
|
25,496
|
$
|
5,805
|
$
|
4,204
|
$
|
35,505
|
$
|
30,845
|
$
|
4,781,587
|
$
|
4,847,937
|
||||||||||||||
|
|
||||||||||||||||||||||||||||
|
|
||||||||||||||||||||||||||||
|
ACQUIRED
|
||||||||||||||||||||||||||||
|
Commercial Loans
|
||||||||||||||||||||||||||||
|
Commercial
|
$
|
-
|
$
|
-
|
$
|
-
|
$
|
-
|
$
|
3,009
|
$
|
72,255
|
$
|
75,264
|
||||||||||||||
|
Commercial Real Estate
|
-
|
-
|
-
|
-
|
2,666
|
197,222
|
199,888
|
|||||||||||||||||||||
|
Business Banking
|
5
|
15
|
-
|
20
|
665
|
57,494
|
58,179
|
|||||||||||||||||||||
|
|
5
|
15
|
-
|
20
|
6,340
|
326,971
|
333,331
|
|||||||||||||||||||||
|
|
||||||||||||||||||||||||||||
|
Consumer Loans
|
||||||||||||||||||||||||||||
|
Indirect
|
518
|
5
|
54
|
577
|
106
|
64,540
|
65,223
|
|||||||||||||||||||||
|
Home Equity
|
190
|
60
|
5
|
255
|
557
|
75,904
|
76,716
|
|||||||||||||||||||||
|
Direct
|
31
|
-
|
7
|
38
|
33
|
5,246
|
5,317
|
|||||||||||||||||||||
|
|
739
|
65
|
66
|
870
|
696
|
145,690
|
147,256
|
|||||||||||||||||||||
|
Residential Real Estate Mortgages
|
1,162
|
265
|
671
|
2,098
|
3,193
|
261,456
|
266,747
|
|||||||||||||||||||||
|
|
$
|
1,906
|
$
|
345
|
$
|
737
|
$
|
2,988
|
$
|
10,229
|
$
|
734,117
|
$
|
747,334
|
||||||||||||||
|
Total Loans
|
$
|
27,402
|
$
|
6,150
|
$
|
4,941
|
$
|
38,493
|
$
|
41,074
|
$
|
5,515,704
|
$
|
5,595,271
|
||||||||||||||
There were no material commitments to extend further credit to borrowers with nonperforming loans.
The methodology used to establish the allowance for loan losses on impaired loans incorporates specific allocations on loans analyzed individually. Classified loans, including all TDRs and nonaccrual commercial loans that are graded substandard or below, with outstanding balances of $500 thousand or more are evaluated for impairment through the Company's quarterly status review process. In determining that we will be unable to collect all principal and interest payments due in accordance with the contractual terms of the loan agreements, we consider factors such as payment history and changes in the financial condition of individual borrowers, local economic conditions, historical loss experience and the conditions of the various markets in which the collateral may be liquidated. For loans that are evaluated for impairment, impairment is measured by one of three methods: 1) the fair value of collateral less cost to sell, 2) present value of expected future cash flows or 3) the loan's observable market price. These impaired loans are reviewed on a quarterly basis for changes in the measurement of impairment. For impaired loans measured using the present value of expected cash flow method, any change to the previously recognized impairment loss is recognized as a change to the allowance account and recorded in the consolidated statement of income as a component of the provision for credit losses.
The following provides additional information on loans specifically evaluated for impairment for the years ended December 31, 2015 and 2014
|
Impaired Loans
|
||||||||||||||||||||||||
|
|
December 31, 2015
|
December 31, 2014
|
||||||||||||||||||||||
|
(in thousands)
|
Recorded
Investment
Balance
(Book)
|
Unpaid
Principal
Balance
(Legal)
|
Related
Allowance
|
Recorded
Investment
Balance
(Book)
|
Unpaid
Principal
Balance
(Legal)
|
Related
Allowance
|
||||||||||||||||||
|
ORIGINATED
|
||||||||||||||||||||||||
|
With no related allowance recorded:
|
||||||||||||||||||||||||
|
Commercial Loans
|
||||||||||||||||||||||||
|
Commercial
|
$
|
2,244
|
$
|
2,490
|
$
|
1,748
|
$
|
1,901
|
||||||||||||||||
|
Commercial Real Estate
|
3,165
|
3,175
|
4,505
|
4,520
|
||||||||||||||||||||
|
Agricultural
|
576
|
1,164
|
20
|
26
|
||||||||||||||||||||
|
Agricultural Real Estate
|
618
|
744
|
1,147
|
1,441
|
||||||||||||||||||||
|
Business Banking
|
983
|
1,033
|
896
|
1,301
|
||||||||||||||||||||
|
Total Commercial Loans
|
7,586
|
8,606
|
8,316
|
9,189
|
||||||||||||||||||||
|
|
||||||||||||||||||||||||
|
Consumer Loans
|
||||||||||||||||||||||||
|
Indirect
|
12
|
21
|
-
|
-
|
||||||||||||||||||||
|
Home Equity
|
7,681
|
8,574
|
5,498
|
6,033
|
||||||||||||||||||||
|
Total Consumer Loans
|
7,693
|
8,595
|
5,498
|
6,033
|
||||||||||||||||||||
|
|
||||||||||||||||||||||||
|
Residential Real Estate Mortgages
|
6,017
|
6,627
|
3,544
|
3,959
|
||||||||||||||||||||
|
Total
|
21,296
|
23,828
|
17,358
|
19,181
|
||||||||||||||||||||
|
|
||||||||||||||||||||||||
|
With an allowance recorded:
|
||||||||||||||||||||||||
|
Commercial Loans
|
||||||||||||||||||||||||
|
Commercial
|
457
|
457
|
300
|
-
|
-
|
-
|
||||||||||||||||||
|
Commercial Real Estate
|
4,210
|
6,059
|
970
|
2,763
|
4,611
|
600
|
||||||||||||||||||
|
Total Commercial Loans
|
4,667
|
6,516
|
1,270
|
2,763
|
4,611
|
600
|
||||||||||||||||||
|
|
||||||||||||||||||||||||
|
ACQUIRED
|
||||||||||||||||||||||||
|
With no related allowance recorded:
|
||||||||||||||||||||||||
|
Commercial Loans
|
||||||||||||||||||||||||
|
Commercial Real Estate
|
-
|
-
|
2,666
|
3,830
|
||||||||||||||||||||
|
Total Commercial Loans
|
-
|
-
|
2,666
|
3,830
|
||||||||||||||||||||
|
|
||||||||||||||||||||||||
|
With an allowance recorded:
|
||||||||||||||||||||||||
|
Commercial Loans
|
||||||||||||||||||||||||
|
Commercial
|
1,205
|
1,321
|
735
|
3,009
|
4,668
|
500
|
||||||||||||||||||
|
Total
|
$
|
27,168
|
$
|
31,665
|
$
|
2,005
|
$
|
25,796
|
$
|
32,290
|
$
|
1,100
|
||||||||||||
The following table summarizes the average recorded investments on loans specifically evaluated for impairment and the interest income recognized for the years ended December 31, 2015, 2014 and 2013:
|
|
December 31, 2015
|
December 31, 2014
|
December 31, 2013
|
|||||||||||||||||||||
|
(in thousands)
|
Average
Recorded
Investment
|
Interest Income
Recognized
Accrual
|
Average
Recorded
Investment
|
Interest Income
Recognized
Accrual
|
Average
Recorded
Investment
|
Interest Income
Recognized
Accrual
|
||||||||||||||||||
|
ORIGINATED
|
||||||||||||||||||||||||
|
Commercial Loans
|
||||||||||||||||||||||||
|
Commercial
|
$
|
2,219
|
$
|
71
|
$
|
1,954
|
$
|
115
|
$
|
3,488
|
$
|
-
|
||||||||||||
|
Commercial Real Estate
|
8,538
|
164
|
9,679
|
169
|
11,085
|
95
|
||||||||||||||||||
|
Agricultural
|
148
|
1
|
91
|
1
|
1,035
|
1
|
||||||||||||||||||
|
Agricultural Real Estate
|
628
|
45
|
1,346
|
46
|
1,067
|
47
|
||||||||||||||||||
|
Business Banking
|
960
|
21
|
610
|
55
|
127
|
61
|
||||||||||||||||||
|
Consumer Loans
|
||||||||||||||||||||||||
|
Home Equity
|
7,070
|
374
|
5,198
|
267
|
3,120
|
145
|
||||||||||||||||||
|
Residential Real Estate Mortgages
|
5,128
|
219
|
3,039
|
119
|
2,085
|
69
|
||||||||||||||||||
|
ACQUIRED
|
||||||||||||||||||||||||
|
Commercial Loans
|
||||||||||||||||||||||||
|
Commercial
|
2,045
|
-
|
5,756
|
-
|
-
|
-
|
||||||||||||||||||
|
Commercial Real Estate
|
5,734
|
-
|
3,386
|
-
|
1,310
|
-
|
||||||||||||||||||
|
Total
|
$
|
32,470
|
$
|
895
|
$
|
31,059
|
$
|
772
|
$
|
23,317
|
$
|
418
|
||||||||||||
While we continue to adhere to prudent underwriting standards, as a lender we may be adversely impacted by general economic weaknesses and, in particular, a sharp downturn in the housing market nationally. Decreases in real estate values could adversely affect the value of property used as collateral for our loans. Adverse changes in the economy may have a negative effect on the ability of our borrowers to make timely loan payments, which would have an adverse impact on our earnings. A further increase in loan delinquencies would decrease our net interest income and adversely impact our loan loss experience, causing increases in our provision and allowance for loan losses.
The Company has developed an internal loan grading system to evaluate and quantify the Bank's loan portfolio with respect to quality and risk. The system focuses on, among other things, financial strength of borrowers, experience and depth of management, primary and secondary sources of repayment, payment history, nature of the business, outlook on particular industries. The internal grading system enables the Company to monitor the quality of the entire loan portfolio on a continuous basis and provide management with an early warning system, enabling recognition and response to problem loans and potential problem loans.
Commercial Grading System
For commercial and agricultural loans, the Company uses a grading system that relies on quantifiable and measurable characteristics when available. This would include comparison of financial strength to available industry averages, comparison of transaction factors (loan terms and conditions) to loan policy, and comparison of credit history to stated repayment terms and industry averages. Some grading factors are necessarily more subjective such as economic and industry factors, regulatory environment, and management. The grading system for commercial and agricultural loans is as follows:
| ● | Doubtful |
A doubtful loan has a high probability of total or substantial loss, but because of specific pending events that may strengthen the asset, its classification as loss is deferred. Doubtful borrowers are usually in default, lack adequate liquidity or capital, and lack the resources necessary to remain an operating entity. Pending events can include mergers, acquisitions, liquidations, capital injections, the perfection of liens on additional collateral, the valuation of collateral, and refinancing. Generally, pending events should be resolved within a relatively short period and the ratings will be adjusted based on the new information. Because of high probability of loss, nonaccrual treatment is required for doubtful assets.
| ● | Substandard |
Substandard loans have a high probability of payment default, or they have other well-defined weaknesses. They require more intensive supervision by bank management. Substandard loans are generally characterized by current or expected unprofitable operations, inadequate debt service coverage, inadequate liquidity, or marginal capitalization. Repayment may depend on collateral or other credit risk mitigants. For some substandard loans, the likelihood of full collection of interest and principal may be in doubt and should be placed on nonaccrual. Although substandard assets in the aggregate will have a distinct potential for loss, an individual asset's loss potential does not have to be distinct for the asset to be rated substandard.
● Special Mention
Special Mention loans have potential weaknesses that may, if not checked or corrected, weaken the asset or inadequately protect the Company's position at some future date. These loans pose elevated risk, but their weakness does not yet justify a substandard classification. Borrowers may be experiencing adverse operating trends (declining revenues or margins) or may be struggling with an ill-proportioned balance sheet (e.g., increasing inventory without an increase in sales, high leverage, tight liquidity). Adverse economic or market conditions, such as interest rate increases or the entry of a new competitor, may also support a special mention rating. Although a Special Mention loan has a higher probability of default than a pass asset, its default is not imminent.
● Pass
Loans graded as Pass encompass all loans not graded as Doubtful, Substandard, or Special Mention. Pass loans are in compliance with loan covenants, and payments are generally made as agreed. Pass loans range from superior quality to fair quality.
Business Banking Grading System
Business Banking loans are graded as either Classified or Non-classified:
● Classified
Classified loans are inadequately protected by the current worth and paying capacity of the obligor or, if applicable, the collateral pledged. These loans have a well-defined weakness, or weaknesses, that jeopardize the liquidation of the debt, or in some cases make collection or liquidation in full, on the basis of currently existing facts, conditions, and values, highly questionable and improbable. They are characterized by the distinct possibility that the Company will sustain some loss if the deficiencies are not corrected. Classified loans have a high probability of payment default, or a high probability of total or substantial loss. These loans require more intensive supervision by management and are generally characterized by current or expected unprofitable operations, inadequate debt service coverage, inadequate liquidity, or marginal capitalization. Repayment may depend on collateral or other credit risk mitigants. When the likelihood of full collection of interest and principal may be in doubt; classified loans are considered to have a nonaccrual status. In some cases, classified loans are considered uncollectible and of such little value that their continuance as assets is not warranted.
● Non-classified
Loans graded as Non-classified encompass all loans not graded as Classified. Non-classified loans are in compliance with loan covenants, and payments are generally made as agreed.
Consumer and Residential Mortgage Grading System
Consumer and Residential Mortgage loans are graded as either Performing or Nonperforming. Nonperforming loans are loans that are 1) over 90 days past due and interest is still accruing or 2) on nonaccrual status. All loans not meeting any of these three criteria are considered Performing.
The following tables illustrate the Company's credit quality by loan class for the years ended December 31, 2015 and 2014:
|
Credit Quality Indicators
December 31, 2015
|
||||||||||||||||||||
|
(In thousands)
|
||||||||||||||||||||
|
ORIGINATED
|
||||||||||||||||||||
|
Commercial Credit Exposure
|
||||||||||||||||||||
|
By Internally Assigned Grade:
|
Commercial |
|
Commercial
Real Estate
|
Agricultural |
|
Agricultural
Real Estate
|
Total
|
|||||||||||||
|
Pass
|
$
|
604,405
|
$
|
1,144,832
|
$
|
33,565
|
$
|
27,320
|
$
|
1,810,122
|
||||||||||
|
Special Mention
|
9,726
|
21,587
|
311
|
429
|
32,053
|
|||||||||||||||
|
Substandard
|
30,187
|
28,478
|
740
|
1,469
|
60,874
|
|||||||||||||||
|
Doubtful
|
-
|
-
|
8
|
-
|
8
|
|||||||||||||||
|
Total
|
$
|
644,318
|
$
|
1,194,897
|
$
|
34,624
|
$
|
29,218
|
$
|
1,903,057
|
||||||||||
|
Business Banking Credit Exposure
|
||||||||||||||||
|
By Internally Assigned Grade:
|
Business Banking
|
Total
|
||||||||||||||
|
Non-classified
|
$
|
386,397
|
$
|
386,397
|
||||||||||||
|
Classified
|
14,524
|
14,524
|
||||||||||||||
|
Total
|
$
|
400,921
|
$
|
400,921
|
||||||||||||
|
|
||||||||||||||||
|
Consumer Credit Exposure
|
||||||||||||||||
|
By Payment Activity:
|
Indirect
|
Home Equity
|
Direct
|
Total
|
||||||||||||
|
Performing
|
$
|
1,473,193
|
$
|
459,540
|
$
|
59,177
|
$
|
1,991,910
|
||||||||
|
Nonperforming
|
4,057
|
5,175
|
77
|
9,309
|
||||||||||||
|
Total
|
$
|
1,477,250
|
$
|
464,715
|
$
|
59,254
|
$
|
2,001,219
|
||||||||
|
Residential Mortgage Credit Exposure
|
||||||||
|
By Payment Activity:
|
Residential
Mortgage
|
Total
|
||||||
|
Performing
|
$
|
958,013
|
$
|
958,013
|
||||
|
Nonperforming
|
8,409
|
8,409
|
||||||
|
Total
|
$
|
966,422
|
$
|
966,422
|
||||
Credit Quality Indicators
December 31, 2015
(In thousands)
|
ACQUIRED
|
||||||||||||||||
|
Commercial Credit Exposure
|
||||||||||||||||
|
By Internally Assigned Grade:
|
Commercial
|
Commercial
Real Estate
|
Agricultural
|
Total
|
||||||||||||
|
Pass
|
$
|
67,241
|
$
|
154,871
|
$
|
-
|
$
|
222,112
|
||||||||
|
Special Mention
|
802
|
2,174
|
-
|
2,976
|
||||||||||||
|
Substandard
|
948
|
9,898
|
-
|
10,846
|
||||||||||||
|
Doubtful
|
-
|
-
|
-
|
-
|
||||||||||||
|
Total
|
$
|
68,991
|
$
|
166,943
|
$
|
-
|
$
|
235,934
|
||||||||
|
Business Banking Credit Exposure
|
||||||||
|
By Internally Assigned Grade:
|
Business Banking
|
Total
|
||||||
|
Non-classified
|
$
|
46,032
|
$
|
46,032
|
||||
|
Classified
|
3,763
|
3,763
|
||||||
|
Total
|
$
|
49,795
|
$
|
49,795
|
||||
|
Consumer Credit Exposure
|
|||||||||||||||
|
By Payment Activity:
|
Indirect
|
Home Equity
|
Direct
|
Total
|
|||||||||||
|
Performing
|
$
|
27,670
|
$
|
63,270
|
$
|
3,882
|
$
|
94,822
|
|||||||
|
Nonperforming
|
105
|
457
|
43
|
605
|
|||||||||||
|
Total
|
$
|
27,775
|
$
|
63,727
|
$
|
3,925
|
$
|
95,427
|
|||||||
|
Residential Mortgage Credit Exposure
|
||||||||
|
By Payment Activity:
|
Residential Mortgage
|
Total
|
||||||
|
Performing
|
$
|
227,448
|
$
|
227,448
|
||||
|
Nonperforming
|
2,910
|
2,910
|
||||||
|
Total
|
$
|
230,358
|
$
|
230,358
|
||||
Credit Quality Indicators
December 31, 2014
(In thousands)
|
ORIGINATED
|
||||||||||||||||||||
|
Commercial Credit Exposure
|
||||||||||||||||||||
|
By Internally Assigned Grade:
|
Commercial
|
Commercial
Real Estate
|
Agricultural
|
Agricultural
Real Estate
|
Total
|
|||||||||||||||
|
Pass
|
$
|
570,884
|
$
|
1,023,856
|
$
|
30,481
|
$
|
23,443
|
$
|
1,648,664
|
||||||||||
|
Special Mention
|
6,022
|
17,341
|
275
|
42
|
23,680
|
|||||||||||||||
|
Substandard
|
38,241
|
27,671
|
2,183
|
1,489
|
69,584
|
|||||||||||||||
|
Doubtful
|
-
|
-
|
8
|
-
|
8
|
|||||||||||||||
|
Total
|
$
|
615,147
|
$
|
1,068,868
|
$
|
32,947
|
$
|
24,974
|
$
|
1,741,936
|
||||||||||
|
Business Banking Credit Exposure
|
||||||||||||||||
|
By Internally Assigned Grade:
|
Business Banking
|
Total
|
||||||||||||||
|
Non-classified
|
$
|
379,445
|
|
|
$
|
379,445
|
||||||||||
|
Classified
|
18,990
|
|
|
18,990
|
||||||||||||
|
Total
|
$
|
398,435
|
|
|
$
|
398,435
|
||||||||||
|
|
|
|
||||||||||||||
|
Consumer Credit Exposure
|
||||||||||||||||
|
By Payment Activity:
|
Indirect
|
Home Equity
|
Direct
|
Total
|
||||||||||||
|
Performing
|
$
|
1,306,095
|
$
|
485,463
|
$
|
55,658
|
$
|
1,847,216
|
||||||||
|
Nonperforming
|
3,955
|
7,417
|
136
|
11,508
|
||||||||||||
|
Total
|
$
|
1,310,050
|
$
|
492,880
|
$
|
55,794
|
$
|
1,858,724
|
||||||||
|
Residential Mortgage Credit Exposure
|
||||||||
|
By Payment Activity:
|
Residential
Mortgage
|
Total
|
||||||
|
Performing
|
$
|
838,816
|
$
|
838,816
|
||||
|
Nonperforming
|
10,026
|
10,026
|
||||||
|
Total
|
$
|
848,842
|
$
|
848,842
|
||||
Credit Quality Indicators
December 31, 2014
(In thousands)
|
ACQUIRED
|
||||||||||||||||
|
Commercial Credit Exposure
|
||||||||||||||||
|
By Internally Assigned Grade:
|
Commercial
|
Commercial
Real Estate
|
Agricultural
|
Total
|
||||||||||||
|
Pass
|
$
|
63,630
|
$
|
186,036
|
$
|
-
|
$
|
249,666
|
||||||||
|
Special Mention
|
2,840
|
2,646
|
-
|
5,486
|
||||||||||||
|
Substandard
|
8,794
|
11,206
|
|
20,000
|
||||||||||||
|
Doubtful
|
-
|
-
|
-
|
-
|
||||||||||||
|
Total
|
$
|
75,264
|
$
|
199,888
|
$
|
-
|
$
|
275,152
|
||||||||
|
Business Banking Credit Exposure
|
||||||||
|
By Internally Assigned Grade:
|
Business Banking
|
Total
|
||||||
|
Non-classified
|
$
|
53,264
|
$
|
53,264
|
||||
|
Classified
|
4,915
|
4,915
|
||||||
|
Total
|
$
|
58,179
|
$
|
58,179
|
||||
|
Consumer Credit Exposure
|
||||||||||||||||
|
By Payment Activity:
|
Indirect
|
Home Equity
|
Direct
|
Total
|
||||||||||||
|
Performing
|
$
|
65,063
|
$
|
76,154
|
$
|
5,277
|
$
|
146,494
|
||||||||
|
Nonperforming
|
160
|
562
|
40
|
762
|
||||||||||||
|
Total
|
$
|
65,223
|
$
|
76,716
|
$
|
5,317
|
$
|
147,256
|
||||||||
|
Residential Mortgage Credit Exposure
|
||||||||
|
By Payment Activity:
|
Residential Mortgage
|
Total
|
||||||
|
Performing
|
$
|
262,883
|
$
|
262,883
|
||||
|
Nonperforming
|
3,864
|
3,864
|
||||||
|
Total
|
$
|
266,747
|
$
|
266,747
|
||||
Troubled Debt Restructuring
Substantially all modifications include one or a combination of the following: an extension of the maturity date at a stated rate of interest lower than the current market rate for new debt with similar risk; temporary reduction in the interest rate; or change in scheduled payment amount.
The following tables illustrate the recorded investment and number of modifications for modified loans, including the recorded investment in the loans prior to a modification and the recorded investment in the loans after restructuring for the years ended December 31, 2015 and 2014:
|
Year ended December 31, 2015
|
||||||||||||
|
|
Number of contracts
|
Pre-Modification Outstanding Recorded Investment
|
Post-Modification Outstanding Recorded Investment
|
|||||||||
|
Commercial
|
||||||||||||
|
Commercial
|
1
|
$
|
186
|
$
|
186
|
|||||||
|
Small Business
|
1
|
220
|
171
|
|||||||||
|
Total Commercial
|
2
|
406
|
357
|
|||||||||
|
Consumer
|
||||||||||||
|
Home Equity
|
50
|
3,664
|
3,261
|
|||||||||
|
Total Consumer
|
50
|
3,664
|
3,261
|
|||||||||
|
|
||||||||||||
|
Residential Real Estate
|
37
|
3,085
|
3,085
|
|||||||||
|
|
||||||||||||
|
Total Troubled Debt Restructurings
|
89
|
$
|
7,155
|
$
|
6,703
|
|||||||
|
|
Year ended December 31, 2014
|
|||||||||||
|
|
Number of contracts
|
Pre-Modification Outstanding Recorded Investment
|
Post-Modification Outstanding Recorded Investment
|
|||||||||
|
Commercial
|
||||||||||||
|
Small Business
|
3
|
$
|
920
|
$
|
842
|
|||||||
|
Total Commercial
|
3
|
920
|
842
|
|||||||||
|
Consumer
|
||||||||||||
|
Indirect
|
1
|
34
|
18
|
|||||||||
|
Home Equity
|
56
|
3,322
|
2,599
|
|||||||||
|
Total Consumer
|
57
|
3,356
|
2,617
|
|||||||||
|
|
||||||||||||
|
Residential Real Estate
|
27
|
2,717
|
2,088
|
|||||||||
|
|
||||||||||||
|
Total Troubled Debt Restructurings
|
87
|
$
|
6,993
|
$
|
5,547
|
|||||||
The following table illustrates the recorded investment and number of modifications for TDRs within the years ended December 31, 2015 and 2014 where a concession has been made and subsequently defaulted during the period:
|
Year ended December 31, 2015
|
Year ended December 31, 2014
|
|||||||||||||||
|
|
Number of contracts
|
Recorded Investment
|
Number of contracts
|
Recorded Investment
|
||||||||||||
|
Consumer
|
||||||||||||||||
|
Indirect
|
-
|
$
|
-
|
1
|
$
|
34
|
||||||||||
|
Home Equity
|
4
|
344
|
6
|
269
|
||||||||||||
|
Total Consumer
|
4
|
344
|
7
|
303
|
||||||||||||
|
|
||||||||||||||||
|
Residential Real Estate
|
3
|
208
|
6
|
429
|
||||||||||||
|
Total Troubled Debt Restructurings
|
7
|
$
|
552
|
13
|
$
|
732
|
||||||||||
(6) Premises and Equipment, Net
A summary of premises and equipment follows:
|
|
December 31,
|
|||||||
|
(In thousands)
|
2015
|
2014
|
||||||
|
Land, buildings, and improvements
|
$
|
125,428
|
$
|
122,400
|
||||
|
Equipment
|
59,574
|
58,835
|
||||||
|
Premises and equipment before accumulated depreciation
|
185,002
|
181,235
|
||||||
|
Accumulated depreciation
|
96,176
|
91,977
|
||||||
|
Total premises and equipment
|
$
|
88,826
|
$
|
89,258
|
||||
Buildings and improvements are depreciated based on useful lives of 15 to 40 years. Equipment is depreciated based on useful lives of three to ten years.
Rental expense included in occupancy expense amounted to $7.9 million in 2015, $8.0 million in 2014, and $7.5 million in 2013. The future minimum rental payments related to noncancelable operating leases with original terms of one year or more are as follows at December 31, 2015 (in thousands):
|
Future Minimum Rental Payments
|
||||
|
|
||||
|
2016
|
$
|
7,367
|
||
|
2017
|
7,015
|
|||
|
2018
|
6,356
|
|||
|
2019
|
5,803
|
|||
|
2020
|
4,977
|
|||
|
Thereafter
|
21,628
|
|||
|
Total
|
$
|
53,146
|
||
(7) Goodwill and Other Intangible Assets
A summary of goodwill is as follows:
|
(In thousands)
|
||||
|
January 1, 2014
|
$
|
263,634
|
||
|
Goodwill Acquired
|
2,323
|
|||
|
December 31, 2015
|
$
|
265,957
|
||
|
|
||||
|
January 1, 2013
|
$
|
264,997
|
||
|
Goodwill Adjustments
|
(1,363
|
)
|
||
|
December 31, 2014
|
$
|
263,634
|
||
The Company has intangible assets with definite useful lives capitalized on its consolidated balance sheet in the form of core deposit and other identified intangible assets. These intangible assets are amortized over their estimated useful lives, which range primarily from one to twelve years.
A summary of core deposit and other intangible assets follows:
|
|
December 31,
|
|||||||
|
(In thousands)
|
2015
|
2014
|
||||||
|
Core deposit intangibles
|
||||||||
|
Gross carrying amount
|
$
|
19,401
|
$
|
19,401
|
||||
|
Less: accumulated amortization
|
14,800
|
12,522
|
||||||
|
Net carrying amount
|
4,601
|
6,879
|
||||||
|
|
||||||||
|
Identified intangible assets
|
||||||||
|
Gross carrying amount
|
29,525
|
28,316
|
||||||
|
Less: accumulated amortization
|
16,861
|
14,878
|
||||||
|
Net carrying amount
|
12,664
|
13,438
|
||||||
|
|
||||||||
|
Total intangibles
|
||||||||
|
Gross carrying amount
|
48,926
|
47,717
|
||||||
|
Less: accumulated amortization
|
31,661
|
27,400
|
||||||
|
Net carrying amount
|
$
|
17,265
|
$
|
20,317
|
||||
Amortization expense on intangible assets with definite useful lives totaled $4.9 million for 2015, $5.0 million for 2014 and $4.9 million for 2013. Amortization expense on intangible assets with definite useful lives is expected to total $3.8 million for 2016, $3.2 million for 2017, $2.5 million for 2018, $1.9 million for 2019, $1.5 million for 2020 and $4.4 million thereafter. Other identified intangible assets include customer lists, non-competes, and trademark intangibles.
(8) Deposits
The following table sets forth the maturity distribution of time deposits at December 31, 2015 (in thousands):
|
Time deposits
|
||||
|
Within one year
|
$
|
372,619
|
||
|
After one but within two years
|
173,561
|
|||
|
After two but within three years
|
104,088
|
|||
|
After three but within four years
|
209,564
|
|||
|
After four but within five years
|
28,789
|
|||
|
After five years
|
20,206
|
|||
|
Total
|
$
|
908,827
|
||
Time deposits of $250,000 or more aggregated $84.9 million and $100.7 million December 31, 2015 and 2014, respectively.
(9) Short-Term Borrowings
In addition to the liquidity provided by balance sheet cash flows, liquidity must also be supplemented with additional sources such as credit lines from correspondent banks as well as borrowings from the FHLB and the Federal Reserve Bank. Other funding alternatives may also be appropriate from time to time, including wholesale and retail repurchase agreements and brokered CDs.
Short-term borrowings totaled $442.5 million and $316.8 million at December 31, 2015 and 2014, respectively, and consist of Federal funds purchased and securities sold under repurchase agreements, which generally represent overnight borrowing transactions, and other short-term borrowings, primarily FHLB advances, with original maturities of one year or less.
The Company has unused lines of credit with the FHLB and access to brokered deposits available for short-term financing of approximately $2.0 billion and $1.8 billion at December 31, 2015 and 2014, respectively. Borrowings on the FHLB lines are secured by FHLB stock, certain securities and one-to-four family first lien mortgage loans. Securities collateralizing repurchase agreements are held in safekeeping by nonaffiliated financial institutions and are under the Company's control.
Information related to short-term borrowings is summarized as follows:
|
(In thousands)
|
2015
|
2014
|
2013
|
|||||||||
|
Federal funds purchased
|
||||||||||||
|
Balance at year-end
|
$
|
99,500
|
$
|
68,000
|
$
|
130,000
|
||||||
|
Average during the year
|
97,424
|
110,154
|
39,907
|
|||||||||
|
Maximum month end balance
|
159,000
|
183,000
|
130,000
|
|||||||||
|
Weighted average rate during the year
|
0.36
|
%
|
0.29
|
%
|
0.26
|
%
|
||||||
|
Weighted average rate at December 31
|
0.51
|
%
|
0.34
|
%
|
0.18
|
%
|
||||||
|
|
||||||||||||
|
Securities sold under repurchase agreements
|
||||||||||||
|
Balance at year-end
|
$
|
167,981
|
$
|
148,802
|
$
|
176,042
|
||||||
|
Average during the year
|
162,201
|
165,858
|
169,352
|
|||||||||
|
Maximum month end balance
|
178,326
|
182,861
|
185,871
|
|||||||||
|
Weighted average rate during the year
|
0.06
|
%
|
0.06
|
%
|
0.06
|
%
|
||||||
|
Weighted average rate at December 31
|
0.06
|
%
|
0.06
|
%
|
0.05
|
%
|
||||||
|
|
||||||||||||
|
Other short-term borrowings
|
||||||||||||
|
Balance at year-end
|
$
|
175,000
|
$
|
100,000
|
$
|
150,000
|
||||||
|
Average during the year
|
80,260
|
106,438
|
71,589
|
|||||||||
|
Maximum month end balance
|
175,000
|
320,000
|
210,000
|
|||||||||
|
Weighted average rate during the year
|
0.42
|
%
|
0.40
|
%
|
0.43
|
%
|
||||||
|
Weighted average rate at December 31
|
0.56
|
%
|
0.36
|
%
|
0.55
|
%
|
||||||
See Note 3 for additional information regarding securities pledged as collateral for securities sold under the repurchase agreements.
(10) Long-Term Debt
Long-term debt consists of obligations having an original maturity at issuance of more than one year. A majority of the Company's long-term debt is comprised of FHLB advances collateralized by the FHLB stock owned by the Company, certain of its mortgage-backed securities and a blanket lien on its residential real estate mortgage loans. A summary as of December 31, 2015 and 2014 is as follows:
|
(In thousands)
|
As of December 31, 2015
|
As of December 31, 2014
|
||||||||||||||||||||||||||||||
|
Maturity
|
Amount
|
Weighted Average Rate
|
Callable Amount
|
Weighted Average Rate
|
Amount
|
Weighted Average Rate
|
Callable Amount
|
Weighted Average Rate
|
||||||||||||||||||||||||
|
2015
|
$ |
-
|
-
|
$ |
-
|
-
|
$ |
217
|
-
|
$ |
-
|
-
|
||||||||||||||||||||
|
2016
|
50,360
|
2.92
|
%
|
30,000
|
4.15
|
%
|
50,626
|
2.91
|
%
|
30,000
|
4.15
|
%
|
||||||||||||||||||||
|
2017
|
40,000
|
2.68
|
%
|
25,000
|
3.48
|
%
|
40,000
|
2.68
|
%
|
25,000
|
3.48
|
%
|
||||||||||||||||||||
|
2018
|
40,000
|
2.57
|
%
|
25,000
|
3.15
|
%
|
40,000
|
2.57
|
%
|
25,000
|
3.15
|
%
|
||||||||||||||||||||
|
2021
|
87
|
4.00
|
%
|
-
|
-
|
102
|
4.00
|
%
|
-
|
-
|
||||||||||||||||||||||
|
|
$
|
130,447
|
$
|
80,000
|
$
|
130,945
|
$
|
80,000
|
||||||||||||||||||||||||
(11) Junior Subordinated Debt
The Company sponsors five business trusts, CNBF Capital Trust I, NBT Statutory Trust I, NBT Statutory Trust II, Alliance Financial Capital Trust I and Alliance Financial Capital Trust II. The trusts were formed for the purpose of issuing company-obligated mandatorily redeemable preferred securities to third-party investors and investing in the proceeds from the sale of such preferred securities solely in junior subordinated debt securities of the Company. The debentures held by each trust are the sole assets of that trust. These five statutory business trusts are collectively referred herein to as "the Trusts." The Company guarantees, on a limited basis, payments of distributions on the trust preferred securities and payments on redemption of the trust preferred securities. The Trusts are variable interest entities ("VIEs") for which the Company is not the primary beneficiary, as defined by U.S. GAAP. In accordance with U.S. GAAP, the accounts of the Trusts are not included in the Company's consolidated financial statements. See Note 1 — Summary of Significant Accounting Policies for additional information about the Company's consolidation policy.
As of December 31, 2015, the Trusts had the following issues of trust preferred debentures, all held by the Trusts, outstanding (dollars in thousands):
|
Description
|
Issuance Date
|
Trust Preferred Securities Outstanding
|
Interest Rate
|
Trust Preferred Debt Owed To Trust
|
Final Maturity Date
|
||||||
|
|
|
|
|
||||||||
|
CNBF Capital Trust I
|
August 1999
|
$
|
18,000
|
3-month LIBOR plus 2.75%
|
$
|
18,720
|
August 2029
|
||||
|
|
|
|
|
||||||||
|
NBT Statutory Trust I
|
November 2005
|
5,000
|
3-month LIBOR plus 1.40%
|
5,155
|
December 2035
|
||||||
|
|
|
|
|
||||||||
|
NBT Statutory Trust II
|
February 2006
|
50,000
|
3-month LIBOR plus 1.40%
|
51,547
|
March 2036
|
||||||
|
|
|
|
|
||||||||
|
Alliance Financial Capital Trust I
|
December 2003
|
10,000
|
3-month LIBOR plus 2.85%
|
10,310
|
January 2034
|
||||||
|
|
|
|
|
||||||||
|
Alliance Financial Capital Trust II
|
September 2006
|
15,000
|
3-month LIBOR plus 1.65%
|
15,464
|
September 2036
|
||||||
The Company's junior subordinated debentures include amounts related to the Company's NBT Statutory Trust I and II as well as junior subordinated debentures associated with one statutory trust affiliates that were acquired from our merger with CNB Financial Corp. and two statutory trusts acquired from Alliance (the "Trusts"). The Trusts qualify as variable interest entities and were formed to issue mandatorily redeemable trust preferred securities to investors and loan the proceeds to us for general corporate purposes. The Trusts hold, as their sole assets, junior subordinated debentures of the Company with face amounts totaling $98 million at December 31, 2015. The Company owns all of the common securities of the Trusts and have accordingly recorded $3.2 million in equity method investments classified as other assets in our Consolidated Balance Sheets at December 31, 2015. The Company owns all of the common stock of the Trusts, which have issued trust preferred securities in conjunction with the Company issuing trust preferred debentures to the Trusts. The terms of the trust preferred debentures are substantially the same as the terms of the trust preferred securities.
The Company's junior subordinated debentures are redeemable prior to the maturity date at our option upon each trust's stated option repurchase dates, and from time to time thereafter. These debentures are also redeemable in whole at any time upon the occurrence of specific events defined within the trust indenture. Our obligations under the debentures and related documents, taken together, constitute a full and unconditional guarantee by the Company of the issuers' obligations under the trust preferred securities. The Company owns all of the common stock of the Trusts, which have issued trust preferred securities in conjunction with the Company issuing trust preferred debentures to the Trusts. The terms of the trust preferred debentures are substantially the same as the terms of the trust preferred securities.
With respect to the Trusts, the Company has the right to defer payments of interest on the debentures issued to the Trusts at any time or from time to time for a period of up to ten consecutive semi-annual periods with respect to each deferral period. Under the terms of the debentures, if in certain circumstances there is an event of default under the debentures or the Company elects to defer interest on the debentures, the Company may not, with certain exceptions, declare or pay any dividends or distributions on its capital stock or purchase or acquire any of its capital stock.
Despite the fact that the Trusts are not included in the Company's consolidated financial statements, $97 million of the $101 million in trust preferred securities issued by these subsidiary trusts is included in the Tier 1 capital of the Company for regulatory capital purposes as allowed by the Federal Reserve Board (NBT Bank owns $1.0 million of CNBF Trust I securities). The Dodd-Frank Act requires bank holding companies with assets greater than $500 million to be subject to the same capital requirements as insured depository institutions, meaning, for instance, that such bank holding companies will not be able to count trust preferred securities issued after May 19, 2010 as Tier 1 capital. The aforementioned Trusts are grandfathered with respect to this enactment based on their date of issuance.
(12) Income Taxes
The significant components of income tax expense attributable to operations are:
|
|
Years ended December 31,
|
|||||||||||
|
(In thousands)
|
2015
|
2014
|
2013
|
|||||||||
|
Current
|
||||||||||||
|
Federal
|
$
|
32,871
|
$
|
26,059
|
$
|
23,536
|
||||||
|
State
|
4,329
|
2,823
|
2,316
|
|||||||||
|
|
37,200
|
28,882
|
25,852
|
|||||||||
|
|
||||||||||||
|
Deferred
|
||||||||||||
|
Federal
|
2,521
|
6,648
|
2,334
|
|||||||||
|
State
|
482
|
1,699
|
10
|
|||||||||
|
|
3,003
|
8,347
|
2,344
|
|||||||||
|
Total income tax expense
|
$
|
40,203
|
$
|
37,229
|
$
|
28,196
|
||||||
Not included in the above table are items that were recorded to stockholders' equity of approximately $3.4 million, $(1.1) million, and $7.0 million for 2015, 2014, and 2013, respectively, relating to deferred taxes on the unrealized (gain) loss on available for sale securities, tax benefits recognized with respect to stock options exercised, and deferred taxes related to pension plans.
The tax effects of temporary differences that give rise to significant portions of the deferred tax assets and deferred tax liabilities are as follows:
|
|
December 31,
|
|||||||
|
(In thousands)
|
2015
|
2014
|
||||||
|
Deferred tax assets
|
||||||||
|
Allowance for loan losses
|
$
|
24,090
|
$
|
25,689
|
||||
|
Deferred compensation
|
10,023
|
8,744
|
||||||
|
Postretirement benefit obligation
|
2,988
|
2,377
|
||||||
|
Fair value adjustments from acquisitions
|
2,543
|
-
|
||||||
|
Unrealized losses on securities
|
589
|
-
|
||||||
|
Accrued liabilities
|
2,889
|
1,778
|
||||||
|
Stock-based compensation expense
|
5,394
|
6,457
|
||||||
|
Equipment leasing
|
476
|
1,416
|
||||||
|
Other
|
1,477
|
1,325
|
||||||
|
Total deferred tax assets
|
50,469
|
47,786
|
||||||
|
Deferred tax liabilities
|
||||||||
|
Pension benefits
|
11,908
|
12,192
|
||||||
|
Fair value adjustments from acquisitions
|
-
|
1,243
|
||||||
|
Unrealized gains on securities
|
-
|
1,331
|
||||||
|
Premises and equipment, primarily due to accelerated depreciation
|
2,444
|
2,491
|
||||||
|
Deferred loan costs
|
1,591
|
1,460
|
||||||
|
Intangible amortization
|
19,082
|
14,162
|
||||||
|
Other
|
504
|
390
|
||||||
|
Total deferred tax liabilities
|
35,529
|
33,269
|
||||||
|
Net deferred tax asset at year-end
|
14,940
|
14,517
|
||||||
|
Net deferred tax asset at beginning of year
|
14,517
|
21,789
|
||||||
|
Increase (Decrease) in net deferred tax asset
|
$
|
423
|
$
|
(7,272
|
)
|
|||
Realization of deferred tax assets is dependent upon the generation of future taxable income or the existence of sufficient taxable income within the available carryback period. A valuation allowance is provided when it is more likely than not that some portion of the deferred tax asset will not be realized. Based on available evidence, gross deferred tax assets will ultimately be realized and a valuation allowance was not deemed necessary at December 31, 2015 and 2014.
At December 31, 2015, 2014, and 2013 the Company had no ASC 740-10 unrecognized tax benefits. The Company does not expect the total amount of unrecognized tax benefits to significantly increase within the next twelve months.
The Company is no longer subject to U.S. Federal tax examination by tax authorities for years prior to 2012 and New York State for years prior to 2012. The Company recognizes interest expense and penalties related to unrecognized tax benefits, if any, in income tax expense.
The following is a reconciliation of the provision for income taxes to the amount computed by applying the applicable Federal statutory rate of 35 % to income before taxes:
|
|
Years ended December 31
|
|||||||||||
|
(In thousands)
|
2015
|
2014
|
2013
|
|||||||||
|
Federal income tax at statutory rate
|
$
|
40,820
|
$
|
39,306
|
$
|
31,482
|
||||||
|
Tax exempt income
|
(2,037
|
)
|
(2,250
|
)
|
(2,433
|
)
|
||||||
|
Net increase in CSV of life insurance
|
(1,373
|
)
|
(1,734
|
)
|
(1,166
|
)
|
||||||
|
Low income housing tax credits
|
(939
|
)
|
(880
|
)
|
(819
|
)
|
||||||
|
State taxes, net of federal tax benefit
|
3,127
|
2,939
|
1,512
|
|||||||||
|
Other, net
|
605
|
(152
|
)
|
(380
|
)
|
|||||||
|
Income tax expense
|
$
|
40,203
|
$
|
37,229
|
$
|
28,196
|
||||||
(13) Employee Benefit Plans
Defined Benefit Postretirement Plans
The Company has a qualified, noncontributory, defined benefit pension plan (“the Plan”) covering substantially all of its employees at December 31, 2015. Benefits paid from the plan are based on age, years of service, compensation, social security benefits, and are determined in accordance with defined formulas. The Company’s policy is to fund the pension plan in accordance with ERISA standards. Assets of the plan are invested in bonds and publicly traded stocks and mutual funds. Prior to January 1, 2000, the Plan was a traditional defined benefit plan based on final average compensation. On January 1, 2000, the Plan was converted to a cash balance plan with grandfathering provisions for existing participants. Effective March 1, 2013, the pension plan was amended. Benefit accruals for participants who, as of January 1, 2000, elected to continue participating in the traditional defined benefit plan design were frozen as of March 1, 2013.
The Company assumed a noncontributory, defined benefit pension plan in the Alliance acquisition. This plan covers certain Alliance full-time employees who met eligibility requirements on October 6, 2006, at which time all benefits were frozen. Under this plan, retirement benefits are primarily a function of both the years of service and the level of compensation. Effective May 1, 2013, this plan was merged into the Plan. The merging of the plans required a valuation as of the merger date and resulted in a $2.4 million adjustment to accumulated other comprehensive income in 2013. The merging of the plans did not have a significant impact on the Company’s financial statements and related footnotes.
In addition to the Plan, the Company provides supplemental employee retirement plans to certain current and former executives. The Company also assumed supplemental retirement plans for certain current and former executives in the Alliance acquisition.
The supplemental employee retirement plans and the defined benefit pension plan are collectively referred to herein as “Pension Benefits.”
Also, the Company provides certain health care benefits for retired employees. Benefits are accrued over the employees’ active service period. Only employees that were employed by NBT Bank on or before January 1, 2000 are eligible to receive postretirement health care benefits. The plan is contributory for participating retirees, requiring participants to absorb certain deductibles and coinsurance amounts with contributions adjusted annually to reflect cost sharing provisions and benefit limitations called for in the plan. Employees become eligible for these benefits if they reach normal retirement age while working for the Company. For eligible employees described above, the Company funds the cost of postretirement health care as benefits are paid. The Company elected to recognize the transition obligation on a delayed basis over twenty years. In addition, the Company assumed post-retirement medical life insurance benefits for certain Alliance employees, retirees and their spouses, if applicable, in the Alliance acquisition. These postretirement benefits are referred to herein as “Other Benefits.”
Accounting standards require an employer to: (1) recognize the overfunded or underfunded status of defined benefit postretirement plans, which is measured as the difference between plan assets at fair value and the benefit obligation, as an asset or liability in its balance sheet; (2) recognize changes in that funded status in the year in which the changes occur through comprehensive income; and (3) measure the defined benefit plan assets and obligations as of the date of its year-end balance sheet.
The components of accumulated other comprehensive loss, which have not yet been recognized as components of net periodic benefit cost, related to pensions and other postretirement benefits at December 31, 2015 are summarized below.
The Company expects that $2.3 million in net actuarial loss and nominal prior service costs will be recognized as components of net periodic benefit cost in 2016.
|
|
Pension Benefits
|
Other Benefits
|
||||||||||||||
|
(In thousands)
|
2015
|
2014
|
2015
|
2014
|
||||||||||||
|
Net actuarial loss
|
$
|
33,070
|
$
|
28,767
|
$
|
2,333
|
$
|
2,929
|
||||||||
|
Prior service cost
|
76
|
97
|
(95
|
)
|
(314
|
)
|
||||||||||
|
Total amounts recognized in accumulated other comprehensive loss (pre-tax)
|
$
|
33,146
|
$
|
28,864
|
$
|
2,238
|
$
|
2,615
|
||||||||
A December 31 measurement date is used for the pension, supplemental pension and postretirement benefit plans. The following table sets forth changes in benefit obligations, changes in plan assets, and the funded status of the pension plans and other postretirement benefits:
|
|
Pension Benefits
|
Other Benefits
|
||||||||||||||
|
(In thousands)
|
2015
|
2014
|
2015
|
2014
|
||||||||||||
|
Change in benefit obligation
|
||||||||||||||||
|
Benefit obligation at beginning of year
|
$
|
98,556
|
$
|
85,667
|
$
|
8,710
|
$
|
7,428
|
||||||||
|
Service cost
|
2,677
|
2,290
|
17
|
16
|
||||||||||||
|
Interest cost
|
3,977
|
4,142
|
374
|
347
|
||||||||||||
|
Plan participants' contributions
|
-
|
-
|
263
|
266
|
||||||||||||
|
Actuarial(gain) loss
|
(5,225
|
)
|
12,501
|
(333
|
)
|
1,452
|
||||||||||
|
Settlement
|
(200
|
)
|
-
|
-
|
-
|
|||||||||||
|
Benefits paid
|
(7,340
|
)
|
(6,044
|
)
|
(709
|
)
|
(799
|
)
|
||||||||
|
Projected benefit obligation at end of year
|
92,445
|
98,556
|
8,322
|
8,710
|
||||||||||||
|
Change in plan assets
|
||||||||||||||||
|
Fair value of plan assets at beginning of year
|
117,232
|
118,574
|
-
|
-
|
||||||||||||
|
Actual return on plan assets
|
(3,159
|
)
|
3,950
|
-
|
-
|
|||||||||||
|
Employer contributions
|
796
|
752
|
446
|
533
|
||||||||||||
|
Plan participants' contributions
|
-
|
-
|
263
|
266
|
||||||||||||
|
Benefits paid
|
(7,340
|
)
|
(6,044
|
)
|
(709
|
)
|
(799
|
)
|
||||||||
|
Fair value of plan assets at end of year
|
107,529
|
117,232
|
-
|
-
|
||||||||||||
|
|
||||||||||||||||
|
Funded status at year end
|
$
|
15,084
|
$
|
18,676
|
$
|
(8,322
|
)
|
$
|
(8,710
|
)
|
||||||
An asset is recognized for an overfunded plan and a liability is recognized for an underfunded plan. The accumulated benefit obligation for pension benefits was $92.4 million and $98.6 million at December 31, 2015 and 2014, respectively. The accumulated benefit obligation for other postretirement benefits was $8.3 million and $8.7 million at December 31, 2015 and 2014, respectively. The funded status of the pension and other postretirement benefit plans has been recognized as follows in the consolidated balance sheets at December 31, 2015 and 2014.
|
|
Pension Benefits
|
Other Benefits
|
||||||||||||||
|
(In thousands)
|
2015
|
2014
|
2015
|
2014
|
||||||||||||
|
Other assets
|
$
|
34,965
|
$
|
39,044
|
$
|
-
|
$
|
-
|
||||||||
|
Other liabilities
|
(19,881
|
)
|
(20,368
|
)
|
(8,322
|
)
|
(8,710
|
)
|
||||||||
|
Funded status
|
$
|
15,084
|
$
|
18,676
|
$
|
(8,322
|
)
|
$
|
(8,710
|
)
|
||||||
The following assumptions were used to determine the benefit obligation and the net periodic pension cost for the years indicated:
|
|
Years ended December 31,
|
|||||||||||
|
2015
|
2014
|
2013
|
||||||||||
|
Weighted average assumptions:
|
||||||||||||
|
The following assumptions were used to determine benefit obligations:
|
||||||||||||
|
Discount rate
|
4.69%-4.71
|
%
|
4.19%-4.30
|
%
|
4.90%-5.05
|
%
|
||||||
|
Expected long-term return on plan assets
|
7.00
|
%
|
7.50
|
%
|
7.50
|
%
|
||||||
|
Rate of compensation increase
|
3.00
|
%
|
3.00%-3.75
|
%
|
3.00
|
%
|
||||||
|
|
||||||||||||
|
The following assumptions were used to determine net periodic pension cost:
|
||||||||||||
|
Discount rate
|
4.19%-4.30
|
%
|
4.90%-5.05
|
%
|
3.50
|
%
|
||||||
|
Expected long-term return on plan assets
|
7.50
|
%
|
7.50
|
%
|
7.50
|
%
|
||||||
|
Rate of compensation increase
|
3.00%-3.75
|
%
|
3.00%-3.75
|
%
|
3.00
|
%
|
||||||
Net periodic benefit cost and other amounts recognized in other comprehensive income (loss) for the years ended December 31 included the following components:
|
|
Pension Benefits
|
Other Benefits
|
||||||||||||||||||||||
|
(In thousands)
|
2015
|
2014
|
2013
|
2015
|
2014
|
2013
|
||||||||||||||||||
|
Components of net periodic benefit cost
|
||||||||||||||||||||||||
|
Service cost
|
$
|
2,677
|
$
|
2,290
|
$
|
2,493
|
$
|
17
|
$
|
16
|
$
|
23
|
||||||||||||
|
Interest cost
|
3,977
|
4,142
|
3,223
|
374
|
347
|
286
|
||||||||||||||||||
|
Expected return on plan assets
|
(8,589
|
)
|
(8,681
|
)
|
(7,804
|
)
|
-
|
-
|
-
|
|||||||||||||||
|
Amortization of gain due to settlement
|
(154
|
)
|
-
|
-
|
-
|
-
|
-
|
|||||||||||||||||
|
Amortization of prior service cost
|
21
|
23
|
23
|
(219
|
)
|
(206
|
)
|
(205
|
)
|
|||||||||||||||
|
Amortization of unrecognized net loss
|
2,174
|
79
|
2,692
|
263
|
151
|
280
|
||||||||||||||||||
|
Net periodic pension cost
|
$
|
106
|
$
|
(2,147
|
)
|
$
|
627
|
$
|
435
|
$
|
308
|
$
|
384
|
|||||||||||
|
|
||||||||||||||||||||||||
|
Other changes in plan assets and benefit obligations recognized in other comprehensive income (pre-tax)
|
||||||||||||||||||||||||
|
Net loss (gain)
|
$
|
6,523
|
$
|
17,233
|
$
|
(21,500
|
)
|
$
|
(333
|
)
|
$
|
1,452
|
$
|
(369
|
)
|
|||||||||
|
Prior service cost
|
-
|
-
|
-
|
-
|
-
|
(54
|
)
|
|||||||||||||||||
|
Amortization of gain due to settlement
|
(46
|
)
|
-
|
-
|
-
|
-
|
-
|
|||||||||||||||||
|
Amortization of prior service cost
|
(21
|
)
|
(23
|
)
|
(23
|
)
|
219
|
206
|
205
|
|||||||||||||||
|
Amortization of unrecognized net gain
|
(2,174
|
)
|
(79
|
)
|
(2,692
|
)
|
(263
|
)
|
(151
|
)
|
(280
|
)
|
||||||||||||
|
Total recognized in other comprehensive loss (income)
|
4,282
|
17,131
|
(24,215
|
)
|
(377
|
)
|
1,507
|
(498
|
)
|
|||||||||||||||
|
|
||||||||||||||||||||||||
|
Total recognized in net periodic benefit cost and other comprehensive income (loss), pre-tax
|
$
|
4,388
|
$
|
14,984
|
$
|
(23,588
|
)
|
$
|
58
|
$
|
1,815
|
$
|
(114
|
)
|
||||||||||
The following table sets forth estimated future benefit payments for the pension plans and other postretirement benefit plans:
|
(In thousands)
|
Pension
Benefits
|
Other
Benefits
|
||||||
|
2016
|
$
|
6,165
|
$
|
621
|
||||
|
2017
|
7,649
|
647
|
||||||
|
2018
|
7,123
|
671
|
||||||
|
2019
|
7,024
|
661
|
||||||
|
2020
|
6,881
|
676
|
||||||
|
2021 - 2025
|
$
|
36,842
|
$
|
3,259
|
||||
The Company is not required to make contributions to the defined benefit plan in 2016.
For measurement purposes, the annual rates of increase in the per capita cost of covered medical and prescription drug benefits for fiscal year 2015 were assumed to be 6.8 to 11.0 percent. The rates were assumed to decrease gradually to 3.9 percent for fiscal year 2075 and remain at that level thereafter. Assumed health care cost trend rates have a significant effect on amounts reported for health care plans. A one-percentage point change in the health care trend rates would have the following effects as of and for the year ended December 31, 2015:
|
(In thousands)
|
One Percentage point increase
|
One Percentage point decrease
|
||||||
|
Increase (decrease) on total service and interest cost components
|
$
|
38
|
$
|
(33
|
)
|
|||
|
Increase (decrease) on postretirement accumulated benefit obligation
|
778
|
(670
|
)
|
|||||
Plan Investment Policy
The Company's key investment objectives in managing its defined benefit plan assets are to ensure that present and future benefit obligations to all participants and beneficiaries are met as they become due; to provide a total return that, over the long-term, maximizes the ratio of the plan assets to liabilities, while minimizing the present value of required Company contributions, at the appropriate levels of risk; to meet statutory requirements and regulatory agencies' requirements; and to satisfy applicable accounting standards. The Company periodically evaluates the asset allocations, funded status, rate of return assumption and contribution strategy for satisfaction of our investment objectives.
The target and actual allocations expressed as a percentage of the defined benefit pension plan's assets are as follows:
|
|
Target 2015
|
2015
|
2014
|
|||||||||
|
Cash and cash equivalents
|
0 - 20
|
%
|
2
|
%
|
4
|
%
|
||||||
|
Fixed income securities
|
20 - 40
|
%
|
42
|
%
|
38
|
%
|
||||||
|
Equities
|
40 - 80
|
%
|
56
|
%
|
58
|
%
|
||||||
|
Total
|
100
|
%
|
100
|
%
|
||||||||
Only high-quality bonds are to be included in the portfolio. All issues that are rated lower than A by Standard and Poor's are to be excluded. Equity securities at December 31, 2015 and 2014 do not include any Company common stock.
The following table presents the financial instruments recorded at fair value on a recurring basis by the Plan as of December 31, 2015 and 2014:
|
(In thousands)
|
Quoted Prices in Active Markets for
Identical Assets
(Level 1)
|
Significant
Other
Observable Inputs
(Level 2)
|
Balance
as of
December 31, 2015
|
|||||||||
|
Cash and cash equivalents
|
$
|
2,513
|
$
|
-
|
$
|
2,513
|
||||||
|
Foreign equity mutual funds
|
33,342
|
-
|
33,342
|
|||||||||
|
Equity mutual funds
|
26,993
|
-
|
26,993
|
|||||||||
|
U.S. government bonds
|
-
|
3,410
|
3,410
|
|||||||||
|
Corporate bonds
|
-
|
41,271
|
41,271
|
|||||||||
|
Totals
|
$
|
62,848
|
$
|
44,681
|
$
|
107,529
|
||||||
|
(In thousands)
|
Quoted Prices in Active Markets for Identical Assets (Level 1)
|
Significant
Other
Observable Inputs
(Level 2)
|
Balance
as of
December 31, 2014
|
|||||||||
|
Cash and cash equivalents
|
$
|
4,423
|
$
|
-
|
$
|
4,423
|
||||||
|
Foreign equity mutual funds
|
38,581
|
-
|
38,581
|
|||||||||
|
Equity mutual funds
|
29,718
|
-
|
29,718
|
|||||||||
|
U.S. government bonds
|
-
|
4,420
|
4,420
|
|||||||||
|
Corporate bonds
|
-
|
40,090
|
40,090
|
|||||||||
|
Totals
|
$
|
72,722
|
$
|
44,510
|
$
|
117,232
|
||||||
The plan had no financial instruments recorded at fair value on a nonrecurring basis as of December 31, 2015.
Determination of Assumed Rate of Return
The expected long-term rate-of-return on assets was 7.0% at December 31, 2015 and 7.50 % at December 31, 2014. This assumption represents the rate of return on plan assets reflecting the average rate of earnings expected on the funds invested or to be invested to provide for the benefits included in the projected benefit obligation. The assumption has been determined by reflecting expectations regarding future rates of return for the portfolio considering the asset distribution and related historical rates of return. The appropriateness of the assumption is reviewed annually.
Employee 401(k) and Employee Stock Ownership Plans
The Company maintains a 401(k) and employee stock ownership plan (the "401(k) Plan"). The Company contributes to the 401(k) Plan based on employees' contributions out of their annual salaries. In addition, the Company may also make discretionary contributions to the 401(k) Plan based on profitability. Participation in the 401(k) Plan is contingent upon certain age and service requirements. The employer contributions associated with the 401(k) Plan were $2.5 million in 2015, $2.8 million in 2014, and $2.1 million in 2013.
(14) Stock-Based Compensation
In April 2008, the Company adopted the NBT Bancorp Inc. 2008 Omnibus Incentive Plan (the "Plan"). Under the terms of the Plan, options and other equity-based awards are granted to directors and employees to increase their direct proprietary interest in the operations and success of the Company. The Plan assumed all prior equity-based incentive plans and any new equity-based awards are granted under the terms of the Plan. Under terms of the Plan, stock options are granted to purchase shares of the Company's common stock at a price equal to the fair market value of the common stock on the date of the grant. Options granted have a vesting period of four years and terminate ten years from the date of the grant. Shares issued as a result of stock option exercises and vesting of restricted shares and stock unit awards are funded from the Company's treasury stock. Restricted shares granted under the Plan vest after five years for employees and three years for non-employee directors. Restricted stock units granted under the Plan may have different terms and conditions. Performance shares and units granted under the Plan for executives may have different terms and conditions. Since 2011, the Company primarily grants restricted stock unit awards. Stock option grants since that time were reloads of existing grants.
The following table summarizes information concerning stock options outstanding at December 31, 2015:
|
|
Number of Shares
|
Weighted average exercise price
|
Weighted Average Remaining Contractual Term (in yrs)
|
Aggregate Intrinsic Value
|
||||||||||||
|
Outstanding at January 1, 2015
|
1,038,342
|
$
|
23.10
|
|||||||||||||
|
Granted
|
36,316
|
25.85
|
||||||||||||||
|
Exercised
|
(519,947
|
)
|
23.16
|
|||||||||||||
|
Forfeited
|
-
|
-
|
||||||||||||||
|
Expired
|
(13,147
|
)
|
22.97
|
|||||||||||||
|
Outstanding at December 31, 2015
|
541,564
|
$
|
23.23
|
3.24
|
$
|
2,541,332
|
||||||||||
|
|
||||||||||||||||
|
Exercisable at December 31, 2015
|
501,952
|
$
|
23.03
|
2.77
|
$
|
2,457,469
|
||||||||||
|
|
||||||||||||||||
|
Expected to Vest
|
39,240
|
$
|
25.76
|
9.11
|
$
|
83,294
|
||||||||||
Total stock-based compensation expense for stock option awards totaled $0.2 million, $0.1 million, and $0.2 million for the years ended December 31, 2015, 2014, and 2013, respectively. Cash proceeds, tax benefits and intrinsic value related to total stock options exercised is as follows:
|
|
Years ended December 31,
|
|||||||||||
|
(dollars in thousands)
|
2015
|
2014
|
2013
|
|||||||||
|
Proceeds from stock options exercised
|
$
|
12,044
|
$
|
6,554
|
$
|
7,927
|
||||||
|
Tax (expense) benefits related to stock options exercised
|
(43
|
)
|
313
|
178
|
||||||||
|
Intrinsic value of stock options exercised
|
2,446
|
789
|
905
|
|||||||||
|
Fair value of shares vested during the year
|
63
|
393
|
766
|
|||||||||
The Company has outstanding restricted and deferred stock awards granted from various plans at December 31, 2015. The Company recognized $4.2 million, $4.2 million, and $3.8 million in stock-based compensation expense related to these stock awards for the years ended December 31, 2015, 2014, and 2013, respectively. Tax benefits recognized with respect to restricted stock awards and stock units were $3.9 million, $2.9 million and $2.4 million for the years ended December 31, 2015, 2014 and 2013, respectively. Unrecognized compensation cost related to restricted stock awards and stock units totaled $3.7 million at December 31, 2015 and will be recognized over 1.7 years on a weighted average basis. Shares issued are funded from the Company's treasury stock. The following table summarizes information for unvested restricted stock awards outstanding as of December 31, 2015:
|
|
Number
of
Shares
|
Weighted-
Average
Grant Date Fair
Value
|
||||||
|
Unvested Restricted Stock Awards
|
||||||||
|
Unvested at January 1, 2015
|
52,000
|
$
|
23.43
|
|||||
|
Forfeited
|
-
|
-
|
||||||
|
Vested
|
(29,000
|
)
|
22.85
|
|||||
|
Unvested at December 31, 2015
|
23,000
|
$
|
24.17
|
|||||
The following table summarizes information for unvested restricted stock units outstanding as of December 31, 2015:
|
|
Number
of
Shares
|
Weighted-
Average
Grant Date Fair
Value
|
||||||
|
Unvested Restricted Stock Units
|
||||||||
|
Unvested at January 1, 2015
|
638,975
|
$
|
31.01
|
|||||
|
Forfeited
|
(8,407
|
)
|
-
|
|||||
|
Vested
|
(125,520
|
)
|
-
|
|||||
|
Granted
|
160,040
|
24.67
|
||||||
|
Unvested at December 31, 2015
|
665,088
|
$
|
35.73
|
|||||
The Company has 3.5 million securities remaining available to be granted as part of the Plan at December 31, 2015.
(15) Stockholders' Equity
In accordance with accounting standards, unrealized gains on available for sale securities and unrecognized actuarial gains or losses and prior service costs associated with the Company's pension and postretirement benefit plans are included in accumulated other comprehensive loss, net of tax. For the years ended December 31, components of accumulated other comprehensive loss are:
|
(In thousands)
|
2015
|
2014
|
||||||
|
Unrecognized prior service cost and net actuarial loss on pension plans
|
$
|
(21,557
|
)
|
$
|
(19,181
|
)
|
||
|
Unrealized net holding gains (losses) on available for sale securities
|
(861
|
)
|
2,154
|
|||||
|
Accumulated other comprehensive loss
|
$
|
(22,418
|
)
|
$
|
(17,027
|
)
|
||
Certain restrictions exist regarding the ability of the subsidiary bank to transfer funds to the Company in the form of cash dividends. The approval of the Office of Comptroller of the Currency (OCC) is required to pay dividends when a bank fails to meet certain minimum regulatory capital standards or when such dividends are in excess of a subsidiary bank's earnings retained in the current year plus retained net profits for the preceding two years as specified in applicable OCC regulations.. At December 31, 2015, approximately $81.9 million of the total stockholders' equity of the Bank was available for payment of dividends to the Company without approval by the OCC. The Bank's ability to pay dividends also is subject to the Bank being in compliance with regulatory capital requirements. The Bank is currently in compliance with these requirements. Under the State of Delaware General Corporation Law, the Company may declare and pay dividends either out of accumulated net retained earnings or capital surplus.
Under a previously disclosed stock repurchase plan, the Company purchased 1,047,152 shares of its common stock during the twelve month period ended December 31, 2015, for a total of $26.8 million at an average price of $25.59 per share. There are 952,848 shares available for repurchase under this plan, which expires on December 31, 2016.
(16) Regulatory Capital Requirements
The Company and NBT Bank are subject to various regulatory capital requirements administered by the federal banking agencies. Failure to meet minimum capital requirements can initiate certain mandatory and possibly additional discretionary actions by regulators that, if undertaken, could have a direct material effect on the consolidated financial statements. Under capital adequacy guidelines and the regulatory framework for prompt corrective action, NBT Bank must meet specific capital guidelines that involve quantitative measures of NBT Bank's assets, liabilities, and certain off-balance sheet items as calculated under regulatory accounting practices. The capital amounts and classifications are also subject to qualitative judgments by the regulators about components, risk weightings, and other factors.
Quantitative measures established by regulation to ensure capital adequacy require the Company and NBT Bank to maintain minimum amounts and ratios (set forth in the table below) of total and Tier 1 Capital to risk-weighted assets and of Tier 1 capital to average assets. As of December 31, 2015 and 2014, the Company and NBT Bank meet all capital adequacy requirements to which they were subject.
Under their prompt corrective action regulations, regulatory authorities are required to take certain supervisory actions (and may take additional discretionary actions) with respect to an undercapitalized institution. Such actions could have a direct material effect on an institution's financial statements. The regulations establish a framework for the classification of banks into five categories: well capitalized, adequately capitalized, under capitalized, significantly under capitalized, and critically under capitalized. As of December 31, 2015, the most recent notification from NBT Bank's regulators categorized NBT Bank as well capitalized under the regulatory framework for prompt corrective action. To be categorized as well capitalized NBT Bank must maintain minimum total risk-based, Tier 1 risk-based, and Tier 1 capital to average asset ratios as set forth in the table below. There are no conditions or events since that notification that management believes have changed NBT Bank's category.
The Company and NBT Bank's actual capital amounts and ratios are presented as follows:
|
|
Actual
|
Regulatory ratio requirements
|
||||||||||||||
|
(Dollars in thousands)
|
Amount
|
Ratio
|
Minimum
capital adequacy
|
For classification
as well capitalized
|
||||||||||||
|
As of December 31, 2015
|
||||||||||||||||
|
Total Capital (to risk weighted assets):
|
||||||||||||||||
|
Company
|
$
|
809,685
|
12.74
|
%
|
8.00
|
%
|
10.00
|
%
|
||||||||
|
NBT Bank
|
724,238
|
11.47
|
%
|
8.00
|
%
|
10.00
|
%
|
|||||||||
|
Tier I Capital (to risk weighted assets)
|
||||||||||||||||
|
Company
|
745,341
|
11.73
|
%
|
4.00
|
%
|
6.00
|
%
|
|||||||||
|
NBT Bank
|
659,894
|
10.45
|
%
|
4.00
|
%
|
6.00
|
%
|
|||||||||
|
Tier I Capital (to average assets)
|
||||||||||||||||
|
Company
|
745,341
|
9.44
|
%
|
4.00
|
%
|
5.00
|
%
|
|||||||||
|
NBT Bank
|
659,894
|
8.41
|
%
|
4.00
|
%
|
5.00
|
%
|
|||||||||
|
Common Equity Tier 1 Capital
|
||||||||||||||||
|
Company
|
648,341
|
10.20
|
%
|
4.50
|
%
|
6.50
|
%
|
|||||||||
|
NBT Bank
|
659,894
|
10.45
|
%
|
4.50
|
%
|
6.50
|
%
|
|||||||||
|
|
||||||||||||||||
|
As of December 31, 2014
|
||||||||||||||||
|
Total Capital (to risk weighted assets):
|
||||||||||||||||
|
Company
|
$
|
777,651
|
13.50
|
%
|
8.00
|
%
|
10.00
|
%
|
||||||||
|
NBT Bank
|
727,771
|
12.72
|
%
|
8.00
|
%
|
10.00
|
%
|
|||||||||
|
Tier I Capital (to risk weighted assets)
|
||||||||||||||||
|
Company
|
709,965
|
12.32
|
%
|
4.00
|
%
|
6.00
|
%
|
|||||||||
|
NBT Bank
|
660,086
|
11.54
|
%
|
4.00
|
%
|
6.00
|
%
|
|||||||||
|
Tier I Capital (to average assets)
|
||||||||||||||||
|
Company
|
709,965
|
9.39
|
%
|
4.00
|
%
|
5.00
|
%
|
|||||||||
|
NBT Bank
|
660,086
|
8.79
|
%
|
4.00
|
%
|
5.00
|
%
|
|||||||||
(17) Earnings Per Share
The following is a reconciliation of basic and diluted earnings per share for the years presented in the consolidated statements of income:
|
|
Years ended December 31,
|
||||||||||||||||||||||||||||||||||
|
|
2015
|
2014
|
2013
|
||||||||||||||||||||||||||||||||
|
(In thousands, except per share data)
|
Net
income
|
Weighted
average
shares
|
Per share
amount
|
Net
income
|
Weighted
average
shares
|
Per share
amount
|
Net
income
|
Weighted
average
shares
|
Per share
amount
|
||||||||||||||||||||||||||
|
Basic earnings per share
|
$
|
76,425
|
43,836
|
$
|
1.74
|
$
|
75,074
|
43,877
|
$
|
1.71
|
$
|
61,747
|
41,930
|
$
|
1.47
|
||||||||||||||||||||
|
Effect of dilutive securities
|
|||||||||||||||||||||||||||||||||||
|
|
|||||||||||||||||||||||||||||||||||
|
Stock based compensation
|
553
|
518
|
420
|
||||||||||||||||||||||||||||||||
|
Diluted earnings per share
|
$
|
76,425
|
44,389
|
$
|
1.72
|
$
|
75,074
|
44,395
|
$
|
1.69
|
$
|
61,747
|
42,350
|
$
|
1.46
|
||||||||||||||||||||
There were approximately thirty thousand, 0.5 million, and 1.0 million weighted average stock options for the years ended December 31, 2015, 2014, and 2013, respectively, that were not considered in the calculation of diluted earnings per share since the stock options' exercise prices were greater than the average market price during these periods.
(18) Reclassification Adjustments Out of Other Comprehensive (Loss) Income
The following table summarizes the reclassification adjustments out of accumulated other comprehensive loss (in thousands):
|
Detail About Accumulated Other Comprehensive (Loss)
Income Components
|
Amount reclassified from accumulated other comprehensive income (loss)
|
Affected line item in the consolidated statement of comprehensive income
|
|||||||
|
|
Years ended
|
|
|||||||
|
|
December 31, 2015
|
December 31, 2014
|
|
||||||
|
Available for sale securities:
|
|
||||||||
|
Gains on available for sale securities
|
$
|
(3,087
|
)
|
$
|
(92
|
)
|
Net securities gains
|
||
|
Amortization of unrealized gains and losses related to securities transfer
|
1,311
|
421
|
Interest Income
|
||||||
|
Tax benefit
|
691
|
(128
|
)
|
Income tax expense
|
|||||
|
Net of tax
|
$
|
(1,085
|
)
|
$
|
201
|
|
|||
|
|
|
||||||||
|
Pension and other benefits:
|
|
||||||||
|
Amortization of net gains
|
$
|
2,437
|
$
|
94
|
Salaries and employee benefits
|
||||
|
Amortization of prior service costs
|
(198
|
)
|
(19
|
)
|
Salaries and employee benefits
|
||||
|
Tax expense
|
868
|
29
|
Income tax expense
|
||||||
|
Net of tax
|
$
|
1,371
|
$
|
46
|
|
||||
|
|
|
||||||||
|
Total reclassifications during the period, net of tax
|
$
|
286
|
$
|
247
|
|
||||
(19) Commitments and Contingent Liabilities
The Company's concentrations of credit risk are reflected in the consolidated balance sheets. The concentrations of credit risk with standby letters of credit, unused lines of credit, commitments to originate new loans and loans sold with recourse generally follow the loan classifications.
At December 31, 2015, approximately 58% of the Company's loans were secured by real estate located in central and upstate New York, northeastern Pennsylvania, western Massachusetts, southern New Hampshire, and Vermont. Accordingly, the ultimate collectability of a substantial portion of the Company's portfolio is susceptible to changes in market conditions of those areas. Management is not aware of any material concentrations of credit to any industry or individual borrowers.
The Company is a party to certain financial instruments with off balance sheet risk in the normal course of business to meet the financing needs of its customers. These financial instruments include commitments to extend credit, unused lines of credit, standby letters of credit, and certain mortgage loans sold to investors with recourse. The Company's exposure to credit loss in the event of nonperformance by the other party to the commitments to extend credit, unused lines of credit, standby letters of credit, and loans sold with recourse is represented by the contractual amount of those instruments. The credit risk associated with commitments to extend credit and standby and commercial letters of credit is essentially the same as that involved with extending loans to customers and is subject to normal credit policies. Collateral may be obtained based on management's assessment of the customer's creditworthiness.
|
|
At December 31,
|
|||||||
|
(In thousands)
|
2015
|
2014
|
||||||
|
Unused lines of credit
|
$
|
252,953
|
$
|
214,175
|
||||
|
Commitments to extend credits, primarily variable rate
|
1,062,425
|
972,912
|
||||||
|
Standby letters of credit
|
31,503
|
35,244
|
||||||
|
Commercial letters of credit
|
11,332
|
22,486
|
||||||
|
Loans sold with recourse
|
25,122
|
23,351
|
||||||
Since many loan commitments, standby letters of credit, and guarantees and indemnification contracts expire without being funded in whole or in part, the contract amounts are not necessarily indicative of future cash flows. The Company does not issue any guarantees that would require liability-recognition or disclosure, other than its standby letters of credit.
The Company guarantees the obligations or performance of customers by issuing stand-by letters of credit to third parties. These stand-by letters of credit are frequently issued in support of third party debt, such as corporate debt issuances, industrial revenue bonds, and municipal securities. The risk involved in issuing stand-by letters of credit is essentially the same as the credit risk involved in extending loan facilities to customers, and letters of credit are subject to the same credit origination, portfolio maintenance and management procedures in effect to monitor other credit and off-balance sheet products. Typically, these instruments have terms of five years or less and expire unused; therefore, the total amounts do not necessarily represent future cash requirements. The fair value of the Company's stand-by letters of credit at December 31, 2015 and 2014 was not significant.
The total amount of loans serviced by the Company for unrelated third parties was approximately $616.1 million and $626.0 million at December 31, 2015 and 2014, respectively. At December 31, 2015 and 2014, the Company had approximately $1.1 million and $1.5 million, respectively, of mortgage servicing rights.
In the normal course of business there are various outstanding legal proceedings. If legal costs are deemed material by management, the Company accrues for the estimated loss from a loss contingency if the information available indicates that it is probable that a liability had been incurred at the date of the financial statements, and the amount of loss can be reasonably estimated.
The Company is required to maintain reserve balances with the Federal Reserve Bank of New York. The required average total reserve for NBT Bank for the 14-day maintenance period ending December 23, 2015 was $55.8 million.
(20) Fair Values of Financial Instruments
The following table sets forth information with regard to estimated fair values of financial instruments at December 31, 2015 and December 31, 2014. This table excludes financial instruments for which the carrying amount approximates fair value. Financial instruments for which the fair value approximates carrying value include cash and cash equivalents, securities available for sale, trading securities, accrued interest receivable, non-maturity deposits, short-term borrowings, accrued interest payable, and interest rate swaps.
|
|
December 31, 2015
|
December 31, 2014
|
||||||||||||||||||
|
(In thousands)
|
Fair Value Hierarchy
|
Carrying amount
|
Estimated fair value
|
Carrying amount
|
Estimated fair value
|
|||||||||||||||
|
Financial assets
|
||||||||||||||||||||
|
Securities held to maturity
|
2
|
$
|
471,031
|
$
|
473,140
|
$
|
454,361
|
$
|
454,994
|
|||||||||||
|
Net loans
|
3
|
5,820,115
|
5,958,427
|
5,528,912
|
5,584,777
|
|||||||||||||||
|
Financial liabilities
|
||||||||||||||||||||
|
Time deposits
|
2
|
$
|
908,827
|
$
|
903,501
|
$
|
1,043,823
|
$
|
1,038,877
|
|||||||||||
|
Long-term debt
|
2
|
130,447
|
131,268
|
130,945
|
132,562
|
|||||||||||||||
|
Junior subordinated debt
|
2
|
101,196
|
97,346
|
101,196
|
103,770
|
|||||||||||||||
Fair value estimates are made at a specific point in time, based on relevant market information and information about the financial instrument. These estimates do not reflect any premium or discount that could result from offering for sale at one time the Company's entire holdings of a particular financial instrument. Because no market exists for a significant portion of the Company's financial instruments, fair value estimates are based on judgments regarding future expected loss experience, current economic conditions, risk characteristics of various financial instruments, and other factors. These estimates are subjective in nature and involve uncertainties and matters of significant judgment and therefore cannot be determined with precision. Changes in assumptions could significantly affect the estimates.
Fair value estimates are based on existing on and off balance sheet financial instruments without attempting to estimate the value of anticipated future business and the value of assets and liabilities that are not considered financial instruments. For example, the Company has a substantial trust and investment management operation that contributes net fee income annually. The trust and investment management operation is not considered a financial instrument, and its value has not been incorporated into the fair value estimates. Other significant assets and liabilities include the benefits resulting from the low-cost funding of deposit liabilities as compared to the cost of borrowing funds in the market, and premises and equipment. In addition, the tax ramifications related to the realization of the unrealized gains and losses can have a significant effect on fair value estimates and have not been considered in the estimate of fair value.
Securities Held to Maturity
The fair value of the Company's investment securities held to maturity is primarily measured using information from a third party pricing service. The fair value measurements consider observable data that may include dealer quotes, market spreads, cash flows, the U.S. Treasury yield curve, live trading levels, trade execution data, market consensus prepayment speeds, credit information and the bond's terms and conditions, among other things.
Net Loans
The fair value of the Company's loans was estimated by discounting the expected future cash flows using the current interest rates at which similar loans would be made for the same remaining maturities. Loans were first segregated by type, and then further segmented into fixed and variable rate and loan quality categories. Expected future cash flows were projected based on contractual cash flows, adjusted for estimated prepayments.
Time Deposits
The fair value of time deposits was estimated using a discounted cash flow approach that applies prevailing market interest rates for similar maturity instruments. The fair values of the Company's time deposit liabilities do not take into consideration the value of the Company's long-term relationships with depositors, which may have significant value.
Long-Term Debt
The fair value of long-term debt was estimated using a discounted cash flow approach that applies prevailing market interest rates for similar maturity instruments.
Trust Preferred Debentures
The fair value of trust preferred debentures has been estimated using a discounted cash flow analysis.
The following table sets forth the Company's financial assets and liabilities measured on a recurring basis that were accounted for at fair value as of December 31, 2015 and December 31, 2014. Assets and liabilities are classified in their entirety based on the lowest level of input that is significant to the fair value measurement (in thousands):
|
|
Quoted Prices in
Active Markets for
Identical Assets
(Level 1)
|
Significant
Other
Observable Inputs
(Level 2)
|
Significant
Unobservable
Inputs
(Level 3)
|
Balance
as of
December 31, 2015
|
||||||||||||
|
Assets:
|
||||||||||||||||
|
Securities Available for Sale:
|
||||||||||||||||
|
Federal Agency
|
$
|
-
|
$
|
311,272
|
$
|
-
|
$
|
311,272
|
||||||||
|
State & municipal
|
-
|
31,637
|
-
|
31,637
|
||||||||||||
|
Mortgage-backed
|
-
|
409,896
|
-
|
409,896
|
||||||||||||
|
Collateralized mortgage obligations
|
-
|
404,971
|
-
|
404,971
|
||||||||||||
|
Other securities
|
7,526
|
9,242
|
-
|
16,768
|
||||||||||||
|
Total Securities Available for Sale
|
$
|
7,526
|
$
|
1,167,018
|
$
|
-
|
$
|
1,174,544
|
||||||||
|
Trading Securities
|
8,377
|
-
|
-
|
8,377
|
||||||||||||
|
Interest Rate Swaps
|
-
|
6,224
|
-
|
6,224
|
||||||||||||
|
Total
|
$
|
15,903
|
$
|
1,173,242
|
$
|
-
|
$
|
1,189,145
|
||||||||
|
|
||||||||||||||||
|
Liabilities:
|
||||||||||||||||
|
Interest Rate Swaps
|
$
|
-
|
$
|
6,224
|
$
|
-
|
$
|
6,224
|
||||||||
|
Total
|
$
|
-
|
$
|
6,224
|
$
|
-
|
$
|
6,224
|
||||||||
|
|
Quoted Prices in
Active Markets for
Identical Assets
(Level 1)
|
Significant
Other
Observable Inputs
(Level 2)
|
Significant
Unobservable
Inputs
(Level 3)
|
Balance
as of
December 31, 2014
|
||||||||||||
|
Assets:
|
||||||||||||||||
|
Securities Available for Sale:
|
||||||||||||||||
|
U.S. Treasury
|
$
|
23,111
|
$
|
-
|
$
|
-
|
$
|
23,111
|
||||||||
|
Federal Agency
|
-
|
329,914
|
-
|
329,914
|
||||||||||||
|
State & municipal
|
-
|
37,570
|
-
|
37,570
|
||||||||||||
|
Mortgage-backed
|
-
|
364,727
|
-
|
364,727
|
||||||||||||
|
Collateralized mortgage obligations
|
-
|
242,129
|
-
|
242,129
|
||||||||||||
|
Other securities
|
7,612
|
8,108
|
-
|
15,720
|
||||||||||||
|
Total Securities Available for Sale
|
$
|
30,723
|
$
|
982,448
|
$
|
-
|
$
|
1,013,171
|
||||||||
|
Trading Securities
|
7,793
|
-
|
-
|
7,793
|
||||||||||||
|
Interest Rate Swaps
|
-
|
4,707
|
-
|
4,707
|
||||||||||||
|
Total
|
$
|
38,516
|
$
|
987,155
|
$
|
-
|
$
|
1,025,671
|
||||||||
|
|
||||||||||||||||
|
Liabilities:
|
||||||||||||||||
|
Interest Rate Swaps
|
$
|
-
|
$
|
4,707
|
$
|
-
|
$
|
4,707
|
||||||||
|
Total
|
$
|
-
|
$
|
4,707
|
$
|
-
|
$
|
4,707
|
||||||||
Fair values for securities are based on quoted market prices or dealer quotes, where available. Where quoted market prices are not available, fair values are based on quoted market prices of comparable instruments. When necessary, the Company utilizes matrix pricing from a third party pricing vendor to determine fair value pricing. Matrix prices are based on quoted prices for securities with similar coupons, ratings, and maturities, rather than on specific bids and offers for the designated security.
The Company enters into interest rate swaps to facilitate customer transactions and meet their financing needs. These swaps are considered derivatives, but are not designated in hedging relationships. These instruments have interest rate and credit risk associated with them. To mitigate the interest rate risk, the Company enters into offsetting interest rate swaps with counterparties. The counterparty swaps are also considered derivatives and are also not designated in hedging relationships. Interest rate swaps are recorded within other assets or other liabilities on the consolidated balance sheet at their estimated fair value. Changes to the fair value of assets and liabilities arising from these derivatives are included, net, in other operating income in the consolidated statement of income.
FASB ASC Topic 820 requires disclosure of assets and liabilities measured and recorded at fair value on a nonrecurring basis. In accordance with the provisions of FASB ASC Topic 310, the Company had collateral dependent impaired loans with a carrying value of approximately $5.9 million which had specific reserves included in the allowance for loan losses of $2.0 million at December 31, 2015. The Company uses the fair value of underlying collateral to estimate the specific reserves for collateral dependent impaired loans. The fair value of underlying collateral is generally determined through independent appraisals, which generally include various Level 3 inputs which are not identifiable. The appraisals may be adjusted by management for qualitative factors such as economic conditions and estimated liquidation expenses ranging from 10% to 35%. Based on the valuation techniques used, the fair value measurements for collateral dependent impaired loans are classified as Level 3.
FASB ASC Topic 825 gives entities the option to measure eligible financial assets, financial liabilities and Company commitments at fair value (i.e., the fair value option), on an instrument-by-instrument basis, that are otherwise not permitted to be accounted for at fair value under other accounting standards. The election to use the fair value option is available when an entity first recognizes a financial asset or financial liability or upon entering into a Company commitment. Subsequent changes in fair value must be recorded in earnings. As of December 31, 2015 and 2014, the Company did not elect the fair value option for any eligible items.
(21) Sale of Equity Investment
On April 17, 2014, NBT Capital Corp., a wholly-owned subsidiary of NBT, sold to LendingClub Corporation, its 20% ownership interest in Springstone Financial, LLC, which NBT originally acquired in exchange for a $3 million investment, as part of LendingClub's acquisition of all of the outstanding equity in Springstone. In total, LendingClub paid the group of selling equityholders a purchase price equal to $140 million in cash and preferred stock. As a result of this sale, the Company recognized a gain of $19.4 million in 2014 and a gain of $4.2 million in 2015. There is $0.9 million in proceeds being held in escrow for indemnification provisions of the sale contract which will be recognized into income when the conditions of the contract have been deemed to be satisfied.
(22) Parent Company Financial Information
Condensed Balance Sheets
|
|
December 31,
|
|||||||
|
(In thousands)
|
2015
|
2014
|
||||||
|
Assets
|
||||||||
|
Cash and cash equivalents
|
$
|
28,682
|
$
|
3,586
|
||||
|
Securities available for sale, at estimated fair value
|
12,711
|
11,649
|
||||||
|
Trading securities
|
8,042
|
6,761
|
||||||
|
Investment in subsidiaries, on equity basis
|
941,731
|
947,880
|
||||||
|
Other assets
|
65,133
|
61,829
|
||||||
|
Total assets
|
$
|
1,056,299
|
$
|
1,031,705
|
||||
|
Liabilities and Stockholders' Equity
|
||||||||
|
Total liabilities
|
$
|
174,295
|
$
|
167,524
|
||||
|
Stockholders' equity
|
882,004
|
864,181
|
||||||
|
Total liabilities and stockholders' equity
|
$
|
1,056,299
|
$
|
1,031,705
|
||||
Condensed Income Statements
|
|
Years ended December 31,
|
|||||||||||
|
(In thousands)
|
2015
|
2014
|
2013
|
|||||||||
|
Dividends from subsidiaries
|
$
|
78,200
|
$
|
35,400
|
$
|
13,500
|
||||||
|
Management fee from subsidiaries
|
92,629
|
87,116
|
84,778
|
|||||||||
|
Securities gains
|
3,034
|
49
|
1,273
|
|||||||||
|
Interest, dividend and other income
|
693
|
800
|
636
|
|||||||||
|
Total revenue
|
174,556
|
123,365
|
100,187
|
|||||||||
|
Operating expense
|
94,332
|
89,834
|
83,679
|
|||||||||
|
Income before income tax benefit and equity in undistributed income of subsidiaries
|
80,224
|
33,531
|
16,508
|
|||||||||
|
Income tax benefit (expense)
|
(515
|
)
|
631
|
(1,046
|
)
|
|||||||
|
Dividends in excess of income (equity in undistributed income) of subsidiaries
|
(3,284
|
)
|
40,912
|
46,285
|
||||||||
|
Net income
|
$
|
76,425
|
$
|
75,074
|
$
|
61,747
|
||||||
Statements of Cash Flow
|
|
Years ended December 31,
|
|||||||||||
|
(In thousands)
|
2015
|
2014
|
2013
|
|||||||||
|
Operating activities
|
||||||||||||
|
Net income
|
$
|
76,425
|
$
|
75,074
|
$
|
61,747
|
||||||
|
Adjustments to reconcile net income to net cash provided by operating activities
|
||||||||||||
|
Stock-based compensation
|
4,086
|
3,521
|
4,305
|
|||||||||
|
Gains (losses) on sales of available-for-sale securities
|
(3,034
|
)
|
49
|
1,273
|
||||||||
|
Equity in undistributed income of subsidiaries
|
2,967
|
(75,824
|
)
|
(59,785
|
)
|
|||||||
|
Cash dividend from subsidiaries
|
-
|
35,400
|
13,500
|
|||||||||
|
Net change in other liabilities
|
6,770
|
18,594
|
(18,077
|
)
|
||||||||
|
Net change in other assets
|
(6,627
|
)
|
(25,151
|
)
|
14,928
|
|||||||
|
Net cash provided by operating activities
|
80,587
|
31,663
|
17,891
|
|||||||||
|
Investing activities
|
||||||||||||
|
Purchases of available-for-sale securities
|
(3,083
|
)
|
(597
|
)
|
-
|
|||||||
|
Sales and maturities of available-for-sale securities
|
5,297
|
140
|
1,948
|
|||||||||
|
Net cash provided by acquisitions
|
-
|
-
|
2,232
|
|||||||||
|
Purchases of premises and equipment
|
(408
|
)
|
(640
|
)
|
(782
|
)
|
||||||
|
Net cash provided by (used in) investing activities
|
1,806
|
(1,097
|
)
|
3,398
|
||||||||
|
Financing activities
|
||||||||||||
|
Proceeds from the issuance of shares to employee benefit plans and other stock plans
|
7,692
|
5,943
|
5,512
|
|||||||||
|
Purchases of treasury shares
|
(26,797
|
)
|
(72
|
)
|
(12,459
|
)
|
||||||
|
Cash dividends and payments for fractional shares
|
(38,149
|
)
|
(36,905
|
)
|
(33,518
|
)
|
||||||
|
Excess tax benefit from exercise of stock options
|
(43
|
)
|
313
|
(178
|
)
|
|||||||
|
Net cash used in financing activities
|
(57,297
|
)
|
(30,721
|
)
|
(40,643
|
)
|
||||||
|
Net increase (decrease) in cash and cash equivalents
|
25,096
|
(155
|
)
|
(19,354
|
)
|
|||||||
|
Cash and cash equivalents at beginning of year
|
3,586
|
3,741
|
23,095
|
|||||||||
|
Cash and cash equivalents at end of year
|
$
|
28,682
|
$
|
3,586
|
$
|
3,741
|
||||||
A statement of changes in stockholders' equity has not been presented since it is the same as the consolidated statement of changes in stockholders' equity previously presented.
None.
As of the end of the period covered by this Annual Report on Form 10-K, an evaluation was carried out by the Company's management, with the participation of its Chief Executive Officer and Chief Financial Officer, of the effectiveness of the Company's disclosure controls and procedures (as defined in Rule 13a-15(e) under the Securities Exchange Act of 1934). Based upon that evaluation, the Chief Executive Officer and Chief Financial Officer concluded that the disclosure controls and procedures were effective as of the end of the period covered by this report. No changes were made to the Company's internal control over financial reporting (as defined in Rule 13a-15(f) under the Securities Exchange Act of 1934) during the last fiscal quarter that materially affected, or are reasonably likely to materially affect, the Company's internal control over financial reporting.
Management Report on Internal Controls Over Financial Reporting
The management of NBT Bancorp, Inc. (the "Company") is responsible for establishing and maintaining adequate internal control over financial reporting. The Company's internal control over financial reporting is a process designed under the supervision of the Company's Chief Executive Officer and Chief Financial Officer to provide reasonable assurance regarding the reliability of financial reporting and the preparation of the Company's consolidated financial statements for external purposes in accordance with generally accepted accounting principles.
As of December 31, 2015, management assessed the effectiveness of the Company's internal control over financial reporting based on the criteria for effective internal control over financial reporting established in "Internal Control — Integrated Framework (2013)," issued by the Committee of Sponsoring Organizations (COSO) of the Treadway Commission. Based on the assessment, management determined that the Company's internal control over financial reporting as of December 31, 2015 was effective at the reasonable assurance level based on those criteria.
KPMG LLP, the independent registered public accounting firm that audited the consolidated financial statements of the Company included in this Annual Report on Form 10-K, has issued a report on the effectiveness of the Company's internal control over financial reporting as of December 31, 2015. The report, which expresses an unqualified opinion on the effectiveness of the Company's internal control over financial reporting as of December 31, 2015, is included in this Item under the heading "Report of Independent Registered Public Accounting Firm" on the following page.
Report of Independent Registered Public Accounting Firm
The Board of Directors and Stockholders
NBT Bancorp Inc.:
We have audited NBT Bancorp, Inc. and subsidiaries' (the Company) internal control over financial reporting as of December 31, 2015, based on criteria established in Internal Control — Integrated Framework (2013) issued by the Committee of Sponsoring Organizations of the Treadway Commission (COSO). The Company's management is responsible for maintaining effective internal control over financial reporting, and for its assessment of the effectiveness of internal control over financial reporting included in the accompanying Management Report on Internal Control Over Financial Reporting. Our responsibility is to express an opinion on the Company's internal control over financial reporting based on our audit.
We conducted our audit in accordance with the standards of the Public Company Accounting Oversight Board (United States). Those standards require that we plan and perform the audit to obtain reasonable assurance about whether effective internal control over financial reporting was maintained in all material respects. Our audit included obtaining an understanding of internal control over financial reporting, assessing the risk that a material weakness exists, and testing and evaluating the design and operating effectiveness of internal control based on the assessed risk. Our audit also included performing such other procedures as we considered necessary in the circumstances. We believe that our audit provides a reasonable basis for our opinion.
A company's internal control over financial reporting is a process designed to provide reasonable assurance regarding the reliability of financial reporting and the preparation of financial statements for external purposes in accordance with generally accepted accounting principles. A company's internal control over financial reporting includes those policies and procedures that (1) pertain to the maintenance of records that, in reasonable detail, accurately and fairly reflect the transactions and dispositions of the assets of the company; (2) provide reasonable assurance that transactions are recorded as necessary to permit preparation of financial statements in accordance with generally accepted accounting principles, and that receipts and expenditures of the company are being made only in accordance with authorizations of management and directors of the company; and (3) provide reasonable assurance regarding prevention or timely detection of unauthorized acquisition, use, or disposition of the company's assets that could have a material effect on the financial statements.
Because of its inherent limitations, internal control over financial reporting may not prevent or detect misstatements. Also, projections of any evaluation of effectiveness to future periods are subject to the risk that controls may become inadequate because of changes in conditions, or that the degree of compliance with the policies or procedures may deteriorate.
In our opinion, the Company maintained, in all material respects, effective internal control over financial reporting as of December 31, 2015, based on the criteria established in Internal Control — Integrated Framework (2013) issued by COSO.
We have also audited, in accordance with the standards of the Public Company Accounting Oversight Board (United States), the consolidated balance sheets of NBT Bancorp Inc. and subsidiaries as of December 31, 2015 and 2014 and the related consolidated statements of income, comprehensive income, changes in stockholders' equity and cash flows for each of the years in the three-year period ended December 31, 2015, and our report dated February 29, 2016 expressed an unqualified opinion on those financial statements.
/s/ KPMG LLP
Albany, New York
February 29, 2016
None.
PART III
The information required by this item is incorporated herein by reference to the Company's definitive Proxy Statement for its Annual Meeting of shareholders to be held on May 3, 2016 (the "Proxy Statement"), which will be filed with the SEC within 120 days after the Company's 2015 fiscal year end.
The information required by this item is incorporated herein by reference to the Proxy Statement which will be filed with the SEC within 120 days after the Company's 2015 fiscal year end.
ITEM 12. Security Ownership of Certain Beneficial Owners and Management and Related Stockholder Matters
The following table provides information with respect to shares of Common Stock that may be issued under the Company's existing equity compensation plans:
|
Plan Category
|
A. Number of securities to be issued upon exercise of outstanding options, warrants and rights
|
B. Weighted-average exercise price of Outstanding options, warrants and rights
|
Number of securities remaining available for Future issuance under Equity compensation plans (excluding securities reflected in column A)
|
|||||||||
|
Equity compensation plans approved by stockholders
|
541,564
|
$
|
23.23
|
3,502,897
|
||||||||
|
Equity compensation plans not approved by stockholders
|
None
|
None
|
None
|
|||||||||
The other information required by this item is incorporated herein by reference to the Proxy Statement which will be filed with the SEC within 120 days of the Company's 2015 fiscal year end.
The information required by this item is incorporated herein by reference to the Proxy Statement which will be filed with the SEC within 120 days of the Company's 2015 fiscal year end.
The information required by this item is incorporated herein by reference to the Proxy Statement which will be filed with the SEC within 120 days of the Company's 2015 fiscal year end.
PART IV
(a)(1) The following Consolidated Financial Statements are included in Part II, Item 8 hereof:
Report of Independent Registered Public Accounting Firm.
Consolidated Balance Sheets as of December 31, 2015 and 2014.
Consolidated Statements of Income for each of the three years ended December 31, 2015, 2014 and 2013.
Consolidated Statements of Changes in Stockholders' Equity for each of the three years ended December 31, 2015, 2014 and 2013.
Consolidated Statements of Cash Flows for each of the three years ended December 31, 2015, 2014 and 2013.
Consolidated Statements of Comprehensive Income for each of the three years ended December 31, 2015, 2014 and 2013.
Notes to the Consolidated Financial Statements.
(a)(2) There are no financial statement schedules that are required to be filed as part of this form since they are not applicable or the information is included in the consolidated financial statements.
(a)(3) See below for all exhibits filed herewith and the Exhibit Index.
|
3.1
|
Restated Certificate of Incorporation of NBT Bancorp Inc. as amended through July 1, 2015 (filed as Exhibit 3.1 to Registrant's Form 10-Q filed on August 10, 2015 and incorporated herein by reference)
|
|
3.2
|
Amended and restated Bylaws of NBT Bancorp Inc. effective July 1, 2015 (filed as Exhibit 3.2 to Registrant's Form 8-K, filed on July 1, 2015 and incorporated herein by reference).
|
|
3.3
|
Certificate of Designation of the Series A Junior Participating Preferred Stock (filed as Exhibit A to Exhibit 4.1 of the Registrant's Form 8-K, filed on November 18, 2004, and incorporated herein by reference).
|
|
4.1
|
Specimen common stock certificate for NBT's Bancorp Inc. common stock (filed as Exhibit 4.1 to the Registrant's Amendment No. 1 to Registration Statement on Form S-4 filed on December 27, 2005 and incorporated herein by reference).
|
|
10.1
|
NBT Bancorp Inc. 1993 Stock Option Plan (filed as Exhibit 99.1 to Registrant's Form S-8 Registration Statement, file number 333-71830 filed on October 18, 2001 and incorporated by reference herein).*
|
|
10.2
|
NBT Bancorp Inc. Non-Employee Director, Divisional Director and Subsidiary Director Stock Option Plan (filed as Exhibit 99.1 to Registrant's Form S-8 Registration Statement, file number 333-73038 filed on November 9, 2001 and incorporated by reference herein).*
|
|
10.3
|
NBT Bancorp Inc. Non-employee Directors Restricted and Deferred Stock Plan (filed as Exhibit 10.5 to Registrant's Form 10-K for the year ended December 31, 2008, filed on March 2, 2009 and incorporated herein by reference).*
|
|
10.4
|
NBT Bancorp Inc. Performance Share Plan (filed as Exhibit 10.6 to Registrant's Form 10-K for the year ended December 31, 2008, filed on March 2, 2009 and incorporated herein by reference).*
|
|
NBT Bancorp Inc. 2016 Executive Incentive Compensation Plan.*
|
|
|
10.6
|
2006 Non-Executive Restricted Stock Plan (filed as Exhibit 99.1 to Registrant's Form S-8 Registration Statement, file number 333-139956, filed on January 12, 2007, and incorporated herein by reference).*
|
|
10.7
|
Supplemental Retirement Agreement between NBT Bancorp Inc., NBT Bank, National Association and Daryl R. Forsythe as amended and restated Effective January 1, 2005 (filed as Exhibit 10.11 to Registrant's Form 10-K for the year ended December 31, 2005, filed on March 15, 2006 and incorporated herein by reference).*
|
|
10.8
|
Death Benefits Agreement between NBT Bancorp Inc., NBT Bank, National Association and Daryl R. Forsythe made August 22, 1995 (filed as Exhibit 10.12 to Registrant's Form 10-K for the year ended December 31, 2005, filed on March 15, 2006 and incorporated herein by reference).*
|
|
10.9
|
Employment Agreement, dated March 10, 2015, by and between NBT Bancorp Inc. and Martin A. Dietrich (filed as Exhibit 10.1 to Registrant's Form 8-K filed on March 16, 2015 and incorporated herein by reference).*
|
|
10.10
|
Supplemental Executive Retirement Agreement between NBT Bancorp Inc. and Martin A. Dietrich as amended and restated January 20, 2010. (filed as Exhibit 10.14 to Registrant's Form 10-K for the year ended December 31, 2009, filed on March 1, 2010 and incorporated herein by reference).*
|
|
10.11
|
Employment Agreement, dated March 10, 2015, by and between NBT Bancorp Inc. and Michael J. Chewens (filed as Exhibit 10.2 to Registrant's Form 8-K filed on March 16, 2015 and incorporated herein by reference).*
|
|
10.12
|
Form of Amended and Restated NBT Bancorp Inc. Supplemental Retirement Agreement, dated as of November 5, 2009, between NBT Bancorp Inc. and Messrs. Chewens, Levy and Raven (filed as Exhibit 10.7 to Registrant's Form 10-Q for the quarterly period ended September 30, 2009, filed on November 9, 2009 and incorporated herein by reference).*
|
|
10.13
|
Amendment to the Supplemental Executive Retirement Agreement, dated March 10, 2015, by and between NBT Bancorp Inc. and Michael J. Chewens (filed as Exhibit 10.6 to Registrant's Form 8-K filed on March 16, 2015 and incorporated herein by reference).*
|
|
10.14
|
Amendment to the Supplemental Executive Retirement Agreement, dated March 10, 2015, by and between NBT Bancorp Inc. and David E. Raven (filed as Exhibit 10.7 to Registrant's Form 8-K filed on March 16, 2015 and incorporated herein by reference).*
|
|
10.15
|
Amendment to the Supplemental Executive Retirement Agreement, dated March 10, 2015, by and between NBT Bancorp Inc. and Jeffrey M. Levy (filed as Exhibit 10.8 to Registrant's Form 8-K filed on March 16, 2015 and incorporated herein by reference).*
|
|
10.16
|
Employment Agreement, dated March 10, 2015, by and between NBT Bancorp Inc. and David E. Raven (filed as Exhibit 10.3 to Registrant's Form 8-K filed on March 16, 2015 and incorporated herein by reference).*
|
|
10.17
|
Employment Agreement, dated March 10, 2015, by and between NBT Bancorp Inc. and Jeffrey M. Levy (filed as Exhibit 10.4 to Registrant's Form 8-K filed on March 16, 2015 and incorporated herein by reference).*
|
|
10.18
|
Split-Dollar Agreement between NBT Bancorp Inc., NBT Bank, National Association and Martin A. Dietrich made November 10, 2008 (filed as Exhibit 10.1 to Registrant's Form 10-Q for the quarterly period ended September 30, 2008, filed on November 10, 2008 and incorporated herein by reference).*
|
|
10.19
|
First Amendment dated November 5, 2009 to Split-Dollar Agreement between NBT Bancorp Inc., NBT Bank, National Association and Martin A. Dietrich made November 10, 2008 (filed as Exhibit 10.6 to Registrant's Form 10-Q for the quarterly period ended September 30, 2009, filed on November 9, 2009 and incorporated herein by reference).*
|
|
10.20
|
Second Amendment dated July 28, 2014 to Split-Dollar Agreement between NBT Bancorp, Inc., NBT Bank, National Association, and Martin A. Dietrich made November 10, 2008 (filed as Exhibit 10.1 to Registrant's Form 8-K, filed on August 1, 2014, and incorporated herein by reference).*
|
|
10.21
|
NBT Bancorp Inc. 2008 Omnibus Incentive Plan (filed as Appendix A of Registrant's Definitive Proxy Statement on Form 14A filed on March 31, 2008, and incorporated herein by reference).*
|
|
10.22
|
Long Term Incentive Compensation Plan for Named Executive Officers (filed as Exhibit 10.24 to Registrant's Form 10-K for the year ended December 31, 2011, filed on February 29, 2012 and incorporated herein by reference).*
|
|
10.23
|
Employment Agreement, dated March 10, 2015, by and between NBT Bancorp Inc. and Timothy L. Brenner (filed as Exhibit 10.5 to Registrant's Form 8-K filed on March 16, 2015 and incorporated herein by reference).*
|
|
10.24
|
Amended and Restated Supplemental Retirement Agreement and First Amendment to the Supplemental Retirement Agreement between Alliance Financial Corporation, Alliance Bank, N.A. and Jack H. Webb (filed as Exhibit 10.29 to Registrant's Form 10-K for the year ended December 31, 2013, filed on March 3, 2014 and incorporated herein by reference).*
|
|
10.25
|
Split Dollar Agreement between the Alliance Bank N.A. and Jack H. Webb (filed as Exhibit 10.30 to Registrant's Form 10-K for the year ended December 31, 2013, filed on March 3, 2014 and incorporated herein by reference).*
|
|
A list of the subsidiaries of the Registrant.
|
|
|
Consent of KPMG LLP.
|
|
|
Certification by the Chief Executive Officer pursuant to Rules 13(a)-14(a)/15(d)-14(e) of the Securities and Exchange Act of 1934.
|
|
|
Certification by the Chief Financial Officer pursuant to Rules 13(a)-14(a)/15(d)-14(e) of the Securities and Exchange Act of 1934.
|
|
|
Certification by the Chief Executive Officer pursuant to 18 U.S.C. 1350, as adopted pursuant to Section 906 of the Sarbanes-Oxley Act of 2002.
|
|
|
Certification of the Chief Financial Officer pursuant to 18 U.S.C. 1350, as adopted pursuant to Section 906 of the Sarbanes-Oxley Act of 2002.
|
* Management contract or compensatory plan or arrangement
|
(b)
|
Exhibits to this Form 10-K are attached or incorporated herein by reference as noted above.
|
|
(c)
|
Not applicable
|
Pursuant to the requirements of Section 13 or 15(d) of the Securities Exchange Act of 1934, NBT Bancorp Inc. has duly caused this report to be signed on its behalf by the undersigned, thereunto duly authorized.
|
NBT BANCORP INC. (Registrant)
|
|
February 29, 2016
|
|
|
|
/s/ Martin A. Dietrich
|
|
Martin A. Dietrich
|
|
|
|
Chief Executive Officer
|
Pursuant to the requirements of the Securities Exchange Act of 1934, this report has been signed below by the following persons on behalf of the Registrant and in the capacities and on the dates indicated.
|
/s/ Daryl R. Forsythe
|
|
|
|
Daryl R. Forsythe
|
|
Chairman and Director
|
|
Date: February 29, 2016
|
|
/s/ Martin A. Dietrich
|
|
|
|
Martin A. Dietrich
|
|
NBT Bancorp Inc. President, CEO, and Director (Principal Executive Officer)
|
|
Date: February 29, 2016
|
|
/s/ Michael J. Chewens
|
|
|
|
Michael J. Chewens
|
|
Chief Financial Officer
|
|
(Principal Financial Officer and Principal Accounting Officer)
|
|
Date: February 29, 2016
|
|
/s/ Patricia T. Civil
|
|
|
|
Patricia T. Civil, Director
|
|
Date: February 29, 2016
|
|
/s/ Timothy E. Delaney
|
|
|
|
Timothy E. Delaney, Director
|
|
Date: February 29, 2016
|
|
/s/ James H. Douglas
|
|
|
|
James H. Douglas, Director
|
|
Date: February 29, 2016
|
|
/s/ John C. Mitchell
|
|
|
|
John C. Mitchell, Director
|
|
Date: February 29, 2016
|
|
/s/ Michael M. Murphy
|
|
|
|
Michael M. Murphy, Director
|
|
Date: February 29, 2016
|
|
/s/ Joseph A. Santangelo
|
|
|
|
Joseph A. Santangelo, Director
|
|
Date: February 29, 2016
|
|
/s/ Robert A. Wadsworth
|
|
|
|
Robert A. Wadsworth, Director
|
|
Date: February 29, 2016
|
|
/s/ Lowell A. Seifter
|
|
|
|
Lowell A. Seifter, Director
|
|
Date: February 29, 2016
|
|
/s/ Jack H. Webb
|
|
|
|
Jack H. Webb, Director
|
|
Date: February 29, 2016
|
103