Attached files
| file | filename |
|---|---|
| EX-31.2 - EX-31.2 - ARRIS International plc | d15560dex312.htm |
| EX-3.1 - EX-3.1 - ARRIS International plc | d15560dex31.htm |
| EX-23 - EX-23 - ARRIS International plc | d15560dex23.htm |
| EX-31.1 - EX-31.1 - ARRIS International plc | d15560dex311.htm |
| EX-32.2 - EX-32.2 - ARRIS International plc | d15560dex322.htm |
| EX-24 - EX-24 - ARRIS International plc | d15560dex24.htm |
| EX-32.1 - EX-32.1 - ARRIS International plc | d15560dex321.htm |
| EX-4.1 - EX-4.1 - ARRIS International plc | d15560dex41.htm |
| EX-21 - EX-21 - ARRIS International plc | d15560dex21.htm |
Table of Contents
Index to Financial Statements
UNITED STATES SECURITIES AND EXCHANGE COMMISSION
WASHINGTON, D.C. 20549
FORM 10-K
For the fiscal year ended December 31, 2015
of
ARRIS INTERNATIONAL PLC
(Exact name of registrant as specified in its charter)
| England and Wales | 001-37672 | 98-1241619 | ||
| (State or Other Jurisdiction of Incorporation) |
(Commission File Number) |
(I.R.S. Employer Identification No.) |
| 3871 Lakefield Drive, Suwanee, Georgia |
30024 | |||
| (Address of Principal Executive Offices) | (Zip Code) | |||
Registrant’s telephone number, including area code: (678) 473-2000
Securities registered pursuant to Section 12(b) of the Act:
Ordinary Shares, £0.01 nominal value — NASDAQ Global Market System
ARRIS International plc is a well-known seasoned issuer.
ARRIS International plc (1) has filed all reports required to be filed by Section 13 or 15(d) of the Securities Exchange Act of 1934 during the preceding 12 months and (2) has been subject to such filing requirements for the past 90 days.
Except as set forth in Item 10, ARRIS International plc is unaware of any delinquent filers pursuant to Item 405 of Regulation S-K.
ARRIS International plc is a large accelerated filer and is not a shell company.
ARRIS International plc is required to submit electronically and post on its corporate web site interactive data files required to be submitted and posted pursuant to Rule 405 of Regulation S-T.
The aggregate market value of ARRIS International plc’s Ordinary Shares held by non-affiliates as of June 30, 2015 was approximately $4.4 billion (computed on the basis of the last reported sales price per share of such stock of $30.60 on the NASDAQ Global Market System). For these purposes, directors, officers and 10% shareholders have been assumed to be affiliates.
As of January 31, 2016, 195,192,022 shares of ARRIS International plc’s Ordinary Shares were outstanding.
Portions of ARRIS International plc’s Proxy Statement for its 2016 Annual Meeting of Stockholders are incorporated by reference into Part III.
Table of Contents
Index to Financial Statements
EXPLANATORY NOTE
On January 4, 2016, ARRIS Group, Inc. (“ARRIS Group”) completed its combination (the “Combination”) with Pace plc, a company incorporated in England and Wales (“Pace”). In connection with the Combination, (i) ARRIS International plc (the “Registrant”), a company incorporated in England and Wales, acquired all of the outstanding ordinary shares of Pace (the “Pace Acquisition”) and (ii) a wholly-owned subsidiary of the Registrant was merged with and into ARRIS Group (the “Merger”), with ARRIS Group surviving the Merger as an indirect wholly-owned subsidiary of the Registrant. Under the terms of the Combination, (a) Pace shareholders received 132.5 pence in cash and 0.1455 ordinary shares of the Registrant for each Pace Share they held, and (b) ARRIS Group stockholders received one ordinary share of the Registrant for each share of ARRIS Group common stock they held. Following the Combination, ARRIS Group became an indirect wholly-owned subsidiary of the Registrant and Pace became a direct wholly-owned subsidiary of the Registrant. The ordinary shares of the Registrant trade on the NASDAQ under the symbol “ARRS.”
This Annual Report on Form 10-K is being filed by the Registrant on behalf of, and as successor, to ARRIS Group. The Registrant is deemed to be the successor to ARRIS Group pursuant to Rule 12g-3(a) under the Securities Exchange Act of 1934, as amended (the “Exchange Act”), and the ordinary shares of the Registrant are deemed to be registered under Section 12(b) of the Exchange Act. In accordance with Rule 12g-3(g) under the Exchange Act, this Annual Report on Form 10-K covers the last full fiscal year of ARRIS Group and generally contains information that would be required if filed by ARRIS Group. Historical financial results presented herein are those of ARRIS Group only and do not reflect any results of Pace.
i
Table of Contents
Index to Financial Statements
ii
Table of Contents
Index to Financial Statements
PART I
| Item 1. | Business |
As used in this Annual Report, unless the context requires otherwise, “we,” “our,” “us,” “the Company,” and “ARRIS” refer to ARRIS International plc (and its predecessors) and our consolidated subsidiaries.
General
Our principal executive offices are located at 3871 Lakefield Drive, Suwanee, Georgia 30024, and our telephone number is (678) 473-2000. We maintain a website at www.arris.com. The information contained on our website is not part of, and is not incorporated by reference into, this Form 10-K. On our website, we provide links to copies of the annual, quarterly and current reports that we file with the Securities and Exchange Commission (“SEC”), Section 16 reports that our officers and directors file with the SEC, any amendments to those reports, proxy materials for meetings of our shareholders, and all Company news releases. Investor presentations are also frequently posted on our website. Copies of our code of ethics and the charters of our standing board committees also are available on our website. We will provide investors copies of these documents in electronic or paper form upon request, free of charge. We will disclose on our website or on a Current Report on Form 8-K any waivers or amendments to our code of ethics made with respect to our directors and executive officers.
Glossary of Terms
Below are commonly used acronyms in our industry and their meanings:
| Acronym |
Terminology | |
| AdVOD |
Linear and Demand Oriented Advertising | |
| ARPU |
Average Revenue Per User | |
| BEQ |
Broadband Edge QAM | |
| BSR |
Broadband Services Router | |
| Cable VoIP |
Cable Voice over Internet Protocol | |
| CAM |
Cable Access Module | |
| CBR |
Constant Bit Rate | |
| CCAP |
Converged Cable Access Platform | |
| CE |
Consumer Electronics | |
| CMS |
Content Management System | |
| CMTS |
Cable Modem Termination System | |
| COTS |
Commercial Off the Shelf | |
| CPE |
Customer Premises Equipment | |
| CVeX |
Converged Video Exchange | |
| CWDM |
Coarse Wave Division Multiplexing | |
| DBS |
Digital Broadcast Satellite | |
| DCT |
Digital Consumer Terminal | |
|
DOCSIS® |
Data Over Cable Service Interface Specification | |
| DPI |
Digital Program Insertion | |
| DRM |
Digital Rights Management | |
| DSL |
Digital Subscriber Line | |
| DTA |
Digital Television Adapter | |
| DVB |
Digital Video Broadcasting | |
| DVR DWDM |
Digital Video Recorder Dense Wave Division Multiplexing | |
| EMTA |
Embedded Multimedia Terminal Adapter | |
| EPON |
Ethernet over Passive Optical Network | |
| eQAM |
Edge Quadrature Amplitude Modulator |
1
Table of Contents
Index to Financial Statements
| Acronym |
Terminology | |
| FPGA |
Field Programmable Gate Arrays | |
| FTTH |
Fiber to the Home | |
| FTTP |
Fiber to the Premises | |
| GAAP |
Generally Accepted Accounting Principles | |
| GHZ |
Gigahertz | |
| GPA |
General Purchase Agreements | |
| HD |
High Definition | |
| HD-DVR |
High Definition Digital Video Recorder | |
| HDTV |
High Definition Television | |
| HDR |
High Dynamic Range | |
| HEVC |
High Efficiency Video Coding | |
| HFC |
Hybrid Fiber-Coaxial | |
| IFRS |
International Financial Reporting Standards | |
| ILEC |
Incumbent Local Exchange Carrier | |
| IoT |
Internet of Things | |
| IP |
Internet Protocol | |
| IPR |
Intellectual Property Rights | |
| IPTV |
Internet Protocol Television | |
| IRD |
Integrated Receiver / Decoder | |
| LAN |
Local Area Network | |
| Mbps |
Megabits per Second | |
| MPEG |
Moving Picture Experts Group | |
| MPEG-2 |
Moving Picture Experts Group, Standard No. 2 | |
| MPEG-4 |
Moving Picture Experts Group, Standard No. 4 | |
| M-CMTS |
Modular CMTS | |
| MSO |
Multiple Systems Operator | |
| MSP |
Media Services Platform | |
| MTA |
Multimedia Terminal Adapter | |
| MVPD |
Multichannel Video Programming Distributors | |
| NGNA |
Next Generation Network Architecture | |
| nDVR |
Network Digital Video Recorder | |
| nPVR |
Network Personal Video Recorder | |
| NSM |
Network Service Manager | |
| NIU |
Network Interface Unit | |
| OLT |
Optical Line Termination | |
| ONU |
Optical Network Unit | |
| OEM |
Original Equipment manufacturer | |
| OSS |
Operations Support System | |
| OTT |
Over-the-Top | |
| PC |
Personal Computer | |
| PCS |
Post Contract Support | |
| PCT |
Patent Convention Treaty | |
| PON PSTN |
Passive Optical Network Public-Switched Telephone Network | |
| PVR QAM |
Personal Video Recorder Quadrature Amplitude Modulation | |
| QoS |
Quality of Service | |
| RDK |
Reference Design Kit | |
| RF |
Radio Frequency | |
| RFOG |
Radio Frequency over Glass | |
| RGU |
Revenue Generating Unit |
2
Table of Contents
Index to Financial Statements
| Acronym |
Terminology | |
| SCTE |
Society of Cable Telecommunication Engineers | |
| SD |
Standard Definition | |
| SDV |
Switched Digital Video | |
| SLA |
Service Level Agreement | |
| TVE |
TV Everywhere | |
| UHD |
Ultra High Definition | |
| Triple Play |
Bundled Offering of Internet, Telephone and TV | |
| VAR |
Value-Added Reseller | |
| VOD |
Video on Demand | |
| VoIP |
Voice over Internet Protocol | |
| VPN |
Virtual Private Network | |
| VSP |
Video Services Platform / Video Service Provider | |
| VSOE |
Vendor-Specific Objective Evidence |
Overview
ARRIS, headquartered in Suwanee, Georgia, is a world leader in entertainment and communications technology. Our innovations combine hardware, software, and services across the cloud, network, and home to power TV and Internet for millions of people around the globe. The people of ARRIS collaborate with the world’s top service providers, content providers, and retailers to advance the state of our industry and pioneer tomorrow’s connected world. For more information, visit www.arris.com.
We operate in two business segments: Customer Premises Equipment (“CPE”) and Network & Cloud (“N&C”). We enable service providers including cable, telephone, and digital broadcast satellite operators and media programmers to deliver media, voice, and IP data services to their subscribers. We are a leader in set-tops, digital video and Internet Protocol Television (“IPTV”) distribution systems, broadband access infrastructure platforms, and associated data and voice CPE, which we also sell directly to consumers through retail channels. Our solutions are complemented by a broad array of services including technical support, repair and refurbishment, and system design and integration.
Pace Acquisition
On January 4, 2016, we completed the acquisition of Pace. As part of the transaction, both ARRIS Group and Pace became wholly owned subsidiaries of ARRIS International plc, our new holding company incorporated in England and Wales. While our jurisdiction of organization was changed, our corporate headquarters remain in the United States.
Except for historical financial information, which relates only to ARRIS Group, or as context otherwise requires, our description of the company and the industry and markets we operate in described in this Annual Report on Form 10-K reflects the combined operations of ARRIS and Pace. We continue to operate in two business segments — Network & Cloud and Consumer Premises Equipment — and the former Pace products are included in these segments.
Industry Overview
Entertainment and communications delivery is evolving rapidly as a result of a convergence of trends — including increased competition among service providers, industry consolidation, advances in technology, and shifts in global content consumption behaviors.
We have recently seen a marked evolution in consumers’ entertainment habits — from a growing preference for program binge-watching to a general increase in direct-to-consumer services using consumer-owned devices. This broadening of content consumption behaviors over a growing number of devices is creating new challenges for service providers as they continue to scale bandwidth and implement new network efficiencies, as well as new demands on the home network to deliver content wirelessly and to every corner of the home.
3
Table of Contents
Index to Financial Statements
Video distribution over the broadband IP network is transforming how content is managed and consumed. IP not only facilitates new forms of video — like Over-the-top TV (“OTT”) and interactive television — and the ways in which video is delivered, but it is also accelerating the evolution of communications services, like interactive media and broadband. As a result, service providers are compelled to continually invest in and upgrade their network and expand their video, voice, data, and mobile services. This trend has accelerated as service providers’ race to deliver residential gigabit broadband speeds to fully support new multiscreen video services and support the explosion of Internet of Things (“IoT”) devices.
Providing these advanced services to consumers is a highly competitive business. This environment is driving service providers to enhance and expand their offerings by adding more high-definition (“HD”) channels, and now Ultra High Definition (“UHD”) TV content, increasing data speeds and expanding wireless services to provide converged media experiences that bridge conventional TV and Internet services. This competition underpins the market for regular video and broadband network upgrades as well as technology investment cycles in CPE, such as set-tops, gateways and modems.
Service providers continue to invest in new capabilities to differentiate and gain market share. That investment has resulted in enhanced user interfaces, higher broadband speeds, additional programming, integrated home networking and monitoring services, with higher reliability. These cycles, combined with associated consumer trends and innovation in entertainment and communications delivery continue to accelerate industry growth.
Current Operating Segments
We report two operating segments, (1) Network & Cloud and (2) Customer Premises Equipment. Corporate and other expenses not included in the measure of segment contribution are reported in an “All Other” category. See Note 10 Segment Information of Notes to the Consolidated Financial Statements for additional information.
Our Strategy
Our long-term business strategy directly addresses these global industry trends. We collaborate with the world’s leading service and content providers to invent the future, a world where entertainment and communications are connected and personalized, blending seamlessly into our everyday lives. ARRIS pursues these goals in the following ways:
| • | Providing a balanced portfolio of products and services connecting the home and business to the worldwide Internet |
| • | Investing in global research and development |
| • | Establishing and maintaining deep relationships with our customers |
| • | Targeting leading positions in large global markets |
| • | Expanding our presence in markets in which we have less scale, for example, satellite, telco, professional services and retail |
| • | Balancing both organic and inorganic investments to expand our business |
| • | Enhancing the ARRIS brand |
Specific aspects of our strategy include:
| • | Leveraging ARRIS’s scale to drive profitable worldwide growth. Our comprehensive portfolio and global scale position ARRIS to cater to the world’s leading service providers and capitalize on their investments in our market. |
| • | Enabling our service provider customers to provide the necessary broadband capacity to support consumer demand for faster Internet connections and the transition to IP Video. Consumer demand for faster Internet speeds continues to grow at an escalating rate, primarily driven by an ever increasing con- |
4
Table of Contents
Index to Financial Statements
| sumption of video. ARRIS provides the technology to enable our customers to manage this exponential bandwidth growth cost effectively. We invest in both DOCSIS and Next Generation PON (FTTH) to ensure our products are at the forefront in enabling service providers to deliver the very highest amount of bandwidth to their subscribers. |
| • | Capitalizing on the evolution towards network convergence and all IP platforms to drive business growth. Service providers face a unique challenge in preparing for the future: delivering today’s new services on legacy equipment, while transitioning to an all-IP model to anticipate the demand for tomorrow’s advanced services. ARRIS collaborates with its global customers to transform their entire delivery chain from content creation to consumption. Our broad portfolio offers a variety of pathways for delivering tomorrow’s services through a combination of network-based video transcoding, packaging, and compression technologies required to deliver new IP video formats; cloud-based platforms to deliver robust and personalized user experiences; and home gateways that are the new hub for delivering IP-based entertainment to connected devices inside and outside the home. |
| • | Enabling differentiated and personalized multiscreen experiences through a holistic approach to content delivery. The growth of connected consumer devices has created an opportunity for service providers to deliver new, more personalized content experiences to consumers across multiple screens. These experiences require control over content distribution as well as seamless integration into multiple touchpoints in the consumer experience. ARRIS is transforming the entertainment experience through a holistic approach to content delivery, leveraging our expertise in the cloud, network, and home — to help providers anticipate demand for more personalized, relevant, and mobile experiences. |
| • | Investing in our product and service portfolios through development, partnership and acquisition. ARRIS’s growth strategy is focused on investing in the right opportunities to significantly expand our business. We leverage our global scale and innovation around the world. We regularly seek organic investment and acquisition opportunities that position ARRIS for future growth. |
| • | Expanding our international business and exploring adjacent market opportunities. ARRIS continuously seeks and analyzes investments in opportunities that allow us to capitalize on the growth of video and broadband services in global markets. Some examples include the growth of digital video and HDTV in the Caribbean and Latin America, Europe, the Middle East and Africa (“EMEA”) and Asia as well as the demand for increased data speeds that are driving infrastructure investment. We also are pursuing opportunities in new and adjacent markets, including satellite, telco, professional services and retail. |
5
Table of Contents
Index to Financial Statements
Our Principal Products
Our innovations combine hardware, software, and services across the cloud, network, and home to power TV and Internet for millions of people around the globe. A cross-section of our products in each of our two business segments Network & Cloud and Customer Premises Equipment are depicted below:
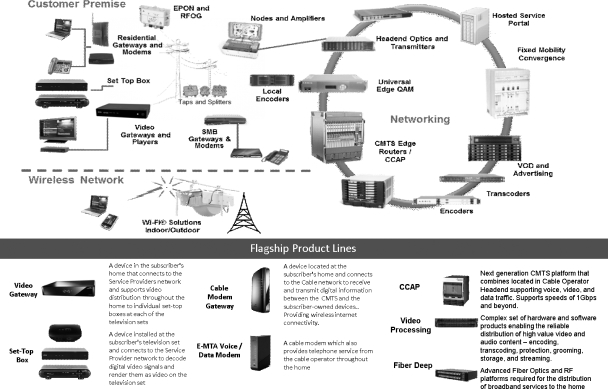
Network & Cloud
| • | Infrastructure Products |
CMTS/CCAP
| • | The Cable Modem Termination System (“CMTS”) is cable operator headend equipment that communicates with cable modems to control the flow of data; allocates shared bandwidth and prioritizes and routes traffic. The Converged Cable Access Platform (“CCAP”) combines the functionality of a CMTS and an Edge QAM to enable voice, video and data in a converged IP network |
Video Infrastructure
| • | Multichannel Video Programming Distributors (“MVPD”) and Programmer Equipment that process and package video content for delivery over the service provider network to be received by a set-top or gateway. Includes encoding, compression, transcoding, storage, policy management, security and encryption, and signal modulation for HFC, DSL and/or fiber networks. |
| • | Ad Insertion Technologies supporting linear and on demand ad placement and substitution in MPEG and IP delivery environments. |
Access & Transport
| • | Equipment in the ground or on transmission poles between service providers’ headend and subscribers’ premises, as well as equipment used to initiate the distribution of content-carrying signals. Includes optical transmission equipment, Fiber Nodes, RF Amplifiers and metro Wi-Fi wireless products. |
6
Table of Contents
Index to Financial Statements
| • | Global Services |
| • | Technical support, professional services, and systems integration capabilities to roll out new solutions and services at a great speed and cadence. |
| • | Cloud Solutions |
| • | Software products that enable providers to securely deliver rich user experiences; multiscreen recommendations, offer management, and advertising services. |
| • | Network Management products that collect vast amounts of information from the Broadband network and apply analytics to diagnose faults and improve performance. |
| • | Workforce management solutions enabling Service Providers to efficiently manage and dispatch field technicians. Network surveillance and issue correlation software and services. |
Customer Premises Equipment
| • | CPE Products |
Set-Top
| • | A device installed at the subscriber’s television set and connects to the service provider network to decode secure digital video signals and render them as video on the television set. |
Gateway
| • | A device that connects to the service provider network and delivers video, voice, and data services throughout the subscriber’s home. |
DSL and Cable Modem
| • | A device located at the subscriber’s home that connects to the cable or telco network to receive and transmit digital information between subscriber-owned devices (e.g. PC or tablet) and the service provider’s headend or central office, providing Internet connectivity. |
E-MTA and Voice / Data Modem
| • | A modem that also provides both data and telephone service from the service provider throughout the home. |
Sales and Marketing
Our sales, sales engineering and technical services teams serve our global customers through offices in the U.S. and many of our global markets. We also work with value added resellers (“VARs”), sales representatives and channel partners that extend our sales presence into operator markets where we do not have established sales offices. We also maintain an inside sales group that is responsible for regular phone contact with the customer, prompt order entry, timely and accurate delivery, and effective sales administration.
Our sales engineering team assists customers in system design and specification. Our technical services team provides professional services to help network operators design and keep their networks operating at peak performance. We provide 24x7 technical support, directly and through channel partners, as well as training, both at our facilities and at our customers’ sites.
We achieve superior customer service through advanced customer relationship management programs combined with information systems that allow us to provide personalized and timely customer support on a range of subjects and to continually refine operations management.
Our marketing organization promotes both the ARRIS brand and our solutions to key stakeholders including customers, consumers, partners, prospects and employees throughout the world. It is complemented by a product management team, which works with our engineering bench to develop and market new products and product
7
Table of Contents
Index to Financial Statements
enhancements. These teams are responsible for inventory levels, pricing, delivery requirements, market demand analysis, as well as product positioning, communications and advertising.
Customers
The majority of our sales are to facilities-based cable and telco multi-channel video service providers. As the global cable, satellite and telecommunications industries continue a trend toward consolidation, our sales to the largest service providers are crucial to our success. Our sales are substantially dependent upon a system operator’s selection of ARRIS’s network equipment, demand for increased broadband services by subscribers, and general capital expenditure levels by system operators. Our two largest customers (including their affiliates, as applicable) are Comcast and Time Warner Cable. From time to time, the affiliates included in our revenues from these customers have changed as a result of mergers and acquisitions. Therefore, the revenue for our customers for prior periods has been adjusted to include, on a comparable basis for all periods presented, the affiliates currently understood to be under common control. Our sales to these customers for the last three years were (in thousands, except percentages):
| Years ended December 31, | ||||||||||||
| 2015 | 2014 | 2013 | ||||||||||
| Comcast and affiliates |
$ | 1,007,892 | $ | 1,012,367 | $ | 674,977 | ||||||
| % of sales |
21.0 | % | 19.0 | % | 18.6 | % | ||||||
| Time Warner Cable and affiliates |
$ | 687,645 | $ | 600,770 | $ | 331,829 | ||||||
| % of sales |
14.3 | % | 11.3 | % | 9.2 | % | ||||||
ARRIS generally utilizes standard terms of sale. These standard terms of sale apply to all customer purchases except those to a few of our large customers with whom we have executed general purchase agreements (“GPAs”). These GPAs do not generally obligate the customer to a specific volume of business. The vast majority of our sales, whether to customers with GPAs or otherwise, result from periodic purchase orders. We have multiple agreements with our largest customers, including Comcast and Time Warner Cable, based upon their needs or as a result of prior acquisitions. We maintain these agreements in the normal course of our business.
International Operations
Our international revenue is generated primarily from Asia-Pacific, EMEA and Americas. The Asia-Pacific market includes Australia, China, Hong Kong, India, Japan, Korea, Singapore, and Taiwan. The EMEA market includes Austria, Belgium, France, Germany, Great Britain, Hungary, Ireland, Israel, Netherlands, Norway, Poland, Portugal, Romania, Russia, Spain, Sweden, Switzerland and Turkey. The Americas market includes Argentina, Bahamas, Brazil, Canada, Chile, Colombia, Costa Rica, Ecuador, Honduras, Jamaica, Mexico, Panama, Peru and Puerto Rico. Revenues from international customers were approximately 28.7%, 25.7%, and 32.1% of total revenues for 2015, 2014 and 2013, respectively.
We continue to strategically invest in worldwide marketing and sales efforts. We currently maintain international sales offices in Argentina, Brazil, Chile, China, Great Britain, Japan, Korea, Mexico, Netherlands and Spain.
Research and Development
We operate in an industry that is subject to rapid changes in technology and our success is largely contingent upon anticipating such changes. Accordingly, we invest significantly in research and development. This commitment to innovation resulted in the development of many next-generation consumer solutions such as CCAP, DOCSIS3.1, HD-DVR, WholeHome DVR/media server, in-home and metro Wi-Fi, IoT and 4K/UHD. We continue to innovate in anticipation of both our customers’ needs and developing industry trends, including:
| • | Transforming the Entertainment Experience — solving the complexity of delivering content to the growing number of connected devices through scalable networking and connectivity solutions in the home that enable efficient streaming of OTT and other advanced entertainment services. |
8
Table of Contents
Index to Financial Statements
| • | Delivering Your Media, Your Way — anticipating demand for more personalized, relevant, and mobile experiences with end-to-end multiscreen solutions to personalize and monetize tomorrow’s content experiences. |
| • | Powering Smarter Networks — realizing the potential of today’s entertainment technology, monetizing future services like UHD, IoT, Gigabit Wi-Fi and multiscreen, and transitioning to all-IP networks through powerful transcoding, bandwidth optimization, and video compression technologies. |
| • | Broadband Access — employing state-of-the-art computing and packet processing technologies to solve the last-mile bottleneck, providing ever higher residential speeds and bandwidth. |
| • | Cloud — the enablement of complex function to be performed in the “cloud” to simplify and streamline the in home network and the service providers’ network operations. |
We have significant engineering resources and employees in the U.S. dedicated to research and development through laboratories in Beaverton, Oregon; Horsham, Pennsylvania; Kirkland, Washington; Lisle, Illinois; Santa Clara, California; San Diego, California; San Jose, California; Suwanee, Georgia; Wallingford, Connecticut; and Lowell, Massachusetts, as well as internationally in Bangalore, India; Cork, Ireland; Linkoping, Sweden; Paris, France; Saltaire, United Kingdom; and Shenzhen, China. We recently announced plans to close our research and development facilities located in Cordoba, Argentina and Tel Aviv, Israel.
Research and development expenses in 2015, 2014 and 2013 were approximately $534.2 million, $556.6 million and $425.8 million, respectively. Research and development expenses as a percent of sales in 2015, 2014 and 2013 were approximately 11.1%, 10.5% and 11.8%, respectively. These costs include allocated common costs associated with information technology and facilities.
Intellectual Property
We have an active patenting program for protecting our innovations. During 2015, we continued to enhance our patent portfolio. We were awarded 213 patents and filed 567 patent applications. As of January 31, 2016, our intellectual property portfolio consisted of approximately 2,340 issued patents (both U.S. and foreign), including patents acquired in connection with the Pace acquisition and we continue to pursue patent protection on new inventions (currently approximately 1,282 U.S. and foreign patent applications pending). In our effort to pursue new patents, we have created a process whereby employees may submit ideas of inventions for review by management. The review process evaluates each submission based on criteria that includes: novelty, potential commercial value of the invention, and detectability of infringement. Patent applications are filed on the inventions that meet the criteria.
Although patents generally have a 20 year legal life, the relevant technologies to which the patents apply often have much shorter lives. As such, the economic useful life of the patents is often the same as that of the associated developed technology.
Our patents and patent applications generally are in the areas of telecommunications hardware, software and related technologies. For technology that is not owned by us, we have a program for obtaining appropriate licenses to ensure that we have the necessary license coverage for our products. In addition, we have formed strategic relationships with leading technology companies to provide us with early access to technology that we believe will help keep us at the forefront of our industry.
We also have a program for protecting and developing trademarks. As of January 31, 2016, ARRIS had 656 registered or pending trademark registrations, including trademarks acquired in connection with the Pace acquisition. Our trademark program includes procedures for the use of current trademarks and for the development of new trademarks. This program is designed to ensure that our employees properly use our registered trademarks and any new trademarks that are expected to develop strong brand loyalty and name recognition. The design of our trademark program is intended to protect our trademarks from dilution or cancellation.
From time to time there are significant disputes with respect to the ownership of the technology used in our industry and accusations of patent infringements. See Part I, Item 3, “Legal Proceedings.”
9
Table of Contents
Index to Financial Statements
Product Sourcing and Distribution
We maintain a balance of internal and external manufacturing providers to continue offering our customers a competitive combination of quality, cost and flexibility in meeting their needs. We operate manufacturing facilities in Taipei, Taiwan; Tijuana, Mexico; and Manaus, Brazil (effective with the acquisition of Pace in 2016). We also use contract manufacturers located in Brazil, China, Thailand, Malaysia, Mexico, South Africa and the United States.
We provide our contract manufacturers with rolling, non-binding forecasts, and we typically have a minimum of 60 days of purchase orders placed with them for products. Purchase orders for delivery within 60 days generally are not cancelable. Purchase orders with delivery past 60 days generally may be cancelled with penalties in accordance with each vendor’s terms. Each contract manufacturer provides a minimum 15-month warranty.
We manufacture a significant portion of our video set-tops and gateways in our manufacturing facility in Taipei, Taiwan. The factory is 209,600 square feet, and, as of December 31, 2015, the facility employed approximately 1,060 people. We manufacture a limited amount of video set-tops in Manaus Brazil to serve the local market. Current outsourcing arrangements include set-tops, modems, DTAs and IP set-tops.
We manufacture a portion of our Network & Cloud products in our manufacturing facility in Tijuana, Mexico. The factory is 83,124 square feet, and, as of December 31, 2015, the facility employed approximately 450 people. Current outsourcing arrangements include CMTS, amplifiers, certain power supplies, accessories, optical modules, digital return modules, circuit boards, repair services, and video infrastructure equipment.
We distribute a substantial number of products that are not produced by us in order to provide our customers with a comprehensive portfolio offering. Domestically, we distribute hardware and installation products through regional warehouses in California, North Carolina, and Washington. Internationally, we distribute through regional warehouses in Australia, Japan and Germany, and through drop shipments from our contract manufacturers located throughout the world.
We obtain key components from numerous third-party suppliers. Our supply agreements include technology licensing and component purchase contracts. Several of our competitors have similar supply agreements for these components. In addition, we license software for operating network and security systems or sub-systems, and a variety of routing protocols from different suppliers.
Backlog
Our backlog consists of unfilled customer orders (believed to be firm and long-term contracts) that have not been completed. With respect to long-term contracts, we include in our backlog only amounts representing orders currently released for production or, in specific instances, the amount we expect to be released in the succeeding 12 months. The amount contained in backlog for any contract or order may not be the total amount of the contract or order. The amount of our backlog at any given time does not reflect expected revenues for any fiscal period.
Our backlog at December 31, 2015, excluding Pace, was approximately $715.8 million, at December 31, 2014 was approximately $631.0 million, and at December 31, 2013 was approximately $538.6 million. We believe that all of the backlog existing at December 31, 2015 will be shipped in 2016.
Anticipated orders from customers may fail to materialize and delivery schedules may be deferred or cancelled for a number of reasons, including reductions in capital spending by network operators, shipping disruptions, customer financial difficulties, annual capital spending budget cycles, and construction delays.
Competition
The markets in which we participate are dynamic and highly competitive, requiring companies to react quickly to capitalize on opportunity. We retain skilled and experienced personnel, and deploy substantial resources to meet the changing demands of the industry and to capitalize on change. We compete with interna-
10
Table of Contents
Index to Financial Statements
tional, national and regional manufacturers, distributors and wholesalers including companies that are larger than we are. Our major competitors include:
| • | ADB Global; |
| • | Asus; |
| • | ATX; |
| • | Belkin; |
| • | BKTel; |
| • | Casa Systems, Inc.; |
| • | Cisco Systems, Inc.; |
| • | Commscope, Inc.; |
| • | Concurrent Computer Corporation; |
| • | Emcore Corporation; |
| • | Ericsson; |
| • | Finisar; |
| • | Gainspeed; |
| • | Guavus; |
| • | Harmonic, Inc.; |
| • | Hitron Technologies Americas Inc.; |
| • | Huawei; |
| • | Humax Co.; |
| • | InnoTrans; |
| • | Kathrein; |
| • | Lindsay Broadband; |
| • | Netgear; |
| • | Netgem; |
| • | Pacific Broadband Networks; |
| • | PCT International; |
| • | RGB Networks; |
| • | Rovi; |
| • | Sagemcom; |
| • | Samsung; |
| • | SeaChange International, Inc.; |
| • | SMC Networks; |
| • | Technetix; |
| • | Technicolor S.A.; |
11
Table of Contents
Index to Financial Statements
| • | Teleste; |
| • | TiVo Inc.; |
| • | Thomson Video Networks; |
| • | TOA Technologies (Oracle); |
| • | TVC Communications, Inc.; |
| • | Ubee Interactive, Inc.; |
| • | Vecima Networks, Inc.; and |
| • | ZTE |
We distinguish our products on the basis of reliability and performance, differentiated features, flexibility, breadth, customer service, and availability of business solutions, while pricing our solutions competitively with those of other manufacturers.
Consumer demand for more bandwidth is a fundamental driver behind the continued growth in CMTS and CCAP Edge Routing capacity deployed by service providers worldwide. The CMTS/CCAP supplier space is highly competitive with strong historical players such as Cisco and announcements of new products from manufacturers such as Casa, Gainspeed and Harmonic.
ARRIS is a worldwide leader in CMTS and CCAP. Our portfolio of IP network solutions continues to provide the scale and efficiency to power service providers’ transition to next-generation networks and services. Showcase solutions like our E6000® Converged Edge Router are behind this global momentum and are responsible for providing service to millions of subscribers through the world’s leading service providers.
These network solutions are complemented by ARRIS’s comprehensive leadership in CPE — including video set-tops/gateways, DOCSIS, DSL, and FTTH solutions. Combined with our global scale, our extensive portfolio and R&D capabilities accelerate time-to-market for next-generation services — enabling our partners to anticipate and meet rapid changes in consumer demand. This positions ARRIS to capitalize on several key industry opportunities: 1.) the set-top’s evolution into the gateway for all communications, media, and other connected services; 2.) the shift to gigabit Wi-Fi and its growing role as a principal conduit for the connected home; 3.) the refresh cycle of today’s broadly deployed base of set-tops and broadband gateways; and 4.) the evolution and hybridization of network standards and models, from xDSL to G.Fast, D3.1 to xPON, new IP video services, and more.
Our multi-screen content management and protection products compete with many vendors offering on-demand video and digital advertising insertion hardware and software, including Adobe, Cisco, Concurrent, Ericsson, Irdeto, SeaChange, TiVo, Verimatrix, and others. Our operations management systems compete with vendors offering network management, mobile workforce management, network configuration management, and network capacity management systems such as TOA Technologies, Click Software, Guavus and others, some of which may currently have greater sales in these areas than ARRIS. In some instances, our customers internally develop their own software for these functions. However, we believe that we offer a more integrated solution that gives us a competitive advantage in supporting the requirements of both today’s distribution networks and the emerging all-digital, packet-based networks.
We also compete with companies such as Cisco, Harmonic, Huawei, Teleste, Technetix and ZTE for network distribution and access equipment. In recent periods, competition in this market has also increased from aftermarket suppliers, whose primary focus is on the refurbishment of OEM equipment, resulting in additional competition for new sales opportunities. In addition, because of the convergence of the cable and telecommunications and rapid technological development, new competitors may enter this space.
Lastly, some of our competitors are larger companies with greater financial resources and product breadth than us. This may enable them to bundle products or be able to market and price products more aggressively than we can.
12
Table of Contents
Index to Financial Statements
Regulation and Corporate Responsibility
Our products and operations are subject to numerous U.S. and international regulations and requirements in the areas of labor, environmental compliance including energy efficiency standards, health and safety and ethics. Historically compliance with such regulations has not had a material impact on our business or results of operations.
We are committed to strong corporate responsibility, and in 2015 we continued our participation as an active member of the Electronic Industry Citizenship Coalition (“EICC”), a non-profit coalition of electronics companies dedicated to supporting the rights and wellbeing of workers and communities affected by the global electronics supply chain. We continue to work with our suppliers by utilizing the EICC process collaboratively to improve working and environmental conditions through industry leading standards and practices to drive continual improvement and mitigate risk. Additional information regarding these policies and programs is available under the “Investors” tab of our corporate web site (www.arris.com).
As signatories to the Voluntary Agreement for Ongoing Improvement to the Energy Efficiency of Set-Top Boxes and Small Network Equipment in the U.S. and the Voluntary Industry Agreement to Improve the Energy Consumption of Complex Set-Top Boxes and Small Network Equipment in the European Union, we continued to be committed to reducing our environmental impact through increasing the energy efficiency of our products while still protecting our need to adapt to rapidly changing technology and the introduction of new features.
Employees
As of January 31, 2016, we had approximately 8,520 employees, which include employees from the Pace acquisition. ARRIS has no employees represented by unions within the United States. We believe that we have a strong relationship with our employees. Our future success depends, in part, on our ability to attract and retain key personnel. Competition for qualified personnel in the cable industry is intense, and the loss of certain key personnel could have a material adverse effect on us. We have entered into employment contracts with our key executive officers and have confidentiality agreements with substantially all of our employees. We also have long-term incentive programs that are intended to provide substantial incentives for our key employees to remain with us.
Our business is dependent on customers’ capital spending on broadband communication systems, and reductions by customers in capital spending would adversely affect our business.
Our performance is primarily dependent on customers’ capital spending for constructing, rebuilding, maintaining or upgrading broadband communications systems. Capital spending in the broadband communications industry is cyclical and can be curtailed or deferred on short notice. A variety of factors affect capital spending, and, therefore, our sales and profits, including:
| • | demands for network services; |
| • | general economic conditions; |
| • | foreign currency fluctuations; |
| • | competition from other providers of broadband and high-speed services; |
| • | customer specific financial or stock market conditions; |
| • | availability and cost of capital; |
| • | governmental regulation; |
| • | customer acceptance of new services offered; and |
| • | real or perceived trends or uncertainties in these factors. |
13
Table of Contents
Index to Financial Statements
Several of our customers have accumulated significant levels of debt. These high debt levels, coupled with the volatility in the capital markets, may impact their access to capital in the future. Even if the financial health of our customers’ remains intact, these customers may not purchase new equipment at levels we have seen in the past or expect in the future. We cannot predict the impact, if any, of any softening or downturn in the national or global economy or of specific customer financial challenges on our customer’s expansion and maintenance expenditures.
We may not realize all of the anticipated benefits of the recently completed Pace acquisition or those benefits may take longer to realize than expected. We may also encounter significant unexpected difficulties in integrating the two businesses.
Our ability to realize all of the anticipated benefits of the recently completed Pace acquisition will depend on our ability to integrate the Pace businesses with our historic operations. The combination of two independent businesses is a complex, costly and time-consuming process. As a result, we will be required to devote significant management attention and resources to integrating the business practices and operations of ARRIS and Pace. The integration process may disrupt the businesses and, if implemented ineffectively, could preclude realization of the full benefits expected. Our failure to meet the challenges involved in integrating the two businesses to realize the anticipated benefits of the transaction could cause an interruption of, or a loss of momentum in, the activities of the business and could adversely affect our results of operations.
In addition, the overall integration of the Pace business may result in material unanticipated problems, expenses, liabilities, competitive responses, and loss of customer relationships. The difficulties of combining the operations of the companies include, among others:
| • | the diversion of management’s attention to integration matters; |
| • | difficulties in achieving anticipated cost savings, synergies, business opportunities and growth prospects expected from the transaction; |
| • | difficulties in the integration of operations and systems; and |
| • | difficulties in managing the expanded operations of a larger and more complex company. |
Many of these factors are outside of our control and any of them could result in increased costs, and decreases in the amount of expected revenues, which could materially impact our business, financial condition and results of operations. In addition, even if the operations of the Pace are integrated successfully, we may not realize the full benefits of the combination, including the potential synergies, cost savings or sales or growth opportunities. These benefits may not be achieved within the anticipated time frame, or at all, or additional unanticipated costs may be incurred in the integration. All of these factors could cause dilution to our earnings per share, decrease or delay the expected accretive effects of the transaction, or negatively impact the trading price of our ordinary shares. As a result, we cannot provide assurance that the combination of the ARRIS and Pace businesses will result in the realization of the full benefits anticipated from the transaction.
Our effective tax rates, which generally are expected to decrease as a result of the transaction, are also subject to a variety of other factors, many of which are beyond our ability to control, such as changes in the rate of economic growth in jurisdictions in which the combined business operates, the financial performance of the combined business in various jurisdictions, currency exchange rate fluctuations, and significant changes in trade, monetary or fiscal policies, including changes in interest rates, and changes in U.S. tax laws, UK tax laws and the tax laws of the other jurisdictions in which we do business. The impact of these factors, individually and in the aggregate, is difficult to predict, in part because the occurrence of the events or circumstances described in such factors may be interrelated, and the impact to the combined company of the occurrence of any one of these events or circumstances could be compounded or, alternatively, reduced, offset, or more than offset, by the occurrence of one or more of the other events or circumstances described in such factors.
14
Table of Contents
Index to Financial Statements
The market in which we operate is intensely competitive, and competitive pressures may adversely affect our results of operations.
The markets in which we participate are dynamic, highly competitive and require companies to react quickly and capitalize on change. We must retain skilled and experienced personnel, as well as deploy substantial resources to meet the changing demands of the industry and must be nimble to be able to capitalize on change. We compete with international, national and regional manufacturers, distributors and wholesalers including some companies that are larger than we are. We list our major competitors in Part I, Item 1, “Business”.
In some instances, our customers themselves may be our competition. Some of our customers may develop their own software requiring support within our products and/or may design and develop products of their own which are produced to their own specifications directly by a contract manufacturer. The rapid technological changes occurring in broadcast and broadband communications industry may lead to the entry of new competitors, including those with substantially greater resources than our own. Because the market in which we compete is characterized by rapid growth and, in some cases, low barriers to entry, smaller companies and start-up ventures also may become principal competitors in the future. Actions by existing competitors and the entry of new competitors may have an adverse effect on our sales and profitability. In the future, technological advances could lead to the obsolescence of some of our current products, which could have a material adverse effect on our business.
Further, several of our larger competitors may be in a better position to withstand any significant, sustained reduction in capital spending by customers. They often have broader product lines and segment focus and therefore are not as susceptible to downturns in a particular market. In addition, several of our competitors have been in operation longer than we have, and therefore have more established relationships with customers.
Consolidations in the broadcast and broadband communication systems industry could have a material adverse effect on our business.
The broadcast and broadband communication systems industry has historically experienced, and continues to experience, the consolidation of many industry participants. For example, Charter Communications, Inc. has announced its intention to acquire Time Warner Cable, AT&T recently completed its acquisition of DIRECTV, Verizon Communications Inc. announced that it is selling certain wireline businesses to Frontier Communications Corp., which transaction is expected to close in March 2016, and Altice recently completed its acquisition of Suddenlink and has announced its intention to acquire Cablevision. When consolidations occur, it is possible that the acquirer will not continue using the same suppliers, possibly resulting in an immediate or future elimination of sales opportunities for us. Even if sales are not reduced, consolidations also could result in delays in purchasing decisions by the affected companies prior to completion of the transaction. Further, even if we believe we will receive additional sales from a customer following a transaction as a result of typical network upgrades that following combinations or otherwise, no assurance can be provided that such anticipated sales will be realized. In addition, consolidations can also result in increased pressure from customers for lower prices or better terms, reflecting the increase in the total volume of products purchased or the elimination of a price differential between the acquiring customer and the company acquired. Any of these results could have a material adverse effect on our business.
Proposed FCC regulations for the broadband communications industry could significantly impact our operations.
The Federal Communications Commission (the “FCC”) has adopted new “net neutrality” regulations that, among other things, subject Internet service providers to common carriage regulation under Title II of the Communications Act. These regulations have been challenged in federal court. In addition, the FCC recently proposed new rules designed to impose new technology mandates on multichannel video programming distributors (“MVPDs”) that would include many of our customers aimed at enabling retail video devices to access MVPD services without the need for an operator-supplied set-top box. If implemented, such mandates could result in our customers reducing their investment in their networks and in the development and deployment of
15
Table of Contents
Index to Financial Statements
new set-top boxes. A significant reduction in their capital expenditures as a result of any such regulations could adversely affect our business, operating results, and financial condition.
We have significant indebtedness, which could limit our operations and opportunities, make it more difficult for us to pay or refinance our debts and/or may cause us to issue additional equity in the future, which would increase the dilution of our stockholders or reduce earnings.
As of December 31, 2015, we had approximately $1,540.0 million in total indebtedness, and we incurred approximately $800.0 million in additional indebtedness to fund the Pace acquisition in January 2016. As of December 31, 2015, we had a $497.9 million available under our revolving line of credit to support our working capital needs. Our debt service obligations with respect to this indebtedness could have an adverse impact on our earnings and cash flows for as long as the indebtedness is outstanding.
This significant indebtedness could also have important consequences to stockholders. For example, it could:
| • | make it more difficult for us to pay or refinance our debts as they become due during adverse economic and industry conditions because any decrease in revenues could cause us to not have sufficient cash flows from operations to make our scheduled debt payments; |
| • | limit our flexibility to pursue other strategic opportunities or react to changes in our business and the industry in which we operate and, consequently, place us at a competitive disadvantage to competitors with less debt; |
| • | require a substantial portion of our cash flows from operations to be used for debt service payments, thereby reducing the availability of our cash flow to fund working capital, capital expenditures, acquisitions and other general corporate purposes; and |
| • | result in higher interest expense in the event of increases in interest rates since the majority of our debt is subject to variable rates. |
Based upon current levels of operations, we expect to be able to generate sufficient cash on a consolidated basis to make all of the principal and interest payments when such payments are due under our senior secured credit facilities; but there can be no assurance that we will be able to repay or refinance such borrowings and obligations.
We may consider it appropriate to reduce the amount of indebtedness currently outstanding. This may be accomplished in several ways, including issuing additional ordinary shares or securities convertible into ordinary shares, reducing discretionary uses of cash or a combination of these and other measures. Issuances of additional ordinary shares or securities convertible into ordinary shares would have the effect of diluting the ownership percentage that stockholders will hold in the company and may reduce our reported earnings per share.
We face risks relating to currency fluctuations and currency exchange.
On an ongoing basis we are exposed to various changes in foreign currency rates because certain sales are denominated in foreign currencies. Additionally, certain intercompany transactions are denominated in foreign currencies and subject to revaluation. These changes can impact our results of operations, cash flows and financial position. We manage these risks through regular operating and financing activities and periodically use derivative financial instruments such as foreign exchange forward and option contracts. There can be no assurance that our risk management strategies will be effective. In addition, many of our international customers make purchases from us that are denominated in U.S dollars. As we have seen the U.S. dollar strengthen, it has impacted these customers’ ability to purchase products. For example, based on the foreign exchange rates as of December 31, 2015 and 2014, the value of the Brazilian real, the Argentine peso and the Mexican peso decreased approximately 49%, 53% and 18% against the U.S. dollar, respectively, which significantly impacted purchases by our customers in these countries in 2015. Further strengthening could have a material impact on our sales in the affected countries.
16
Table of Contents
Index to Financial Statements
We also may encounter difficulties in converting our earnings from international operations to U.S. dollars for use in the United States. These obstacles may include problems moving funds out of the countries in which the funds were earned and difficulties in collecting accounts receivable in foreign countries where the usual accounts receivable payment cycle is longer.
We may have difficulty in forecasting our sales and may experience volatility in revenues.
Because a significant portion of our customer’s purchases are discretionary, accurately forecasting our sales is difficult. In addition, our customers in recent years have submitted their purchase orders less evenly over the course of each quarter and year, and with shorter lead times than they have historically. The combination of our dependence on relatively few key customers and the award by those customers of irregular but sizeable contracts, together with the size of our operations, make it difficult to forecast sales and can result in revenue volatility, which could further result in maintaining inventory levels that are too high or too low for our ultimate needs and could have a negative impact on our business.
The broadcast and broadband communications system industry on which our business is focused is significantly impacted by technological change.
The broadcast and broadband communication systems industry has gone through dramatic technological change resulting in service providers rapidly migrating their business from a one-way television service to a two-way communications network enabling multiple services, such as residential and business high-speed Internet access, residential and business telephony services, digital television, video on demand and advertising services. New services, such as home security, power monitoring and control, 3-D and 4K (UHD) television that are or may be offered by service providers, are also based on, and will be characterized by, rapidly evolving technology. The development of increasing transmission speed, density and bandwidth for Internet traffic has also enabled the provision of high quality, feature length video over the Internet. This over-the-top IP video service enables content providers such as Netflix and Hulu, programmers such as HBO and ESPN and portals like Google to provide video services on-demand, by-passing traditional video service providers. The Chairman of the FCC has also announced his intention to have the FCC adopt new regulations to facilitate the ability of over-the-top services to compete against traditional multichannel video programming providers. As these service providers enhance their quality and scalability, traditional providers are introducing similar services over their existing networks, as well as over-the-top IP video for delivery not only to televisions but to computers, tablets, and telephones in order to remain competitive. Our business is dependent on our ability to develop products that enable current and new customers to exploit these rapid technological changes. We believe the continued growth of over-the-top IP video represents a shift from the traditional video delivery paradigm. To the extent that we are unable to adapt our technologies to serve this emerging demand, including obtaining necessary certifications from content providers and programmers to include their over-the-top video applications as part of our product offerings, our business may be adversely affected.
The continued industry move to open standards may impact our future results.
The broadcast and broadband communication systems industry has and will continue to demand products based on open standards. The move toward open standards, including the FCC’s proposed rules, is expected to increase both the number of service providers that will offer services to the market. This trend is also expected to increase the number of competitors who are able to supply products to service providers and drive down the capital costs per subscriber deployed. These factors may adversely impact both our future revenues and margins. In addition, many of our customers participate in “technology pools” and increasingly request that we donate a portion of our source code used by the customer to these pools which may impact our ability to recapture the R&D investment made in developing such code.
We believe that we will be increasingly required to work with third party technology providers. As a result, we expect the shift to more open standards may require us to license software and other components indirectly to third parties via various open source licenses. In some circumstances, ARRIS’s use of such open source technology may include technology or protocols developed by standards settings bodies, other industry forums or third
17
Table of Contents
Index to Financial Statements
party companies. The terms of the open source licenses granted by such parties may limit our ability to commercialize products that utilize such technology, which could have a material adverse effect on our results.
We no longer have use of the “Motorola” brand name.
In connection with our acquisition of Motorola Home, we were granted the right, subject to certain conditions, to continue to use the Motorola brand name on certain products. Our right to use the Motorola brand name ended at the end of 2015 and use of the brand name for products similar to products that we sell in the retail channel has been licensed to a competitor of ours. Shelf space in retail outlets can be impacted by how recognizable a brand is by customers. If our rebranding of those products is not successful, or if use of the Motorola brand by a competitor causes confusion amongst customers, our retail sales may decrease. Further, the loss of the use of the “Motorola” brand may result in a lower amount of shelf space, or space in less desirable areas, which may impact our sales.
Our business is concentrated in a few key customers. The loss of any of these customers or a significant reduction in sales to any of these customers would have a material adverse effect on our business.
For the year ended December 31, 2015, sales to our two largest customers (including their affiliates, as applicable) accounted for approximately 35.3% of our total revenue. While we will have less customer concentration as a result of the Pace acquisition, sales to some customers are expected to significantly increase. The loss of any of our large customers, or a significant reduction in the products or services provided to any of them would have a material adverse impact on our business. For many of these customers, we also are one of their largest suppliers. As a result, if from time-to-time customers elect to purchase products from our competitors in order to diversify their supplier base and to dual-source key products or to curtail purchasing due to budgetary or market conditions, such decisions could have material consequences to our business. In addition, because of the magnitude of our sales to these customers the terms and timing of our sales are heavily negotiated, and even minor changes can have a significant impact upon our business.
We may face higher costs associated with protecting our intellectual property or obtaining necessary access to the intellectual property of others.
Our future success depends in part upon our proprietary technology, product development, technological expertise and distribution channels, in addition to a number of important patents and licenses. We cannot predict whether we can protect our technology or whether competitors will be able to develop similar technology independently and such technology could be subject to challenge, unlawful copying or other unfair competitive practices. Given the dependence on technology within the market in which we complete, there are frequent claims and related litigation regarding patent and other intellectual property rights. We have received, directly or indirectly, and expect to continue to receive, from third parties, including some of our competitors, notices claiming that we, or our customers using our products, have infringed upon third-party patents or other proprietary rights. We are involved in several proceedings (and other proceedings have been threatened) in which our customers were sued for patent infringement. (See Part II, Item 1, “Legal Proceedings”) In these cases our customers have made claims against us and other suppliers for indemnification. We may become involved in similar litigation involving these and other customers in the future, including as a result of the Pace acquisition. These claims, regardless of their merit, could result in costly litigation, divert the time, attention and resources of our management, delay our product shipments, and, in some cases, require us to enter into royalty or licensing agreements. If a claim of patent infringement against us or our customer is successful and we fail to obtain a license or develop non-infringing technology, we or our customer may be prohibited from marketing or selling products containing the infringing technology which could materially affect our business and operating results. In addition, the payment of any damages or any necessary licensing fees or indemnification costs associated with a patent infringement claim could be material and could also materially adversely affect our operating results.
18
Table of Contents
Index to Financial Statements
We have substantial goodwill and amortizable intangible assets.
Our financial statements reflect substantial goodwill and intangible assets, approximately $1,014.0 million and $810.4 million, respectively, as of December 31, 2015, that was recognized in connection with prior acquisitions and we expect to record significant additional goodwill and intangible assets as a result of the Pace acquisition.
We annually (and more frequently if changes in circumstances indicate that the asset may be impaired) review the carrying amount of our goodwill in order to determine whether it has been impaired for accounting purposes. In general, if the fair value of the corresponding reporting unit is less that the carrying amount of the reporting unit, we record an impairment. The determination of fair value is dependent upon a number of factors, including assumptions about future cash flows and growth rates that are based on our current and long-term business plans. With respect to the amortizable intangible assets, we test recoverability when events or changes in circumstances indicate that their carrying amounts may not be recoverable. Examples of such circumstances include, but are not limited to, operating or cash flow losses from the use of such assets or changes in our intended uses of such assets. If we determine that an asset or asset group is not recoverable, then we would record an impairment charge if the carrying amount of the asset or asset group exceeds its fair value. Fair value is based on estimated discounted future cash flows expected to be generated by the asset or asset group. The assumptions underlying cash flow projections would represent management’s best estimates at the time of the impairment review.
While no goodwill or intangible asset impairments were recorded in 2015 or 2014, as the ongoing expected cash flows and carrying amounts of our remaining goodwill and intangible assets are assessed, changes in the economic conditions, changes to our business strategy, changes in operating performance or other indicators of impairment could cause us to realize impairment charges in the future, including as a result of restructuring undertaken in connection with the integration of the former Pace operations during 2016. For additional information, see the discussion under “Critical Accounting Policies” in Item 7, Management’s Discussion and Analysis of Financial Condition and Results of Operations.
Pace was not subject to the internal controls and other compliance obligations of the U.S. securities laws, and we may not be able to timely and effectively implement controls and procedures over Pace operations as required under the U.S. securities laws.
Pace was not subject to the information and reporting requirements of the Exchange Act, and other U.S. federal securities laws, including the compliance obligations relating to, among other things, the maintenance of a system of internal controls as contemplated by the Exchange Act. We will need to timely and effectively implement the internal controls necessary to satisfy those requirements, which require an annual management assessment of the effectiveness of internal control over financial reporting. We intend to take appropriate measures to establish or implement an internal control environment at Pace aimed at successfully fulfilling these requirements. However, it is possible that we may experience delays in implementing or be unable to implement the required internal financial reporting controls and procedures, which could result in enforcement actions, the assessment of penalties and civil suits, failure to meet reporting obligations and other material and adverse events that could have a negative effect on the market price for our ordinary shares.
The Pace acquisition may not be accretive to our earnings and may cause dilution to our earnings per share, which may negatively affect the market price of our stock.
We currently anticipate that the Pace acquisition will be accretive to our non-GAAP earnings per share in 2016 and thereafter. This expectation is based on preliminary estimates that may materially change. We may encounter additional integration-related costs, may fail to realize all of the benefits anticipated in the acquisition or be subject to other factors that adversely affect preliminary estimates. Any of these factors could cause delay or significantly reduce the expected accretive effect of the acquisition and contribute to a decrease in the trading price of our stock.
19
Table of Contents
Index to Financial Statements
The IRS may not agree that we are a foreign corporation for U.S. federal income tax purposes.
Although, following the Pace transaction, we are incorporated under the laws of England and Wales and are a tax resident in the United Kingdom for UK tax purposes, the IRS may assert that we should be treated as a U.S. corporation (and, therefore, a U.S. tax resident) for U.S. federal income tax purposes. For U.S. federal income tax purposes, a corporation generally is considered to be a tax resident in the jurisdiction of its organization or incorporation. Because we are incorporated under the laws of England and Wales, we generally would be classified as a non-U.S. corporation (and, therefore, a non-U.S. tax resident) under these rules. Section 7874 of the Internal Revenue Code of 1986, as amended (the “Code”) however, provides an exception to this general rule under which a foreign incorporated entity may, in certain circumstances, be treated as a U.S. corporation for U.S. federal income tax purposes.
Generally, for us to be treated as a non-U.S. corporation for U.S. federal income tax purposes under Section 7874, the former stockholders of ARRIS must own (within the meaning of Section 7874) less than 80% (by both vote and value) of all of the outstanding shares of ARRIS International (the “Ownership Test”). Based on the terms of the Pace transaction, we believe historic ARRIS stockholders do own less than 80% of all of the outstanding shares in ARRIS International and, thus, the Ownership Test has been satisfied. However, ownership for purposes of Section 7874 is subject to various adjustments under the Code and the Treasury Regulations promulgated thereunder, and there is limited guidance regarding the Section 7874 provisions, including regarding the application of the Ownership Test. Thus, there can be no assurance that the IRS will agree with the position that the Ownership Test was satisfied following the Pace transaction and/or would not successfully challenge the status of ARRIS International as a non-U.S. corporation for U.S. federal income tax purposes.
If we were to be treated as a U.S. corporation for U.S. federal income tax purposes, we could be subject to substantial additional U.S. taxes. For UK tax purposes, we are expected, regardless of any application of Section 7874, to be treated as a UK tax resident. Consequently, if we are treated as a U.S. corporation for U.S. federal income tax purposes under Section 7874, we could be liable for both U.S. and UK taxes, which could have a material adverse effect on our financial condition and results of operations.
Our status as a foreign corporation for U.S. tax purposes could be affected by a change in law.
Under current law, we expect to be treated as a non-U.S. corporation for U.S. federal income tax purposes. However, changes to Section 7874 or the Treasury Regulations promulgated thereunder, or other changes in law, could adversely affect our status as a non-U.S. corporation for U.S. federal income tax purposes, our effective tax rate and/or future tax planning, and any such changes could have prospective or retroactive application to us and our stockholders.
Recent legislative proposals have aimed to expand the scope of Section 7874, or otherwise address certain perceived issues arising in connection with so-called inversion transactions. For example, proposals introduced by certain members of both houses of the U.S. Congress that, if enacted in their present form, would be effective retroactively to any transactions completed after May 8, 2014 would, among other things, treat a foreign acquiring corporation as a U.S. corporation under Section 7874 if the former stockholders of the U.S. corporation own more than 50% (by vote or value) of the shares of the foreign acquiring corporation after the transaction. These proposals, if enacted in their present form and if made retroactively effective, would cause us to be treated as a U.S. corporation for U.S. federal income tax purposes. It is presently uncertain whether any such legislative proposals or any other legislation relating to Section 7874 or so-called inversion transactions will be enacted into law and, if so, what impact such legislation would have on us.
In addition, the U.S. Treasury has indicated that it is considering regulatory action in connection with so-called inversion transactions. The specific timing and substance of any such action is presently uncertain. The regulations described in notices issued by the U.S. Treasury would, among other things, make it more difficult for the Ownership Test to be satisfied and would limit or eliminate certain tax benefits to so-called inverted corporations, including with respect to access to certain foreign earnings and/or the ability to restructure the non-U.S. members of the group. Although the promulgation of the Treasury Regulations described in the recently issued Treasury notices is not expected to materially affect our tax status, the precise scope and application of
20
Table of Contents
Index to Financial Statements
these regulatory proposals will not be clear until proposed Treasury Regulations are actually issued. Accordingly, until such regulations are promulgated and fully understood, we cannot be certain that such regulations would not have an adverse impact on us. Moreover, the notice also indicate that the U.S. Treasury and the IRS are considering issuing additional guidance, which in the case of “inverted groups” would be retroactive, to address certain transactions that have the effect of “shifting” U.S.-source earnings to lower-tax jurisdictions, including by limiting U.S. tax deductions for interest on certain intercompany debt obligations. Any such future guidance could have a material adverse impact on our financial position and results of operations.
Section 7874 of the Code may limit our ability to utilize certain U.S. tax attributes.
Following the acquisition of a U.S. corporation by a non-U.S. corporation, Section 7874 of the Code can limit the ability of the acquired U.S. corporation and its U.S. affiliates to utilize certain U.S. tax attributes (including net operating losses and certain tax credits) to offset, during the ten-year period following the acquisition, their U.S. taxable income, or related income tax liability, resulting from certain (a) transfers to related foreign persons of stock or other properties of the acquired U.S. corporation and its U.S. affiliates and (b) income received or accrued from related foreign persons during such period by reason of a license of any property by the acquired U.S. corporation and its U.S. affiliates (collectively, “inversion gain”). Based on the limited guidance available and as a result of the Pace transaction, we believe that this limitation under Section 7874 will apply and, as a result, we do not currently expect that the Company or its U.S. affiliates will be able to utilize certain U.S. tax attributes to reduce the amount of any inversion gain and/or to offset applicable U.S. federal income tax liability attributable to any inversion, but may continue to be used to reduce our taxable income from ordinary operations.
Products currently under development may fail to realize anticipated benefits.
Rapidly changing technologies, evolving industry standards, frequent new product introductions and relatively short product life cycles characterize the markets for our products. The technology applications that we currently are developing are subject to technological, supply chain, product development and other related risks that could delay successful delivery. The market in which we operate is subject to a rapid rate of technological change, reflected in increased development and manufacturing complexity and increasingly demanding customer requirements, all of which can result in unforeseen delivery problems. Even if the products in development are successfully brought to market, they may be late, may not be widely used or we may not be able to capitalize successfully on the developed technology. To compete successfully, we must quickly design, develop, manufacture and sell new or enhanced products that provide increasingly higher levels of performance and reliability. However, we may not be able to develop or introduce these products successfully if such products:
| • | are not cost-effective; |
| • | are not brought to market in a timely manner; |
| • | fail to achieve market acceptance; or |
| • | fail to meet industry certification standards. |
Furthermore, our competitors may develop similar or alternative technologies that, if successful, could have a material adverse effect on us. Our strategic alliances are generally based on business relationships that have not been the subject of written agreements expressly providing for the alliance to continue for a significant period of time and the loss of any such strategic relationship could have a material adverse effect on our business and results of operations.
Defects within our products could have a material impact on our results.
Many of our products are complex technology that include both hardware and software components. It is not unusual for software, especially in earlier versions, to contain bugs that can unexpectedly interfere with expected operations. While we employ rigorous testing prior to the shipment of our products, defects, including those resulting from components we purchase, may still occur from time to time. Product defects, including hardware
21
Table of Contents
Index to Financial Statements
failures, could impact our reputation with our customers which may result in fewer sales. In addition, depending on the number of products affected, the cost of fixing or replacing such products could have a material impact on our operating results. In some cases, we are dependent on a sole supplier for components used in our products. Defects in sole-sourced components subject us to additional risk of being able to quickly address any product issues or failures experienced by our customers as a result of the component defect and could delay our ability to deliver new products until the defective components are corrected or a new supplier is identified and qualified. This could increase our costs in resolving the product issue, result in decreased sales of the impacted product, or damage our reputation with customers, any of which could have the effect of negatively impacting our operating results.
Hardware or software defects could also permit unauthorized users to gain access to our customers’ networks and/or a consumer’s home network. In addition to potentially damaging our reputation with customers, such defects may also subject us to claims for damages under agreements with our customers and subject us to fines by regulatory authorities.
We offer warranties of various lengths to our customers on many of our products and have established warranty reserves based on, among other things, our historic experience, failure rates and cost to repair. In the event of a significant non-recurring product failure, the amount of the warranty reserve may not be sufficient. From time to time we may also make repairs on defects that occur outside of the provided warranty period. Such costs would not be covered by the established reserves and, depending on the volume of any such repairs, may have a material adverse effect on our results from operations or financial condition.
Our success depends on our ability to attract and retain qualified personnel in all facets of our operations.
Competition for qualified personnel is intense, and we may not be successful in attracting and retaining key personnel, which could impact our ability to maintain and grow our operations. Our future success will depend, to a significant extent, on the ability of our management to operate effectively. In the past, competitors and others have attempted to recruit our employees and their attempts may continue. The loss of services of any key personnel, the inability to attract and retain qualified personnel in the future or delays in hiring required personnel, particularly engineers and other technical professionals, could negatively affect our business.
We are dependent on a limited number of suppliers and inability to obtain adequate and timely delivery of supplies could have a material adverse effect on our business.
Many components, subassemblies and modules necessary for the manufacture or integration of our products are obtained from a sole supplier or a limited group of suppliers. Likewise, we have only a limited number of potential suppliers for certain materials and hardware used in our products and a number of our agreements with suppliers are short-term in nature. Our reliance on sole or limited suppliers, particularly foreign suppliers, and our reliance on subcontractors involves several risks including a potential inability to obtain an adequate supply of required components, subassemblies, modules and other materials and reduced control over pricing, quality and timely delivery of components, subassemblies, modules and other products. An inability to obtain adequate deliveries or any other circumstance that would require us to seek alternative sources of supply could affect our ability to ship products on a timely basis which could damage relationships with current and prospective customers and potentially have a material adverse effect on our business. Our ability to ship products could also be impacted by country laws and/or union labor disruptions. For example the labor dispute involving union dock workers at certain U.S. west coast port facilities, in many cases, greatly increased the shipping time for our products arriving through the affected ports and also increase our shipping costs as we had to increase the number of products shipped using air freight which is significantly more expensive. Disputes of this nature may have a material impact on our financial results.
22
Table of Contents
Index to Financial Statements
We are subject to the economic, political and social instability risks associated with doing business in certain foreign countries.
For the year ended December 31, 2015, approximately 28.7% of our sales were made outside of the United States. In addition, a significant portion of our products are manufactured or assembled in China, Mexico and Taiwan. As a result, we are exposed to risk of international operations, including:
| • | fluctuations in currency exchange rates; |
| • | inflexible employee contracts or labor laws in the event of business downturns; |
| • | compliance with United States and foreign laws concerning trade and employment practices; |
| • | the challenges inherent in consistently maintaining compliance with the Foreign Corrupt Practice Act; |
| • | the imposition of government controls; |
| • | difficulties in obtaining or complying with export license requirements; |
| • | labor unrest, including strikes, and difficulties in staffing; |
| • | security concerns; |
| • | economic boycott for doing business in certain countries; |
| • | coordinating communications among and managing international operations; |
| • | currency controls; |
| • | changes in tax and trade laws that increase our local costs; |
| • | exposure to heightened corruption risks; and |
| • | reduced protection for intellectual property rights. |
Political instability and military and terrorist activities may have significant impacts on our customers’ spending in these regions and can further enhance many of the risks identified above. Any of these risks could impact our sales, interfere with the operation of our facilities and result in reduced production, increased costs, or both, which could have an adverse effect on our financial results.
We depend on channel partners to sell our products in certain regions and are subject to risks associated with these arrangements.
We utilize distributors, value-added resellers, system integrators, and manufacturers’ representatives to sell our products to certain customers and in certain geographic regions to improve our access to these customers and regions and to lower our overall cost of sales and post-sales support. Our sales through channel partners are subject to a number of risks, including:
| • | ability of our selected channel partners to effectively sell our products to end customers; |
| • | our ability to continue channel partner arrangements into the future since most are for a limited term and subject to mutual agreement to extend; |
| • | a reduction in gross margins realized on sale of our products; and |
| • | a diminution of contact with end customers which, over time, could adversely impact our ability to develop new products that meet customers’ evolving requirements. |
The import of our products is subject to trade regulations.
The import of our products into the United States and certain other countries is subject to the trade regulations in the countries where they are imported. Products may be subject to customs’ duties that we pay to the applicable government agency and then collect from our customers in connection with the sale of the imported
23
Table of Contents
Index to Financial Statements
products. The amount of the customs duty owed, if any, is based on classification of the products within the applicable customs regulations. While we believe that our products have been properly classified, the U.S. Customs Agency or other applicable foreign regulatory agencies, may challenge our classifications and the amount of any duty payable. For example, we currently have a case pending in the U.S. Court of International Trade regarding the challenge by the U.S. Customs Agency with respect to certain digital television adapters that we import into the United States and believe are duty free. If it is ultimately determined that a product has been misclassified for customs purposes, we may be required to pay additional duties for products previously imported and we may not be successful in collecting the increased duty from the customer that purchased the products. In addition, we could be required to pay interest and/or fines to the applicable regulator, which amounts could be significant and negatively impact our results of operations. Further, if we do not comply with the applicable trade regulations, delivery of products to customers may be delayed which could negatively impact our sales and results of operations.
Our stock price has been and may continue to be volatile.
Our ordinary shares currently are traded on The NASDAQ Global Select Market. The trading price of our shares has been and may continue to be subject to large fluctuations. Our stock price may increase or decrease in response to a number of events and factors including:
| • | future announcements concerning us, key customers or competitors; |
| • | quarterly variations in operating results; |
| • | changes in financial estimates and recommendations by securities analysts; |
| • | developments with respect to technology or litigation; |
| • | the operating and stock price performance of our competitors; and |
| • | acquisitions and financings. |
Fluctuations in the stock market, generally, also impact the volatility of our stock price. General stock market movements may adversely affect the price of our ordinary shares, regardless of our operating performance.
Cyber-security incidents, including data security breaches or computer viruses, could harm our business by disrupting our delivery of services, damaging our reputation or exposing us to liability.
We receive, process, store and transmit, often electronically, the confidential data of our clients and others. Unauthorized access to our computer systems or stored data could result in the theft or improper disclosure of confidential information, the deletion or modification of records or could cause interruptions in our operations. These cyber-security risks increase when we transmit information from one location to another, including transmissions over the Internet or other electronic networks. Despite implemented security measures, our facilities, systems and procedures, and those of our third-party service providers, may be vulnerable to security breaches, acts of vandalism, software viruses, misplaced or lost data, programming and/or human errors or other similar events which may disrupt our delivery of services or expose the confidential information of our clients and others.
In addition, defects in the hardware or software we develop and sell could also result in unauthorized access to our customers’ and/or consumers’ networks. Any security breach involving the misappropriation, loss or other unauthorized disclosure or use of confidential information of our customers or others, whether by us or a third party, could (i) subject us to civil and criminal penalties, (ii) have a negative impact on our reputation, or (iii) expose us to liability to our customers, third parties or government authorities. Any of these developments could have a material adverse effect on our business, results of operations and financial condition. We have not experienced any such incidents that have had material consequences to date. We expect the U.S. and other countries to adopt additional cyber-security legislation that, if enacted, could impose additional obligations upon us that may negatively impact our operating results.
24
Table of Contents
Index to Financial Statements
New regulations related to conflict minerals may adversely affect us
We are subject to the SEC disclosure obligations relating to our use of so-called “conflict minerals” — columbite-tantalite, cassiterite (tin), wolframite (tungsten) and gold. These minerals are present in substantially all of our products. We are required to file a report with the SEC annually covering our use of these materials and their source.
In preparing these reports, we are dependent upon information supplied by suppliers of products that contain, or potentially contain, conflict minerals. To the extent that the information that we receive from our suppliers is inaccurate or inadequate or our processes in obtaining that information do not fulfill the SEC’s requirements, we could face reputational risks. Further, if in the future we are unable to certify that our products are conflict mineral free, we may face challenges with our customers, which could place us at a competitive disadvantage.
We do not intend to pay cash dividends in the foreseeable future.
We do not anticipate paying cash dividends on our ordinary shares in the foreseeable future. In addition, our ability to pay dividends is limited by the terms of our credit facilities. Payment of dividends in the future will depend on, among other things, business conditions, our results of operations, cash requirements, financial condition, contractual restrictions, provisions of applicable law and other factors that our board of directors may deem relevant.
As a result of shareholder voting requirements in the United Kingdom relative to Delaware, we have less flexibility with respect to certain aspects of capital management than we had as a Delaware corporation.
Prior to the Pace transaction, we were incorporated under Delaware law, which allowed our directors to authorize the issuance, without stockholder approval or any preemptive rights, of any shares authorized by our certificate of incorporation that were not already issued. Under English law, our directors may issue new ordinary shares up to a maximum amount equal to the allotment authority granted to the directors under our articles of association or by an ordinary resolution of our shareholders, subject to a five year limit on such authority. Additionally, subject to specified exceptions, English law grants preemptive rights to existing shareholders to subscribe for new issuances of shares for cash, but allows shareholders to waive these rights by way of a special resolution with respect to any particular allotment of shares or generally, subject to a five-year limit on such waiver. Our articles of association contain, as permitted by English law, a provision authorizing our Board to issue new shares for cash without preemptive rights. The authorization of the directors to issue shares without further shareholder approval and the authorization of the waiver of the statutory preemption rights must both be renewed by the shareholders at least every five years, and we cannot provide any assurance that these authorizations always will be approved, which could limit our ability to issue equity and, thereby, adversely affect the holders of our ordinary shares. While we do not believe that the differences between Delaware law and English law relating to our capital management will have a material adverse effect on us, situations may arise where the flexibility had under Delaware law would have provided benefits to our shareholders that is not be available under English law.
Any attempted takeovers of us will be governed by English law.
As a UK incorporated company, we are subject to English law. An English public limited company is potentially subject to the protections afforded by the Takeover Code if, among other factors, a majority of its directors are resident within the UK, the Channel Islands or the Isle of Man. We do not believe that the Takeover Code applies to us, and, as a result, our articles of association include measures similar to what may be found in the charters of U.S. companies, including the power for our Board to allot shares where in the opinion of the Board it is necessary to do so in the context of an acquisition of 20% or more of the issued voting shares in specified circumstances (this power is subject to renewal by our shareholders at least every five years and will cease to be applicable if the Takeover Code is subsequently deemed by the Takeover Panel to be applicable to ARRIS. Further, it could be more difficult for us to obtain shareholder approval for a merger or negotiated transaction because the shareholder approval requirements for certain types of transactions differ, and in some cases are
25
Table of Contents
Index to Financial Statements
greater, under English law than under Delaware law. The provisions of our articles of association and English law may have an anti-takeover impact on us and our ordinary shares.
Transfers of our ordinary shares, other than one effected by means of the transfer of book-entry interests in the Depository Trust Company (“DTC”), may be subject to UK stamp duty.
All of our outstanding shares are currently represented by book-entry interests in DTC. Transfers of our ordinary shares within DTC should not be subject to stamp duty or stamp duty reserve tax (“SDRT”) provided no instrument of transfer is entered into and no election that applies to our ordinary shares is made or has been made by DTC or Cede under Section 97A FA 1986. In this regard DTC has confirmed that neither DTC nor Cede (its nominee) has made an election under section 97A of the Finance Act which would affect our shares issued to Cede, as part of the Pace transaction. If such an election is or has been made, transfers of our ordinary shares within DTC generally will be subject to SDRT at the rate of 0.5% of the amount or value of the consideration. Transfers of our ordinary shares held in certificated form generally will be subject to stamp duty at the rate of 0.5% of the consideration given (rounded up to the nearest £5). SDRT will also be chargeable on an agreement to transfer such shares, although such liability would be discharged if stamp duty is duly paid on the instrument of transfer implementing such agreement within a period of six years from the agreement. Subsequent transfer of our ordinary shares to an issuer of depository receipts or into a clearance system (including DTC) may be subject to SDRT at a rate of 1.5% of the consideration given or received or, in certain cases, the value of our ordinary shares transferred. The purchaser or transferee of the ordinary shares generally will be responsible for paying any stamp duty or SDRT payable.
If the UK were to exit from the European Union, our business could suffer a material adverse effect.
The UK recently announced that it will hold a referendum on June 23, 2016 related to its continued membership in the European Union. This referendum could introduce potentially significant new uncertainties and instability in financial and trade markets, both ahead of the date for any such referendum and, depending on the outcome, after the referendum.
Given the lack of precedent, it is unclear how a potential withdrawal of the UK from the European Union would affect the UK’s access to the EU Single Market and other important financial and trade relationships and how it would affect us. A withdrawal could, among other outcomes, disrupt the free movement of goods, services and people between the UK and the European Union, undermine bilateral cooperation in key policy areas and significantly disrupt trade between the UK and the European Union. Under current European Union rules, following a withdrawal the UK would not be able to negotiate bilateral trade agreements with member countries of the European Union. In addition, a withdrawal of the UK from the European Union could significantly affect the fiscal, monetary and regulatory landscape within the UK and could have a material impact on its economy and the future growth of its various industries, including the broadcast and broadband communication systems industry in which we operate. Although it is not possible to predict fully the effects of a withdrawal of the UK from the European Union, if it were to occur it could have a material adverse effect on our business and our results of operations.
| Item 1B. | Unresolved Staff Comments |
No unresolved staff comments.
| Item 2. | Properties |
Our corporate headquarters are located in Suwanee, Georgia. We own sites in Apodaca, Mexico; Cary, North Carolina; Horsham, Pennsylvania; and Hsin Tien, Taiwan. We operate manufacturing and warehouse facilities, research and development, administrative and sales offices in various locations in the United States and in many foreign countries. These properties are generally used by each of our operating segments.
As of January 31, 2016, we have approximately 72 principal leased facilities, 32 of which are located in North America and 40 of which are located in other countries. Larger leased sites include properties location in
26
Table of Contents
Index to Financial Statements
Bangalore, India; Beaverton, Oregon; Boca Raton, Florida; Linkoping, Sweden; Lisle, Illinois; Lowell, Massachusetts; Manaus, Brazil; Ontario, California; Paris, France; San Antonio, Texas; Santa Clara, California; San Diego, California; San Jose, California; Suwanee, Georgia; Tel Aviv, Israel; Tijuana, Mexico; Saltaire, United Kingdom; and Wallingford, Connecticut.
We believe that our existing facilities, including both owned and leased, are in good condition and suitable for the conduct of our business. We generally consider that the facilities are being appropriately utilized and that they have sufficient production capacity for their present intended purposes. The extent of utilization of such facilities varies from plant to plant and from time to time during the year. For additional information regarding our obligations under property leases, see Note 21 Commitments and Contingencies of Notes to the Consolidated Financial Statements.
| Item 3. | Legal Proceedings |
We have been, and expect in the future to be a party to various legal proceedings, investigations or claims. In accordance with applicable accounting guidance, we record accruals for certain of our outstanding legal proceedings when it is probable that a liability will be incurred and the amount of loss can be reasonably estimated. We evaluate, at least on a quarterly basis, developments in our legal proceedings or other claims that could affect the amount of any accrual, as well as any developments that would result in a loss contingency to become both probable and reasonably estimable. When a loss contingency is not both probable and reasonably estimable, we do not record a loss accrual.
If the loss (or an additional loss in excess of any prior accrual) is reasonably possible and material, we disclose an estimate of the possible loss or range of loss, if such estimate can be made. The assessment whether a loss is probable or reasonably possible and whether the loss or a range of loss is estimable, involves a series of complex judgments about future events. Even if a loss is reasonably possible, we may not be able to estimate a range of possible loss, particularly where (i) the damages sought are substantial or indeterminate, (ii) the proceedings are in the early stages, or (iii) the matters involve novel or unsettled legal theories or a large number of parties. In such cases, there is considerable uncertainty regarding the ultimate resolution of such matters, including the amount of any possible loss. Accordingly, with respect to the proceedings described below, we are currently unable to reasonably estimate the possible loss or range of possible loss. However, because the results in litigation are unpredictable, an adverse resolution of one or more of such matters could have a material adverse effect on our business, financial position, results of operations or cash flows.
Due to the nature of our business, it is subject to patent infringement claims, including current suits against us or one or more of our wholly-owned subsidiaries or one or more of our customers who may seek indemnification from us. We believe that we have meritorious defenses to the allegation made in the pending cases and intend to vigorously defend these lawsuits; however, we are unable currently to determine the ultimate outcome of these or similar matters. In addition, we are a defendant in various litigation matters generally arising out of the normal course of business. Except as described below, ARRIS is not party to (nor have indemnification claims been made with respect to) any proceedings that are, or reasonably are expected to be, material to its business, results of operations or financial condition. However, since it is difficult to predict the outcome of legal proceedings, it is possible that the ultimate outcomes could materially and adversely affect our business, financial position, results of operations or cash flows. Accordingly, with respect to these proceedings, we are currently unable to reasonably estimate the possible loss or range of possible loss.
AIP v. MSOs, C.A. 12-cv-01690 et al., District of Delaware. On December 11, 2012, AIP filed several suits against service providers alleging infringement of four U.S. patents. The complaint requests unspecified damages for infringement and injunction against future infringement. Certain of our customers have requested that we provide indemnification. This case has been stayed pending Inter Partes Review at the Patent and Trademark Office. The Patent Trial and Appeals Board hearing the Inter Partes Review has ruled all claims of the patent are invalid. AIP appealed to the Court of Appeals for the Federal Circuit. To date, no evidence of infringement or damages has been introduced. It is premature to assess the likelihood of an unfavorable outcome. In the event of an unfavorable outcome, ARRIS may be required to indemnify one or more of the MSOs and/or pay damages for utilizing certain technology.
27
Table of Contents
Index to Financial Statements
AT&T v. Cox, C.A. 14-cv-01106., District of Delaware. On August 28, 2014, AT&T sued Cox for infringement of eight U.S. patents. Cox has requested that we provide indemnification. The complaint requests unspecified damages for past and future infringement. To date, no evidence of damages has been introduced. It is premature to assess the likelihood of an unfavorable outcome. In the event of an unfavorable outcome, ARRIS may be required to indemnify the MSOs and/or pay damages for utilizing certain technology.
Bear Creek Technologies v. MSOs, C.A. 2:11-cv-00103, District of Delaware. On February 22, 2011, Bear Creek sued MSOs, telcos and other VoIP service providers for infringement of US Patent No. 7,889,722, relating to EMTAs. Certain of our customers have requested that we provide indemnification. The complaint requests unspecified damages for past infringement and injunction against future infringement. This case has been stayed pending reexamination of the patent by the United States Patent and Trademark Office. In reexamination the Patent and Trademark Office held all claims invalid, and an appeal of that holding is currently pending with the Patent Trial and Appeals Board. To date, no evidence of damages has been introduced. It is premature to assess the likelihood of an unfavorable outcome. In the event of an unfavorable outcome, ARRIS may be required to indemnify the MSOs and/or pay damages for utilizing certain technology.
Broadband iTV v. Time Warner Cable (TWC) et al., C.A. 1:14-cv-00169, District of Hawaii. On April 9, 2014, Broadband iTV filed suit against TWC alleging infringement of U.S. Patent No. 7,631,336 relating to media sharing. TWC has requested that we provide indemnification. The complaint requests unspecified damages for past infringement and an injunction. It is premature to assess the likelihood of an unfavorable outcome. In the event of an unfavorable outcome, ARRIS may be required to indemnify TWC and/or pay damages for utilizing certain technology.
C-Cation v. ARRIS et al., C.A. 14-cv-00059, Eastern District of Texas; C-Cation v. Atlantic Broadband et al., C.A. 15-cv-00295, District of Delaware. On February 4, 2014, C-Cation filed suit against TWC, ARRIS, Cisco and Casa alleging infringement of U.S. Patent No. 5,563,883 relating to channel management. On April 7, 2015, C-Cation filed an additional suit against several remaining MSOs alleging infringement of the same patent. Certain of our customers have requested that we provide indemnification. An Inter Partes Review request filed by ARRIS on the claims asserted in the litigation has been instituted and a hearing will be scheduled to assess invalidity of the claims. The litigation has been stayed pending conclusion of the Inter Partes Review proceeding. The asserted patent expired in 2014 and the complaint requests unspecified damages for past infringement. It is premature to assess the likelihood of an unfavorable outcome. In the event of an unfavorable outcome, ARRIS may be required to pay damages for utilizing certain technology.
ChanBond v. MSOs, C.A. 15-cv-00848, et al, District of Delaware (RGA). On September 21, 2015, ChanBond filed suit against several MSOs alleging infringement of three US Patents. Certain of our customers have requested that we provide indemnification. The complaint requests unspecified damages for infringement and injunction against future infringement. To date, no evidence of infringement or damages has been introduced. It is premature to assess the likelihood of an unfavorable outcome. In the event of an unfavorable outcome, ARRIS may be required to indemnify the MSOs and/or pay damages for utilizing certain technology.
Pace c/ Copie France, RG N°14/02114, Court of First Instance of Nanterre (Tribunal de Grande Instance de Nanterre). On August 17, 2015, Copie France filed suit against Pace France and Sagemcom Broadband SAS, on a subsidiary basis, in connection with a litigation matter against Canal+, claiming the collection of private copy levies for allegedly misclassified devices put into service by Canal+. By filing suit on a subsidiary basis against Pace France, it will permit Copie France to seek recovery from Pace France in the event its claims against Canal+ are rejected. It is premature to assess the likelihood of an unfavorable outcome. In the event of an unfavorable outcome, an ARRIS subsidiary may be required to pay damages to Copie France.
Dragon Intellectual Property v. MSOs, C.A. 13-cv-02069; 13-cv-02063, etc., District of Delaware (RGA). On December 20, 2013, Dragon IP filed suit against several MSOs alleging infringement of US Patent No. 5,930,444. Certain of our customers have requested that we provide indemnification. The complaint requests unspecified damages for infringement and injunction against future infringement. A Petition for Inter Partes Review of the asserted patent has been instituted against the patent. The Patent Trials and Appeals Board has now ruled all instituted claims to be invalid. To date, no evidence of infringement or damages has been
28
Table of Contents
Index to Financial Statements
introduced. It is premature to assess the likelihood of an unfavorable outcome. In the event of an unfavorable outcome, ARRIS may be required to indemnify the MSOs and/or pay damages for utilizing certain technology.
Intellectual Ventures I and II v. AT&T, CenturyLink, C.A. 12-cv-00193, 13-cv-01631, etc. District of Delaware. On February 16, 2012, Intellectual Ventures filed a claim against AT&T alleging infringement of several US patents. Certain of our customers have requested that we provide indemnification. The complaint requests damages for past and future infringement. To date, no evidence of infringement or damages has been introduced. It is premature to assess the likelihood of an unfavorable outcome. In the event of an unfavorable outcome, ARRIS may be required to indemnify AT&T and/or pay damages for utilizing certain technology.
MediaTube et al v. Bell Canada et al, C.A. T-705-13, Canadian Federal Court. On April 23, 2013, MediaTube Corp. filed a claim against Bell Canada entities alleging infringement of a Canadian patent. The complaint requests damages for past and future infringement. To date, no evidence of infringement or damages has been introduced. It is premature to assess the likelihood of an unfavorable outcome. In the event of an unfavorable outcome, ARRIS may be required to indemnify Bell Canada and/or pay damages for utilizing certain technology.
Mobile Telecommunications Technologies v. MSOs, C.A. 16-cv-00007, 16-cv-0013, etc., Eastern District of Texas. On January 4, 2016, Mobile Telecommunications Technologies (M-Tel) filed suit against several MSOs alleging infringement of three expired U.S. patents alleged to cover various Wi-Fi functionality. Certain of our customers have requested that we provide indemnification. The complaint requests unspecified damages for past infringement. To date, no evidence of infringement or damages has been introduced. It is premature to assess the likelihood of an unfavorable outcome. In the event of an unfavorable outcome, ARRIS may be required to indemnity one or more MSOs and/or pay damages for utilizing certain technology.
Quantum Stream v. DirecTV, C.A. 15-cv-08240., Southern District of New York. On October 20, 2015, Quantum Stream filed suit against DirecTV alleging infringement of two U.S. patents alleged to cover provision of video content and addressable advertising. DirecTV has asked that we indemnify. The complaint requests unspecified damages for past infringement and an injunction against future infringement. To date, no evidence of infringement or damages has been introduced. It is premature to assess the likelihood of an unfavorable outcome. In the event of an unfavorable outcome, ARRIS may be required to indemnity one or more MSOs and/or pay damages for utilizing certain technology.
Sprint Communications v. MSOs, C.A. 11-cv-2686, District of Kansas. On December 19, 2011, Sprint filed suit against several MSOs alleging infringement of several patents alleged to cover various aspects of voice services. Certain of our customers have requested that we provide indemnification. The complaint requests unspecified damages for past infringement and injunction against future infringement. To date, no evidence of damages has been introduced. It is premature to assess the likelihood of an unfavorable outcome. In the event of an unfavorable outcome, ARRIS may be required to indemnify the MSOs and/or pay damages for utilizing certain technology. With respect to any liability attributable to Motorola Home in this matter, a subsidiary of Google has agreed to indemnify ARRIS.
Sony Corp. v. Pace plc et al., C.A. 15-cv-00288, District of Delaware. On April 1, 2015, Sony filed suit against Pace alleging infringement of six U.S. Patents alleged to cover various features of the set top box. The complaint requests unspecified damages for past infringement and injunction against future infringement. To date, no evidence of infringement or damages has been introduced. It is premature to assess the likelihood of an unfavorable outcome. In the event of an unfavorable outcome, ARRIS may be required to pay damages for utilizing certain technology.
TQ Delta v. MSOs, C.A. 15-cv-00611; 15-cv-00615, etc., District of Delaware. On July 17, 2015, TQ Delta filed suit against several MSOs alleging infringement of several U.S. patents. Certain of our customers have requested that we provide indemnification. The complaint requests unspecified damages for past and future infringement. To date, no evidence of infringement or damages has been introduced. It is premature to assess the likelihood of an unfavorable outcome. In the event of an unfavorable outcome, ARRIS may be required to indemnify the MSOs and/or pay damages for utilizing certain technology.
29
Table of Contents
Index to Financial Statements
TQ Delta v. 2Wire Inc., C.A. 13-cv-01835, District of Delaware. On November 4, 2013, TQ Delta filed suit against 2Wire alleging infringement of several U.S. patents. The complaint requests unspecified damages for past infringement and an injunction against future infringement. To date, no evidence of infringement or damages has been introduced. It is premature to assess the likelihood of an unfavorable outcome. In the event of an unfavorable outcome, ARRIS may be required to pay damages for utilizing certain technology.
Two Way Media v. Bell Canada et al, C.A. T-809-14, Canadian Federal Court. On April 2, 2014, Two Way Media filed a claim against Bell Canada entities alleging infringement of a Canadian patent. Bell Canada has requested that we provide indemnification. The complaint requests damages for past and future infringement. To date, no evidence of infringement or damages has been introduced. It is premature to assess the likelihood of an unfavorable outcome. In the event of an unfavorable outcome, ARRIS may be required to indemnify Bell Canada and/or pay damages for utilizing certain technology.
United Access Technologies v. AT&T, C.A. 11-cv-00338, District of Delaware. On April 15, 2011, United Access Technologies filed suit against AT&T alleging infringement of three U.S. patents. The complaint requests unspecified damages for past and future infringement. To date, no evidence of infringement or damages has been introduced. It is premature to assess the likelihood of an unfavorable outcome. In the event of an unfavorable outcome, ARRIS may be required to indemnify AT&T and/or pay damages for utilizing certain technology.
In the acquisition agreement entered into in connection with the acquisition of the Motorola Home business, a subsidiary of Google agreed to indemnify, defend and hold harmless ARRIS and various related parties with respect to, among other things, any losses suffered by ARRIS as a result of a court order involving, or the settlement of, certain agreed-upon litigation, including the Sprint lawsuit described above that reference this indemnification obligation. There are various limitations upon this obligation.
From time to time third parties demand that we or our customers enter into a license agreement with respect to patents owned, or allegedly owned, by the third parties. Such demands cause us to dedicate time to study the patents and enter into discussions with the third parties regarding the merits and value, if any, of the patents. These discussions, may materialize into license agreements or patent claims asserted against us or our customers. If asserted against our customers, our customers may request indemnification from us. It is not possible to determine the impact of any such demands and the related discussions on ARRIS’s business, results of operations or financial condition.
| Item 4. | Mine Safety Disclosures |
Not Applicable
30
Table of Contents
Index to Financial Statements
| Item 4A. | Executive Officers and Board Committees |
Executive Officers of the Company
The following table sets forth the name, age as of February 29, 2016, and position of our executive officers.
| Name |
Age | Position | ||||
| Robert J. Stanzione |
68 | President and Chief Executive Officer, Chairman of the Board | ||||
| David B. Potts |
58 | Executive Vice President, Chief Financial Officer | ||||
| Lawrence A. Margolis |
68 | Executive Vice President, Corporate Strategy and Administration | ||||
| Bruce W. McClelland |
49 | President, Network & Cloud | ||||
| Lawrence Robinson |
48 | President, Customer Premises Equipment | ||||
| Ronald M. Coppock |
61 | President, International Sales and Global Marketing | ||||
| Tim O’Loughlin |
42 | President, North American Sales | ||||
| Phil Baldock |
40 | Senior Vice President, Chief Information Officer | ||||
| James R. Brennan |
54 | Senior Vice President, Supply Chain & Quality | ||||
| Victoria P. Brewster |
53 | Senior Vice President, Human Resources | ||||
| Patrick W. Macken |
42 | Senior Vice President, General Counsel and Secretary | ||||
Robert J. Stanzione has been Chief Executive Officer since 2000. In 1995, Mr. Stanzione was appointed President & CEO of ARRIS Interactive, LLC, a Nortel Networks/ANTEC joint venture. As ARRIS Interactive’s first CEO, Mr. Stanzione grew the venture from a start-up company to the world market leader in cable telephony products. In 1998 he became President, Chief Operating Officer and a Director of ANTEC and was appointed to the CEO role on January 1, 2000. In 2001, ANTEC acquired Nortel’s share of ARRIS Interactive and re-named the Company ARRIS Group, Inc. Under Mr. Stanzione’s leadership, ARRIS continued to invest in opportunities to significantly expand the business, including the 2013 acquisition of Motorola Mobility’s Home business and the 2016 acquisition of Pace, which created a new entity, ARRIS International plc. From 1969 to 1995, before joining ARRIS, Mr. Stanzione held a wide range of senior management positions with AT&T.
Mr. Stanzione holds a Bachelor’s degree in Mechanical Engineering from Clemson University, a Master’s degree in Industrial Engineering from North Carolina State University and has completed executive development programs at the University of Richmond, Babson College and the International Institute for Management Development in Switzerland.
Mr. Stanzione is a Board Member of the National Cable & Telecommunications Association (NCTA). In June 2012, he was named to serve on The Cable Center Board of Directors. Mr. Stanzione was awarded the SCTE’s Chairman’s Award in 2008, the Vanguard Award for Associates & Affiliates in 2009, and was inducted into the Cable TV Pioneers in 2010. He is a member of the Class of 2016 Cable Hall of Fame and also serves as a Trustee on the Committee for Economic Development in Washington, D.C.
David B. Potts has been the Chief Financial Officer since 2004. Prior to joining ARRIS, Mr. Potts was Chief Financial Officer of ARRIS Interactive L.L.C. and held various executive management positions with Nortel Networks, including Vice President and Chief Financial Officer of Bell Northern Research and Vice President of Mergers and Acquisitions. Prior to Nortel Networks, Mr. Potts was with Touche Ross in Toronto.
Mr. Potts holds a Bachelor of Commerce degree from Lakehead University in Canada and is a member of the Institute of Chartered Accountants in Canada.
Lawrence A. Margolis is Executive Vice President, Corporate Strategy and Administration of the Company. In his role, Mr. Margolis has played an integral role in past joint ventures and the creation and operation of ARRIS acquisitions. Mr. Margolis has operating management responsibility for Corporate Strategy and Business Development functions of the Company.
31
Table of Contents
Index to Financial Statements
Mr. Margolis was previously Executive Vice President, Law and Administration and Secretary of ARRIS and previous to that Chief Financial Officer of ARRIS. Prior to ARRIS, he held executive positions with Anixter, Inc., a global communications products distribution company, including Vice President, General Counsel and Secretary. Mr. Margolis was previously a partner at the law firm of Schiff Hardin & Waite.
Mr. Margolis holds a Bachelor’s degree in English Literature from the University of Kansas and a Juris Doctor from the University of Michigan Law School.
Bruce W. McClelland is President of Network & Cloud and Global Services. Mr. McClelland is responsible for overseeing the Company’s leading portfolio of network technologies including CCAP, CMTS, QAM, Video Processing and Wireline technologies. Mr. McClelland’s portfolio also features the Company’s expanding Software Solutions, which include multi-screen support, targeted advertising, personalized content, whole-home technologies, as well as Global Services.
Most recently, Mr. McClelland was ARRIS’s Group President, for Products and Services, after leading the Customer Premises Equipment Unit as Vice President and General Manager. McClelland joined the Company as Vice President of Engineering, responsible for development of a broad range of voice and data cable TV products.
Prior to ARRIS, Mr. McClelland was responsible for the development of Nortel’s Signaling System #7 and Signal Transfer Point product lines as well as several development roles within Nortel’s Class 4/5 DMS switching product line.
Mr. McClelland serves on the board and as Chairman of ActiveVideo, LLC, based in San Jose, California, and joint venture initiative between ARRIS and Charter Communications. Mr. McClelland also serves on the board of Benu Networks, based in Billerica, Massachusetts.
Mr. McClelland received a Bachelor of Electrical Engineering from the University of Saskatchewan.
Lawrence Robinson is President, Customer Premises Equipment, which comprises in-home video solutions including digital cable set-tops, satellite receivers, and IP-based TV products, as well as a comprehensive portfolio of broadband devices incorporating the latest in DOCSIS, DSL, and fiber technologies.
Mr. Robinson assumed his current role after the ARRIS acquisition of Motorola Mobility’s Home business where he was Senior Vice President and General Manager of the Home Devices business responsible for its video, voice and data product portfolio, including set-tops, modems and gateways. Mr. Robinson brings more than a decade of experience in the broadband and video industry, including roles in general management, product management and business development.
While at Motorola, Mr. Robinson held a variety of senior level positions including Corporate Vice President, Product Management in the Digital Video Solutions Group. In this role, he led the definition and management of digital cable and satellite set-tops product lines for the Americas’ market. Robinson also managed strategic partnerships that complemented the portfolio.
In addition to his broadband and video industry experience, Mr. Robinson brings more than a decade of experience in large scale, aerospace communications systems, in addition to management consulting experience with PricewaterhouseCoopers, LLP.
Mr. Robinson holds a Master’s degree in Technology Management from the University of Pennsylvania and a Bachelor’s degree in Electrical Engineering from the Catholic University of America.
Ronald M. Coppock is President of International Sales and Global Marketing at ARRIS. In this role, Mr. Coppock leads International Sales, reflecting the Company’s focus on global growth. He also runs global marketing and sales operations. Mr. Coppock assumed his current role after the acquisition of Pace. Previously, Coppock served as President of Worldwide Sales and Marketing at ARRIS. In this role, he was responsible for worldwide sales and marketing.
Prior to joining ARRIS, Mr. Coppock held various sales and marketing positions such as Senior Vice President International, TSX Texscan; Director of Marketing for Westcott Communications Private Television Networks; Western Regional Manager, Scientific-Atlanta Network Systems and Satellite Communications Group;
32
Table of Contents
Index to Financial Statements
Director National Accounts at Pioneer; and various positions at Pioneer Communications and Oak Communications. Mr. Coppock received a Bachelor’s degree in Business Administration & Marketing from Auburn University. He is an active member of the American Marketing Association, Auburn School of Business Alumni Association and serves on the Cystic Fibrosis Foundation Board. Coppock is also a member of the Cable TV Pioneers.
Tim O’Loughlin is President, North American Sales at ARRIS. Mr. O’Loughlin assumed his current role after the acquisition of Pace. Previously, he served as President of Pace Americas, overseeing the United States and Canada.
Mr. O’Loughlin joined Pace in March 2001 as part of the marketing team and served in various roles including Senior Vice President of Sales and Customer Support, Vice President of Business Development, and Vice President of Sales and Marketing. He was an instrumental part of Pace’s expansion throughout the cable, telecommunications, and satellite industries.
Prior to joining Pace, Mr. O’Loughlin held strategic marketing positions in the hospitality and telecom industries. He holds a Bachelor’s degree in Business Administration and an MBA from Florida Atlantic University.
Phil Baldock is Senior Vice President, Chief Information Officer at ARRIS. Mr. Baldock assumed his current role after the acquisition of Pace. He is responsible for developing ARRIS’s IT strategy to deliver increased operating performance and productivity. Previously, Mr. Baldock served as Senior Vice President of Business Operations at Pace, overseeing Manufacturing Strategy, Procurement, Quality and Business Systems. He was also responsible for Pace’s supplier relationships and acted in a governance capacity, ensuring Pace met its corporate social responsibility obligations.
Mr. Baldock joined Pace in 1997 as a Financial Accountant at the Company’s UK headquarters. In 2005, he transferred to the Pace Americas office in Boca Raton, FL where his roles included Product Manager, Director of Commercial Operations and VP, Customer Support.
Mr. Baldock qualified as a Chartered Management Accountant in the UK and holds a Bachelor’s Degree in Accounting from Glasgow Caledonian University and an MBA from the University of Florida
James R. Brennan is Senior Vice President of Supply Chain and Quality and responsible for leading the supply chain, quality and operation services and solutions that deliver financial results, customer satisfaction and industry leading practices.
Mr. Brennan held a similar role as the Corporate Vice President of Supply Chain and Quality for the Motorola Mobility’s Home business. He served in various executive positions at Motorola, including Vice President Business Transformation and Chief Quality Officer and Corporate Vice President of the Home Networks Mobility supply chain, which included global operations associated with planning, purchasing, new product introduction, manufacturing, customer fulfillment and repair. Mr. Brennan also served in other senior leadership positions, including strategy, business operations, IT, and mergers and acquisitions.
Prior to joining Motorola in 2000, Mr. Brennan held leadership positions at General Instrument in Operations and Northrop Grumman/Vought Aircraft in engineering development, manufacturing, flight test operations and quality.
Mr. Brennan earned a Bachelor’s degree in Mechanical Engineering from Old Dominion University. He also completed the University of Pennsylvania’s Wharton School and the University of Michigan’s executive programs.
Vicki P. Brewster is Senior Vice President of Human Resources, where she leads global people strategies that enable growth, energize the culture, and create an employee competitive advantage for ARRIS.
Ms. Brewster has held leadership HR roles at ARRIS for nearly a decade, managing global business-critical functions including talent acquisition, compensation, benefits, HR systems, talent management, and employee relations. Her work includes leading the HR integration of strategic ARRIS acquisitions including Motorola Home. Prior to joining ARRIS, Ms. Brewster held senior leadership roles at S1 Corporation, NDCHealth, WebMD, and HBO & Company.
33
Table of Contents
Index to Financial Statements
Ms. Brewster holds a Bachelor’s degree in Industrial Relations and Psychology from the University of North Carolina at Chapel Hill.
Patrick W. Macken is Senior Vice President, General Counsel and Secretary. In this role, he oversees all aspects of the Company’s legal function. Mr. Macken joined ARRIS from Troutman Sanders LLP, where he served as partner in the firm’s Corporate Group, providing legal counsel and support to ARRIS for more than 10 years. His legal expertise spans securities law, mergers and acquisitions, capital markets, commercial law and corporate governance.
Mr. Macken holds a Bachelor’s Degree and a Juris Doctorate from Tulane University.
Board Committees
Our Board of Directors has three permanent committees: Audit, Compensation, and Nominating & Corporate Governance. The charters for all three committees are located on our website at www.arris.com. The Board believes that each of its members, with the exception of Mr. Stanzione, is independent, as defined by the SEC and NASDAQ rules. The Board has identified Harry L. Bosco as the lead independent director. Additionally, the Board has identified Doreen A. Toben as an audit committee financial expert.
34
Table of Contents
Index to Financial Statements
PART II
| Item 5. | Market for Registrant’s Common Equity, Related Stockholder Matters and Issuer Purchases of Equity Securities |
ARRIS’s stock is traded on the NASDAQ Global Select Market under the symbol “ARRS.” The following table reports the high and low trading prices per share of our stock as listed on the NASDAQ Global Market System:
| High | Low | |||||||
| 2014 |
||||||||
| First Quarter |
$ | 31.42 | $ | 23.38 | ||||
| Second Quarter |
34.22 | 24.76 | ||||||
| Third Quarter |
35.83 | 28.22 | ||||||
| Fourth Quarter |
30.99 | 23.71 | ||||||
| 2015 |
||||||||
| First Quarter |
$ | 31.45 | $ | 25.64 | ||||
| Second Quarter |
37.50 | 28.57 | ||||||
| Third Quarter |
32.01 | 24.46 | ||||||
| Fourth Quarter |
32.93 | 25.80 | ||||||
We have not paid cash dividends on our stock since our inception.
As of January 31, 2016, there was one record holder of our ordinary shares (with approximately 41,000 beneficial holders.) This number excludes shareholders holding stock under nominee or street name accounts with brokers or banks.
Issuer Purchases of Equity Securities
The table below sets forth the purchases of ARRIS stock for the quarter ended December 31, 2015:
| Period |
Total Number of Shares Purchased(1) |
Average Price Paid Per Share |
Total Number of Shares Purchased as Part of Publicly Announced Plans or Programs |
Approximate Dollar Value of Shares That May Yet Be Purchased Under the Plans or Programs (in thousands) |
||||||||||||
| November 2015 |
102 | $ | 29.72 | — | 144,630 | |||||||||||
| December 2015 |
483,512 | $ | 29.42 | — | 144,630 | |||||||||||
| (1) | Includes approximately 483,614 shares repurchased to satisfy tax withholding obligations that arose on the vesting of shares of restricted stock units. |
Our board of directors previously authorized share repurchase plans, in May 2011 and October 2012, pursuant to which we could purchase up to an aggregate of $300.0 million of our common stock. In connection with our acquisition of Motorola Home in 2013, we suspended making any repurchases under the approved plans, but the plans were not terminated and have not expired. No repurchases have been made under this plan in 2013 and 2014.
During the first quarter of 2015, we repurchased 0.9 million shares of our common stock for $25.0 million at an average stock price of $28.70.
In early 2016, our Board of Directors approved a new $300.0 million share repurchase authorization replacing all prior programs. Unless terminated earlier by a Board resolution, this new plan will expire when ARRIS has used all authorized funds for repurchase.
35
Table of Contents
Index to Financial Statements
Stock Performance Graph
Below is a graph comparing total stockholder return on the Company’s stock from December 31, 2010 through December 31, 2015, with the Standard & Poor’s 500 and the Index of NASDAQ U.S. Stocks of entities in the industry of electronics and electrical equipment and components, exclusive of computer equipment (SIC 3600-3699), prepared by the Research Data Group, Inc.
COMPARISON OF 5 YEAR CUMULATIVE TOTAL RETURN*
Among ARRIS Group Inc., the S&P 500 Index, and SIC Codes 3600 - 3699
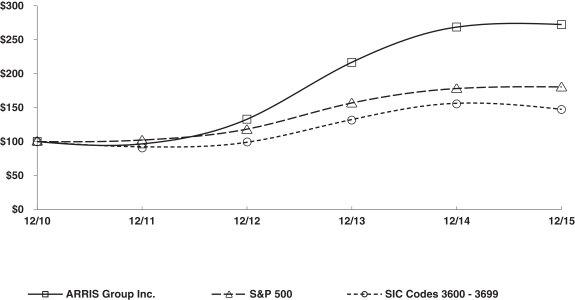
*$100 invested on 12/31/10 in stock or index, including reinvestment of dividends.
Fiscal year ending December 31.
Copyright© 2016 S&P, a division of McGraw Hill Financial. All rights reserved.
| 12/10 | 12/11 | 12/12 | 12/13 | 12/14 | 12/15 | |||||||||||||||||||
| ARRIS Group Inc. |
100.00 | 96.43 | 133.16 | 216.93 | 269.07 | 272.46 | ||||||||||||||||||
| S&P 500 |
100.00 | 102.11 | 118.45 | 156.82 | 178.29 | 180.75 | ||||||||||||||||||
| SIC Codes 3600 — 3699 |
100.00 | 92.26 | 98.80 | 132.65 | 156.62 | 147.62 | ||||||||||||||||||
| Copyright© 2016 Standard & Poor’s, a division of McGraw Hill Financial. All rights reserved. (www.researchdatagroup.com/S&P.htm) |
| |||||||||||||||||||||||
Notwithstanding anything to the contrary set forth in any of our filings under the Securities Act of 1933, or the Securities Exchange Act of 1934 that might incorporate future filings, including this Annual Report on Form 10-K, in whole or in part, the Performance Graph presented above shall not be incorporated by reference into any such filings.
36
Table of Contents
Index to Financial Statements
| Item 6. | Selected Consolidated Historical Financial Data |
The selected consolidated financial data as of December 31, 2015 and 2014 and for each of the three years in the period ended December 31, 2015 set forth below are derived from the accompanying audited consolidated financial statements of ARRIS, and should be read in conjunction with such statements and related notes thereto. The selected consolidated financial data as of December 31, 2013, 2012, and 2011 and for the years ended December 31, 2012 and 2011 is derived from audited consolidated financial statements that have not been included in this filing. The historical consolidated financial information is not necessarily indicative of the results of future operations and should be read in conjunction with ARRIS’s historical consolidated financial statements and the related notes thereto and “Management’s Discussion and Analysis of Financial Condition and Results of Operations” included elsewhere in this document.
On April 17, 2013, we completed our acquisition of Motorola Home and applied the acquisition method of accounting for the business combination. The selected balance sheet data as of December 31, 2013 represents the consolidated statement of financial position of the combined company. The consolidated operating data for the year ended December 31, 2013 includes approximately eight months of operating results of the combined company. No results from our acquisition of Pace, which was completed on January 4, 2016, are included below.
See Note 23 Summary Quarterly Consolidated Financial Information of the Notes to the Consolidated Financial Statements for a summary of our quarterly consolidated financial information for 2015 and 2014 (in thousands, except per share data).
| 2015 | 2014 | 2013 | 2012 | 2011 | ||||||||||||||||
| Consolidated Operating Data: |
||||||||||||||||||||
| Net sales |
$ | 4,798,332 | $ | 5,322,921 | $ | 3,620,902 | $ | 1,353,663 | $ | 1,088,685 | ||||||||||
| Cost of sales |
3,379,409 | 3,740,425 | 2,598,154 | 891,086 | 678,172 | |||||||||||||||
|
|
|
|
|
|
|
|
|
|
|
|||||||||||
| Gross margin |
1,418,923 | 1,582,496 | 1,022,748 | 462,577 | 410,513 | |||||||||||||||
| Selling, general, and administrative expenses |
417,085 | 410,568 | 338,252 | 161,338 | 148,755 | |||||||||||||||
| Research and development expenses |
534,168 | 556,575 | 425,825 | 170,706 | 146,519 | |||||||||||||||
| Amortization of intangible assets |
227,440 | 236,521 | 193,637 | 30,294 | 33,649 | |||||||||||||||
| Integration, acquisition, restructuring and other costs |
29,277 | 37,498 | 83,047 | 12,968 | 7,565 | |||||||||||||||
| Impairment of goodwill & intangibles |
— | — | — | — | 88,633 | |||||||||||||||
|
|
|
|
|
|
|
|
|
|
|
|||||||||||
| Operating income (loss) |
210,953 | 341,334 | (18,013 | ) | 87,271 | (14,608 | ) | |||||||||||||
| Interest expense |
70,936 | 62,901 | 67,888 | 17,797 | 16,939 | |||||||||||||||
| Loss (gain) on investments |
6,220 | 10,961 | 2,698 | (1,404 | ) | 1,570 | ||||||||||||||
| Loss (gain) on foreign currency |
20,761 | 2,637 | (3,502 | ) | 786 | (580 | ) | |||||||||||||
| Interest income |
(2,379 | ) | (2,590 | ) | (2,936 | ) | (3,242 | ) | (3,154 | ) | ||||||||||
| Other expense (income), net |
8,362 | 28,195 | 13,989 | (962 | ) | (872 | ) | |||||||||||||
|
|
|
|
|
|
|
|
|
|
|
|||||||||||
| Income (loss) before income taxes |
107,053 | 239,230 | (96,150 | ) | 74,296 | (28,511 | ) | |||||||||||||
| Income tax expense (benefit) |
22,594 | (87,981 | ) | (47,390 | ) | 20,837 | (10,849 | ) | ||||||||||||
|
|
|
|
|
|
|
|
|
|
|
|||||||||||
| Consolidated net income (loss) |
84,459 | 327,211 | (48,760 | ) | 53,459 | (17,662 | ) | |||||||||||||
| Net loss attributable to noncontrolling interest |
(7,722 | ) | — | — | — | — | ||||||||||||||
|
|
|
|
|
|
|
|
|
|
|
|||||||||||
| Net income (loss) attributable to ARRIS Group, Inc. |
$ | 92,181 | $ | 327,211 | $ | (48,760 | ) | $ | 53,459 | $ | (17,662 | ) | ||||||||
|
|
|
|
|
|
|
|
|
|
|
|||||||||||
| Basic |
$ | 0.63 | $ | 2.27 | $ | (0.37 | ) | $ | 0.47 | $ | (0.15 | ) | ||||||||
| Diluted |
$ | 0.62 | $ | 2.21 | $ | (0.37 | ) | $ | 0. 46 | $ | (0.15 | ) | ||||||||
| Selected Balance Sheet Data: |
||||||||||||||||||||
| Total assets |
$ | 4,518,603 | $ | 4,341,042 | $ | 4,287,129 | $ | 1,404,935 | $ | 1,359,613 | ||||||||||
| Long-term obligations |
$ | 1,655,012 | $ | 1,646,604 | $ | 1,880,594 | $ | 74,385 | $ | 285,552 | ||||||||||
37
Table of Contents
Index to Financial Statements
| Item 7. | Management’s Discussion and Analysis of Financial Condition and Results of Operations |
Overview
ARRIS International plc is a world leader in entertainment and communications technology. Our innovations combine hardware, software, and services across the cloud, network, and home to power TV and Internet for millions of people around the globe. The people of ARRIS collaborate with the world’s top service providers, content providers, and retailers to advance the state of our industry and pioneer tomorrow’s connected world.
We are headquartered in Suwanee, Georgia. We operate in two business segments: Customer Premises Equipment (“CPE”) and Network & Cloud (“N&C”). We enable service providers including cable, telephone, and digital broadcast satellite operators and media programmers to deliver media, voice, and IP data services to their subscribers. We are a leader in set-tops, digital video and Internet Protocol Television (“IPTV”) distribution systems, broadband access infrastructure platforms, and associated data and voice CPE, which we also sell directly to consumers through retail channels. Our solutions are complemented by a broad array of services including technical support, repair and refurbishment, and system design and integration.
On January 4, 2016, ARRIS Group, Inc. completed its Combination with Pace, a company incorporated in England and Wales. In connection with the Combination, (i) ARRIS International plc, a company incorporated in England and Wales, acquired all of the outstanding ordinary shares of Pace and (ii) a wholly owned subsidiary of ARRIS International was merged with and into ARRIS Group, with ARRIS Group surviving the Merger as an indirect wholly owned subsidiary of ARRIS International. Under the terms of the Combination, (a) Pace shareholders received 132.5 pence in cash and 0.1455 ordinary shares of ARRIS International for each Pace Share they held, and (b) ARRIS Group stockholders received one ordinary share of ARRIS International for each share of ARRIS Group common stock they held.
Following the Combination, both ARRIS Group and Pace became indirect wholly-owned subsidiaries of ARRIS International. The ordinary shares of ARRIS International trade on The NASDAQ Stock Market LLC under the symbol “ARRS.” In addition, while ARRIS International is incorporated under the laws of England and Wales, our corporate headquarters remain in Suwanee, Georgia. Following the Combination, we continue to operate in two business segments with the former Pace products included in our Network & Cloud and Consumer Premises Equipment Segments. As a result of the Combination not being completed until after the end of the 2015 fiscal year, except as specifically noted below, the results described below relate only to ARRIS Group.
Business and Financial Highlights:
Business Highlights
| • | Announced the acquisition of Pace which closed in January 2016. |
| • | Formed a new venture with Charter Communications acquiring ActiveVideo Networks, in April 2015. |
| • | Continued international expansion, most notably with new business with NBN in Australia and Liberty Global in Europe. |
| • | Leading market position in several key product areas, including CMTS, video and broadband gateways. |
| • | Amended our credit agreement in June 2015 providing for improved terms and conditions and the necessary funding for the cash component of the Pace acquisition |
Financial Highlights
| • | Sales in 2015 were $4,798.3 million as compared to $5,322.9 million in 2014, a decrease of 9.9% reflecting continued service provider growth challenges, particularly with our telco customers. |
| • | International sales increased 1.0% from the prior year despite the adverse impact related to the strengthening of the U.S. dollar through 2015. |
38
Table of Contents
Index to Financial Statements
| • | Gross margin percentage was 29.6% in 2015, compared to 29.7% in 2014. |
| • | Total operating expenses (excluding amortization of intangible assets, integration, acquisition, restructuring and other costs) in the 2015 were $951.3 million, as compared to $967.1 million in the same period last year. |
| • | We ended 2015 with $879.1 million of cash, cash equivalents, and marketable security investments, which compares to $697.4 million at the end of 2014. We generated approximately $343.9 million of cash from operating activities in 2015 and $459.3 million during 2014. |
| • | We ended 2015 with long-term debt of $1,509.1 million, at face value, the current portion of which is $49.5 million. We repaid $38.5 million of our Term Loans under our credit facility and $15 million of indebtedness related to ActiveVideo in 2015. |
| • | During 2015, we used $25.0 million of cash to repurchase 0.9 million shares of our common stock at an average price of $28.70 per share. |
Industry Conditions
Global macro-economic conditions improved in 2015 over the historically low levels experienced since 2007, although the U.S. and many other international markets we serve saw only modest growth. We expect to see further limited economic growth in many of our markets in 2016 notwithstanding the continuing global economic uncertainty. We believe this economic uncertainty will continue to influence the capital expenditure strategy of many of our customers and, as a result, we expect only modest growth in the overall capital expenditure in the markets we serve in 2016.
Consolidation of Customers Has Occurred and May Continue — Altice completed its acquisition of Suddenlink in December 2015 and has announced its intent to acquire Cablevision. Liberty Global is moving forward with its plans to acquire Cable & Wireless. While Comcast is no longer in contract to acquire Time Warner Cable, Charter has announced its intent to acquire both Time Warner Cable and Brighthouse. Meanwhile, AT&T acquired DIRECTV in July 2015, and in February 2015 Verizon announced its intention to sell certain properties to Frontier Communications. We believe our acquisition of Pace positions us favorably to capitalize on this consolidation through a broader portfolio, global scale, and leadership in many of the platforms and components that these providers depend on to deliver services. The impact of this customer M&A activity is difficult to estimate but may include:
| • | a near-term delay in capital expenditures by the impacted customers until transactions are completed. Once the transactions are completed, we believe there is the potential for increased capital expenditure as acquiring operators work to standardize the purchased network to the acquirer’s existing systems and, in many cases, upgrade the acquired networks; |
| • | pressures from the resulting customers for lower prices or better terms, reflecting the increase in the total volume of products purchased or the elimination of a price differential between the acquiring customer and the company acquired; and |
| • | potential volatility in demand depending upon which technology, products and vendors each customer chooses to use post integration, including reductions in purchases from us in order to diversify their supplier base. |
Capital Expenditures of Telecom Customers Have Been and May Continue to be Lower — The FCC recently completed a wireless spectrum auction which raised a record amount for the acquired wireless spectrum licenses. Many of our telecom customers, including AT&T and Verizon, participated in this auction in the interest of expanding their network capacity to meet increasing customer demand. As a result, capital expenditures at our existing and potential telecom customers are expected to be lower in the near term as a result of the costs associated with participating in the auction. Additional spectrum auctions, both in the U.S. (in 2016) and in some foreign markets are expected to occur which could further impact the capital expenditure strategies of telecom customers. The purchase of DirecTV by AT&T has altered the historic AT&T product strategy for video
39
Table of Contents
Index to Financial Statements
deployments decreasing our sales. Verizon has announced the sale of certain properties to Frontier, coupled with a decrease in net subscriber additions has impacted the demand for our products. Nevertheless, as described below, we still believe that the need for network expansion to meet customer demand presents potential opportunities for increased sales of our products to these customers.
Foreign Exchange Fluctuations Have and May Continue to Impact Demand — The majority of our international sales are denominated in U.S. dollars. As a result of the recent strengthening of the U.S. dollar, our international customers have and may continue to experience greater costs in converting their local currencies to US dollars to purchase our products. These customers may delay or reduce future purchases from us, and we may experience pricing pressures in order to maintain or increase our market share with these international customers, and we may face longer payment cycles.
Impacts of regulatory changes — The FCC has recently adopted new “net neutrality” regulations that, among other things, subject Internet service providers to common carriage regulation under Title II of the Communications Act. These regulations have been appealed in federal court. In February 2016, the FCC proposed new rules intended to impose new technology mandates on multichannel video programming distributors (“MVPDs”) that would include many of our customers aimed at enabling retail video devices to access MVPD services without the need for an operator-supplied set-top box. If implemented, such mandates could result in our customers reducing their investment in their networks and in the development and deployment of new set-top boxes and/or increase the number of companies that we compete with.
Competition from Non-Cable and Telecom Service Providers — OTT TV continues to gain traction with consumers through providers like Netflix and Hulu. This is driving two key service provider trends: 1.) new demand for higher bandwidth, and 2.) increasing pressure to integrate OTT into traditional TV services. Both of these trends support ARRIS’s business, which provides both the infrastructure and CPE to deliver new hybridized services over IP.
Growth of Connected Device Ecosystem — Consumers’ growing appetite for connected devices creates an unprecedented opportunity to deliver consistent and engaging services over this Internet of Things. Service providers have an incumbent advantage in offering new forms of entertainment and communications, but still face many challenges in delivering new services across this complex system of devices. ARRIS is in position to drive this opportunity for providers as a result of our expertise in full-cycle service delivery — from the network to the cloud and the home. We provide the portfolio and professional services to navigate this new combination of device interfaces, communications protocols, device management standards, and security considerations.
Content Navigation and Personalization — As the library of available media continues to grow, consumers are having a harder time finding what they’re looking for, and service providers are facing new pressure to simplify the experience. ARRIS is collaborating with the world’s leading providers to solve these challenges through a combination of technology for content navigation and personalization. This technology can tailor content selection, search, and recommendations to consumers’ preferences, saving them time in deciding what to watch, and then personalizing that experience by delivering it whenever they want and on their device of choice. By making content navigation more proactive and personalized, ARRIS believes that providers can anticipate consumers’ needs and enable them to spend more time watching and less time scrolling through content.
Network Optimization and Scaling Infrastructure to Keep Up with Increasing Consumer Bandwidth Demand — As service providers prepare to deliver more advanced services to subscribers — such as 4K TV, IoT, gigabit Wi-Fi — they’re investing increasingly in their networks to anticipate the reciprocal need for more bandwidth. Providers are looking to ARRIS for its leadership in technologies like DOCSIS, CCAP, and Remote PHY to scale to these multi-gigabit services and ARRIS continues to invest in R&D to keep its customers’ networks ahead of market demand for these services.
Competition Increasing between Cable Operators, Telecom Companies, and New Entrants — The lines between telecom and cable providers has blurred as each has embraced the triple play. Moreover, new market participants, like Google, have entered the market with competing products, such as fiber-to-the-home services. This competition emphasizes the enabling technologies behind each approach — including DOCSIS, fiber,
40
Table of Contents
Index to Financial Statements
G.Fast, and others — and the increasing investment in the network infrastructure and CPE required to deliver these services. ARRIS’s leadership across these solutions positions us to capitalize on the growing competition between all three stakeholders.
Service Providers are Demanding Advanced Network Technologies and Software Solutions. The increase in volume and complexity of the signals transmitted over broadband networks as a result of the migration to an all-digital, all-IP, on demand network is causing service providers to deploy new technologies. Service providers also are demanding sophisticated network and service management software applications that minimize operating expenditures needed to support the complexity of two-way broadband communications systems. As a result, service providers are focusing on technologies and products that are flexible, cost-effective, compliant with open industry standards, and scalable to meet subscriber growth and effectively deliver reliable, enhanced services. As part of this evolution, some operators (for example Comcast with its Reference Design Kit (“RDK”) efforts) are choosing to design portions of the set-tops firmware internally. As a result we anticipate that over time operators will migrate to an all IP network and look to enable new platforms and technologies intended to accelerate the deployment of new services. As this occurs, which we believe will be over a multi-year period, we anticipate a decline in demand for our traditional set-tops and an increase in demand in new IP set-tops.
Consolidation of Vendors Has Occurred and May Continue — Our industry has seen, and is expected to continue to see, significant consolidation. The specific impact of the above trend is difficult to predict and quantify, but in general we believe:
| • | Vendor consolidation gives competitors greater scale for R&D, sales and marketing, and manufacturing, all of which potentially allow them to more effectively meet customer expectations and lower their product costs. |
| • | At the same time, vendor consolidation may make customers uncomfortable with the share of spend going to the new, larger entity which may create opportunities for ARRIS to become an alternate supplier. |
Results of Operations
Overview
As highlighted above, we have faced, and in the future will face, significant changes in our industry and business. These changes have impacted our results of operations and are expected to do so in the future. As a result, we have implemented strategies both in anticipation and in reaction to the impact of these dynamics.
41
Table of Contents
Index to Financial Statements
Below is a table that shows our key operating data as a percentage of sales. Following the table is a detailed description of the major factors impacting the year-over-year changes of the key lines of our results of operations.
| Years Ended December 31, | ||||||||||||
| 2015 | 2014 | 2013 | ||||||||||
| Net sales |
100.0 | % | 100.0 | % | 100.0 | % | ||||||
| Cost of sales |
70.4 | 70.3 | 71.8 | |||||||||
|
|
|
|
|
|
|
|||||||
| Gross margin |
29.6 | 29.7 | 28.2 | |||||||||
| Operating expenses: |
||||||||||||
| Selling, general, and administrative expenses |
8.7 | 7.7 | 9.3 | |||||||||
| Research and development expenses |
11.1 | 10.5 | 11.8 | |||||||||
| Amortization of intangible assets |
4.8 | 4.4 | 5.3 | |||||||||
| Integration, acquisition, restructuring and other costs |
0.6 | 0.7 | 2.3 | |||||||||
|
|
|
|
|
|
|
|||||||
| Operating income (loss) |
4.4 | 6.4 | (0.5 | ) | ||||||||
| Other expense (income): |
||||||||||||
| Interest expense |
1.5 | 1.2 | 1.9 | |||||||||
| Loss on investments |
0.1 | 0.2 | 0.1 | |||||||||
| Loss (gain) on foreign currency |
0.5 | 0.1 | (0.1 | ) | ||||||||
| Interest income |
(0.1 | ) | (0.1 | ) | (0.1 | ) | ||||||
| Other expense, net |
0.2 | 0.5 | 0.4 | |||||||||
|
|
|
|
|
|
|
|||||||
| Income (loss) before income taxes |
2.2 | 4.5 | (2.7 | ) | ||||||||
| Income tax expense (benefit) |
0.5 | (1.6 | ) | (1.3 | ) | |||||||
|
|
|
|
|
|
|
|||||||
| Consolidated net income (loss) |
1.7 | % | 6.1 | % | (1.4 | )% | ||||||
| Net loss attributable to noncontrolling interest |
(0.2 | ) | — | — | ||||||||
|
|
|
|
|
|
|
|||||||
| Net income (loss) attributable to ARRIS Group, Inc. |
1.9 | % | 6.1 | % | (1.4 | )% | ||||||
|
|
|
|
|
|
|
|||||||
Comparison of Operations for the Three Years Ended December 31, 2015
Net Sales
The table below sets forth our net sales for the three years ended December 31, 2015, 2014 and 2013 for each of our business segments described in Item 1 of this Form 10-K (in thousands, except percentages):
| Net Sales | Increase (Decrease) Between Periods | |||||||||||||||||||||||||||
| For the Years Ended December 31, | 2015 vs. 2014 | 2014 vs. 2013 | ||||||||||||||||||||||||||
| 2015 | 2014 | 2013 | $ | % | $ | % | ||||||||||||||||||||||
| Business Segment: |
||||||||||||||||||||||||||||
| CPE |
$ | 3,136,585 | $ | 3,690,454 | $ | 2,448,381 | $ | (553,869 | ) | (15.0 | )% | $ | 1,242,073 | 50.7 | % | |||||||||||||
| N&C |
1,661,594 | 1,637,544 | 1,193,001 | 24,050 | 1.5 | % | 444,543 | 37.3 | % | |||||||||||||||||||
| Other |
153 | (5,077 | ) | (20,480 | ) | 5,230 | 103.0 | % | 15,403 | 75.2 | % | |||||||||||||||||
|
|
|
|
|
|
|
|
|
|
|
|||||||||||||||||||
| Total sales |
$ | 4,798,332 | $ | 5,322,921 | $ | 3,620,902 | $ | (524,589 | ) | (9.9 | )% | $ | 1,702,019 | 47.0 | % | |||||||||||||
|
|
|
|
|
|
|
|
|
|
|
|||||||||||||||||||
42
Table of Contents
Index to Financial Statements
The table below sets forth our domestic and international sales for the three years ended December 31, 2015, 2014 and 2013 (in thousands, except percentages):
| Net Sales | Increase (Decrease) Between Periods | |||||||||||||||||||||||||||
| For the Years Ended December 31, | 2015 vs. 2014 | 2014 vs. 2013 | ||||||||||||||||||||||||||
| 2015 | 2014 | 2013 | $ | % | $ | % | ||||||||||||||||||||||
| Domestic |
$ | 3,418,583 | $ | 3,957,203 | $ | 2,457,172 | $ | (538,620 | ) | (13.6 | )% | $ | 1,500,031 | 61.0 | % | |||||||||||||
| International: |
||||||||||||||||||||||||||||
| Americas, excluding U.S |
880,581 | 900,822 | 746,146 | (20,241 | ) | (2.2 | )% | 154,676 | 20.7 | % | ||||||||||||||||||
| Asia Pacific |
142,893 | 147,921 | 153,674 | (5,028 | ) | (3.4 | )% | (5,753 | ) | (3.7 | )% | |||||||||||||||||
| EMEA |
356,275 | 316,975 | 263,910 | 39,300 | 12.4 | % | 53,065 | 20.1 | % | |||||||||||||||||||
|
|
|
|
|
|
|
|
|
|
|
|||||||||||||||||||
| Total international |
1,379,749 | 1,365,718 | 1,163,730 | 14,031 | 1.0 | % | 201,988 | 17.4 | % | |||||||||||||||||||
|
|
|
|
|
|
|
|
|
|
|
|||||||||||||||||||
| Total sales |
$ | 4,798,332 | $ | 5,322,921 | $ | 3,620,902 | $ | (524,589 | ) | (9.9 | )% | $ | 1,702,019 | 47.0 | % | |||||||||||||
|
|
|
|
|
|
|
|
|
|
|
|||||||||||||||||||
Customer Premises Equipment Net Sales 2015 vs. 2014
During the year ended December 31, 2015, sales of our CPE segment decreased by approximately $553.9 million, or 15.0%, as compared to 2014. CPE sales declined primarily as a result of lower video CPE product sales compared to the prior year. The decline was driven by sales of new product introductions and platform transitions implemented by certain customers during 2014 which did not recur, as well as telco customer subscriber growth challenges in 2015 as several of these customers look to reevaluate or change their video strategy. This was partially offset by growth in sales of broadband CPE products.
Network & Cloud Net Sales 2015 vs. 2014
During the year ended December 31, 2015, sales in the N&C segment increased by approximately $24.1 million, or 1.5%, as compared to 2014. Net sales of professional services increased $40.3 million compared to the prior year. The increase year over year was a result of the growing pipeline of professional services projects during 2015. Net sales of Cloud increased $11.7 million compared to 2014, primarily due to the addition of ActiveVideo in 2015. Net sales of infrastructure equipment decreased $27.9 million compared to the prior year. The decrease reflects higher shipments in the second half of 2014 resulting from the launch of the E6000 CCAP platform, offset by increases in distribution and transmission equipment sales.
Customer Premises Equipment Net Sales 2014 vs. 2013
During the year ended December 31, 2014, sales of our CPE segment increased by approximately $1,242.1 million, or 50.7%, as compared to 2013. The increase was attributable to the inclusion of sales associated with our acquisition of Motorola Home as well as the introduction of new products, in particular the XG1 and Verizon Media Server (VMS) video gateways. The sales increase was also driven by strong cable and telco set-tops and broadband device demand.
Network & Cloud Net Sales 2014 vs. 2013
During the year ended December 31, 2014, sales in the N&C segment increased by approximately $444.5 million, or 37.3%, as compared to 2013. The increase in sales was primarily the result of the inclusion of sales associated with our acquisition of Motorola Home as well as strong sales across most product lines, led by our new CMTS platform, the E6000 CCAP and video solutions.
43
Table of Contents
Index to Financial Statements
Gross Margin
The table below sets forth our gross margin for the three years ended December 31, 2015, 2014 and 2013 (in thousands, except percentages):
| Gross Margin | Increase (Decrease) Between Periods | |||||||||||||||||||||||||||
| For the Years Ended December 31, | 2015 vs. 2014 | 2014 vs. 2013 | ||||||||||||||||||||||||||
| 2015 | 2014 | 2013 | $ | % | $ | % | ||||||||||||||||||||||
| Gross margin dollars |
$ | 1,418,923 | $ | 1,582,496 | $ | 1,022,748 | (163,573 | ) | (10.3 | )% | 559,748 | 54.7 | % | |||||||||||||||
| Gross margin |
29.6 | % | 29.7 | % | 28.2 | % | (0.1 | ) | 1.5 | |||||||||||||||||||
During the year ended December 31, 2015, gross margin dollars decreased as compared to the same period in 2014 primarily as a result of lower sales.
During the year ended December 31, 2014, gross margin dollars and gross margin percentage increased as compared to 2013. The increase in gross margin dollars was primarily the result of the inclusion of sales associated with our acquisition of Motorola Home. In addition, the gross margin for the year ended December 31, 2013 included a $53.8 million impact associated with writing up the historic cost of the Motorola Home inventory to fair value at the date of acquisition (subsequently increasing cost of goods sold) as well as $16.5 million of costs associated with the rationalization of certain products after the acquisition date.
Operating Expenses
The table below provides detail regarding our operating expenses (in thousands, except percentages):
| Operating Expenses | Increase (Decrease) Between Periods | |||||||||||||||||||||||||||
| For the Years Ended December 31, | 2015 vs. 2014 | 2014 vs. 2013 | ||||||||||||||||||||||||||
| 2015 | 2014 | 2013 | $ | % | $ | % | ||||||||||||||||||||||
| Selling, general & administrative |
$ | 417,085 | $ | 410,568 | $ | 338,252 | $ | 6,517 | 1.6 | % | $ | 72,316 | 21.4 | % | ||||||||||||||
| Research & development |
534,168 | 556,575 | 425,825 | (22,407 | ) | (4.0 | )% | 130,750 | 30.7 | % | ||||||||||||||||||
| Amortization of intangible assets |
227,440 | 236,521 | 193,637 | (9,081 | ) | (3.8 | )% | 42,884 | 21.1 | % | ||||||||||||||||||
| Integration, acquisition, restructuring & other |
29,277 | 37,498 | 83,047 | (8,221 | ) | (21.9 | )% | (45,549 | ) | (54.8 | )% | |||||||||||||||||
|
|
|
|
|
|
|
|
|
|
|
|||||||||||||||||||
| Total |
$ | 1,207,970 | $ | 1,241,162 | $ | 1,040,761 | $ | (33,192 | ) | (2.7 | )% | $ | 200,401 | 19.3 | % | |||||||||||||
|
|
|
|
|
|
|
|
|
|
|
|||||||||||||||||||
Selling, General, and Administrative, or SG&A, Expenses
Our selling, general and administrative expenses include sales and marketing costs, including personnel expenses for sales and marketing staff expenses, advertising, trade shows, corporate communications, product marketing expenses and other marketing expenses. In addition, general and administrative expenses consist of personnel expenses and other general corporate expenses for corporate executives, finance and accounting, human resources, facilities, information technology, legal and professional fees.
2015 vs. 2014
SG&A expenses increased for the year ended December 31, 2015 compared to the prior year. The increase was primarily due to $8.5 million of incremental expense associated with the ActiveVideo acquisition, $6.2 million increase in sales and marketing expenses and $8.3 million increase in general and administrative expenses, offset by lower variable and other compensation expense of approximately $16.5 million.
44
Table of Contents
Index to Financial Statements
2014 vs. 2013
The year-over-year increase in SG&A expenses primarily reflect the inclusion of expenses associated with the Motorola Home acquisition, as well as higher variable compensation costs and bad debt expense. The increase was partially offset as a result of certain information technology and other costs, formerly allocated to SG&A, which have been reclassified effective January 1, 2014 to cost of sales and research and development as a result of the way we review the business.
Research & Development, or R&D, Expenses
Research and development expenses consist primarily of personnel expenses, payments to suppliers for design services, product certification expenditures to qualify our products for sale into specific markets, prototypes, other consulting fees and reasonable allocations of our information technology and corporate facility costs. Research and development expenses are recognized as they are incurred.
2015 vs. 2014
The decrease year-over-year in R&D expense reflects lower variable and other compensation expense of approximately $17.2 million, $5.3 million reduction in consulting fees, project related expenses and IT expenses, lower depreciation expense of $7.9 million which were partially offset by $7.0 million of incremental expense associated with the ActiveVideo acquisition.
2014 vs. 2013
The increase year-over-year in R&D expense reflects the inclusion of expenses associated with the Motorola Home acquisition, as well as higher variable compensation costs and allocations of information technology and other costs.
Amortization of Intangible Assets
Our intangible amortization expense relates to finite-lived intangible assets primarily acquired in business combinations. Intangibles amortization expense was $227.4 million in 2015, as compared with $236.5 and $193.6 million in 2014 and 2013, respectively.
As a result of the Pace acquisition in 2016, we anticipate higher amortization of intangibles expense in future periods.
Integration, Acquisition, Restructuring and Other Costs
During 2015, we recorded acquisition related expenses and integration expenses of $28.2 million. The expenses in 2015 were primarily related to the acquisition of Pace completed in 2016 and the ActiveVideo acquisition, and are expected to increase in 2016 as we work to integrate the Pace acquisition.
During 2014, we recorded acquisition related expenses and integration expenses of $34.1 million. These expenses primarily related to the acquisition of Motorola Home and consisted of integration related outside services and legal fees. The Company has substantially completed its integration of the Motorola Home business in 2014.
During 2013, we recorded acquisition related expenses and integration expenses of $18.6 million and $26.9 million, respectively. These expenses related to the acquisition of Motorola Home and consisted of transaction costs, integration related outside services and legal fees.
During 2015, 2014 and 2013, we recorded restructuring charges of $1.0 million, $3.4 million and $37.6 million, respectively. The charges in 2015 were related to severance and employee termination benefits. The charge recorded in 2014 related to rationalization of facilities resulting in costs related to severance and employee termination benefits and the charges in 2013 were related to severance, employee termination benefits and facilities. We anticipate that we will incur additional restructuring costs in 2016 as a result of the recent acquisition of Pace.
45
Table of Contents
Index to Financial Statements
Direct Contribution
The table below sets forth our direct contribution, which is defined as gross margin less direct operating expenses, for the three years ended December 31, 2015, 2014 and 2013 (in thousands, except percentages):
| Direct Contribution | Increase (Decrease) Between Periods | |||||||||||||||||||||||||||
| For the Years Ended December 31, | 2015 vs. 2014 | 2014 vs. 2013 | ||||||||||||||||||||||||||
| 2015 | 2014 | 2013 | $ | % | $ | % | ||||||||||||||||||||||
| Segment: |
||||||||||||||||||||||||||||
| CPE |
$ | 548,840 | $ | 791,244 | $ | 509,473 | $ | (242,404 | ) | (30.6 | )% | $ | 281,771 | 55.3 | % | |||||||||||||
| N&C |
487,166 | 430,943 | 264,589 | 56,223 | 13.0 | % | 166,354 | 62.9 | % | |||||||||||||||||||
|
|
|
|
|
|
|
|
|
|
|
|||||||||||||||||||
| Total |
$ | 1,036,006 | $ | 1,222,187 | $ | 774,062 | $ | (186,181 | ) | (15.2 | )% | $ | 448,125 | 57.9 | % | |||||||||||||
|
|
|
|
|
|
|
|
|
|
|
|||||||||||||||||||
Customer Premises Equipment Direct Contribution 2015 vs. 2014
During 2015, direct contribution in our CPE segment decreased by approximately 30.6% as compared to the same period in 2014. The decrease was primarily attributable to lower sales as noted above.
Network & Cloud Direct Contribution 2015 vs. 2014
During 2015, direct contribution in our N&C segment increased by approximately 13.0% as compared to the same period in 2014. The increase was primarily attributable to sales of higher margin infrastructure products.
Customer Premises Equipment Direct Contribution 2014 vs. 2013
During 2014, direct contribution in our CPE segment increased by approximately 55.3% as compared to the same period in 2013. The increase was primarily attributable to the inclusion of direct contribution associated with our acquisition of Motorola Home. Further, the direct contribution is favorably impacted by mix, given, that in the aggregate the contribution margin of former Motorola Home products are greater than that of former ARRIS products.
Network & Cloud Direct Contribution 2014 vs. 2013
During 2014, direct contribution in our N&C segment increased by approximately 62.9% as compared to the same period in 2013. The increase was primarily attributable to the inclusion of direct contribution associated with our acquisition of Motorola Home and the success of our E6000 CMTS platform.
Corporate and Unallocated Costs
There are expenses that are not included in the measure of segment direct contribution and as such are reported as “Corporate and Unallocated Costs” and are included in the reconciliation to income (loss) before income taxes. The “Corporate and Unallocated Costs” category of expenses include corporate sales and marketing, home office general and administrative expenses, annual bonus and equity compensation.
For the three years ended December 31, 2015, 2014 and 2013, the composition of our corporate and unallocated costs that are reflected in the consolidated statement of operations were as follows (in thousands, except percentages):
| Direct Contribution | Increase (Decrease) Between Periods | |||||||||||||||||||||||||||
| For the Years Ended December 31, | 2015 vs. 2014 | 2014 vs. 2013 | ||||||||||||||||||||||||||
| 2015 | 2014 | 2013 | $ | % | $ | % | ||||||||||||||||||||||
| Cost of sales |
$ | 56,311 | $ | 69,973 | $ | 122,460 | $ | (13,662 | ) | (19.5 | )% | $ | (52,487 | ) | (42.9 | )% | ||||||||||||
| Selling, general & administrative expense |
349,993 | 349,693 | 278,921 | 300 | 0.1 | % | 70,772 | 25.4 | % | |||||||||||||||||||
| Research & development expenses |
162,032 | 187,168 | 114,010 | (25,136 | ) | (13.4 | )% | 73,158 | 64.2 | % | ||||||||||||||||||
|
|
|
|
|
|
|
|
|
|
|
|||||||||||||||||||
| Total |
$ | 568,336 | $ | 606,834 | $ | 515,391 | $ | (38,498 | ) | (6.3 | )% | $ | 91,443 | 17.7 | % | |||||||||||||
|
|
|
|
|
|
|
|
|
|
|
|||||||||||||||||||
46
Table of Contents
Index to Financial Statements
During 2015, corporate and unallocated costs decreased compared to in 2014. The decrease was primarily due to lower variable compensation costs.
During 2014, corporate and unallocated costs increased compared to 2013. The increase was primarily due to the inclusion of expenses associated with our acquisition of Motorola Home.
Other Expense
The table below provides detail regarding our other expense (in thousands):
| Other Expense (Income) | Increase (Decrease) Between Periods | |||||||||||||||||||||||||||
| For the Years Ended December 31, | 2015 vs. 2014 | 2014 vs. 2013 | ||||||||||||||||||||||||||
| 2015 | 2014 | 2013 | $ | % | $ | % | ||||||||||||||||||||||
| Interest expense |
$ | 70,936 | $ | 62,901 | $ | 67,888 | $ | 8,035 | 12.8 | % | $ | (4,987 | ) | (7.3 | )% | |||||||||||||
| Loss on investments |
6,220 | 10,961 | 2,698 | (4,741 | ) | (43.3 | )% | 8,263 | 306.3 | % | ||||||||||||||||||
| Loss (gain) on foreign currency |
20,761 | 2,637 | (3,502 | ) | 18,124 | 687.3 | % | 6,139 | 175.3 | % | ||||||||||||||||||
| Interest income |
(2,379 | ) | (2,590 | ) | (2,936 | ) | 211 | 8.1 | % | 346 | 11.8 | % | ||||||||||||||||
| Other expense |
8,362 | 28,195 | 13,989 | (19,833 | ) | (70.3 | )% | 14,206 | 101.6 | % | ||||||||||||||||||
|
|
|
|
|
|
|
|
|
|
|
|||||||||||||||||||
| Total other expense |
$ | 103,900 | $ | 102,104 | $ | 78,137 | $ | 1,796 | 1.8 | % | $ | 23,967 | 30.7 | % | ||||||||||||||
|
|
|
|
|
|
|
|
|
|
|
|||||||||||||||||||
Interest Expense
Interest expense reflects the amortization of debt issuance costs (deferred finance fees and debt discounts) related to our term loans, the non-cash interest component of our convertible subordinated notes which were fully redeemed during the fourth quarter of 2013, and interest expense paid on the notes, term loans and other debt obligations.
Interest expense was $70.9 million in 2015, as compared with $62.9 million and $67.9 million in 2014 and 2013, respectively.
During 2015, in connection with amending our credit agreement, as described in more detail below, we expensed approximately $13.0 million of debt issuance costs and wrote off approximately $2.1 million of existing debt issuance costs associated with certain lenders who were not party to the amended Term Loan A Facility and Revolving Credit Facility, which were included as interest expense in the Consolidated Statements of Operations for the year ended December 31, 2015. Upon the closing of the Pace acquisition in 2016, we incurred an additional $2.3 million of debt issuance costs which will be capitalized and amortized over the term of the loan.
During 2014, optional debt pre-payments were made resulting in the accelerated write-off of deferred financing fees and debt discount of $2.7 million.
Loss on Investments
From time to time, we hold certain investments in the common stock of private and publicly-traded companies, a number of non-marketable equity securities, and investments in rabbi trusts associated with our deferred compensation plans. In addition, we have certain investments in limited liability companies and partnerships that are accounted for using the equity method of accounting. As such our equity portion in current earnings of such companies is included in the loss (gain) on investments.
During the years ended December 31, 2015, 2014 and 2013, we recorded net losses on investment related to these investments of $6.2 million, $11.0 million and $2.7 million, respectively, including impairment charges.
The Company performed an evaluation of its investments and concluded that indicators of impairment existed for certain investments, and that their fair value had declined. This resulted in other-than-temporary impairment charge of $7.0 million during the year ended December 31, 2014. No impairment charges were recorded in 2015 and 2013.
Loss (Gain) on Foreign Currency
During the years ended December 31, 2015, 2014 and 2013, we recorded net losses (gains) on foreign currency of $20.8 million, $2.6 million and $(3.5) million, respectively. We have US dollar functional currency enti-
47
Table of Contents
Index to Financial Statements
ties that bill certain international customers in their local currency and foreign functional currency entities that procure in U.S. dollars. We also have certain predictable expenditures for international operations in local currency. Additionally, certain intercompany transactions are denominated in foreign currencies and subject to re-measurement. To mitigate the volatility related to fluctuations in the foreign exchange rates, we have entered into various foreign currency contracts. The gain or loss on foreign currency is driven by the fluctuations in the foreign currency exchange rates.
As part of the Pace acquisition completed in 2016, we paid the former Pace shareholders 132.5 pence per share in cash consideration, which was approximately 434.3 million British pounds, in the aggregate, as of January 4, 2016. We have entered into foreign currency forward contracts to purchase British pounds and sell U.S. Dollars in order to mitigate the volatility related to fluctuations in the foreign exchange rate prior to the closing period. As of December 31, 2015, we had forward contracts with notional amounts totaling 385 million British pounds which mature on March 31, 2016. The contracts fixed the British pound to U.S. dollar forward exchange rate at various rates. During the year ended December 31, 2015, losses of $22.3 million were recorded related to the British pound forward contracts. These contracts were terminated upon the close of the Pace acquisition in January 2016.
Interest Income
Interest income reflects interest earned on cash, cash equivalents, and short-term and long-term marketable security investments. During the years ended December 31, 2015, 2014 and 2013, we recorded interest income of $2.4 million, $2.6 million and $2.9 million, respectively.
Other Expense
Other expense for the years ended December 31, 2015, 2014 and 2013 were $8.4 million, $28.2 million and $14.0 million, respectively.
In connection with our acquisition of Motorola Home, we obtained certain foreign tax credit benefits for which we were obligated to pay Google if and when utilized and for which we recorded a liability. During 2015, we recorded income of $3.7 million, as a result of a reduction of foreign tax credit attributes reducing the liability to Google previously recorded in 2014 from $20.5 million to $16.8 million. For the year ended December 31, 2015, we recorded a loss of $5.3 million from the sale of land and building associated with our San Diego campus facilities.
For the year ended December 31, 2014, we recorded a $2.1 million write-down in the carrying amount of land and building reclassified as held for sale as a result of obtaining a letter of intent for its sale and is included in other expense, net. In connection with Comcast’s agreement in January 2013 to invest in ARRIS upon the acquisition of Motorola Home, the agreed-upon purchase price was less than the market price on the date of agreement, requiring the forward arrangement be marked to market for the difference in fair value. As a result, we recorded a mark-to-market adjustment of $13.2 million in 2013 which was recorded as Other Expense.
Income Tax Expense (Benefit)
Our annual provision for income taxes and determination of the deferred tax assets and liabilities require management to assess uncertainties, make judgments regarding outcomes, and utilize estimates. To the extent the final outcome differs from initial assessments and estimates, future adjustments to our tax assets and liabilities will be necessary.
In 2015, we recorded $22.6 million of income tax expense for U.S. federal and state taxes and foreign taxes, which was 21.1% of our pre-tax income of $107.1 million. The Company’s effective income tax rate for 2015 was favorably impacted by $2.4 million for the following items. The tax benefit was due to the release of $27.3 million of valuation allowances primarily recorded for U.S. federal net operating losses arising from the acquisition of the Motorola Home business from Google. This benefit was offset unfavorably by $19.0 million for a gain recognized on the Taiwan entity, $4.9 million for increases in Subpart F income and $1.1 million for the recapture of losses upon conversion of ARRIS International Limited to a private limited company. Other favorable items were recorded for U.S Federal, U.S. State and non-U.S. return to provision items of $1.3 million and adjustments to uncertain tax positions of $8.6 million. Other items with an unfavorable impact on the tax rate
48
Table of Contents
Index to Financial Statements
include adjustments to foreign tax credits received from Google of $3.7 million, the effect of accelerating the vesting of equity compensation of $4.1 million and $2.2 million for the conversion of ActiveVideo to a partnership. In addition, $20.4 million of current tax benefit was recorded when the President signed legislation to approve the extension of the U.S. federal research and development tax credit permanently. Exclusive of these items, the effective income tax rate would have been approximately 22.6%.
In 2014, we recorded ($88.0) million of income tax benefit for U.S. federal and state taxes and foreign taxes, which was (36.8)% of our pre-tax income of $239.2 million. The Company’s effective income tax rate for 2014 was favorably impacted by $176.5 million for the following items. The tax benefit was primarily due to the release of valuation allowances recorded for U.S. federal net operating losses, U.S. federal tax credits and from deferred tax assets recorded for state net operating losses and state research and development tax credits arising from the acquisition of the Motorola Home business from Google. In addition, $18.1 million of current tax benefit was recorded when the President signed legislation to approve the extension of the U.S. federal research and development tax credit through December 31, 2014. To assess the Company’s ability to remove the valuation allowances recorded against certain deferred tax assets acquired in the Motorola Home acquisition, the Company was required to analyze the impact of the various tax rules which limit a Company’s ability to utilize net operating losses and tax credits. The Company was also required to assess tax planning strategies to best allow for the utilization of the tax attributes. During the fourth quarter of 2014, the Company completed the required tax analysis and received the final information from Google as to the amounts and types of acquired deferred tax assets. Exclusive of these items, the effective income tax rate would have been approximately 29.6%.
In 2013, we recorded $47.4 million of income tax benefit for U.S. federal and state taxes and foreign taxes, which was 49.3% of our pre-tax loss of $96.2 million. The effective income tax rate was favorably impacted by $15.4 million for the following items. The most significant 2013 items were the reversal of $6.7 million of tax liabilities from uncertain tax positions, mostly attributable to the expiration of certain statutes of limitations in the third and fourth quarters of 2013, and a favorable impact of $8.7 million from global provision-to-return adjustments, including the 2012 U.S. federal credit for research and development, which was not reenacted until first quarter of 2013. Additionally, the Company recorded a pre-tax book loss on an investment in ARRIS by Comcast of approximately $26.4 million and a pre-tax book loss of approximately $10.0 million on certain foreign entities from the Motorola Home acquisition, on which no tax benefit was recorded. Exclusive of these items, the effective income tax rate would have been approximately (17.9)%.
Non-GAAP Measures
As part of our ongoing review of financial information related to our business, we regularly use non-GAAP measures, in particular non-GAAP earnings, as we believe they provide a meaningful insight into our business and trends. We also believe that these non-GAAP measures provide readers of our financial statements with useful information and insight with respect to the results of our business. However, the presentation of non-GAAP information is not intended to be considered in isolation or as a substitute for results prepared in accordance with GAAP. Below are tables for the 2015, 2014 and 2013 which detail and reconcile GAAP and non-GAAP net sales and adjusted net income:
| Year 2015 | Year 2014 | Year 2013 | ||||||||||||||||
| Amount | Per Diluted Share |
Amount | Per Diluted Share |
Amount | Per Diluted Share | |||||||||||||
| Net Sales |
$ | 4,798,332 | $ | 5,322,921 | $ | 3,620,902 | ||||||||||||
| Highlighted items: |
||||||||||||||||||
| Acquisition accounting impacts of deferred revenue |
— | 5,091 | 7,121 | |||||||||||||||
| Reduction in revenue related to Comcast investment in ARRIS |
— | — | 13,182 | |||||||||||||||
|
|
|
|
|
|
|
|
|
| ||||||||||
| Net Sales excluding highlighted items |
$ | 4,798,332 | $ | 5,328,012 | $ | 3,641,205 | ||||||||||||
|
|
|
|
|
|
|
|
|
| ||||||||||
49
Table of Contents
Index to Financial Statements
| Year 2015 | Year 2014 | Year 2013 | ||||||||||||||||||||||
| Amount | Per Diluted Share |
Amount | Per Diluted Share |
Amount | Per Diluted Share |
|||||||||||||||||||
| Net income attributable to ARRIS Group, Inc |
$ | 92,181 | $ | 0.62 | $ | 327,211 | $ | 2.21 | $ | (48,760 | ) | $ | (0.37 | ) (1) | ||||||||||
| Highlighted items: |
||||||||||||||||||||||||
| Impacting gross margin: |
||||||||||||||||||||||||
| Stock compensation expense |
8,508 | 0.06 | 6,716 | 0.04 | 4,269 | 0.03 | ||||||||||||||||||
| Acquisition accounting impacts of deferred revenue |
— | — | 3,448 | 0.02 | 5,545 | 0.04 | ||||||||||||||||||
| Reduction in revenue related to Comcast investment in ARRIS Group, Inc |
— | — | — | — | 13,182 | 0.10 | ||||||||||||||||||
| Acquisition accounting impacts related to inventory |
— | — | — | — | 53,782 | 0.40 | ||||||||||||||||||
| Product rationalization |
— | — | — | — | 16,473 | 0.12 | ||||||||||||||||||
| Impacting operating expenses: |
||||||||||||||||||||||||
| Integration, acquisition, restructuring and other costs |
29,277 | 0.20 | 37,498 | 0.25 | 83,047 | 0.61 | ||||||||||||||||||
| Amortization of intangible assets |
227,440 | 1.52 | 236,521 | 1.60 | 193,637 | 1.44 | ||||||||||||||||||
| Stock compensation expense |
55,710 | 0.37 | 47,084 | 0.32 | 31,520 | 0.23 | ||||||||||||||||||
| Noncontrolling interest share of non-GAAP adjustments |
(2,947 | ) | (0.02 | ) | — | — | — | — | ||||||||||||||||
| Impacting other (income) / expense: |
||||||||||||||||||||||||
| Non-cash interest expense |
— | — | — | — | 9,926 | 0.08 | ||||||||||||||||||
| Mark to market FV adjustment related to Comcast investment in ARRIS Group, Inc |
— | — | — | — | 13,189 | 0.10 | ||||||||||||||||||
| Impairment on Investments |
(9 | ) | (0.00 | ) | 7,050 | 0.05 | — | — | ||||||||||||||||
| Debt amendment fees |
15,342 | 0.10 | — | — | — | — | ||||||||||||||||||
| Credit facility — ticking fees |
1,700 | 0.01 | — | — | 865 | 0.01 | ||||||||||||||||||
| Asset impairment |
— | — | 2,132 | 0.01 | — | — | ||||||||||||||||||
| Foreign exchange contract losses related to cash consideration of Pace acquisition |
22,283 | 0.15 | — | — | — | — | ||||||||||||||||||
| Liability/adjustment related to foreign tax credit benefits |
(3,669 | ) | (0.02 | ) | 20,492 | 0.14 | — | — | ||||||||||||||||
| Loss on sale of building |
5,142 | 0.03 | — | — | — | — | ||||||||||||||||||
| Impacting income tax expense: |
||||||||||||||||||||||||
| Net tax items |
(128,864 | ) | (0.86 | ) | (279,135 | ) | (1.88 | ) | (152,883 | ) | (1.13 | ) | ||||||||||||
|
|
|
|
|
|
|
|
|
|
|
|
|
|||||||||||||
| Total highlighted items |
229,913 | 1.54 | 81,806 | 0.55 | 272,552 | 2.03 | ||||||||||||||||||
|
|
|
|
|
|
|
|
|
|
|
|
|
|||||||||||||
| Net income excluding highlighted items |
$ | 322,094 | $ | 2.16 | $ | 409,017 | $ | 2.76 | $ | 223,792 | $ | 1.66 | ||||||||||||
|
|
|
|
|
|
|
|
|
|
|
|
|
|||||||||||||
| Weighted average common shares — basic |
146,388 | 144,386 | 131,980 | |||||||||||||||||||||
|
|
|
|
|
|
|
|||||||||||||||||||
| Weighted average common shares — diluted |
149,359 | 148,280 | 135,136 | |||||||||||||||||||||
|
|
|
|
|
|
|
|||||||||||||||||||
| (1) | Basic shares used as losses were reported for the period and the inclusion of dilutive shares would be anti-dilutive. |
50
Table of Contents
Index to Financial Statements
In managing and reviewing our business performance, we exclude a number of items generally required to be reported under GAAP. Management believes that excluding these items is useful in understanding the trends and managing our operations. We provide these supplemental non-GAAP measures in order to assist the investment community to see ARRIS through the “eyes of management,” and therefore enhance understanding of ARRIS’s operating performance. Non-GAAP financial measures should be viewed in addition to, and not as an alternative to, the Company’s reported results prepared in accordance with GAAP. Our non-GAAP financial measures reflect adjustments based on the following items, as well as the related income tax effects:
Stock-Based Compensation Expense: We have excluded the effect of stock-based compensation expenses in calculating our non-GAAP operating expenses and net income (loss) measures. Although stock-based compensation is a key incentive offered to our employees, we continue to evaluate our business performance excluding stock-based compensation expenses. We record non-cash compensation expense related to grants of restricted stock units. Depending upon the size, timing and the terms of the grants, the non-cash compensation expense may vary significantly but will recur in future periods.
Acquisition Accounting Impacts Related to Deferred Revenue: In connection with the accounting related to our acquisitions, business combination rules require us to account for the fair values of deferred revenue arrangements for which acceptance has not been obtained, and post contract support in our purchase accounting. The non-GAAP adjustment to our sales and cost of sales is intended to include the full amounts of such revenues as if these purchase accounting adjustments had not been applied. We believe the adjustment to these revenues is useful as a measure of the ongoing performance of our business. We historically have experienced high renewal rates related to our support agreements, and our objective is to increase the renewal rates on acquired post contract support agreements. However, we cannot be certain that our customers will renew their contracts.
Reduction in Revenue Related to Comcast Investment in ARRIS: In connection with our acquisition of Motorola Home, Comcast was given an opportunity to invest in ARRIS. The accounting guidance required that we record the implied fair value of benefit received by Comcast from that investment as a reduction in revenue. Until the closing of the deal, changes in the value of the investment were marked to market and flowed through other expense (income). We have excluded the effect of the implied fair value in calculating our non-GAAP financial measures. We believe it is useful to understand the effects of these items on our total revenues and other expense (income).
Acquisition Accounting Impacts Related to Inventory Valuation: In connection with our acquisition of Motorola Home, business combinations rules required the inventory be recorded at fair value on the opening balance sheet. This is different from historical cost. Essentially we were required to write the inventory up to end customer price less a reasonable margin as a distributor. This resulted in an increase in the value of inventory and resulted in higher cost of goods sold as it was sold.
Product Rationalization: In conjunction with the integration of Motorola Home, we identified certain product lines that overlap. In the second quarter of 2013, we decided to eliminate certain products. As a result, we recorded expenses related to the elimination of inventory and certain vendor liabilities. We believe it is useful to understand the effects of this item on our total cost of goods sold.
Integration, Acquisition, Restructuring and Other Costs: We have excluded the effect of acquisition, integration, and other expenses and the effect of restructuring expenses in calculating our non-GAAP operating expenses and net income measures. We incurred expenses in connection with the acquisition of ActiveVideo, the Motorola Home acquisition, and the Pace acquisition, which we generally would not otherwise incur in the periods presented as part of our continuing operations. Acquisition and integration expenses consist of transaction costs, costs for transitional employees, other acquired employee related costs, and integration related outside services. Restructuring expenses consist of employee severance, abandoned facilities, product line disposition and other exit costs. We believe it is useful to understand the effects of these items on our total operating expenses.
Amortization of Intangible Assets: We have excluded the effect of amortization of intangible assets in calculating our non-GAAP operating expenses and net income (loss) measures. Amortization of intangible assets is non-cash, and is inconsistent in amount and frequency and is significantly affected by the timing and size of
51
Table of Contents
Index to Financial Statements
our acquisitions. Investors should note that the use of intangible assets contributed to our revenues earned during the periods presented and will contribute to our future period revenues as well. Amortization of intangible assets will recur in future periods.
Noncontrolling Interest share of Non-GAAP Adjustments: The joint venture formed with Charter for the ActiveVideo acquisition is accounted for by ARRIS under the consolidation method. As a result, the consolidated statements of operations include the revenues, expenses, and gains and losses of the noncontrolling interest. The amount of net income (loss) related to the noncontrolling interest are reported and presented separately in the consolidated statement of operations. We have excluded the noncontrolling share of any non GAAP adjusted measures recorded by the venture, as we believe it is useful to understand the effect of excluding this item when evaluating our ongoing performance.
Non-Cash Interest on Convertible Debt: We have excluded the effect of non-cash interest in calculating our non-GAAP operating expenses and net income (loss) measures. We record the accretion of the debt discount related to the equity component non-cash interest expense. We believe it is useful to understand the component of interest expense that will not be paid out in cash.
Mark To Market Fair Value Adjustment Related To Comcast Investment in ARRIS: In connection with our acquisition of Motorola Home, Comcast was given an opportunity to invest in ARRIS. The accounting guidance required us to mark to market the changes in the value of the investment and reflected that amount in other expense (income). We have excluded the effect of the implied fair value in calculating our non-GAAP financial measures. We believe it is useful to understand the effects of these items on our total other expense (income).
Impairment of Investment: We have excluded the effect of other-than-temporary impairments of a cost method investment in calculating our non-GAAP financial measures. We believe it is useful to understand the effect of this non-cash item in our other expense (income).
Debt Amendment Fees: In the second quarter of 2015, the Company amended its credit agreement. See “Financial Liquidity and Capital Resources”. Certain fees related to the debt modification have already been paid, and other fees related to the new Term Loan A-1 facility will be paid upon funding. We believe it is useful to understand the effect of this on our other expense (income).
Credit Facility — Ticking Fees: In connection with the acquisition of Pace and Motorola Home, the cash portion of the consideration was funded through debt financing commitments. A “ticking fee” is a fee paid to our banks to compensate for the time lag between the commitment allocation on a loan and the actual funding. We have excluded the effect of the ticking fee in calculating our non-GAAP financial measures. We believe it is useful to understand the effect of this item in our other expense (income).
Asset Impairment: In the second quarter of 2014, we entered into a contract to facilitate the sale of a building at less than its carrying amount. The asset was reclassified as held for sale and was measured at fair value less cost to sell. We have recorded an impairment charge to reduce the assets carrying amount to its estimated fair value less costs to sell in the period the held for sale criteria were met. We have excluded the effect of the asset held for sale impairment in calculating our non-GAAP financial measures. We believe it is useful to understand the effect of this non-cash item in our other expense (income).
Foreign Exchange Contract (Gains) Losses Related to Cash Consideration of Pace Acquisition: In the second quarter of 2015, the Company announced its intent to acquire Pace in exchange for stock and cash. We subsequently entered into foreign exchange forward contracts in order to hedge the foreign currency risk associated with the cash consideration of the Pace acquisition. These foreign exchange forward contracts were not designated as hedges, and accordingly, all changes in the fair value of these instruments are recognized as a loss (gain) on foreign currency in the Consolidated Statements of Operations. We believe it is useful to understand the effect of this on our other expense (income).
Liability/Adjustment Related to Foreign Tax Credit Benefits: In connection with our acquisition of Motorola Home, we obtained certain foreign tax credit benefits for which we recorded a liability to Google that we pay if and when the benefits are utilized resulting from certain provisions in the acquisition agreement. The expense and subsequent adjustments related to this liability has been recorded as part of other expense (income).
52
Table of Contents
Index to Financial Statements
We have excluded the effect of the expense in the calculation of our non-GAAP financial measures. We believe it is useful to understand the effects of this item on our total other expense (income).
Loss on Sale of Building: In the first quarter of 2015, the Company sold land and a building that qualified for sale-leaseback accounting and was classified as an operating lease. A loss has been recorded on the sale. We have excluded the effect of the loss on sale of property in calculating our non-GAAP financial measures. We believe it is useful to understand the effect of excluding this item when evaluating our ongoing performance.
Net Tax Items: We have excluded the tax effect of the non-GAAP items mentioned above. Additionally, we have excluded the effects of certain tax adjustments related to state valuation allowances, research and development tax credits and provision to return differences.
Financial Liquidity and Capital Resources
Overview
One of our key strategies remains maintaining and improving our capital structure. The key metrics we focus on are summarized in the table below:
Liquidity & Capital Resources Data
| Year Ended December 31, | ||||||||||||
| 2015 | 2014 | 2013 | ||||||||||
| (in thousands, except DSO and Turns) | ||||||||||||
| Key Working Capital Items |
||||||||||||
| Cash provided by operating activities |
$ | 343,872 | $ | 459,281 | $ | 562,716 | ||||||
| Cash, cash equivalents, and short-term investments |
$ | 879,052 | $ | 692,538 | $ | 509,798 | ||||||
| Long-term U.S corporate bonds |
$ | — | $ | 4,867 | $ | 3,577 | ||||||
| Accounts Receivable, net |
$ | 651,893 | $ | 598,603 | $ | 619,571 | ||||||
| -Days Sales Outstanding |
48 | 42 | 54 | |||||||||
| Inventory, net |
$ | 401,592 | $ | 401,165 | $ | 330,129 | ||||||
| -Turns |
8.4 | 10.2 | 10.1 | |||||||||
| Key Financing Items |
||||||||||||
| Term loans at face value |
$ | 1,509,063 | $ | 1,547,563 | $ | 1,752,563 | ||||||
| Cash used for redemption of convertible notes |
$ | — | $ | — | $ | 232,050 | ||||||
| Cash used for debt repayment |
$ | 53,500 | $ | 209,653 | $ | 172,437 | ||||||
| Lease financing obligation |
$ | 58,729 | $ | — | $ | — | ||||||
| Cash used for share repurchases |
$ | 24,999 | $ | — | $ | — | ||||||
| Key Investing Items |
||||||||||||
| Capital Expenditures |
$ | 49,890 | $ | 56,588 | $ | 71,443 | ||||||
Overview
In managing our liquidity and capital structure, we remained and are focused on key goals, and we have and will continue in the future to implement actions to achieve them. They include:
| • | Liquidity — ensure that we have sufficient cash resources or other short term liquidity to manage day to day operations. |
| • | Growth — implement a plan to ensure that we have adequate capital resources, or access thereto, to fund internal growth and execute acquisitions. |
| • | Deleverage — reduce our debt obligations. |
| • | Share repurchases — opportunistically repurchase our ordinary shares. |
53
Table of Contents
Index to Financial Statements
Accounts Receivable & Inventory
We use the number of times per year that inventory turns over (based upon sales for the most recent period, or turns) to evaluate inventory management, and days sales outstanding, or DSOs, to evaluate accounts receivable management.
Accounts receivable at the end of 2015 increased as compared to the end of 2014, primarily as a result of payment patterns of our customers and timing of shipments to customers. DSOs increased reflecting a larger international mix.
Inventory at the end of 2015 was similar to that of the end of 2014, however, inventory turns were lower in 2015 reflecting the timing of customer requirements and anticipated demand for certain products.
Accounts receivable at the end of 2014 decreased as compared to the end of 2013. DSOs decreased from 2014 to 2013, primarily the result of payment patterns of our customers and timing of shipments to customers.
Inventory increased in 2014 as compared to 2013, primarily as a result of higher CPE inventory levels to protect against potential supply chain disruptions with West Coast port of entry delays, as well as timing of customer requirements. In addition, the decision to in-source the manufacturing of certain product lines resulted in higher levels of component inventory previously held at contract manufacturers.
Redemption of 2.00% Convertible Senior Notes due 2026
In 2013, the Company redeemed its convertible notes, for $231.2 million in cash considerations and issued 3.1 million shares of stock to Note holders.
Term Debt Repayments
In 2015, we repaid $53.5 million of our term debt, of which $38.5 million was term debt under our senior secured credit facilities and $15.0 million was term debt assumed and settled in conjunction with the ActiveVideo acquisition in April 2015.
In 2014, we repaid $209.7 million of debt, of which $205.0 million related to our term debt, including a $150 million of optional prepayment and $4.7 million of debt assumed and settled in conjunction with the closing of the SeaWell acquisition in April 2014.
In 2013, we repaid $172.4 million of our term debt, including a $125 million optional repayment.
Lease Financing Obligation
In the first quarter of 2015, we sold our San Diego office complex consisting of land and buildings. We concurrently entered into a leaseback arrangement for two of the buildings (Building 1 and Building 2). Building 1 did not qualify for sale leaseback accounting due to continuing involvement that will exist for the 10-year lease term. Accordingly, the carrying amount of Building 1 will remain on the Company’s balance sheet and will be depreciated over the ten-year lease period with the proceeds reflected as a financing obligation.
Share Repurchases
During 2015, we repurchased 0.9 million shares of our stock for $25.0 million at an average stock price of $28.70.
ARRIS did not repurchase any shares under the previously adopted share repurchase plan in 2014 and 2013.
In early 2016, our Board of Directors approved a new $300 million share repurchase authorization replacing all prior programs. Unless terminated earlier by a Board resolution, this new plan will expire when ARRIS has used all authorized funds for repurchase.
54
Table of Contents
Index to Financial Statements
Summary of Current Liquidity Position and Potential for Future Capital Raising
We believe our current liquidity position, where we had approximately $879.1 million of cash, cash equivalents, and short-term investments on hand as of December 31, 2015, together with approximately $497.9 million in availability under our new Revolving Credit Facility, and the prospects for continued generation of cash from operations, are adequate for our short- and medium-term business needs, including our expanded operations following the completion of the Pace acquisition. Our cash, cash-equivalents and short-term investments as of December 31, 2015 include approximately $181.2 million held by foreign subsidiaries whose earnings we expect to reinvest indefinitely outside of the United States. Approximately $5.4M of cash as of December 31, 2015 are held by our Israeli subsidiary whose earnings is not reinvested indefinitely. We do not expect to need the cash generated by those foreign subsidiaries to fund our domestic operations. However, in the unforeseen event that we repatriate cash from those foreign subsidiaries, in excess of what is owed to the United States parent, we may be required to provide for and pay U.S. taxes on permanently repatriated funds.
We have subsidiaries in countries that maintain restrictions, such as legal reserves, with respect to the amount of dividends that the subsidiaries can distribute. Additionally, some countries impose restrictions or controls over how and when dividends can be paid by these subsidiaries. While we do not currently intend to repatriate earnings from entities in these countries, if we were to be required to distribute earnings from such countries, the timing of the distribution and the funds available to distribute, would be adversely impacted by these restrictions.
We expect to be able to generate sufficient cash on a consolidated basis to make all of the principal and interest payments under our senior secured credit facilities. Should our available funds be insufficient to support these initiatives or our operations, it is possible that we will raise capital through private or public, share or debt offerings.
Senior Secured Credit Facilities
On June 18, 2015, we amended and restated our credit agreement dated March 27, 2013 (the “Existing Credit Agreement”) to improve the terms and conditions of the credit agreement, extend the maturities of certain loan facilities, increase the amount of the revolving credit facility, and add a new term A-1 loan facility to fund the acquisition of Pace. The credit facility under the amended credit agreement (the “Amended Credit Agreement”) is comprised of (i) a “Term Loan A Facility” of $990 million, (ii) a “Term Loan B Facility” of $543.8 million, (iii) a “Revolving Credit Facility” of $500 million and (iv) a “Term Loan A-1 Facility” of $800 million, which was funded upon the closing of the acquisition of Pace in 2016. The Amended Credit Agreement refinanced the Term Loan A Facility and Revolving Credit Facility under the Existing Credit Agreement while the Term Loan B Facility is a continuation of the Term Loan B Facility under the Existing Credit Agreement. Under the Amended Credit Agreement, the Term Loan A Facility and the Revolving Credit Facility will mature on June 18, 2020. The Term Loan B Facility will mature on April 17, 2020. We determined that the refinancing transaction was treated as a debt modification as the changes in the terms of the amended Term Loan A Facility and Revolving Credit Facility were not considered substantial. In connection with the Amended Credit Agreement, as of December 31, 2015, we capitalized approximately $5.0 million of financing fees and $3.2 million of original issuance discount. An additional $2.3 million of original issuance discount will be capitalized in the first quarter of 2016 related to drawing on the Term A-1 Facility. In addition, we expensed approximately $13.0 million of debt issuance costs and wrote off approximately $2.1 million of existing debt issuance costs associated with certain lenders who were not party to the amended Term Loan A Facility and Revolving Credit Facility, which were included as interest expense in the Consolidated Statements of Operations for the year ended December 31, 2015. Interest rates on borrowings under the senior secured credit facilities are set forth in the table below. As of December 31, 2015, we had $1,509.1 million face value outstanding under the Term Loan A and Term Loan B Facilities, no borrowings under the Revolving Credit Facility and letters of credit totaling $2.1 million issued under the Revolving Credit Facility.
| Rate | As of December 31, 2015 | |||||
| Term Loan A |
LIBOR + 1.75 % | 2.17% | ||||
| Term Loan B |
LIBOR (1) + 2.50 % | 3.25% | ||||
| Revolving Credit Facility (2) |
LIBOR + 1.75 % | Not Applicable | ||||
55
Table of Contents
Index to Financial Statements
| (1) | Includes LIBOR floor of 0.75% |
| (2) | Includes unused commitment fee of 0.35% and letter of credit fee of 1.75% not reflected in interest rate above. |
Borrowings under the senior secured credit facilities are secured by first priority liens on substantially all of the assets of ARRIS and certain of its present and future subsidiaries that are or become parties to, or guarantors under, the Amended Credit Agreement governing the senior secured credit facilities. The Amended Credit Agreement provides terms for mandatory prepayments and optional prepayments and commitment reductions. The Amended Credit Agreement also includes events of default, which are customary for facilities of this type (with customary grace periods, as applicable), including provisions under which, upon the occurrence of an event of default, all amounts outstanding under the credit facilities may be accelerated. The Amended Credit Agreement contains usual and customary limitations on indebtedness, liens, restricted payments, acquisitions and asset sales in the form of affirmative, negative and financial covenants, which are customary for financings of this type, including the maintenance of a minimum interest coverage ratio of 3.50:1 and a maximum leverage ratio of 3.75:1 (with a scheduled decrease to 3.50:1 in the first quarter of 2017). As of December 31, 2015, we were in compliance with all covenants under the Amended Credit Agreement.
The Amended Credit Agreement provides for certain adjustments to the interest rates paid on the Term Loan A, Term Loan A-1, Term Loan B and Revolving Credit Facility based upon certain leverage ratios.
Commitments
Following is a summary of our contractual obligations as of December 31, 2015 (in thousands):
| Payments due by period | ||||||||||||||||||||
| Contractual Obligations |
Less than 1 Year | 1-3 Years | 3-5 Years | More than 5 Years |
Total | |||||||||||||||
| Credit facilities (1) |
$ | 49,500 | $ | 99,000 | $ | 1,360,562 | $ | — | $ | 1,509,062 | ||||||||||
| Operating leases, net of sublease income (2) |
33,259 | 44,458 | 26,822 | 44,232 | 148,771 | |||||||||||||||
| Purchase obligations (3) |
405,761 | 10,002 | — | — | 415,763 | |||||||||||||||
|
|
|
|
|
|
|
|
|
|
|
|||||||||||
| Total contractual obligations (4) |
$ | 488,520 | $ | 153,460 | $ | 1,387,384 | $ | 44,232 | $ | 2,073,596 | ||||||||||
|
|
|
|
|
|
|
|
|
|
|
|||||||||||
| (1) | Represents face values of Term Loan A and B which have terms of five years and seven years respectively. The balance excludes Term Loan A-1 Facility of $800 million, which was funded upon the closing of the acquisition of Pace in 2016. Upon the funding, we incurred an additional $2.3 million of original issuance discounts associated with Term Loan A-1 subsequent to December 31, 2015. |
| (2) | Includes leases which are reflected in restructuring accruals on the consolidated balance sheets. |
| (3) | Represents obligations under agreements with non-cancelable terms to purchase goods or services. The agreements are enforceable and legally binding, and specify terms, including quantities to be purchased and the timing of the purchase. |
| (4) | Approximately $46.2 million of uncertain tax positions have been excluded from the contractual obligation table because we are unable to make reasonably reliable estimates of the period of cash settlement with the respective taxing authorities. |
Off-Balance Sheet Arrangements
We do not have any material off-balance sheet arrangements as defined in Item 303(a)(4)(ii) of Regulation S-K.
56
Table of Contents
Index to Financial Statements
Cash Flow
Below is a table setting forth the key line items of our Consolidated Statements of Cash Flows (in thousands):
| 2015 | 2014 | 2013 | ||||||||||
| Cash provided by (used in): |
||||||||||||
| Operating activities |
343,872 | 459,281 | $ | 562,716 | ||||||||
| Investing activities |
(45,946 | ) | (124,586 | ) | (1,889,502 | ) | ||||||
| Financing activities |
(134 | ) | (211,343 | ) | 1,637,521 | |||||||
|
|
|
|
|
|
|
|||||||
| Net increase in cash and cash equivalents |
$ | 297,792 | $ | 123,352 | $ | 310,735 | ||||||
|
|
|
|
|
|
|
|||||||
Operating Activities:
Below are the key line items affecting cash from operating activities (in thousands):
| 2015 | 2014 | 2013 | ||||||||||
| Consolidated net income (loss) |
$ | 84,459 | $ | 327,211 | $ | (48,760 | ) | |||||
| Adjustments to reconcile net income (loss) to cash provided by operating activities |
395,648 | 229,213 | 284,738 | |||||||||
|
|
|
|
|
|
|
|||||||
| Net income including adjustments |
480,107 | 556,424 | 235,978 | |||||||||
| (Increase) decrease in accounts receivable |
(55,132 | ) | 16,796 | 9,241 | ||||||||
| (Increase) decrease in inventory |
(6,685 | ) | (71,036 | ) | 74,111 | |||||||
| Increase (decrease) in accounts payable and accrued liabilities |
15,065 | (116,909 | ) | 247,301 | ||||||||
| All other, net |
(89,483 | ) | 74,006 | (3,915 | ) | |||||||
|
|
|
|
|
|
|
|||||||
| Cash provided by operating activities |
$ | 343,872 | $ | 459,281 | $ | 562,716 | ||||||
|
|
|
|
|
|
|
|||||||
2015 vs. 2014
Consolidated net income including adjustments, as per the table above, decreased $76.3 million during 2015 as compared to 2014 reflecting lower sales and gross margin.
Accounts receivable increased $55.1 million in 2015. This increase was primarily a result of purchasing pattern and payment patterns of our customers. Some international customers have delayed payments as they dealt with exchange rate fluctuations for those purchases contracted in U.S. dollars. Additionally, in 2015, we have higher international accounts receivable. Customers internationally typically have longer payment terms.
Inventory increased by $6.7 million in 2015, reflecting timing of customer requirements and anticipated demand for certain products.
Accounts payable and accrued liabilities increased by $15.1 million in 2015. The significant component of this change was an increase in accounts payable reflecting timing of payments and an increase in deferred revenue, offset by a decrease in accrued liabilities reflecting lower annual bonus accrual, warranty claims paid as well as payment of the liabilities assumed during the ActiveVideo acquisition.
All other accounts, net, include the changes in other receivables, income taxes payable (recoverable), and prepaids. The other receivables represent amounts due from our contract manufacturers for material used in the assembly of our finished goods. The change in our income taxes recoverable account is a result of the timing of the actual estimated tax payments during the year as compared to the actual tax liability for the year. The net change during 2015 was approximately $89.5 million as compared to $74.0 million in 2014.
57
Table of Contents
Index to Financial Statements
2014 vs. 2013
Net income including adjustments increased $320.4 million during 2014 as compared to 2013 reflecting higher sales and gross margin.
Accounts receivable decreased $16.8 million in 2014. These decreases were primarily related to the payment patterns of our customers.
Inventory increased by $71.0 million in 2014, primarily as a result of higher CPE inventory levels to protect against potential supply chain disruptions with West Coast port of entry delays, as well as timing of customer requirements. In addition, the decision to in-source the manufacturing of certain product lines resulted in higher levels of component inventory previously held at contract manufacturers.
Accounts payable and accrued liabilities decreased by $116.9 million in 2014. The significant component of this change was a decrease in accounts payable reflecting timing of payments.
All other accounts, net, include the changes in other receivables, income taxes payable (recoverable), and prepaids. The other receivables represent amounts due from our contract manufacturers for material used in the assembly of our finished goods. The change in our income taxes recoverable account is a result of the timing of the actual estimated tax payments during the year as compared to the actual tax liability for the year. The net change during 2014 was approximately $74.0 million as compared to $3.9 million in 2013.
Investing Activities:
Below are the key line items affecting investing activities (in thousands):
| 2015 | 2014 | 2013 | ||||||||||
| Purchases of property, plant and equipment |
$ | (49,890 | ) | $ | (56,588 | ) | $ | (71,443 | ) | |||
| Acquisitions, net of cash acquired |
(97,905 | ) | — | (2,208,114 | ) | |||||||
| Purchases of investments |
(48,566 | ) | (127,780 | ) | (104,626 | ) | ||||||
| Sales of investments |
161,824 | 59,679 | 479,781 | |||||||||
| Proceeds from equity investment |
2,904 | — | 14,780 | |||||||||
| Purchase of intangible assets |
(39,340 | ) | — | — | ||||||||
| Proceeds from sale-leaseback transaction |
24,960 | — | — | |||||||||
| Other, net |
67 | 103 | 120 | |||||||||
|
|
|
|
|
|
|
|||||||
| Cash used in investing activities |
$ | (45,946 | ) | $ | (124,586 | ) | $ | (1,889,502 | ) | |||
|
|
|
|
|
|
|
|||||||
Purchases of property, plant and equipment — Represents capital expenditures which are mainly for test equipment, laboratory equipment, and computing equipment.
Acquisitions, net of cash acquired — Represents cash investments we have made in our various acquisitions.
Purchases and sales of investments — Represents purchases and sales of securities and other investments.
Proceeds from equity investment — Represent dividend proceeds received from return of an equity investment.
Purchase of intangible assets — Represent primarily the purchase of technology licenses.
Proceeds from sale-leaseback transaction — Represent proceeds received from the sale of land and building that qualified for sale leaseback accounting.
Other, net — Represent cash proceeds received from sale of assets.
58
Table of Contents
Index to Financial Statements
Financing Activities:
Below are the key items affecting our financing activities (in thousands):
| 2015 | 2014 | 2013 | ||||||||||
| Proceeds from issuance of debt |
$ | — | $ | — | $ | 1,925,000 | ||||||
| Payment for debt discount |
(3,247 | ) | — | (9,853 | ) | |||||||
| Payment of debt obligations |
(53,500 | ) | (209,653 | ) | (404,488 | ) | ||||||
| Payment of deferred financing costs |
(4,992 | ) | — | (42,724 | ) | |||||||
| Proceeds from sale-leaseback financing transaction |
58,729 | — | — | |||||||||
| Payment of lease financing obligation |
(425 | ) | — | — | ||||||||
| Repurchase of common stock |
(24,999 | ) | — | — | ||||||||
| Proceeds from issuance of common stock |
16,189 | 19,196 | 175,072 | |||||||||
| Repurchase of shares to satisfy minimum tax withholdings |
(46,680 | ) | (29,845 | ) | (12,664 | ) | ||||||
| Excess tax benefits from stock-based compensation plans |
3,997 | 8,959 | 7,178 | |||||||||
| Contribution from noncontrolling interest |
54,794 | — | — | |||||||||
|
|
|
|
|
|
|
|||||||
| Cash (used in) provided by financing activities |
$ | (134 | ) | $ | (211,343 | ) | $ | 1,637,521 | ||||
|
|
|
|
|
|
|
|||||||
Proceeds From issuance of debt — As part of the Motorola Home acquisition, we entered into senior secured credit facilities which comprised of Term Loan A facility of $1.1 billion with a term of five years and Term Loan B facility of $0.8 billion with a term of seven years.
Payment for debt discount — Represents amounts paid to lenders in the form of upfront fees, which have been treated as a reduction in the proceeds received by the Company and are considered a component of the discount on the Term Loans A and B.
Payment of debt obligation — Represents the payment of the convertible debt and the term loans under the senior secured credit facilities plus the payment of debt assumed and settled in conjunction with the closing of the ActiveVideo acquisition in 2015 and SeaWell acquisition in 2014.
Payment of deferred financing costs — Represents the finance fees related to the issuance of the senior secured credit facilities. These costs will be amortized over the life of the term loans and revolving credit facility or written-off on an accelerated basis if optional prepayments are made on the debt.
Proceeds from sale-leaseback financing transaction — Represents the portion of the sale of building that did not qualify for sale-leaseback accounting. As such the sale was recorded as a financing transaction that will be amortized over the ten year lease period.
Payment of lease financing transaction — Represents the amortization related to the portion of the sale of building that did not qualify for sale-leaseback accounting.
Repurchase of common stock — Represents the cash used to buy back the Company’s stock.
Proceeds from issuance of common stock — Represents cash proceeds related to the exercise of stock options, offset with expenses paid related to the issuance of stock. It also represents cash proceeds from shares issued to Google and Comcast in relation to the Motorola Home acquisition in 2013.
Repurchase of shares to satisfy minimum tax withholdings — Represents the minimum shares withheld to satisfy the minimum tax withholding when restricted stock units vests.
Excess tax benefits from stock-based compensation plans — Represents the cash that otherwise would have been paid for income taxes if increases in the value of equity instruments also had not been deductible in determining taxable income.
Contribution from noncontrolling interest — This represents the equity investment contributions by the noncontrolling interest in a venture formed between ARRIS and Charter Communications Inc. related to the ActiveVideo acquisition.
59
Table of Contents
Index to Financial Statements
Income Taxes Benefit Related to Equity Compensation
During 2015, approximately $20.2 million of U.S. federal tax benefits were obtained from tax deductions arising from equity-based compensation deductions, all of which resulted from 2015 exercises of non-qualified stock options and lapses of restrictions on restricted stock awards. During 2014, approximately $17.2 million of U.S. federal tax benefits were obtained from tax deductions arising from equity-based compensation deductions, all of which resulted from 2014 exercises of non-qualified stock options and lapses of restrictions on restricted stock awards. During 2013, approximately $2.8 million of U.S. federal tax benefits were obtained from tax deductions arising from equity-based compensation deductions, all of which resulted from 2013 exercises of non-qualified stock options and lapses of restrictions on restricted stock awards.
Interest Rates
As described above, all indebtedness under our senior secured credit facilities bears interest at variable rates based on LIBOR plus an applicable spread. We entered into interest rate swap arrangements to convert a notional amount of $625.0 million of our variable rate debt based on one-month LIBOR to a fixed rate. The objective of these swaps is to manage the variability of cash flows in the interest payments related to the portion of the variable rate debt designated as being hedged.
Foreign Currency
A significant portion of our products are manufactured or assembled in China, Mexico and Taiwan, and we have research and development centers outside the United States in, China, England, France, India, Ireland, Northern Ireland, and Sweden. Our sales into international markets have been and are expected in the future to be an important part of our business. These foreign operations are subject to the usual risks inherent in conducting business abroad, including risks with respect to currency exchange rates, economic and political destabilization, restrictive actions and taxation by foreign governments, nationalization, the laws and policies of the United States affecting trade, foreign investment and loans, and foreign tax laws.
We have certain international customers who are billed in their local currency and certain international operations that procure in U.S dollars. We also have certain predictable expenditures for international operations in local currency. Additionally, certain intercompany transactions are denominated in foreign currencies and subject to revaluation. As part of the Pace acquisition, we paid the former Pace shareholders 132.5 pence per share in cash consideration, which is approximately 434.3 million British pounds, in the aggregate, as of January 4, 2016. We use a hedging strategy and enter into forward or currency option contracts based on a percentage of expected foreign currency revenues and expenses. The percentage can vary, based on the predictability of the exposures denominated in the foreign currency. These contracts were settled upon the close of the Pace acquisition in January 2016.
Financial Instruments
In the ordinary course of business, we, from time to time, will enter into financing arrangements with customers. These financial arrangements include letters of credit, commitments to extend credit and guarantees of debt. These agreements could include the granting of extended payment terms that result in longer collection periods for accounts receivable and slower cash inflows from operations and/or could result in the deferral of revenue.
We execute letters of credit and bank guarantees in favor of certain landlords, customers and vendors to guarantee performance on contracts. Certain financial instruments require cash collateral, and these amounts are reported in Other Assets on the Consolidated Balance Sheets. As of December 31, 2015 and 2014, we had approximately $0.8 million and $1.0 million outstanding, respectively, of restricted cash.
Cash, Cash Equivalents, Short-Term Investments and Long-Term Investments
Our cash and cash equivalents (which are highly-liquid investments with an original maturity of three months or less) are primarily held in demand deposit accounts and money market accounts. We hold short-term
60
Table of Contents
Index to Financial Statements
investments consisting debt securities classified as available-for-sale, which are stated at estimated fair value. The debt securities consist primarily of commercial paper, certificates of deposits, short term corporate obligations and U.S. government agency financial instruments.
We hold cost method investments in private companies. These investments are recorded at $16.6 million and $15.2 million as of December 31, 2015 and 2014, respectively. See Note 7 Fair Value Measurements of Notes to the Consolidated Financial Statements for disclosures related to the fair value of our investments.
We have two rabbi trusts that are used as funding vehicles for various deferred compensation plans that were available to certain current and former officers and key executives. We also have deferred retirement salary plans, which were limited to certain current or former officers of a business acquired in 2007. We hold investments to cover the liability.
ARRIS also funds its nonqualified defined benefit plan for certain executives in a rabbi trust.
Capital Expenditures
Capital expenditures are made at a level designed to support the strategic and operating needs of the business. ARRIS’s capital expenditures were $49.9 million in 2015 as compared to $56.6 million in 2014 and $71.4 million in 2013. We had no significant commitments for capital expenditures at December 31, 2015. Management expects to invest approximately $60.0 million in capital expenditures for the year 2016.
Deferred Income Tax Assets — Including Net Operating Loss Carryforwards and Research and Development Credit Carryforwards, and Capitalized Research and Experimentation Costs and Valuation Allowances
Deferred income tax assets represent amounts available to reduce income taxes payable on taxable income in future years. Such assets arise because of temporary differences between the financial reporting and tax bases of assets and liabilities, as well as from net operating loss and tax credit carryforwards. We evaluate the recoverability of these future tax deductions and credits by assessing the adequacy of future expected taxable income from all sources, including reversal of taxable temporary differences, forecasted operating earnings and available tax planning strategies. If we conclude that deferred tax assets are more-likely-than-not to not be realized, then we record a valuation allowance against those assets. We continually review the adequacy of the valuation allowances established against deferred tax assets. As part of that review, we regularly project taxable income based on book income projections by legal entity. Our ability to utilize our U.S. federal, state and foreign deferred tax assets is dependent upon our future taxable income by legal entity.
As of December 31, 2015, ARRIS had net operating loss carryforwards for U.S. federal, state, and foreign income tax purposes of approximately $218.9 million, $353.1 million and $54.9 million, respectively. The U.S. federal NOLs expire through 2031. Foreign NOLs related to our Irish subsidiary in the amount of $17.8 million have an indefinite life. Other significant foreign NOLs arise from our Canadian subsidiary ($11.8 million, expiring within 18 years), Dutch subsidiaries ($2.7 million, expiring during the next three years), and French branch ($4.8 million, no expiration), our U.K. branch ($6.1 million, no expiration), our U.K. subsidiary ($1.6 million, no expiration) and our Israeli subsidiary ($5.5 million, no expiration). The net operating losses are subject to various limitations on how and when the losses can be used to offset against taxable income. Approximately $110.1 million of U.S. federal, $154.2 million of state NOLs, and $17.0 million of the foreign NOLs are subject to valuation allowances because we do not believe the ultimate realization of that portion of the deferred tax assets associated with these U.S. federal and state and foreign NOLs is more-likely-than-not.
During 2015, we used approximately $327.1 million of U.S. federal NOLs to reduce taxable income. For state tax filings, we recorded the usage of $66.2 million of pre-apportioned and $30.6 million of post-apportioned U.S. state NOLs to reduce taxable income.
As of December 31, 2014, ARRIS had net operating loss carryforwards for U.S. federal, state, and foreign income tax purposes of approximately $552.9 million, $417.3 million, and $57.8 million, respectively. The U.S. federal NOLs expire through 2031. Foreign NOLs related to our Irish subsidiary in the amount of $18.5 million have an indefinite life. Other significant foreign NOLs arise from our Canadian subsidiary ($13.7 million,
61
Table of Contents
Index to Financial Statements
expiring within 20 years), Dutch subsidiaries ($3.3 million, expiring during the next eight years), and French branch ($5.4 million, no expiration), our U.K. branch ($6.4 million, no expiration), our U.K. subsidiary ($3.1 million, no expiration), and our Israeli subsidiary ($6.3 million, no expiration). The net operating losses are subject to various limitations on how and when the losses can be used to offset against taxable income. Approximately $178.2 million of U.S. Federal, $228.5 million of state NOLs, and $18.8 million of the foreign NOLs are subject to valuation allowances because we do not believe the ultimate realization of that portion of the deferred tax assets associated with these U.S. federal and state and foreign NOLs is more-likely-than-not.
During 2014, we used approximately $75.2 million of U.S. federal NOLs to reduce taxable income. For state tax filings, we recorded the usage of $54.0 million of post-apportioned and $375.6 million of pre-apportioned U.S. state NOLs to reduce taxable income.
During the tax year ending December 31, 2015, we utilized $0.3 million of U.S. foreign tax credits and $6.5 million of U.S. state research and development tax credits, to offset against U.S. federal and state income tax liabilities. No U.S. Federal research and development tax credits were utilized during 2015. During the tax years ending December 31, 2014, and 2013, we utilized $27.2 million and $5.5 million, respectively of U.S. federal and state research and development tax credits, to offset against U.S. federal and state income tax liabilities. As of December 31, 2015, ARRIS has a deferred tax asset of $70.7 million for U.S. federal research and development tax credits and $28.3 million of for state research and development tax credits. Remaining unutilized U.S. federal research and development tax credits can be carried back one year and carried forward twenty years. Foreign tax credits can be carried forward 10 years. The state research and development tax credits carry forward and will expire pursuant to the various applicable state laws. Approximately $26.9 million of U.S. federal research and development tax credits and $9.9 million of state research and development tax credits are subject to valuation allowances because we do not believe the ultimate realization of the related deferred tax assets is more-likely-than-not.
ARRIS has generally reported taxable income in excess of its pre-tax net book income for financial reporting purposes. A significant reconciling item between the taxable income and the pre-tax net book income has been the book amortization expense relating to the separately stated intangible assets arising from acquisitions. Other significant reconciling items between taxable income and pre-tax net book income are certain reserves that are recorded as expenses for pre-tax net book income purposes which are not deductible for income tax purposes until they are paid. As of December 31, 2015, the Company reports $579.7 million of capitalized research and experimentation costs, which are available to reduce U.S. federal and state taxable income in future years, based on a straight-line method over a ten year life. The costs are amortized over the remaining lives on a straight-line basis, with the final amortization occurring in 2026.
The Company obtains significant benefits from U.S. federal research and development tax credits, which are used to reduce the Company’s U.S. federal income tax liability. In December of 2015, the research and development tax credit was made permanent. As a result of this legislation being enacted, the Company recorded a net benefit of $20.4 million in the fourth quarter of 2015.
Defined Benefit Pension Plans
ARRIS sponsors a qualified and a non-qualified non-contributory defined benefit pension plan that cover certain U.S. employees. As of January 1, 2000, we froze the qualified defined pension plan benefits for its participants.
The U.S. pension plan benefit formulas generally provide for payments to retired employees based upon their length of service and compensation as defined in the plans. Our investment policy is to fund the qualified plan as required by the Employee Retirement Income Security Act of 1974 (“ERISA”) and to the extent that such contributions are tax deductible. For 2015, the plan assets were comprised of approximately 40% to 45%, 0% to 5% and 50% to 60% of equity securities, debt securities and money market funds, respectively. For 2014, the plan assets were comprised of approximately 43%, 3% and 54% of equity securities, debt securities and money market funds, respectively. For 2016, the plan’s current target allocations are 40% to 45% equity securities, 0% to 5% debt securities, and 50% to 60% money market funds. Liabilities or amounts in excess of these funding
62
Table of Contents
Index to Financial Statements
levels are accrued and reported in the consolidated balance sheets. We have established a rabbi trust to fund the pension obligations of the Chief Executive Officer under his Supplemental Retirement Plan including the benefit under our non-qualified defined benefit plan. In addition, we have established a rabbi trust for certain executive officers and certain senior management personnel to fund the pension liability to those officers under the non-qualified plan. Effective June 30, 2013, ARRIS amended the Supplemental Retirement Plan. This amendment effectively froze entry of any new participants into the Supplemental Plan and, for existing participants, a freeze on any additional benefit accrual after June 30, 2013. The participant’s benefit will continue to be distributed in accordance with the provisions of the Supplemental Plan but the final benefit accrual was frozen as of June 30, 2013. A curtailment gain of approximately $0.3 million, which represents the difference in the projected benefit obligation and the accumulated benefit obligation at June 30, 2013, offsets the existing plan loss and lowers future pension expense.
The investment strategies of the plans place a high priority on benefit security. The plans invest conservatively so as not to expose assets to depreciation in adverse markets. The plans’ strategy also places a high priority on earning a rate of return greater than the annual inflation rate along with maintaining average market results. The plan has targeted asset diversification across different asset classes and markets to take advantage of economic environments and to also act as a risk minimizer by dampening the portfolio’s volatility.
The weighted-average actuarial assumptions used to determine the benefit obligations for the three years presented are set forth below:
| 2015 | 2014 | 2013 | ||||||||||
| Assumed discount rate for plan participants |
4.15 | % | 3.75 | % | 4.50 | % | ||||||
The weighted-average actuarial assumptions used to determine the net periodic benefit costs are set forth below:
| 2015 | 2014 | 2013 | ||||||||||
| Assumed discount rate plan participants |
3.75 | % | 4.50 | % | 3.75 | % | ||||||
| Rate of compensation increase |
N/A | N/A | 3.75 | % | ||||||||
| Expected long-term rate of return on plan assets |
6.00 | % | 6.00 | % | 6.00 | % | ||||||
The expected long-term rate of return on assets is derived using the building block approach which includes assumptions for the long term inflation rate, real return, and equity risk premiums.
ARRIS estimates it will make funding contributions of $728 thousand in 2016.
ARRIS also provides a non-contributory defined benefit plan which cover employees in Taiwan (“Taiwan Plan”). Any other benefit plans outside of the U.S. are not material to ARRIS either individually or in the aggregate.
Key assumptions used in the valuation of the Taiwan Plan are as follows:
| 2015 | 2014 | 2013 | ||||||||||
| Assumed discount rate for obligations |
1.70 | % | 1.90 | % | 1.80 | % | ||||||
| Assumed discount rate for expense |
1.90 | % | 1.80 | % | 1.80 | % | ||||||
| Rate of compensation increase for indirect labor |
4.00 | % | 4.50 | % | 4.50 | % | ||||||
| Rate of compensation increase for direct labor |
2.00 | % | 2.00 | % | 2.00 | % | ||||||
| Expected long-term rate of return on plan assets (1) |
2.00 | % | 2.00 | % | 2.00 | % | ||||||
| (1) | Asset allocation is 100% in money market investments |
ARRIS estimates it will make funding contributions of $10.4 million in 2016.
63
Table of Contents
Index to Financial Statements
Other Benefit Plans
ARRIS has established defined contribution plans pursuant to the Internal Revenue Code Section 401(k) that cover all eligible U.S. employees. We contribute to these plans based upon the dollar amount of each participant’s contribution. We made matching contributions to these plans of approximately $16.6 million, $15.3 million, and $10.9 million in 2015, 2014 and 2013, respectively.
We have a deferred compensation plan that does not qualify under Section 401(k) of the Internal Revenue Code and is available to our key executives and certain other employees. Employee compensation deferrals and matching contributions are held in a rabbi trust. The total of net employee deferrals and matching contributions, which is reflected in other long-term liabilities, were $3.6 million and $3.3 million at December 31, 2015 and 2014, respectively. Total expenses included in continuing operations for the matching contributions were approximately $0.1 million in both 2015 and 2014.
We previously offered a deferred compensation arrangement that allowed certain employees to defer a portion of their earnings and defer the related income taxes. As of December 31, 2004, the plan was frozen and no further contributions are allowed. The deferred earnings are invested in a rabbi trust. The total of net employee deferral and matching contributions, which is reflected in other long-term liabilities, was $2.8 million and $2.9 million at December 31, 2015 and 2014, respectively.
We also have a deferred retirement salary plan, which was limited to certain current or former officers of a business acquired in 2007. The present value of the estimated future retirement benefit payments is being accrued over the estimated service period from the date of signed agreements with the employees. The accrued balance of this plan, the majority of which is included in other long-term liabilities, were $1.7 million and $1.8 million at December 31, 2015 and 2014. Total expense (income) included in continuing operations for the deferred retirement salary plan were approximately $0.3 million and $0.1 million for 2015 and 2014, respectively.
Critical Accounting Policies
The accounting and financial reporting policies of ARRIS are in conformity with U.S. generally accepted accounting principles. The preparation of financial statements in conformity with U.S. generally accepted accounting principles requires management to make estimates and assumptions that affect the reported amounts of assets and liabilities, the disclosure of contingent assets and liabilities at the date of the financial statements, and the reported amounts of revenues and expenses during the reporting period. Management has discussed the development and selection of the critical accounting estimates discussed below with the Audit Committee of the Board of Directors and the Audit Committee has reviewed the related disclosures.
a) Revenue Recognition
ARRIS generates revenue as a result of varying activities, including the delivery of stand-alone equipment, custom design and installation services, and bundled sales arrangements inclusive of equipment, software and services. The revenue from these activities is recognized in accordance with applicable accounting guidance and their related interpretations. Revenue is recognized when all of the following criteria have been met:
| • | When persuasive evidence of an arrangement exists. Contracts and customer purchase orders are used to determine the existence of an arrangement. For professional services evidence that an agreement exists includes information documenting the scope of work to be performed, price, and customer acceptance provisions. These are contained in the signed Contract, Purchase Order, or other documentation that shows scope, price and customer acceptance provisions. |
| • | Delivery has occurred. Shipping documents, proof of delivery and customer acceptance (when applicable) are used to verify delivery. |
| • | The fee is fixed or determinable. Pricing is considered fixed or determinable at the execution of a customer arrangement, based on specific products and quantities to be delivered at specific prices. This |
64
Table of Contents
Index to Financial Statements
| determination includes a review of the payment terms associated with the transaction and whether the sales price is subject to refund or adjustment or future discounts. |
| • | Collectability is reasonably assured. We assess the ability to collect from customers based on a number of factors that include information supplied by credit agencies, analyzing customer accounts, reviewing payment history and consulting bank references. Should a circumstance arise where a customer is deemed not creditworthy, all revenue related to the transaction will be deferred until such time that payment is received and all other criteria to allow us to recognize revenue have been met. |
Revenue is deferred if any of the above revenue recognition criteria is not met as well as when certain circumstances exist for any of our products or services, including, but not limited to:
| • | When undelivered products or services that are essential to the functionality of the delivered product exist, revenue is deferred until such undelivered products or services are delivered as the customer would not have full use of the delivered elements. |
| • | When required acceptance has not occurred. |
| • | When trade-in rights are granted at the time of sale, that portion of the sale is deferred until the trade-in right is exercised or the right expires. In determining the deferral amount, management estimates the expected trade-in rate and future value of the product upon trade-in. These factors are periodically reviewed and updated by management, and the updates may result in either an increase or decrease in the deferral. |
Equipment — We provide operators with equipment that can be placed within various stages of a broadband system that allows for the delivery of telephony, video and high-speed data as well as outside plant construction and maintenance equipment. For equipment sales, revenue recognition is generally established when the products have been shipped, risk of loss has transferred, objective evidence exists that the product has been accepted, and no significant obligations remain relative to the transaction. Additionally, based on historical experience, ARRIS has established reliable estimates related to sales returns and other allowances for discounts. These estimates are recorded as a reduction to revenue at the time the revenue is initially recorded.
Multiple Element Arrangements — Certain customer transactions may include multiple deliverables based on the bundling of equipment, software and services. When a multiple element arrangement exists, the fee from the arrangement is allocated to the various deliverables, to the extent appropriate, so that the proper amount can be recognized as revenue as each element is delivered. Based on the composition of the arrangement, we analyze the provisions of the accounting guidance to determine the appropriate model that is applied towards accounting for the multiple element arrangement. If the arrangement includes a combination of elements that fall within different applicable guidance, ARRIS follows the provisions of the hierarchal literature to separate those elements from each other and apply the relevant guidance to each.
To determine the estimated selling price in multiple-element arrangements, we first look to establish vendor specific objective evidence (“VSOE”) of the selling price using the prices charged for a deliverable when sold separately. If VSOE of the selling price cannot be established for a deliverable, we look to establish third-party evidence (“TPE”) of the selling price by evaluating the pricing of similar and interchangeable competitor products or services in stand-alone arrangements. However, as our products typically contain a significant element of proprietary technology and may offer substantially different features and functionality from our competitors, we have been unable to obtain comparable pricing information with respect to our competitors’ products. Therefore, we have not been able to obtain reliable evidence of TPE of the selling price. If neither VSOE nor TPE of the selling price can be established for a deliverable, we establish best estimate selling price (“BESP”) by reviewing historical transaction information and considering several other internal factors, including discounting and margin objectives. We regularly review estimated selling price of the product offerings and maintain internal controls over the establishment and updates of these estimates.
Our equipment deliverables typically include proprietary operating system software, which together deliver the essential functionality of our products. Therefore, our equipment are considered non-software elements and are not subject to industry-specific software revenue recognition guidance. For equipment, revenue recognition is
65
Table of Contents
Index to Financial Statements
generally established when the products have been shipped, risk of loss has transferred, objective evidence exists that the product has been accepted, and no significant obligations remain relative to the transaction.
For arrangements that fall within the software revenue recognition guidance, the fee is allocated to the various elements based on VSOE of fair value. If sufficient VSOE of fair value does not exist for the allocation of revenue to all the various elements in a multiple element arrangement, all revenue from the arrangement is deferred until the earlier of the point at which such sufficient VSOE of fair value is established or all elements within the arrangement are delivered. If VSOE of fair value exists for all undelivered elements, but does not exist for one or more delivered elements, the arrangement consideration is allocated to the various elements of the arrangement using the residual method of accounting. Under the residual method, the amount of the arrangement consideration allocated to the delivered elements is equal to the total arrangement consideration less the aggregate fair value of the undelivered elements. Using this method, any potential discount on the arrangement is allocated entirely to the delivered elements, which ensures that the amount of revenue recognized at any point in time is not overstated. Under the residual method, if VSOE of fair value exists for the undelivered element, generally PCS, the fair value of the undelivered element is deferred and recognized ratably over the term of the PCS contract, and the remaining portion of the arrangement is recognized as revenue upon delivery, which generally occurs upon delivery of the product or implementation of the system. Many of ARRIS’s products are sold in combination with customer support and maintenance services, which consist of software updates and product support. Software updates provide customers with rights to unspecified software updates that ARRIS chooses to develop and to maintenance releases and patches that we choose to release during the term of the support period. Product support services include telephone support, remote diagnostics, email and web access, access to on-site technical support personnel and repair or replacement of hardware in the event of damage or failure during the term of the support period. Maintenance and support service fees are recognized ratably under the straight-line method over the term of the contract, which is generally one year. We do not record receivables associated with maintenance revenues without a firm, non-cancelable order from the customer. VSOE of fair value is determined based on the price charged when the same element is sold separately and based on the prices at which our customers have renewed their customer support and maintenance. For elements that are not yet being sold separately, the price established by management, if it is probable that the price, once established, will not change before the separate introduction of the element into the marketplace is used to measure VSOE of fair value for that element.
Software Sold Without Tangible Equipment — While not significant, ARRIS does sell internally developed software as well as software developed by outside third parties that does not require significant production, modification or customization. For arrangements that contain only software and the related post-contract support, we recognize revenue in accordance with the applicable software revenue recognition guidance. If the arrangement includes multiple elements that are software only, then the software revenue recognition guidance is applied and the fee is allocated to the various elements based on vendor-specific objective evidence (“VSOE”) of fair value. If sufficient VSOE of fair value does not exist for the allocation of revenue to all the various elements in a multiple element software arrangement, all revenue from the arrangement is deferred until the earlier of the point at which such sufficient VSOE of fair value is established or all elements within the arrangement are delivered. If VSOE of fair value exists for all undelivered elements, but does not exist for one or more delivered elements, the arrangement consideration is allocated to the various elements of the arrangement using the residual method of accounting. Under the residual method, the amount of the arrangement consideration allocated to the delivered elements is equal to the total arrangement consideration less the aggregate fair value of the undelivered elements. Under the residual method, if VSOE of fair value exists for the undelivered element, generally post contract support (“PCS”), the fair value of the undelivered element is deferred and recognized ratably over the term of the PCS contract, and the remaining portion of the arrangement is recognized as revenue upon delivery. If sufficient VSOE of fair value does not exist for PCS, revenue for the arrangement is recognized ratably over the term of support.
Standalone Services — Installation, training, and professional services are generally recognized as service revenue when performed or upon completion of the service when the final act is significant in relation to the overall service transaction. The key element for Professional Services in determining when service transaction
66
Table of Contents
Index to Financial Statements
revenue has been earned is determining the pattern of delivery or performance which determines the extent to which the earnings process is complete and the extent to which customers have received value from services provided. The delivery or performance conditions of our service transactions are typically evaluated under the proportional performance or completed performance model.
Incentives — Customer incentive programs that include consideration, primarily rebates/credits to be used against future product purchases and certain volume discounts, are recorded as a reduction of revenue when the shipment of the requisite equipment occurs.
Value Added Resellers — ARRIS typically employs the sell-in method of accounting for revenue when using a Value Added Reseller (“VAR”) as our channel to market. Because product returns are restricted, revenue under this method is generally recognized at the time of shipment to the VAR provided all criteria for recognition are met. There are occasions, based on facts and circumstances surrounding the VAR transaction, where ARRIS will employ the sell-through method of recognizing revenue and defer that revenue until payment occurs.
Retail — Some of our product is sold through retail channels, which may include provisions involving a right of return. Upon shipment of the product, we reduce revenue for an estimate of potential future product returns related to the current period product revenue. Management analyzes historical returns, channel inventory levels, and current economic trends related to our products when evaluating the adequacy of the allowance for sales returns. When applicable, revenue on shipments is reduced for estimated price protection and sales incentives that are deemed to be contra-revenue under the authoritative guidance for revenue recognition.
b) Goodwill and Intangible Assets
Intangible assets are classified into three categories: (1) intangible assets with definite lives subject to amortization, (2) intangible assets with indefinite lives not subject to amortization and (3) goodwill. For intangible assets with definite lives, tests for impairment must be performed if conditions exist that indicate the carrying value may not be recoverable. For intangible assets with indefinite lives and goodwill, tests for impairment must be performed at least annually or more frequently if events or circumstances indicate that assets might be impaired.
The following table presents the carrying values of intangible assets included in our consolidated balance sheet (in thousands):
| December 31, 2015 |
Carrying Value |
Percentage of Total Assets |
||||||
| Goodwill |
$ | 1,013,963 | 22 | % | ||||
| Definite-lived intangible assets, net |
804,548 | 18 | % | |||||
| Indefinite-lived intangible assets |
5,900 | — | ||||||
|
|
|
|
|
|||||
| Total |
$ | 1,824,411 | 40 | % | ||||
|
|
|
|
|
|||||
Other Intangible Assets
When facts and circumstances indicate that the carrying value of definite-lived intangible assets may not be recoverable, management assesses the recoverability of the carrying value by preparing estimates of sales volume and the resulting profit and cash flows. Examples of such circumstances include, but are not limited to, operating or cash flow losses from the use of such assets or changes in our intended uses of such assets. These estimated future cash flows are consistent with those we use in our internal planning. To test for recovery, we group assets (an “asset group”) in a manner that represents the lowest level for which identifiable cash flows are largely independent of the cash flows of other groups of assets and liabilities. If the sum of the expected future cash flows (undiscounted and pre-tax based upon policy decision) is less than the carrying amount, we recognize an impairment loss. The impairment loss recognized is the amount by which the carrying amount of the asset or asset group exceeds the fair value. We use a variety of methodologies to determine the fair value of these assets, including discounted cash flow models, which are consistent with the assumptions we believe hypothetical marketplace participants would use.
67
Table of Contents
Index to Financial Statements
We test intangible assets determined to have indefinite useful lives, including certain trademarks, in-process research and development and goodwill, for impairment annually, or more frequently if events or circumstances indicate that assets might be impaired. We perform these annual impairment reviews as of the first day of our fourth fiscal quarter (October 1). We use a variety of methodologies in conducting impairment assessments of indefinite-lived intangible assets, including, but not limited to, discounted cash flow models, which are based on the assumptions we believe hypothetical marketplace participants would use. For indefinite-lived intangible assets, other than goodwill, if the carrying amount exceeds the fair value, an impairment charge is recognized in an amount equal to that excess. Acquired in-process research and development assets are initially recognized and measured at fair value and classified as indefinite-lived assets until the successful completion or abandonment of the associated research and development efforts. Accordingly, during the development period after acquisition, this asset is not amortized as charges to earnings. Completion of the associated research and development efforts would cause the indefinite-lived in-process research and development assets to become a definite-lived asset. As such, prior to commencing amortization the assets is tested for impairment.
We have the option to perform a qualitative assessment of indefinite-lived intangible assets, other than goodwill, prior to completing the impairment test described above. The Company must assess whether it is more likely than not that the fair value of the intangible asset is less than its carrying amount. If the Company concludes that this is the case, it must perform the testing described above. Otherwise, the Company does not need to perform any further assessment.
Assumptions and estimates about future values and remaining useful lives of our acquired intangible assets are complex and subjective. They can be affected by a variety of factors, including external factors such as industry and economic trends and internal factors such as changes in our business strategy and our internal forecasts.
There were no impairment charges related to intangible assets (definite-lived and indefinite-lived), other than goodwill, during 2015, 2014 and 2013. Our ongoing consideration of all the factors described previously could result in additional impairment charges in the future, which could adversely affect our net income.
Goodwill
We perform impairment tests of goodwill at our reporting unit level, which is at or one level below our operating segments. For purposes of impairment testing, our reporting units are based on our organizational structure, the financial information that is provided to and reviewed by segment management and aggregation criteria applicable to component businesses that are economically similar. Our operating segments are primarily based on the nature of the products and services offered, which is consistent with the way management runs our business. Our Customer Premises Equipment operating segment is the same as the reporting unit. Our Network & Cloud operating segment is subdivided into three reporting units which are Network Infrastructure, Cloud Services, and Cloud TV. Goodwill is assigned to the reporting unit or units that benefit from the synergies arising from each business combination.
The goodwill impairment test consists of a two-step process, if necessary. The first step is to compare the fair value of a reporting unit to its carrying value, including goodwill. We typically use a weighting of income approach using discounted cash flow models and a market approach to determine the fair value of a reporting unit. The assumptions used in these models are consistent with those we believe hypothetical marketplace participants would use. Under the income approach, we calculate the fair value of a reporting unit based on the present value of estimated future cash flows. The discounted cash flow analysis requires us to make various judgmental assumptions, including assumptions about future cash flows, growth rates and weighted average cost of capital (discount rate). The assumptions about future cash flows and growth rates are based on the current and long-term business plans of each reporting unit. Discount rate assumptions are based on an assessment of the risk inherent in the future cash flows of the respective reporting units. Under the market approach, we estimate the fair value based upon Market multiples of revenue and earnings derived from publicly traded companies with similar operating and investment characteristics as the reporting unit. The weighting of the fair value derived from the market approach ranges from 0% to 50% depending on the level of comparability of these publicly-traded companies to
68
Table of Contents
Index to Financial Statements
the reporting unit. When market comparable are not meaningful or not available, we may estimate the fair value of a reporting unit using only the income approach. We considered the relative strengths and weaknesses inherent in the valuation methodologies utilized in each approach and consulted with a third party valuation specialist to assist in determining the appropriate weighting.
In order to assess the reasonableness of the calculated fair values of our reporting units, we also compare the sum of the reporting units’ fair values to our market capitalization and calculate an implied control premium (the excess of the sum of the reporting units’ fair values over the market capitalization). We evaluate the control premium by comparing it to the fair value estimates of the reporting unit. If the implied control premium is not reasonable in light of the analysis, we will reevaluate the fair value estimates of the reporting unit by adjusting the discount rates and/or other assumptions. If the fair value of the reporting unit is less than its carrying value, the second step of the impairment test must be performed in order to determine the amount of impairment loss, if any. The second step compares the implied fair value of the reporting unit’s goodwill with the carrying amount of that goodwill. If the carrying amount of the reporting unit’s goodwill exceeds its implied fair value, an impairment charge is recognized in an amount equal to that excess. The loss recognized cannot exceed the carrying amount of goodwill.
The Company has the option to perform a qualitative assessment of goodwill prior to completing the two-step process described above to determine whether it is more likely than not that the fair value of a reporting unit is less than its carrying amount, including goodwill and other intangible assets. If the Company concludes that this is the case, it must perform the two-step process. Otherwise, the Company will forego the two-step process and does not need to perform any further testing.
Assumptions and estimates about future cash flows and discount rates are complex and often subjective. They are sensitive to changes in underlying assumptions and can be affected by a variety of factors, including external factors such as industry and economic trends, and internal factors such as changes in our business strategy and our internal forecasts. Our assessment includes significant estimates and assumptions including the timing and amount of future discounted cash flows, the discount rate and the perpetual growth rate used to calculate the terminal value.
Our discounted cash flow analysis included projected cash flows over a ten-year period, using our three-year business plans plus an additional seven years of projected cash flows based on the most recent three-year plan. These forecasted cash flows took into consideration management’s outlook for the future and were compared to historical performance to assess reasonableness. A discount rate was applied to the forecasted cash flows. The discount rate considered market and industry data, as well as the specific risk profile of the reporting unit. A terminal value was calculated, which estimates the value of annual cash flow to be received after the discrete forecast periods. The terminal value was based upon an exit value of annual cash flow after the discrete forecast period in year ten.
Examples of events or circumstances that could reasonably be expected to negatively affect the underlying key assumptions and ultimately impact the estimated fair value of our reporting units may include such items as the following:
| • | a prolonged decline in capital spending for constructing, rebuilding, maintaining, or upgrading broadband communications systems; |
| • | rapid changes in technology occurring in the broadband communication markets which could lead to the entry of new competitors or increased competition from existing competitors that would adversely affect our sales and profitability; |
| • | the concentration of business we receive from several key customers, the loss of which would have a material adverse effect on our business; |
| • | continued consolidation of our customers base in the telecommunications industry could result in delays or reductions in purchases of our products and services, if the acquirer decided not to continue using us as a supplier; |
69
Table of Contents
Index to Financial Statements
| • | new products and markets currently under development may fail to realize anticipated benefits; |
| • | changes in business strategies affecting future investments in businesses, products and technologies to complement or expand our business could result in adverse impacts to existing business and products; |
| • | volatility in the capital (equity and debt) markets, resulting in a higher discount rate; and |
| • | legal proceeding settlements and/or recoveries, and its effect on future cash flows. |
As a result, there can be no assurance that the estimates and assumptions made for purposes of the annual goodwill impairment test will prove to be accurate predictions of the future. Although management believes the assumptions and estimates made are reasonable and appropriate, different assumptions and estimates could materially impact the reported financial results.
There was no impairment of goodwill resulting from our annual impairment testing in 2015, 2014 and 2013.
a) Accounts Receivable and Allowance for Doubtful Accounts and Sales Returns
Accounts receivable are stated at amounts owed by the customers, net of allowance for doubtful accounts, sales returns and allowances. We establish a reserve for doubtful accounts based upon our historical experience and leading market indicators in collecting accounts receivable. A majority of our accounts receivable are from a few large cable system operators and telecommunication companies, either with investment rated debt outstanding or with substantial financial resources, and have favorable payment histories. If we were to have a collection problem with one of our major customers, it is possible the reserve will not be sufficient. We calculate our reserve for uncollectible accounts using a model that considers customer payment history, recent customer press releases, bankruptcy filings, if any, Dun & Bradstreet reports, and financial statement reviews. Our calculation is reviewed by management to assess whether there needs to be an adjustment to the reserve for uncollectible accounts. The reserve is established through a charge to the provision and represents amounts of current and past due customer receivable balances of which management deems a loss to be both probable and estimable. Accounts receivable are charged to the allowance when determined to be no longer collectible.
In the event that we are not able to predict changes in the financial condition of our customers, resulting in an unexpected problem with collectability of receivables and our actual bad debts differ from estimates, or we adjust estimates in future periods, our established allowances may be insufficient and we may be required to record additional allowances. Alternatively, if we provided more allowances than are ultimately required, we may reverse a portion of such provisions in future periods based on our actual collection experience. In the event we adjust our allowance estimates, it could materially affect our operating results and financial position.
We also establish a reserve for sales returns and allowances. The reserve is an estimate of the impact of potential returns based upon historic trends.
d) Inventory Valuation
Inventory is stated at the lower of market cost. Inventory cost is determined on a first-in, first-out basis. The cost of work-in-process and finished goods is comprised of material, labor and overhead.
We continuously evaluate future usage of product and where supply exceeds demand, we may establish a reserve. In reviewing inventory valuations, we also review for obsolete items. This evaluation requires us to estimate future usage, which, in an industry where rapid technological changes and significant variations in capital spending by system operators are prevalent, is difficult. As a result, to the extent that we have overestimated future usage of inventory, the value of that inventory on our financial statements may be overstated. When we believe that we have overestimated our future usage, we adjust for that overstatement through an increase in cost of sales in the period identified as the inventory is written down to its net realizable value. Inherent in our valuations are certain management judgments and estimates, including markdowns, shrinkage, manufacturing schedules, possible alternative uses and future sales forecasts, which can significantly impact ending inventory valuation and gross margin. The methodologies utilized by ARRIS in its application of the above methods are consistent for all periods presented.
70
Table of Contents
Index to Financial Statements
We conduct physical inventory counts at all ARRIS locations, either annually or through ongoing cycle-counts, to confirm the existence of our inventory.
e) Warranty
We offer warranties of various lengths to our customers depending on product specifics and agreement terms with our customers. We provide, by a current charge to cost of sales in the period in which the related revenue is recognized, an estimate of future warranty obligations. The estimate is based upon historical experience. The embedded product base, failure rates, cost to repair and warranty periods are used as a basis for calculating the estimate. We also provide, via a charge to current cost of sales, estimated expected costs associated with non-recurring product failures. In the event of a significant non-recurring product failure, the amount of the reserve may not be sufficient. In the event that our historical experience of product failure rates and costs of correcting product failures change, our estimates relating to probable losses resulting from a significant non-recurring product failure changes, or to the extent that other non-recurring warranty claims occur in the future, we may be required to record additional warranty reserves. Alternatively, if we provided more reserves than we needed, we may reverse a portion of such provisions in future periods. In the event we change our warranty reserve estimates, the resulting charge against future cost of sales or reversal of previously recorded charges may materially affect our operating results and financial position.
f) Income Taxes
Considerable judgment must be exercised in determining the proper amount of deferred income tax assets to record on the balance sheet and also in concluding as to the correct amount of income tax liabilities relating to uncertain tax positions.
Deferred income tax assets must be evaluated quarterly and a valuation allowance should be established and maintained when it is more-likely-than-not that all or a portion of deferred income tax assets will not be realized. In determining the likelihood of realizing deferred income tax assets, management must consider all positive and negative evidence, such as the probability of future taxable income, tax planning, and the historical profitability of the entity in the jurisdiction where the asset has been recorded. Significant judgment must also be utilized by management in modeling the future taxable income of a legal entity in a particular jurisdiction. Whenever management subsequently concludes that it is more-likely-than-not that a deferred income tax asset will be realized, the valuation allowance must be partially or totally removed.
Uncertain tax positions occur, and a resulting income tax liability is recorded, when management concludes that an income tax position fails to achieve a more-likely-than-not recognition threshold. In evaluating whether or not an income tax position is uncertain, management must presume the income tax position will be examined by the relevant taxing authority that has full knowledge of all relevant information and management must consider the technical merits of an income tax position based on the statutes, legislative intent, regulations, rulings and case law specific to each income tax position. Uncertain income tax positions must be evaluated quarterly and, when they no longer fail to meet the more-likely-than-not recognition threshold, the related income tax liability must be derecognized.
Forward-Looking Statements
Certain information and statements contained in this Management’s Discussion and Analysis of Financial Condition and Results of Operations and other sections of this report, including statements using terms such as “may,” “expect,” “anticipate,” “intend,” “estimate,” “believe,” “plan,” “continue,” “could be,” or similar variations thereof, constitute forward-looking statements with respect to the financial condition, results of operations, and business of ARRIS, including statements that are based on current expectations, estimates, forecasts, and projections about the markets in which we operate and management’s beliefs and assumptions regarding these markets. These and any other statements in this document that are not statements about historical facts also are “forward-looking statements.” We caution investors that forward-looking statements made by us are not guarantees of future performance and that a variety of factors could cause our actual results to differ materially from the anticipated results or other expectations expressed in our forward-looking statements. Important factors that
71
Table of Contents
Index to Financial Statements
could cause results or events to differ from current expectations are described in the risk factors set forth in Item 1A, “Risk Factors.” These factors are not intended to be an all-encompassing list of risks and uncertainties that may affect the operations, performance, development and results of our business, but instead are the risks that we currently perceive as potentially being material. In providing forward-looking statements, ARRIS expressly disclaims any obligation to update publicly or otherwise these statements, whether as a result of new information, future events or otherwise except to the extent required by law.
| Item 7A. | Quantitative and Qualitative Disclosures About Market Risk |
We are exposed to various market risks, including interest rates and foreign currency rates. The following discussion of our risk-management activities includes “forward-looking statements” that involve risks and uncertainties. Actual results could differ materially from those projected in the forward-looking statements.
A significant portion of our products are manufactured or assembled in China, Mexico and Taiwan, and we have research and development centers outside the United States in China, England, France, India, Ireland, Northern Ireland and Sweden. Our sales into international markets have been and are expected in the future to be an important part of our business. These foreign operations are subject to the usual risks inherent in conducting business abroad, including risks with respect to currency exchange rates, economic and political destabilization, restrictive actions and taxation by foreign governments, nationalization, the laws and policies of the United States affecting trade, foreign investment and loans, and foreign tax laws.
We have certain international customers who are billed in their local currency, and we have certain predictable expenditures for international operations in local currency. Additionally, certain intercompany transactions are denominated in foreign currencies and subject to revaluation. Changes in the monetary exchange rates may adversely affect our results of operations and financial condition. To manage the volatility relating to these typical business exposures, we use a hedging strategy and may enter into various derivative transactions, when appropriate. We do not hold or issue derivative instruments for trading or other speculative purposes. The euro is the predominant currency of the customers who are billed in their local currency. Additionally, we face certain other working capital exposures related to both the euro and the British pound, and we are also subject to the revaluation of one of our long-term pension obligations denominated in the New Taiwan dollar. Taking into account the effects of foreign currency fluctuations of the euro, the British pound, the New Taiwan dollar, Australian dollar and Canadian dollar versus the U.S. dollar, a hypothetical 10% appreciation or depreciation in the value of the U.S. dollar against these foreign currencies from the prevailing market rates would result in a corresponding decrease or increase, respectively, of $5.1 million in the underlying exposures as of December 31, 2015.
All indebtedness under our senior secured credit facilities bears interest at variable rates based on LIBOR plus an applicable spread. We entered into interest rate swap arrangements to convert a notional amount of $625.0 million of our variable rate debt based on one-month LIBOR to a fixed rate. This objective of these swaps is to manage the variability of cash flows in the interest payments related to the portion of the variable rate debt designated as being hedged.
| Item 8. | Consolidated Financial Statements and Supplementary Data |
The report of our independent registered public accounting firm and consolidated financial statements and notes thereto for the Company are included in this Report and are listed in the Index to Consolidated Financial Statements.
| Item 9. | Changes in and Disagreements with Accountants on Accounting and Financial Disclosure |
Not Applicable
| Item 9A. | Controls and Procedures |
(a) Evaluation of Disclosure Controls and Procedures. Our principal executive officer and principal financial officer evaluated the effectiveness of our disclosure controls and procedures (as such term is defined in
72
Table of Contents
Index to Financial Statements
Rule 13a-15(e) under the Securities Exchange Act of 1934 as of the end of the period covered by this report (the “Evaluation Date”). Based on that evaluation, such officers concluded that, as of the Evaluation Date, our disclosure controls and procedures were effective as contemplated by the Act.
(b) Changes in Internal Control over Financial Reporting. Our principal executive officer and principal financial officer evaluated the changes in our internal control over financial reporting that occurred during the most recent fiscal quarter. Based on that evaluation, our principal executive officer and principal financial officer concluded that, there had been no change in our internal control over financial reporting during the most recent fiscal quarter that has materially affected, or is reasonably likely to materially affect, our internal control over financial reporting.
On January 4, 2016 we completed our acquisition of Pace and we are in the process of implementing our internal controls over financial reporting for Pace. Accordingly, as permitted by SEC rules, the assessment of internal controls over financial reporting described above excludes the entities acquired as part of the Pace acquisition.
| Item 9B. | Other Information |
Not Applicable
73
Table of Contents
Index to Financial Statements
MANAGEMENT’S REPORT ON INTERNAL CONTROL OVER FINANCIAL REPORTING
ARRIS Group, Inc.’s management is responsible for establishing and maintaining an adequate system of internal control over financial reporting as required by the Sarbanes-Oxley Act of 2002 and as defined in Exchange Act Rule 13a-15(f). A control system can provide only reasonable, not absolute, assurance that the objectives of the control system are met.
Under management’s supervision, an evaluation of the design and effectiveness of ARRIS Group, Inc.’s internal control over financial reporting was conducted based on the framework in Internal Control — Integrated Framework issued by the Committee of Sponsoring Organizations of the Treadway Commission (2013 framework)(COSO). Based on this evaluation, management concluded that ARRIS Group, Inc.’s internal control over financial reporting was effective as of December 31, 2015.
The effectiveness of ARRIS Group, Inc.’s internal control over financial reporting as of December 31, 2015 has been audited by Ernst & Young LLP, an independent registered public accounting firm retained as auditors of ARRIS Group, Inc.’s financial statement, as stated in their report which is included herein.
| /s/ R J STANZIONE |
| Robert J. Stanzione Chief Executive Officer, Chairman |
| /s/ DAVID B, POTTS |
| David B. Potts Executive Vice President, Chief Financial Officer and Chief Accounting Officer |
February 29, 2016
74
Table of Contents
Index to Financial Statements
Report of Independent Registered Public Accounting Firm
The Board of Directors and Stockholders of ARRIS International plc.
We have audited ARRIS Group, Inc.’s internal control over financial reporting as of December 31, 2015, based on criteria established in Internal Control — Integrated Framework issued by the Committee of Sponsoring Organizations of the Treadway Commission (2013 framework) (the COSO criteria). ARRIS Group, Inc.’s management is responsible for maintaining effective internal control over financial reporting, and for its assessment of the effectiveness of internal control over financial reporting included in the accompanying Management’s Report on Internal Control over Financial Reporting. Our responsibility is to express an opinion on the Company’s internal control over financial reporting based on our audit.
We conducted our audit in accordance with the standards of the Public Company Accounting Oversight Board (United States). Those standards require that we plan and perform the audit to obtain reasonable assurance about whether effective internal control over financial reporting was maintained in all material respects. Our audit included obtaining an understanding of internal control over financial reporting, assessing the risk that a material weakness exists, testing and evaluating the design and operating effectiveness of internal control based on the assessed risk, and performing such other procedures as we considered necessary in the circumstances. We believe that our audit provides a reasonable basis for our opinion.
A company’s internal control over financial reporting is a process designed to provide reasonable assurance regarding the reliability of financial reporting and the preparation of financial statements for external purposes in accordance with generally accepted accounting principles. A company’s internal control over financial reporting includes those policies and procedures that (1) pertain to the maintenance of records that, in reasonable detail, accurately and fairly reflect the transactions and dispositions of the assets of the company; (2) provide reasonable assurance that transactions are recorded as necessary to permit preparation of financial statements in accordance with generally accepted accounting principles, and that receipts and expenditures of the company are being made only in accordance with authorizations of management and directors of the company; and (3) provide reasonable assurance regarding prevention or timely detection of unauthorized acquisition, use, or disposition of the company’s assets that could have a material effect on the financial statements.
Because of its inherent limitations, internal control over financial reporting may not prevent or detect misstatements. Also, projections of any evaluation of effectiveness to future periods are subject to the risk that controls may become inadequate because of changes in conditions, or that the degree of compliance with the policies or procedures may deteriorate.
In our opinion, ARRIS Group, Inc. maintained, in all material respects, effective internal control over financial reporting as of December 31, 2015, based on the COSO criteria.
We also have audited, in accordance with the standards of the Public Company Accounting Oversight Board (United States), the consolidated balance sheets of ARRIS Group, Inc. as of December 31, 2015 and 2014, and the related consolidated statements of operations, comprehensive income (loss), cash flows, and stockholders’ equity for each of the three years in the period ended December 31, 2015, and our report dated February 29, 2016, expressed an unqualified opinion thereon.
/s/ Ernst & Young LLP
Atlanta, Georgia
February 29, 2016
75
Table of Contents
Index to Financial Statements
INDEX TO CONSOLIDATED FINANCIAL STATEMENTS
76
Table of Contents
Index to Financial Statements
Report of Independent Registered Public Accounting Firm
The Board of Directors and Stockholders of ARRIS International plc.
We have audited the accompanying consolidated balance sheets of ARRIS Group, Inc. as of December 31, 2015 and 2014, and the related consolidated statements of operations, comprehensive income (loss), cash flows and stockholders’ equity for each of the three years in the period ended December 31, 2015. These financial statements are the responsibility of the Company’s management. Our responsibility is to express an opinion on these financial statements based on our audits.
We conducted our audits in accordance with the standards of the Public Company Accounting Oversight Board (United States). Those standards require that we plan and perform the audit to obtain reasonable assurance about whether the financial statements are free of material misstatement. An audit includes examining, on a test basis, evidence supporting the amounts and disclosures in the financial statements. An audit also includes assessing the accounting principles used and significant estimates made by management, as well as evaluating the overall financial statement presentation. We believe that our audits provide a reasonable basis for our opinion.
In our opinion, the financial statements referred to above present fairly, in all material respects, the consolidated financial position of ARRIS Group, Inc. at December 31, 2015 and 2014, and the consolidated results of its operations and its cash flows for each of the three years in the period ended December 31, 2015, in conformity with U.S. generally accepted accounting principles.
We also have audited, in accordance with the standards of the Public Company Accounting Oversight Board (United States), ARRIS Group, Inc.’s internal control over financial reporting as of December 31, 2015, based on criteria established in Internal Control-Integrated Framework issued by the Committee of Sponsoring Organizations of the Treadway Commission (2013 framework) and our report dated February 29, 2016 expressed an unqualified opinion thereon.
/s/ Ernst & Young LLP
Atlanta, Georgia
February 29, 2016
77
Table of Contents
Index to Financial Statements
ARRIS GROUP, INC.
| December 31, | ||||||||
| 2015 | 2014 | |||||||
| |
(in thousands except share and per share data) |
| ||||||
| ASSETS |
||||||||
| Current assets: |
||||||||
| Cash and cash equivalents |
$ | 863,582 | $ | 565,790 | ||||
| Short-term investments, at fair value |
15,470 | 126,748 | ||||||
|
|
|
|
|
|||||
| Total cash, cash equivalents and short-term investments |
879,052 | 692,538 | ||||||
| Accounts receivable (net of allowances for doubtful accounts of $9,975 in 2015 and $6,392 in 2014) |
651,893 | 598,603 | ||||||
| Other receivables |
12,233 | 10,640 | ||||||
| Inventories (net of reserves of $57,026 in 2015 and $62,359 in 2014) |
401,592 | 401,165 | ||||||
| Prepaid income taxes |
25,624 | 11,023 | ||||||
| Prepaids |
19,319 | 27,497 | ||||||
| Current deferred income taxes |
— | 113,390 | ||||||
| Other current assets |
120,490 | 55,257 | ||||||
|
|
|
|
|
|||||
| Total current assets |
2,110,203 | 1,910,113 | ||||||
| Property, plant and equipment (net of accumulated depreciation of $304,532 in 2015 and $265,811 in 2014) |
312,311 | 366,431 | ||||||
| Goodwill |
1,013,963 | 936,067 | ||||||
| Intangible assets (net of accumulated amortization of $850,873 in 2015 and $619,283 in 2014) |
810,448 | 943,388 | ||||||
| Investments |
69,542 | 77,640 | ||||||
| Noncurrent deferred income taxes |
185,439 | 71,686 | ||||||
| Other assets |
21,610 | 35,717 | ||||||
|
|
|
|
|
|||||
| Total assets |
$ | 4,523,516 | $ | 4,341,042 | ||||
|
|
|
|
|
|||||
| LIABILITIES AND STOCKHOLDERS’ EQUITY |
||||||||
| Current liabilities: |
||||||||
| Accounts payable |
$ | 514,877 | $ | 480,150 | ||||
| Accrued compensation, benefits and related taxes |
111,389 | 145,278 | ||||||
| Accrued warranty |
27,630 | 42,763 | ||||||
| Deferred revenue |
137,606 | 92,772 | ||||||
| Current portion of long-term debt and lease financing obligation |
43,591 | 67,024 | ||||||
| Income taxes payable |
8,368 | 10,610 | ||||||
| Other accrued liabilities |
169,169 | 165,080 | ||||||
|
|
|
|
|
|||||
| Total current liabilities |
1,012,630 | 1,003,677 | ||||||
| Long-term debt and lease financing obligation, net of current portion |
1,496,243 | 1,448,960 | ||||||
| Accrued pension |
64,052 | 64,917 | ||||||
| Noncurrent income taxes |
42,197 | 41,082 | ||||||
| Noncurrent deferred income taxes |
503 | 274 | ||||||
| Other noncurrent liabilities |
66,930 | 91,371 | ||||||
|
|
|
|
|
|||||
| Total liabilities |
2,682,555 | 2,650,281 | ||||||
|
|
|
|
|
|||||
| Stockholders’ equity: |
||||||||
| Preferred stock, par value $1.00 per share, 5.0 million shares authorized; none issued and outstanding |
— | — | ||||||
| Common stock, par value $0.01 per share, 320.0 million shares authorized; 147.5 million and 145.1 million shares issued and outstanding in 2015 and 2014, respectively |
1,790 | 1,796 | ||||||
| Capital in excess of par value |
1,777,276 | 1,739,700 | ||||||
| Treasury stock at cost, 35.1 million shares and 34.2 million shares in 2015 and 2014, respectively |
(331,329 | ) | (306,330 | ) | ||||
| Retained earnings |
358,823 | 266,642 | ||||||
| Accumulated other comprehensive income |
(12,646 | ) | (11,047 | ) | ||||
|
|
|
|
|
|||||
| Total ARRIS Group, Inc. stockholders’ equity |
1,793,914 | 1,690,761 | ||||||
| Stockholders’ equity attributable to noncontrolling interest |
47,047 | — | ||||||
|
|
|
|
|
|||||
| Total stockholders’ equity |
1,840,961 | 1,690,761 | ||||||
|
|
|
|
|
|||||
| Total liabilities and stockholders’ equity |
$ | 4,523,516 | $ | 4,341,042 | ||||
|
|
|
|
|
|||||
See accompanying notes to the consolidated financial statements.
78
Table of Contents
Index to Financial Statements
ARRIS GROUP, INC.
CONSOLIDATED STATEMENTS OF OPERATIONS
| For the Years Ended December 31, | ||||||||||||
| 2015 | 2014 | 2013 | ||||||||||
| (in thousands, except per share data) | ||||||||||||
| Net sales |
$ | 4,798,332 | $ | 5,322,921 | $ | 3,620,902 | ||||||
| Cost of sales |
3,379,409 | 3,740,425 | 2,598,154 | |||||||||
|
|
|
|
|
|
|
|||||||
| Gross margin |
1,418,923 | 1,582,496 | 1,022,748 | |||||||||
| Operating expenses: |
||||||||||||
| Selling, general, and administrative expenses |
417,085 | 410,568 | 338,252 | |||||||||
| Research and development expenses |
534,168 | 556,575 | 425,825 | |||||||||
| Amortization of intangible assets |
227,440 | 236,521 | 193,637 | |||||||||
| Integration, acquisition, restructuring and other costs |
29,277 | 37,498 | 83,047 | |||||||||
|
|
|
|
|
|
|
|||||||
| Total operating expenses |
1,207,970 | 1,241,162 | 1,040,761 | |||||||||
| Operating income (loss) |
210,953 | 341,334 | (18,013 | ) | ||||||||
| Other expense (income): |
||||||||||||
| Interest expense |
70,936 | 62,901 | 67,888 | |||||||||
| Loss on investments |
6,220 | 10,961 | 2,698 | |||||||||
| Loss (gain) on foreign currency |
20,761 | 2,637 | (3,502 | ) | ||||||||
| Interest income |
(2,379 | ) | (2,590 | ) | (2,936 | ) | ||||||
| Other expense (income), net |
8,362 | 28,195 | 13,989 | |||||||||
|
|
|
|
|
|
|
|||||||
| Income (loss) before income taxes |
107,053 | 239,230 | (96,150 | ) | ||||||||
| Income tax expense (benefit) |
22,594 | (87,981 | ) | (47,390 | ) | |||||||
|
|
|
|
|
|
|
|||||||
| Consolidated net income (loss) |
84,459 | 327,211 | (48,760 | ) | ||||||||
| Net loss attributable to noncontrolling interest |
(7,722 | ) | — | — | ||||||||
|
|
|
|
|
|
|
|||||||
| Net income (loss) attributable to ARRIS Group, Inc. |
$ | 92,181 | $ | 327,211 | $ | (48,760 | ) | |||||
|
|
|
|
|
|
|
|||||||
| Net income (loss) per common share (1): |
||||||||||||
| Basic |
$ | 0.63 | $ | 2.27 | $ | (0.37 | ) | |||||
|
|
|
|
|
|
|
|||||||
| Diluted |
$ | 0.62 | $ | 2.21 | $ | (0.37 | ) | |||||
|
|
|
|
|
|
|
|||||||
| Weighted average common shares: |
||||||||||||
| Basic |
146,388 | 144,386 | 131,980 | |||||||||
|
|
|
|
|
|
|
|||||||
| Diluted |
149,359 | 148,280 | 131,980 | |||||||||
|
|
|
|
|
|
|
|||||||
| (1) | Calculated based on net income attributable to shareowners of ARRIS Group, Inc. |
See accompanying notes to the consolidated financial statements.
79
Table of Contents
Index to Financial Statements
ARRIS GROUP, INC.
CONSOLIDATED STATEMENTS OF COMPREHENSIVE INCOME (LOSS)
| For the Years Ended December 31, | ||||||||||||
| 2015 | 2014 | 2013 | ||||||||||
| (in thousands) | ||||||||||||
| Consolidated net income (loss) |
$ | 84,459 | $ | 327,211 | $ | (48,760 | ) | |||||
| Available-for-sale securities: |
||||||||||||
| Unrealized gain (loss) on available-for-sale securities, net of tax (expense) benefit of $37, $73 and $(19) in 2015, 2014 and 2013, respectively |
(64 | ) | (127 | ) | 65 | |||||||
| Reclassification adjustments recognized in net income, net of tax (expense) benefit of $(100), $89 and $(10) in 2015, 2014 and 2013, respectively |
172 | (154 | ) | 35 | ||||||||
|
|
|
|
|
|
|
|||||||
| Net change in available-for-sale |
108 | (281 | ) | 100 | ||||||||
|
|
|
|
|
|
|
|||||||
| Derivative instruments: |
||||||||||||
| Unrealized loss on derivative instruments, net of tax benefit of $4,936, $3,149 and $2,613 in 2015, 2014 and 2013, respectively |
(8,319 | ) | (5,391 | ) | (4,527 | ) | ||||||
| Reclassification adjustments recognized in net income, net of tax expense of $(2,791), $(2,784) and $(1,146) in 2015, 2014 and 2013, respectively |
4,704 | 4,766 | 1,986 | |||||||||
|
|
|
|
|
|
|
|||||||
| Net change in derivative instruments |
(3,615 | ) | (625 | ) | (2,541 | ) | ||||||
|
|
|
|
|
|
|
|||||||
| Pension liabilities: |
||||||||||||
| Unrealized gain (loss) on pension liability, net of tax (expense) benefit of $(1,082), $2,709 and $(982) in 2015, 2014 and 2013, respectively |
2,044 | (5,273 | ) | 4,670 | ||||||||
| Reclassification adjustments recognized in net income, net of tax expense of $(498), $(261) and $(309) in 2015, 2014 and 2013, respectively |
942 | 508 | 1,472 | |||||||||
|
|
|
|
|
|
|
|||||||
| Net change in pension liabilities |
2,986 | (4,765 | ) | 6,142 | ||||||||
|
|
|
|
|
|
|
|||||||
| Cumulative translation adjustments |
(1,078 | ) | (714 | ) | 173 | |||||||
|
|
|
|
|
|
|
|||||||
| Other comprehensive income (loss), net of tax |
(1,599 | ) | (6,385 | ) | 3,874 | |||||||
|
|
|
|
|
|
|
|||||||
| Comprehensive income (loss) |
82,860 | 320,826 | (44,886 | ) | ||||||||
|
|
|
|
|
|
|
|||||||
| Comprehensive income (loss) attributable to noncontrolling interest |
(7,747 | ) | — | — | ||||||||
|
|
|
|
|
|
|
|||||||
| Comprehensive income (loss) attributable to ARRIS Group, Inc. |
$ | 90,607 | $ | 320,826 | $ | (44,886 | ) | |||||
|
|
|
|
|
|
|
|||||||
See accompanying notes to the consolidated financial statements.
80
Table of Contents
Index to Financial Statements
ARRIS GROUP, INC.
CONSOLIDATED STATEMENTS OF CASH FLOWS
| Years Ended December 31, | ||||||||||||
| 2015 | 2014 | 2013 | ||||||||||
| (in thousands) | ||||||||||||
| Operating activities: |
||||||||||||
| Consolidated net income (loss) |
$ | 84,459 | $ | 327,211 | $ | (48,760 | ) | |||||
| Depreciation |
71,780 | 78,988 | 61,516 | |||||||||
| Amortization of intangible assets |
231,590 | 236,751 | 193,637 | |||||||||
| Amortization of deferred financing fees and debt discount |
9,646 | 11,575 | 9,982 | |||||||||
| Deferred income tax provision (benefit) |
5,418 | (163,485 | ) | (55,763 | ) | |||||||
| Stock compensation expense |
64,218 | 53,799 | 35,789 | |||||||||
| Provision for doubtful accounts |
2,997 | 5,336 | (658 | ) | ||||||||
| Revenue reduction related to Comcast’s investment in ARRIS |
— | — | 13,182 | |||||||||
| Mark-to-market fair value adjustment related to Comcast’s investment in ARRIS |
— | — | 13,189 | |||||||||
| Non-cash restructuring and related charges |
— | — | 6,761 | |||||||||
| Non-cash interest expense on convertible notes |
— | — | 9,926 | |||||||||
| Loss on disposal and write down of assets |
7,776 | 4,247 | 1,657 | |||||||||
| Loss on investments |
6,220 | 10,961 | 2,698 | |||||||||
| Excess income tax benefits from stock-based compensation plans |
(3,997 | ) | (8,959 | ) | (7,178 | ) | ||||||
| Changes in operating assets and liabilities, net of effect of acquisitions and dispositions: |
||||||||||||
| Accounts receivable |
(55,132 | ) | 16,796 | 9,241 | ||||||||
| Other receivables |
(6,017 | ) | (2,997 | ) | (2,182 | ) | ||||||
| Inventories |
(6,685 | ) | (71,036 | ) | 74,111 | |||||||
| Accounts payable and accrued liabilities |
15,065 | (116,909 | ) | 247,301 | ||||||||
| Prepaids and other, net |
(83,466 | ) | 77,003 | (1,733 | ) | |||||||
|
|
|
|
|
|
|
|||||||
| Net cash provided by operating activities |
343,872 | 459,281 | 562,716 | |||||||||
| Investing activities: |
||||||||||||
| Purchases of investments |
(48,566 | ) | (127,780 | ) | (104,626 | ) | ||||||
| Sales of investments |
161,824 | 59,679 | 479,781 | |||||||||
| Proceeds from equity investments |
2,904 | — | 14,780 | |||||||||
| Purchases of property, plant and equipment |
(49,890 | ) | (56,588 | ) | (71,443 | ) | ||||||
| Purchases of intangible assets |
(39,340 | ) | — | — | ||||||||
| Proceeds from sale-leaseback transaction |
24,960 | — | — | |||||||||
| Acquisition, net of cash acquired |
(97,905 | ) | — | (2,208,114 | ) | |||||||
| Other, net |
67 | 103 | 120 | |||||||||
|
|
|
|
|
|
|
|||||||
| Net cash used in investing activities |
(45,946 | ) | (124,586 | ) | (1,889,502 | ) | ||||||
See accompanying notes to the consolidated financial statements.
81
Table of Contents
Index to Financial Statements
ARRIS GROUP, INC.
CONSOLIDATED STATEMENTS OF CASH FLOWS (Continued)
| Years Ended December 31, | ||||||||||||
| 2015 | 2014 | 2013 | ||||||||||
| (in thousands) | ||||||||||||
| Financing activities: |
||||||||||||
| Proceeds from issuance of common stock, net |
$ | 16,189 | $ | 19,196 | $ | 175,072 | ||||||
| Repurchase of common stock |
(24,999 | ) | — | — | ||||||||
| Excess income tax benefits from stock-based compensation plans |
3,997 | 8,959 | 7,178 | |||||||||
| Repurchase of shares to satisfy employee minimum tax withholdings |
(46,680 | ) | (29,845 | ) | (12,664 | ) | ||||||
| Proceeds from issuance of debt |
— | — | 1,925,000 | |||||||||
| Payment of debt obligations |
(53,500 | ) | (209,653 | ) | (404,488 | ) | ||||||
| Payment of lease financing obligation |
(425 | ) | — | — | ||||||||
| Proceeds from sale-leaseback financing transaction |
58,729 | — | — | |||||||||
| Payment for debt discount |
(3,247 | ) | — | (9,853 | ) | |||||||
| Payment for deferred financing fees |
(4,992 | ) | — | (42,724 | ) | |||||||
| Contribution from noncontrolling interest |
54,794 | — | — | |||||||||
|
|
|
|
|
|
|
|||||||
| Net cash (used in) provided by financing activities |
(134 | ) | (211,343 | ) | 1,637,521 | |||||||
| Net increase in cash and cash equivalents |
297,792 | 123,352 | 310,735 | |||||||||
| Cash and cash equivalents at beginning of year |
565,790 | 442,438 | 131,703 | |||||||||
|
|
|
|
|
|
|
|||||||
| Cash and cash equivalents at end of year |
$ | 863,582 | $ | 565,790 | $ | 442,438 | ||||||
|
|
|
|
|
|
|
|||||||
| Supplemental cash flow information: |
||||||||||||
| Interest paid during the year |
$ | 60,798 | $ | 51,122 | $ | 48,008 | ||||||
|
|
|
|
|
|
|
|||||||
| Income taxes paid during the year |
$ | 39,065 | $ | 37,152 | $ | 12,470 | ||||||
|
|
|
|
|
|
|
|||||||
| Non-cash investing and financing activities: debt assumed in acquisition |
$ | 15,000 | $ | — | $ | — | ||||||
|
|
|
|
|
|
|
|||||||
Supplemental cash flow information:
As part of the acquisition agreement entered into with the Motorola Home acquisition, in the third quarter of 2013 the Company received $85 million in cash for indemnification of certain retained litigation by the seller for which the Company remitted payment of $85 million as settlement. This has been reflected in the cash flows from operating activities.
In addition to the $85 million discussed in the aforementioned paragraph, the Company also settled a retained litigation for $196 million, $50 million of which was paid directly by the Company and the remaining indemnified and paid by Google. Since the Company had the right to receive the cash from Google and the obligation to pay the amount to a third party, we have included the gross amounts in the cash flows from operating activities.
See accompanying notes to the consolidated financial statements.
82
Table of Contents
Index to Financial Statements
ARRIS GROUP, INC.
CONSOLIDATED STATEMENTS OF STOCKHOLDERS’ EQUITY
| Common Stock |
Capital in Excess of Par Value |
Treasury Stock |
Retained Earnings (Accumulated Deficit) |
Accumulated Other Comprehensive Loss |
Total ARRIS Group, Inc. stockholders’ equity |
Non- controlling Interest |
Total stockholders’ equity |
|||||||||||||||||||||||||
| Balance, January 1, 2013 |
$ | 1,488 | $ | 1,285,575 | $ | (306,330 | ) | $ | (11,809 | ) | $ | (8,536 | ) | $ | 960,388 | $ | — | $ | 960,388 | |||||||||||||
| Net loss |
— | — | — | (48,760 | ) | — | (48,760 | ) | — | (48,760 | ) | |||||||||||||||||||||
| Other comprehensive income (loss), net of tax |
— | — | — | — | 3,874 | 3,874 | — | 3,874 | ||||||||||||||||||||||||
| Compensation under stock award plans |
— | 35,789 | — | — | — | 35,789 | — | 35,789 | ||||||||||||||||||||||||
| Issuance of common stock and other |
278 | 365,010 | — | — | — | 365,288 | — | 365,288 | ||||||||||||||||||||||||
| Income tax benefit related to exercise of stock options |
— | 2,408 | — | — | — | 2,408 | — | 2,408 | ||||||||||||||||||||||||
|
|
|
|
|
|
|
|
|
|
|
|
|
|
|
|
|
|||||||||||||||||
| Balance, December 31, 2013 |
1,766 | 1,688,782 | (306,330 | ) | (60,569 | ) | (4,662 | ) | 1,318,987 | 1,318,987 | ||||||||||||||||||||||
| Net income |
— | — | — | 327,211 | — | 327,211 | — | 327,211 | ||||||||||||||||||||||||
| Other comprehensive income (loss), net of tax |
— | — | — | — | (6,385 | ) | (6,385 | ) | — | (6,385 | ) | |||||||||||||||||||||
| Compensation under stock award plans |
— | 53,799 | — | — | — | 53,799 | — | 53,799 | ||||||||||||||||||||||||
| Issuance of common stock and other |
30 | (10,679 | ) | — | — | — | (10,649 | ) | — | (10,649 | ) | |||||||||||||||||||||
| Income tax benefit related to exercise of stock options |
— | 8,959 | — | — | — | 8,959 | — | 8,959 | ||||||||||||||||||||||||
| Other |
— | (1,161 | ) | — | — | — | (1,161 | ) | — | (1,161 | ) | |||||||||||||||||||||
|
|
|
|
|
|
|
|
|
|
|
|
|
|
|
|
|
|||||||||||||||||
| Balance, December 31, 2014 |
$ | 1,796 | $ | 1,739,700 | $ | (306,330 | ) | $ | 266,642 | $ | (11,047 | ) | $ | 1,690,761 | $ | — | $ | 1,690,761 | ||||||||||||||
| Net income (loss) |
— | — | — | 92,181 | — | 92,181 | (7,722 | ) | 84,459 | |||||||||||||||||||||||
| Other comprehensive income (loss), net of tax |
— | — | — | — | (1,599 | ) | (1,599 | ) | (25 | ) | (1,624 | ) | ||||||||||||||||||||
| Contribution from noncontrolling interest |
— | — | — | — | — | — | 54,794 | 54,794 | ||||||||||||||||||||||||
| Compensation under stock award plans |
— | 64,218 | — | — | — | 64,218 | — | 64,218 | ||||||||||||||||||||||||
| Issuance of common stock and other |
(6 | ) | (30,572 | ) | — | — | — | (30,578 | ) | — | (30,578 | ) | ||||||||||||||||||||
| Repurchase of common stock, net of issuances |
— | — | (24,999 | ) | — | — | (24,999 | ) | — | (24,999 | ) | |||||||||||||||||||||
| Income tax benefit related to exercise of stock options |
— | 3,930 | — | — | — | 3,930 | — | 3,930 | ||||||||||||||||||||||||
|
|
|
|
|
|
|
|
|
|
|
|
|
|
|
|
|
|||||||||||||||||
| Balance, December 31, 2015 |
$ | 1,790 | $ | 1,777,276 | $ | (331,329 | ) | $ | 358,823 | $ | (12,646 | ) | $ | 1,793,914 | $ | 47,047 | $ | 1,840,961 | ||||||||||||||
|
|
|
|
|
|
|
|
|
|
|
|
|
|
|
|
|
|||||||||||||||||
See accompanying notes to the consolidated financial statements.
83
Table of Contents
Index to Financial Statements
NOTES TO THE CONSOLIDATED FINANCIAL STATEMENTS
Note 1. Organization and Basis of Presentation
On January 4, 2016, ARRIS Group, Inc. (“ARRIS Group”) completed its combination (the “Combination”) with Pace plc, a company incorporated in England and Wales (“Pace”). In connection with the Combination, (i) ARRIS International plc (the “Registrant”), a company incorporated in England and Wales, acquired all of the outstanding ordinary shares of Pace (the “Pace Acquisition”) and (ii) a wholly-owned subsidiary of the Registrant was merged with and into ARRIS Group (the “Merger”), with ARRIS Group surviving the Merger as an indirect wholly-owned subsidiary of the Registrant. Under the terms of the Combination, (a) Pace shareholders received 132.5 pence in cash and 0.1455 ordinary shares of the Registrant for each Pace Share they held, and (b) ARRIS Group stockholders received one ordinary share of the Registrant for each share of ARRIS Group common stock they held. Following the Combination, ARRIS Group became an indirect wholly-owned subsidiary of the Registrant and Pace became a direct wholly-owned subsidiary of the Registrant. The ordinary shares of the Registrant trade on the NASDAQ under the symbol “ARRS.”
This Annual Report on Form 10-K is being filed by the Registrant on behalf of, and as successor, to ARRIS Group. The Registrant is deemed to be the successor to ARRIS Group pursuant to Rule 12g-3(a) under the Securities Exchange Act of 1934, as amended (the “Exchange Act”), and the ordinary shares of the Registrant are deemed to be registered under Section 12(b) of the Exchange Act. In accordance with Rule 12g-3(g) under the Exchange Act, this Annual Report on Form 10-K covers the last full fiscal year of ARRIS Group and generally contains information that would be required if filed by ARRIS Group. Historical financial results presented herein are those of ARRIS Group only and do not reflect any results of Pace.
ARRIS Group, Inc. (together with its consolidated subsidiaries and consolidated venture, except as the context otherwise indicates, “ARRIS” or the “Company”) is a global media entertainment and data communications solutions provider, headquartered in Suwanee, Georgia. The Company operates in two business segments, Customer Premises Equipment and Network & Cloud (See Note 10 Segment Information of Notes to the Consolidated Financial Statements for additional details.), specializing in enabling service providers including cable, telephone, and digital broadcast satellite operators and media programmers to deliver media, voice, and IP data services to their subscribers. ARRIS is a leader in set-tops, digital video and Internet Protocol Television distribution systems, broadband access infrastructure platforms, and associated data and voice Customer Premises Equipment. The Company’s solutions are complemented by a broad array of services including technical support, repair and refurbishment, and systems design and integration.
Note 2. Summary of Significant Accounting Policies
(a) Consolidation
The accompanying consolidated financial statements include the accounts of the Company and its wholly owned foreign and domestic subsidiaries and consolidated venture in which the Company owns more than 50% of the outstanding voting shares of the entity. Intercompany accounts and transactions have been eliminated in consolidation. The consolidated financial statements are prepared in accordance with accounting principles generally accepted in the United States (U.S. GAAP), and our reporting currency is the United States Dollar (USD).
(b) Use of Estimates
The preparation of the consolidated financial statements in conformity with U.S. generally accepted accounting principles requires management to make estimates and assumptions that affect the amounts reported in the consolidated financial statements and accompanying notes. Actual results could differ from those estimates.
(c) Reclassifications
Certain prior year amounts in the financial statements and notes have been reclassified to conform to the fiscal year 2015 presentation.
84
Table of Contents
Index to Financial Statements
(d) Cash, Cash Equivalents, and Investments
ARRIS’s cash and cash equivalents (which are highly-liquid investments with an original maturity of three months or less) are primarily held in demand deposit accounts and money market accounts. The Company holds investments consisting of mutual funds and debt securities classified as available-for-sale, which are stated at estimated fair value. The debt securities consist primarily of commercial paper, certificates of deposits, short term corporate obligations and U.S. government agency financial instruments. These investments are on deposit with major financial institutions.
The Company accounts for investments in companies in which it has significant influence, or ownership between 20% and 50% of the investee under the equity method of accounting. Under the equity method, the investment is originally recorded at cost and adjusted to recognize the Company’s share of net earnings or losses, any basis difference of the investee, and dividends received.
Investments in which we do not exercise significant influence (generally less than a 20 percent ownership interest) are accounted for under the cost method.
The Company evaluates its investments for impairment whenever events or changes in circumstances indicate that the carrying amount of such investments may not be recoverable. An investment is written down to fair value if there is evidence of a loss in value which is other than temporary.
(e) Accounts Receivable and Allowance for Doubtful Accounts and Sales Returns
Accounts receivable are stated at amounts owed by the customers, net of allowance for doubtful accounts, sales returns and allowances. ARRIS establishes a reserve for doubtful accounts based upon the historical experience and leading market indicators in collecting accounts receivable. A majority of the accounts receivable are from a few large cable system operators and telecommunication companies, either with investment rated debt outstanding or with substantial financial resources, and have favorable payment histories. If ARRIS was to have a collection problem with one of its major customers, it is possible the reserve will not be sufficient. ARRIS calculates the reserve for uncollectible accounts using a model that considers customer payment history, recent customer press releases, bankruptcy filings, if any, Dun & Bradstreet reports, and financial statement reviews. The calculation is reviewed by management to assess whether there needs to be an adjustment to the reserve for uncollectible accounts. The reserve is established through a charge to the provision and represents amounts of current and past due customer receivable balances of which management deems a loss to be both probable and estimable. Accounts receivable are charged to the allowance when determined to be no longer collectible.
ARRIS also establishes a reserve for sales returns and allowances. The reserve is an estimate of the impact of potential returns based upon historic trends.
The following table represents a summary of the changes in the reserve for allowance for doubtful accounts, and sales returns and allowances for fiscal 2015, 2014 and 2013 (in thousands):
| 2015 | 2014 | 2013 | ||||||||||
| Balance at beginning of fiscal year |
$ | 6,392 | $ | 1,887 | $ | 1,630 | ||||||
| Charges to expenses |
2,997 | 5,336 | 257 | |||||||||
| Reclassification (deductions) |
586 | (831 | ) | — | ||||||||
|
|
|
|
|
|
|
|||||||
| Balance at end of fiscal year |
$ | 9,975 | $ | 6,392 | $ | 1,887 | ||||||
|
|
|
|
|
|
|
|||||||
(f) Inventories
Inventories are stated at the lower of cost market. Inventory cost is determined on a first-in, first-out basis. The cost of work-in-process and finished goods is comprised of material, labor, and overhead.
85
Table of Contents
Index to Financial Statements
(g) Revenue recognition
ARRIS generates revenue as a result of varying activities, including the delivery of stand-alone equipment, custom design and installation services, and bundled sales arrangements inclusive of equipment, software and services. The revenue from these activities is recognized in accordance with applicable accounting guidance and their related interpretations.
Revenue is recognized when all of the following criteria have been met:
| • | When persuasive evidence of an arrangement exists. Contracts and customer purchase orders are used to determine the existence of an arrangement. For professional services evidence that an agreement exists includes information documenting the scope of work to be performed, price, and customer acceptance. These are contained in the signed contract, purchase order, or other documentation that shows scope, price and customer acceptance. |
| • | Delivery has occurred. Shipping documents, proof of delivery and customer acceptance (when applicable) are used to verify delivery. |
| • | The fee is fixed or determinable. Pricing is considered fixed or determinable at the execution of a customer arrangement, based on specific products and quantities to be delivered at specific prices. This determination includes a review of the payment terms associated with the transaction and whether the sales price is subject to refund or adjustment or future discounts. |
| • | Collectability is reasonably assured. The Company assesses the ability to collect from customers based on a number of factors that include information supplied by credit agencies, analyzing customer accounts, reviewing payment history and consulting bank references. Should a circumstance arise where a customer is deemed not creditworthy, all revenue related to the transaction will be deferred until such time that payment is received and all other criteria to allow the Company to recognize revenue have been met. |
Revenue is deferred if any of the above revenue recognition criteria is not met as well as when certain circumstances exist for any of our products or services, including, but not limited to:
| • | When undelivered products or services that are essential to the functionality of the delivered product exist, revenue is deferred until such undelivered products or services are delivered as the customer would not have full use of the delivered elements. |
| • | When required acceptance has not occurred. |
| • | When trade-in rights are granted at the time of sale, that portion of the sale is deferred until the trade-in right is exercised or the right expires. In determining the deferral amount, management estimates the expected trade-in rate and future value of the product upon trade-in. These factors are periodically reviewed and updated by management, and the updates may result in either an increase or decrease in the deferral. |
Equipment — The Company provides operators with equipment that can be placed within various stages of a broadband system that allows for the delivery of telephony, video and high-speed data as well as outside plant construction and maintenance equipment. For equipment sales, revenue recognition is generally established when the products have been shipped, risk of loss has transferred, objective evidence exists that the product has been accepted, and no significant obligations remain relative to the transaction. Additionally, based on historical experience, ARRIS has established reliable estimates related to sales returns and other allowances for discounts. These estimates are recorded as a reduction to revenue at the time the revenue is initially recorded.
Multiple Element Arrangements — Certain customer transactions may include multiple deliverables based on the bundling of equipment, software and services. When a multiple element arrangement exists, the fee from the arrangement is allocated to the various deliverables, to the extent appropriate, so that the proper amount can be recognized as revenue as each element is delivered. Based on the composition of the arrangement, the Company analyzes the provisions of the accounting guidance to determine the appropriate model that is applied
86
Table of Contents
Index to Financial Statements
towards accounting for the multiple element arrangement. If the arrangement includes a combination of elements that fall within different applicable guidance, ARRIS follows the provisions of the hierarchal literature to separate those elements from each other and apply the relevant guidance to each.
To determine the estimated selling price in multiple-element arrangements, the Company first looks to establish vendor specific objective evidence (“VSOE”) of the selling price using the prices charged for a deliverable when sold separately. If VSOE of the selling price cannot be established for a deliverable, the Company looks to establish third-party evidence (“TPE”) of the selling price by evaluating the pricing of similar and interchangeable competitor products or services in stand-alone arrangements. However, as ARRIS’s products typically contain a significant element of proprietary technology and may offer substantially different features and functionality from its competitors, ARRIS has been unable to obtain comparable pricing information with respect to its competitors’ products. Therefore, the Company has not been able to obtain reliable evidence of TPE of the selling price. If neither VSOE nor TPE of the selling price can be established for a deliverable, the Company establishes best estimate selling price (“BESP”) by reviewing historical transaction information and considering several other internal factors, including discounting and margin objectives. The Company regularly reviews estimated selling price of the product offerings and maintain internal controls over the establishment and updates of these estimates.
ARRIS’s equipment deliverables typically include proprietary operating system software, which together deliver the essential functionality of its products. Therefore, ARRIS’s equipment are considered non-software elements and are not subject to industry-specific software revenue recognition guidance. For equipment, revenue recognition is generally established when the products have been shipped, risk of loss has transferred, objective evidence exists that the product has been accepted, and no significant obligations remain relative to the transaction.
For arrangements that fall within the software revenue recognition guidance, the fee is allocated to the various elements based on VSOE of fair value. If sufficient VSOE of fair value does not exist for the allocation of revenue to all the various elements in a multiple element arrangement, all revenue from the arrangement is deferred until the earlier of the point at which such sufficient VSOE of fair value is established or all elements within the arrangement are delivered. If VSOE of fair value exists for all undelivered elements, but does not exist for one or more delivered elements, the arrangement consideration is allocated to the various elements of the arrangement using the residual method of accounting. Under the residual method, the amount of the arrangement consideration allocated to the delivered elements is equal to the total arrangement consideration less the aggregate fair value of the undelivered elements. Using this method, any potential discount on the arrangement is allocated entirely to the delivered elements, which ensures that the amount of revenue recognized at any point in time is not overstated. Under the residual method, if VSOE of fair value exists for the undelivered element, generally PCS, the fair value of the undelivered element is deferred and recognized ratably over the term of the PCS contract, and the remaining portion of the arrangement is recognized as revenue upon delivery, which generally occurs upon delivery of the product or implementation of the system. Many of ARRIS’s products are sold in combination with customer support and maintenance services, which consist of software updates and product support. Software updates provide customers with rights to unspecified software updates that ARRIS chooses to develop and to maintenance releases and patches that the Company chooses to release during the period of the support period. Product support services include telephone support, remote diagnostics, email and web access, access to on-site technical support personnel and repair or replacement of hardware in the event of damage or failure during the term of the support period. Maintenance and support service fees are recognized ratably under the straight-line method over the term of the contract, which is generally one year. The Company does not record receivables associated with maintenance revenues without a firm, non-cancelable order from the customer. VSOE of fair value is determined based on the price charged when the same element is sold separately and based on the prices at which our customers have renewed their customer support and maintenance. For elements that are not yet being sold separately, the price established by management, if it is probable that the price, once established, will not change before the separate introduction of the element into the marketplace is used to measure VSOE of fair value for that element.
87
Table of Contents
Index to Financial Statements
Software Sold Without Tangible Equipment — While not significant, ARRIS does sell internally developed software as well as software developed by outside third parties that does not require significant production, modification or customization. For arrangements that contain only software and the related post-contract support, the Company recognizes revenue in accordance with the applicable software revenue recognition guidance. If the arrangement includes multiple elements that are software only, then the software revenue recognition guidance is applied and the fee is allocated to the various elements based on vendor-specific objective evidence (“VSOE”) of fair value. If sufficient VSOE of fair value does not exist for the allocation of revenue to all the various elements in a multiple element software arrangement, all revenue from the arrangement is deferred until the earlier of the point at which such sufficient VSOE of fair value is established or all elements within the arrangement are delivered. If VSOE of fair value exists for all undelivered elements, but does not exist for one or more delivered elements, the arrangement consideration is allocated to the various elements of the arrangement using the residual method of accounting. Under the residual method, the amount of the arrangement consideration allocated to the delivered elements is equal to the total arrangement consideration less the aggregate fair value of the undelivered elements. Under the residual method, if VSOE of fair value exists for the undelivered element, generally post contract support (“PCS”), the fair value of the undelivered element is deferred and recognized ratably over the term of the PCS contract, and the remaining portion of the arrangement is recognized as revenue upon delivery. If sufficient VSOE of fair value does not exist for PCS, revenue for the arrangement is recognized ratably over the term of support.
Standalone Services — Installation, training, and professional services are generally recognized in service revenue when performed or upon completion of the service when the final act is significant in relation to the overall service transaction. The key element for Professional Services in determining when service transaction revenue has been earned is determining the pattern of delivery or performance which determines the extent to which the earnings process is complete and the extent to which customers have received value from services provided. The delivery or performance conditions of our service transactions are typically evaluated under the proportional performance or completed performance model.
Incentives — Customer incentive programs that include consideration, primarily rebates/credits to be used against future product purchases and certain volume discounts, are recorded as a reduction of revenue when the shipment of the requisite equipment occurs.
Value Added Resellers — ARRIS typically employs the sell-in method of accounting for revenue when using a Value Added Reseller (“VAR”) as our channel to market. Because product returns are restricted, revenue under this method is generally recognized at the time of shipment to the VAR provided all criteria for recognition are met. There are occasions, based on facts and circumstances surrounding the VAR transaction, where ARRIS will employ the sell-through method of recognizing revenue and defer that revenue until payment occurs.
Retail — Some of ARRIS product is sold through retail channels, which may include provisions involving a right of return. Upon shipment of the product, the Company reduces revenue for an estimate of potential future product returns related to the current period product revenue. Management analyzes historical returns, channel inventory levels, and current economic trends related to the Company’s products when evaluating the adequacy of the allowance for sales returns. When applicable, revenue on shipments is reduced for estimated price protection and sales incentives that are deemed to be contra-revenue under the authoritative guidance for revenue recognition.
(h) Shipping and Handling Fees
Shipping and handling costs for the years ended December 31, 2015, 2014, and 2013 were approximately $5.6 million, $6.9 million and $4.9 million, respectively, and are classified in net sales and cost of sales.
(i) Taxes Collected from Customers and Remitted to Governmental Authorities
Taxes assessed by a government authority that are both imposed on and concurrent with specific revenue transactions between us and our customers are presented on a net basis in our Consolidated Statements of Operations.
88
Table of Contents
Index to Financial Statements
(j) Depreciation of Property, Plant and Equipment
The Company provides for depreciation of property, plant and equipment on the straight-line basis over estimated useful lives of 10 to 40 years for buildings and improvements, 2 to 10 years for machinery and equipment, and the shorter of the term of the lease or useful life for leasehold improvements. Included in depreciation expense is the amortization of landlord funded tenant improvements which amounted to $4.5 million in 2015, $4.0 million in 2014 and $2.5 million in 2013. Depreciation expense, including amortization of capital leases, for the years ended December 31, 2015, 2014, and 2013 was approximately $71.8 million, $79.0 million, and $61.5 million, respectively.
Certain events or changes in circumstances may indicate that the recoverability of the carrying amount of property, plant and equipment should be assessed, including, among others, a significant decrease in market value, a significant change in the business climate in a particular market, or a current period operating or cash flow loss combined with historical losses or projected future losses. To test for recovery, we group assets (an “asset group”) in a manner that represents the lowest level for which identifiable cash flows are largely independent of the cash flows of other groups of assets and liabilities. When such events or changes in circumstances are present, we estimate the future cash flows expected to result from the use of the asset or asset group and its eventual disposition. These estimated future cash flows are consistent with those we use in our internal planning. If the sum of the expected future cash flows (undiscounted and pre-tax based upon policy decision) is less than the carrying amount, we recognize an impairment loss. The impairment loss recognized is the amount by which the carrying amount exceeds the fair value. We use a variety of methodologies to determine the fair value of property, plant and equipment, including appraisals and discounted cash flow models, which are consistent with the assumptions we believe hypothetical marketplace participants would use. See Note 13 Property, Plant and Equipment of Notes to the Consolidated Financial Statements for further information property, plant and equipment.
(k) Goodwill, and Other Intangible Assets
We classify intangible assets into three categories: (1) intangible assets with definite lives subject to amortization, (2) intangible assets with indefinite lives not subject to amortization and (3) goodwill. We determine the useful lives of our identifiable intangible assets after considering the specific facts and circumstances related to each intangible asset. Factors we consider when determining useful lives include the contractual term of any agreement related to the asset, the historical performance of the asset, the Company’s long-term strategy for using the asset, any laws or other local regulations which could impact the useful life of the asset, and other economic factors, including competition and specific market conditions. Intangible assets that are deemed to have definite lives are amortized, primarily on a straight-line basis, over their useful lives, generally ranging from 1 to 13 years. See Note 5 Goodwill and Other Intangible Assets of Notes to the Consolidated Financial Statements for further information on goodwill and other intangible assets.
Other Intangible Assets
When facts and circumstances indicate that the carrying value of definite-lived intangible assets may not be recoverable, management assesses the recoverability of the carrying value by preparing estimates of sales volume and the resulting profit and cash flows. These estimated future cash flows are consistent with those we use in our internal planning. To test for recovery, we group assets (an “asset group”) in a manner that represents the lowest level for which identifiable cash flows are largely independent of the cash flows of other groups of assets and liabilities. If the sum of the expected future cash flows (undiscounted and pre-tax based upon policy decision) is less than the carrying amount, we recognize an impairment loss. The impairment loss recognized is the amount by which the carrying amount of the asset or asset group exceeds the fair value. We use a variety of methodologies to determine the fair value of these assets, including discounted cash flow models, which are consistent with the assumptions we believe hypothetical marketplace participants would use.
We test intangible assets determined to have indefinite useful lives, including certain trademarks, in-process research and development and goodwill, for impairment annually, or more frequently if events or circumstances indicate that assets might be impaired. Our Company performs these annual impairment reviews as of the first
89
Table of Contents
Index to Financial Statements
day of our fourth fiscal quarter (October 1). We use a variety of methodologies in conducting impairment assessments of indefinite-lived intangible assets, including, but not limited to, discounted cash flow models, which are based on the assumptions we believe hypothetical marketplace participants would use. For indefinite-lived intangible assets, other than goodwill, if the carrying amount exceeds the fair value, an impairment charge is recognized in an amount equal to that excess. Acquired in-process research and development assets are initially recognized and measured at fair value and classified as indefinite-lived assets until the successful completion or abandonment of the associated research and development efforts. Accordingly, during the development period after acquisition, this asset is not amortized as charges to earnings. Completion of the associated research and development efforts cause the indefinite-lived in-process research and development assets to become a finite-lived asset. As such, prior to commencing amortization the assets is tested for impairment.
The Company has the option to perform a qualitative assessment of indefinite-lived intangible assets, other than goodwill, prior to completing the impairment test described above. The Company must assess whether it is more likely than not that the fair value of the intangible asset is less than its carrying amount. If the Company concludes that this is the case, it must perform the testing described above. Otherwise, the Company does not need to perform any further assessment.
There were no impairment charges related to intangible assets (definite-lived and indefinite-lived other than goodwill), during 2015, 2014 and 2013.
Goodwill
We perform impairment tests of goodwill at our reporting unit level, which is at or one level below our operating segments. Our operating segments are primarily based on the nature of the products and services offered, which is consistent with the way management runs our business. Our Customer Premises Equipment operating segment is the same as the reporting unit. Our Network & Cloud operating segment is subdivided into three reporting units which are Network Infrastructure, Cloud Services, and Cloud TV. Goodwill is assigned to the reporting unit or units that benefit from the synergies arising from each business combination.
The goodwill impairment test consists of a two-step process, if necessary. The first step is to compare the fair value of a reporting unit to its carrying value, including goodwill. We typically use a weighting of income approach using discounted cash flow models and a market approach to determine the fair value of a reporting unit. The assumptions used in these models are consistent with those we believe hypothetical marketplace participants would use. If the fair value of the reporting unit is less than its carrying value, the second step of the impairment test must be performed in order to determine the amount of impairment loss, if any. The second step compares the implied fair value of the reporting unit’s goodwill with the carrying amount of that goodwill. If the carrying amount of the reporting unit’s goodwill exceeds its implied fair value, an impairment charge is recognized in an amount equal to that excess. The loss recognized cannot exceed the carrying amount of goodwill.
The Company has the option to perform a qualitative assessment of goodwill prior to completing the two-step process described above to determine whether it is more likely than not that the fair value of a reporting unit is less than its carrying amount, including goodwill and other intangible assets. If the Company concludes that this is the case, it must perform the two-step process. Otherwise, the Company will forego the two-step process and does not need to perform any further testing.
There was no impairment of goodwill resulting from our annual impairment testing in 2015, 2014 and 2013.
(l) Advertising and Sales Promotion
Advertising and sales promotion costs are expensed as incurred. Advertising expense was approximately $16.8 million, $8.2 million, and $4.1 million for the years ended December 31, 2015, 2014 and 2013, respectively.
(m) Research and Development
Research and development (“R&D”) costs are expensed as incurred. The expenditures include compensation costs, materials, other direct expenses, and an allocation of information technology, telecommunications, and facilities costs.
90
Table of Contents
Index to Financial Statements
(n) Warranty
ARRIS provides warranties of various lengths to customers based on the specific product and the terms of individual agreements. For further discussion, see Note 9 Guarantees of the Notes to the Consolidated Financial Statements, Guarantees for further discussion.
(o) Income Taxes
ARRIS uses the liability method of accounting for income taxes, which requires recognition of temporary differences between financial statement and income tax bases of assets and liabilities, measured by enacted tax rates.
If necessary, the measurement of deferred tax assets is reduced by a valuation allowance to the amount that is more-likely-than-not to be realized based on available evidence. ARRIS reports a liability for unrecognized tax benefits resulting from uncertain tax positions taken or expected to be taken in a tax return. The Company recognizes interest and penalties, if any, related to unrecognized tax benefits in income tax expense. See Note 16 Income Taxes of Notes to the Consolidated Financial Statements for further discussion.
(p) Foreign Currency Translation
A significant portion of the Company’s products are manufactured or assembled in China, Mexico and Taiwan, and we have research and development centers in Argentina, China, India, Ireland, Israel and Sweden. Sales into international markets have been and are expected in the future to be an important part of the Company’s business. These foreign operations are subject to the usual risks inherent in conducting business abroad, including risks with respect to currency exchange rates, economic and political destabilization, restrictive actions and taxation by foreign governments, nationalization, the laws and policies of the United States affecting trade, foreign investment and loans, and foreign tax laws.
ARRIS has certain international customers who are billed in their local currency and certain international operations that procure in U.S. dollars. ARRIS also has certain predictable expenditures for international operations in local currency. Additionally, certain intercompany transactions are denominated in foreign currencies and subject to revaluation. The Company enters into forward or currency option contracts based on a percentage of expected foreign currency exposures. The percentage can vary, based on the predictability of the exposures denominated in the foreign currency. See Note 8 Derivative Instruments and Hedging Activities of Notes to the Consolidated Financial Statements for further discussion.
(q) Stock-Based Compensation
See Note 17 Stock-Based Compensation of Notes to the Consolidated Financial Statements for further discussion of the Company’s significant accounting policies related to stock based compensation.
(r) Concentrations of Credit Risk
Financial instruments that potentially subject ARRIS to concentrations of credit risk consist principally of cash, cash equivalents and short-term investments, accounts receivable and derivatives. ARRIS places its temporary cash investments with high credit quality financial institutions. Concentrations with respect to accounts receivable occur as the Company sells primarily to large, well-established companies including companies outside of the United States. The Company’s credit policy generally does not require collateral from its customers. ARRIS closely monitors extensions of credit to other parties and, where necessary, utilizes common financial instruments to mitigate risk or requires cash on delivery terms. Overall financial strategies and the effect of using a hedge are reviewed periodically.
91
Table of Contents
Index to Financial Statements
(s) Fair Value
The following methods and assumptions were used by the Company in estimating its fair value disclosures for financial instruments:
| • | Cash, cash equivalents, and short-term investments: The carrying amounts reported in the consolidated balance sheets for cash, cash equivalents, and short-term investments approximate their fair values. |
| • | Accounts receivable and accounts payable: The carrying amounts reported in the balance sheet for accounts receivable and accounts payable approximate their fair values. |
| • | Marketable securities: The fair values for trading and available-for-sale equity securities are based on quoted market prices or observable prices based on inputs not in active markets but corroborated by market data. |
| • | Non-marketable securities: Non-marketable equity securities are subject to a periodic impairment review; however, there are no open-market valuations, and the impairment analysis requires significant judgment. This analysis includes assessment of the investee’s financial condition, the business outlook for its products and technology, its projected results and cash flow, recent rounds of financing, and the likelihood of obtaining subsequent rounds of financing. |
| • | Senior secured credit facilities: Comprised of term loans and revolving credit facility of which the outstanding principal amount approximates fair value. |
| • | Derivative instruments: The carrying amounts reported in the balance sheet for derivative financial instruments approximate their fair values. The Company has designated interest rate derivatives as cash flow hedges and the objective is to manage the variability of cash flows in the interest payments related to the portion of the variable-rate debt designated as being hedged. The Company’s foreign currency derivative instruments economically hedge certain risk but are not designated as hedges. The objective of these derivatives instruments is to add stability to foreign currency gains and losses recorded as other expense (income) and to manage its exposure to foreign currency movements. |
(t) Computer Software
Internal-use software
The Company capitalizes costs associated with internally developed and/or purchased software systems for internal use that have reached the application development stage and meet recoverability tests. Capitalized costs include external direct costs of materials and services utilized in developing or obtaining internal-use software and payroll and payroll-related expenses for employees who are directly associated with and devote time to the internal-use software project. Capitalization of such costs begins when the preliminary project stage is complete and ceases no later than the point at which the project is substantially complete and ready for its intended purpose. These capitalized costs are amortized on a straight-line basis over periods of two to seven years, beginning when the asset is ready for its intended use. Capitalized costs are included in property, plant, and equipment on the consolidated balance sheets.
External-use software
Research and development costs are charged to expense as incurred. ARRIS generally has not capitalized any such development costs because the costs incurred between the attainment of technological feasibility for the related software product through the date when the product is available for general release to customers has been insignificant.
(u) Comprehensive Income (Loss)
The components of comprehensive income (loss) include net income (loss), unrealized gains (losses) on available-for-sale securities, unrealized gains (losses) on derivative instruments, change in unfunded pension liability, net of tax, if applicable and change in cumulative translation adjustments.
92
Table of Contents
Index to Financial Statements
Note 3. Impact of Recently Issued Accounting Standards
Adoption of new accounting standards — In April 2014, the Financial Accounting Standards Board (“FASB”) issued an accounting standard update that changes the requirements for reporting discontinued operations. A discontinued operation may include a component of an entity or a group of components of an entity. A disposal of a component of an entity or a group of components of an entity is required to be reported in discontinued operations if the disposal represents a strategic shift that has (or will have) a major effect on an entity’s operations and financial results and when the component or group of components meets the criteria to be classified as held for sale, is disposed of by sale or is disposed of by other than by sale. ARRIS adopted this standard prospectively on January 1, 2015. The adoption of this guidance did not have a material impact on the Company’s consolidated financial position and results of operations.
In April 2015, the FASB issued new guidance, which requires the cost of issuing debt to no longer be recorded as a separate asset but rather to be presented on the balance sheet as a direct reduction to the carrying value of the related debt liability, similar to the presentation of debt discounts. This guidance is effective for interim and annual periods beginning after December 15, 2015 including retrospective conforming presentation of prior periods presented. Early adoption of the standard is permitted. We early adopted the standard as of December 31, 2015. As a result of the retrospective adoption, we reclassified unamortized debt issuance costs of $25.3 million as of December 30, 2014 from other current assets and other assets to current and long-term debt on our Consolidated Balance Sheets. Adoption of this standard did not impact our results of operations or cash flows in the current or previous annual reporting periods.
In September 2015, the FASB issued updated guidance related to the simplification of the accounting for measurement-period adjustments in business combinations. This standard update eliminates the requirement to account for measurement-period adjustments retrospectively. This standard update instead requires an acquirer to recognize the measurement-period adjustments in the reporting period in which the adjustments are determined. This standard update also requires that an acquirer record the effects on earnings of any changes resulting from the change in provisional amounts, calculated as if the accounting had been completed at the acquisition date. The Company adopted this standard during the fourth quarter of 2015. The adoption of this standard did not have a material impact on our consolidated financial position and results of operations.
On November 20, 2015, the Financial Accounting Standards Board issued new guidance, Balance Sheet Classification of Deferred Taxes, requiring all deferred tax assets and liabilities, and any related valuation allowance, to be classified as noncurrent on the balance sheet. The classification change for all deferred taxes as noncurrent eliminates the need to separately identify the net current and net noncurrent deferred tax asset or liability in each jurisdiction and allocate valuation allowances. The Company elected to prospectively adopt the accounting standard in the beginning of our fourth quarter of fiscal 2015. Prior periods in our Consolidated Financial Statements were not retrospectively adjusted.
Accounting standards issued but not yet effective — In May 2014, the FASB issued an accounting standard update, Revenue from Contracts with Customers. The standard requires an entity should recognize revenue to depict the transfer of promised goods or services to customers in an amount that reflects the consideration to which the entity expects to be entitled in exchange for those goods or services. The new guidance is effective for annual reporting periods beginning after December 15, 2016, including interim periods within that reporting period. Early adoption is not permitted. It can be adopted either retrospectively to each prior reporting period presented or as a cumulative effect adjustment as of the date of adoption. The Company is currently assessing the potential impact of this update on its consolidated financial statements. In August 2015, the FASB delayed the effective date of this standard by one year to reporting periods beginning after December 15, 2017, but permit companies the option to adopt the standard one year earlier (that is, as of the original effective date).
In June 2014, the FASB issued an update to its accounting guidance related to share-based compensation. The guidance requires that a performance target that affects vesting and that could be achieved after the requisite service period, be treated as a performance condition, and therefore shall not be reflected in determining the fair value of the award at the grant date. This update further clarifies that compensation cost should be recognized in the period in which it becomes probable that the performance target will be achieved and should represent the
93
Table of Contents
Index to Financial Statements
compensation cost attributable to the period(s) for which the requisite service has already been rendered. The guidance will be effective for annual and interim periods beginning after December 15, 2015 and is not expected to have a material effect on the Company’s consolidated financial position and results of operations.
In August 2014, the FASB issued new guidance related to the disclosures around going concern. The new standard provides guidance around management’s responsibility to evaluate whether there are conditions or events, considered in the aggregate, that raise substantial doubt about an entity’s ability to continue as a going concern, and if those conditions exist to provide related footnote disclosures. The new standard is effective for fiscal years, and interim periods within those fiscal years, beginning after December 15, 2016. Early adoption is permitted. The adoption of this standard is not expected to have a material impact on the Company’s consolidated financial statements.
In January 2015, the FASB issued new guidance simplifying income statement presentation by eliminating the concept of “extraordinary items”. This guidance eliminates from U.S. GAAP the concept of extraordinary items. The new standard is effective for fiscal years, and interim periods within those fiscal years, beginning after December 15, 2015. A reporting entity may apply the amendments prospectively. We do not anticipate that this guidance will materially impact our consolidated financial statements.
In February 2015, the FASB issued new guidance related to consolidations. The new guidance amends certain requirements for determining whether a variable interest entity must be consolidated. The amendments are effective for public business entities for fiscal years, and for interim periods within those fiscal years, beginning after December 15, 2015. The adoption of the new guidance is not expected to have a material impact on the Company’s consolidated financial statements.
In April 2015, the FASB issued new guidance, in determining whether fees for purchasing cloud computing services (or hosted software solutions) are considered internal-use software or should be considered a service contract. A cloud computing agreement that includes a software license should be accounted for in the same manner as internal-use software if the customer has contractual right to take possession of the software during the hosting period without significant penalty and it is feasible to either run the software on the customer’s hardware or contract with another vendor to host the software. Arrangements that don’t meet the requirements for internal-use software should be accounted for as a service contract. This guidance will be effective for interim and annual periods beginning after December 15, 2015. Early adoption of the standard is permitted. The adoption of this standard is not expected to have a material impact on the Company’s consolidated financial statements.
In July 2015, the FASB issued updated guidance related to the simplification of the measurement of inventory. This standard update does not apply to inventory that is measured using last-in, first-out or the retail inventory method. This standard update applies to all other inventory, which includes inventory that is measured using first-in, first-out or average cost methods. The standard update requires entities to measure inventory at the lower of cost and net realizable value. Net realizable value is defined as the estimated selling prices in the ordinary course of business, less reasonably predictable costs of completion, disposal and transportation. This standard update is effective for fiscal years beginning after December 15, 2015. Early adoption is permitted. The adoption of this standard update is not expected to have a material impact on our condensed consolidated financial statements.
Note 4. Business Acquisitions
Acquisition of ActiveVideo
In April 2015, the Company and Charter Communications Inc. formed a venture, A-C Acquisition, LLC (“A-C Venture”) with ARRIS’s and Charter’s ownership percentage of the venture being 65% and 35%, respectively. On April 30, 2015, A-C Venture acquired 100% of the outstanding shares in ActiveVideo Networks, Inc. (“ActiveVideo”). The consideration for the acquisition was $98 million in cash. ActiveVideo, headquartered in San Jose, California, is a software company that uses cloud-based technology to bring advanced user interfaces and services to cable and IPTV set-top boxes, as well as connected consumer electronic devices. Goodwill arising from the acquisition is attributable to the workforce of the acquired business, future technology,
94
Table of Contents
Index to Financial Statements
future customer relationships, and strategic opportunities that are expected to arise from the acquisition. No tax deductible goodwill existed as of the acquisition date. Subsequent to the acquisition date, ActiveVideo converted to a limited liability company creating tax basis in goodwill essentially equal to its book basis. The total goodwill was assigned to the Company’s Cloud TV reporting unit, within the Company’s N&C reportable segment.
The results of operations of ActiveVideo have been included in the Company’s Consolidated Financial Statements as of and from the date of acquisition.
The following table summarizes the estimated fair value of the net assets acquired and the liabilities assumed at the acquisition dates (in thousands):
| April 30, 2015 | ||||
| Consideration transferred (net of cash acquired of $523) |
$ | 97,905 | ||
| Assets acquired and liabilities assumed: |
||||
| Current assets |
1,984 | |||
| Property and equipment |
1,714 | |||
| Other assets |
68 | |||
| Identifiable intangible assets |
57,700 | |||
| Debt assumed |
(15,000 | ) | ||
| Other liabilities assumed |
(27,314 | ) | ||
|
|
|
|||
| Net identifiable assets acquired |
19,152 | |||
|
|
|
|||
| Goodwill |
$ | 78,753 | ||
|
|
|
|||
The acquired identifiable intangible assets of ActiveVideo as of the date of the acquisition are summarized below (in thousands):
| Intangible Asset |
Amount | Weighted-Average Useful Life |
||||||
| Customer relationships |
$ | 26,200 | 7 years | |||||
| Developed technology |
25,600 | 5 years | ||||||
| Trademarks |
5,900 | Indefinite | ||||||
|
|
|
|||||||
| $ | 57,700 | |||||||
|
|
|
|||||||
The Company incurred acquisition related costs of $1.1 million in 2015. These amounts were expensed as incurred and are included in the Consolidated Statement of Operations in the line item titled “Integration, acquisition, restructuring and other costs”.
As of the acquisition date, total equity contributed by the noncontrolling interest was $54 million, reflecting its proportionate 35% share of the acquisition consideration of $34 million, payment of assumed liabilities of $13 million and additional working capital funding of $7 million.
The accounting for the business combination is complete at the end of the reporting period.
Acquisition of Motorola Home
On April 17, 2013, ARRIS completed its acquisition of Motorola Home from General Instrument Holdings, Inc., a subsidiary of Google, Inc. Consideration for the acquisition consisted of approximately $2,208.1 million in cash, inclusive of working capital adjustments, and 10.6 million shares of ARRIS’s stock (the “Acquisition”).
The Acquisition enhanced the Company’s scale and product breadth in the telecom industry, significantly diversified the Company’s customer base and expanded dramatically the Company’s international presence. Notably, the acquisition brought to ARRIS, Motorola Home’s product scale and scope in end-to-end video processing and delivery, including a full range of QAM and IP set-tops products, as well as IP Gateway CPE equipment for data and voice services for broadband service providers. The Acquisition also enhanced the depth and scale of the Company’s R&D capabilities, particularly in the video arena.
95
Table of Contents
Index to Financial Statements
Note 5. Goodwill and Intangible Assets
The changes in the carrying amount of goodwill for the three years ended December 31, 2015 are as follows (in thousands):
| CPE | N & C | Total | ||||||||||
| Goodwill |
$ | 31,850 | $ | 540,921 | $ | 572,771 | ||||||
| Accumulated impairment losses |
— | (378,656 | ) | (378,656 | ) | |||||||
|
|
|
|
|
|
|
|||||||
| Balance as of December 31, 2012 |
31,850 | 162,265 | 194,115 | |||||||||
| Goodwill acquired |
656,808 | 92,593 | 749,401 | |||||||||
| Other |
— | (3,114 | ) | (3,114 | ) | |||||||
|
|
|
|
|
|
|
|||||||
| Goodwill |
688,658 | 630,400 | 1,319,058 | |||||||||
| Accumulated impairment losses |
— | (378,656 | ) | (378,656 | ) | |||||||
|
|
|
|
|
|
|
|||||||
| Balance as of December 31, 2013 |
688,658 | 251,744 | 940,402 | |||||||||
| Goodwill acquired |
— | 1,682 | 1,682 | |||||||||
| Other |
(4,061 | ) | (1,956 | ) | (6,017 | ) | ||||||
|
|
|
|
|
|
|
|||||||
| Goodwill |
684,597 | 630,126 | 1,314,723 | |||||||||
| Accumulated impairment losses |
— | (378,656 | ) | (378,656 | ) | |||||||
|
|
|
|
|
|
|
|||||||
| Balance as of December 31, 2014 |
684,597 | 251,470 | 936,067 | |||||||||
| Goodwill acquired (disposed), net |
— | 78,053 | 78,053 | |||||||||
| Other |
(2,015 | ) | 1,858 | (157 | ) | |||||||
|
|
|
|
|
|
|
|||||||
| Goodwill |
682,582 | 710,037 | 1,392,619 | |||||||||
| Accumulated impairment losses |
— | (378,656 | ) | (378,656 | ) | |||||||
|
|
|
|
|
|
|
|||||||
| Balance as of December 31, 2015 |
$ | 682,582 | $ | 331,381 | $ | 1,013,963 | ||||||
|
|
|
|
|
|
|
|||||||
During the 2015, the Company recorded $78.8 million of goodwill related to the ActiveVideo acquisition and disposed of $(0.7) million of goodwill related to the sale of our Supplies business.
Intangible Assets
The gross carrying amount and accumulated amortization of the Company’s intangible assets as of December 31, 2015 and December 31, 2014 are as follows (in thousands):
| December 31, 2015 | December 31, 2014 | |||||||||||||||||||||||
| Gross Amount |
Accumulated Amortization |
Net Book Value |
Gross Amount |
Accumulated Amortization |
Net Book Value |
|||||||||||||||||||
| Definite-lived intangible assets : |
||||||||||||||||||||||||
| Customer relationships (2) |
$ | 930,212 | $ | 468,414 | $ | 461,798 | $ | 904,012 | $ | 366,452 | $ | 537,560 | ||||||||||||
| Developed technology, patents & licenses (1,2,3) |
704,137 | 361,719 | 342,418 | 632,487 | 234,882 | 397,605 | ||||||||||||||||||
| Trademarks, trade and domain names |
21,072 | 20,740 | 332 | 21,072 | 17,949 | 3,123 | ||||||||||||||||||
|
|
|
|
|
|
|
|
|
|
|
|
|
|||||||||||||
| Sub-total |
$ | 1,655,421 | $ | 850,873 | $ | 804,548 | $ | 1,562,671 | $ | 619,283 | $ | 943,388 | ||||||||||||
|
|
|
|
|
|
|
|
|
|
|
|
|
|||||||||||||
| Indefinite-lived intangible assets: |
||||||||||||||||||||||||
| Trademarks (2) |
$ | 5,900 | — | $ | 5,900 | $ | — | — | $ | — | ||||||||||||||
| In-process R&D (3) |
— | — | — | 5,100 | — | 5,100 | ||||||||||||||||||
|
|
|
|
|
|
|
|
|
|
|
|
|
|||||||||||||
| Sub-total |
$ | 5,900 | — | $ | 5,900 | $ | 5,100 | — | $ | 5,100 | ||||||||||||||
|
|
|
|
|
|
|
|
|
|
|
|
|
|||||||||||||
| Total |
$ | 1,661,321 | $ | 850,873 | $ | 810,448 | $ | 1,562,671 | $ | 619,283 | $ | 943,388 | ||||||||||||
|
|
|
|
|
|
|
|
|
|
|
|
|
|||||||||||||
96
Table of Contents
Index to Financial Statements
| (1) | In 2015, the Company recorded intangible assets of $34.3 million for a non-exclusive license to approximately four thousand patents purchased by RPX Corporation (“RPX”), resulting from its agreement to participate in a syndicate of approximately 30 companies, including certain customers of ARRIS, to fund the RPX purchase of patent assets from Rockstar Consortium and its subsidiaries (“Rockstar”). The license assets have a weighted average useful life of nine years at acquisition. |
| (2) | The increase in 2015 reflects intangible assets acquired in the ActiveVideo acquisition. See Note 4 Business Acquisitions of Notes to the Consolidated Financial Statements for further information on ActiveVideo intangible assets acquired. |
| (3) | In-process research and development of $5.1 million was reclassified in 2015 to become a definite-lived asset upon completion of the associated research and development efforts. |
Amortization expense recorded on the intangible assets for the years ended December 31, 2015, 2014 and 2013 was $231.6 million, $236.8 million, and $193.6 million, respectively. The estimated total amortization expense for finite-lived intangibles for each of the next five fiscal years is as follows (in thousands):
| 2016 |
$ | 203,778 | ||
| 2017 |
186,843 | |||
| 2018 |
136,281 | |||
| 2019 |
113,732 | |||
| 2020 |
104,955 | |||
| Thereafter |
58,959 |
Note 6. Investments
ARRIS’s investments consisted of the following (in thousands):
| As of December 31, 2015 |
As of December 31, 2014 |
|||||||
| Current Assets: |
||||||||
| Available-for-sale securities |
$ | 15,470 | $ | 126,748 | ||||
| Noncurrent Assets: |
||||||||
| Available-for-sale securities |
4,036 | 8,631 | ||||||
| Equity method investments |
24,452 | 27,355 | ||||||
| Cost method investments |
16,646 | 15,161 | ||||||
| Other investments |
24,408 | 26,493 | ||||||
|
|
|
|
|
|||||
| Total classified as non-current assets |
69,542 | 77,640 | ||||||
|
|
|
|
|
|||||
| Total |
$ | 85,012 | $ | 204,388 | ||||
|
|
|
|
|
|||||
Available-for-sale securities — ARRIS’s investments in debt and marketable equity securities are categorized as available-for-sale and are carried at fair value. Realized gains and losses on available-for-sale securities are included in net income. Unrealized gains and losses on available-for-sale securities are included in our Consolidated Balance Sheet as a component of accumulated other comprehensive income (loss). Realized and unrealized gains and losses in total and by individual investment as of December 31, 2015 and 2014 were not material. The amortized cost basis of the Company’s investments approximates fair value.
97
Table of Contents
Index to Financial Statements
The contractual maturities of the Company’s available-for-sale securities as of December 31, 2015 are shown below. Actual maturities may differ from contractual maturities because the issuers of the securities may have the right to prepay obligations without prepayment penalties (in thousands):
| December 31, 2015 | ||||
| Within one year |
$ | 15,470 | ||
| After one year through five years |
— | |||
| After five years through ten years |
— | |||
| After ten years |
4,036 | |||
|
|
|
|||
| Total |
$ | 19,506 | ||
|
|
|
|||
Equity method investments — ARRIS owns certain investments in limited liability companies and partnerships that are accounted for using the equity method as the Company has significant influence over operating and financial policies of the investee companies. These investments are recorded at $24.5 million and $27.4 as of December 31, 2015 and 2014, respectively.
The following table summarizes the ownership structure and ownership percentage of the non-consolidated investments as of December 31, 2015, accounted for using the equity method.
| Name of Investee |
Ownership Structure |
% Ownership | ||
| MPEG LA |
Limited Liability Company | 8.4% | ||
| Music Choice |
Limited Liability Partnership | 18.2% | ||
| Conditional Access Licensing (“CAL”) |
Limited Liability Company | 49.0% | ||
| Combined Conditional Access Development (“CCAD”) |
Limited Liability Company | 50.0% |
ARRIS owns investments in two limited liability corporations. The investees were determined to be variable interest entities and ARRIS is not the primary beneficiary, as ARRIS does not have the power to direct the activities of the investee that most significantly impact its economic performance. The limited liability corporations are a licensing and a research and development company. The purpose of the limited liability corporations are to develop, deploy, license, support, and to gain market acceptance for certain technologies that reside in a cable plant or in a cable device. Subject to agreement on annual statements of work, the Company is providing to one of the ventures, engineering services per year approximating 20% to 30% of the approved venture budget, which is expected to be in the range of approximately $6 million to $8 million per year. The Company is also required to make annual contributions for the purpose of funding development projects identified by the venture. During 2015, the Company made funding contributions to the investment of $16.0 million.
The following table summarizes the carrying amount and maximum exposure to loss for the investments accounted for using the equity method as of December 31, 2015 (in thousands)
| Carrying Amount | Maximum Exposure to Loss |
|||||||
| Conditional Access Licensing |
$ | 11,238 | $ | 11,238 | ||||
| Combined Conditional Access Development |
2,148 | 18,000 | ||||||
The Company’s future total annual funding contributions to CCAD are expected to be in the range of approximately $16 million to $18 million, and represent the Company’s annual maximum exposure to loss.
During the quarter ended December 31, 2015, the Company recorded a gain of $2.5 million resulting from the transfer of certain technology to CCAD. An additional $2.5 million of unrecognized gain is being treated as a basis difference in the investment, and will be recognized over an expected period of four years.
Cost method investments — ARRIS holds cost method investments in certain private companies. Due to the fact the investments are in private companies, the Company is exempt from estimating the fair value on an interim and annual basis. It is impractical to estimate the fair value since the quoted market price is not available.
98
Table of Contents
Index to Financial Statements
Furthermore, the cost of obtaining an independent valuation appears excessive considering the materiality of the investments to the Company. However, ARRIS is required to estimate the fair value if there has been an identifiable event or change in circumstance that may have a significant adverse effect on the fair value of the investment.
Other investments — ARRIS holds investments in certain life insurance contracts. The Company determined the fair value to be the amount that could be realized under the insurance contract as of each reporting period. The changes in the fair value of these contracts are included in net income.
Other-Than-Temporary Investment Impairments — In making this determination, ARRIS evaluates its investments for any other-than-temporary impairment on a quarterly basis considering all available evidence, including changes in general market conditions, specific industry and individual entity data, the financial condition and the near-term prospects of the entity issuing the security, and the Company’s ability and intent to hold the investment until recovery.
For the year ended December 31, 2015, ARRIS concluded that one private company had indicators of impairment that resulted in other-than-temporary impairment charge of $0.2 million. For the year ended December 31, 2014, the Company concluded that two private companies had indicators of impairment that resulted in other-than-temporary impairment charges of $7.0 million. These charges are reflected in the Consolidated Statements of Operations.
Classification of securities as current or non-current is dependent upon management’s intended holding period, the security’s maturity date and liquidity consideration based on market conditions. If management intends to hold the securities for longer than one year as of the balance sheet date, they are classified as non-current.
Note 7. Fair Value Measurements
Fair value is based on the price that would be received to sell an asset or paid to transfer a liability in an orderly transaction between market participants at the measurement date. U.S GAAP establishes a fair value hierarchy that is based on the extent and level of judgment used to estimate the fair value of assets and liabilities. In order to increase consistency and comparability in fair value measurements, the FASB has established a fair value hierarchy that prioritizes observable and unobservable inputs used to measure fair value into three broad levels. An asset or liability’s categorization within the fair value hierarchy is based upon the lowest level of input that is significant to the measurement of its fair value. The three levels of input defined by U.S. GAAP are as follows:
Level 1: Quoted prices (unadjusted) in active markets that are accessible at the measurement date for assets or liabilities.
Level 2: Observable prices that are based on inputs not quoted on active markets, but corroborated by market data.
Level 3: Unobservable inputs are used when little or no market data is available.
99
Table of Contents
Index to Financial Statements
The following table presents the Company’s investment assets (excluding equity and cost method investments) and derivatives measured at fair value on a recurring basis as of December 31, 2015 and 2014 (in thousands):
| December 31, 2015 | ||||||||||||||||
| Level 1 | Level 2 | Level 3 | Total | |||||||||||||
| Certificates of deposit |
$ | — | $ | 4,208 | $ | — | $ | 4,208 | ||||||||
| Corporate bonds |
— | 6,257 | — | 6,257 | ||||||||||||
| Short-term bond fund |
5,005 | — | — | 5,005 | ||||||||||||
| Corporate obligations |
— | 1 | — | 1 | ||||||||||||
| Money markets |
209 | — | — | 209 | ||||||||||||
| Mutual funds |
131 | — | — | 131 | ||||||||||||
| Other investments |
— | 3,695 | — | 3,695 | ||||||||||||
| Interest rate derivatives — liability derivatives |
— | (10,759 | ) | — | (10,759 | ) | ||||||||||
| Foreign currency contracts — asset position |
— | 7,064 | — | 7,064 | ||||||||||||
| Foreign currency contracts — liability position |
— | (24,371 | ) | — | (24,371 | ) | ||||||||||
| December 31, 2014 | ||||||||||||||||
| Level 1 | Level 2 | Level 3 | Total | |||||||||||||
| Certificates of deposit |
$ | — | $ | 63,171 | $ | — | $ | 63,171 | ||||||||
| Commercial paper |
— | 1,000 | — | 1,000 | ||||||||||||
| Corporate bonds |
— | 37,737 | — | 37,737 | ||||||||||||
| Short-term bond fund |
29,708 | — | — | 29,708 | ||||||||||||
| Corporate obligations |
— | 46 | — | 46 | ||||||||||||
| Money markets |
210 | — | — | 210 | ||||||||||||
| Mutual funds |
133 | — | — | 133 | ||||||||||||
| Other investments |
— | 3,369 | — | 3,369 | ||||||||||||
| Interest rate derivatives — asset derivatives |
— | 1,416 | — | 1,416 | ||||||||||||
| Interest rate derivatives — liability derivatives |
— | (6,414 | ) | — | (6,414 | ) | ||||||||||
| Foreign currency contracts — asset position |
— | 2,876 | — | 2,876 | ||||||||||||
| Foreign currency contracts — liability position |
— | (201 | ) | — | (201 | ) | ||||||||||
All of the Company’s short-term and long-term investments at December 31, 2015 are classified within Level 1 or Level 2 of the fair value hierarchy as they are valued using quoted market prices, market prices for similar securities, or alternative pricing sources with reasonable levels of price transparency. The types of instruments valued based on quoted market prices in active markets include the Company’s investment in money market funds, mutual funds and municipal bonds. Such instruments are generally classified within Level 1 of the fair value hierarchy. The types of instruments valued based on other observable inputs include corporate obligations and bonds, commercial paper and certificates of deposit. Such instruments are classified within Level 2 of the fair value hierarchy.
In addition to the financial instruments included in the above table, certain nonfinancial assets and liabilities are to be measured at fair value on a nonrecurring basis in accordance with applicable authoritative guidance. This includes items such as nonfinancial assets and liabilities initially measured at fair value in a business combination (but not measured at fair value in subsequent periods) and nonfinancial long-lived asset groups measured at fair value for an impairment assessment. In general, nonfinancial assets including goodwill, other intangible assets and property and equipment are measured at fair value when there is an indication of impairment and are recorded at fair value only when any impairment is recognized. As of December 31, 2015, the Company had not recorded any impairment related to such assets and had no other material nonfinancial assets or liabilities requiring adjustments or write-downs to their current fair value.
100
Table of Contents
Index to Financial Statements
The Company believes the principal amount of the debt as of December 31, 2015 approximated the fair value because it bears interest at rates that are adjusted periodically, analysis of recent market conditions, prevailing interest rates, and other Company specific factors. The Company has classified the debt as a Level 2 item within the fair value hierarchy.
101
Table of Contents
Index to Financial Statements
Note 8. Derivative Instruments and Hedging Activities
Overview
ARRIS is exposed to financial market risk, primarily related to foreign currency and interest rates. These exposures are actively monitored by management. To manage the volatility relating to certain of these exposures, the Company enters into a variety of derivative financial instruments. Management’s objective is to reduce, where it is deemed appropriate to do so, fluctuations in earnings and cash flows associated with changes in foreign currency and interest rates. ARRIS’s policies and practices are to use derivative financial instruments only to the extent necessary to manage exposures. ARRIS does not hold or issue derivative financial instruments for trading or speculative purposes.
The Company records all derivatives on the balance sheet at fair value. The accounting for changes in the fair value of derivatives depends on the intended use of the derivative, whether the Company has elected to designate a derivative in a hedging relationship and apply hedge accounting and whether the hedging relationship has satisfied the criteria necessary to apply hedge accounting. Derivatives designated and qualifying as a hedge of the exposure to changes in the fair value of an asset, liability, or firm commitment attributable to a particular risk, such as interest rate risk, are considered fair value hedges. Derivatives designated and qualifying as a hedge of the exposure to variability in expected future cash flows, or other types of forecasted transactions, are considered cash flow hedges. Derivatives also may be designated as hedges of the foreign currency exposure of a net investment in a foreign operation. Hedge accounting generally provides for the matching of the timing of gain or loss recognition on the hedging instrument with the recognition of the changes in the fair value of the hedged asset or liability that are attributable to the hedged risk in a fair value hedge or the earnings effect of the hedged forecasted transactions in a cash flow hedge. The Company may enter into derivative contracts that are intended to economically hedge certain of its risk, even though hedge accounting does not apply or the Company elects not to apply hedge accounting. In accordance with the FASB’s fair value measurement guidance, the Company made an accounting policy election to measure the credit risk of its derivative financial instruments that are subject to master netting agreements on a net basis by counterparty portfolio.
Cash flow hedges of interest rate risk
In April 2013, ARRIS entered into senior secured credit facilities having variable interest rates with Bank of America, N.A. and various other institutions, which are comprised of (i) a “Term Loan A Facility” of $1.1 billion, (ii) a “Term Loan B Facility” of $825 million and (iii) a “Revolving Credit Facility” of $250 million. In June 2015, ARRIS amended and restated its existing credit agreement to improve the terms and conditions of the credit agreement, extend the maturities of certain loan facilities, increase the amount of the revolving credit facility, and add a new “Term Loan A-1 Facility” to fund the acquisition of Pace. As a result of this exposure to interest rate movements, ARRIS entered into various interest rate swap arrangements, which effectively converted $625 million of the Company’s variable-rate debt based on one-month LIBOR to an aggregate fixed rate of approximately 3.15% as of September 30, 2015. This fixed rate could vary up by 50 basis points or down by 25 basis points based on future changes to the Company’s net leverage ratio. $600 million of these swaps matures on December 29, 2017 and $25 million matures on March 31, 2020. Additionally, the Company also entered into six $100 million forward-starting interest rate swap arrangements, which effectively will convert $600 million of the Company’s variable-rate debt based on one-month LIBOR to an aggregate fixed rate of 4.03% based on the Company’s interest rates as of December 31, 2015. This fixed rate could also vary up by 50 basis points or down by 25 basis points based on future changes to the Company’s net leverage ratio. Each of these swaps begins on December 29, 2017 and matures on March 31, 2020. ARRIS has designated these swaps as cash flow hedges, and the objective of these hedges is to manage the variability of cash flows in the interest payments related to the portion of the variable-rate debt designated as being hedged.
The Company’s objectives in using interest rate derivatives are to add stability to interest expense and to manage its exposure to interest rate movements. To accomplish this objective, the Company uses interest rate swaps as part of its interest rate risk management strategy. Interest rate swaps designated as cash flow hedges involve the receipt of variable amounts from a counterparty in exchange for the Company making fixed-rate payments over the life of the agreements without exchange of the underlying notional amount.
102
Table of Contents
Index to Financial Statements
The effective portion of changes in the fair value of derivatives designated and that qualify as cash flow hedges is recorded in Accumulated Other Comprehensive Income and is subsequently reclassified into earnings in the period that the hedged forecasted transaction affects earnings. During 2015, such derivatives were used to hedge the variable cash flows associated with debt. The ineffective portion of the change in fair value of the derivatives is recognized directly in earnings. During the years ended December 31, 2015 and 2014, the Company did not have expenses related to hedge ineffectiveness in earnings.
Amounts reported in accumulated other comprehensive income related to derivatives will be reclassified to interest expense as interest payments are made on the Company’s variable-rate debt. Over the next 12 months, the Company estimates that an additional $4.5 million may be reclassified as an increase to interest expense.
The table below presents the pre-tax impact of the Company’s derivative financial instruments had on the Accumulated Other Comprehensive Income and Statement of Operations for the years ended December 31, 2015 and 2014 (in thousands):
| Years Ended December 31, | ||||||||
| 2015 | 2014 | |||||||
| Gain (Loss) Recognized in OCI on Derivative (Effective Portion) |
$ | (13,256 | ) | $ | (8,541 | ) | ||
| Location of Gain (Loss) Reclassified from Accumulated OCI into Income (Effective Portion) |
Interest expense | Interest expense | ||||||
| Amounts Reclassified from Accumulated OCI into Income (Effective Portion) |
$ | 7,495 | $ | 7,550 | ||||
The following table indicates the location on the Consolidated Balance Sheets in which the Company’s derivative assets and liabilities designated as hedging instruments have been recognized and the related fair values of those derivatives as of December 31, 2015 and December 31, 2014 were as follows (in thousands):
| As of December 31, 2015 | As of December 31, 2014 | |||||||||||
| Balance Sheet Location | Fair Value | Balance Sheet Location | Fair Value | |||||||||
| Derivatives designated as hedging instruments: |
||||||||||||
| Interest rate derivatives — asset derivatives |
Other assets | $ | — | Other assets | $ | 1,416 | ||||||
| Interest rate derivatives — liability derivatives |
Other accrued liabilities | (4,489 | ) | Other accrued liabilities | (6,414 | ) | ||||||
| Interest rate derivatives — liability derivatives |
Other noncurrent liabilities | (6,270 | ) | Other noncurrent liabilities | — | |||||||
The change in the fair values of ARRIS’s derivative designated as hedging instruments recorded in the Consolidated Statements of Operations during the years ended December 31, 2015, 2014, and 2013 were as follows (in thousands):
| Years Ended December 31, | ||||||||||||||
| Statement of Operations Location | 2015 | 2014 | 2013 | |||||||||||
| Derivatives designated as hedging instruments: |
||||||||||||||
| Interest rates derivatives |
Interest expense | $ | 7,495 | $ | 7,550 | $ | 3,132 | |||||||
Credit-risk-related contingent features
ARRIS has agreements with each of its derivative counterparties that contain a provision where the Company could be declared in default on its derivative obligations if repayment of the underlying indebtedness is accelerated by the lender due to the Company’s default on the indebtedness. As of December 31, 2015, the fair value of derivatives in a net liability position, which includes accrued interest but excludes any adjustment for nonperformance risk, related to these agreements was $11.2 million. As of December 31, 2015, the Company has
103
Table of Contents
Index to Financial Statements
not posted any collateral related to these agreements nor has it required any of its counterparties to post collateral related to these or any other agreements.
Non-designated hedges of foreign currency risk
The Company has U.S. dollar functional currency entities that bill certain international customers in their local currency and foreign functional currency entities that procure in U.S. dollars. ARRIS also has certain predictable expenditures for international operations in local currency. Additionally, certain intercompany transactions are denominated in foreign currencies and subject to revaluation. To mitigate the volatility related to fluctuations in the foreign exchange rates for certain exposures, ARRIS has entered into various foreign currency contracts. As of December 31, 2015, the Company had option collars with notional amounts totaling 80 million euros which mature throughout 2016 and 2017, forward contracts with notional amounts totaling 75 million euros which mature throughout 2016 and 2017, forward contracts with a total notional amount of 90 million Australian dollars which mature throughout 2016 and forward contracts with notional amounts totaling 40 million Canadian dollars which mature throughout 2015.
As part of the Pace acquisition, the Company paid the former Pace shareholders 132.5 pence per share in cash consideration, which is approximately 434.3 million British pounds, in the aggregate, as of January 4, 2016. As such, the Company entered into foreign currency forward contracts to purchase British pounds and sell U.S. Dollars to mitigate the volatility related to fluctuations in the foreign exchange rate prior to the closing period. As of December 31, 2015, the Company had forward contracts with notional amounts totaling 385 million British pounds which mature on March 31, 2016. The contracts fixed the British pound to U.S. dollar forward exchange rate at various rates. During the year ended December 31, 2015, losses of $22.3 million were recorded related to the British pound forward contracts. These contracts were effectively closed upon the close of the Pace acquisition in January 2016.
The Company’s objectives in using foreign currency derivatives are to add stability to foreign currency gains and losses recorded as other expense (income) and to manage its exposure to foreign currency movements. To accomplish this objective, the Company uses foreign currency option and foreign currency forward contracts as part of its foreign currency risk management strategy. The Company’s foreign currency derivative instruments economically hedge certain risk but are not designated as hedges, and accordingly, all changes in the fair value of the instruments are recognized as a loss (gain) on foreign currency in the Consolidated Statements of Operations. The maximum time frame for ARRIS’s derivatives is currently less than 18 months.
The following table indicates the location on the Consolidated Balance Sheets in which the Company’s derivative assets and liabilities not designated as hedging instruments have been recognized and the related fair values of those derivatives as of December 31, 2015 and December 31, 2014 were as follows (in thousands):
| As of December 31, 2015 | As of December 31, 2014 | |||||||||||
| Balance Sheet Location | Fair Value | Balance Sheet Location | Fair Value | |||||||||
| Derivatives not designated as hedging instruments: |
||||||||||||
| Foreign exchange contracts — asset derivatives |
Other current assets | $ | 6,495 | Other current assets | $ | 2,876 | ||||||
| Foreign exchange contracts — asset derivatives |
Other assets | 569 | Other current assets | — | ||||||||
| Foreign exchange contracts — liability derivatives |
Other accrued liabilities | (23,632 | ) | Other accrued liabilities | (201 | ) | ||||||
| Foreign exchange contracts — liability derivatives |
Other noncurrent liabilities | (739 | ) | Other noncurrent liabilities | — | |||||||
104
Table of Contents
Index to Financial Statements
The change in the fair values of ARRIS’s derivatives not designated as hedging instruments recorded in the Consolidated Statements of Operations during the years ended December 31, 2015, 2014, and 2013 were as follows (in thousands):
| Years Ended December 31, | ||||||||||||||
| Statement of Operations Location | 2015 | 2014 | 2013 | |||||||||||
| Derivatives not designated as hedging instruments: |
||||||||||||||
| Foreign exchange contracts |
Loss (gain) on foreign currency | $ | 7,597 | $ | (4,527 | ) | $ | (428 | ) | |||||
Note 9. Guarantees
Warranty
ARRIS provides warranties of various lengths to customers based on the specific product and the terms of individual agreements. The Company provides for the estimated cost of product warranties based on historical trends, the embedded base of product in the field, failure rates, and repair costs at the time revenue is recognized. Expenses related to product defects and unusual product warranty problems are recorded in the period that the problem is identified. While the Company engages in extensive product quality programs and processes, including actively monitoring and evaluating the quality of its suppliers, the estimated warranty obligation could be affected by changes in ongoing product failure rates, material usage and service delivery costs incurred in correcting a product failure, as well as specific product failures outside of ARRIS’s baseline experience. If actual product failure rates, material usage or service delivery costs differ from estimates, revisions (which could be material) would be recorded against the warranty liability.
The Company offers extended warranties and support service agreements on certain products. Revenue from these agreements is deferred at the time of the sale and recognized on a straight-line basis over the contract period. Costs of services performed under these types of contracts are charged to expense as incurred, which approximates the timing of the revenue stream.
Information regarding the changes in ARRIS’s aggregate product warranty liabilities for the years ending December 31, 2015 and 2014 were as follows (in thousands):
| 2015 | 2014 | |||||||
| Beginning balance |
$ | 74,320 | $ | 81,500 | ||||
| Accruals related to warranties (including changes in assumptions) |
19,111 | 33,320 | ||||||
| Settlements made (in cash or in kind) |
(44,404 | ) | (40,500 | ) | ||||
|
|
|
|
|
|||||
| Ending balance |
$ | 49,027 | $ | 74,320 | ||||
|
|
|
|
|
|||||
Note 10. Segment Information
The “management approach” has been used to present the following segment information. This approach is based upon the way the management of the Company organizes segments for making operating decisions and assessing performance. Financial information is reported on the basis that it is used internally by the chief operating decision maker (“CODM”) for evaluating segment performance and deciding how to allocate resources to segments. The Company’s chief executive officer has been identified as the CODM.
The CODM manages the Company under two segments:
| • | Customer Premises Equipment (“CPE”) — The CPE segment’s product solutions include set-tops, gateways, and subscriber premises equipment that enable service providers to offer Voice, Video and high-speed data services to residential and business subscribers. |
| • | Network & Cloud (“N&C”) — The N&C segment’s product solutions include cable modem termination system, video infrastructure, distribution and transmission equipment and cloud solutions that enable |
105
Table of Contents
Index to Financial Statements
| facility-based service providers to construct a state-of-the-art residential and metro distribution network. The portfolio also includes a full suite of global services that offer technical support, professional services and system integration offerings to enable solutions sales of ARRIS’s end-to-end product portfolio. |
These operating segments are determined based on the nature of the products and services offered. The measures that are used to assess the reportable segment’s operating performance are sales and direct contribution. Direct contribution is defined as gross margin less direct operating expense. The “Corporate and Unallocated Costs” category of expenses include corporate sales and marketing, home office general and administrative expenses, annual bonus and equity compensation. These expenses are not included in the measure of segment direct contribution and as such are reported as “Corporate and Unallocated Costs” and are included in the reconciliation to income (loss) before income taxes. A measure of assets is not applicable, as segment assets are not regularly reviewed by the CODM for evaluating performance or allocating resources.
The tables below present information about the Company’s reportable segments for the years ended December 31, 2015, 2014 and 2013 (in thousands):
| 2015 | 2014 | 2013 | ||||||||||
| Net sales to external customers: |
||||||||||||
| CPE |
$ | 3,136,585 | $ | 3,690,454 | $ | 2,448,381 | ||||||
| N&C |
1,661,594 | 1,637,544 | 1,193,001 | |||||||||
| Other |
153 | (5,077 | ) | (20,480 | ) | |||||||
|
|
|
|
|
|
|
|||||||
| Total |
4,798,332 | 5,322,921 | 3,620,902 | |||||||||
|
|
|
|
|
|
|
|||||||
| Direct contribution: |
||||||||||||
| CPE |
548,840 | 791,244 | 509,473 | |||||||||
| N&C |
487,166 | 430,943 | 264,589 | |||||||||
|
|
|
|
|
|
|
|||||||
| Segment total |
1,036,006 | 1,222,187 | 774,062 | |||||||||
|
|
|
|
|
|
|
|||||||
| Corporate and unallocated costs |
(568,336 | ) | (606,834 | ) | (515,391 | ) | ||||||
| Amortization of intangible assets |
(227,440 | ) | (236,521 | ) | (193,637 | ) | ||||||
| Integration, acquisition, restructuring and other |
(29,277 | ) | (37,498 | ) | (83,047 | ) | ||||||
|
|
|
|
|
|
|
|||||||
| Operating income (loss) |
210,953 | 341,334 | (18,013 | ) | ||||||||
|
|
|
|
|
|
|
|||||||
| Interest expense |
70,936 | 62,901 | 67,888 | |||||||||
| Loss on investments |
6,220 | 10,961 | 2,698 | |||||||||
| Interest income |
(2,379 | ) | (2,590 | ) | (2,936 | ) | ||||||
| Loss (gain) on foreign currency |
20,761 | 2,637 | (3,502 | ) | ||||||||
| Other expense ( income), net |
8,362 | 28,195 | 13,989 | |||||||||
|
|
|
|
|
|
|
|||||||
| Income (loss) before income taxes |
$ | 107,053 | $ | 239,230 | $ | (96,150 | ) | |||||
|
|
|
|
|
|
|
|||||||
For the years ended December 31, 2015, 2014 and 2013, the compositions of our corporate and unallocated costs that are reflected in the consolidated statement of operations were as follows (in thousands):
| 2015 | 2014 | 2013 | ||||||||||
| Corporate and unallocated costs: |
||||||||||||
| Cost of sales |
$ | 56,311 | $ | 69,973 | $ | 122,460 | ||||||
| Selling, general and administrative expenses |
349,993 | 349,693 | 278,921 | |||||||||
| Research and development expenses |
162,032 | 187,168 | 114,010 | |||||||||
|
|
|
|
|
|
|
|||||||
| Total |
$ | 568,336 | $ | 606,834 | $ | 515,391 | ||||||
|
|
|
|
|
|
|
|||||||
106
Table of Contents
Index to Financial Statements
The following table summarizes the Company’s net intangible assets and goodwill by reportable segment as of December 31, 2015 and 2014 (in thousands):
| Network & Cloud |
CPE | Total | ||||||||||
| December 31, 2015 |
||||||||||||
| Goodwill |
$ | 331,381 | $ | 682,582 | $ | 1,013,963 | ||||||
| Intangible assets, net |
284,528 | 525,920 | 810,448 | |||||||||
| December 31, 2014 |
||||||||||||
| Goodwill |
$ | 251,470 | $ | 684,597 | $ | 936,067 | ||||||
| Intangible assets, net |
298,799 | 644,589 | 943,388 | |||||||||
The following table summarizes the Company’s revenues by products and services as of December 31, 2015, 2014 and 2013 (in thousands):
| 2015 | 2014 | 2013 | ||||||||||
| CPE: |
||||||||||||
| CPE products |
$ | 3,136,585 | $ | 3,690,454 | $ | 2,448,381 | ||||||
|
|
|
|
|
|
|
|||||||
| Network & Cloud: |
||||||||||||
| Infrastructure equipment |
1,407,735 | 1,435,676 | 1,020,722 | |||||||||
| Global services |
181,892 | 141,625 | 120,314 | |||||||||
| Cloud solutions |
71,967 | 60,243 | 51,965 | |||||||||
|
|
|
|
|
|
|
|||||||
| Sub-total |
1,661,594 | 1,637,544 | 1,193,001 | |||||||||
|
|
|
|
|
|
|
|||||||
| Other: |
||||||||||||
| Other |
153 | (5,077 | ) | (20,480 | ) | |||||||
|
|
|
|
|
|
|
|||||||
| Total net sales |
$ | 4,798,332 | $ | 5,322,921 | $ | 3,620,902 | ||||||
|
|
|
|
|
|
|
|||||||
The Company’s two largest customers (including their affiliates, as applicable) are Comcast and Time Warner Cable. Over the past year, certain customers’ beneficial ownership may have changed as a result of mergers and acquisitions. Therefore the revenue for ARRIS’s customers for prior periods has been adjusted to include the affiliates under common control. A summary of sales to these customers for 2015, 2014 and 2013 is set forth below (in thousands, except percentages):
| Years ended December 31, | ||||||||||||
| 2015 | 2014 | 2013 | ||||||||||
| Comcast and affiliates |
$ | 1,007,892 | $ | 1,012,367 | $ | 674,977 | ||||||
| % of sales |
21.0 | % | 19.0 | % | 18.6 | % | ||||||
| Time Warner Cable and affiliates |
$ | 687,645 | $ | 600,770 | $ | 331,829 | ||||||
| % of sales |
14.3 | % | 11.3 | % | 9.2 | % | ||||||
107
Table of Contents
Index to Financial Statements
ARRIS sells its products primarily in the United States. The Company’s international revenue is generated from Asia Pacific, Canada, Europe and Latin America. Sales to customers outside of United States were approximately 28.8%, 25.7% and 32.1% of total sales for the years ended December 31, 2015, 2014 and 2013, respectively. International sales for the years ended December 31, 2015, 2014 and 2013 were as follows (in thousands):
| Years Ended December 31, | ||||||||||||
| 2015 | 2014 | 2013 | ||||||||||
| Americas, excluding U.S (1) |
$ | 880,581 | $ | 900,822 | $ | 746,146 | ||||||
| Asia Pacific |
142,893 | 147,921 | 153,674 | |||||||||
| EMEA |
356,275 | 316,975 | 263,910 | |||||||||
|
|
|
|
|
|
|
|||||||
| Total international sales |
$ | 1,379,749 | $ | 1,365,718 | $ | 1,163,730 | ||||||
|
|
|
|
|
|
|
|||||||
| (1) | Excludes U.S. sales of $3,418.6 million, $3,957.2 million and $2,457.2 million for the years ended December 31, 2015, 2014 and 2013, respectively. |
The following table summarizes ARRIS’s international property, plant and equipment assets by geographic region as of December 31, 2015 and 2014 (in thousands):
| As of December 31, | ||||||||
| 2015 | 2014 | |||||||
| Americas, excluding U.S. |
$ | 6,659 | $ | 7,303 | ||||
| Asia Pacific |
74,651 | 76,970 | ||||||
| EMEA |
7,265 | 8,129 | ||||||
|
|
|
|
|
|||||
| Total |
$ | 88,575 | $ | 92,402 | ||||
|
|
|
|
|
|||||
| (1) | Excludes U.S. assets of $223.7 million and $274.0 million for the years ended December 31, 2015 and 2014, respectively. |
Note 11. Inventories
The components of inventory are as follows, net of reserves (in thousands):
| December 31, | ||||||||
| 2015 | 2014 | |||||||
| Raw material |
$ | 60,287 | $ | 61,068 | ||||
| Work in process |
3,076 | 6,713 | ||||||
| Finished goods |
338,229 | 333,384 | ||||||
|
|
|
|
|
|||||
| Total inventories, net |
$ | 401,592 | $ | 401,165 | ||||
|
|
|
|
|
|||||
Note 12. Property, Plant and Equipment
Property, plant and equipment, at cost, consisted of the following (in thousands):
| December 31, | ||||||||
| 2015 | 2014 | |||||||
| Land |
$ | 68,562 | $ | 87,952 | ||||
| Buildings and leasehold improvements |
141,171 | 141,581 | ||||||
| Machinery and equipment |
407,110 | 402,709 | ||||||
|
|
|
|
|
|||||
| 616,843 | 632,242 | |||||||
| Less: Accumulated depreciation |
(304,532 | ) | (265,811 | ) | ||||
|
|
|
|
|
|||||
| Total property, plant and equipment, net |
$ | 312,311 | $ | 366,431 | ||||
|
|
|
|
|
|||||
108
Table of Contents
Index to Financial Statements
During 2014, the Company entered into a binding letter of intent for the sale of land and building for $2.9 million which was lower than its carrying amount of $4.8 million. The asset was reclassified as held for sale and was measured at its fair value less cost to sell and classified as a component of “Other current assets” as of December 31, 2014. The Company recorded an impairment charge of $2.1 million to reduce the asset’s carrying amount to its estimated fair value less cost to sell during 2014, which is reported in the Consolidated Statements of Operations under the caption “Other expense (income), net.” The sale closed in the first quarter of 2015.
Note 13. Lease Financing Obligation
Sale-leaseback of San Diego Office Complex:
In 2015, the Company sold its San Diego office complex consisting of land and buildings with a net book value of $71.0 million, for total consideration of $85.5 million. The Company concurrently entered into a leaseback arrangement for two buildings on the San Diego campus (“Building 1” and “Building 2”) with an initial leaseback term of ten years for Building 1 and a maximum term of one year for Building 2. The Company determined that the sale-leaseback of Building 1 did not qualify for sale-leaseback accounting due to continuing involvement that will exist for the 10-year lease term. Accordingly, the carrying amount of Building 1 will remain on the Company’s balance sheet and will be depreciated over its remaining useful life with the proceeds reflected as a financing obligation.
At December 31, 2015, the minimum lease payments required on the financing obligation were as follows (in thousands):
| 2016 |
$ | 4,016 | ||
| 2017 |
4,136 | |||
| 2018 |
4,260 | |||
| 2019 |
4,388 | |||
| 2020 |
4,520 | |||
| Thereafter through 2025 |
20,757 | |||
|
|
|
|||
| Total minimum lease payments |
$ | 42,077 | ||
|
|
|
The Company concluded that Building 2 qualified for sale-leaseback accounting with the subsequent leaseback classified as an operating lease. A loss of $5.3 million was recorded at the closing of the transaction in 2015.
109
Table of Contents
Index to Financial Statements
Note 14. Indebtedness
The following is a summary of indebtedness and lease financing obligations as of December 31, 2015 and 2014 (in thousands):
| As of December 31, 2015 | As of December 31, 2014 | |||||||
| Current liabilities: |
||||||||
| Term A loan |
$ | 49,500 | $ | 75,625 | ||||
| Lease finance obligation |
758 | — | ||||||
|
|
|
|
|
|||||
| Current obligations |
50,258 | 75,625 | ||||||
| Current deferred financing fees and debt discount |
(6,667 | ) | (8,601 | ) | ||||
|
|
|
|
|
|||||
| 43,591 | 67,024 | |||||||
| Noncurrent liabilities: |
||||||||
|
|
|
|||||||
| Term A loan |
915,750 | 928,125 | ||||||
| Term B loan |
543,812 | 543,812 | ||||||
| Revolver |
— | — | ||||||
| Lease finance obligation |
58,676 | — | ||||||
|
|
|
|
|
|||||
| Noncurrent obligations |
1,518,238 | 1,471,937 | ||||||
| Noncurrent deferred financing fees and debt discount |
(21,995 | ) | (22,977 | ) | ||||
|
|
|
|
|
|||||
| 1,496,243 | 1,448,960 | |||||||
|
|
|
|
|
|||||
| Total |
$ | 1,539,834 | $ | 1,515,984 | ||||
|
|
|
|
|
|||||
Senior Secured Credit Facilities
On June 18, 2015, ARRIS amended and restated its existing credit agreement dated March 27, 2013 (the “Existing Credit Agreement”) to improve the terms and conditions of the credit agreement, extend the maturities of certain loan facilities, increase the amount of the revolving credit facility, and add a new term A-1 loan facility to fund the acquisition of Pace. The credit facility under the amended credit agreement (the “Amended Credit Agreement”) was entered into with Bank of America, N.A. and various other institutions, and is comprised of (i) a “Term Loan A Facility” of $990 million, (ii) a “Term Loan B Facility” of $543.8 million, (iii) a “Revolving Credit Facility” of $500 million and (iv) a “Term Loan A-1 Facility” of $800 million, was funded upon the closing of the acquisition of Pace in 2016. The Amended Credit Agreement refinanced the Term Loan A Facility and Revolving Credit Facility under the Existing Credit Agreement while the Term Loan B Facility is a continuation of the Term Loan B Facility under the Existing Credit Agreement. Under the Amended Credit Agreement, the Term Loan A Facility and the Revolving Credit Facility will mature on June 18, 2020. The Term Loan B Facility will mature on April 17, 2020. ARRIS determined that the refinancing transaction was treated as a debt modification as the changes in the terms of the amended Term Loan A Facility and Revolving Credit Facility were not considered substantial. In connection with the Amended Credit Agreement, as of December 31, 2015, the Company capitalized approximately $5.0 million of financing fees and $3.2 million of original issuance discount. An additional $2.3 million of original issuance discount will be capitalized in the first quarter of 2016 related to drawing on the Term A-1 Facility. In addition, the Company expensed approximately $13.0 million of debt issuance costs and wrote off approximately $2.1 million of existing debt issuance costs associated with certain lenders who were not party to the amended Term Loan A Facility and Revolving Credit Facility, which were included as interest expense in the Consolidated Statements of Operations for the year ended December 31, 2015.
Interest rates on borrowings under the senior secured credit facilities are set forth in the table below. As of December 31, 2015, ARRIS had $1,509.1 million principal amount outstanding under the Term Loan A and
110
Table of Contents
Index to Financial Statements
Term Loan B Facilities, no borrowings under the Revolving Credit Facility and letters of credit totaling $2.1 million issued under the Revolving Credit Facility.
| Rate | As of December 31, 2015 | |||||
| Term Loan A |
LIBOR + 1.75 % | 2.17 | % | |||
| Term Loan B |
LIBOR(1) + 2.50 % | 3.25 | % | |||
| Revolving Credit Facility (2) |
LIBOR + 1.75 % | Not Applicable | ||||
| (1) | Includes LIBOR floor of 0.75% |
| (2) | Includes unused commitment fee of 0.35% and letter of credit fee of 1.75% not reflected in interest rate above. |
Borrowings under the senior secured credit facilities are secured by first priority liens on substantially all of the assets of ARRIS and certain of its present and future subsidiaries who are or become parties to, or guarantors under, the Amended Credit Agreement governing the senior secured credit facilities. The Amended Credit Agreement provides terms for mandatory prepayments and optional prepayments and commitment reductions. The Amended Credit Agreement also includes events of default, which are customary for facilities of this type (with customary grace periods, as applicable), including provisions under which, upon the occurrence of an event of default, all amounts outstanding under the credit facilities may be accelerated. The Amended Credit Agreement contains usual and customary limitations on indebtedness, liens, restricted payments, acquisitions and asset sales in the form of affirmative, negative and financial covenants, which are customary for financings of this type, including the maintenance of a minimum interest coverage ratio of 3.50:1 and a maximum leverage ratio of 3.75:1 (with a scheduled decrease to 3.50:1 in the first quarter of 2017). As of December 31, 2015, ARRIS was in compliance with all covenants under the Amended Credit Agreement.
The Amended Credit Agreement provides for certain adjustments to the interest rates paid on the Term Loan A, Term Loan A-1, Term Loan B and Revolving Credit Facility based upon certain leverage ratios.
During the year ended December 31, 2015, the Company made mandatory prepayments of approximately $38.5 million related to the senior secured credit facilities. In addition, the Company paid $15 million of debt assumed in the ActiveVideo acquisition during the second quarter of 2015. Quarterly mandatory principal repayments on Term Loan A-1 will begin in the first quarter of 2016.
As of December 31, 2015, the scheduled maturities of the contractual debt obligations for the next five years are as follows (in thousands):
| 2016 |
$ | 49,500 | ||
| 2017 |
49,500 | |||
| 2018 |
49,500 | |||
| 2019 |
49,500 | |||
| 2020 |
1,311,062 |
111
Table of Contents
Index to Financial Statements
Note 15. Earnings Per Share
The following is a reconciliation of the numerators and denominators of the basic and diluted earnings (loss) per share computations for the periods indicated (in thousands, except per share data):
| For the Years Ended December 31, | ||||||||||||
| 2015 | 2014 | 2013 | ||||||||||
| Basic: |
||||||||||||
| Net income (loss) attributable to ARRIS Group Inc. |
$ | 92,181 | $ | 327,211 | $ | (48,760 | ) | |||||
|
|
|
|
|
|
|
|||||||
| Weighted average shares outstanding |
146,388 | 144,386 | 131,980 | |||||||||
|
|
|
|
|
|
|
|||||||
| Basic earnings (loss) per share |
$ | 0.63 | $ | 2.27 | $ | (0.37 | ) | |||||
|
|
|
|
|
|
|
|||||||
| Diluted: |
||||||||||||
| Net income (loss) attributable to ARRIS Group Inc. |
$ | 92,181 | $ | 327,211 | $ | (48,760 | ) | |||||
|
|
|
|
|
|
|
|||||||
| Weighted average shares outstanding |
146,388 | 144,386 | 131,980 | |||||||||
| Net effect of dilutive shares |
2,971 | 3,894 | — | |||||||||
|
|
|
|
|
|
|
|||||||
| Total |
149,359 | 148,280 | 131,980 | |||||||||
|
|
|
|
|
|
|
|||||||
| Diluted earnings (loss) per share |
$ | 0.62 | $ | 2.21 | $ | (0.37 | ) | |||||
|
|
|
|
|
|
|
|||||||
For the year ended December 31, 2015, 2014 and 2013, approximately 6.8 thousand, 4.3 thousand and 1.1 million of the equity-based awards, respectively, were excluded from the computation of diluted earnings per share shares because their effect would have been anti-dilutive. These exclusions are made if the exercise price of these equity-based awards is in excess of the average market price of the common stock for the period, or if the Company has net losses, both of which have an anti-dilutive effect.
During the twelve months ended December 31, 2015, the Company issued 3.2 million shares of its common stock related to stock option exercises and the vesting of restricted shares, as compared to 3.1 million shares for the twelve months ended December 31, 2014.
In 2013, in connection with the Motorola Home acquisition, Google was issued approximately 10.6 million shares of ARRIS’s common stock as part of the purchase consideration. Furthermore, Comcast was given an opportunity to invest in ARRIS, and the Company entered into a separate agreement accounted for as a contingent equity forward with a subsidiary of Comcast providing for the purchase by it from the Company of approximately 10.6 million shares of common stock for $150 million.
The Company issued 3.1 million shares of its common stock in the fourth quarter of 2013 in conjunction with redeeming its 2% Convertible Notes.
The Company has not paid cash dividends on its stock since its inception.
Note 16. Income Taxes
Income (loss) before income taxes (in thousands):
| Years Ended December 31, | ||||||||||||
| 2015 | 2014 | 2013 | ||||||||||
| Domestic |
$ | 47,063 | $ | 180,133 | $ | (128,588 | ) | |||||
| Foreign |
59,990 | 59,097 | 32,438 | |||||||||
|
|
|
|
|
|
|
|||||||
| $ | 107,053 | $ | 239,230 | $ | (96,150 | ) | ||||||
|
|
|
|
|
|
|
|||||||
112
Table of Contents
Index to Financial Statements
Income tax expense (benefit) consisted of the following (in thousands):
| Years Ended December 31, | ||||||||||||
| 2015 | 2014 | 2013 | ||||||||||
| Current — Federal |
$ | (5,063 | ) | $ | 45,937 | $ | (5,133 | ) | ||||
| State |
7,204 | 13,260 | (40 | ) | ||||||||
| Foreign |
15,035 | 18,136 | 10,624 | |||||||||
|
|
|
|
|
|
|
|||||||
| 17,176 | 77,333 | 5,451 | ||||||||||
|
|
|
|
|
|
|
|||||||
| Deferred — Federal |
7,521 | (140,404 | ) | (50,485 | ) | |||||||
| State |
(2,402 | ) | (19,978 | ) | (2,189 | ) | ||||||
| Foreign |
299 | (4,932 | ) | (167 | ) | |||||||
|
|
|
|
|
|
|
|||||||
| 5,418 | (165,314 | ) | (52,841 | ) | ||||||||
|
|
|
|
|
|
|
|||||||
| Income tax expense (benefit) |
$ | 22,594 | $ | (87,981 | ) | $ | (47,390 | ) | ||||
|
|
|
|
|
|
|
|||||||
A reconciliation of the U.S. statutory federal income tax rate of 35% and the effective income tax rates is as follows:
| Years Ended December 31, | ||||||||||||
| 2015 | 2014 | 2013 | ||||||||||
| Statutory U.S. federal income tax rate |
35.0 | % | 35.0 | % | 35.0 | % | ||||||
| Effects of: |
||||||||||||
| State income taxes, net of federal benefit |
5.2 | (6.6 | ) | 2.2 | ||||||||
| Acquired deferred tax assets |
5.8 | (16.5 | ) | — | ||||||||
| U.S. domestic manufacturing deduction |
(0.7 | ) | (2.1 | ) | 1.1 | |||||||
| Nontaxable Comcast derivative gain |
— | — | (9.6 | ) | ||||||||
| Facilitative acquisition costs |
— | — | (3.5 | ) | ||||||||
| Research and development tax credits |
(26.6 | ) | (8.7 | ) | 26.8 | |||||||
| Subpart F income |
4.8 | 0.8 | — | |||||||||
| Changes in valuation allowance |
(26.6 | ) | (44.2 | ) | — | |||||||
| Foreign tax credits |
(20.7 | ) | (0.6 | ) | 1.3 | |||||||
| Non-deductible officer compensation |
5.3 | 0.6 | (0.5 | ) | ||||||||
| Non-U.S. tax rate differential |
(5.0 | ) | (2.6 | ) | 1.3 | |||||||
| Recapture of dual consolidated losses |
1.1 | 4.0 | — | |||||||||
| Taiwan gain |
34.3 | — | — | |||||||||
| Other, net |
9.2 | 4.1 | (4.8 | ) | ||||||||
|
|
|
|
|
|
|
|||||||
| 21.1 | % | (36.8 | )% | 49.3 | % | |||||||
|
|
|
|
|
|
|
|||||||
113
Table of Contents
Index to Financial Statements
Deferred income taxes reflect the net tax effects of temporary differences between carrying amounts of assets and liabilities for financial reporting purposes and the amounts used for income tax purposes. Significant components of ARRIS’s net deferred income tax assets (liabilities) were as follows (in thousands):
| December 31, | ||||||||
| 2015 | 2014 | |||||||
| Deferred income tax assets (1): |
||||||||
| Inventory costs |
$ | 28,728 | $ | 34,695 | ||||
| Accrued vacation |
7,138 | 7,980 | ||||||
| Acquisition charges |
6,556 | — | ||||||
| Allowance for bad debt |
4,396 | — | ||||||
| Equity compensation |
14,673 | 14,639 | ||||||
| Deferred revenue |
— | 1,001 | ||||||
| Federal/state net operating loss carryforwards |
95,571 | 217,656 | ||||||
| Federal capital loss carryforwards |
— | 7,701 | ||||||
| Foreign net operating loss carryforwards |
10,989 | 11,840 | ||||||
| Research and development credits |
79,809 | 62,661 | ||||||
| Property, plant and equipment, depreciation and basis differences |
1,285 | — | ||||||
| Pension and deferred compensation |
19,166 | 18,393 | ||||||
| Warranty reserve |
18,215 | 26,187 | ||||||
| Capitalized research and development |
215,894 | 226,270 | ||||||
| Other |
22,929 | 42,188 | ||||||
|
|
|
|
|
|||||
| Total deferred income tax assets |
525,349 | 671,211 | ||||||
|
|
|
|
|
|||||
| Deferred income tax liabilities: |
||||||||
| Property, plant and equipment, depreciation and basis differences |
— | (19,744 | ) | |||||
| Excess tax on future repatriation of foreign earnings |
(1,184 | ) | (1,184 | ) | ||||
| Other noncurrent liabilities |
(3,210 | ) | (30,904 | ) | ||||
| Goodwill and intangible assets |
(248,231 | ) | (316,192 | ) | ||||
|
|
|
|
|
|||||
| Total deferred income tax liabilities |
(252,625 | ) | (368,024 | ) | ||||
|
|
|
|
|
|||||
| Net deferred income tax assets |
272,724 | 303,187 | ||||||
| Valuation allowance |
(87,788 | ) | (118,629 | ) | ||||
|
|
|
|
|
|||||
| Net deferred income tax assets (liabilities) |
$ | 184,936 | $ | 184,558 | ||||
|
|
|
|
|
|||||
| (1) | See Note 3 Impact of Recently Issued Accounting Standards of Notes to Consolidated Financial Statements regarding the early adoption of Balance Sheet Classification of Deferred Taxes requiring all deferred tax assets and liabilities, and any related valuation allowance, to be classified as noncurrent on the balance sheet. |
As of December 31, 2015 and December 31, 2014, ARRIS had $218.9 million and $552.9 million, respectively, of U.S. federal net operating losses available to offset against future ARRIS taxable income. During 2015, ARRIS utilized approximately $327.1 million of U.S. federal net operating losses against taxable income. The U.S. federal net operating losses may be carried forward for twenty years. The available acquired U.S. Federal net operating losses as of December 31, 2015, will expire between the years 2015 and 2031. A significant portion of the acquired U.S. federal net operating losses expire by 2017.
114
Table of Contents
Index to Financial Statements
As of December 31, 2015, ARRIS also had $353.1 million of state net operating loss carryforwards in various states. The amounts available for utilization vary by state due to the apportionment of the Company’s taxable income and state law governing the expiration of these net operating losses. State net operating loss carryforwards of approximately $28.9 million relate to the exercise of employee stock options and restricted stock (“equity compensation”). Any future cash benefit resulting from the utilization of these state net operating losses attributable to this portion of equity compensation will be credited directly to paid-in capital during the year in which the cash benefit is realized.
ARRIS has foreign net operating loss carryforwards available, as of December 31, 2015, of approximately $54.9 million with varying expiration dates. Approximately $17.8 million of the total foreign net operating loss carryforwards relate to ARRIS’s Irish subsidiary and have an indefinite life. Approximately $11.8 million of the foreign net operating loss carryforwards relate to the Canadian subsidiary and expire within 18 years.
During the tax years ending December 31, 2015, and 2014, we utilized $0 and $25.7 million, respectively, of U.S. federal research and development credits to reduce U.S. federal income tax liabilities. As of December 31, 2015, ARRIS has $70.7 million of available U.S. federal research and development tax credits and $28.3 million of available state research and development tax credits to carry forward to subsequent years. The remaining unutilized U.S. federal research and development tax credits can be carried back one year and carried forward twenty years. The state research and development tax credits carry forward and will expire pursuant to various applicable state rules.
ARRIS’s ability to use U.S. federal and state net operating loss carryforwards to reduce future taxable income, or to use U.S. federal and state research and development tax credit and foreign tax credit carryforwards to reduce future income tax liabilities, is subject to restrictions attributable to equity transactions that resulted in a change of ownership during prior tax years, as defined in Internal Revenue Code Sections 382, 383 and the separate return limitation year (“SRLY”) rules.
The valuation allowance for deferred income tax assets of $87.8 million and $118.6 million at December 31, 2015 and 2014, respectively, relates to the uncertainty surrounding the realization of certain deferred income tax assets in various jurisdictions. The $30.8 million net reduction in valuation allowances for the year was due primarily to a reduction in the valuation allowance on net operating losses from the Motorola Home acquisition. The Company continually reviews the adequacy of its valuation allowances by reassessing whether it is more-likely-than-not to realize its various deferred income tax assets.
An analysis of the deferred tax asset valuation allowances is as follows: (in thousands):
| 2015 | 2014 | 2013 | ||||||||||
| Balance at beginning of fiscal year |
$ | 118,629 | $ | 163,745 | $ | 17,973 | ||||||
| Additions |
3,312 | 37,708 | 147,349 | |||||||||
| Deductions |
(34,153 | ) | (82,824 | ) | (1,577 | ) | ||||||
|
|
|
|
|
|
|
|||||||
| Balance at end of fiscal year |
$ | 87,788 | $ | 118,629 | $ | 163,745 | ||||||
|
|
|
|
|
|
|
|||||||
As of December 31, 2015, the Company did not provide U.S. federal income taxes or foreign withholding taxes on approximately $61 million of undistributed earnings of its foreign subsidiaries as such earnings are intended to be reinvested indefinitely. The Company did record a deferred tax liability of approximately $1.2 million relating to approximately $5.4 million of distributable earnings of an Israeli subsidiary. Should earnings of the other foreign subsidiaries be distributed in the form of dividends, or otherwise, ARRIS would have additional taxable income and, depending on the Company’s tax posture in the year of repatriation, may have to pay additional income taxes. Withholding taxes in various jurisdictions may also apply to the repatriation of foreign earnings. Determination of the amount of unrecognized income tax liability related to these permanently
115
Table of Contents
Index to Financial Statements
reinvested and undistributed foreign subsidiary earnings is not practicable because of the complexities associated with this hypothetical calculation.
Tabular Reconciliation of Unrecognized Tax Benefits (in thousands):
| December 31, | ||||||||||||
| 2015 | 2014 | 2013 | ||||||||||
| Beginning balance |
$ | 48,019 | $ | 28,344 | $ | 25,704 | ||||||
| Gross increases — tax positions in prior period |
1,599 | 17,636 | 2,442 | |||||||||
| Gross decreases — tax positions in prior period |
(2,185 | ) | (4,115 | ) | (21 | ) | ||||||
| Gross increases — current-period tax positions |
9,578 | 9,979 | 6,999 | |||||||||
| Increases (decreases) from acquired businesses |
— | (196 | ) | 2,014 | ||||||||
| Decreases relating to settlements with taxing authorities and other |
(6,689 | ) | (2,480 | ) | (1,098 | ) | ||||||
| Decreases due to lapse of statute of limitations |
(403 | ) | (1,149 | ) | (7,696 | ) | ||||||
|
|
|
|
|
|
|
|||||||
| Ending balance |
$ | 49,919 | $ | 48,019 | $ | 28,344 | ||||||
|
|
|
|
|
|
|
|||||||
The Company and its subsidiaries file income tax returns in the U.S. federal jurisdiction, and various state and foreign jurisdictions. With few exceptions, the Company is no longer subject to U.S. federal, state and local, or non-U.S. income tax examinations by tax authorities for years before 2011. As of December 31, 2015, the Company and its subsidiaries were under income tax audit in nine jurisdictions (the state of California, the state of New York, the state of Michigan, the state of Illinois, the state of New Jersey, China, Vietnam, Japan and Portugal) and the Company has not received notices of any planned or proposed income tax audits.
ARRIS does not anticipate any audit adjustments in excess of its current accrual for uncertain tax positions.
At the end of 2015, the Company’s total tax liability related to uncertain net tax positions totaled approximately $46.2 million, all of which would cause the effective income tax rate to change upon the recognition. The difference between the $49.9 million of unrecognized tax benefits reported in the tabular reconciliation above and the $46.2 million of total tax liability relating to uncertain net tax positions are attributable to interest, penalties and the federal benefit of state deductions. Based on information currently available, the Company anticipates that over the next twelve month period, statutes of limitations may close and audit settlements will occur relating to existing unrecognized tax benefits of approximately $0.5 million primarily arising from U.S. Federal and state tax related items. The Company reported approximately $1.7 million and $1.7 million, respectively, of interest and penalty accrual related to the anticipated payment of these potential tax liabilities as of December 31, 2015 and 2014. The Company classifies interest and penalties recognized on the liability for uncertain tax positions as income tax expense.
Note 17. Stock-Based Compensation
ARRIS grants stock awards under its 2011 Stock Incentive Plan (“SIP”). Upon approval of the 2011 SIP, all shares available for grant under existing stock incentive plans were no longer available. However, all outstanding options granted under the previous plans are still exercisable. The Board of Directors approved the SIP and the prior plans to facilitate the retention and continued motivation of key employees, consultants and directors, and to align more closely their interests with those of the Company and its stockholders.
Awards under the SIP may be in the form of stock options, stock grants, stock units, restricted stock, stock appreciation rights, performance shares and units, and dividend equivalent rights. A total of 17,500,000 shares of the Company’s shares may be issued pursuant to the SIP. The SIP has been designed to allow for flexibility in the form of awards; however, awards denominated in shares of common stock other than stock options and stock appreciation rights will be counted against the SIP limit as 1.87 shares for every one share covered by such an award. The vesting requirements for issuance under the SIP may vary; however, awards generally are required to have a minimum three-year vesting period or term.
116
Table of Contents
Index to Financial Statements
In connection with the 2011 acquisition of BigBand Networks, Inc., ARRIS assumed the BigBand Networks, Inc. 2007 Equity Incentive Plan (the “Assumed BigBand Plan”), including the restricted stock units outstanding under the Assumed BigBand Plan at the time of the acquisition. ARRIS may continue to grant awards under the Assumed BigBand Plan in certain circumstances so long as the grants comply with the applicable requirements of NASDAQ. A total of 125,352 shares of the Company’s ordinary shares remain available for issuance under the Assumed BigBand Plan.
Stock Options
ARRIS grants stock options to certain employees. Stock options generally vest over three or four years of service and have either seven or ten year contractual terms. The exercise price of an option is equal to the fair market value of ARRIS’s stock on the date of grant.
There were no new options granted in 2015, 2014 and 2013. The total intrinsic value of options exercised during 2015, 2014 and 2013 was approximately $0.7 million, $6.5 million and $9.6 million, respectively.
A summary of activity of ARRIS’s options granted under its stock incentive plans is presented below:
| Options | Weighted Average Exercise Price |
Weighted Average Remaining Contractual Term (in years) |
Aggregate Intrinsic Value (in thousands) |
|||||||||||||
| Beginning balance, December 31, 2014 |
38,000 | $ | 11.97 | |||||||||||||
| Exercised |
(35,422 | ) | 11.93 | |||||||||||||
| Expired |
(2,578 | ) | 12.57 | |||||||||||||
|
|
|
|||||||||||||||
| Ending balance, December 31, 2015 |
— | — | — | $ | — | |||||||||||
|
|
|
|||||||||||||||
| Exercisable at December 31, 2015 |
— | — | — | $ | — | |||||||||||
|
|
|
|||||||||||||||
Restricted Stock (Non-Performance) and Stock Units
ARRIS grants restricted stock and stock units to certain employees and its non-employee directors. The Company records a fixed compensation expense equal to the fair market value of the shares of restricted stock granted on a straight-line basis over the requisite services period for the restricted shares. The Company applies an estimated forfeiture rate based upon historical rates. The fair value is the market price of the underlying ordinary shares on the date of grant.
In connection with the Pace acquisition, ARRIS accelerated the vesting of the time-based restricted shares that otherwise were scheduled to vest in 2016 for all of its executive officers and additional acceleration of Messrs. Stanzione and Margolis time-based restricted shares that otherwise would vest in 2017, 2018 and 2019. The total shares accelerated in December 2015 were 504,833 shares.
The following table summarizes ARRIS’s unvested restricted stock (excluding performance-related) and stock unit transactions during the year ending December 31, 2015:
| Shares | Weighted Average Grant Date Fair Value |
|||||||
| Unvested at December 31, 2014 |
6,991,789 | $ | 19.29 | |||||
| Granted |
2,336,360 | 29.08 | ||||||
| Vested |
(3,019,824 | ) | 18.13 | |||||
| Forfeited |
(323,076 | ) | 21.24 | |||||
|
|
|
|||||||
| Unvested at December 31, 2015 |
5,985,249 | 23.59 | ||||||
|
|
|
|||||||
117
Table of Contents
Index to Financial Statements
Restricted Shares — Subject to Comparative Market Performance
ARRIS grants to certain employees restricted shares, in which the number of shares is dependent upon the Company’s total shareholder return as compared to the shareholder return of the NASDAQ composite over a three year period. The number of shares which could potentially be issued ranges from zero to 200% of the target award. For the shares granted in 2013, the three-year measurement period ended on December 31, 2015. However, in connection with the Pace acquisition, ARRIS accelerated the vesting of the market-based restricted shares that otherwise were scheduled to vest in 2016 for all of its executive officers using measurement period ended on December 23, 2015. This resulted in an achievement of 200.0% of the target award, or 504,810 shares. The remaining grants outstanding that are subject to market performance are 444,790 shares at target; at 200% performance 889,580 would be issued. Compensation expense is recognized on a straight-line basis over the three year measurement period and is based upon the fair market value of the shares estimated to be earned. The fair value of the restricted shares is estimated on the date of grant using a Monte Carlo Simulation model.
The total fair value of restricted shares, including both non-performance and performance-related shares, that vested during 2015, 2014 and 2013 was $118.3 million, $82.6 million and $36.3 million, respectively.
Employee Stock Purchase Plan (“ESPP”)
ARRIS offers an ESPP to certain employees. The plan complies with Section 423 of the U.S. Internal Revenue Code, which provides that employees will not be immediately taxed on the difference between the market price of the stock and a discounted purchase price if it meets certain requirements. Participants can request that up to 10% of their base compensation be applied toward the purchase of ARRIS ordinary shares under ARRIS’s ESPP. Purchases by any one participant are limited to $25,000 (based upon the fair market value) in any one year. The exercise price is the lower of 85% of the fair market value of the ARRIS ordinary shares on either the first day of the purchase period or the last day of the purchase period. A plan provision which allows for the more favorable of two exercise prices is commonly referred to as a “look-back” feature. Any discount offered in excess of five percent generally will be considered compensatory and appropriately is recognized as compensation expense. Additionally, any ESPP offering a look-back feature is considered compensatory. ARRIS uses the Black-Scholes option valuation model to value shares issued under the ESPP. The valuation is comprised of two components; the 15% discount of a share of ordinary shares and 85% of a six month option held (related to the look-back feature). The weighted average assumptions used to estimate the fair value of purchase rights granted under the ESPP for 2015, 2014 and 2013, were as follows: risk-free interest rates of 0.1%; a dividend yield of 0%; volatility factor of the expected market price of ARRIS’s stock of 0.41, 0.37, and 0.26, respectively; and a weighted average expected life of 0.5 year for each. The Company recorded stock compensation expense related to the ESPP of approximately $5.1 million, $4.1 million and $1.4 million for the years ended December 31, 2015, 2014 and 2013, respectively.
Unrecognized Compensation Cost
As of December 31, 2015, there was approximately $112.7 million of total unrecognized compensation cost related to unvested share-based awards granted under the Company’s incentive plans. This compensation cost is expected to be recognized over a weighted-average period of 2.6 years.
Note 18. Employee Benefit Plans
The Company sponsors a qualified and a non-qualified non-contributory defined benefit pension plan that covers certain U.S. employees. As of January 1, 2000, the Company froze the qualified defined pension plan benefits for its participants. These participants elected to enroll in ARRIS’s enhanced 401(k) plan.
The U.S. pension plan benefit formulas generally provide for payments to retired employees based upon their length of service and compensation as defined in the plans. ARRIS’s investment policy is to fund the qualified plan as required by the Employee Retirement Income Security Act of 1974 (“ERISA”) and to the extent that such contributions are tax deductible.
118
Table of Contents
Index to Financial Statements
The investment strategies of the plans place a high priority on benefit security. The plans invest conservatively so as not to expose assets to depreciation in adverse markets. The plans’ strategy also places a high priority on earning a rate of return greater than the annual inflation rate along with maintaining average market results. The plan has targeted asset diversification across different asset classes and markets to take advantage of economic environments and to also act as a risk minimizer by dampening the portfolio’s volatility. The following table summarizes the weighted average pension asset allocations as December 31, 2015 and 2014:
| Weighted Average Allocation | ||||||||||||
| Target | Actual | |||||||||||
| 2015 | 2015 | 2014 | ||||||||||
| Equity securities |
40-45 | % | 40 | % | 43 | % | ||||||
| Debt securities |
0-5 | 2 | 3 | |||||||||
| Cash and cash equivalents |
50-60 | 58 | 54 | |||||||||
|
|
|
|
|
|
|
|||||||
| 100 | % | 100 | % | 100 | % | |||||||
|
|
|
|
|
|
|
|||||||
The following table summarizes the Company’s U.S. pension plan assets by category and by level (as described in Note 7 of the Notes to the Consolidated Financial Statements) as of December 31, 2015 and 2014 (in thousands):
| December 31, 2015 | ||||||||||||||||
| Level 1 | Level 2 | Level 3 | Total | |||||||||||||
| Cash and cash equivalents (1) |
$ | — | $ | 7,424 | $ | — | $ | 7,424 | ||||||||
| Equity securities (2): |
||||||||||||||||
| U.S. large cap |
1,330 | — | — | 1,330 | ||||||||||||
| U.S. mid cap |
1,160 | — | — | 1,160 | ||||||||||||
| U.S. small cap |
1,160 | — | — | 1,160 | ||||||||||||
| International |
1,757 | — | — | 1,757 | ||||||||||||
| Fixed income securities (3): |
685 | — | — | 685 | ||||||||||||
|
|
|
|
|
|
|
|
|
|||||||||
| Total |
$ | 6,092 | $ | 7,424 | $ | — | $ | 13,516 | ||||||||
|
|
|
|
|
|
|
|
|
|||||||||
| December 31, 2014 | ||||||||||||||||
| Level 1 | Level 2 | Level 3 | Total | |||||||||||||
| Cash and cash equivalents (1) |
$ | — | $ | 7,752 | $ | — | $ | 7,752 | ||||||||
| Equity securities (2): |
||||||||||||||||
| U.S. large cap |
1,571 | — | — | 1,571 | ||||||||||||
| U.S. mid cap |
1,640 | — | — | 1,640 | ||||||||||||
| U.S. small cap |
1,367 | — | — | 1,367 | ||||||||||||
| International |
2,050 | — | — | 2,050 | ||||||||||||
| Fixed income securities (3): |
205 | — | — | 205 | ||||||||||||
|
|
|
|
|
|
|
|
|
|||||||||
| Total |
$ | 6,833 | $ | 7,752 | $ | — | $ | 14,585 | ||||||||
|
|
|
|
|
|
|
|
|
|||||||||
| (1) | Cash and cash equivalents, which are used to pay benefits and administrative expenses, are held in a stable value fund. |
| (2) | Equity securities consist of mutual funds and the underlying investments are indexes. Investments in mutual funds are valued at the net asset value per share multiplied by the number of shares held. |
| (3) | Fixed income securities consist of bonds securities in mutual funds, and are valued at the net asset value per share multiplied by the number of shares held. |
119
Table of Contents
Index to Financial Statements
The Company has established a rabbi trust to fund the pension obligations of the Chief Executive Officer under his Supplemental Retirement Plan including the benefit under the Company’s non-qualified defined benefit plan. In addition, the Company has established a rabbi trust for certain executive officers to fund the Company’s pension liability to those officers under the non-qualified plan. Effective June 30, 2013, the Company amended the Supplemental Retirement Plan. This amendment effectively froze entry of any new participants into the Supplemental Plan and, for existing participants, a freeze on any additional benefit accrual after June 30, 2013. The participant’s benefit will continue to be distributed in accordance with the provisions of the Supplemental Plan but the final benefit accrual was frozen as of June 30, 2013. A curtailment gain of approximately $0.3 million, which represents the difference in the projected benefit obligation and the accumulated benefit obligation at June 30, 2013, offsets the existing plan loss and lowers future pension expense.
Summary data for the U.S. non-contributory defined benefit pension plans is as follows (in thousands):
| Years Ended December 31, | ||||||||
| 2015 | 2014 | |||||||
| Change in Projected Benefit Obligation: |
||||||||
| Projected benefit obligation at beginning of year |
$ | 46,550 | $ | 40,382 | ||||
| Service cost |
— | — | ||||||
| Interest cost |
1,716 | 1,783 | ||||||
| Actuarial (gain) loss |
(3,962 | ) | 5,692 | |||||
| Benefit payments |
(1,305 | ) | (1,307 | ) | ||||
| Other |
— | — | ||||||
|
|
|
|
|
|||||
| Projected benefit obligation at end of year |
$ | 42,999 | $ | 46,550 | ||||
|
|
|
|
|
|||||
| Change in Plan Assets: |
||||||||
| Fair value of plan assets at beginning of year |
$ | 14,585 | $ | 15,162 | ||||
| Actual return on plan assets |
81 | 575 | ||||||
| Company contributions |
155 | 155 | ||||||
| Expenses and benefits paid from plan assets |
(1,305 | ) | (1,307 | ) | ||||
| Other |
— | — | ||||||
|
|
|
|
|
|||||
| Fair value of plan assets at end of year (1) |
$ | 13,516 | $ | 14,585 | ||||
|
|
|
|
|
|||||
| Funded Status: |
||||||||
| Funded status of plan |
$ | (29,483 | ) | $ | (31,965 | ) | ||
| Unrecognized actuarial loss |
9,196 | 13,233 | ||||||
|
|
|
|
|
|||||
| Net amount recognized |
$ | (20,287 | ) | $ | (18,732 | ) | ||
|
|
|
|
|
|||||
| (1) | In addition to the pension plan assets, ARRIS has established two rabbi trusts to further fund the pension obligations of the Chief Executive and certain executive officers of $18.0 million as of December 31, 2015 and $20.3 million as of December 31, 2014, and are included in Investments on the Consolidated Balance Sheets. |
Amounts recognized in the statement of financial position consist of (in thousands):
| Years Ended December 31, | ||||||||
| 2015 | 2014 | |||||||
| Current liabilities |
$ | (426 | ) | $ | (393 | ) | ||
| Noncurrent liabilities |
(29,057 | ) | (31,572 | ) | ||||
| Accumulated other comprehensive income (1) |
9,196 | 13,233 | ||||||
|
|
|
|
|
|||||
| Total |
$ | (20,287 | ) | $ | (18,732 | ) | ||
|
|
|
|
|
|||||
120
Table of Contents
Index to Financial Statements
| (1) | The accumulated other comprehensive income on the Consolidated Balance Sheets as of December 31, 2015 and 2014 is presented net of income tax. |
Other changes in plan assets and benefit obligations recognized in other comprehensive income (loss) are as follows (in thousands):
| Years Ended December 31, | ||||||||||||
| 2015 | 2014 | 2013 | ||||||||||
| Net (gain) loss |
$ | (3,203 | ) | $ | 5,992 | $ | (2,359 | ) | ||||
| Amortization of net loss |
(834 | ) | (305 | ) | (607 | ) | ||||||
| Settlement charge |
— | — | (318 | ) | ||||||||
|
|
|
|
|
|
|
|||||||
| Total recognized in other comprehensive income (loss) |
$ | (4,037 | ) | $ | 5,687 | $ | 3,284 | |||||
|
|
|
|
|
|
|
|||||||
The following table summarizes the amounts in other comprehensive income (loss) expected to be amortized and recognized as a component of net periodic benefit cost in 2016 (in thousands):
| Amortization of net loss |
$ | 1,711 |
Information for defined benefit plans with accumulated benefit obligations in excess of plan assets is as follows (in thousands):
| December 31, | ||||||||
| 2015 | 2014 | |||||||
| Accumulated benefit obligation |
$ | 42,999 | $ | 46,550 | ||||
| Projected benefit obligation |
$ | 42,999 | $ | 46,550 | ||||
| Plan assets |
$ | 13,516 | $ | 14,585 | ||||
Net periodic pension cost for 2015, 2014 and 2013 for pension and supplemental benefit plans includes the following components (in thousands):
| 2015 | 2014 | 2013 | ||||||||||
| Service cost |
$ | — | $ | — | $ | 122 | ||||||
| Interest cost |
1,716 | 1,783 | 1,619 | |||||||||
| Return on assets (expected) |
(839 | ) | (874 | ) | (876 | ) | ||||||
| Amortization of net actuarial loss (1) |
834 | 305 | 607 | |||||||||
|
|
|
|
|
|
|
|||||||
| Net periodic pension cost |
$ | 1,711 | $ | 1,214 | $ | 1,472 | ||||||
|
|
|
|
|
|
|
|||||||
| (1) | ARRIS uses the allowable 10% corridor approach to determine the amount of gains/losses subject to amortization in pension cost. Gains/losses are amortized on a straight-line basis over the average future service of members expected to receive benefits |
The weighted-average actuarial assumptions used to determine the benefit obligations for the three years presented are set forth below:
| 2015 | 2014 | 2013 | ||||||||||
| Assumed discount rate for plan participants |
4.15 | % | 3.75 | % | 4.50 | % | ||||||
121
Table of Contents
Index to Financial Statements
The weighted-average actuarial assumptions used to determine the net periodic benefit costs are set forth below:
| 2015 | 2014 | 2013 | ||||||||||
| Assumed discount rate for plan participants |
3.75 | % | 4.50 | % | 3.75 | % | ||||||
| Rate of compensation increase |
N/A | N/A | 3.75 | % | ||||||||
| Expected long-term rate of return on plan assets |
6.00 | % | 6.00 | % | 6.00 | % | ||||||
The expected long-term rate of return on assets is derived using the building block approach which includes assumptions for the long term inflation rate, real return, and equity risk premiums.
The Company estimates it will make funding contributions of $728 thousand in 2016.
As of December 31, 2015, the expected benefit payments related to the Company’s U.S. defined benefit pension plans during the next ten years are as follows (in thousands):
| 2016 |
$ | 1,626 | ||
| 2017 |
14,360 | |||
| 2018 |
1,652 | |||
| 2019 |
1,697 | |||
| 2020 |
1,814 | |||
| 2021 — 2025 |
9,993 |
Defined Benefits Plans Outside the U.S.
The Company also provides a non-contributory defined benefit plan which cover employees in Taiwan (“Taiwan Plan”). Any other benefit plans outside of the U.S. are not material to the Company either individually or in the aggregate.
122
Table of Contents
Index to Financial Statements
The funded status of the Taiwan non-contributory defined benefit pension plans is as follows (in thousands):
| Years Ended December 31, | ||||||||
| 2015 | 2014 | |||||||
| Change in Projected Benefit Obligation: |
||||||||
| Projected benefit obligation at beginning of year |
$ | 35,541 | $ | 33,933 | ||||
| Service cost |
738 | 751 | ||||||
| Interest cost |
661 | 599 | ||||||
| Actuarial loss |
708 | 1,101 | ||||||
| Benefit payments |
(1,276 | ) | (843 | ) | ||||
|
|
|
|
|
|||||
| Projected benefit obligation at end of year |
$ | 36,372 | $ | 35,541 | ||||
|
|
|
|
|
|||||
| Change in Plan Assets: |
||||||||
| Fair value of plan assets at beginning of year |
$ | 8,923 | $ | 8,302 | ||||
| Actual return on plan assets |
236 | 190 | ||||||
| Company contributions |
1,273 | 1,274 | ||||||
| Expenses and benefits paid from plan assets |
(1,200 | ) | (843 | ) | ||||
|
|
|
|
|
|||||
| Fair value of plan assets at end of year |
$ | 9,232 | $ | 8,923 | ||||
|
|
|
|
|
|||||
| Funded Status: |
||||||||
| Funded status of plan |
$ | (27,140 | ) | $ | (26,618 | ) | ||
| Unrecognized actuarial (gain) loss |
(4,320 | ) | (4,036 | ) | ||||
|
|
|
|
|
|||||
| Net amount recognized |
$ | (31,460 | ) | $ | (30,654 | ) | ||
|
|
|
|
|
|||||
Amounts recognized in the statement of financial position consist of (in thousands):
| Years Ended December 31, | ||||||||
| 2015 | 2014 | |||||||
| Noncurrent liabilities |
$ | (27,140 | ) | $ | (26,618 | ) | ||
| Accumulated other comprehensive income |
(4,320 | ) | (4,036 | ) | ||||
|
|
|
|
|
|||||
| Total |
$ | (31,460 | ) | $ | (30,654 | ) | ||
|
|
|
|
|
|||||
Other changes in plan assets and benefit obligations recognized in other comprehensive income (loss) are as follows (in thousands):
| Years Ended December 31, | ||||||||||||
| 2015 | 2014 | 2013 | ||||||||||
| Net loss (gain) |
$ | 813 | $ | 1,077 | $ | (3,107 | ) | |||||
| Amortization of net gain (loss) |
(529 | ) | (464 | ) | (808 | ) | ||||||
|
|
|
|
|
|
|
|||||||
| Total recognized in other comprehensive income (loss) |
$ | 284 | $ | 613 | $ | (3,915 | ) | |||||
|
|
|
|
|
|
|
|||||||
123
Table of Contents
Index to Financial Statements
Information for defined benefit plans with accumulated benefit obligations in excess of plan assets is as follows (in thousands):
| December 31, | ||||||||
| 2015 | 2014 | |||||||
| Accumulated benefit obligation |
$ | 26,966 | $ | 25,758 | ||||
| Projected benefit obligation |
$ | 36,372 | $ | 35,541 | ||||
| Plan assets |
$ | 9,232 | $ | 8,923 | ||||
Net periodic pension cost for 2015, 2014 and 2013 for pension and supplemental benefit plans includes the following components (in thousands):
| 2015 | 2014 | 2013 | ||||||||||
| Service cost |
$ | 738 | $ | 751 | $ | 999 | ||||||
| Interest cost |
661 | 599 | 698 | |||||||||
| Return on assets (expected) |
(176 | ) | (166 | ) | (163 | ) | ||||||
| Amortization of net actuarial loss |
529 | 464 | 808 | |||||||||
|
|
|
|
|
|
|
|||||||
| Net periodic pension cost |
$ | 1,752 | $ | 1,648 | $ | 2,342 | ||||||
|
|
|
|
|
|
|
|||||||
As of December 31, 2015, the expected benefit payments related to the Company’s Taiwan defined benefit pension plans during the next ten years are as follows (in thousands):
| 2016 |
$ | 1,746 | ||
| 2017 |
1,794 | |||
| 2018 |
2,528 | |||
| 2019 |
2,112 | |||
| 2020 |
2,445 | |||
| 2021 — 2025 |
13,182 |
Key assumptions used in the valuation of the Taiwan Plan are as follows:
| 2015 | 2014 | 2013 | ||||||||||
| Assumed discount rate for obligations |
1.70 | % | 1.90 | % | 1.80 | % | ||||||
| Assumed discount rate for expense |
1.90 | % | 1.80 | % | 1.80 | % | ||||||
| Rate of compensation increase for indirect labor |
4.00 | % | 4.50 | % | 4.50 | % | ||||||
| Rate of compensation increase for direct labor |
2.00 | % | 2.00 | % | 2.00 | % | ||||||
| Expected long-term rate of return on plan assets (1) |
2.00 | % | 2.00 | % | 2.00 | % | ||||||
| (1) | Asset allocation is 100% in money market investments |
ARRIS estimates it will make funding contributions of $10.4 million in 2016.
Other Benefit Plans
ARRIS has established defined contribution plans pursuant to the Internal Revenue Code Section 401(k) that cover all eligible U.S. employees. ARRIS contributes to these plans based upon the dollar amount of each participant’s contribution. ARRIS made matching contributions to these plans of approximately $16.6 million, $15.3 million and $10.9 million in 2015, 2014 and 2013, respectively.
124
Table of Contents
Index to Financial Statements
The Company has a deferred compensation plan that does not qualify under Section 401(k) of the Internal Revenue Code, and is available to key executives of the Company and certain other employees. Employee compensation deferrals and matching contributions are held in a rabbi trust. The total of net employee deferrals and matching contributions, which is reflected in other long-term liabilities, was $3.6 million and $3.3 million at December 31, 2015 and 2014, respectively. Total expenses included in continuing operations for the matching contributions were approximately $0.1 million in 2015 and 2014.
The Company previously offered a deferred compensation arrangement, which allowed certain employees to defer a portion of their earnings and defer the related income taxes. As of December 31, 2004, the plan was frozen and no further contributions are allowed. The deferred earnings are invested in a rabbi trust. The total of net employee deferral and matching contributions, which is reflected in other long-term liabilities, was $2.8 million and $2.9 million at December 31, 2015 and 2014, respectively.
The Company also has a deferred retirement salary plan, which was limited to certain current or former officers of C-COR. The present value of the estimated future retirement benefit payments is being accrued over the estimated service period from the date of signed agreements with the employees. The accrued balance of this plan, the majority of which is included in other long-term liabilities, were $1.7 million and $1.8 million at December 31, 2015 and 2014, respectively. Total expenses (income) included in continuing operations for the deferred retirement salary plan were approximately $0.3 million and $0.1 million for 2015 and 2014, respectively.
Note 19. Accumulated Other Comprehensive Income (Loss)
The following table summarizes the changes in accumulated other comprehensive income (loss) by component, net of taxes, for the years ended December 31, 2015 and 2014 (in thousands):
| Available-for sale securities |
Derivative instruments |
Change related to pension liability |
Cumulative translation adjustments |
Total | ||||||||||||||||
| Balance as of December 31, 2014 |
$ | 25 | $ | (3,166 | ) | $ | (7,181 | ) | $ | (725 | ) | $ | (11,047 | ) | ||||||
| Other comprehensive (loss) income before reclassifications |
(64 | ) | (8,319 | ) | 2,044 | (1,078 | ) | (7,417 | ) | |||||||||||
| Amounts reclassified from accumulated other comprehensive income (loss) |
172 | 4,704 | 942 | — | 5,818 | |||||||||||||||
|
|
|
|
|
|
|
|
|
|
|
|||||||||||
| Net current-period other comprehensive income (loss) |
108 | (3,615 | ) | 2,986 | (1,078 | ) | (1,599 | ) | ||||||||||||
|
|
|
|
|
|
|
|
|
|
|
|||||||||||
| Balance as of December 31, 2015 |
$ | 133 | $ | (6,781 | ) | $ | (4,195 | ) | $ | (1,803 | ) | $ | (12,646 | ) | ||||||
|
|
|
|
|
|
|
|
|
|
|
|||||||||||
| Available-for sale securities |
Derivative instruments |
Change related to pension liability |
Cumulative translation adjustments |
Total | ||||||||||||||||
| Balance as of December 31, 2013 |
$ | 306 | $ | (2,541 | ) | $ | (2,416 | ) | $ | (11 | ) | $ | (4,662 | ) | ||||||
| Other comprehensive (loss) income before reclassifications |
(127 | ) | (5,391 | ) | (5,273 | ) | (714 | ) | (11,505 | ) | ||||||||||
| Amounts reclassified from accumulated other comprehensive income (loss) |
(154 | ) | 4,766 | 508 | — | 5,120 | ||||||||||||||
|
|
|
|
|
|
|
|
|
|
|
|||||||||||
| Net current-period other comprehensive income (loss) |
(281 | ) | (625 | ) | (4,765 | ) | (714 | ) | (6,385 | ) | ||||||||||
|
|
|
|
|
|
|
|
|
|
|
|||||||||||
| Balance as of December 31, 2014 |
$ | 25 | $ | (3,166 | ) | $ | (7,181 | ) | $ | (725 | ) | $ | (11,047 | ) | ||||||
|
|
|
|
|
|
|
|
|
|
|
|||||||||||
125
Table of Contents
Index to Financial Statements
Note 20. Repurchases of Stock
The Company’s Board of Directors previously authorized share repurchase plans, in May 2011 and October 2012, pursuant to which we could purchase up to an aggregate of $300.0 million of our common stock.
During the first quarter of 2015, ARRIS repurchased 0.9 million shares of the Company’s common stock at an average price of $28.70 per share, for an aggregate consideration of approximately $25.0 million.
Note 21. Commitments and Contingencies
General Matters
ARRIS leases office, distribution, and warehouse facilities as well as equipment under long-term leases expiring at various dates through 2023. Included in these operating leases are certain amounts related to restructuring activities; these lease payments and related sublease income are included in restructuring accruals on the consolidated balance sheets. Future minimum operating lease payments under non-cancelable leases at December 31, 2015 were as follows (in thousands):
| Operating Leases | ||||
| 2016 |
$ | 26,241 | ||
| 2017 |
20,180 | |||
| 2018 |
15,409 | |||
| 2019 |
11,592 | |||
| 2020 |
9,937 | |||
| Thereafter |
35,873 | |||
| Less sublease income |
(1,287 | ) | ||
|
|
|
|||
| Total minimum lease payments |
$ | 117,945 | ||
|
|
|
|||
Total rental expense for all operating leases amounted to approximately $26.9 million, $32.0 million and $22.5 million for the years ended December 31, 2015, 2014 and 2013, respectively.
Additionally, the Company had contractual obligations of approximately $405.8 million under agreements with non-cancelable terms to purchase goods or services over the next year. All contractual obligations outstanding at the end of prior years were satisfied within a 12 month period, and the obligations outstanding as of December 31, 2015 are expected to be satisfied by 2016.
Bank Guarantees
The Company has outstanding bank guarantees, of which certain amounts are collateralized by restricted cash. As of December 31, 2015, the restricted cash associated with the outstanding bank guarantee was $0.8 million which is reflected in Other Assets on the Consolidated Balance Sheets.
Legal Proceedings
The Company accrues a liability for legal contingencies when it believes that it is both probable that a liability has been incurred and that it can reasonably estimate the amount of the loss. The Company reviews these accruals and adjusts them to reflect ongoing negotiations, settlements, rulings, advice of legal counsel and other relevant information. To the extent new information is obtained and the Company’s views on the probable outcomes of claims, suits, assessments, investigations or legal proceedings change, changes in the Company’s accrued liabilities would be recorded in the period in which such determinations are made. Unless noted otherwise, the amount of liability is not probable or the amount cannot be reasonably estimated; and, therefore, accruals have not been made.
126
Table of Contents
Index to Financial Statements
Due to the nature of the Company’s business, it is subject to patent infringement claims, including current suits against it or one or more of its wholly-owned subsidiaries, or one or more of our customers who may seek indemnification from us, alleging infringement by various Company products and services. The Company believes that it has meritorious defenses to the allegation made in its pending cases and intends to vigorously defend these lawsuits; however, it is currently unable to determine the ultimate outcome of these or similar matters. Accordingly, with respect to these proceedings, we are currently unable to reasonably estimate the possible loss or range of possible losses. In addition, the Company is a defendant in various litigation matters generally arising out of the normal course of business.
Note 22. Subsequent Events
Acquisition of Pace
On January 4, 2016, ARRIS completed its acquisition of Pace, a leading technology solutions provider incorporated in England and Wales, for approximately $2,073 million, including $638.8 million in cash and issuance of 47.7 million shares of ARRIS International plc (formerly ARRIS International Limited) (“New ARRIS”) ordinary shares (the “Combination”).
In connection with the Combination, (i) New ARRIS, a company incorporated in England and Wales and wholly-owned subsidiary of ARRIS Group, agreed to acquire all of the outstanding ordinary shares of Pace by means of court-sanctioned scheme of arrangement (the “Scheme”) under English law and (ii) ARRIS entered into a Merger Agreement (the “Merger Agreement”), dated April 22, 2015, among ARRIS, New ARRIS, ARRIS US Holdings, Inc. (formerly Archie U.S. Holdings LLC), a Delaware corporation and wholly-owned subsidiary of New ARRIS (“US Holdco”) and Archie U.S. Merger LLC, a Delaware limited liability company and wholly-owned subsidiary of US Holdco (“Merger Sub”), whereby Merger Sub would be merged with and into ARRIS, with ARRIS surviving as an indirect wholly-owned subsidiary of New ARRIS.
The Combination combines the strengths of both companies on a global scale—broadening ARRIS’s worldwide CPE leadership with a competitive stake in satellite communications; leveraging new synergies in telco TV; expanding its cloud, network, home, and services portfolio; and increasing its collaboration with the world’s leading service providers. In addition to CPE, the Combination further establishes ARRIS as a global leader in HFC/Optics, complementing its established CMTS leadership position.
The following table summarizes the fair value of consideration transferred for Pace (in thousands):
| Cash Consideration (1) |
$ | 638,790 | ||
| Stock Consideration (2) |
1,434,690 | |||
|
|
|
|||
| Total consideration transferred |
$ | 2,073,480 | ||
|
|
|
| (1) | Cash consideration represents the cash payment of 132.5 pence (converted to $1.95 at an exchange rate of 1.4707) for each of Pace’s shares and equity awards outstanding. |
| (2) | Stock consideration represents the conversion of each of Pace’s shares and equity awards outstanding at a conversion rate of 0.1455 with a value of $30.08 at January 4, 2016, which represents the opening price of the Company’s common stock at the date of Combination. |
127
Table of Contents
Index to Financial Statements
The following is a summary of the preliminary estimated fair values of the net assets acquired (in thousands):
| Total estimated consideration transferred |
$ | 2,073,480 | ||
|
|
|
|||
| Cash and cash equivalents |
298,671 | |||
| Accounts and other receivables |
546,159 | |||
| Inventories |
490,925 | |||
| Prepaids |
21,599 | |||
| Property, plant and equipment |
98,371 | |||
| Intangible assets |
1,100,000 | |||
| Noncurrent deferred income tax assets |
27,635 | |||
| Other assets |
6,704 | |||
| Accounts payable and other current liabilities |
(754,838 | ) | ||
| Deferred revenue |
(24,743 | ) | ||
| Short-term borrowings |
(263,795 | ) | ||
| Current income taxes liability |
(7,801 | ) | ||
| Other accrued liabilities |
(129,915 | ) | ||
| Other noncurrent liabilities |
(427,831 | ) | ||
|
|
|
|||
| Net assets acquired |
981,141 | |||
|
|
|
|||
| Goodwill |
$ | 1,092,339 | ||
|
|
|
The Combination will be accounted for using the acquisition method of accounting in accordance with ASC 805, Business Combinations, which requires, among other things, that the assets acquired and liabilities assumed be recognized at their acquisition date fair values, with any excess of the consideration transferred over the estimated fair values of the identifiable net assets acquired recorded as goodwill. The Company is in the process of valuing the net assets acquired based on physical appraisals, discounted cash flows analysis or other appropriate valuation techniques to determine the fair value of the assets acquired and liabilities assumed. The final accounting for the business combination may differ from that disclosed in these consolidated financial statements.
The estimated goodwill of $1,092 million arising from the acquisition is attributable to the workforce of the acquired business, strategic opportunities and synergies that are expected to arise from the acquisition of Pace. The goodwill will be assigned to both of the Company’s reportable segments. The goodwill is not expected to be deductible for income tax purposes.
The Company incurred acquisition related costs of $25.8 million, during the fiscal year ended December 31, 2015. This amount was expensed by the Company as incurred and is included in the Consolidated Statement of Operations in the line item titled “Acquisition costs”.
To fund the Combination, the Company added a new $800 million “Term Loan A-1 Facility” to the existing senior secured credit facilities with Bank of America, N.A. and various other institutions in June 2015, which was funded on January 5, 2016 in conjunction with the Combination. Refer to Note 14 Indebtedness of Notes to the Consolidated Financial Statements for more information.
Share Repurchase Program
In early 2016, the ARRIS International plc’s Board of Directors approved a new $300 million share repurchase authorization replacing all prior programs. Unless terminated earlier by a Board resolution, this new plan will expire when ARRIS has used all authorized funds for repurchase.
128
Table of Contents
Index to Financial Statements
Note 23. Summary Quarterly Consolidated Financial Information (unaudited)
The following table summarizes ARRIS’s quarterly consolidated financial information (in thousands, except per share data):
| Quarters in 2015 Ended | ||||||||||||||||
| March 31, | June 30, | September 30, (1) | December 31, (2) | |||||||||||||
| Net sales |
$ | 1,215,158 | $ | 1,260,077 | $ | 1,221,416 | $ | 1,101,681 | ||||||||
| Gross margin |
336,556 | 364,361 | 359,333 | 358,673 | ||||||||||||
| Operating income |
45,718 | 51,542 | 60,781 | 52,912 | ||||||||||||
| Net income attributable to ARRIS Group, Inc. |
$ | 19,126 | $ | 16,758 | $ | 26,256 | $ | 30,041 | ||||||||
|
|
|
|
|
|
|
|
|
|||||||||
| Net income per basic share |
$ | 0.13 | $ | 0.11 | $ | 0.18 | $ | 0.20 | ||||||||
| Net income per diluted share |
$ | 0.13 | $ | 0.11 | $ | 0.18 | $ | 0.20 | ||||||||
| Quarters in 2014 Ended | ||||||||||||||||
| March 31, (3) | June 30, | September 30, (4) | December 31, (5) | |||||||||||||
| Net sales |
$ | 1,225,017 | $ | 1,429,071 | $ | 1,405,445 | $ | 1,263,388 | ||||||||
| Gross margin |
346,774 | 419,412 | 435,734 | 380,576 | ||||||||||||
| Operating income |
37,986 | 91,676 | 122,109 | 89,563 | ||||||||||||
| Net income attributable to ARRIS Group, Inc. |
$ | 40,800 | $ | 39,024 | $ | 54,626 | $ | 192,761 | ||||||||
|
|
|
|
|
|
|
|
|
|||||||||
| Net income per basic share |
$ | 0.29 | $ | 0.27 | $ | 0.38 | $ | 1.33 | ||||||||
| Net income per diluted share |
$ | 0.28 | $ | 0.26 | $ | 0.37 | $ | 1.29 | ||||||||
Year 2015
| (1) | The Company recorded a tax benefit of $27.3 million primarily from the release of valuation allowances from deferred tax assets recorded for U.S. federal net operating losses arising from the acquisition of the Motorola Home business from Google. The Company also recorded a tax expense of $18.9 million on a gain recognition agreement for its Taiwanese entity, inclusive of a benefit of $18.9 million obtained from foreign tax credits generated by the transaction. |
| (2) | $20.4 million of current tax benefit was recorded when the President signed legislation to approve the extension of the U.S. federal research and development tax credit permanently during Q4 of 2015. |
Year 2014
| (3) | The Company recorded a tax benefit from the release of $18.2 million of valuation allowances from deferred tax assets recorded for U.S. federal net operating losses arising from the acquisition of the Motorola Home business from Google. |
| (4) | The Company identified and corrected an immaterial error in the accounting for income taxes related to the prior year ended December 31, 2013. The correction related to the Company’s subsequent consideration of certain tax consequences related to a legal entity and tax restructuring completed in the fourth quarter of 2013. The impact of adjusting these amounts had a non-cash effect, increasing income tax expense and noncurrent income tax liabilities by $9.8 million. In accordance with ASC Topic 250, Accounting Changes and Error Corrections, the Company evaluated the impact on its financial statements for the year ended December 31, 2013 and concluded that the results of operations for these periods were not materially misstated. |
| (5) | The Company recorded a tax benefit from the release of $134.8 million of valuation allowances from deferred tax assets recorded for U.S. federal net operating losses and U.S. federal tax credits and $9.0 million of valuation allowances from deferred tax assets recorded for state net operating losses and state research and development tax credits arising from the acquisition of the Motorola Home business from Google. In addition, $18.1 million of current tax benefit was recorded when the President signed legislation to approve the extension of the U.S. federal research and development tax credit through December 31, 2014. |
129
Table of Contents
Index to Financial Statements
PART III
Item 10. Directors, Executive Officers, and Corporate Governance
Information relating to directors and officers of ARRIS, the Audit Committee of the board of directors and stockholder nominations for directors is set forth under the captions entitled “Election of Directors,” “Section 16(a) Beneficial Ownership Reporting Compliance,” and “Committees of the Board of Directors and Meeting Attendance” in the Company’s Proxy Statement for the Annual Meeting of Stockholders to be held in 2016 (the “Proxy Statement”) and is incorporated herein by reference. Certain information concerning the executive officers of the Company is set forth in Part I of this document under the caption entitled “Executive Officers of the Company”.
ARRIS’s code of ethics and financial code of ethics (applicable to our CEO, senior financial officers, and all finance, accounting, and legal managers) are available on our website at www.arris.com under Investor Relations, Corporate Governance. The website also will disclose whether there have been any amendments or waivers to the Code of Ethics and Financial Code of Ethics. ARRIS will provide copies of these documents in electronic or paper form upon request to Investor Relations, free of charge.
ARRIS’s board of directors has identified Doreen A. Toben, chairperson of the Audit Committee, as our audit committee financial expert, as defined by the SEC.
Item 11. Executive Compensation
Information regarding compensation of officers and directors of ARRIS is set forth under the captions entitled “Executive Compensation,” “Compensation of Directors,” “Employment Contracts and Termination of Employment and Change-In-Control Arrangements,” “Committees Composition and Meeting Attendance,” and “Compensation Committee Report” in the Proxy Statement and is incorporated herein by reference.
Item 12. Security Ownership of Certain Beneficial Owners, Management and Related Stockholders Matters
EQUITY COMPENSATION PLAN INFORMATION
The following table sets forth information concerning our ordinary shares that may be issued under all equity compensation plans as of December 31, 2015:
| Plan Category |
Number of Securities to be Issued Upon Exercise of Outstanding Options, Warrants and Rights (1) |
Weighted-Average Exercise Price of Outstanding Options, Warrants and Rights |
Number of
Securities Remaining Available for Future Issuance Under Equity Compensation Plans (Excluding Securities Reflected in 1st Column) (2) |
|||||||||
| Equity compensation plans approved by security holders |
7,109,179 | — | 12,768,393 | |||||||||
| Equity compensation plans not approved by security holders |
— | — | — | |||||||||
| Total |
7,109,179 | — | 12,768,393 | |||||||||
| (1) | The total number of securities to be issued upon exercise of outstanding options, warrants and rights consists of, upon vesting, restricted shares of 7,109,179. |
| (2) | Represents securities available for future issuance under current plans. 10,399,122 stock options or 5,561,028 restricted shares are available under for issuance the ARRIS 2011 Stock Incentive Plan, as amended and restated (the “2011 Pan”). The 2011 Plan has been designed to allow for flexibility in the form of awards; awards denominated in shares of common stock other than stock options and stock appreciation |
130
Table of Contents
Index to Financial Statements
| rights will be counted against the plan limit as 1.87 shares for every one share covered by such an award. 2,240,351 shares are available for issuance under the 2001 Employee Stock Purchase Plan, which is in compliance with Section 423 of the U.S. Internal Revenue Code. 125,325 shares are available for issuance under the BigBand Networks, Inc. 2007 Equity Incentive Plan. |
Information regarding ownership of ARRIS ordinary shares is set forth under the captions entitled “Equity Compensation Plan Information,” “Security Ownership of Management and Directors” and “Security Ownership of Principal Shareholders” in the Proxy Statement and is incorporated herein by reference.
Item 13. Certain Relationships, Related Transactions, and Director Independence
Information regarding certain relationships, related transactions with ARRIS, and director independence is set forth under the captions entitled “Compensation of Directors,” “Certain Relationships and Related Party Transactions,” and “An Ordinary Proposal to Elect Directors” in the Proxy Statement and is incorporated herein by reference.
Item 14. Principal Accountant Fees and Services
Information regarding principal accountant fees and services is set forth under the caption “Independent Registered Public Accounting Firm” in the Proxy Statement and is incorporated herein by reference.
131
Table of Contents
Index to Financial Statements
PART IV
Item 15. Exhibits and Financial Statement Schedules
(a) (1) Financial Statements
The following Consolidated Financial Statements of ARRIS International plc and Report of Ernst & Young LLP, Independent Registered Public Accounting Firm are filed as part of this Report.
(a) (2) Financial Statements Schedules
All schedules are omitted because they are not applicable or not required because this information is provided in the financial statements
(a) (3) Exhibit List
Each management contract or compensation plan required to be filed as an exhibit is identified by an asterisk (*).
| Exhibit Number |
Description of Exhibit |
The filings referenced for incorporation by reference are ARRIS Group, Inc. (as precessor registrant; file no. 000-31254) filings unless otherwise noted | ||
| 3.1 | Article of Association of ARRIS International plc | Filed herewith | ||
| 4.1 | Form of Certificate for Ordinary Shares | Filed herewith | ||
| 4.2 | Registration Rights Agreement with General Instrument Holdings, Inc. | April 18, 2013, Form 8-K, Exhibit 4.1 | ||
| 10.1(a)* | Amended and Restated Employment Agreement with Robert J. Stanzione, dated August 6, 2001 | September 30, 2001 Form 10-Q, Exhibit 10.10(c) | ||
| 10.1(b)* | Supplemental Executive Retirement Plan for Robert J. Stanzione, effective August 6, 2001 | September 30, 2001 Form 10-Q, Exhibit 10.10(d) | ||
| 10.1(c)* | Amendment to Employment Agreement with Robert J. Stanzione, dated December 8, 2006 | December 12, 2006 Form 8-K, Exhibit 10.7 | ||
| 10.1(d)* | Second Amendment to Amended and Restated Employment Agreement with Robert J. Stanzione, dated November 26, 2008 | November 28, 2008 Form 8-K, Exhibit 10.8 | ||
| 10.1(e)* | First Amendment to the Robert Stanzione Supplemental Executive Retirement Plan, dated November 26, 2008 | November 28, 2008 Form 8-K, Exhibit 10.9 | ||
| 10.2(a)* | Amended and Restated Employment Agreement with Lawrence A. Margolis, dated April 29, 1999 | June 30, 1999 Form 10-Q, Exhibit 10.33, filed by ANTEC Corp | ||
| 10.2(b)* | Amendment to Employment Agreement with Lawrence Margolis, dated December 8, 2006 | December 12, 2006 Form 8-K, Exhibit 10.6 | ||
132
Table of Contents
Index to Financial Statements
| Exhibit Number |
Description of Exhibit |
The filings referenced for incorporation by reference are ARRIS Group, Inc. (as precessor registrant; file no. 000-31254) filings unless otherwise noted | ||
| 10.2(c)* | Second Amendment to Amended and Restated Employment Agreement with Lawrence Margolis, dated November 26, 2008 | November 28, 2008 Form 8-K, Exhibit 10.7 | ||
| 10.2(d)* | Third Amendment to Amended and Restated Employment Agreement with Lawrence Margolis, dated October 31, 2012…. | September 30, 2012 Form 10-Q, Exhibit 10.1 | ||
| 10.3(a)* | Employment Agreement with David B. Potts dated December 8, 2006 | December 12, 2006 Form 8-K, Exhibit 10.4 | ||
| 10.3(b)* | First Amendment to Employment Agreement with David B. Potts, dated November 26, 2008 | November 28, 2008 Form 8-K, Exhibit 10.6 | ||
| 10.4(a)* | Employment Agreement with Ronald M. Coppock, dated December 8, 2006 | December 12, 2006 Form 8-K, Exhibit 10.1 | ||
| 10.4(b)* | First Amendment to Employment Agreement with Ronald M. Coppock, dated November 26, 2008 | November 28, 2008 Form 8-K, Exhibit 10.3 | ||
| 10.5* | Employment Agreement with Bruce McClelland, dated November 26, 2008 | November 28, 2008 Form 8-K, Exhibit 10.2 | ||
| 10.6* | Deed Poll of Indemnity with Directors | January 4, 2016 Form 8-K of ARRIS International plc, Exhibit 10.1 | ||
| 10.7* | Form of Employment Agreement Waiver entered into with each Executive Officer as of January 3, 2014 (Pace Combination) | January 4, 2016 Form 8-K of ARRIS International plc, Exhibit 10.13 | ||
| 10.8* | Form of Opt Plan Waiver | January 4, 2016 Form 8-K of ARRIS International plc, Exhibit | ||
| 10.9* | ARRIS International plc Amended and Restated Employee Stock Purchase Plan | January 4, 2016 Form 8-K of ARRIS International plc, Exhibit 10.2 | ||
| 10.10* | ARRIS International plc 2011 Stock Incentive Plan | January 4, 2016 Form 8-K of ARRIS International | ||
| 10.11* | Broadband Parent Corporation 2001 Stock Incentive Plan | January 4, 2016 Form 8-K of ARRIS International plc, Exhibit 10.4 | ||
| 10.12* | ARRIS Group, Inc. 2004 Stock Incentive Plan | January 4, 2016 Form 8-K of ARRIS International plc, Exhibit 10.5 | ||
| 10.13* | ARRIS Group, Inc. 2007 Stock Incentive Plan | January 4, 2016 Form 8-K of ARRIS International plc, Exhibit 10.6 | ||
| 10.14* | ARRIS Group, Inc. 2008 Stock Incentive Plan | January 4, 2016 Form 8-K of ARRIS International plc, Exhibit 10.7 | ||
| 10.15* | BigBand Networks, Inc. 2007 Equity Incentive Plan | January 4, 2016 Form 8-K of ARRIS International plc, Exhibit 10.8 | ||
| 10.16* | Pace Sharesave Plan | January 4, 2016 Form 8-K of ARRIS International plc, Exhibit 10.9 | ||
133
Table of Contents
Index to Financial Statements
| Exhibit Number |
Description of Exhibit |
The filings referenced for incorporation by reference are ARRIS Group, Inc. (as precessor registrant; file no. 000-31254) filings unless otherwise noted | ||
| 10.17* | Assumption Agreement for benefit plans (Pace Combination) | January 4, 2016 Form 8-K of ARRIS International plc, Exhibit 10.10 | ||
| 10.18* | Form of Deed of Grant for Pace Sharesave Plan | January 4, 2016 Form 8-K of ARRIS International plc, Exhibit 10.11 | ||
| 10.19* | Form of Stock Options Grant under 2001 and 2004 Stock Incentive Plans | March 31, 2005 Form 10-Q, Exhibit 10.20 | ||
| 10.20* | Form of Restricted Stock Grant under 2001 and 2004 Stock Incentive Plans | March 31, 2005 Form 10-Q, Exhibit 10.21 | ||
| 10.21* | Form of Incentive Stock Option Agreement | September 30, 2007, Form 10-Q Exhibit 10.1 | ||
| 10.22* | Form of Nonqualified Stock Option Agreement | September 30, 2007, Form 10-Q Exhibit 10.2 | ||
| 10.23* | Form of Restricted Stock Award Agreement | September 30, 2007, Form 10-Q Exhibit 10.3 | ||
| 10.24* | Form of Nonqualified Stock Options Agreement | April 11, 2008, Form 8-K Exhibit 10.1 | ||
| 10.25* | Form of Restricted Stock Grant | April 11, 2008, Form 8-K Exhibit 10.2 | ||
| 10.26* | Form of Restricted Stock Unit Grant | April 11, 2008, Form 8-K Exhibit 10.3 | ||
| 10.27* | Form of Restricted Stock Agreement | March 31, 2009, Form 10-Q, Exhibit 10.24 | ||
| 10.28* | Form of Restricted Stock Unit | March 31, 2009, Form 10-Q, Exhibit 10.24 | ||
| 10.29* | Assumption Agreement for Benefit Plans (Motorola Home acquisition) | April 16, 2013, Form 8-K, Exhibit 10.1 | ||
| 10.30* | Form of Restricted Stock Grant Award Agreement under 2011 Stock Incentive Plan | April 16, 2013, Form 8-K, Exhibit 10.3 | ||
| 10.31* | Form of Change of Control Waiver (Motorola Home acquisition) | April 16, 2013, Form 8-K, Exhibit 10.4 | ||
| 10.32 | Amended and Restated 2013 Credit Agreement | June 19, 2015, Form 8-K, Exhibit 10.1 | ||
| 21 | Subsidiaries of the Registrant | Filed herewith. | ||
| 23 | Consent of Independent Registered Public Accounting Firm | Filed herewith. | ||
| 24 | Powers of Attorney | Filed herewith. | ||
| 31.1 | Section 302 Certification of the Chief Executive Officer | Filed herewith. | ||
134
Table of Contents
Index to Financial Statements
| Exhibit Number |
Description of Exhibit |
The filings referenced for incorporation by reference are ARRIS Group, Inc. (as precessor registrant; file no. 000-31254) filings unless otherwise noted | ||
| 31.2 | Section 302 Certification of the Chief Financial Officer | Filed herewith. | ||
| 32.1 | Section 906 Certification of the Chief Executive Officer | Filed herewith. | ||
| 32.2 | Section 906 Certification of the Chief Financial Officer | Filed herewith. | ||
| 101.INS | XBRL Instant Document | Filed herewith | ||
| 101.SCH | XBRL Taxonomy Extension Schema Document | Filed herewith | ||
| 101.CAL | XBRL Taxonomy Extension Calculation Linkbase Document | Filed herewith | ||
| 101.DEF | XBRL Taxonomy Extension Definition Linkbase Document | Filed herewith | ||
| 101.LAB | XBRL Taxonomy Extension Labels Linkbase Document | Filed herewith | ||
| 101. PRE | XBRL Taxonomy Extension Presentation Linkbase Document | Filed herewith | ||
135
Table of Contents
Index to Financial Statements
Pursuant to the requirements of Section 13 or 15(d) of the Securities Exchange Act of 1934, the Registrant has duly caused this report to be signed on its behalf by the undersigned, thereunto duly authorized.
| ARRIS INTERNATIONAL PLC |
| /s/ DAVID B. POTTS |
| David B. Potts Executive Vice President, Chief Financial Officer and Chief Accounting Officer |
Dated: February 29, 2016
Pursuant to the requirements of the Securities Exchange Act of 1934, this report has been signed below by the following persons on behalf of the Registrant and in the capacities and on the dates indicated.
| /s/ R J STANZIONE Robert J. Stanzione |
Chief Executive Officer and Chairman of the Board of Directors | February 29, 2016 | ||
| /s/ DAVID B. POTTS David B. Potts |
Executive Vice President, Chief Financial Officer and Chief Accounting Officer | February 29, 2016 | ||
| /s/ ALEX B. BEST* Alex B. Best |
Director | February 29, 2016 | ||
| /s/ HARRY L. BOSCO* Harry L. Bosco |
Director | February 29, 2016 | ||
| /s/ J. TIMOTHY BRYAN J. Timothy Bryan |
Director | February 29, 2016 | ||
| /s/ JAMES A. CHIDDIX* James A. Chiddix |
Director | February 29, 2016 | ||
| /s/ ANDREW T. HELLER* Andrew T. Heller |
Director | February 29, 2016 | ||
| /s/ JEONG H. KIM* Jeong H. Kim |
Director | February 29, 2016 | ||
| /s/ DOREEN A. TOBEN* Doreen A. Toben |
Director | February 29, 2016 | ||
| /s/ DEBORA J. WILSON* Debora J. Wilson |
Director | February 29, 2016 | ||
| /s/ DAVID A. WOODLE* David A. Woodle |
Director | February 29, 2016 | ||
| *By: /s/ PATRICK W. MACKEN |
||||
| Patrick W. Macken |
||||
| (as attorney in fact for each | ||||
| person indicated) | ||||
136