Attached files
| file | filename |
|---|---|
| EX-31.1 - EX-31.1 - JARDEN CORP | d12340dex311.htm |
| EX-12.1 - EX-12.1 - JARDEN CORP | d12340dex121.htm |
| EX-23.1 - EX-23.1 - JARDEN CORP | d12340dex231.htm |
| EX-32.1 - EX-32.1 - JARDEN CORP | d12340dex321.htm |
| EX-21.1 - EX-21.1 - JARDEN CORP | d12340dex211.htm |
| EX-31.2 - EX-31.2 - JARDEN CORP | d12340dex312.htm |
Table of Contents
UNITED STATES
SECURITIES AND EXCHANGE COMMISSION
Washington, D. C. 20549
FORM 10-K
(Mark one)
| x | ANNUAL REPORT PURSUANT TO SECTION 13 or 15(d) OF THE SECURITIES EXCHANGE ACT OF 1934 |
For the fiscal year ended December 31, 2015
| ¨ | TRANSITION REPORT PURSUANT TO SECTION 13 or 15(d) OF THE SECURITIES EXCHANGE ACT OF 1934 |
For the transition period from to
Commission File Number: 001-13665
Jarden Corporation
(Exact name of registrant as specified in its charter)
| Delaware | 35-1828377 | |
| (State or other jurisdiction of incorporation or organization) | (I.R.S. Employer Identification No.) | |
| 1800 North Military Trail, Boca Raton, FL | 33431 | |
| (Address of principal executive offices) | (Zip code) | |
(561) 447-2520
(Registrant’s telephone number, including area code)
Securities registered pursuant to Section 12(b) of the Act:
| Title of each class | Name of each exchange on which registered | |||
| Common Stock, $0.01 par value | New York Stock Exchange |
Securities registered pursuant to Section 12(g) of the Act: None
Indicate by check mark if the registrant is a well-known seasoned issuer, as defined in Rule 405 of the Securities Act. Yes x No ¨
Indicate by check mark if the registrant is not required to file reports pursuant to Section 13 or Section 15(d) of the Act. Yes ¨ No x
Indicate by check mark whether the registrant (1) has filed all reports required to be filed by Section 13 or 15(d) of the Securities Exchange Act of 1934 during the preceding 12 months (or for such shorter period that the registrant was required to file such reports), and (2) has been subject to such filing requirements for the past 90 days. Yes x No ¨
Indicate by check mark whether the registrant has submitted electronically and posted on its corporate Web site, if any, every Interactive Data File required to be submitted and posted pursuant to Rule 405 of Regulation S-T (§232.405 of this chapter) during the preceding 12 months (or for such shorter period that the registrant was required to submit and post such files). Yes x No ¨
Indicate by check mark if disclosure of delinquent filers pursuant to Item 405 of Regulation S-K (§229.405 of this chapter) is not contained herein, and will not be contained, to the best of registrant’s knowledge, in definitive proxy or information statements incorporated by reference in Part III of this Form 10-K or any amendment to this Form 10-K. ¨
Indicate by check mark whether the registrant is a large accelerated filer, an accelerated filer, a non-accelerated filer or a smaller reporting company. See the definitions of “large accelerated filer,” “accelerated filer” and “smaller reporting company” in Rule 12b-2 of the Exchange Act.
| Large accelerated filer | x | Accelerated filer | ¨ | |||
| Non-accelerated filer | ¨ (Do not check if a smaller reporting company) | Smaller reporting company | ¨ | |||
Indicate by check mark whether the registrant is a shell company (as defined in Rule 12b-2 of the Exchange Act). Yes ¨ No x
As of June 30, 2015, the last business day of the registrant’s most recently completed second fiscal quarter, the aggregate market value of the registrant’s common stock held by non-affiliates of the registrant was approximately $9.4 billion based upon the closing market price on such date as reported on the New York Stock Exchange.
All (i) executive officers and directors of the registrant and (ii) all persons filing a Schedule 13D with the Securities and Exchange Commission in respect to registrant’s common stock who hold 10% or more of the registrant’s outstanding common stock, have been deemed, solely for the purpose of the foregoing calculation, to be “affiliates” of the registrant.
There were approximately 219,906,000 shares outstanding of the registrant’s common stock, par value $0.01 per share, as of February 16, 2016.
DOCUMENTS INCORPORATED BY REFERENCE
Certain information required for Part III of this report will be set forth in and, incorporated herein by reference to the Company’s definitive Proxy Statement for the 2016 Annual Meeting of Stockholders, which is anticipated to be filed with the Securities and Exchange Commission pursuant to Regulation 14A not later than 120 days following the end of the Company’s fiscal year ended December 31, 2015.
Table of Contents
JARDEN CORPORATION
TABLE OF CONTENTS TO FORM 10-K
Table of Contents
PART I
| Item | 1. Business |
Overview
Jarden Corporation (which may be referred to hereafter as “Jarden,” the “Company,” “we,” “us” or “our”) is a global consumer products company that enjoys leading positions in a broad range of primarily niche markets for branded consumer products. We seek to grow our business by continuing our tradition of product innovation, new product introductions and providing the consumer with the experience and value they associate with our strong brand portfolio.
Our unique operating culture has evolved into operating processes and a simple business philosophy which we call “Jarden’s DNA.” This philosophy is based largely on common sense and is the embodiment of our culture, of who we are, how we operate and how we act as a company and as individuals. The core elements of Jarden’s DNA are:
| • | Strive to be better. |
| • | Retain and develop the best talent. |
| • | Support the individual, but encourage teamwork. |
| • | Think lean, act large. |
| • | Listen, learn and innovate. |
| • | Deliver exceptional financial results. |
| • | Have fun, work hard, execute. |
| • | Enhance the communities in which we operate. |
We are a leading provider of a diverse range of consumer products with a portfolio of over 120 trusted, quality brands sold globally. We operate in three primary business segments through a number of well recognized brands, including: Branded Consumables: Ball®, Bee®, Bernardin®, Bicycle®, Billy Boy®, Crawford®, Diamond®, Envirocooler®, Fiona®, First Alert®, First Essentials®, Hoyle®, Kerr®, Lehigh®, Lifoam®, Lillo®, Loew-Cornell®, Mapa®, NUK®, Pine Mountain®, ProPak®, Quickie®, Spontex®, Tigex®, Waddington,Yankee Candle® and YOU®; Consumer Solutions: Bionaire®, Crock-Pot®, FoodSaver®, Health o meter®, Holmes®, Mr. Coffee®, Oster®, Patton®, Rival®, Seal-a-Meal®, Sunbeam®, VillaWare® and White Mountain®; and Outdoor Solutions: Abu Garcia®, AeroBed®, Berkley®, Campingaz®, Coleman®, Dalbello®, ExOfficio®, Fenwick®, Greys®, Gulp!®, Hardy®, Invicta®, K2®, Jostens®, Marker®, Marmot®, Mitchell®, Neff®, PENN®, Rawlings®, Ride®, Sevylor®, Shakespeare®, Squadra®, Stearns®, Stren®, Trilene®, Völkl®, Worth® and Zoot®. Our growth strategy is based on introducing new products, as well as on expanding existing product categories, which is supplemented through opportunistically acquiring businesses that reflect our core strategy, often with highly-recognized brands within the categories they serve, innovative products and multi-channel distribution.
We have achieved leading market positions in a number of niche categories by selling branded products through a variety of distribution channels, including club, department store, drug, grocery, mass merchant, sporting goods and specialty retailers, as well as direct to consumers. By leveraging our strong brand portfolio, category management expertise and customer service focus, we have established and continue to maintain long-term relationships with leading retailers within these channels and are currently the category manager at certain of these retailers in certain product categories. Moreover, several of our leading brands, such as Ball®, Bee®, Bicycle®, Coleman®, Diamond®, Jostens®, Hodgman®, Madshus®, Pflueger®, Rawlings®, Shakespeare®, Sunbeam®, Tubbs®, Völkl® and Worth® have been in continuous use for over 100 years. We continue to strive to expand our existing customer relationships and attract new customers by introducing new product line extensions and entering new product categories.
1
Table of Contents
Acquisitions
2015 Activity
On November 2, 2015, the Company acquired Visant Holding Corp., the parent company of Jostens, Inc. and other entities composing the Jostens business (“Jostens”), which is a market-leading, iconic brand and trusted partner to schools and students nationwide that provides a product portfolio of high quality yearbooks, class and championship rings, caps and gowns, diplomas and varsity jackets and accessories, among others (the “Jostens Acquisition”). The total value of the transaction, including debt repaid, was approximately $1.5 billion, subject to certain adjustments. The Jostens Acquisition is expected to expand the Company’s product offerings and brings customizable production capabilities in printing, jewelry and apparel. Jostens is reported in the Company’s Outdoor Solutions segment and is included in the Company’s results of operations from the date of acquisition.
On July 31, 2015, the Company acquired Waddington Group, Inc. (“Waddington”), a leading manufacturer and marketer of premium disposable tableware for commercial, foodservice and retail markets (the “Waddington Acquisition”). The total value of the transaction, including debt repaid, was approximately $1.35 billion, subject to certain adjustments. The Waddington Acquisition is expected to expand the Company’s product offerings and distribution channels, particularly in the business-to-business category, as well as create cross-selling opportunities. Waddington is reported in the Company’s Branded Consumables segment and is included in the Company’s results of operations from the date of acquisition.
During the 2015, the Company also completed two tuck-in acquisitions that by nature were complementary to the Company’s core businesses and from an accounting standpoint were not significant.
2014 Activity
On August 29, 2014, the Company completed the acquisition of Rexair Holdings, Inc. (“Rexair”), a global provider of premium vacuum cleaning systems sold primarily under the Rainbow® brand name. The total value of the transaction, including debt repaid, was approximately $349 million. Rexair is reported in the Company’s Consumer Solutions segment and is included in the Company’s results of operations from the date of acquisition.
During 2014, the Company completed two other tuck-in acquisitions that by nature were complementary to the Company’s core businesses and from an accounting standpoint were not significant.
2013 Activity
On October 3, 2013, the Company acquired Yankee Candle Investments LLC (“Yankee Candle”), a leading specialty-branded premium scented candle company (the “YCC Acquisition”). The total value of the YCC Acquisition, including debt repaid, was approximately $1.8 billion. Yankee Candle is reported in the Company’s Branded Consumables segment and was included in the Company’s results of operations from the date of acquisition.
During 2013, the Company completed one other tuck-in acquisition that by nature was complementary to the Company’s core businesses and from an accounting standpoint was not significant.
Pending Merger
On December 14, 2015, the Company and Newell Rubbermaid Inc. (“Newell Rubbermaid”) announced that they had entered into an Agreement and Plan of Merger (the “Merger Agreement”). Newell Rubbermaid is a global marketer of consumer and commercial products. Under the Merger Agreement each common share of the Company will be exchanged for 0.862 of a share of common stock of Newell Rubbermaid and $21 dollars in cash. The transaction is expected to close in the second quarter of 2016. Under certain terms specified in the Merger Agreement, the Company or Newell Rubbermaid may terminate the Merger Agreement and, as a result,
2
Table of Contents
either party may be required to pay a termination fee of varying amounts. In the event all other closing conditions are satisfied but Newell Rubbermaid is unable to obtain its committed financing or alternative investment grade financing, then, in certain circumstances, either party may terminate the Merger Agreement, and in connection with such termination, Newell Rubbermaid will be required to pay Jarden a cash termination fee equal to $900 million. If the Merger Agreement is terminated due to Jarden or Newell entering into a definitive agreement for a superior proposal, Jarden or Newell, as applicable, will be required to pay the other a cash termination fee equal to $385 million. If the Merger Agreement is terminated due to (i) a failure to obtain the necessary Jarden stockholder approval, but Newell stockholders have approved the issuance of the stock consideration, then Jarden will reimburse Newell for up to $100 million of Newel Rubbermaid fees and expenses or (ii) a failure to obtain the necessary Newell stockholder approval, but Jarden stockholders have approved the adoption of the Merger Agreement, then Newell will reimburse Jarden for up to $100 million of Jarden fees and expenses. Upon consummation, the Company’s outstanding common stock will cease to trade. Unless otherwise indicated, the consolidated financial statements and related notes pertain to the Company as a stand-alone entity and do not reflect the impact of the pending merger with Newell Rubbermaid.
Business Segments
We operate three primary business segments: Branded Consumables; Consumer Solutions; and Outdoor Solutions.
Branded Consumables
The Branded Consumables segment manufactures or sources, markets and distributes a broad line of branded consumer products, many of which are affordable, consumable and fundamental household staples, including arts and crafts paint brushes, air fresheners, brooms, brushes, buckets, children’s card games, clothespins, collectible tins, condoms, cord, rope and twine, premium disposable tableware, dusters, dust pans, feeding bottles, fencing, fire extinguishing products, firelogs and firestarters, foam coolers, foodservice disposable packaging and systems, fresh preserving jars and accessories, home decor accessories, home fragrance products, kitchen matches, mops, other craft items, pacifiers, plastic cutlery, playing cards and accessories, rubber gloves and related cleaning products, safes, premium scented candles and accessories, security cameras, security doors, smoke and carbon monoxide alarms, soothers, sponges, storage organizers and workshop accessories, teats, toothpicks, travel sprays, window guards and other accessories. This segment markets our products under brand names such as Aviator®, Ball®, Bee®, Bernardin®, Bicycle®, Billy Boy®, BRK®, Caterline®, Classicware®, Crawford®, Diamond®, Eco Products®, Envirocooler®, Fiona®, First Alert®, First Essentials®, Hoyle®, Java-Log®, KEM®, Kerr®, Lehigh®, Lifoam® Lillo®, Loew-Cornell®, Mapa®, Millefiori ®, Masterpiece®, Milan®, NUK®, Pine Mountain®, ProPak®, Quickie Green Cleaning®, Quickie Home-Pro®, Quickie Microban®, Quickie Original®, Quickie Professional®, Reflections®, Spontex®, Tigex®, Waddington, Wellington®, Yankee Candle® and YOU®, among others.
We sell a variety of branded consumables products including:
| Principal Brands |
Principal Products | |
| Ball®, Bernardin® and Kerr® | Fresh preserving jars and accessories | |
| BRK®, First Alert®, Onelink®, Protector® and Tundra® | Home safety products | |
| Fiona®, First Essentials®, Lillo®, NUK® and Tigex® | Baby care products | |
| Diamond®, Mapa®, Quickie Green Cleaning®, Quickie Home-Pro®, Quickie Microban®, Quickie Original®, Quickie Professional®, Spontex®, Virulana® and YOU® | Home care products | |
| CaterLine®, Classicware®, Eco Products®, Masterpiece®, Milan® and Reflections® | Premium disposable tableware | |
3
Table of Contents
| Principal Brands |
Principal Products | |
| American Home™, Home Classics®, Housewarmer®, Millefiori®, Mystic Harbor®, Pure Radiance™, ScentBeads®, SoHo Living® and Yankee Candle® | Candle products, home fragrance products, auto air fresheners and home decor accessories | |
| Billy Boy®, Blausiegel®, Fromms® and Mucambo® | Health care products | |
| Aviator®, Bee®, Bicycle®, Hoyle® and KEM® | Playing cards and card accessories | |
| Lehigh®, SecureLine® and Wellington® | Cord, rope and twine | |
| Envirocooler®, Lifoam® and ProPak® | Foam coolers, reusable ice, protective packaging and other recreational products | |
| Loew-Cornell® and Woodsies® | Arts and crafts products | |
| Java-Log®, Northland®, Pine Mountain®, Starterlogg® and Superlog® | Firelogs and firestarters | |
| Crawford® and Storehorse® | Storage organizers and workshop accessories | |
Sales and Marketing
For our Branded Consumables sales efforts, we utilize internal sales, marketing and customer service staff, supported by a network of outside sales representatives and agents. Regional sales managers are organized by geographic area and, in some cases, customers, and are responsible for customer relations management, pricing and distribution strategies, and sales generation. Our customer-specific organized sales staff includes individuals focused on key customers and also key customer groups such as casinos, electrical distributors and personal protective equipment distributors. In addition, we market our Yankee Candle® premium scented candles and home fragrance products through a network of company-operated retail stores, primarily located in the United States and Canada. Our marketing and sales departments work closely together to develop pricing and distribution strategies and to design packaging and develop product line extensions and new products.
Distribution and Fulfillment
We distribute our Branded Consumables products through a number of company-owned distribution centers and third-party warehouses throughout Europe, North and South America and the Pacific Rim. Whenever possible, we utilize highly automated packaging equipment, allowing us to maintain our efficient and effective logistics and freight management processes. We also work with outsourced providers for the delivery of our products in order to ensure that as many shipments as possible are processed as full truckloads, saving significant freight costs. Additionally, we sell our premium scented candles and accessories through our network of approximately 595 company-operated retail stores, direct to consumer catalog and web-based sales, our fundraising catalog business, as well as a national and international wholesale network.
Manufacturing
We manufacture products such as our candles, firelogs and firestarters, foam coolers, kitchen matches and metal closures for our fresh preserving jars in our domestic facilities. We also manufacture playing cards and certain baby care products, home care products, health care products and home safety products at facilities around the world, including facilities located in Asia, Europe, Latin America, North America and South America. Our efficient and automated plastic cutlery manufacturing and firelog and firestarter operations enable us to produce, count and package plastic cutlery and produce and package firelogs and firestarters ready for retail distribution with minimal labor costs. Our foodservice disposables operations include production facilities strategically located across North America and in the United Kingdom, providing a broad array of products to
4
Table of Contents
our end user and distribution customers alike. High-speed, short-run customization capabilities set us apart allowing us to provide personalized items for small intimate settings up to large scale events. Our candle manufacturing processes are designed to ensure the highest quality of candle fragrance, wick quality and placement, color, fill level, shelf life and burn rate, and we continuously engage in efforts to further improve our quality and lower our costs by using efficient production and distribution methods and technological advancements.
Raw Materials and Sourcing of Product
Much of our glass fresh preserving jars and raw paper stock for playing cards are supplied under multi-year supply agreements with primary vendors which assist us in achieving attractive pricing taking into consideration our volumes. Such materials are also available from other sources at competitive prices. Other raw materials used in manufacturing, including expanded polystyrene, extinguisher powder, metal, nylon, paper, plastic resin, sawdust, tin plate, wax and wood are supplied by multiple vendors and are currently available from a variety of sources at competitive prices. Our plastic cutlery is sourced from both our Process Solutions segment and China. Our foodservice disposables business sources raw materials under a combination of multi-year supply agreements and spot buying arrangements with multiple vendors allowing us to achieve attractive pricing and leverage our total volume. Polystyrene, polypropylene and polyethylene terephthalate, in a variety of grades, are the primary inputs along with a range of bio-degradable and compostable materials sourced primarily from China and North America. The natural rubber for gloves, wood pulp for sponges and latex, polypropylene and silicone for baby products are raw materials that are available from multiple sources. Additionally, we maintain strong relationships with our principal fragrance and wax suppliers and we have developed, jointly with our suppliers, proprietary fragrances which are exclusive to the Company. Most raw materials used in the premium scented candle and manufacturing process, including glassware, wick and packaging materials, are readily available from alternative sources at comparable prices.
Our China office is responsible for sourcing finished products from Asia in order to grow and diversify our product portfolio. Quality testing for these products is performed both by our China office and by our North American quality laboratories.
Historically, the raw materials and components that are necessary for the manufacture of our Branded Consumables products have been available in the quantities that we require.
Intellectual Property
The principal trademarks in our Branded Consumables segment consist of Ball®, Diamond®, First Alert®, Lehigh®, Mapa®, NUK®, Pine Mountain®, Quickie®, Spontex® and Yankee Candle®. We believe our principal trademarks have high levels of brand-name recognition among retailers and consumers. In addition, we believe our brands have an established reputation for quality, reliability and value. We monitor and protect our brands against infringement, and we actively pursue the licensing of our trademarks to third parties for products that complement our product lines or businesses. We also hold numerous design and utility patents covering a wide variety of products, the loss of any one of which would likely not have a material adverse effect on our business taken as a whole.
We have the right to use the Ball® and Kerr® trademarks on certain products pursuant to perpetual royalty-free licenses. We also have licensing agreements for brands such as Coca-Cola®, Realtree® and World Series of Poker® to manufacture and distribute playing cards under those brand names, as well as licensing agreements with Gerber® to manufacture and distribute various baby care products and with the Collegiate Licensing Company to manufacture and distribute premium scented candle products, foodservice disposables and auto air freshener products.
5
Table of Contents
Seasonality
Sales of our fresh preserving products generally reflect the pattern of the growing season, and retail sales of our plastic cutlery are concentrated in the summer months and holiday periods. Sales of our home improvement products and foam coolers are concentrated in the spring and summer months. Sales of our firelog and firestarter products are concentrated in the fall and winter months. Sales of all these products may be negatively affected by unfavorable weather conditions and other market trends. Periods of drought, for example, may adversely affect the supply and price of fruit, vegetables and other foods available for fresh preserving. Warm weather in the fall and winter may adversely affect our firelog and firestarter sales. Sales of our products under the Yankee Candle® brand are generally strongest in the fourth quarter preceding the holiday season and may be negatively affected by unfavorable retail conditions and other market trends. Sales of our arts and crafts products, premium disposable tableware, home care and baby care products, home safety products and playing cards are generally not seasonally concentrated.
Consumer Solutions
The Consumer Solutions segment manufactures or sources, markets, and distributes a diverse line of household products, including kitchen appliances and home environment products. This segment maintains a strong portfolio of globally-recognized brands including Bionaire®, Cadence®, Crock-Pot®, FoodSaver®, Health o meter®, Holmes®, Mr. Coffee®, Oster®, Patton®, Rainbow®, Rival®, Seal-a-Meal® and Sunbeam®. The principal products in this segment include: household kitchen appliances, such as blenders, coffeemakers, irons, mixers, slow cookers, tea kettles, toasters, toaster ovens and vacuum packaging machines; home environmental products, such as air purifiers, fans, heaters, humidifiers and vacuum cleaning systems; clippers, trimmers and other hair care products for professional use in the beauty and barber and animal categories; electric blankets, heating pads, mattress pads and throws; products for the hospitality industry; and scales for consumer use. The Consumer Solutions segment also has rights to sell various small appliance products, in substantially all of Europe under the Breville® brand name.
We believe that our Consumer Solutions sales are well-diversified with respect to both geography and distribution channels. We sell a variety of branded household products including:
| Principal Brands |
Principal Products | |
| FoodSaver® and Seal-a-Meal® |
Home vacuum packaging | |
| Health o meter® |
Scales | |
| Mr. Coffee® |
Coffeemakers and other beverage products | |
| Breville®, Cadence®, Oster®, Rival® and Sunbeam® |
Small appliances and personal care products | |
| Crock-Pot® and White Mountain® |
Specialty kitchen products | |
| Bionaire®, Holmes®, Patton® and Sunbeam® |
Home environment products | |
| Rainbow® |
Vacuum cleaning systems | |
Sales and Marketing
Our Consumer Solutions segment has an internal sales force and marketing department that focus their efforts in those markets that require high levels of consumer understanding, market dynamics and local expertise. In addition, our vacuum cleaning systems are sold through an exclusive independent distributor network. The team dedicates resources across the organization to focus on developing strong brands and quality products. The sales force is allocated primarily by geographic region: Asia, Canada, Europe, Latin America and the United States, with sub-groups to sell different product lines. We operate in a matrix model with the business and operational teams to ensure consistency and fulfillment of marketing strategy and establish direction for the
6
Table of Contents
growth priorities of the brands. Advertising and brand building activities include public relations impressions, television, radio and print advertisements, direct to consumer marketing, mobile marketing activities, online marketing, consumer promotions, consumer contests and sweepstakes, demonstrations and educational events at trade shows.
In addition to brand development, we have an extensive licensing strategy to extend the reach of the brands across categories, geographies and strategic product extensions. We believe that utilizing licensing generates high value consumer impressions that are aligned with the strategic objectives of the brands and enhances emotional relevance of the product. We believe that Crock-Pot®, Oster®, Rival® and Sunbeam® are among the leading licensed housewares brands in the consumer products industry. We also establish strategic alliances with key external brands such as Arm & Hammer®, Hawaiian Punch®, Keurig®, Margaritaville®, Therapedic®, WeMo®, and licensing agreements for our products with brands of the National Collegiate Athletic Association®, National Football League® and National Hockey League®, providing us the opportunity to broaden our consumer appeal and distribution channel penetration by leveraging their consumer recognition through exciting, differentiated products.
Distribution and Fulfillment
We utilize a combination of third-party and company-owned warehouses in Asia, Canada, Europe, Latin America and the United States to distribute our Consumer Solutions products.
Manufacturing
Our research and development department designs and engineers many of our products, collaborates with our internal and external manufacturing resources and sets strict product performance specifications and testing requirements. Our Consumer Solutions products are developed, designed and tested at many sites around the world. Products are manufactured at six internal facilities located in the Western Hemisphere as well as through multiple key third-party suppliers, primarily in Asia. In order to ensure the quality and consistency of our products manufactured by third-party suppliers in Asia, we have sourcing operations based in Hong Kong and mainland China that provide oversight relating to product development, design assurance, project management, sourcing management, supply chain/logistics, quality engineering and pre-shipment inspections.
Raw Materials and Sourcing of Product
Our primary raw materials for our in-house manufactured products include copper, glass, plastic resin, steel and various paper-related packaging materials. For all key raw materials, we generally maintain relationships with two or more vendors to ensure we have sufficient quantities available to meet our short- and long-term production requirements. We have partnered with other Jarden subsidiaries where possible to establish new vendor relationships and consolidate, if and when possible, our order volume. We also source finished goods products from other vendors who also use many of the same materials mentioned above. Similarly, we have consolidated vendors where appropriate and expanded where necessary to take advantage of those opportunities available through our prior acquisitions.
Intellectual Property
The principal trademarks in our Consumer Solutions segment consist of Bionaire®, Breville®, Cadence®, Crock-Pot®, FoodSaver®, Health o meter®, Holmes®, Mr. Coffee®, Oster®, Rainbow® and Sunbeam®. We believe our principal trademarks have high levels of brand-name recognition among retailers and consumers. In addition, we believe our brands have an established reputation for quality, reliability and value. We monitor and protect our brands against infringement, and we actively pursue the licensing of our trademarks to third parties for products that complement our product lines or businesses. We also hold numerous design and utility patents covering a wide variety of products, the loss of any one of which would likely not have a material adverse effect on our business taken as a whole.
7
Table of Contents
Seasonality
Sales of our Consumer Solutions products generally are strongest in the fourth quarter preceding the holiday season and may be negatively affected by unfavorable retail conditions and other market trends, as well as irregular weather patterns.
Outdoor Solutions
The Outdoor Solutions segment manufactures or sources, markets and distributes global consumer active lifestyle products for outdoor and outdoor-related activities. For general outdoor activities, the Outdoor Solutions segment is a leading provider of active lifestyle products, offering an array of products that include camping and outdoor equipment such as air beds, camping stoves, coolers, foldable furniture, gas grills, lanterns and flashlights, sleeping bags, tents and water recreation products such as inflatable boats, kayaks and tow-behinds under brand names such as Campingaz®, Coleman®, Esky® and Invicta®. The Outdoor Solutions segment is also a leading provider of fishing equipment under brand names such as Abu Garcia®, All Star®, Berkley®, Fenwick®, Greys®, Gulp!®, Hardy®, JRC™, Mitchell®, PENN®, Pflueger®, Sebile®, Sevenstrand®, Shakespeare®, Spiderwire®, Stren®, Trilene®, Ugly Stik® and Xtools®. Team sports equipment for baseball, softball, football and basketball products are sold under brand names such as Miken®, Rawlings® and Worth®. Alpine and nordic skiing, snowboarding, snowshoeing and in-line skating products are sold under brand names such as Atlas®, Dalbello®, Full Tilt®, K2®, Line®, Little Bear®, Madshus®, Marker®, Morrow®, Ride®, Tubbs®, Völkl® and 5150®. Water sports equipment, personal flotation devices and all-terrain vehicle gear are sold under brand names such as Helium®, Hodgman®, MadDog Gear®, Sevylor®, Sospenders® and Stearns®. The Company also sells high performance technical and outdoor apparel and equipment under brand names such as CAPP3L®, Ex Officio®, K2®, Marker®, Marmot®, Planet Earth®, Ride®, Squadra®, Völkl® and Zoot®, and premium air beds under the AeroBed® brand. Additionally, the Company provides a product portfolio of high-quality class and championship rings and other jewelry, caps and gowns, diplomas, varsity jackets, yearbooks and other accessories, among others under the Jostens® brand.
A summary of the well-known brand names we sell through the Outdoor Solutions segment follows:
| Principal Brands |
Principal Products | |
| Campingaz®, Coleman®, Esky® and Invicta® | Camping and outdoor equipment | |
| Abu Garcia®, All Star®, Berkley®, Chub®, Fenwick®, Greys®, Gulp!®, Hardy®, Johnson®, JRC™, Mitchell®, PENN®, Pflueger®, Sebile®, Shakespeare®, Spiderwire®, Stren®, Trilene®, Ugly Stik® and Xtools® | Fishing equipment | |
| Miken®, Rawlings® and Worth® | Team sports equipment and apparel | |
| Atlas®, Dalbello®, Full Tilt®, K2®, Line®, Little Bear®, Madshus®, Marker®, Morrow®, Ride®, Tubbs®, Völkl® and 5150® | Alpine and Nordic skiing, snowboarding, snowshoeing and in-line skating equipment | |
| Helium®, Hodgman®, MadDog Gear®, Sevylor®, Sospenders® and Stearns® | Personal flotation devices, water sports equipment and all-terrain vehicle gear | |
| AeroBed® and Coleman® | Inflatable air beds and accessories | |
| CAPP3L®, Ex Officio®, K2®, Marker®, Marmot®, Planet Earth®, Ride®, Squadra®, Völkl® and Zoot® | Technical and outdoor apparel and equipment | |
| Jostens® | Class and championship rings and other jewelry, caps and gowns, diplomas, varsity jackets, yearbooks and other accessories, among others | |
8
Table of Contents
Sales and Marketing
The sales force is generally deployed by geographic region: Canada, Europe, Latin America, the Pacific Rim and the United States. Our focus is on providing active lifestyle products to a broad spectrum of outdoor enthusiasts, from expert rock climbers to beginner fishermen. For example, Coleman is positioned as “The Outdoor Company®”, an outdoor lifestyle brand. Within each brand, we strive to create a unique look and functionality for our products and are utilizing new and enhanced in-store merchandising to communicate those differences to the consumer. We also continue to invest in brand and market research, as well as regularly utilize various promotions and public relations campaigns. In addition, Jostens markets and sells in the academic and achievement channel, under which we primarily serve U.S. high schools, colleges and universities, marketing and selling products to administrators, students and their parents. Jostens relies primarily on a network of independent sales representatives to sell its scholastic products in K-12 schools and an internal sales team sells products to colleges and universities.
In addition to brand development, we are focused on expanding our licensing strategy to enhance brand exposure and brand equity through appropriate product extensions, while generating incremental revenue and recognition. We believe we have an objective and targeted image of high quality and excellent value. We also have licensing agreements for our products with brands of Disney®, Major League Baseball®, Marvel®, Mattel®, National Basketball Association®, National Football League®, National Hockey League® and National Collegiate Athletic Association®, as well as with various individual collegiate athletics departments. We utilize these licensing rights to market and distribute products across a number of product categories.
Distribution and Fulfillment
We have warehouse and distribution facilities in Canada, Europe, Latin America, the Pacific Rim and the United States. We also use third-party warehouses and logistical services. We distribute our products to customers around the world utilizing both direct shipping from our manufacturers and distribution from our internal and third-party warehouse facilities.
Manufacturing
We manufacture our products at facilities in China, Europe, Latin America and North America, as well as through third-party sourcing, primarily in Asia. In order to ensure the quality and consistency of our products manufactured by third-party manufacturers in Asia, we have Asian-based sourcing facilities that provide manufacturing oversight, project management and quality support.
Raw Materials and Sourcing of Product
Our primary raw materials include aluminum, copper, corrugated cardboard for packaging, electrical components, glass fiber, magnesium, plastic resin, steel, urethane and various textiles and fabrics. Plastic resin and urethane are components in coolers and plastic resin is also a component of several other Outdoor Solutions products. Steel is a predominate component of our products. These raw materials are purchased from regular commercial suppliers and are available from multiple sources in quantities sufficient to meet normal requirements. The supply and demand for these key raw materials are subject to cyclical and other market factors. Additionally, the principal raw materials of Jostens’ products are adhesives, gold and other precious metals, ink, paper and precious, semiprecious and synthetic stones.
We also purchase a substantial number of finished products from various suppliers, but are not heavily dependent upon a single supplier for our sourced products in total.
9
Table of Contents
Intellectual Property
The principal trademarks consist of Abu Garcia®, AeroBed®, Berkley®, Campingaz®, Coleman®, Jostens®, K2®, Marmot®, Rawlings®, Shakespeare® and Völkl®. We believe our principal trademarks in the Outdoor Solutions segment have high levels of brand-name recognition among retailers and consumers throughout Asia, Europe, Latin America and North America. In addition, we believe our brands have an established reputation for quality, reliability and value. We monitor and protect our brands against infringement, and we actively pursue the licensing of our trademarks to third parties for products that complement our product lines or businesses. We hold numerous design and utility patents covering a wide variety of products, the loss of any of which would likely not have a material adverse effect on our business as a whole.
Seasonality
Sales of our Outdoor Solutions products are generally seasonal, with the strongest sales in the first and second quarters of the calendar year for our camping and outdoor equipment, second and fourth quarter, for our Jostens and team sports businesses, second and third quarters for our fishing business and third and fourth quarters for our winter sports and technical apparel businesses. Sales of these products may be negatively affected by unfavorable weather conditions and other market trends.
Process Solutions
In addition to the three primary business segments described above, our Process Solutions segment manufactures, markets and distributes a wide variety of plastic products including closures, contact lens packaging, medical disposables, plastic cutlery and rigid packaging. Many of these products are consumable in nature or represent components of consumer products. Our materials business produces specialty nylon polymers, conductive fibers and monofilament used in various products, including woven mats used by paper producers and weed trimmer cutting line, as well as fiberglass radio antennas for citizen band, marine and military applications. We are also the largest North American producer of niche products fabricated from solid zinc strip and are the sole source supplier of copper-plated zinc penny blanks to the United States Mint and a major supplier to the Royal Canadian Mint, as well as a supplier of brass, bronze and nickel-plated finishes on steel and zinc for coinage to other international markets. In addition, we manufacture a line of industrial zinc products marketed globally for use in the architectural, automotive, construction, electrical component and plumbing markets.
Sales and Marketing
Process Solutions utilizes a team sell approach that includes internal sales, marketing, customer service, outside sales representatives and manufacturing team members to offer best-in-class solutions to both our industrial and consumer product customers. Our marketing, sales and research and development departments work closely together to develop new products and innovative technologies that add value to both our customers and the end users. Market research, focus groups and end user interviews are key components in our customer-focused marketing strategy, as we continue to fill the new product pipeline with solutions that offer innovation at a value.
Our business growth is fueled by building strong brands in both the industrial and consumer product markets. We use print, radio and television advertisements, public relations impressions, online marketing, co-op direct to consumer marketing, consumer promotions and trade shows as vehicles to build our brands globally.
Government Contracts
We enter into contracts with the United States government, which contain termination provisions customary for government contracts. The United States government retains the right to terminate such contracts at its
10
Table of Contents
convenience. However, if a contract is terminated, we are entitled to be reimbursed for allowable costs and profits to the date of termination relating to authorized work performed to such date. The United States government contracts are also subject to reduction or modification in the event of changes in government requirements or budgetary constraints. Since entering into a contract with us in 1981, the United States government has not terminated the penny blank supply arrangement. We have a multi-year supply contract with the Royal Canadian Mint that runs through May 2016 for defined volumes on a “take or pay” basis.
Manufacturing
We manufacture our products, including the Shakespeare® brand of nylon, in facilities in Europe and North America. Our research and development group, Jarden Design Associates, engineers sustainable products and services for our business units and OEM customers.
Customers and Competition
We distribute our products globally, primarily through club stores, craft stores, direct-to-consumer channels, consisting of company websites, department stores, drugstores, grocery retailers, home improvement stores, mass merchandisers and on-line; specialty retailers and wholesalers, as well as our Yankee Candle retail stores. Additionally we distribute our Jostens and Waddington products through the academic and achievement channel and foodservice channel, respectively. In 2015, approximately 15% of our consolidated net sales were to Walmart, who purchased product from all of our business segments and was our single largest customer. No other customer represents more than 5% of our consolidated net sales. Other leading customers include Amazon.com, Bed Bath and Beyond, Canadian Tire, Costco, Dick’s Sporting Goods, The Home Depot, Kroger, Lowe’s, Sam’s Club and Target.
The markets in which our businesses operate are generally highly competitive, based primarily on product quality, product innovation, price and customer service and support, although the degree and nature of such competition vary by location and product line. Since we offer such a broad range of consumer products, our competitors are varied and are both larger and smaller companies that offer the same or similar consumer products. We do not have a competitor that offers an array of consumer products that are comparable to ours. We have a larger number of competitors that generally only compete within a few individual products or product lines. In addition to branded products, we regularly compete against the private label brands of retailers and “generic” non-branded products in certain categories. Our Yankee Candle retail stores compete primarily with specialty candle and personal care retailers and a variety of other retailers, including department stores, gift stores and national specialty retailers that carry candles along with personal care items, giftware and housewares.
Competitive Strengths
We believe that the following competitive strengths serve as a foundation for our business strategy:
Market Leadership Positions. In North America, we believe we are a leader in several categories, including alpine skis and bindings, snowboarding and snowshoeing, baseballs, softball bats and batting helmets, softballs and gloves, camping gear, cordage, firelogs and firestarters, fishing line, fishing soft baits, rods, reels and combos, fresh preserving jars and accessories, home vacuum packaging, matches and toothpicks, personal flotation devices, playing cards, boxed plastic cutlery, premium scented candles, selected small kitchen appliances, warming blankets, yearbooks and class rings and a number of other branded consumer products. We believe that the specialized nature of our niche categories, and our market shares therein, provide us with competitive advantages in terms of demand from consumers and enhanced brand awareness. We believe our leadership positions contribute to our ability to attract new customers and enter new distribution channels.
We are either the named category manager, sole supplier or one of a very limited number of external vendors to the leading retailers in both the firelogs and firestarters, and rope, cord and twine product lines. In the playing card industry, we believe our Branded Consumables segment is a leading provider of playing cards under the Bee®, Bicycle® and Hoyle® brands. In our Safety and Security business we believe that our First Alert®
11
Table of Contents
brand is one of the most trusted names in home safety by U.S. consumers. Additionally, First Alert® was also recently named as one of “America’s Greatest Brands” by the American Brands Council. We believe we are a leading provider of cellulose sponges in Europe under the Spontex® brand and of condoms in Germany under the Billy Boy® brand. In the baby care industry, we enjoy leading positions in the soother and infant bottle portion of the market in Brazil, France and Germany, under the Fiona®, Lillo®, NUK® and Tigex® brands and rank among the top players in Spain and the United States in these niche markets. In the domestic giftware industry, we believe we are a leading provider of premium scented candles under the Yankee Candle® brand. Within our foodservice disposables business, style and innovation have led the Waddington, PolarPak® and Eco Products® names to be recognized leaders in the disposables space across North America. In Europe, the Waddington name and product innovation along with a series of acquisitions have resulted in an expanded product offering and an expanding geographic reach. As a leading provider of small kitchen appliances, we work directly with retailers, often as the category manager, to identify and support consumers’ needs. Our Crock-Pot®, FoodSaver®, Mr. Coffee®, Oster® and Sunbeam® brands hold leading or significant positions in a number of small kitchen appliance categories. We created the home vacuum packaging category at most of our retailers and continue to lead the category by providing innovation and marketing tools to promote the FoodSaver® brand and home vacuum packaging to consumers. Our Coleman® and Campingaz® brands are widely recognized domestically, in Europe and in the Pacific Rim, and we believe we are a leader in a number of camping and outdoor equipment product categories, including tents, lanterns and stoves. Our Abu Garcia®, Berkley®, Mitchell®, PENN®, Shakespeare®, Spiderwire® and Ugly Stik® brands are recognized globally as prominent brands in fishing. Through our Helium®, Hodgman®, Nevin®, Sospenders® and Stearns® brands, we believe we are a leading provider of flotation vests, jackets and suits (“personal flotation devices”), cold water immersion products and wet suits. We believe Sevylor® is a leading brand in innovative inflatable towables, boats, kayaks and related products. We believe we are a leader in each of the ski, snowboard and snowshoe categories that we participate in. We sell alpine and Nordic skis under a number of brands, including K2®, Line®, Madshus® and Völkl®, and alpine ski bindings under the name Marker® in the three major ski markets of the world: Europe, Japan and North America. We sell boots, bindings, snowboards, snowboard outerwear and snowshoes under a number of brands including Atlas®, Dalbello®, K2®, Morrow®, Ride®, Tubbs®, Völkl® and 5150®. We believe our Marmot® brand is a leader in the premium-priced, high-performance technical outdoor apparel and equipment market. Marmot designs, manufactures, markets and distributes performance jackets, technical rainwear, expedition garments, fleeces, outerwear, softshells, skiwear and accessories, gloves, and expedition quality tents, packs and sleeping bags and related accessories sold under the Marmot® brand name and ski apparel sold under the Marker® brand name. The Ex Officio® brand is recognized as a leader in the design, manufacture, sale and distribution of outdoor and adventure travel apparel for men and women. We believe that Rawlings® is a leading brand and supplier of baseball equipment in North America and their products include baseball gloves, baseballs, batters’ helmets, catchers’ and umpires’ protective equipment, aluminum, composite and wood baseball bats, batters’ gloves and accessories. Rawlings is a major supplier to professional, collegiate, interscholastic and amateur organizations worldwide and is also the official baseball supplier to Major League Baseball (“MLB”), Minor League Baseball and the National Collegiate Athletic Association®, as well as the official helmet supplier to MLB. We believe Worth® and Miken® are leading brands for softball products with leading positions in collegiate and amateur slow pitch and fast pitch softball. We believe that Jostens® is a leading brand in the education and achievement channel and supplier of yearbooks, class and championship rings and other jewelry, regalia, announcements, diplomas and accessories.
Strong Brand-Name Recognition. Our portfolio of leading consumer brands assists us in gaining retail shelf space and introducing new products. The Bionaire®, Coleman®, Crock-Pot®, First Alert®, FoodSaver®, Health o Meter®, Holmes®, K2®, Marmot®, Mr. Coffee®, Oster®, Pine Mountain®, Rawlings®, Ride®, Rival®, Shakespeare®, Starterlogg®, Stearns®, Sunbeam® and Völkl® brands are highly-recognized brands in their respective market segments. We believe the Rawlings® and Worth® brands in baseball and softball, respectively, and K2®, Marker® and Völkl® in snowboards, skis and ski bindings have an extremely high brand name recognition in their market segments. Our Abu Garcia®, Berkley®, Mitchell®, PENN®, Pflueger®, Shakespeare®, Stren®, Trilene® and Ugly Stik® brands are highly recognized within the outdoor enthusiast and fishing market segments. We believe our Ex Officio®, K2®, Marmot®, Marker®, Planet Earth® and Völkl® brands represent
12
Table of Contents
quality technical apparel and equipment within their market segments. We believe Diamond® is a leading brand in plastic cutlery, kitchen matches and toothpicks for use in and around the home. We believe that the Mapa® brand is synonymous with rubber gloves in Argentina and France; that the Spontex® brand is a household name in Western and Central Europe; and that the NUK® brand is a worldwide leader in soothers. We also believe our AeroBed®, Ball®, Crock-Pot®, FoodSaver®, Quickie® and Yankee Candle® brands are household names in inflatable airbeds, fresh preserving, slow cooking, home vacuum packaging systems and cleaning tools and related supplies and premium scented candles, respectively. We believe that Jostens® is a highly recognized brand in the academic and achievement channel, from K-12 to colleges and universities. Overall, we believe our strong brand recognition and consumer awareness, coupled with the quality of our products, help promote significant customer loyalty.
Comprehensive Product Offering. We provide retailers with a broad and diversified portfolio of consumer products across numerous product categories, which add diversity to our revenues and cash flows. Within these categories, we service the needs of a wide range of consumers by providing products to satisfy their different interests, preferences and budgets. Our Branded Consumables segment offers a diversified portfolio of consumer products to serve the value, mid-tier and premium price points, including in part, baby care products (e.g., feeding bottles, pacifiers, soothers and teats), cordage (e.g., rope and twine), fire extinguishing products, firelogs and firestarters, fresh preserving products, home care products (e.g., brooms, brushes, buckets, dusters, dust pans, kitchen matches, mops, plastic cutlery, rubber gloves, sponges and related cleaning products), playing cards and card accessories, security screen doors and fencing, smoke and carbon monoxide alarms, storage organizers and workshop accessories. We believe our Consumer Solutions segment is well-positioned in the kitchen and household appliance categories to take advantage of a “good, better, best” strategy in order to target consumers with various levels of price sensitivity and product sophistication. We believe that our Outdoor Solutions segment, with its products ranging from skis to fishing equipment to personal flotation devices to baseball gloves to lanterns and coolers, is a leading global outdoor lifestyle business with comprehensive product offerings in numerous categories.
We believe our ability to serve retailers with a broad array of branded products and introduce new products will continue to allow us to further penetrate our existing customer bases, while also attracting new customers.
Recurring Revenue Stream. We derive recurring and, we believe, non-cyclical annual sales from many of our leading products due to their affordability and position as fundamental staples within many households. Our cord, rope and twine, feeding bottles, firelogs, firestarters, home care products (e.g., mops, rubber gloves, sponges and related cleaning products), jar closures, kitchen matches, plastic cutlery, premium scented candles and accessories, teats and toothpicks are consumable in nature and exemplify these traits. Moreover, we believe that as the installed base of FoodSaver® and Seal-a-Meal® appliances increases, our disposable storage bags and related accessories used with these appliances will constitute an increasing percentage of total food preservation revenues. Additional sources of recurring revenue include replacement blades for our grooming and shearing business and filters for air purifiers and humidifiers.
Continuous Improvement Programs. A core element of Jarden’s DNA is to “strive to be better.” To that end, we continuously strive to enhance profitability and competitive advantage by leveraging our scale as a buyer in the marketplace and reducing our internal operating costs by sharing infrastructure and expertise across all business units. These endeavors cover all cost centers, including all costs of goods sold (material, labor and overhead), transportation and warehousing, and selling, general and administrative expenses. In addition to the continuous improvement investments made within each business unit, we manage a portfolio of Kaizen events that bring advisors together from across business units to design solutions to specific challenges in manufacturing, warehousing and/or business operations.
Our procurement professionals participate on cross-business commodity councils to negotiate and implement enterprise level supply agreements that take into account our global demand for raw materials, components, finished goods, fulfillment services, professional services, information technology, telecommunications, transportation, and other goods and services. These supply agreements allow all Jarden businesses, regardless of size, to operate with the buying power of a Fortune 500 company.
13
Table of Contents
In order to leverage our global procurement and fulfillment expertise to the benefit of our stockholders, we employ a center-led strategy that consolidates redundant functions within business units to reduce overhead and increase focus on new areas of product innovation. Jarden businesses are constantly collaborating on projects to share resources and best practices in a way that increases our unique competitive advantage. Furthermore, opportunities are selectively pursued across business units to cross-utilize infrastructure such as factory, office and warehouse capacity.
The commodity councils and center-led procurement operating models are highly scalable and simplify the integration of newly-acquired companies. Jarden is able to take advantage of leverage from acquired companies and offer those companies access to Fortune 500 scale, enabling the realization of synergies and cost savings. Our supply chain operations partner with all our businesses to ensure that we are continuously focused on enhancing profitability and competitive advantage. Our operating models are extended globally to adapt to the growth in our portfolio of businesses and revenue outside traditional markets in North America.
We utilize an efficient outsourced manufacturing network of suppliers for certain of our products. Many of these relationships are long-term, affording us increased flexibility and stability in our operations. This diverse network allows us to maintain multiple sources of quality products while keeping price points competitive. The global reach of our supply network also enables our businesses to leverage our collective experience when seeking new sources of supply in low cost regions outside our traditional supply markets.
Operating numerous factories globally gives our supply chain executives invaluable real-time insight into the relative cost and complexity associated with manufacturing in many regions of the world. This insight is used to ensure that we are producing our products in the location that will deliver the best cost and quality. We continuously evaluate the portfolio of products we manufacture and source to ensure that we are pursuing the best strategy for either outsourcing or insourcing to further vertically integrate our supply chain.
Chief among our priorities in the area of manufacturing is to ensure that our factories are operating safely, sustainably and efficiently and that deployed capital is delivering a strong return for our stockholders. To achieve these objectives, our manufacturing and continuous-improvement professionals participate on cross-business councils to share innovative ideas, leverage scale in the market place, and implement standards of best practice. These councils facilitate quicker problem solving by identifying and deploying the most qualified subject matter experts in the Company regardless of their business affiliation. All of our manufacturing facilities are measured by a standardized set of key performance indicators that seek to assure production processes fall within operational expectations.
In order to reach our customers globally, our distribution and warehousing networks in and between major markets are significant. Our approach to design emphasizes collaboration across all platforms to increase optimization, reduce logistics costs, and engineer networks that are aligned with the needs of our customers. In many ways, the collective expertise across the Jarden portfolio of businesses allows each individual company to shorten its learning curve in any number of functional areas. This translates into a competitive advantage for our customers and employees.
Low Cost Manufacturing. We focus on executing manufacturing programs with superior efficiencies, low cost and high quality. We organize the production runs in many of our business segments’ product lines to minimize the number of manufacturing functions and the frequency of material handling. We also utilize, where practical, a flexible process which uses cellular manufacturing to allow a continuous flow of parts with minimal set up time. In our lower cost country manufacturing facilities, we focus on manufacturing proprietary products and products where our expertise provides a lower production cost despite the generally higher level of labor required. As the economics of manufacturing product in a particular region evolves, Jarden reviews the viability of whether or not relocation of manufacturing lines is required to assure competitive cost structures and that timely marketplace distribution alignment is maintained.
14
Table of Contents
Repatriation of Manufacturing. Wages in Chinese manufacturing centers have historically increased and there continues to be volatility in transportation cost and availability to ship product to our largest markets. In addition, the world’s emerging economies continue to shift manufacturing capacity to satisfy domestic demand as their consumer class grows which we believe will increasingly put exporters at a disadvantage. Although our business units have been able to maintain a competitive advantage over the years by off-shoring manufacturing to low cost countries such as China, we also retained a significant internal manufacturing capability in North America. Our history of prudent capital investments has enabled cost effective repatriation of the manufacturing of several products, including personal flotation devices, composite baseball bats, hard side coolers, plastic cutlery, box fans, small kitchen appliances and other products previously manufactured in China.
Proven and Incentivized Management Team. Our management team has a proven track record of successful management with positive operating results. Our “Office of the Chairman” team is comprised of Martin E. Franklin, our Founder and Executive Chairman, Ian G.H. Ashken, our Co-founder, Vice Chairman and President, and James E. Lillie, our Chief Executive Officer. Our primary business units are led by executives with extensive experience in the branded consumer products markets.
Business Strategy
Our objective is to increase profitability, cash flow and revenue while enhancing our position as a leading manufacturer, marketer and distributor of branded consumer products “used in and around the home” and “home away from home.” Our strategy for achieving these objectives includes the following key elements:
Further Penetrate Existing Distribution Channels. We seek to further penetrate existing distribution channels to drive organic growth by leveraging our strong existing customer relationships and attracting new customers. We intend to further penetrate existing distribution channels by continuing to:
| • | provide quality products; |
| • | fulfill logistical requirements and volume demands efficiently and consistently; |
| • | provide comprehensive product support from design to after-market customer service; |
| • | cross-sell our brands across various business segments to our extensive combined customer bases; |
| • | leverage strong established European, Latin American and Pacific Rim distribution channels; and |
| • | establish new distribution channels through our subsidiaries in Asia. |
Introduce New Products. To drive organic growth from our existing businesses, we intend to continue to leverage our strong brand names, customer relationships and proven capacity for innovation to develop new products and product extensions in each of our major product categories.
During 2015, in our Branded Consumables segment, our Jarden Home and Family business expanded its product offerings with the introduction of a new line orthodontic shape pacifiers under the NUK® brand that provide exceptional comfort by maximizing tongue movement and reducing mouth and jaw pressure. We also introduced a customizing pacifier tool that allows customers to create their own pacifier. The Waddington business introduced the Envisions® product line introducing newly developed high quality graphics technology which allows customers to customize products with their own brand, message or graphics quickly and cost effectively. Our Yankee Candle business introduced the American Home™ brand. These new candles and home fragrance products were developed to offer a premium candle in the stores they visit every day, such as grocery stores, drug stores, superstores and big box stores. They feature quality details not typically found in other brands sold in the food, drug and grocery channels of distribution, such as full fragrances that last from the start to finish of the burn and wicks specifically selected for each of those fragrances to ensure an even burning candle. The brand launched with more than 100 new items included in the introduction.
15
Table of Contents
During 2015, our Consumer Solutions segment continued to develop innovative products to meet the needs of consumers driven by trends in blending, food preservation, food preparation, garment care and health and wellness. In response to strong consumer demand for personal blending, we introduced the Oster® My Blend Pro personal blender with a 500 watt motor and insulated sport bottle and the Breville® Blend-Active personal blender. Additionally, in Latin America we introduced the Oster® Xpert Series Professional blenders which transform food using proprietary reversing technology, agitator and intelligent programs, helping consumers achieve their health and lifestyle goals. Continued consumer interest in food preservation has grown the category and as a result we refreshed our popular FoodSaver® 2-in-1 system which supports heat-sealing, zipper bags and containers. We introduced innovative Crock Pot® slow cookers with hinged lids and stove top safe inserts. Also, in the United Kingdom we introduced Breville® toasters which perfectly fits oversized bread. We continued to introduce new Oster® garment care products with exclusive dimpling and steam channeling technologies which reduce friction and maximize steam distribution for better ironing results with less effort. Finally in response to health and wellness trends, we introduced the Health o meter® nuyu products which include a smart phone application integrated with an activity monitor, Bluetooth scale and sleep system which adjusts temperature to work like the body’s circadian rhythm for a better night’s sleep.
During 2015, in our Outdoor Solutions segment, the camping and outdoor business introduced its new HyperFlame™ technology which provides an even heat distribution and better wind resistance for outdoor cooking, as well as BatteryLock™ technology for flashlights which stops battery drain and reduces damaging toxic corrosion. In our team sports business, Rawlings launched the Gold Glove Club with elite independent team dealers across the country. This exclusive club grants dealer access to two new pro player models each month within our iconic Heart of the Hide® and Pro Preferred glove lines. Rawlings also introduced a new Plug ‘N Play baseball merchandising display that enables the consumer to quickly determine the exact baseball glove they need, simplifying the in-store buying process. In the winter sports business, Marker® introduced a unique and powerful new pin tech touring binding range. The Kingpin bindings are the first of their kind to offer the performance of a high performance downhill binding in a ski touring lightweight package and are also the first pin is the first PinTech binding in the world to gain DIN ISO 13992:2007 certification from Germany’s prestigious TÜV testing organization. Additionally, Völkl® re-launched its Ride the Mountain (RTM) all mountain ski range with an innovative integration of the new iPT Wideride XL binding. The binding connection to the ski is milled into the ski and is 42% wider than its predecessor leading to precise and direct power transmission to the skis edged for higher precision and control for expert skiers. In the fishing business, we expanded our fly fishing offerings within the Fenwick®, Hardy®, and Hodgman® brand names and increased the use of lighter weight materials in the composition of its rod and reel selections.
Pursue Strategic Acquisitions. Consistent with our historical acquisition strategy, to the extent we pursue future acquisitions, we intend to focus on businesses with product offerings that provide geographic or product diversification, or expansion into related categories that can be marketed through our existing distribution channels or provide us with new distribution channels for our existing products, thereby increasing marketing and distribution efficiencies. Furthermore, we expect that acquisition candidates would demonstrate a combination of attractive margins, strong cash flow characteristics, category leading positions and products that generate recurring revenue. We anticipate that the fragmented nature of the consumer products market will continue to provide opportunities for growth through strategic acquisitions of complementary businesses. However, there can be no assurance that we will complete an acquisition in any given year or that any such acquisition will be significant or successful. We will only pursue a candidate when it is deemed to be fiscally prudent and that meets our acquisition criteria. We anticipate that any future acquisitions would be financed through any combination of cash on hand, operating cash flow, availability under our existing credit facilities and new capital market offerings. Currently, the Merger Agreement with Newell Rubbermaid restricts the Company’s ability to enter into acquisition agreements or consummate acquisitions without the prior consent of Newell Rubbermaid.
Further Expand Internationally. We derived approximately 35% and 39% of our consolidated sales in 2015 and 2014, respectively, from international markets. We believe that we can expand our international sales
16
Table of Contents
primarily by leveraging our distribution channel opportunities across product lines and by pursuing strategic cross-selling or co-branding in our foreign businesses with established complementary distribution channels. We also believe that our strong international distribution network will continue to assist us in placing more products into foreign channels and increase the rate at which our products assimilate themselves into homes in the European, Latin American and Pacific Rim markets.
Focus on Operating Margin Improvements. We focus on expanding margins through operating efficiencies and the realization of synergies from our business units, the integration of our businesses and the transfer of best practices throughout each of our operating units. We use our scale to leverage our supply chain, distribution and production costs as well.
Environmental Matters
Our operations are subject to federal, state and local environmental and health and safety laws and regulations, including those that impose workplace standards and regulate the discharge of pollutants into the environment and establish standards for the handling, generation, emission, release, discharge, treatment, storage and disposal of materials and substances including solid and hazardous wastes. We believe that we are in material compliance with such laws and regulations. Further, the cost of maintaining compliance has not, and we believe in the future, will not, have a material adverse effect on our business, consolidated results of operations and consolidated financial condition. Due to the nature of our operations and the frequently changing nature of environmental compliance standards and technology, we cannot predict with any certainty that future material capital or operating expenditures will not be required in order to comply with applicable environmental laws and regulations.
In addition to operational standards, environmental laws also impose obligations on various entities to clean up contaminated properties or to pay for the cost of such remediation, often upon parties that did not actually cause the contamination. We have attempted to limit our exposure to such liabilities through contractual indemnities and other mechanisms. We do not believe that any of our existing remediation obligations, including those at third-party sites where we have been named a potentially responsible party, will have a material adverse effect upon our business, consolidated results of operations or consolidated financial condition.
Employees
As of December 31, 2015, we employed over 40,000 people in Canada, Europe, Latin America, the Pacific Rim (including China) and the United States, of which approximately 3,900 are unionized.
We have not experienced a work stoppage during the past five years. Management believes that our relationships with our employees and collective bargaining unions are satisfactory.
Research and Development
Research and development costs are expensed as incurred in connection with our internal programs for the development of products and processes. Research and development costs for 2015, 2014 and 2013 were approximately $93 million, $93 million and $92 million, respectively.
Website Access Disclosure
Our internet website address is http://www.jarden.com. We make available free of charge through our website our annual report on Form 10-K, quarterly reports on Form 10-Q, current reports on Form 8-K, and all amendments to those reports filed pursuant to Section 13(a) or 15(d) of the Securities Exchange Act of 1934, as amended, and the proxy statement for our annual meeting of stockholders, as soon as reasonably practicable after such material is electronically filed with or furnished to the Securities and Exchange Commission (the “SEC”). In addition, information concerning purchases and sales of our equity securities by our executive officers and directors is posted on our website by the end of the business day after filing with the SEC.
17
Table of Contents
Our website also includes the following corporate governance materials under the tab “For Investors - Governance”: our Business Conduct and Ethics Policy; our Board of Directors Governance Principles and Code of Conduct Policy; our Stock Ownership Guidelines and Insider Trading Policy; our Management and Board of Directors; our Committee Composition; our Insider Transactions; and the charters of our Board of Directors committees. These corporate governance materials are also available in print upon request by any stockholder to our Investor Relations department at our executive corporate headquarters.
Information on our website does not constitute part of this Annual Report on Form 10-K.
In addition to the information included in this Item 1, see Item 7 (Management’s Discussion and Analysis of Financial Condition and Results of Operations) and Item 8, Note 1 (Business and Significant Accounting Policies) and Note 17 (Segment Information) for financial and other information concerning our business segments and geographic areas.
The ownership of our common stock involves a number of risks and uncertainties. Potential investors should carefully consider the risks and uncertainties described below and the other information in this Annual Report on Form 10-K before deciding whether to invest in our securities. Our business, financial condition or results of operations could be materially adversely affected by any of these risks. The risks described below are not the only ones facing us. Additional risks that are currently unknown to us or that we currently consider to be immaterial may also impair our business or adversely affect our financial condition or results of operations.
Risks Relating to Our Business
We are subject to risks related to our dependence on the strength of retail economies in various parts of the world and our performance may be affected by the global economic environment.
Our business depends on the strength of the retail economies in various parts of the world, primarily in North America but increasingly in Asia, Europe and Central and South America, which have experienced instability in recent years and may experience further volatility, or be subject to further deterioration, for the foreseeable future. These retail economies are affected primarily by factors such as consumer demand and the condition of the retail industry, which, in turn, are affected by general economic conditions and specific events such as natural disasters, terrorist attacks and political unrest. The impact of these external factors is difficult to predict, and one or more of the factors could adversely impact our business, results of operations and financial condition.
Purchases of many consumer products are discretionary and tend to be highly correlated with the cycles of the levels of disposable income of consumers. As a result, any substantial deterioration in general economic conditions could adversely affect consumer spending patterns, our sales and our results of operations. If the global economy experiences significant disruptions or slowdown, our business could be negatively impacted by reduced demand for our products. We could also be negatively impacted by an economic crisis in individual countries or regions, including sovereign risk related to a deterioration in the credit worthiness of or a default by local governments. Such events could negatively impact our overall liquidity and/or create significant credit risks relative to our local customers and depository institutions.
Changes in the retail industry and markets for consumer products affecting our customers or retailing practices could negatively impact existing customer relationships and our results of operations.
We sell our Outdoor Solutions, Consumer Solutions and Branded Consumables products to retailers, including club, department store, drug, grocery, mass merchant, sporting goods and specialty retailers, as well as direct to consumers. A significant deterioration in the financial condition of our major customers could have a material adverse effect on our sales and profitability. We regularly monitor and evaluate the credit status of our
18
Table of Contents
customers and attempt to adjust sales terms as appropriate. Despite these efforts, a bankruptcy filing by a key customer could have a material adverse effect on our business, results of operations and financial condition.
In addition, as a result of the desire of retailers to more closely manage inventory levels, there is a growing trend among retailers to make purchases on a “just-in-time” basis. This requires us to shorten our lead time for production in certain cases and more closely anticipate demand, which could in the future require us to carry additional inventories.
We may be negatively affected by changes in the policies of our retailer customers, such as inventory destocking, limitations on access to and time on shelf space, use of private label brands, price demands, payment terms and other conditions, which could negatively impact our results of operations.
There is a growing trend among retailers in the U.S. and in foreign markets to undergo changes that could decrease the number of stores that carry our products or increase the concentration of ownership within the retail industry, including:
| • | consolidating their operations; |
| • | undergoing restructurings or store closings; |
| • | undergoing reorganizations; or |
| • | realigning their affiliations. |
These consolidations could result in a shift of bargaining power to the retail industry and in fewer outlets for our products. Further consolidations could result in price and other competition that could reduce our margins and our net sales.
Our sales are highly dependent on purchases from several large customers and any significant decline in these purchases or pressure from these customers to reduce prices could have a negative effect on our future financial performance.
Our customer base is relatively concentrated. In 2015, one customer, Walmart, accounted for approximately 15% of our consolidated net sales.
Although we have long-established relationships with many of our customers, we do not have any long-term supply or binding contracts or guarantees of minimum purchases. Purchases by our customers are generally made using individual purchase orders. As a result, these customers may cancel their orders, change purchase quantities from forecast volumes, delay purchases for a number of reasons beyond our control or change other terms of our business relationship. Significant or numerous cancellations, reductions, delays in purchases or changes in business practices or by customers could have a material adverse effect on our business, results of operations and financial condition. In addition, because many of our costs are fixed, a reduction in customer demand could have an adverse effect on our gross profit margins and operating income.
We depend on a continuous flow of new orders from our large, high-volume retail customers; however, we may be unable to continually meet the needs of our customers. Furthermore, on-time delivery and satisfactory customer service are becoming increasingly important to our customers. Retailers are increasing their demands on suppliers to:
| • | reduce lead times for product delivery, which may require us to increase inventories and could impact the timing of reported sales; |
| • | improve customer service, such as with direct import programs, whereby product is supplied directly to retailers from third-party suppliers; and |
19
Table of Contents
| • | adopt new technologies related to inventory management such as Radio Frequency Identification, otherwise known as RFID technology, which may have substantial implementation costs. |
We cannot provide any assurance that we can continue to successfully meet the needs of our customers. A substantial decrease in sales to any of our major customers could have a material adverse effect on our business, results of operations and financial condition.
Changes in foreign, cultural, political and financial market conditions could impair our international operations and financial performance.
Some of our operations are conducted or products are sold in countries where economic growth has slowed, such as Brazil; or where economies have suffered economic, social and/or political instability or hyperinflation; or where the ability to repatriate funds has been significantly delayed or impaired in recent years, such as Venezuela and Argentina. Current government economic and fiscal policies in these economies, including stimulus measures and currency exchange rates and controls, may not be sustainable and, as a result, our sales or profits related to those countries may decline. The economies of other foreign countries important to our operations, including other countries in Asia, Europe and Latin America, could also suffer slower economic growth or economic, social and/or political instability or hyperinflation in the future. Our international operations (and particularly our business in emerging markets), including manufacturing and sourcing operations (and the international operations of our customers), are subject to inherent risks which could adversely affect us, including, among other things:
| • | protectionist policies restricting or impairing the manufacturing, sales or import and export of our products; |
| • | new restrictions on access to markets; |
| • | lack of developed infrastructure; |
| • | inflation (including hyperinflation) or recession; |
| • | devaluations or fluctuations in the value of currencies; |
| • | changes in and the burdens and costs of compliance with a variety of foreign laws and regulations, including tax laws, accounting standards, trade protections measures and import and export licensing requirements, environmental laws and occupational health and safety laws; |
| • | social, political or economic instability; |
| • | acts of war and terrorism; |
| • | natural disasters or other crises; |
| • | reduced protection of intellectual property rights in some countries; |
| • | increases in duties and taxation; |
| • | restrictions on transfer of funds and/or exchange of currencies; |
| • | expropriation of assets or forced relocations of operations; and |
| • | other adverse changes in policies, including monetary, tax and/or lending policies, encouraging foreign investment or foreign trade by our host countries. |
Should any of these risks occur, our ability to manufacture, source, sell or export our products or repatriate profits could be impaired; we could experience a loss of sales and profitability from our international operations; and/or we could experience a substantial impairment or loss of assets, any of which could have a material adverse impact on our business.
20
Table of Contents
Currency devaluations or fluctuations or exchange controls may significantly increase our expenses and affect our results of operations as well as the carrying value of international assets on our balance sheet, especially where the currency is subject to intense political and other outside pressure, such as in the case of the Venezuelan Bolivar and the Chinese Renminbi.
While we transact business predominantly in U.S. dollars and most of our revenues are collected in U.S. dollars, a substantial portion of our assets, revenues, costs, such as payroll, rent and indirect operational costs, and earnings are denominated in other currencies, such as the Chinese Renminbi, European Euro, Japanese Yen, Mexican Peso, and British Pound. Changes in the relation of these and other currencies to the U.S. dollar will affect the carrying value of our international assets, as well as our sales and profitability and could result in exchange losses. For example, a stronger Mexican Peso would mean our products assembled or produced in Mexico would be more expensive to import into the U.S. or other countries, thereby reducing profitability of those products. Likewise, if the government of China allowed the Chinese Renminbi to rise substantially versus the U.S. dollar, the cost of our products produced in China would rise.
In 2010, Venezuela was designated a hyper-inflationary economy. Consequently, the Company changed the functional currency of the Company’s subsidiaries in Venezuela from the Venezuelan Bolivar to the U.S. dollar and recorded an accounting charge against earnings relating to foreign exchange translation as a result of the hyperinflationary status. The Venezuelan government devalued its currency in 2010 and again in February 2013. In 2013, the Venezuelan government eliminated the regulated System of Transactions in Foreign Currency Denominated Securities (“SITME”) market and established a new auction-based exchange rate market program, the Complementary System of Foreign Currency Administration (“SICAD”). As of December 31, 2014, the Company recorded a remeasurement charge related to remeasuring the Company’s Bolivar-denominated assets and liabilities at their expected settlement rates based on the Company’s experience with the foreign exchange markets for Venezuelan Bolivars during 2014. In February 2015, the Venezuelan government established a new foreign exchange system, the Marginal Currency System (“SIMADI”) and consequently eliminated the SICAD-II program. As such, the Company recorded a remeasurement charge related to remeasuring the Company’s Bolivar-denominated assets and liabilities at the SIMADI exchange rate, as this was the Company’s expected settlement rate. Prior to March 31, 2015, the Company included the results of its Venezuelan operations in the consolidated financial statements using the consolidation method of accounting. Venezuelan exchange control regulations became increasingly restrictive and resulted in an other-than-temporary lack of exchangeability between the Venezuelan Bolivar and U.S. dollar, and restricted our Venezuelan operations’ ability to pay obligations denominated in U.S. dollars, as well as dividends. These exchange regulations, combined with certain Venezuelan regulations, limit the Company’s ability to rationalize its manufacturing platform to a level that would allow the Company to maintain a sustainable production level that is commensurate with the declining demand resulting from the deteriorating macroeconomic conditions in Venezuela. Furthermore, the Venezuelan government imposed price restrictions that prohibit the Company from pricing its products at acceptable levels. As a result of these factors, effective March 31, 2015, the Company began reporting the results of its Venezuelan operations using the cost method of accounting, and the Company recorded deconsolidation charges related to the deconsolidation of the Company’s subsidiaries operating in Venezuela that include, in part, charges for the remeasurement of net monetary assets and the impairment of long-lived assets. As a result of this deconsolidation, we believe there will be no future remeasurement charges from any future devaluations of the Venezuelan Bolivar that impact negatively the carrying value of our assets in Venezuela or could materially adversely affect our business, results of operations and financial condition.
As we have substantial operations and assets located outside the United States, foreign currency devaluations or fluctuations in the applicable foreign currency exchange rates in relation to the U.S. dollar could continue to have a material adverse impact on our business, results of operations and financial condition, both for purposes of actual conversion and financial reporting purposes. The impact of future exchange rate devaluations or fluctuations on our results of operations cannot be accurately predicted. There can be no assurance that the U.S. dollar foreign exchange rates will be stable in the future or that fluctuations in financial or foreign markets will not have a material adverse effect on our business, results of operations and financial condition.
21
Table of Contents
Our failure to generate sufficient cash to meet our liquidity needs may affect our ability to service our indebtedness and grow our business.
Our ability to make payments on and to refinance our indebtedness, including any of our debt securities and amounts borrowed under our senior secured credit facility, and to fund planned capital expenditures and expansion efforts and strategic acquisitions we may make in the future, if any, will depend on our ability to generate cash in the future. This, to a certain extent, is subject to general economic, financial, competitive and other factors that are beyond our control.
Based on our current level of operations, we believe our cash flow from operations, together with available cash and available borrowings under our senior secured credit facility, will be adequate to meet future liquidity needs for at least the next twelve months. However, we cannot assure you that our business will generate sufficient cash flow from operations in the future, that our currently anticipated growth in revenues and cash flow will be realized on schedule or that future borrowings will be available to us under our senior secured credit facility in an amount sufficient to enable us to service indebtedness, including any of our debt securities, grow our business or to fund other liquidity needs. We may need to refinance all or a portion of our indebtedness, including any of our debt securities and our senior secured credit facility, on or before maturity. We cannot assure you that we will be able to do so on commercially reasonable terms or at all, which could have a material adverse effect on our business.
Our indebtedness imposes constraints and requirements on our business and financial performance, and our compliance and performance in relationship to these could materially adversely affect our financial condition and operations.
We have a significant amount of indebtedness. As of December 31, 2015, we had total indebtedness of approximately $6.4 billion. Our significant indebtedness could:
| • | increase our vulnerability to general adverse economic and industry conditions; |
| • | require us to dedicate a substantial portion of our cash flow from operations to payments on our indebtedness, thereby reducing the availability of our cash flow to fund working capital, capital expenditures, acquisitions and investments and other general corporate purposes; |
| • | limit our flexibility in planning for, or reacting to, changes in our business and the markets in which we operate; |
| • | adversely affect our ability to expand our business, market our products and make investments and capital expenditures; |
| • | adversely affect our ability to pursue our acquisition strategy; |
| • | place us at a competitive disadvantage compared to our competitors that have less debt; and |
| • | limit, among other things, our ability to borrow additional funds. |
The terms of the instruments governing our indebtedness, including our senior secured credit facility and the indentures governing our 7 1⁄2% senior subordinated notes due 2017, our 1 7⁄8% senior subordinated convertible notes due 2018, our 1 1⁄2% senior subordinated convertible notes due 2019, our 3 3⁄4% senior notes due 2021, our 6 1⁄8% senior notes due 2022, our 1 1⁄8% senior subordinated convertible notes due 2034, and our 5% senior notes due 2023, allows us to issue and incur additional debt upon satisfaction of certain conditions. We anticipate that any future acquisitions we pursue as part of our growth strategy or potential stock repurchase programs may be financed through a combination of cash on hand, operating cash flow, availability under our existing credit facilities and new capital market offerings. If new debt is added to current debt levels, the related risks described above could increase.
In addition, the instruments governing our indebtedness, including our senior secured credit facility and the indentures governing our 7 1⁄2% senior subordinated notes due 2017, our 1 7⁄8% senior subordinated convertible
22
Table of Contents
notes due 2018, our 1 1⁄2% senior subordinated convertible notes due 2019, our 3 3⁄4% senior notes due 2021, our 6 1⁄8% senior notes due 2022, our 1 1⁄8% senior subordinated convertible notes due 2034, and our 5% senior notes due 2023, contain restrictive covenants that will limit our ability to engage in activities that may be in our long-term best interests. Our failure to comply with those covenants could result in an event of default which, if not cured or waived, could result in the acceleration of all of our indebtedness.
Our variable rate indebtedness subjects us to interest rate risk, which could cause our debt service obligations to increase significantly.
Borrowings under the revolving portion of our senior secured credit facility are at variable rates of interest and expose us to interest rate risk. If interest rates increase, our debt service obligations on the variable rate indebtedness would increase even though the amount borrowed remained the same, and our net income and cash flows would decrease.
Our indebtedness, including our senior secured credit facility and the indentures governing our 7 1⁄2% senior subordinated notes due 2017, our 1 7⁄8% senior subordinated convertible notes due 2018, our 1 1⁄2% senior subordinated convertible notes due 2019, our 3 3⁄4% senior notes due 2021, our 6 1⁄8% senior notes due 2022, our 1 1⁄8% senior subordinated convertible notes due 2034, and our 5% senior notes due 2023, contain various covenants which limit our management’s discretion in the operation of our business and the failure to comply with such covenants could have a material adverse effect on our business, financial condition and results of operations.
The instruments governing our indebtedness, including our senior secured credit facility and the indentures governing our 7 1⁄2% senior subordinated notes due 2017, our 1 7⁄8% senior subordinated convertible notes due 2018, our 1 1⁄2% senior subordinated convertible notes due 2019, our 3 3⁄4% senior notes due 2021, our 6 1⁄8% senior notes due 2022, our 1 1⁄8% senior subordinated convertible notes due 2034, and our 5% senior notes due 2023, contain various provisions that limit our management’s discretion by restricting our and our subsidiaries’ ability to, among other things and in certain instances:
| • | incur additional indebtedness; |
| • | pay dividends or distributions on, or redeem or repurchase, capital stock; |
| • | make investments; |
| • | engage in transactions with affiliates; |
| • | incur liens; |
| • | transfer or sell assets; and |
| • | consolidate, merge or transfer all or substantially all of our assets. |
In addition, our senior secured credit facility requires us to meet certain financial ratios and other covenants. Any failure to comply with the restrictions of our senior secured credit facility and the indentures related to our outstanding notes or any other subsequent financing agreements may result in an event of default. An event of default may allow our creditors, if the agreements so provide, to accelerate the related debt as well as any other debt to which a cross-acceleration or cross-default provision applies. In addition, the lenders under our senior secured credit facility may be able to terminate any commitments they had made to supply us with further funds. Furthermore, substantially all of our domestic assets (including equity interests) are pledged to secure our indebtedness under our senior secured credit facility. If we default on the financial covenants in our senior secured credit facility, our lenders could foreclose on their security interest in such assets, which would have a material adverse effect on our business, results of operations and financial condition.
23
Table of Contents
Instability in the credit markets may impede our ability to successfully access capital markets and ensure adequate liquidity.
In recent years, the global credit markets have experienced significant disruption and volatility as evidenced by a lack of liquidity in the debt capital markets, significant write-offs in the financial services sector, the re-pricing of credit risk in the broadly syndicated credit market and failure of certain major financial institutions. As a result, in some cases, the ability or willingness of traditional sources of capital to provide financing has been reduced. Such market disruptions may continue, which could increase our cost of borrowing or affect our ability to access one or more financial markets. If we are not able to access debt capital markets at competitive rates, our ability to implement our business plan and strategy will be negatively affected. In particular, our accounts receivable securitization facility is designed to be a relatively short-term facility. If we are unable to refinance or replace this facility, our ability to manage our liquidity needs could be impaired which could result in a material adverse effect on our business, financial condition and results of operation.
Our lenders may have suffered losses related to the weakening economy and may not be able to fund our borrowings.
Our lenders, including the lenders participating in our senior secured credit facility, may have suffered losses in recent years related to their lending and other financial relationships, especially because of the general weakening of the national economy since 2008 and increased financial instability of many borrowers. There can be no assurance that additional lenders will not become insolvent or tighten their lending standards, which could make it more difficult for us to borrow under our senior secured credit facility or to obtain other financing on favorable terms or at all. Our financial condition and results of operations could be adversely affected if we were unable to draw funds under our senior secured credit facility because of a lender default or to obtain other cost-effective financing.
If we fail to develop new or expand existing customer relationships, our ability to grow our business will be impaired.
Our growth depends to a significant degree upon our ability to develop new customer relationships and to expand existing relationships with current customers. We cannot guarantee that new customers will be found, that any such new relationships will be successful when they are in place, or that business with current customers will increase. Failure to develop and expand such relationships could have a material adverse effect on our business, results of operations and financial condition.
Our operating results can be adversely affected by changes in the cost or availability of raw materials.
Pricing and availability of raw materials for use in our businesses can be volatile due to numerous factors beyond our control, including general, domestic and international economic conditions, labor costs, production levels, competition, consumer demand, import duties and tariffs and currency exchange rates. This volatility can significantly affect the availability and cost of raw materials for us, and may, therefore, have a material adverse effect on our business, results of operations and financial condition.
Recently, the prices of many raw materials used in our businesses have been increasing. During periods of rising prices of raw materials, there can be no assurance that we will be able to pass any portion of such increases on to customers. Conversely, when raw material prices decline, customer demands for lower prices could result in lower sale prices and, to the extent we have existing inventory, lower margins. As a result, fluctuations in raw material prices could have a material adverse effect on our business, results of operations and financial condition.
Some of the products we manufacture require particular types of glass, metal, paper, plastic, wax, wood or other materials. Supply shortages for a particular type of material can delay production or cause increases in the cost of manufacturing our products. This could have a material adverse effect on our business, results of operations and financial condition.
24
Table of Contents
With the growing trend towards consolidation among suppliers of many of our raw materials, especially resin, glass and steel, we are increasingly dependent upon key suppliers whose bargaining strength is growing. In addition, many of those suppliers have been reducing production capacity of those raw materials in the North American market. We may be negatively affected by changes in availability and pricing of raw materials resulting from this consolidation and reduced capacity, which could negatively impact our results of operations.
Seasonality and weather conditions may cause our operating results to vary from quarter to quarter.
Sales of certain of our products are seasonal. Sales of our outdoor camping equipment, fishing equipment and sporting goods equipment products increase during warm weather months and decrease during winter, while sales of our skis, snowboards and snowshoes increase during the cold weather months and decrease during summer. Additionally, sales of our Branded Consumables products generally reflect the season, with sales of our home improvement products concentrated in the spring and summer months and sales of our firelogs and firestarters, and scented candles concentrated in the fall and winter months. Sales of our Consumer Solutions products generally are strongest in the fourth quarter preceding the holiday season.
Weather conditions may also negatively impact sales. For instance, fewer than anticipated natural disasters (i.e., hurricanes and ice storms) could negatively affect the sale of certain outdoor recreation products; mild winter weather may negatively impact sales of our winter sports products, firelogs and firestarters, and certain personal care and wellness products; and the late arrival of summer weather may negatively impact sales of outdoor camping equipment, fishing equipment, sporting goods and water sports products. These factors could have a material adverse effect on our business, results of operations and financial condition.
If we cannot continue to develop new products in a timely manner, and at favorable margins, we may not be able to compete effectively.
We believe that our future success will depend, in part, upon our ability to continue to introduce innovative design extensions for our existing products and to develop, manufacture and market new products. We cannot assure you that we will be successful in the introduction, manufacturing and marketing of any new products or product innovations, or develop and introduce, in a timely manner, innovations to our existing products that satisfy customer needs or achieve market acceptance. Our failure to develop new products and introduce them successfully and in a timely manner, and at favorable margins, would harm our ability to successfully grow our business and could have a material adverse effect on our business, results of operations and financial condition.
Competition in our industries may hinder our ability to execute our business strategy, achieve profitability, or maintain relationships with existing customers.
We operate in some highly competitive industries. In these industries, we compete against numerous other domestic and foreign companies. Competition in the markets in which we operate is based primarily on product quality, product innovation, price and customer service and support, although the degree and nature of such competition vary by location and product line. We also face competition from the manufacturing operations of some of our current and potential customers with private label or captive house brands.
Some of our competitors are more established in their industries and have substantially greater revenue or resources than we do. Our competitors may take actions to match new product introductions and other initiatives. Since many of our competitors source their products from third parties, our ability to obtain a cost advantage through sourcing is reduced. Certain of our competitors may be willing to reduce prices and accept lower profit margins to compete with us. Further, retailers often demand that suppliers reduce their prices on existing products. Competition could cause price reductions, reduced profits or losses or loss of market share, any of which could have a material adverse effect on our business, results of operations and financial condition.
25
Table of Contents
To compete effectively in the future in the consumer products industry, among other things, we must:
| • | maintain strict quality standards; |
| • | develop new products that appeal to consumers; and |
| • | deliver products on a reliable basis at competitive prices. |
Our inability to do any of these things could have a material adverse effect on our business, results of operations and financial condition.
We are subject to risks related to acquisitions, and our failure to successfully consummate acquisitions and/or integrate acquired businesses could have a material adverse effect on our business and results of operations.
We have achieved growth through the acquisition of both relatively large and small companies. There can be no assurance that we will continue to be able to integrate successfully these businesses or future acquisitions into our existing business without substantial costs, delays or other operational or financial difficulties. There is also no assurance that we will be able to successfully leverage synergies among our businesses to increase sales and obtain cost savings. Additionally, the failure of these businesses to achieve expected results, diversion of our management’s attention and failure to retain key personnel at these businesses could have a material adverse effect on our business, results of operations and financial condition.
We anticipate that any future acquisitions we pursue as part of our business strategy may be financed through a combination of cash on hand, operating cash flow, availability under our senior secured credit facility and new capital market offerings. If new debt is added to current debt levels, or if we incur other liabilities, including contingent liabilities, in connection with an acquisition, the debt or liabilities could impose additional constraints and requirements on our business and financial performance, which could materially adversely affect our financial condition and operations.
Our ability to consummate acquisitions and integrate acquired businesses is also subject to oversight and review of various governmental and regulatory authorities, including the U.S. Department of Justice and the Federal Trade Commission in the United States, as well as comparable agencies in other countries. There can be no assurance that these governmental and regulatory authorities will permit us to consummate acquisitions we have identified or that they will not require us to divest or alter the operations of acquired businesses after the consummation of the acquisitions. Any such action could impose substantial cost and operational difficulties on our businesses and could have a material adverse effect on our business, results of operations and financial condition.
Failure to successfully implement our reorganization and acquisition-related projects timely and economically could materially increase our costs and impair our results of operations.
We are in the process of significant reorganization and acquisition-related projects. There can be no assurance that these projects can be completed on time or within our projected costs. Furthermore, these projects will result in an increased reliance on sourced finished goods from third parties, particularly international vendors. Our failure to implement these projects economically and successfully could have a material adverse effect on our business, financial condition and results of operations.
26
Table of Contents
We are subject to several production-related risks which could jeopardize our ability to realize anticipated sales and profits.
In order to realize sales and operating profits at anticipated levels, we must manufacture or source and deliver in a timely manner products of high quality. Among others, the following factors can have a negative effect on our ability to do these things:
| • | labor difficulties; |
| • | scheduling and transportation difficulties, including the availability and cost of ocean freight containers; |
| • | management dislocation; |
| • | substandard product quality, which can result in higher warranty, product liability and product recall costs; |
| • | delays in development of quality new products; |
| • | changes in laws and regulations, including changes in tax rates, accounting standards, and environmental, safety and occupational laws; |
| • | health and safety laws and regulations; and |
| • | changes in the availability and costs of labor. |
Any adverse change in any of the above-listed factors could have a material adverse effect on our business, results of operations and financial condition.
Because we manufacture or source a significant portion of our products from Asia, our production lead times are relatively long. Therefore, we often commit to production in advance of firm customer orders. If we fail to forecast customer or consumer demand accurately, we may encounter difficulties in filling customer orders or in liquidating excess inventories or may find that customers are canceling orders or returning products.
Additionally, changes in retailer inventory management strategies could make inventory management more difficult. Any of these results could have a material adverse effect on our business, results of operations and financial condition.
Our operations are dependent upon third-party vendors and suppliers whose failure to perform adequately could disrupt our business operations.
We currently source a significant portion of parts and products from third parties. Our ability to select and retain reliable vendors and suppliers who provide timely deliveries of quality parts and products will impact our success in meeting customer demand for timely delivery of quality products. We typically do not enter into long-term contracts with our primary vendors and suppliers. Instead, most parts and products are supplied on a “purchase order” basis. As a result, we may be subject to unexpected changes in pricing or supply of products. In addition, the financial condition of our vendors and suppliers may be adversely affected by general economic conditions, such as the credit crisis and turbulent macroeconomic environment in recent years. Should any of these parties fail to manufacture sufficient supply, go out of business or discontinue a particular component, we may not be able to find alternative vendors and suppliers in a timely manner, if at all. Any inability of our vendors and suppliers to timely deliver quality parts and products or any unanticipated change in supply, quality or pricing of products could be disruptive and costly to us.
27
Table of Contents
Our reliance on manufacturing facilities and suppliers in Asia could make us vulnerable to supply interruptions related to the political, legal and cultural environment in Asia.
A significant portion of our products are manufactured by third-party suppliers in Asia, primarily the People’s Republic of China, or at our own facilities in China. Our ability to continue to select reliable vendors who provide timely deliveries of quality parts and products will impact our success in meeting customer demand for timely delivery of quality products. Furthermore, the ability of our own facilities to timely deliver finished goods, and the ability of third-party suppliers to timely deliver finished goods and/or raw materials, may be affected by events beyond their control, such as inability of shippers to timely deliver merchandise due to work stoppages or slowdowns, or significant weather and health conditions (such as SARS) affecting manufacturers and/or shippers. Any adverse change in, among other things, any of the following could have a material adverse effect on our business, results of operations and financial condition:
| • | our relationship with third-party suppliers; |
| • | the financial condition of third-party suppliers; |
| • | our ability to import products from these third-party suppliers or our own facilities; or |
| • | third-party suppliers’ ability to manufacture and deliver outsourced products on a timely basis. |
We cannot assure you that we could quickly or effectively replace any of our suppliers if the need arose, and we cannot assure you that we could retrieve tooling and molds possessed by any of our third-party suppliers. Our dependence on these few suppliers could also adversely affect our ability to react quickly and effectively to changes in the market for our products. In addition, international manufacturing is subject to significant risks, including, among other things:
| • | labor unrest; |
| • | social, political and economic instability; |
| • | restrictions on transfer of funds; |
| • | domestic and international customs and tariffs; |
| • | unexpected changes in regulatory environments; and |
| • | potentially adverse tax consequences. |
Labor in China has historically been readily available at relatively low cost as compared to labor costs in North America. However, because China is experiencing rapid social, political and economic changes, labor costs have risen in some regions and there can be no assurance that labor will continue to be available to us in China at costs consistent with historical levels or that changes in labor or other laws will not be enacted which would have a material adverse effect on our operations in China. Any future increase in labor cost in China is likely to be higher than historical amounts.
As a result of experiencing such rapid social, political and economic change, China is also likely to enact new, and/or revise its existing, labor laws and regulations on employee compensation and benefits. Any such changes in Chinese labor laws and regulations would likely have an adverse effect on product manufacturing costs in China. Furthermore, if China laborers go on strike to demand higher wages, our operations could be disrupted. Although China currently enjoys “most favored nation” trading status with the United States, the U.S. government has in the past proposed to revoke such status and to impose higher tariffs on products imported from China. We cannot assure you that our business will not be affected by the aforementioned risks, each of which could have a material adverse effect on our business, results of operations and financial condition.
28
Table of Contents
If we experience revenue declines and decreased profitability, we may incur future impairment charges that could have a material adverse effect on our results of operations.
Our revenue growth and profitability are dependent on our ability to introduce new products and maintain market share. Several factors also impact our profitability which are discussed in this section. If declines in revenues and profitability prevent us from achieving our earnings projections, we may incur impairment charges related to goodwill or indefinite lived intangible assets, or both, which could have a material adverse effect on our results of operations.
Our business, results of operations and financial condition could be materially adversely affected by the loss of our executive officers and the inability to attract and retain appropriately qualified replacements or the diversion of our executive officers’ time and energy to permitted outside interests.
We are highly dependent on the continuing efforts of our executive officers, particularly Martin E. Franklin, our Founder and Executive Chairman, Ian G.H. Ashken, our Co-Founder, Vice Chairman and President, and James E. Lillie, our Chief Executive Officer, who make up our “Office of the Chairman”. We believe these officers’ experience in the branded consumer products industry and our business, and with strategic acquisitions of complementary businesses within our primary business segments, have been important to our historical growth and are important to our future growth strategy. We currently have employment agreements with all of these executive officers. However, we cannot assure you that we will be able to retain any of these executive officers. Our business, results of operations and financial condition could be materially adversely affected by the loss of any of these executive officers and the inability to attract and retain appropriately qualified replacements. We do not maintain “key man” insurance on any of our executive officers.
Messrs. Franklin and Ashken have other active business interests and engage in other activities beyond their positions at Jarden (something they have always been permitted to do under the terms of their respective employment agreements with us since co-founding the business in 2001, provided such other activities do not interfere with their duties as executives of Jarden or directly compete with us). In particular, Mr. Franklin has been and will be a director of investment companies whose strategy is to acquire one or more operating businesses. Because Mr. Franklin may have an obligation to assist these other companies in actively sourcing and acquiring target businesses, he will be required to spend time and energy (such time and energy may be potentially significant) that he might otherwise devote to Jarden on behalf of another enterprise, which could have an adverse impact on our business.
Mr. Franklin has committed to our Board of Directors that any such outside company he assists in actively sourcing and acquiring target businesses will be seeking transactions outside of those that fit within Jarden’s publicly announced acquisition criteria and will not interfere with Mr. Franklin’s or Mr. Ashken’s obligations to Jarden. Mr. Franklin also committed to the Board of Directors that in order to avoid the potential for a conflict, prior to assisting any such outside company in pursuing any acquisition transaction involving a branded consumer products company that fits within Jarden’s publicly announced acquisition criteria, Mr. Franklin would first confirm with an independent committee of our Board of Directors that Jarden was not interested in pursuing the potential acquisition opportunity. If the independent committee concludes that Jarden is interested in that opportunity, Mr. Franklin would not assist or support the other company in pursuing that transaction. However, we cannot assure you that the other company will not choose to pursue transactions that Jarden would have considered. If it pursues transactions that Jarden would have considered, this could negatively impact Jarden’s growth from future acquisitions.
A deterioration of relations with our labor unions could have a material adverse effect on our business, financial condition and results of operations.
Approximately 531 union workers are covered by collective bargaining agreements at six of our facilities. These agreements expire at our jar closure facility (Muncie, Indiana) in 2017, at our match manufacturing facility (Cloquet, Minnesota) in 2019, at our zinc facility (Greeneville, Tennessee) in 2017, at our babycare facility
29
Table of Contents
(Reedsburg, Wisconsin) in 2017, at our monofilament plant (Enka, North Carolina) in 2016 and at our Owatonna, Minnesota facility in 2016. Additionally, approximately 60 employees at our Legutiano, Spain manufacturing facility, approximately 160 employees at our Lyon, France facility, approximately 200 employees at our Ipoh, Malaysia facility, approximately 335 employees at our Zeven, Germany facility, approximately 39 employees at our other European facilities, approximately 2359 employees at our Latin America facilities, and approximately 176 at our Canadian facility are unionized.
We have not experienced a work stoppage during the past five years. However, we cannot assure you that there will not be a work stoppage in the future. Any such work stoppage could have a material adverse effect on our business, financial condition and results of operations.
Our business involves the potential for product recalls, product liability and other claims against us, which could affect our earnings and financial condition.
As a manufacturer and distributor of consumer products, we are subject to the Consumer Products Safety Act of 1972, which empowers the Consumer Products Safety Commission to exclude from the market products that are found to be unsafe or hazardous. Under certain circumstances, the Consumer Products Safety Commission could require us to repurchase or recall one or more of our products. Additionally, laws regulating certain consumer products exist in some cities and states, as well as in other countries in which we sell our products, and more restrictive laws and regulations may be adopted in the future. Any repurchase or recall of our products could be costly to us and could damage our reputation. If we were required to remove, or we voluntarily removed, our products from the market, our reputation could be tarnished and we might have large quantities of finished products that we could not sell.
We also face exposure to product liability claims in the event that one of our products is alleged to have resulted in property damage, bodily injury or other adverse effects. Although we maintain product liability insurance in amounts that we believe are reasonable, that insurance is, in most cases, subject to large self-insured retentions for which we are responsible, and we cannot assure you that we will be able to maintain such insurance on acceptable terms, if at all, in the future or that product liability claims will not exceed the amount of insurance coverage. Additionally, we do not maintain product recall insurance. As a result, product recalls or product liability claims could have a material adverse effect on our business, results of operations and financial condition. In addition, we face potential exposure to unusual or significant litigation arising out of alleged defects in our products or otherwise. We spend substantial resources ensuring compliance with governmental and other applicable standards. However, compliance with these standards does not necessarily prevent individual or class action lawsuits, which can entail significant cost and risk. We do not maintain insurance against many types of claims involving alleged defects in our products that do not involve personal injury or property damage. As a result, these types of claims could have a material adverse effect on our business, results of operations and financial condition.
Our product liability insurance program is an occurrence-based program based on our current and historical claims experience and the availability and cost of insurance. We currently either self-insure or administer a high retention insurance program for most product liability risks. Historically, product liability awards have rarely exceeded our individual per occurrence self-insured retention. We cannot assure you, however, that our future product liability experience will be consistent with our past experience or that claims and awards subject to self-insured retention will not be material to us.
See Note 11 (Commitments and Contingencies) of the notes to our consolidated financial statements included in this Annual Report on Form 10-K for the year ended December 31, 2015 for a further discussion of these and other regulatory and litigation-related matters.
30
Table of Contents
If we fail to adequately protect our intellectual property rights, competitors may manufacture and market products similar to ours, which could adversely affect our market share and results of operations.
Our success with our proprietary products depends, in part, on our ability to protect our current and future technologies and products and to defend our intellectual property rights. If we fail to adequately protect our intellectual property rights, competitors may manufacture and market products similar to ours. Our principal intellectual property rights include our trademarks.
We also hold numerous design and utility patents covering a wide variety of products. We cannot be sure that we will receive patents for any of our patent applications or that any existing or future patents that we receive or license will provide competitive advantages for our products. We also cannot be sure that competitors will not challenge, invalidate or avoid the application of any existing or future patents that we receive or license. In addition, patent rights may not prevent our competitors from developing, using or selling products that are similar or functionally equivalent to our products.
Our results could be adversely affected if the cost of compliance with environmental, health and safety laws and regulations becomes too burdensome.
Our operations are subject to federal, state, local and foreign environmental, health and safety laws and regulations, including those that impose workplace standards and regulate the discharge of pollutants into the environment and establish standards for the handling, generation, emission, release, discharge, treatment, storage and disposal of materials and substances including solid and hazardous wastes. We believe that we are in material compliance with such laws and regulations and that the cost of maintaining compliance will not have a material adverse effect on our business, results of operations or financial condition. However, due to the nature of our operations and the frequently changing nature of environmental compliance standards and technology, we cannot assure you that future material capital expenditures will not be required in order to comply with applicable environmental, health and safety laws and regulations.
We may be subject to environmental and other regulations due to our production and marketing of products in certain states and countries. We also face increasing complexity in our product design and procurement operations as we adjust to new requirements relating to the materials composition of our products. The European Union (“EU”) issued two directives, currently in effect, relating to chemical substances in electronic products. The Waste Electrical and Electronic Equipment Directive requires producers of electrical goods to pay for specified collection, recycling, treatment and disposal of past and future covered products (the “WEEE Legislation”). The EU has issued another directive that requires electrical and electronic equipment placed on the EU market after July 1, 2006 to be free of lead, mercury, cadmium, hexavalent chromium (above a threshold limit) and brominated flame retardants (the “RoHS Legislation”). If we do not comply with these directives, we may suffer a loss of revenue, be unable to sell in certain markets and/or countries, be subject to penalties and enforced fees and/or suffer a competitive disadvantage. Similar legislation could be enacted in other jurisdictions, including in the United States. Costs to comply with the WEEE Legislation, RoHS Legislation and/or similar future legislation, if applicable, could include costs associated with modifying our products, recycling and other waste processing costs, legal and regulatory costs and insurance costs. We may also be required to take reserves for costs associated with compliance with these regulations. We cannot assure you that the costs to comply with these new laws, or with current and future environmental and worker health and safety laws, will not have a material adverse effect on our business, results of operations and financial condition.
We may incur significant costs in order to comply with environmental remediation obligations.
In addition to operational standards, environmental laws also impose obligations on various entities to clean up contaminated properties or to pay for the cost of such remediation, often upon parties that did not actually cause the contamination. Accordingly, we may be liable, either contractually or by operation of law, for remediation costs even if the contaminated property is not presently owned or operated by us, is a landfill or
31
Table of Contents
other location where we have disposed wastes, or if the contamination was caused by third parties during or prior to our ownership or operation of the property. Given the nature of the past industrial operations conducted by us and others at these properties, there can be no assurance that all potential instances of soil or groundwater contamination have been identified, even for those properties where an environmental site assessment has been conducted. We do not believe that any of our existing remediation obligations, including at third-party sites where we have been named a potentially responsible party, will have a material adverse effect upon our business, results of operations or financial condition. However, future events, such as changes in existing laws or policies or their enforcement, or the discovery of currently unknown contamination, may give rise to additional remediation liabilities that may be material. See “Environmental Matters” under Note 11 (Commitments and Contingencies) of the notes to our consolidated financial statements in this Annual Report on Form 10-K for the year ended December 31, 2015 for a further discussion of these and other environmental-related matters.
Compliance with changing regulation of corporate governance and public disclosure may result in additional expenses.
Changing laws, regulations and standards relating to corporate governance and public disclosure, including the Sarbanes-Oxley Act of 2002, the Dodd-Frank Wall Street Reform and Consumer Protection Act of 2010, new SEC regulations and New York Stock Exchange market rules, are creating uncertainty for companies such as ours. These new or changed laws, regulations and standards are subject to varying interpretations, in many cases due to their lack of specificity. As a result, their application in practice may evolve over time as new guidance is provided by regulatory and governing bodies, which could result in continuing uncertainty regarding compliance matters and higher costs necessitated by ongoing revisions to disclosure and governance practices. We are committed to maintaining high standards of corporate governance and public disclosure. As a result, our efforts to comply with evolving laws, regulations and standards have resulted in, and are likely to continue to result in, increased general and administrative expenses and a diversion of management time and attention from revenue-generating activities to compliance activities. In particular, our efforts to comply with Section 404 of the Sarbanes-Oxley Act of 2002 and the related regulations regarding our required assessment of our internal controls over financial reporting and our external auditors’ audit of that assessment have required the commitment of significant financial and managerial resources. We expect these efforts to require the continued commitment of significant resources. Furthermore, our board members, chief executive officer and chief financial officer could face an increased risk of personal liability in connection with the performance of their duties. As a result, we may have difficulty attracting and retaining qualified board members and executive officers, which could harm our business. If our efforts to comply with new or changed laws, regulations and standards differ from the activities intended by regulatory or governing bodies due to ambiguities related to practice, our reputation may be harmed.
We may not be able to implement or operate successfully and without interruptions to the operating software systems and other computer technologies that we depend on to operate our business, which could negatively impact or disrupt our business.
We are in the process of selecting or implementing new operating software systems within a number of our business segments, and complications from these projects could cause considerable disruptions to our business. While significant testing will take place and the rollout will occur in stages, the period of change from the old system to the new system will involve risk. Application program bugs, system conflict crashes, user error, data integrity issues, customer data conflicts and integration issues among our legacy systems all pose potential risks. Any of these issues could have a material adverse effect on our business, results of operations and financial condition.
We rely on other companies to maintain some of our information technology infrastructure. Should they fail to perform due to events outside our control, it could affect our service levels and threaten our ability to conduct business. In addition, natural disasters such as hurricanes may disrupt our infrastructure and our disaster recovery process may not be sufficient to protect against loss.
32
Table of Contents
Additionally, our business operations are dependent on our logistical systems, which include our order management systems and our computerized warehouse systems. Any interruption in our logistical systems could impact our ability to procure our products from our factories and suppliers, transport them to our distribution facilities, store them and deliver them to our customers on time and in the correct amounts.
If our efforts to protect the security of personal information about our customers and consumers are unsuccessful and unauthorized access to that personal information is obtained, we could be subject to costly government enforcement action and private litigation and our reputation could suffer.
Our operations, especially our retail operations, involve the storage and transmission of our customers’ and consumers’ proprietary information, such as credit card and bank account numbers, and security breaches could expose us to a risk of loss of this information, government enforcement action and litigation and possible liability. Our payment services may be susceptible to credit card and other payment fraud schemes, including unauthorized use of credit cards, debit cards or bank account information, identity theft or merchant fraud.
If our security measures are breached as a result of third-party action, employee error, malfeasance or otherwise, and as a result, someone obtains unauthorized access to our customers’ and consumers’ data, our reputation may be damaged, our business may suffer and we could incur significant liability. Because techniques used to obtain unauthorized access or to sabotage systems change frequently and generally are not recognized until launched against a target, we may be unable to anticipate these techniques or implement adequate preventative measures. If an actual or perceived breach of our security occurs, the public perception of the effectiveness of our security measures could be harmed and we could lose customers and consumers, which could adversely affect our business.
Risks Relating to Our Proposed Merger with Newell Rubbermaid
We may have difficulty attracting, motivating and retaining executives and other key employees in light of the pending merger with Newell Rubbermaid.
Competition for qualified personnel can be intense. Current and prospective employees of the Company may experience uncertainty about the effect of the merger, which may impair our ability to attract, retain and motivate key management, sales, marketing, technical and other personnel prior to the merger. Employee retention may be particularly challenging during the pendency of the merger, as employees of the Company may experience uncertainty about their future roles with the combined company.
In addition, there could be disruptions to or distractions for the workforce and management associated with planning for the integration of the Company into Newell Rubbermaid once the transaction is approved.
Completion of the merger is subject to conditions and if these conditions are not satisfied or waived, the merger will not be completed.
The obligations of Newell Rubbermaid and Jarden to complete the merger are subject to satisfaction or waiver of a number of conditions. The obligations of Newell Rubbermaid and Jarden are each subject to, among other conditions: (i) adoption of the merger agreement by Jarden’s stockholders; (ii) approval by Newell Rubbermaid’s stockholders of the issuance of the stock consideration to be provided in the merger; (iii) effectiveness under the Securities Act of 1933, as amended, of Newell Rubbermaid’s Form S-4 registration statement relating to the offer, sale and issuance of the stock consideration and the absence of any stop order in respect thereof or proceedings by the SEC for that purpose; (iv) approval for listing on the New York Stock Exchange, Inc. of the shares of Newell Rubbermaid common stock to be issued as stock consideration; (v) expiration or termination of the applicable Hart-Scott-Rodino Act waiting period and the affirmative approval or expiration of waiting periods in certain other specified jurisdictions; (vi) the absence of laws, orders, judgments and injunctions that restrain, enjoin or otherwise prohibit consummation of the merger; (vii) subject to
33
Table of Contents
certain exceptions, the accuracy of representations and warranties with respect to the businesses of Jarden and Newell Rubbermaid and compliance by Jarden and Newell Rubbermaid with their respective covenants contained in the merger agreement, and (viii) the absence of a material adverse effect relating to Newell Rubbermaid or Jarden.
Many of the conditions to completion of the proposed merger are not within either Newell Rubbermaid’s or Jarden’s control, and neither company can predict when or if these conditions will be satisfied. Although Newell Rubbermaid and Jarden have agreed in the merger agreement to use commercially reasonable efforts, subject to certain limitations, to complete the proposed merger as promptly as practicable, these and other conditions to the completion of the proposed merger may fail to be satisfied. If any of these conditions are not satisfied or waived prior to July 31, 2016, which may be extended by either Newell Rubbermaid or Jarden up to two times, each for an additional 45 day period, it is possible that the merger agreement may be terminated, in which case the proposed merger would not occur. In addition, satisfying the conditions to and completion of the proposed merger may take longer, and could cost more, than Newell Rubbermaid and Jarden expect. Furthermore, the requirements for obtaining the required clearances and approvals could delay the completion of the proposed merger for a significant period of time or prevent them from occurring. Any delay in completing the merger could cause Newell Rubbermaid and Jarden not to realize some or all of the benefits that the parties expect to achieve if the merger is successfully completed within its expected time frame. Further, there can be no assurance that the conditions to the closing of the merger will be satisfied or waived or that the merger will be completed. See the risk factor entitled “Failure to complete the merger could negatively impact the stock price and the future business and financial results of the Company,” below.
Our business relationships may be subject to disruption due to uncertainty associated with the merger.
Parties with which we do business may experience uncertainty associated with the transaction, including with respect to current or future business relationships with Newell Rubbermaid, Jarden or the combined company. Our business relationships may be subject to disruption as customers, distributors, suppliers, vendors and others may attempt to negotiate changes in existing business relationships or consider entering into business relationships with parties other than Newell Rubbermaid, Jarden or the combined company. These disruptions could have an adverse effect on the business, financial condition, results of operations or prospects of the Company. The risks, and adverse effects, of such disruptions could be exacerbated by a delay in completion of the merger or termination of the merger agreement.
Failure to complete the merger could negatively impact the stock price and the future business and financial results of the Company.
If the merger is not completed for any reason, the ongoing business of the Company may be adversely affected and, without realizing any of the benefits of having completed the merger, we would be subject to a number of risks, including the following:
| • | we may experience negative reactions from the financial markets, including negative impacts on our stock price; |
| • | we may experience negative reactions from our customers, regulators and employees; |
| • | we will be required to pay certain costs relating to the merger, whether or not the merger is completed; |
| • | the merger agreement places certain restrictions on the conduct of our business prior to completion of the merger. Such restrictions, the waiver of which is subject to the consent of the Newell Rubbermaid (in certain cases, not to be unreasonably withheld, conditioned or delayed), may prevent us from making certain acquisitions or taking certain other specified actions during the pendency of the; and |
| • | matters relating to the merger (including integration planning) will require substantial commitments of time and resources by our management, which would otherwise have been devoted to day-to-day operations and other opportunities that may have been beneficial to us as an independent company. |
34
Table of Contents
In addition to the above risks, we may be required, under certain circumstances, to pay to Newell Rubbermaid a termination fee, which may materially adversely affect our financial results. Further, we could be subject to litigation related to any failure to complete the merger or related to any enforcement proceeding commenced against us to perform its obligations under the merger agreement. If the merger is not completed, these risks may materialize and may have a material adverse effect on our business, results of operations, financial condition, and stock price.
Item 1B. Unresolved Staff Comments
Not Applicable.
Our corporate offices are located in leased office space in Boca Raton and Miami, Florida and in Norwalk, Connecticut. At December 31, 2015, the Company and its subsidiaries lease or own facilities throughout the U.S., some of which have multiple buildings and warehouses, and these U.S. facilities encompass approximately 21 million square feet. We lease or own international facilities encompassing approximately 14 million square feet primarily in Asia, Canada, Europe and Latin America. Of the U.S. and international manufacturing and warehouse facilities, approximately 17 million square feet of space is owned, while the remaining 18 million square feet of space is leased. The approximate percentage of the facility square footage used by each segment is as follows: Branded Consumables—45%; Consumer Solutions—13%; Outdoor Solutions—39%; and Process Solutions—3%.
In general, our properties are well-maintained, considered adequate and are utilized for their intended purposes. See Note 5 to our consolidated financial statements, Property, Plant and Equipment, which discloses amounts invested in land, buildings and machinery and equipment. Also see Note 11 (Commitments and Contingencies) to our consolidated financial statements, which discloses the Company’s operating lease commitments.
The Company is involved in various legal disputes and other legal proceedings that arise from time to time in the ordinary course of business. In addition, the Company and/or certain of its subsidiaries have been identified by the United States Environmental Protection Agency (“EPA”) or a state environmental agency as a Potentially Responsible Party (“PRP”) pursuant to the federal Superfund Act and/or state Superfund laws comparable to the federal law at various sites. Based on currently available information, the Company does not believe that the disposition of any of the legal or environmental disputes the Company or its subsidiaries are currently involved in will have a material adverse effect upon the consolidated financial condition, results of operations or cash flows of the Company. It is possible that, as additional information becomes available, the impact on the Company of an adverse determination could have a different effect.
Litigation
The Company and/or its subsidiaries are involved in various lawsuits arising from time to time that the Company considers ordinary routine litigation incidental to its business. Amounts accrued for litigation matters represent the anticipated costs (damages and/or settlement amounts) in connection with pending litigation and claims and related anticipated legal fees for defending such actions. The costs are accrued when it is both probable that a liability has been incurred and the amount can be reasonably estimated. The accruals are based upon the Company’s assessment, after consultation with counsel (if deemed appropriate), of probable loss based on the facts and circumstances of each case, the legal issues involved, the nature of the claim made, the nature of the damages sought and any relevant information about the plaintiffs and other significant factors that vary by case. When it is not possible to estimate a specific expected cost to be incurred, the Company evaluates the range
35
Table of Contents
of probable loss and records the minimum end of the range. The Company believes that anticipated probable costs of litigation matters have been adequately reserved to the extent determinable. Based on current information, the Company believes that the ultimate conclusion of the various pending litigation of the Company, in the aggregate, will not have a material adverse effect on the consolidated financial position, results of operations or cash flows of the Company.
Product Liability
As a consumer goods manufacturer and distributor, the Company and/or its subsidiaries face the risk of product liability and related lawsuits involving claims for substantial money damages, product recall actions and higher than anticipated rates of warranty returns or other returns of goods.
The Company and/or its subsidiaries are therefore party to various personal injury and property damage lawsuits relating to their products and incidental to their business. Annually, the Company sets its product liability insurance program, which is an occurrence-based program based on the Company and its subsidiaries’ current and historical claims experience and the availability and cost of insurance. The Company’s product liability insurance program generally includes a self-insurance retention per occurrence.
Cumulative amounts estimated to be payable by the Company with respect to pending and potential claims for all years in which the Company is liable under its self-insurance retention have been accrued as liabilities. Such accrued liabilities are based on estimates (which include actuarial determinations made by an independent actuarial consultant as to liability exposure, taking into account prior experience, number of claims and other relevant factors); thus, the Company’s ultimate liability may exceed or be less than the amounts accrued. The methods of making such estimates and establishing the resulting liability are reviewed on a regular basis and any adjustments resulting therefrom are reflected in current operating results.
Based on current information, the Company believes that the ultimate conclusion of the various pending product liability claims and lawsuits of the Company, in the aggregate, will not have a material adverse effect on the consolidated financial position, results of operations or cash flows of the Company.
Merger Litigation
Vincent A. Hirsch v. James E. Lillie, Martin E. Franklin, Ian G.H. Ashken, Michael S. Gross, Robert L. Wood, Irwin D. Simon, William P. Lauder, Ros L’esperance, Peter A. Hochfelder, Newell Rubbermaid Inc., NCPF Acquisition Corp. I and NCPF Acquisition Corp. II, Case No. 9:16-CV-80258 (United States District Court for the Southern District of Florida)
The above-named lawsuit, which was filed on February 24, 2016, is a putative class action, purportedly on behalf of Jarden shareholders filed against the individual director defendants, who are directors of Jarden Corporation. Newell Rubbermaid Inc., NCPF Acquisition Corp. I and NCPF Acquisition Corp. II are also named as defendants. The Complaint alleges claims under § 14(a) of the Securities Exchange Act of 1934; SEC Rule 14a-9 against all defendants; and Section 20(a) of the Securities Exchange Act against the individual director defendants. Plaintiff alleges that the joint proxy/prospectus of Newell Rubbermaid and Jarden concerning the merger transactions contemplated by the Merger Agreement omitted certain information. Plaintiff seeks to enjoin the proposed merger transactions, rescission in the event the merger is consummated, and the award of attorneys’ fees and costs. The individual director defendants deny the allegations and intend to vigorously defend the action.
Item 4. Mine Safety Disclosures
Not Applicable.
Executive Officers of the Registrant
Pursuant to General Instruction G(3), the information regarding our executive officers called for by Item 401(b) of Regulation S-K is hereby included in Part I of this Annual Report on Form 10-K.
36
Table of Contents
The executive officers of our Company are as follows:
Martin E. Franklin, age 51, is the Company’s Founder and serves as Executive Chairman of our Company. Mr. Franklin was appointed to our Board of Directors on June 25, 2001 and became Chairman and Chief Executive Officer effective September 24, 2001 and served as Chairman and Chief Executive Officer until June 13, 2011, at which time he began service as Executive Chairman. Mr. Franklin is also a principal and executive officer of a number of private investment entities. Mr. Franklin also served as the Chairman and/or Chief Executive Officer of three public companies, Benson Eyecare Corporation, Lumen Technologies, Inc. and Bollé Inc., between 1992 and 2000. Mr. Franklin also currently serves as a director of Nomad Foods Limited, Platform Specialty Products Corporation and Restaurant Brands International Inc.
Ian G.H. Ashken, age 55, is the Company’s Co-Founder and serves as Vice Chairman and President of our Company. Mr. Ashken was appointed to the Board of Directors on June 25, 2001 and became Vice Chairman, Chief Financial Officer and Secretary effective September 24, 2001. Mr. Ashken was Secretary until February 15, 2007 and Chief Financial Officer until June 12, 2014. Mr. Ashken is also a principal and executive officer of a number of private investment entities. Mr. Ashken also served as the Vice Chairman and/or Chief Financial Officer of three public companies, Benson Eyecare Corporation, Lumen Technologies, Inc. and Bollé, Inc. between 1992 and 2000. Mr. Ashken also currently serves as a director of Platform Specialty Products Corporation.
James E. Lillie, age 54, is Chief Executive Officer of our Company. Mr. Lillie joined our Company in August 2003 as Chief Operating Officer and assumed the additional title and responsibilities of President effective January 2004. Mr. Lillie served as President and Chief Operating Officer until June 13, 2011, at which time he began service as Chief Executive Officer. From 2000 to 2003, Mr. Lillie served as Executive Vice President of Operations at Moore Corporation, Limited, a diversified commercial printing and business communications company. From 1999 to 2000, Mr. Lillie served as Executive Vice President of Operations at Walter Industries, Inc., a Kohlberg, Kravitz, Roberts & Company (“KKR”) portfolio company. From 1990 to 1999, Mr. Lillie held a succession of senior level management positions across a variety of disciplines, including human resources, manufacturing, finance and operations at World Color, Inc., another KKR portfolio company. Mr. Lillie also currently serves as a director of Nomad Foods Limited.
Alan W. LeFevre, age 56, is Executive Vice President – Finance and Chief Financial Officer of our Company. Mr. LeFevre has been with the Company since January 2005 where he has served as Executive Vice President and Chief Financial Officer of the Company’s Jarden Consumer Solutions subsidiary (“JCS”) until June 12, 2014. From 1997 to 2005, Mr. LeFevre was with American Household, Inc., which was acquired by the Company in January 2005, where he held positions of increasing responsibility.
John E. Capps, age 51, is Executive Vice President – Administration, General Counsel and Secretary of our Company. Mr. Capps has been with the Company since January 2005. From 2003 to 2005, Mr. Capps was with American Household, Inc. which was acquired by the Company in January 2005, where he most recently served as Vice President-Legal. Prior to 2003, Mr. Capps was in private law practice with the firm Sullivan & Cromwell LLP.
Richard T. Sansone, age 49, is Executive Vice President – Operations of our Company. Mr. Sansone has been with the Company since December 2005. Prior to joining our Company, he most recently served as Senior Vice President, Controller and Chief Accounting Officer of RR Donnelley and Sons (formerly Moore Corporation, Limited), from April 2001 to December 2005. From 1992 to 2001, Mr. Sansone was with PricewaterhouseCoopers LLP where he was an Audit Senior Manager.
Our executive officers serve at the discretion of our Board of Directors.
37
Table of Contents
PART II
| Item 5. | Market for Registrant’s Common Equity, Related Stockholder Matters and Issuer Purchases of Equity Securities |
Jarden Corporation’s (the “Company” or “Jarden”) common stock is traded on the New York Stock Exchange (“NYSE”) under the symbol “JAH.” As of February 16, 2016, there were approximately 2,860 registered holders of record of the Company’s common stock, par value $0.01 per share. On February 16, 2016, the last recorded sales price of the Company’s common stock was $50.83. In January 2012, the Company announced that the Board of Directors of the Company (the “Board”), in connection with the acceleration of its stock repurchase program, had decided to suspend the Company’s dividend program following the dividend paid on January 31, 2012.
The table below sets forth the intraday high and low sales prices of the Company’s common stock as reported on the NYSE for the periods indicated:
| Common Stock Price | ||||||||||||||||
| 2015 | 2014 | |||||||||||||||
| High | Low | High | Low | |||||||||||||
| First Quarter |
$ | 54.26 | $ | 44.77 | $ | 42.67 | $ | 38.10 | ||||||||
| Second Quarter |
54.57 | 50.77 | 40.58 | 36.17 | ||||||||||||
| Third Quarter |
57.09 | 47.21 | 41.37 | 36.73 | ||||||||||||
| Fourth Quarter |
57.97 | 43.19 | 48.72 | 36.27 | ||||||||||||
38
Table of Contents
Performance Graph
The following Performance Graph and related information shall not be deemed “soliciting material” or to be “filed” with the Securities and Exchange Commission, nor shall such information be incorporated by reference into any future filing under the Securities Act of 1933 or Securities Exchange Act of 1934, each as amended, except to the extent that the Company specifically incorporates it by reference into such filing.
The graph below compares total stockholder return on the Company’s common stock from December 31, 2010 through December 31, 2015 with the cumulative total return of (a) the Standard and Poor’s (“S&P”) 500 Index, and (b) the S&P Midcap 400 Index, assuming a $100 investment made on December 31, 2010. Each of the three measures of cumulative total return assumes reinvestment of dividends, if applicable. The stock performance shown on the graph below is based on historical data and is not indicative of, or intended to forecast, possible future performance of the Company’s common stock.
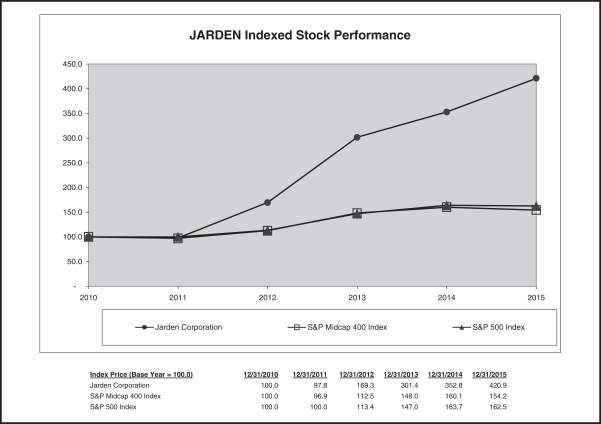
Equity Compensation Plan Information
Information regarding Jarden’s equity compensation plans, including both stockholder-approved plans and plans not approved by stockholders, is incorporated by reference in Item 12 of Part III of this Annual Report on Form 10-K.
Recent Sales of Unregistered Securities
None.
39
Table of Contents
Recent Purchases of our Registered Equity Securities by the Issuer and Affiliated Purchases
The following table provides information about purchases by the Company during the three months ended December 31, 2015 of equity securities of the Company:
| Period |
Total Number of Shares Purchased |
Average Price Paid Per Share |
Total Number of Shares Purchased As Part of a Publicly Announced Repurchase Program (1) |
Approximate Dollar Value of Shares that May Yet be Purchased Under the Repurchase Program (1) |
||||||||||||
| October 1—October 31 |
— | $ | — | — | $ | 251,962,000 | ||||||||||
| November 1—November 30 |
1,052,102 | 47.52 | 1,052,102 | 201,962,000 | ||||||||||||
| December 1—December 31 |
— | — | — | 201,962,000 | ||||||||||||
|
|
|
|
|
|
|
|||||||||||
| Total |
1,052,102 | 47.52 | 1,052,102 | |||||||||||||
|
|
|
|
|
|
|
|||||||||||
| (1) | In February 2014, the Company’s Board of Directors authorized an increase in the then available amount under the Company’s existing stock repurchase program to allow for the repurchase of up to $500 million in the aggregate of the Company’s common stock. |
40
Table of Contents
Item 6. Selected Financial Data
The following tables set forth the Company’s selected financial data as of and for the years ended December 31, 2015, 2014, 2013, 2012 and 2011. The selected financial data set forth below has been derived from the audited consolidated financial statements and related notes thereto, where applicable, for the respective fiscal years. The selected financial data should be read in conjunction with “Management’s Discussion and Analysis of Financial Condition and Results of Operations,” as well as the consolidated financial statements and notes thereto. These historical results are not necessarily indicative of the results to be expected in the future. Certain reclassifications have been made in the Company’s financial statements of prior years to conform to the current year presentation. These reclassifications had no impact on previously reported net income.
| As of and for the Years Ended December 31, | ||||||||||||||||||||
| (in millions, except per share data) |
2015(b) | 2014(b) | 2013(b) | 2012 | 2011 | |||||||||||||||
| STATEMENTS OF OPERATIONS DATA |
||||||||||||||||||||
| Net sales |
$ | 8,603.9 | $ | 8,287.1 | $ | 7,355.9 | $ | 6,696.1 | $ | 6,679.9 | ||||||||||
| Operating earnings (a) |
507.7 | 639.8 | 572.9 | 576.8 | 522.9 | |||||||||||||||
| Interest expense, net |
226.1 | 210.3 | 195.4 | 185.3 | 179.7 | |||||||||||||||
| Loss on early extinguishment of debt |
— | 56.7 | 25.9 | — | 12.8 | |||||||||||||||
| Income tax provision |
135.1 | 130.3 | 147.7 | 147.6 | 125.7 | |||||||||||||||
|
|
|
|
|
|
|
|
|
|
|
|||||||||||
| Net income (a) |
$ | 146.5 | $ | 242.5 | $ | 203.9 | $ | 243.9 | $ | 204.7 | ||||||||||
|
|
|
|
|
|
|
|
|
|
|
|||||||||||
| Basic earnings per share (a) |
$ | 0.75 | $ | 1.31 | $ | 1.20 | $ | 1.39 | $ | 1.03 | ||||||||||
| Diluted earnings per share (a) |
$ | 0.72 | $ | 1.28 | $ | 1.18 | $ | 1.38 | $ | 1.03 | ||||||||||
| OTHER FINANCIAL DATA |
||||||||||||||||||||
| Net cash provided by operating activities |
$ | 684.7 | $ | 627.0 | $ | 668.5 | $ | 480.3 | $ | 427.1 | ||||||||||
| Net cash provided by (used in) financing activities |
2,618.7 | 265.5 | 1,405.6 | 164.7 | (196.7 | ) | ||||||||||||||
| Net cash used in investing activities |
(3,117.1 | ) | (711.5 | ) | (1,957.4 | ) | (427.5 | ) | (113.1 | ) | ||||||||||
| Depreciation and amortization |
245.4 | 191.1 | 165.9 | 152.8 | 163.7 | |||||||||||||||
| Capital expenditures |
214.6 | 202.1 | 211.0 | 154.5 | 126.9 | |||||||||||||||
| Cash dividends declared per common share (d) |
— | — | — | — | 0.15 | |||||||||||||||
| BALANCE SHEET DATA |
||||||||||||||||||||
| Cash and cash equivalents |
$ | 1,298.4 | $ | 1,164.8 | $ | 1,128.5 | $ | 1,034.1 | $ | 808.3 | ||||||||||
| Working capital (e) |
2,379.0 | 2,240.8 | 2,044.1 | 2,081.7 | 2,029.8 | |||||||||||||||
| Total assets |
14,293.1 | 10,799.3 | 10,096.1 | 7,710.6 | 7,116.7 | |||||||||||||||
| Total debt |
6,381.0 | 5,058.9 | 4,742.4 | 3,798.1 | 3,159.4 | |||||||||||||||
| Total stockholders’ equity |
4,052.3 | 2,609.3 | 2,549.7 | 1,759.6 | 1,912.0 | |||||||||||||||
| (a) | Includes the following significant items affecting comparability: |
| • | 2015 includes: $60.6 million of charges related to the deconsolidation of the Company’s Venezuela operations that include, in part, charges for the remeasurement of net monetary assets and the impairment of long-lived assets (see Note 1 to the consolidated financial statements); non-cash impairment charges of $151 million related to the impairment of goodwill, intangible and other assets (see Note 6 to the consolidated financial statements); $77.8 million of cumulative stock-based compensation related to certain restricted share awards where compensation expense was not previously recognized as the achievement of the performance targets was not deemed probable (see Note 13 to the consolidated financial statements); $36.9 million for the purchase accounting adjustment charged to cost of sales for the elimination of manufacturer’s profit in inventory related to acquisitions and $105 million acquisition-related and other costs, net. |
| • | 2014 includes: $175 million of charges related to the Company’s Venezuela operations, which are primarily comprised of a foreign exchange-related charge of $151 million due to the write-down of net monetary assets (see Note 1 to the consolidated financial statements); non-cash impairment charges of $25.4 million related to the impairment of intangible assets (see Note 6 to the consolidated financial |
41
Table of Contents
| statements); $42.0 million of acquisition-related and other costs, net; and a $56.7 million loss on the extinguishment of debt (see Note 9 to the consolidated financial statements). |
| • | 2013 includes: $29.0 million of charges related to its Venezuela operations, which are almost entirely comprised of a non-cash charge related to the write-down of monetary assets (see Note 1 to the consolidated financial statements); $89.8 million for the purchase accounting adjustment charged to cost of sales for the elimination of manufacturer’s profit in inventory related to acquisitions; $22.0 million of restructuring costs, net (see item (c) below); and a $25.9 million loss on the extinguishment of debt (see Note 9 to the consolidated financial statements). |
| • | 2012 includes: $27.1 million of restructuring costs, net (see item (c) below); and $17.5 million of acquisition-related and other costs, net. |
| • | 2011 includes: non-cash impairment charges of $52.5 million, primarily comprised of a non-cash impairment charge of $43.4 million related to the impairment of goodwill and intangibles; $23.4 million of restructuring costs, net (see item (c) below); and $21.4 million of acquisition-related and other costs, net. |
| (b) | The results of Visant Holding Corp., Waddington Group, Inc., Rexair Holdings, Inc. and Yankee Candle Investments LLC are included from their dates of acquisition of November 2, 2015, July 31, 2015, August 29, 2014 and October 3, 2013, respectively. |
| (c) | Restructuring costs include costs associated with exit or disposal activities, including costs of employee and lease terminations and facility closings or other exit activities (see Note 16 to the consolidated financial statements). |
| (d) | In January 2012, the Company announced that the Board had decided to suspend the Company’s dividend program following the dividend paid on January 31, 2012. |
| (e) | Working capital is defined as current assets less current liabilities. For 2015, 2014, 2013, 2012 and 2011, working capital excluding cash was $1.1 billion, $1.1 billion, $916 million, $1.0 billion and $1.2 billion, respectively. |
Item 7. Management’s Discussion and Analysis of Financial Condition and Results of Operations
The following discussion of financial condition and results of operations of Jarden Corporation and its subsidiaries (hereinafter referred to as the “Company” or “Jarden”) should be read together with the consolidated financial statements and notes to those statements included in Item 8 of Part II of this Annual Report on Form 10-K. Unless otherwise indicated, references in the following discussion to 2015, 2014 and 2013 are to Jarden’s fiscal years ended December 31, 2015, 2014 and 2013, respectively.
Overview
The Company is a leading provider of a broad range of consumer products. The Company reports four business segments: Branded Consumables, Consumer Solutions, Outdoor Solutions and Process Solutions. The majority of the Company’s sales are within the United States. The Company’s international operations are mainly based in Asia, Canada, Europe and Latin America.
The Company distributes its products globally, primarily through club stores; craft stores; direct-to-consumer channels, consisting of company websites; department stores; drugstores; grocery retailers; home improvement stores; mass merchandisers; on-line; specialty retailers and wholesalers, as well as our Yankee Candle retail stores. Additionally, we distribute our Jostens and Waddington products through the academic and achievement channel and foodservice channel, respectively. The markets in which the Company’s businesses operate are generally highly competitive, based primarily on product quality, product innovation, price and customer service and support, although the degree and nature of such competition vary by location and product line. Since the Company operates primarily in the consumer products markets, it is generally affected by, among other factors, overall economic conditions and the related impact on consumer confidence.
42
Table of Contents
The Branded Consumables segment manufactures or sources, markets and distributes a broad line of branded consumer products, many of which are affordable, consumable and fundamental household staples, including arts and crafts paint brushes, air fresheners, brooms, brushes, buckets, children’s card games, clothespins, collectible tins, condoms, cord, rope and twine, premium disposable tableware, dusters, dust pans, feeding bottles, fencing, fire extinguishing products, firelogs and firestarters, foam coolers, foodservice disposable packaging and systems, fresh preserving jars and accessories, home decor accessories, home fragrance products, kitchen matches, mops, other craft items, pacifiers, plastic cutlery, playing cards and accessories, rubber gloves and related cleaning products, safes, premium scented candles and accessories, security cameras, security doors, smoke and carbon monoxide alarms, soothers, sponges, storage organizers and workshop accessories, teats, toothpicks, travel sprays, window guards and other accessories. This segment markets our products under brand names such as Aviator®, Ball®, Bee®, Bernardin®, Bicycle®, Billy Boy®, BRK®, Caterline®, Classicware®, Crawford®, Diamond®, Eco Products®, Envirocooler®, Fiona®, First Alert®, First Essentials®, Hoyle®, Java-Log®, KEM®, Kerr®, Lehigh®, Lifoam® Lillo®, Loew-Cornell®, Mapa®, Millefiori ®, Masterpiece®, Milan®, NUK®, Pine Mountain®, ProPak®, Quickie Green Cleaning®, Quickie Home-Pro®, Quickie Microban®, Quickie Original®, Quickie Professional®, Reflections®, Spontex®, Tigex®, Waddington, Wellington®, Yankee Candle® and YOU®, among others.
The Consumer Solutions segment manufactures or sources, markets, and distributes a diverse line of household products, including kitchen appliances and home environment products. This segment maintains a strong portfolio of globally-recognized brands including Bionaire®, Cadence®, Crock-Pot®, FoodSaver®, Health o meter®, Holmes®, Mr. Coffee®, Oster®, Patton®, Rainbow®, Rival®, Seal-a-Meal® and Sunbeam®. The principal products in this segment include: household kitchen appliances, such as blenders, coffeemakers, irons, mixers, slow cookers, tea kettles, toasters, toaster ovens and vacuum packaging machines; home environmental products, such as air purifiers, fans, heaters, humidifiers and vacuum cleaning systems; clippers, trimmers and other hair care products for professional use in the beauty and barber and animal categories; electric blankets, heating pads, mattress pads and throws; products for the hospitality industry; and scales for consumer use. The Consumer Solutions segment also has rights to sell various small appliance products, in substantially all of Europe under the Breville® brand name.
The Outdoor Solutions segment manufactures or sources, markets and distributes global consumer active lifestyle products for outdoor and outdoor-related activities. For general outdoor activities, the Outdoor Solutions segment is a leading provider of active lifestyle products, offering an array of products that include camping and outdoor equipment such as air beds, camping stoves, coolers, foldable furniture, gas grills, lanterns and flashlights, sleeping bags, tents and water recreation products such as inflatable boats, kayaks and tow-behinds under brand names such as Campingaz®, Coleman®, Esky® and Invicta®. The Outdoor Solutions segment is also a leading provider of fishing equipment under brand names such as Abu Garcia®, All Star®, Berkley®, Fenwick®, Greys®, Gulp!®, Hardy®, JRC™, Mitchell®, PENN®, Pflueger®, Sebile®, Sevenstrand®, Shakespeare®, Spiderwire®, Stren®, Trilene®, Ugly Stik® and Xtools®. Team sports equipment for baseball, softball, football and basketball products are sold under brand names such as Miken®, Rawlings® and Worth®. Alpine and nordic skiing, snowboarding, snowshoeing and in-line skating products are sold under brand names such as Atlas®, Dalbello®, Full Tilt®, K2®, Line®, Little Bear®, Madshus®, Marker®, Morrow®, Ride®, Tubbs®, Völkl® and 5150®. Water sports equipment, personal flotation devices and all-terrain vehicle gear are sold under brand names such as Helium®, Hodgman®, MadDog Gear®, Sevylor®, Sospenders® and Stearns®. The Company also sells high performance technical and outdoor apparel and equipment under brand names such as CAPP3L®, Ex Officio®, K2®, Marker®, Marmot®, Planet Earth®, Ride®, Squadra®, Völkl® and Zoot®, and premium air beds under the AeroBed® brand. Additionally, the Company provides a product portfolio of high-quality class and championship rings and other jewelry, caps and gowns, diplomas, varsity jackets, yearbooks and other accessories, among others under the Jostens® brand.
In addition to the three primary business segments described above, our Process Solutions segment manufactures, markets and distributes a wide variety of plastic products including closures, contact lens packaging, medical disposables, plastic cutlery and rigid packaging. Many of these products are consumable in
43
Table of Contents
nature or represent components of consumer products. Our materials business produces specialty nylon polymers, conductive fibers and monofilament used in various products, including woven mats used by paper producers and weed trimmer cutting line, as well as fiberglass radio antennas for citizen band, marine and military applications. We are also the largest North American producer of niche products fabricated from solid zinc strip and are the sole source supplier of copper-plated zinc penny blanks to the United States Mint and a major supplier to the Royal Canadian Mint, as well as a supplier of brass, bronze and nickel-plated finishes on steel and zinc for coinage to other international markets. In addition, we manufacture a line of industrial zinc products marketed globally for use in the architectural, automotive, construction, electrical component and plumbing markets.
The Company’s objective is to increase profitability, cash flow and revenue while enhancing our position as a leading manufacturer, marketer and distributor of branded consumer products “used in and around the home” and “home away from home.” The Company’s strategy for achieving these objectives includes the following key elements:
| • | further penetrate existing distribution channels by leveraging our strong existing customer relationships and attracting new customers; |
| • | leverage our strong brand names, customer relationships and proven capacity for innovation to develop new products and product extensions in each of our major product categories; |
| • | pursue strategic acquisitions; |
| • | gradually expand international revenues to approximately 50% of total revenue; |
| • | expand margins through operating efficiencies and the realization of synergies from our supply chain, distribution and production costs; |
| • | take advantage of cross-channel opportunities by using each business’ geographic strength to support expansion of affiliated businesses; |
| • | efficiently deploy working capital to enhance operating cash flow; |
| • | maintain capital expenditures at an annualized run rate in the range of approximately 2.0% —2.5% of net sales; and |
| • | prudently and creatively access capital markets. |
The Company believes its product innovations and product extensions will continue to drive sales growth in both new and existing customers while also expanding margins. Strategic acquisitions and continued geographic expansion, depending on overall market conditions, help supplement sales growth and product extensions. The Company believes savings from operational efficiencies from supply chain, distribution and production costs synergies will provide increased cash flow from operations.
Summary of Significant 2015 Activities
| • | The company continued its growth momentum in 2015 and ended the year with 4.8% broad-based organic net sales growth as compared to 5.8% organic growth in 2014 and 4.4% organic growth in 2013. |
| • | On November 2, 2015, the Company acquired Visant Holding Corp., the parent company of Jostens, Inc. and other entities composing the Jostens business (“Jostens”), which is a market-leading, iconic brand and trusted partner to schools and students nationwide that provides a product portfolio of high quality yearbooks, class and championship rings, caps and gowns, diplomas, and varsity jackets (the “Jostens Acquisition”). |
| • | In October 2015, the Company borrowed $200 million under its senior secured credit facility (the “Facility”) under its existing senior secured term loan A facility that matures in 2019. |
44
Table of Contents
| • | In October 2015, the Company completed the sale of $300 million in aggregate principal amount of 5% senior notes that mature in November 2023 (the “Senior Notes”), in a private offering to qualified institutional buyers pursuant to Rule 144A under the Securities Act of 1933, as amended (the “Securities Act”) and to certain persons outside of the U.S. pursuant to Regulation S under the Securities Act. |
| • | In October 2015, pursuant to a public offering of its common stock, the Company completed an equity offering of 10.0 million newly-issued shares of common stock at $49.00 per share. |
| • | In July 2015, the Company acquired Waddington Group, Inc. (“Waddington”), a leading manufacturer and marketer of premium disposable tableware for commercial, foodservice and retail markets (the “Waddington Acquisition”). |
| • | In July 2015, the Company borrowed $900 million under the Facility, which is comprised of $300 million under the existing senior secured term loan B1 facility and $600 million under a new senior secured term loan B2 facility. |
| • | In July 2015, pursuant to a public offering of its common stock, the Company completed an equity offering of 18.4 million newly-issued shares of common stock at $54.50 per share. |
Acquisitions
Consistent with the Company’s historical acquisition strategy, to the extent the Company pursues future acquisitions, the Company intends to focus on businesses with product offerings that provide geographic or product diversification, or expansion into related categories that can be marketed through the Company’s existing distribution channels or provide us with new distribution channels for its existing products, thereby increasing marketing and distribution efficiencies. Furthermore, the Company expects that acquisition candidates would demonstrate a combination of attractive margins, strong cash flow characteristics, category leading positions and products that generate recurring revenue. The Company anticipates that the fragmented nature of the consumer products market will continue to provide opportunities for growth through strategic acquisitions of complementary businesses. However, there can be no assurance that the Company will complete an acquisition in any given year or that any such acquisition will be significant or successful. The Company will only pursue a candidate when it is deemed to be fiscally prudent and that meets the Company’s acquisition criteria. The Company anticipates that any future acquisitions would be financed through any combination of cash on hand, operating cash flow, availability under its existing credit facilities and new capital market offerings.
2015 Activity
On November 2, 2015, the Company acquired Jostens, which is a market-leading, iconic brand and trusted partner to schools and students nationwide that provides a product portfolio of high quality yearbooks, class and championship rings, caps and gowns, diplomas, and varsity jackets and accessories, among others. The total value of the transaction, including debt repaid, was approximately $1.5 billion, subject to certain adjustments. The Jostens Acquisition is expected to expand the Company’s product offerings and brings customizable production capabilities in printing, jewelry, and apparel. Jostens will be reported in the Company’s Outdoor Solutions segment and is included in the Company’s results of operations from the date of acquisition.
On July 31, 2015, the Company acquired Waddington, a leading manufacturer and marketer of premium disposable tableware for commercial, foodservice and retail markets. The total value of the transaction, including debt repaid, was approximately $1.35 billion, subject to certain adjustments. The Waddington Acquisition is expected to expand to the Company’s product offerings, expand distribution channels, particularly in the business-to-business category, as well as create cross-selling opportunities. Waddington is reported in the Company’s Branded Consumables segment and is included in the Company’s results of operations from the date of acquisition.
45
Table of Contents
During 2015, the Company also completed two small tuck-in acquisitions that by nature were complementary to the Company’s core businesses and from an accounting standpoint were not significant.
2014 Activity
On August 29, 2014, the Company completed the acquisition of Rexair Holdings, Inc. (“Rexair”), a global provider of premium vacuum cleaning systems sold primarily under the Rainbow® brand name (the “Rexair Acquisition”). The total value of the transaction, including debt assumed and repaid, was approximately $349 million. Rexair is reported in the Company’s Consumer Solutions segment and is included in the Company’s results of operations from the date of acquisition.
During 2014, the Company completed two other tuck-in acquisitions that by nature were complementary to the Company’s core businesses and from an accounting standpoint were not significant.
2013 Activity
On October 3, 2013, the Company acquired Yankee Candle Investments LLC (“Yankee Candle”), a leading specialty-branded premium scented candle company (the “YCC Acquisition”). The total value of the YCC Acquisition, including debt assumed and/or repaid, was approximately $1.8 billion. Yankee Candle is reported in the Company’s Branded Consumables segment and is included in the Company’s results of operations from October 3, 2013.
During 2013, the Company completed one other tuck-in acquisition that by nature was complementary to the Company’s core businesses and from an accounting standpoint was not significant.
Pending Merger
On December 14, 2015, the Company and Newell Rubbermaid Inc. (“Newell Rubbermaid”) announced that they had entered into an Agreement and Plan of Merger (the “Merger Agreement”). Newell Rubbermaid is a global marketer of consumer and commercial products. Under the Merger Agreement each common share of the Company will be exchanged for 0.862 of a share of common stock of Newell Rubbermaid and $21 dollars in cash. The transaction is expected to close in the second quarter of 2016. Under certain terms specified in the Merger Agreement, the Company or Newell Rubbermaid may terminate the Merger Agreement and, as a result, either party may be required to pay a termination fee of varying amounts. In the event all other closing conditions are satisfied but Newell Rubbermaid is unable to obtain its committed financing or alternative investment grade financing, then, in certain circumstances, either party may terminate the Merger Agreement, and in connection with such termination, Newell Rubbermaid will be required to pay Jarden a cash termination fee equal to $900 million. If the Merger Agreement is terminated due to Jarden or Newell entering into a definitive agreement for a superior proposal, Jarden or Newell, as applicable, will be required to pay the other a cash termination fee equal to $385 million. If the Merger Agreement is terminated due to (i) a failure to obtain the necessary Jarden stockholder approval, but Newell stockholders have approved the issuance of the stock consideration, then Jarden will reimburse Newell for up to $100 million of Newel Rubbermaid fees and expenses or (ii) a failure to obtain the necessary Newell stockholder approval, but Jarden stockholders have approved the adoption of the Merger Agreement, then Newell will reimburse Jarden for up to $100 million of Jarden fees and expenses. Upon consummation, the Company’s outstanding common stock will cease to trade. Unless otherwise indicated, the consolidated financial statements and related notes pertain to the Company as a stand-alone entity and do not reflect the impact of the pending merger with Newell Rubbermaid.
46
Table of Contents
Venezuela Operations
Prior to March 31, 2015, the Company included the results of its Venezuelan operations in its consolidated financial statements using the consolidation method of accounting. Venezuelan exchange control regulations have become increasingly restrictive and have resulted in an other-than-temporary lack of exchangeability between the Venezuelan Bolivar and U.S. dollar, and have restricted our Venezuelan operations’ ability to pay obligations denominated in U.S. dollars, as well as pay dividends. These exchange regulations, combined with certain Venezuelan regulations, limit the Company’s ability to rationalize its manufacturing platform to a level that would allow the Company to maintain a sustainable production level that is commensurate with the declining demand resulting from the deteriorating macroeconomic conditions in Venezuela. Furthermore, the Venezuelan government imposes price restrictions that prohibit the Company from pricing its products at acceptable levels. As such, effective March 31, 2015, the Company began reporting the results of its Venezuelan operations using the cost method of accounting. As a result, during the three months ended March 31, 2015, the Company recorded charges of $60.6 million related to the deconsolidation of the Company’s subsidiaries operating in Venezuela (the “Venezuela-related charges”) that include in part, charges for the remeasurement of net monetary assets and the impairment of long-lived assets (discussed hereafter). The Venezuela-related charges are recorded in selling, general and administrative expenses (“SG&A”).
On February 10, 2015, the Venezuelan government established a new foreign exchange system, the Marginal Currency System (“SIMADI”). Furthermore, in February 2015 shortly after establishment of SIMADI, the SICAD-II program was eliminated. As such, the Company determined it would be most appropriate to remeasure the net monetary assets of the Company’s subsidiaries operating in Venezuela at the SIMADI exchange rate, as this was the Company’s expected settlement rate. The SIMADI exchange rate was approximately 193 Bolivars per U.S. dollar at March 31, 2015. As such, due to the change to the SIMADI exchange rate, during the three months ended March 31, 2015, the Company recorded a foreign exchange-related charge of $13.0 million related to the write-down of net monetary assets due to this remeasurement. This charge is included in the aforementioned Venezuela-related charges. Furthermore, as a result of the continued foreign exchange restrictions, combined with the unfavorable macroeconomic conditions in Venezuela, the Company recorded a $37.3 million impairment charge on property, plant and equipment that were previously recorded at historical cost. This charge is included in the aforementioned Venezuela-related charges.
Up until December 31, 2014, the financial statements of the Company’s subsidiaries operating in Venezuela were remeasured at and reflected in the Company’s consolidated financial statements at the CENCOEX official exchange rate of 6.30 Bolivars per U.S. dollar. Due to the evolving foreign exchange control environment in Venezuela and additional experience with the various foreign exchange mechanisms, specifically SICAD and SICAD-II, as of December 31, 2014, the Company determined it would be most appropriate to remeasure the financial statements of the Company’s subsidiaries operating in Venezuela at the SICAD-II exchange rate of 50.0 Bolivars per U.S. dollar. As a result of the change to the SICAD-II exchange rate, the results of operations for 2014 includes a charge of $151 million related to the write-down of net monetary assets due to this remeasurement. This charge is included in SG&A.
In February 2013, the Venezuelan government devalued the Bolivar relative to the U.S. dollar. As a result, the Company recorded $29.0 million of Venezuela-related charges during 2013, which are almost entirely comprised of a non-cash charge related to the write-down of monetary assets due to the change in the official exchange rate. These charges are included in SG&A.
47
Table of Contents
Consolidated Results of Operations
| Years Ended December 31, | ||||||||||||
| (in millions) |
2015 | 2014 | 2013 | |||||||||
| Net sales |
$ | 8,603.9 | $ | 8,287.1 | $ | 7,355.9 | ||||||
| Cost of sales |
5,912.0 | 5,654.2 | 5,241.2 | |||||||||
|
|
|
|
|
|
|
|||||||
| Gross profit |
2,691.9 | 2,632.9 | 2,114.7 | |||||||||
| Selling, general and administrative expenses |
2,021.3 | 1,960.0 | 1,519.8 | |||||||||
| Restructuring costs, net |
12.1 | 7.7 | 22.0 | |||||||||
| Impairment of goodwill, intangibles and other assets |
150.8 | 25.4 | — | |||||||||
|
|
|
|
|
|
|
|||||||
| Operating earnings |
507.7 | 639.8 | 572.9 | |||||||||
| Interest expense, net |
226.1 | 210.3 | 195.4 | |||||||||
| Loss on early extinguishment of debt |
— | 56.7 | 25.9 | |||||||||
|
|
|
|
|
|
|
|||||||
| Income before taxes |
281.6 | 372.8 | 351.6 | |||||||||
| Income tax provision |
135.1 | 130.3 | 147.7 | |||||||||
|
|
|
|
|
|
|
|||||||
| Net income |
$ | 146.5 | $ | 242.5 | $ | 203.9 | ||||||
|
|
|
|
|
|
|
|||||||
Results of Operations—Comparing 2015 to 2014
| Net Sales | Operating Earnings (Loss) |
|||||||||||||||
| Years Ended December 31, | ||||||||||||||||
| (in millions) |
2015 | 2014 | 2015 | 2014 | ||||||||||||
| Branded Consumables |
$ | 3,338.6 | $ | 2,993.6 | $ | 460.3 | $ | 395.3 | ||||||||
| Consumer Solutions |
2,167.1 | 2,211.6 | 273.6 | 329.6 | ||||||||||||
| Outdoor Solutions |
2,736.6 | 2,739.2 | 34.1 | 193.4 | ||||||||||||
| Process Solutions |
452.4 | 427.5 | 47.8 | 39.8 | ||||||||||||
| Corporate |
— | — | (308.1 | ) | (318.3 | ) | ||||||||||
| Intercompany eliminations |
(90.8 | ) | (84.8 | ) | — | — | ||||||||||
|
|
|
|
|
|
|
|
|
|||||||||
| $ | 8,603.9 | $ | 8,287.1 | $ | 507.7 | $ | 639.8 | |||||||||
|
|
|
|
|
|
|
|
|
|||||||||
| Note: | Changes in net sales on a currency-neutral basis that are presented hereafter are provided to enhance visibility of the underlying operations by excluding the impact of foreign currency translation on period-over-period changes. |
Net Sales
Net sales for 2015 increased $317 million, or 3.8%, to $8.6 billion versus the same prior year period. Excluding the impact of the Jostens, Rexair and Waddington acquisitions (approximately 6%), as well as the negative impact of the Company’s deconsolidated Venezuelan operations and certain exited product categories (approximately 2%), net sales on a currency-neutral basis increased approximately 5%, primarily due to increased demand in certain product categories both domestically and internationally, particularly in Europe and Latin America, expanded product offerings, increased demand at major retailers and increased sell-through in certain product categories, partially offset by weakness in other product categories and the impact of unfavorable weather conditions. Unfavorable foreign currency translation accounted for a decrease in net sales of approximately 5%.
Net sales in the Branded Consumables segment increased $345 million, or 11.5%. Excluding the impact of the Waddington Acquisition (approximately 12%), net sales on a currency-neutral basis increased approximately 5%, primarily due to increased sales of certain product categories in the safety and security and Yankee Candle
48
Table of Contents
businesses, largely due to increased sales in Europe and expanded product offerings and increased demand at certain mass market retailers, as well as an increase in international sales in certain products in the baby care and home care businesses in part due to new product offerings, promotional strategies and expanded distribution in certain countries. This increase was partially offset by weakness in certain other product categories, in part due to the timing of seasonal sales, unfavorable weather conditions for certain product categories and exited product categories. Additionally, mandatory smoke alarm regulations in France favorably affected product demand. Unfavorable foreign currency translation accounted for a decrease in net sales of approximately 5%.
Net sales in the Consumer Solutions segment decreased $44.5 million, or 2.0%. Excluding the impact of the Rexair Acquisition (approximately 4%), as well as the negative impact of the Company’s deconsolidated Venezuelan operations and certain exited product categories (approximately 7%), net sales on a currency-neutral basis increased approximately 7%. The increase is primarily due to increased demand internationally, primarily in Europe and Latin America, which contributed to an increase in net sales of approximately 5%, largely due to expanded product offerings in the small appliance category and increased point of sale. Domestic net sales contributed to an increase in net sales of approximately 2%, largely due to increased orders in the small appliance category at certain mass market retailers. Unfavorable foreign currency translation accounted for a decrease in net sales of approximately 6%.
Net sales in the Outdoor Solutions segment decreased $2.6 million, or 0.1%. Excluding the impact of the Jostens Acquisition (approximately 3%), net sales on a currency-neutral basis increased approximately 3%, largely due to increased net sales in the camping and outdoor, fishing and winter sports businesses. This increase is primarily due to increased demand domestically at certain mass market, sporting goods and specialty retailers, expanded product offerings and increased demand internationally, largely in Europe. Unfavorable foreign currency translation accounted for a decrease in net sales of approximately 6%.
Net sales in the Process Solutions segment increased 5.8% on a period-over-period basis, primarily due to increased coinage sales.
Cost of Sales
Cost of sales for 2015 increased $258 million, or 4.6%, to $5.9 billion versus the prior year. The increase was primarily due to increased sales (approximately $628 million), in part due to acquisitions (approximately $355 million), inclusive of a charge related to a purchase accounting adjustment mostly due to the Waddington and Jostens acquisitions for the elimination of manufacturer’s profit in inventory (approximately $37 million), partially offset by the Company’s Venezuelan operations (approximately $64 million) and favorable foreign currency translation (approximately $340 million). Cost of sales as a percentage of net sales for 2015 and 2014 was 68.7% and 68.2%, respectively (68.3% and 67.9% for 2015 and 2014, respectively, excluding the charge for the elimination of manufacturer’s profit in inventory).
Selling, General and Administrative Costs
SG&A for 2015 increased $61.3 million, or 3.1%, to $2.0 billion versus the prior year. The change is primarily due to the impact of acquisitions (approximately $122 million), an increase in stock-based compensation (approximately $82 million) and a gain on the sale of certain assets (approximately $39 million) recorded in 2014, partially offset by a decrease in Venezuela-related charges (approximately $90 million) and favorable foreign currency translation (approximately $95 million). During the fourth quarter of 2015, the Company recognized approximately $78 million of cumulative stock-based compensation costs related to certain restricted stock awards where compensation expense was not previously recognized as the achievement of the performance targets was not deemed probable.
49
Table of Contents
Operating Earnings
Operating earnings for 2015 in the Branded Consumables segment increased $65.0 million, or 16.4%, versus the prior year, primarily due to the Waddington Acquisition, an increase in gross profit (approximately $26 million), primarily due to the gross profit impact of improved margins and a decrease in the impairment of goodwill, intangibles and other assets (approximately $9 million), partially offset by the purchase accounting adjustment for the elimination of manufacturer’s profit in inventory (approximately $18 million) related to the Waddington Acquisition. Operating earnings for 2015 in the Consumer Solutions segment decreased $56.0 million, or 17%, versus the same prior year period, primarily due to a decrease in gross profit (approximately $56 million), primarily due to the Company’s Venezuela operations, and the gross margin impact of lower sales and slightly lower margins, partially offset by the favorable gross margin impact of the Rexair Acquisition. Additionally, the impact on SG&A due to the Rexair Acquisition was essentially offset by a gain on the sale of an Asian Manufacturing facility recorded in 2014 (approximately $39 million). Operating earnings for 2015 in the Outdoor Solutions segment decreased $159 million, or 82.4%, versus the same prior year period, primarily due to an increase in the impairment of goodwill, intangible and other assets (approximately $136 million), a decrease in gross profit excluding Jostens (approximately $37 million), primarily due to the gross margin impact of lower sales and the purchase accounting adjustment for the elimination of manufacturer’s profit in inventory (approximately $16 million) related to the Jostens Acquisition, partially offset by a decrease in SG&A (approximately $28 million) excluding Jostens. Operating earnings for 2015 in the Process Solutions increased $8.0 million, or 20.1%, versus the same prior year period, primarily due to an increase in gross profit.
Impairment Charges
For 2015, the Company recorded $151 million of non-cash charges related to the impairment of goodwill, intangible and other assets. In the fourth quarter of 2015, the Company’s annual impairment test, in connection with certain fourth quarter triggering events, resulted in a non-cash charge of $145 million to reflect impairment of goodwill and intangible assets. Of this charge, $119 million related to the impairment of goodwill in the Company’s Outdoor Solutions segment. The impairment charge was recorded within the winter sports business. The impairment was due to a decrease in the fair value of forecasted cash flows, reflecting the continued deterioration of revenues and margins in the business. The Company also recorded a non-cash charge of $26.4 million within the Outdoor Solutions segment relating to certain tradenames primarily associated with this segment’s winter sports business. The impairment was due to a decrease in the fair value of forecasted cash flows, primarily resulting from the deterioration of revenues and margins related to these tradenames.
Interest Expense
Net interest expense increased $15.8 million to $226 million for 2015 versus the prior year, primarily due to higher average debt levels versus the prior year.
Income Taxes
The Company’s reported tax rate 2015 and 2014 was 48.0% and 35.0%, respectively. The difference from the statutory tax rate to the reported tax rate for 2015 results principally from the tax charge related to the impairment of goodwill (approximately $30.9 million) and the U.S. tax expense related to the taxation of foreign income and potential tax exposures (approximately $7.9 million). There is no difference from the statutory tax rate to the reported tax rate for 2014 due to the offsetting effect of differences resulting from the U.S. tax expense related to the taxation of foreign income, state tax and the remeasurement of the Company’s operations in Venezuela.
Net Income
Net income for 2015 decreased $96.0 million to $147 million versus the prior year. For 2015 and 2014, earnings per diluted share were $0.72 and $1.28, respectively. The decrease in net income was in part due to the increase in the impairment of goodwill, intangibles and other assets (approximately $125 million) and the
50
Table of Contents
aforementioned increase in stock-based compensation costs (approximately $82 million), partially offset by the decrease in Venezuela-related charges (approximately $90 million) and a decrease in the loss on the extinguishment of debt (approximately $57 million).
Results of Operations—Comparing 2014 to 2013
| Net Sales | Operating Earnings (Loss) |
|||||||||||||||
| Years Ended December 31, | ||||||||||||||||
| (in millions) |
2014 | 2013 | 2014 | 2013 | ||||||||||||
| Branded Consumables |
$ | 2,993.6 | $ | 2,266.6 | $ | 395.3 | $ | 253.5 | ||||||||
| Consumer Solutions |
2,211.6 | 2,040.0 | 329.6 | 270.0 | ||||||||||||
| Outdoor Solutions |
2,739.2 | 2,724.4 | 193.4 | 196.1 | ||||||||||||
| Process Solutions |
427.5 | 403.6 | 39.8 | 40.4 | ||||||||||||
| Corporate |
— | — | (318.3 | ) | (187.1 | ) | ||||||||||
| Intercompany eliminations |
(84.8 | ) | (78.7 | ) | — | — | ||||||||||
|
|
|
|
|
|
|
|
|
|||||||||
| $ | 8,287.1 | $ | 7,355.9 | $ | 639.8 | $ | 572.9 | |||||||||
|
|
|
|
|
|
|
|
|
|||||||||
| Note: | Changes in net sales on a currency-neutral basis that are presented hereafter are provided to enhance visibility of the underlying operations by excluding the impact of foreign currency translation on period-over-period changes. |
Net Sales
Net sales for 2014 increased $931 million, or 12.7%, to $8.3 billion versus the prior year. Excluding the impact of the YCC Acquisition and the Rexair Acquisition (approximately 8%), net sales on a currency-neutral basis increased approximately 6%, primarily due to increased demand and sell-through in certain product categories, favorable weather conditions and increased seasonal demand for certain product categories, expanded product offerings and increased demand internationally in certain product categories, partially offset by lower seasonal demand and weakness in certain other product categories. Unfavorable foreign currency translation accounted for a decrease in net sales of approximately 1%.
Net sales in the Branded Consumables segment increased $727 million, or 32.1%. Excluding the impact of the YCC Acquisition (approximately 24%), net sales on a currency-neutral basis increased approximately 9%, primarily due to increased sales in certain product categories in the home care, leisure and entertainment and safety and security businesses, including the food preservation category, primarily due to increased point of sale and product demand; the firebuilding category whose sales were positively affected by favorable weather conditions during the first quarter of 2014 and increased seasonal demand; the safety and security category whose sales increased sales in certain products in part due to increased demand at certain mass market retailers; and increased seasonal demand in the Yankee Candle business. Unfavorable foreign currency translation accounted for a decrease in net sales of approximately 1%.
Net sales in the Consumer Solutions segment increased $172 million, or 8.4%. Excluding the impact of the Rexair Acquisition (approximately 2%), net sales on a currency-neutral basis increased approximately 8%. The increase is primarily due to increased demand internationally, primarily in Latin America, which contributed to an increase in net sales of approximately 7%, largely due to expanded product offerings in the small appliance category, increased point of sale and expanded distribution and an increase in domestic net sales, which contributed to an increase in net sales of approximately 1%, largely due to increased orders in certain small appliance and home environment product categories at certain mass market retailers. Unfavorable foreign currency translation accounted for a decrease in net sales of approximately 2%.
51
Table of Contents
Net sales in the Outdoor Solutions segment increased $14.8 million, or 0.5%. Net sales on a currency-neutral basis increased approximately 2%. Net sales in the apparel, camping and outdoor and fishing businesses provided an increase in net sales of approximately 3%. The increase is primarily due to increased demand at certain mass market retailers, favorable weather conditions in certain regions and increased demand internationally in certain businesses, primarily in Asia and Europe, due in part to improved point of sale, new product offerings and improved economic conditions in certain regions. This increase was partially offset by decreased sales in certain other businesses, primarily the winter sports business, largely due to lower seasonal demand in certain winter sports categories, the timing of sales and weakness in certain product categories. Unfavorable foreign currency translation accounted for a decrease in net sales of approximately 1%.
Net sales in the Process Solutions segment increased 5.9% on a period-over-period basis, primarily due to increased sales within each of its business units.
Cost of Sales
Cost of sales for 2014 increased $413 million, or 7.9%, to $5.6 billion versus the prior year. The increase was primarily due to increased sales (approximately $295 million) and the YCC Acquisition, partially offset by the cost of sales impact of improved margins (approximately $105 million) and favorable foreign currency translation (approximately $69 million). Cost of sales as a percentage of net sales for 2014 and 2013 was 68.2% and 71.3%, respectively (67.9% and 70.0% for 2014 and 2013, respectively, excluding the charge for the elimination of manufacturer’s profit in inventory). The improvement is in part due to product mix, which is largely due to the impact of the YCC Acquisition.
Selling, General and Administrative Costs
SG&A for 2014 increased $440 million, or 29.0%, to $2.0 billion versus the prior year. The change is primarily due to the impact of the YCC Acquisition, an increase in Venezuela foreign exchange-related charges (approximately $146 million), an increase in acquisition-related and other costs (approximately $32 million) and an increase in marketing and product development costs (approximately $23 million) related to the Company’s investment in brand equity, partially offset by a decrease in stock-based compensation (approximately $46 million). Favorable foreign currency translation (approximately $23 million) was essentially offset by other items.
Operating Earnings
Operating earnings for 2014 in the Branded Consumables segment increased $142 million, or 56.0%, versus the prior year, primarily due to the YCC Acquisition, an increase in gross profit (approximately $130 million), mostly due to the gross profit impact of higher sales and the period-over-period decrease in the purchase accounting adjustment for the elimination of manufacturer’s profit in inventory (approximately $80 million), partially offset by an increase in SG&A (approximately $43 million) and an increase in the charges recorded related to the impairment of intangible assets ($14 million). Operating earnings for 2014 in the Consumer Solutions segment increased $59.6 million, or 22.1%, versus the prior year, primarily due to an increase in gross profit (approximately $40 million), mostly due to the gross profit impact of higher sales and improved gross margins, and a gain on the sale of an Asian manufacturing facility (approximately $39 million), partially offset by an increase in SG&A (approximately $19 million). Operating earnings for 2014 in the Outdoor Solutions segment decreased $2.7 million, or 1.4%, versus the prior year, primarily due to an increase in SG&A (approximately $4 million), partially offset by an increase in gross profit, primarily due to the gross profit impact of higher sales. The increase in the charges recorded related to the impairment of intangible assets ($10 million) were essentially offset by a decrease in restructuring costs. Operating earnings for 2014 in the Process Solutions segment decreased $0.6 million, or 1.5%, versus the prior year, mostly due to the increase in the charges recorded related to the impairment of intangible assets.
52
Table of Contents
Impairment Charges
In the fourth quarter of 2014, the Company’s annual impairment test, in connection with certain fourth quarter triggering events, resulted in non-cash charges to reflect impairment of intangible assets related to certain of the Company’s tradenames. The impairment charges were allocated to the Company’s reporting segments as follows:
| (in millions) |
2014 | |||
| Impairment of intangibles |
||||
| Branded Consumables |
$ | 13.9 | ||
| Consumer Solutions |
0.7 | |||
| Outdoor Solutions |
9.9 | |||
| Process Solutions |
0.9 | |||
|
|
|
|||
| $ | 25.4 | |||
|
|
|
|||
In the Branded Consumables segment, the impairment charge recorded relates to certain tradenames primarily associated with this segment’s home care and safety and security businesses. The impairment was due to a decrease in the fair value of forecasted cash flows, primarily resulting from the deterioration of revenues and margins related to these tradenames. In the Outdoor Solutions segment, the impairment charge recorded relates primarily to certain tradenames within this segment’s team sports and winter sports business, primarily a result of the deterioration of revenues and margins related to these tradenames.
Interest Expense
Net interest expense increased $14.9 million to $210 million for 2014 versus the prior year, primarily due to higher average debt levels versus the prior year.
Income Taxes
The Company’s reported tax rate for 2014 and 2013 was 35.0% and 42.1%, respectively. There is no difference from the statutory tax rate to the reported tax rate for 2014 due to the offsetting effect of differences resulting from the U.S. tax expense related to the taxation of foreign income, state tax and the remeasurement of the Company’s operations in Venezuela. The difference from the statutory tax rate to the reported tax rate for 2013 results principally due to the currency devaluation in Venezuela and from the translation of U.S. dollar denominated net assets in Venezuela and the tax effects of non-deductible compensation expense.
Net Income
Net income for 2014 increased $38.6 million to $243 million versus the prior year. For 2014 and 2013, earnings per diluted share were $1.28 and $1.18, respectively. The increase in net income was in part due to the YCC Acquisition, the gross profit impact of higher sales and a decrease in the purchase accounting adjustment for the elimination of manufacturer’s profit in inventory (approximately $66 million), partially offset by an increase in Venezuela foreign exchange-related charges (approximately $151 million), an increase in net acquisition-related and other costs (approximately $23 million) and an increase in the loss on early extinguishment of debt ($24 million).
53
Table of Contents
Reconciliation of Non-GAAP measure
Organic net sales growth is a non-GAAP measure of net sales growth excluding the impacts of foreign exchange, certain acquisitions and exited businesses from year-over-year comparisons. The Company believes this measure provides investors with a more complete understanding of the underlying sales trends by providing net sales on a consistent basis. Organic net sales growth is also one of the measures used by management to analyze operating performance. The following table provides a reconciliation of organic net sales growth to the comparable GAAP measure of net sales growth for 2015, 2015 and 2013.
| Years ended December 31 |
||||||||||||
| 2015 | 2014 | 2013 | ||||||||||
| Reconciliation of Non-GAAP measure |
||||||||||||
| Net sales growth |
3.8 | % | 12.7 | % | 9.9 | % | ||||||
| Foreign exchange impacts |
5.5 | % | 1.4 | % | 1.7 | % | ||||||
| (Acquisitions)/exited businesses and other, net |
(4.5 | )% | (8.3 | )% | (7.2 | )% | ||||||
|
|
|
|
|
|
|
|||||||
| Organic net sales growth |
4.8 | % | 5.8 | % | 4.4 | % | ||||||
|
|
|
|
|
|
|
|||||||
Financial Condition, Liquidity and Capital Resources
LIQUIDITY
At December 31, 2015 and 2014, the Company had cash and cash equivalents of $1.3 billion and $1.2 billion, respectively. The Company believes that its cash and cash equivalents, cash generated from operations and the availability under the Facility, the securitization facility and the credit facilities of certain foreign subsidiaries as of December 31, 2015 provide sufficient liquidity to support working capital requirements, planned capital expenditures, debt obligations, completion of current and future restructuring and acquisition-related integration programs and pension plan contribution requirements for the foreseeable future, as well as fund the potential repurchase of shares of the Company’s common stock under the Company’s existing stock repurchase program (the “Stock Repurchase Program”).
As of December 31, 2015, the amount of cash held by the Company’s non-U.S. subsidiaries was approximately $401 million, of which approximately $396 million is considered to be indefinitely reinvested overseas, such that no provision for U.S. federal and state income taxes has been made in the Company’s consolidated statements of operations. If these funds are needed for the Company’s operations in the U.S., any distribution of these non-U.S. earnings may be subject to both U.S. federal and state income taxes, as adjusted for non-U.S. tax credits, if any, and withholding taxes payable to the various non-U.S. countries. However, the Company does not have any current needs or foreseeable plans other than to indefinitely reinvest these funds within our non-U.S. subsidiaries.
Cash Flows from Operating Activities
Net cash provided by operating activities was $685 million and $627 million for 2015 and 2014, respectively. The change is in part due to improved operating results, partially offset by unfavorable working capital changes, in part due to comparatively higher seasonal inventory levels in certain businesses, in part due to the timing of purchases and sales for both comparable periods, as inventory levels at December 31, 2015, excluding the impact of the acquisitions, were approximately 4% higher than the comparable prior year-end. Additionally, the cash flow from operating activities for 2014 was negatively affected by approximately $42 million of make-whole interest paid. Additionally, cash provided by operating activities was negatively affected by the period-over-period increase in acquisition-related and other costs (approximately $63 million).
Net cash provided by operating activities was $627 million and $669 million for 2014 and 2013, respectively. The change is due in part to a period-over-period increase in cash paid for taxes (approximately $51 million), the change in the adjustment for excess tax benefits from stock-based compensation (approximately $26 million), as well as the period-over-period increase in make-whole interest related to the extinguishment of debt (approximately $30 million), partially offset by the impact of higher sales.
54
Table of Contents
Cash Flows from Financing Activities
Net cash provided by financing activities was $2.6 billion and $265 million for 2015 and 2014, respectively. The change is primarily due to the period-over-period change in the issuance/repurchase of common stock, net (approximately $1.6 billion) and the increase in the proceeds from the issuance of long-term debt in excess of payments on long-term debt (approximately $818 million), partially offset by the period-over-period decrease in the net change in short-term debt (approximately $60 million).
Net cash provided by financing activities was $265 million and $1.4 billion for 2014 and 2013, respectively. The change is primarily due to the period-over-period change in the issuance/repurchase of common stock, net (approximately $736 million), the decrease in the proceeds from the issuance of long-term debt in excess of payments on long-term debt (approximately $349 million) and the period-over-period decrease in the net change in short-term debt (approximately $77 million).
Cash Flows from Investing Activities
Net cash used in investing activities for 2015 and 2014 was $3.1 billion and $711 million, respectively. Cash used for the acquisition of businesses, net of cash acquired for 2015 increased approximately $2.4 billion versus the prior year. Cash provided by other investing activities increased approximately $26 million versus the same prior year period, primarily due to proceeds received during 2015 related to the sale of a facility during December 2014. For 2015, capital expenditures were $215 million versus $202 million for the prior year.
Net cash used in investing activities for 2014 and 2013 was $711 million and $2.0 billion, respectively. Cash used for the acquisition of businesses, net of cash acquired for 2014 decreased approximately $1.3 billion versus the prior year. For 2014, capital expenditures were $202 million versus $211 million for the prior year.
CAPITAL RESOURCES
In October 2015, pursuant to a public offering of its common stock, the Company completed an equity offering of 10.0 million newly-issued shares of common stock at $49.00 per share. The net proceeds to the Company, after the payment of underwriting discounts and expenses of the offering, were approximately $477 million. The proceeds were used to fund a portion of the Jostens Acquisition.
In October 2015, the Company borrowed $200 million under the Facility under its existing senior secured term loan A facility that matures in 2019 and bears interest at LIBOR plus a 175 basis point spread. The proceeds were used to fund a portion of the Jostens Acquisition.
In October 2015, the Company completed the sale of $300 million in aggregate principal amount of 5% senior notes that mature in November 2023, in a private offering to qualified institutional buyers pursuant to Rule 144A under the Securities Act and to certain persons outside of the U.S. pursuant to Regulation S under the Securities Act and received net proceeds of approximately $296 million, after deducting fees and expenses. These notes are subject to similar restrictive and financial covenants as the Company’s Senior Notes. The proceeds were used to fund a portion of the Jostens Acquisition.
In July 2015, pursuant to a public offering of its common stock, the Company completed a public offering of 18.4 million newly-issued shares of common stock at $54.50 per share. The net proceeds to the Company, after the payment of underwriting discounts and other expenses of the offering, were approximately $971 million. The net proceeds were used to fund a portion of the Waddington Acquisition.
In July 2015, the Company borrowed $900 million under the Facility, which is comprised of $300 million under the existing senior secured term loan B1 facility that matures in 2020 and bears interest at LIBOR plus a 275 basis point spread; and $600 million under a new senior secured term loan B2 facility that matures in 2022 and bears interest at LIBOR plus a 275 basis point spread. The proceeds were used, in part, to fund a portion of the Waddington Acquisition.
55
Table of Contents
At December 31, 2015, there was no amount outstanding under the Company’s $250 million senior secured revolving credit facility (the “Revolver”) that matures in 2019. The Revolver bears interest at certain selected rates, including LIBOR plus a basis point spread. At December 31, 2015, commitment fee on unused balances was 0.35% per annum.
The Company maintains a $500 million receivables purchase agreement (the “Securitization Facility”) that matures in October 2016. At December 31, 2015, the borrowing rate margin and the unused line fee on the Securitization Facility were 0.80% and 0.40% per annum, respectively. At December 31, 2015, the Securitization Facility had outstanding borrowings totaling $489 million.
At December 31, 2015, net availability under the Revolver and the Securitization Facility was approximately $204 million, after deducting approximately $57 million of outstanding standby and commercial letters of credit.
Certain domestic and foreign subsidiaries of the Company maintain working capital lines of credit with their respective local financial institutions for use in operating activities. At December 31, 2015, the aggregate amount available under these lines of credit totaled approximately $88 million.
The Company was not in default of any of its debt covenants at December 31, 2015.
During 2015, 2014 and 2013, the Company repurchased approximately 1.9 million, 5.2 million and 8.4 million shares, respectively, of its common stock under the Stock Repurchase Program valued at approximately $90 million, $208 million and $250 million, respectively. At December 31, 2015, approximately $202 million remains available under the Stock Repurchase Program.
Contractual Obligations and Commercial Commitments
The following table includes aggregate information about the Company’s contractual obligations as of December 31, 2015 and the periods in which payments are due. Certain of these amounts are not required to be included in its consolidated balance sheets:
| Year(s) | ||||||||||||||||||||
| (in millions) |
Total | 1 | 2-3 | 4-5 | After 5 | |||||||||||||||
| Debt (1) |
$ | 7,121.7 | $ | 718.9 | $ | 2,052.9 | $ | 2,065.9 | $ | 2,284.0 | ||||||||||
| Operating leases |
699.5 | 125.9 | 204.2 | 147.8 | 221.6 | |||||||||||||||
| Unconditional purchase obligations |
234.0 | 109.3 | 92.7 | 32.0 | — | |||||||||||||||
| Other current and non-current obligations |
8.3 | 3.7 | 1.2 | 1.1 | 2.3 | |||||||||||||||
|
|
|
|
|
|
|
|
|
|
|
|||||||||||
| Total |
$ | 8,063.5 | $ | 957.8 | $ | 2,351.0 | $ | 2,246.8 | $ | 2,507.9 | ||||||||||
|
|
|
|
|
|
|
|
|
|
|
|||||||||||
| (1) | These amounts reflect scheduled debt principal payments and the expected future interest expense related to the debt at December 31, 2015 that carries a fixed rate of interest. As of December 31, 2015, approximately $3.2 billion of the Company’s debt is considered fixed-rate debt, by nature or through use of interest rate swaps. As of December 31, 2015, approximately $3.2 billion of the Company’s debt is considered variable-rate debt, by nature or through use of interest rate swaps with a weighted average interest rate of approximately 2.6%. For further information regarding the Company’s debt and interest rate structure, see Note 9 and Note 10 to the consolidated financial statements. |
The table above does not reflect tax reserves and accrued interest thereon of $209 million and $10.2 million, respectively, as the Company cannot reasonably predict the timing of the settlement of the related tax positions beyond 2015. See Note 12 to the consolidated financial statements for additional information on the Company’s unrecognized tax benefits at December 31, 2015.
56
Table of Contents
Commercial commitments, such as standby and commercial letters of credit, are items that the Company could be obligated to pay in the future and are also not included in the above table.
Risk Management
From time to time, the Company enters into derivative transactions to hedge its exposures to interest rate, foreign currency rate and commodity price fluctuations. The Company does not enter into derivative transactions for trading purposes.
Interest Rate Contracts
The Company manages its fixed and floating rate debt mix using interest rate swaps. The Company uses fixed and floating rate swaps to alter its exposure to the impact of changing interest rates on its consolidated results of operations and future cash outflows for interest. Floating rate swaps are used, depending on market conditions, to convert the fixed rates of long-term debt into short-term variable rates. Fixed rate swaps are used to reduce the Company’s risk of the possibility of increased interest costs. Interest rate swap contracts are therefore used by the Company to separate interest rate risk management from the debt funding decision.
Fair Value Hedges
During October 2015, the Company terminated $650 million notional amount of interest rate swaps that exchange a fixed rate of interest for variable rate of interest (LIBOR) plus a basis point spread and received approximately $6 million in net proceeds. These floating rate swaps were designated as fair value hedges against the Company’s 7 1⁄2% senior subordinated notes due 2017. The gain on the termination of these swaps is deferred as a component of these notes and will be amortized over the remaining life of these notes.
Cash Flow Hedges
At December 31, 2015, the Company had $350 million notional amount outstanding in swap agreements that exchange a variable rate of interest (LIBOR) for fixed interest rates over the terms of the agreements and are designated as cash flow hedges of the interest rate risk attributable to forecasted variable interest payments and have maturity dates through June 2020. At December 31, 2015, the weighted average fixed rate of interest on these swaps was approximately 1.9%. The effective portion of the after-tax fair value gains or losses on these swaps is included as a component of accumulated other comprehensive income (“AOCI”).
Foreign Currency Contracts
The Company uses forward foreign currency contracts to mitigate the foreign currency exchange rate exposure on the cash flows related to forecasted inventory purchases and sales and have maturity dates through March 2017. The derivatives used to hedge these forecasted transactions that meet the criteria for hedge accounting are accounted for as cash flow hedges. The effective portion of the gains or losses on these derivatives is deferred as a component of AOCI and is recognized in earnings at the same time that the hedged item affects earnings and is included in the same caption in the statements of operations as the underlying hedged item. At December 31, 2015, the Company had approximately $590 million notional amount outstanding of forward foreign currency contracts that are designated as cash flow hedges of forecasted inventory purchases and sales.
The Company also uses foreign currency contracts, primarily forward foreign currency contracts, to mitigate the foreign currency exposure of certain other foreign currency transactions. At December 31, 2015, the Company had approximately $621 million notional amount outstanding of these foreign currency contracts that are not designated as effective hedges for accounting purposes and have maturity dates through December 2016. Fair market value gains or losses are included in the results of operations and are classified in SG&A.
57
Table of Contents
Commodity Contracts
The Company enters into commodity-based derivatives in order to mitigate the risk that the rising price of these commodities could have on the cost of certain of the Company’s raw materials. These commodity-based derivatives provide the Company with cost certainty, and in certain instances, allow the Company to benefit should the cost of the commodity fall below certain dollar thresholds. At December 31, 2015, the Company had approximately $28 million notional amount outstanding of commodity-based derivatives that are not designated as effective hedges for accounting purposes and have maturity dates through December 2016. Fair market value gains or losses are included in the results of operations and are classified in cost of sales.
The following table presents the fair value of derivative financial instruments as of December 31, 2015:
| (in millions) |
Asset (Liability) |
|||
| Derivatives designated as effective hedges: |
||||
| Cash flow hedges: |
||||
| Interest rate swaps |
$ | (7.4 | ) | |
| Foreign currency contracts |
18.9 | |||
|
|
|
|||
| Subtotal |
11.5 | |||
|
|
|
|||
| Derivatives not designated as effective hedges: |
||||
| Foreign currency contracts |
3.4 | |||
| Commodity contracts |
(8.9 | ) | ||
|
|
|
|||
| Subtotal |
(5.5 | ) | ||
|
|
|
|||
| Total |
$ | 6.0 | ||
|
|
|
|||
Net Investment Hedge
The Company has designated approximately €300 million of the principal balance of its Euro-denominated 3 3⁄4% senior notes due October 2021 as a net investment hedge (the “Hedging Instrument”) of the foreign currency exposure of its net investment in certain Euro-denominated subsidiaries. Foreign currency gains and losses on the Hedging Instrument are included as a component of AOCI. At December 31, 2015, $51.1 million of after-tax deferred gains have been recorded in AOCI.
Significant Accounting Policies and Critical Estimates
The Company’s financial statements are prepared in accordance with generally accepted accounting principles in the United States of America (“GAAP”), which require us to make certain judgments, estimates and assumptions that affect the amounts reported in the financial statements and accompanying notes. The following list of critical accounting policies is not intended to be a comprehensive list of all its accounting policies. The Company’s significant accounting policies are more fully described in Note 1 to the consolidated financial statements. The following represents a summary of the Company’s critical accounting policies, defined as those policies that the Company believes are the most important to the portrayal of its financial condition and results of operations, and/or require management’s significant judgments and/or estimates. In many cases, the accounting treatment for a particular transaction is specifically directed by GAAP with no need for management’s judgment in their application.
Revenue Recognition and Allowance for Product Returns
The Company recognizes revenues at the time of product shipment or delivery, depending upon when title and risk of loss passes, to unaffiliated customers, and when all of the following have occurred: a firm sales agreement is in place, pricing is fixed or determinable, and collection is reasonably assured. Revenue is
58
Table of Contents
recognized as the net amount estimated to be received after deducting estimated amounts for product returns, discounts and allowances. The Company estimates future product returns, discounts and allowances based upon historical return rates and its reasonable judgment.
Revenues from the sale of gift cards are deferred and the revenue is recognized when the gift card is redeemed by the customer or the likelihood of the gift card being redeemed by the customer is remote (“gift card breakage”). Gift card breakage income is recognized in proportion to the actual redemption of gift cards based on the Company’s historical redemption patterns.
Income Taxes
The Company records a valuation allowance to reduce its deferred tax assets to the amount that the Company believes is more likely than not to be realized. While the Company has considered future taxable income and ongoing prudent and feasible tax planning strategies in assessing the need for the valuation allowance, in the event the Company were to determine that it would not be able to realize all or part of its net deferred tax assets in the future, an adjustment to the deferred tax assets would be charged to income in the period such determination was made. Likewise, should the Company determine that it would be able to realize its deferred tax assets in the future in excess of its net recorded amount, an adjustment to the deferred tax assets would increase income in the period such determination was made.
Additionally, the Company recognizes tax benefits for certain tax positions based upon judgments as to whether it is more likely than not that a tax position will be sustained upon examination. The measurement of tax positions that meet the more-likely-than-not recognition threshold are based in part on estimates and assumptions as to the probability of an outcome, along with estimated amounts to be realized upon any settlement. While the Company believes the resulting tax balances at December 31, 2015 and 2014 are fairly stated based upon these estimates, the ultimate resolution of these tax positions could result in favorable or unfavorable adjustments to its consolidated financial statements and such adjustments could be material. See Note 12 to the consolidated financial statements for further information regarding taxes.
Goodwill and Indefinite-Lived Intangibles
The application of the purchase method of accounting for business combinations requires the use of significant estimates and assumptions in determining the fair value of assets acquired and liabilities assumed in order to properly allocate the purchase price. The estimates of the fair value of the assets acquired and liabilities assumed are based upon assumptions believed to be reasonable using established valuation techniques that consider a number of factors and when appropriate, valuations performed by independent third party appraisers.
As a result of acquisitions in current and prior years, the Company has significant intangible assets on its balance sheet that include goodwill and indefinite-lived intangibles (primarily trademarks and tradenames). The Company’s goodwill and indefinite-lived intangibles are tested and reviewed for impairment annually (during the fourth quarter, which coincides with the Company’s planning process), or more frequently if facts and circumstances warrant. The Company uses a qualitative approach to test goodwill for impairment by first assessing qualitative factors to determine whether it is more-likely-than-not that the fair value of a reporting unit is less than its carrying amount as a basis for determining whether it is necessary to perform the two-step goodwill impairment test. The qualitative (“Step 0”) approach, which was only applied to a portion of the Company’s reporting units, assesses various factors including, in part, the macroeconomic environment, industry and market specific conditions, financial performance, operating costs and cost impacts, as well as issues or events specific to the reporting unit. If necessary, the first step (“Step 1”) in the goodwill impairment test involves comparing the fair value of each of its reporting units to the carrying value of those reporting units. If the carrying value of a reporting unit exceeds the fair value of the reporting unit, the Company is required to proceed to the second step. In the second step, the fair value of the reporting unit would be allocated to the assets (including unrecognized intangibles) and liabilities of the reporting unit, with any residual representing the
59
Table of Contents
implied fair value of goodwill. An impairment loss would be recognized if, and to the extent that, the carrying value of goodwill exceeded the implied value. The Company uses a qualitative approach to test indefinite-lived intangible assets for impairment by first assessing qualitative factors to determine whether it is more-likely-than-not that the fair value of an indefinite-lived intangible asset is impaired as a basis for determining whether it is necessary to perform quantitative impairment testing. The Company applied this qualitative approach to select indefinite-lived intangible assets. For other indefinite-lived intangible assets, the Company proceeded directly to quantitative impairment testing.
Both qualitative and quantitative goodwill impairment testing requires significant use of judgment and assumptions, including the identification of reporting units; the assignment of assets and liabilities to reporting units; and the estimation of future cash flows, business growth rates, terminal values and discount rates. The Company uses various valuation methods, such as the discounted cash flow and market multiple methods. The income approach used is the discounted cash flow methodology and is based on five-year cash flow projections. The cash flows projected are analyzed on a “debt-free” basis (before cash payments to equity and interest bearing debt investors) in order to develop an enterprise value from operations for the reporting unit. A provision is also made, based on these projections, for the value of the reporting unit at the end of the forecast period, or terminal value. The present value of the finite-period cash flows and the terminal value are determined using a selected discount rate. The market multiple methodology involves estimating value based on the trading multiples for comparable public companies. Multiples are determined through an analysis of certain publicly traded companies that are selected on the basis of operational and economic similarity with the business operations. Valuation multiples are calculated for the comparable companies based on daily trading prices. A comparative analysis between the reporting unit and the public companies forms the basis for the selection of appropriate risk-adjusted multiples. The comparative analysis incorporates both quantitative and qualitative risk factors which relate to, among other things, the nature of the industry in which the reporting unit and other comparable companies are engaged.
The testing of unamortizable intangibles under established guidelines for impairment also requires significant use of judgment and assumptions (such as cash flow projections, terminal values and discount rates). For impairment testing purposes, the fair value of unamortizable intangibles is determined using the same method which was used for determining the initial value. The first method is the relief from royalty method, which estimates the value of a tradename by discounting the hypothetical avoided royalty payments to their present value over the economic life of the asset. The second method is the excess earnings method, which estimates the value of the intangible asset by quantifying the residual (or excess) cash flows generated by the asset, and discounting those cash flows to the present. The excess earnings methodology requires the application of contributory asset charges. Contributory asset charges typically include assumed payments for the use of working capital, tangible assets and other intangible assets. Changes in forecasted operations and other assumptions could materially affect the estimated fair values. Changes in business conditions could potentially require adjustments to these asset valuations.
As previously disclosed, in the fourth quarter of 2015 and 2014, the Company’s annual impairment test, in connection with certain fourth quarter triggering events, resulted in a non-cash charges of $145 million and $25.4 million, respectively, to reflect impairment of goodwill and intangible assets (see Note 12 to the consolidated financial statements).
While some of the Company’s businesses experienced a revenue decline and decreased profitability in 2015, the Company believes that its long-term growth strategy supports its fair value conclusions. For both goodwill and indefinite-lived intangible assets, the recoverability of these amounts is dependent upon achievement of the Company’s projections and the execution of key initiatives related to revenue growth and improved profitability. As a result of the 2015 annual impairment testing, aside from the impaired reporting unit, the enterprise value of all of the Company’s reporting units undergoing Step 1 analyses exceeded their carrying value by more than 10%; however, changes in business conditions and assumptions could potentially require future adjustments to these asset valuations. Some of the inherent estimates and assumptions used in determining fair value of the
60
Table of Contents
reporting units are outside the control of management, including interest rates, cost of capital, tax rates, our credit ratings, foreign exchange rates, labor inflation, and industry growth. While we believe we have made reasonable estimates and assumptions to calculate the fair value of the reporting unit and other indefinite life intangible assets, it is possible a change could occur. As for all of the Company’s reporting units, if in future years, the reporting unit’s actual results are not consistent with the Company’s estimates and assumptions used to calculate fair value, the Company may be required to perform the second step, which could result in additional material impairments to goodwill. The Company will continue to monitor its reporting units and the indefinite-lived intangible assets. Should projected cash flows or profitability not be achieved, or should actual capital expenditures exceed current plans, estimated fair values could be reduced to below carrying values resulting in material non-cash impairment charges. The reporting units undergoing Step 0 analyses were not deemed to have significant negative qualitative factors that would result in it being more likely than not that the reporting units were impaired. Furthermore, there were no changes from the prior year in any significant assumptions involved in testing goodwill and other indefinite-lived intangible assets that were not impaired that resulted in a material change to the fair value of a reporting unit or an intangible asset. The Company will continue to monitor its reporting units for any triggering events or other signs of impairment.
Other Long-Lived Assets
The Company evaluates the recoverability of long-lived assets, including property, plant and equipment and amortizable intangible assets, whenever events or changes in circumstances indicate that the carrying amount of an asset may not be recoverable. Impairment indicators that could trigger an impairment review include significant underperformance relative to historical or projected future operating results, significant changes in the manner of use of the assets or the strategy for the overall business, significant decreases in the market value of the assets and significant negative industry or economic trends. When the Company determines that the carrying amount of long-lived assets may not be recoverable based upon the existence of one or more of these indicators, the assets are assessed for impairment based on the estimated future undiscounted cash flows expected to result from the use of the asset and its eventual disposition. The cash flows are estimated utilizing various assumptions regarding future revenue and expenses, working capital, and proceeds from disposal. If the carrying amount exceeds the sum of the undiscounted future cash flows, the Company discounts the future cash flows using a discount rate required for a similar investment of like risk and records an impairment charge as the difference between the fair value and the carrying value of the asset group.
Pension and Postretirement Benefit Plans
The Company records annual amounts relating to its pension and postretirement plans based on calculations, which include various actuarial assumptions, including discount rates, assumed rates of return, compensation increases, turnover rates and health care cost trend rates. The Company reviews its actuarial assumptions on an annual basis and makes modifications to the assumptions based on current rates and trends when it is deemed appropriate to do so. The effect of modifications is generally deferred and amortized over future periods. The Company believes that the assumptions utilized in recording its obligations under its plans are reasonable based on its experience, market conditions and the input from its actuaries and investment advisors. The pension and postretirement obligations are measured as of December 31 for 2015 and 2014.
The Company employs a total return investment approach for its pension and postretirement benefit plans whereby a mix of equities and fixed income investments are used to maximize the long-term return of pension and postretirement plan assets. The intent of this strategy is to minimize plan expenses by outperforming plan liabilities over the long run. Risk tolerance is established through careful consideration of plan liabilities, plan funded status, and corporate financial condition. The investment portfolios contain a diversified blend of equity and fixed-income investments. Furthermore, equity investments are diversified across geography and market capitalization through investments in U.S. large-capitalization stocks, U.S. small-capitalization stocks and international securities. Investment risk is measured and monitored on an ongoing basis through annual liability measurements, periodic asset/liability studies and quarterly investment portfolio reviews.
61
Table of Contents
The expected long-term rate of return for plan assets is based upon many factors including expected asset allocations, historical asset returns, current and expected future market conditions, risk and active management premiums. The prospective target asset allocation percentage for the pension plans is approximately 25% – 40% for equity securities, approximately 20% – 40% for fixed-income investments and approximately 25% – 45% for other securities. At December 31, 2015, the domestic plan assets were allocated as follows: Equities: approximately 30% and Other Investments (alternative investments, fixed-income securities, cash and other): approximately 70%.
For 2015, 2014 and 2013, the actual return (loss) on plan assets for the Company’s U.S. pension plan assets was approximately ($14) million, $28 million and $19 million, respectively, versus an expected return on plan assets of approximately $20 million, $18 million and $17 million, respectively. The actual amount of future contributions will depend, in part, on long-term actual return on assets and future discount rates. Pension contributions for 2016 are estimated to be approximately $6 million, compared to approximately $19 million in 2015.
The weighted average expected return on plan assets assumption for 2015 was approximately 7.1% for the Company’s pension plans. The weighted average discount rate at the 2015 measurement date used to measure the pension and postretirement benefit obligations was approximately 4.3%. A one percentage point increase in the discount rate at the 2015 measurement date would decrease the pension plans’ projected benefit obligation by approximately $74 million.
The healthcare cost trend rates used in valuing the Company’s postretirement benefit obligation are established based upon actual healthcare cost trends and consultation with actuaries and benefit providers. At the 2015 measurement date, the current weighted average healthcare cost trend rate assumption was approximately 6.7%. The current healthcare cost trend rate gradually decreases to an ultimate healthcare cost trend rate of 4.5%. A one percentage point change in assumed healthcare cost trend rates would not have a material effect on the postretirement benefit obligation or the service and interest cost components of postretirement benefit costs.
Product Liability
As a consumer goods manufacturer and distributor, the Company faces the risk of product liability and related costs for substantial money damages, product recall actions and higher than anticipated rates of warranty returns or other returns of goods. Each year the Company sets its product liability insurance program, which is an occurrence-based program, based on current and historical claims experience and the availability and cost of related insurance.
Product liabilities are based on estimates (which include actuarial determinations made by an independent actuarial consultant as to liability exposure, taking into account prior experience, number of claims and other relevant factors); thus, the Company’s ultimate liability may exceed or be less than the amounts accrued. The methods of making such estimates and establishing the resulting liability are reviewed on a regular basis and any adjustments resulting therefrom are reflected in current operating results.
Product Warranty Costs
The Company recognizes warranty costs based on an estimate of amounts required to meet future warranty obligations arising as part of the sale of its products. The Company accrues an estimated liability at the time of a product sale based on historical claim rates applied to current period sales, as well as any information applicable to current product sales that may indicate a deviation from such historical claim rate trends.
62
Table of Contents
Stock-Based Compensation
The fair value of stock options is determined using the Black-Scholes option-pricing. The fair value of the market-based restricted stock awards is determined using a Monte Carlo simulation embedded in a lattice model, and for all other restricted stock awards the fair value is based on the closing price of the Company’s common stock on the date of grant. The determination of the fair value of the Company’s stock option awards and restricted stock awards is based on a variety of factors including, but not limited to, the Company’s common stock price, expected stock price volatility over the expected life of awards, and actual and projected exercise behavior. Additionally, the Company estimates forfeitures for stock options and restricted stock awards at the grant date of the award based on historical experience and estimates are adjusted as necessary if actual forfeitures differ from these estimates. Certain performance awards require management’s judgment as to whether performance targets will be achieved.
Compensation costs for stock-based awards reflects the number of awards expected to vest and is ultimately adjusted in future periods to reflect the actual number of vested awards. Compensation costs for awards with performance conditions is only recognized if and when it becomes probable that the performance condition will be achieved. The probability of vesting is reassessed each reporting period and the compensation costs is adjusted based on this probability assessment. The cumulative effect on current and prior periods of a change in the estimated number of shares for which the requisite service is expected to be or has been rendered is recognized in compensation cost in the period of the change.
Contingencies
The Company is involved in various legal disputes and other legal proceedings that arise from time to time in the ordinary course of business. In addition, the Company or various of its subsidiaries have been identified by the United States Environmental Protection Agency or a state environmental agency as a Potentially Responsible Party pursuant to the federal Superfund Act and/or state Superfund laws comparable to the federal law at various sites. Based on currently available information, the Company does not believe that the disposition of any of the legal or environmental disputes the Company or its subsidiaries are currently involved in will have a material adverse effect on the consolidated financial condition, results of operations or cash flows of the Company. It is possible, that as additional information becomes available, the impact on the Company of an adverse determination could have a different effect.
New and Pending Accounting Pronouncements
During 2015, 2014 and 2013, the Company adopted various accounting standards. A description of these standards and their effect on the consolidated financial statements are described in Note 2 to the consolidated financial statements.
Pending standards and their estimated effect on the Company’s consolidated financial statements are described in Note 2 to the consolidated financial statements.
Forward-Looking Statements
The Private Securities Litigation Reform Act of 1995 provides a safe harbor for forward-looking statements made by or on behalf of the Company. The Company may from time to time make written or oral statements that are “forward-looking,” including statements contained in this report and other filings with the SEC and in reports to its stockholders. Such forward-looking statements include the Company’s proposed combination with Newell Rubbermaid, earnings per share, adjusted diluted earnings per share, expected or estimated revenue, meeting financial goals, the outlook for the Company’s markets and the demand for its products, estimated sales, segment earnings, net interest expense, income tax provision, restructuring and other charges, cash flows from operations, consistent profitable growth, free cash flow, future revenues and gross operating and EBITDA margin
63
Table of Contents
improvement requirement and expansion, organic net sales growth, performance trends, bank leverage ratio, the success of new product introductions, growth in costs and expenses, the impact of commodities, currencies, and transportation costs and the Company’s ability to manage its risk in these areas, repurchase of shares of common stock from time to time under the Company’s stock repurchase program, our ability to raise new debt, and the impact of acquisitions, divestitures, restructurings and other unusual items, including the Company’s ability to successfully integrate and obtain the anticipated results and synergies from its consummated acquisitions. These statements are made on the basis of management’s views and assumptions as of the time the statements are made and the Company undertakes no obligation to update these statements. There can be no assurance, however, that its expectations will necessarily come to pass. Significant factors affecting these expectations are set forth under Item 1A. — Risk Factors of this Annual Report on Form 10-K for the fiscal year ended December 31, 2015.
Item 7A. Quantitative and Qualitative Disclosures About Market Risk
In general, business enterprises can be exposed to market risks including fluctuations in interest rates, foreign currency exchange rates and certain commodity prices, and that can affect the cost of operating, investing and financing under those conditions. The Company believes it has moderate exposure to these risks. The Company assesses market risk based on changes in interest rates, foreign currency rates and commodity prices utilizing a sensitivity analysis that measures the potential loss in earnings, fair values and cash flows based on a hypothetical 10% change in these rates and prices.
The Company is exposed to interest rate risk on its variable rate debt and price risk on its fixed rate debt. As such, the Company monitors the interest rate environment and uses interest rate swap agreements to manage its interest rate risk and price risk by balancing its exposure to fixed and variable interest rates while attempting to minimize interest costs. As of December 31, 2015, approximately $3.2 billion of the Company’s debt carries a variable rate of interest. The remainder of the debt (approximately $3.2 billion) carries a fixed rate of interest either by nature or through the use of interest rate swaps. Based upon the Company’s debt structure at December 31, 2015, a hypothetical 10% change in these interest rates would change interest expense by approximately $9 million and the fair values of fixed rate debt by approximately $60 million.
While the Company transacts business predominantly in U.S. dollars and most of its revenues are collected in U.S. dollars, a substantial portion of the Company’s operating costs are denominated in other currencies, such as the Brazilian Real, British Pound, Canadian dollar, Chinese Renminbi, European Euro, Japanese Yen and Mexican Peso. Changes in the relation of these and other currencies to the U.S. dollar will affect Company’s sales and profitability and could result in exchange losses. For 2015, approximately 35% of the Company’s sales were denominated in foreign currencies, the most significant of which were: European Euro—approximately 17%; and Canadian dollar—approximately 5%. The primary purpose of the Company’s foreign currency hedging activities is to mitigate the foreign currency exchange rate exposure on the cash flows related to forecasted inventory purchases and sales. A hypothetical 10% change in foreign currency exchange rates would not have a material effect on foreign currency gains and losses related to the foreign currency derivatives or the net fair value of the Company’s foreign currency derivatives.
The Company is exposed to the price risk that the rising cost of commodities has on certain of its raw materials. As such, the Company monitors the commodities markets and from time to time the Company enters into commodity-based derivatives in order to mitigate the impact that the rising price of these commodities has on the cost of certain of the Company’s raw materials. A hypothetical 10% change in the commodity prices underlying the derivatives would not have a material effect on the fair value commodity derivatives and the related gains and losses included in the Company’s results of operations.
The Company is exposed to credit loss in the event of non-performance by the counterparties to its derivative financial instruments, all of which are highly rated institutions; however, the Company does not anticipate non-performance by such counterparties.
The Company does not enter into derivative financial instruments for trading purposes.
64
Table of Contents
| Item 8. | Financial Statements and Supplementary Data |
CONSOLIDATED STATEMENTS OF OPERATIONS
(In millions, except per share amounts)
| Years Ended December 31, | ||||||||||||
| 2015 | 2014 | 2013 | ||||||||||
| Net sales |
$ | 8,603.9 | $ | 8,287.1 | $ | 7,355.9 | ||||||
| Cost of sales |
5,912.0 | 5,654.2 | 5,241.2 | |||||||||
|
|
|
|
|
|
|
|||||||
| Gross profit |
2,691.9 | 2,632.9 | 2,114.7 | |||||||||
| Selling, general and administrative expenses |
2,021.3 | 1,960.0 | 1,519.8 | |||||||||
| Restructuring costs, net |
12.1 | 7.7 | 22.0 | |||||||||
| Impairment of goodwill, intangibles and other assets |
150.8 | 25.4 | — | |||||||||
|
|
|
|
|
|
|
|||||||
| Operating earnings |
507.7 | 639.8 | 572.9 | |||||||||
| Interest expense, net |
226.1 | 210.3 | 195.4 | |||||||||
| Loss on early extinguishment of debt |
— | 56.7 | 25.9 | |||||||||
|
|
|
|
|
|
|
|||||||
| Income before taxes |
281.6 | 372.8 | 351.6 | |||||||||
| Income tax provision |
135.1 | 130.3 | 147.7 | |||||||||
|
|
|
|
|
|
|
|||||||
| Net income |
$ | 146.5 | $ | 242.5 | $ | 203.9 | ||||||
|
|
|
|
|
|
|
|||||||
| Earnings per share: |
||||||||||||
| Basic |
$ | 0.75 | $ | 1.31 | $ | 1.20 | ||||||
| Diluted |
$ | 0.72 | $ | 1.28 | $ | 1.18 | ||||||
| Weighted average shares outstanding: |
||||||||||||
| Basic |
195.8 | 185.3 | 170.6 | |||||||||
| Diluted |
204.5 | 189.8 | 172.5 | |||||||||
The accompanying notes are an integral part of the consolidated financial statements.
65
Table of Contents
CONSOLIDATED STATEMENTS OF COMPREHENSIVE INCOME
(In millions, except per share amounts)
| Years Ended December 31, | ||||||||||||
| 2015 | 2014 | 2013 | ||||||||||
| Comprehensive income (loss): |
||||||||||||
| Net income |
$ | 146.5 | $ | 242.5 | $ | 203.9 | ||||||
| Other comprehensive income, before tax: |
||||||||||||
| Cumulative translation adjustment |
(173.4 | ) | (113.4 | ) | (31.3 | ) | ||||||
| Derivative financial instruments |
2.7 | 18.4 | 4.6 | |||||||||
| Accrued benefit cost |
0.3 | (12.5 | ) | 38.3 | ||||||||
| Unrealized loss on investment |
— | (0.4 | ) | — | ||||||||
|
|
|
|
|
|
|
|||||||
| Total other comprehensive income (loss), before tax |
(170.4 | ) | (107.9 | ) | 11.6 | |||||||
| Income tax (provision) benefit related to other comprehensive income (loss) |
(11.0 | ) | (14.2 | ) | (16.8 | ) | ||||||
|
|
|
|
|
|
|
|||||||
| Comprehensive income (loss) |
$ | (34.9 | ) | $ | 120.4 | $ | 198.7 | |||||
|
|
|
|
|
|
|
|||||||
The accompanying notes are an integral part of the consolidated financial statements.
66
Table of Contents
CONSOLIDATED BALANCE SHEETS
(In millions, except per share amounts)
| As of December 31, | ||||||||
| 2015 | 2014 | |||||||
| Assets: |
||||||||
| Cash and cash equivalents |
$ | 1,298.4 | $ | 1,164.8 | ||||
| Accounts receivable, net of allowances of $145.5 in 2015, $119.7 in 2014 |
1,310.4 | 1,277.9 | ||||||
| Inventories |
1,783.2 | 1,504.7 | ||||||
| Deferred taxes on income |
— | 166.2 | ||||||
| Prepaid expenses and other current assets |
262.3 | 204.4 | ||||||
|
|
|
|
|
|||||
| Total current assets |
4,654.3 | 4,318.0 | ||||||
|
|
|
|
|
|||||
| Property, plant and equipment, net |
1,074.4 | 849.9 | ||||||
| Goodwill |
4,260.4 | 2,880.2 | ||||||
| Intangibles, net |
4,094.6 | 2,598.5 | ||||||
| Other assets |
209.4 | 152.7 | ||||||
|
|
|
|
|
|||||
| Total assets |
$ | 14,293.1 | $ | 10,799.3 | ||||
|
|
|
|
|
|||||
| Liabilities: |
||||||||
| Short-term debt and current portion of long-term debt |
$ | 593.5 | $ | 594.9 | ||||
| Accounts payable |
813.2 | 809.9 | ||||||
| Accrued salaries, wages and employee benefits |
206.4 | 195.1 | ||||||
| Other current liabilities |
662.2 | 477.3 | ||||||
|
|
|
|
|
|||||
| Total current liabilities |
2,275.3 | 2,077.2 | ||||||
|
|
|
|
|
|||||
| Long-term debt |
5,787.5 | 4,464.0 | ||||||
| Deferred taxes on income |
1,603.5 | 1,222.1 | ||||||
| Other non-current liabilities |
574.5 | 426.7 | ||||||
|
|
|
|
|
|||||
| Total liabilities |
10,240.8 | 8,190.0 | ||||||
|
|
|
|
|
|||||
| Commitments and contingencies (see Note 11) |
— | — | ||||||
| Stockholders’ equity: |
||||||||
| Preferred stock ($0.01 par value, 5.0 shares authorized, no shares issued and outstanding at December 31, 2015 and 2014) |
— | — | ||||||
| Common stock ($0.01 par value, 500 and 300 shares authorized at December 31, 2015 and December 31, 2014, respectively, 261.7 and 233.3 shares issued at December 31, 2015 and December 31, 2014, respectively) |
2.6 | 2.3 | ||||||
| Additional paid-in capital |
4,094.2 | 2,515.5 | ||||||
| Retained earnings |
1,431.2 | 1,284.7 | ||||||
| Accumulated other comprehensive income (loss) |
(362.1 | ) | (180.7 | ) | ||||
| Less: Treasury stock (41.9 and 41.3 shares, at cost, at December 31, 2015 and 2014, respectively) |
(1,113.6 | ) | (1,012.5 | ) | ||||
|
|
|
|
|
|||||
| Total stockholders’ equity |
4,052.3 | 2,609.3 | ||||||
|
|
|
|
|
|||||
| Total liabilities and stockholders’ equity |
$ | 14,293.1 | $ | 10,799.3 | ||||
|
|
|
|
|
|||||
The accompanying notes are an integral part of the consolidated financial statements.
67
Table of Contents
CONSOLIDATED STATEMENTS OF CASH FLOWS
(In millions)
| Years Ended December 31, | ||||||||||||
| 2015 | 2014 | 2013 | ||||||||||
| Cash flows from operating activities: |
||||||||||||
| Net income |
$ | 146.5 | $ | 242.5 | $ | 203.9 | ||||||
| Reconciliation of net income to net cash provided by operating activities: |
||||||||||||
| Depreciation and amortization |
245.4 | 191.1 | 165.9 | |||||||||
| Impairment of goodwill, intangibles and other assets |
150.8 | 25.4 | — | |||||||||
| Venezuela-related charges |
60.6 | 150.9 | 27.4 | |||||||||
| Deferred income taxes |
(56.7 | ) | (53.5 | ) | (10.7 | ) | ||||||
| Stock-based compensation |
131.3 | 49.7 | 95.8 | |||||||||
| Excess tax benefits from stock-based compensation |
(25.9 | ) | (38.0 | ) | (11.6 | ) | ||||||
| Other |
113.5 | 43.5 | 10.7 | |||||||||
| Changes in operating assets and liabilities, net of effects from acquisitions: |
||||||||||||
| Accounts receivable |
28.0 | (109.1 | ) | 16.9 | ||||||||
| Inventory |
(117.9 | ) | (75.6 | ) | 103.9 | |||||||
| Accounts payable |
(53.0 | ) | 160.0 | 4.5 | ||||||||
| Accrued salaries, wages and employee benefits |
(8.4 | ) | 1.8 | (17.4 | ) | |||||||
| Other assets and liabilities |
70.5 | 38.3 | 79.2 | |||||||||
|
|
|
|
|
|
|
|||||||
| Net cash provided by operating activities |
684.7 | 627.0 | 668.5 | |||||||||
|
|
|
|
|
|
|
|||||||
| Cash flows from financing activities: |
||||||||||||
| Net change in short-term debt |
(34.0 | ) | 25.4 | 102.0 | ||||||||
| Proceeds from issuance of long-term debt |
1,389.8 | 1,764.8 | 1,273.4 | |||||||||
| Payments on long-term debt |
(54.7 | ) | (1,248.0 | ) | (407.7 | ) | ||||||
| Proceeds from issuance of stock, net of transaction fees |
1,449.6 | — | 748.3 | |||||||||
| Repurchase of common stock and shares tendered for taxes |
(134.1 | ) | (285.3 | ) | (297.8 | ) | ||||||
| Debt issuance costs |
(17.7 | ) | (21.4 | ) | (19.8 | ) | ||||||
| Excess tax benefits from stock-based compensation |
25.9 | 38.0 | 11.6 | |||||||||
| Other, net |
(6.1 | ) | (8.0 | ) | (4.4 | ) | ||||||
|
|
|
|
|
|
|
|||||||
| Net cash provided by financing activities |
2,618.7 | 265.5 | 1,405.6 | |||||||||
|
|
|
|
|
|
|
|||||||
| Cash flows from investing activities: |
||||||||||||
| Additions to property, plant and equipment |
(214.6 | ) | (202.1 | ) | (211.0 | ) | ||||||
| Acquisition of businesses, net of cash acquired |
(2,937.1 | ) | (517.4 | ) | (1,820.1 | ) | ||||||
| Other |
34.6 | 8.0 | 73.7 | |||||||||
|
|
|
|
|
|
|
|||||||
| Net cash used in investing activities |
(3,117.1 | ) | (711.5 | ) | (1,957.4 | ) | ||||||
|
|
|
|
|
|
|
|||||||
| Effect of exchange rate changes on cash and cash equivalents |
(52.7 | ) | (144.7 | ) | (22.3 | ) | ||||||
|
|
|
|
|
|
|
|||||||
| Net increase in cash and cash equivalents |
133.6 | 36.3 | 94.4 | |||||||||
| Cash and cash equivalents at beginning of period |
1,164.8 | 1,128.5 | 1,034.1 | |||||||||
|
|
|
|
|
|
|
|||||||
| Cash and cash equivalents at end of period |
$ | 1,298.4 | $ | 1,164.8 | $ | 1,128.5 | ||||||
|
|
|
|
|
|
|
|||||||
| Supplemental cash disclosures: |
||||||||||||
| Taxes paid |
$ | 126.1 | $ | 126.1 | $ | 74.7 | ||||||
| Make-whole interest |
— | 42.3 | 12.3 | |||||||||
| Interest paid |
177.9 | 182.8 | 181.7 | |||||||||
The accompanying notes are an integral part of the consolidated financial statements.
68
Table of Contents
CONSOLIDATED STATEMENTS OF CHANGES IN STOCKHOLDERS’ EQUITY
(in millions)
|
Common Stock |
Treasury Stock |
Additional Paid-In Capital |
Retained Earnings |
Accumulated Other Comprehensive Income (Loss) |
Total | |||||||||||||||||||||||||||
| Shares | Amount | Shares | Amount | |||||||||||||||||||||||||||||
| Balance, December 31, 2012 |
208.6 | $ | 2.1 | (32.5 | ) | $ | (562.4 | ) | $ | 1,535.0 | $ | 838.3 | $ | (53.4 | ) | $ | 1,759.6 | |||||||||||||||
| Comprehensive income |
— | — | — | — | — | 203.9 | (5.2 | ) | 198.7 | |||||||||||||||||||||||
| Proceeds from issuance of common stock, net |
24.7 | 0.2 | — | — | 744.7 | — | — | 744.9 | ||||||||||||||||||||||||
| Restricted stock awards, stock options exercised and stock plan purchases |
— | — | 3.0 | 48.0 | (30.7 | ) | — | — | 17.3 | |||||||||||||||||||||||
| Restricted stock awards cancelled and shares tendered |
— | — | (2.0 | ) | (52.7 | ) | 4.9 | — | — | (47.8 | ) | |||||||||||||||||||||
| Stock-based compensation |
— | — | — | — | 95.8 | — | — | 95.8 | ||||||||||||||||||||||||
| Shares repurchased |
— | — | (8.4 | ) | (250.0 | ) | — | — | — | (250.0 | ) | |||||||||||||||||||||
| Equity component of convertible notes, net of tax and other |
— | — | — | — | 31.2 | — | — | 31.2 | ||||||||||||||||||||||||
|
|
|
|
|
|
|
|
|
|
|
|
|
|
|
|
|
|||||||||||||||||
| Balance, December 31, 2013 |
233.3 | $ | 2.3 | (39.9 | ) | $ | (817.1 | ) | $ | 2,380.9 | $ | 1,042.2 | $ | (58.6 | ) | $ | 2,549.7 | |||||||||||||||
| Comprehensive income |
— | — | — | — | — | 242.5 | (122.1 | ) | 120.4 | |||||||||||||||||||||||
| Restricted stock awards, stock options exercised and stock plan purchases |
— | — | 5.9 | 94.7 | (88.0 | ) | — | — | 6.7 | |||||||||||||||||||||||
| Restricted stock awards cancelled and shares tendered |
— | — | (2.1 | ) | (82.3 | ) | 40.5 | — | — | (41.8 | ) | |||||||||||||||||||||
| Stock-based compensation |
— | — | — | — | 49.7 | — | — | 49.7 | ||||||||||||||||||||||||
| Shares repurchased |
— | — | (5.2 | ) | (207.8 | ) | — | — | — | (207.8 | ) | |||||||||||||||||||||
| Equity component of convertible notes, net of tax and other |
— | — | — | — | 132.4 | — | — | 132.4 | ||||||||||||||||||||||||
|
|
|
|
|
|
|
|
|
|
|
|
|
|
|
|
|
|||||||||||||||||
| Balance, December 31, 2014 |
233.3 | $ | 2.3 | (41.3 | ) | $ | (1,012.5 | ) | $ | 2,515.5 | $ | 1,284.7 | $ | (180.7 | ) | $ | 2,609.3 | |||||||||||||||
| Comprehensive income |
— | — | — | — | — | 146.5 | (181.4 | ) | (34.9 | ) | ||||||||||||||||||||||
| Proceeds from issuance of common stock, net |
28.4 | 0.3 | — | — | 1,447.5 | — | — | 1,447.8 | ||||||||||||||||||||||||
| Restricted stock awards, stock options exercised and stock plan purchases |
— | — | 2.6 | 42.3 | (35.1 | ) | — | — | 7.2 | |||||||||||||||||||||||
| Restricted stock awards cancelled and shares tendered |
— | — | (1.3 | ) | (53.2 | ) | 35.0 | — | — | (18.2 | ) | |||||||||||||||||||||
| Stock-based compensation |
— | — | — | — | 131.3 | — | — | 131.3 | ||||||||||||||||||||||||
| Shares repurchased |
— | — | (1.9 | ) | (90.2 | ) | — | — | — | (90.2 | ) | |||||||||||||||||||||
|
|
|
|
|
|
|
|
|
|
|
|
|
|
|
|
|
|||||||||||||||||
| Balance, December 31, 2015 |
261.7 | $ | 2.6 | (41.9 | ) | $ | (1,113.6 | ) | $ | 4,094.2 | $ | 1,431.2 | $ | (362.1 | ) | $ | 4,052.3 | |||||||||||||||
|
|
|
|
|
|
|
|
|
|
|
|
|
|
|
|
|
|||||||||||||||||
The accompanying notes are an integral part of the consolidated financial statements.
69
Table of Contents
NOTES TO CONSOLIDATED FINANCIAL STATEMENTS
(Dollars in millions, except per share data and unless otherwise indicated)
1. Business and Significant Accounting Policies
Business
Jarden Corporation and its subsidiaries (hereinafter referred to as the “Company” or “Jarden”) is a leading provider of a diverse range of consumer products with a portfolio of over 120 trusted, quality brands sold globally. Jarden operates in three primary business segments through a number of well recognized brands, including: Branded Consumables: Ball®, Bee®, Bernardin®, Bicycle®, Billy Boy®, Crawford®, Diamond®, Envirocooler®, Fiona®, First Alert®, First Essentials®, Hoyle®, Kerr®, Lehigh®, Lifoam®, Lillo®, Loew-Cornell®, Mapa®, NUK®, Pine Mountain®, ProPak®, Quickie®, Spontex®, Tigex®, Waddington ,Yankee Candle® and YOU®; Consumer Solutions: Bionaire®, Crock-Pot®, FoodSaver®, Health o meter®, Holmes®, Mr. Coffee®, Oster®, Patton®, Rival®, Seal-a-Meal®, Sunbeam®, VillaWare® and White Mountain®; and Outdoor Solutions: Abu Garcia®, AeroBed®, Berkley®, Campingaz®, Coleman®, Dalbello®, ExOfficio®, Fenwick®, Greys®, Gulp!®, Hardy®, Invicta®, K2®, Jostens®, Marker®, Marmot®, Mitchell®, Neff®, PENN®, Rawlings®, Ride®, Sevylor®, Shakespeare®, Squadra®, Stearns®, Stren®, Trilene®, Völkl®, Worth® and Zoot®. Our growth strategy is based on introducing new products, as well as on expanding existing product categories, which is supplemented through opportunistically acquiring businesses that reflect our core strategy, often with highly-recognized brands within the categories they serve, innovative products and multi-channel distribution.
Basis of Presentation
The consolidated financial statements include the consolidated accounts of the Company and have been prepared in accordance with generally accepted accounting principles in the United States of America (“GAAP”).
All significant intercompany transactions and balances have been eliminated upon consolidation. Unless otherwise indicated, references in the consolidated financial statements to 2015, 2014 and 2013 are to the Company’s calendar years ended December 31, 2015, 2014 and 2013, respectively.
Certain reclassifications have been made in the Company’s consolidated financial statements of prior years to conform to the current year presentation. These reclassifications have no impact on previously reported net income.
Supplemental Information
Stock-based compensation costs, which are included in selling, general and administrative expenses (“SG&A”), were $131, $49.7 and $95.8 for 2015, 2014 and 2013, respectively.
Interest expense is net of interest income of $2.6, $7.2 and $6.0 for 2015, 2014 and 2013, respectively.
Foreign Operations
The functional currency for most of the Company’s consolidated foreign operations is the local currency. Assets and liabilities are translated at year-end exchange rates, and income and expenses are translated at average exchange rates during the year. Net unrealized exchange adjustments arising on the translation of foreign currency financial statements are reported as cumulative translation adjustments within accumulated other comprehensive income. Foreign currency transaction gains and losses are included in the results of operations and are generally classified in SG&A. Foreign currency transaction losses for 2015, 2014 and 2013 were $0.4, $2.0 and $6.4, respectively.
70
Table of Contents
The U.S. dollar is the functional currency for certain foreign subsidiaries that conduct their business primarily in U.S. dollars. As such, monetary items are translated at current exchange rates, and non-monetary items are translated at historical exchange rates.
Venezuela Operations
Prior to March 31, 2015, the Company included the results of its Venezuelan operations in its consolidated financial statements using the consolidation method of accounting. Venezuelan exchange control regulations have become increasingly restrictive and have resulted in an other-than-temporary lack of exchangeability between the Venezuelan Bolivar and U.S. dollar, and have restricted our Venezuelan operations’ ability to pay obligations denominated in U.S. dollars, as well as pay dividends. These exchange regulations, combined with certain Venezuelan regulations, limit the Company’s ability to rationalize its manufacturing platform to a level that would allow the Company to maintain a sustainable production level that is commensurate with the declining demand resulting from the deteriorating macroeconomic conditions in Venezuela. Furthermore, the Venezuelan government imposes price restrictions that prohibit the Company from pricing its products at acceptable levels. As such, effective March 31, 2015, the Company began reporting the results of its Venezuelan operations using the cost method of accounting. As a result, during the three months ended March 31, 2015, the Company recorded charges of $60.6 related to the deconsolidation of the Company’s subsidiaries operating in Venezuela (the “Venezuela-related charges”) that include in part, charges for the remeasurement of net monetary assets and the impairment of long-lived assets (discussed hereafter). The Venezuela-related charges are recorded in SG&A.
On February 10, 2015, the Venezuelan government established a new foreign exchange system, the Marginal Currency System (“SIMADI”). Furthermore, in February 2015 shortly after establishment of SIMADI, the SICAD-II program was eliminated. As such, the Company determined it would be most appropriate to remeasure the net monetary assets of the Company’s subsidiaries operating in Venezuela at the SIMADI exchange rate, as this was the Company’s expected settlement rate. The SIMADI exchange rate was approximately 193 Bolivars per U.S. dollar at March 31, 2015. As such, due to the change to the SIMADI exchange rate, during the three months ended March 31, 2015, the Company recorded a foreign exchange-related charge of $13.0 related to the write-down of net monetary assets due to this remeasurement. This charge is included in the aforementioned Venezuela-related charges. Furthermore, as a result of the continued foreign exchange restrictions, combined with the unfavorable macroeconomic conditions in Venezuela, the Company recorded a $37.3 impairment charge on property, plant and equipment that were previously recorded at historical cost. This charge is included in the aforementioned Venezuela-related charges.
Up until December 31, 2014, the financial statements of the Company’s subsidiaries operating in Venezuela were remeasured at and reflected in the Company’s consolidated financial statements at the CENCOEX official exchange rate of 6.30 Bolivars per U.S. dollar. Due to the evolving foreign exchange control environment in Venezuela and additional experience with the various foreign exchange mechanisms, specifically SICAD and SICAD-II, as of December 31, 2014, the Company determined it would be most appropriate to remeasure the financial statements of the Company’s subsidiaries operating in Venezuela at the SICAD-II exchange rate of 50.0 Bolivars per U.S. dollar. As a result of the change to the SICAD-II exchange rate, the results of operations for 2014 includes a charge of $151 related to the write-down of net monetary assets due to this remeasurement. This charge is included in SG&A.
In February 2013, the Venezuelan government devalued the Bolivar relative to the U.S. dollar. As a result, the Company recorded $29.0 of Venezuela-related charges during 2013 related to its Venezuela operations, which are almost entirely comprised of a non-cash charge related to the write-down of monetary assets due to the change in the official exchange rate. These charges are included in SG&A.
Use of Estimates
The preparation of the consolidated financial statements in accordance with GAAP requires estimates and assumptions that affect amounts reported and disclosed in the consolidated financial statements and
71
Table of Contents
accompanying notes. Actual results could differ materially from those estimates. Significant accounting estimates and assumptions are used for, but not limited to, the allowance for doubtful accounts; asset impairments; useful lives of tangible and intangible assets; pension and postretirement liabilities; tax valuation allowances and unrecognized tax benefits; reserves for sales returns and allowances; product warranty; product liability; excess and obsolete inventory valuation; stock-based compensation; and litigation and environmental liabilities. These accounting estimates may be adjusted or refined due to changes in the facts and circumstances supporting these accounting estimates. Such changes and refinements are reflected in the consolidated financial statements in the period in which they are made and, if material, their effects are disclosed in the consolidated financial statements.
Concentrations of Credit Risk
Substantially all of the Company’s trade receivables are due from retailers and distributors located throughout Asia, Canada, Europe, Latin America and the United States. Approximately 15%, 15% and 17% of the Company’s consolidated net sales in 2015, 2014 and 2013, respectively, were to a single customer who purchased product from all of the Company’s business segments.
Cash and Cash Equivalents
The Company considers highly liquid investments purchased with an original maturity of three months or less to be cash equivalents.
Accounts Receivable
The Company provides credit, in the normal course of business, to its customers. The Company maintains an allowance for doubtful customer accounts for estimated losses that may result from the inability of the Company’s customers to make required payments. That estimate is based on a variety of factors, including historical collection experience, current economic and market conditions, and a review of the current status of each customer’s trade accounts receivable. The Company charges actual losses when incurred to this allowance.
Leasehold Improvements
Leasehold improvements are recorded at cost less accumulated amortization. Improvements are amortized over the shorter of the remaining lease term (and any renewal period if such a renewal is reasonably assured at inception) or the estimated useful lives of the assets.
Property, Plant and Equipment
Property, plant and equipment are recorded at cost less accumulated depreciation. Maintenance and repair costs are charged to expense as incurred, and expenditures that extend the useful lives of assets are capitalized. The Company reviews property, plant and equipment for impairment whenever events or circumstances indicate that carrying amounts may not be recoverable through future undiscounted cash flows. If the Company concludes that impairment exists, the carrying amount is reduced to fair value.
The Company provides for depreciation primarily using the straight-line method in amounts that allocate the cost of property, plant and equipment over the following ranges of useful lives:
| Buildings and improvements |
5 to 45 years | |||
| Machinery, equipment and tooling (includes capitalized software) |
3 to 25 years | |||
| Furniture and fixtures |
3 to 10 years |
Land is not depreciated.
72
Table of Contents
Goodwill and Intangible Assets
Goodwill and certain intangibles (primarily trademarks and tradenames) are not amortized; however, they are subject to evaluation for impairment using a fair value based test. This evaluation is performed annually, during the fourth quarter or more frequently if facts and circumstances warrant. The Company uses a qualitative approach to test goodwill for impairment by first assessing qualitative factors to determine whether it is more-likely-than-not that the fair value of a reporting unit is less than its carrying amount as a basis for determining whether it is necessary to perform the two-step goodwill impairment test. The Company applied this qualitative approach to select reporting units. For other reporting units, the Company proceeded directly to the first step of goodwill impairment testing. The first step in the goodwill impairment test involves comparing the fair value of each of its reporting units to the carrying value of those reporting units. If the carrying value of a reporting unit exceeds the fair value of the reporting unit, the Company is required to proceed to the second step. In the second step, the fair value of the reporting unit would be allocated to the assets (including unrecognized intangibles) and liabilities of the reporting unit, with any residual representing the implied fair value of goodwill. An impairment loss would be recognized if, and to the extent that, the carrying value of goodwill exceeded the implied value (see Note 6). The Company uses a qualitative approach to test indefinite-lived intangible assets for impairment by first assessing qualitative factors to determine whether it is more-likely-than-not that the fair value of an indefinite-lived intangible asset is impaired as a basis for determining whether it is necessary to perform quantitative impairment testing. The Company applied this qualitative approach to select indefinite-lived intangible assets. For other indefinite-lived intangible assets, the Company proceeded directly to quantitative impairment testing. The Company reviews amortizable intangible assets for impairment whenever events or circumstances indicate that carrying amounts may not be recoverable. If the Company concludes that impairment exists, the carrying amount is reduced to fair value.
Amortization
Deferred debt issue costs are amortized over the term of the related debt. Identifiable intangible assets are recognized apart from goodwill and are amortized over their estimated useful lives, except for identifiable intangible assets with indefinite lives, which are not amortized.
Revenue Recognition
The Company recognizes revenues at the time of product shipment or delivery, depending upon when title and risk of loss passes, to unaffiliated customers, and when all of the following have occurred: a firm sales agreement is in place, pricing is fixed or determinable and collection is reasonably assured. Revenue is recognized as the net amount estimated to be received after deducting estimated amounts for product returns, discounts and allowances. The Company estimates future product returns, discounts and allowances based upon historical return rates and its reasonable judgment. Amounts received from customers in advance to purchase goods and services are recorded as a liability and revenue is not recognized until the goods or services are delivered.
The Company sells gift cards to customers in its retail stores, third-party retail stores and through consumer direct operations. Gift cards do not have an expiration date. At the point of sale of a gift card, the Company records deferred revenue. Gift card revenue is recognized when the gift card is redeemed by the customer or the likelihood of the gift card being redeemed by the customer is remote (“gift card breakage”). Gift card breakage income is recognized in proportion to the actual redemption of gift cards based on the Company’s historical redemption pattern and is included in net sales in the Company’s consolidated statements of operations.
Cost of Sales
The Company’s cost of sales includes the costs of raw materials and finished goods purchases, manufacturing costs and warehouse and distribution costs.
73
Table of Contents
Advertising Costs
Advertising costs consist primarily of ad demo, media placement and promotions, and are expensed as incurred. The amounts charged to advertising and included in SG&A in the consolidated statements of operations for 2015, 2014 and 2013 were $187, $189 and $172, respectively.
Product Liability Reserves
The Company has a self-insurance program for product liability that includes reserves for self-retained losses and certain excess and aggregate risk transfer insurance. The estimated product liability reserve incorporates historical loss experience combined with actuarial evaluation methods, review of significant individual files and the application of risk transfer programs. The Company’s actuarial evaluation methods consider claims incurred, but not reported when determining the product liability reserve.
Product Warranty Costs
The Company recognizes warranty costs based on an estimate of amounts required to meet future warranty obligations arising as a cost of the sale of its products. The Company accrues an estimated liability at the time of a product sale based on historical claim rates applied to current period sales, as well as any information applicable to current product sales that may indicate a deviation from such historical claim rate trends. Warranty reserves are included within “Other current liabilities” and “Other non-current liabilities” in the Company’s consolidated balance sheets.
Sales Incentives and Trade Promotion Allowances
The Company offers various sales incentives and trade promotional programs to its reseller customers from time to time in the normal course of business. These sales incentives and trade promotion programs typically include arrangements known as slotting fees, cooperative advertising and buydowns. These arrangements are recorded as a reduction to net sales in the Company’s consolidated statements of operations.
Income Taxes
Deferred taxes are provided for differences between the financial statement and tax basis of assets and liabilities using enacted tax rates. The Company established a valuation allowance against a portion of the net tax benefit associated with all carryforwards and temporary differences in a prior year, as it was more likely than not that these would not be fully utilized in the available carryforward period. A portion of this valuation allowance remained as of December 31, 2015 and 2014 (see Note 12).
The Company recognizes tax benefits for certain tax positions based upon judgments as to whether it is more likely than not that a tax position will be sustained upon examination. The measurement of tax positions that meet the more-likely-than-not recognition threshold are based in part on estimates and assumptions as to be the probability of an outcome, along with estimated amounts to be realized upon any settlement.
Components of accumulated other comprehensive income (loss) (“AOCI”) are presented net of tax at the applicable statutory rates and are primarily generated domestically.
Disclosures about Fair Value of Financial Instruments and Credit Risk
The carrying values of cash and cash equivalents, accounts receivable, accounts payable and accrued liabilities approximate their fair market values due to the short-term maturities of these instruments. The fair market value (Level 1 measurement) of the Company’s senior notes and senior subordinated notes are based upon quoted market prices. The fair market value (Level 2 measurement) of the Company’s other long-term debt is estimated using interest rates currently available to the Company for debt with similar terms and maturities (see Note 9).
74
Table of Contents
Unless otherwise disclosed in the notes to the consolidated financial statements, the estimated fair value of financial assets and liabilities approximates carrying value.
Financial instruments that potentially subject the Company to credit risk consist primarily of trade receivables and interest-bearing investments. Trade receivable credit risk is limited due to the diversity of the Company’s customers and the Company’s ongoing credit review procedures. Collateral for trade receivables is generally not required. The Company places its interest-bearing cash equivalents with major financial institutions.
The Company is exposed to credit loss in the event of non-performance by the counterparties to its derivative financial instruments, all of which are highly rated financial institutions; however, the Company does not anticipate non-performance by such counterparties.
Fair Value Measurements
GAAP defines three levels of inputs that may be used to measure fair value and requires that the assets or liabilities carried at fair value be disclosed by the input level under which they were valued. The input levels are defined as follows:
Level 1: Quoted market prices in active markets for identical assets and liabilities.
Level 2: Observable inputs other than defined in Level 1, such as quoted prices for similar assets or liabilities; quoted prices in markets that are not active; or other inputs that are observable or can be corroborated by observable market data for substantially the full term of the assets or liabilities.
Level 3: Unobservable inputs that are not corroborated by observable market data.
The following table summarizes assets and liabilities that are measured at fair value on a recurring basis at December 31, 2015 and 2014:
| 2015 | ||||||||||||||||
| Fair Value Asset (Liability) | ||||||||||||||||
| (in millions) |
Level 1 | Level 2 | Level 3 | Total | ||||||||||||
| Derivatives: |
||||||||||||||||
| Assets |
$ | — | $ | 31.9 | $ | — | $ | 31.9 | ||||||||
| Liabilities |
— | (25.9 | ) | — | (25.9 | ) | ||||||||||
| Available-for-sale securities |
— | — | — | — | ||||||||||||
| Contingent consideration |
— | — | (28.7 | ) | (28.7 | ) | ||||||||||
| 2014 | ||||||||||||||||
| Fair Value Asset (Liability) | ||||||||||||||||
| (in millions) |
Level 1 | Level 2 | Level 3 | Total | ||||||||||||
| Derivatives: |
||||||||||||||||
| Assets |
$ | — | $ | 29.3 | $ | — | $ | 29.3 | ||||||||
| Liabilities |
— | (23.5 | ) | — | (23.5 | ) | ||||||||||
| Available-for-sale securities |
— | 1.5 | — | 1.5 | ||||||||||||
| Contingent consideration |
— | — | (32.6 | ) | (32.6 | ) | ||||||||||
Derivative assets and liabilities relate to interest rate swaps, foreign currency contracts and commodity contracts. Fair values are determined by the Company using market prices obtained from independent brokers or determined using valuation models that use as their basis readily observable market data that is actively quoted and can be validated through external sources, including independent pricing services, brokers and market transactions. Available-for-sale securities are valued based on quoted market prices.
75
Table of Contents
The following table summarizes the assets that are measured at Level 3 fair value on a non-recurring basis at December 31, 2015 and 2014:
| (in millions) |
2015 | 2014 | ||||||
| Intangible assets |
$ | 14.9 | $ | 106.7 | ||||
At December 31, 2015 and 2014, goodwill of certain reporting units and certain intangible assets are recorded at fair value based upon the Company’s impairment testing and as circumstances require.
The Company’s goodwill and indefinite-lived intangibles are fair valued using discounted cash flows and market multiple methods. Goodwill impairment testing requires significant use of judgment and assumptions including the identification of reporting units; the assignment of assets and liabilities to reporting units; and the estimation of future cash flows, business growth rates, terminal values and discount rates. The testing of indefinite-lived intangibles under established guidelines for impairment also requires significant use of judgment and assumptions, such as the estimation of cash flow projections, terminal values and discount rates.
The fair value measurement of the contingent consideration obligations arising from acquisitions is based upon Level 3 inputs including, in part, the estimate of future cash flows based upon the likelihood of achieving the various earn-out criteria. Changes in the fair value of the contingent consideration obligations are recorded in SG&A.
Changes in the fair value of the contingent consideration obligations for 2015 and 2014 were as follows:
| (in millions) |
2015 | 2014 | ||||||
| Contingent consideration at January 1, |
$ | 32.6 | $ | 43.0 | ||||
| Acquisitions |
8.1 | 1.4 | ||||||
| Payments |
(6.3 | ) | (9.2 | ) | ||||
| Adjustments and foreign exchange |
(5.7 | ) | (2.6 | ) | ||||
|
|
|
|
|
|||||
| Contingent consideration at December 31, |
$ | 28.7 | $ | 32.6 | ||||
|
|
|
|
|
|||||
Stock-Based Compensation
The Company estimates the fair value of share-based awards on the date of grant, which is generally the date the award is approved by the Board of Directors of the Company (the “Board”) or committee thereof. The fair value of stock options is determined using the Black-Scholes option-pricing model. The fair value of the market-based restricted stock awards is determined using a Monte Carlo simulation embedded in a lattice model, and for all other restricted stock awards, based on the closing price of the Company’s common stock on the date of grant. The determination of the fair value of the Company’s stock option awards and restricted stock awards is based on a variety of factors including, but not limited to, the Company’s common stock price, expected stock price volatility over the expected life of awards, and actual and projected exercise behavior (see Note 13). Additionally, the Company has estimated forfeitures for share-based awards at the dates of grant based on historical experience. The forfeiture estimate is revised as necessary if actual forfeitures differ from these estimates.
The Company issues restricted stock awards whose restrictions lapse upon either the passage of time (service vesting), achieving performance targets, attaining Company common stock price thresholds, or some combination of these restrictions. For those restricted stock awards with only service conditions, the Company recognizes compensation cost on a straight-line basis over the explicit service period. For those restricted stock awards with market conditions, the Company recognizes compensation cost on a straight-line basis over the derived service period unless the market condition is satisfied prior to the end of the derived service period. For performance only awards, the Company recognizes compensation cost on a straight-line basis over the implicit
76
Table of Contents
service period which represents the Company’s best estimates for when the target will be achieved. If it becomes apparent that the original service periods are no longer accurate, the remaining unrecognized compensation cost will be recognized over the revised remaining service periods. For restricted stock awards that contain both service and market or performance vesting conditions, compensation cost is recognized over the shorter of the two conditions if only one of the conditions must be met or the longer of the two conditions if both conditions must be met.
Compensation costs for stock-based awards reflects the number of awards expected to vest and is ultimately adjusted in future periods to reflect the actual number of vested awards. Compensation costs for awards with performance conditions is only recognized if and when it becomes probable that the performance condition will be achieved. The probability of vesting is reassessed each reporting period and the compensation costs is adjusted based on this probability assessment. The cumulative effect on current and prior periods of a change in the estimated number of shares for which the requisite service is expected to be or has been rendered is recognized in compensation cost in the period of the change.
For restricted stock awards that contain performance or market vesting conditions, the Company excludes these awards from diluted earnings per share computations until the end of the reporting period that the contingency is met.
Pension and Postretirement Benefit Plans
The Company records annual amounts relating to its pension and postretirement benefit plans based on calculations which include various actuarial assumptions, including discount rates, assumed rates of return, compensation increases, turnover rates and healthcare cost trend rates. The Company reviews its actuarial assumptions on an annual basis and makes modifications to the assumptions based on current rates and trends when it is deemed appropriate to do so. The effect of modifications is generally recorded or amortized over future service periods. The assumptions utilized in recording its obligations under its pension and postretirement benefit plans are based on its experience, market conditions and input from its actuaries and investment advisors.
Restructuring Costs
Restructuring costs include costs associated with exit or disposal activities, including costs for employee and lease terminations, facility closings or other exit activities.
2. New Accounting Guidance and Adoption of New Accounting Guidance
New Accounting Guidance
In January 2016, the Financial Accounting Standards Board (the “FASB”) issued Accounting Standards Update (“ASU”) No. 2016-01, “Financial Instruments — Overall: Recognition and Measurement of Financial Assets and Financial Liabilities” (“ASU 2016-01”). ASU 2016-01 primarily affects the accounting for equity investments, financial liabilities under the fair value option, and the presentation and disclosure requirements for financial instruments. Additionally, ASU 2016-01 clarifies guidance related to the valuation allowance assessment when recognizing deferred tax assets resulting from unrealized losses on available-for-sale debt securities. ASU 2016-01 will be effective for public business entities in fiscal years beginning after December 15, 2017, including interim periods within those fiscal years. Early adoption is permitted. The Company is assessing the impact that the provisions of ASU 2016-01 will have on the consolidated financial position, results of operations and cash flows of the Company.
In July 2015, the FASB issued ASU No. 2015-11, “Simplifying the Measurement of Inventory” (“ASU 2015-11”). ASU 2015-11 requires that inventory within its scope be measured at the lower of cost and net realizable value (“NRV”). NRV is the estimated selling prices in the ordinary course of business, less reasonably
77
Table of Contents
predictable costs of completion, disposal, and transportation. Subsequent measurement is unchanged for inventory measured using the last in, first out or the retail inventory methods. ASU 2015-11 is effective for fiscal years beginning after December 15, 2016, with early adoption permitted. The Company is assessing the impact that the provisions of ASU 2016-01 will have on the consolidated financial position, results of operations and cash flows of the Company.
In May 2015, the FASB issued ASU No. 2015-07, “Disclosures for Investments in Certain Entities That Calculate Net Asset Value per Share (or Its Equivalent) (“ASU 2015-07”). ASU 2015-07 removes the requirement to categorize within the fair value hierarchy all investments for which fair value is measured using the net asset value per share practical expedient and remove certain related disclosure requirements. ASU 2015-07 is effective for annual periods and for interim periods within those fiscal years, beginning after December 15, 2015. Early adoption is permitted. Since ASU 2015-07 only modifies existing disclosures, the adoption of ASU 2015-07 will not affect the consolidated financial position, results of operations or cash flows of the Company.
In April 2015, the FASB issued ASU No. 2015-03, “Simplifying the Presentation of Debt Issuance Costs” (“ASU 2015-03”). ASU No. 2015-03 changes the presentation of debt issuance costs in financial statements. ASU 2015-03 requires that debt issuance costs related to a recognized debt liability be presented in the balance sheet as a direct deduction from the carrying amount of that debt liability rather than as an asset. ASU 2015-03 is effective for annual periods and for interim periods within those fiscal years, beginning after December 15, 2015. Early adoption is permitted. The Company does not expect the provisions of ASU 2015-03 to have a material effect on its consolidated financial position, results of operations or cash flows.
In February 2015, the FASB issued ASU No. 2015-02, “Amendments to the Consolidation Analysis” (“ASU 2015-02”). ASU 2015-02 affects reporting entities that are required to evaluate whether they should consolidate certain legal entities. Specifically, ASU 2015-02 modifies the evaluation of whether limited partnerships and similar legal entities are variable interest entities or voting interest entities. ASU 2015-02 is effective for annual periods and for interim periods within those fiscal years, beginning after December 15, 2015. Early adoption is permitted. The Company does not expect the provisions of ASU 2015-02 to have a material effect on its consolidated financial position, results of operations or cash flows.
In May 2014, the FASB issued ASU No. 2014-09, “Revenue from Contracts with Customers” (“ASU 2014-09”). ASU 2014-09, which supersedes the most current revenue recognition guidance, is based on the principle that revenue is recognized to depict the transfer of goods or services to customers in an amount that reflects the consideration that an entity expects to be entitled to in exchange for those goods or services. ASU 2014-09 also requires certain disclosures that enable users of the financial statements to understand the nature, amount, timing, and uncertainty of revenue and cash flows arising from contracts with customers. In August 2015, the FASB issued ASU 2015-14, “Revenue from Contracts with Customers: Deferral of the Effective Date” (“ASU 2015-14”). ASU 2015-14 defers the effective date of ASU 2014-09 by one year. As such, ASU 2014-09 is effective for annual reporting periods, including interim periods within that reporting period, beginning after December 15, 2017. Earlier adoption is permitted only as of annual reporting periods beginning after December 15, 2016, including interim reporting periods within that reporting period. The Company is assessing the impact that the provisions of ASU 2014-09 will have on the consolidated financial position, results of operations and cash flows of the Company.
Adoption of New Accounting Guidance
In November 2015, the FASB issued ASU No. 2015-17, “Balance Sheet Classification of Deferred Taxes” (“ASU 2015-17”). ASU 2015-17 requires that all deferred tax assets and liabilities, along with any related valuation allowance, be classified as noncurrent on the balance sheet. ASU 2015-17 is effective for annual periods and for interim periods within those fiscal years, beginning after December 15, 2017 with early adoption permitted. In 2015, the Company early adopted the provisions of ASU 2015-17 for the year ended December 31, 2015 on a prospective basis. As such, prior periods were not retrospectively adjusted.
78
Table of Contents
In April 2014, the FASB issued ASU No. 2014-08, “Reporting Discontinued Operations and Disclosures of Disposals of Components of an Entity” (“ASU 2014-08”). ASU 2014-08 establishes criteria for determining which disposals qualify as discontinued operations and also establishes disclosure requirements for both discontinued operations and material disposals that do not meet the definition of discontinued operations. ASU 2014-08 is effective for annual periods beginning on or after December 15, 2014. The adoption of the provisions of ASU 2014-08 did not have a material effect on the consolidated financial position, results of operations or cash flows of the Company.
3. Acquisitions
2015 Activity
On July 31, 2015, the Company acquired Waddington Group, Inc. (“Waddington”), a leading manufacturer and marketer of premium disposable tableware for commercial, foodservice and retail markets for a purchase price of approximately $712 (the “Waddington Acquisition”). The total value of the transaction, including debt repaid, was approximately $1.35 billion, subject to certain adjustments. The Waddington Acquisition is expected to expand the Company’s product offerings and distribution channels, particularly in the business-to-business category, as well as create cross-selling opportunities. Waddington is reported in the Company’s Branded Consumables segment and is included in the Company’s results of operations from the date of acquisition. The Company’s consolidated statement of operations for 2015 includes approximately $350 of net sales and approximately $32 of operating earnings related to Waddington.
On November 2, 2015, the Company acquired Visant Holding Corp., the parent company of Jostens, Inc. and other entities composing the Jostens business (“Jostens”), which is a market-leading, iconic brand and trusted partner to schools and students nationwide that provides a product portfolio of high quality yearbooks, class and championship rings, caps and gowns, diplomas, and varsity jackets and accessories, among others, for a purchase price of approximately $45 (the “Jostens Acquisition”). The total value of the transaction, including debt repaid, was approximately $1.5 billion, subject to certain adjustments. The Jostens Acquisition is expected to expand the Company’s product offerings and brings customizable production capabilities in printing, jewelry, and apparel. Jostens is reported in the Company’s Outdoor Solutions segment and is included in the Company’s results of operations from the date of acquisition. The Company’s consolidated statement of operations for 2015 includes approximately $96 of net sales and approximately $12 of operating loss related to Jostens.
The excess of the cost of the Waddington Acquisition and Jostens Acquisition over the net of amounts assigned to the fair value of the assets acquired and the liabilities assumed is recorded as goodwill. The Company’s preliminary fair valuation of assets acquired and liabilities assumed, which is subject to further refinement, is based on all available information, including, in part, certain preliminary valuations and other analyses. Based on this preliminary fair valuation, the purchase price is allocated as follows:
| Waddington | Jostens | |||||||
| Purchase Price Allocation (in millions): |
||||||||
| Preliminary value assigned: |
||||||||
| Accounts receivable |
$ | 83.5 | $ | 46.2 | ||||
| Inventories |
140.6 | 113.4 | ||||||
| Other current assets |
20.3 | 41.1 | ||||||
| Property, plant and equipment |
164.2 | 111.6 | ||||||
| Intangible assets |
721.0 | 879.9 | ||||||
| Goodwill |
592.6 | 919.3 | ||||||
| Other assets |
18.9 | 10.4 | ||||||
| Accounts payable |
(36.6 | ) | (23.7 | ) | ||||
| Other current liabilities |
(81.4 | ) | (150.7 | ) | ||||
| Other non-current liabilities |
(1.9 | ) | (102.9 | ) | ||||
| Long-term debt |
(627.3 | ) | (1,499.1 | ) | ||||
| Non-current deferred tax liability |
(282.2 | ) | (300.6 | ) | ||||
|
|
|
|
|
|||||
| Total purchase price, net of cash acquired |
$ | 711.7 | $ | 44.9 | ||||
|
|
|
|
|
|||||
79
Table of Contents
The following unaudited pro forma financial information presents the combined results of operations of the Company, Waddington and Jostens for 2015 and 2014 as if the Waddington Acquisition and Jostens Acquisition (collectively, the “Acquisitions”) had occurred on January 1, 2014. The unaudited pro forma financial information is not intended to represent or be indicative of the Company’s consolidated results of operations or financial condition that would have been reported had the Acquisitions been completed as of January 1, 2014 and should not be taken as indicative of the Company’s future consolidated results of operations or financial condition. Pro forma adjustments are tax-effected at the Company’s estimated statutory tax rates.
| (in millions, except per share data) | 2015 | 2014 | ||||||
| Net sales |
$ | 9,675.2 | $ | 9,703.1 | ||||
| Net income |
178.7 | 332.9 | ||||||
| Earnings per share: |
||||||||
| Basic |
$ | 0.83 | $ | 1.56 | ||||
| Diluted |
$ | 0.81 | $ | 1.53 | ||||
The unaudited pro forma financial information for 2015 and 2014 include $82.9 for the amortization of purchased intangibles from the Acquisitions. The unaudited pro forma financial information for 2014 also includes $131 of non-recurring charges related to the Acquisitions, which are comprised of charges for the fair market value adjustment for manufacturers profit in inventory and other acquisition-related costs.
During 2015, the Company also completed two tuck-in acquisitions that by nature were complementary to the Company’s core businesses and from an accounting standpoint were not significant.
2014 Activity
On August 29, 2014, the Company completed the acquisition of Rexair Holdings, Inc. (“Rexair”), a global provider of premium vacuum cleaning systems sold primarily under the Rainbow® brand name. The total value of the transaction, including debt repaid, was approximately $349. The acquisition of Rexair is expected to expand distribution channels, as well as expand the Company’s current product offerings. Rexair is reported in the Company’s Consumer Solutions segment and is included in the Company’s results of operations from the date of acquisition.
During 2014, the Company completed two other tuck-in acquisitions that by nature were complementary to the Company’s core businesses and from an accounting standpoint were not significant.
2013 Activity
On October 3, 2013, the Company acquired Yankee Candle Investments LLC (“Yankee Candle”), a leading specialty-branded premium scented candle company (the “YCC Acquisition”). The total value of the YCC Acquisition, including debt repaid, was approximately $1.8 billion. Yankee Candle is reported in the Company’s Branded Consumables segment and was included in the Company’s results of operations from October 3, 2013. The Company’s 2013 consolidated statement of operations includes approximately $344 of net sales and approximately $28 of operating earnings related to Yankee Candle.
During 2013, the Company completed one other tuck-in acquisition that by nature was complementary to the Company’s core businesses and from an accounting standpoint was not significant.
Other
For 2015 and 2014 and 2013, cost of sales includes charges of $36.9, $23.4 and $89.8, respectively, for the purchase accounting adjustment for the elimination of manufacturer’s profit in inventory related to acquisitions.
For 2015, 2014 and 2013, SG&A includes $12.6, $7.2 and $2.8, respectively, in transaction costs related to acquisitions.
80
Table of Contents
Pending Merger
On December 14, 2015, the Company and Newell Rubbermaid Inc. (“Newell Rubbermaid”) announced that they had entered into an Agreement and Plan of Merger (the “Merger Agreement”). Newell Rubbermaid is a global marketer of consumer and commercial products. Under the Merger Agreement each common share of the Company will be exchanged for 0.862 of a share of common stock of Newell Rubbermaid and $21 dollars in cash. The transaction is expected to close in the second quarter of 2016. Under certain terms specified in the Merger Agreement, the Company or Newell Rubbermaid may terminate the Merger Agreement and, as a result, either party may be required to pay a termination fee of varying amounts, based upon the facts and circumstances, of up to $900 to the other party. Upon consummation, the Company’s outstanding common shares will cease to trade. Unless otherwise indicated, the consolidated financial statements and related notes pertain to the Company as a stand-alone entity and do not reflect the impact of the pending merger with Newell Rubbermaid.
4. Inventories
Inventories are stated at the lower-of-cost-or-market with cost being determined principally by the first-in, first-out method, and are comprised of the following at December 31, 2015 and 2014:
| (in millions) |
2015 | 2014 | ||||||
| Raw materials and supplies |
$ | 293.0 | $ | 250.0 | ||||
| Work-in-process |
120.6 | 71.0 | ||||||
| Finished goods |
1,369.6 | 1,183.7 | ||||||
|
|
|
|
|
|||||
| Total |
$ | 1,783.2 | $ | 1,504.7 | ||||
|
|
|
|
|
|||||
5. Property, Plant and Equipment
Property, plant and equipment, net, is comprised of the following at December 31, 2015 and 2014:
| (in millions) |
2015 | 2014 | ||||||
| Land |
$ | 62.2 | $ | 62.5 | ||||
| Buildings |
476.8 | 460.1 | ||||||
| Machinery and equipment |
1,650.6 | 1,311.4 | ||||||
| Construction-in-progress |
96.8 | 98.8 | ||||||
|
|
|
|
|
|||||
| 2,286.4 | 1,932.8 | |||||||
| Less: Accumulated depreciation |
(1,212.0 | ) | (1,082.9 | ) | ||||
|
|
|
|
|
|||||
| Total |
$ | 1,074.4 | $ | 849.9 | ||||
|
|
|
|
|
|||||
Depreciation of property, plant and equipment for 2015, 2014 and 2013 was $184, $164 and $144, respectively.
81
Table of Contents
6. Goodwill and Intangibles
Goodwill activity for 2015 and 2014 is as follows:
| December 31, 2015 | ||||||||||||||||||||||||||||
| (in millions) |
Net Book Value at December 31, 2014 |
Additions | Impairment Charge |
Foreign Exchange and Other Adjustments |
Gross Carrying Amount |
Accumulated Impairment Charges |
Net Book Value |
|||||||||||||||||||||
| Goodwill |
||||||||||||||||||||||||||||
| Branded Consumables |
$ | 1,385.1 | $ | 592.6 | $ | — | $ | (5.2 | ) | $ | 2,195.7 | $ | (223.2 | ) | $ | 1,972.5 | ||||||||||||
| Consumer Solutions |
757.7 | — | — | (17.1 | ) | 740.6 | — | 740.6 | ||||||||||||||||||||
| Outdoor Solutions |
715.7 | 936.7 | (119.2 | ) | (7.6 | ) | 1,663.3 | (137.7 | ) | 1,525.6 | ||||||||||||||||||
| Process Solutions |
21.7 | — | — | — | 21.7 | — | 21.7 | |||||||||||||||||||||
|
|
|
|
|
|
|
|
|
|
|
|
|
|
|
|||||||||||||||
| $ | 2,880.2 | $ | 1,529.3 | $ | (119.2 | ) | $ | (29.9 | ) | $ | 4,621.3 | $ | (360.9 | ) | $ | 4,260.4 | ||||||||||||
|
|
|
|
|
|
|
|
|
|
|
|
|
|
|
|||||||||||||||
| December 31, 2014 | ||||||||||||||||||||||||||||
| (in millions) |
Net Book Value at December 31, 2013 |
Additions | Impairment Charge |
Foreign Exchange and Other Adjustments |
Gross Carrying Amount |
Accumulated Impairment Charges |
Net Book Value |
|||||||||||||||||||||
| Goodwill |
||||||||||||||||||||||||||||
| Branded Consumables |
$ | 1,353.8 | $ | 23.0 | $ | — | $ | 8.3 | $ | 1,608.3 | $ | (223.2 | ) | $ | 1,385.1 | |||||||||||||
| Consumer Solutions |
526.3 | 244.5 | — | (13.1 | ) | 757.7 | — | 757.7 | ||||||||||||||||||||
| Outdoor Solutions |
718.5 | — | — | (2.8 | ) | 734.2 | (18.5 | ) | 715.7 | |||||||||||||||||||
| Process Solutions |
21.7 | — | — | — | 21.7 | — | 21.7 | |||||||||||||||||||||
|
|
|
|
|
|
|
|
|
|
|
|
|
|
|
|||||||||||||||
| $ | 2,620.3 | $ | 267.5 | $ | — | $ | (7.6 | ) | $ | 3,121.9 | $ | (241.7 | ) | $ | 2,880.2 | |||||||||||||
|
|
|
|
|
|
|
|
|
|
|
|
|
|
|
|||||||||||||||
In the fourth quarter of 2015, the Company’s impairment test resulted in a non-cash charge of $119 to reflect impairment of goodwill in the Company’s Outdoor Solutions segment. The impairment charge was recorded within the winter sports business. The impairment was due to a decrease in the fair value of forecasted cash flows, reflecting the deterioration of revenues and margins in the business.
Intangibles activity for 2015 and 2014 is as follows:
| (in millions) |
Gross Carrying Amount at December 31, 2014 |
Additions | Impairment Charge |
Accumulated Amortization and Foreign Exchange |
Net Book Value at December 31, 2015 |
Amortization Periods (years) |
||||||||||||||||||
| Intangibles |
||||||||||||||||||||||||
| Patents |
$ | 9.3 | $ | — | $ | — | $ | (5.3 | ) | $ | 4.0 | 12-30 | ||||||||||||
| Manufacturing process and expertise |
65.2 | 34.0 | — | (56.7 | ) | 42.5 | 3-7 | |||||||||||||||||
| Brand names |
23.3 | 2.5 | — | (14.0 | ) | 11.8 | 4-20 | |||||||||||||||||
| Non-compete agreements |
— | 18.4 | — | (1.2 | ) | 17.2 | 3-5 | |||||||||||||||||
| Customer relationships and distributor channels |
549.6 | 1,203.3 | — | (159.6 | ) | 1,593.3 | 10-35 | |||||||||||||||||
| Trademarks and tradenames |
2,131.7 | 357.0 | (26.4 | ) | (36.5 | ) | 2,425.8 | indefinite | ||||||||||||||||
|
|
|
|
|
|
|
|
|
|
|
|||||||||||||||
| $ | 2,779.1 | $ | 1,615.2 | $ | (26.4 | ) | $ | (273.3 | ) | $ | 4,094.6 | |||||||||||||
|
|
|
|
|
|
|
|
|
|
|
|||||||||||||||
82
Table of Contents
| (in millions) |
Gross Carrying Amount at December 31, 2013 |
Additions | Impairment Charge |
Accumulated Amortization and Foreign Exchange |
Net Book Value at December 31, 2014 |
Amortization Periods (years) |
||||||||||||||||||
| Intangibles |
||||||||||||||||||||||||
| Patents |
$ | 9.3 | $ | — | $ | — | $ | (4.5 | ) | $ | 4.8 | 12-30 | ||||||||||||
| Manufacturing process and expertise |
56.2 | 9.0 | — | (45.7 | ) | 19.5 | 3-7 | |||||||||||||||||
| Brand names |
23.3 | — | — | (10.5 | ) | 12.8 | 4-20 | |||||||||||||||||
| Customer relationships and distributor channels |
347.4 | 202.2 | — | (100.6 | ) | 449.0 | 10-35 | |||||||||||||||||
| Trademarks and tradenames |
2,080.9 | 76.2 | (25.4 | ) | (19.3 | ) | 2,112.4 | indefinite | ||||||||||||||||
|
|
|
|
|
|
|
|
|
|
|
|||||||||||||||
| $ | 2,517.1 | $ | 287.4 | $ | (25.4 | ) | $ | (180.6 | ) | $ | 2,598.5 | |||||||||||||
|
|
|
|
|
|
|
|
|
|
|
|||||||||||||||
In the fourth quarter of 2015 and 2014, the Company’s annual impairment test, in connection with certain fourth quarter triggering events, resulted in non-cash charges to reflect impairment of intangible assets related to certain of the Company’s tradenames. The impairment charges were allocated to the Company’s reporting segments as follows:
| (in millions) |
2015 | 2014 | ||||||
| Impairment of intangibles |
||||||||
| Branded Consumables |
$ | — | $ | 13.9 | ||||
| Consumer Solutions |
— | 0.7 | ||||||
| Outdoor Solutions |
26.4 | 9.9 | ||||||
| Process Solutions |
— | 0.9 | ||||||
|
|
|
|
|
|||||
| $ | 26.4 | $ | 25.4 | |||||
|
|
|
|
|
|||||
Impairments – 2015
In the Outdoor Solutions segment, the impairment charge recorded relates to certain tradenames primarily associated with this segment’s winter sports business. The impairment was due to a decrease in the fair value of forecasted cash flows, primarily resulting from the continued deterioration of revenues and margins related to these tradenames.
During 2015, the Company recorded a $5.2 impairment charge related to the impairment of certain other assets. This impairment charge is classified in the consolidated financial statement of operations in impairment of goodwill, intangibles and other assets.
Impairments – 2014
In the Branded Consumables segment, the impairment charge recorded relates to certain tradenames primarily associated with this segment’s home care and safety and security businesses. The impairment was due to a decrease in the fair value of forecasted cash flows, primarily resulting from the deterioration of revenues and margins related to these tradenames. In the Outdoor Solutions segment, the impairment charge recorded relates primarily to certain tradenames within this segment’s team sports and winter sports business, primarily a result of the deterioration of revenues and margins related to these tradenames.
83
Table of Contents
The estimated future amortization expense related to amortizable intangible assets at December 31, 2015 is as follows:
| Years Ending December 31, |
Amount | |||
| (in millions) | ||||
| 2016 |
$ | 130.0 | ||
| 2017 |
120.5 | |||
| 2018 |
112.6 | |||
| 2019 |
105.1 | |||
| 2020 |
96.7 | |||
| Thereafter |
1,103.9 | |||
Amortization of intangibles for 2015, 2014 and 2013 was $61.8, $27.5 and $21.7, respectively. At December 31, 2015, approximately $7 billion of the goodwill and other intangible assets recorded by the Company is not deductible for income tax purposes.
7. Other Current Liabilities
Other current liabilities are comprised of the following at December 31, 2015 and 2014:
| (in millions) |
2015 | 2014 | ||||||
| Cooperative advertising, customer rebates and allowances |
$ | 107.5 | $ | 118.5 | ||||
| Deferred income |
183.4 | 17.4 | ||||||
| Warranty and product liability reserves |
96.4 | 102.9 | ||||||
| Accrued environmental and other litigation |
14.5 | 20.4 | ||||||
| Other |
260.4 | 218.1 | ||||||
|
|
|
|
|
|||||
| Total |
$ | 662.2 | $ | 477.3 | ||||
|
|
|
|
|
|||||
8. Warranty Reserve
Warranty reserve activity for 2015 and 2014 is as follows:
| (in millions) |
2015 | 2014 | ||||||
| Warranty reserve at January 1, |
$ | 96.8 | $ | 98.0 | ||||
| Provision for warranties issued |
135.7 | 148.2 | ||||||
| Warranty claims paid |
(140.0 | ) | (148.6 | ) | ||||
| Acquisitions and other adjustments |
(2.0 | ) | (0.8 | ) | ||||
|
|
|
|
|
|||||
| Warranty reserve at December 31, |
$ | 90.5 | $ | 96.8 | ||||
|
|
|
|
|
|||||
| Allocation in the consolidated balance sheets: |
||||||||
| Other current liabilities |
$ | 78.0 | $ | 84.2 | ||||
| Other non-current liabilities |
12.5 | 12.6 | ||||||
|
|
|
|
|
|||||
| Total |
$ | 90.5 | $ | 96.8 | ||||
|
|
|
|
|
|||||
84
Table of Contents
9. Debt
Debt is comprised of the following at December 31, 2015 and 2014:
| (in millions) |
December 31, 2015 |
December 31, 2014 |
||||||
| Senior Secured Credit Facility Term Loans |
$ | 3,067.6 | $ | 2,024.6 | ||||
| 6 1⁄8% Senior Notes due 2022 (a) |
300.0 | 300.0 | ||||||
| 3 3⁄4% Senior Notes due 2021 (a) |
321.8 | 357.9 | ||||||
| 5% Senior Notes due 2023 (a) |
300.0 | — | ||||||
| 7 1⁄2% Senior Subordinated Notes due 2017 (b) |
654.6 | 650.6 | ||||||
| 17/8% Senior Subordinated Convertible Notes due 2018 (c) |
459.3 | 445.8 | ||||||
| 1 1⁄2% Senior Subordinated Convertible Notes due 2019 (c) |
234.0 | 226.0 | ||||||
| 1 1⁄8% Senior Subordinated Convertible Notes due 2034 (c) |
501.8 | 484.1 | ||||||
| Securitization Facility |
489.3 | 479.3 | ||||||
| Non-U.S. borrowings |
40.3 | 83.2 | ||||||
| Other |
12.3 | 7.4 | ||||||
|
|
|
|
|
|||||
| Total debt |
6,381.0 | 5,058.9 | ||||||
|
|
|
|
|
|||||
| Less: current portion |
(593.5 | ) | (594.9 | ) | ||||
|
|
|
|
|
|||||
| Total long-term debt |
$ | 5,787.5 | $ | 4,464.0 | ||||
|
|
|
|
|
|||||
| (a) | Collectively, the “Senior Notes” |
| (b) | The “Senior Subordinated Notes” |
| (c) | Collectively, the “Senior Subordinated Convertible Notes” |
Senior Secured Credit Facility
In October 2015, the Company borrowed $200 under its senior secured credit facility (the “Facility”) under its existing senior secured term loan A facility that matures in 2019 and bears interest at LIBOR plus a basis point spread. The proceeds were used to fund a portion of the Jostens Acquisition.
In July 2015, the Company borrowed $900 under the Facility, which was comprised of $300 under the existing senior secured term loan B1 facility that matures in 2020 and bears interest at LIBOR plus a basis point spread; and $600 under a new senior secured term loan B2 facility that matures in 2022 and bears interest at LIBOR plus a basis point spread. The proceeds were used, in part, to fund a portion of the Waddington Acquisition.
At December 31, 2015, the Facility is comprised of:
| • | a $860 senior secured term loan A facility maturing in 2019, that bears interest at LIBOR plus a basis point spread; |
| • | a $650 senior secured term loan B facility maturing in 2018 that bears interest at LIBOR plus a basis point spread; |
| • | a $1.1 billion senior secured term loan B1 facility maturing in 2020 that bears interest at LIBOR plus a basis point spread; |
| • | a $600 senior secured term loan B2 facility maturing in 2022 that bears interest at LIBOR plus a basis point spread; and |
| • | a $250 senior secured revolving credit facility (the “Revolver”), which is comprised of a $175 U.S. dollar component and a $75 multi-currency component. The Revolver matures in 2019 and bears interest at certain selected rates, including LIBOR plus a basis point spread. At December 31, 2015 and 2014, there was no amount outstanding under the Revolver. The Company is required to pay an annualized commitment fee of approximately 0.35% on the unused balance of the Revolver. |
85
Table of Contents
The weighted average interest rate on the Facility was approximately 2.9% at December 31, 2015.
Senior Notes
In October 2015, the Company completed the sale of $300 in aggregate principal amount of 5% senior notes that mature in November 2023, in a private offering to qualified institutional buyers pursuant to Rule 144A under the Securities Act of 1933, as amended (the “Securities Act”) and to certain persons outside of the U.S. pursuant to Regulation S under the Securities Act and received net proceeds of approximately $296, after deducting fees and expenses. These notes are subject to similar restrictive and financial covenants as the Company’s existing senior notes. The proceeds were used to fund a portion of the Jostens Acquisition.
The Company may redeem all or part of the 6 1⁄8% senior notes due 2022 beginning in November 2015 at specified redemption prices ranging from approximately 100% to 103% of the principal amount, plus accrued and unpaid interest to the date of redemption.
The Company has designated the principal balance of the 3 3⁄4% senior notes due 2021, as a net investment hedge of the foreign currency exposure of its net investment (the “Hedging Instrument”) in certain Euro-denominated subsidiaries. Foreign currency gains and losses on the Hedging Instrument are recorded as an adjustment to AOCI. See Note 10 for disclosures regarding the Company’s derivative financial instruments.
Senior Subordinated Convertible Notes
The Company’s 1 1⁄8% senior subordinated convertible notes due 2034 (the “2034 Convertible Notes”), which have aggregate principal of $690, have a conversion rate that is approximately 20.0 shares of the Company’s common stock (subject to customary adjustments, including in connection with a fundamental change transaction) per $1 thousand principal amount of the 2034 Convertible Notes, which is equivalent to an initial conversion price of approximately $49.91 per share. On or after March 18, 2024, the Company may redeem any or all of the 2034 Convertible Notes, subject to certain exceptions and conditions, in cash at a redemption price equal to the principal amount of 2034 Convertible Notes to be redeemed, plus accrued and unpaid interest. The holders of the 2034 Convertible Notes may require the Company to repurchase for cash all or a portion of the 2034 Convertible Notes on March 15, 2024 at a repurchase price equal to the principal amount of the 2034 Convertible Notes to be repurchased, plus accrued and unpaid interest. Additionally, if the Company undergoes a fundamental change (as defined in the indenture governing the 2034 Convertible Notes) prior to maturity, holders of the 2034 Convertible Notes may require the Company to repurchase for cash some or all of their 2034 Convertible Notes at a repurchase price equal to the principal amount of the 2034 Convertible Notes being repurchased, plus accrued and unpaid interest. It is the Company’s intent to settle the principal amount and accrued interest on the 2034 Convertible Notes with cash.
The Company’s 1 1⁄2% senior subordinated convertible notes due 2019 (the “2019 Convertible Notes”), which have an aggregate principal balance of $265, have a conversion rate of approximately 25.7 shares of the Company’s common stock (subject to customary adjustments, including in connection with a fundamental change transaction) per $1 thousand principal amount, which is equivalent to a conversion price of approximately $38.97 per share. The 2019 Convertible Notes are not subject to redemption at the Company’s option prior to the maturity date. Prior to March 1, 2019, the 2019 Convertible Notes will be convertible only upon the occurrence of certain events and during certain periods, and thereafter, at any time until the second scheduled trading day immediately preceding the maturity date. If the Company undergoes a fundamental change (as defined in the indenture governing these convertible notes) prior to maturity, holders of the 2019 Convertible Notes will have the right, at their option, to require the Company to repurchase for cash some or all of the 2019 Convertible Notes at a repurchase price equal to the principal amount of the 2019 Convertible Notes being repurchased, plus accrued and unpaid interest. Upon conversion, holders will receive, at the Company’s discretion, cash, shares of the Company’s common stock or a combination thereof. It is the Company’s intent to settle the principal amount and accrued interest on the 2019 Convertible Notes with cash.
86
Table of Contents
The Company’s 1 7⁄8% senior subordinated convertible notes due 2018 (the “2018 Convertible Notes”), which have an aggregate principal balance of $500, have a conversion rate of approximately 31.8 shares of the Company’s common stock (subject to customary adjustments, including in connection with a fundamental change transaction) per $1 thousand principal amount, which is equivalent to a conversion price of approximately $31.49 per share. The 2018 Convertible Notes are not subject to redemption at the Company’s option prior to the maturity date. Prior to June 1, 2018, the 2018 Convertible Notes will be convertible only upon the occurrence of certain events and during certain periods, and thereafter, at any time until the second scheduled trading day immediately preceding the maturity date. If the Company undergoes a fundamental change (as defined in the indenture governing these convertible notes) prior to maturity, holders of the 2018 Convertible Notes will have the right, at their option, to require the Company to repurchase for cash some or all of the 2018 Convertible Notes at a repurchase price equal to the principal amount of the 2018 Convertible Notes being repurchased, plus accrued and unpaid interest. Upon conversion, holders will receive, at the Company’s discretion, cash, shares of the Company’s common stock or a combination thereof. It is the Company’s intent to settle the principal amount and accrued interest on the 2018 Convertible Notes with cash.
The effective annual interest rates on the Senior Subordinated Convertible Notes, which are based upon the initial fair valuations, are as follows:
| 2018 Convertible Notes |
5.5 | % | ||
| 2019 Convertible Notes |
5.6 | % | ||
| 2034 Convertible Notes |
5.5 | % |
Securitization Facility
The Company maintains a $500 receivables purchase agreement (the “Securitization Facility”) that matures in October 2016 and bears interest at a margin over the commercial paper rate. Under the Securitization Facility, a substantial portion of the Company’s Branded Consumables, Consumer Solutions and Outdoor Solutions domestic accounts receivable are sold to a special purpose entity, Jarden Receivables, LLC (“JRLLC”), which is a wholly-owned consolidated indirect subsidiary of the Company. JRLLC funds these purchases with borrowings under a loan agreement, which are secured by the accounts receivable. There is no recourse to the Company for the unpaid portion of any loans under this loan agreement. To the extent there is availability, the Securitization Facility will be drawn upon and repaid as needed to fund general corporate purposes. At December 31, 2015, the borrowing rate margin and the unused line fee on the securitization were 0.80% and 0.40% per annum, respectively.
Non-U.S. Borrowings
The Company’s non-U.S. borrowings are comprised of amounts borrowed under various foreign credit lines and facilities. Certain of these foreign credit lines are secured by certain non-U.S. subsidiaries’ inventory and/or accounts receivable.
Debt Covenants and Other
The Senior Notes and Senior Subordinated Notes are subject to a number of restrictive covenants that, in part, limit the ability of the Company and certain of its subsidiaries, subject to certain exceptions and qualifications, to incur additional indebtedness, to incur liens, engage in mergers and consolidations, enter into transactions with affiliates, make certain investments, transfer or sell assets, pay dividends to third parties or distributions on or repurchase the Company’s common stock, prepay debt subordinate to the Senior Notes or dispose of assets.
The Facility contains certain restrictions, subject to certain exceptions and qualifications, on the conduct of the Company and certain of its subsidiaries, including, among other restrictions: incurring debt, disposing of
87
Table of Contents
certain assets, making investments, creating or suffering liens, completing certain mergers, consolidations and sales of assets, acquisitions, declaring dividends to third parties, redeeming or prepaying other debt, and certain transactions with affiliates. The Facility also includes financial covenants that require the Company to maintain certain total leverage and interest coverage ratios.
The Facility contains a covenant that restricts the Company and its subsidiaries from making certain “restricted payments” (any dividend or other distribution, whether in cash, securities or other property, with respect to any stock or stock equivalents of the Company or any subsidiary), except that:
| • | the Company may declare and make dividend payments or other distributions payable in common stock; |
| • | the Company may repurchase shares of its own stock (provided certain financial and other conditions are met); and |
| • | the Company may make restricted payments during any fiscal year not otherwise permitted, provided that certain financial and other conditions are met. |
The Facility and the indentures related to the Senior Notes and the Senior Subordinated Notes (the “Indentures”) contain cross-default provisions pursuant to which a default in respect to certain of the Company’s other indebtedness could trigger a default by the Company under the Facility and the Indentures. If the Company defaults under the covenants (including the cross-default provisions), the Company’s lenders could foreclose on their security interest in the Company’s assets, which may have a material adverse effect on the consolidated financial condition, results of operations or cash flows of the Company.
The Company’s obligations under the Facility, Senior Subordinated Notes, Senior Notes and Senior Subordinated Convertible Notes are guaranteed, on a joint and several basis, by certain of its domestic subsidiaries, all of which are directly or indirectly wholly-owned by the Company (see Note 19).
The Company’s debt maturities for the five years following December 31, 2015 and thereafter are as follows:
| Years Ending December 31, |
Amount | |||
| (in millions) | ||||
| 2016 |
$ | 593.5 | ||
| 2017 |
729.3 | |||
| 2018 |
1,167.1 | |||
| 2019 |
976.0 | |||
| 2020 |
995.4 | |||
| Thereafter |
2,184.3 | |||
|
|
|
|||
| Total principal payments |
6,645.6 | |||
| Net discount and other |
(264.6 | ) | ||
|
|
|
|||
| Total |
$ | 6,381.0 | ||
|
|
|
|||
At December 31, 2015 and 2014, unamortized deferred debt issue costs were $52.6 and $44.9, respectively. These costs are included in “Other assets” on the consolidated balance sheets and are being amortized over the respective terms of the underlying debt.
At December 31, 2015 and 2014, the approximate fair market value of total debt is as follows:
| (in millions) |
2015 | 2014 | ||||||
| Level 1 |
$ | 1,624 | $ | 1,413 | ||||
| Level 2 |
4,765 | 3,741 | ||||||
|
|
|
|
|
|||||
| Total |
$ | 6,389 | $ | 5,154 | ||||
|
|
|
|
|
|||||
88
Table of Contents
10. Derivative Financial Instruments
From time to time, the Company enters into derivative transactions to hedge its exposures to interest rate, foreign currency rate and commodity price fluctuations. The Company does not enter into derivative transactions for trading purposes.
Interest Rate Contracts
The Company manages its fixed and floating rate debt mix using interest rate swaps. The Company uses fixed and floating rate swaps to alter its exposure to the impact of changing interest rates on its consolidated results of operations and future cash outflows for interest. Floating rate swaps are used, depending on market conditions, to convert the fixed rates of long-term debt into short-term variable rates. Fixed rate swaps are used to reduce the Company’s risk of the possibility of increased interest costs. Interest rate swap contracts are therefore used by the Company to separate interest rate risk management from the debt funding decision.
Fair Value Hedges
During October 2015, the Company terminated $650 notional amount of interest rate swaps that exchange a fixed rate of interest for variable rate of interest (LIBOR) plus a basis point spread and received approximately $6 in net proceeds. These floating rate swaps were designated as fair value hedges against the Senior Subordinated Notes. The gain on the termination of these swaps is deferred as a component of the Senior Subordinated Notes and will be amortized over the remaining life of these notes.
Cash Flow Hedges
At December 31, 2015, the Company had $350 notional amount outstanding in swap agreements that exchange a variable rate of interest (LIBOR) for fixed interest rates over the terms of the agreements and are designated as cash flow hedges of the interest rate risk attributable to forecasted variable interest payments and have maturity dates through June 2020. At December 31, 2015, the weighted average fixed rate of interest on these swaps was approximately 1.9%. The effective portion of the after-tax fair value gains or losses on these swaps is included as a component of AOCI.
Foreign Currency Contracts
The Company uses forward foreign currency contracts to mitigate the foreign currency exchange rate exposure on the cash flows related to forecasted inventory purchases and sales and have maturity dates through March 2017. The derivatives used to hedge these forecasted transactions that meet the criteria for hedge accounting are accounted for as cash flow hedges. The effective portion of the gains or losses on these derivatives is deferred as a component of AOCI and is recognized in earnings at the same time that the hedged item affects earnings and is included in the same caption in the statements of operations as the underlying hedged item. At December 31, 2015, the Company had approximately $590 notional amount outstanding of forward foreign currency contracts that are designated as cash flow hedges of forecasted inventory purchases and sales.
The Company also uses foreign currency contracts, primarily forward foreign currency contracts, to mitigate the foreign currency exposure of certain other foreign currency transactions. At December 31, 2015, the Company had approximately $621 notional amount outstanding of these foreign currency contracts that are not designated as effective hedges for accounting purposes and have maturity dates through December 2016. Fair market value gains or losses are included in the results of operations and are classified in SG&A.
89
Table of Contents
Commodity Contracts
The Company enters into commodity-based derivatives in order to mitigate the risk that the rising price of these commodities could have on the cost of certain of the Company’s raw materials. These commodity-based derivatives provide the Company with cost certainty, and in certain instances, allow the Company to benefit should the cost of the commodity fall below certain dollar thresholds. At December 31, 2015, the Company had approximately $28 notional amount outstanding of commodity-based derivatives that are not designated as effective hedges for accounting purposes and have maturity dates through December 2016. Fair market value gains or losses are included in the results of operations and are classified in cost of sales.
At December 31, 2015 and 2014, the fair value of derivative financial instruments is as follows:
| 2015 | 2014 | |||||||||||||||||||
| Fair Value of Derivatives |
Fair Value of Derivatives |
Weighted Average Remaining Term (years) |
||||||||||||||||||
| (in millions) |
Asset (a) | Liability (a) | Asset (a) | Liability (a) | ||||||||||||||||
| Derivatives designated as effective hedges: |
||||||||||||||||||||
| Cash flow hedges: |
||||||||||||||||||||
| Interest rate swaps |
$ | — | $ | 7.4 | $ | 0.6 | $ | 7.2 | 2.7 | |||||||||||
| Foreign currency contracts |
23.6 | 4.7 | 25.9 | 3.8 | 0.6 | |||||||||||||||
| Fair value hedges: |
||||||||||||||||||||
| Interest rate swaps |
— | — | — | 2.2 | — | |||||||||||||||
|
|
|
|
|
|
|
|
|
|||||||||||||
| Subtotal |
23.6 | 12.1 | 26.5 | 13.2 | ||||||||||||||||
|
|
|
|
|
|
|
|
|
|||||||||||||
| Derivatives not designated as effective hedges: |
||||||||||||||||||||
| Foreign currency contracts |
8.3 | 4.9 | 2.8 | 1.3 | 0.6 | |||||||||||||||
| Commodity contracts |
— | 8.9 | — | 9.0 | 0.5 | |||||||||||||||
|
|
|
|
|
|
|
|
|
|||||||||||||
| Subtotal |
8.3 | 13.8 | 2.8 | 10.3 | ||||||||||||||||
|
|
|
|
|
|
|
|
|
|||||||||||||
| Total |
$ | 31.9 | $ | 25.9 | $ | 29.3 | $ | 23.5 | ||||||||||||
|
|
|
|
|
|
|
|
|
|||||||||||||
| (a) | Consolidated balance sheet location: |
| Asset: Other current and non-current assets |
| Liability: Other current and non-current liabilities |
90
Table of Contents
The following table presents gain and loss activity (on a pretax basis) for 2015, 2014 and 2013 related to derivative financial instruments designated as effective hedges:
| 2015 | 2014 | 2013 | ||||||||||||||||||||||||||||||||||
| Gain/(Loss) | Gain/(Loss) | Gain/(Loss) | ||||||||||||||||||||||||||||||||||
| (in millions) |
Recognized in OCI (a) |
Reclassified from AOCI to Income |
Recognized in Income (b) |
Recognized in OCI (a) |
Reclassified from AOCI to Income |
Recognized in Income (b) |
Recognized in OCI (a) |
Reclassified from AOCI to Income |
Recognized in Income (b) |
|||||||||||||||||||||||||||
| Derivatives designated as |
| |||||||||||||||||||||||||||||||||||
| Cash flow hedges: |
||||||||||||||||||||||||||||||||||||
| Interest rate swaps |
$ | (0.8 | ) | $ | — | $ | — | $ | (3.0 | ) | $ | — | $ | — | $ | 8.9 | $ | — | $ | — | ||||||||||||||||
| Foreign currency contracts |
35.9 | 32.4 | (8.0 | ) | 27.7 | 6.3 | (1.9 | ) | 13.9 | 18.2 | (5.5 | ) | ||||||||||||||||||||||||
|
|
|
|
|
|
|
|
|
|
|
|
|
|
|
|
|
|
|
|||||||||||||||||||
| Total |
$ | 35.1 | $ | 32.4 | $ | (8.0 | ) | $ | 24.7 | $ | 6.3 | $ | (1.9 | ) | $ | 22.8 | $ | 18.2 | $ | (5.5 | ) | |||||||||||||||
|
|
|
|
|
|
|
|
|
|
|
|
|
|
|
|
|
|
|
|||||||||||||||||||
| Location of gain/(loss) in the |
| |||||||||||||||||||||||||||||||||||
| Net sales |
$ | 1.0 | $ | — | $ | 2.0 | $ | — | $ | 0.1 | $ | — | ||||||||||||||||||||||||
| Cost of sales |
31.4 | — | 4.3 | — | 18.1 | — | ||||||||||||||||||||||||||||||
| SG&A |
— | (8.0 | ) | — | (1.9 | ) | — | (5.5 | ) | |||||||||||||||||||||||||||
|
|
|
|
|
|
|
|
|
|
|
|
|
|||||||||||||||||||||||||
| Total |
$ | 32.4 | $ | (8.0 | ) | $ | 6.3 | $ | (1.9 | ) | $ | 18.2 | $ | (5.5 | ) | |||||||||||||||||||||
|
|
|
|
|
|
|
|
|
|
|
|
|
|||||||||||||||||||||||||
| (a) | Represents effective portion recognized in Other Comprehensive Income (“OCI”). |
| (b) | Represents portion excluded from effectiveness testing. |
At December 31, 2015, deferred net gains of $27 within AOCI are expected to be reclassified to earnings over the next twelve months.
The following table presents gain and loss activity (on a pretax basis) for 2015, 2014 and 2013 related to derivative financial instruments not designated as effective hedges:
| Gain/(Loss) Recognized in Income (a) |
||||||||||||
| (in millions) |
2015 | 2014 | 2013 | |||||||||
| Derivatives not designated as effective hedges: |
||||||||||||
| Cash flow derivatives: |
||||||||||||
| Foreign currency contracts |
$ | 14.7 | $ | 4.3 | $ | (2.7 | ) | |||||
| Commodity contracts |
(11.2 | ) | (8.9 | ) | 0.9 | |||||||
|
|
|
|
|
|
|
|||||||
| Total |
$ | 3.5 | $ | (4.6 | ) | $ | (1.8 | ) | ||||
|
|
|
|
|
|
|
|||||||
Net Investment Hedge
The Company has designated €300 of the principal balance of its Euro-denominated 3 3⁄4% senior notes due October 2021 (the “Hedging Instrument”) as a net investment hedge of the foreign currency exposure of its net investment in certain Euro-denominated subsidiaries. Foreign currency gains and losses on the Hedging Instrument are included as a component of AOCI. At December 31, 2015, $51.1 of after-tax deferred gains have been recorded in AOCI.
91
Table of Contents
11. Commitments and Contingencies
Operating Leases
The Company conducts its operations in various leased facilities under leases that are classified as operating leases for financial statement purposes. Certain leases provide for payment of real estate taxes, common area maintenance, insurance and certain other expenses. Lease terms may have escalating rent provisions and rent holidays which are expensed on a straight-line basis over the term of the lease. Also, certain equipment used in the Company’s operations are leased under operating leases.
Operating lease commitments for the five years following December 31, 2015 and thereafter are as follows:
| Years Ending December 31, |
Amount | |||
| (in millions) | ||||
| 2016 |
$ | 125.9 | ||
| 2017 |
108.6 | |||
| 2018 |
95.6 | |||
| 2019 |
81.8 | |||
| 2020 |
66.0 | |||
| Thereafter |
221.6 | |||
|
|
|
|||
| Total |
$ | 699.5 | ||
|
|
|
|||
The fixed operating lease commitments detailed above assume that the Company continues the leases through their initial lease terms. Rent expense, including equipment rentals, was $150, $150 and $120 for 2015, 2014 and 2013, respectively.
Contingencies
The Company is involved in various legal disputes and other legal proceedings that arise from time to time in the ordinary course of business. In addition, the Company and/or certain of its subsidiaries have been identified by the United States Environmental Protection Agency (“EPA”) or a state environmental agency as a Potentially Responsible Party (“PRP”) pursuant to the federal Superfund Act and/or state Superfund laws comparable to the federal law at various sites. Based on currently available information, the Company does not believe that the disposition of any of the legal or environmental disputes the Company or its subsidiaries are currently involved in will have a material adverse effect upon the consolidated financial condition, results of operations or cash flows of the Company. It is possible that, as additional information becomes available, the impact on the Company of an adverse determination could have a different effect.
Environmental
The Company’s operations are subject to certain federal, state, local and foreign environmental laws and regulations in addition to laws and regulations regarding labeling and packaging of products and the sales of products containing certain environmentally sensitive materials. In addition to ongoing environmental compliance at its operations, the Company also is actively engaged in environmental remediation activities, the majority of which relates to divested operations and sites. Various of the Company’s subsidiaries have been identified by the EPA or a state environmental agency as a PRP pursuant to the federal Superfund Act and/or state Superfund laws comparable to the federal law at various sites (collectively, the “Environmental Sites”). The Company has established reserves to cover the anticipated probable costs of investigation and remediation based upon periodic reviews of all sites for which they have, or may have, remediation responsibility. The Company accrues environmental investigation and remediation costs when it is probable that a liability has been incurred, the amount of the liability can be reasonably estimated and their responsibility for the liability is established. Generally, the timing of these accruals coincides with the earlier of a formal commitment to an investigation plan, completion of a feasibility study or a commitment to a formal plan of action. The Company accrues its best
92
Table of Contents
estimate of investigation and remediation costs based upon facts known at such dates, and because of the inherent difficulties in estimating the ultimate amount of environmental costs, which are further described below, these estimates may materially change in the future as a result of the uncertainties described below. Estimated costs, which are based upon experience with similar sites and technical evaluations, are judgmental in nature and are recorded at discounted amounts without considering the impact of inflation and are adjusted periodically to reflect changes in applicable laws or regulations, changes in available technologies and receipt by the Company of new information. It is difficult to estimate the ultimate level of future environmental expenditures due to a number of uncertainties surrounding environmental liabilities. These uncertainties include the applicability of laws and regulations, changes in environmental remediation requirements, the enactment of additional regulations, uncertainties surrounding remediation procedures including the development of new technology, the identification of new sites for which various of the Company’s subsidiaries could be a PRP, information relating to the exact nature and extent of the contamination at each Environmental Site and the extent of required cleanup efforts, the uncertainties with respect to the ultimate outcome of issues which may be actively contested and the varying costs of alternative remediation strategies.
Due to the uncertainties described above, the Company’s ultimate future liability with respect to sites at which remediation has not been completed may vary from the amounts reserved as of December 31, 2015.
The Company believes that the costs of completing environmental remediation of all sites for which the Company has a remediation responsibility have been adequately reserved and that the ultimate resolution of these matters will not have a material adverse effect on its consolidated financial position, results of operations or cash flows.
Litigation
The Company and/or its subsidiaries are involved in various lawsuits arising from time to time that the Company considers ordinary routine litigation incidental to its business. Amounts accrued for litigation matters represent the anticipated costs (damages and/or settlement amounts) in connection with pending litigation and claims and related anticipated legal fees for defending such actions. The costs are accrued when it is both probable that a liability has been incurred and the amount can be reasonably estimated. The accruals are based upon the Company’s assessment, after consultation with counsel (if deemed appropriate), of probable loss based on the facts and circumstances of each case, the legal issues involved, the nature of the claim made, the nature of the damages sought and any relevant information about the plaintiffs and other significant factors that vary by case. When it is not possible to estimate a specific expected cost to be incurred, the Company evaluates the range of probable loss and records the minimum end of the range. The Company believes that anticipated probable costs of litigation matters have been adequately reserved to the extent determinable. Based on current information, the Company believes that the ultimate conclusion of the various pending litigation of the Company, in the aggregate, will not have a material adverse effect on the consolidated financial position, results of operations or cash flows of the Company.
Product Liability
As a consumer goods manufacturer and distributor, the Company and/or its subsidiaries face the risk of product liability and related lawsuits involving claims for substantial money damages, product recall actions and higher than anticipated rates of warranty returns or other returns of goods.
The Company and/or its subsidiaries are therefore party to various personal injury and property damage lawsuits relating to their products and incidental to their business. Annually, the Company sets its product liability insurance program, which is an occurrence-based program based on the Company and its subsidiaries’ current and historical claims experience and the availability and cost of insurance. The Company’s product liability insurance program generally includes a self-insurance retention per occurrence.
93
Table of Contents
Cumulative amounts estimated to be payable by the Company with respect to pending and potential claims for all years in which the Company is liable under its self-insurance retention have been accrued as liabilities. Such accrued liabilities are based on estimates (which include actuarial determinations made by an independent actuarial consultant as to liability exposure, taking into account prior experience, number of claims and other relevant factors); thus, the Company’s ultimate liability may exceed or be less than the amounts accrued. The methods of making such estimates and establishing the resulting liability are reviewed on a regular basis and any adjustments resulting therefrom are reflected in current operating results.
Based on current information, the Company believes that the ultimate conclusion of the various pending product liability claims and lawsuits of the Company, in the aggregate, will not have a material adverse effect on the consolidated financial position, results of operations or cash flows of the Company.
Subsequent Event
Vincent A. Hirsch v. James E. Lillie, Martin E. Franklin, Ian G.H. Ashken, Michael S. Gross, Robert L. Wood, Irwin D. Simon, William P. Lauder, Ros L’esperance, Peter A. Hochfelder, Newell Rubbermaid Inc., NCPF Acquisition Corp. I and NCPF Acquisition Corp. II, Case No. 9:16-CV-80258 (United States District Court for the Southern District of Florida)
The above-named lawsuit, which was filed on February 24, 2016, is a putative class action, purportedly on behalf of Jarden shareholders filed against the individual director defendants, who are directors of Jarden Corporation. Newell Rubbermaid Inc., NCPF Acquisition Corp. I and NCPF Acquisition Corp. II are also named as defendants. The Complaint alleges claims under § 14(a) of the Securities Exchange Act of 1934; SEC Rule 14a-9 against all defendants; and Section 20(a) of the Securities Exchange Act against the individual director defendants. Plaintiff alleges that the joint proxy/prospectus of Newell Rubbermaid and Jarden concerning the merger transactions contemplated by the Merger Agreement omitted certain information. Plaintiff seeks to enjoin the proposed merger transactions, rescission in the event the merger is consummated, and the award of attorneys’ fees and costs. The individual director defendants deny the allegations and intend to vigorously defend the action.
12. Taxes on Income
The components of the provision for income taxes attributable to continuing operations for 2015, 2014 and 2013 are as follows:
| (in millions) |
2015 | 2014 | 2013 | |||||||||
| Current income tax expense: |
||||||||||||
| U.S. federal |
$ | 111.3 | $ | 87.1 | $ | 63.1 | ||||||
| Foreign |
62.0 | 86.0 | 86.2 | |||||||||
| State and local |
18.5 | 10.7 | 9.1 | |||||||||
|
|
|
|
|
|
|
|||||||
| Total |
191.8 | 183.8 | 158.4 | |||||||||
|
|
|
|
|
|
|
|||||||
| Deferred income tax expense (benefit): |
||||||||||||
| U.S. federal |
(57.8 | ) | (47.4 | ) | 7.9 | |||||||
| Foreign |
(2.8 | ) | (14.0 | ) | (15.8 | ) | ||||||
| State, local and other, net of federal tax benefit |
3.9 | 7.9 | (2.8 | ) | ||||||||
|
|
|
|
|
|
|
|||||||
| Total |
(56.7 | ) | (53.5 | ) | (10.7 | ) | ||||||
|
|
|
|
|
|
|
|||||||
| Total income tax provision |
$ | 135.1 | $ | 130.3 | $ | 147.7 | ||||||
|
|
|
|
|
|
|
|||||||
94
Table of Contents
The difference between the federal statutory income tax rate and the Company’s reported income tax rate as a percentage of income from operations for 2015, 2014 and 2013 is reconciled as follows:
| 2015 | 2014 | 2013 | ||||||||||
| Federal statutory tax rate |
35.0 | % | 35.0 | % | 35.0 | % | ||||||
| Increase (decrease) in rates resulting from: |
||||||||||||
| State and local taxes, net |
5.0 | 3.0 | 1.2 | |||||||||
| Foreign rate differences |
(7.0 | ) | (5.7 | ) | (2.8 | ) | ||||||
| Non-deductible compensation |
2.0 | 0.4 | 3.4 | |||||||||
| Foreign earnings not permanently reinvested |
1.7 | (9.7 | ) | 1.1 | ||||||||
| Tax settlements and related adjustments |
0.5 | 2.2 | 0.1 | |||||||||
| Goodwill impairments |
11.0 | — | — | |||||||||
| Valuation allowance |
(0.7 | ) | 2.6 | 1.5 | ||||||||
| Venezuela devaluation and inflationary adjustments and tax exempt income |
— | 9.0 | 2.2 | |||||||||
| Foreign dividends |
0.9 | 0.5 | 1.3 | |||||||||
| Non-deductible transaction costs |
1.1 | 0.5 | 0.5 | |||||||||
| Domestic production activity deduction |
(3.2 | ) | (1.3 | ) | (0.4 | ) | ||||||
| Other |
1.7 | (1.5 | ) | (1.0 | ) | |||||||
|
|
|
|
|
|
|
|||||||
| Reported income tax rate |
48.0 | % | 35.0 | % | 42.1 | % | ||||||
|
|
|
|
|
|
|
|||||||
Foreign pre-tax income was approximately $206, $146, and $219 for 2015, 2014 and 2013, respectively.
Deferred tax assets (liabilities) at December 31, 2015 and 2014 are comprised of the following:
| (in millions) |
2015 | 2014 | ||||||
| Intangibles |
$ | (1,476.9 | ) | $ | (906.4 | ) | ||
| Goodwill |
(169.3 | ) | (159.7 | ) | ||||
| Financial reporting amount of a subsidiary in excess of tax basis |
(71.2 | ) | (70.4 | ) | ||||
| Foreign earnings not permanently reinvested |
(6.9 | ) | (5.6 | ) | ||||
| Property and equipment |
(78.7 | ) | (11.5 | ) | ||||
| Convertible debt |
(97.1 | ) | (110.4 | ) | ||||
| Other |
(0.7 | ) | (9.0 | ) | ||||
|
|
|
|
|
|||||
| Gross deferred tax liabilities |
(1,900.8 | ) | (1,273.0 | ) | ||||
|
|
|
|
|
|||||
| Net operating loss |
66.4 | 50.9 | ||||||
| Accounts receivable allowances |
23.1 | 13.8 | ||||||
| Inventory valuation |
54.9 | 58.9 | ||||||
| Pension and postretirement |
49.5 | 17.0 | ||||||
| Stock-based compensation |
39.4 | 12.6 | ||||||
| Other compensation and benefits |
26.9 | 21.3 | ||||||
| Operating reserves |
52.7 | 55.4 | ||||||
| Other |
47.1 | 38.1 | ||||||
|
|
|
|
|
|||||
| Gross deferred tax assets |
360.0 | 268.0 | ||||||
|
|
|
|
|
|||||
| Valuation allowance |
(37.7 | ) | (40.8 | ) | ||||
|
|
|
|
|
|||||
| Net deferred tax liability |
$ | (1,578.5 | ) | $ | (1,045.8 | ) | ||
|
|
|
|
|
|||||
The Company continually reviews the adequacy of the valuation allowance. A valuation allowance is recorded if, based on the weight of available evidence, it is more likely than not that a deferred tax asset will not be realized. This assessment is based on an evaluation of the level of historical taxable income and projections
95
Table of Contents
for future taxable income. During 2015, the Company’s valuation allowance decreased by $3.1 principally due to foreign currency translation. During 2014, the Company’s valuation allowance increased by $6.6 principally due to a provision made against the net deferred tax assets of the Company’s operations in Venezuela. During 2013, the Company’s valuation allowance increased by $6.1 principally due to the inability to recognize certain foreign losses for which a valuation allowance was previously provided.
The net operating losses (“NOLs”) reflected on the deferred tax asset table consist of state and foreign net operating loss carryforwards. At December 31, 2015, the Company had net U.S. federal NOLs of approximately $437, none of which are reflected in the consolidated financial statements. In 2015, the Company utilized approximately $153 of these previously unrecognized U.S. federal NOLs in its consolidated financial statements. Additionally, approximately $437 of these U.S. federal NOLs are subject to varying limitations on their use under Section 382 of the Internal Revenue Code of 1986, as amended. Included in the total NOLs reported on the financial statement are $141 of foreign NOLs which the Company has accumulated or acquired through acquisitions. Of the total foreign NOLs, approximately none will expire in 2015. Approximately $50 of the foreign NOLs will expire in years subsequent to 2016, and approximately $91 have an unlimited life.
Certain vested and exercised employee equity compensation awards have resulted in tax deductions in excess of previously recorded tax benefits based on the value of such equity compensation awards at the time of grant (“windfalls”). The additional tax benefit associated with the windfalls is not recognized for financial statement purposes until the deduction reduces taxes payable as recorded on the Company’s financial statements with an offset to additional paid-in-capital. Windfall tax benefits of $25.9, $38.0 and $11.6 were recognized in 2015, 2014 and 2013, respectively.
Generally, the Company intends to indefinitely reinvest undistributed earnings of certain of its foreign subsidiaries outside the U.S. in the future growth of its foreign businesses. As a result, the Company has not provided for U.S. income taxes on undistributed foreign earnings of approximately $1.3 billion at December 31, 2015. Determination of the amount of unrecognized deferred U.S. income liability is not practicable, in part, because of the complexities associated with its hypothetical calculation, which include the impact of complex foreign and domestic tax laws with respect to dividend remittances, remittance requirements imposed by certain of the Company’s debt agreements and the impact of foreign laws restricting such remittances. In 2015, 2014 and 2013, the Company recorded a deferred tax charge (benefit) of $1.3, ($42.8) and $1.4, respectively, related to profits that were deemed not to be permanently reinvested outside of the United States. The deferred benefit is principally due to the reduction of undistributed earnings attributable to the Company’s operations in Venezuela.
The following table sets forth the details and the activity related to unrecognized tax benefit as of and for the years ended December 31, 2015 and 2014:
| (in millions) |
2015 | 2014 | ||||||
| Unrecognized tax benefits, January 1, |
$ | 145.3 | $ | 88.9 | ||||
| Increases (decreases): |
||||||||
| Acquisitions |
7.7 | 5.2 | ||||||
| Tax positions taken during the current period |
77.9 | 48.1 | ||||||
| Tax positions taken during a prior period |
(12.5 | ) | 3.7 | |||||
| Settlements with taxing authorities |
(8.7 | ) | (0.5 | ) | ||||
| Other |
(0.7 | ) | (0.1 | ) | ||||
|
|
|
|
|
|||||
| Unrecognized tax benefits, December 31, |
$ | 209.0 | $ | 145.3 | ||||
|
|
|
|
|
|||||
During 2015 and 2014, the change in the unrecognized tax benefits primarily relates to tax positions taken during the current period and tax settlements made during the year. At December 31, 2015, the amount of gross unrecognized tax benefits that, if recognized, would affect the reported tax rate is $215. The Company has indemnification for $4.4 of the gross unrecognized tax benefits from the sellers of acquired companies.
96
Table of Contents
The Company believes that it is reasonably possible that a decrease of approximately $25 of unrecognized tax benefits, related to certain domestic exposures may be necessary within the coming year as a result of a lapse of the statute of limitations.
Not withstanding the possible decrease due to expiring statutes, it is likely that the total amount of unrecognized tax benefits will increase in the next 12 months. Such increase will occur as a result of the Company’s tax return position with respect to the utilization of tax attributes and the conclusion of ongoing tax audits in various jurisdictions around the world. While one or more of these events is reasonably possible to occur within the next 12 months, the Company is not able to accurately estimate the range of the change in the unrecognized tax benefits that will result. The calculation of unrecognized tax benefits involves dealing with uncertainties in the application of complex global tax regulations. Management regularly assesses the Company’s tax positions in light of legislative, bilateral tax treaties, regulatory and judicial developments in the countries in which the Company does business.
The Company conducts business globally and, as a result, the Company or its subsidiaries file income tax returns in the U.S. federal jurisdiction, and in various state, local, and foreign jurisdictions. In the normal course of business, the Company or its subsidiaries are subject to examination by tax authorities throughout the world, including such major jurisdictions as Argentina, Brazil, Canada, China, Colombia, France, Germany, Hong Kong, Hungary, India, Italy, Japan, Malaysia, Mexico, Peru, Spain, Sweden and the U.S. (including, state and local jurisdictions). As of December 31, 2015, the Company remains subject to examination by federal and state tax authorities for the tax years 2005 to 2014. At December 31, 2015, certain of the Company’s more significant foreign jurisdictions remain subject to examination for various tax years between 2007 and 2014.
The Company classifies all interest expense and penalties on uncertain tax positions as income tax expense. The provision for income taxes for 2015, 2014 and 2013 includes tax-related interest expense of $(0.1), $1.8 and $1.7, respectively. As of December 31, 2015 and 2014, the liability for tax-related interest expense was $10.2 and $10.3, respectively.
13. Stockholders’ Equity and Share-Based Awards
The Company maintains the 2013 Stock Incentive Plan, which allows for grants of stock options, restricted stock and short-term cash awards. At December 31, 2015, there were approximately 2.5 million share-based awards collectively available for grant under this stock plan.
Stock Options
A summary of the Company’s stock option activity in 2015 is as follows:
| Shares (in thousands) |
Weighted Average Exercise Price |
Weighted Average Remaining Life (years) |
Total Intrinsic Value (in millions) |
|||||||||||||
| Options outstanding, beginning of year |
301.0 | $ | 9.50 | |||||||||||||
| Granted |
— | — | ||||||||||||||
| Exercised |
(183.7 | ) | 9.72 | |||||||||||||
| Cancelled |
(1.7 | ) | 9.00 | |||||||||||||
|
|
|
|
|
|||||||||||||
| Options outstanding, end of year (a) |
115.6 | $ | 9.16 | 0.7 | $ | 4.5 | ||||||||||
|
|
|
|
|
|
|
|||||||||||
| (a) | All options outstanding are exercisable |
The Company does not use cash to settle any of its stock options or restricted stock awards and when available issues shares from its treasury stock instead of issuing new shares. Common stock options vest ratably
97
Table of Contents
over an explicit service period of typically 3 to 4 years and generally have a contractual term of 7 years. The total intrinsic value of stock options exercised was $7.9, $7.2 and $6.8 for 2015, 2014 and 2013, respectively. There were no stock options granted in 2015, 2014 and 2013.
Restricted Shares of Common Stock
The Company issues restricted stock awards whose restrictions lapse upon either the passage of time (service vesting), achieving performance targets, attaining Company common stock price thresholds or some combination of these restrictions. The contractual life is generally 7 years for those restricted stocks with performance targets, common stock price thresholds or some combination thereof. For those restricted stock awards with common stock price thresholds, the fair values were determined using a Monte Carlo simulation embedded in a lattice model. The fair value for all other restricted stock awards were based on the closing price of the Company’s common stock on the dates of grant.
A summary of the Company’s restricted stock activity for 2015 is as follows:
| Shares (in thousands) |
||||
| Outstanding as of December 31, 2014 |
7,214.1 | |||
| Granted |
2,290.0 | |||
| Released/Vested |
(2,280.4 | ) | ||
| Cancelled |
(580.3 | ) | ||
|
|
|
|||
| Outstanding as of December 31, 2015 |
6,643.4 | |||
|
|
|
|||
The total fair value of restricted shares granted and total fair value of restricted shares vested for 2015, 2014 and 2013 is as follows:
| (in millions) |
2015 | 2014 | 2013 | |||||||||
| Total fair value of restricted shares granted |
$ | 113.1 | $ | 222.0 | $ | 75.0 | ||||||
| Total fair value of restricted shares vested |
61.6 | 77.1 | 85.7 | |||||||||
For those restricted stock awards with common stock price thresholds, the weighted average grant date fair values of these awards were $52.05, $36.61 and $22.53 for 2015, 2014 and 2013, respectively, based on the following assumptions:
| 2015 | 2014 | 2013 | ||||||||||
| Expected volatility |
26.0 | % | 32.0 | % | 40.7 | % | ||||||
| Risk-free interest rates |
1.8 | % | 1.7 | % | 0.8 | % | ||||||
| Derived service periods (in years) |
0.1 | 0.3 | 0.1 | |||||||||
For all other restricted stock awards, the weighted average grant date fair values were $52.09, $40.99 and $36.92 for the years ended December 31, 2015, 2014 and 2013, respectively.
As part of the restricted stock awards granted in 2015, in January 2015, the Board authorized an annual grant of approximately 0.8 million restricted stock awards to certain executive officers, which had an aggregate grant date fair value of $33.9 and vested during 2015 when the Company’s weighted average share price exceeded certain thresholds. In 2015, the Company also granted approximately 0.6 million restricted stock awards with an aggregate grant date fair value of $33.2, a portion of which will vest on the third anniversary from the grant date and the remainder will vest upon the achievement of certain performance targets. In December 2015, the Board authorized the 2016 annual grant and awarded approximately 0.8 million restricted stock awards to certain executive officers which had an aggregate grant date fair value of $40.0 and will vest
98
Table of Contents
when the Company’s weighted average share price exceeds certain thresholds. Additionally in December 2015, the Board authorized a stock bonus of approximately 0.1 million restricted stock awards to certain executive officers which had an aggregate grant date fair value of $6.0 and vested immediately.
During the fourth quarter of 2015, the Company recognized $77.8 of cumulative stock-based compensation related to certain restricted stock awards granted during 2014 where compensation expense was not previously recognized as the achievement of the performance targets was not deemed probable.
As of December 31, 2015, there was $149 of unrecognized stock-based compensation cost related to non-vested share-based awards whose costs are expected to be expensed through 2017 over a weighted-average period of approximately 9 months.
Stockholders’ Equity
In October 2015, pursuant to a public offering of its common stock, the Company completed an equity offering of 10.0 million newly-issued shares of common and received net proceeds of approximately $477. The proceeds were used to fund a portion of the Jostens Acquisition.
In July 2015, pursuant to a public offering of its common stock, the Company completed an equity offering of 18.4 million newly-issued shares of common stock and received net proceeds of approximately $971. The proceeds were used to fund a portion of the Waddington Acquisition.
In September 2013, pursuant to a public offering of its common stock, the Company completed an equity offering of approximately 24.8 million newly-issued shares of common stock and received net proceeds of approximately $745. The proceeds were used to fund a portion of the YCC Acquisition.
14. Earnings Per Share
A computation of the weighted average shares outstanding for 2015, 2014 and 2013 is as follows:
| (in millions) |
2015 | 2014 | 2013 | |||||||||
| Weighted average shares outstanding: |
||||||||||||
| Basic |
195.8 | 185.3 | 170.6 | |||||||||
| Dilutive share-based awards |
0.4 | 0.8 | 1.4 | |||||||||
| Convertible debt |
8.3 | 3.7 | 0.5 | |||||||||
|
|
|
|
|
|
|
|||||||
| Diluted |
204.5 | 189.8 | 172.5 | |||||||||
|
|
|
|
|
|
|
|||||||
Because it is the Company’s intention to redeem the principal amount of the Senior Subordinated Convertible Notes in cash, the treasury stock method is used for determining potential dilution in the diluted earnings per share computation. As of December 31, 2015, there were 4.9 million potentially dilutive restricted share awards with performance-based vesting targets that were not met and as such, have been excluded from the computation of diluted earnings per share.
15. Employee Benefit Plans
The Company maintains defined benefit pension plans for certain of its employees and provides certain postretirement medical and life insurance benefits for a portion of its employees. At December 31, 2015, substantially all the domestic pension and postretirement plans are frozen to new entrants and to future benefit accruals. Benefit obligations are calculated using generally accepted actuarial methods. Actuarial gains and losses are amortized using the corridor method over the average remaining service life of its active employees. The pension and postretirement benefit obligations are measured as of December 31, for 2015 and 2014.
99
Table of Contents
Net Periodic Expense
The components of net periodic pension and postretirement benefit expense for 2015, 2014 and 2013 are as follows:
| Pension Benefits | ||||||||||||||||||||||||||||||||||||
| 2015 | 2014 | 2013 | ||||||||||||||||||||||||||||||||||
| (in millions) |
Domestic | Foreign | Total | Domestic | Foreign | Total | Domestic | Foreign | Total | |||||||||||||||||||||||||||
| Service cost |
$ | — | $ | 2.3 | $ | 2.3 | $ | — | $ | 2.1 | $ | 2.1 | $ | — | $ | 2.2 | $ | 2.2 | ||||||||||||||||||
| Interest cost |
14.3 | 1.5 | 15.8 | 14.6 | 2.4 | 17.0 | 13.3 | 2.3 | 15.6 | |||||||||||||||||||||||||||
| Expected return on plan assets |
(20.1 | ) | (1.2 | ) | (21.3 | ) | (17.5 | ) | (1.4 | ) | (18.9 | ) | (16.9 | ) | (1.2 | ) | (18.1 | ) | ||||||||||||||||||
| Amortization: |
||||||||||||||||||||||||||||||||||||
| Prior service credit |
— | — | — | — | (0.9 | ) | (0.9 | ) | — | — | — | |||||||||||||||||||||||||
| Net actuarial loss |
5.7 | 1.1 | 6.8 | 4.9 | 0.3 | 5.2 | 7.4 | 0.4 | 7.8 | |||||||||||||||||||||||||||
|
|
|
|
|
|
|
|
|
|
|
|
|
|
|
|
|
|
|
|||||||||||||||||||
| Net periodic (income) expense |
(0.1 | ) | 3.7 | 3.6 | 2.0 | 2.5 | 4.5 | 3.8 | 3.7 | 7.5 | ||||||||||||||||||||||||||
| Curtailments and settlements |
5.0 | 0.4 | 5.4 | 5.7 | 0.2 | 5.9 | — | (0.1 | ) | (0.1 | ) | |||||||||||||||||||||||||
|
|
|
|
|
|
|
|
|
|
|
|
|
|
|
|
|
|
|
|||||||||||||||||||
| Total expense |
$ | 4.9 | $ | 4.1 | $ | 9.0 | $ | 7.7 | $ | 2.7 | $ | 10.4 | $ | 3.8 | $ | 3.6 | $ | 7.4 | ||||||||||||||||||
|
|
|
|
|
|
|
|
|
|
|
|
|
|
|
|
|
|
|
|||||||||||||||||||
| Assumptions |
||||||||||||||||||||||||||||||||||||
| Weighted average assumption used to calculate net periodic cost: |
||||||||||||||||||||||||||||||||||||
| Discount rate |
3.98 | % | 2.23 | % | 3.69 | % | 4.80 | % | 3.58 | % | 4.58 | % | 3.95 | % | 3.34 | % | 3.85 | % | ||||||||||||||||||
| Expected return on plan assets |
7.40 | % | 3.80 | % | 7.05 | % | 7.50 | % | 4.20 | % | 7.11 | % | 7.75 | % | 3.98 | % | 7.32 | % | ||||||||||||||||||
| Rate of compensation increase |
— | 2.44 | % | 2.44 | % | — | 2.50 | % | 2.50 | % | — | 2.56 | % | 2.56 | % | |||||||||||||||||||||
| Postretirement Benefits | ||||||||||||
| (in millions) |
2015 | 2014 | 2013 | |||||||||
| Service cost |
$ | — | $ | — | $ | — | ||||||
| Interest cost |
0.3 | 0.3 | 0.3 | |||||||||
| Amortization: |
||||||||||||
| Prior service credit |
(0.1 | ) | (0.3 | ) | (0.3 | ) | ||||||
| Net actuarial gain |
(0.2 | ) | (0.2 | ) | (0.1 | ) | ||||||
|
|
|
|
|
|
|
|||||||
| Net periodic cost (credit) |
$ | — | $ | (0.2 | ) | $ | (0.1 | ) | ||||
|
|
|
|
|
|
|
|||||||
| Assumptions |
||||||||||||
| Weighted average assumption used to calculate net periodic cost: |
||||||||||||
| Discount rate |
3.84 | % | 4.70 | % | 3.90 | % | ||||||
The amount of AOCI expected to be recognized in net periodic benefit cost for the year ending December 31, 2016 is as follows:
| Pension Benefits | ||||||||||||||||
| (in millions) |
Domestic | Foreign | Total | Postretirement | ||||||||||||
| Net actuarial loss (gain) |
$ | 6.7 | $ | 0.7 | $ | 7.4 | $ | (0.2 | ) | |||||||
100
Table of Contents
Funded Status
The following table provides a reconciliation of the benefit obligation, plan assets and the funded status of the pension and postretirement plans as of December 31, 2015 and 2014:
| Pension Benefits | Postretirement Benefits |
|||||||||||||||||||||||||||||||
| 2015 | 2014 | 2015 | 2014 | |||||||||||||||||||||||||||||
| (in millions) |
Domestic | Foreign | Total | Domestic | Foreign | Total | ||||||||||||||||||||||||||
| Change in benefit obligation: |
||||||||||||||||||||||||||||||||
| Benefit obligation at beginning of year |
$ | 308.6 | $ | 74.1 | $ | 382.7 | $ | 314.4 | $ | 71.0 | $ | 385.4 | $ | 6.8 | $ | 6.4 | ||||||||||||||||
| Acquisitions |
374.9 | — | 374.9 | — | — | — | 0.7 | — | ||||||||||||||||||||||||
| Service cost |
— | 2.3 | 2.3 | — | 2.1 | 2.1 | — | — | ||||||||||||||||||||||||
| Interest cost |
14.3 | 1.5 | 15.8 | 14.6 | 2.4 | 17.0 | 0.3 | 0.3 | ||||||||||||||||||||||||
| Curtailments and settlements |
(18.8 | ) | (1.7 | ) | (20.5 | ) | (25.2 | ) | (0.9 | ) | (26.1 | ) | — | — | ||||||||||||||||||
| Amendments |
— | — | — | (1.1 | ) | (1.1 | ) | — | — | |||||||||||||||||||||||
| Actuarial loss (gain) |
(16.3 | ) | (4.8 | ) | (21.1 | ) | 24.2 | 12.6 | 36.8 | (0.5 | ) | 0.3 | ||||||||||||||||||||
| Participant contributions |
— | — | — | — | — | — | 0.2 | 0.2 | ||||||||||||||||||||||||
| Benefits paid |
(22.7 | ) | (2.3 | ) | (25.0 | ) | (19.4 | ) | (3.1 | ) | (22.5 | ) | (0.5 | ) | (0.4 | ) | ||||||||||||||||
| Foreign currency translation and other |
— | (6.8 | ) | (6.8 | ) | — | (8.9 | ) | (8.9 | ) | — | — | ||||||||||||||||||||
|
|
|
|
|
|
|
|
|
|
|
|
|
|
|
|
|
|||||||||||||||||
| Benefit obligation at end of year (a) |
640.0 | 62.3 | 702.3 | 308.6 | 74.1 | 382.7 | 7.0 | 6.8 | ||||||||||||||||||||||||
|
|
|
|
|
|
|
|
|
|
|
|
|
|
|
|
|
|||||||||||||||||
| Change in plan assets: |
||||||||||||||||||||||||||||||||
| Fair value of plan assets at beginning of year |
$ | 268.5 | $ | 35.0 | $ | 303.5 | $ | 270.0 | $ | 35.7 | $ | 305.7 | $ | — | $ | — | ||||||||||||||||
| Acquisitions |
292.5 | — | 292.5 | — | — | — | — | — | ||||||||||||||||||||||||
| Actual return (loss) on plan assets |
(14.2 | ) | 0.5 | (13.7 | ) | 27.6 | 3.0 | 30.6 | — | — | ||||||||||||||||||||||
| Company contributions |
12.2 | 4.2 | 16.4 | 15.5 | 3.7 | 19.2 | 0.3 | 0.2 | ||||||||||||||||||||||||
| Settlements |
(18.8 | ) | (1.7 | ) | (20.5 | ) | (25.2 | ) | (0.9 | ) | (26.1 | ) | — | — | ||||||||||||||||||
| Participant contributions |
— | — | — | — | — | — | 0.2 | 0.2 | ||||||||||||||||||||||||
| Benefits paid |
(22.7 | ) | (2.3 | ) | (25.0 | ) | (19.4 | ) | (3.1 | ) | (22.5 | ) | (0.5 | ) | (0.4 | ) | ||||||||||||||||
| Foreign currency translation and other |
— | (3.2 | ) | (3.2 | ) | — | (3.4 | ) | (3.4 | ) | — | — | ||||||||||||||||||||
|
|
|
|
|
|
|
|
|
|
|
|
|
|
|
|
|
|||||||||||||||||
| Fair value of plan assets at end of year |
517.5 | 32.5 | 550.0 | 268.5 | 35.0 | 303.5 | — | — | ||||||||||||||||||||||||
|
|
|
|
|
|
|
|
|
|
|
|
|
|
|
|
|
|||||||||||||||||
| Net (liability) recognized in the consolidated balance sheet |
$ | (122.5 | ) | $ | (29.8 | ) | $ | (152.3 | ) | $ | (40.1 | ) | $ | (39.1 | ) | $ | (79.2 | ) | $ | (7.0 | ) | $ | (6.8 | ) | ||||||||
|
|
|
|
|
|
|
|
|
|
|
|
|
|
|
|
|
|||||||||||||||||
| Assumptions |
||||||||||||||||||||||||||||||||
| Weighted average assumption used to calculate benefit obligation: |
||||||||||||||||||||||||||||||||
| Discount rate |
4.44 | % | 2.56 | % | 4.27 | % | 3.90 | % | 2.23 | % | 3.58 | % | 4.30 | % | 3.90 | % | ||||||||||||||||
| Rate of compensation increase |
— | 2.49 | % | 2.49 | % | — | 2.44 | % | 2.44 | % | — | — | ||||||||||||||||||||
| Healthcare cost trend rate: |
||||||||||||||||||||||||||||||||
| Current |
— | — | — | — | — | — | 6.71 | % | 6.45 | % | ||||||||||||||||||||||
| Ultimate |
— | — | — | — | — | — | 4.50 | % | 4.50 | % | ||||||||||||||||||||||
| (a) | The accumulated benefit obligation for all defined benefit pension plans was $690 and $376 at December 31, 2015 and 2014, respectively. |
101
Table of Contents
Amounts recognized in the Company’s consolidated balance sheets at December 31, 2015 and 2014 consist of:
| Pension Benefits | Postretirement Benefits | |||||||||||||||
| (in millions) |
2015 | 2014 | 2015 | 2014 | ||||||||||||
| Other assets |
$ | 6.4 | $ | 5.4 | $ | — | $ | — | ||||||||
| Accrued benefit cost |
(158.7 | ) | (84.6 | ) | (7.0 | ) | (6.8 | ) | ||||||||
|
|
|
|
|
|
|
|
|
|||||||||
| Net amount recognized |
$ | (152.3 | ) | $ | (79.2 | ) | $ | (7.0 | ) | $ | (6.8 | ) | ||||
|
|
|
|
|
|
|
|
|
|||||||||
Summary of under-funded or non-funded pension benefit plans with projected benefit obligation in excess of plan assets at December 31, 2015 and 2014:
| Pension Benefits | ||||||||
| (in millions) |
2015 | 2014 | ||||||
| Projected benefit obligation |
$ | 687.8 | $ | 369.0 | ||||
| Fair value of plan assets |
529.1 | 284.5 | ||||||
Summary of pension plans with accumulated benefit obligations in excess of plan assets at December 31, 2015 and 2014:
| Pension Benefits | ||||||||
| (in millions) |
2015 | 2014 | ||||||
| Accumulated benefit obligation |
$ | 672.9 | $ | 359.5 | ||||
| Fair value of plan assets |
522.0 | 281.2 | ||||||
The Company employs a total return investment approach for its pension plans whereby a mix of equities and fixed income investments are used to maximize the long-term return of pension plan assets. The intent of this strategy is to minimize plan expenses by outperforming plan liabilities over the long run. Risk tolerance is established through careful consideration of plan liabilities, plan funded status, and the Company’s financial condition. The domestic investment portfolios contain a diversified blend of equity and fixed-income investments. The domestic equity investments are diversified across geography and market capitalization through investments in U.S. large-capitalization stocks, U.S. small-capitalization stocks and international securities. The domestic fixed income investments are primarily comprised of investment-grade and high-yield securities through investments in corporate and government bonds, government agencies and asset-backed securities. The Level 1 and Level 2 investments are primarily based upon quoted market prices and the classification between Level 1 and Level 2 is based upon the valuation frequency of the investments. The domestic Level 3 investments are primarily comprised of hedge fund of funds whose assets are primarily valued based upon the net asset value per share and an insurance contract valued at contract value. The Company maintains numerous foreign defined benefit pension plans. The asset allocations for the foreign investment may vary by plan and jurisdiction and are primarily based upon the plan structure and plan participant profile. The foreign Level 3 investments are primarily comprised of insurance contracts valued at contract value. Investment risk is measured and monitored on an ongoing basis through annual liability measurements, periodic asset/liability studies and quarterly investment portfolio reviews.
The expected long-term rate of return for plan assets is based upon many factors, including expected asset allocations, historical asset returns, current and expected future market conditions, risk and active management premiums. The expected long-term rate of return is adjusted when there are fundamental changes in expected returns on the Company’s defined benefit pension plan’s investments. The Company’s target asset allocation for 2015 and 2014 is as follows: equities—approximately 25%-40%; bonds—approximately 20%-40%; and cash alternatives investments and other—approximately 25%-45%. Actual asset allocations may vary from the targeted allocations for various reasons, including market conditions and the timing of transactions.
102
Table of Contents
The composition of domestic pension plan assets at December 31, 2015 and 2014 is as follows:
| Fair Value Measurements of Plan Assets – Domestic Plans | ||||||||||||||||
| (in millions) |
December 31, 2015 | |||||||||||||||
| Asset Category |
Level 1 | Level 2 | Level 3 | Total | ||||||||||||
| Equity securities and funds: |
||||||||||||||||
| Domestic |
$ | 115.1 | $ | 4.9 | $ | — | $ | 120.0 | ||||||||
| International |
59.3 | 29.0 | — | 88.3 | ||||||||||||
| Fixed income securities and funds |
119.9 | 28.7 | — | 148.6 | ||||||||||||
| Alternative investments |
20.7 | 95.9 | 37.8 | 154.4 | ||||||||||||
| Cash and other |
5.1 | — | 1.1 | 6.2 | ||||||||||||
|
|
|
|
|
|
|
|
|
|||||||||
| Total |
$ | 320.1 | $ | 158.5 | $ | 38.9 | $ | 517.5 | ||||||||
|
|
|
|
|
|
|
|
|
|||||||||
| Fair Value Measurements of Plan Assets – Domestic Plans | ||||||||||||||||
| (in millions) |
December 31, 2014 | |||||||||||||||
| Asset Category |
Level 1 | Level 2 | Level 3 | Total | ||||||||||||
| Equity securities and funds: |
||||||||||||||||
| Domestic |
$ | 29.0 | $ | 10.2 | $ | — | $ | 39.2 | ||||||||
| International |
— | 40.4 | — | 40.4 | ||||||||||||
| Fixed income securities and funds |
73.6 | 30.5 | — | 104.1 | ||||||||||||
| Alternative investments |
24.5 | 48.8 | 10.2 | 83.5 | ||||||||||||
| Cash and other |
0.2 | — | 1.1 | 1.3 | ||||||||||||
|
|
|
|
|
|
|
|
|
|||||||||
| Total |
$ | 127.3 | $ | 129.9 | $ | 11.3 | $ | 268.5 | ||||||||
|
|
|
|
|
|
|
|
|
|||||||||
The composition of foreign pension plan assets at December 31, 2015 and 2014 is as follows:
| Fair Value Measurements of Plan Assets – Foreign Plans | ||||||||||||||||
| (in millions) |
December 31, 2015 | |||||||||||||||
| Asset Category |
Level 1 | Level 2 | Level 3 | Total | ||||||||||||
| Equity securities and funds |
$ | 5.0 | $ | — | $ | — | $ | 5.0 | ||||||||
| Fixed income securities and funds |
12.4 | — | — | 12.4 | ||||||||||||
| Cash and other |
0.9 | — | 14.2 | 15.1 | ||||||||||||
|
|
|
|
|
|
|
|
|
|||||||||
| Total |
$ | 18.3 | $ | — | $ | 14.2 | $ | 32.5 | ||||||||
|
|
|
|
|
|
|
|
|
|||||||||
| Fair Value Measurements of Plan Assets – Foreign Plans | ||||||||||||||||
| (in millions) |
December 31, 2014 | |||||||||||||||
| Asset Category |
Level 1 | Level 2 | Level 3 | Total | ||||||||||||
| Equity securities and funds |
$ | 5.8 | $ | — | $ | — | $ | 5.8 | ||||||||
| Fixed income securities and funds |
12.7 | — | — | 12.7 | ||||||||||||
| Cash and other |
1.0 | — | 15.5 | 16.5 | ||||||||||||
|
|
|
|
|
|
|
|
|
|||||||||
| Total |
$ | 19.5 | $ | — | $ | 15.5 | $ | 35.0 | ||||||||
|
|
|
|
|
|
|
|
|
|||||||||
103
Table of Contents
The activity for Level 3 pension plan assets for 2015 and 2014 is as follows:
| Level 3 Pension Plan Assets | ||||||||
| (in millions) |
Domestic Plans |
Foreign Plans |
||||||
| Balance, December 31, 2013 |
$ | 13.8 | $ | 17.3 | ||||
| Actual return on plan assets: |
||||||||
| Relating to assets held at year-end |
0.7 | 0.4 | ||||||
| Relating to assets sold during the period |
0.2 | — | ||||||
| Purchases, sales, settlements and other, net |
(3.4 | ) | (2.2 | ) | ||||
|
|
|
|
|
|||||
| Balance, December 31, 2014 |
$ | 11.3 | $ | 15.5 | ||||
| Acquisitions |
36.0 | — | ||||||
| Actual return (loss) on plan assets: |
||||||||
| Relating to assets held at year-end |
(1.6 | ) | 0.4 | |||||
| Relating to assets sold during the period |
0.1 | — | ||||||
| Purchases, sales, settlements and other, net |
(6.9 | ) | (1.7 | ) | ||||
|
|
|
|
|
|||||
| Balance, December 31, 2015 |
$ | 38.9 | $ | 14.2 | ||||
|
|
|
|
|
|||||
Domestic Contributions
In 2016, the Company expects to make cash contributions of approximately $3 and $1 to its domestic pension and postretirement plans, respectively. These contributions are for both funded and unfunded plans and are net of participant contributions.
Foreign Contributions
The Company funds its pension plans in amounts consistent with applicable laws and regulations and expects to make cash contributions of approximately $3 in 2016.
Information about the expected benefit payments for the Company’s pension and postretirement plans are as follows:
| Years Ending December 31, |
Pension Plans |
Postretirement Plans |
||||||
| (in millions) | ||||||||
| 2016 |
$ | 45.3 | $ | 0.6 | ||||
| 2017 |
45.2 | 0.6 | ||||||
| 2018 |
45.1 | 0.6 | ||||||
| 2019 |
45.5 | 0.6 | ||||||
| 2020 |
46.5 | 0.5 | ||||||
| Next 5 years |
225.5 | 2.3 | ||||||
The current healthcare cost trend rate gradually declines through 2037 to the ultimate trend rate and remains level thereafter. A one percentage point change in assumed healthcare cost trend rates would not have a material effect on the postretirement benefit obligation or the service and interest cost components of postretirement benefit costs.
The Company sponsors a defined contribution savings plan for substantially all of its U.S. employees. Under provisions for this plan, employees may contribute a percentage of eligible compensation on both a before-tax basis and after-tax basis. The Company generally matches a percentage of a participating employee’s before-tax contributions. For 2015, 2014 and 2013, the defined contribution savings plan expense was $12.5, $8.9 and $7.8, respectively.
104
Table of Contents
16. Restructuring Costs
Restructuring costs for 2015, 2014 and 2013 are as follows:
| 2015 | ||||||||||||
| (in millions) |
Employee Terminations |
Other Charges |
Total | |||||||||
| Branded Consumables |
$ | 2.2 | $ | 3.1 | $ | 5.3 | ||||||
| Consumer Solutions |
— | 0.3 | 0.3 | |||||||||
| Outdoor Solutions |
4.5 | — | 4.5 | |||||||||
| Corporate |
— | 2.0 | 2.0 | |||||||||
|
|
|
|
|
|
|
|||||||
| Total |
$ | 6.7 | $ | 5.4 | $ | 12.1 | ||||||
|
|
|
|
|
|
|
|||||||
| 2014 | ||||||||||||
| (in millions) |
Employee Terminations |
Other Charges |
Total | |||||||||
| Branded Consumables |
$ | 3.5 | $ | 0.1 | $ | 3.6 | ||||||
| Consumer Solutions |
0.7 | 1.1 | 1.8 | |||||||||
| Outdoor Solutions |
2.1 | 0.2 | 2.3 | |||||||||
|
|
|
|
|
|
|
|||||||
| Total |
$ | 6.3 | $ | 1.4 | $ | 7.7 | ||||||
|
|
|
|
|
|
|
|||||||
| 2013 | ||||||||||||
| (in millions) |
Employee Terminations |
Other Charges |
Total | |||||||||
| Branded Consumables |
$ | 4.8 | $ | 2.2 | $ | 7.0 | ||||||
| Consumer Solutions |
2.9 | 0.4 | 3.3 | |||||||||
| Outdoor Solutions |
7.7 | 4.0 | 11.7 | |||||||||
|
|
|
|
|
|
|
|||||||
| Total |
$ | 15.4 | $ | 6.6 | $ | 22.0 | ||||||
|
|
|
|
|
|
|
|||||||
Branded Consumables Segment Restructuring Costs
During 2015, the Company initiated plans to rationalize the operating processes of certain domestic and international operations. These plans primarily consists of headcount reductions. Restructuring costs for 2015 primarily relate to these plans. For 2015, other charges are primarily comprised of lease terminations.
During 2013, the Company initiated a plan to rationalize the operating processes of certain international operations. The plan primarily consists of headcount reductions. Restructuring costs for 2013 primarily relate to this plan. For 2013, other charges are primarily comprised of lease terminations.
Outdoor Solutions Segment Restructuring Costs
During 2015, the Company initiated plans to rationalize the operating processes of certain international operations. The plan primarily consists of headcount reductions. Restructuring costs for 2015 primarily relate to these plans.
During 2013, the Company initiated a plan to rationalize the operating processes of certain international operations. The plan primarily consists of headcount reductions. Restructuring costs for 2013 primarily relate to this plan. For 2013, other charges are primarily comprised of lease and contract termination fees.
105
Table of Contents
Accrued restructuring costs activity for 2015 and 2014 are as follows:
| (in millions) |
Accrual Balance at December 31, 2014 |
Restructuring Costs, net |
Payments | Foreign Currency and Other |
Accrual Balance at December 31, 2015 |
|||||||||||||||
| Severance and other employee-related (a) |
$ | 5.4 | $ | 6.7 | $ | (5.6 | ) | $ | (0.4 | ) | $ | 6.1 | ||||||||
| Other costs (b) |
5.4 | 5.4 | (6.0 | ) | (0.2 | ) | 4.6 | |||||||||||||
|
|
|
|
|
|
|
|
|
|
|
|||||||||||
| Total |
$ | 10.8 | $ | 12.1 | $ | (11.6 | ) | $ | (0.6 | ) | $ | 10.7 | ||||||||
|
|
|
|
|
|
|
|
|
|
|
|||||||||||
| (in millions) |
Accrual Balance at December 31, 2013 |
Restructuring Costs, net |
Payments | Foreign Currency and Other |
Accrual Balance at December 31, 2014 |
|||||||||||||||
| Severance and other employee-related (a) |
$ | 16.6 | $ | 6.3 | $ | (17.2 | ) | $ | (0.3 | ) | $ | 5.4 | ||||||||
| Other costs (b) |
13.4 | 1.4 | (9.4 | ) | — | 5.4 | ||||||||||||||
|
|
|
|
|
|
|
|
|
|
|
|||||||||||
| Total |
$ | 30.0 | $ | 7.7 | $ | (26.6 | ) | $ | (0.3 | ) | $ | 10.8 | ||||||||
|
|
|
|
|
|
|
|
|
|
|
|||||||||||
| (a) | For 2015 and 2014, the total headcount underlying these costs is approximately 204 and 2,850, respectively. At December 31, 2015, approximately 70 employees have not been terminated under the plans. The amounts accrued at December 31, 2015 for severance and other employee-related are expected to be paid through 2016. |
| (b) | Amounts accrued at December 31, 2015 for other costs (principally lease and contract termination costs) are expected to be paid through 2019. |
17. Segment Information
The Company reports four business segments: Branded Consumables, Consumer Solutions, Outdoor Solutions and Process Solutions. The majority of the Company’s sales are within the United States. The Company’s international operations are mainly based in Asia, Canada, Europe and Latin America. The Company and its chief operating decision maker use “segment earnings” to measure segment operating performance.
The Branded Consumables segment manufactures or sources, markets and distributes a broad line of branded consumer products, many of which are affordable, consumable and fundamental household staples, including arts and crafts paint brushes, air fresheners, brooms, brushes, buckets, children’s card games, clothespins, collectible tins, condoms, cord, rope and twine, premium disposable tableware, dusters, dust pans, feeding bottles, fencing, fire extinguishing products, firelogs and firestarters, foam coolers, fresh preserving jars and accessories, home decor accessories, home fragrance products, kitchen matches, mops, other craft items, pacifiers, plastic cutlery, playing cards and accessories, rubber gloves and related cleaning products, safes, premium scented candles and accessories, security cameras, security doors, smoke and carbon monoxide alarms, soothers, sponges, storage organizers and workshop accessories, teats, toothpicks, travel sprays, window guards and other accessories. This segment markets our products under brand names such as Aviator®, Ball®, Bee®, Bernardin®, Bicycle®, Billy Boy®, BRK®, Crawford®, Diamond®, Envirocooler®, Fiona®, First Alert®, First Essentials®, Hoyle®, Java-Log®, KEM®, Kerr®, Lehigh®, Lifoam® Lillo®, Loew-Cornell®, Millefiori®, Mapa®, NUK®, Pine Mountain®, ProPak®, Quickie Green Cleaning®, Quickie Home-Pro®, Quickie Microban®, Quickie Original®, Quickie Professional®, Spontex®, Tigex®, Waddington, Wellington®, Yankee Candle® and YOU®, among others.
The Consumer Solutions segment manufactures or sources, markets, and distributes a diverse line of household products, including kitchen appliances and home environment products. This segment maintains a strong portfolio of globally-recognized brands including Bionaire®, Cadence®, Crock-Pot®, FoodSaver®, Health o meter®, Holmes®, Mr. Coffee®, Oster®, Patton®, Rainbow®, Rival®, Seal-a-Meal®, Sunbeam® and Villaware®.
106
Table of Contents
The principal products in this segment include: household kitchen appliances, such as blenders, coffeemakers, irons, mixers, slow cookers, tea kettles, toasters, toaster ovens and vacuum packaging machines; home environmental products, such as air purifiers, fans, heaters, humidifiers and vacuum cleaning systems; clippers, trimmers and other hair care products for professional use in the beauty and barber and animal categories; electric blankets, heating pads, mattress pads and throws; products for the hospitality industry; and scales for consumer use. The Consumer Solutions segment also has rights to sell various small appliance products, in substantially all of Europe under the Breville® brand name.
The Outdoor Solutions segment manufactures or sources, markets and distributes global consumer active lifestyle products for outdoor and outdoor-related activities. For general outdoor activities, the Outdoor Solutions segment is a leading provider of active lifestyle products, offering an array of products that include camping and outdoor equipment such as air beds, camping stoves, coolers, foldable furniture, gas grills, lanterns and flashlights, sleeping bags, tents and water recreation products such as inflatable boats, kayaks and tow-behinds under brand names such as Campingaz®, Coleman®, Esky® and Invicta®. The Outdoor Solutions segment is also a leading provider of fishing equipment under brand names such as Abu Garcia®, All Star®, Berkley®, Fenwick®, Greys®, Gulp!®, Hardy®, JRC™, Mitchell®, PENN®, Pflueger®, Sebile®, Sevenstrand®, Shakespeare®, Spiderwire®, Stren®, Trilene®, Ugly Stik® and Xtools®. Team sports equipment for baseball, softball, football, basketball and lacrosse products are sold under brand names such as deBeer®, Gait®, Miken®, Rawlings® and Worth®. Alpine and nordic skiing, snowboarding, snowshoeing and in-line skating products are sold under brand names such as Atlas®, Dalbello®, Full Tilt®, K2®, Line®, Little Bear®, Madshus®, Marker®, Morrow®, Ride®, Tubbs®, Völkl® and 5150®. Water sports equipment, personal flotation devices and all-terrain vehicle gear are sold under brand names such as Helium®, Hodgman®, MadDog Gear®, Sevylor®, Sospenders® and Stearns®. The Company also sells high performance technical and outdoor apparel and equipment under brand names such as CAPP3L®, Ex Officio®, K2®, Marker®, Marmot®, Planet Earth®, Ride®, Squadra®, Völkl® and Zoot®, and premium air beds under the AeroBed® brand. Additionally, the Company provides a product portfolio of high-quality class and championship rings and other jewelry, caps and gowns, diplomas, varsity jackets, yearbooks and other accessories, among others, under the Jostens® brand.
The Process Solutions segment manufactures, markets and distributes a wide variety of plastic products including closures, contact lens packaging, medical disposables, plastic cutlery and rigid packaging. Many of these products are consumable in nature or represent components of consumer products. This segment’s materials business produces specialty nylon polymers, conductive fibers and monofilament used in various products, including woven mats used by paper producers and weed trimmer cutting line, as well as fiberglass radio antennas for marine, citizen band and military applications. This segment is also a leading North American producer of niche products fabricated from solid zinc strip and is the sole source supplier of copper-plated zinc penny blanks to the United States Mint and a major supplier to the Royal Canadian Mint, as well as a supplier of brass, bronze and nickel-plated finishes on steel and zinc for coinage to other international markets. In addition, the Company manufactures a line of industrial zinc products marketed globally for use in the architectural, automotive, construction, electrical component and plumbing markets.
107
Table of Contents
Segment information as of and for the years ended December 31, 2015, 2014 and 2013 is as follows:
| 2015 | ||||||||||||||||||||||||||||||||
| (in millions) |
Branded Consumables |
Consumer Solutions |
Outdoor Solutions |
Process Solutions |
Intercompany Eliminations |
Total Operating Segments |
Corporate/ Unallocated |
Consolidated | ||||||||||||||||||||||||
| Net sales |
$ | 3,338.6 | $ | 2,167.1 | $ | 2,736.6 | $ | 452.4 | $ | (90.8 | ) | $ | 8,603.9 | $ | — | $ | 8,603.9 | |||||||||||||||
|
|
|
|
|
|
|
|
|
|
|
|
|
|
|
|
|
|||||||||||||||||
| Segment earnings (loss) |
638.3 | 329.6 | 305.7 | 60.1 | — | 1,333.7 | (131.7 | ) | 1,202.0 | |||||||||||||||||||||||
| Adjustments to reconcile to reported operating earnings (loss): |
||||||||||||||||||||||||||||||||
| Fair market value adjustment to inventory |
(18.2 | ) | — | (18.7 | ) | — | — | (36.9 | ) | — | (36.9 | ) | ||||||||||||||||||||
| Restructuring costs, net |
(5.4 | ) | (0.3 | ) | (4.4 | ) | — | — | (10.1 | ) | (2.0 | ) | (12.1 | ) | ||||||||||||||||||
| Acquisition-related and other costs |
(29.3 | ) | (17.5 | ) | (34.1 | ) | (0.5 | ) | — | (81.4 | ) | (23.3 | ) | (104.7 | ) | |||||||||||||||||
| Venezuela-related charges |
— | — | — | — | — | — | (60.6 | ) | (60.6 | ) | ||||||||||||||||||||||
| Other (a) |
— | — | — | — | — | — | (83.8 | ) | (83.8 | ) | ||||||||||||||||||||||
| Impairment of goodwill, intangibles and other assets |
(5.2 | ) | — | (145.6 | ) | — | — | (150.8 | ) | — | (150.8 | ) | ||||||||||||||||||||
| Depreciation and amortization |
(119.9 | ) | (38.2 | ) | (68.8 | ) | (11.8 | ) | — | (238.7 | ) | (6.7 | ) | (245.4 | ) | |||||||||||||||||
|
|
|
|
|
|
|
|
|
|
|
|
|
|
|
|
|
|||||||||||||||||
| Operating earnings (loss) |
$ | 460.3 | $ | 273.6 | $ | 34.1 | $ | 47.8 | $ | — | $ | 815.8 | $ | (308.1 | ) | $ | 507.7 | |||||||||||||||
|
|
|
|
|
|
|
|
|
|
|
|
|
|
|
|
|
|||||||||||||||||
| Other segment data: |
||||||||||||||||||||||||||||||||
| Total assets |
$ | 5,936.3 | $ | 2,235.0 | $ | 4,826.6 | $ | 198.5 | $ | — | $ | 13,196.4 | $ | 1,096.7 | $ | 14,293.1 | ||||||||||||||||
| Capital expenditures |
109.5 | 27.7 | 52.5 | 13.2 | — | 202.9 | 11.7 | 214.6 | ||||||||||||||||||||||||
| 2014 | ||||||||||||||||||||||||||||||||
| (in millions) |
Branded Consumables |
Consumer Solutions |
Outdoor Solutions |
Process Solutions |
Intercompany Eliminations |
Total Operating Segments |
Corporate/ Unallocated |
Consolidated | ||||||||||||||||||||||||
| Net sales |
$ | 2,993.6 | $ | 2,211.6 | $ | 2,739.2 | $ | 427.5 | $ | (84.8 | ) | $ | 8,287.1 | $ | — | $ | 8,827.1 | |||||||||||||||
|
|
|
|
|
|
|
|
|
|
|
|
|
|
|
|
|
|||||||||||||||||
| Segment earnings (loss) |
520.6 | 358.0 | 302.3 | 52.0 | — | 1,232.9 | (128.9 | ) | 1,104.0 | |||||||||||||||||||||||
| Adjustments to reconcile to reported operating earnings (loss): |
||||||||||||||||||||||||||||||||
| Fair market value adjustment to inventory |
(2.1 | ) | (21.3 | ) | — | — | — | (23.4 | ) | — | (23.4 | ) | ||||||||||||||||||||
| Restructuring costs, net |
(3.6 | ) | (1.8 | ) | (2.3 | ) | — | — | (7.7 | ) | — | (7.7 | ) | |||||||||||||||||||
| Acquisition-related and other costs (b) |
(19.6 | ) | 27.8 | (41.1 | ) | — | — | (32.9 | ) | (9.1 | ) | (42.0 | ) | |||||||||||||||||||
| Venezuela-related charges |
— | — | — | — | — | — | (174.6 | ) | (174.6 | ) | ||||||||||||||||||||||
| Impairment of goodwill, intangibles and other assets |
(13.9 | ) | (0.7 | ) | (9.9 | ) | (0.9 | ) | — | (25.4 | ) | — | (25.4 | ) | ||||||||||||||||||
| Depreciation and amortization |
(86.1 | ) | (32.4 | ) | (55.6 | ) | (11.3 | ) | — | (185.4 | ) | (5.7 | ) | (191.1 | ) | |||||||||||||||||
|
|
|
|
|
|
|
|
|
|
|
|
|
|
|
|
|
|||||||||||||||||
| Operating earnings (loss) |
$ | 395.3 | $ | 329.6 | $ | 193.4 | $ | 39.8 | $ | — | $ | 958.1 | $ | (318.3 | ) | $ | 639.8 | |||||||||||||||
|
|
|
|
|
|
|
|
|
|
|
|
|
|
|
|
|
|||||||||||||||||
| Other segment data: |
||||||||||||||||||||||||||||||||
| Total assets |
$ | 4,223.1 | $ | 2,516.5 | $ | 2,829.4 | $ | 194.1 | $ | — | $ | 9,763.1 | $ | 1,036.2 | $ | 10,799.3 | ||||||||||||||||
| Capital expenditures |
92.3 | 28.6 | 57.3 | 17.6 | — | 195.8 | 6.3 | 202.1 | ||||||||||||||||||||||||
108
Table of Contents
| 2013 | ||||||||||||||||||||||||||||||||
| (in millions) |
Branded Consumables |
Consumer Solutions |
Outdoor Solutions |
Process Solutions |
Intercompany Eliminations |
Total Operating Segments |
Corporate/ Unallocated |
Consolidated | ||||||||||||||||||||||||
| Net sales |
$ | 2,266.6 | $ | 2,040.0 | $ | 2,724.4 | $ | 403.6 | $ | (78.7 | ) | $ | 7,355.9 | $ | — | $ | 7,355.9 | |||||||||||||||
|
|
|
|
|
|
|
|
|
|
|
|
|
|
|
|
|
|||||||||||||||||
| Segment earnings (loss) |
411.1 | 307.2 | 298.4 | 51.7 | — | 1,068.4 | (132.4 | ) | 936.0 | |||||||||||||||||||||||
| Adjustments to reconcile to reported operating earnings (loss): |
||||||||||||||||||||||||||||||||
| Fair market value adjustment to inventory |
(82.4 | ) | — | (7.4 | ) | — | — | (89.8 | ) | — | (89.8 | ) | ||||||||||||||||||||
| Restructuring costs, net |
(7.0 | ) | (3.3 | ) | (11.7 | ) | — | — | (22.0 | ) | — | (22.0 | ) | |||||||||||||||||||
| Acquisition-related and other costs (c) |
(7.4 | ) | (1.4 | ) | (25.9 | ) | — | — | (34.7 | ) | 17.1 | (17.6 | ) | |||||||||||||||||||
| Venezuela-related charges |
— | — | — | — | — | — | (29.0 | ) | (29.0 | ) | ||||||||||||||||||||||
| Other (d) |
— | — | — | — | — | — | (38.8 | ) | (38.8 | ) | ||||||||||||||||||||||
| Depreciation and amortization |
(60.8 | ) | (32.5 | ) | (57.3 | ) | (11.3 | ) | — | (161.9 | ) | (4.0 | ) | (165.9 | ) | |||||||||||||||||
|
|
|
|
|
|
|
|
|
|
|
|
|
|
|
|
|
|||||||||||||||||
| Operating earnings (loss) |
$ | 253.5 | $ | 270.0 | $ | 196.1 | $ | 40.4 | $ | — | $ | 760.0 | $ | (187.1 | ) | $ | 572.9 | |||||||||||||||
|
|
|
|
|
|
|
|
|
|
|
|
|
|
|
|
|
|||||||||||||||||
| Other segment data: |
||||||||||||||||||||||||||||||||
| Capital expenditures |
$ | 39.0 | $ | 39.0 | $ | 87.2 | $ | 8.4 | $ | — | $ | 173.6 | $ | 37.4 | $ | 211.0 | ||||||||||||||||
| (a) | Primarily comprised of the cumulative stock-based compensation related to certain restricted stock awards where compensation expense was not previously recognized (see Note 13). |
| (b) | Consolidated amount includes a gain of $38.7 on the sale of an Asian manufacturing facility recorded in the Consumer Solutions segment. |
| (c) | Consolidated amount includes a net gain on the sale of certain domestic assets recorded in the Corporate segment. |
| (d) | Represents stock-based compensation related to a grant of common stock to certain executive officers (see Note 13). |
Note: Intersegment sales are recorded at cost plus an agreed upon profit.
Geographic Information
Geographic information as of and for the years ended December 31, 2015, 2014 and 2013 is as follows:
| (in millions) |
Domestic | International | Total | |||||||||
| 2015 |
||||||||||||
| Net sales |
$ | 5,558.1 | $ | 3,045.8 | $ | 8,603.9 | ||||||
| Property, plant and equipment, net |
732.3 | 342.1 | 1,074.4 | |||||||||
| 2014 |
||||||||||||
| Net sales |
$ | 5,085.2 | $ | 3,201.9 | $ | 8,287.1 | ||||||
| Property, plant and equipment, net |
516.0 | 333.9 | 849.9 | |||||||||
| 2013 |
||||||||||||
| Net sales |
$ | 4,482.7 | $ | 2,873.2 | $ | 7,355.9 | ||||||
109
Table of Contents
18. Accumulated Other Comprehensive Income (Loss)
AOCI activity for 2015 is as follows:
| (in millions) |
Cumulative Translation Adjustment |
Derivative Financial Instruments |
Accrued Benefit Cost |
AOCI | ||||||||||||
| AOCI at December 31, 2014 |
$ | (139.5 | ) | $ | 13.4 | $ | (54.6 | ) | $ | (180.7 | ) | |||||
| AOCI activity, net of tax: |
||||||||||||||||
| OCI excluding reclassifications |
(185.7 | ) | 42.9 | 40.7 | (102.1 | ) | ||||||||||
| Reclassifications to earnings |
— | (39.6 | ) | (39.7 | ) | (79.3 | ) | |||||||||
|
|
|
|
|
|
|
|
|
|||||||||
| OCI, net of tax |
(185.7 | ) | 3.3 | 1.0 | (181.4 | ) | ||||||||||
|
|
|
|
|
|
|
|
|
|||||||||
| AOCI at December 31, 2015 |
$ | (325.2 | ) | $ | 16.7 | $ | (53.6 | ) | $ | (362.1 | ) | |||||
|
|
|
|
|
|
|
|
|
|||||||||
For 2015, 2014 and 2013 reclassifications from AOCI to the results of operations for the Company’s pension and postretirement benefit plans were an expense of $11.9, $9.7 and $7.4, respectively, and primarily represent the amortization of net actuarial losses and plan settlements (see Note 15). For 2015, 2014 and 2013, reclassifications from AOCI to the results of operations for the Company’s derivative financial instruments for effective cash flow hedges were income of $32.4, $6.3 and $18.2, respectively (see Note 10).
The income tax (provision) benefit allocated to the components of OCI for 2015, 2014 and 2013 is as follows:
| (in millions) |
2015 | 2014 | 2013 | |||||||||
| Cumulative translation adjustment |
$ | (12.3 | ) | $ | (12.5 | ) | $ | — | ||||
| Derivative financial instruments |
0.6 | (6.0 | ) | (2.3 | ) | |||||||
| Accrued benefit cost |
0.7 | 4.2 | (14.5 | ) | ||||||||
| Unrealized gain on investment |
— | 0.1 | — | |||||||||
|
|
|
|
|
|
|
|||||||
| Income tax (provision) benefit related to OCI |
$ | (11.0 | ) | $ | (14.2 | ) | $ | (16.8 | ) | |||
|
|
|
|
|
|
|
|||||||
19. Condensed Consolidating Financial Data
The Company provides condensed consolidating financial data for its subsidiaries that are guarantors of its registered public debt. The Company’s 6 1⁄8% Senior Notes due 2022 and Senior Subordinated Notes (see Note 9) are fully guaranteed, jointly and severally, by certain of the Company’s domestic subsidiaries (“Guarantor Subsidiaries”). The guarantees of the Guarantor Subsidiaries are subject to release only in certain limited circumstances. The Company’s non-United States subsidiaries and those domestic subsidiaries who are not guarantors (“Non-Guarantor Subsidiaries”) are not guaranteeing these notes. Presented below is the condensed consolidating financial data of the Company (“Parent”), the Guarantor Subsidiaries and the Non-Guarantor Subsidiaries on a consolidated basis, using the equity method of accounting for subsidiaries, as of and for the years ended December 31, 2015, 2014 and 2013.
110
Table of Contents
Condensed Consolidating Results of Operations
| Year Ended December 31, 2015 | ||||||||||||||||||||
| (in millions) |
Parent | Guarantor Subsidiaries |
Non- Guarantor Subsidiaries |
Eliminations | Consolidated | |||||||||||||||
| Net sales |
$ | — | $ | 5,966.6 | $ | 3,465.0 | $ | (827.7 | ) | $ | 8,603.9 | |||||||||
| Cost of sales |
— | 4,212.6 | 2,527.1 | (827.7 | ) | 5,912.0 | ||||||||||||||
|
|
|
|
|
|
|
|
|
|
|
|||||||||||
| Gross profit |
— | 1,754.0 | 937.9 | — | 2,691.9 | |||||||||||||||
| Selling, general and administrative expenses |
207.3 | 1,122.3 | 691.7 | — | 2,021.3 | |||||||||||||||
| Restructuring costs, net |
2.0 | 4.8 | 5.3 | — | 12.1 | |||||||||||||||
| Impairment of goodwill, intangibles and other assets |
— | 126.6 | 24.2 | — | 150.8 | |||||||||||||||
|
|
|
|
|
|
|
|
|
|
|
|||||||||||
| Operating earnings (loss) |
(209.3 | ) | 500.3 | 216.7 | — | 507.7 | ||||||||||||||
| Interest expense, net |
174.2 | 38.2 | 13.7 | — | 226.1 | |||||||||||||||
|
|
|
|
|
|
|
|
|
|
|
|||||||||||
| Income (loss) before taxes and equity earnings of subsidiaries |
(383.5 | ) | 462.1 | 203.0 | — | 281.6 | ||||||||||||||
| Income tax provision (benefit) |
(139.3 | ) | 198.7 | 75.7 | — | 135.1 | ||||||||||||||
| Equity earnings of subsidiaries |
390.7 | 89.1 | — | (479.8 | ) | — | ||||||||||||||
|
|
|
|
|
|
|
|
|
|
|
|||||||||||
| Net income (loss) |
146.5 | 352.5 | 127.3 | (479.8 | ) | 146.5 | ||||||||||||||
| Other comprehensive income (loss), net of |
(181.4 | ) | (136.5 | ) | (165.1 | ) | 301.6 | (181.4 | ) | |||||||||||
|
|
|
|
|
|
|
|
|
|
|
|||||||||||
| Comprehensive income (loss) |
$ | (34.9 | ) | $ | 216.0 | $ | (37.8 | ) | $ | (178.2 | ) | $ | (34.9 | ) | ||||||
|
|
|
|
|
|
|
|
|
|
|
|||||||||||
| Year Ended December 31, 2014 | ||||||||||||||||||||
| (in millions) |
Parent | Guarantor Subsidiaries |
Non-Guarantor Subsidiaries |
Eliminations | Consolidated | |||||||||||||||
| Net sales |
$ | — | $ | 5,678.9 | $ | 3,407.1 | $ | (798.9 | ) | $ | 8,287.1 | |||||||||
| Cost of sales |
— | 4,064.8 | 2,388.3 | (798.9 | ) | 5,654.2 | ||||||||||||||
|
|
|
|
|
|
|
|
|
|
|
|||||||||||
| Gross profit |
— | 1,614.1 | 1,018.8 | — | 2,632.9 | |||||||||||||||
| Selling, general and administrative expenses |
104.8 | 1,130.3 | 724.9 | — | 1,960.0 | |||||||||||||||
| Restructuring costs, net |
— | — | 7.7 | — | 7.7 | |||||||||||||||
| Impairment of goodwill, intangibles and other assets |
— | 23.2 | 2.2 | — | 25.4 | |||||||||||||||
|
|
|
|
|
|
|
|
|
|
|
|||||||||||
| Operating earnings (loss) |
(104.8 | ) | 460.6 | 284.0 | — | 639.8 | ||||||||||||||
| Interest expense, net |
171.9 | 31.3 | 7.1 | — | 210.3 | |||||||||||||||
| Loss on early extinguishment of debt |
56.7 | — | — | — | 56.7 | |||||||||||||||
|
|
|
|
|
|
|
|
|
|
|
|||||||||||
| Income (loss) before taxes and equity earnings of subsidiaries |
(333.4 | ) | 429.3 | 276.9 | — | 372.8 | ||||||||||||||
| Income tax provision (benefit) |
(126.1 | ) | 162.4 | 94.0 | — | 130.3 | ||||||||||||||
| Equity earnings of subsidiaries |
449.8 | 156.1 | — | (605.9 | ) | — | ||||||||||||||
|
|
|
|
|
|
|
|
|
|
|
|||||||||||
| Net income (loss) |
242.5 | 423.0 | 182.9 | (605.9 | ) | 242.5 | ||||||||||||||
| Other comprehensive income (loss), net of tax |
(122.1 | ) | (160.9 | ) | (191.8 | ) | 352.7 | (122.1 | ) | |||||||||||
|
|
|
|
|
|
|
|
|
|
|
|||||||||||
| Comprehensive income (loss) |
$ | 120.4 | $ | 262.1 | $ | (8.9 | ) | $ | (253.2 | ) | $ | 120.4 | ||||||||
|
|
|
|
|
|
|
|
|
|
|
|||||||||||
111
Table of Contents
| Year Ended December 31, 2013 | ||||||||||||||||||||
| (in millions) |
Parent | Guarantor Subsidiaries |
Non-Guarantor Subsidiaries |
Eliminations | Consolidated | |||||||||||||||
| Net sales |
$ | — | $ | 4,930.5 | $ | 3,191.7 | $ | (766.3 | ) | $ | 7,355.9 | |||||||||
| Cost of sales |
— | 3,732.3 | 2,275.2 | (766.3 | ) | 5,241.2 | ||||||||||||||
|
|
|
|
|
|
|
|
|
|
|
|||||||||||
| Gross profit |
— | 1,198.2 | 916.5 | — | 2,114.7 | |||||||||||||||
| Selling, general and administrative expenses |
133.8 | 804.6 | 581.4 | — | 1,519.8 | |||||||||||||||
| Restructuring costs, net |
— | 5.8 | 16.2 | — | 22.0 | |||||||||||||||
|
|
|
|
|
|
|
|
|
|
|
|||||||||||
| Operating earnings (loss) |
(133.8 | ) | 387.8 | 318.9 | — | 572.9 | ||||||||||||||
| Interest expense, net |
199.3 | (21.8 | ) | 17.9 | — | 195.4 | ||||||||||||||
| Loss on early extinguishment of debt |
25.9 | — | — | — | 25.9 | |||||||||||||||
|
|
|
|
|
|
|
|
|
|
|
|||||||||||
| Income (loss) before taxes and equity earnings of subsidiaries |
(359.0 | ) | 409.6 | 301.0 | — | 351.6 | ||||||||||||||
| Income tax provision (benefit) |
(124.9 | ) | 165.9 | 106.7 | — | 147.7 | ||||||||||||||
| Equity earnings of subsidiaries |
438.0 | 145.0 | — | (583.0 | ) | — | ||||||||||||||
|
|
|
|
|
|
|
|
|
|
|
|||||||||||
| Net income (loss) |
203.9 | 388.7 | 194.3 | (583.0 | ) | 203.9 | ||||||||||||||
| Other comprehensive income (loss), net of tax |
(5.2 | ) | (2.0 | ) | (26.1 | ) | 28.1 | (5.2 | ) | |||||||||||
|
|
|
|
|
|
|
|
|
|
|
|||||||||||
| Comprehensive income (loss) |
$ | 198.7 | $ | 386.7 | $ | 168.2 | $ | (554.9 | ) | $ | 198.7 | |||||||||
|
|
|
|
|
|
|
|
|
|
|
|||||||||||
Condensed Consolidating Balance Sheets
| As of December 31, 2015 | ||||||||||||||||||||
| (in millions) |
Parent | Guarantor Subsidiaries |
Non-Guarantor Subsidiaries |
Eliminations | Consolidated | |||||||||||||||
| Assets: |
||||||||||||||||||||
| Cash and cash equivalents |
$ | 879.6 | $ | 7.6 | $ | 411.2 | $ | — | $ | 1,298.4 | ||||||||||
| Accounts receivable |
— | 5.4 | 1,305.0 | — | 1,310.4 | |||||||||||||||
| Inventories |
— | 990.6 | 792.6 | — | 1,783.2 | |||||||||||||||
| Other current assets |
53.6 | 69.7 | 139.0 | — | 262.3 | |||||||||||||||
|
|
|
|
|
|
|
|
|
|
|
|||||||||||
| Total current assets |
933.2 | 1,073.3 | 2,647.8 | — | 4,654.3 | |||||||||||||||
|
|
|
|
|
|
|
|
|
|
|
|||||||||||
| Property, plant and equipment, net |
50.8 | 504.3 | 519.3 | — | 1,074.4 | |||||||||||||||
| Goodwill |
— | 3,069.8 | 1,190.6 | — | 4,260.4 | |||||||||||||||
| Intangibles, net |
— | 3,008.1 | 1,086.5 | — | 4,094.6 | |||||||||||||||
| Intercompany receivables |
6,237.9 | 4,947.3 | 4,560.9 | (15,746.1 | ) | — | ||||||||||||||
| Investment in subsidiaries |
8,161.1 | 2,111.4 | — | (10,272.5 | ) | — | ||||||||||||||
| Other non-current assets |
66.7 | 8.9 | 133.8 | — | 209.4 | |||||||||||||||
|
|
|
|
|
|
|
|
|
|
|
|||||||||||
| Total assets |
$ | 15,449.7 | $ | 14,723.1 | $ | 10,138.9 | $ | (26,018.6 | ) | $ | 14,293.1 | |||||||||
|
|
|
|
|
|
|
|
|
|
|
|||||||||||
| Liabilities and stockholders’ equity: |
||||||||||||||||||||
| Short-term debt and current portion of long-term debt |
$ | 66.5 | $ | 1.8 | $ | 525.2 | $ | — | $ | 593.5 | ||||||||||
| Accounts payable |
8.3 | 493.4 | 311.5 | — | 813.2 | |||||||||||||||
| Other current liabilities |
94.3 | 289.4 | 484.9 | — | 868.6 | |||||||||||||||
|
|
|
|
|
|
|
|
|
|
|
|||||||||||
| Total current liabilities |
169.1 | 784.6 | 1,321.6 | — | 2,275.3 | |||||||||||||||
|
|
|
|
|
|
|
|
|
|
|
|||||||||||
| Long-term debt |
5,774.6 | 4.1 | 8.8 | — | 5,787.5 | |||||||||||||||
| Intercompany payables |
5,172.4 | 4,126.7 | 6,447.0 | (15,746.1 | ) | — | ||||||||||||||
| Deferred taxes on income |
60.5 | 1,154.5 | 388.5 | — | 1,603.5 | |||||||||||||||
| Other non-current liabilities |
220.8 | 146.6 | 207.1 | — | 574.5 | |||||||||||||||
| Total stockholders’ equity |
4,052.3 | 8,506.6 | 1,765.9 | (10,272.5 | ) | 4,052.3 | ||||||||||||||
|
|
|
|
|
|
|
|
|
|
|
|||||||||||
| Total liabilities and stockholders’ equity |
$ | 15,449.7 | $ | 14,723.1 | $ | 10,138.9 | $ | (26,018.6 | ) | $ | 14,293.1 | |||||||||
|
|
|
|
|
|
|
|
|
|
|
|||||||||||
112
Table of Contents
| As of December 31, 2014 | ||||||||||||||||||||
| (in millions) |
Parent | Guarantor Subsidiaries |
Non-Guarantor Subsidiaries |
Eliminations | Consolidated | |||||||||||||||
| Assets: |
||||||||||||||||||||
| Cash and cash equivalents |
$ | 728.8 | $ | 9.3 | $ | 426.7 | $ | — | $ | 1,164.8 | ||||||||||
| Accounts receivable |
— | 1.2 | 1,276.7 | — | 1,277.9 | |||||||||||||||
| Inventories |
— | 919.4 | 585.3 | — | 1,504.7 | |||||||||||||||
| Other current assets |
38.3 | 161.7 | 170.6 | — | 370.6 | |||||||||||||||
|
|
|
|
|
|
|
|
|
|
|
|||||||||||
| Total current assets |
767.1 | 1,091.6 | 2,459.3 | — | 4,318.0 | |||||||||||||||
|
|
|
|
|
|
|
|
|
|
|
|||||||||||
| Property, plant and equipment, net |
47.0 | 456.5 | 346.4 | — | 849.9 | |||||||||||||||
| Goodwill |
— | 2,572.0 | 308.2 | — | 2,880.2 | |||||||||||||||
| Intangibles, net |
— | 2,350.7 | 247.8 | — | 2,598.5 | |||||||||||||||
| Intercompany receivables |
4,641.2 | 4,758.6 | 4,547.7 | (13,947.5 | ) | — | ||||||||||||||
| Investment in subsidiaries |
7,111.3 | 2,029.1 | — | (9,140.4 | ) | — | ||||||||||||||
| Other non-current assets |
56.4 | 26.9 | 69.4 | — | 152.7 | |||||||||||||||
|
|
|
|
|
|
|
|
|
|
|
|||||||||||
| Total assets |
$ | 12,623.0 | $ | 13,285.4 | $ | 7,978.8 | $ | (23,087.9 | ) | $ | 10,799.3 | |||||||||
|
|
|
|
|
|
|
|
|
|
|
|||||||||||
| Liabilities and stockholders’ equity: |
||||||||||||||||||||
| Short-term debt and current portion of long-term debt |
$ | 47.0 | $ | 1.6 | $ | 546.3 | $ | — | $ | 594.9 | ||||||||||
| Accounts payable |
8.7 | 529.8 | 271.4 | — | 809.9 | |||||||||||||||
| Other current liabilities |
63.6 | 337.4 | 271.4 | — | 672.4 | |||||||||||||||
|
|
|
|
|
|
|
|
|
|
|
|||||||||||
| Total current liabilities |
119.3 | 868.8 | 1,089.1 | — | 2,077.2 | |||||||||||||||
|
|
|
|
|
|
|
|
|
|
|
|||||||||||
| Long-term debt |
4,442.0 | 4.2 | 17.8 | — | 4,464.0 | |||||||||||||||
| Intercompany payables |
5,197.4 | 4,044.0 | 4,706.1 | (13,947.5 | ) | — | ||||||||||||||
| Deferred taxes on income |
100.4 | 1,039.3 | 82.4 | — | 1,222.1 | |||||||||||||||
| Other non-current liabilities |
154.6 | 160.5 | 111.6 | — | 426.7 | |||||||||||||||
| Total stockholders’ equity |
2,609.3 | 7,168.6 | 1,971.8 | (9,140.4 | ) | 2,609.3 | ||||||||||||||
|
|
|
|
|
|
|
|
|
|
|
|||||||||||
| Total liabilities and stockholders’ equity |
$ | 12,623.0 | $ | 13,285.4 | $ | 7,978.8 | $ | (23,087.9 | ) | $ | 10,799.3 | |||||||||
|
|
|
|
|
|
|
|
|
|
|
|||||||||||
113
Table of Contents
Condensed Consolidating Statements of Cash Flows
| Year Ended December 31, 2015 | ||||||||||||||||||||
| (in millions) |
Parent | Guarantor Subsidiaries |
Non-Guarantor Subsidiaries |
Eliminations | Consolidated | |||||||||||||||
| Net cash provided by (used in) operating activities: |
$ | (137.6 | ) | $ | 1,080.3 | $ | (248.8 | ) | $ | (9.2 | ) | $ | 684.7 | |||||||
| Financing activities: |
||||||||||||||||||||
| Net change in short-term debt |
— | (0.9 | ) | (33.1 | ) | — | (34.0 | ) | ||||||||||||
| (Payments on) proceeds from intercompany transactions |
545.3 | (932.5 | ) | 382.6 | 4.6 | — | ||||||||||||||
| Proceeds from issuance of long-term debt |
1,386.0 | — | 3.8 | — | 1,389.8 | |||||||||||||||
| Payments on long-term debt |
(52.6 | ) | (0.8 | ) | (1.3 | ) | — | (54.7 | ) | |||||||||||
| Issuance (repurchase) of common stock, net |
1,315.5 | — | — | — | 1,315.5 | |||||||||||||||
| Excess tax benefits from stock-based compensation |
25.9 | — | — | — | 25.9 | |||||||||||||||
| Other |
(17.7 | ) | (0.4 | ) | (5.7 | ) | — | (23.8 | ) | |||||||||||
|
|
|
|
|
|
|
|
|
|
|
|||||||||||
| Net cash provided by (used in) financing activities |
3,202.4 | (934.6 | ) | 346.3 | 4.6 | 2,618.7 | ||||||||||||||
|
|
|
|
|
|
|
|
|
|
|
|||||||||||
| Investing activities: |
||||||||||||||||||||
| Additions to property, plant and equipment |
(11.7 | ) | (133.7 | ) | (69.2 | ) | — | (214.6 | ) | |||||||||||
| Acquisition of business, net of cash acquired |
(2,904.0 | ) | (7.0 | ) | (26.1 | ) | — | (2,937.1 | ) | |||||||||||
| Intercompany investing activities, net |
— | (4.6 | ) | — | 4.6 | — | ||||||||||||||
| Other |
1.7 | (2.1 | ) | 35.0 | — | 34.6 | ||||||||||||||
|
|
|
|
|
|
|
|
|
|
|
|||||||||||
| Net cash used in investing activities |
(2,914.0 | ) | (147.4 | ) | (60.3 | ) | 4.6 | (3,117.1 | ) | |||||||||||
|
|
|
|
|
|
|
|
|
|
|
|||||||||||
| Effect of exchange rate changes on cash |
— | — | (52.7 | ) | — | (52.7 | ) | |||||||||||||
|
|
|
|
|
|
|
|
|
|
|
|||||||||||
| Net increase (decrease) in cash and cash equivalents |
150.8 | (1.7 | ) | (15.5 | ) | — | 133.6 | |||||||||||||
| Cash and cash equivalents at beginning of year |
728.8 | 9.3 | 426.7 | — | 1,164.8 | |||||||||||||||
|
|
|
|
|
|
|
|
|
|
|
|||||||||||
| Cash and cash equivalents at end of year |
$ | 879.6 | $ | 7.6 | $ | 411.2 | $ | — | $ | 1,298.4 | ||||||||||
|
|
|
|
|
|
|
|
|
|
|
|||||||||||
114
Table of Contents
| Year Ended December 31, 2014 | ||||||||||||||||||||
| (in millions) |
Parent | Guarantor Subsidiaries |
Non-Guarantor Subsidiaries |
Eliminations | Consolidated | |||||||||||||||
| Net cash provided by (used in) operating activities: |
$ | (145.5 | ) | $ | 555.1 | $ | 236.5 | $ | (19.1 | ) | $ | 627.0 | ||||||||
| Financing activities: |
||||||||||||||||||||
| Net change in short-term debt |
— | — | 25.4 | — | 25.4 | |||||||||||||||
| (Payments on) proceeds from intercompany transactions |
11.8 | (74.9 | ) | 44.0 | 19.1 | — | ||||||||||||||
| Proceeds from issuance of long-term debt |
1,752.5 | 1.6 | 10.7 | — | 1,764.8 | |||||||||||||||
| Payments on long-term debt |
(1,245.7 | ) | (1.5 | ) | (0.8 | ) | — | (1,248.0 | ) | |||||||||||
| Issuance (repurchase) of common stock, net |
(285.3 | ) | — | — | — | (285.3 | ) | |||||||||||||
| Excess tax benefits from stock-based compensation |
38.0 | — | — | — | 38.0 | |||||||||||||||
| Other |
(21.4 | ) | (7.6 | ) | (0.4 | ) | — | (29.4 | ) | |||||||||||
|
|
|
|
|
|
|
|
|
|
|
|||||||||||
| Net cash provided by (used in) financing activities |
249.9 | (82.4 | ) | 78.9 | 19.1 | 265.5 | ||||||||||||||
|
|
|
|
|
|
|
|
|
|
|
|||||||||||
| Investing activities: |
||||||||||||||||||||
| Additions to property, plant and equipment |
(6.2 | ) | (129.0 | ) | (66.9 | ) | — | (202.1 | ) | |||||||||||
| Acquisition of business, net of cash acquired |
— | (340.5 | ) | (176.9 | ) | — | (517.4 | ) | ||||||||||||
| Other |
(0.2 | ) | (7.4 | ) | 15.6 | — | 8.0 | |||||||||||||
|
|
|
|
|
|
|
|
|
|
|
|||||||||||
| Net cash used in investing activities |
(6.4 | ) | (476.9 | ) | (228.2 | ) | — | (711.5 | ) | |||||||||||
|
|
|
|
|
|
|
|
|
|
|
|||||||||||
| Effect of exchange rate changes on cash |
— | — | (144.7 | ) | — | (144.7 | ) | |||||||||||||
|
|
|
|
|
|
|
|
|
|
|
|||||||||||
| Net increase (decrease) in cash and cash equivalents |
98.0 | (4.2 | ) | (57.5 | ) | — | 36.3 | |||||||||||||
| Cash and cash equivalents at beginning of year |
630.8 | 13.5 | 484.2 | — | 1,128.5 | |||||||||||||||
|
|
|
|
|
|
|
|
|
|
|
|||||||||||
| Cash and cash equivalents at end of year |
$ | 728.8 | $ | 9.3 | $ | 426.7 | $ | $ | 1,164.8 | |||||||||||
|
|
|
|
|
|
|
|
|
|
|
|||||||||||
115
Table of Contents
| Year Ended December 31, 2013 | ||||||||||||||||||||
| (in millions) |
Parent | Guarantor Subsidiaries |
Non-Guarantor Subsidiaries |
Eliminations | Consolidated | |||||||||||||||
| Net cash provided by (used in) operating activities: |
$ | (180.6 | ) | $ | 675.2 | $ | 182.8 | $ | (8.9 | ) | $ | 668.5 | ||||||||
| Financing activities: |
||||||||||||||||||||
| Net change in short-term debt |
— | (0.1 | ) | 102.1 | — | 102.0 | ||||||||||||||
| (Payments on) proceeds from intercompany transactions |
775.4 | (567.5 | ) | (200.5 | ) | (7.4 | ) | — | ||||||||||||
| Proceeds from issuance of long-term debt |
1,261.5 | — | 11.9 | — | 1,273.4 | |||||||||||||||
| Payments on long-term debt |
(404.5 | ) | (1.8 | ) | (1.4 | ) | — | (407.7 | ) | |||||||||||
| Issuance (repurchase) of common stock, net |
450.5 | — | — | — | 450.5 | |||||||||||||||
| Excess tax benefits from stock-based compensation |
11.6 | — | — | — | 11.6 | |||||||||||||||
| Other |
(19.2 | ) | (4.4 | ) | (0.6 | ) | — | (24.2 | ) | |||||||||||
|
|
|
|
|
|
|
|
|
|
|
|||||||||||
| Net cash provided by (used in) financing activities |
2,075.3 | (573.8 | ) | (88.5 | ) | (7.4 | ) | 1,405.6 | ||||||||||||
|
|
|
|
|
|
|
|
|
|
|
|||||||||||
| Investing activities: |
||||||||||||||||||||
| Additions to property, plant and equipment |
(37.5 | ) | (77.7 | ) | (95.8 | ) | — | (211.0 | ) | |||||||||||
| Acquisition of business, net of cash acquired |
(1,807.4 | ) | — | (12.7 | ) | — | (1,820.1 | ) | ||||||||||||
| Intercompany investing activities, net |
— | (16.3 | ) | — | 16.3 | — | ||||||||||||||
| Other |
20.8 | 1.2 | 51.7 | — | 73.7 | |||||||||||||||
|
|
|
|
|
|
|
|
|
|
|
|||||||||||
| Net cash used in investing activities |
(1,824.1 | ) | (92.8 | ) | (56.8 | ) | 16.3 | (1,957.4 | ) | |||||||||||
|
|
|
|
|
|
|
|
|
|
|
|||||||||||
| Effect of exchange rate changes on cash |
— | — | (22.3 | ) | — | (22.3 | ) | |||||||||||||
|
|
|
|
|
|
|
|
|
|
|
|||||||||||
| Net increase in cash and cash equivalents |
70.6 | 8.6 | 15.2 | — | 94.4 | |||||||||||||||
| Cash and cash equivalents at beginning of year |
560.2 | 4.9 | 469.0 | — | 1,034.1 | |||||||||||||||
|
|
|
|
|
|
|
|
|
|
|
|||||||||||
| Cash and cash equivalents at end of year |
$ | 630.8 | $ | 13.5 | $ | 484.2 | $ | — | $ | 1,128.5 | ||||||||||
|
|
|
|
|
|
|
|
|
|
|
|||||||||||
The amounts reflected as proceeds (payments) from (to) intercompany transactions represent cash flows originating from transactions conducted between guarantor subsidiaries, non-guarantor subsidiaries and parent in the normal course of business operations.
116
Table of Contents
Report of Independent Registered Public Accounting Firm
To the Board of Directors and Stockholders of Jarden Corporation:
In our opinion, the accompanying consolidated balance sheets and the related consolidated statements of operations, comprehensive income, stockholders’ equity and cash flows present fairly, in all material respects, the financial position of Jarden Corporation and its subsidiaries at December 31, 2015 and 2014, and the results of their operations and their cash flows for each of the three years in the period ended December 31, 2015 in conformity with accounting principles generally accepted in the United States of America. In addition, in our opinion, the financial statement schedule listed in the accompanying index appearing under Item 15(2) presents fairly, in all material respects, the information set forth therein when read in conjunction with the related consolidated financial statements. Also in our opinion, the Company maintained, in all material respects, effective internal control over financial reporting as of December 31, 2015, based on criteria established in Internal Control—Integrated Framework (2013) issued by the Committee of Sponsoring Organizations of the Treadway Commission (COSO). The Company’s management is responsible for these financial statements and financial statement schedule, for maintaining effective internal control over financial reporting and for its assessment of the effectiveness of internal control over financial reporting, included in Management’s Report on Internal Control over Financial Reporting appearing under Item 9A. Our responsibility is to express opinions on these financial statements, on the financial statement schedule, and on the Company’s internal control over financial reporting based on our integrated audits. We conducted our audits in accordance with the standards of the Public Company Accounting Oversight Board (United States). Those standards require that we plan and perform the audits to obtain reasonable assurance about whether the financial statements are free of material misstatement and whether effective internal control over financial reporting was maintained in all material respects. Our audits of the financial statements included examining, on a test basis, evidence supporting the amounts and disclosures in the financial statements, assessing the accounting principles used and significant estimates made by management, and evaluating the overall financial statement presentation. Our audit of internal control over financial reporting included obtaining an understanding of internal control over financial reporting, assessing the risk that a material weakness exists, and testing and evaluating the design and operating effectiveness of internal control based on the assessed risk. Our audits also included performing such other procedures as we considered necessary in the circumstances. We believe that our audits provide a reasonable basis for our opinions.
As discussed in Note 2 to the consolidated financial statements, the Company changed the manner in which it classifies deferred tax assets and liabilities on the consolidated balance sheet in 2015.
A company’s internal control over financial reporting is a process designed to provide reasonable assurance regarding the reliability of financial reporting and the preparation of financial statements for external purposes in accordance with generally accepted accounting principles. A company’s internal control over financial reporting includes those policies and procedures that (i) pertain to the maintenance of records that, in reasonable detail, accurately and fairly reflect the transactions and dispositions of the assets of the company; (ii) provide reasonable assurance that transactions are recorded as necessary to permit preparation of financial statements in accordance with generally accepted accounting principles, and that receipts and expenditures of the company are being made only in accordance with authorizations of management and directors of the company; and (iii) provide reasonable assurance regarding prevention or timely detection of unauthorized acquisition, use, or disposition of the company’s assets that could have a material effect on the financial statements.
Because of its inherent limitations, internal control over financial reporting may not prevent or detect misstatements. Also, projections of any evaluation of effectiveness to future periods are subject to the risk that controls may become inadequate because of changes in conditions, or that the degree of compliance with the policies or procedures may deteriorate.
117
Table of Contents
As described in Management’s Report on Internal Control over Financial Reporting, management has excluded Waddington Group, Inc. and Visant Holding Corp. from its assessment of internal control over financial reporting as of December 31, 2015 because they were acquired by the Company in a purchase business combination during 2015. We have also excluded Waddington Group, Inc. and Visant Holding Corp. from our audit of internal control over financial reporting. Waddington Group, Inc. and Visant Holding Corp. are wholly-owned subsidiaries whose total assets and total net sales excluded from management’s assessment and our audit of internal control over financial reporting represent approximately 3% and 2%, respectively and 4% and 1%, respectively of the related consolidated financial statement amounts as of and for the year ended December 31, 2015.
/s/ PricewaterhouseCoopers LLP
New York, New York
February 26, 2016
118
Table of Contents
Supplementary Data
Selected Quarterly Financial Data (Unaudited)
| (in millions, except per share amounts) |
First Quarter |
Second Quarter |
Third Quarter |
Fourth Quarter (b) |
Total | |||||||||||||||
| 2015 |
||||||||||||||||||||
| Net sales |
$ | 1,731.5 | $ | 2,005.7 | $ | 2,256.3 | $ | 2,610.4 | $ | 8,603.9 | ||||||||||
| Gross profit |
500.5 | 607.5 | 693.5 | 890.3 | 2,691.8 | |||||||||||||||
| Net income (loss) as reported |
(55.5 | ) | 85.9 | 120.2 | (4.1 | ) | 146.5 | |||||||||||||
| Basic earnings (loss) per share (a) |
(0.30 | ) | 0.46 | 0.60 | (0.02 | ) | 0.75 | |||||||||||||
| Diluted earnings (loss) per share (a) |
(0.30 | ) | 0.44 | 0.57 | (0.02 | ) | 0.72 | |||||||||||||
| 2014 |
||||||||||||||||||||
| Net sales |
$ | 1,731.8 | $ | 1,975.1 | $ | 2,142.2 | $ | 2,438.0 | $ | 8,287.1 | ||||||||||
| Gross profit |
514.4 | 602.0 | 673.3 | 843.2 | 2,632.9 | |||||||||||||||
| Net income as reported |
3.7 | 52.1 | 108.6 | 78.1 | 242.5 | |||||||||||||||
| Basic earnings per share (a) |
0.02 | 0.28 | 0.59 | 0.42 | 1.31 | |||||||||||||||
| Diluted earnings per share (a) |
0.02 | 0.28 | 0.58 | 0.41 | 1.28 | |||||||||||||||
| (a) | Earnings per share calculations for each quarter are based on the weighted average number of shares outstanding for each period, and the sum of the quarterly amounts may not necessarily equal the annual earnings per share amounts. |
| (b) | The results of operations for the fourth quarter of 2015 includes $77.8 of cumulative stock-based compensation related to certain restricted share awards where compensation expense was not previously recognized as the achievement of the performance targets was not deemed probable (see Note 13 to the consolidated financial statements), a non-cash impairment charges of $151 related to the impairment of goodwill, intangible and other assets (see Note 6 to the consolidated financial statements) and a charge of $16.2 for the purchase accounting adjustment for the elimination of manufacturer’s profit in inventory related to the Jostens Acquisition. The results of operations for the fourth quarter of 2014 include $151 of foreign exchange-related charges related to the Company’s Venezuela operations (see Note 1 to the consolidated financial statements), non-cash impairment charges of $25.4 related to the impairment intangible assets (see Note 6 to the consolidated financial statements) and a gain of $38.7 on the sale of an Asian manufacturing facility. |
| Item 9. | Changes in and Disagreements with Accountants on Accounting and Financial Disclosure |
Not Applicable.
| Item 9A. | Controls and Procedures |
Evaluation of Disclosure Controls and Procedures
The Company’s management carried out an evaluation, under the supervision and with the participation of the Company’s Chief Executive Officer and Chief Financial Officer, of the effectiveness of the design and operation of the Company’s disclosure controls and procedures (as such term is defined in Rules 13a-15(e) and 15d-15(e) under the Securities Exchange Act of 1934, as amended (the “Exchange Act”) as of December 31, 2015, pursuant to Exchange Act Rule 13a-15. Based upon that evaluation, the Company’s Chief Executive Officer and Chief Financial Officer concluded that the Company’s disclosure controls and procedures were effective as of December 31, 2015.
Management’s Report on Internal Control Over Financial Reporting
Management of the Company is responsible for establishing and maintaining adequate internal control over financial reporting as defined in Rules 13a-15(f) and 15d-15(f) under the Exchange Act. The Company’s internal control over financial reporting is designed to provide reasonable assurance regarding the reliability of financial reporting and the preparation of financial statements for external purposes in accordance with accounting
119
Table of Contents
principles generally accepted in the United States of America (“GAAP”). The Company’s internal control over financial reporting includes those policies and procedures that:
| • | pertain to the maintenance of records that in reasonable detail accurately and fairly reflect the transactions and dispositions of the assets of the Company; |
| • | provide reasonable assurance that transactions are recorded as necessary to permit preparation of financial statements in accordance with GAAP, and that receipts and expenditures of the Company are being made only in accordance with authorizations of management and directors of the Company; and |
| • | provide reasonable assurance regarding prevention or timely detection of unauthorized acquisition, use or disposition of the Company’s assets that could have a material effect on the financial statements. |
Because of its inherent limitations, internal control over financial reporting may not prevent or detect misstatements. Also, projections of any evaluation of effectiveness to future periods are subject to the risk that controls may become inadequate because of changes in conditions, or that the degree of compliance with the policies or procedures may deteriorate.
As required by Section 404 of the Sarbanes-Oxley Act of 2002, management assessed the effectiveness of the Company’s internal control over financial reporting as of December 31, 2015. In making this assessment, management used the criteria set forth in the Internal Control—Integrated Framework (2013) issued by the Committee of Sponsoring Organizations of the Treadway Commission (COSO).
Based on our assessment and the above criteria, management concluded that the Company maintained effective internal control over financial reporting as of December 31, 2015.
On July 31, 2015 and November 1, 2015, the Company acquired Waddington and Jostens, respectively. The Company has excluded Waddington’s and Jostens’s internal controls over financial reporting as of December 31, 2015 from its assessment of and conclusion on the effectiveness of its internal controls over financial reporting. Waddington and Jostens, constituted approximately 3% and 2%, respectively, of the Company’s consolidated assets at December 31, 2015 and approximately 4% and 1%, respectively, of the Company’s net sales for the year ended December 31, 2015.
The effectiveness of the Company’s internal control over financial reporting as of December 31, 2015 has been audited by the Company’s independent auditor, PricewaterhouseCoopers LLP, an independent registered public accounting firm, and issued their audit report expressing an unqualified opinion on the Company’s internal control over financial reporting, as stated in their report which is included elsewhere herein.
Changes in Internal Control Over Financial Reporting
During the fourth quarter ended December 31, 2015, there was no change in internal controls over financial reporting (as defined in Rules 13a-15(f) and 15d-15(f) under the Exchange Act) that materially affected, or is reasonably likely to materially affect, the Company’s internal control over financial reporting.
| Item 9B. | Other Information |
Not Applicable.
120
Table of Contents
PART III
| Item 10. | Directors, Executive Officers and Corporate Governance |
Information regarding executive officers is included in Part I of this Annual Report on Form 10-K as permitted by General Instruction G(3).
Jarden Corporation has adopted a “Business Conduct and Ethics Policy” (“Code”) for all its employees, including its principal executive officer, principal financial officer and principal accounting officer. The Code is available on the Company’s Internet website at http://www.jarden.com, at the tab “For Investors—Governance.”
Other information required by Item 10, including information regarding directors, membership and function of the audit committee, including the financial expertise of its members, and Section 16(a) compliance, appearing under the captions “Election of Directors,” “Information Regarding Board of Directors and Committees” and “Other Matters” of the Company’s Proxy Statement for the 2016 Annual Meeting of Stockholders is incorporated herein by reference. The Company intends to file its Proxy Statement with the Securities and Exchange Commission (the “SEC”) not later than 120 days after December 31, 2015.
| Item 11. | Executive Compensation |
The information required by Item 11 appearing under the captions “Information Regarding Board of Directors and Committees—Compensation of Directors” and “Executive Compensation” of the Company’s Proxy Statement for the 2016 Annual Meeting of Stockholders is incorporated herein by reference. The Company intends to file its Proxy Statement with the SEC not later than 120 days after December 31, 2015.
| Item 12. | Security Ownership of Certain Beneficial Owners and Management and Related Stockholder Matters |
The information required by Item 12 appearing under the captions “Security Ownership of Certain Beneficial Owners and Management” and “Executive Compensation—Equity Compensation Plan Information” of the Company’s Proxy Statement for the 2016 Annual Meeting of Stockholders is incorporated herein by reference. The Company intends to file its Proxy Statement with the SEC not later than 120 days after December 31, 2015.
| Item 13. | Certain Relationships and Related Transactions, and Director Independence |
The information required by Item 13 appearing under the captions “Information Regarding Board of Directors and Committees” and “Certain Relationships and Related Transactions” of the Company’s Proxy Statement for the 2016 Annual Meeting of Stockholders is incorporated herein by reference. The Company intends to file its Proxy Statement with the SEC not later than 120 days after December 31, 2015.
| Item 14. | Principal Accounting Fees and Services |
The information required by Item 14 appearing under the caption “Independent Registered Public Accounting Firm” of the Company’s Proxy Statement for the 2016 Annual Meeting of Stockholders is incorporated by reference. The Company intends to file its Proxy Statement with the SEC not later than 120 days after December 31, 2015.
121
Table of Contents
PART IV
| Item 15. | Exhibits, Financial Statement Schedules |
The following documents are filed as part of this report:
| (1) | Financial Statements: |
| (2) | Financial Statement Schedule: |
See Schedule II of this Form 10-K.
| (3) | Exhibits: |
Copies of exhibits incorporated by reference can be obtained from the SEC and are located in SEC File No. 001-13665.
| Exhibit Number |
Description of Exhibit | |
| 2.1 | Unit Purchase Agreement, dated September 3, 2013, by and among Yankee Candle Group LLC, the Company, Yankee Candle Investments LLC and the other parties hereto (filed as Exhibit 2.1 to the Company’s Current Report on Form 8-K, filed on September 4, 2013, and incorporated herein by reference). | |
| 2.2 | Agreement and Plan of Merger, dated July 11, 2015, by and among the Company, TWG Merger Sub, Inc., Waddington Group, Inc. and Olympus Growth Fund V, L.P. (filed as Exhibit 2.1 to the Company’s Current Report on Form 8-K, filed on July 15, 2015, and incorporated herein by reference). | |
| 2.3 | Agreement and Plan of Merger, dated October 13, 2015, by and among the Company, VHC Merger Sub, Inc., Visant Holding Corp. and the stockholder representatives named therein (filed as Exhibit 2.1 to the Company’s Current Report on Form 8-K, filed on October 14, 2015, and incorporated herein by reference). | |
| 2.4 | Agreement and Plan of Merger, dated as of December 13, 2015, by and among Newell Rubbermaid Inc., Jarden Corporation, NCPF Acquisition Corp. I and NCPF Acquisition Corp. II (filed as Exhibit 2.1 to the Company’s Current Report on Form 8-K, filed on December 14, 2015, and incorporated herein by reference). | |
122
Table of Contents
| Exhibit Number |
Description of Exhibit | |
| 3.1 | Restated Certificate of Incorporation of the Company (filed as Exhibit 3.1 to the Company’s Annual Report on Form 10-K, filed on March 27, 2002, and incorporated herein by reference). | |
| 3.2 | Certificate of Amendment of the Restated Certificate of Incorporation of the Company (filed as Exhibit 3.2 to the Company’s Current Report on Form 8-K, filed on June 4, 2002, and incorporated herein by reference). | |
| 3.3 | Certificate of Amendment of the Restated Certificate of Incorporation of the Company (filed as Exhibit 3.1 to the Company’s Current Report on Form 8-K, filed on June 15, 2005, and incorporated herein by reference). | |
| 3.4 | Certificate of Amendment of the Restated Certificate of Incorporation of the Company (filed as Exhibit 3.1 to the Company’s Current Report on Form 8-K, filed on June 17, 2011, and incorporated herein by reference). | |
| 3.5 | Certificate of Amendment of the Restated Certificate of Incorporation of the Company (filed as Exhibit 3.1 to the Company’s Current Report on Form 8-K, filed on June 17, 2014, and incorporated herein by reference). | |
| 3.6 | Certificate of Amendment of the Restated Certificate of Incorporation of the Company (filed as Exhibit 3.1 to the Company’s Current Report on Form 8-K, filed on June 9, 2015, and incorporated herein by reference). | |
| 3.7 | Third Amended and Restated Bylaws of the Company (filed as Exhibit 3.1 to the Company’s Current Report on Form 8-K, filed on July 29, 2014, and incorporated herein by reference). | |
| 3.8 | Amendment to Third Amended and Restated Bylaws of the Company (filed as Exhibit 3.1 to the Company’s Current Report on Form 8-K, filed on December 14, 2015, and incorporated herein by reference). | |
| 4.1 | Base Indenture, dated February 13, 2007 (the “2007 Indenture”), between the Company and The Bank of New York, as Trustee (filed as Exhibit 4.1 to the Company’s Current Report on Form 8-K, filed on February 16, 2007 and incorporated herein by reference). | |
| 4.2 | First Supplemental Indenture to the 2007 Indenture, dated February 13, 2007 among the Company, the guarantors party thereto and The Bank of New York, as Trustee (filed as Exhibit 4.2 to the Company’s Current Report on Form 8-K, filed on February 16, 2007, and incorporated herein by reference). | |
| 4.3 | Second Supplemental Indenture to the 2007 Indenture, dated February 14, 2007 among the Company, the guarantors party thereto and The Bank of New York, as Trustee (filed as Exhibit 4.3 to the Company’s Current Report on Form 8-K, filed on February 16, 2007, and incorporated herein by reference). | |
| 4.4 | Third Supplemental Indenture to the 2007 Indenture, dated May 11, 2007 among the Company, the guarantors party thereto and The Bank of New York, as Trustee (filed as Exhibit 4.1 to the Company’s Quarterly Report on Form 10-Q, filed on July 31, 2007, and incorporated herein by reference). | |
| 4.5 | Fourth Supplemental Indenture to the 2007 Indenture, dated July 6, 2007 among the Company, the guarantors party thereto and The Bank of New York, as Trustee (filed as Exhibit 4.1 to the Company’s Quarterly Report on Form 10-Q, filed on November 5, 2007, and incorporated herein by reference). | |
| 4.6 | Fifth Supplemental Indenture to the 2007 Indenture, dated December 7, 2007 among the Company, the guarantors party thereto and The Bank of New York, as Trustee (filed as Exhibit 4.6 to the Company’s Annual Report on Form 10-K filed on February 25, 2008, and incorporated herein by reference). | |
123
Table of Contents
| Exhibit Number |
Description of Exhibit | |
| 4.7 | Sixth Supplemental Indenture to the 2007 Indenture, dated November 23, 2009 among the Company, the guarantors party thereto and Wells Fargo Bank, National Association, as successor Trustee (filed as Exhibit 4.7 to the Company’s Annual Report on Form 10-K, filed on February 24, 2010, and incorporated herein by reference). | |
| 4.8 | Seventh Supplemental Indenture to the 2007 Indenture, dated October 20, 2010 among the Company, the guarantors party thereto and Wells Fargo Bank, National Association, as successor Trustee (filed as Exhibit 4.1 to the Company’s Quarterly Report on Form 10-Q, filed on October 29, 2010 and incorporated herein by reference). | |
| 4.9 | Base Indenture dated April 30, 2009 (the “2009 Indenture”), between the Company and The Bank of New York Mellon, as Trustee (filed as Exhibit 4.1 to the Company’s Current Report on Form 8-K, filed on May 6, 2009, and incorporated herein by reference). | |
| 4.10 | Third Supplemental Indenture to the 2009 Indenture, dated November 9, 2010, among the Company, the guarantors party thereto and Wells Fargo Bank, National Association, as Trustee (filed as Exhibit 4.2 to the Company’s Current Report on Form 8-K, filed on November 15, 2010 and incorporated herein by reference). | |
| 4.11 | Instrument of Resignation, Appointment and Acceptance, dated November 6, 2009, among the Company, The Bank of New York Mellon and Wells Fargo Bank, National Association (filed as Exhibit 4.11 to the Company’s Annual Report on Form 10-K, filed on February 24, 2010, and incorporated herein by reference). | |
| 4.12 | Indenture related to the Company’s 1 7/8% Senior Subordinated Convertible Notes due 2018, dated as of September 18, 2012, among the Company, the subsidiary guarantors party thereto and Wells Fargo Bank, National Association, as trustee (filed as Exhibit 4.1 to the Company’s Current Report on Form 8-K, filed on September 21, 2012 and incorporated herein by reference). | |
| 4.13 | Indenture related to the Company’s 1 1⁄2% Senior Subordinated Convertible Notes due 2019, dated as of June 12, 2013, among the Company, the subsidiary guarantors party thereto and Wells Fargo Bank, National Association, as trustee (filed as Exhibit 4.1 to the Company’s Current Report on Form 8-K, filed on June 14, 2013, and incorporated herein by reference). | |
| 4.14 | Indenture related to the Company’s 1 1⁄8% Senior Subordinated Convertible Notes due 2034, dated as of March 17, 2014, among the Company, the subsidiary guarantors party thereto and Wells Fargo Bank, National Association, as trustee (filed as Exhibit 4.1 to the Company’s Current Report on Form 8-K, filed on March 21, 2014, and incorporated herein by reference). | |
| 4.15 | Indenture related to the Company’s 3 3⁄4% Senior Notes due 2021, dated as of July 14, 2014, among the Company, the subsidiary guarantors party thereto, Wells Fargo Bank, National Association, as trustee and Société Générale Bank & Trust, as paying agent, transfer agent, registrar and authenticating agent (filed as Exhibit 4.1 to the Company’s Current Report on Form 8-K, filed on July 18, 2014, and incorporated herein by reference). | |
| 4.16 | Indenture related to Jarden Corporation’s 5% Senior Notes due 2023, dated as of October 30, 2015, among the Company, the subsidiary guarantors party thereto and Wells Fargo Bank, National Association, as trustee (filed as Exhibit 4.1 to the Company’s Current Report on Form 8-K, filed on November 2, 2015, and incorporated herein by reference). | |
| †10.1 | Form of Indemnification Agreement (filed as Exhibit 10.13 to the Company’s Registration Statement on Form 10, filed on March 17, 1993, and incorporated herein by reference). | |
| †10.2 | List of Directors and Executive Officers party to Exhibit 10.1 (filed as Exhibit 10.10 to the Company’s Annual Report on Form 10-K, filed on March 31, 1996, and incorporated herein by reference). | |
124
Table of Contents
| Exhibit Number |
Description of Exhibit | |
| †10.3 | Jarden Corporation Amended and Restated 2003 Stock Incentive Plan (incorporated by reference from Annex C to the Company’s 2005 Definitive Proxy Statement with respect to the Company’s 2005 Annual Meeting of Stockholders, as filed on May 9, 2005). | |
| †10.4 | Amendment No. 1 to the Jarden Corporation Amended and Restated 2003 Stock Incentive Plan (filed as Exhibit 10.1 to the Company’s Current Report on Form 8-K, filed on December 19, 2007, and incorporated herein by reference). | |
| †10.5 | Jarden Corporation 2009 Stock Incentive Plan (incorporated by reference from Annex A to the Company’s 2009 Definitive Proxy Statement with respect to the Company’s 2009 Annual Meeting of Stockholders, as filed on April 9, 2009). | |
| †10.6 | Jarden Corporation 2013 Stock Incentive Plan (incorporated by reference from Annex A to the Company’s 2013 Definitive Proxy Statement with respect to the Company’s 2013 Annual Meeting of Stockholders, as filed on April 15, 2013). | |
| †10.7 | Jarden Corporation 2013 Employee Stock Purchase Plan (incorporated by reference from Annex B to the Company’s 2013 Definitive Proxy Statement with respect to the Company’s 2013 Annual Meeting of Stockholders, as filed on April 15, 2013). | |
| †10.8 | Fifth Amended and Restated Employment Agreement, dated as of July 23, 2012, between the Company and Martin E. Franklin (filed as Exhibit 10.1 to the Company’s Current Report on Form 8-K, filed on July 27, 2012, and incorporated herein by reference). | |
| †10.9 | Fifth Amended and Restated Employment Agreement, dated as of July 23, 2012, between the Company and Ian G.H. Ashken (filed as Exhibit 10.2 to the Company’s Current Report on Form 8-K, filed on July 27, 2012, and incorporated herein by reference). | |
| †10.10 | Fourth Amended and Restated Employment Agreement between the Company and James E. Lillie, dated as of July 23, 2012 (filed as Exhibit 10.3 to the Company’s Current Report on Form 8-K, filed on July 27, 2012, and incorporated herein by reference). | |
| †10.11 | Amended and Restated Employment Agreement between the Company and John E. Capps, dated as of July 23, 2012 (filed as Exhibit 10.4 to the Company’s Current Report on Form 8-K, filed on July 27, 2012, and incorporated herein by reference). | |
| †10.12 | Amended and Restated Employment Agreement between the Company and Richard T. Sansone, dated as of July 23, 2012 (filed as Exhibit 10.5 to the Company’s Current Report on Form 8-K, filed on July 27, 2012, and incorporated herein by reference). | |
| †10.13 | Equity Award, Lock-Up and Amendment Agreement, dated as of December 19, 2013, by and between Jarden Corporation and Martin E. Franklin (filed as Exhibit 10.1 to the Company’s Current Report on Form 8-K, filed on December 20, 2013, and incorporated herein by reference). | |
| †10.14 | Equity Award, Lock-Up and Amendment Agreement, dated as of December 19, 2013, by and between Jarden Corporation and Ian G.H. Ashken (filed as Exhibit 10.2 to the Company’s Current Report on Form 8-K, filed on December 20, 2013, and incorporated herein by reference). | |
| †10.15 | Equity Award, Lock-Up and Amendment Agreement, dated as of December 19, 2013, by and between Jarden Corporation and James E. Lillie (filed as Exhibit 10.3 to the Company’s Current Report on Form 8-K, filed on December 20, 2013, and incorporated herein by reference). | |
| †10.16 | Amendment Agreement, dated as of December 13, 2015, by and between the Company and Martin E. Franklin (filed as Exhibit 10.1 to the Company’s Current Report on Form 8-K, filed on December 17, 2015, and incorporated herein by reference). | |
125
Table of Contents
| Exhibit Number |
Description of Exhibit | |
| †10.17 | Amendment Agreement, dated as of December 13, 2015, by and between the Company and Ian G.H. Ashken (filed as Exhibit 10.2 to the Company’s Current Report on Form 8-K, filed on December 17, 2015, and incorporated herein by reference). | |
| †10.18 | Amendment Agreement, dated as of December 13, 2015, by and between the Company and James E. Lillie (filed as Exhibit 10.3 to the Company’s Current Report on Form 8-K, filed on December 17, 2015, and incorporated herein by reference). | |
| †10.19 | Separation Agreement, dated as of December 13, 2015, by and between the Company and Martin E. Franklin (filed as Exhibit 10.4 to the Company’s Current Report on Form 8-K, filed on December 17, 2015, and incorporated herein by reference). | |
| †10.20 | Separation Agreement, dated as of December 13, 2015, by and between the Company and Ian G.H. Ashken (filed as Exhibit 10.5 to the Company’s Current Report on Form 8-K, filed on December 17, 2015, and incorporated herein by reference). | |
| †10.21 | Separation Agreement, dated as of December 13, 2015, by and between the Company and James E. Lillie (filed as Exhibit 10.6 to the Company’s Current Report on Form 8-K, filed on December 17, 2015, and incorporated herein by reference). | |
| †10.22 | Restricted Stock Agreement, dated February 12, 2014, between the Company and Martin E. Franklin (filed as Exhibit 10.1 to the Company’s Current Report on Form 8-K, filed on February 14, 2014, and incorporated herein by reference). | |
| †10.23 | Restricted Stock Agreement, dated February 12, 2014, between the Company and Ian G.H. Ashken (filed as Exhibit 10.2 to the Company’s Current Report on Form 8-K, filed on February 14, 2014, and incorporated herein by reference). | |
| †10.24 | Restricted Stock Agreement, dated February 12, 2014, between the Company and James E. Lillie (filed as Exhibit 10.3 to the Company’s Current Report on Form 8-K, filed on February 14, 2014, and incorporated herein by reference). | |
| †10.25 | Restricted Stock Agreement, dated December 31, 2015, between the Company and Martin E. Franklin (filed as Exhibit 10.1 to the Company’s Current Report on Form 8-K, filed on January 7, 2016, and incorporated herein by reference). | |
| †10.26 | Restricted Stock Agreement, dated December 31, 2015, between the Company and Ian G.H. Ashken (filed as Exhibit 10.2 to the Company’s Current Report on Form 8-K, filed on January 7, 2016, and incorporated herein by reference). | |
| †10.27 | Restricted Stock Agreement, dated December 31, 2015, between the Company and James E. Lillie (filed as Exhibit 10.3 to the Company’s Current Report on Form 8-K, filed on January 7, 2016, and incorporated herein by reference). | |
| 10.28 | Amended and Restated Credit Agreement, dated as of December 19, 2014, among the Company, as the US borrower, Jarden Lux Holdings S.à r.l.. and Jarden Lux Finco S.à r.l., collectively as the Luxembourg Borrower, the several lenders and letter of credit issuers from time to time party thereto, and Barclays Bank PLC, as administrative agent and collateral agent (filed as Exhibit A to Exhibit 10.1 to the Company’s Current Report on Form 8-K, filed on December 29, 2014, and incorporated herein by reference). | |
| 10.29 | Pledge and Security Agreement, dated as of March 31, 2011, among the Company, as a grantor, each other grantors signatory thereto and Barclays Bank PLC, as administrative agent (filed as Exhibit 10.2 to the Company’s Current Report on Form 8-K, filed on April 6, 2011, and incorporated herein by reference). | |
126
Table of Contents
| Exhibit Number |
Description of Exhibit | |
| 10.30 | Guaranty, dated as of March 31, 2011, of the Company and the several subsidiary guarantors signatory thereto (filed as Exhibit 10.3 to the Company’s Current Report on Form 8-K, filed on April 6, 2011, and incorporated herein by reference). | |
| 10.31 | Amendment No. 1 to Amended and Restated Credit Agreement, dated as of July 30, 2015, among the Company, as the US Borrower, Barclays Bank PLC, as administrative agent and collateral agent, and the other lenders and letter of credit issuers party thereto (filed as Exhibit 10.1 to the Company’s Current Report on Form 8-K, filed on July 31, 2015, and incorporated herein by reference). | |
| 10.32 | Consent, Agreement and Affirmation of Guaranty and Pledge and Security Agreement relating to Amendment No. 1 to Amended and Restated Credit Agreement (filed as Exhibit 10.2 to the Company’s Current Report on Form 8-K, filed on July 31, 2015, and incorporated herein by reference). | |
| 10.33 | Amendment No. 2 to the Amended and Restated Credit Agreement, dated as of October 30, 2015, among Jarden Corporation, as the US Borrower, Barclays Bank PLC, as administrative agent and collateral agent, and the other lenders and letter of credit issuers party thereto (filed as Exhibit 10.1 to the Company’s Current Report on Form 8-K, filed on November 2, 2015, and incorporated herein by reference). | |
| 10.34 | Consent, Agreement and Affirmation of Guaranty and Pledge and Security Agreement relating to Amendment No. 2 to the Amended and Restated Credit Agreement (filed as Exhibit 10.2 to the Company’s Current Report on Form 8-K, filed on November 2, 2015, and incorporated herein by reference). | |
| 10.35 | Third Amended and Restated Loan Agreement, dated as of February 17, 2012, among the Company, as initial servicer; Jarden Receivables, LLC, as borrower; SunTrust Bank, as a lender, PNC Bank, National Association, as a lender and Wells Fargo Bank, National Association, as a lender and issuer of letters of credit, and SunTrust Robinson Humphrey, Inc., as administrator, together with the Reaffirmation, Acknowledgement and Consent of Performance Guarantor thereunder executed by the Company (filed as Exhibit 10.3 to the Company’s Current Report on Form 8-K, filed on February 24, 2012, and incorporated herein by reference). | |
| 10.36 | Amendment No. 1 to the Third Amended and Restated Loan Agreement, dated as of October 10, 2013, among the Company, as servicer; Jarden Receivables, LLC, as borrower; SunTrust Bank, as a lender, PNC Bank, National Association, as a lender and Wells Fargo Bank, National Association, as a lender and issuer of letters of credit, and SunTrust Robinson Humphrey, Inc., as administrator, together with the Reaffirmation, Acknowledgement and Consent of Performance Guarantor thereunder executed by the Company (filed as Exhibit 10.1 to the Company’s Current Report on Form 8-K, filed on October 16, 2013, and incorporated herein by reference). | |
| 10.37 | Amendment No. 2 to the Third Amended and Restated Loan Agreement, dated as of April 23, 2014, among the Company, as servicer; Jarden Receivables, LLC, as borrower; SunTrust Bank, as a lender, PNC Bank, National Association, as a lender and Wells Fargo Bank, National Association, as a lender and issuer of letters of credit, and SunTrust Robinson Humphrey, Inc., as administrator, together with the Reaffirmation, Acknowledgement and Consent of Performance Guarantor thereunder executed by the Company (filed as Exhibit 10.1 to the Company’s Quarterly Report on Form 10-Q, filed on July 31, 2014, and incorporated herein by reference). | |
| 10.38 | Amendment No. 3 to the Third Amended and Restated Loan Agreement, dated as of December 24, 2014, among the Company, as servicer; Jarden Receivables, LLC, as borrower; SunTrust Bank, as a lender, PNC Bank, National Association, as a lender and Wells Fargo Bank, National Association, as a lender and issuer of letters of credit, and SunTrust Robinson Humphrey, Inc., as administrator, together with the Reaffirmation, Acknowledgement and Consent of Performance Guarantor thereunder executed by the Company (filed as Exhibit 10.38 to the Company’s Annual Report on Form 10-K, filed on March 2, 2015, and incorporated herein by reference). | |
127
Table of Contents
| Exhibit Number |
Description of Exhibit | |
| 10.39 | Second Amended and Restated Receivables Contribution and Sales Agreement, dated as of July 29, 2010, among the originators party thereto and Jarden Receivables, LLC, as buyer (filed as Exhibit 10.2 to the Company’s Current Report on Form 8-K, filed on August 4, 2010, and incorporated herein by reference). | |
| 10.40 | Amendment No. 1 to Second Amended and Restated Receivables Contribution and Sales Agreement, dated as of February 17, 2012, among the originators party thereto and Jarden Receivables, LLC, as buyer (filed as Exhibit 10.4 to the Company’s Current Report on Form 8-K, filed on February 24, 2012, and incorporated herein by reference). | |
| 10.41 | Amendment No. 2 to Second Amended and Restated Receivables Contribution and Sales Agreement, dated as of April 23, 2014, among the originators party thereto and Jarden Receivables, LLC, as buyer(filed as Exhibit 10.2 to the Company’s Quarterly Report on Form 10-Q, filed on July 31, 2014, and incorporated herein by reference). | |
| 10.42 | Performance Undertaking, dated August 8, 2007, executed by the Company, as performance guarantor, in favor of Jarden Receivables LLC, as beneficiary (filed as Exhibit 10.6 to the Company’s Current Report on Form 8-K, filed on August 14, 2007, and incorporated herein by reference). | |
| 10.43 | Lender Note, dated February 17, 2012, executed by Jarden Receivables, LLC in favor of SunTrust Bank (filed as Exhibit 10.5 to the Company’s Current Report on Form 8-K, filed on February 24, 2012, and incorporated herein by reference). | |
| 10.44 | Amended and Restated Lender Note, dated February 17, 2012, executed by Jarden Receivables, LLC in favor of Wells Fargo Bank, National Association (filed as Exhibit 10.6 to the Company’s Current Report on Form 8-K, filed on February 24, 2012, and incorporated herein by reference). | |
| 10.45 | Lender Note, dated February 17, 2012, executed by Jarden Receivables, LLC in favor of PNC Bank, National Association (filed as Exhibit 10.7 to the Company’s Current Report on Form 8-K, filed on February 24, 2012, and incorporated herein by reference). | |
| 10.46 | Form of 7 1⁄2% Senior Subordinated Note due 2017 (filed as Exhibit A to Exhibit 4.2 to the Company’s Current Report on Form 8-K, filed on February 16, 2007 and incorporated herein by reference). | |
| 10.47 | Form of 6 1⁄8% Senior Note Due 2022 (filed as Exhibit A to Exhibit 4.2 to the Company’s Current Report on Form 8-K, filed on November 15, 2010, and incorporated herein by reference). | |
| 10.48 | Form of 1 7⁄8% Senior Subordinated Convertible Note due 2018 (filed as Exhibit A to Exhibit 4.1 to the Company’s Current Report on Form 8-K, filed on September 21, 2012, and incorporated herein by reference). | |
| 10.49 | Form of 1 1⁄2% Senior Subordinated Convertible Note due 2019 (filed as Exhibit A to Exhibit 4.1 to the Company’s Current Report on Form 8-K, filed on June 14, 2013, and incorporated herein by reference). | |
| 10.50 | Form of 1 1⁄8% Senior Subordinated Convertible Notes due 2034 (filed as Exhibit A to Exhibit 4.1 to the Company’s Current Report on Form 8-K, filed on March 21, 2014, and incorporated herein by reference). | |
| 10.51 | Form of 3 3⁄4% Senior Note due 2021 (filed as Exhibit A to Exhibit 4.1 to the Company’s Current Report on Form 8-K, filed on July 18, 2014, and incorporated herein by reference). | |
| 10.52 | Form of 5% Senior Note due 2023 (filed as Exhibit A to Exhibit 4.1 to the Company’s Current Report on Form 8-K, filed on November 2, 2015, and incorporated herein by reference). | |
128
Table of Contents
| Exhibit Number |
Description of Exhibit | |
| 10.53 | Share Purchase Agreement, dated April 1, 2010, by and among the Company, Total S.A. and Camping Gaz (Deutschland) GmbH (filed as Exhibit 10.1 to the Company’s Current Report on Form 8-K, filed on April 7, 2010, and incorporated herein by reference). | |
| *12.1 | Computation of Ratio of Earnings to Fixed Charges. | |
| *21.1 | Subsidiaries of the Company. | |
| *23.1 | Consent of Independent Registered Public Accounting Firm. | |
| *24.1 | Power of Attorney (included on the signature page hereto). | |
| *31.1 | Certification of Chief Executive Officer pursuant to Section 302 of the Sarbanes-Oxley Act of 2002. | |
| *31.2 | Certification of Chief Financial Officer pursuant to Section 302 of the Sarbanes-Oxley Act of 2002. | |
| *32.1 | Certification pursuant to 18 U.S.C. Section 1350 as adopted pursuant to Section 906 of the Sarbanes-Oxley Act of 2002. | |
| 101 | The following materials from the Company’s Annual Report on Form 10-K for the year ended December 31, 2015, formatted in XBRL (Extensible Business Reporting Language): (i) the Consolidated Statements of Operations for the years ended December 31, 2015, 2014 and 2013, (ii) the Consolidated Statements of Comprehensive Income for the years ended December 31, 2015, 2014 and 2013, (iii) the Consolidated Balance Sheets at December 31, 2015 and 2015, (iv) the Consolidated Statements of Cash Flows for the years ended December 31, 2015, 2014 and 2013, (v) the Consolidated Statements of Changes in Stockholders’ Equity for the years ended December 31, 2015, 2014 and 2013, and (vi) Notes to Consolidated Financial Statements. | |
| * | Filed herewith |
| † | This Exhibit represents a management contract or compensatory plan. |
129
Table of Contents
Pursuant to the requirements of Section 13 or 15(d) of the Securities Exchange Act of 1934, the registrant has duly caused this report to be signed on its behalf by the undersigned, thereunto duly authorized.
| JARDEN CORPORATION | ||
| (Registrant) | ||
| By: | /s/ JAMES E. LILLIE | |
| James E. Lillie Chief Executive Officer February 26, 2016 | ||
We, the undersigned directors and officers of Jarden Corporation, hereby severally constitute Martin E. Franklin and Ian G.H. Ashken, and each of them singly, our true and lawful attorneys with full power to them and each of them to sign for us, in our names in the capacities indicated below, any and all amendments to this Annual Report on Form 10-K filed with the Securities and Exchange Commission.
Pursuant to the requirements of the Securities Exchange Act of 1934, this report has been signed by the following persons on behalf of the registrant and in the capacities and on the dates indicated below.
| /s/ MARTIN E. FRANKLIN Martin E. Franklin |
Executive Chairman | February 26, 2016 | ||
| /s/ IAN G.H. ASHKEN Ian G.H. Ashken |
Vice Chairman and President |
February 26, 2016 | ||
| /s/ JAMES E. LILLIE James E. Lillie |
Director and Chief Executive Officer (Principal Executive Officer) |
February 26, 2016 | ||
| /s/ ALAN W. LEFEVRE Alan W. LeFevre |
Executive Vice President – Finance and Chief Financial Officer (Principal Financial Officer) |
February 26, 2016 | ||
| /s/ JAMES L. CUNNINGHAM III James L. Cunningham III |
Senior Vice President and Chief Accounting Officer (Principal Accounting Officer) |
February 26, 2016 | ||
| /s/ MICHAEL S. GROSS Michael S. Gross |
Director | February 26, 2016 | ||
| /s/ PETER A. HOCHFELDER Peter A. Hochfelder |
Director | February 26, 2016 | ||
| /s/ WILLIAM P. LAUDER William P. Lauder |
Director | February 26, 2016 | ||
| /s/ ROS L’ESPERANCE Ros L’Esperance |
Director | February 26, 2016 | ||
| /s/ IRWIN D. SIMON Irwin D. Simon |
Director | February 26, 2016 | ||
| /s/ ROBERT L. WOOD Robert L. Wood |
Director | February 26, 2016 | ||
130
Table of Contents
Schedule II
JARDEN CORPORATION
VALUATION AND QUALIFYING ACCOUNTS AND RESERVES
(in millions)
| Balance at beginning of period |
Charges to costs and expense |
Deductions from reserves |
Other (2) | Balance at end of period |
||||||||||||||||
| Reserves against accounts receivable (1): |
||||||||||||||||||||
| 2015 |
$ | (119.7 | ) | $ | (111.6 | ) | $ | 76.4 | $ | 9.4 | $ | (145.5 | ) | |||||||
| 2014 |
(97.0 | ) | (93.1 | ) | 67.4 | 3.0 | (119.7 | ) | ||||||||||||
| 2013 |
(79.7 | ) | (92.5 | ) | 74.9 | 0.3 | (97.0 | ) | ||||||||||||
| (1) | Principally consisting of reserves for uncollectable accounts and sales returns and allowances. |
| (2) | Principally consisting of foreign currency translation. |
131
Table of Contents
ANNUAL REPORT ON FORM 10-K
FOR THE YEAR ENDED DECEMBER 31, 2015
EXHIBIT INDEX
Copies of exhibits incorporated by reference can be obtained from the SEC and are located in Commission File No. 001-13665.
| Exhibit Number |
Description of Exhibit | |
| *12.1 | Computation of Ratio of Earnings to Fixed Charges. | |
| *21.1 | Subsidiaries of the Company. | |
| *23.1 | Consent of Independent Registered Public Accounting Firm. | |
| *24.1 | Power of Attorney (included on the signature page hereto). | |
| *31.1 | Certification of Chief Executive Officer pursuant to Section 302 of the Sarbanes-Oxley Act of 2002. | |
| *31.2 | Certification of Chief Financial Officer pursuant to Section 302 of the Sarbanes-Oxley Act of 2002. | |
| *32.1 | Certification pursuant to 18 U.S.C. Section 1350 as adopted pursuant to Section 906 of the Sarbanes-Oxley Act of 2002. | |
| 101 | The following materials from the Company’s Annual Report on Form 10-K for the year ended December 31, 2015, formatted in XBRL (Extensible Business Reporting Language): (i) the Consolidated Statements of Operations for the years ended December 31, 2015, 2014 and 2013, (ii) the Consolidated Statements of Comprehensive Income for the years ended December 31, 2015, 2014 and 2013, (iii) the Consolidated Balance Sheets at December 31, 2015 and 2015, (iv) the Consolidated Statements of Cash Flows for the years ended December 31, 2015, 2014 and 2013, (v) the Consolidated Statements of Changes in Stockholders’ Equity for the years ended December 31, 2015, 2014 and 2013, and (vi) Notes to Consolidated Financial Statements. | |
| * | Filed herewith |
| † | This Exhibit represents a management contract or a compensatory plan. |
132