Attached files
| file | filename |
|---|---|
| 8-K - 8-K - XPO Logistics, Inc. | d149108d8k.htm |
| EX-99.2 - EX-99.2 - XPO Logistics, Inc. | d149108dex992.htm |
|
|
Exhibit 99.1
XPO Investor Presentation and Transcript
February 2016
|
|
Disclaimers
Forward-Looking Statements
This document includes forward-looking statements within the meaning of Section 27A of the Securities Act of 1933, as amended, and Section 21E of the Securities Exchange Act of 1934, as amended, including the expected maturity of the company’s debt, the expected customer interest in our last mile network in Europe, the expected ability to integrate operations, cross-sell services, realize cost savings, synergies and profit improvement opportunities, expected market trends and growth, the expected performance of our business units in economic downturns and our 2016 and 2018 financial targets. All statements other than statements of historical fact are, or may be deemed to be, forward-looking statements. In some cases, forward-looking statements can be identified by the use of forward-looking terms such as “anticipate,” “estimate,” “believe,” “continue,” “could,” “intend,” “may,” “plan,” “potential,” “predict,” “should,” “will,” “expect,” “objective,” “projection,” “forecast,” “goal,” “guidance,” “outlook,” “effort,” “target” or the negative of these terms or other comparable terms. However, the absence of these words does not mean that the statements are not forward-looking. These forward-looking statements are based on certain assumptions and analyses made by us in light of our experience and our perception of historical trends, current conditions and expected future developments, as well as other factors we believe are appropriate in the circumstances.
These forward-looking statements are subject to known and unknown risks, uncertainties and assumptions that may cause actual results, levels of activity, performance or achievements to be materially different from any future results, levels of activity, performance or achievements expressed or implied by such forward-looking statements. Factors that might cause or contribute to a material difference include those discussed in XPO’s filings with the SEC and the following: economic conditions generally; competition and pricing pressure; the expected impact of recent acquisitions and the related financing, including the expected impact on XPO’s results of operations; XPO’s ability to successfully integrate and realize anticipated synergies, cost savings and profit improvement opportunities; XPO’s ability to attract and retain key employees to execute its growth strategy; litigation, including litigation related to alleged misclassification of independent contractors; the ability to develop and implement suitable information technology systems; the ability to maintain positive relationships with XPO’s networks of third-party transportation providers; XPO’s ability to attract and retain qualified drivers; XPO’s ability to retain and add customers; XPO’s ability to find suitable acquisition candidates and execute its acquisition strategy; XPO’s ability to raise debt and equity capital; fuel price or fuel surcharge changes; rail and other network changes; labor matters; weather and other service disruptions; and governmental regulation. All forward-looking statements set forth in this document are qualified by these cautionary statements and there can be no assurance that the actual results or developments anticipated will be realized or, even if substantially realized, that they will have the expected consequences to, or effects on, XPO or its businesses or operations. Forward-looking statements set forth in this document speak only as of the date hereof, and XPO undertakes no obligation to update forward-looking statements to reflect subsequent events or circumstances, changes in expectations or the occurrence of unanticipated events except to the extent required by law.
Non-GAAP Financial Measures
This document contains certain non-GAAP financial measures as defined under Securities and Exchange Commission (“SEC”) rules, such as adjusted net loss attributable to common shareholders and adjusted EBITDA, in each case for the three- and 12-month periods ended December 31, 2015 and 2014, and EBITDA for the Transportation and Logistics segments for the quarters ended December 31, 2015 and 2014. As required by SEC rules, we provide reconciliations of these measures to the most directly comparable measure under United States generally accepted accounting principles (“GAAP”), which are set forth in the attachments to this document. We believe that adjusted net loss attributable to common shareholders and adjusted diluted loss per share improves comparability from period to period by removing the impact of nonrecurring expense items, including preferred stock beneficial conversion charge, acquisition-related transaction and integration costs; debt commitment fees; costs related to the rebranding to XPO Logistics (including accelerated amortization of trade names); loss on the conversion of the company’s convertible senior notes; impact of non-controlling interests; and gain on sale of intermodal equipment. We believe that EBITDA and adjusted EBITDA improve comparability from period to period by removing the impact of our capital structure (interest expense from our outstanding debt), asset base (depreciation and amortization) and tax consequences, and the nonrecurring expense items noted above. In addition to its use by management, we believe that EBITDA and adjusted EBITDA are measures widely used by securities analysts, investors and others to evaluate the financial performance of companies in our industry. Other companies may calculate EBITDA and adjusted EBITDA differently, and therefore our measure may not be comparable to similarly titled measures of other companies. EBITDA and adjusted EBITDA are not measures of financial performance or liquidity under GAAP and should not be considered in isolation or as an alternative to net income, cash flows from operating activities and other measures determined in accordance with GAAP. Items excluded from EBITDA and adjusted EBITDA are significant and necessary components of the operations of our business, and, therefore, EBITDA and adjusted EBITDA should only be used as a supplemental measure of our operating performance.
2 | Investor Presentation February 2016
|
|
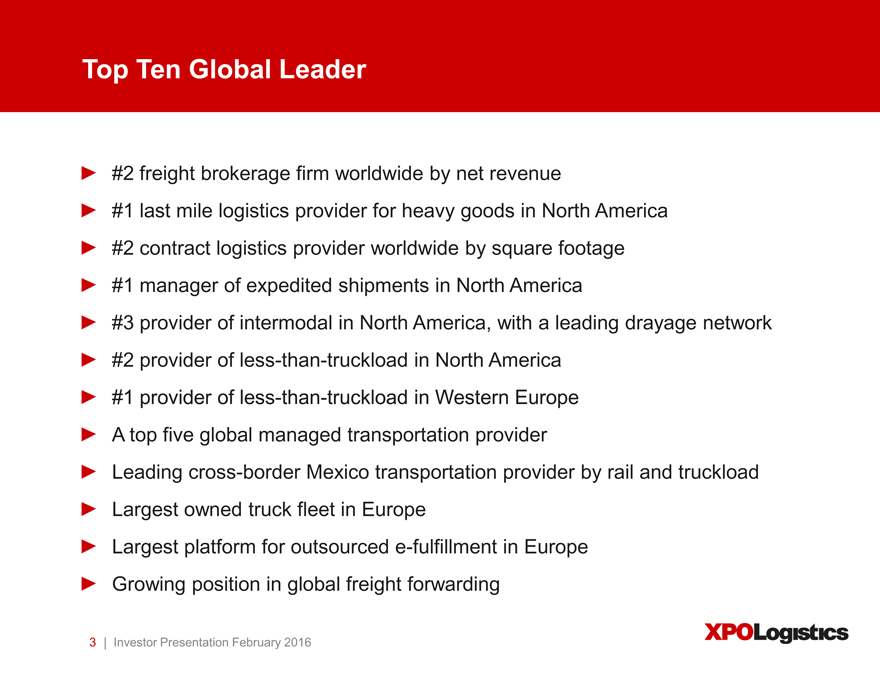
Top Ten Global Leader
#2 freight brokerage firm worldwide by net revenue
#1 last mile logistics provider for heavy goods in North America #2 contract logistics provider worldwide by square footage #1 manager of expedited shipments in North America
#3 provider of intermodal in North America, with a leading drayage network #2 provider of less-than-truckload in North America #1 provider of less-than-truckload in Western Europe A top five global managed transportation provider Leading cross-border Mexico transportation provider by rail and truckload Largest owned truck fleet in Europe Largest platform for outsourced e-fulfillment in Europe Growing position in global freight forwarding
3 | Investor Presentation February 2016
|
|
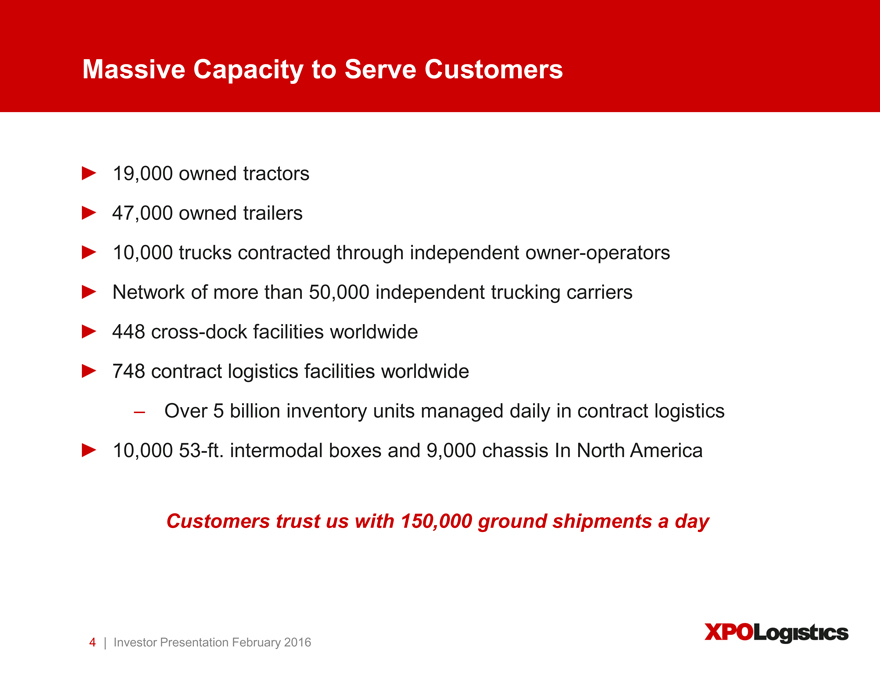
Massive Capacity to Serve Customers
19,000 owned tractors 47,000 owned trailers
10,000 trucks contracted through independent owner-operators Network of more than 50,000 independent trucking carriers 448 cross-dock facilities worldwide 748 contract logistics facilities worldwide
Over 5 billion inventory units managed daily in contract logistics
10,000 53-ft. intermodal boxes and 9,000 chassis In North America
Customers trust us with 150,000 ground shipments a day
4 | Investor Presentation February 2016
|
|
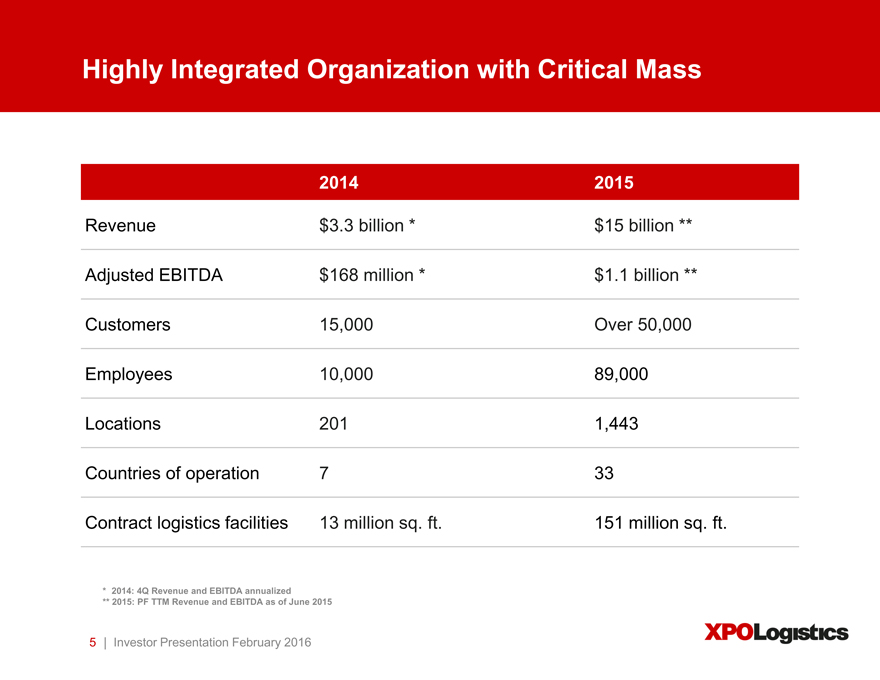
Highly Integrated Organization with Critical Mass
2014 2015
Revenue $ 3.3 billion * $ 15 billion **
Adjusted EBITDA $ 168 million * $ 1.1 billion **
Customers 15,000 Over 50,000
Employees 10,000 89,000
Locations 201 1,443
Countries of operation 7 33
Contract logistics facilities 13 million sq. ft. 151 million sq. ft.
* 2014: 4Q Revenue and EBITDA annualized
** 2015: PF TTM Revenue and EBITDA as of June 2015
5 | Investor Presentation February 2016
|
|
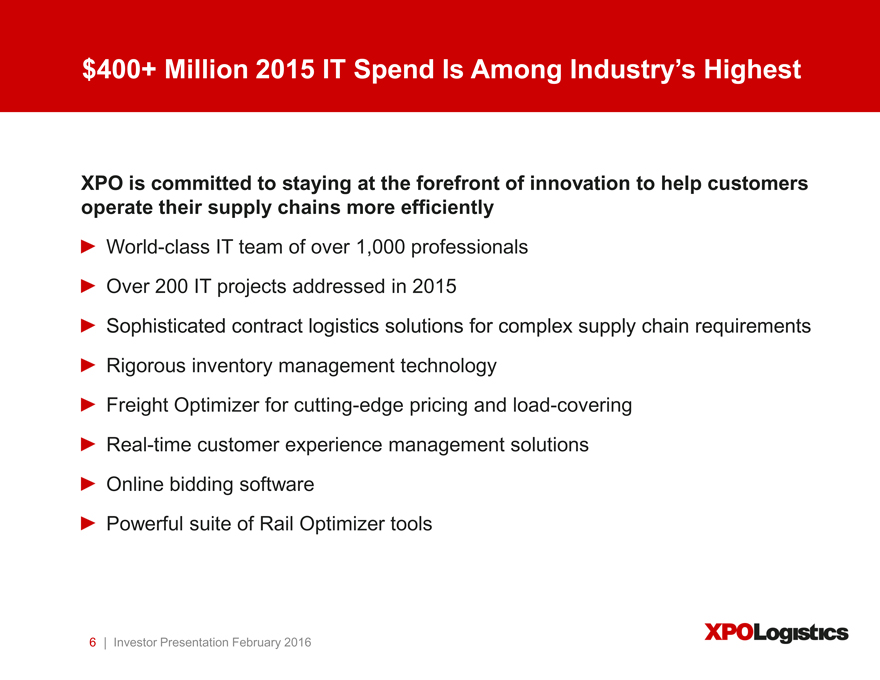
$400+ Million 2015 IT Spend Is Among Industry’s Highest
XPO is committed to staying at the forefront of innovation to help customers operate their supply chains more efficiently
World-class IT team of over 1,000 professionals Over 200 IT projects addressed in 2015
Sophisticated contract logistics solutions for complex supply chain requirements Rigorous inventory management technology Freight Optimizer for cutting-edge pricing and load-covering Real-time customer experience management solutions Online bidding software Powerful suite of Rail Optimizer tools
6 | Investor Presentation February 2016
|
|
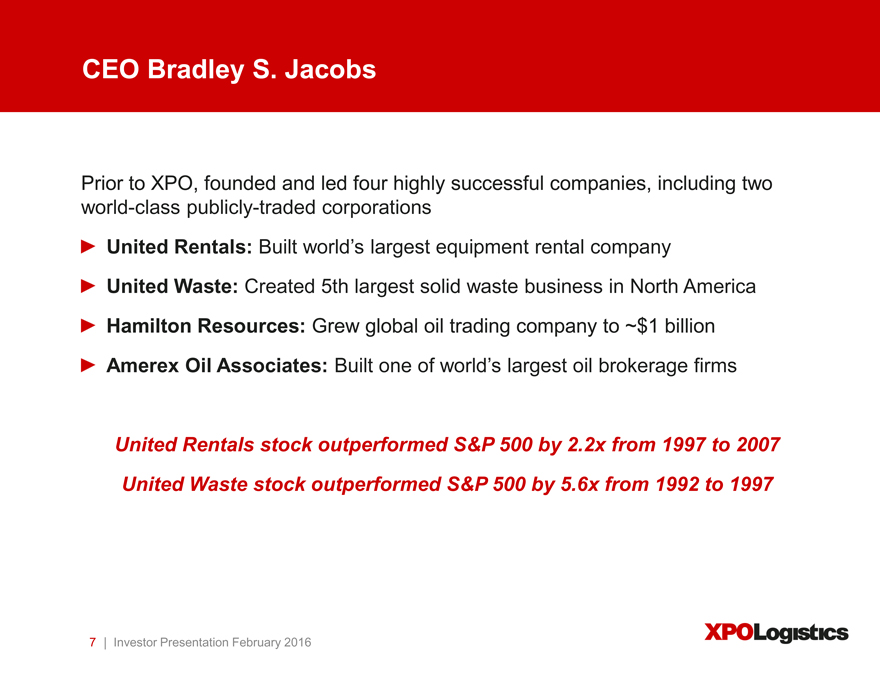
CEO Bradley S. Jacobs
Prior to XPO, founded and led four highly successful companies, including two world-class publicly-traded corporations
United Rentals stock outperformed S&P 500 by 2.2x from 1997 to 2007 United Waste stock outperformed S&P 500 by 5.6x from 1992 to 1997
7 | Investor Presentation February 2016
|
|
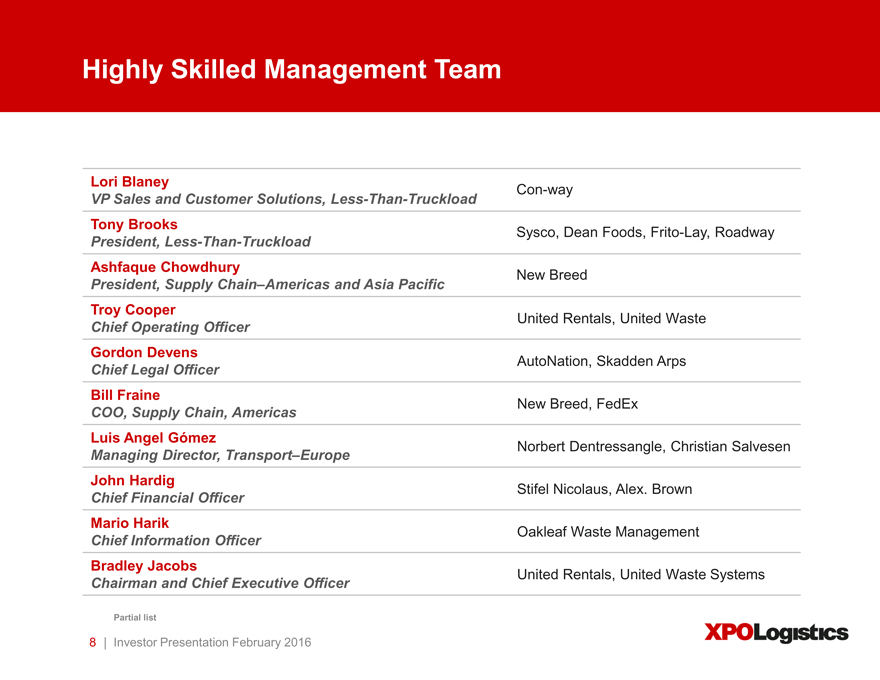
Highly Skilled Management Team
Lori Blaney Con-way
VP Sales and Customer Solutions, Less-Than-Truckload
Tony Brooks Sysco, Dean Foods, Frito-Lay, Roadway
President, Less-Than-Truckload
Ashfaque Chowdhury New Breed
President, Supply Chain–Americas and Asia Pacific
Troy Cooper
Chief Operating Officer United Rentals, United Waste
Gordon Devens
Chief Legal Officer AutoNation, Skadden Arps
Bill Fraine
COO, Supply Chain, Americas New Breed, FedEx
Luis Angel Gómez
Managing Director, Transport–Europe Norbert Dentressangle, Christian Salvesen
John Hardig
Chief Financial Officer Stifel Nicolaus, Alex. Brown
Mario Harik
Chief Information Officer Oakleaf Waste Management
Bradley Jacobs
Chairman and Chief Executive Officer United Rentals, United Waste Systems
Partial list
8 | Investor Presentation February 2016
|
|
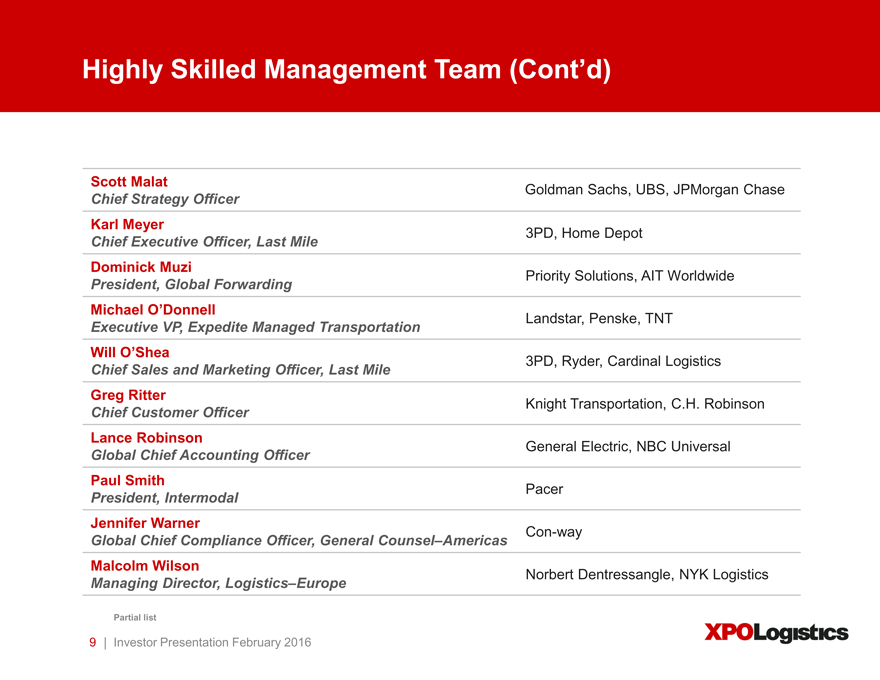
Highly Skilled Management Team (Cont’d)
Scott Malat Goldman Sachs, UBS, JPMorgan Chase
Chief Strategy Officer
Karl Meyer
Chief Executive Officer, Last Mile 3PD, Home Depot
Dominick Muzi
President, Global Forwarding Priority Solutions, AIT Worldwide
Michael O’Donnell
Executive VP, Expedite Managed Transportation Landstar, Penske, TNT
Will O’Shea
Chief Sales and Marketing Officer, Last Mile 3PD, Ryder, Cardinal Logistics
Greg Ritter
Chief Customer Officer Knight Transportation, C.H. Robinson
Lance Robinson
Global Chief Accounting Officer General Electric, NBC Universal
Paul Smith
President, Intermodal Pacer
Jennifer Warner
Global Chief Compliance Officer, General Counsel–Americas Con-way
Malcolm Wilson
Managing Director, Logistics–Europe Norbert Dentressangle, NYK Logistics
Partial list
9 | Investor Presentation February 2016
|
|
Blue Chip Customers
Any trademarks or logos used in this presentation are the property of their respective owners
10 | Investor Presentation February 2016
|
|
Blue Chip Customers
Any trademarks or logos used in this presentation are the property of their respective owners
11 | Investor Presentation February 2016
|
|
End-to-End Supply Chain Solutions
|
|
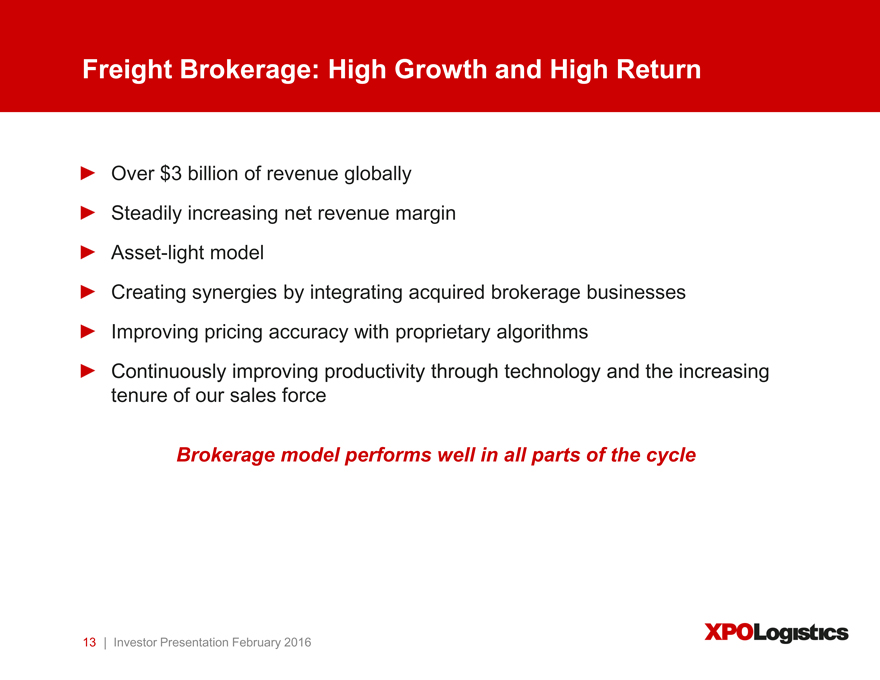
Freight Brokerage: High Growth and High Return
Over $3 billion of revenue globally Steadily increasing net revenue margin Asset-light model
Creating synergies by integrating acquired brokerage businesses Improving pricing accuracy with proprietary algorithms
Continuously improving productivity through technology and the increasing tenure of our sales force
Brokerage model performs well in all parts of the cycle
13 | Investor Presentation February 2016
|
|
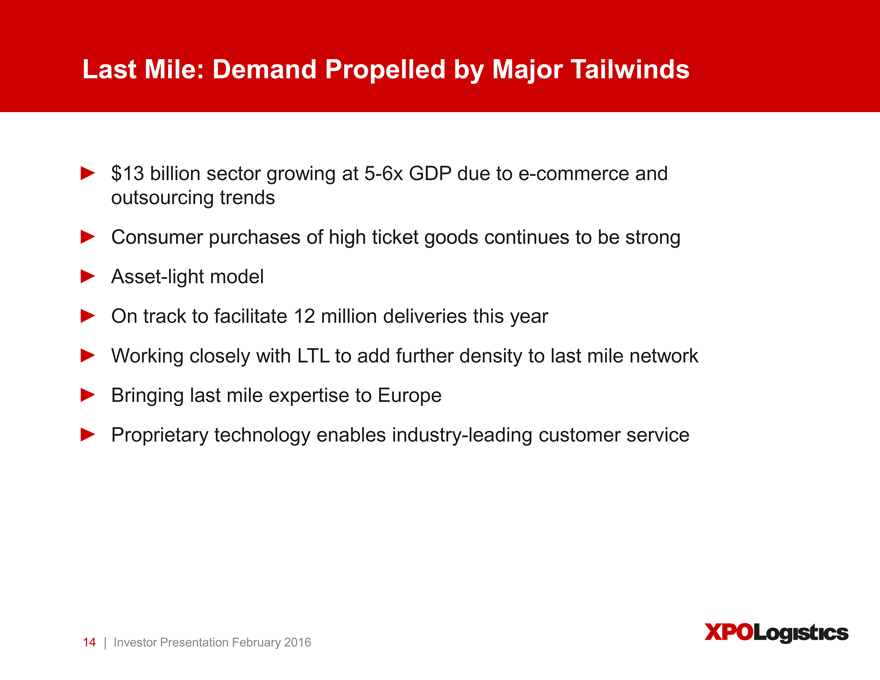
Last Mile: Demand Propelled by Major Tailwinds
$13 billion sector growing at 5-6x GDP due to e-commerce and outsourcing trends Consumer purchases of high ticket goods continues to be strong Asset-light model On track to facilitate 12 million deliveries this year Working closely with LTL to add further density to last mile network Bringing last mile expertise to Europe Proprietary technology enables industry-leading customer service
14 | Investor Presentation February 2016
|
|
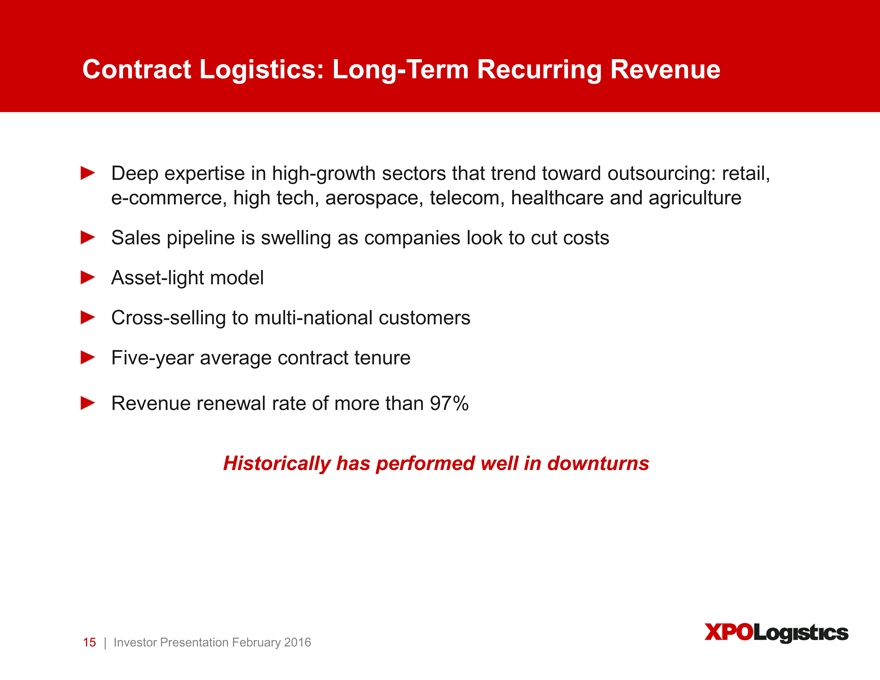
Contract Logistics: Long-Term Recurring Revenue
Deep expertise in high-growth sectors that trend toward outsourcing: retail, e-commerce, high tech, aerospace, telecom, healthcare and agriculture Sales pipeline is swelling as companies look to cut costs Asset-light model Cross-selling to multi-national customers Five-year average contract tenure
Revenue renewal rate of more than 97%
Historically has performed well in downturns
15 | Investor Presentation February 2016
|
|
European Operations Continue to Beat Budget
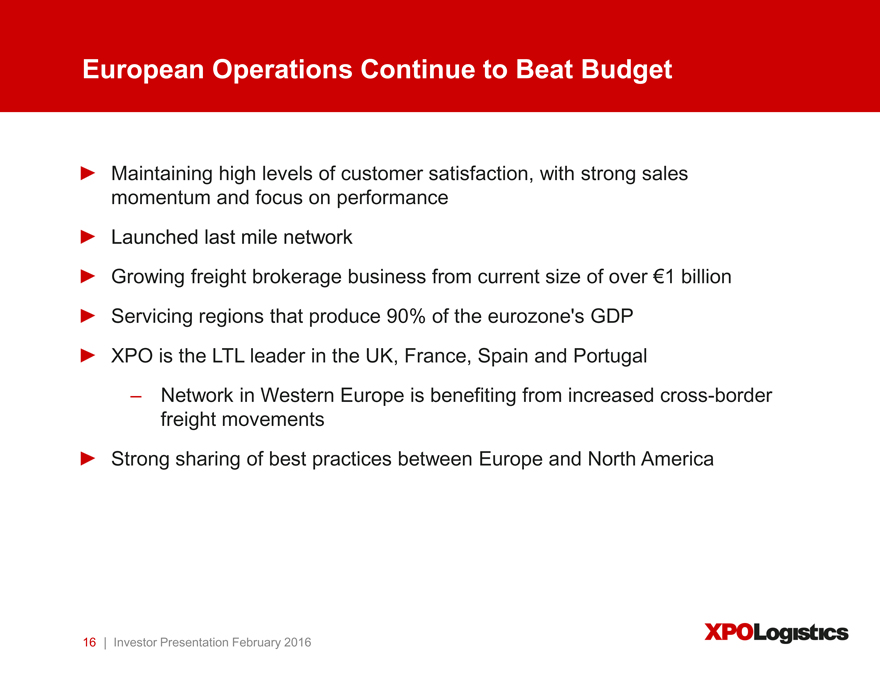
Maintaining high levels of customer satisfaction, with strong sales momentum and focus on performance Launched last mile network Growing freight brokerage business from current size of over ¬1 billion Servicing regions that produce 90% of the eurozone’s GDP
XPO is the LTL leader in the UK, France, Spain and Portugal
Network in Western Europe is benefiting from increased cross-border freight movements
Strong sharing of best practices between Europe and North America
16 | Investor Presentation February 2016
|
|
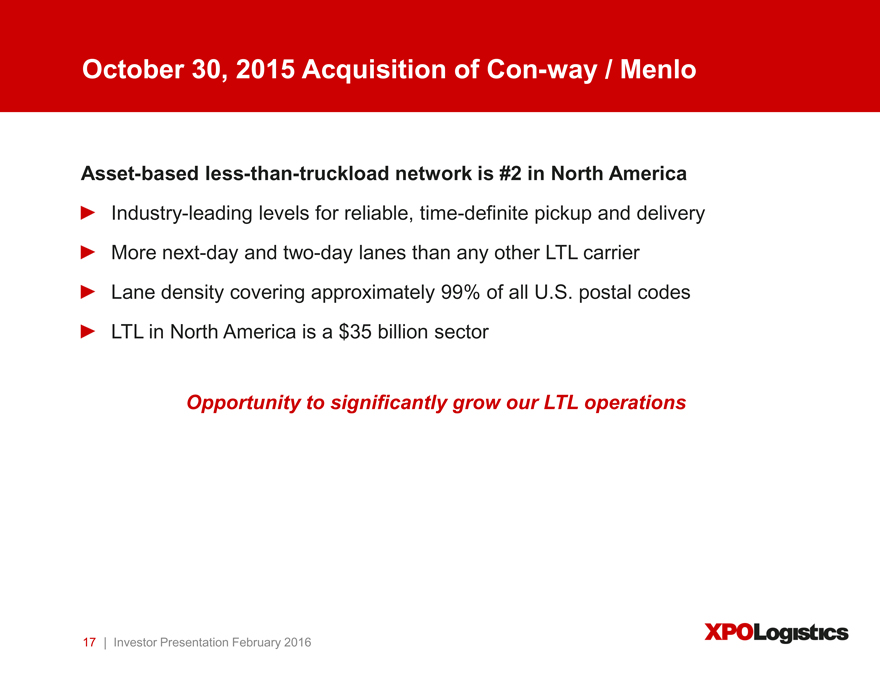
October 30, 2015 Acquisition of Con-way / Menlo
Asset-based less-than-truckload network is #2 in North America
Industry-leading levels for reliable, time-definite pickup and delivery More next-day and two-day lanes than any other LTL carrier Lane density covering approximately 99% of all U.S. postal codes LTL in North America is a $35 billion sector
Opportunity to significantly grow our LTL operations
17 | Investor Presentation February 2016
|
|
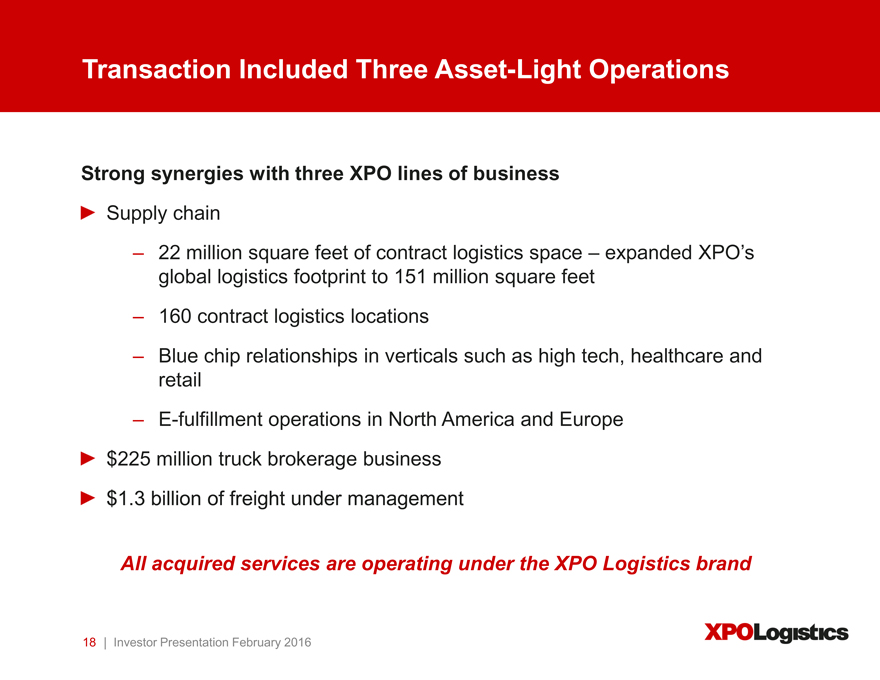
Transaction Included Three Asset-Light Operations
Strong synergies with three XPO lines of business
Supply chain
22 million square feet of contract logistics space – expanded XPO’s global logistics footprint to 151 million square feet 160 contract logistics locations Blue chip relationships in verticals such as high tech, healthcare and retail E-fulfillment operations in North America and Europe
$225 million truck brokerage business $1.3 billion of freight under management
All acquired services are operating under the XPO Logistics brand
18 | Investor Presentation February 2016
|
|
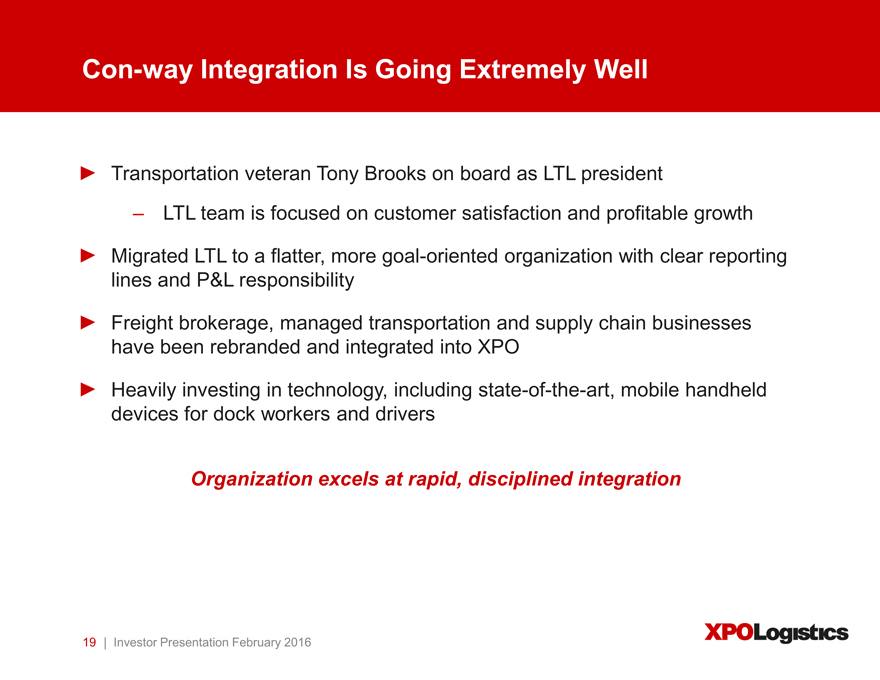
Con-way Integration Is Going Extremely Well
Transportation veteran Tony Brooks on board as LTL president
LTL team is focused on customer satisfaction and profitable growth
Migrated LTL to a flatter, more goal-oriented organization with clear reporting lines and P&L responsibility
Freight brokerage, managed transportation and supply chain businesses have been rebranded and integrated into XPO
Heavily investing in technology, including state-of-the-art, mobile handheld devices for dock workers and drivers
Organization excels at rapid, disciplined integration
19 | Investor Presentation February 2016
|
|
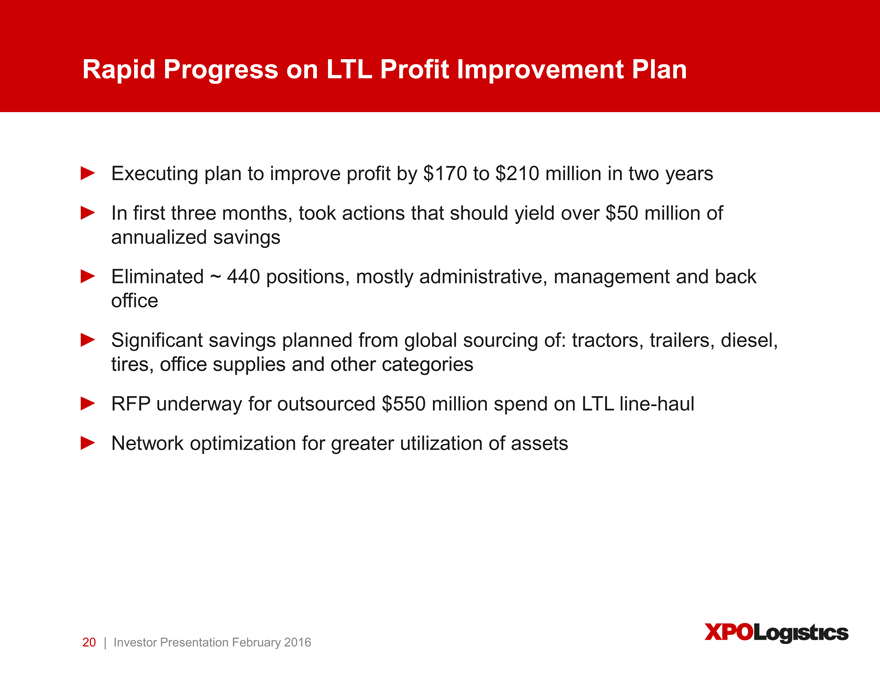
Rapid Progress on LTL Profit Improvement Plan
Executing plan to improve profit by $170 to $210 million in two years In first three months, took actions that should yield over $50 million of annualized savings Eliminated ~ 440 positions, mostly administrative, management and back office Significant savings planned from global sourcing of: tractors, trailers, diesel, tires, office supplies and other categories RFP underway for outsourced $550 million spend on LTL line-haul Network optimization for greater utilization of assets
20 | Investor Presentation February 2016
|
|
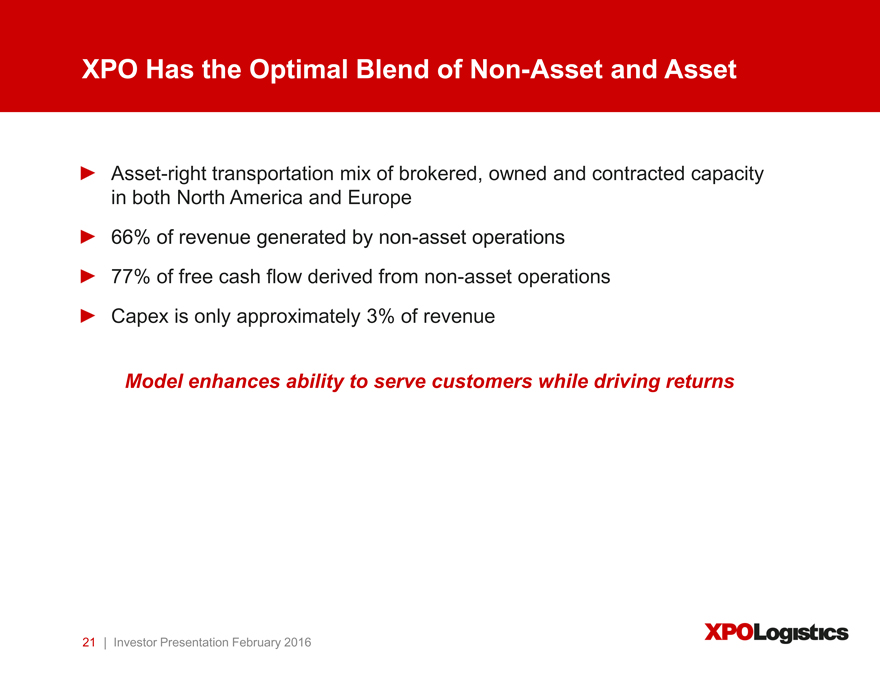
XPO Has the Optimal Blend of Non-Asset and Asset
Asset-right transportation mix of brokered, owned and contracted capacity in both North America and Europe 66% of revenue generated by non-asset operations 77% of free cash flow derived from non-asset operations Capex is only approximately 3% of revenue
Model enhances ability to serve customers while driving returns
21 | Investor Presentation February 2016
|
|
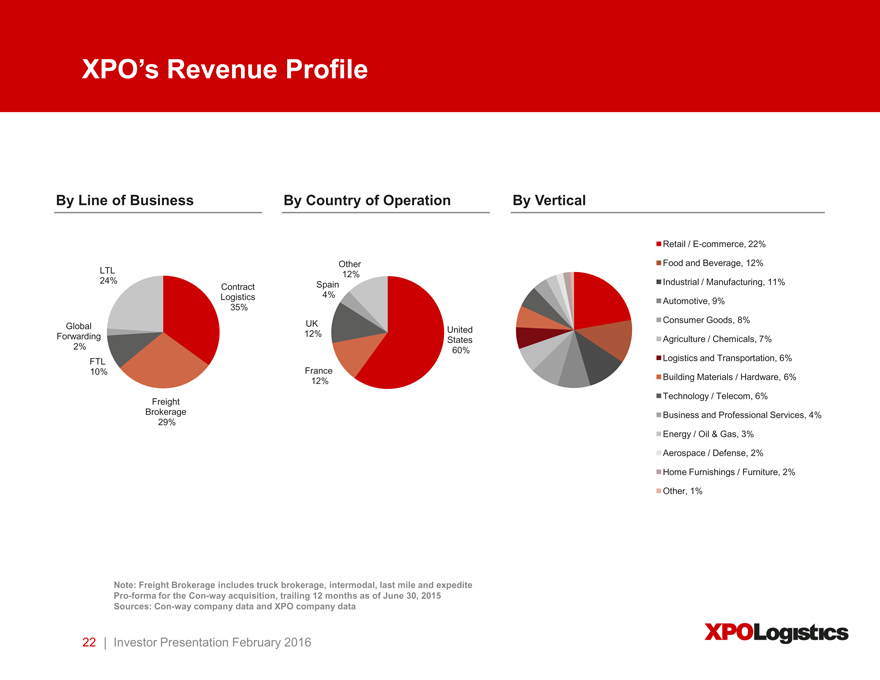
XPO’s Revenue Profile
By Line of Business By Country of Operation By Vertical
Retail / E-commerce, 22%
Other Food and Beverage, 12%
LTL 12%
24% Contract Spain Industrial / Manufacturing, 11%
Logistics 4% Automotive, 9%
35%
Global UK Consumer Goods, 8%
Forwarding 12% United Agriculture / Chemicals, 7%
States
2% 60%
FTL Logistics and Transportation, 6%
10% France
12% Building Materials / Hardware, 6%
Freight Technology / Telecom, 6%
Brokerage Business and Professional Services, 4%
29%
Energy / Oil & Gas, 3%
Aerospace / Defense, 2%
Home Furnishings / Furniture, 2%
Other, 1%
Note: Freight Brokerage includes truck brokerage, intermodal, last mile and expedite Pro-forma for the Con-way acquisition, trailing 12 months as of June 30, 2015 Sources: Con-way company data and XPO company data
22 | Investor Presentation February 2016
|
|

Financial Highlights
|
|
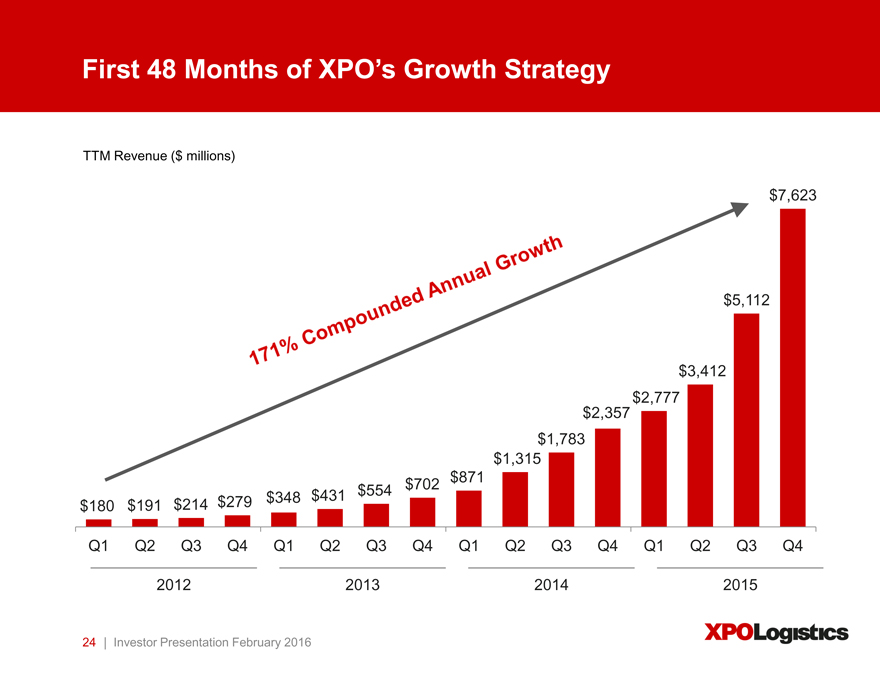
First 48 Months of XPO’s Growth Strategy
TTM Revenue ($ millions)
$7,623
$5,112
$3,412
$2,777
$2,357
$1,783
$1,315
$871
$180 $191 $214 $279 $348 $431 $554 $702
Q1 Q2 Q3 Q4 Q1 Q2 Q3 Q4 Q1 Q2 Q3 Q4 Q1 Q2 Q3 Q4
2012 2013 2014 2015
24 | Investor Presentation February 2016
|
|
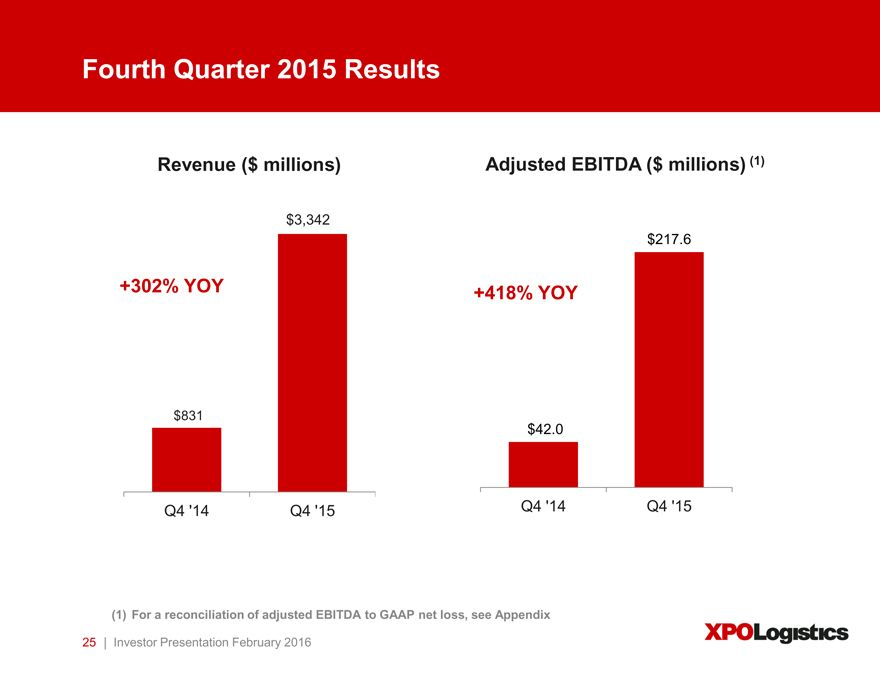
Fourth Quarter 2015 Results
Revenue ($ millions) Adjusted EBITDA ($ millions) (1)
$3,342
$217.6
+302% YOY +418% YOY
$831
$42.0
Q4 ‘14 Q4 ‘15 Q4 ‘14 Q4 ‘15
(1) For a reconciliation of adjusted EBITDA to GAAP net loss, see Appendix
25 | Investor Presentation February 2016
|
|
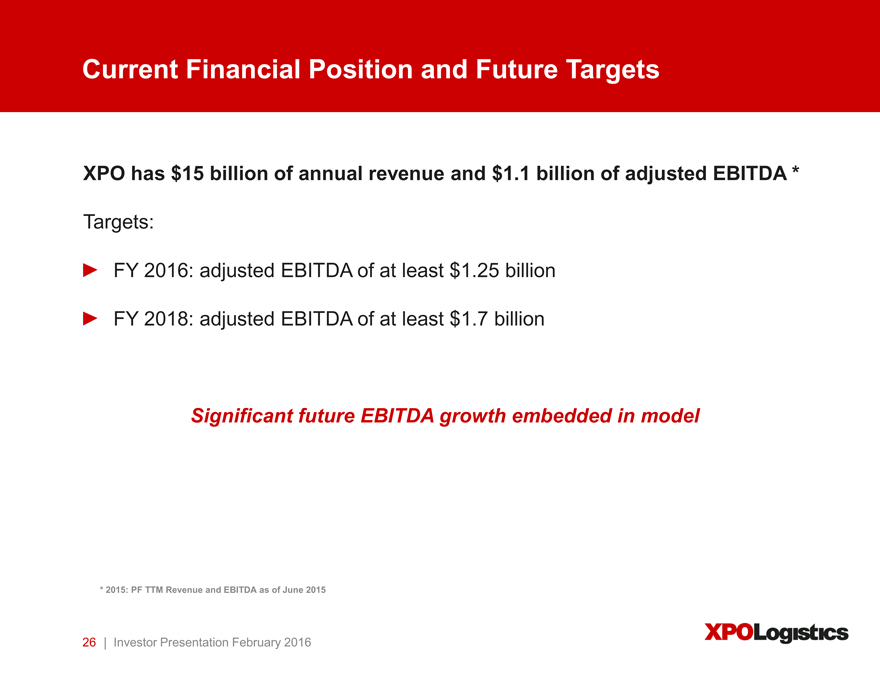
Current Financial Position and Future Targets
XPO has $15 billion of annual revenue and $1.1 billion of adjusted EBITDA *
Targets:
FY 2016: adjusted EBITDA of at least $1.25 billion
FY 2018: adjusted EBITDA of at least $1.7 billion
Significant future EBITDA growth embedded in model
* 2015: PF TTM Revenue and EBITDA as of June 2015
26 | Investor Presentation February 2016
|
|
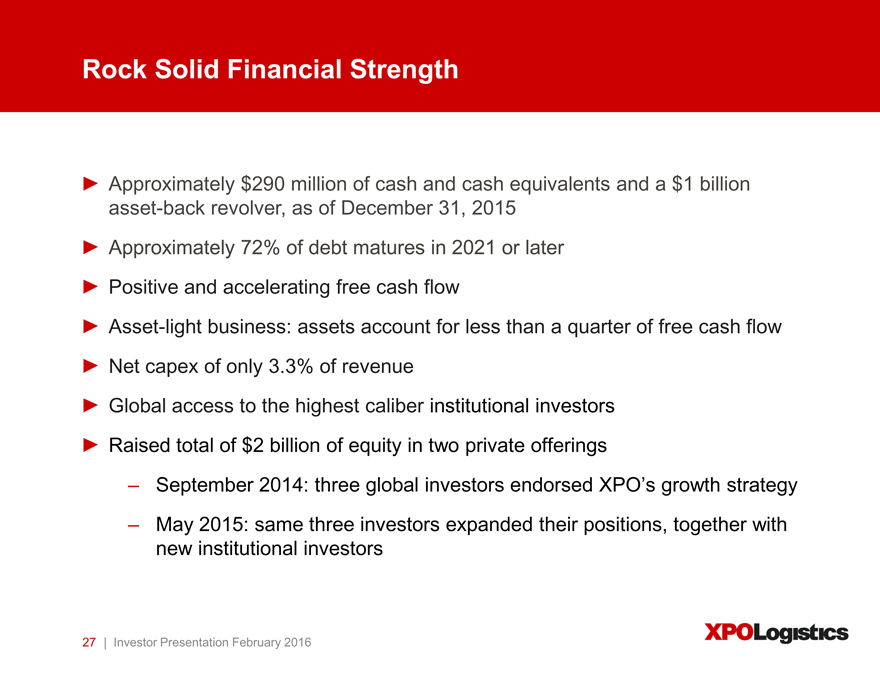
Rock Solid Financial Strength
Approximately $290 million of cash and cash equivalents and a $1 billion asset-back revolver, as of December 31, 2015 Approximately 72% of debt matures in 2021 or later Positive and accelerating free cash flow Asset-light business: assets account for less than a quarter of free cash flow Net capex of only 3.3% of revenue Global access to the highest caliber institutional investors Raised total of $2 billion of equity in two private offerings
September 2014: three global investors endorsed XPO’s growth strategy May 2015: same three investors expanded their positions, together with new institutional investors
27 | Investor Presentation February 2016
|
|
Summary
|
|
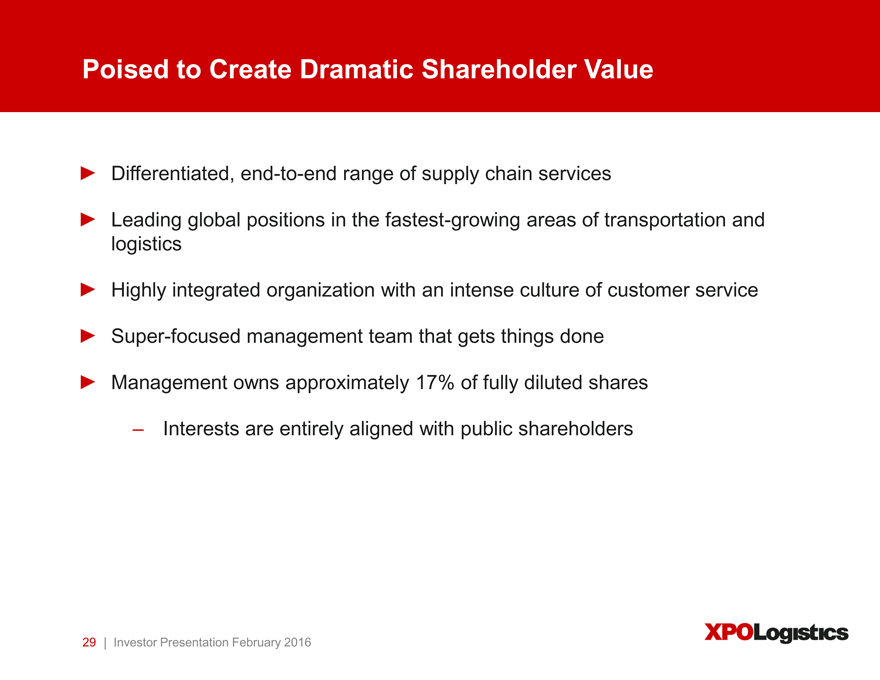
Poised to Create Dramatic Shareholder Value
Differentiated, end-to-end range of supply chain services
Leading global positions in the fastest-growing areas of transportation and logistics
Highly integrated organization with an intense culture of customer service Super-focused management team that gets things done Management owns approximately 17% of fully diluted shares
Interests are entirely aligned with public shareholders
29 | Investor Presentation February 2016
|
|
Supplemental Materials
|
|
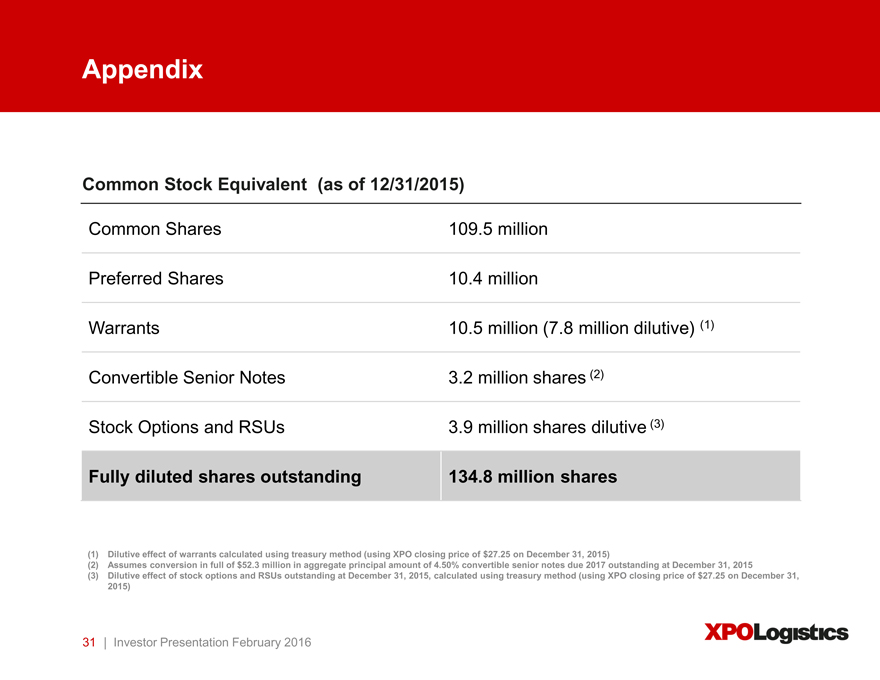
Appendix
Common Stock Equivalent (as of 12/31/2015)
Common Shares 109.5 million
Preferred Shares 10.4 million
Warrants 10.5 million (7.8 million dilutive) (1)
Convertible Senior Notes 3.2 million shares (2)
Stock Options and RSUs 3.9 million shares dilutive (3)
Fully diluted shares outstanding 134.8 million shares
(1) Dilutive effect of warrants calculated using treasury method (using XPO closing price of $27.25 on December 31, 2015)
(2) Assumes conversion in full of $52.3 million in aggregate principal amount of 4.50% convertible senior notes due 2017 outstanding at December 31, 2015
(3) Dilutive effect of stock options and RSUs outstanding at December 31, 2015, calculated using treasury method (using XPO closing price of $27.25 on December 31,
2015)
31 | Investor Presentation February 2016
|
|
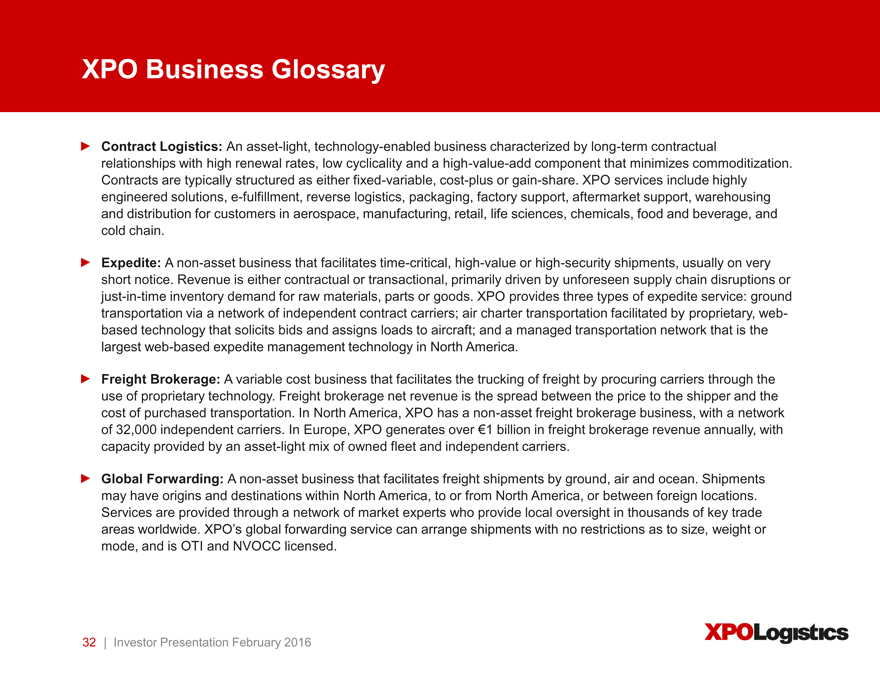
XPO Business Glossary
Contract Logistics: An asset-light, technology-enabled business characterized by long-term contractual relationships with high renewal rates, low cyclicality and a high-value-add component that minimizes commoditization. Contracts are typically structured as either fixed-variable, cost-plus or gain-share. XPO services include highly engineered solutions, e-fulfillment, reverse logistics, packaging, factory support, aftermarket support, warehousing and distribution for customers in aerospace, manufacturing, retail, life sciences, chemicals, food and beverage, and cold chain.
Expedite: A non-asset business that facilitates time-critical, high-value or high-security shipments, usually on very short notice. Revenue is either contractual or transactional, primarily driven by unforeseen supply chain disruptions or just-in-time inventory demand for raw materials, parts or goods. XPO provides three types of expedite service: ground transportation via a network of independent contract carriers; air charter transportation facilitated by proprietary, web-based technology that solicits bids and assigns loads to aircraft; and a managed transportation network that is the largest web-based expedite management technology in North America.
Freight Brokerage: A variable cost business that facilitates the trucking of freight by procuring carriers through the use of proprietary technology. Freight brokerage net revenue is the spread between the price to the shipper and the cost of purchased transportation. In North America, XPO has a non-asset freight brokerage business, with a network of 32,000 independent carriers. In Europe, XPO generates over ¬1 billion in freight brokerage revenue annually, with capacity provided by an asset-light mix of owned fleet and independent carriers.
Global Forwarding: A non-asset business that facilitates freight shipments by ground, air and ocean. Shipments may have origins and destinations within North America, to or from North America, or between foreign locations. Services are provided through a network of market experts who provide local oversight in thousands of key trade areas worldwide. XPO’s global forwarding service can arrange shipments with no restrictions as to size, weight or mode, and is OTI and NVOCC licensed.
32 | Investor Presentation February 2016
|
|
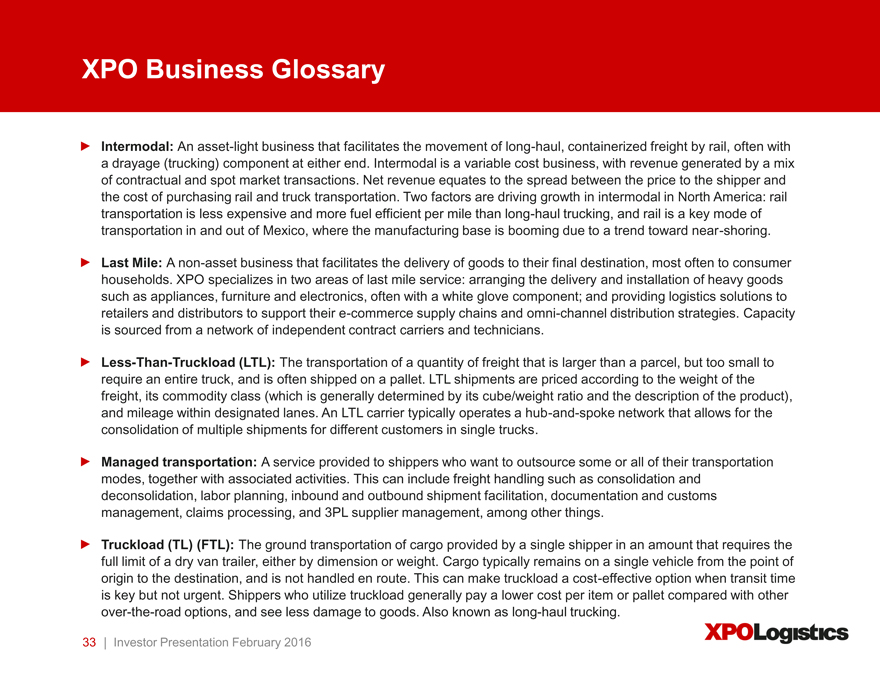
XPO Business Glossary
Intermodal: An asset-light business that facilitates the movement of long-haul, containerized freight by rail, often with a drayage (trucking) component at either end. Intermodal is a variable cost business, with revenue generated by a mix of contractual and spot market transactions. Net revenue equates to the spread between the price to the shipper and the cost of purchasing rail and truck transportation. Two factors are driving growth in intermodal in North America: rail transportation is less expensive and more fuel efficient per mile than long-haul trucking, and rail is a key mode of transportation in and out of Mexico, where the manufacturing base is booming due to a trend toward near-shoring.
Last Mile: A non-asset business that facilitates the delivery of goods to their final destination, most often to consumer households. XPO specializes in two areas of last mile service: arranging the delivery and installation of heavy goods such as appliances, furniture and electronics, often with a white glove component; and providing logistics solutions to retailers and distributors to support their e-commerce supply chains and omni-channel distribution strategies. Capacity is sourced from a network of independent contract carriers and technicians.
Less-Than-Truckload (LTL): The transportation of a quantity of freight that is larger than a parcel, but too small to require an entire truck, and is often shipped on a pallet. LTL shipments are priced according to the weight of the freight, its commodity class (which is generally determined by its cube/weight ratio and the description of the product), and mileage within designated lanes. An LTL carrier typically operates a hub-and-spoke network that allows for the consolidation of multiple shipments for different customers in single trucks.
Managed transportation: A service provided to shippers who want to outsource some or all of their transportation modes, together with associated activities. This can include freight handling such as consolidation and deconsolidation, labor planning, inbound and outbound shipment facilitation, documentation and customs management, claims processing, and 3PL supplier management, among other things.
Truckload (TL) (FTL): The ground transportation of cargo provided by a single shipper in an amount that requires the full limit of a dry van trailer, either by dimension or weight. Cargo typically remains on a single vehicle from the point of origin to the destination, and is not handled en route. This can make truckload a cost-effective option when transit time is key but not urgent. Shippers who utilize truckload generally pay a lower cost per item or pallet compared with other over-the-road options, and see less damage to goods. Also known as long-haul trucking.
33 | Investor Presentation February 2016
|
|
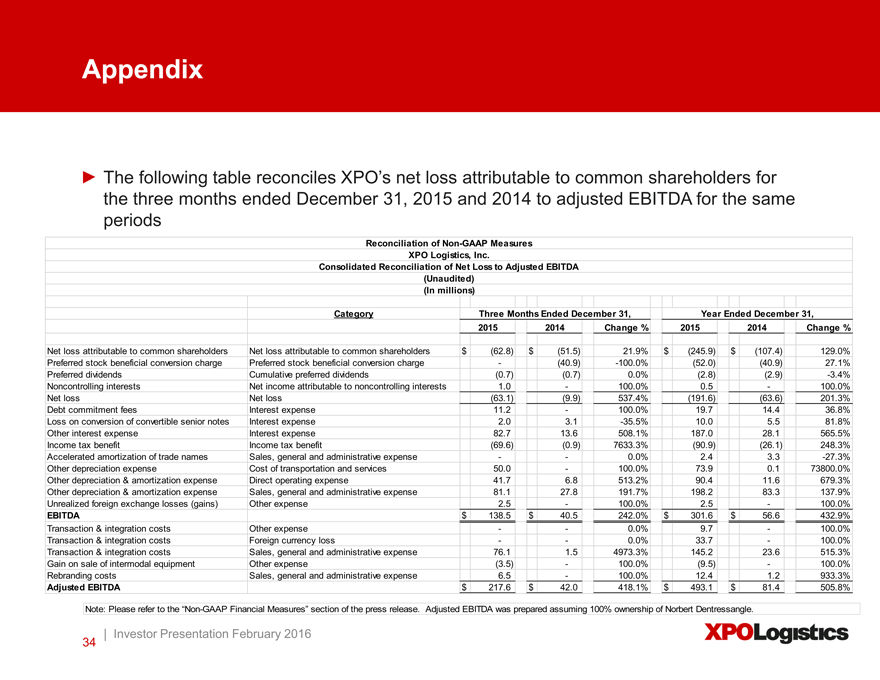
Appendix
The following table reconciles XPO’s net loss attributable to common shareholders for the three months ended December 31, 2015 and 2014 to adjusted EBITDA for the same periods
Reconciliation of Non-GAAP Measures
XPO Logistics, Inc.
Consolidated Reconciliation of Net Loss to Adjusted EBITDA
(Unaudited)
(In millions)
Category Three Months Ended December 31, Year Ended December 31,
2015 2014 Change % 2015 2014 Change %
Net loss attributable to common shareholders Net loss attributable to common shareholders $(62.8) $(51.5) 21.9% $(245.9) $(107.4) 129.0%
Preferred stock beneficial conversion charge Preferred stock beneficial conversion charge -(40.9) -100.0%(52.0)(40.9) 27.1%
Preferred dividends Cumulative preferred dividends(0.7)(0.7) 0.0%(2.8)(2.9) -3.4%
Noncontrolling interests Net income attributable to noncontrolling interests 1.0—100.0% 0.5—100.0%
Net loss Net loss(63.1)(9.9) 537.4%(191.6)(63.6) 201.3%
Debt commitment fees Interest expense 11.2—100.0% 19.7 14.4 36.8%
Loss on conversion of convertible senior notes Interest expense 2.0 3.1 -35.5% 10.0 5.5 81.8%
Other interest expense Interest expense 82.7 13.6 508.1% 187.0 28.1 565.5%
Income tax benefit Income tax benefit(69.6)(0.9) 7633.3%(90.9)(26.1) 248.3%
Accelerated amortization of trade names Sales, general and administrative expense — 0.0% 2.4 3.3 -27.3%
Other depreciation expense Cost of transportation and services 50.0—100.0% 73.9 0.1 73800.0%
Other depreciation & amortization expense Direct operating expense 41.7 6.8 513.2% 90.4 11.6 679.3%
Other depreciation & amortization expense Sales, general and administrative expense 81.1 27.8 191.7% 198.2 83.3 137.9%
Unrealized foreign exchange losses (gains) Other expense 2.5—100.0% 2.5—100.0%
EBITDA $ 138.5 $ 40.5 242.0% $ 301.6 $ 56.6 432.9%
Transaction & integration costs Other expense — 0.0% 9.7—100.0%
Transaction & integration costs Foreign currency loss — 0.0% 33.7—100.0%
Transaction & integration costs Sales, general and administrative expense 76.1 1.5 4973.3% 145.2 23.6 515.3%
Gain on sale of intermodal equipment Other expense(3.5)—100.0%(9.5)—100.0%
Rebranding costs Sales, general and administrative expense 6.5—100.0% 12.4 1.2 933.3%
Adjusted EBITDA $ 217.6 $ 42.0 418.1% $ 493.1 $ 81.4 505.8%
Note: Please refer to the “Non-GAAP Financial Measures” section of the press release. Adjusted EBITDA was prepared assuming 100% ownership of Norbert Dentressangle.
Note: Please refer to the “Non-GAAP Financial Measures” section
| Investor Presentation February 2016 34