Attached files
| file | filename |
|---|---|
| EX-32.1 - EX-32.1 - ONTO INNOVATION INC. | nano-ex321_7.htm |
| EX-31.1 - EX-31.1 - ONTO INNOVATION INC. | nano-ex311_9.htm |
| EX-23.1 - EX-23.1 - ONTO INNOVATION INC. | nano-ex231_8.htm |
| EX-31.2 - EX-31.2 - ONTO INNOVATION INC. | nano-ex312_6.htm |
| EX-21.1 - EX-21.1 - ONTO INNOVATION INC. | nano-ex211_10.htm |
UNITED STATES
SECURITIES AND EXCHANGE COMMISSION
Washington, D.C. 20549
FORM 10-K
(Mark One)
|
x |
ANNUAL REPORT PURSUANT TO SECTION 13 OR 15(d) OF THE SECURITIES EXCHANGE ACT OF 1934 |
For the fiscal year ended December 26, 2015
OR
|
o |
TRANSITION REPORT PURSUANT TO SECTION 13 OR 15(d) OF THE SECURITIES EXCHANGE ACT OF 1934 |
For the transition period from to
Commission file number: 000-13470
NANOMETRICS INCORPORATED
(Exact name of registrant as specified in its charter)
|
Delaware |
|
94-2276314 |
|
(State or other jurisdiction of incorporation or organization) |
|
(I.R.S. Employer Identification Number) |
|
1550 Buckeye Drive Milpitas, California |
|
95035 |
|
(Address of principal executive offices) |
|
(Zip Code) |
Registrant’s telephone number, including area code: (408) 545-6000
Securities registered pursuant to Section 12(b) of the Act:
|
Title of each class |
|
Name of each exchange on which registered |
|
Common Stock, $0.001 par value per share |
|
The NASDAQ Stock Market LLC (NASDAQ Global Select Market) |
Securities registered pursuant to Section 12(g) of the Act:
None
Indicate by check mark if the Registrant is a well-known seasoned issuer as defined in Rule 405 of the Securities Act. Yes o No x.
Indicate by check mark if the Registrant is not required to file reports pursuant to Section 13 or Section 15(d) of the Act. Yes o No x.
Indicate by check mark whether the Registrant (1) has filed all reports required to be filed by Section 13 or 15(d) of the Securities Exchange Act of 1934 during the preceding 12 months (or for such shorter period that the Registrant was required to file such reports), and (2) has been subject to such filing requirements for the past 90 days. Yes x No o.
Indicate by check mark whether the registrant has submitted electronically and posted on its corporate Web site, if any, every Interactive Data File required to be submitted and posted pursuant to Rule 405 of Regulation S-T during the preceding 12 months (or for such shorter period that the registrant was required to submit and post such files). Yes x No o.
Indicate by check mark if disclosure of delinquent filers pursuant to Item 405 of Regulation S-K is not contained herein, and will not be contained, to the best of Registrant’s knowledge, in definitive proxy or information statements incorporated by reference in Part III of this Form 10-K or any amendment to this Form 10-K. o
Indicate by check mark whether the Registrant is a large accelerated filer, an accelerated filer, a non-accelerated filer or a smaller reporting company. See the definitions of “large accelerated filer”, “accelerated filer”, and “smaller reporting company” in Rule 12b-2 of the Exchange Act. (Check one):
|
Large accelerated filer |
|
o |
|
Accelerated filer |
|
ý |
|
|
|
|
|
|||
|
Non-accelerated filer |
|
o |
|
Smaller reporting company |
|
o |
Indicate by check mark whether the Registrant is a shell company (as defined by Rule 12b-2 of the Act) Yes o No x.
As of June 27, 2015, the last business day of the Registrant’s most recently completed second fiscal quarter, the aggregate market value of the common stock of Registrant held by non-affiliates, based upon the closing sales price for the Registrant’s common stock for such date, as quoted on the NASDAQ Global Select Market, was approximately $400.6 million. Shares of common stock held by each officer and director and by each person who owned 5% or more of the outstanding common stock have been excluded because such persons may be deemed to be “affiliates” as that term is defined under the rules and regulations of the Exchange Act. This determination of affiliate status is not necessarily a conclusive determination for any other purpose.
The number of shares of the Registrant’s common stock outstanding as of February 12, 2016 was 24,297,590.
DOCUMENTS INCORPORATED BY REFERENCE
The Registrant has incorporated by reference into Part III of this Annual Report on Form 10-K portions of its Proxy Statement for its 2016 Annual Meeting of Stockholders to be filed pursuant to Regulation 14A. The Proxy Statement will be filed within 120 days of Registrant’s fiscal year ended December 26, 2015.
FORM 10-K
FOR THE FISCAL YEAR ENDED DECEMBER 26, 2015
TABLE OF CONTENTS
|
|
|
|
|
|
|
ITEM 1. |
3 |
|
|
|
ITEM 1A. |
10 |
|
|
|
ITEM 1B. |
20 |
|
|
|
ITEM 2. |
20 |
|
|
|
ITEM 3. |
20 |
|
|
|
ITEM 4. |
20 |
|
|
|
|
|
|
|
|
|
|
|
|
|
ITEM 5. |
21 |
|
|
|
ITEM 6. |
23 |
|
|
|
ITEM 7. |
MANAGEMENT’S DISCUSSION AND ANALYSIS OF FINANCIAL CONDITION AND RESULTS OF OPERATIONS |
24 |
|
|
ITEM 7A. |
34 |
|
|
|
ITEM 8. |
36 |
|
|
|
ITEM 9. |
CHANGES IN AND DISAGREEMENTS WITH ACCOUNTANTS ON ACCOUNTING AND FINANCIAL DISCLOSURE |
69 |
|
|
ITEM 9A. |
69 |
|
|
|
ITEM 9B. |
70 |
|
|
|
|
|
|
|
|
|
|
|
|
|
ITEM 10. |
71 |
|
|
|
ITEM 11. |
71 |
|
|
|
ITEM 12. |
SECURITY OWNERSHIP OF CERTAIN BENEFICIAL OWNERS AND MANAGEMENT AND RELATED STOCKHOLDER MATTERS |
71 |
|
|
ITEM 13. |
CERTAIN RELATIONSHIPS AND RELATED TRANSACTIONS, AND DIRECTOR INDEPENDENCE |
72 |
|
|
ITEM 14. |
72 |
|
|
|
|
|
|
|
|
|
|
|
|
|
ITEM 15. |
73 |
|
|
|
|
|
|
|
|
74 |
||
1
CAUTIONARY INFORMATION REGARDING FORWARD-LOOKING STATEMENTS
This Annual Report on Form 10-K for the year ended December 26, 2015, or “Form 10-K,” contains forward-looking statements concerning our business, operations, and financial performance and condition as well as our plans, objectives, and expectations for business operations and financial performance and condition. Any statements contained herein that are not of historical facts may be deemed to be forward-looking statements. You can identify these statements by words such as “anticipate,” “assume,” “believe,” “could,” “estimate,” “expect,” “intend,” “may,” “plan,” “should,” “will,” “would,” and other similar expressions that are predictions of or indicate future events and future trends. These forward-looking statements are based on current expectations, estimates, forecasts, and projections about our business and the industry in which we operate and management's beliefs and assumptions and are not guarantees of future performance or development and involve known and unknown risks, uncertainties, and other factors that are in some cases beyond our control. As a result, any or all of our forward-looking statements in this Form 10-K may turn out to be inaccurate. Factors that could materially affect our business operations and financial performance and condition include, but are not limited to, those risks and uncertainties described herein under “Item 1A - Risk Factors.” You are urged to consider these factors carefully in evaluating the forward-looking statements and are cautioned not to place undue reliance on the forward-looking statements. The forward-looking statements are based on information available to us as of the filing date of this Form 10-K. Unless required by law, we do not intend to publicly update or revise any forward-looking statements to reflect new information or future events or otherwise. You should, however, review the factors and risks we describe in the reports we will file from time to time with the Securities and Exchange Commission, or SEC, after the date of this Form 10-K.
2
Overview
Nanometrics Incorporated and its subsidiaries (“Nanometrics”, the “Company”, or “we”) is a leading provider of advanced, high-performance process control metrology and inspection systems used primarily in the fabrication of integrated circuits, sensors, discrete components, high-brightness LEDs (“HB-LED”) and data storage devices. Our automated and integrated systems address numerous process control applications, including critical dimension and film thickness measurement, device topography, defect inspection, and analysis of various other film properties such as optical, electrical and material characteristics. Our process control solutions are deployed throughout the fabrication process, from front-end-of-line substrate manufacturing, to high-volume production of semiconductors and other devices, to advanced wafer-scale packaging applications. Our systems enable device manufacturers to improve yields, increase productivity and lower their manufacturing costs.
We were incorporated in California in 1975, and reincorporated in Delaware in 2006. We have been publicly traded since 1984 (NASDAQ: NANO). We have an installed base of more than 6,500 systems in over 150 production factories worldwide. Our major customers include Samsung Electronics Co. Ltd., Intel Corporation, SK Hynix Semiconductor, Inc., Micron, Inc., Taiwan Semiconductor Manufacturing Company Limited, GlobalFoundries and Toshiba Corporation.
Additional information about us is available on our website at http://www.nanometrics.com. The information that can be accessed through our website, however, is not part of this Annual Report. The investor relations section of our website is located at http://www.nanometrics.com/investor.html. Our Annual Reports on Form 10-K, Quarterly Reports on Form 10-Q, Current Reports on Form 8-K and any amendments to those reports are available on the investor relations section of our website as soon as reasonably practicable after we electronically file or furnish such materials to the United States Securities and Exchange Commission (“SEC”). In addition, the reports and materials that we file with the SEC are available at the SEC's website (http://www.sec.gov) and at the SEC's Public Reference Room at 100 F Street, NE, Washington DC 20549. Interested parties may obtain information on the operation of the Public Reference Room by calling the SEC at 1-800-SEC-0330.
Industry Background
We participate in the sale, design, manufacture, marketing and support of process control systems for optical critical dimension metrology, thin film metrology, advanced 3-D packaging process control, and wafer defect inspection used for semiconductor manufacturing. Semiconductors are primarily packaged as integrated circuits within electronic devices, including consumer electronics, server and enterprise systems, mobile computing devices (including smart phones and tablets), data storage devices, embedded automotive and control systems, LEDs, and a multitude of other electronic products being proliferated worldwide. Integrated circuits are made up of semiconductor material layers integrating millions or billions of transistors and other electronic components, connected through a complex wiring scheme of small copper or aluminum wires, ultimately packaged into thin form factors to be mounted on circuit boards or other substrates. Our core focus is the measurement and control of the structure, composition, and geometry of the devices from the transistor layer through advanced wafer-scale packaging to improve device performance and manufacturing yields. Our end customers manufacture many types of integrated circuits for a multitude of applications, each having unique manufacturing challenges. This includes integrated circuits to enable information processing and management (logic integrated circuits), memory storage (NAND, 3D-NAND, NOR, and DRAM), analog devices (e.g., Wi-Fi and 4G radio integrated circuits, power devices) MEMS sensor devices (accelerometers, pressure sensors, microphones), image sensors, thin film head components for hard disk drives and alternative energy devices such as LEDs, power inverters and solar cells.
Demand for our products continues to be driven by our customers' desire for higher overall chip performance, including improvements in power efficiency, logic processing capability, data storage volume and manufacturing yield. To achieve these goals, our customers have increased their use of more complex materials and processing methods in their manufacturing flow. The majority of our chip customers manufacture devices in production runs defined by the smallest printed feature and the associated circuit manufacturing methods, known as a technology node, which are measured in nanometers ("nm"), or one-billionth of a meter. Current volume production is running at the 28nm-20nm nodes across foundry, logic, and memory, with customers ramping 16nm/14nm node and developing 10 nm and below devices. In some cases our customers are implementing new materials and methods in high volume manufacturing, including materials and device architectures to reduce power consumption including high dielectric constant (or high-k) materials, FinFET or tri-gate transistors, stacked memory devices including 3D-NAND, and additional system on chip solutions. To shrink features, new methods including multiple patterning lithography have been deployed. We believe the use of these new materials and methods has increased demand for our products. Next-generation devices with features smaller than 16nm/14nm are beginning to ramp production, which in turn likely will require new advancements in metrology and inspection capabilities. DRAM memory makers have shifted to 2y node production with development for sub 20nm node devices currently underway (where x, y and z represent successively smaller geometries). Non-volatile memory makers of NAND and NOR devices have ramped 1x and 1y node
3
devices into high volume manufacturing with work extending into 1z node development and production as well as simultaneously developing and ramping stacked or 3D non-volatile memory structures. Current 3D NAND devices are built around a stack of 24-48 layer pairs, and are expected to migrate to 64 layer or more pairs in the next generation of devices. Foundry and logic manufacturers are in volume production of both 28nm and 22nm node devices, ramping volume production of 16nm/14nm node devices and in advanced development of 1y devices. Thin film head components for hard disk drives are also being driven to smaller sizes to support next generation hard disk drives with ever increasing storage capacity requiring continued improvements in read and write head component scaling. We also enable clean energy device manufacturers, such as for LEDs and solar Photo-Voltaics ("PVs"), to achieve higher yields and lower manufacturing costs.
Our Business
We offer a diverse line of process control and inspection products and technologies to address the manufacturing requirements of the semiconductor (and other solid state device) manufacturing industry. Our metrology systems measure and characterize the physical dimensions, material composition, optical and electrical characteristics and other critical parameters of solid state devices, from initial wafer substrate manufacturing through final packaging. For the photolithographic process, thin-film and critical-dimension metrology systems provide control of device dimensions and layer alignment. Advanced packaging techniques require metrology systems to control wafer scale features for through-silicon-via (“TSV”), micro-bump technologies and copper pillar. Additional applications include characterization of local and global topography across the wafer and inspection for both front-end of line (“FEOL”) and advanced packaging. Our materials characterization systems monitor the physical, optical, and electrical characteristics of materials including those on compound semiconductors, discrete devices, LEDs, solar PVs and unpatterned silicon wafers.
We are continually working to strengthen our competitive position by developing new technologies and products in our market segment. We have expanded our product offerings to address growing applications within the semiconductor manufacturing and adjacent industries. In pursuit of our goals, we have:
|
|
· |
Introduced new products, applications, and upgrades in every core product line and primary market served; |
|
|
· |
Diversified our product line and served markets through acquisitions, such as: the 2006 acquisition of Accent Optical Technologies, Inc., a supplier of overlay and thin film metrology and process control systems; the 2008 acquisition of Tevet Process Control Technologies (“Tevet”), an integrated metrology supplier; the 2009 acquisition of the UniFire™ product line from Zygo Corporation, a wholly owned subsidiary of AMETEK, Inc. (“Zygo”); and the 2011 acquisition of Nanda Technologies GmbH, a supplier of high sensitivity, high throughput defect inspection systems; |
|
|
· |
Continued development of new measurement and inspection technologies for advanced fabrication processes; and |
|
|
· |
Researched and developed innovative applications of existing technology to new market opportunities within the solar PV, HB-LED, discrete device, data storage industries, and advanced packaging processes. |
Nanometrics Products
We offer a diverse line of systems to address the broad range of process control requirements of the semiconductor manufacturing industry. In addition, we believe that our engineering expertise and strategic acquisitions enable us to develop and offer advanced process control solutions that, in the future, should address industry advancement and trends.
Automated Systems
Our automated systems primarily consist of fully automated metrology systems that are employed in semiconductor production environments. The Atlas® II, Atlas II+ and Atlas XP/Atlas XP+ represent our line of high-performance metrology systems providing optical critical dimension (“OCD”®), thin film metrology and wafer stress for transistor and interconnect metrology applications. The OCD technology is supported by our NanoCD® suite of solutions including our NanoDiffract® software and NanoGen™ scalable computing engine that enables visualization, modeling, and analysis of complex structures. The UniFire™ system measures multiple parameters at any given process step in the advanced packaging process flow for critical dimension, overlay, and topography applications and has recently added inspection capabilities for both FEOL patterned wafer and advanced packaging related applications.
Integrated Systems
Our integrated metrology (“IM”) systems are installed directly onto wafer processing equipment to provide near real-time measurements for improved process control and maximum throughput. Our IM systems are sold directly to end customers. The IMPULSE+ and IMPULSE® represent our latest metrology platform for OCD, and thin film metrology, and have been successfully qualified on numerous independent Wafer Fabrication Equipment Suppliers’ platforms. Our NanoCD suite of
4
solutions is sold in conjunction with our IMPULSE® systems. Our Trajectory® system provides in-line measurement of layers in thin film thickness and composition in semiconductor applications and is qualified in production with major device makers.
Materials Characterization
Our materials characterization products include systems that are used to monitor the physical, optical, electrical and material characteristics of discrete electronic industry, opto-electronic, HB-LED, solar PV, compound semiconductor, strained silicon and silicon-on-insulator (“SOI”) devices, including composition, crystal structure, layer thickness, dopant concentration, contamination and electron mobility.
Our Imperia™ is a photoluminescence (“PL”) full wafer imaging and mapping system designed for high-volume compound semiconductor metrology applications including power control and photonics applications adding significant inspection and substrate metrology capability to the established PL fleet. The RPMBlue™ is our latest PL mapping system designed specifically for the HB-LED market, and is complemented by the RPMBlue-FS, enabling a breadth of research and development configurability. We sell Fourier-Transform Infrared (“FTIR”) automated and manual systems in the QS2200/3300 and QS1200 respectively. The FTIR systems are spectrometers designed for non-destructive wafer analysis for various applications. The NanoSpec® line, including the NanoSpec II, supports thin film measurement across all applications in both low volume production and research applications.
Our process control systems can be categorized as follows:
|
System |
|
Market |
|
Applications |
|
Automated Systems |
|
|
|
|
|
Atlas II/Atlas II+/Atlas XP/Atlas XP+ |
|
Semiconductor |
|
Film Thickness, Film Stress, CD |
|
UniFire |
|
Semiconductor |
|
Film Thickness, Overlay, CD, and Advanced Packaging Applications |
|
Integrated Systems |
|
|
|
|
|
IMPULSE/IMPULSE+ |
|
Semiconductor |
|
Film Thickness, CD |
|
Trajectory |
|
Semiconductor, Solar PV |
|
Film Thickness, Composition |
|
OCD Analysis |
|
|
|
|
|
NanoDiffract |
|
Semiconductor |
|
OCD |
|
NanoGen |
|
Semiconductor |
|
OCD |
|
Materials Characterization Systems |
|
|
|
|
|
ECVPro |
|
Compound Semiconductor, Solar PV, HB-LED |
|
Electrical Properties |
|
HL5500 |
|
Compound Semiconductor, Solar PV, HB-LED |
|
Electrical Properties |
|
QS1200 |
|
Substrate Semiconductor, Solar PV |
|
Substrate Properties, Film Composition and Thickness |
|
QS2200/3300 |
|
Substrate Semiconductor |
|
Substrate Properties, Film Composition |
|
NanoSpec® II |
|
Semiconductor |
|
Film Thickness (Tabletop) |
|
RPMBlueTM |
|
HB-LED |
|
Epitaxial Layer Properties |
|
Stratus |
|
Semiconductor |
|
Substrate Properties, Film Composition and Thickness (Tabletop) |
|
Imperia |
|
Compound Semiconductor, Solar PV, HB-LED |
|
Epitaxial Layer Properties, Defectivity, Bow/Wrap |
See Note 16 of our consolidated financial statements in Item 8, "Financial Statements and Supplementary Data," for revenues by product type, which information is incorporated by reference here.
Customers
We sell our metrology and inspection systems worldwide to semiconductor manufacturers, and producers of HB-LEDs, data storage devices, silicon wafers, solar PVs, and photomasks. The majority of our systems are sold to customers located in Asia and the United States.
5
The following customers accounted for 10% or more of our total net revenues:
|
|
|
2015 |
|
|
2014 |
|
|
2013 |
|
|||
|
Taiwan Semiconductor Manufacturing Company Limited |
|
|
19.4% |
|
|
*** |
|
|
*** |
|
||
|
Micron |
|
|
15.8% |
|
|
|
10.4% |
|
|
*** |
|
|
|
Samsung Electronics Co. Ltd. |
|
|
13.2% |
|
|
|
26.9% |
|
|
|
14.4% |
|
|
SK Hynix |
|
|
10.7% |
|
|
|
12.2% |
|
|
|
18.4% |
|
|
Toshiba Corporation |
|
|
10.2% |
|
|
*** |
|
|
*** |
|
||
|
Intel Corporation |
|
*** |
|
|
|
12.6% |
|
|
|
30.0% |
|
|
|
*** |
The customer accounted for less than 10% of total net revenues during the period. |
Sales and Marketing
We believe that the capability for direct sales and support is beneficial for developing and maintaining close customer relationships and for rapidly responding to changing customer requirements. We provide local direct sales, service and application support through our worldwide offices located in the United States, South Korea, Japan, Taiwan, China and Singapore, and work with selected dealers and sales representatives in Asia and in the United States and other countries. Our employees include our technical applications team, which comprises technically experienced sales engineers who are knowledgeable in the use of metrology systems generally and the unique features and advantages of our specific products. Supported by our technical applications team, our sales and support teams work closely with our customers to offer cost-effective solutions to complex measurement and process problems.
Net revenues from customers located in the United States and in foreign countries, as a percentage of total net revenues were as follows:
|
|
|
2015 |
|
|
2014 |
|
|
2013 |
|
|||
|
United States |
|
|
20% |
|
|
|
22% |
|
|
|
33% |
|
|
South Korea |
|
|
16% |
|
|
|
25% |
|
|
|
24% |
|
|
Japan |
|
|
17% |
|
|
|
9% |
|
|
|
8% |
|
|
Taiwan |
|
|
25% |
|
|
|
12% |
|
|
|
7% |
|
|
China |
|
|
9% |
|
|
|
17% |
|
|
|
9% |
|
|
All other countries |
|
|
13% |
|
|
|
15% |
|
|
|
19% |
|
See Note 16 of our consolidated financial statements in Item 8, "Financial Statements and Supplementary Data," for segment and geographical financial information, including revenues and long-lived assets by geographic region, which information is incorporated by reference here.
Customer Service and Support
We believe that customer service and technical support for our systems are important factors that distinguish us from our competitors and are essential to building and maintaining close, long-term relationships with our customers. We provide a standard one-year warranty on parts and labor for most of our products. We provide system support to our customers through factory technical support and globally deployed field service personnel. The factory technical support operations provide customers with telephonic technical support access, direct training programs, operating manuals and other technical support information to enable effective use of our metrology and measurement instruments and systems. We have field service operations based in various locations throughout the United States, South Korea, Taiwan, China, Japan, Singapore, Israel, France, Italy, and Germany.
Service revenues, including sales of replacement parts, represented 22%, 20%, and 26% of total net revenues in 2015, 2014 and 2013, respectively.
Backlog
As of December 26, 2015 and December 27, 2014, our backlog was $32.1 million and $41.5 million, respectively. Backlog includes orders, both shipped and not yet recognized in revenue, and not shipped, for products, services and upgrades where written customer requests have been received and we expect to ship and/or recognize revenue within 12 months. Orders are subject to cancellation or delay by the customer subject to possible penalties. However, historically, order cancellations have not been significant. Because orders presently in backlog could be cancelled or rescheduled and some orders can be received and shipped
6
within the same quarter, we do not believe that current backlog is an accurate indication of our future revenues or financial performance.
Competition
We offer different products for various semiconductor manufacturing process steps, and several of our products extend across the same process flow. However, for process control of each of these process steps, we have multiple competitors. In every market in which we participate, the global semiconductor equipment industry is intensely competitive, and driven by rapid technological adoption cycles. Our ability to effectively compete depends upon our ability to continually improve our products, applications and services, and our ability to develop new products, applications and services that meet constantly evolving customer requirements.
We believe that our competitive position in each of our markets is based on the ability of our products and services to address customer requirements related to numerous competitive factors. Competitive selections are based on many factors involving technological innovation, productivity, total cost of ownership of the system, including impact on end of line yield, price, product performance and throughput capability, quality, reliability and customer support.
In automated systems for the semiconductor industry, our principal competitors are KLA-Tencor Corporation (“KLA-Tencor”) and Nova Measuring Instruments Ltd. ("Nova") for thin film and critical dimension metrology, and CAMTek and Rudolf Technologies and other smaller suppliers for advanced packaging. Our primary competitor in integrated systems is Nova. The HB-LED, discrete device, bare silicon and solar PV markets, which are addressed primarily by our material characterization systems, are served by numerous competitors and no single competitor or group of competitors has established a majority position.
Manufacturing
Our manufacturing operations are in Milpitas, California and at various contract manufacturers around the world. It is our strategy to outsource all assemblies that do not contain elements that we believe lead to a direct competitive advantage. The majority of our automated and integrated products are currently manufactured at our Milpitas facility. We also use contract manufacturers in other locations in the United States and in China, Israel and Japan. We currently do not expect our manufacturing operations to require additional major investments in capital equipment.
We produce key parts and components and make reasonable efforts to ensure that any externally purchased parts or raw materials are available from multiple suppliers, but this is not always possible. Certain components, sub-assemblies and services necessary for the manufacture of our systems are obtained either from a sole supplier or limited group of suppliers. We also have an established long-term supply agreement for supply of our spectroscopic ellipsometers and interferometers for use in our products. Although we seek to reduce our dependence on sole and limited source suppliers, partial or complete loss of these sources could disrupt production, delay scheduled deliveries to customers and have a material adverse effect on our revenues and results of operations.
Research and Development
We continue to invest in research and development (“R&D”) to provide our customers with products that add value to their manufacturing processes and that provide a better and differentiated solution than our competitors, so that our products stay in the forefront of current and future market demands. Whether it is for an advancement of current technology, yield and manufacturing improvement, enabling new end device technology, or the development of a new application in our core or emerging markets, we are committed to product excellence and longevity.
In our automated markets, our R&D efforts resulted in the successful product launch of the Atlas II+ product in the marketplace, our flagship product for OCD. The Atlas II+ product provides enhanced OCD capability with a significantly lower cost of ownership model. Additionally, the UniFire system development continued with new system configurations and applications development targeted at advanced packaging applications, including further extensions for advanced packaging applications. In our integrated markets, the IMPULSE system has been further developed for inline lithography track configuration to extend our tool of record position for lithography OCD. The IMPULSE+ system, which incorporates performance and productivity enhancements to the IMPULSE was introduced in 2015.
7
Patents and Intellectual Property
Our success depends in large part on the technical innovation of our products and protecting such innovations through a variety of methods. We actively pursue a program of filing patent applications to seek protection of technologically sensitive features of our metrology and inspection systems. As of December 26, 2015, we had 214 patents, including foreign patents, with expiration dates ranging from 2016 until 2035. We believe that our success will depend to a great degree upon innovation, technological expertise and our ability to adapt our products to new technology. While we attempt to establish our intellectual property rights through patents and trademarks and protect intellectual property rights through non-disclosure agreements, we may not be able to fully protect our technology, and competitors may be able to develop similar technology independently. Others may obtain patents and assert them against us. In addition, the laws of certain foreign countries may not protect our intellectual property to the same extent as do the laws of the United States. From time to time we receive communications from third parties asserting that our metrology systems may contain design features that the third parties claim may infringe upon their proprietary rights.
Employees
At December 26, 2015, we employed 518 persons worldwide with sales, applications and service support in key geographic areas aligned with our customer locations. None of our employees are represented by a union and we have never experienced a work stoppage as a result of union actions. Many of our employees have specialized skills that are of value to us. Our future success will depend in large part upon our ability to attract and retain highly skilled scientific, technical and managerial personnel, who are in great demand in our industry. We consider our employee relations to be good.
Environmental Matters
Our operations are subject to various federal, state and local environmental protection regulations governing the use, storage, handling and disposal of hazardous materials, chemicals, and certain waste products. We believe that compliance with federal, state and local environmental protection regulations will not have a material adverse effect on our capital expenditures, earnings and competitive and financial position.
In the event that we fail to comply with such laws and regulations, we could be liable for damages, penalties and fines. We further discuss the impact of environmental regulation under “Risk Factors- We are subject to various environmental laws and regulations that could impose substantial costs upon us and may harm our business, operating results and financial condition.” in Item 1A.
Executive Officers of the Registrant
The names of our executive officers and their ages, titles and biographies as of February 12, 2016, are set forth below:
|
Name |
|
Age |
|
|
Position |
|
|
Timothy J. Stultz, Ph.D. |
|
|
68 |
|
|
President, Chief Executive Officer and Director |
|
Jeffrey Andreson |
|
|
54 |
|
|
Chief Financial Officer |
|
S. Mark Borowicz, Ph.D. |
|
|
43 |
|
|
Sr. Vice President, Product & Field Operations |
|
Kevin Heidrich |
|
|
45 |
|
|
Sr. Vice President, Applications & Strategy |
|
Janet Taylor |
|
|
58 |
|
|
General Counsel |
Dr. Timothy J. Stultz has served as President, Chief Executive Officer and director of Nanometrics Incorporated since August 2007. Dr. Stultz has more than 30 years of executive management experience. Prior to joining Nanometrics, Dr. Stultz was President and Chief Executive Officer of Imago Scientific Instruments Corporation, a supplier of proprietary 3-D atom probe microscopes to the research, materials and microelectronics industries; President and Chief Executive Officer for ThauMDx, a developer of diagnostic systems for the healthcare industry; and Vice President and General Manager of Veeco Instruments' Metrology and Instrumentation Business. Dr. Stultz received his B.S., M.S. and Ph.D. in Materials Science and Engineering from Stanford University.
Jeffrey Andreson joined Nanometrics as Chief Financial Officer in September 2014. Prior to Nanometrics, Mr. Andreson served at Intevac Corporation from August 2007 to September 2014 most recently as Executive Vice President, Finance and Administration, Chief Financial Officer, Treasurer and Secretary from August 2007 and in this role was responsible for finance, information services and legal. From June to August 2007, Mr. Andreson served as Executive Vice President, Finance at Intevac. Prior to joining Intevac, Mr. Andreson served 12 years with Applied Materials in various controllership positions within the company most recently as Managing Director and Controller of the $2 billion Applied Materials’ Global Services product group. Mr. Andreson joined Applied
8
Materials in 1995 and held a number of senior financial positions, including: Managing Director, Global Financial Planning and Analysis; Controller, Metron Subsidiary; Controller, North American Sales and Service; and Controller, Volume Manufacturing. From 1989 through 1995, Mr. Andreson held various roles at Measurex Corporation. Mr. Andreson holds an MBA from Santa Clara University and a B.S. degree in finance from San Jose State University.
Dr. S. Mark Borowicz joined Nanometrics as Senior Vice President, Product & Field Operations Group in March 2013. Prior to Nanometrics, Dr. Borowicz held senior management positions in business development and product marketing at KLA-Tencor, Inc. from 2000 to 2013, where he was responsible for sales and product management for inspection and metrology businesses. Dr. Borowicz has seven patents in the field of electron beam technologies. Dr. Borowicz holds a B .S. in Mechanical Engineering from West Virginia University and a Ph.D. in Materials Engineering from Auburn University.
Kevin Heidrich, Sr. Vice President, Applications and Strategy, joined Nanometrics in 2006. Kevin has participated in many functions, expanding his scope in the past eight years to include new product development, corporate marketing, product marketing, business development and is now responsible for both corporate strategy and applications as Nanometrics expands its overall solution space within process control metrology. Prior to Nanometrics, Kevin spent a decade at Intel Corporation in a variety of roles including process research and development at Intel’s Technology Development facility. Mr. Heidrich received B.S. and M.S. degrees from the Colorado School of Mines in Chemical Engineering.
Janet Taylor joined Nanometrics as General Counsel in July 2015. Ms. Taylor served as Senior Vice President, General Counsel and Company Secretary of STATS ChipPAC Ltd., from June 2005 to June 2015, where she was responsible for all legal matters, including corporate governance, intellectual property, litigation and securities compliance. Prior to joining STATS ChipPAC Ltd, Ms. Taylor was engaged in transactional practices at international law firms in New York, Singapore and London. Ms. Taylor was admitted to the Bar in New York in 1990 and in Singapore in 2010. Ms. Taylor holds a J.D. from the Harvard Law School and a B.A. in History from the University of Texas at Austin.
9
In addition to the other information contained in this Annual Report on Form 10-K, we have identified the following risks and uncertainties that may have a material adverse effect on our business, financial condition or results of operations. Investors should carefully consider the risks described below before making an investment decision. The risks described below are not the only ones we face. Additional risks not currently known to us or that we currently believe are immaterial may also impair our business operations. Our business could be harmed by any of these risks. The trading price of our common stock could decline due to any of these risks and investors may lose all or part of their investment. This section should be read in conjunction with the Consolidated Financial Statements and Notes thereto, and Management’s Discussion and Analysis of Financial Condition and Results of Operations contained in this Annual Report on Form 10-K.
The Global economic conditions and the cyclical nature of the semiconductor industry can reduce demand for our products which in turn may cause us to operate unprofitably and may cause reductions in available cash, and may negatively impact our financial performance.
Global economic conditions, the gradual recovery of the global economy and the cyclical nature of the semiconductor industry have impacted and could impact future customer demand for our products and our financial performance. The degree of this impact will depend on a number of factors, including the timing and extent of recovery of the U.S. and global economy from the recession. Demand for our products is largely dependent on our customers' capital spending on semiconductor equipment, which depends, in large part, on consumer spending, required manufacturing capacity, and customer access to capital. Economic uncertainty, unemployment, higher interest rates, higher tax rates, fluctuations in foreign currency exchange rates, and other economic factors may lead to a decrease in consumer spending and may cause certain customers to cancel existing orders or delay placing orders. If we are unable to timely and appropriately adapt to changes resulting from difficult economic conditions, it may cause volatility in our operating results, business, and financial condition, and results of operations may be adversely affected.
In addition, demand for our products is highly inelastic which means we have little ability to control product revenues created by customer demand for more capacity. The market for our products is characterized by constant and rapid technological change, price erosion, product obsolescence, evolving standards, short product life cycles and significant volatility in supply and demand. Due to the inelastic nature of demand in the semiconductor industry, we may need to take actions to reduce costs in the future, which could reduce our ability to significantly invest in research and development at levels we believe are necessary. If we are unable to effectively align our cost structure with prevailing market conditions, our business, financial condition and results of operations may be materially and adversely affected.
We may also experience supplier or customer issues as a result of adverse macroeconomic conditions. If our customers have difficulties in obtaining capital or financing, this could result in lower sales. Customers with liquidity issues could also result in an increase in bad debt expense. These conditions could also affect our key suppliers, which could affect their ability to supply parts and result in delays of our customer shipments.
Our largest customers account for a substantial portion of our net revenues, and our net revenues would materially decline if one or more of these customers were to purchase significantly fewer of our systems.
Historically, a significant portion of our net revenues in each quarter and each year has been derived from sales to relatively few customers, and we expect this trend to continue. In fiscal year 2015, five customers represented 19%, 16%, 13%, 11% and 10%, respectively, or collectively 69%, of our total net revenues. There are only a limited number of large companies operating in the semiconductor manufacturing industry and our market is characterized by continued consolidation in the customer base. Accordingly, we expect that we will continue to depend on a small number of large customers for a significant portion of our net revenues for the foreseeable future. If our current relationships with our large customers are impaired, or if we are unable to develop similar collaborative relationships with important customers in the future, our net revenues could decline significantly. In addition, because there are a limited number of customers, customers may seek concessions related to price, terms and conditions and intellectual property. Any of these changes could negatively impact our financial performance and results of operations.
10
We rely on a limited number of outside suppliers and subcontractors to supply certain components and subassemblies, and on single or a limited group of outside suppliers for certain materials for our products, which could result in a potential inability to obtain an adequate supply of required components due to the suppliers' failure or inability to provide such components in a timely manner, or at all, and reduced control over pricing and timely delivery of components and materials, any of which could adversely affect our results of operations.
Our manufacturing activities consist of integrating, assembling and testing components and subassemblies. We rely on a limited number of outside suppliers and subcontractors to manufacture certain components and subassemblies. We order one of the most critical components of our technology, the spectroscopic ellipsometer component incorporated into our advanced measurement systems, from external suppliers.
We procure some of our other critical systems' components, subassemblies and services from single suppliers or a limited group of outside suppliers in order to ensure overall quality and timeliness of delivery. Many of these components and subassemblies have significant production lead times. To date, we have been able to obtain adequate supplies of components and subassemblies for our systems in a timely manner. However, disruption or termination of certain of these sources could have a significant adverse impact on our ability to manufacture our systems. In addition, our failure to timely use components in our manufacturing processes due to delays or cancellation of orders may lead to write-downs of inventory. A disruption in supply or inventory window would, in turn, have a material adverse effect on our business, financial condition and results of operations. Our reliance on a sole supplier or a limited group of suppliers and our reliance on subcontractors involve several risks, including:
|
|
· |
a potential inability to obtain an adequate supply of required components due to the suppliers' failure or inability to provide such components in a timely manner, or at all; and |
|
|
· |
reduced control over pricing and timely delivery of components. |
Although the timeliness, yield and quality of deliveries to date from our subcontractors have been acceptable, manufacture of certain of these components and subassemblies is an extremely complex process, and long lead times are required. Any inability to obtain adequate deliveries or any other circumstance that would require us to seek alternative sources of supply or to manufacture such components internally could delay our ability to ship our products, which could damage relationships with current and prospective customers and have a material adverse effect on our business, financial condition and results of operations.
Some of our current and potential competitors have significantly greater resources than we do, and increased competition could impair sales of our products.
We operate in the highly competitive semiconductor industry and face competition from a number of companies, many of which have greater financial, engineering, manufacturing, research and development, marketing and customer support resources than we do. As a result, our competitors may be able to respond more quickly to new or emerging technologies or market developments by devoting greater resources to the development, promotion and sale of products, which could impair sales of our products. Moreover, there has been merger and acquisition activity among our competitors and potential competitors. These transactions by our competitors and potential competitors may provide them with a competitive advantage over us by enabling them to rapidly expand their product offerings and service capabilities to meet a broader range of customer needs. Many of our customers and potential customers in the semiconductor industry are large companies that require global support and service for their metrology systems. Some of our larger or more geographically diverse competitors might be better equipped to provide this global support and service.
Because of the high cost of switching equipment vendors in our markets, it may be difficult for us to attract customers from our competitors even if our metrology systems are superior to theirs.
We believe that once a semiconductor customer has selected one vendor's metrology system, the customer generally relies upon that system and, to the extent possible, subsequent generations of the same vendor's system, for the life of the application. Once a vendor's metrology system has been installed, a customer must often make substantial technical modifications and may experience downtime to switch to another vendor's metrology system. Accordingly, unless our systems offer performance or cost advantages that outweigh a customer's expense of switching to our systems; it will be difficult for us to achieve significant sales from that customer once it has selected another vendor's system for an application.
Our integrated metrology systems are integrated onto systems sold independently by Wafer Fabrication Equipment Suppliers, and a decrease in sales by these suppliers, or the development of competing systems by these suppliers, could harm our business.
We believe that sales of integrated metrology systems will continue to be an important source of our net revenues. Sales of our integrated metrology systems depend upon the ability of a small number of Wafer Fabrication Equipment Suppliers to sell
11
semiconductor manufacturing equipment products that are compatible with our metrology systems as components. If these suppliers, such as Applied Materials, Inc., Lam Research Corporation and Tokyo Electron, are unable to sell such products, if they choose to focus their attention on products that do not integrate our systems, or if they choose to develop competing systems, our business could suffer.
We are subject to order and shipment uncertainties. Our profitability will decline if we fail to accurately forecast customer demand when managing inventory.
We generally sell our products on the basis of purchase orders rather than long-term purchase commitments from our customers. Our customers can typically cancel purchase orders or defer product shipments for some period without incurring liabilities to us. We typically plan production and inventory levels based on internal forecasts of customer demand, which can be highly unpredictable and can fluctuate substantially, which could lead to excess inventory write-downs and resulting negative impacts on gross margin and net income. We have limited visibility into our customers' inventories, future customer demand and the product mix that our customers will require, which could adversely affect our production forecasts and operating margins. In addition, innovation in our industry could render significant portions of our inventory obsolete. If we overestimate our customers' requirements, we may have excess inventory, which could lead to obsolete inventory and unexpected costs. Conversely, if we underestimate our customers' requirements, we may have inadequate inventory, which could lead to foregone revenue opportunities, loss of potential market share and damage to customer relationships as product deliveries may not be made on a timely basis, disrupting our customers' production schedules. In response to anticipated long lead times to obtain inventory and materials from outside suppliers and foundries, we periodically order materials in advance of customer demand. This advance ordering has in the past and may in the future result in excess inventory levels or unanticipated inventory write-downs if expected orders fail to materialize, or other factors make our products less saleable. In addition, any significant future cancellation or deferral of product orders could adversely affect our revenue and margins, increase inventory write-downs due to obsolete inventory, and adversely affect our operating results and stock price.
If we do not manage our supply chain effectively, our operating results may be adversely affected.
We need to continually evaluate our global supply chains and assess opportunities to reduce costs. We must also enhance quality, speed and flexibility to meet changing demand for our products and product mix and uncertain market conditions. Our success also depends in part on refining our cost structure and supply chains so that we have flexibility and are able to protect and improve profitability. To improve our margins on a product, we will need to establish high volume supply agreements with our vendors. We cannot be certain that we will be able to timely negotiate vendor supply agreements on improved terms and conditions, or at all. Failure to achieve the desired level of cost reductions could adversely affect our financial results. Despite our efforts to control costs and increase efficiency in our facilities, changes in demand could still cause us to realize lower operating margins and profitability.
If we choose to acquire new and complementary businesses, or products or technologies instead of developing them ourselves, we may be unable to complete these acquisitions or may not be able to successfully integrate an acquired business in a cost-effective and non-disruptive manner.
Our success depends on our ability to continually enhance and broaden our product offerings in response to changing technologies, customer demands and competitive pressures. To achieve this, from time to time we have acquired complementary businesses, products, or technologies instead of developing them ourselves and may choose to do so in the future. For example, in November 2011, we acquired Nanda Technologies GmbH, a supplier of high-throughput, high-sensitivity defect inspection technology for semiconductor manufacturing. In June 2009, we entered into a strategic partnership with Zygo under an exclusive OEM supply agreement to provide interferometer sensors to us for incorporation into our UniFire line of products as well as our family of automated metrology systems. However, we may not be able to identify suitable transactions in the future, or if we do identify such transactions, we may not be able to complete them on commercially acceptable terms, or at all. We also face intense competition for acquisitions from other acquirers in our industry. These competing acquirers may have significantly greater financial and other resources than us, which may prevent us from successfully pursuing a transaction.
Potential risks associated with acquisitions could include, among other things:
|
|
· |
our inability to realize the benefits or cost savings that we expect to realize as a result of the acquisition; |
|
|
· |
diversion of management's attention; |
|
|
· |
our inability to successfully integrate our businesses with the business of the acquired company; |
|
|
· |
motivating, recruiting and retaining executives and key employees; conforming standards, controls, procedures and policies, business cultures and compensation structures among our company and the acquired company; |
|
|
· |
consolidating and streamlining sales, marketing and corporate operations; |
12
|
|
· |
potential exposure to unknown liabilities of acquired companies; |
|
|
· |
loss of key employees and customers of the acquired business; and |
|
|
· |
managing tax costs or inefficiencies associated with integrating our operations following completion of the acquisitions. |
If an acquisition is not successfully completed or integrated into our existing operations, our business, financial condition and results of operations could be adversely impacted.
In addition, to finance any acquisitions we may be required to raise additional funds through public or private equity or debt financings, however:
|
|
· |
to obtain such financing we may be forced to obtain financing on terms that are not favorable to us and, in the case of equity or convertible debt financing, the financing may result in dilution to our stockholders; or |
|
|
· |
such financing may not be available to us at all, which could prevent us from entering into or completing the acquisition. |
Our success depends on the performance of key personnel, including our senior management and on our ability to identify, hire and retain key management personnel.
We believe our continued ability to recruit, hire, retain and motivate highly-skilled engineering, operations, sales, administrative and managerial personnel is key to our future success. Competition for these employees is intense, particularly with respect to attracting and retaining qualified technical and senior management personnel. We have experienced turnover in our senior management team. Our business may be harmed if we are unable to recruit, retain and effectively integrate our senior management into our business operations.
We do not have employment agreements with key members of our technical staff and our senior management team, and these individuals or other key employees may leave us. We do not have key person life insurance on any of our executives. In addition, to support our future growth, we will need to attract and retain additional qualified employees. If we fail to attract, motivate and retain qualified senior management personnel, our business could be harmed and our ability to implement our strategy could be compromised.
If we deliver systems with defects, our credibility will be harmed, revenue from, and market acceptance of, our systems will decrease and we could expend significant capital and resources as a result of such defects.
Our products are complex and frequently operate in high-performance, challenging environments. Notwithstanding our internal quality specifications, our systems have sometimes contained errors, defects and bugs when introduced. If we deliver systems with errors, defects or bugs, our credibility and the market acceptance and sales of our systems would be harmed. Further, if our systems contain errors, defects or bugs, we may be required to expend significant capital and resources to alleviate such problems and incur significant costs for product recalls and inventory write-offs. Defects could also lead to product liability lawsuits against us or against our customers. We have agreed to indemnify our customers in some circumstances against liability arising from defects in our systems. In the event of a successful product liability claim, we could be obligated to pay damages significantly in excess of our product liability insurance limits.
If we experience significant delays in shipping our products to our customers, our business and reputation may suffer.
Our products are complex and require technical expertise to design and manufacture properly. Various problems occasionally arise during the manufacturing process that may cause delays and/or impair product quality. Any significant delays stemming from the failure of our products to meet or exceed our internal quality specifications, or for any other reasons, would delay our shipments. Shipment delays could harm our business and reputation in the industry.
Net average selling prices of our products may decrease over time, which could have a material adverse effect on our revenues and operating results.
It is common in our industry for the average selling price of a given product to decrease over time as production volumes increase, competing products are developed or new technologies featuring higher performance or lower cost emerge. To combat the negative effects that erosion of average selling prices have had in the past and may in the future have on our net revenues, we attempt to actively manage the prices of our existing products and regularly introduce new process technologies and products in the market that exhibit higher performance, that are in demand, or that lower manufacturing cost. Failure to maintain our current prices or to successfully execute on our new product development strategy will cause our net revenues and gross margin to decline, which adversely affect our operating results and stock price.
13
Third party infringement claims could be costly to defend, and successful infringement claims by third parties could result in substantial damages, lost product sales and the loss of important intellectual property rights by us.
The semiconductor industry is generally subject to frequent litigation regarding patents and other intellectual property rights. Our commercial success depends, in part, on our ability to avoid infringing or misappropriating patents or other proprietary rights owned by third parties. From time to time we may receive communications from third parties asserting that our metrology systems may contain design features which are claimed to infringe on their proprietary rights. Our new or current products may infringe valid intellectual property rights, but even if our products do not infringe, we may be required to expend significant sums of money to defend against infringement claims, or to actively protect our intellectual property rights through litigation. In the event that a claim is made and there is an adverse result of any intellectual property rights litigation, we could be required to pay substantial damages for infringement, expend significant resources to develop non-infringing technology, incur material liability for royalty payments or fees to obtain licenses to the technology covered by the litigation, or be subjected to an injunction, which could prevent us from selling our products and materially and adversely affect our net revenues and results of operations. We cannot be sure that we will be successful in any such non-infringing development or that any such license would be available on commercially reasonable terms, if at all. Any claims relating to the infringement of third-party proprietary rights, even if not meritorious, could result in costly litigation, lost sales or damaged customer relationships, and diversion of management's attention and resources.
Our intellectual property may be infringed by third parties despite our efforts to protect it, which could threaten our future success and competitive position and harm our operating results.
Our future success and competitive position depend in part upon our ability to obtain and maintain proprietary technology for our principal product families, and we rely, in part, on patent, trade secret and trademark law to protect that technology. If we fail to adequately protect our intellectual property, it will be easier for our competitors to sell competing products. We own or may license patents relating to our systems, and have filed applications for additional patents. Any of our pending patent applications may be rejected, and we may not in the future be able to develop additional proprietary technology that is patentable. In addition, the patents we own, have been issued or licensed, may not provide us with competitive advantages and may be challenged by third parties. Third parties may also design around these patents.
In addition to patent protection, we rely upon trade secret protection for our confidential and proprietary information and technology. We routinely enter into confidentiality agreements with our employees. However, in the event that these agreements may be breached, we may not have adequate remedies. Our confidential and proprietary information and technology might also be independently developed by or become otherwise known to third parties.
We may be required to initiate litigation to enforce patents issued to or licensed by us, or to determine the scope or validity of a third party's patent or to enforce trade secret, confidentiality or other proprietary rights. Any such litigation, regardless of outcome, could be expensive and time consuming, and could subject us to significant liabilities or require us to re-engineer our product or obtain expensive licenses from third parties, any of which would adversely affect our business and operating results.
Despite our efforts to protect our proprietary rights, unauthorized parties may attempt to copy or otherwise obtain or use our products or technology. Our ability to enforce our patents and other intellectual property is limited by our financial resources and is subject to general litigation risks. If we seek to enforce our rights, we may be subject to claims that the intellectual property rights are invalid, are otherwise not enforceable or are licensed to the party against whom we assert a claim. In addition, our assertion of intellectual property rights could result in the other party seeking to assert alleged intellectual property rights of its own against us, which is a frequent occurrence in such litigation.
Our efforts to protect our intellectual property may be less effective in some foreign countries where intellectual property rights are not as well protected as in the United States.
In 2015, 2014, and 2013, 80%, 78% and 67%, respectively, of our total net revenues were derived from sales to customers in foreign countries, including certain countries in Asia, such as Japan, South Korea, China and Taiwan. The laws of some foreign countries do not protect our proprietary rights to as great an extent as do the laws of the United States, and many U.S. companies have encountered substantial problems in protecting their proprietary rights against infringement in these countries. If we fail to adequately protect our intellectual property in these countries, it would be easier for our competitors to sell competing products and our business would suffer.
14
Variations in the amount of time it takes for us to sell our systems may cause volatility in our operating results, which could cause our stock price to decline.
Variations in the length of our sales and product acceptance cycles could cause our revenues to fluctuate widely from period to period. Our customers generally take long periods of time to evaluate our metrology systems. We expend significant resources educating and providing information to our prospective customers regarding the uses and benefits of our systems. The length of time that it takes for us to complete a sale depends upon many factors, including:
|
|
· |
the efforts of our sales force and our independent sales representatives; |
|
|
· |
the complexity of the customer’s metrology needs; |
|
|
· |
the internal technical capabilities and sophistication of the customer; |
|
|
· |
the customer’s budgetary constraints; and |
|
|
· |
the quality and sophistication of the customer’s current processing equipment. |
Because of the number of factors influencing the sales process, the period between our initial contact with a customer and the time at which we recognize revenue from that customer, if at all, varies widely. Our sales cycles, including the time it takes for us to build a product to customer specifications after receiving an order, typically range from three to nine months. Occasionally our sales cycles can be much longer, particularly with customers in Asia who may require longer evaluation and acceptance periods. During the sales cycles, we commit substantial resources to our sales efforts in advance of receiving any revenue, and we may never receive any revenue from a customer despite our sales efforts.
If we do complete a sale, customers often purchase only one of our systems and then evaluate its performance for a lengthy period of time before purchasing additional systems. The purchases are generally made through purchase orders rather than through long-term contracts. The number of additional products that a customer purchases, if any, depends on many factors, including a customer’s capacity requirements, and/or shifting to more and advanced manufacturing processes that require more or different products to control. If they change their rate of capacity or have technological change, we cannot compensate for this fluctuation in demand by adjusting the price of our products. The period between a customer’s initial purchase and any subsequent purchases and acceptance is unpredictable and can vary from three months to a year or longer. Variations in the length of this period could cause fluctuations in our operating results, which could adversely affect our stock price.
Relatively small fluctuations in our system sales volume may cause our operating results to vary significantly each quarter.
During any quarter, a significant portion of our revenue is derived from the sale of a relatively small number of systems. Our automated metrology systems can be priced up to, or above, $2,100,000 per system, and our integrated metrology systems can be priced up to, or above, $500,000 per system. Accordingly, a small change in the number or mix of systems that we sell could cause significant changes in our operating results.
Lack of market acceptance for our products may affect our ability to generate revenue and may harm our business.
We have invested substantial time and resources into the development of new products, services and technologies. However, we cannot accurately predict the future level of acceptance of our products and services by our customers. As a result, we may not be able to generate anticipated revenue from sales of these products and services, or future new products, services and improvements.
We depend on new products and processes for our success. Consequently, we are subject to risks associated with rapid technological change.
Rapid technological changes in semiconductor manufacturing processes subject us to increased pressure to develop technological advances enabling such processes. We believe that our future success depends in part upon our ability to develop and offer new products with improved capabilities and to continue to enhance our existing products. We cannot make assurances if or when the products and solutions where we have focused our research and development expenditures will become commercially successful. If new products have reliability or quality problems, our performance could be impacted by reduced orders, higher manufacturing costs, and delays in acceptance or payment for new products, and additional service and warranty expenses. We might not be able to develop and manufacture new products successfully, or new products that we introduce may fail in the marketplace. Our failure to complete commercialization of these new products in a timely manner could result in unanticipated costs and inventory obsolescence, which would adversely affect our financial results. Any significant delay in releasing new systems could adversely affect our reputation, give a competitor a first-to-market advantage or allow a competitor to achieve greater market share.
15
To develop new products and processes, we expect to continue to make significant investments in research and development and to pursue joint development relationships with customers, suppliers or other members of the industry. We must manage product transitions and joint development relationships successfully, as introduction of new products could adversely affect our sale of existing products.
We are subject to risks associated with our competitors’ strategic relationships and their introduction of new products, and we may lack the financial resources or technological capabilities of certain of our competitors needed to capture increased market share.
We expect to face significant competition from multiple current and future competitors. We believe that other companies are developing systems and products that are competitive to our products and are planning to introduce new products, which may affect our ability to sell our existing or future products. We face a greater risk if our competitors enter into strategic relationships with leading semiconductor manufacturers covering products similar to those we sell or may develop, as this could adversely affect our ability to sell products to those manufacturers.
Some of our competitors have substantially greater financial resources and more extensive engineering, manufacturing, marketing and customer service and support resources than we do and therefore have the potential to increasingly dominate the semiconductor equipment industry. These competitors may deeply discount products similar to those that we sell, challenging or even exceeding our ability to make similar accommodations and threatening our ability to sell those products. As a result, we may fail to continue to compete successfully worldwide.
In addition, our competitors may provide innovative technology that may have performance advantages over systems we currently offer or may offer in the future. They may be able to develop products comparable or superior to those that we offer or may adapt more quickly to new technologies or evolving customer requirements. In particular, while we currently are developing additional product enhancements that we believe will address future customer requirements, we may fail in a timely manner to complete the development or introduction of these additional product enhancements successfully, or these product enhancements may not achieve market acceptance or be competitive. Accordingly, we may be unable to continue to compete in our markets and competition may intensify, or future competition, operating results, financial condition, and/or cash flows could suffer.
If we are unable to adjust the scale of our business in response to rapid changes in demand in the semiconductor equipment industry, our operating results and our ability to compete successfully may be impaired.
The business cycle in the semiconductor equipment industry has historically been characterized by frequent periods of rapid change in demand that challenge our management to adjust spending and resources allocated to operating activities. During periods of growth or decline in demand for our products and services, we face significant challenges in maintaining adequate financial and business controls, management processes, information systems and procedures and in training, managing, and appropriately sizing our supply chain, our work force, and other components of our business on a timely basis. Our success will depend, to a significant extent, on the ability of our executive officers and other members of our senior management to identify and respond to these challenges, our gross margins and earnings may be impaired during periods of demand decline, and we may lack the infrastructure and resources to scale up our business to meet customer expectations and compete successfully during periods of demand growth.
We manufacture all of our systems at a limited number of facilities, and any prolonged disruption in the operations of those facilities could reduce our revenues.
We produce all of our systems in our manufacturing facilities located in Milpitas, California. We use contract manufacturers in China, Israel, Japan and the United States. Our manufacturing processes are highly complex and require sophisticated, costly equipment and specially designed facilities. As a result, any prolonged disruption in the operations of our manufacturing facilities, such as those resulting from acts of war, terrorism, political instability, health epidemics, fire, earthquake, flooding or other natural disaster could seriously harm our ability to satisfy our customer order deadlines.
Our results of operations could vary as a result of the methods, estimates and judgments we use in applying our accounting policies.
The methods, estimates and judgments we use in applying our accounting policies have a significant impact on our results of operations. See “Note 1. Nature of Business, Basis of Presentation and Significant Accounting Policies” in Part II, Item 8, Note 1 of our consolidated financial statements. These methods, estimates and judgments are, by their nature, subject to substantial risks, uncertainties and assumptions, and factors may arise over time that leads us to change our methods, estimates and judgments. Changes in these methods, estimates and judgments could significantly affect our results of operations. In particular, our operating results have been affected by our recording of a valuation allowance against our U.S. deferred tax assets, the calculation of share-based
16
compensation expense and by the testing and potential impairment of long-lived assets such as goodwill and other intangible assets. For example, during the year ended December 27, 2014, we recorded a $21.1 million valuation allowance against our U.S. deferred tax assets as we determined, based on the weight of available evidence, it was more-likely-than-not that some or all of our deferred tax assets would not be realized. The valuation allowance had a significant impact to our operating results. The process of evaluating potential impairments is highly subjective and requires significant judgment, and our results of operations could vary significantly from estimates. To the extent that we believe it is more-likely-than-not that we will realize our U.S. deferred tax assets, our financial statements will reflect another significant change to our tax provision and operating results.
Our operating results have varied in the past and probably will continue to vary significantly in the future, which will cause volatility in our stock price.
Our quarterly and annual operating results have varied significantly in the past and are likely to vary in the future, which volatility could cause our stock price to decline. Some of the factors that may influence our operating results and subject our stock to extreme price and volume fluctuations include:
|
|
· |
general economic growth or decline in the U.S. or foreign markets; |
|
|
· |
changes in customer demand for our systems; |
|
|
· |
the gain or loss of a key customer or significant changes in the financial condition or one or more key customers; |
|
|
· |
economic conditions in the semiconductor industries; |
|
|
· |
the timing, cancellation or delay of customer orders and shipments; |
|
|
· |
market acceptance of our products and our customers' products; |
|
|
· |
our ability to recover the higher costs associated with meeting our customers' increasing service demands; |
|
|
· |
competitive pressures on product prices and changes in pricing by our customers or suppliers; |
|
|
· |
the timing of new product announcements and product releases by us or our competitors and our ability to design, introduce and manufacture new products on a timely and cost-effective basis; |
|
|
· |
fluctuations in foreign currency exchange rates, particularly the Japanese yen, the Korean won and the British pound sterling; |
|
|
· |
the occurrence of tax valuation allowances; |
|
|
· |
the occurrence of potential impairments of long-lived assets; |
|
|
· |
the timing of acquisitions of businesses, products or technologies; |
|
|
· |
the effects of war, natural disasters, acts of terrorism or political unrest; |
|
|
· |
the loss of key personnel; and |
|
|
· |
the levels of our fixed expenses, relative to our revenue level. |
The foregoing factors are difficult to forecast, and these, as well as other factors, could materially and adversely affect our quarterly and annual operating results. If our operating results in any period fall below the expectations of securities analysts and investors, the market price of our common stock would likely decline.
We are highly dependent on international sales and operations, which exposes us to foreign political and economic risks.
A majority of our sales and operations are outside of the United States. As a result, we are subject to regulatory, geopolitical and other risks associated with doing business in foreign countries. We anticipate that international sales will continue to account for a significant portion of our revenues. International sales and operations carry inherent risks such as:
|
|
· |
regulatory limitations imposed by foreign governments; |
|
|
· |
obstacles to the protection of our intellectual property, political, military and terrorism risks; |
|
|
· |
foreign currency controls and currency exchange rate fluctuations; |
|
|
· |
periodic local or international economic downturns; |
|
|
· |
political instability, natural disasters, acts of war or terrorism in regions where we have operations; |
17
|
|
· |
repatriation of cash earned in foreign countries; |
|
|
· |
longer payment cycles and difficulties in collecting accounts receivable outside of the U.S.; |
|
|
· |
disruptions or delays in shipments caused by customs brokers or other government agencies; |
|
|
· |
uncertainty regarding liability under foreign laws; |
|
|
· |
unexpected changes in regulatory requirements (including import and export requirements), tariffs, customs, duties and other trade barriers; |
|
|
· |
difficulties in staffing and managing foreign operations; |
|
|
· |
potentially adverse tax consequences resulting from changes in tax laws; and |
|
|
· |
other challenges caused by distance, language and cultural differences. |
If any of these risks materialize and we are unable to manage them, our international sales and operations would suffer.
Changes in our effective income tax rate could affect our results of operations.
Fluctuations in our effective tax rate may affect operating results. Our effective tax rate is subject to fluctuation based on a variety of factors, such as:
|
|
· |
the jurisdictions in which our profits are determined to be earned and taxed; |
|
|
· |
changes to tax laws, regulations and interpretations; |
|
|
· |
our ability to obtain approval and the timing of receipt of approval from the Internal Revenue Service of tax elections; |
|
|
· |
changes in the valuation of our deferred tax assets and liabilities; |
|
|
· |
increases in expenses not deductible for tax purposes, including write-offs of acquired in-process research and development and impairment of goodwill in connection with acquisitions and |
|
|
· |
changes in available tax credits. |
Any material increase in our effective tax rate would adversely affect our operating results.
We are exposed to fluctuations in the foreign currency exchange rates.
As a global concern, we face exposure to adverse movements in foreign currency exchange rates. Our exposure to foreign currency exchange rate fluctuations arise in part from current intercompany accounts in which costs are charged between our U.S. headquarters and foreign subsidiaries. These exposures may change over time as business practices evolve and could have a material adverse impact on our financial results and cash flow.
Anti-takeover provisions in our charter documents and Delaware law could discourage, delay or prevent a change in control of our company and may affect the trading price of our common stock.
The anti-takeover provisions of the Delaware General Corporation Law may discourage, delay or prevent a change in control of our company by limiting our ability to engage in a business combination with an interested stockholder, even if a change of control would be beneficial to our existing stockholders. In addition, our certificate of incorporation and bylaws may discourage, delay or prevent a change in our management or control over us that stockholders may consider favorable. Our certificate of incorporation and bylaws:
|
|
· |
authorize the issuance of “blank check” preferred stock that could be issued by our board of directors to thwart a takeover attempt; |
|
|
· |
limit who may call special meetings of stockholders; and |
|
|
· |
prohibit stockholder action by written consent, requiring all actions to be taken at a meeting of the stockholders. |
18
If our network security measures are breached and unauthorized access is obtained to a customer's data, to our data, or to our information technology systems, we may incur significant legal and financial exposure and liabilities.
As part of our business, we store our data and certain data about our customers in our information technology system. While our system is designed with access security, if a third party gain unauthorized access to our data, including any data regarding our customers, the security breach could expose us to a risk of loss of this information, loss of business, litigation and possible liability. These security measures may be breached as a result of third-party action, including intentional misconduct by computer hackers, employee error, malfeasance or otherwise. Additionally, third parties may attempt to fraudulently induce employees or customers into disclosing sensitive information such as user names, passwords or other information to gain access to our customers' data or our data, including our intellectual property and other confidential business information, or our information technology systems. Because the techniques used to obtain unauthorized access, or to sabotage systems, change frequently and generally are not recognized until launched against a target, we may be unable to anticipate these techniques or to implement adequate preventative measures. Any security breach could result in a loss of confidence by our customers, damage our reputation, disrupt our business, lead to legal liability and negatively impact our future sales.
We are subject to various environmental laws and regulations that could impose substantial costs upon us and may harm our business, operating results and financial condition.
Some of our operations use substances regulated under various federal, state, local, and international laws governing the environment, including those relating to the storage, use, discharge, disposal, labeling, and human exposure to hazardous and toxic materials. We could incur costs, fines and civil or criminal sanctions, third-party property damage or personal injury claims, or could be required to incur substantial investigation or remediation costs, if we were to violate or become liable under environmental laws. Liability under environmental laws can be joint and several and without regard to comparative fault. Compliance with current or future environmental laws and regulations could restrict our ability to expand our facilities or require us to acquire additional expensive equipment, modify our manufacturing processes, or incur other significant expenses. We may unintentionally violate environmental laws or regulations in the future as a result of human error, equipment failure or other causes.
Compliance with federal securities laws, rules and regulations, as well as NASDAQ requirements, is becoming increasingly complex, and the significant attention and expense we must devote to those areas may have an adverse impact on our business.
Federal securities laws, rules and regulations, as well as NASDAQ rules and regulations, require companies to maintain extensive corporate governance measures, impose comprehensive reporting and disclosure requirements, set strict independence and financial expertise standards for audit and other committee members and impose civil and criminal penalties for companies and their chief executive officers, chief financial officers and directors for securities law violations. These laws, rules and regulations have increased, and in the future are expected to continue to increase, the scope, complexity and cost of our corporate governance, reporting and disclosure practices, which could harm our results of operations and divert management's attention from business operations.
We may be exposed to liabilities under the FCPA and other anti-corruption laws, and any determination that we violated these laws could have a material adverse effect on our business.
We are subject to the Foreign Corrupt Practice Act of 1977 ("FCPA"), and other laws that prohibit improper payments or offers of payments to foreign governments and their officials and political parties by U.S. persons and issuers as defined by the statute, for the purpose of obtaining or retaining business. Also, similar worldwide anti-bribery laws, such as the U.K. Bribery Act and Chinese anti-corruption laws, generally prohibit companies and their intermediaries from making improper payments to non-U.S. officials for the purpose of obtaining or retaining business. Some of our distribution partners are located in parts of the world that have experienced governmental corruption to some degree and, in certain circumstances, strict compliance with anti-bribery laws may conflict with local customs and practices. Although we have implemented policies and procedures to discourage these practices by our employees, our existing safeguards and any future improvements may prove to be less than effective, and our employees, consultants, sales agents or distributors may engage in conduct for which we might be held responsible. Violations of the FCPA or international anti-corruption laws may result in severe criminal or civil sanctions, and we may be subject to other liabilities, which could negatively affect our business, operating results and financial condition. In addition, the U.S. government may seek to hold us liable for successor liability FCPA violations committed by companies in which we invest or that we acquire. We cannot assure you that our internal control policies and procedures will protect us from reckless or negligent acts committed by our employees, distributors, partners, consultants or agents.
Recent regulations related to conflict minerals could adversely impact our business.
The Dodd-Frank Wall Street Reform and Consumer Protection Act contains provisions to improve transparency and accountability concerning the supply of tin, tantalum, tungsten and gold, known as conflict minerals, originating from the Democratic
19
Republic of Congo, or DRC, and adjoining countries. As a result, in August 2012 the United States Securities and Exchange Commission, or SEC, adopted annual disclosure and reporting requirements for public companies that use conflict minerals mined from the DRC and adjoining countries in their products. We have determined that we use at least one of these conflict minerals in the manufacture of our products, although we have not yet determined the source of the minerals that we use. These new disclosure requirements require us to use diligent efforts to determine which conflict minerals we use and the source of those conflict minerals, and disclose the results of our findings. There have been and will continue to be costs associated with complying with these disclosure requirements, including those costs incurred in conducting diligent efforts to determine which conflict minerals we use and the sources of conflict minerals used in our products. Further, the implementation of these rules could adversely affect the sourcing, supply and pricing of materials used in our products. As there may be only a limited number of suppliers offering conflict free minerals, we cannot be sure that we will be able to obtain necessary conflict free conflict minerals in sufficient quantities or at competitive prices. In addition, we may face reputational challenges if we determine that our products contain minerals not determined to be conflict free or if we are unable to sufficiently verify the origins for all conflict minerals used in our products through the procedures we implement. If we determine it is necessary to redesign our products to not use conflict minerals, we would incur costs associated with doing so.
None.
At December 26, 2015, our owned or leased facilities included those described below:
|
Type |
|
Location |
|
Square Footage |
|
|
Use |
|
|
Owned |
|
Milpitas, California |
|
|
135,692 |
|
|
Corporate headquarters, manufacturing and corporate housing |
|
Leased |
|
United Kingdom |
|
|
20,338 |
|
|
Sales and service |
|
Leased |
|
South Korea |
|
|
20,234 |
|
|
Sales, service and corporate housing |
|
Leased |
|
Japan |
|
|
14,974 |
|
|
Sales, service and corporate housing |
|
Leased |
|
United States |
|
|
19,551 |
|
|
Engineering, sales and service |
|
Leased |
|
Taiwan |
|
|
18,248 |
|
|
Sales and service |
|
Leased |
|
China |
|
|
11,379 |
|
|
Sales and service |
|
Leased |
|
Singapore |
|
|
4,529 |
|
|
Sales and service |
|
Leased |
|
France |
|
|
828 |
|
|
Sales and service |
|
Leased |
|
Switzerland |
|
|
387 |
|
|
Sales and service |
We believe that our existing facilities are suitable and adequate for our current needs and anticipated growth.
Not Applicable.
Not Applicable.
20
|
ITEM 5. |
MARKET FOR REGISTRANT’S COMMON EQUITY, RELATED STOCKHOLDER MATTERS AND ISSUER PURCHASES OF EQUITY SECURITIES |
Market Information for Common Stock
Our common stock is quoted on the NASDAQ Global Select Market under the symbol “NANO.” The following table sets forth, for the fiscal periods indicated, the high and low closing sales prices per share of our common stock on a quarterly basis as reported on the NASDAQ Global Select Market.
|
Fiscal Year 2015 |
|
High |
|
|
Low |
|
||
|
First quarter |
|
$ |
18.60 |
|
|
$ |
15.32 |
|
|
Second quarter |
|
$ |
17.09 |
|
|
$ |
14.46 |
|
|
Third quarter |
|
$ |
16.30 |
|
|
$ |
12.33 |
|
|
Fourth quarter |
|
$ |
15.91 |
|
|
$ |
12.12 |
|
|
Fiscal Year 2014 |
|
High |
|
|
Low |
|
||
|
First quarter |
|
$ |
19.05 |
|
|
$ |
16.18 |
|
|
Second quarter |
|
$ |
18.42 |
|
|
$ |
15.55 |
|
|
Third quarter |
|
$ |
18.60 |
|
|
$ |
15.15 |
|
|
Fourth quarter |
|
$ |
16.59 |
|
|
$ |
13.07 |
|
Stockholders
On February 12, 2016, there were approximately 181 holders of record of our common stock. Because brokers and the institutions on behalf of stockholders hold many of our shares of common stock, we are unable to estimate the total number of stockholders represented by these record holders.
Dividend Policy
We have never declared or paid any cash dividends on our capital stock. We currently expect to retain future earnings, if any, for use in the operation, expansion of our business and repurchase of shares and do not anticipate paying any cash dividends in the foreseeable future. Under our loan and security agreement with Comerica Bank, we are not permitted to pay dividends without the consent of Comerica Bank.
21
Stock Performance Graph
The following graph presentation compares cumulative five-year stockholder returns on an indexed basis, assuming a $100 initial investment and reinvestment of dividends, of (a) Nanometrics Incorporated, (b) a broad-based equity market index and (c) an industry-specific index. The broad-based equity market index used is the NASDAQ Composite Index and the industry-specific index used is the RDG Technology Composite Index.
This performance graph shall not be deemed “filed” for purposes of Section 18 of the Securities Exchange Act of 1934, as amended or otherwise subject to the liabilities under that Section, and shall not be deemed to be incorporated by reference into any of our filings under the Securities Act of 1933, as amended or the Exchange Act.
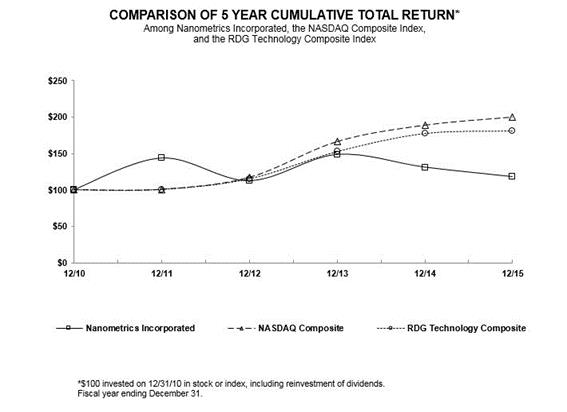
|
|
|
12/10 |
|
|
12/11 |
|
|
12/12 |
|
|
12/13 |
|
|
12/14 |
|
|
12/15 |
|
||||||
|
Nanometrics Incorporated |
|
|
100.00 |
|
|
|
143.57 |
|
|
|
112.39 |
|
|
|
148.48 |
|
|
|
131.10 |
|
|
|
118.00 |
|
|
NASDAQ Composite |
|
|
100.00 |
|
|
|
100.53 |
|
|
|
116.92 |
|
|
|
166.19 |
|
|
|
188.78 |
|
|
|
199.95 |
|
|
RDG Technology Composite |
|
|
100.00 |
|
|
|
100.56 |
|
|
|
115.30 |
|
|
|
152.75 |
|
|
|
177.73 |
|
|
|
181.32 |
|
Recent Sales of Unregistered Securities
None.
Issuer Purchases of Equity Securities
On May 29, 2012, our Board of Directors approved a program to repurchase up to $20.0 million of our common stock, referred to as the 2012 program. Stock repurchases under this program may be made through open market and privately negotiated transactions, at times and in such amounts as management deems appropriate. The timing and actual number of shares repurchased is dependent on a variety of factors including price, corporate and regulatory requirements and other market conditions.
During fiscal year 2015, we repurchased and retired 111,050 shares of our common stock at the weighted average price of $15.49 per share under this approved plan, all of which were purchased in the first quarter of fiscal year 2015. As of December 26, 2015, $4.4 million remained available for the future repurchase of shares of common stock under the 2012 program.
22
The selected consolidated financial data set forth below should be read in conjunction with “Management’s Discussion and Analysis of Financial Condition and Results of Operations” and the consolidated financial statements and related notes included elsewhere in this Annual Report on Form 10-K. Our fiscal years 2015, 2014, 2013, 2012 and 2011, as referred to below, refer to our fiscal years ended December 26, 2015, December 27, 2014, December 28, 2013, December 29, 2012 and December 31, 2011, respectively.
|
|
|
Fiscal Year |
|
|||||||||||||||||
|
|
|
2015 |
|
|
2014(1) |
|
|
2013 |
|
|
2012 |
|
|
2011(2) |
|
|||||
|
|
|
(in thousands, except per share data) |
|
|||||||||||||||||
|
Consolidated Statement of Operations Data: |
|
|
|
|
|
|
|
|
|
|
|
|
|
|
|
|
|
|
|
|
|
Total net revenues |
|
$ |
187,367 |
|
|
$ |
166,443 |
|
|
$ |
144,307 |
|
|
$ |
182,881 |
|
|
$ |
230,061 |
|
|
Gross profit |
|
$ |
89,667 |
|
|
$ |
75,822 |
|
|
$ |
62,676 |
|
|
$ |
83,928 |
|
|
$ |
122,101 |
|
|
Income (loss) from operations |
|
$ |
4,973 |
|
|
$ |
(11,653 |
) |
|
$ |
(21,709 |
) |
|
$ |
5,478 |
|
|
$ |
45,766 |
|
|
Net income (loss) |
|
$ |
2,905 |
|
|
$ |
(31,118 |
) |
|
$ |
(14,146 |
) |
|
$ |
4,465 |
|
|
$ |
28,685 |
|
|
Basic net income (loss) per share |
|
$ |
0.12 |
|
|
$ |
(1.30 |
) |
|
$ |
(0.61 |
) |
|
$ |
0.19 |
|
|
$ |
1.26 |
|
|
Diluted net income (loss) per share |
|
$ |
0.12 |
|
|
$ |
(1.30 |
) |
|
$ |
(0.61 |
) |
|
$ |
0.19 |
|
|
$ |
1.22 |
|
|
|
(1) |
Our net loss included a non-cash valuation allowance of $21.1 million on certain U.S. deferred tax assets. |
|
|
(2) |
We acquired Nanda Technologies GmbH in fiscal 2011. The result of this acquisition have been included in our consolidated financial statements since the date of the acquisition. |
|
|
|
Fiscal Year Ended |
|
|||||||||||||||||
|
|
|
2015 |
|
|
2014 |
|
|
2013 |
|
|
2012 |
|
|
2011 |
|
|||||
|
|
|
(in thousands) |
|
|||||||||||||||||
|
Consolidated Balance Sheet Data: |
|
|
|
|
|
|
|
|
|
|
|
|
|
|
|
|
|
|
|
|
|
Cash, cash equivalents and marketable securities |
|
$ |
83,085 |
|
|
$ |
83,962 |
|
|
$ |
92,862 |
|
|
$ |
109,908 |
|
|
$ |
97,699 |
|
|
Working capital |
|
$ |
132,903 |
|
|
$ |
119,644 |
|
|
$ |
141,797 |
|
|
$ |
158,587 |
|
|
$ |
160,629 |
|
|
Total assets |
|
$ |
235,540 |
|
|
$ |
223,236 |
|
|
$ |
262,834 |
|
|
$ |
259,454 |
|
|
$ |
267,221 |
|
|
Long-term liabilities including current portion of debt obligation |
|
$ |
3,001 |
|
|
$ |
5,497 |
|
|
$ |
6,504 |
|
|
$ |
13,884 |
|
|
$ |
17,213 |
|
|
Total stockholders’ equity |
|
$ |
187,328 |
|
|
$ |
179,537 |
|
|
$ |
207,373 |
|
|
$ |
215,771 |
|
|
$ |
209,992 |
|
23
Overview
You should read the following discussion and analysis of our financial condition and results of operations together with “Selected Financial Data” and our consolidated financial statements and related notes appearing elsewhere in this Annual Report on Form 10-K. This discussion and analysis contains forward-looking statements that involve risks, uncertainties and assumptions. The actual results may differ materially from those anticipated in these forward-looking statements as a result of certain factors, including, but not limited to, those presented under “Risk Factors” in Item 1A and elsewhere in this Annual Report on Form 10-K. Please see “Cautionary Information Regarding Forward-Looking Statements” at the beginning of this Form 10-K for additional information you should consider regarding forward-looking statements.
We are an innovator in the field of metrology and inspection systems for semiconductor manufacturing and other industries. Our systems are designed to precisely monitor optical critical dimensions and film thickness that are necessary to control the manufacturing process and to identify defects that can affect production yields and performance.
Principal factors that impact our revenue growth include capital expenditures by manufacturers of semiconductors to increase capacity and to enable their development of new technologies, and our ability to improve market share. The increasing complexity of the manufacturing processes for semiconductors is an important factor in the demand for our innovative metrology systems, as are the adoption of optical critical dimension (“OCD”) metrology across fabrication processes, immersion lithography and multiple patterning, new types of thin film materials, advanced packaging strategies and wafer backside inspection, and the need for improved process control to drive process efficiencies. Our strategy is to continue to innovate organically as well as to evaluate strategic acquisitions to address business challenges and opportunities.
Our revenues are primarily derived from product sales but are also derived from customer service and system upgrades for the installed base of our products. In 2015, we derived 78% of our total net revenues from product sales and 22% of our total net revenues from services.
Important Themes and Significant Trends
The semiconductor equipment industry is characterized by cyclical growth. Changing trends in the semiconductor industry continue to drive the need for metrology as a major component of device manufacturing. These trends include:
|
|
· |
Proliferation of Optical Critical Dimension Metrology across Fabrication Processes. Our customers use photolithographic processes to create patterns on wafers. Critical dimensions must be carefully controlled during this process. In advanced node device definition, additional monitoring of thickness and profile dimensions on these patterned structures at Chemical Mechanical Polishing, Etch, and Thin Film processing is driving broader OCD adoption. Our proprietary OCD systems can provide the critical process control of these circuit dimensions that is necessary for successful manufacturing of these state-of-the-art devices. Nanometrics OCD technology is broadly adopted across NAND, DRAM, and logic semiconductor manufacturing processes. |
|
|
· |
Development of 3D Transistor Architectures. Our end customers continue to improve device density and performance by scaling front-end-of-line transistor architectures. Many of these designs, including FinFET transistors and 3D-NAND, have buried features and high aspect ratio stacked features that enable improved performance and density. The advanced designs require additional process control to manage the complex shapes and materials properties, driving additional applications for both OCD and our UniFire systems. |
|
|
· |
Adoption of Advanced Packaging Processes. Our customers use photolithography, etching, metallization and wafer thinning to enable next generation advanced packaging solutions for semiconductor devices. These new packaging techniques lead to increased functionality in smaller, less expensive form factors. Advanced packages can be broken down into high density flip chip or bump packages that increase pin density allowing for more complex I/O on advanced CPU parts. Similar or different devices can be stacked at the wafer level using a Through Silicon Via ("TSV") process. The TSV process enables high density small form factor parts, being primarily driven by mobile consumer products (e.g. cellular telephones with integrated CMOS camera sensors). Increasingly advanced packaging technologies are being adopted by our end customers. |
|
|
· |
Adoption of New Types of Thin Film Materials. The need for ever increasing device circuit speed coupled with lower power consumption has pushed semiconductor device manufacturers to begin the replacement of traditional aluminum etch back interconnect flows, as well as conventional gate dielectric materials, with new materials and processes that are driving broader adoption of thin film and OCD metrology systems. To achieve greater semiconductor device speed, manufacturers have adopted copper in Logic/IDM and it is now proliferating in next generation DRAM and Flash nodes. |
24
|
|
Additionally, to achieve improved transistor performance in logic devices and higher cell densities in memory devices, new materials including high dielectric constant (or high-k) gate materials are increasingly being substituted for traditional silicon-oxide gate dielectric materials. High-k materials comprise complex thin films including layers of hafnium oxide and a bi-layer of thin film metals. Our advanced metrology and inspection solutions are required for control of process steps, which are critical to enable the device performance improvements that these new materials allow. |
|
|
· |
Need for Improved Process Control to Drive Process Efficiencies. Competitive forces influencing semiconductor device manufacturers, such as price-cutting, shorter product life cycles and time to market, place pressure on manufacturers to rapidly achieve production efficiency. Device manufacturers are using our integrated and automated systems throughout the fabrication process to ensure that manufacturing processes scale rapidly, are accurate and can be repeated on a consistent basis. |
Critical Accounting Policies
The preparation of our financial statements conforms to accounting principles generally accepted in the United States of America, which requires management to make estimates and judgments in applying our accounting policies that have an important impact on our reported amounts of assets, liabilities, revenue, expenses and related disclosures at the date of our financial statements. On an ongoing basis, management evaluates its estimates including those related to bad debts, inventory valuations, warranty obligations, impairment and income taxes. Management bases its estimates and judgments on historical experience and on various other factors that are believed to be reasonable under the circumstances, the results of which form the basis for making judgments about the carrying values of assets and liabilities that are not readily apparent from other sources. Actual results may differ from management’s estimates. We believe that the application of the following accounting policies requires significant judgments and estimates on the part of management. For a summary of all of our accounting policies, including those discussed below, see Note 1 to our consolidated financial statements.
Revenue Recognition - We recognize revenue when persuasive evidence of an arrangement exists, delivery has occurred or services have been rendered, the seller's price is fixed or determinable, and collectability is reasonably assured. We derive revenue from the sale of process control metrology and inspection systems (“product revenue”) as well as spare part sales, billable services, service contracts, and upgrades (together “service revenue”). Upgrades are a group of parts and/or software that change the existing configuration of a product and are included in service revenue. They are distinguished from product revenue, which consists of complete, advanced process control metrology and inspection systems (the “system(s)”). Nanometrics' systems consist of hardware and software components that function together to deliver the essential functionality of the system. Arrangements for sales of systems often include defined customer-specified acceptance criteria.
For product sales to existing customers, revenue recognition occurs at the time title and risk of loss transfer to the customer, which usually occurs upon shipment from our manufacturing location, if it can be reliably demonstrated that the product has successfully met the defined customer specified acceptance criteria and all other recognition criteria have been met. For initial sales where we have not previously met the defined customer specified acceptance criteria, we recognize product revenues upon the earlier of receipt of written customer acceptance or expiration of the contractual acceptance period. In Japan, where contractual terms with the customer specify risk of loss and title transfers upon customer acceptance, we recognize revenue upon receipt of written customer acceptance, provided that all other recognition criteria have been met.
We warrant our products against defects in manufacturing. Upon recognition of product revenue, we record a liability for anticipated warranty costs. On occasion, customers request a warranty period longer than our standard warranty. In those instances where extended warranty services are separately quoted to the customer, we defer and recognize the associated revenue as service revenue ratably over the term of the contract. We include the portion of service contracts and extended warranty services agreements that are uncompleted at the end of any reporting period in deferred revenue.
As part of customer services, we also sell software that is considered to be an upgrade to a customer's existing systems. These standalone software upgrades are not essential to the tangible product's functionality and are accounted for under software revenue recognition rules which require vendor specific objective evidence ("VSOE") of fair value to allocate revenue in a multiple element arrangement. We recognize revenue from upgrades when the upgrades are delivered to the customer, provided that all other recognition criteria have been met.
We recognize revenue related to spare parts upon shipment. We recognize revenue related to billable services when the services are completed. Service contracts may be purchased by the customer during or after the warranty period and we recognize revenue ratably over the service contract period.
Frequently, we deliver products and various services in a single transaction. Our deliverables consist of tools, installation, upgrades, billable services, spare parts, and service contracts. Our typical multi-element arrangements include a sale of one or multiple
25
tools that include installation and standard warranty. Other arrangements may consist of a sale of tools bundled with service elements or delivery of different types of services. Tools, upgrades, and spare parts are generally delivered to customers within a period of up to six months from order date. Installation is usually performed soon after delivery of the tool. We defer the portion of revenue associated with installation based on estimated fair value and we recognize that revenue upon completion of the installation. Billable services are billed on a time and materials basis and performed as requested by customers. Under service contract arrangements, services are provided as needed over the fixed arrangement term and such terms can be up to 12 months. We do not generally grant customers a general right of return or refund and may impose a penalty on orders cancelled prior to the scheduled shipment date.
We evaluate our revenue arrangements to identify deliverables and to determine whether these deliverables are separable into multiple units of accounting. We allocate the arrangement consideration among the deliverables based on relative selling price. We have established VSOE for some of our products and services when a substantial majority of selling prices falls within a narrow range when sold separately. For deliverables with no established VSOE, we use best estimate of selling price to determine standalone selling price for such deliverable. We do not use third party evidence to determine standalone selling price since this information is not widely available in the market as our products contain a significant element of proprietary technology and the solutions offered differ substantially from our competitors. We have established a process for developing best estimated selling price ("BESP"), which incorporates historical selling prices, the effect of market conditions, gross margin objectives, pricing practices, as well as entity-specific factors. We monitor and evaluate BESP on a regular basis to ensure that changes in circumstances are accounted for in a timely manner.
When certain elements in multiple-element arrangements are not delivered or accepted at the end of a reporting period, the relative selling prices of undelivered elements are deferred until these elements are delivered and/or accepted. If deliverables cannot be accounted for as separate units of accounting, the entire arrangement is accounted for as a single unit of accounting and we defer revenue until all elements are delivered and all revenue recognition requirements are met.
Allowance for Doubtful Accounts – We maintain allowances for estimated losses resulting from the inability of our customers to make their required payments. We establish credit limits through a process of reviewing the financial history and stability of our customers. Where appropriate and available, we obtain credit rating reports and financial statements of customers when determining or modifying their credit limits. We regularly evaluate the collectability of our trade receivable balances based on a combination of factors such as the length of time the receivables are past due, customary payment practices in the respective geographies and our historical collection experience with customers. We believe that our allowance for doubtful accounts adequately reflects our risk associated with our receivables. If the financial condition of a customer were to deteriorate, resulting in their inability to make payments, we would assess the necessity of recording additional allowances. This would result in additional general and administrative expenses being recorded for the period in which such determination was made
Inventories – Inventories are stated at the lower of cost, which approximates actual cost on a first-in, first-out basis, or market. We are exposed to a number of economic and industry-specific factors that could result in portions of our inventory becoming either obsolete or in excess of anticipated usage, or saleable only for amounts that are less than their carrying amounts. These factors include, but are not limited to, technological changes in our market, our ability to meet changing customer requirements, competitive pressures in products and prices, and the availability of key components from our suppliers. We have established inventory reserves when conditions exist that suggest that our inventory may be in excess of anticipated demand or is obsolete based upon our assumptions about future demand for our products and market conditions. Once a reserve has been established, it is maintained until the part to which it relates is sold or is otherwise disposed of. Therefore, a sale of reserved inventory has a higher gross profit margin. We regularly evaluate our ability to realize the value of our inventory based on a combination of factors including the following: historical usage rates, forecasted sales of usage, product end-of-life dates, estimated current and future market values and new product introductions. Inventory includes evaluation tools placed at customer sites. For demonstration inventory, we also consider the age of the inventory and potential cost to refurbish the inventory prior to sale. We amortize demonstration inventory over its useful life and the amortization expense is included in total inventory write down on our statements of cash flows. When recorded, our reserves are intended to reduce the carrying value of our inventory to its net realizable value. If actual demand for our products deteriorates, or market conditions are less favorable than those that we project, additional reserves may be required, which would adversely affect gross margin and net income.
26
Product Warranties – We sell the majority of our products with a standard twelve month repair or replacement warranty from the date of acceptance or shipment date. We provide an accrual for estimated future warranty costs based upon the historical relationship of warranty costs to the cost of products sold. The estimated future warranty obligations related to product sales are reported in the period in which the related revenue is recognized. The estimated future warranty obligations are affected by the warranty periods, sales volumes, product failure rates, material usage and labor and replacement costs incurred in correcting a product failure. If actual product failure rates, material usage, labor or replacement costs differ from our estimates, revisions to the estimated warranty obligations would be required. For new product introductions where limited or no historical information exists, we may use warranty information from other previous product introductions to guide us in estimating our warranty accrual. The warranty accrual represents the best estimate of the amount necessary to settle future and existing claims on products sold as of the balance sheet date. We periodically assess the adequacy of our recorded warranty reserve and adjust the amounts in accordance with changes in these factors.
Goodwill and Intangible Assets - Intangible assets with finite lives are amortized over their useful lives and are subject to an impairment assessment, as well as an evaluation of the appropriateness of their estimated useful lives, whenever events or changes in circumstances indicate that the carrying amount(s) may not be recoverable. Goodwill and indefinite lived assets are not amortized but tested annually for impairment. The goodwill impairment assessment involves three tests, Step 0, Step 1 and Step 2. The Step 0 test involves performing an initial qualitative assessment to determine whether it is more likely than not that the asset is impaired and thus whether it is necessary to proceed to Step 1 and calculate the fair value of the reporting unit. We may proceed directly to the Step 1 test without performing the Step 0 test. The Step 1 test involves measuring the recoverability of goodwill at the reporting unit level by comparing the reporting unit's carrying amount, including goodwill, to the fair value of the reporting unit.
We perform a Step 0 assessment of the goodwill during the fourth quarter of each fiscal year, or whenever events or circumstances occur which indicate that an impairment may have occurred. As part of this assessment, we consider the trading value of our stock, the industry trends, and our sales forecast and products plans to determine if it is more likely than not that the fair value is higher than the carrying values of our reporting unit. If, after assessing the qualitative factors, we determine that it is not likely that the fair value of a reporting unit is less than its carrying value, then performing the two-step impairment test is unnecessary. However, if we conclude otherwise, then we are required to perform the Step 1 of the two-step goodwill impairment test. The Step 1 test requires a comparison of the fair value of our reporting unit to its net book value. If the fair value of the reporting unit is greater than its net book value, then no impairment is deemed to have occurred. If the fair value is less, then the Step 2 must be performed to determine the amount, if any, of actual impairment.
The process of evaluating the potential impairment of goodwill is highly subjective and requires significant judgment. In estimating the fair value of goodwill at the reporting unit level, we make estimates and judgments about future revenues and cash flows for the reporting unit. To determine the fair value, our review process includes the income method and is based on a discounted future cash flow approach that uses estimates including the following for the reporting unit: estimated revenue, market segment growth rates and market share assumptions; estimated costs; and appropriate discount rates based on the particular reporting unit's weighted average cost of capital. Our estimates of market segment growth, our market segment share and costs are based on historical data, various internal estimates and certain external sources, and are based on assumptions that are consistent with the plans and estimates we are using to manage the underlying businesses. Our business consists of both established and emerging technologies and our forecasts for emerging technologies are based upon internal estimates and external sources rather than historical information. We also consider our market capitalization on the dates of our impairment tests in determining the fair value of the respective businesses. As part of this assessment, we consider the trading value of our stock and our implied value, as compared to our net assets, as well as the valuation of our acquired businesses. If the carrying amount of the reporting unit exceeds its fair value as determined by these assessments, goodwill is considered impaired, and the Step 2 test is performed to measure the amount of impairment loss. As part of the Step 2 test to determine the amount of goodwill impairment, if any, we allocate the fair value of the reporting unit to all of its assets and liabilities as if the reporting unit had been acquired in a business combination and the fair value of the reporting unit was the price paid to acquire the reporting unit. The excess of the fair value of the reporting unit over the amount assigned to its assets and liabilities is the implied fair value of goodwill. When impairment is deemed to have occurred, we will recognize an impairment charge to reduce the carrying amount of our goodwill to its implied fair value.
Income Tax Assets and Liabilities - We account for income taxes such that deferred tax assets and liabilities are recognized using enacted tax rates for the effect of temporary differences between the book and tax accounting for assets and liabilities. Also, deferred tax assets are reduced by a valuation allowance to the extent we cannot conclude that it is more likely than not that a portion of the deferred tax asset will be realized in the future. We evaluate the deferred tax assets on a continuous basis throughout the year to determine whether or not a valuation allowance is appropriate. Factors used in this determination include future expected income and the underlying asset or liability which generated the temporary tax difference. Our income tax provision is primarily impacted by federal statutory rates, state and foreign income taxes and changes in our valuation allowance.
27
Recent Accounting Pronouncements
See Note 2 of our consolidated financial statements for a description of recent accounting pronouncements, including the respective dates of adoption and effects on our results of operations and financial condition.
Results of Operations
Total net revenues.
Our net revenues comprised the following (in thousands, except percentages):
|
|
|
Fiscal Year |
|
|
|
|
|
|
|
|
|
|||||
|
|
|
2015 |
|
|
2014 |
|
|
Change |
|
|||||||
|
Automated systems |
|
$ |
102,386 |
|
|
$ |
108,768 |
|
|
$ |
(6,382 |
) |
|
|
(5.9 |
)% |
|
Integrated systems |
|
|
31,579 |
|
|
|
15,334 |
|
|
|
16,245 |
|
|
|
105.9 |
% |
|
Materials characterization systems |
|
|
12,980 |
|
|
|
9,487 |
|
|
|
3,493 |
|
|
|
36.8 |
% |
|
Total product revenue |
|
|
146,945 |
|
|
|
133,589 |
|
|
|
13,356 |
|
|
|
10.0 |
% |
|
Service |
|
|
40,422 |
|
|
|
32,854 |
|
|
|
7,568 |
|
|
|
23.0 |
% |
|
Total net revenues |
|
$ |
187,367 |
|
|
$ |
166,443 |
|
|
$ |
20,924 |
|
|
|
12.6 |
% |
|
|
|
Fiscal Year |
|
|
|
|
|
|
|
|
|
|||||
|
|
|
2014 |
|
|
2013 |
|
|
Change |
|
|||||||
|
Automated systems |
|
$ |
108,768 |
|
|
$ |
82,924 |
|
|
$ |
25,844 |
|
|
|
31.2 |
% |
|
Integrated systems |
|
|
15,334 |
|
|
|
11,412 |
|
|
|
3,922 |
|
|
|
34.4 |
% |
|
Materials characterization systems |
|
|
9,487 |
|
|
|
13,066 |
|
|
|
(3,579 |
) |
|
|
(27.4 |
)% |
|
Total product revenue |
|
|
133,589 |
|
|
|
107,402 |
|
|
|
26,187 |
|
|
|
24.4 |
% |
|
Service |
|
|
32,854 |
|
|
|
36,905 |
|
|
|
(4,051 |
) |
|
|
(11.0 |
)% |
|
Total net revenues |
|
$ |
166,443 |
|
|
$ |
144,307 |
|
|
$ |
22,136 |
|
|
|
15.3 |
% |
In 2015, total net revenues increased by $20.9 million from 2014, principally due to an industry-wide improvement in 3D NAND-related semiconductor capital spending and from an increase in foundry penetration. Approximately $16.2 million of the increase in product revenues was attributable to sales of our Integrated Systems (principally IMPULSE®), primarily with 3D-NAND-related customers. Materials Characterization accounted for $3.5 million of the increase and was partially offset by Automated systems sales which decreased by $6.4 million. Service revenue increased by $7.6 million in 2015 principally due to an increase in upgrade revenue as a result of higher demand for upgrades of installed tools. Upgrades tend to fluctuate based on availability of new functionality from upgrades and customer production cycles, which determine when customers purchase available upgrades.
In 2014, total net revenues increased by $22.1 million from 2013, principally due to an industry-wide improvement in memory-related semiconductor capital spending and from an increase in foundry penetration, supported by the adoption of multiple Atlas ® , UniFire™ and IMPULSE ® systems by several customers during the first half of the year. This increase was partially offset by the decline in process metrology spending that occurred in the third quarter of 2014 due to a significant pause in spending at our two largest customers, and a decline in service revenues. Approximately $26.2 million of the increase in product revenues was attributable to sales of our Automated Systems (principally Atlas® followed by UniFire™). Integrated Systems accounted for $3.9 million of the increase (principally IMPULSE ®) and was partially offset by Materials Characterization sales which decreased by $3.6 million. Service revenue decreased by $4.1 million in 2014 principally due to a decrease in upgrade revenue as a result of lower demand for upgrades of installed tools during the first, third and fourth quarters of 2014. Upgrades tend to fluctuate from quarter to quarter based on availability of new functionality from upgrades and customer production cycles, which determine when customers purchase available upgrades.
With a significant portion of the world's semiconductor manufacturing capacity located in Asia, a substantial portion of our revenues continue to be generated in that region. Although sales to customers within individual countries of that region will vary from time to time, we expect that a substantial portion of our revenues will continue to be generated in Asia.
28
Gross margin.
Our gross margin breakdown was as follows:
|
|
|
Fiscal Year |
|
|||||||||
|
|
|
2015 |
|
|
2014 |
|
|
2013 |
|
|||
|
Products |
|
|
46.7 |
% |
|
|
46.5 |
% |
|
|
44.6 |
% |
|
Service |
|
|
51.9 |
% |
|
|
41.9 |
% |
|
|
47.2 |
% |
The calculation of product gross margin includes both cost of products and amortization of intangibles. The gross margin on product revenue increased to 46.7% in 2015 from 46.5% in 2014. The increase was due primarily to improved factory overhead absorption, lower amortization of intangibles and a 10% increase in product revenue during 2015, offset by higher installation and warranty costs. The gross margin on our services business increased to 51.9% from 41.9% in 2014, reflecting an increase of 10 percentage points, due principally to an increase in upgrade revenues, which typically have higher margins than core service revenue.
The gross margin on product revenue increased to 46.5% in 2014 from 44.6% in 2013, reflecting an increase of 1.9 percentage points from 2013. The increase was due primarily to improved factory overhead absorption and a change in product mix to higher margin products, as well as from the 24.4% increase in product revenue during 2014. The gross margin on our services business decreased to 41.9% in 2014 from 47.2% in 2013, reflecting a decrease of 5.3 percentage points, due principally to a decrease in upgrade revenues, which typically have higher margins than core service revenue.
Operating expenses.
Our operating expenses comprise the following categories (in thousands, except percentages):
|
|
|
Fiscal Year |
|
|
|
|
|
|
|
|
|
|||||
|
|
|
2015 |
|
|
2014 |
|
|
Change |
|
|||||||
|
Research and development |
|
$ |
32,701 |
|
|
$ |
33,776 |
|
|
$ |
(1,075 |
) |
|
|
(3.2 |
)% |
|
Selling |
|
|
28,055 |
|
|
|
27,033 |
|
|
|
1,022 |
|
|
|
3.8 |
% |
|
General and administrative |
|
|
22,444 |
|
|
|
23,980 |
|
|
|
(1,536 |
) |
|
|
(6.4 |
)% |
|
Amortization of intangible assets |
|
|
114 |
|
|
|
420 |
|
|
|
(306 |
) |
|
|
(72.9 |
)% |
|
Restructuring charge |
|
|
1,380 |
|
|
|
2,266 |
|
|
|
(886 |
) |
|
|
(39.1 |
)% |
|
Total operating expenses |
|
$ |
84,694 |
|
|
$ |
87,475 |
|
|
$ |
(2,781 |
) |
|
|
(3.2 |
)% |
|
|
|
Fiscal Year |
|
|
|
|
|
|
|
|
|
|||||
|
|
|
2014 |
|
|
2013 |
|
|
Change |
|
|||||||
|
Research and development |
|
$ |
33,776 |
|
|
$ |
32,714 |
|
|
$ |
1,062 |
|
|
|
3.2 |
% |
|
Selling |
|
|
27,033 |
|
|
|
27,129 |
|
|
|
(96 |
) |
|
|
(0.4 |
)% |
|
General and administrative |
|
|
23,980 |
|
|
|
22,101 |
|
|
|
1,879 |
|
|
|
8.5 |
% |
|
Amortization of intangible assets |
|
|
420 |
|
|
|
701 |
|
|
|
(281 |
) |
|
|
(40.1 |
)% |
|
Restructuring charge |
|
|
2,266 |
|
|
|
1,740 |
|
|
|
526 |
|
|
|
30.2 |
% |
|
Total operating expenses |
|
$ |
87,475 |
|
|
$ |
84,385 |
|
|
$ |
3,090 |
|
|
|
3.7 |
% |
Research and development.
Research and development costs decreased by $1.1 million or 3.2% in 2015 compared to 2014 related primarily due to a decrease in spending for non-recurring engineering projects, including product design and prototype development, along with related material spending and expenses associated with R&D investments for our next generation Automated and Integrated systems, partially offset by increases in variable compensation costs.
Research and development costs increased by $1.1 million or 3.2% in 2014 compared to 2013 related primarily to expense incurred in developing product improvements for our OCD and advance packaging system products.
Selling.
Selling expenses increased by $1.0 million or 3.8% in fiscal year 2015 compared to fiscal year 2014. The increase is primarily due to an increase in commissions and amortization of demonstration tools, offset in part by a decrease in travel and related expenses.
Selling expenses remained relatively flat in fiscal year 2014 compared to fiscal year 2013.
29
General and administrative.
General and administrative expenses decreased by $1.5 million or 6.4% in fiscal year 2015 compared to 2014. The decrease was primarily due lower headcount and a decrease in consulting expenditures.
General and administrative expenses increased by $1.9 million or 8.5% in fiscal year 2014 compared to 2013. The increase was primarily due to the depreciation related to our ERP implementation in 2014 and higher variable compensation expenses.
Amortization of intangible assets.
Amortization of intangible assets included in operating expenses in fiscal year 2015 decreased compared to 2014, as a result of the reduction in amortization due to intangible assets that became fully amortized in 2014.
Amortization of intangible assets included in operating expenses in fiscal year 2014 decreased slightly compared to 2013, as a result of the reduction in amortization due to intangible assets that became fully amortized in 2013.
Restructuring charge.
We recorded a restructuring charge of $1.4 million in 2015 as a result of our decision to maximize operating effectiveness. This amount includes charges primarily related to employee severance and related costs. As of December 26, 2015, we had completed and settled in full all cash payments related to employee severance.
We recorded a restructuring charge of $2.3 million in 2014 related to our efforts to improve operating efficiencies. This amount included charges primarily related to employee severance, other expenses (primarily vendor contract termination costs) and early termination costs related to a facility lease due to expire in 2017 in the amounts of $1.2 million, $0.3 million and $0.8 million respectively. We measured and recognized the exit liability associated with the lease at the cease-use date. We completed this restructuring plan in March 2015. Other related costs were recognized as incurred.
Other income (expense), net.
Our other income (expense), net, consisted of the following items (in thousands, except percentages):
|
|
|
Fiscal Year |
|
|
|
|
|
|
|
|
|
|||||
|
|
|
2015 |
|
|
2014 |
|
|
Change |
|
|||||||
|
Interest income |
|
$ |
71 |
|
|
$ |
47 |
|
|
$ |
24 |
|
|
|
51.1 |
% |
|
Interest expense |
|
|
(289 |
) |
|
|
(389 |
) |
|
|
100 |
|
|
|
(25.7 |
)% |
|
Other income (expense) |
|
|
813 |
|
|
|
374 |
|
|
|
439 |
|
|
|
117.4 |
% |
|
Total other income (expense), net |
|
$ |
595 |
|
|
$ |
32 |
|
|
$ |
563 |
|
|
|
1759.4 |
% |
|
|
|
Fiscal Year |
|
|
|
|
|
|
|
|
|
|||||
|
|
|
2014 |
|
|
2013 |
|
|
Change |
|
|||||||
|
Interest income |
|
$ |
47 |
|
|
$ |
62 |
|
|
$ |
(15 |
) |
|
|
(24.2 |
)% |
|
Interest expense |
|
|
(389 |
) |
|
|
(651 |
) |
|
|
262 |
|
|
|
(40.2 |
)% |
|
Other income (expense) |
|
|
374 |
|
|
|
(1,267 |
) |
|
|
1,641 |
|
|
NM* |
|
|
|
Total other expense, net |
|
$ |
32 |
|
|
$ |
(1,856 |
) |
|
$ |
1,888 |
|
|
|
(101.7 |
)% |
|
* |
NM = not meaningful |
Interest income increased minimally in 2015 from 2014 as the average balances of cash, cash equivalents, and marketable securities remained relatively flat. Interest expense was lower in 2015 than in the prior year due primarily to payments made to Zygo to decrease the outstanding liability related to acquisition of certain assets from Zygo. Other income increased by $0.4 million principally due to fluctuations in foreign exchange rates.
Interest income declined minimally in 2014 from 2013 as the average balances of cash, cash equivalents, and marketable securities remained relatively flat. Interest expense was lower in 2014 than in the prior year due to the repayment of the entire outstanding balance of the mortgage on our headquarters during 2013. Other income increased by $1.6 million principally due to fluctuations in foreign exchange rates, and to a lesser extent, from a $0.2 million increase in fair value of contingent consideration liability.
30
Provision for (benefit from) income taxes.
Our provision (benefit) for income taxes was $2.7 million, $19.5 million and $(9.4) million in 2015, 2014 and 2013, respectively. The decrease in the tax provision for 2015 from 2014 was primarily related to the recording of a valuation allowance against our U.S. deferred tax assets for the year ended 2014. The increase in the tax provision for 2014 from 2013 was primarily related to the recording of the same valuation allowance.
Our provision for income taxes for 2015 of $2.7 million reflects an effective tax rate of 47.8%. This rate differs from the Federal statutory rate of 35.0% primarily due to losses incurred in foreign jurisdictions where no benefit is currently recorded, as well as equity compensation expenses for which no current tax deduction is available. Our provision for income taxes for 2014 of $19.5 million reflects an effective tax rate of (167.8) %. This rate differs from the Federal statutory rate of 35.0% primarily due to the recording of a valuation allowance against our U.S. deferred tax assets which represented a $23.9 million provision as well as equity compensation expenses for which no current tax deduction is available, offset by foreign income being taxed at lower rates. Our benefit from income taxes for 2013 of $(9.4) million reflects an effective tax rate of 40.0%. This rate differs from the Federal statutory rate of 35.0% primarily due to the reinstatement of the Federal R&D tax credit, which represented a $1.4 million benefit for both 2012 and 2013, as well as the benefit from state income taxes, offset by tax on foreign income, and equity compensation expenses for which no current tax deduction is available.
We maintain valuation allowances when it is likely that all or a portion of a deferred tax asset will not be realized. Changes in valuation allowances from period to period are included in our income tax provision in the period of change. In determining whether a valuation allowance is warranted, we take into account such factors as prior earnings history, expected future earnings, unsettled circumstances that, if unfavorably resolved, would adversely affect utilization of a deferred tax asset, carry-back and carry-forward periods, and tax strategies that could potentially enhance the likelihood of realization of a deferred tax asset. We currently maintain a valuation allowance against our deferred tax assets in U.S., Israel, Germany, Switzerland, Singapore, and United Kingdom.
Liquidity and Capital Resources
The following table presents selected financial information and statistics as of and for the years ended December 26, 2015, December 27, 2014 and December 28, 2013 (in millions):
|
|
|
|
|
|||||||||
|
|
|
December 26, 2015 |
|
|
December 27, 2014 |
|
|
December 28, 2013 |
|
|||
|
Cash, cash equivalents and marketable securities |
|
$ |
83.1 |
|
|
$ |
84.0 |
|
|
$ |
92.9 |
|
|
Working capital |
|
$ |
132.9 |
|
|
$ |
119.6 |
|
|
$ |
141.8 |
|
|
Cash provided by (used in) operating activities |
|
$ |
1.6 |
|
|
$ |
(0.6 |
) |
|
$ |
(2.4 |
) |
|
Cash provided by (used in) investing activities |
|
$ |
2.0 |
|
|
$ |
(8.1 |
) |
|
$ |
(7.8 |
) |
|
Cash provided by (used in) financing activities |
|
$ |
0.2 |
|
|
$ |
(0.7 |
) |
|
$ |
(7.5 |
) |
During 2015, cash provided by operating activities was a result of $2.9 million of net income, non-cash adjustments to net income of $19.4 million and a decrease in net change in operating assets and liabilities of $20.7 million. Increase in cash from operating activities in fiscal 2015 compared to fiscal 2014 was primarily due to improved working capital and increase in sales. Cash provided by investing activities of $2.0 million during 2015, consisted primarily of cash provided by maturities of marketable securities, net of purchases of $0.4 million, and cash received from sales of marketable securities of $3.4 million, partially offset by cash used to acquire property, plant and equipment of $1.8 million. Cash provided by financing activities of $0.2 million during 2015 consisted primarily of $4.0 million in proceeds from issuance of common stock from the employee stock purchase program and the exercise of stock options, partially offset by cash used to repurchase common stock of $1.7 million, royalty and other payments to Zygo of $0.9 million, and cash paid for taxes on net issuance of stock awards of $1.2 million.
During 2014, cash used in operating activities of $0.6 million was a result of $31.1 million of net losses, non-cash adjustments to net income of $37.8 million and a decrease in net change in operating assets and liabilities of $7.3 million. Cash used in investing activities of $8.1 million during 2014 consisted primarily of cash used for purchases of marketable securities, net of maturities, of $2.3 million; and cash used to acquire property, plant and equipment of $5.8 million. Cash used in financing activities of $0.7 million during 2014 consisted primarily of cash used to repurchase common stock of $5.3 million, royalty and other payments to Zygo of $0.6 million, and cash paid for taxes on net issuance of stock awards of $0.7 million, partially offset by $6.0 million in proceeds from issuance of common stock from the employee stock purchase program and the exercise of stock options.
During 2013, cash used in operating activities of $2.4 million was a result of $14.1 million of net losses, non-cash adjustments to net income of $18.7 million and a decrease in net change in operating assets and liabilities of $7.0 million. Cash used in investing
31
activities of $7.8 million during 2013 consisted primarily of cash used for purchases of marketable securities, net of maturities, of $2.1 million; and cash used to acquire property, plant and equipment of $5.7 million. Cash used in financing activities of $7.5 million during 2013 consisted primarily of cash used to repurchase common stock of $5.0 million, mortgage repayments on our corporate headquarters of $5.2 million, royalty and other payments to Zygo of $1.0 million, and cash paid for taxes on net issuance of stock awards of $1.2 million, partially offset by $5.0 million in proceeds from issuance of common stock from the employee stock purchase program and the exercise of stock options.
We earn a portion of our operating income outside the United States, which is deemed to be indefinitely reinvested in foreign jurisdictions. As a result, $6.4 million of our cash is held by foreign subsidiaries, a portion of which would have to be repatriated to the United States. We currently do not intend nor foresee a need to repatriate these funds. We believe our existing balances of cash, cash equivalents and marketable securities will be sufficient to satisfy our working capital needs, capital asset purchases, outstanding commitments and other liquidity requirements associated with our existing operations over the next twelve months.
If we should require more capital in the United States than is generated by our domestic operations, for example to fund significant discretionary activities such as business acquisitions and share repurchases, we could elect to repatriate future earnings from foreign jurisdictions or raise capital in the United States through debt or equity issuances. These alternatives could result in higher effective tax rates, increased interest expense, or dilution of our earnings.
Debt and Repurchases of Common Stock
Line of Credit - On April 23, 2012, we amended our revolving line of credit facility with Comerica Bank to (i) extend the maturity date of such facility by two years to April 30, 2014, (ii) decrease the unused revolving line commitment fee from 0.1875% per annum to 0.10% per annum, and (iii) reduce the minimum interest rate on borrowings from 5.75% to 3.00% per annum. On May 30, 2014, we amended our revolving line of credit facility with Comerica Bank principally (i) to extend the maturity date of such facility by two years to May 30, 2016, and (ii) to increase the minimum amount available to borrow to $12.0 million.
The instrument governing the line of credit facility includes certain financial covenants regarding tangible net worth. The revolving line of credit agreement includes a provision for the issuance of commercial or standby letters of credit by the bank on our behalf. The value of all letters of credit outstanding reduces the total line of credit available. The revolving line of credit is collateralized by a blanket lien on all of our domestic assets excluding intellectual property and real estate. The minimum borrowing interest rate is 3.00% per annum. Borrowing is limited to the lesser of (a) $12.0 million plus the borrowing base, or (b) $20.0 million. The total borrowing available as of December 26, 2015 was $16.7 million. As of December 26, 2015, we were not in breach of any restrictive covenants in connection with this line of credit. There were no borrowings against the line of credit during 2015 or 2014 and there were no outstanding amounts drawn on this facility as of December 26, 2015 and December 27, 2014, respectively. Although we have no current plans to request advances under this credit facility, we may use the proceeds of any future borrowing for general corporate purposes, future acquisitions or expansion of our business.
Repurchases of Common Stock - In May 29, 2012, our Board of Directors approved a stock repurchase program to repurchase up to $20.0 million of our common stock. As of December 26, 2015, our Board of Directors had further authorized additional repurchases resulting in an aggregate repurchase authorization of up to $30.0 million of shares of common stock under the approved programs.
Stock repurchases under the programs may be made through open market and privately negotiated transactions, at times and in such amounts as management deems appropriate. The timing and actual number of shares repurchased is dependent on a variety of factors including price, corporate and regulatory requirements and other market conditions.
Shares repurchased and retired for the indicated periods of the applicable repurchase programs with the associated cost of repurchase and amount available for repurchase at the end of the respective periods are as follows (in thousands, except number of shares and weighted average price per share):
|
|
|
Fiscal Year 2015 |
|
|
Fiscal Year 2014 |
|
|
Fiscal Year 2013 |
|
|||
|
Number of shares of common stock repurchased |
|
|
111,050 |
|
|
|
362,633 |
|
|
|
332,771 |
|
|
Weighted average price per share |
|
$ |
15.49 |
|
|
$ |
14.74 |
|
|
$ |
15.03 |
|
|
Total cost of repurchase |
|
$ |
1,721 |
|
|
$ |
5,344 |
|
|
$ |
5,000 |
|
|
Amount available for repurchase at end of period |
|
$ |
4,397 |
|
|
$ |
6,118 |
|
|
$ |
11,462 |
|
$4.4 million remained available for the future repurchase of our common stock under the 2012 program.
32
Business Partnership - On June 17, 2009, we announced a strategic business partnership with Zygo whereby we have purchased inventory and certain other assets from Zygo, and the two companies entered into a supply agreement. We will make payments to Zygo (with an estimated present value of $1.5 million as of December 26, 2015) over a period of time as acquired inventory is sold and other aspects of the supply agreement are executed. We made royalty and sustaining engineering payments of $0.9 million and $0.6 million to Zygo in fiscal years 2015 and 2014, respectively.
We have evaluated and will continue to evaluate the acquisitions of products, technologies or businesses that are complementary to our business. These activities may result in product and business investments, which may affect our cash position and working capital balances. Some of these activities might require significant cash outlays.
Our principal sources of liquidity are cash and cash equivalents, and marketable securities, cash flow generated from our operations, and, to a lesser extent, borrowings from a line of credit. Our liquidity is affected by many factors, including those that relate to our specific operations and those that relate to the uncertainties of global and regional economies and the sectors of the semiconductor industry which we operate in. Although our cash requirements will fluctuate based on the timing and extent of these factors, we believe our existing cash, cash equivalents and marketable securities and borrowing availability, combined with cash currently projected to be generated from our operations, will be sufficient to meet our liquidity needs through at least the next twelve months.
Off-Balance Sheet Arrangements
We had no off-balance sheet arrangements or obligations as of December 26, 2015 and December 27, 2014, respectively.
Contractual Obligations
The following table summarizes our contractual cash obligations as of December 26, 2015, and the effect of such obligations.
|
|
|
|
|
|
|
Payments due by period |
|
|||||||||||||
|
|
|
Total |
|
|
Less than 1 year |
|
|
1-3 years |
|
|
4-5 years |
|
|
More than 5 years |
|
|||||
|
Purchase commitments - inventory (1) |
|
$ |
24,890 |
|
|
$ |
24,890 |
|
|
$ |
— |
|
|
$ |
— |
|
|
$ |
— |
|
|
Fair value of deferred payments to Zygo Corporation related to acquisition (2) |
|
|
1,804 |
|
|
|
1,004 |
|
|
|
400 |
|
|
|
400 |
|
|
|
— |
|
|
Restructuring |
|
|
256 |
|
|
|
256 |
|
|
|
— |
|
|
|
— |
|
|
|
— |
|
|
Other long-term liabilities |
|
|
333 |
|
|
|
2 |
|
|
|
— |
|
|
|
— |
|
|
|
331 |
|
|
Operating lease obligations |
|
|
2,823 |
|
|
|
1,372 |
|
|
|
1,140 |
|
|
|
311 |
|
|
|
— |
|
|
Total |
|
$ |
30,106 |
|
|
$ |
27,524 |
|
|
$ |
1,540 |
|
|
$ |
711 |
|
|
$ |
331 |
|
|
(1) |
We maintain certain open inventory purchase agreements with our suppliers to ensure a smooth and continuous supply availability for key components. Our liability under these purchase commitments is generally restricted to a forecasted time-horizon as mutually agreed upon between the parties. This forecasted time-horizon can vary among different suppliers. We estimate our open inventory purchase commitment as of December 26, 2015 was approximately $24.9 million. Actual expenditures will vary based upon the volume of the transactions and length of contractual service provided. In addition, the amounts paid under these arrangements may be less in the event that the arrangements are renegotiated or cancelled. |
|
(2) |
On June 17, 2009, we announced a strategic business partnership with Zygo Corporation, a wholly-owned subsidiary of AMETEK, Inc. (“Zygo”), whereby we have purchased inventory and certain other assets from Zygo, and the two companies entered into a supply agreement. We will make payments to Zygo (with an estimated present value of $1.5 million and an estimated future value of $1.8 million as of December 26, 2015) over a period of time as acquired inventory is sold and other aspects of the supply agreement are executed. |
Excluded from the contractual obligation table above are $0.8 million of future payments related to uncertain tax positions because we cannot reliably estimate the timing of the settlements with the respective tax authorities.
33
We are exposed to financial market risks related to foreign currency exchange rates and interest rates. We do not use derivative financial instruments.
Foreign Currency Risk
A substantial part of our business consists of sales made to customers outside the United States: 80%, 78%, and 67% of sales in 2015, 2014, and 2013, respectively, and 22%, 16%, and 16% of net revenues in 2015, 2014, and 2013, respectively, were denominated in currencies other than the U.S. dollar. Additionally, portions of our costs of net revenues and our operating expenses are incurred by our international operations and denominated in local currencies.
Our exposure to foreign currency exchange rate fluctuations arises in part from intercompany balances in which costs are charged between our U.S. headquarters and our foreign subsidiaries. On our consolidated balance sheet these intercompany balances are eliminated and thus no consolidated balances are associated with these intercompany balances; however, since each foreign entity's functional currency is generally its respective local currency, there is exposure to foreign exchange risk on a consolidated basis. Intercompany balances are denominated primarily in U.S. dollars and, to a lesser extent, other local currencies. The net intercompany balance, exposed to foreign currency risk, at December 26, 2015 was approximately $0.7 million. A hypothetical change of 10% in the relative value of the US dollar versus local functional currencies could result in an increase or decrease of approximately $0.1 million in transaction gains or losses which would be included in our statement of operations.
For 2015, 2014 and 2013, foreign currency transactions resulted in a loss of $0.5 million, a gain of $0.1 million and a loss of $0.7 million, respectively.
We enter into foreign currency forward exchange contracts to protect against currency exchange risks associated with existing assets and liabilities. A foreign currency forward exchange contract acts as a hedge by increasing in value when underlying assets decrease in value or underlying liabilities increase in value due to changes in foreign exchange rates. Conversely, a foreign currency forward exchange contract decreases in value when underlying assets increase in value or underlying liabilities decrease in value due to changes in foreign exchange rates. These forward contracts are not designated as accounting hedges, so the unrealized gains and losses are recognized in other income, net, in advance of the actual foreign currency cash flows with the fair value of these forward contracts being recorded as accrued liabilities or other current assets.
We do not use forward contracts for trading purposes. Our forward contracts generally have maturities of 30 days or less. We enter into foreign currency forward exchange contracts based on estimated future asset and liability exposures, and the effectiveness of our hedging program depends on our ability to estimate these future asset and liability exposures. Recognized gains and losses with respect to our current hedging activities will ultimately depend on how accurately we are able to match the amount of foreign currency forward exchange contracts with actual underlying asset and liability exposures.
The following table provides information about our foreign currency forward exchange contracts as of December 26, 2015. The information is provided in United States dollar equivalent amounts. The table presents the notional amounts, at contract exchange rates, and the weighted average contractual foreign currency exchange rates expressed as units of the foreign currency per United States dollar, which in some cases may not be the market convention for quoting a particular currency. All of these forward contracts mature during January 2016.
|
|
|
Notional Principal |
|
|
Contract Price |
|
||
|
|
|
(in millions) |
|
|
|
|
|
|
|
Forward Contracts |
|
|
|
|
|
|
|
|
|
Korean won |
|
$ |
7.0 |
|
|
$ |
1,174 |
|
|
European Union euro |
|
|
4.1 |
|
|
|
1.10 |
|
|
Israeli shekel |
|
|
2.1 |
|
|
|
3.88 |
|
|
Singapore dollar |
|
|
2.7 |
|
|
|
1.41 |
|
|
Chinese yuan |
|
|
1.4 |
|
|
|
6.52 |
|
|
Japanese yen |
|
|
13.2 |
|
|
|
121.27 |
|
|
Total |
|
$ |
30.5 |
|
|
|
|
|
|
Estimated Fair Value |
|
$ |
30.4 |
|
|
|
|
|
34
There were no forward contracts as of December 27, 2014.
We actively monitor our foreign currency risks, but there is no guarantee that our foreign currency hedging activities will substantially offset the impact of fluctuations in currency exchange rates on our results of operations, cash flows and financial position.
Interest Rate Risk
Our exposure to market risk resulting from changes in interest rates relates primarily to our investment portfolio. At December 26, 2015, and December 27, 2014, we held $44.9 million and $49.3 million, respectively, in marketable securities. The fair value of our marketable securities could be adversely impacted due to a rise in interest rates, but we do not believe such impact would be material. Securities with longer maturities are subject to a greater interest rate risk than those with shorter maturities and as of December 26, 2015 and December 27, 2014, the average duration of our portfolio was less than nine months. We do not hold securities for trading purposes.
As of December 26, 2015 and December 27, 2014, there were no amounts borrowed against the line of credit and, therefore, there exists no significant interest rate risks.
35
The information required by Item 8 of Form 10-K is presented here in the following order:
INDEX TO CONSOLIDATED FINANCIAL STATEMENTS
|
|
Page |
|
Financial Statements: |
|
|
37 |
|
|
38 |
|
|
39 |
|
|
40 |
|
|
41 |
|
|
42 |
|
|
43 |
|
|
Supplementary Data: |
|
|
68 |
36
Report of Independent Registered Public Accounting Firm
To the Board of Directors and Stockholders of
Nanometrics Incorporated
In our opinion, the accompanying consolidated balance sheets and the related consolidated statements of operations, comprehensive income (loss), stockholders’ equity, and of cash flows present fairly, in all material respects, the financial position of Nanometrics Incorporated and its subsidiaries at December 26, 2015 and December 27, 2014, and the results of their operations and their cash flows for each of the three years in the period ended December 26, 2015, in conformity with accounting principles generally accepted in the United States of America. In addition, in our opinion, the financial statement schedule listed in the accompanying index appearing under Item 15(a)(2) presents fairly, in all material respects, the information set forth therein when read in conjunction with the related consolidated financial statements. Also in our opinion, the Company maintained, in all material respects, effective internal control over financial reporting as of December 26, 2015, based on criteria established in Internal Control - Integrated Framework 2013 issued by the Committee of Sponsoring Organizations of the Treadway Commission (COSO). The Company's management is responsible for these financial statements and financial statement schedule, for maintaining effective internal control over financial reporting and for its assessment of the effectiveness of internal control over financial reporting, included in the accompanying Management's Report on Internal Control over Financial Reporting. Our responsibility is to express opinions on these financial statements, on the financial statement schedule and on the Company's internal control over financial reporting based on our integrated audits. We conducted our audits in accordance with the standards of the Public Company Accounting Oversight Board (United States). Those standards require that we plan and perform the audits to obtain reasonable assurance about whether the financial statements are free of material misstatement and whether effective internal control over financial reporting was maintained in all material respects. Our audits of the financial statements included examining, on a test basis, evidence supporting the amounts and disclosures in the financial statements, assessing the accounting principles used and significant estimates made by management, and evaluating the overall financial statement presentation. Our audit of internal control over financial reporting included obtaining an understanding of internal control over financial reporting, assessing the risk that a material weakness exists, and testing and evaluating the design and operating effectiveness of internal control based on the assessed risk. Our audits also included performing such other procedures as we considered necessary in the circumstances. We believe that our audits provide a reasonable basis for our opinions.
A company’s internal control over financial reporting is a process designed to provide reasonable assurance regarding the reliability of financial reporting and the preparation of financial statements for external purposes in accordance with generally accepted accounting principles. A company’s internal control over financial reporting includes those policies and procedures that (i) pertain to the maintenance of records that, in reasonable detail, accurately and fairly reflect the transactions and dispositions of the assets of the company; (ii) provide reasonable assurance that transactions are recorded as necessary to permit preparation of financial statements in accordance with generally accepted accounting principles, and that receipts and expenditures of the company are being made only in accordance with authorizations of management and directors of the company; and (iii) provide reasonable assurance regarding prevention or timely detection of unauthorized acquisition, use, or disposition of the company’s assets that could have a material effect on the financial statements.
Because of its inherent limitations, internal control over financial reporting may not prevent or detect misstatements. Also, projections of any evaluation of effectiveness to future periods are subject to the risk that controls may become inadequate because of changes in conditions, or that the degree of compliance with the policies or procedures may deteriorate.
/s/PricewaterhouseCoopers LLP
San Jose, California
February 24, 2016
37
NANOMETRICS INCORPORATED
(In thousands except share and per share amounts)
|
|
|
December 26, 2015 |
|
|
December 27, 2014 |
|
||
|
ASSETS |
|
|
|
|
|
|
|
|
|
Current assets: |
|
|
|
|
|
|
|
|
|
Cash and cash equivalents |
|
$ |
38,154 |
|
|
$ |
34,676 |
|
|
Marketable securities |
|
|
44,931 |
|
|
|
49,286 |
|
|
Accounts receivable, net of allowances of $150 and $253, respectively |
|
|
37,832 |
|
|
|
26,121 |
|
|
Inventories |
|
|
47,749 |
|
|
|
35,105 |
|
|
Inventories-delivered systems |
|
|
2,856 |
|
|
|
1,912 |
|
|
Prepaid expenses and other |
|
|
6,592 |
|
|
|
9,289 |
|
|
Deferred income tax assets |
|
|
— |
|
|
|
1,457 |
|
|
Total current assets |
|
|
178,114 |
|
|
|
157,846 |
|
|
Property, plant and equipment, net |
|
|
44,493 |
|
|
|
49,633 |
|
|
Goodwill |
|
|
9,415 |
|
|
|
10,494 |
|
|
Intangible assets, net |
|
|
1,867 |
|
|
|
4,294 |
|
|
Deferred income tax assets |
|
|
1,118 |
|
|
|
410 |
|
|
Other assets |
|
|
533 |
|
|
|
559 |
|
|
Total assets |
|
$ |
235,540 |
|
|
$ |
223,236 |
|
|
LIABILITIES AND STOCKHOLDERS’ EQUITY |
|
|
|
|
|
|
|
|
|
Current liabilities: |
|
|
|
|
|
|
|
|
|
Accounts payable |
|
$ |
11,675 |
|
|
$ |
10,199 |
|
|
Accrued payroll and related expenses |
|
|
10,097 |
|
|
|
8,700 |
|
|
Deferred revenue |
|
|
12,790 |
|
|
|
10,021 |
|
|
Other current liabilities |
|
|
8,878 |
|
|
|
8,265 |
|
|
Income taxes payable |
|
|
1,771 |
|
|
|
1,017 |
|
|
Total current liabilities |
|
|
45,211 |
|
|
|
38,202 |
|
|
Deferred revenue |
|
|
827 |
|
|
|
2,591 |
|
|
Income taxes payable |
|
|
775 |
|
|
|
701 |
|
|
Deferred tax liability |
|
|
521 |
|
|
|
926 |
|
|
Other long-term liabilities |
|
|
878 |
|
|
|
1,279 |
|
|
Total liabilities |
|
|
48,212 |
|
|
|
43,699 |
|
|
Commitments and contingencies (Note 11) |
|
|
|
|
|
|
|
|
|
Stockholders’ equity: |
|
|
|
|
|
|
|
|
|
Preferred stock, $0.001 par value; 3,000,000 shares authorized; no shares issued or outstanding |
|
|
— |
|
|
|
— |
|
|
Common stock, $0.001 par value, 47,000,000 shares authorized: 24,224,286 and 23,813,729, respectively, issued and outstanding |
|
|
24 |
|
|
|
24 |
|
|
Additional paid-in capital |
|
|
258,715 |
|
|
|
251,396 |
|
|
Accumulated deficit |
|
|
(66,209 |
) |
|
|
(69,114 |
) |
|
Accumulated other comprehensive income |
|
|
(5,202 |
) |
|
|
(2,769 |
) |
|
Total stockholders’ equity |
|
|
187,328 |
|
|
|
179,537 |
|
|
Total liabilities and stockholders’ equity |
|
$ |
235,540 |
|
|
$ |
223,236 |
|
See Notes to Consolidated Financial Statements
38
NANOMETRICS INCORPORATED
CONSOLIDATED STATEMENTS OF OPERATIONS
(In thousands except per share amounts)
|
|
|
Years Ended |
|
|||||||||
|
|
|
December 26, 2015 |
|
|
December 27, 2014 |
|
|
December 28, 2013 |
|
|||
|
Net revenues: |
|
|
|
|
|
|
|
|
|
|
|
|
|
Products |
|
$ |
146,945 |
|
|
$ |
133,589 |
|
|
$ |
107,402 |
|
|
Service |
|
|
40,422 |
|
|
|
32,854 |
|
|
|
36,905 |
|
|
Total net revenues |
|
|
187,367 |
|
|
|
166,443 |
|
|
|
144,307 |
|
|
Costs of net revenues: |
|
|
|
|
|
|
|
|
|
|
|
|
|
Cost of products |
|
|
76,224 |
|
|
|
68,812 |
|
|
|
59,509 |
|
|
Cost of service |
|
|
19,450 |
|
|
|
19,086 |
|
|
|
19,489 |
|
|
Amortization of intangible assets |
|
|
2,026 |
|
|
|
2,723 |
|
|
|
2,633 |
|
|
Total costs of net revenues |
|
|
97,700 |
|
|
|
90,621 |
|
|
|
81,631 |
|
|
Gross profit |
|
|
89,667 |
|
|
|
75,822 |
|
|
|
62,676 |
|
|
Operating expenses: |
|
|
|
|
|
|
|
|
|
|
|
|
|
Research and development |
|
|
32,701 |
|
|
|
33,776 |
|
|
|
32,714 |
|
|
Selling |
|
|
28,055 |
|
|
|
27,033 |
|
|
|
27,129 |
|
|
General and administrative |
|
|
22,444 |
|
|
|
23,980 |
|
|
|
22,101 |
|
|
Amortization of intangible assets |
|
|
114 |
|
|
|
420 |
|
|
|
701 |
|
|
Restructuring charge |
|
|
1,380 |
|
|
|
2,266 |
|
|
|
1,740 |
|
|
Total operating expenses |
|
|
84,694 |
|
|
|
87,475 |
|
|
|
84,385 |
|
|
Income (loss) from operations |
|
|
4,973 |
|
|
|
(11,653 |
) |
|
|
(21,709 |
) |
|
Other (income) expense: |
|
|
|
|
|
|
|
|
|
|
|
|
|
Interest income |
|
|
71 |
|
|
|
47 |
|
|
|
62 |
|
|
Interest expense |
|
|
(289 |
) |
|
|
(389 |
) |
|
|
(651 |
) |
|
Other income (expense), net |
|
|
813 |
|
|
|
374 |
|
|
|
(1,267 |
) |
|
Total other income (expense), net |
|
|
595 |
|
|
|
32 |
|
|
|
(1,856 |
) |
|
Income (loss) before income taxes |
|
|
5,568 |
|
|
|
(11,621 |
) |
|
|
(23,565 |
) |
|
Provision for (benefit from) income taxes |
|
|
2,663 |
|
|
|
19,497 |
|
|
|
(9,419 |
) |
|
Net income (loss) |
|
$ |
2,905 |
|
|
$ |
(31,118 |
) |
|
$ |
(14,146 |
) |
|
Net income (loss) per share: |
|
|
|
|
|
|
|
|
|
|
|
|
|
Basic |
|
$ |
0.12 |
|
|
$ |
(1.30 |
) |
|
$ |
(0.61 |
) |
|
Diluted |
|
$ |
0.12 |
|
|
$ |
(1.30 |
) |
|
$ |
(0.61 |
) |
|
Weighted average shares used in per share calculation: |
|
|
|
|
|
|
|
|
|
|
|
|
|
Basic |
|
|
24,059 |
|
|
|
23,958 |
|
|
|
23,290 |
|
|
Diluted |
|
|
24,375 |
|
|
|
23,958 |
|
|
|
23,290 |
|
See Notes to Consolidated Financial Statements
39
NANOMETRICS INCORPORATED
CONSOLIDATED STATEMENTS OF COMPREHENSIVE INCOME (LOSS)
(In thousands)
|
|
|
Year Ended |
|
|||||||||
|
|
|
December 26, 2015 |
|
|
December 27, 2014 |
|
|
December 28, 2013 |
|
|||
|
Net income (loss) |
|
$ |
2,905 |
|
|
$ |
(31,118 |
) |
|
$ |
(14,146 |
) |
|
Other comprehensive income (loss): |
|
|
|
|
|
|
|
|
|
|
|
|
|
Change in foreign currency translation adjustment |
|
|
(2,344 |
) |
|
|
(3,239 |
) |
|
|
(818 |
) |
|
Employee benefit plan adjustment |
|
|
(76 |
) |
|
|
(106 |
) |
|
|
151 |
|
|
Net change on unrealized gains (losses) on available-for-sale investments |
|
|
(13 |
) |
|
|
(36 |
) |
|
|
7 |
|
|
Other comprehensive loss |
|
|
(2,433 |
) |
|
|
(3,381 |
) |
|
|
(660 |
) |
|
Comprehensive income (loss) |
|
$ |
472 |
|
|
$ |
(34,499 |
) |
|
$ |
(14,806 |
) |
See Notes to Consolidated Financial Statements
40
NANOMETRICS INCORPORATED
CONSOLIDATED STATEMENTS OF STOCKHOLDERS’ EQUITY
(In thousands, except share amounts)
|
|
|
Common Stock |
|
|
Additional Paid-In |
|
|
Accumulated |
|
|
Accumulated Other Comprehensive |
|
|
Total Stockholders’ |
|
|||||||||
|
|
|
Shares |
|
|
Amount |
|
|
Capital |
|
|
Deficit |
|
|
Income |
|
|
Equity |
|
||||||
|
Balance as of December 31, 2012 |
|
|
23,250,429 |
|
|
$ |
23 |
|
|
$ |
238,326 |
|
|
$ |
(23,850 |
) |
|
$ |
1,272 |
|
|
$ |
215,771 |
|
|
Net loss |
|
|
— |
|
|
|
— |
|
|
|
— |
|
|
|
(14,146 |
) |
|
|
— |
|
|
|
(14,146 |
) |
|
Employee benefit plan adjustment |
|
|
— |
|
|
|
— |
|
|
|
— |
|
|
|
— |
|
|
|
151 |
|
|
|
151 |
|
|
Foreign currency translation adjustments |
|
|
— |
|
|
|
— |
|
|
|
— |
|
|
|
— |
|
|
|
(818 |
) |
|
|
(818 |
) |
|
Unrealized loss on investments, net of tax |
|
|
— |
|
|
|
— |
|
|
|
— |
|
|
|
— |
|
|
|
7 |
|
|
|
7 |
|
|
Issuance of common stock under stock-based compensation plans |
|
|
619,617 |
|
|
|
1 |
|
|
|
3,733 |
|
|
|
— |
|
|
|
— |
|
|
|
3,734 |
|
|
Stock-based compensation expense |
|
|
— |
|
|
|
— |
|
|
|
7,674 |
|
|
|
— |
|
|
|
— |
|
|
|
7,674 |
|
|
Repurchases and retirement of common stock |
|
|
(332,771 |
) |
|
|
— |
|
|
|
(5,000 |
) |
|
|
— |
|
|
|
— |
|
|
|
(5,000 |
) |
|
Balance as of December 28, 2013 |
|
|
23,537,275 |
|
|
|
24 |
|
|
|
244,733 |
|
|
|
(37,996 |
) |
|
|
612 |
|
|
|
207,373 |
|
|
Net loss |
|
|
|
|
|
|
|
|
|
|
|
|
|
|
(31,118 |
) |
|
|
— |
|
|
|
(31,118 |
) |
|
Employee benefit plan adjustment |
|
|
— |
|
|
|
— |
|
|
|
— |
|
|
|
— |
|
|
|
(106 |
) |
|
|
(106 |
) |
|
Foreign currency translation adjustments |
|
|
— |
|
|
|
— |
|
|
|
— |
|
|
|
— |
|
|
|
(3,239 |
) |
|
|
(3,239 |
) |
|
Unrealized gain on investments, net of tax |
|
|
— |
|
|
|
— |
|
|
|
— |
|
|
|
— |
|
|
|
(36 |
) |
|
|
(36 |
) |
|
Issuance of common stock under stock-based compensation plans |
|
|
639,087 |
|
|
|
— |
|
|
|
5,255 |
|
|
|
— |
|
|
|
— |
|
|
|
5,255 |
|
|
Stock-based compensation expense |
|
|
— |
|
|
|
— |
|
|
|
6,752 |
|
|
|
— |
|
|
|
— |
|
|
|
6,752 |
|
|
Repurchases and retirement of common stock |
|
|
(362,633 |
) |
|
|
— |
|
|
|
(5,344 |
) |
|
|
— |
|
|
|
— |
|
|
|
(5,344 |
) |
|
Balance as of December 27, 2014 |
|
|
23,813,729 |
|
|
|
24 |
|
|
|
251,396 |
|
|
|
(69,114 |
) |
|
|
(2,769 |
) |
|
|
179,537 |
|
|
Net income |
|
|
— |
|
|
|
— |
|
|
|
— |
|
|
|
2,905 |
|
|
|
|
|
|
|
2,905 |
|
|
Employee benefit plan adjustment |
|
|
— |
|
|
|
— |
|
|
|
— |
|
|
|
— |
|
|
|
(76 |
) |
|
|
(76 |
) |
|
Foreign currency translation adjustments |
|
|
— |
|
|
|
— |
|
|
|
— |
|
|
|
— |
|
|
|
(2,344 |
) |
|
|
(2,344 |
) |
|
Unrealized gain on investments, net of tax |
|
|
— |
|
|
|
— |
|
|
|
— |
|
|
|
— |
|
|
|
(13 |
) |
|
|
(13 |
) |
|
Issuance of common stock under stock-based compensation plans |
|
|
521,607 |
|
|
|
— |
|
|
|
2,792 |
|
|
|
— |
|
|
|
— |
|
|
|
2,792 |
|
|
Stock-based compensation expense |
|
|
— |
|
|
|
— |
|
|
|
6,248 |
|
|
|
— |
|
|
|
— |
|
|
|
6,248 |
|
|
Repurchases and retirement of common stock |
|
|
(111,050 |
) |
|
|
— |
|
|
|
(1,721 |
) |
|
|
— |
|
|
|
— |
|
|
|
(1,721 |
) |
|
Balance as of December 26, 2015 |
|
|
24,224,286 |
|
|
$ |
24 |
|
|
$ |
258,715 |
|
|
$ |
(66,209 |
) |
|
$ |
(5,202 |
) |
|
$ |
187,328 |
|
See Notes to Consolidated Financial Statements
41
NANOMETRICS INCORPORATED
CONSOLIDATED STATEMENTS OF CASH FLOWS
(In thousands)
|
|
|
Years Ended |
|
|||||||||
|
|
|
December 26, 2015 |
|
|
December 27, 2014 |
|
|
December 28, 2013 |
|
|||
|
Cash flows from operating activities: |
|
|
|
|
|
|
|
|
|
|
|
|
|
Net income (loss) |
|
$ |
2,905 |
|
|
$ |
(31,118 |
) |
|
$ |
(14,146 |
) |
|
Reconciliation of net income (loss) to net cash provided by (used in) operating activities: |
|
|
|
|
|
|
|
|
|
|
|
|
|
Depreciation and amortization |
|
|
9,075 |
|
|
|
9,767 |
|
|
|
8,787 |
|
|
Stock-based compensation |
|
|
6,248 |
|
|
|
6,752 |
|
|
|
7,674 |
|
|
Excess tax benefit from equity awards |
|
|
— |
|
|
|
— |
|
|
|
53 |
|
|
Disposal of fixed assets |
|
|
1,121 |
|
|
|
249 |
|
|
|
177 |
|
|
Inventory write-down |
|
|
2,645 |
|
|
|
2,897 |
|
|
|
7,579 |
|
|
Deferred income taxes |
|
|
345 |
|
|
|
17,915 |
|
|
|
(6,889 |
) |
|
Changes in fair value of contingent payments to Zygo Corporation |
|
|
(56 |
) |
|
|
201 |
|
|
|
1,325 |
|
|
Changes in assets and liabilities: |
|
|
|
|
|
|
|
|
|
|
|
|
|
Accounts receivable |
|
|
(12,610 |
) |
|
|
3,861 |
|
|
|
(10,376 |
) |
|
Inventories |
|
|
(16,431 |
) |
|
|
(7,173 |
) |
|
|
(7,024 |
) |
|
Inventories-delivered systems |
|
|
(943 |
) |
|
|
4,988 |
|
|
|
(4,627 |
) |
|
Prepaid expenses and other |
|
|
3,271 |
|
|
|
2,303 |
|
|
|
(1,855 |
) |
|
Accounts payable, accrued and other liabilities |
|
|
4,167 |
|
|
|
1,790 |
|
|
|
4,840 |
|
|
Deferred revenue |
|
|
1,006 |
|
|
|
(12,855 |
) |
|
|
12,717 |
|
|
Income taxes payable |
|
|
828 |
|
|
|
(212 |
) |
|
|
(666 |
) |
|
Net cash provided by (used in) operating activities |
|
|
1,571 |
|
|
|
(635 |
) |
|
|
(2,431 |
) |
|
Cash flows from investing activities: |
|
|
|
|
|
|
|
|
|
|
|
|
|
Sales of marketable securities |
|
|
3,383 |
|
|
|
— |
|
|
|
— |
|
|
Maturities of marketable securities |
|
|
41,863 |
|
|
|
38,839 |
|
|
|
47,089 |
|
|
Purchases of marketable securities |
|
|
(41,449 |
) |
|
|
(41,100 |
) |
|
|
(49,182 |
) |
|
Purchases of property, plant and equipment |
|
|
(1,846 |
) |
|
|
(5,792 |
) |
|
|
(5,689 |
) |
|
Net cash provided by (used in) investing activities |
|
|
1,951 |
|
|
|
(8,053 |
) |
|
|
(7,782 |
) |
|
Cash flows from financing activities: |
|
|
|
|
|
|
|
|
|
|
|
|
|
Payments to Zygo Corporation related to acquisition |
|
|
(851 |
) |
|
|
(587 |
) |
|
|
(1,004 |
) |
|
Repayments of debt obligations |
|
|
— |
|
|
|
— |
|
|
|
(5,224 |
) |
|
Proceeds from sale of shares under employee stock option plans and purchase plan |
|
|
3,974 |
|
|
|
5,958 |
|
|
|
4,967 |
|
|
Excess tax benefit from equity awards |
|
|
— |
|
|
|
— |
|
|
|
(53 |
) |
|
Taxes paid on net issuance of stock awards |
|
|
(1,182 |
) |
|
|
(702 |
) |
|
|
(1,181 |
) |
|
Repurchases of common stock |
|
|
(1,721 |
) |
|
|
(5,344 |
) |
|
|
(5,000 |
) |
|
Net cash provided by (used in) financing activities |
|
|
220 |
|
|
|
(675 |
) |
|
|
(7,495 |
) |
|
Effect of exchange rate changes on cash and cash equivalents |
|
|
(264 |
) |
|
|
(726 |
) |
|
|
(442 |
) |
|
Net increase (decrease) in cash and cash equivalents |
|
|
3,478 |
|
|
|
(10,089 |
) |
|
|
(18,150 |
) |
|
Cash and cash equivalents, beginning of period |
|
|
34,676 |
|
|
|
44,765 |
|
|
|
62,915 |
|
|
Cash and cash equivalents, end of period |
|
$ |
38,154 |
|
|
$ |
34,676 |
|
|
$ |
44,765 |
|
|
Supplemental disclosure of cash flow information: |
|
|
|
|
|
|
|
|
|
|
|
|
|
Cash paid for interest |
|
$ |
— |
|
|
$ |
— |
|
|
$ |
232 |
|
|
Cash paid (refund) for income taxes, net |
|
$ |
(826 |
) |
|
$ |
861 |
|
|
$ |
313 |
|
|
Supplemental disclosure of non-cash investing activities: |
|
|
|
|
|
|
|
|
|
|
|
|
|
Transfer of inventory to property, plant and equipment, net |
|
$ |
1,469 |
|
|
$ |
3,275 |
|
|
$ |
3,145 |
|
See Notes to Consolidated Financial Statements
42
NANOMETRICS INCORPORATED
NOTES TO CONSOLIDATED FINANCIAL STATEMENTS
Note 1. Nature of Business, Basis of Presentation and Significant Accounting Policies
Description of Business – Nanometrics Incorporated (“Nanometrics” or the “Company”) and its wholly-owned subsidiaries design, manufacture, market, sell and support optical critical dimension ("OCD"), thin film and overlay dimension metrology and inspection systems used primarily in the manufacturing of semiconductors, solar photovoltaics (“solar PV”) and high-brightness LEDs (“HB-LED”), as well as by customers in the silicon wafer and data storage industries. Nanometrics' metrology systems precisely measure a wide range of film types deposited on substrates during manufacturing to control manufacturing processes and increase production yields in the fabrication of integrated circuits. The Company’s OCD technology is a patented critical dimension measurement technology that is used to precisely determine the dimensions on the semiconductor wafer that directly control the resulting performance of the integrated circuit devices. The thin film metrology systems use a broad spectrum of wavelengths, high-sensitivity optics, proprietary software, and patented technology to measure the thickness and uniformity of films deposited on silicon and other substrates as well as their chemical composition. The overlay metrology systems are used to measure the overlay accuracy of successive layers of semiconductor patterns on wafers in the photolithography process. Nanometrics' inspection systems are used to find defects on patterned and unpatterned wafers at nearly every stage of the semiconductor production flow. The corporate headquarters of Nanometrics is located in Milpitas, California.
Basis of Presentation – The consolidated financial statements include Nanometrics Incorporated and its wholly-owned subsidiaries. All significant intercompany accounts and transactions have been eliminated in consolidation.
Fiscal Year – On October 17, 2014, the Board of Directors of the Company approved a change in the Company's fiscal year from a fiscal year ending on the Saturday closest to December 31 to a 52/53 week fiscal year ending on the last Saturday of the calendar year. All periods presented consisted of a 52-week year.
Use of Estimates – The preparation of financial statements in conformity with accounting principles generally accepted in the United States of America ("U.S. GAAP") requires management to make estimates and assumptions that affect the reported amounts of assets and liabilities and disclosure of contingent assets and liabilities at the date of the financial statements and the reported amounts of revenues and expenses during the reported period. Actual results could differ materially from those estimates. Estimates are used for, but not limited to, revenue recognition, the provision for doubtful accounts, the provision for excess, obsolete, or slow moving inventories, valuation of intangible and long-lived assets, warranty accruals, income taxes, valuation of stock-based compensation, and contingencies.
Foreign Currency Translation – The assets and liabilities of foreign subsidiaries are translated from their respective local functional currencies at exchange rates in effect at the balance sheet date and income and expense accounts are translated at average exchange rates during the reporting period. Resulting translation adjustments are reflected in “Accumulated other comprehensive income,” a component of stockholders’ equity. Foreign currency transaction gains and losses, as well as remeasurement of assets and liabilities denominated in a currency other than the functional currency are reflected in “Other income (expense)” in the consolidated statements of operations in the period incurred, and consists of a $0.5 million gain, a $0.1 million gain and a $0.7 million loss for the years ended December 26, 2015, December 27, 2014, and December 28, 2013, respectively.
Revenue Recognition – The Company derives revenue from the sale of process control metrology systems (“product revenue”) as well as spare part sales, billable service, service contracts, and upgrades (together “service revenue”). Upgrades are a group of parts and/or software that change the existing configuration of a product and are included in service revenue. They are distinguished from product revenue, which consists of complete, advanced process control metrology and inspection systems (the “system(s)”). Nanometrics' systems consist of hardware and software components that function together to deliver the essential functionality of the system. Arrangements for sales of systems often include defined customer-specified acceptance criteria.
In summary, the Company recognizes revenue when persuasive evidence of an arrangement exists, delivery has occurred or services have been rendered, the seller's price is fixed or determinable, and collectability is reasonably assured.
43
NANOMETRICS INCORPORATED
NOTES TO CONSOLIDATED FINANCIAL STATEMENTS – (Continued)
For product sales to existing customers, revenue recognition occurs at the time title and risk of loss transfer to the customer, which usually occurs upon shipment from the Company's manufacturing location, if it can be reliably demonstrated that the product has successfully met the defined customer specified acceptance criteria and all other recognition criteria have been met. For initial sales where the product has not previously met the defined customer specified acceptance criteria, product revenues are recognized upon the earlier of receipt of written customer acceptance or expiration of the contractual acceptance period. In Japan, where contractual terms with the customer specify risk of loss and title transfers upon customer acceptance, revenue is recognized upon receipt of written customer acceptance, provided that all other recognition criteria have been met.
The Company warrants its products against defects in manufacturing. Upon recognition of product revenue, a liability is recorded for anticipated warranty costs. On occasion, customers request a warranty period longer than the Company's standard warranty. In those instances where extended warranty services are separately quoted to the customer, the associated revenue is deferred and recognized as service revenue ratably over the term of the contract. The portion of service contracts and extended warranty services agreements that are uncompleted at the end of any reporting period are included in deferred revenue.
As part of its customer services, the Company sells software that is considered to be an upgrade to a customer's existing systems. These standalone software upgrades are not essential to the tangible product's functionality and are accounted for under software revenue recognition rules which require vendor specific objective evidence ("VSOE") of fair value to allocate revenue in a multiple element arrangement. Revenue from upgrades is recognized when the upgrades are delivered to the customer, provided that all other recognition criteria have been met.
Revenue related to spare parts is recognized upon shipment. Revenue related to billable services is recognized as the services are performed. Service contracts may be purchased by the customer during or after the warranty period and revenue is recognized ratably over the service contract period.
Frequently, the Company delivers products and various services in a single transaction. The Company's deliverables consist of tools, installation, upgrades, billable services, spare parts, and service contracts. The Company's typical multi-element arrangements include a sale of one or multiple tools that include installation and standard warranty. Other arrangements consist of a sale of tools bundled with service elements or delivery of different types of services. The Company's tools, upgrades, and spare parts are generally delivered to customers within a period of up to six months from order date. Installation is usually performed soon after delivery of the tool. The portion of revenue associated with installation is deferred based on relative selling price and that revenue is recognized upon completion of the installation. Billable services are billed on a time and materials basis and performed as requested by customers. Under service contract arrangements, services are provided as needed over the fixed arrangement term, which terms can be up to twelve months. The Company does not grant its customers a general right of return or any refund terms and imposes a penalty on orders cancelled prior to the scheduled shipment date.
The Company regularly evaluates its revenue arrangements to identify deliverables and to determine whether these deliverables are separable into multiple units of accounting. In accordance with revenue recognition guidance, the Company allocates the arrangement consideration among the deliverables based on relative selling prices. The Company has established VSOE for some of its products and services when a substantial majority of selling prices falls within a narrow range when sold separately. For deliverables with no established VSOE, the Company uses best estimate of selling price to determine standalone selling price for such deliverable. The Company does not use third party evidence to determine standalone selling price since this information is not widely available in the market as the Company's products contain a significant element of proprietary technology and the solutions offered differ substantially from competitors. The Company has established a process for developing estimated selling prices, which incorporates historical selling prices, the effect of market conditions, gross margin objectives, pricing practices, as well as entity-specific factors. The Company monitors and evaluates estimated selling price on a regular basis to ensure that changes in circumstances are accounted for in a timely manner.
When certain elements in multiple-element arrangements are not delivered or accepted at the end of a reporting period, the relative selling prices of undelivered elements are deferred until these elements are delivered and/or accepted. If deliverables cannot be accounted for as separate units of accounting, the entire arrangement is accounted for as a single unit of accounting and revenue is deferred until all elements are delivered and all revenue recognition requirements are met.
Business Combinations - The Company allocates the purchase price of acquired companies to the tangible and intangible assets acquired and liabilities assumed based upon their estimated fair values at the acquisition date. The purchase price allocation process
44
NANOMETRICS INCORPORATED
NOTES TO CONSOLIDATED FINANCIAL STATEMENTS – (Continued)
requires management to make significant estimates and assumptions, especially at the acquisition date with respect to intangible assets and inventory acquired. While best estimates and assumptions as a part of the purchase price allocation process are used to accurately value assets acquired and liabilities assumed at the acquisition date, estimates are inherently uncertain and subject to refinement. As a result, during the measurement period, which may be up to one year from the acquisition date, the Company may record adjustments to the assets acquired and liabilities assumed, with the corresponding offset to goodwill. Upon the conclusion of the measurement period or final determination of the values of assets acquired or liabilities assumed, whichever comes first, any subsequent adjustments are recorded in the consolidated statements of operations.
The Company estimates the fair value of inventory acquired by utilizing the net realizable value method which is based on the estimated sales price of the product less appropriate costs to complete and selling costs. Examples of critical estimates in valuing certain intangible assets that were acquired or may be acquired in the future include but are not limited to:
|
|
· |
future expected cash flows from sales of products, services and acquired developed technologies and patents; |
|
|
· |
expected costs to develop the in-process research and development into commercially viable products and estimated cash flows from the projects when completed; |
|
|
· |
the acquired company's customer relationships, as well as assumptions about the estimated useful lives of the relationships; and |
|
|
· |
discount rates. |
Unanticipated events and circumstances may occur that may affect the accuracy or validity of assumptions, estimates or actual results associated with business combinations.
Cash, Cash Equivalents and Marketable Securities – The Company considers all highly liquid investments with original maturities of three months or less, when purchased, to be cash equivalents. Marketable securities are classified as “available-for-sale” and are reported at fair value with unrealized gains and losses reported in stockholders' equity as a component of other comprehensive income. The cost of securities sold is based on the specific identification method. The Company classifies its investments as current based on the nature of the investment and their availability for use in current operations. The Company reviews its investment portfolio quarterly to determine if any securities may be other-than-temporarily impaired due to increased credit risk, changes in industry or sector of a certain instrument or ratings downgrades.
Fair Value of Financial Instruments – Financial instruments include cash and cash equivalents, accounts receivable and accounts payable. Cash equivalents are stated at fair market value based on quoted market prices. The carrying values of accounts receivable and accounts payable approximate their fair values because of the short-term maturity of these financial instruments.
Derivatives – The Company enters into foreign currency forward exchange contracts to protect against currency exchange risks associated with existing assets and liabilities. A foreign currency forward exchange contract acts as a hedge by increasing in value when underlying assets decrease in value or underlying liabilities increase in value due to changes in foreign exchange rates. Conversely, a foreign currency forward exchange contract decreases in value when underlying assets increase in value or underlying liabilities decrease in value due to changes in foreign exchange rates. These forward contracts are not designated as accounting hedges, so the unrealized gains and losses are recognized in other income, net, in advance of the actual foreign currency cash flows with the fair value of these forward contracts being recorded as accrued liabilities or other current assets. The Company does not use forward contracts for trading purposes.
Allowance for Doubtful Accounts – The Company maintains allowances for estimated losses resulting from the inability of its customers to make required payments. Credit limits are established through a process of reviewing the financial history and stability of its customers. Where appropriate and available, the Company obtains credit rating reports and financial statements of customers when determining or modifying their credit limits. The Company regularly evaluates the collectability of its trade receivable balances based on a combination of factors such as the length of time the receivables are past due, customary payment practices in the respective geographies and historical collection experience with customers. The Company believes that its allowance for doubtful accounts adequately reflects the risk associated with its receivables. If the financial conditions of a customer were to deteriorate, resulting in their inability to make payments, the Company may need to record additional allowances, which would result in additional general and administrative expenses being recorded for the period in which such determination was made.
Inventories – Inventories are stated at the lower of cost, which approximates actual cost on a first-in, first-out basis, or market. The Company is exposed to a number of economic and industry factors that could result in portions of inventory becoming either
45
NANOMETRICS INCORPORATED
NOTES TO CONSOLIDATED FINANCIAL STATEMENTS – (Continued)
obsolete or in excess of anticipated usage, or saleable only for amounts that are less than their carrying amounts. These factors include, but are not limited to, technological changes in the market, the Company’s ability to meet changing customer requirements, competitive pressures in products and prices, and the availability of key components from suppliers. The Company has established inventory reserves when conditions exist that suggest that inventory may be in excess of anticipated demand or is obsolete based upon assumptions about future demand for the Company’s products and market conditions. Once a reserve has been established, it is maintained until the part to which it relates is sold or is otherwise disposed of. The Company regularly evaluates its ability to realize the value of inventory based on a combination of factors including the following: historical usage rates, forecasted sales of usage, product end-of-life dates, estimated current and future market values and new product introductions. For demonstration inventory, the Company also considers the age of the inventory and potential cost to refurbish the inventory prior to sale. Demonstration inventory is amortized over its useful life and the amortization expense is included in total inventory write down on the statements of cash flows. When recorded, reserves are intended to reduce the carrying value of the Company’s inventory to its net realizable value. If actual demand for the Company’s products deteriorates, or market conditions are less favorable than those that the Company projects, additional reserves may be required.
Inventories – delivered systems – The Company reflects the cost of systems that were invoiced upon shipment but deferred for revenue recognition purposes separate from its inventory held for sale as “Inventories – delivered systems.”
Property, Plant and Equipment – Property, plant and equipment are stated at cost. Depreciation and amortization is computed using the straight–line method over the following estimated useful lives of the assets:
|
Building and Improvements |
|
5-40 years |
|
Machinery and equipment |
|
3-10 years |
|
Furniture and fixtures |
|
3-10 years |
|
Software |
|
3-7 years |
Goodwill and Intangible Assets – Goodwill is initially recorded when the purchase price paid for an acquisition exceeds the estimated fair value of the net identified tangible and intangible assets acquired. Intangible assets with finite lives are amortized over their respective useful lives on a straight-line basis and are also evaluated annually for impairment or whenever events or circumstances occur which indicate that those assets might be impaired. Goodwill and indefinite lived assets are not amortized but tested annually for impairment. The Company’s impairment review process is completed during the fourth quarter of each year or whenever events, or circumstances occur which indicate that an impairment may have occurred. The Company assesses qualitative factors to determine whether it is more likely than not that the fair value of a reporting unit is less than its carrying value. If, after assessing the qualitative factors, the Company determines that it is not likely that the fair value of a reporting unit is less than its carrying value, then performing the two-step impairment test is unnecessary. However, if the Company concludes otherwise, then it is required to perform the first step of the two-step goodwill impairment test. The first step requires a comparison of the fair value of Nanometrics’ reporting unit to its net book value. If the fair value of the reporting unit is greater than its carrying value, then no impairment is deemed to have occurred. If the fair value is less, then the second step must be performed to determine the amount, if any, of actual impairment. Amortization of intangible assets with finite lives is computed using the straight-line method over the following estimated useful lives of the assets:
|
Developed technology |
|
5-10 years |
|
Customer relationships |
|
2-10 years |
|
Brand name |
|
5-10 years |
|
Patented technology |
|
7-10 years |
|
Trademark |
|
5 years |
Long-Lived Assets – The Company evaluates its long-lived assets for impairment whenever events or changes in circumstances indicate that the carrying amount of an asset may not be recoverable. When the sum of the undiscounted future net cash flows expected to result from the use of the asset and its eventual disposition is less than its carrying amount, impairment may exist. To determine the amount of impairment, the Company compares the fair value of the asset to its carrying value. If the carrying value of the asset exceeds its fair value, an impairment loss equal to the difference is recognized. See Note 7, "Goodwill and Intangible Assets" for further details.
46
NANOMETRICS INCORPORATED
NOTES TO CONSOLIDATED FINANCIAL STATEMENTS – (Continued)
Income Tax Assets and Liabilities – The Company accounts for income taxes such that deferred tax assets and liabilities must be recognized using enacted tax rates for the effect of temporary differences between the book and tax accounting for assets and liabilities. Also, deferred tax assets are reduced by a valuation allowance to the extent that management cannot conclude that it is more likely than not that a portion of the deferred tax asset will be realized in the future. The Company evaluates the deferred tax assets on a continuous basis throughout the year to determine whether or not a valuation allowance is appropriate. Factors used in this determination include future expected income and the underlying asset or liability which generated the temporary tax difference. The income tax provision is primarily impacted by federal statutory rates, state and foreign income taxes and changes in the valuation allowance.
Product Warranties – The Company sells the majority of its products with a twelve months repair or replacement warranty from the date of acceptance, which generally represents the date of shipment. The Company provides an accrual for estimated future warranty costs based upon the historical relationship of warranty costs to the cost of products sold. The estimated future warranty obligations related to product sales are reported in the period in which the related revenue is recognized. The estimated future warranty obligations are affected by the warranty periods, sales volumes, product failure rates, material usage and labor and replacement costs incurred in correcting a product failure. If actual product failure rates, material usage, labor or replacement costs differ from the Company’s estimates, revisions to the estimated warranty obligations would be required. For new product introductions where limited or no historical information exists, the Company may use warranty information from other previous product introductions to guide it in estimating the warranty accrual. The warranty accrual represents the best estimate of the amount necessary to settle future and existing claims on products sold as of the balance sheet date. The Company periodically assesses the adequacy of its recorded warranty reserve and adjusts the amounts in accordance with changes in these factors.
Shipping and Handling Costs – Shipping and handling costs are included as a component of cost of net revenues.
Advertising Costs – The Company expenses advertising costs as incurred. Advertising costs were $0.3 million in 2015, $0.2 million in 2014, and $0.2 million in 2013.
Defined Employee Benefit Plans – The Company maintains a defined benefit pension plan in Taiwan for which current service costs are charged to operations as they accrue based on services rendered by employees during the year. Pension benefit obligations are determined by using management’s actuarial assumptions, including discount rates, assumed asset rates of return, compensation increases and employee turnover rates.
Net Income (Loss) Per Share - Basic net income (loss) per share excludes dilution and is computed by dividing net income (loss) by the number of weighted average common shares outstanding for the period. Diluted net income (loss) per share reflects the potential dilution from outstanding dilutive stock options (using the treasury stock method) restricted stock units subject to vesting and shares issuable under the employee stock purchase plan. In applying the treasury stock method, 0.3 million stock option shares for fiscal year 2015 were included because their effects were anti-dilutive. While these stock option shares are currently anti-dilutive, they could be dilutive in the future. During both fiscal 2014 and 2013, the Company incurred a net loss, therefore, diluted net loss per share excludes 0.4 million shares that were anti-dilutive.
Certain Significant Risks and Uncertainties – Financial instruments that potentially subject us to a concentration of credit risk consist of cash, cash equivalents, marketable securities, and accounts receivable. The Company's cash and cash equivalents are primarily invested in deposit accounts and money market accounts with large financial institutions. At times, these deposits and securities may exceed federally insured limits; however, the Company has not experienced any losses on such accounts. The Company invests its cash not required for use in operations in high credit quality securities based on the Company's investment policy. The Company's investment policy provides guidelines and limits regarding credit quality, investment concentration, investment type, and maturity that the Company believes will provide liquidity while reducing risk of loss of capital. Investments are of a short-term nature and include investments in commercial paper, corporate debt securities, U.S. Treasury, U.S. Government, and U.S. Agency debt.
The Company sells its products primarily to end users in the United States, Asia and Europe and, generally, does not require its customers to provide collateral or other security to support accounts receivable. Management performs ongoing credit evaluations of its customers’ financial condition and maintains an allowance for estimated potential bad debt losses. The Company’s customer base is highly concentrated and historically, a relatively small number of customers have accounted for a significant portion of its revenues. Aggregate revenue from the Company's top five largest customers in 2015, 2014 and 2013 consisted of 69%, 72% and 71%, respectively, of its total net revenues. The Company participates in a dynamic high technology industry and believes that changes in
47
NANOMETRICS INCORPORATED
NOTES TO CONSOLIDATED FINANCIAL STATEMENTS – (Continued)
any of the following areas could have a material adverse effect on its future financial position, results of operations or cash flows: advances and trends in new technologies and industry standards; competitive pressures in the form of new products or price reductions on current products; changes in product mix; changes in the overall demand for products offered; changes in third-party manufacturers; changes in key suppliers; changes in certain strategic relationships or customer relationships; litigation or claims against the Company based on intellectual property, patent, product, regulatory or other factors; fluctuations in foreign currency exchange rates; risk associated with changes in domestic and international economic and/or political regulations; availability of necessary components or sub-assemblies; disruption of manufacturing facilities; and its ability to attract and retain employees necessary to support its growth.
Certain components and sub-assemblies used in the Company’s products are purchased from a sole supplier or a limited group of suppliers. In particular, the Company currently purchases its spectroscopic ellipsometer and robotics used in its advanced measurement systems from a sole supplier or a limited group of suppliers located in the United States. Any shortage or interruption in the supply of any of the components or sub-assemblies used in its products or its inability to procure these components or sub-assemblies from alternate sources on acceptable terms could have a material adverse effect on its business, financial condition and results of operations.
Note 2. Recent Accounting Pronouncements
Recently Issued Accounting Pronouncements
In November 2015, the Financial Accounting Standards Board (“FASB”) issued an accounting standards update that amends existing guidance to require that deferred income tax liabilities and assets be classified as noncurrent in a classified balance sheet, and eliminates the prior guidance which required an entity to separate deferred tax liabilities and assets into a current amount and a noncurrent amount in a classified balance sheet. As permitted, the Company early-adopted this standard in fiscal year 2015 on a prospective basis. No prior periods were retrospectively adjusted.
In July 2015, the FASB issued an accounting standards update which simplifies the measurement of inventory by requiring inventory to be measured at the lower of cost and net realizable value. The new standard applies only to inventories for which cost is determined by methods other than last-in-first-out and the retail inventory method. It is effective for public companies for annual reporting periods beginning after December 15, 2016, and interim periods within those fiscal years. Early adoption is permitted. The Company is currently evaluating the impact of this standard to determine if this guidance will have a material impact on its consolidated financial statements.
In January 2015, the FASB issued an accounting standard update which simplifies income statement classification by removing the concept of extraordinary items from U.S. GAAP. As a result, items that are both unusual and infrequent will no longer be separately reported net of tax after continuing operations. The new standard is effective for the fiscal years, and interim periods within those fiscal years, beginning after December 15, 2015. Early adoption is permitted. The Company does not expect any impact on the adoption of this standard on its consolidated financial statements.
In August 2014, the FASB issued an accounting standard update related to the disclosures around going concern. The new standard provides guidance around management’s responsibility to evaluate whether there are conditions or events that raise substantial doubt about the entity’s ability to continue as a going concern within one year after the date that the financial statements are issued. The new standard is effective for the annual periods and interim periods within those annual periods beginning after December 15, 2016. Early application is permitted. The Company does not expect any impact on the adoption of this standard on its consolidated financial statements.
In May 2014, the FASB issued an accounting standards update which requires an entity to recognize the amount of revenue to which it expects to be entitled for the transfer of promised goods or services to customers. The standard will replace most existing revenue recognition guidance in U.S. GAAP when it becomes effective. In July 2015, the FASB deferred for one year the effective date of the new revenue standard, but early adoption will be permitted. The new standard will be effective for the Company on January 1, 2018. The standard permits the use of either the retrospective or cumulative effect transition method. The Company is evaluating the effect that the standard will have on its consolidated financial statements and related disclosures. The Company has not yet selected a transition method nor has it determined the effect of the standard on its ongoing financial reporting.
48
NANOMETRICS INCORPORATED
NOTES TO CONSOLIDATED FINANCIAL STATEMENTS – (Continued)
In July 2013, the FASB issued an accounting standards update which provides that a liability related to an unrecognized tax benefit would be offset against a deferred tax asset for a net operating loss carryforward, a similar tax loss or a tax credit carryforward if such settlement is required or expected in the event the uncertain tax position is disallowed. In situations in which a net operating loss carryforward, a similar tax loss or a tax credit carryforward is not available at the reporting date under the tax law of the jurisdiction or the tax law of the jurisdiction does not require, and the entity does not intend to use, the deferred tax asset for such purpose, the unrecognized tax benefit will be presented in the financial statements as a liability and will not be combined with deferred tax assets. The amendments should be applied prospectively to all unrecognized tax benefits that exist at the effective date. Retrospective application is permitted. The new standard is effective for fiscal years and interim periods beginning after December 15, 2013. The Company adopted this standard during the three months ended March 29, 2014, resulting in a one-time tax benefit of $0.3 million, a reduction in deferred tax assets of $0.3 million, and a reduction in long-term income taxes payable of $0.6 million.
Note 3. Fair Value Measurements and Disclosures
The Company determines the fair values of its financial instruments based on the fair value hierarchy established in FASB Accounting Standards Codification ("ASC") 820, Fair Value Measurement, which requires an entity to maximize the use of observable inputs and minimize the use of unobservable inputs when measuring fair value. The classification of a financial asset or liability within the hierarchy is based upon the lowest level input that is significant to the fair value measurement. The fair value hierarchy prioritizes the inputs into the following three levels that may be used to measure fair value:
Level 1 — Quoted prices in active markets for identical assets or liabilities.
Level 2 — Inputs other than Level 1 that are observable, either directly or indirectly, such as quoted prices for similar assets and liabilities in active markets or inputs that are observable for the asset or liability, either directly or indirectly through market corroboration, for substantially the full term of the financial instrument.
Level 3 — Unobservable inputs that are supported by little or no market activity and are significant to the fair value of the assets or liabilities. Such unobservable inputs include an estimated discount rate used in the Company's discounted present value analysis of future cash flows, which reflects the Company's estimate of debt with similar terms in the current credit markets. As there is currently minimal activity in such markets, the actual rate could be materially different.
Fair value is defined as the price that would be received upon the sale of an asset or paid to transfer a liability in an orderly transaction between market participants at the measurement date. The standard assumes that the transaction to sell the asset or transfer the liability occurs in the principal or most advantageous market for the asset or liability and establishes that the fair value of an asset or liability shall be determined based on the assumptions that market participants would use in pricing the asset or liability.
49
NANOMETRICS INCORPORATED
NOTES TO CONSOLIDATED FINANCIAL STATEMENTS – (Continued)
The following tables present the Company’s assets and liabilities measured at estimated fair value on a recurring basis, excluding accrued interest components, categorized in accordance with the fair value hierarchy (in thousands), as of the following dates:
|
|
|
December 26, 2015 |
|
|
December 27, 2014 |
|
||||||||||||||||||||||||||
|
|
|
Fair Value Measurements Using Input Types |
|
|
|
|
|
|
Fair Value Measurements Using Input Types |
|
|
|
|
|
||||||||||||||||||
|
|
|
Level 1 |
|
|
Level 2 |
|
|
Level 3 |
|
|
Total |
|
|
Level 1 |
|
|
Level 2 |
|
|
Level 3 |
|
|
Total |
|
||||||||
|
Assets: |
|
|
|
|
|
|
|
|
|
|
|
|
|
|
|
|
|
|
|
|
|
|
|
|
|
|
|
|
|
|
|
|
|
Cash equivalents: |
|
|
|
|
|
|
|
|
|
|
|
|
|
|
|
|
|
|
|
|
|
|
|
|
|
|
|
|
|
|
|
|
|
Money market funds |
|
$ |
590 |
|
|
$ |
— |
|
|
$ |
— |
|
|
$ |
590 |
|
|
$ |
610 |
|
|
$ |
— |
|
|
$ |
— |
|
|
$ |
610 |
|
|
Commercial paper and corporate debt securities |
|
|
— |
|
|
|
4,568 |
|
|
|
— |
|
|
|
4,568 |
|
|
|
— |
|
|
|
— |
|
|
|
— |
|
|
|
— |
|
|
Total cash equivalents |
|
$ |
590 |
|
|
$ |
4,568 |
|
|
$ |
— |
|
|
$ |
5,158 |
|
|
$ |
610 |
|
|
$ |
— |
|
|
$ |
— |
|
|
$ |
610 |
|
|
|
|
|
|
|
|
|
|
|
|
|
|
|
|
|
|
|
|
|
|
|
|
|
|
|
|
|
|
|
|
|
|
|
|
Marketable securities: |
|
|
|
|
|
|
|
|
|
|
|
|
|
|
|
|
|
|
|
|
|
|
|
|
|
|
|
|
|
|
|
|
|
U.S. Treasury, U.S. Government and U.S. Government agency debt securities |
|
|
4,401 |
|
|
|
20,164 |
|
|
|
— |
|
|
|
24,565 |
|
|
|
2,497 |
|
|
|
20,537 |
|
|
|
— |
|
|
|
23,034 |
|
|
Commercial paper, municipal securities and corporate debt securities |
|
|
— |
|
|
|
20,366 |
|
|
|
— |
|
|
|
20,366 |
|
|
|
— |
|
|
|
26,252 |
|
|
|
— |
|
|
|
26,252 |
|
|
Total marketable securities |
|
$ |
4,401 |
|
|
$ |
40,530 |
|
|
$ |
— |
|
|
$ |
44,931 |
|
|
$ |
2,497 |
|
|
$ |
46,789 |
|
|
$ |
— |
|
|
$ |
49,286 |
|
|
|
|
|
|
|
|
|
|
|
|
|
|
|
|
|
|
|
|
|
|
|
|
|
|
|
|
|
|
|
|
|
|
|
|
Total(1) |
|
$ |
4,991 |
|
|
$ |
45,098 |
|
|
$ |
— |
|
|
$ |
50,089 |
|
|
$ |
3,107 |
|
|
$ |
46,789 |
|
|
$ |
— |
|
|
$ |
49,896 |
|
|
|
|
|
|
|
|
|
|
|
|
|
|
|
|
|
|
|
|
|
|
|
|
|
|
|
|
|
|
|
|
|
|
|
|
Liabilities: |
|
|
|
|
|
|
|
|
|
|
|
|
|
|
|
|
|
|
|
|
|
|
|
|
|
|
|
|
|
|
|
|
|
Contingent consideration payable |
|
$ |
— |
|
|
$ |
— |
|
|
$ |
1,490 |
|
|
$ |
1,490 |
|
|
$ |
— |
|
|
$ |
— |
|
|
$ |
2,397 |
|
|
$ |
2,397 |
|
|
(1) |
Excludes $33.0 million and $34.1 million held in operating accounts as of December 26, 2015 and December 27, 2014, respectively. |
The fair values of the marketable securities that are classified as Level 1 in the table above were derived from quoted market prices for identical assets or liabilities in active markets that the Company has the ability to access. The fair value of marketable securities that are classified as Level 2 in the table above were derived from non-binding market consensus prices that were corroborated by observable market data, quoted market prices for similar instruments, or pricing models, such as discounted cash flow techniques with all significant inputs derived from or corroborated by observable market data. There were no transfers of instruments between Level 1, Level 2 and Level 3 during the financial periods presented.
|
Changes in Level 3 liabilities (in thousands) |
|
|
|
|
|
Fair value at December 28, 2013 |
|
$ |
2,783 |
|
|
Payments made to Zygo Corporation |
|
|
(587 |
) |
|
Change in fair value included in earnings |
|
|
201 |
|
|
Fair value at December 27, 2014 |
|
|
2,397 |
|
|
Payments made to Zygo Corporation |
|
|
(851 |
) |
|
Change in fair value included in earnings |
|
|
(56 |
) |
|
Fair value at December 26, 2015 |
|
$ |
1,490 |
|
As of December 26, 2015, the Company had liabilities of $1.5 million resulting from the acquisition of certain assets from Zygo Corporation, a wholly-owned subsidiary of AMETEK, Inc. (“Zygo”), which are measured at fair value on a recurring basis, and changes in fair value recorded in other income (expense), net. Of the $1.5 million of Zygo liabilities at December 26, 2015, $0.9 million was a current liability and $0.6 million was a long-term liability. As of December 27, 2014, the Company had liabilities of $2.4 million resulting from the acquisition of certain assets from Zygo which are measured at fair value on a recurring basis. Of the $2.4 million of Zygo liability at December 27, 2014, $1.4 million was a current liability and $1.0 million was a long-term liability. The fair values of these liabilities were determined using Level 3 inputs using a discounted cash flow model incorporating
50
NANOMETRICS INCORPORATED
NOTES TO CONSOLIDATED FINANCIAL STATEMENTS – (Continued)
assumptions that market participants would use in their estimates of fair value. Some of these assumptions included estimates for discount rate, and timing and the amount of cash flows.
Derivatives
The Company uses foreign currency forward contracts to mitigate variability in gains and losses generated from the re-measurement of certain monetary assets and liabilities denominated in foreign currencies. These derivatives are carried at fair value with changes recorded in other income (expense), net in the consolidated statements of operations. Changes in the fair value of these derivatives are largely offset by re-measurement of the underlying assets and liabilities. The derivatives have maturities of approximately 30 days.
The loss on settlement of forward foreign currency contracts included in the fiscal year ended December 26, 2015, was $0.3 million, and is included in other income (expense), net, in the consolidated statements of operations. There were no forward foreign currency contracts entered into in fiscal 2014.
The following table summarizes the Company’s outstanding derivative instruments on a gross basis as of December 26, 2015:
|
|
|
Notional Principal |
|
|
|
|
|
(in millions) |
|
|
|
Undesignated Hedges: |
|
|
|
|
|
Forward Foreign Currency Contracts |
|
$ |
30.5 |
|
51
NANOMETRICS INCORPORATED
NOTES TO CONSOLIDATED FINANCIAL STATEMENTS – (Continued)
Note 4. Cash and Investments
The following table presents cash, cash equivalents, and available-for-sale investments as of the following dates (in thousands):
|
|
|
December 26, 2015 |
|
|||||||||||||
|
|
|
Amortized Cost |
|
|
Gross Unrealized Gains |
|
|
Gross Unrealized Losses |
|
|
Estimated Fair Market Value |
|
||||
|
|
|
|
|
|
|
|
|
|
|
|
|
|
|
|
|
|
|
Cash |
|
$ |
32,996 |
|
|
$ |
— |
|
|
$ |
— |
|
|
$ |
32,996 |
|
|
Cash equivalents: |
|
|
|
|
|
|
|
|
|
|
|
|
|
|
|
|
|
Money market funds |
|
|
590 |
|
|
|
— |
|
|
|
— |
|
|
|
590 |
|
|
Commercial paper and corporate debt securities |
|
|
4,568 |
|
|
|
— |
|
|
|
— |
|
|
|
4,568 |
|
|
Marketable securities: |
|
|
|
|
|
|
|
|
|
|
|
|
|
|
|
|
|
Commercial paper |
|
|
1,884 |
|
|
|
— |
|
|
|
— |
|
|
|
1,884 |
|
|
U.S. Treasury securities |
|
|
4,411 |
|
|
|
— |
|
|
|
(10 |
) |
|
|
4,401 |
|
|
U.S. Government agency securities |
|
|
20,193 |
|
|
|
1 |
|
|
|
(29 |
) |
|
|
20,165 |
|
|
Municipal securities |
|
|
3,747 |
|
|
|
1 |
|
|
|
(3 |
) |
|
|
3,745 |
|
|
Corporate debt securities |
|
|
14,759 |
|
|
|
— |
|
|
|
(23 |
) |
|
|
14,736 |
|
|
Total cash, cash equivalents, and marketable securities |
|
$ |
83,148 |
|
|
$ |
2 |
|
|
$ |
(65 |
) |
|
$ |
83,085 |
|
|
|
|
|
|
|
|
|
|
|
|
|
|
|
|
|
|
|
|
|
|
December 27, 2014 |
|
|||||||||||||
|
|
|
Amortized Cost |
|
|
Gross Unrealized Gains |
|
|
Gross Unrealized Losses |
|
|
Estimated Fair Market Value |
|
||||
|
Cash |
|
$ |
34,066 |
|
|
$ |
— |
|
|
$ |
— |
|
|
$ |
34,066 |
|
|
Cash equivalents: |
|
|
|
|
|
|
|
|
|
|
|
|
|
|
|
|
|
Money market funds |
|
|
610 |
|
|
|
— |
|
|
|
— |
|
|
|
610 |
|
|
Marketable securities: |
|
|
|
|
|
|
|
|
|
|
|
|
|
|
|
|
|
Commercial paper and corporate debt securities |
|
|
805 |
|
|
|
— |
|
|
|
— |
|
|
|
805 |
|
|
U.S. Treasury securities |
|
|
2,498 |
|
|
|
— |
|
|
|
(1 |
) |
|
|
2,497 |
|
|
U.S. Government agency securities |
|
|
20,556 |
|
|
|
1 |
|
|
|
(19 |
) |
|
|
20,538 |
|
|
Municipal securities |
|
|
3,755 |
|
|
|
1 |
|
|
|
(7 |
) |
|
|
3,749 |
|
|
Corporate debt securities |
|
|
21,722 |
|
|
|
1 |
|
|
|
(26 |
) |
|
|
21,697 |
|
|
Total cash, cash equivalents, and marketable securities |
|
$ |
84,012 |
|
|
$ |
3 |
|
|
$ |
(53 |
) |
|
$ |
83,962 |
|
Available-for-sale marketable securities, readily convertible to cash, with maturity dates of 90 days or less are classified as cash equivalents, while those with maturity dates greater than 90 days are classified as marketable securities within short-term assets. All marketable securities as of December 26, 2015 and December 27, 2014, were available-for-sale and reported at fair value based on the estimated or quoted market prices as of the balance sheet date. Gross realized gain and losses on sale of securities are recorded in other income, net, in our statement of operations. Net realized gain and losses for fiscal 2015, 2014, and 2013 was $0.2 million, $0.2 million and $0.2 million, respectively.
Unrealized gains or losses, net of tax effect, are recorded in accumulated other comprehensive income (loss) within stockholders' equity. Both the gross unrealized gains and gross unrealized losses for the fiscal years ended December 26, 2015, and December 27, 2014 were insignificant and no marketable securities had other than temporary impairment. All marketable securities as of December 26, 2015 and December 27, 2014, had maturity dates of less than two years and were not invested in foreign entities.
Note 5. Accounts Receivable
The Company maintains arrangements under which eligible accounts receivable in Japan are sold without recourse to unrelated third-party financial institutions. These receivables were not included in the consolidated balance sheets as the criteria for sale treatment had been met. After a transfer of financial assets, an entity stops recognizing the financial assets when control has been
52
NANOMETRICS INCORPORATED
NOTES TO CONSOLIDATED FINANCIAL STATEMENTS – (Continued)
surrendered. The agreement met the criteria of a true sale of these assets since the acquiring party retained the title to these receivables and had assumed the risk that the receivables will be collectible. The Company pays administrative fees as well as interest ranging from 1.15% to 1.68% based on the anticipated length of time between the date the sale is consummated and the expected collection date of the receivables sold. The Company sold $15.7 million and $7.7 million of receivables during fiscal years ended December 26, 2015 and December 27, 2014, respectively. There were no material gains or losses on the sale of such receivables. There were no amounts due from such third party financial institutions at December 26, 2015, and December 27, 2014.
Note 6. Financial Statement Components
The following tables provide details of selected financial statement components as of the following dates (in thousands):
|
|
|
At |
|
|||||
|
|
|
December 26, 2015 |
|
|
December 27, 2014 |
|
||
|
Inventories: |
|
|
|
|
|
|
|
|
|
Raw materials and sub-assemblies |
|
$ |
26,784 |
|
|
$ |
19,463 |
|
|
Work in process |
|
|
12,862 |
|
|
|
7,723 |
|
|
Finished goods |
|
|
8,103 |
|
|
|
7,919 |
|
|
Inventories |
|
|
47,749 |
|
|
|
35,105 |
|
|
Inventories-delivered systems |
|
|
2,856 |
|
|
|
1,912 |
|
|
Total inventories |
|
$ |
50,605 |
|
|
$ |
37,017 |
|
|
|
|
|
|
|
|
|
|
|
|
Property, plant and equipment, net:(1) |
|
|
|
|
|
|
|
|
|
Land |
|
$ |
15,569 |
|
|
$ |
15,572 |
|
|
Building and improvements |
|
|
20,158 |
|
|
|
19,641 |
|
|
Machinery and equipment |
|
|
32,995 |
|
|
|
29,456 |
|
|
Furniture and fixtures |
|
|
2,266 |
|
|
|
2,225 |
|
|
Software |
|
|
8,245 |
|
|
|
7,942 |
|
|
Capital in progress |
|
|
1,328 |
|
|
|
3,512 |
|
|
Total property, plant and equipment, gross |
|
|
80,561 |
|
|
|
78,348 |
|
|
Accumulated depreciation and amortization |
|
|
(36,068 |
) |
|
|
(28,715 |
) |
|
Total property, plant and equipment, net |
|
$ |
44,493 |
|
|
$ |
49,633 |
|
|
(1) Total depreciation and amortization expense for the years ended December 26, 2015, December 27, 2014 and December 28, 2013 was $6.9 million, $6.6 million, and $5.4 million, respectively. |
|
|||||||
|
Other Current Liabilities: |
|
|
|
|
|
|
|
|
|
Accrued warranty |
|
$ |
4,504 |
|
|
$ |
2,953 |
|
|
Accrued restructuring |
|
|
256 |
|
|
|
997 |
|
|
Accrued professional services |
|
|
481 |
|
|
|
778 |
|
|
Fair value of current portion of contingent payments to Zygo Corporation related to acquisition |
|
|
945 |
|
|
|
1,385 |
|
|
Other |
|
|
2,692 |
|
|
|
2,152 |
|
|
Total other current liabilities |
|
$ |
8,878 |
|
|
$ |
8,265 |
|
53
NANOMETRICS INCORPORATED
NOTES TO CONSOLIDATED FINANCIAL STATEMENTS – (Continued)
Components of Accumulated Other Comprehensive Income (Loss)
|
|
|
Years Ended |
|
|||||||||||||
|
|
|
Foreign Currency Translations |
|
|
Defined Benefit Pension Plans |
|
|
Unrealized Income (Loss) on Investment |
|
|
Accumulated Other Comprehensive Income |
|
||||
|
Balance as of December 28, 2013 |
|
$ |
635 |
|
|
$ |
(28 |
) |
|
$ |
5 |
|
|
$ |
612 |
|
|
Current period change |
|
|
(3,239 |
) |
|
|
(106 |
) |
|
|
(36 |
) |
|
|
(3,381 |
) |
|
Balance as of December 27, 2014 |
|
|
(2,604 |
) |
|
|
(134 |
) |
|
|
(31 |
) |
|
|
(2,769 |
) |
|
Current period change |
|
|
(2,344 |
) |
|
|
(76 |
) |
|
|
(13 |
) |
|
|
(2,433 |
) |
|
Balance as of December 26, 2015 |
|
$ |
(4,948 |
) |
|
$ |
(210 |
) |
|
$ |
(44 |
) |
|
$ |
(5,202 |
) |
The items above, except for unrealized income (loss) on investment, did not impact the Company’s income tax provision. The amounts reclassified from each component of accumulated other comprehensive income into income statement line items were insignificant.
Note 7. Goodwill and Intangible Assets
The following table summarizes the activity in the Company’s goodwill during the years ended December 26, 2015 and December 27, 2014, respectively (in thousands):
|
Balance as of December 29, 2013 |
|
$ |
11,743 |
|
|
Foreign currency movements |
|
|
(1,249 |
) |
|
Balance as of December 28, 2014 |
|
|
10,494 |
|
|
Foreign currency movements |
|
|
(1,079 |
) |
|
Balance as of December 26, 2015 |
|
$ |
9,415 |
|
There were no business acquisitions made by the Company during fiscal years 2015, 2014 and 2013.
Goodwill Impairment and Long-lived Asset Impairment
The Company’s impairment review process is completed during the fourth quarter of each year, or whenever events or circumstances occur that indicate that an impairment may have occurred. The goodwill impairment assessment involves three tests, Step 0, Step 1 and Step 2. The Company performs a Step 0 test, which involves an initial qualitative assessment to determine whether it is more likely than not that the fair value of a reporting unit is less than its carrying value. If, after assessing the qualitative factors, the Company determines that it is more likely than not that the fair value of a reporting unit is less than its carrying value, then performing the two-step impairment test is necessary. Otherwise, no further testing is necessary.
The Company completed its annual goodwill impairment assessment during the fourth quarter of 2015 by first performing a Step 0 qualitative assessment. As part of this assessment, the Company considered the trading value of the Company's stock, the industry trends, and the Company's sales forecast and products plans. The Company concluded that it was more likely than not that the fair value was more than the carrying values of the Company's reporting unit and therefore did not proceed to the Step 1 goodwill impairment test.
The process of evaluating the potential impairment of long-lived assets is highly subjective and requires significant judgment. In estimating the fair value of these assets, the Company made estimates and judgments about future revenues and cash flows. The Company’s forecasts were based on assumptions that are consistent with the plans and estimates the Company is using to manage its business. Changes in these estimates could change the Company’s conclusion regarding impairment of the long-lived assets and potentially result in future impairment charges for all or a portion of their balance at December 26, 2015. The Company did not record any impairment charges related to goodwill in fiscal year 2015.
54
NANOMETRICS INCORPORATED
NOTES TO CONSOLIDATED FINANCIAL STATEMENTS – (Continued)
The Company assesses if there have been triggers that may require it to evaluate the reasonableness of the remaining estimated useful lives of its intangible assets. No such triggers were identified during fiscal year 2015.
Finite-lived intangible assets are recorded at cost, less accumulated amortization. Finite-lived intangible assets as of December 26, 2015 and December 27, 2014 consisted of the following (in thousands):
|
|
|
December 26, 2015 |
|
|||||||||
|
|
|
Adjusted cost |
|
|
Accumulated amortization |
|
|
Net carrying amount |
|
|||
|
Developed technology |
|
$ |
16,098 |
|
|
$ |
(14,387 |
) |
|
$ |
1,711 |
|
|
Customer relationships |
|
|
9,364 |
|
|
|
(9,364 |
) |
|
|
— |
|
|
Brand names |
|
|
1,927 |
|
|
|
(1,903 |
) |
|
|
24 |
|
|
Patented technology |
|
|
2,252 |
|
|
|
(2,120 |
) |
|
|
132 |
|
|
Trademark |
|
|
80 |
|
|
|
(80 |
) |
|
|
— |
|
|
Total |
|
$ |
29,721 |
|
|
$ |
(27,854 |
) |
|
$ |
1,867 |
|
|
|
|
December 27, 2014 |
|
|||||||||
|
|
|
Adjusted cost |
|
|
Accumulated amortization |
|
|
Net carrying amount |
|
|||
|
Developed technology |
|
$ |
16,950 |
|
|
$ |
(12,991 |
) |
|
$ |
3,959 |
|
|
Customer relationships |
|
|
9,461 |
|
|
|
(9,449 |
) |
|
|
12 |
|
|
Brand names |
|
|
1,927 |
|
|
|
(1,802 |
) |
|
|
125 |
|
|
Patented technology |
|
|
2,252 |
|
|
|
(2,054 |
) |
|
|
198 |
|
|
Trademark |
|
|
80 |
|
|
|
(80 |
) |
|
|
— |
|
|
Total |
|
$ |
30,670 |
|
|
$ |
(26,376 |
) |
|
$ |
4,294 |
|
The amortization of finite-lived intangibles is computed using the straight-line method. Estimated lives of finite-lived intangibles range from two to ten years. Total amortization expense for the fiscal years ended December 26, 2015, December 27, 2014 and December 28, 2013, was $2.1 million, $3.1 million and $3.3 million, respectively.
There were no impairment charges related to intangible assets recorded during the year ended December 26, 2015.
The estimated future amortization expense of finite intangible assets as of December 26, 2015, is as follows (in thousands):
|
Fiscal Years |
|
Amounts |
|
|
|
2016 |
|
$ |
1,455 |
|
|
2017 |
|
|
206 |
|
|
2018 |
|
|
140 |
|
|
2019 |
|
|
66 |
|
|
Thereafter |
|
|
— |
|
|
Total future amortization expense |
|
$ |
1,867 |
|
Note 8. Warranties
Product Warranty – The Company sells the majority of its products with a 12 months repair or replacement warranty from the date of acceptance or shipment date. The Company provides an accrual for estimated future warranty costs based upon the historical relationship of warranty costs to the cost of products sold. The estimated future warranty obligations related to product sales are recorded in the period in which the related revenue is recognized. The estimated future warranty obligations are affected by the warranty periods, sales volumes, product failure rates, material usage, and labor and replacement costs incurred in correcting a product failure. If actual product failure rates, material usage, labor or replacement costs were to differ from the Company’s estimates, revisions to the estimated warranty obligations would be required. For new product introductions where limited or no historical information exists, the Company may use warranty information from other previous product introductions to guide it in estimating its warranty accrual. The warranty accrual represents the best estimate of the amount necessary to settle future and existing claims on
55
NANOMETRICS INCORPORATED
NOTES TO CONSOLIDATED FINANCIAL STATEMENTS – (Continued)
products sold as of the balance sheet date. The Company periodically assesses the adequacy of its reported warranty reserve and adjusts such amounts in accordance with changes in these factors.
Components of the warranty accrual, which were included in the accompanying consolidated balance sheets with other current liabilities, were as follows (in thousands):
|
|
|
Years Ended |
|
|||||
|
|
|
December 26, 2015 |
|
|
December 27, 2014 |
|
||
|
Balance as of beginning of period |
|
$ |
2,953 |
|
|
$ |
3,426 |
|
|
Accruals for warranties issued during period |
|
|
8,332 |
|
|
|
5,987 |
|
|
Settlements during the period |
|
|
(6,781 |
) |
|
|
(6,460 |
) |
|
Balance as of end of period |
|
$ |
4,504 |
|
|
$ |
2,953 |
|
Note. 9. Restructuring
The Company recorded a restructuring charge of approximately $1.4 million in 2015 as a result of its decision to maximize operating effectiveness. This amount includes charges primarily related to employee severance and related costs. As of December 26, 2015, the Company had completed and settled in full all cash payments related to these charges.
The Company recorded a restructuring charge of approximately $2.3 million in 2014 as a result of its decision to consolidate and reorganize certain of its operations, primarily in the U.K. This amount included charges primarily related to employee severance, other expenses (primarily vendor contract termination costs) and early termination costs of a facility lease due to expire in 2017 in the amounts of $0.3 million and $0.8 million, respectively. The Company completed this restructuring plan by March 2015 and does not expect any remaining charges. Other related costs will be recognized as incurred.
As of December 26, 2015 and December 27, 2014, respectively, the components of the Company’s restructuring reserves were included in other current liabilities and were as follows (in thousands):
|
|
|
Employee severance and benefits |
|
|
Facility termination costs |
|
|
Other |
|
|
Total |
|
||||
|
Balance as of December 27, 2014 |
|
$ |
383 |
|
|
$ |
583 |
|
|
$ |
31 |
|
|
$ |
997 |
|
|
Charges |
|
|
1,369 |
|
|
|
— |
|
|
|
11 |
|
|
|
1,380 |
|
|
Cash Payments |
|
|
(1,752 |
) |
|
|
(334 |
) |
|
|
(35 |
) |
|
|
(2,121 |
) |
|
Balance as of December 26, 2015 |
|
$ |
— |
|
|
$ |
249 |
|
|
$ |
7 |
|
|
$ |
256 |
|
|
|
|
Employee severance and benefits |
|
|
Facility termination costs |
|
|
Other |
|
|
Total |
|
||||
|
Balance as of December 28, 2013 |
|
$ |
— |
|
|
$ |
— |
|
|
$ |
— |
|
|
$ |
— |
|
|
Charges |
|
|
1,163 |
|
|
|
784 |
|
|
|
319 |
|
|
|
2,266 |
|
|
Cash Payments |
|
|
(780 |
) |
|
|
(201 |
) |
|
|
(288 |
) |
|
|
(1,269 |
) |
|
Balance as of December 27, 2014 |
|
$ |
383 |
|
|
$ |
583 |
|
|
$ |
31 |
|
|
$ |
997 |
|
Note 10. Line of Credit and Debt Obligations
Line of Credit – On May 30, 2014, the Company amended its revolving line of credit facility to (i) extend the maturity date of such facility by two years to May 30, 2016, and (ii) to increase the minimum amount available to borrow to $12.0 million.
The instrument governing the line of credit facility includes certain financial covenants regarding tangible net worth. The revolving line of credit agreement includes a provision for the issuance of commercial or standby letters of credit by the bank on behalf of the Company. The value of all letters of credit outstanding reduces the total line of credit available. The revolving line of credit is collateralized by a blanket lien on all of the Company’s domestic assets excluding intellectual property and real estate. The minimum borrowing interest rate is 3.00% per annum. Borrowing is limited to the lesser of (a) $12.0 million plus the borrowing base,
56
NANOMETRICS INCORPORATED
NOTES TO CONSOLIDATED FINANCIAL STATEMENTS – (Continued)
or (b) $20.0 million. The total borrowing base available as of December 26, 2015 was $16.7 million. As of December 26, 2015, the Company was not in breach of any restrictive covenants in connection with this line of credit. There were no outstanding amounts drawn on this facility as of December 26, 2015. Although management has no current plans to request advances under this credit facility, the Company may use the proceeds of any future borrowing for general corporate purposes, future acquisitions or expansion of the Company’s business.
Note 11. Commitments and Contingencies
Intellectual Property Indemnification Obligations – The Company will, from time to time, in the normal course of business, agree to indemnify certain customers, vendors or others against third party claims that Nanometrics’ products, when used for their intended purpose(s), or the Company’s intellectual property, infringe the intellectual property rights of such third parties or other claims made against parties with whom it enters into contractual relationships. It is not possible to determine the maximum potential amount of liability under these indemnification obligations due to the limited history of prior indemnification claims and the unique facts and circumstances that are likely to be involved in each particular claim. Historically, the Company has not made payments under these obligations and believes that the estimated fair value of these agreements is immaterial. Accordingly, no liabilities have been recorded for these obligations in the accompanying consolidated balance sheets as of December 26, 2015 and December 27, 2014.
The Company maintains certain open inventory purchase agreements with its suppliers to ensure a smooth and continuous supply availability for key components. The Company’s liability under these purchase commitments is generally restricted to a forecasted time-horizon as mutually agreed upon between the parties. This forecasted time-horizon can vary among different suppliers. The Company estimates its open inventory purchase commitment as of December 26, 2015 was approximately $24.9 million. Actual expenditures will vary based upon the volume of the transactions and length of contractual service provided. In addition, the amounts paid under these arrangements may be less in the event that the arrangements are renegotiated or cancelled.
The Company leases facilities and certain equipment under non-cancelable operating leases. Rent expense, which is recorded on a straight-line basis over the term of the respective lease, for 2015, 2014 and 2013, was approximately $1.7 million, $2.0 million and $2.2 million, respectively. Future minimum lease payments under its operating leases are as follows (in thousands):
|
|
|
Operating Leases |
|
|
|
2016 |
|
$ |
1,372 |
|
|
2017 |
|
|
733 |
|
|
2018 |
|
|
407 |
|
|
2019 |
|
|
311 |
|
|
Thereafter |
|
|
— |
|
|
Total |
|
$ |
2,823 |
|
On June 17, 2009, the Company announced a strategic business partnership with Zygo Corporation whereby it has purchased inventory and certain other assets from Zygo Corporation, and the two companies entered into a supply agreement. The Company will make payments to Zygo Corporation (with an estimated present value of $1.5 million and an estimated future value of $1.8 million as of December 26, 2015) over a period of time as acquired inventory is sold and other aspects of the supply agreement are executed.
57
NANOMETRICS INCORPORATED
NOTES TO CONSOLIDATED FINANCIAL STATEMENTS – (Continued)
Note 12. Net Income (Loss) Per Share
The Company presents both basic and diluted net income (loss) per share on the face of its consolidated statements of operations. Basic net income (loss) per share excludes the effect of potentially dilutive shares and is computed by dividing net income (loss) by the weighted-average number of shares of common stock outstanding for the period. Diluted net income (loss) per share is computed using the weighted-average number of shares of common stock outstanding for the period plus the effect to all potentially dilutive common shares outstanding during the period, including contingently issuable shares and certain stock options, calculated using the treasury stock method. A reconciliation of the share denominator of the basic and diluted net income (loss) per share computations is as follows (in thousands):
|
|
|
Years Ended |
|
|||||||||
|
|
|
December 26, 2015 |
|
|
December 27, 2014 |
|
|
December 28, 2013 |
|
|||
|
Weighted average common shares outstanding used in basic net income (loss) per share calculation |
|
|
24,059 |
|
|
|
23,958 |
|
|
|
23,290 |
|
|
Potential dilutive common stock equivalents, using treasury stock method |
|
|
316 |
|
|
|
— |
|
|
|
— |
|
|
Weighted average shares used in diluted net income (loss) per share calculation |
|
|
24,375 |
|
|
|
23,958 |
|
|
|
23,290 |
|
For the year ended December 26, 2015, December 27, 2014, and December 28, 2013, the Company had securities outstanding which could potentially dilute basic earnings per share in the future. For the year ended December 26, 2015, weighted average common share equivalents consisting of stock options and restricted stock units included in the calculation of diluted net income per share were 0.3 million shares. For the years ended December 27, 2014 and December 28, 2013 potential dilutive common stock equivalents of 0.4 million shares and 0.4 million shares, respectively, were anti-dilutive and therefore were excluded from the calculation due to the net loss positions.
Note 13. Stockholders' Equity and Stock-Based Compensation
Stockholders' Equity
Preferred and Common Stock
The authorized capital stock of Nanometrics consists of 47,000,000 shares of common stock, par value $0.001 per share, and 3,000,000 shares of preferred stock, par value $0.001 per share.
Stock Repurchase
On May 29, 2012, the Company's Board of Directors approved a program to repurchase up to $20.0 million of its common stock, referred to as the 2012 program. Stock repurchases under this program may be made through open market and privately negotiated transactions, at times and in such amounts as management deems appropriate. The timing and actual number of shares repurchased is dependent on a variety of factors including price, corporate and regulatory requirements and other market conditions. Shares repurchased and retired for the indicated periods of the applicable repurchase programs with the associated cost of repurchase and amount available for repurchase at the end of the respective periods are as follows (in thousands, except number of shares and weighted average price per share):
|
|
|
Fiscal Year 2015 |
|
|
Fiscal Year 2014 |
|
|
Fiscal Year 2013 |
|
|||
|
Number of shares of common stock repurchased |
|
|
111,050 |
|
|
|
362,633 |
|
|
|
332,771 |
|
|
Weighted average price per share |
|
$ |
15.49 |
|
|
$ |
14.74 |
|
|
$ |
15.03 |
|
|
Total cost of repurchase |
|
$ |
1,721 |
|
|
$ |
5,344 |
|
|
$ |
5,000 |
|
|
Amount available for repurchase at end of period |
|
$ |
4,397 |
|
|
$ |
6,118 |
|
|
$ |
11,462 |
|
$4.4 million remained available for the future repurchase of our common stock under the 2012 program.
58
NANOMETRICS INCORPORATED
NOTES TO CONSOLIDATED FINANCIAL STATEMENTS – (Continued)
Stock Option Plans
The Nanometrics option plans are as follows:
|
Plan Name |
|
Participants |
|
Shares Authorized |
|
|
|
2005 Equity Incentive Plan |
|
Employees, consultants and directors |
|
|
7,292,594 |
|
|
2002 Non-statutory Stock Option Plan |
|
Employees and consultants |
|
|
1,200,000 |
|
|
2000 Employee Stock Option Plan |
|
Employees and consultants |
|
|
2,450,000 |
|
|
2000 Director Stock Option Plan |
|
Non-employee directors |
|
|
250,000 |
|
|
Accent Optical Technologies, Inc. Stock Incentive Plan |
|
Employees and consultants |
|
|
205,003 |
|
Employee Stock Purchase Plan
Under the 2003 Employee Stock Purchase Plan (“ESPP”), eligible employees are allowed to have salary withholdings of up to 10% of their base compensation to purchase shares of common stock at a price equal to 85% of the lower of the market value of the stock at the beginning or end of each six-month offering period, subject to an annual statutory limitation. At the end of the fiscal year ended December 26, 2015, the Company had 0.3 million shares remaining for issuance under the ESPP. Shares purchased under the ESPP were 125,504 shares, 122,112 shares and 126,068 shares in 2015, 2014 and 2013 at a weighted average price of $13.98, $13.76 and $12.36, respectively.
Stock-based Compensation
The Company measures and recognizes compensation expense for all share-based payment awards made to employees and directors including employee stock options, restricted stock units and employee stock purchases related to the Employee Stock Purchase Plan (collectively “Employee Stock Purchases”) based on estimated fair values. The fair value of share-based payment awards is estimated on the date of grant using an option-pricing model. The value of the portion of the award that is ultimately expected to vest is recognized as expense over the requisite service periods in the Company's consolidated statement of operations.
Stock-based compensation expense recognized during the period is based on the value of the portion of share-based payment awards that is ultimately expected to vest during the period. As stock-based compensation expense recognized in the consolidated statement of operations for the years ended December 26, 2015, December 27, 2014 and December 28, 2013 is based on awards expected to vest, it has been reduced for estimated forfeitures. ASC 740 requires forfeitures to be estimated at the time of grant and revised, if necessary, in subsequent periods if actual forfeitures differ from those estimates. The Company's estimated forfeiture rates are based on historical forfeiture experience, which the Company believes is the best available information to estimate the future forfeiture rate. Tax benefits resulting from tax deductions in excess of the compensation cost recognized for those options are required to be separately classified in the consolidated statements of cash flows. The Company recognized zero, zero and $0.1 million of excess tax benefit in fiscal years 2015, 2014 and 2013, respectively.
Valuation and Expense Information
The fair value of stock-based awards to employees is calculated using the Black-Scholes option pricing model, which requires subjective assumptions, including future stock price volatility and expected time to exercise. The expected life of options granted were calculated using the simplified method allowed by the SAB 107. The risk-free rates were based on the U.S Treasury rates in effect during the corresponding period of grant. The expected volatility were based on the historical volatility of the Company's stock price. These factors could change in the future, which would affect the stock-based compensation expense in future periods.
59
NANOMETRICS INCORPORATED
NOTES TO CONSOLIDATED FINANCIAL STATEMENTS – (Continued)
The weighted-average fair value of stock-based compensation to employees is based on the single option valuation approach. Forfeitures are estimated and it is assumed no dividends will be declared. The estimated fair value of stock-based compensation awards to employees is amortized over the vesting period of the options. The weighted-average fair value calculations are based on the following average assumptions:
|
|
|
Fiscal Year 2015 |
|
|
Fiscal Year 2014 |
|
|
Fiscal Year 2013 |
|
|||
|
Stock Options: |
|
|
|
|
|
|
|
|
|
|
|
|
|
Expected life |
|
|
— |
|
|
4.6 years |
|
|
4.5 years |
|
||
|
Volatility |
|
|
— |
|
|
|
54.9 |
% |
|
|
69.9 |
% |
|
Risk free interest rate |
|
|
— |
|
|
|
1.54 |
% |
|
|
1.05 |
% |
|
Dividends |
|
|
— |
|
|
|
— |
|
|
|
— |
|
|
Employee Stock Purchase Plan: |
|
|
|
|
|
|
|
|
|
|
|
|
|
Expected life |
|
0.5 years |
|
|
0.5 years |
|
|
0.5 years |
|
|||
|
Volatility |
|
|
36.9 |
% |
|
|
31.2 |
% |
|
|
26.8 |
% |
|
Risk free interest rate |
|
|
0.12 |
% |
|
|
0.54 |
% |
|
|
0.11 |
% |
|
Dividends |
|
|
— |
|
|
|
— |
|
|
|
— |
|
Stock Options and Restricted Stock Units (“RSUs”)
On May 24, 2013, the Company approved further amendments to the 2005 Equity Incentive Plan including: increasing the number of shares of common stock authorized by 2.6 million shares, changing the multiplier ratio from 2:1 to 1.7:1 against the plan for each award, other than a stock option or stock appreciation right, and providing the maximum term of stock options to be seven years. All other terms remained the same.
Stock Options
The weighted average fair value per share of the stock options awarded in fiscal years 2014 and 2013 was $8.13 and $8.58, respectively. No stock options were granted in 2015. A summary of activity of stock options in 2015 is as follows:
|
|
|
Number of Shares Outstanding (Options) |
|
|
Weighted Average Exercise Price |
|
|
Weighted Average Remaining Contractual Term (Years) |
|
|
Aggregate Intrinsic Value (in Thousands) |
|
||||
|
Options |
|
|
|
|
|
|
|
|
|
|
|
|
|
|
|
|
|
Outstanding at December 27, 2014 |
|
|
1,382,993 |
|
|
$ |
13.92 |
|
|
|
3.41 |
|
|
$ |
4,108 |
|
|
Exercised |
|
|
(229,510 |
) |
|
$ |
9.65 |
|
|
|
|
|
|
|
|
|
|
Granted |
|
|
— |
|
|
$ |
— |
|
|
|
- |
|
|
$ |
— |
|
|
Cancelled |
|
|
(94,012 |
) |
|
$ |
16.67 |
|
|
|
|
|
|
|
|
|
|
Outstanding at December 26, 2015 |
|
|
1,059,471 |
|
|
$ |
14.61 |
|
|
|
2.47 |
|
|
$ |
1,920 |
|
|
Exercisable at December 26, 2015 |
|
|
926,415 |
|
|
$ |
14.36 |
|
|
|
2.15 |
|
|
$ |
1,879 |
|
The aggregate intrinsic value in the above table represents the total pretax intrinsic value, based on the Company’s closing stock price of $15.79 as of December 26, 2015, which would have been received by the option holders had all option holders exercised their options as of that date. The total intrinsic value of options exercised during 2015, 2014 and 2013 was $1.6 million, $3.0 million and $2.9 million, respectively. The fair value of options vested during 2015, 2014 and 2013 was $1.5 million, $3.2 million and $3.7 million, respectively.
60
NANOMETRICS INCORPORATED
NOTES TO CONSOLIDATED FINANCIAL STATEMENTS – (Continued)
The following table summarizes ranges of outstanding and exercisable options as of December 26, 2015.
|
|
|
Options Outstanding |
|
|
Options Exercisable |
|
||||||||||||||
|
Exercise Prices |
|
Number Outstanding |
|
|
Weighted Average Remaining Contractual Life (Years) |
|
|
Weighted Average Exercise Price |
|
|
Number Exercisable |
|
|
Weighted Average Exercise Price |
|
|||||
|
$2.38-$10.46 |
|
|
134,762 |
|
|
|
0.90 |
|
|
$ |
7.84 |
|
|
|
134,762 |
|
|
$ |
7.8400 |
|
|
$10.83-$11.17 |
|
|
14,156 |
|
|
|
1.30 |
|
|
$ |
10.93 |
|
|
|
14,156 |
|
|
$ |
1.9279 |
|
|
$11.37-$11.37 |
|
|
114,166 |
|
|
|
1.89 |
|
|
$ |
11.37 |
|
|
|
114,166 |
|
|
$ |
11.3700 |
|
|
$12.98-$14.8 |
|
|
111,259 |
|
|
|
2.62 |
|
|
$ |
13.67 |
|
|
|
94,579 |
|
|
$ |
13.6200 |
|
|
$14.88-$15.65 |
|
|
111,967 |
|
|
|
3.84 |
|
|
$ |
15.44 |
|
|
|
78,894 |
|
|
$ |
15.4300 |
|
|
$15.74-$15.98 |
|
|
161,850 |
|
|
|
1.81 |
|
|
$ |
15.91 |
|
|
|
143,100 |
|
|
$ |
15.9200 |
|
|
$16.00-$16.50 |
|
|
41,804 |
|
|
|
4.76 |
|
|
$ |
16.43 |
|
|
|
23,190 |
|
|
$ |
16.4200 |
|
|
$16.70-$16.7 |
|
|
186,434 |
|
|
|
1.86 |
|
|
$ |
16.70 |
|
|
|
186,434 |
|
|
$ |
16.7000 |
|
|
$16.89-$18.51 |
|
|
123,773 |
|
|
|
4.22 |
|
|
$ |
17.82 |
|
|
|
80,931 |
|
|
$ |
17.8300 |
|
|
$18.79-$19.84 |
|
|
59,300 |
|
|
|
2.98 |
|
|
$ |
19.12 |
|
|
|
56,203 |
|
|
$ |
19.1300 |
|
|
$2.38-$19.84 |
|
|
1,059,471 |
|
|
|
2.47 |
|
|
$ |
14.61 |
|
|
|
926,415 |
|
|
$ |
14.3600 |
|
As of December 26, 2015, the total unrecognized compensation costs related to unvested stock options was $0.6 million and is expected to be recognized as an expense over a weighted average remaining amortization period of 1.58 years.
Restricted Stock Units (“RSUs”)
Each RSU counts against the Company’s “2005 Equity Incentive Plan” at a ratio of one and seven tenths shares for each unit granted but represents an amount equal to the fair value of one share of the Company’s common stock. The Company granted 506,459 and 473,600 RSUs during the years ended December 26, 2015 and December 27, 2014, respectively, to key employees with vesting periods up to three years.
A summary of activity for RSUs is as follows:
|
Summary of activity for RSUs |
|
Number of RSUs |
|
|
Weighted Average Fair Value |
|
||
|
Outstanding RSUs as of December 27, 2014 |
|
|
563,337 |
|
|
$ |
17.90 |
|
|
Granted |
|
|
506,459 |
|
|
$ |
15.62 |
|
|
Released |
|
|
(237,520 |
) |
|
$ |
16.59 |
|
|
Cancelled |
|
|
(119,033 |
) |
|
$ |
16.59 |
|
|
Outstanding RSUs as of December 26, 2015 |
|
|
713,243 |
|
|
$ |
15.99 |
|
As of December 26, 2015, the total unrecognized compensation costs related to RSU's was $6.9 million and is expected to be recognized as an expense over a weighted average remaining amortization period of 1.95 years.
61
NANOMETRICS INCORPORATED
NOTES TO CONSOLIDATED FINANCIAL STATEMENTS – (Continued)
Market-Based Performance Stock Units (“PSUs”)
In March 2015, in addition to granting RSUs that vest on the passage of time only, the Company granted PSUs to an executive. The PSUs will vest in three equal tranches over one, two and three years based on the relative performance of the Company’s stock during those periods, compared to a peer group over the same period. If a target stock price performance is achieved, 40,000 shares of the Company’s common stock will vest, and up to a maximum of 60,000 shares will vest if the maximum stock price performance is achieved for each tranche.
Valuation of PSUs
On the date of grant, the Company estimated the fair value of PSUs using a Monte Carlo simulation model. The assumptions for the valuation of PSUs are summarized as follows:
|
|
|
2015 Award |
|
|
|
Number of PSUs granted and outstanding as of December 26, 2015 |
|
|
40,000 |
|
|
Grant Date Fair Value Per Share |
|
$ |
18.35 |
|
|
Weighted-average assumptions/inputs: |
|
|
|
|
|
Expected Divident |
|
|
— |
|
|
Range of risk-free interest rates |
|
0.25%-1.1% |
|
|
|
Range of expected volatilities for peer group |
|
23%-65% |
|
|
The number of RSUs granted during fiscal year 2015 was 506,459, which counted as 860,980 shares against the 2005 Equity Incentive Plan. The number of RSUs cancelled during fiscal year 2015 was 119,033, which counted as 202,356 shares against the 2005 Equity Incentive Plan. Each RSU represents an amount equal to the fair value of one share of the Company's common stock.
A summary of activity under the Company’s stock option plans including options and RSUs during fiscal year 2015, 2014 and 2013 and shares available for grant as of the respective period end dates, is as follows:
|
|
|
Fiscal Year 2015 |
|
|
Fiscal Year 2014 |
|
|
Fiscal Year 2013 |
|
|||
|
Shares available for grant at beginning of fiscal year |
|
|
2,464,082 |
|
|
|
2,937,001 |
|
|
|
1,093,565 |
|
|
Increase in authorized shares |
|
|
— |
|
|
|
— |
|
|
|
2,600,000 |
|
|
Options - granted |
|
|
— |
|
|
|
(74,300 |
) |
|
|
(430,800 |
) |
|
Options - cancelled |
|
|
94,012 |
|
|
|
191,061 |
|
|
|
150,459 |
|
|
Options - expired plan shares |
|
|
(1,800 |
) |
|
|
(17,491 |
) |
|
|
(53,607 |
) |
|
RSUs – granted |
|
|
(860,980 |
) |
|
|
(805,120 |
) |
|
|
(664,902 |
) |
|
RSUs – cancelled |
|
|
202,356 |
|
|
|
167,404 |
|
|
|
133,418 |
|
|
RSUs - shares issued to satisfy tax withholding obligations |
|
|
120,919 |
|
|
|
65,527 |
|
|
|
108,868 |
|
|
PSUs – granted |
|
|
(68,000 |
) |
|
|
— |
|
|
|
— |
|
|
Shares available for grant at end of fiscal year |
|
|
1,950,589 |
|
|
|
2,464,082 |
|
|
|
2,937,001 |
|
62
NANOMETRICS INCORPORATED
NOTES TO CONSOLIDATED FINANCIAL STATEMENTS – (Continued)
Stock-based Compensation Expense
Stock-based compensation expense for all share-based payment awards made to the Company’s employees and directors pursuant to the employee stock option and employee stock purchase plans by function were as follows (in thousands):
|
|
|
Fiscal Year 2015 |
|
|
Fiscal Year 2014 |
|
|
Fiscal Year 2013 |
|
|||
|
Cost of products |
|
$ |
274 |
|
|
$ |
268 |
|
|
$ |
207 |
|
|
Cost of service |
|
|
309 |
|
|
|
287 |
|
|
|
278 |
|
|
Research and development |
|
|
1,036 |
|
|
|
1,245 |
|
|
|
1,478 |
|
|
Selling |
|
|
1,881 |
|
|
|
1,642 |
|
|
|
1,894 |
|
|
General and administrative |
|
|
2,748 |
|
|
|
3,243 |
|
|
|
2,919 |
|
|
Restructuring |
|
|
— |
|
|
|
67 |
|
|
|
898 |
|
|
Total stock-based compensation expense related to employee stock options and employee stock purchases |
|
$ |
6,248 |
|
|
$ |
6,752 |
|
|
$ |
7,674 |
|
Note 14. Defined Benefit Pension Plan
Nanometrics sponsors a statutory government mandated defined benefit pension plan (the “Benefit Plan”) in Taiwan for its local employees. The fair value of plan assets was $0.2 million for each of the fiscal years ended 2015, 2014 and 2013, respectively; and the net funding deficiency of the Benefit Plan was $0.3 million, $0.3 million, and $0.2 million for the fiscal years ended December 26, 2015, December 27, 2014, and December 28, 2013, respectively. Based on the nature and limited extent of the pension plan, we determined this pension plan was not material for separate disclosure.
Note 15. Income Taxes
Income Tax Assets and Liabilities - The Company accounts for income taxes whereby deferred tax assets and liabilities are recognized using enacted tax rates for the effect of temporary differences between the book and tax accounting for assets and liabilities. Also, deferred tax assets are reduced by a valuation allowance to the extent that management cannot conclude that it is more likely than not that a portion of the deferred tax asset will be realized in the future. The Company evaluates the deferred tax assets on a continuous basis throughout the year to determine whether or not a valuation allowance is appropriate. Factors used in this determination include future expected income and the underlying asset or liability which generated the temporary tax difference. The income tax provision is primarily impacted by federal statutory rates, state and foreign income taxes, and changes in the valuation allowance.
Income (loss) before provision for income taxes consists of the following (in thousands):
|
|
|
Years Ended |
|
|||||||||
|
|
|
December 26, 2015 |
|
|
December 27, 2014 |
|
|
December 28, 2013 |
|
|||
|
Domestic |
|
$ |
178 |
|
|
$ |
(15,691 |
) |
|
$ |
(26,447 |
) |
|
Foreign |
|
|
5,390 |
|
|
|
4,070 |
|
|
|
2,882 |
|
|
Income (loss) before income taxes |
|
$ |
5,568 |
|
|
$ |
(11,621 |
) |
|
$ |
(23,565 |
) |
63
NANOMETRICS INCORPORATED
NOTES TO CONSOLIDATED FINANCIAL STATEMENTS – (Continued)
The provision (benefit) for income taxes consists of the following (in thousands):
|
|
|
Years Ended |
|
|||||||||
|
|
|
December 26, 2015 |
|
|
December 27, 2014 |
|
|
December 28, 2013 |
|
|||
|
Current: |
|
|
|
|
|
|
|
|
|
|
|
|
|
Federal |
|
$ |
148 |
|
|
$ |
358 |
|
|
$ |
119 |
|
|
State |
|
|
3 |
|
|
|
(151 |
) |
|
|
5 |
|
|
Foreign |
|
|
2,266 |
|
|
|
1,327 |
|
|
|
933 |
|
|
|
|
|
2,417 |
|
|
|
1,534 |
|
|
|
1,057 |
|
|
Deferred: |
|
|
|
|
|
|
|
|
|
|
|
|
|
Federal |
|
|
190 |
|
|
|
17,368 |
|
|
|
(10,686 |
) |
|
State |
|
|
3 |
|
|
|
550 |
|
|
|
(325 |
) |
|
Foreign |
|
|
53 |
|
|
|
45 |
|
|
|
535 |
|
|
|
|
|
246 |
|
|
|
17,963 |
|
|
|
(10,476 |
) |
|
Provision (benefit) for income taxes |
|
$ |
2,663 |
|
|
$ |
19,497 |
|
|
$ |
(9,419 |
) |
Significant components of the Company's deferred tax assets and liabilities are as follows (in thousands):
|
|
|
At |
|
|||||
|
|
|
December 26, 2015 |
|
|
December 27, 2014 |
|
||
|
Deferred tax assets: |
|
|
|
|
|
|
|
|
|
Reserves and accruals |
|
$ |
13,712 |
|
|
$ |
10,744 |
|
|
Deferred revenue |
|
|
1,154 |
|
|
|
1,370 |
|
|
Shared based compensation |
|
|
3,856 |
|
|
|
4,030 |
|
|
Tax credit carry-forwards |
|
|
8,658 |
|
|
|
8,122 |
|
|
Net operating losses |
|
|
13,218 |
|
|
|
14,695 |
|
|
Depreciation & amortization |
|
|
366 |
|
|
|
2,750 |
|
|
Other |
|
|
94 |
|
|
|
372 |
|
|
Total deferred tax assets |
|
|
41,058 |
|
|
|
42,083 |
|
|
Less: Valuation allowance |
|
|
(36,786 |
) |
|
|
(35,835 |
) |
|
Total deferred tax assets net of valuation allowance |
|
|
4,272 |
|
|
|
6,248 |
|
|
Deferred tax liabilities: |
|
|
|
|
|
|
|
|
|
Depreciation & amortization |
|
|
(2,537 |
) |
|
|
(4,020 |
) |
|
Other |
|
|
(1,137 |
) |
|
|
(1,485 |
) |
|
Total deferred tax liabilities |
|
|
(3,674 |
) |
|
|
(5,505 |
) |
|
Net deferred tax assets |
|
$ |
598 |
|
|
$ |
743 |
|
As of December 26, 2015, the Company had net operating loss carryforwards of $9.9 million for federal, $39.5 million in California and $38.5 million in foreign countries, which begin to expire in 2015. A total of $1.4 million of the federal net operating loss, $3.0 million of the California net operating loss carryforward and $1.6 million of the foreign net operating loss carryforwards are related to excess tax benefits as a result of stock option exercises, and therefore will be recorded in additional paid-in capital in the period that they become realized. During the year ended December 26, 2015, the Company did not realize any excess tax benefits as a result of stock option exercises, therefore, there were no amounts recorded to additional paid-in capital.
As of December 26, 2015, the Company had available carryforward Federal and California R&D tax credits of $7.5 million and $6.9 million, respectively. Federal R&D tax credit carryforwards begin to expire in 2024. State R&D tax credits carryforward indefinitely. A total of $0.2 million of the state R&D tax credits are related to excess tax benefits as a result of stock option exercises, and therefore will be recorded to additional paid-in-capital in the period that they become realized.
During the years ended December 26, 2015 and December 27, 2014, the valuation allowances increased by $1.6 million and $23.9 million, respectively. The valuation allowance increase in 2014 was primarily related to a full valuation allowance recorded
64
NANOMETRICS INCORPORATED
NOTES TO CONSOLIDATED FINANCIAL STATEMENTS – (Continued)
against the Company's U.S. deferred tax assets. The realization of deferred tax assets is primarily dependent on the Company generating sufficient U.S. and foreign taxable income in future fiscal years. The Company regularly assesses the need for a valuation allowance against its deferred tax assets. In making that assessment, the Company considers both positive and negative evidence related to the likelihood of realization of the deferred tax assets to determine, based on the weight of available evidence, whether it is more-likely-than-not that some or all of the deferred tax assets will not be realized. In evaluating the need for a valuation allowance, the Company considers its cumulative loss in the U.S. as a significant piece of negative evidence. During the year ended December 27, 2014, the Company recorded a $21.1 million valuation allowance against its U.S. deferred tax assets as it determined, within the period, it would not meet the more likely than not threshold. The Company continues to maintain valuation allowances against certain foreign deferred tax assets as a result of uncertainties regarding the realization of the asset due to cumulative losses and uncertainty of future taxable income. The Company will continue to assess the realizability of the deferred tax assets in each of the applicable jurisdictions and maintain the valuation allowances until sufficient positive evidence exists to support a reversal. In the event the Company determines that the deferred tax assets are realizable, an adjustment to the valuation allowances will be reflected in the tax provision for the period such determination is made.
Changes in tax laws and tax rates could affect the Company's recorded deferred tax assets and liabilities in the future. The Company's tax liabilities involve dealing with uncertainties in the application of complex tax laws and regulations in a multitude of jurisdictions across its global operations. Management will account for any such changes or factors in the period in which such law changes are enacted.
Differences between income taxes computed by applying the statutory federal income tax rate to income (loss) before income taxes and the provision (benefit) for income taxes consist of the following (in thousands):
|
|
|
Years Ended |
|
|||||||||
|
|
|
December 26, 2015 |
|
|
December 27, 2014 |
|
|
December 28, 2013 |
|
|||
|
Income taxes computed at U.S. statutory rate |
|
$ |
1,949 |
|
|
$ |
(4,067 |
) |
|
$ |
(8,247 |
) |
|
State income taxes |
|
|
28 |
|
|
|
(109 |
) |
|
|
147 |
|
|
Foreign tax rate differential |
|
|
342 |
|
|
|
777 |
|
|
|
479 |
|
|
Change in valuation allowance |
|
|
1,648 |
|
|
|
23,894 |
|
|
|
— |
|
|
Non-deductible Equity Compensation |
|
|
311 |
|
|
|
242 |
|
|
|
210 |
|
|
Tax credits |
|
|
(1,834 |
) |
|
|
(2,187 |
) |
|
|
(2,103 |
) |
|
Liabilities for uncertain tax positions |
|
|
74 |
|
|
|
118 |
|
|
|
111 |
|
|
Other, net |
|
|
145 |
|
|
|
829 |
|
|
|
(16 |
) |
|
Provision (benefit) for income taxes |
|
$ |
2,663 |
|
|
$ |
19,497 |
|
|
$ |
(9,419 |
) |
Certain amounts of the income tax rate reconciliation for the years ended December 27, 2014 and December 28, 2013, were reclassified to other components within the reconciliation to be consistent with classification used for the year ended December 26, 2015. There was no impact to the total provision (benefit) for income taxes based on these reclassifications.
As of December 26, 2015, approximately $6.5 million of undistributed earnings from non-U.S. operations held by the Company's foreign subsidiaries are designated as indefinitely reinvested outside the U.S. Accordingly, no additional U.S. income taxes or additional foreign withholding taxes have been provided thereon. The amount of unrecognized deferred tax liability related to these earnings would be immaterial.
The Company recognizes tax liabilities for uncertain tax positions and adjust these liabilities when its judgment changes as a result of the evaluation of new information not previously available. Due to the complexity of some of these uncertainties, the ultimate resolution may result in a payment that is materially different from the Company's current estimate of the tax liabilities. These differences will be reflected as increases or decreases to income tax expense in the period in which they are determined.
The accounting for uncertainty in income taxes recognized in an enterprise's financial statements prescribes a recognition threshold and measurement attribute for the financial statement recognition and measurement of a tax position taken or expected to be taken on a tax return, and the derecognition of tax benefits, classification on the balance sheet, interest and penalties, accounting in interim periods, disclosure, and transition.
65
NANOMETRICS INCORPORATED
NOTES TO CONSOLIDATED FINANCIAL STATEMENTS – (Continued)
A reconciliation of the beginning and ending amount of unrecognized tax benefits is as follows (in thousands):
|
|
|
Rollforward Table (at Gross): As of |
|
|||||||||
|
|
|
December 26, 2015 |
|
|
December 27, 2014 |
|
|
December 28, 2013 |
|
|||
|
Unrecognized tax benefits - beginning of the period |
|
$ |
6,442 |
|
|
$ |
4,436 |
|
|
$ |
3,464 |
|
|
Gross increases-tax positions in prior period |
|
|
127 |
|
|
|
655 |
|
|
|
305 |
|
|
Gross decreases-tax positions in prior period |
|
|
(306 |
) |
|
|
(123 |
) |
|
|
— |
|
|
Gross increases-current-period tax positions |
|
|
698 |
|
|
|
1,541 |
|
|
|
688 |
|
|
Lapse of statute of limitations |
|
|
— |
|
|
|
(67 |
) |
|
|
(21 |
) |
|
Unrecognized tax benefits - end of the period |
|
$ |
6,961 |
|
|
$ |
6,442 |
|
|
$ |
4,436 |
|
The unrecognized tax benefit at December 26, 2015 was $7.0 million, of which $0.8 million would impact the effective tax rate if recognized. The Company accrues interest and penalties related to unrecognized tax benefits in its provision for income taxes. The total amount of penalties and interest were not material as of December 26, 2015, December 27, 2014 and December 28, 2013. The Company does not expect a material change in its unrecognized tax benefits within the next 12 months.
The Company is subject to taxation in the U.S. and various states including California, and foreign jurisdictions including Korea, Japan, Taiwan, and China. Due to tax attribute carry-forwards, the Company is subject to examination for tax years 2003 forward for U.S. tax purposes. The Company was also subject to examination in various states for tax years 2002 forward. The Company is subject to examination for tax years 2007 forward for various foreign jurisdictions.
Note 16. Segment, Geographic, Product and Significant Customer Information
The Company has one operating segment, which is the sale, design, manufacture, marketing and support of thin film and optical critical dimension systems. The Chief Executive Officer has been identified as the Chief Operating Decision Maker (“CODM”) because he has the final authority over resource allocation decisions and performance assessment. The CODM does not receive discrete financial information about individual components of the Company's business. For the years ended December 26, 2015, December 27, 2014, and December 28, 2013, the Company recorded revenue from customers primarily in the United States, Asia and Europe. The following tables summarize total net revenues and long-lived assets (excluding intangible assets) attributed to significant countries (in thousands):
|
|
|
Years Ended |
|
|||||||||
|
|
|
December 26, 2015 |
|
|
December 27, 2014 |
|
|
December 28, 2013 |
|
|||
|
Total net revenues (1): |
|
|
|
|
|
|
|
|
|
|
|
|
|
United States |
|
$ |
36,720 |
|
|
$ |
36,123 |
|
|
$ |
47,019 |
|
|
China |
|
|
17,373 |
|
|
|
28,702 |
|
|
|
13,063 |
|
|
Japan |
|
|
31,140 |
|
|
|
15,185 |
|
|
|
11,629 |
|
|
South Korea |
|
|
30,572 |
|
|
|
41,381 |
|
|
|
34,873 |
|
|
Taiwan |
|
|
46,715 |
|
|
|
19,790 |
|
|
|
9,645 |
|
|
Other |
|
|
24,847 |
|
|
|
25,262 |
|
|
|
28,078 |
|
|
Total net revenues |
|
$ |
187,367 |
|
|
$ |
166,443 |
|
|
$ |
144,307 |
|
|
(1) |
Net revenues are attributed to countries based on the customer's deployment and service locations of systems. |
66
NANOMETRICS INCORPORATED
NOTES TO CONSOLIDATED FINANCIAL STATEMENTS – (Continued)
|
|
|
December 26, 2015 |
|
|
December 27, 2014 |
|
||
|
Long-lived tangible assets: |
|
|
|
|
|
|
|
|
|
United States |
|
$ |
42,581 |
|
|
$ |
47,729 |
|
|
Japan |
|
|
59 |
|
|
|
71 |
|
|
South Korea |
|
|
697 |
|
|
|
284 |
|
|
Taiwan |
|
|
1,056 |
|
|
|
1,473 |
|
|
All Other |
|
|
100 |
|
|
|
76 |
|
|
Total long-lived tangible assets |
|
$ |
44,493 |
|
|
$ |
49,633 |
|
The Company’s product lines differ primarily based on the environment in which the systems will be used. Automated systems are used primarily in high-volume production environments. Materials characterization products are primarily used to measure the composition, band gap, structure, and other physical and electrical properties of semiconducting materials for discrete electronic industry, high brightness LED and solar/photovoltaic structures in both development and high volume environments. Integrated systems are installed inside wafer processing equipment to provide near real-time measurements for improving process control and increasing throughput. Revenues by product type were as follows (in thousands):
|
|
|
Years Ended |
|
|||||||||
|
|
|
December 26, 2015 |
|
|
December 27, 2014 |
|
|
December 28, 2013 |
|
|||
|
Automated Systems |
|
$ |
102,386 |
|
|
$ |
108,768 |
|
|
$ |
82,924 |
|
|
Integrated Systems |
|
|
31,579 |
|
|
|
15,334 |
|
|
|
11,412 |
|
|
Materials Characterization Systems |
|
|
12,980 |
|
|
|
9,487 |
|
|
|
13,066 |
|
|
Total product revenues |
|
$ |
146,945 |
|
|
$ |
133,589 |
|
|
$ |
107,402 |
|
The following customers accounted for 10% or more of total accounts receivable, net:
|
|
|
Years Ended |
|
|||||||||
|
|
|
December 26, 2015 |
|
|
December 27, 2014 |
|
|
December 28, 2013 |
|
|||
|
Toshiba Corporation |
|
|
27.1 |
% |
|
*** |
|
|
*** |
|
||
|
Taiwan Semiconductor Manufacturing Company Limited |
|
|
25.6 |
% |
|
|
20.2 |
% |
|
|
12.1 |
% |
|
SK Hynix |
|
*** |
|
|
*** |
|
|
|
21.8 |
% |
||
|
Samsung Electronics Co. Ltd. |
|
*** |
|
|
|
10.0 |
% |
|
|
27.4 |
% |
|
|
Micron |
|
*** |
|
|
|
23.7 |
% |
|
*** |
|
||
|
Intel Corporation |
|
*** |
|
|
*** |
|
|
|
14.4 |
% |
||
|
GlobalFoundries |
|
*** |
|
|
|
10.2 |
% |
|
*** |
|
||
***The customer accounted for less than 10% of total accounts receivable, net, as of that period end.
The following customers accounted for 10% or more of total net revenue:
|
|
|
Years Ended |
|
|||||||||
|
|
|
December 26, 2015 |
|
|
December 27, 2014 |
|
|
December 28, 2013 |
|
|||
|
Taiwan Semiconductor Manufacturing Company Limited |
|
|
19.4 |
% |
|
*** |
|
|
*** |
|
||
|
Micron |
|
|
15.8 |
% |
|
|
10.4 |
% |
|
*** |
|
|
|
Samsung Electronics Co. Ltd. |
|
|
13.2 |
% |
|
|
26.9 |
% |
|
|
14.4 |
% |
|
SK Hynix |
|
|
10.7 |
% |
|
|
12.2 |
% |
|
|
18.4 |
% |
|
Toshiba Corporation |
|
|
10.2 |
% |
|
*** |
|
|
*** |
|
||
|
Intel Corporation |
|
*** |
|
|
|
12.6 |
% |
|
|
30.0 |
% |
|
***The customer accounted for less than 10% of total net revenue during the period.
67
SUPPLEMENTAL FINANCIAL INFORMATION
Selected Quarterly Financial Results (Unaudited)
The following table sets forth selected consolidated quarterly results of operations for the years ended December 26, 2015 and December 27, 2014 (in thousands, except per share amounts):
|
|
|
Quarters Ended |
|
|||||||||||||
|
|
|
December 26, 2015 |
|
|
September 26, 2015 |
|
|
June 27, 2015 |
|
|
March 28, 2015 |
|
||||
|
Total net revenues |
|
$ |
42,684 |
|
|
$ |
45,678 |
|
|
$ |
48,629 |
|
|
$ |
50,376 |
|
|
Gross profit |
|
$ |
20,805 |
|
|
$ |
22,219 |
|
|
$ |
23,264 |
|
|
$ |
23,379 |
|
|
Income (loss) from operations |
|
$ |
(1,041 |
) |
|
$ |
1,264 |
|
|
$ |
2,509 |
|
|
$ |
2,241 |
|
|
Net income (loss) |
|
$ |
(1,813 |
) |
|
$ |
818 |
|
|
$ |
1,344 |
|
|
$ |
2,556 |
|
|
Net income (loss) per share: |
|
|
|
|
|
|
|
|
|
|
|
|
|
|
|
|
|
Basic |
|
$ |
(0.07 |
) |
|
$ |
0.03 |
|
|
$ |
0.06 |
|
|
$ |
0.11 |
|
|
Diluted |
|
$ |
(0.07 |
) |
|
$ |
0.03 |
|
|
$ |
0.06 |
|
|
$ |
0.11 |
|
|
Shares used in per share computations: |
|
|
|
|
|
|
|
|
|
|
|
|
|
|
|
|
|
Basic |
|
|
24,203 |
|
|
|
24,145 |
|
|
|
24,020 |
|
|
|
23,866 |
|
|
Diluted |
|
|
24,203 |
|
|
|
24,352 |
|
|
|
24,285 |
|
|
|
24,257 |
|
|
|
|
Quarters Ended |
|
|||||||||||||
|
|
|
December 27, 2014 |
|
|
September 27, 2014 |
|
|
June 28, 2014 |
|
|
March 29, 2014 |
|
||||
|
Total net revenues |
|
$ |
39,705 |
|
|
$ |
27,133 |
|
|
$ |
48,029 |
|
|
$ |
51,576 |
|
|
Gross profit |
|
$ |
17,349 |
|
|
$ |
11,416 |
|
|
$ |
22,908 |
|
|
$ |
24,149 |
|
|
Income (loss) from operations |
|
$ |
(3,806 |
) |
|
$ |
(10,609 |
) |
|
$ |
746 |
|
|
$ |
2,016 |
|
|
Net income (loss)(1) |
|
$ |
(4,639 |
) |
|
$ |
(28,662 |
) |
|
$ |
588 |
|
|
$ |
1,595 |
|
|
Net income (loss) per share: |
|
|
|
|
|
|
|
|
|
|
|
|
|
|
|
|
|
Basic |
|
$ |
(0.19 |
) |
|
$ |
(1.19 |
) |
|
$ |
0.02 |
|
|
$ |
0.07 |
|
|
Diluted |
|
$ |
(0.19 |
) |
|
$ |
(1.19 |
) |
|
$ |
0.02 |
|
|
$ |
0.07 |
|
|
Shares used in per share computations: |
|
|
|
|
|
|
|
|
|
|
|
|
|
|
|
|
|
Basic |
|
|
24,048 |
|
|
|
24,132 |
|
|
|
23,939 |
|
|
|
23,711 |
|
|
Diluted |
|
|
24,048 |
|
|
|
24,132 |
|
|
|
24,220 |
|
|
|
24,159 |
|
(1)Net loss included a non-cash valuation allowance of $21.1 million on certain U.S. deferred tax assets for three months ended September 27, 2014.
68
None.
Evaluation of Disclosure Controls and Procedures
We maintain disclosure controls and procedures that are designed to ensure that information required to be disclosed in our reports under the Exchange Act is recorded, processed, summarized and reported within the time periods specified in the SEC’s rules and forms, and that such information is accumulated and communicated to management, including our Chief Executive Officer (“CEO”) and Chief Financial Officer (“CFO”), as appropriate, to allow timely decisions regarding required disclosure. Our management, with participation of our CEO and CFO, has evaluated the effectiveness of our disclosure controls and procedures as of the end of the fiscal year covered by this Annual Report on Form 10-K.
Based upon that evaluation, our CEO and CFO have concluded that, as of the end of the period covered in this report, our disclosure controls and procedures were effective to ensure that information required to be disclosed by us in reports that we file or submit under the Exchange Act is recorded, processed, summarized, and reported within the time periods specified in SEC rules and forms and is accumulated and communicated to our management, including our principal executive officer and principal financial officer, as appropriate, to allow timely decisions regarding required disclosure.
Report of Management on Internal Control over Financial Reporting
Our management is responsible for establishing and maintaining adequate internal control over financial reporting as defined in Rules 13a-15(f) and 15d-15(f) under the Exchange Act. Our internal control over financial reporting was designed to provide reasonable, not absolute, assurance regarding the integrity, reliability and fair presentation of our financial reporting and the preparation of financial statements for external purposes in accordance with generally accepted accounting principles.
Internal control over financial reporting includes those policies and procedures that (i) pertain to the maintenance of records that in reasonable detail accurately and fairly reflect the transactions and dispositions of the assets of the Company; (ii) provide reasonable assurance that transactions are recorded as necessary to permit preparation of financial statements in accordance with generally accepted accounting principles, and that receipts and expenditures of the Company are being made only in accordance with authorizations of management and directors of the Company; and (iii) provide reasonable assurance regarding prevention or timely detection of unauthorized acquisition, use or disposition of the Company’s assets that could have a material effect on the financial statements.
A control system, no matter how well designed and operated, can provide only reasonable, not absolute, assurance that the control system’s objectives will be met. Further, the design of a control system must reflect the fact that there are resource constraints. Because of the inherent limitations in all control systems, no evaluation of controls can provide absolute assurance that all control issues and instances of fraud, if any, within our company have been detected. Under the supervision and with the participation of our management, including our CEO and CFO, we assessed the effectiveness of our internal control over financial reporting as of December 26, 2015. In making this assessment, we used the criteria established in the framework on Internal Control – Integrated Framework 2013 issued by the Committee of Sponsoring Organizations (“COSO”) of the Treadway Commission.
Based on our assessment, which was conducted according to the COSO criteria, we have concluded that our internal control over financial reporting was effective in achieving its objectives as of December 26, 2015.
The effectiveness of our internal control over financial reporting as of December 26, 2015 has been audited by PricewaterhouseCoopers LLP, an independent registered public accounting firm, as stated in their report which appears herein.
Changes in Internal Control over Financial Reporting
No change in our internal controls over financial reporting (as defined in Rules 13a-15(f) and 15d-15(f) under the Exchange Act) occurred during the fourth quarter ended December 26, 2015, that has materially affected, or is reasonably likely to materially affect, our internal control over financial reporting.
69
None.
70
The information required by this Item is incorporated by reference to our Proxy Statement for our 2016 Annual Meeting of Stockholders (the “Proxy Statement”) to be filed with the SEC not later than 120 days after the end of our fiscal year ended December 26, 2015, specifically:
|
|
· |
Information regarding our directors and any persons nominated to become a director, as well as with respect to some other required board matters, is set forth under Proposal 1 entitled “Election of Directors” and under “Corporate Governance.” |
|
|
· |
Information regarding our audit committee and our designated “audit committee financial expert” is set forth under the caption “Corporate Governance.” |
|
|
· |
Information on our code of business conduct and ethics for directors, officers and employees is set forth under the caption “Code of Ethics” under “Corporate Governance.” |
|
|
· |
Information regarding Section 16(a) beneficial ownership reporting compliance is set forth under the caption “Section 16(a) Beneficial Ownership Reporting Compliance.” |
|
|
· |
Information regarding procedures by which stockholders may recommend nominees to our board of directors is set forth under the caption “Nominating and Governance Committee” under “Corporate Governance.” |
Information regarding our executive officers is set forth at the end of Item 1, Part 1 of this Annual Report on Form 10-K under the caption “Executive Officers of the Registrant."
Information regarding compensation of our named executive officers is set forth under the caption “Executive Compensation” in the Proxy Statement, which information is incorporated herein by reference.
Information regarding compensation of our directors is set forth under the caption "Compensation of Directors" in the Proxy Statement, which information is incorporated herein by reference.
Information regarding compensation committee interlocks is set forth under the caption "Compensation Committee Interlocks and Insider Participation" in the Proxy Statement, which information is incorporated herein by reference.
The Compensation Committee Report is set forth under the caption "Compensation Committee Report" in the Proxy Statement, which report is incorporated herein by reference.
|
ITEM 12. |
SECURITY OWNERSHIP OF CERTAIN BENEFICIAL OWNERS AND MANAGEMENT AND RELATED STOCKHOLDER MATTERS |
Information regarding security ownership of certain beneficial owners, directors and executive officers is set forth under the caption "Security Ownership of Certain Beneficial Owners and Management" in the Proxy Statement, which information is incorporated herein by reference.
71
Equity Compensation Plan Information
The following table gives information about the common stock that may be issued under all of our existing equity compensation plans as of December 26, 2015.
|
Plan category |
|
Number of securities to be issued upon exercise of outstanding options, warrants and rights |
|
|
Weighted-average exercise price of outstanding options |
|
|
Number of securities remaining available for future issuance under equity compensation plans (excluding securities reflected in first column) |
|
|||
|
Equity compensation plans approved by security holders |
|
|
918,373 |
|
|
$ |
19.41 |
|
|
|
1,950,589 |
|
|
Equity compensation plans not approved by security holders (1) |
|
|
141,098 |
|
|
$ |
16.66 |
|
|
|
— |
|
|
Total |
|
|
1,059,471 |
|
|
$ |
14.61 |
|
|
|
1,950,589 |
|
|
(1) |
Represents the 2002 Non-Statutory Stock Plan, which was adopted without the approval of security holders. This Plan provides for the grant of non-statutory stock options to employees and service providers at grant prices equal to the fair market value on the date of grant, with an expiration date not to exceed 10 years from the grant date. |
Information regarding certain relationships and related transactions is set forth under the caption "Related Person Transaction Policy" under the caption "Corporate Governance" in the Proxy Statement, which information is incorporated herein by reference.
Information regarding director independence is set forth under the caption “Board of Directors Meetings and Committees” under “Corporate Governance” in the Proxy Statement, which information is incorporated herein by reference.
Information regarding principal auditor fees and services is set forth under the proposal entitled “Ratification of Appointment of Independent Registered Public Accounting Firm” in the Proxy Statement, which information is incorporated herein by reference.
72
|
(a) |
The following documents are filed as part of this report on Form 10-K: |
|
|
(1) |
Consolidated Financial Statements. |
See Index to Consolidated Financial Statements in Item 8 on page 36 of this Annual Report on Form 10-K.
|
|
(2) |
Consolidated Financial Statement Schedule. |
The following consolidated financial statement schedule of Nanometrics Incorporated is filed as part of this Annual Report on Form 10-K and should be read in conjunction with the Consolidated Financial Statements:
|
Schedule |
Page |
|
II - Valuation and Qualifying Accounts as of and for the years ended December 26, 2015, December 27, 2014 and December 28, 2013 |
78 |
Schedules not listed above have been omitted because they are not applicable or are not required or the information required to be set forth therein is included in the Consolidated Financial Statements or notes thereto.
|
|
(3) |
Exhibits. |
See Exhibit Index following the signature page of this Annual Report on Form 10-K, which is incorporated by reference here.
73
Pursuant to the requirements of Section 13 or 15(d) of the Securities Exchange Act of 1934, the registrant has duly caused this report to be signed on its behalf by the undersigned, thereunto duly authorized.
Dated: February 24, 2016
|
NANOMETRICS INCORPORATED |
||
|
By: |
|
/S/ Timothy J. Stultz |
|
|
|
Timothy J. Stultz |
|
|
|
President and Chief Executive Officer |
|
|
|
(Duly Authorized Officer and Principal Executive Officer) |
Pursuant to the requirements of the Securities Exchange Act of 1934, this Report on Form 10-K has been signed below by the following persons on behalf of the registrant and in the capacities and on the dates indicated.
|
Signature |
|
Title |
|
Date |
|
|
|
|
|
|
|
/S/ Timothy J. Stultz |
|
President, Chief Executive Officer and Director |
|
February 24, 2016 |
|
Timothy J. Stultz |
|
(Principal Executive Officer) |
|
|
|
|
|
|
|
|
|
/S/ Jeffrey Andreson |
|
Chief Financial Officer |
|
February 24, 2016 |
|
Jeffrey Andreson |
|
(Principal Financial Officer and Principal Accounting Officer) |
|
|
|
|
|
|
|
|
|
/S/ Bruce C. Rhine |
|
Chairman of the Board of Directors |
|
February 24, 2016 |
|
Bruce C. Rhine |
|
|
|
|
|
|
|
|
|
|
|
/S/ J. Thomas Bentley |
|
Director |
|
February 24, 2016 |
|
J. Thomas Bentley |
|
|
|
|
|
|
|
|
|
|
|
/S/ Edward J. Brown Jr. |
|
Director |
|
February 24, 2016 |
|
Edward J. Brown Jr. |
|
|
|
|
|
|
|
|
|
|
|
/S/ Christopher A. Seams |
|
Director |
|
February 24, 2016 |
|
Christopher A. Seams |
|
|
|
|
|
|
|
|
|
|
|
/S/ Christine Tsingos |
|
Director |
|
February 24, 2016 |
|
Christine Tsingos |
|
|
|
|
74
EXHIBIT INDEX
|
Exhibit No. |
|
Description |
|
3.(i) |
|
Certificate of Incorporation |
|
|
|
|
|
3.1(1) |
|
Certificate of Incorporation of the Registrant |
|
|
|
|
|
3.(ii) |
|
Bylaws |
|
|
|
|
|
3.2 (2) |
|
Bylaws of the Registrant |
|
|
|
|
|
4 |
|
Instruments Defining the Rights of Security Holders, Including Indentures |
|
|
|
|
|
4.1 (3) |
|
Form of Common Stock Certificate |
|
|
|
|
|
10 |
|
Material Contracts |
|
|
|
|
|
|
|
Management Contracts, Compensatory Plans, Contracts or Arrangements |
|
|
|
|
|
10.1 (4) |
|
Form of Indemnification Agreement between the Registrant and each of its directors and executive officers |
|
|
|
|
|
10.2 (5) |
|
Registrant’s 2000 Employee Stock Option Plan and form of Stock Option Agreement |
|
|
|
|
|
10.3 (6) |
|
Registrant’s 2000 Director Stock Option Plan and form of Stock Option Agreement |
|
|
|
|
|
10.4 (7) |
|
Registrant’s 2002 Non-statutory Stock Option Plan and form of Stock Option Agreement |
|
|
|
|
|
10.5 (8) |
|
Registrant’s Amended and Restated 2003 Employee Stock Purchase Plan |
|
|
|
|
|
10.6 (9) |
|
Form of Subscription Agreement Under the Registrant’s Amended and Restated 2003 Employee Stock Purchase Plan |
|
|
|
|
|
10.7 (18) |
|
Registrant’s Amended and Restated 2005 Equity Incentive Plan |
|
|
|
|
|
10.8 (6) |
|
Registrant’s Amended and Restated 2005 Equity Incentive Plan forms of Stock Option and Restricted Stock Unit Agreements |
|
|
|
|
|
10.9 (10) |
|
Executive Performance Bonus Plan |
|
|
|
|
|
10.10 (11) |
|
Form of Offer Letter to Timothy J. Stultz |
|
|
|
|
|
10.11 (12) |
|
Amended and Restated Executive Severance Agreement between the Registrant and Timothy J. Stultz, dated February 23, 2010 |
|
|
|
|
|
10.12 (19) |
|
Employment Agreement between Registrant and Jeffrey Andreson, dated September 22, 2014 |
|
|
|
|
|
10.13 (23) |
|
Compensation Arrangements with Principal Executive Officer and Principal Financial Office |
|
|
|
|
|
10.14 (24) |
|
Form of Performance-Based Restricted Stock Unit Agreement |
|
|
|
|
|
10.15 (25) |
|
General Severance Benefits and Change in Control Severance Benefits Agreement between Registrant and Timothy J. Stultz, Ph.D., dated May 19, 2015 |
|
|
|
|
|
10.16 (25) |
|
General Severance Benefits and Change in Control Severance Benefits Agreement between Registrant and Jeffrey Andreson, dated May 19, 2015 |
|
|
|
|
|
10.17 (25)
|
|
General Severance Benefits and Change in Control Severance Benefits Agreement between Registrant and S. Mark Borowicz, dated May 19, 2015 |
75
|
|
|
|
|
10.18 (25)
|
|
General Severance Benefits and Change in Control Severance Benefits Agreement between Registrant and Kevin Heidrich, dated May 19, 2015 |
|
|
|
|
|
10.19 (26) |
|
Form of Indemnification Agreement between the Registrant and each of its directors and executive officers |
|
|
|
|
|
10.20 (27) |
|
General Severance Benefits and Change in Control Severance Benefits Agreement between Registrant and Janet Taylor, date August 27, 2015 |
|
|
|
|
|
10.21 (27) |
|
Compensation Arrangement With Non-Employee Directors |
|
|
|
|
|
|
|
All Other Material Contracts |
|
|
|
|
|
10.22 (7) |
|
Loan and Security Agreement effective as of February 14, 2007 by and between Comerica Bank, the Registrant, Accent Optical Technologies, Nanometrics, Inc. and Nanometrics IVS Division, Inc. |
|
|
|
|
|
10.23 (13) |
|
First Amendment to the Loan and Security Agreement dated September 14, 2007 |
|
|
|
|
|
10.24 (13) |
|
Second Amendment to the Loan and Security Agreement dated May 11, 2009, with an effective date of April 29, 2009 |
|
|
|
|
|
10.25 (14) |
|
Third Amendment to the Loan and Security Agreement dated June 15, 2009 |
|
|
|
|
|
10.26 (15) |
|
Fourth Amendment to the Loan and Security Agreement dated April 13, 2010 |
|
|
|
|
|
10.27 (14) |
|
Asset Transfer Agreement by and between Zygo Corporation and the Registrant, dated June 17, 2009 |
|
|
|
|
|
10.28 (14) |
|
Supply Agreement by and between Zygo Corporation and the Registrant dated June 17, 2009 |
|
|
|
|
|
10.29 (17) |
|
Fifth Amendment to the Loan and Security Agreement dated April 23, 2012 |
|
|
|
|
|
10.30 (20) |
|
Compensation of Non-Employee Directors |
|
|
|
|
|
10.31 (21) |
|
Extension to the Loan and Security Agreement dated April 30, 2014 |
|
|
|
|
|
10.32 (22) |
|
Sixth Amendment to the Loan and Security Agreement by and between the Registrant and Comerica Bank dated May 30, 2014 |
|
|
|
|
|
14 |
|
Code of Ethics |
|
|
|
|
|
14.1 (16) |
|
Registrant’s Code of Business Conduct and Ethics |
|
|
|
|
|
21 |
|
Subsidiaries |
|
|
|
|
|
21.1 |
|
Subsidiaries of the Registrant |
|
|
|
|
|
23 |
|
Consents of Experts and Counsel |
|
|
|
|
|
23.1 |
|
Consent of PricewaterhouseCoopers LLP Independent Registered Public Accounting Firm |
|
|
|
|
|
31 |
|
Rule 13a-14(a)/15d-14(a) Certifications |
|
|
|
|
76
|
31.1 |
|
Certification of Timothy J. Stultz, principal executive officer of the Registrant, pursuant to Section 302 of the Sarbanes-Oxley Act of 2002 |
|
|
|
|
|
31.2 |
|
Certification of Jeffrey Andreson, principal financial officer and principal accounting officer of the Registrant, pursuant to Section 302 of the Sarbanes-Oxley Act of 2002 |
|
|
|
|
|
32 |
|
Section 1350 Certifications |
|
|
|
|
|
32.1* |
|
Certification of Timothy J. Stultz, principal executive officer of the Registrant, and Jeffrey Andreson, principal financial officer and principal accounting officer of the Registrant pursuant to Section 906 of the Sarbanes-Oxley Act of 2002 |
|
|
|
|
|
101.INS |
|
XBRL Instance Document |
|
|
|
|
|
101.SCH |
|
XBRL Taxonomy Extension Schema Document |
|
|
|
|
|
101.CAL |
|
XBRL Taxonomy Extension Calculation Linkbase Document |
|
|
|
|
|
101.DEF |
|
XBRL Taxonomy Extension Definition Linkbase Document |
|
|
|
|
|
101.LAB |
|
XBRL Taxonomy Extension Label Linkbase Document |
|
|
|
|
|
101.PRE |
|
XBRL Taxonomy Extension Presentation Linkbase Document |
|
|
|
|
|
(1) |
Incorporated by reference to Exhibit 3.1 filed with the Registrant's Current Report on Form 8-K (File No. 000-13470) filed on October 5, 2006. |
|
(2) |
Incorporated by reference to Exhibit 3.1 filed with the Registrant's Current Report on Form 8-K (File No. 000-13470) filed on April 12, 2012. |
|
(3) |
Incorporated by reference to Exhibit 4.1 filed with the Registrant's Quarterly Report on Form 10-Q (File No. 000-13470) filed on November 9, 2006. |
|
(4) |
Incorporated by reference to Exhibit 10.1 filed with the Registrant's Current Report on Form 8-K (File No. 000-13470) filed on February 20, 2013. |
|
(5) |
Incorporated by reference to Exhibit 4.2 filed with the Registrant's Registration Statement on Form S-8 (File No. 333-40866) filed on July 6, 2000. |
|
(6) |
Incorporated by reference to the like-described exhibit filed with the Registrant's Annual Report on Form 10-K (File No. 000-13470) filed on March 13, 2008. |
|
(7) |
Incorporated by reference to the like-described exhibit filed with the Registrant's Quarterly Report on Form 10-Q (File No. 000-13470) filed on May 10, 2007. |
|
(8) |
Incorporated by reference to Appendix 1 filed with the Registrant's definitive proxy statement on Schedule 14A (File No. 000-13470) filed on April 21, 2009. |
|
(9) |
Incorporated by reference to Exhibit 4.1 filed with the Registrant's Registration Statement on Form S-8 (File No.333-108474) filed on September 3, 2003. |
|
(10) |
Incorporated by reference to the like-described exhibit filed with the Registrant's Quarterly Report on Form 10-Q (File No. 000-13470) filed on May 11, 2011. |
|
(11) |
Incorporated by reference to Exhibit 10.1 filed with the Registrant's Current Report on Form 8-K (File No. 000-13470) filed on August 8, 2007. |
|
(12) |
Incorporated by reference to the like-described exhibit filed with the Registrant's Annual Report on Form 10-K (File No. 000-13470) filed on March 26, 2010. |
|
(13) |
Incorporated by reference to the like-described exhibit filed with the Registrant's Quarterly Report on Form 10-Q (File No. 000-13470) filed on May 12, 2009. |
|
(14) |
Incorporated by reference to the like-described exhibit filed with the Registrant's Quarterly Report on Form 10-Q (File No. 000-13470) filed on August 11, 2009. |
|
(15) |
Incorporated by reference to Exhibit 99.1 filed with the Registrant's Current Report on Form 8-K (File No. 000-13470) filed on April 19, 2010. |
|
(16) |
Incorporated by reference to Exhibit 14 filed with the Registrant's Annual Report on Form 10-K (File No. 000-13470) filed on April 1, 2004. |
|
(17) |
Incorporated by reference to Exhibit 10.1 filed with the Registrant's Quarterly Report on Form 10-Q (File No. 000-13470) filed on May 9, 2012. |
|
(18) |
Incorporated by reference to Appendix A filed with the Registrant's definitive proxy statement on Schedule 14A (File No. 000-13470) filed on April 10, 2013. |
|
(19) |
Incorporated by reference to Exhibit 10.1 filed with the Registrant's Quarterly Report on Form 10-Q (File No. 000-13470) filed on October 31, 2014. |
|
(20) |
Incorporated by reference to Exhibit 10.26 filed with the Registrant's Annual Report on Form 10-K (File No. 000-13470) filed on March 7, 2014. |
|
(21) |
Incorporated by reference to Exhibit 10.1 filed with the Registrant's Quarterly Report on Form 10-Q (File No. 000-13470) filed on August 1, 2014. |
|
(22) |
Incorporated by reference to Exhibit 99.1 filed with the Registrant's Current Report on Form 8-K (File No. 000-13470) filed on June 4, 2014. |
|
(23) |
Incorporated by reference to the disclosure in Item 5.02 of the Registrant's Current Report on Form 8-K (File No. 000-13470) filed on March 2, 2015. |
|
(24) |
Incorporated by reference to Exhibit 99.1 filed with the Registrant's Current Report on Form 8-K (File No. 000-13470) filed on March 24, 2015. |
|
(25) |
Incorporated by reference to the like-described exhibit filed with the Registrant's Current Report on Form 8-K (File No. 000-13470) filed on May 22, 2015. |
|
(26) |
Incorporated by reference to Exhibit 10.1 filed with the Registrant's Current Report on Form 8-K (File No. 000-13470) filed on February 20, 2013. |
|
(27) |
Incorporated by reference to the like-described exhibit filed with the Registrant's Quarterly Report on Form 10-Q (File No. 000-13470) filed on October 30, 2015. |
|
* |
Filed herewith. |
77
NANOMETRICS INCORPORATED
VALUATION AND QUALIFYING ACCOUNTS
Our allowance for doubtful accounts receivable consists of the following (in thousands):
|
Year Ended |
|
Balance at beginning of period |
|
|
Charged to costs and expenses |
|
|
Deductions – write-offs of accounts |
|
|
Balance at end of period |
|
||||
|
December 26, 2015 |
|
$ |
253 |
|
|
$ |
(113 |
) |
|
$ |
10 |
|
|
$ |
150 |
|
|
December 27, 2014 |
|
$ |
293 |
|
|
$ |
(40 |
) |
|
$ |
— |
|
|
$ |
253 |
|
|
December 28, 2013 |
|
$ |
82 |
|
|
$ |
255 |
|
|
$ |
(44 |
) |
|
$ |
293 |
|
Our valuation allowance for deferred tax assets consists of the following (in thousands):
|
Year Ended |
|
Balance at beginning of period |
|
|
Charged to costs and expenses |
|
|
Deductions – write-offs of accounts |
|
|
Balance at end of period |
|
||||
|
December 26, 2015 |
|
$ |
35,835 |
|
|
$ |
951 |
|
|
$ |
— |
|
|
$ |
36,786 |
|
|
December 27, 2014 |
|
$ |
11,665 |
|
|
$ |
24,170 |
|
|
$ |
— |
|
|
$ |
35,835 |
|
|
December 28, 2013 |
|
$ |
10,229 |
|
|
$ |
1,436 |
|
|
$ |
— |
|
|
$ |
11,665 |
|
78