Attached files
| file | filename |
|---|---|
| EX-23.1 - EX-23.1 - Hatteras Financial Corp | hts-ex231_11.htm |
| EX-31.2 - EX-31.2 - Hatteras Financial Corp | hts-ex312_10.htm |
| EX-32.2 - EX-32.2 - Hatteras Financial Corp | hts-ex322_9.htm |
| EX-12.1 - EX-12.1 - Hatteras Financial Corp | hts-ex121_6.htm |
| EX-21.1 - EX-21.1 - Hatteras Financial Corp | hts-ex211_7.htm |
| EX-32.1 - EX-32.1 - Hatteras Financial Corp | hts-ex321_12.htm |
| EX-31.1 - EX-31.1 - Hatteras Financial Corp | hts-ex311_8.htm |
UNITED STATES
SECURITIES AND EXCHANGE COMMISSION
Washington, D.C. 20549
FORM 10-K
|
x |
ANNUAL REPORT PURSUANT TO SECTION 13 OR 15(d) OF THE SECURITIES EXCHANGE ACT OF 1934 |
For the Fiscal Year Ended December 31, 2015
OR
|
¨ |
TRANSITION REPORT PURSUANT TO SECTION 13 OR 15(d) OF THE SECURITIES EXCHANGE ACT OF 1934 |
For the transition period from ______ to ______.
Commission file number 001-34030
HATTERAS FINANCIAL CORP.
(Exact name of registrant as specified in its charter)
|
Maryland |
|
26-1141886 |
|
(State or other jurisdiction of incorporation or organization) |
|
(IRS Employer Identification No.) |
|
|
|
|
|
751 W. Fourth Street, Suite 400 Winston Salem, North Carolina |
|
27101 |
|
(Address of principal executive offices) |
|
(Zip Code) |
(336) 760-9347
(Registrant’s telephone number, including area code)
Securities registered pursuant to Section 12(b) of the Act:
|
Title of each class |
|
Name of each exchange on which registered |
|
Common stock, $0.001 par value |
|
New York Stock Exchange |
|
7.625% Series A Cumulative Redeemable Preferred stock, $0.001 par value |
|
New York Stock Exchange |
Securities registered pursuant to Section 12(g) of the Act: None
Indicate by check mark if the registrant is a well-known seasoned issuer, as defined in Rule 405 of the Securities Act. Yes x No ¨
Indicate by check mark if the registrant is not required to file reports pursuant to Section 13 or Section 15(d) of the Exchange Act. Yes ¨ No x
Indicate by check mark whether the registrant (1) has filed all reports required to be filed by Section 13 or 15(d) of the Securities Exchange Act of 1934 during the preceding 12 months (or for such shorter period that the registrant was required to file such reports), and (2) has been subject to such filing requirements for the past 90 days. Yes x No ¨
Indicate by check mark whether the registrant has submitted electronically and posted on its corporate Web site, if any, every Interactive Data File required to be submitted and posted pursuant to Rule 405 of Regulation S-T during the preceding 12 months (or for such shorter period that the registrant was required to submit and post such files). Yes x No ¨
Indicate by check mark if disclosure of delinquent filers pursuant to Item 405 of Regulation S-K is not contained herein, and will not be contained, to the best of the registrant’s knowledge, in definitive proxy or information statements incorporated by reference in Part III of this Form 10-K or any amendment to this Form 10-K. x
Indicate by check mark whether the registrant is a large accelerated filer, an accelerated filer, a non-accelerated filer or a smaller reporting company. See the definitions of “large accelerated filer,” “accelerated filer” and “smaller reporting company” in Rule 12b-2 of the Exchange Act. Check one:
|
Large accelerated filer |
|
x |
|
Accelerated filer |
|
¨ |
|
Non-accelerated filer |
|
¨ (Do not check if a smaller reporting company) |
|
Smaller reporting company |
|
¨ |
Indicate by check mark whether the registrant is a shell company (as defined in Rule 12b-2 of the Exchange Act). Yes ¨ No x
The aggregate market value of the voting and non-voting common equity held by non-affiliates of the registrant was approximately $1,577,685,818 based on the closing price on the New York Stock Exchange as of June 30, 2015.
Number of the registrant’s common stock outstanding as of February 23, 2016: 94,533,206
DOCUMENTS INCORPORATED BY REFERENCE
Portions of the registrant’s definitive Proxy Statement with respect to its 2016 Annual Meeting of Shareholders to be filed not later than 120 days after the end of the registrant’s fiscal year are incorporated by reference into Part II, Item 5 and Part III, Items 10,11,12,13 and 14 hereof as noted therein.
INDEX
|
Item No. |
|
|
Form 10-K |
|
|
|
PART I |
|
|
Item 1. |
|
|
3 |
|
Item 1A. |
|
|
7 |
|
Item 1B. |
|
|
27 |
|
Item 2. |
|
|
27 |
|
Item 3. |
|
|
27 |
|
Item 4. |
|
|
27 |
|
|
|
PART II |
|
|
Item 5. |
|
|
27 |
|
Item 6. |
|
|
29 |
|
Item 7. |
|
Management’s Discussion and Analysis of Financial Condition and Results of Operations |
32 |
|
Item 7A. |
|
|
55 |
|
Item 8. |
|
|
58 |
|
Item 9. |
|
Changes in and Disagreements with Accountants on Accounting and Financial Disclosure |
58 |
|
Item 9A. |
|
|
58 |
|
Item 9B. |
|
|
59 |
|
|
|
PART III |
|
|
Item 10. |
|
|
59 |
|
Item 11. |
|
|
59 |
|
Item 12. |
|
Security Ownership of Certain Beneficial Owners and Management and Related Stockholder Matters |
59 |
|
Item 13. |
|
Certain Relationships and Related Transactions, and Director Independence |
59 |
|
Item 14. |
|
|
59 |
|
|
|
PART IV |
|
|
Item 15. |
|
|
59 |
Cautionary Note Regarding Forward-Looking Statements
This report contains various “forward-looking statements” within the meaning of Section 27A of the Securities Act of 1933, as amended (the “Securities Act”), and Section 21E of the Securities Exchange Act of 1934, as amended (the “Exchange Act”). Such statements include, in particular, statements about our plans, intentions, expectations, beliefs, and strategies as they relate to our business as described herein. You can identify forward-looking statements by the use of forward-looking terminology such as “believes,” “expects,” “may,” “will,” “would,” “could,” “should,” “seeks,” “approximately,” “intends,” “plans,” “projects,” “estimates” or “anticipates” or the negative of these words and phrases or similar words or phrases. Forward‑looking statements in this report include, among others, statements about our future financial condition, results of operations, our investment, financing and hedging strategies and objectives, the effects of movements in interest rates on our assets and liabilities (including our hedging instruments) and our net income, the effect of increased prepayment rates on the value of our assets, and expected liquidity needs and sources (including our ability to obtain financing or raise capital).
Although we believe that our plans, intentions, expectations and beliefs reflected in or suggested by such forward-looking statements are reasonable, we cannot assure you that our plans, intentions, expectations or beliefs will be achieved. If a change occurs, our business, financial condition, liquidity and results of operations may vary materially from those expressed in our forward-looking statements. The following factors could cause actual results to vary from our forward-looking statements:
|
|
· |
changes in interest rates, interest rate spreads or the yield curve; |
|
|
· |
changes in prepayment rates of mortgages underlying our assets; |
|
|
· |
the occurrence, extent and timing of credit losses within our portfolio; |
|
|
· |
the concentration of the credit risks to which we are exposed; |
|
|
· |
legislative and regulatory actions affecting our business; |
|
|
· |
increases in payment delinquencies and defaults on the mortgages comprising and underlying our target assets; |
|
|
· |
changes in liquidity in the market for real estate securities, the re-pricing of credit risk in the capital markets, inaccurate ratings of securities by rating agencies, rating agency downgrades of securities, and increases in the supply of real estate securities available-for-sale; |
|
|
· |
changes in our investment, financing and hedging strategies and the new risks to which those changes may expose us; |
|
|
· |
changes in the competitive landscape within our industry, including changes that may affect our ability to attract and retain personnel; |
|
|
· |
our ability to build and maintain successful relationships with loan originators; |
|
|
· |
our ability to acquire mortgage loans in connection with our mortgage loan conduit program; |
|
|
· |
our ability to securitize the mortgage loans we acquire; |
|
|
· |
our exposure to legal and regulatory claims, including litigation arising from our involvement in securitization transactions and investments in mortgage servicing rights (“MSR”); |
|
|
· |
our ability to acquire MSR and successfully operate our seller-servicer subsidiary and oversee our subservicers; and |
|
|
· |
our ability to borrow or raise capital to finance our assets. |
These and other risks, uncertainties and factors, including those set forth under the sections captioned “Risk Factors” and “Management’s Discussion and Analysis of Financial Condition and Results of Operations” herein, as updated by our quarterly and current reports that we file with the Securities and Exchange Commission (“SEC”), could cause our actual results to differ materially from those projected in any forward-looking statements we make.
We cannot guarantee future results, levels of activity, performance or achievements. You should not place undue reliance on forward-looking statements, which apply only as of the date of this report. We do not intend and disclaim any duty or obligation to update or revise any industry information or forward-looking statements set forth in this report to reflect new information, future events or otherwise, except as required under the U.S. federal securities laws.
2
PART I
In this report, unless the context suggests otherwise, references to “our company,” “we,” “us” and “our” refers to Hatteras Financial Corp., a Maryland corporation, and its consolidated subsidiaries, and “manager” refers to Atlantic Capital Advisors LLC, a North Carolina limited liability company (“ACA”).
Our Company
We are an externally-managed mortgage real estate investment trust (“REIT”) that invests primarily in single-family residential mortgage real estate assets, such as mortgage-backed securities (“MBS”), MSR, residential mortgage loans and other financial assets. MBS are pass-through securities consisting of a pool of mortgage loans. To date, the majority of our investments have been MBS issued or guaranteed by a U.S. Government agency, such as Ginnie Mae, or by a U.S. Government-sponsored enterprise, such as Fannie Mae or Freddie Mac. We refer to these securities as “agency securities.” We were incorporated in Maryland in September 2007. We listed our common stock on the New York Stock Exchange (“NYSE”) in April 2008 and trade under the symbol “HTS.”
Our business operations are primarily comprised of the following:
|
Hatteras Financial Corp., the parent company |
Invests primarily in various types of residential mortgage assets with a focus on agency securities. |
|
Onslow Bay Financial LLC |
Wholly owned subsidiary formed to acquire, invest in, securitize and manage non-agency mortgage loans. |
|
First Winston Securities, Inc. |
Wholly owned subsidiary that operates as a broker-dealer, and is a member of the Financial Industry Regulatory Authority. |
|
Wind River TRS LLC |
Wholly owned subsidiary which invests in and manages MSR, both for us and for third parties, via its acquisition of Pingora Asset Management LLC (“PAM”) and Pingora Loan Servicing LLC (“PLS”). |
We are organized and conduct our operations to qualify as a REIT under the Internal Revenue Code of 1986, as amended (the “Code”), and generally are not subject to federal taxes on our income to the extent we timely distribute our income to our shareholders and maintain our qualification as a REIT.
Our Strategy
Our principal goal is to provide an attractive risk-adjusted total return to our shareholders over the long term, primarily through dividends and secondarily through capital appreciation. We selectively acquire and manage an investment portfolio of real estate financial assets, with the aim of generating attractive returns throughout interest rate cycles. We focus on asset selection and implement a relative value investment approach across various sectors within the residential mortgage market. Our primary investment assets include the following:
|
|
· |
Agency MBS, meaning MBS whose principal and interest payments are guaranteed by Ginnie Mae, Fannie Mae, or Freddie Mac; |
|
|
· |
Other agency issued securities, such as credit-risk transfer (“CRT”) bonds; |
|
|
· |
MSR; |
|
|
· |
Non-agency securities, meaning MBS that are not issued or guaranteed by Ginnie Mae, Fannie Mae, or Freddie Mac; |
|
|
· |
Residential mortgage loans; and |
|
|
· |
Other real estate related assets as permitted by our investment guidelines and REIT requirements. |
Our primary business since inception has been owning and managing agency securities, with a primary focus on adjustable-rate mortgage (“ARM”) securities. We currently intend for agency securities to continue to be the majority of our investment assets. As part of this strategy we employ financing, or leverage, to increase our returns. Much of this financing is short-term, which exposes us to interest rate risk. To reduce this risk to levels we believe are acceptable, we use various hedges, such as interest rate swaps, swaptions and futures contracts. We may, subject to maintaining our REIT qualification, also employ other hedging instruments from time to time, including interest rate caps, collars, and “to-be-announced” (“TBA”) securities to protect against adverse interest rate movements.
In August of 2015, Wind River TRS LLC, our wholly owned subsidiary, acquired PAM and PLS (together, “Pingora”). Pingora owns and manages our MSR portfolio as well as MSR portfolios for third parties. As an investor in MSR, we purchase the right to
3
control the servicing of mortgage loans from high-quality originators. We do not directly service the mortgage loans we acquire, nor the mortgage loans underlying the MSR we acquire; rather, we contract with licensed third-party subservicers to handle substantially all servicing functions. In addition to allowing us to own and manage MSR as an additional asset class, we believe Pingora provides attractive synergies with our other lines of business.
In general, our strategy focuses on managing the interest rate risk related to our mortgage assets along with our exposure to credit risk. The table below shows the percentage of our capital allocated to each of our investment strategies as of December 31, 2015:
|
|
December 31, 2015 |
|
|
|
|
|
|
|
|
Agency investments |
|
78.4 |
% |
|
Non-agency investments |
|
7.6 |
% |
|
Mortgage servicing rights |
|
14.0 |
% |
|
Total |
|
100.0 |
% |
Prior to 2015, we had allocated essentially all of our capital to investing in agency securities. We believe the diversification of our investment strategy will provide us with a more efficient portfolio and additional flexibility to allocate capital to our investments opportunistically based on our expectation of market conditions.
Due to our significant exposure to interest rate risk from our investments, we focus on constructing a portfolio with a short effective duration, which we believe limits the impact of changes in interest rates on the market value of our portfolio and on our net interest margin (interest income less financing costs). However, because our investments vary in interest rate, prepayment speed and maturity, the leverage or borrowings that we employ to fund our asset purchases will never exactly match the terms or performance of our assets, even after we have employed our hedging techniques. Based on our manager’s experience, the interest rates of our assets will change more slowly than the corresponding short-term rates on the borrowings used to finance our assets. Consequently, changes in interest rates, particularly short-term interest rates, may significantly influence our net income and shareholders’ equity.
Our manager’s approach to managing our investment portfolio is to take a longer term view of assets and liabilities; accordingly, our periodic earnings and mark-to-market valuations at the end of a period will not significantly influence our strategy of providing cash distributions to shareholders over the long term. Our manager has invested and seeks to invest in mortgage assets that it believes are likely to generate attractive risk-adjusted returns on capital invested, after considering (1) the amount and nature of anticipated cash flows from the asset, (2) our ability to borrow against the asset, (3) the capital requirements resulting from the purchase and financing of the asset, and (4) the costs of financing, hedging, and managing the asset.
Our Assets
Agency Securities – The majority of our invested assets have been in agency MBS, and we currently intend that the majority of our investment assets will continue to be agency MBS. We invest in both adjustable-rate and fixed-rate MBS. ARMs are mortgage loans that have floating interest rates that reset on a specific time schedule, such as monthly, quarterly or annually, based on a specified index, such as the 12-month moving average of the one-year constant maturity U.S. Treasury rate (“CMT”) or the London Interbank Offered Rate (“LIBOR”). The ARMs we generally invest in, sometimes referred to as hybrid ARMs, have interest rates that are fixed for an initial period (typically three, five, seven or 10 years) and then reset annually thereafter to an increment over a pre-determined interest rate index. Until late 2015, all of our fixed-rate MBS have been 10-year and 15-year amortizing fixed-rate securities. Late in 2015, we began purchasing 30-year fixed-rate securities. We also invest in CRT securities issued by Fannie Mae and Freddie Mac (“agency CRT securities”). As of December 31, 2015, our investment portfolio consisted of approximately $14.4 billion in market value of MBS and agency CRT securities, consisting of $13.4 billion of adjustable rate securities and $1.0 billion of fixed-rate securities.
We purchase a substantial portion of our agency securities through delayed delivery transactions (forward purchase commitments), including TBA securities. At times when market conditions are conducive, we may choose to move the settlement of these TBA securities out to a later date by entering into an offsetting short position in the near month, which is then net settled for cash, and simultaneously entering into a substantially similar TBA contract for a later settlement date. Such a set of transactions is referred to as a TBA “dollar roll” transaction. The TBA securities purchased at the later settlement date are typically priced at a discount to securities for settlement in the current month. This difference is referred to as the “price drop.” The price drop represents compensation to us for foregoing net interest margin and is referred to as TBA “dollar roll income.” Specified pools of mortgage loans can also be the subject of a dollar roll transaction, when market conditions allow.
Non-agency Investments – We own non-agency investments both in the form whole loans and, at times, MBS. We invest in prime non-conforming residential whole mortgage loans through our wholly owned subsidiary, Onslow Bay Financial LLC (“Onslow”). Onslow acquires such loans from select mortgage loan originators and secondary market institutions with the intent to securitize the loans through the issuance of non-agency MBS. Our intention is to generally retain the related subordinated securities, representing the credit risk tranche associated with these securitization transactions, as well as portions of the AAA tranches. While we purchase loans
4
with the intent of securitization, depending on our view of the securitization market, we may decide to retain some amount of the whole loans as a direct investment. We do not originate loans or provide direct financing to lenders; rather, through our mortgage loan conduit we contract with originators to acquire loans they originate that meet our purchase criteria. We completed our first securitization during the fourth quarter of 2015 and we may complete additional securitizations in the coming year, subject to market conditions.
Mortgage Servicing Rights – We invest in the income from MSR through ownership interests in our wholly owned subsidiary, PLS. We view MSR income as a complimentary asset to our overall investment portfolio. As an asset that is generally inverse in nature to interest rate changes when compared to our agency securities, we believe that the inclusion of MSR in our strategic mix is beneficial not only in providing earnings stability, but also as an offset to value changes in our interest-earning portfolio. The MSR we own are all on agency loans, and almost all of these loans are fixed-rate in nature.
Our Borrowings
We use leverage as part of our investment strategy. Borrowing against our assets can increase returns, but also increases the risk associated with our portfolio. Our primary source of debt is repurchase agreements, which are collateralized borrowings. Our repurchase agreements generally have maturities that range from one month to one year, although occasionally we may enter into longer term borrowing agreements to more closely match the rate adjustment period of our securities. We also borrow against our mortgage loans using warehouse lines of credit structured as repurchase agreements. These warehouse lines will generally have annual maturities, with various covenants regarding the amount, type and time that various mortgage loans can remain on the line. Another source of borrowing that we have for our mortgage loans is our securitization debt. By securitizing and selling certain portions of the securitization trust, we effectively achieve long-term funding for a portion of our loan portfolio.
We intend that our borrowings will generally be between six and nine times the amount of our shareholders’ equity. The level of our borrowings may vary periodically above or below this range depending on market conditions. In addition, dollar roll transactions, as described above, represent a form of financing that can be either on or off balance sheet, depending on whether the security being rolled is a specified pool (results in on-balance sheet financing) or a TBA security (results in off-balance sheet financing).
Our Hedging
Our hedging strategies are designed to reduce the impact on our income and shareholders’ equity caused by the potential adverse effects of changes in interest rates on our assets and liabilities. Subject to complying with REIT requirements, we use hedging techniques to seek to mitigate the differences between the interest rate adjustments on our assets and borrowings as well as the risk of adverse changes in interest rates on the value of our assets. These techniques primarily consist of entering into interest rate swap agreements and buying and selling futures contracts. We may also enter into interest rate cap, floor or collar agreements, purchase put and call options on securities or securities underlying futures contracts, or enter into forward rate agreements. As of September 30, 2013, we no longer pursue hedge accounting treatment for our interest rate swaps. As a result, our net income may suffer because losses on the derivatives we enter into may not be offset in net income by changes in the cash flows or fair value of the related hedged transaction, if the hedged item is an available-for-sale security. Consequently, any declines in the hedged interest rates of available-for-sale securities would result in a charge to net income.
Purpose of and Changes in Strategies
Our investment, financing and hedging strategies are designed to:
|
|
· |
limit credit risk; |
|
|
· |
manage cash flows so as to provide for regular quarterly distributions to our shareholders; |
|
|
· |
manage financing risks; |
|
|
· |
mitigate the fluctuations in the market value of our mortgage assets due to changing interest rates; |
|
|
· |
reduce the impact that changing interest rates have on our net interest margin; |
|
|
· |
maintain our qualification as a REIT; and |
|
|
· |
comply with available exemptions from regulation as an investment company under the Investment Company Act of 1940, as amended (the “Investment Company Act”). |
Our board of directors has adopted a policy that currently requires the majority of our investments to be agency securities. Due to changes in market conditions, the market value and duration of our securities will fluctuate from time to time and may cause our investment portfolio allocations to be inconsistent with the investment strategies described in this report. In such event, in consultation with our board of directors, our manager may recommend that we reallocate our investment portfolio. Subject to our intent to qualify for an exemption from registration under the Investment Company Act and to maintain our qualification as a REIT, our board of directors,
5
with the approval of a majority of our independent directors, may vary our investment strategy, our financing strategy or our hedging strategy at any time.
Our Manager
We are externally-managed and advised by our manager, Atlantic Capital Advisors LLC. We believe our relationship with our manager enables us to leverage our manager’s infrastructure, business relationships and management expertise to execute our investment strategy effectively. We believe that our manager’s expertise in mortgage REIT operations, agency securities, whole loans and leveraged finance markets enhances our ability to acquire assets opportunistically and to finance those assets in a manner designed to generate consistent risk-adjusted returns for our shareholders.
Pursuant to the terms of the management agreement, our manager provides us with our management team, including a chief executive officer and a chief financial officer (each of whom also serves as an officer of our manager) along with appropriate support personnel. Our manager is responsible for our operations and the performance of all services and activities relating to the management of our assets and operations, subject to the direction of our board of directors.
ACA manages both our company and ACM Financial Trust (“ACM”), a privately-held mortgage REIT founded in 1998. Michael R. Hough, our chief executive officer, is also the chief executive officer of our manager and ACM. Our president Benjamin M. Hough, chief financial officer Kenneth A. Steele and chief investment officer Frederick J. Boos, II are all also executives of our manager and of ACM. As of December 31, 2015, ACM owned approximately $1.1 billion in MBS. We do not own any interest in ACM.
The Management Agreement
Our management functions are provided by our manager, ACA. Our relationship with ACA is controlled by a management agreement. The management agreement requires our manager to manage our business affairs in conformity with policies and investment guidelines that are approved by a majority of our independent directors and monitored by our board of directors. Our manager is subject to the direction and oversight of our board of directors. Our manager is responsible for (1) the identification, selection, purchase and sale of our investments, (2) our financing and risk management activities, and (3) providing us with investment advisory services. In addition, our manager is responsible for our day-to-day operations.
The term of the management agreement expires on February 23, 2017. Under the terms of the agreement, it will automatically renew for an additional one year term on February 23 of each year thereafter unless terminated or otherwise renegotiated.
Our manager is entitled to receive a management fee payable monthly in arrears in an amount equal to 1/12th of an amount determined as follows:
|
|
· |
for our equity up to $250 million, 1.50% (per annum) of equity; plus |
|
|
· |
for our equity in excess of $250 million and up to $500 million, 1.10% (per annum) of equity; plus |
|
|
· |
for our equity in excess of $500 million and up to $750 million, 0.80% (per annum) of equity; plus |
|
|
· |
for our equity in excess of $750 million, 0.50% (per annum) of equity. |
For purposes of calculating the management fee, we define equity as the value, computed in accordance with U.S. generally accepted accounting principles (“GAAP”), of our shareholders’ equity, adjusted to exclude the effects of unrealized gains or losses. Under the terms of the management agreement, we also reimburse ACA for certain expenses relating to our operations.
There is no incentive compensation payable to our manager pursuant to the management agreement, although from time to time we may issue long-term equity incentive compensation to employees of ACA, including those that are executive officers of our company.
Competition
Our success depends, in large part, on our ability to acquire assets at favorable spreads over our borrowing costs. In acquiring mortgage assets, we compete with other mortgage REITs, mortgage finance and specialty finance companies, savings and loan associations, banks, mortgage bankers, insurance companies, mutual funds, institutional investors, investment banking firms, governmental bodies and other entities. In addition, there are numerous mortgage REITs with similar asset acquisition objectives, including ACM, and others may be organized in the future. The effect of the existence of additional REITs may be to increase competition for the available supply of mortgage assets suitable for purchase.
Operating Segments
We manage our business on an aggregated, single segment basis for purposes of assessing performance and making operating decisions, and accordingly, have only one reporting and operating segment.
6
Employees
We are managed by ACA pursuant to the management agreement between ACA and us. As of the date of this report, we have 44 employees in our operating subsidiaries and our manager has an additional 17 employees.
Additional Information
Our principal offices are located at 751 W. Fourth Street, Suite 400, Winston-Salem, North Carolina 27101. Our telephone number is (336) 760-9347.
We have made available any materials we file with the SEC, including our Annual Reports on Form 10-K, Quarterly Reports on Form 10-Q, Current Reports on Form 8-K, and amendments to those reports, on our website at www.hatfin.com free of charge. Copies of these documents are available in print to any shareholder who requests them. Requests should be sent to Hatteras Financial Corp., 751 W. Fourth Street, Suite 400, Winston-Salem, North Carolina 27101, Attention: Corporate Secretary. Also posted on our website, and available in print upon request, are charters of each committee of our board of directors, our code of business conduct and ethics, our corporate governance guidelines and our whistleblower policy. Within the time period required by the SEC, we will post on our website any amendment to our code of business conduct and ethics and any waiver applicable to any executive officer, director or senior financial officer. However, the information located on, or accessible from, our website is not, and should not be deemed to be, part of this report or incorporated into any other filing that we submit to the SEC.
All reports, proxy and information statements and other information we file with the SEC may also be read and copied at the SEC’s public reference room at 100 F Street, N.E., Washington, D.C. 20549. Further information regarding the operation of the public reference room may be obtained by calling 1-800-SEC-0330. In addition, all materials we file with the SEC can be obtained at the SEC’s website at www.sec.gov.
Investment in our stock involves significant risks. If any of the risks discussed in this report occur, our business, financial condition, liquidity and results of operations could be materially and adversely affected. The risk factors set forth below are not the only risks that may affect us. Additional risks and uncertainties not presently known to us, or not identified below, may also materially affect our business, financial condition, liquidity and results of operations. Some statements in this report, including statements in the following risk factors, constitute forward-looking statements. Please refer to the section entitled “Cautionary Note Regarding Forward-Looking Statements.”
The risk factors below are broken into five broad categories:
|
|
· |
Risks Related to Our Management and Conflicts of Interest |
|
|
· |
Risks Related to Our Business |
|
|
· |
Risks Related to Debt Financing |
|
|
· |
Risks Related to Our Corporate Structure |
|
|
· |
Federal Income Tax Risks |
Risks Related to Our Management and Conflicts of Interest
We are dependent upon key employees of our manager, and we may not find suitable replacements if these key personnel are no longer available to us.
Our success depends to a significant degree upon the contributions of Messrs. Michael and Benjamin Hough and Messrs. Steele and Boos, whose continued service is not guaranteed, and each of whom would be difficult to replace. Because these key personnel collectively have a substantial amount of experience in the fixed income markets and prior experience managing a mortgage REIT, we depend on their experience and expertise to manage our day-to-day operations and our strategic business direction. In addition, many of these individuals have strong industry reputations, which aid us in identifying and financing investment opportunities. The loss of the services of these key personnel could diminish our relationships with lenders, and industry personnel and harm our business and our prospects. We cannot assure you that these individuals can be replaced with equally skilled and experienced professionals.
Termination by us of our management agreement with our manager without cause is difficult and costly.
Our management agreement is automatically renewed each year on February 23 for a one-year term unless terminated or otherwise renegotiated. Our independent directors review our manager’s performance periodically and the management agreement may be terminated upon the affirmative vote of at least two-thirds of our independent directors, or by a vote of the holders of a majority of our
7
outstanding common stock, based upon: (1) unsatisfactory performance by our manager that is materially detrimental to us or (2) a determination that the management fees payable to our manager are not fair, subject to our manager’s right to prevent such a termination by accepting a reduction of management fees agreed to by at least two-thirds of our independent directors and our manager.
We must provide 180 days’ prior notice of any such termination. Our manager will be paid a termination fee equal to four times the average annual management fee earned by our manager during the two years immediately preceding termination. The termination fee may make it more difficult for us to terminate the management agreement. These provisions increase the cost to us of terminating the management agreement, thereby adversely affecting our ability to terminate our manager without cause.
Our manager may allocate mortgage-related opportunities to ACM, and thus may divert attractive investment opportunities away from us.
Each of our executive officers and some of our directors also serve as officers and owners of our manager. Our manager is also the external manager of ACM, a private mortgage REIT with investment objectives that are similar to ours. Furthermore, two of our executive officers, Messrs. Michael and Benjamin Hough are also executive officers and directors of ACM. Mr. Steele serves as our chief financial officer and also as chief financial officer of ACM. Mr. Boos serves as our chief investment officer and also as chief investment officer of ACM. Our executive officers, who as of December 31, 2015, collectively and beneficially owned approximately 0.7% of the outstanding common stock of ACM on a diluted basis, intend to continue in such capacities with ACM. Most investment opportunities that are suitable for us are also suitable for ACM; therefore, these dual responsibilities create conflicts of interest for these officers in the event they are presented with opportunities that may benefit either us or ACM. Our management agreement requires our manager to allocate investments between us and ACM by determining the entity for which they believe the investment opportunity is most suitable. In making this determination, our manager considers the investment strategy and guidelines of each entity with respect to acquisition of assets, portfolio needs, market conditions, cash flow and other factors that they deem appropriate. However, our manager generally has no obligation to make any specific investment opportunities available to us, and the above mentioned conflicts of interest may result in decisions or allocations of securities that may benefit one entity more than the other. Thus, the executive officers of our manager could direct attractive investment opportunities to ACM instead of to us. Such events could result in us investing in investments that provide less attractive returns, reducing the level of distributions we may be able to pay to our shareholders.
Furthermore, in the future our manager may sponsor or provide management services to other investment vehicles with investment objectives that overlap with ours. Accordingly, we may further compete for access to the benefits that we expect our relationship with our manager to provide and for the time of its key employees.
Our manager and its key employees, who are our executive officers, face competing demands relating to their time and this may adversely affect our operations.
We rely on our manager and its employees, including Messrs. Michael and Benjamin Hough and Messrs. Steele and Boos, for the day-to-day operation of our business. Our manager is also the manager of ACM and each of the key employees of our manager are executive officers of ACM. As a result of their interests in ACM, Messrs. Michael and Benjamin Hough and Messrs. Steele and Boos face conflicts of interest in allocating their time among us and ACM.
Because our manager has duties to ACM as well as to our company, we do not have the undivided attention of the management team of our manager and our manager faces conflicts in allocating management time and resources between our company and ACM. Further, during turbulent market conditions or other times when we need focused support and assistance from our manager, ACM or other entities for which our manager also acts as an investment manager will likewise require greater focus and attention, placing competing high levels of demand on our manager’s limited resources. In such situations, we may not receive the necessary support and assistance we require or would otherwise receive if we were internally managed or if our manager did not act as a manager for other entities.
Our board of directors approved broad investment guidelines for our manager and do not approve each investment decision made by our manager; as a result, our manager may cause us to acquire or sell assets such that our investment portfolio produces investment returns that are below expectations or that result in net operating losses.
Our manager is authorized to follow broad investment guidelines. Our board of directors, including our independent directors, periodically reviews our investment guidelines and our investment policies. However, our board of directors does not review each proposed investment. In addition, in conducting periodic reviews, the board of directors relies primarily on information provided to it by our manager. Furthermore, purchases and sales of investments entered into by our manager may be difficult or impossible to unwind by the time they are reviewed by the board of directors. Our manager has great latitude within the investment guidelines in determining the types of assets it may decide are proper investments for us.
8
Because our board of directors could change our investment policies without shareholder approval to permit us to invest more heavily in investments other than agency securities, we may invest in assets that bear greater credit, interest rate, prepayment or passive investment risks.
Our board of directors has adopted a policy that currently requires that the majority of our investments be agency securities. Due to changes in market conditions, subject to our intent to qualify for an exemption from registration under the Investment Company Act and to maintain our qualification as a REIT, our board of directors, with the approval of a majority of our independent directors and without shareholder approval, may vary our investment strategy, our financing strategy or our hedging strategy at any time. For example, recently we have made investments in MSR and individual prime jumbo whole loans with a goal of securitizing them into non-agency MBS. Our board of directors could further change our investment policies to permit us to invest more heavily in investments other than agency securities, such as other investment-grade mortgage assets, other real estate-related investments (which may not be investment grade) that management determines are consistent with our asset allocation policy and with our tax status as a REIT, and the securities of other REITs. If we acquire investments of lower credit quality, our profitability may decline and we may incur losses if there are defaults on assets underlying those investments or if the rating agencies downgrade the credit quality of those investments.
Investing in other REITs involves obtaining interests in real estate-related investments indirectly, which carries several risks, including the following:
|
|
· |
returns on our investments are not directly linked to returns on the assets of the REITs in which we invest; |
|
|
· |
we may have no ability to affect the management, investment decisions or operations of the REITs in which we invest; |
|
|
· |
prices of publicly-traded securities are likely to be volatile; and |
|
|
· |
the disposition value of investments is dependent upon general and specific market conditions. |
Each of these risks could cause the performance of our investments in other REITs to be lower than anticipated, which would adversely impact the overall returns for our investment portfolio.
Our manager’s management fee is payable regardless of the performance of our portfolio.
Our manager is entitled to receive a management fee from us that is based on the amount of our equity (as defined in the management agreement), regardless of the performance of our investment portfolio. For example, we would pay our manager a management fee for a specific period even if we experienced a net loss during the same period. Our manager’s entitlement to this compensation might reduce its incentive to devote its time and effort to seeking investments that provide attractive risk-adjusted returns for our investment portfolio. This in turn could adversely affect our ability to make distributions to our shareholders and the market price of our stock.
Risks Related to Our Business
Difficult conditions in the residential mortgage and real estate markets as well as the broader financial markets and economy generally may adversely affect our business, results of operations and financial condition.
Our results of operations are materially affected by conditions in the residential mortgage and real estate markets, including the market for MBS, as well as the broader financial markets and the economy generally. In recent years, concerns about the mortgage market, significant declines in home prices, increases in home foreclosures, high unemployment, the availability and cost of financing, and rising government debt levels, as well as inflation, energy costs, U.S. budget debates and European sovereign debt issues, have contributed to increased volatility and uncertainty for the economy and financial markets. In particular, the residential mortgage market in the United States has experienced a variety of difficulties and changed economic conditions, including defaults, credit losses and liquidity concerns. Certain commercial banks, investment banks and insurance companies have announced extensive losses from exposure to the residential mortgage market. These factors have impacted investor perception of the risk associated with MBS in which we invest. As a result, values for MBS in which we invest have experienced volatility. Any decline in the value of our investments, or perceived market uncertainty about their value, would likely make it difficult for us to obtain financing on favorable terms or at all, or maintain our compliance with terms of any financing arrangements already in place. Further increased volatility or stagnation in, or deterioration of, the residential mortgage and MBS markets may adversely affect the performance and market value of our investments.
The federal conservatorship of Fannie Mae and Freddie Mac and related efforts, along with any changes in laws and regulations affecting the relationship between Fannie Mae and Freddie Mac and the federal government, may adversely affect our business.
The payments we expect to receive on the agency securities in which we invest depend upon a steady stream of payments on the mortgages underlying the securities and are guaranteed by Ginnie Mae, Fannie Mae and Freddie Mac. Ginnie Mae is part of a U.S. Government agency and its guarantees are backed by the full faith and credit of the United States. Fannie Mae and Freddie Mac are U.S. Government-sponsored enterprises, but their guarantees are not backed by the full faith and credit of the United States.
In 2008, after Fannie Mae and Freddie Mac were placed in federal conservatorship, the Secretary of the U.S. Treasury noted that the guarantee payment structure of Fannie Mae and Freddie Mac required examination, and that changes in the structures of the entities
9
were necessary. The future roles of Fannie Mae and Freddie Mac, if any, could be significantly reduced and the nature of their guarantees could be eliminated or considerably limited relative to historical measurements. Any changes to the nature of the guarantees provided by Fannie Mae and Freddie Mac, if any, could redefine what constitutes an agency security and could have broad adverse market implications as well as negatively impact us.
The problems faced by Fannie Mae and Freddie Mac resulting in their being placed into federal conservatorship have stirred debate among some federal policy makers regarding the continued role of the U.S. Government in providing liquidity for the residential mortgage market. Following expiration of the current authorization, each of Fannie Mae and Freddie Mac could be dissolved and the U.S. Government could decide to stop providing liquidity support of any kind to the mortgage market. If Fannie Mae or Freddie Mac were eliminated, or their structures were to change radically, we would not be able to acquire agency securities from these companies, which would drastically reduce the amount and type of agency securities available for investment, which are our primary targeted investments.
Our income could be negatively affected in a number of ways depending on the manner in which related events unfold. For example, the current credit support provided by the U.S. Treasury to Fannie Mae and Freddie Mac, and any additional credit support it may provide in the future, could have the effect of lowering the interest rate we expect to receive from agency securities, thereby tightening the spread between the interest we earn on our portfolio of targeted assets and our cost of financing that portfolio. A reduction in the supply of agency securities could also negatively affect the pricing of agency securities we seek to acquire by reducing the spread between the interest we earn on our portfolio of targeted assets and our cost of financing that portfolio.
Future actions could further change the relationship between Fannie Mae and Freddie Mac and the federal government, and could also nationalize or eliminate such entities entirely. Any law affecting these government-sponsored enterprises may create market uncertainty and have the effect of reducing the actual or perceived credit quality of securities issued or guaranteed by Fannie Mae or Freddie Mac. As a result, such laws could increase the risk of loss on investments in Fannie Mae and/or Freddie Mac agency securities. It also is possible that such laws could adversely impact the market for such securities and spreads at which they trade. All of the foregoing could materially adversely affect our business, operations and financial condition.
Mortgage loan modification programs and future legislative action may adversely affect the value of, and the returns on, the MBS and MSR in which we invest.
Since 2008, the U.S. Government, through the Federal Housing Authority and the Federal Deposit Insurance Corporation, commenced implementation of programs designed to provide homeowners with assistance in avoiding residential mortgage loan foreclosures. The programs involve, among other things, the modification of mortgage loans to reduce the principal amount of the loans or the rate of interest payable on the loans, or to extend the payment terms of the loans. From time to time, additional programs have been proposed to assist severely trouble borrowers with their mortgage by way of loan modification. These loan modification programs, as well as future legislative or regulatory actions, including amendments to the bankruptcy laws, that result in the modification of outstanding mortgage loans may adversely affect the value of, and the returns on, the MBS and MSR in which we invest.
We cannot predict the impact, if any, on our earnings or cash available for distribution to our shareholders of the FHFA’s proposed revisions to Fannie Mae’s and Freddie Mac’s existing infrastructures to align the standards and practices of the three entities.
On February 21, 2012, the Federal Housing Finance Agency (“FHFA”) released its Strategic Plan for Enterprise Conservatorships, which set forth three goals for the next phase of the Fannie Mae and Freddie Mac conservatorships. These three goals are to (i) build a new infrastructure for the secondary mortgage market, (ii) gradually contract Fannie Mae and Freddie Mac’s presence in the marketplace while simplifying and shrinking their operations, and (iii) maintain foreclosure prevention activities and credit availability for new and refinanced mortgages. On October 4, 2012, the FHFA released its white paper entitled Building a New Infrastructure for the Secondary Mortgage Market, which proposes a new infrastructure for Fannie Mae and Freddie Mac that has two basic goals.
The first such goal is to replace the current, outdated infrastructures of Fannie Mae and Freddie Mac with a common, more efficient infrastructure that aligns the standards and practices of the two entities, beginning with core functions performed by both entities such as issuance, master servicing, bond administration, collateral management and data integration. The FHFA has taken steps to establish a common securitization platform (“CSP”) for residential MBS reflecting the feedback from a broad cross-section of industry participants. In September 2015, the FHFA released an update on the CSP, detailing progress made in the development of a new infrastructure for the securitization of single-family mortgages by Fannie Mae and Freddie Mac. The update looks ahead to the anticipated announcement in 2016 of an implementation date for the initial software release that will allow use of the CSP by Freddie Mac, followed by the second software release that will enable both Freddie Mac and Fannie Mae to use the CSP to issue MBS.
The second goal is to establish an operating framework for Fannie Mae and Freddie Mac that is consistent with the progress of housing finance reform and encourages and accommodates the increased participation of private capital in assuming credit risk associated with the secondary mortgage market.
The FHFA recognizes that there are a number of impediments to their goals which may or may not be surmountable, such as the absence of any significant secondary mortgage market mechanisms beyond Fannie Mae, Freddie Mac and Ginnie Mae, and that their proposals are in the formative stages. As a result, it is unclear if the proposals will be enacted. If such proposals are enacted, it is unclear
10
how closely what is enacted will resemble the proposals from the FHFA White Paper or what the effects of the enactment will be in terms of our net asset value, earnings or cash available for distribution to our shareholders
If we are unable to find suitable investments, we may not be able to achieve our investment objectives or pay dividends.
The availability of mortgage-related assets meeting our criteria depends upon, among other things, the level of activity and quality of and demand for securities in the mortgage securitization and secondary markets. The market for MBS depends upon various factors including the level of activity in the residential real estate market, the level of and difference between short-term and long-term interest rates, incentives for issuers to securitize mortgage loans and demand for MBS by institutional investors. The size and level of activity in the residential real estate lending market depends on various factors, including the level of interest rates, regional and national economic conditions and real estate values. To the extent we are unable to acquire a sufficient volume of mortgage-related assets meeting our criteria, our results of operations would be adversely affected. Furthermore, we cannot assure you that we will be able to acquire sufficient mortgage-related assets at spreads above our costs of funds.
A disproportionate rise in short-term interest rates as compared to longer-term interest rates may adversely affect our income.
The relationship between short-term and longer-term interest rates is often referred to as the “yield curve.” Ordinarily, short-term interest rates are lower than longer-term interest rates. If short-term interest rates rise disproportionately relative to longer-term interest rates (a flattening of the yield curve), our borrowing costs may increase more rapidly than the interest income earned on our assets. Because we expect our investments, on average, generally will bear interest based on longer-term rates than our borrowings, a flattening of the yield curve would tend to decrease our net interest margin and the market value of our net assets. Additionally, to the extent cash flows from investments that return scheduled and unscheduled principal are reinvested, the spread between the yields on the new investments and available borrowing rates may decline, which would likely decrease our net interest margin. It is also possible that short-term interest rates may exceed longer-term interest rates (a yield curve inversion), in which event our borrowing costs may exceed our interest income and we could incur operating losses.
A flat or inverted yield curve may adversely affect MBS and mortgage loan prepayment rates and supply.
Our net interest margin varies primarily as a result of changes in interest rates as well as changes in the shape of the yield curve. We believe that when the yield curve is relatively flat, borrowers have an incentive to refinance into mortgage loans with longer initial fixed rate periods and fixed rate mortgage loans, causing our adjustable-rate securities to experience faster prepayments. In addition, a flatter yield curve generally leads to fixed-rate mortgage rates that are closer to the interest rates available on adjustable-rate mortgages, possibly decreasing the supply of adjustable-rate securities. At times, short-term interest rates may increase and exceed long-term interest rates, causing an inverted yield curve. When the yield curve is inverted, fixed-rate mortgage loan rates may approach or be lower than adjustable-rate mortgage loan rates, further exacerbating these conditions. Increases in prepayments on our investment portfolio will cause our premium amortization to accelerate, lowering the yield on such assets. If this happens, we could experience a decrease in net income or incur a net loss during these periods, which may negatively impact our distributions to shareholders.
Interest rate mismatches between our interest-earning investments and the borrowings used to fund our purchases of these securities may reduce our income during periods of changing interest rates.
Historically, we have funded most of our investments with borrowings that have interest rates that adjust more frequently than the interest rate indices and repricing terms of our investments. Accordingly, if short-term interest rates increase, our borrowing costs may increase faster than the interest rates on our securities adjust. As a result, in a period of rising interest rates, we could experience a decrease in net income or a net loss. Interest rates are highly sensitive to many factors, including governmental, monetary and tax policies, domestic and international economic and political considerations and other factors, all of which are beyond our control.
Interest rate caps on our adjustable-rate MBS and mortgage loans may reduce our income or cause us to suffer a loss during periods of rising interest rates.
The mortgage loans underlying our adjustable-rate securities typically will be subject to periodic and lifetime interest rate caps. Additionally, we may invest in ARMs with an initial “teaser” rate that will provide us with a lower than market interest rate initially, which may accordingly have lower interest rate caps than ARMs without such teaser rates. Periodic interest rate caps limit the amount an interest rate can increase during a given period. Lifetime interest rate caps limit the amount an interest rate can increase through maturity of a mortgage loan. If these interest rate caps apply to the mortgage loans underlying our adjustable-rate securities, the interest distributions made on the related securities will be similarly impacted. Our borrowings may not be subject to similar interest rate caps. Accordingly, in a period of rapidly increasing interest rates, the interest rates paid on our borrowings could increase without limitation while caps would limit the interest distributions on our adjustable-rate MBS and mortgage loans. Further, some of the mortgage loans underlying our adjustable-rate MBS may be subject to periodic payment caps that result in a portion of the interest on those loans being deferred and added to the principal outstanding. As a result, we could receive less interest distributions on adjustable-rate MBS, particularly those with an initial teaser rate, than we need to pay interest on our related borrowings. These factors could lower our net
11
interest margin, cause us to suffer a net loss or cause us to incur additional borrowings to fund interest payments during periods of rising interest rates or sell our investments at a loss.
Because we own MBS with periods of fixed rates, an increase in interest rates may adversely affect our book value.
Increases in interest rates may negatively affect the market value of our MBS and mortgage loans. If an investment has a fixed rate, or is in a period where the rate is fixed, such as our hybrid ARMs, it generally will be more negatively affected by these increases than an investment with a currently adjustable-rate. In accordance with accounting rules, we are required to reduce our shareholders’ equity, or book value, by the amount of any decrease in the market value of our mortgage-related assets. Reductions in shareholders’ equity decrease the amounts we may borrow to purchase additional securities, which could restrict our ability to increase our net interest margin.
Our delayed delivery transactions, including TBA securities and dollar roll transactions, subject us to certain risks, including price risks and counterparty risks.
We purchase a substantial portion of our agency securities through delayed delivery transactions, including TBA securities and dollar roll transactions. In a delayed delivery transaction, we enter into a forward purchase agreement with a counterparty to purchase either (1) identified agency securities or (2) to-be-issued (or “to-be-announced”) agency securities with certain terms. As with any forward purchase contract, the value of the underlying agency securities may decrease between the contract date and the settlement date. Furthermore, a transaction counterparty may fail to deliver the underlying agency securities at the settlement date. If any of the above risks were to occur, our financial condition and results of operations may be materially adversely affected.
Because we acquire MBS that are backed by hybrid ARMs and fixed-rate securities, an increase in interest rates may adversely affect our profitability.
Most of our investments currently consist of MBS that are backed by hybrid ARMs, which have a fixed rate for an initial period of time before becoming adjustable-rate securities, or fixed-rate mortgage securities. As we typically hedge less than 100 percent of our funding cost exposure, during a period of rising interest rates the interest payments on our borrowings could increase, while the interest payments we earn on our hybrid mortgage securities and fixed-rate mortgage securities would not change. As a result, our returns would be reduced.
Changes in prepayment rates on our MBS may decrease our net interest margin.
Pools of mortgage loans underlie the MBS that we acquire. We receive principal distributions as payments are made on these underlying mortgage loans. Prepayment rates are influenced by changes in current interest rates and a variety of economic, geographic and other factors, all of which are beyond our control. Prepayment rates generally increase when interest rates fall and decrease when interest rates rise, but changes in prepayment rates are difficult to predict. Prepayment rates also may be affected by conditions in the housing and financial markets, government actions, general economic conditions and the relative interest rates on fixed-rate and adjustable-rate mortgage loans. Furthermore, specific government programs to support the housing market and U.S. economy, such as the Home Affordable Refinance Program and the three rounds of quantitative easing could cause variability in prepayment rates. Variations in our expected prepayments could adversely affect our profitability, including in the following ways:
|
|
· |
We may purchase MBS that have a higher interest rate than the market interest rate at the time of purchase. In exchange for this higher interest rate, we would be required to pay a premium over the face amount of the security to acquire the security. In accordance with accounting rules, we would amortize this premium over the term of the mortgage security. If principal distributions are received faster than anticipated, we would be required to expense the premium faster. |
|
|
· |
We may not be able to reinvest the principal distributions received on MBS in similar new MBS. Further, to the extent that we are able to reinvest, the effective interest rates on the new MBS may be lower than the yields on the mortgages that were prepaid. |
We also may acquire MBS at a discount. If the actual prepayment rates on a discount mortgage security are slower than anticipated at the time of purchase, we would be required to recognize the discount as income more slowly than anticipated. This would adversely affect our profitability. Slower than expected prepayments also may adversely affect the market value of a discount mortgage security.
Fannie Mae, Freddie Mac or Ginnie Mae guarantees of principal and interest related to agency securities do not protect us against prepayment risks.
Competition may prevent us from acquiring MBS at favorable yields and that would negatively impact our profitability.
Our net interest margin largely depends on our ability to acquire MBS at favorable spreads over our borrowing costs. In acquiring MBS, we compete with other mortgage REITs, mortgage finance and specialty finance companies, savings and loan associations, banks, mortgage bankers, insurance companies, mutual funds, institutional investors, investment banking firms, other lenders and other entities that purchase mortgage-related assets. Many of our competitors are substantially larger and have considerably greater financial,
12
technical and marketing resources than we do. Other REITs have raised, or may be expected to raise, significant amounts of capital, and may have investment objectives that overlap with ours, which may create competition for investment opportunities. As a result, we may not in the future be able to acquire sufficient MBS at favorable spreads over our borrowing costs which would adversely affect our profitability.
Rapid changes in the values of our real estate-related investments may make it difficult for us to maintain our qualification as a REIT or exemption from the Investment Company Act.
We may acquire non-real estate related assets in the event our independent directors change our investment strategies. If the market value or income potential of real estate-related investments declines as a result of increased interest rates, prepayment rates or other factors, we may need to increase our real estate investments and income and/or liquidate our non-qualifying assets in order to maintain our REIT qualification or exemption from the Investment Company Act. If the decline in real estate asset values and/or income occurs quickly, this may be especially difficult to accomplish. This difficulty may be exacerbated by the illiquid nature of any non-real estate assets that we may own. We may have to make investment decisions that we otherwise would not make absent the REIT and Investment Company Act considerations.
Because assets we expect to acquire may experience periods of illiquidity, we may lose profits or be prevented from earning capital gains if we cannot sell mortgage-related assets at an opportune time.
We bear the risk of being unable to dispose of our mortgage-related assets at advantageous times or in a timely manner because mortgage-related assets generally experience periods of illiquidity, including during periods of delinquencies and defaults with respect to residential mortgage loans. The lack of liquidity may result from the absence of a willing buyer or an established market for these assets, as well as legal or contractual restrictions on resale or the unavailability of financing for these assets. As a result, our ability to vary our investment portfolio in response to changes in economic and other conditions may be relatively limited, which may cause us to incur losses.
Hedging against interest rate exposure may adversely affect our earnings.
Subject to complying with REIT requirements, we employ techniques that limit, or “hedge,” the adverse effects of rising interest rates on our short-term repurchase agreements and on the value of our assets. Our hedging activity will vary in scope based on the level and volatility of interest rates and principal repayments, the type of securities held and other changing market conditions. These techniques may include entering into interest rate swap and swaption agreements or interest rate cap or floor agreements, purchasing or selling futures contracts, purchasing put and call options on securities or securities underlying futures contracts, or entering into forward rate agreements. We have implemented a policy to limit our use of hedging instruments to only those techniques described above and to only enter into hedging transactions with counterparties that have a high-quality credit rating. However, there are no perfect hedging strategies, and interest rate hedging may fail to protect us from loss. In addition, these hedging strategies may adversely affect us because hedging activities involve an expense that we will incur regardless of the effectiveness of the hedging activity. Hedging activities could result in losses if the event against which we hedge does not occur. Additionally, interest rate hedging could fail to protect us or adversely affect us because, among other things:
|
|
· |
available interest rate hedging may not correspond directly with the interest rate risk for which protection is sought; |
|
|
· |
the duration of the hedge may not match the duration of the related asset or liability; |
|
|
· |
fair value accounting rules could foster adverse valuation adjustments due to credit quality considerations that could impact both earnings and shareholders’ equity; |
|
|
· |
the party owing money in the hedging transaction may default on its obligation to pay; |
|
|
· |
the credit quality of the party owing money on the hedge may be downgraded to such an extent that it impairs our ability to sell or assign our side of the hedging transaction; and |
|
|
· |
the value of derivatives used for hedging is adjusted at each reporting date in accordance with accounting rules to reflect changes in fair value. Downward adjustments, or “mark-to-market losses,” would reduce our shareholders’ equity. |
Clearing facilities or exchanges upon which some of our hedging instruments are traded may increase margin requirements on our hedging instruments in the event of adverse economic developments.
In response to events having or expected to have adverse economic consequences or which create market uncertainty, clearing facilities or exchanges upon which some of our hedging instruments, such as interest rate swaps and Eurodollar futures contracts, are traded may require us to post additional collateral. In the event that future adverse economic developments or market uncertainty result in increased margin requirements for our hedging instruments, it could materially adversely affect our liquidity position, business, financial condition and results of operations.
13
Failure to obtain and maintain an exemption from being regulated as a commodity pool operator could subject us to additional regulation and compliance requirements and may result in fines and other penalties which could materially adversely affect our business and financial condition.
The Dodd-Frank Wall Street Reform and Consumer Act (the “Dodd-Frank Act”) established a comprehensive new regulatory framework for derivative contracts commonly referred to as “swaps.” As a result, any investment fund, including a mortgage REIT, that trades in swaps may be considered a “commodity pool,” which would cause its directors to be regulated as “commodity pool operators” (“CPOs”). Under the rules, funds that are considered CPOs solely because of their use of swaps must register with the National Futures Association (the “NFA”), which requires compliance with NFA’s rules, and are subject to regulation by the U.S. Commodity Futures Trading Commission (the “CFTC”) including with respect to disclosure, reporting, recordkeeping and business conduct. However, the CFTC's Division of Swap Dealer and Intermediary Oversight issued a no-action letter saying, although it believes that mortgage REITs are properly considered commodity pools, it would not recommend that the CFTC take enforcement action against the operator of a mortgage REIT who does not register as a CPO if, among other things, the mortgage REIT limits the initial margin and premiums required to establish its swaps, futures and other commodity interest positions to not more than five percent of its total assets, the mortgage REIT limits the net income derived annually from those commodity interest positions that are not qualifying hedging transactions to less than five percent of its gross income and interests in the mortgage REIT are not marketed to the public as or in a commodity pool or otherwise as or in a vehicle for trading in the commodity futures, commodity options or swaps markets.
We use hedging instruments in conjunction with our investment portfolio and related borrowings to reduce or mitigate risks associated with changes in interest rates. We do not currently engage in any speculative derivatives activities or other non-hedging transactions using swaps, swaptions, futures or options on futures. We do not use these instruments for the purpose of trading in commodity interests, and we do not consider our company or its operations to be a commodity pool as to which CPO regulation or compliance is required. We have submitted the required filing to claim the no-action relief afforded by the no-action letter described above. Consequently, we will be restricted to operating within the parameters discussed in the no-action letter and will not enter into hedging transactions covered by the no-action letter if they would cause us to exceed the limits set forth in the no-action letter.
The CFTC has substantial enforcement power with respect to violations of the laws over which it has jurisdiction, including their anti-fraud and anti-manipulation provisions. For example, CFTC may suspend or revoke the registration of a person who fails to comply, prohibit such a person from trading or doing business with registered entities, impose civil money penalties, require restitution and seek fines or imprisonment for criminal violations. Additionally, a private right of action exists against those who violate the laws over which CFTC has jurisdiction or who willfully aid, abet, counsel, induce or procure a violation of those laws. In the event that we fail to comply with statutory requirements relating to derivatives or with the CFTC's rules thereunder, including the no-action letter described above, we may be subject to significant fines, penalties and other civil or governmental actions or proceedings, any of which could have a materially adverse effect on our business, financial condition and results of operations.
It may be uneconomical to “roll” our TBA dollar roll transactions or we may be unable to meet margin calls on our TBA contracts, which could negatively affect our financial condition and results of operations.
We may utilize TBA dollar roll transactions as a means of investing in and financing agency securities. TBA contracts enable us to purchase or sell, for future delivery, agency securities with certain principal and interest terms and certain types of collateral, but the particular agency securities to be delivered are not identified until shortly before the TBA contract settlement date. Prior to settlement of the TBA contract we may choose to move the settlement of the securities out to a later date by entering into an offsetting position (referred to as a “pair off”), net settling the paired off positions for cash, and simultaneously purchasing a similar TBA contract for a later settlement date, collectively referred to as a “dollar roll.” The agency securities purchased for a forward settlement date under the TBA contract are typically priced at a discount to agency securities for settlement in the current month. This difference (or discount) is referred to as the “price drop.” The price drop is the economic equivalent of net interest carry income on the underlying agency securities over the roll period (interest income less implied financing cost) and is commonly referred to as “dollar roll income.” Consequently, dollar roll transactions and such forward purchases of agency securities represent off-balance sheet financing and increase our “at risk” leverage.
Under certain market conditions, TBA dollar roll transactions may result in negative carry income whereby the agency securities purchased for a forward settlement date under the TBA contract are priced at a premium to agency securities for settlement in the current month. Under such conditions, it would generally be uneconomical to roll our TBA contracts prior to the settlement date and we could have to take physical delivery of the underlying securities and settle our obligations for cash. We may not have sufficient funds or alternative financing sources available to settle such obligations. In addition, pursuant to the margin provisions established by the Mortgage-Backed Securities Division (“MBSD”) of the Fixed Income Clearing Corporation we are subject to margin calls on our TBA contracts. Further, our prime brokerage agreements may require us to post additional margin above the levels established by the MBSD. Negative carry income on TBA dollar roll transactions or failure to procure adequate financing to settle our obligations or meet margin calls under our TBA contracts could result in defaults or force us to sell assets under adverse market conditions or through foreclosure and adversely affect our financial condition and results of operations.
14
We are highly dependent on information and communications systems. Any systems failures could significantly disrupt our business, which may, in turn, negatively affect our operations and the market price of our stock and our ability to pay dividends to our shareholders.
Our business is highly dependent on communications and information systems. Any failure or interruption of our manager’s systems or cyber-attacks or security breaches of our manager’s networks or systems could cause delays or other problems in our portfolio trading activities, which could have a material adverse effect on our operating results, the market price of our stock and our ability to pay dividends to our shareholders. In addition, we also face the risk of operational failure, termination or capacity constraints of any of the third parties with which we do business or that facilitate our business activities, including clearing agents or other financial intermediaries we use to facilitate our portfolio transactions.
Computer malware, viruses, and computer hacking and phishing attacks have become more prevalent in our industry and may occur on our systems in the future. We rely heavily on our manager’s financial, accounting and other data processing systems. It is difficult to determine what, if any, negative impact may directly result from any specific interruption or cyber-attacks or security breaches of our manager’s networks or systems or any failure to maintain performance, reliability and security of our technical infrastructure. As a result, any such computer malware, viruses, and computer hacking and phishing attacks may negatively affect our operations.
Declining real estate values could impair our assets and harm our operations.
Some risks associated with our business are more severe during periods of economic slowdown or recession, especially if these periods are accompanied by declining real estate values. The ability of a borrower to repay a loan secured by a residential property typically is dependent upon the income or assets of the borrower. During an economic slowdown, unemployment rises and increasing numbers of borrowers have difficulty in making payments on their debts, including on mortgage loans. When a recession is combined with declining real estate values, as was the case in the recession that started in 2008, defaults on mortgages may increase dramatically.
Owners of agency securities are protected from the risk of default on the underlying mortgages by guarantees from Fannie Mae, Freddie Mac or, in the case of the Ginnie Mae, the U.S. Government. However, we also may acquire non-agency securities, which are backed by residential real property but, in contrast to agency securities, the principal and interest payments are not guaranteed by Fannie Mae or Freddie Mac. Our non-agency securities investments are therefore particularly sensitive to recessions and declining real estate values.
In the event of a default on a mortgage loan that we hold in our portfolio or a mortgage loan underlying non-agency securities in our portfolio, we bear the risk of loss as a result of the potential deficiency between the value of the collateral and the debt owed on the mortgage, as well as the costs and delays of foreclosure or other remedies, and the costs of maintaining and ultimately selling a property after foreclosure.
Any sustained period of increased payment delinquencies, defaults, foreclosures or losses on our non-agency securities or mortgage loans could adversely affect our revenues, results of operations, financial condition, business prospects and ability to make distributions to shareholders.
We may engage in new business initiatives and invest in diverse types of assets and these activities could expose us to new, different or increased risks.
We frequently evaluate new business opportunities and investment strategies that would allow us to diversify our business. We have invested in and may in the future invest in a variety of mortgage-related and other financial assets that may or may not be closely related to our current business. Additionally, we may enter other operating businesses that may or may not be closely related to our current business. These new assets or business operations may have new, different or increased risks than what we are currently exposed to in our business and we may not be able to manage these risks successfully. Additionally, when investing in new assets or businesses we will be exposed to the risk that those assets, or income generated by those assets or businesses, will affect our ability to meet the requirements to maintain our REIT status or our status as exempt from registration under the Investment Company Act. If we are not able to successfully manage the risks associated with new assets types or businesses, it could have an adverse effect on our business, results of operations and financial condition.
We may not be able to raise the capital required to finance our assets and grow our business.
The growth of our operating businesses may require access to debt and equity capital that may or may not be available on favorable terms or at the desired times, or at all. In addition, we invest in certain assets, such as MSR, for which financing has historically been difficult or costly to obtain. Our inability to obtain financing for our target assets could require us to seek debt or equity capital that may be more costly or unavailable to us. We cannot assure you that we will have access to any debt or equity capital on favorable terms or at the desired times, or at all. Our inability to raise such capital or obtain financing on favorable terms could materially adversely affect our liquidity position, business, results of operations and financial condition.
In addition, as discussed in the notes to our consolidated financial statements, the acquisition of Pingora on August 31, 2015 was accounted for using the acquisition method. Substantially all of the $23.5 million purchase price for Pingora was allocated to intangible
15
assets including approximately $4.0 million of goodwill. Pingora’s inability to raise debt or equity capital or obtain financing on favorable terms could materially adversely affect its business and profitability, and could require us to recognize an impairment on these intangible assets.
The expansion of our business into investments in and the securitization of non-agency securities may expose us to additional risks.
We have limited experience acquiring mortgage loans in the secondary market and completing securitization transactions. Our investments in and the securitization of residential mortgage loans are subject to many of the same risks as those related to our other assets, including risks related to changes in interest rates, economic factors in general, prepayment speeds, hedging strategies and regulatory changes. However, there can be no assurance that we will be able to continue our securitization program successfully, or at all. In addition, the purchase of residential mortgage loans in the secondary market requires us, in some circumstances, to maintain certain licenses and failure to maintain those licenses may adversely affect our ability to acquire mortgage loans and successfully operate our securitization program. If we are not able to successfully manage these and other risks related to investing in and securitizing non-agency securities, it may adversely affect our business, results of operations and financial condition.
We may not be able to acquire residential mortgage loans.
The success of our mortgage loan conduit program depends upon sourcing a large volume of desirable residential mortgage loans. We may be unable to do so for many reasons. We may be unable to locate originators that are able or willing to originate mortgage loans that meet our standards and we may not be able to source acquisitions of bulk pools of mortgage loans from originators, banks and other sellers, in either case, on terms and conditions favorable to us. Additionally, competition for mortgage loans may drive down supply or drive up prices, making it uneconomical to purchase the loans. General economic factors, such as recession, declining home values, unemployment and high interest rates, may limit the supply of available loans. As a result, we may incur additional costs to acquire a sufficient volume of mortgage loans or be unable to acquire mortgage loans at a reasonable price. If we cannot source an adequate volume of desirable loans, our mortgage loan conduit program may be unprofitable, and we may hold individual loans for long periods, increasing our exposure to the credit of the borrowers and requiring capital that might be better used elsewhere in our business.
Market conditions and other factors may affect our ability to securitize residential mortgage loans.
Our ability to securitize residential mortgage loans is affected by a number of factors, including:
|
|
· |
conditions in the securities markets, generally; |
|
|
· |
conditions in the asset-backed securities markets, specifically; |
|
|
· |
yields of our portfolio mortgage loans; |
|
|
· |
the credit quality of our portfolio of mortgage loans; and |
|
|
· |
our ability to obtain any necessary credit enhancement. |
In recent years, the asset-backed securitization markets have experienced disruptions and reductions in securitization volumes. Recent conditions in the securitization markets have included reduced liquidity, increased risk premiums for issuers, reduced investor demand, financial distress among financial guaranty insurance providers, and a general tightening of credit. These conditions may increase our cost of funding and reduce or even eliminate our access to the securitization market. As a result, these conditions may result in our inability to sell securities in the asset-backed securities market. Further, our lending facilities may not be adequate to fund our mortgage purchasing activities until such disruptions in the securitization markets subside. Any future disruptions in this market or any adverse change or delay in our ability to access the market could have a material adverse effect on our financial position, liquidity and results of operations. Low investor demand for asset-backed securities could force us to hold mortgage loans until investor demand improves, but our capacity to hold such mortgage loans is not unlimited. Adverse market conditions could also result in increased costs and reduced margins earned in connection with our planned securitization transactions.
Our ability to execute securitizations of residential mortgage loans could be delayed, limited, or precluded by legislative and regulatory reforms applicable to asset-backed securities and the institutions that sponsor, service, rate, or otherwise participate in, or contribute to, the successful execution of a securitization transaction. These factors could limit, delay, or preclude our ability to execute securitization transactions and could also reduce the returns we would otherwise expect to earn in connection with securitization transactions.
Provisions of the Dodd-Frank Act require significant revisions to the legal and regulatory framework which apply to the asset-backed securities markets and securitizations. We cannot predict how the Dodd-Frank Act and the other regulations that have been proposed will affect our ability to execute securitizations of residential mortgage loans. These laws and regulations could effectively preclude us from executing securitization transactions, could delay our execution of these types of transactions, or could reduce the returns we would otherwise expect to earn from executing securitization transactions.
16
Other matters, such as (i) accounting standards applicable to securitization transactions and (ii) capital and leverage requirements applicable to banks and other regulated financial institutions that traditionally purchase and hold asset-backed securities, could result in less investor demand for securities issued through securitization transactions we plan to execute or increased competition from other institutions that execute securitization transactions.
Our ability to profitably execute or participate in future securitizations of residential mortgage loans is dependent on numerous factors, and if we are not able to achieve our desired level of profitability or if we incur losses in connection with executing or participating in future securitizations, it could materially and adversely impact our business and financial condition.
There are a number of factors that can impact whether a securitization transaction that we execute or participate in is profitable. One of these factors is the price we pay for the mortgage loans that we securitize, which in the case of residential mortgage loans, is impacted by the level of competition in the marketplace and the relative desirability to originators of retaining residential mortgage loans as investments or selling them to third parties such as us. Another factor that impacts the profitability of a securitization transaction is the cost of the short-term debt used to finance our holdings of mortgage loans prior to securitization. Such cost is affected by a number of factors, including the availability of this type of financing, interest rates, the duration of the financing, and the extent to which third parties are willing to provide short-term financing.
After we acquire mortgage loans that we intend to securitize, we can also suffer losses if the value of those loans declines prior to securitization. Such declines can be due to, among other things, changes in interest rates and changes in the credit quality of the loan. To the extent we seek to hedge against a decline in loan value due to changes in interest rates, there is a cost of hedging that also affects whether a securitization is profitable.
Rating agencies have historically played a central role in the securitization markets. Many purchasers of asset-backed securities require that a security be rated by the agencies at or above a specific grade before they will consider purchasing it. The rating agencies could adversely affect our ability to execute securitization transactions by deciding not to publish ratings for our securitization transaction, deciding not to consent to the inclusion of those ratings in the prospectuses, or by assigning ratings that are below the thresholds investors require. Further, rating agencies could alter their ratings processes or criteria after we have accumulated loans for securitization in a manner that reduces the value of previously acquired loans or that requires us to incur additional costs to comply with those processes and criteria.
The price that investors will pay for securities issued in our securitization transactions also has a significant impact on the profitability of the transactions to us. In addition, transaction costs incurred in executing transactions impact the profitability of our securitization transactions and any liability that we may incur, or may be required to reserve for, in connection with executing a transaction can reduce the profitability of a transaction or cause a loss to us. To the extent that we are not able to profitably execute future securitizations of residential mortgage loans, it could materially and adversely impact our business and financial condition.
We are exposed to credit risk on the residential mortgage loans we acquire and securitize and we may not be able to successfully manage those risks and mitigate our losses.
Despite our efforts to manage credit risk related to the residential mortgage loans we acquire and securitize, there are many aspects of credit risk that we cannot control. In addition, our portfolio of mortgage assets may be concentrated in terms of credit risk. Our due diligence, underwriting, quality control and loss mitigation policies and procedures may not be effective at preventing or limiting compliance violations or borrower delinquencies and defaults, and the loan servicing companies that service the mortgage loans may not comply with loss mitigation regulations or applicable investor requirements. Prior to acquiring loans, we perform due diligence, including re-underwriting and compliance with applicable laws, and we rely on resources and data available to us from the seller, which may be limited. Our underwriting and due diligence efforts may not reveal matters that could lead to losses. If our underwriting process is not adequate, and we fail to detect certain loan defects or compliance issues related to origination or servicing, we may incur losses. We could also incur losses if a counterparty that sold us a loan is unwilling or unable (e.g., due to its financial condition) to repurchase that loan or asset or pay damages to us if we determine subsequent to purchase that one or more of the representations or warranties made to us in connection with the sale was inaccurate. As a result, we could incur losses that would materially and adversely affect our financial condition and results of operations.
Our past and future securitization activities expose us to an increased risk of litigation, which may materially and adversely affect our business and financial condition.
In connection with our mortgage loan conduit program, we prepare disclosure documentation, including term sheets and offering memorandums, which include disclosures regarding the securitization transactions and the assets being securitized. If our disclosure documentation is alleged or found to contain inaccuracies or omissions, we may be liable under federal securities laws, state securities laws or other applicable laws for damages to third parties that invest in these securitization transactions, including in circumstances in which we relied on a third party in preparing accurate disclosures, or we may incur other expenses and costs in connection with disputing these allegations or settling claims. We may also sell or contribute residential mortgage loans to third parties who, in turn, securitize those loans. In these circumstances, we may also prepare disclosure documentation, including documentation that is included in term sheets and offering memorandums relating to those securitization transactions. We could be liable under federal securities laws, state
17
securities laws, or other applicable laws for damages to third parties that invest in these securitization transactions, including liability for disclosures prepared by third parties or with respect to loans that we did not sell or contribute to the securitization.
In recent years, there has also been debate as to whether there are defects in the legal process and legal documents governing transactions in which securitization trusts and other secondary purchasers take legal ownership of residential mortgage loans and establish their rights as first priority lien holders on underlying mortgaged property. To the extent there are problems with the manner in which title and lien priority rights were established or transferred, securitization transactions that we sponsored and third-party sponsored securitizations that we hold investments in, we may experience losses.
Defending a lawsuit can consume significant resources and may divert management’s attention from our operations. We may be required to establish reserves for potential losses from litigation, which could be material. To the extent we are unsuccessful in our defense of any lawsuit, we could suffer losses which could be in excess of any reserves established relating to that lawsuit and these losses could be material.
We may be subject to counterparty risk in connection with our mortgage loan conduit program and our acquisitions of MSR.
When engaging in securitization transactions and MSR acquisitions, we may be required to make representations and warranties to the purchasers of the underlying residential mortgage loans regarding, among other things, certain characteristics of those mortgage loans. If our representations and warranties are inaccurate, we may be obligated to repurchase certain mortgage loans, which may result in a loss. Even if we obtain representations and warranties from the loan originator or other parties from whom we acquired the mortgage loans or MSR, as applicable, they may not correspond with the representations and warranties we make or may otherwise not protect us from losses. For example, if representations and warranties we obtain from those parties do not exactly align with the representations and warranties we make, or if the representations and warranties made to us are not enforceable or if we cannot collect damages for a breach (e.g., due to the financial condition of the party that made the representation or warranty to us or statutes of limitations), we may incur losses.
We may be subject to fines or other penalties based on the conduct of the mortgage loan originators and brokers that originated the residential mortgage loans that we subsequently acquire and the third-party servicers who service the loans underlying the MSR we acquire.
We are dependent on third-party mortgage originators to originate mortgage loans that comply with applicable law and on third-party mortgage servicers to perform the actual day-to-day servicing obligations on the mortgage loans underlying the MSR. Mortgage loan originators and brokers are subject to strict and evolving consumer protection laws and other legal obligations with respect to the origination of residential mortgage loans. These laws and regulations include the “ability-to-repay” and “qualified mortgage” regulations of the Consumer Financial Protection Bureau (“CFPB”), which became effective in 2014. In addition, there are various other federal, state, and local laws and regulations that are intended to discourage predatory lending practices by residential mortgage loan originators. These laws may be highly subjective and open to interpretation and, as a result, a regulator or court may determine that that there has been a violation where an originator or servicer of mortgage loans reasonably believed that the law or requirement had been satisfied. Failure or alleged failure by originators or servicers to comply with these laws and regulations could subject us, as an assignee or purchaser of these loans or as an investor in MSR or securities backed by these loans, to delays in foreclosure proceedings, increased litigation expenses, monetary penalties and defenses to foreclosure, including by recoupment or setoff of finance charges and fees collected, and in some cases could also result in rescission of the affected residential mortgage loans, which could adversely impact our business and financial results.
The final servicing rules promulgated by the CFPB to implement certain sections of the Dodd-Frank Act include provisions relating to periodic billing statements and disclosures, responding to borrower inquiries and complaints, force-placed insurance, and adjustable rate mortgage interest rate adjustment notices. Further, the mortgage servicing rules require servicers to, among other things, make good faith early intervention efforts to notify delinquent borrowers of loss mitigation options, to implement specified loss mitigation procedures, and if feasible, exhaust all loss mitigation options before proceeding to foreclosure. Proposed updates to further refine these rules have been published and will likely lead to further changes in requirements applicable to servicing mortgage loans.
While some of these laws may not explicitly hold us responsible for the legal violations of these third parties, federal and state agencies and private litigants have increasingly sought to impose such liability. In addition, various regulators and plaintiffs’ lawyers have sought to hold assignees of mortgage loans liable for the alleged violations of the originating lender under theories of express or implied assignee liability. Further, it is possible that a third-party servicer’s failure to comply with the new and evolving servicing protocols could adversely affect the value of our MSR. Accordingly, we may be subject to fines, penalties or civil liability based upon the conduct of the mortgage lenders that originated the mortgage loans we hold and the third-party servicers who service the loans for which we own the MSR.
18
Investments in MSR may expose us to additional risks.
Our investments in MSR may subjects us to certain additional risks, including the following:
|
|
· |
We have limited experience acquiring MSR and operating a servicer and while ownership of MSR and the operation of a servicer includes many of the same risks as our other target assets, including risks related to prepayments, borrower credit, defaults, interest rates, hedging, and regulatory changes, there can be no assurance that we will be able to successfully operate a servicer subsidiary and integrate it into our business operations. |
|
|
· |
Our subsidiary’s status a Fannie Mae, Freddie Mac and Ginnie Mae approved servicer is subject to compliance with each of their respective selling and servicing guidelines, minimum capital requirements and other conditions they may impose from time to time at their discretion. The failure to meet such guidelines and conditions could result in the unilateral termination of our subsidiary’s status as an approved servicer. |
|
|
· |
Our subsidiary is presently licensed in all states to hold MSR, and to purchase whole loans, where a license is necessary to carry on such activities, with the exception of New York. Such state licenses may be revoked by a state regulatory authority, and we may lose MSR under the regulatory jurisdiction of such state regulatory authority for which we will have little or no recourse. |
|
|
· |
Our rights to the excess servicing spread are subordinate to the interests of Fannie Mae and Freddie Mac and are subject to extinguishment. Fannie Mae and Freddie Mac each require approval of the sale of excess servicing spreads pertaining to their respective MSR. A condition to the grant of such consent is the execution of an acknowledgement agreement or subordination of interest agreement. Under such agreements, our rights and interest in the excess servicing spread is subject and subordinate to the interests of Fannie Mae and Freddie Mac and are subject to extinguishment. |
|
|
· |
Changes in minimum servicing amounts for agency loans could occur at any time and could negatively impact the value of the income derived from MSR. |
|
|
· |
Investments in MSR are highly illiquid and subject to numerous restrictions on transfer and, as a result, there is risk that we would be unable to locate a willing buyer or get approval to sell MSR in the future should we desire to do so. |
If we are not able to successfully manage these and other risks related to investing and managing MSR, it may adversely affect our business, results of operations and financial condition.
The assets in our portfolio are recorded at fair value, but there may be substantial uncertainty as to the value of certain assets.
Some of the assets in our portfolio are not publicly traded. The fair value of securities and other assets that are not publicly traded may not be readily determinable. We value these assets quarterly at fair value, as determined in accordance with the Financial Accounting Standards Board Accounting Standard Codification 820, Fair Value Measurements and Disclosures, which may include unobservable inputs. Because such valuations are subjective, the fair value of certain of our assets may fluctuate over short periods of time and our determinations of fair value may differ materially from the values that would have been used if a ready market for these securities existed. In addition, the mortgage loans held for investment and MSR we acquire are recorded at fair value on our balance sheet based upon significant estimates and assumptions. The determination of the fair value of mortgage loans held for investment and MSR requires management to make numerous estimates and assumptions. Such estimates and assumptions include, without limitation, estimates of future cash flows associated with the assets based upon assumptions involving interest rates as well as the prepayment rates, delinquency levels and foreclosure rates of the underlying mortgage loans. The ultimate realization of the value of mortgage loans held for investment and MSR may be materially different than the fair values of such assets as may be reflected in our consolidated balance sheet as of any particular date. The use of different estimates or assumptions in connection with the valuation of these assets could produce materially different fair values for such assets, which could have a material adverse effect on our business, results of operations and financial condition. Accordingly, there may be material uncertainty about the fair value of any mortgage loans and MSR we acquire.
Our results may experience greater fluctuations by not electing hedge accounting treatment on our derivative instruments.
We have elected to not qualify for hedge accounting treatment under the Financial Accounting Standards Board (“FASB”) Accounting Standards Codification (“ASC”) Topic 815 (“ASC 815”), Derivatives and Hedging, for our current derivative instruments. The economics of our derivative hedging transactions are not affected by this election; however, our GAAP net income may be subject to greater fluctuations from period to period as a result of this accounting treatment for changes in fair values of the derivatives.
19
Risks Related to Debt Financing
We incur significant debt to finance our investments, which subjects us to increased risk of loss.
We generally borrow between six and nine times the amount of our shareholders’ equity, although our borrowings may at times be above or below this amount. As of December 31, 2015, our borrowings were approximately $13.6 billion, and our debt-to-shareholders’ equity ratio was approximately 6.3:1, while our effective leverage ratio, which includes the impact of off-balance sheet financing related to TBA dollar roll transactions, was 7.6:1. We incur leverage by borrowing against our MBS and mortgage loans. Incurring debt subjects us to many risks, including the risks that:
|
|
· |
our cash flow from operations will be insufficient to make required payments of principal and interest, resulting in the loss of some or all of our securities due to foreclosure or sale in order to satisfy our debt obligations; |
|
|
· |
our debt may increase our vulnerability to adverse economic and industry conditions; |
|
|
· |
we may be required to dedicate a substantial portion of our cash flow from operations to payments on our debt, thereby reducing funds available for distribution to shareholders, funding our operations, future business opportunities or other purposes; |
|
|
· |
the terms of any refinancing will not be as favorable as the terms of the debt being refinanced; |
|
|
· |
the use of leverage could adversely affect our ability to make distributions to our shareholders and could reduce the market price of our common stock; |
|
|
· |
a default under a mortgage loan could result in an involuntary liquidation of the securities pledged for such mortgage loan, including any cross-collateralized securities, which would result in a loss to us equal to the difference between the value of the securities upon liquidation and the carrying value of the securities; and |
|
|
· |
to the extent we are compelled to liquidate assets to repay debts, such an event could jeopardize (1) our REIT status, or (2) our exemption from registration under the Investment Company Act, the loss of either of which could decrease our overall profitability and our ability to make distributions to our shareholders. |
A decrease in the value of assets financed through repurchase agreements may lead our lenders to require us to pledge additional assets as collateral. If our assets are insufficient to meet the collateral requirements, then we may be compelled to liquidate particular assets at an inopportune time.
A majority of our borrowings are and will be secured by our securities, generally under repurchase agreements. The amount borrowed under a repurchase agreement is based on the market value of the security pledged to secure the borrowings. Our repurchase agreements allow our lenders to revise the market value of the securities pledged as collateral from time to time to reflect then–current market conditions. Possible market developments, including a sharp rise in interest rates, a change in prepayment rates or increasing market concern about the value or liquidity of one or more types of securities in which our investment portfolio is concentrated, may cause a decline in the market value of the securities used to secure these debt obligations, which could limit our ability to borrow or result in lenders requiring us to pledge additional collateral to secure our borrowings or repay a portion of the outstanding borrowings, on minimal notice. In that situation, we could be required to sell securities under adverse market conditions in order to obtain the additional collateral required by the lender or to pay down our borrowings. If these sales are made at prices lower than the carrying value of the securities, we would experience losses, thus adversely affecting our operating results and net profitability. In recent years, a number of companies owning mortgage securities have been required by lenders to pledge additional collateral as the market value of their mortgage securities declined. In the ordinary course of our business, we experience margin calls, which require us to pledge additional collateral or pay down our borrowings. See “Management’s Discussion and Analysis of Financial Condition and Results of Operations — Liquidity and Capital Resources.”
Further, financial institutions may require us to maintain a certain amount of cash that is not invested or to set aside non-leveraged assets sufficient to maintain a specified liquidity position which would allow us to satisfy our collateral obligations. As a result, we may not be able to leverage our assets as fully as we would choose, which could reduce our return on equity. In the event that we are unable to meet these collateral obligations, then, as described above, our financial condition could deteriorate rapidly.
Failure to procure adequate debt financing, or to renew or replace existing debt financing as it matures, would adversely affect our results and may, in turn, negatively affect the value of our stock and our ability to distribute dividends.
We use debt financing as a strategy to increase our return on investments. However, we may not be able to achieve our desired debt-to-equity ratio for a number of reasons, including the following:
|
|
· |
our lenders do not make debt financing available to us at acceptable rates; or |
|
|
· |
our lenders require that we pledge additional collateral to cover our borrowings, which we may be unable to do. |
20
The dislocations in the residential mortgage market and credit markets have led lenders, including the financial institutions that provide financing for our investments, to heighten their credit review standards, and, in some cases, to reduce or eliminate loan amounts available to borrowers. As a result, we cannot assure you that any, or sufficient, debt funding will be available to us in the future on terms that are acceptable to us. In the event that we cannot obtain sufficient funding on acceptable terms, there may be a negative impact on the value of our stock and our ability to make distributions, and you may lose part or all of your investment.
Furthermore, because we rely primarily on short-term borrowings, our ability to achieve our investment objective depends not only on our ability to borrow money in sufficient amounts and on favorable terms, but also on our ability to renew or replace on a continuous basis our maturing short-term borrowings. As of December 31, 2015, a majority of our borrowings bore maturities of 30 days or less. If we are not able to renew or replace maturing borrowings, we will have to sell some or all of our assets, possibly under adverse market conditions.
Lenders may require us to enter into restrictive covenants relating to our operations.
When we obtain financing, lenders could impose restrictions on us that would affect our ability to incur additional debt, our capability to make distributions to shareholders and our flexibility to determine our operating policies. Loan documents we execute may contain negative covenants that limit, among other things, our ability to repurchase stock, distribute more than a certain amount of our funds from operations, and employ leverage beyond certain amounts.
If the counterparties to our repurchase transactions default on their obligations to resell the underlying security back to us at the end of the transaction term, or if the value of the underlying security has declined as of the end of that term or if we default on our obligations under the repurchase agreement, we will lose money on our repurchase transactions.
When we engage in a repurchase transaction, we generally sell securities to the transaction counterparty and receive cash from the counterparty. The counterparty is obligated to resell the securities back to us at the end of the term of the transaction, which is typically from 30 days to less than one year, but which may have terms in excess of one year. The cash we receive from the counterparty when we initially sell the securities to the counterparty is less than the value of those securities, which is referred to as the haircut. If the counterparty defaults on its obligation to resell the securities back to us we would incur a loss on the transaction equal to the amount of the haircut (assuming there was no change in the value of the securities). See Item 7 – “Management’s Discussion and Analysis of Financial Condition and Results of Operations” in this report for further discussion regarding risks related to exposure to foreign-owned financial institution counterparties in light of recent market conditions. We would also lose money on a repurchase transaction if the value of the underlying securities has declined as of the end of the transaction term, as we would have to repurchase the securities for their initial value but would receive securities worth less than that amount. Any losses we incur on our repurchase transactions could adversely affect our earnings, and thus our cash available for distribution to our shareholders.
If we default on one of our obligations under a repurchase transaction, the counterparty can terminate the transaction and cease entering into any other repurchase transactions with us. In that case, we would likely need to establish a replacement repurchase facility with another repurchase dealer in order to continue to leverage our investment portfolio and carry out our investment strategy. There is no assurance we would be able to establish a suitable replacement facility on acceptable terms or at all.
Our use of repurchase agreements to borrow funds may give our lenders greater rights in the event that either we or a lender file for bankruptcy.
Our borrowings under repurchase agreements may qualify for special treatment under the bankruptcy code, giving our lenders the ability to avoid the automatic stay provisions of the bankruptcy code and to take possession of and liquidate our collateral under the repurchase agreements without delay in the event that we file for bankruptcy. Furthermore, the special treatment of repurchase agreements under the bankruptcy code may make it difficult for us to recover our pledged assets in the event that a lender files for bankruptcy. Thus, our use of repurchase agreements will expose our pledged assets to risk in the event of a bankruptcy filing by either a lender or us.
Risks Related to Our Corporate Structure
Failure to maintain an exemption from the Investment Company Act would adversely affect our results of operations.
We believe that we conduct our business in a manner that allows us to avoid having to register as an investment company under the Investment Company Act. Under Section 3(c)(5)(C), the Investment Company Act exempts entities that are primarily engaged in the business of purchasing or otherwise acquiring “mortgages and other liens on and interests in real estate.” The staff of the SEC has provided guidance on the availability of this exemption. Specifically, the staff’s position generally requires us to maintain at least 55% of our assets directly in qualifying real estate interests and 80% in real estate-related investments (including our qualifying real estate interests). We refer to this exemption as the “Mortgage Exemption.” In order to constitute a qualifying real estate interest under the 55% requirement, a real estate interest must meet various criteria. Mortgage securities that do not represent all of the certificates issued with respect to an underlying pool of mortgages may be treated as securities separate from the underlying mortgage loans and, thus, may not
21
qualify for purposes of the 55% requirement. Our ownership of these mortgage securities, therefore, is limited by the provisions of the Investment Company Act. Accordingly, we intend to maintain at least 55% of our assets in whole pools of agency and non-agency securities. However, competition for investments may prevent us from acquiring mortgage securities that meet the 55% requirement at favorable yields or from acquiring sufficient qualifying securities to comply with the Mortgage Exemption under the Investment Company Act.
In addition, on August 31, 2011, the SEC issued a concept release (No. IC-29778; File No. SW7-34-11, Companies Engaged in the Business of Acquiring Mortgages and Mortgage-Related Instruments) pursuant to which it is reviewing whether certain companies that invest in MBS and rely on the exemption from registration under Section 3(c)(5)(C) of the Investment Company Act (such as us) should continue to be allowed to rely on such exemption from registration. If we fail to continue to qualify for this exemption from registration as an investment company, or the SEC determines that companies that invest in MBS are no longer able to rely on this exemption, our ability to use leverage would be substantially reduced and we would be unable to conduct our business as planned, or we may be required to register as an investment company under the Investment Company Act, either of which could negatively affect the value of our stock and our ability to make distributions to our shareholders.
Our policies are determined by our board of directors, and our shareholders have limited rights.
Our board of directors is responsible for our strategic business direction. Our major policies, including our policies with respect to acquisitions, leasing, financing, growth, operations, debt limitation and distributions, are determined by our board of directors. Our board of directors may amend or revise these and other policies from time to time without a vote of our shareholders. Our board’s broad discretion in setting policies and shareholders’ inability to exert control over those policies increases the uncertainty and risks you face as a shareholder.
Our board of directors may approve the issuance of capital stock with terms that may discourage a third party from acquiring us and may increase or decrease our authorized capital stock without shareholder approval.
Subject to the rights of holders of our 7.625% Series A Cumulative Redeemable Preferred Stock (“Series A Preferred Stock”) to approve the classification or issuance of any class or series of stock ranking senior to our Series A Preferred Stock, our charter permits our board of directors to issue shares of preferred stock, issuable in one or more classes or series. We may issue a class of preferred stock to individual investors in order to comply with the various REIT requirements. Our charter further permits our board of directors to amend our charter to increase or decrease the aggregate number of shares of our authorized stock or the number of shares of stock of any class or series without shareholder approval. Subject to the rights of holders of Series A Preferred Stock discussed above, our board of directors may also classify or reclassify any unissued shares of preferred or common stock and establish the preferences and rights (including the right to vote, participate in earnings and to convert into shares of our common stock) of any such shares of stock, which rights may be superior to those of shares of our common stock. Thus, our board of directors could authorize the issuance of shares of preferred or common stock with terms and conditions that could have the effect of discouraging a takeover or other transaction in which holders of some or a majority of the outstanding shares of our common stock might receive a premium for their shares over the then current market price of our common stock. Furthermore, to the extent we issue additional equity interests, your percentage ownership interest in us will be diluted. In addition, depending on the terms and pricing of any additional offerings, you may also experience dilution in the book value and fair value of your shares.
Our ownership limitations may restrict business combination opportunities.
To qualify as a REIT under the Code, no more than 50% of the value of our outstanding shares of capital stock may be owned, directly or under applicable attribution rules, by five or fewer individuals (as defined by the Code to include certain entities) during the last half of each taxable year (other than our first REIT taxable year). To preserve our REIT qualification, our charter generally prohibits direct or indirect ownership by any person of either (1) more than the aggregate stock ownership limit or (2) more than the common stock ownership limit. In addition, the articles supplementary for our Series A Preferred Stock provide that generally no person may own, or be deemed to own by virtue of the attribution provisions of the Code, either more than 9.8% in value or in number of shares, whichever is more restrictive, of our outstanding Series A Preferred Stock. Generally, shares owned by affiliated owners will be aggregated for purposes of the ownership limits. Any transfer of shares of our stock that would violate the ownership limits will result in the shares that would otherwise be held in violation of the ownership limits being designated as “shares-in-trust” and transferred automatically to a trust effective on the day before the purported transfer or other event giving rise to such excess ownership. The intended transferee will acquire no rights in such shares. The beneficiary of the trust will be one or more charitable organizations named by us. The ownership limits could have the effect of delaying, deferring or preventing a change in control or other transaction in which holders of shares of common stock might receive a premium for their shares of common stock over the then current market price or that such holders might believe to be otherwise in their best interests. The ownership limit provisions also may make our shares an unsuitable investment vehicle for any person seeking to obtain, either alone or with others as a group, ownership of either (1) more than 9.8% of the number or value of our outstanding shares of common stock or Series A Preferred Stock or (2) more than 9.8% of the number or value of our outstanding shares of all classes.
22
Provisions of Maryland law and other provisions of our organizational documents may limit the ability of a third party to acquire control of our company.
Certain provisions of the Maryland General Corporation Law (“MGCL”) may have the effect of delaying, deferring or preventing a transaction or a change in control of our company that might involve a premium price for holders of our common stock or otherwise be in their best interests, including:
|
|
· |
“business combination” provisions that, subject to limitations, prohibit certain business combinations between us and an “interested stockholder” (defined generally as any person who beneficially owns 10% or more of the voting power of our shares or an affiliate thereof) for five years after the most recent date on which the shareholder becomes an interested stockholder, and thereafter impose special shareholder voting requirements on these combinations; and |
|
|
· |
“control share” provisions that provide that “control shares” of our company (defined as shares which, when aggregated with other shares controlled by the acquiring shareholder, entitle the shareholder to exercise one of three increasing ranges of voting power in electing directors) acquired in a “control share acquisition” (defined as the direct or indirect acquisition of ownership or control of “control shares”) have no voting rights except to the extent approved by our shareholders by the affirmative vote of at least two-thirds of all the votes entitled to be cast on the matter, excluding all interested shares. |
Our bylaws provide that we are not subject to the “control share” provisions of the MGCL. However, our board of directors may elect to make the “control share” statute applicable to us at any time, and may do so without shareholder approval.
Title 3, Subtitle 8 of the MGCL permits our board of directors, without shareholder approval and regardless of what is currently provided in our charter or bylaws, to elect on behalf of our company to be subject to statutory provisions that may have the effect of delaying, deferring or preventing a transaction or a change in control of our company that might involve a premium price for holders of our common stock or otherwise be in their best interest. Pursuant to Title 3, Subtitle 8 of the MGCL, our charter provides that our board of directors will have the exclusive power to fill vacancies on our board. As a result, unless all of the directorships are vacant, our shareholders will not be able to fill vacancies with nominees of their own choosing. Our board of directors may elect to opt in to additional provisions of Title 3, Subtitle 8 of the MGCL without shareholder approval at any time.
Additionally, our charter and bylaws contain other provisions that may delay or prevent a change of control of our company. For example, our charter and bylaws provide that the number of directors constituting our full board may be fixed only by our directors, that our bylaws may only be amended by our directors and that a special meeting of shareholders may not be called by holders of our common stock holding less than a majority of our outstanding shares entitled to vote at such meeting.
Our rights and the rights of our shareholders to take action against our directors and officers are limited, which could limit your recourse in the event of actions not in shareholders’ best interests.
Our charter limits the liability of our directors and officers for money damages, except for liability resulting from actual receipt of an improper benefit or profit in money, property or services, or a final judgment based upon a finding of active and deliberate dishonesty by the director or officer that was material to the cause of action adjudicated.
Our charter also authorizes us to indemnify our directors and officers for actions taken by them in those capacities to the extent permitted by Maryland law, and our bylaws obligate us, to the maximum extent permitted by Maryland law, to indemnify any present or former director or officer of our company from and against any claim or liability to which he or she may become subject by reason of his or her service in that capacity. In addition, we may be obligated to fund the defense costs incurred by our directors and officers. Finally, we have entered into agreements with our directors and officers pursuant to which we have agreed to indemnify them to the maximum extent permitted by Maryland law.
Future offerings of debt securities, which would rank senior to our common stock upon liquidation, and future offerings of equity securities, which would dilute our existing shareholders and may be senior to our common stock for the purposes of dividend and liquidating distributions, may adversely affect the market price of our common stock.
Our common stock is ranked junior to our Series A Preferred Stock. Our outstanding Series A Preferred Stock also has or will have a preference upon our dissolution, liquidation or winding up in respect of assets available for distribution to our shareholders. Holders of our common stock are not entitled to preemptive rights or other protections against dilution. In the future, we may attempt to increase our capital resources by making offerings of debt or additional offerings of equity securities, including commercial paper, senior or subordinated notes and series of preferred stock or common stock. Upon liquidation, holders of our debt securities and shares of preferred stock, if any, and lenders with respect to other borrowings will receive a distribution of our available assets prior to the holders of our common stock. Additional equity offerings may dilute the holdings of our existing shareholders or reduce the market price of our common stock, or both. Preferred stock could have a preference on liquidating distributions or a preference on dividend payments or both that could limit our ability to make a dividend distribution to the holders of our common stock. Because our decision to issue securities in any future offering will depend on market conditions and other factors beyond our control, we cannot predict or estimate the amount, timing or nature of our future offerings. Thus, holders of our common stock bear the risk of our future offerings reducing the market price of our common stock and diluting their stock holdings in us.
23
We have not established a minimum dividend payment level and there are no assurances of our ability to pay dividends in the future.
We intend to pay quarterly dividends and to make distributions to our shareholders in amounts such that all or substantially all of our taxable income in each year, subject to certain adjustments, is distributed. This, along with other factors, should enable us to qualify for the tax benefits accorded to a REIT under the Code. However, we have not established a minimum dividend payment level and our ability to pay dividends may be adversely affected by the risk factors described in this report. All distributions will be made at the discretion of our board of directors and will depend on our earnings, our financial condition, maintenance of our REIT status and such other factors as our board of directors may deem relevant from time to time. There are no assurances of our ability to pay dividends in the future. In addition, some of our distributions may include a return of capital.
Broad market fluctuations could negatively impact the market price of our stock.
We cannot assure you that the market price of our common stock will not fluctuate or decline significantly in the future. Some of the factors that could affect our stock price or result in fluctuations in the price or trading volume of our common stock include:
|
|
· |
actual or anticipated variations in our quarterly operating results; |
|
|
· |
changes in our operations or earnings estimates or publication of research reports about us or the industry; |
|
|
· |
increases in market interest rates may lead purchasers of our stock to demand a higher yield; |
|
|
· |
changes in market valuations of similar companies; |
|
|
· |
adverse market reaction to any increased indebtedness we incur in the future; |
|
|
· |
additions or departures of key management personnel; |
|
|
· |
actions by institutional shareholders; |
|
|
· |
speculation in the press or investment community; and |
|
|
· |
general market and economic conditions. |
In addition, the stock market has experienced price and volume fluctuations that have affected the market prices of many companies in industries similar or related to ours and may have been unrelated to operating performances of these companies. These broad market fluctuations could reduce the market price of our common stock.
Future issuances or sales of shares could cause our share price to decline.
Sales of substantial numbers of shares of our common stock in the public market, or the perception that such sales might occur, could adversely affect the market price of our common stock. In addition, the sale of these shares could impair our ability to raise capital through a sale of additional equity securities.
Other issuances of our common stock could have an adverse effect on the market price of our common stock. In addition, future issuances of our common stock may be dilutive to existing shareholders.
Federal Income Tax Risks
If we do not qualify as a REIT, we will be subject to tax as a regular corporation and face substantial tax liability.
We expect to continue to operate so as to qualify as a REIT under the Code. However, qualification as a REIT involves the application of highly technical and complex Code provisions for which only a limited number of judicial or administrative interpretations exist. Even a technical or inadvertent mistake could jeopardize our REIT status. Furthermore, new tax legislation, administrative guidance or court decisions, in each instance potentially with retroactive effect, could make it more difficult or impossible for us to qualify as a REIT. If we fail to qualify as a REIT in any tax year, then we would be taxed as a regular domestic corporation, which, among other things, means being unable to deduct distributions to shareholders in computing taxable income and being subject to federal income tax, including any applicable alternative minimum tax, on our taxable income at regular corporate rates. Any resulting tax liability could be substantial and would reduce the amount of cash available for distribution to shareholders, which could in turn have an adverse impact on the value of our stock. Furthermore, unless we were entitled to relief under applicable statutory provisions, we would be disqualified from treatment as a REIT for the subsequent four taxable years following the year during which we lost our qualification, and thus, our cash available for distribution to shareholders would be reduced for each of the years during which we did not qualify as a REIT.
Even if we remain qualified as a REIT, we may face other tax liabilities that reduce our cash flow.
Even if we remain qualified for taxation as a REIT, we may be subject to certain federal, state and local taxes on our income and assets. Any of these taxes would decrease cash available for distribution to our shareholders.
24
Complying with REIT requirements may cause us to forego otherwise attractive opportunities.
In order to maintain our qualification as a REIT for federal income tax purposes, we must continually satisfy tests concerning, among other things, the sources of our income, the nature and diversification of our assets, the amounts we distribute to our shareholders and the ownership of our stock. We may be required to make distributions to shareholders at disadvantageous times or when we do not have funds readily available for distribution. Thus, compliance with the REIT requirements may hinder our ability to operate solely on the basis of maximizing profits.
Complying with REIT requirements may limit our ability to hedge effectively.
The REIT provisions of the Code may limit our ability to hedge our assets and operations. Under these provisions, any income that we generate from transactions intended to hedge our interest rate, inflation and/or currency risks will be excluded from gross income for purposes of the REIT 75% and 95% gross income tests if the instrument hedges (1) interest rate risk on liabilities incurred to carry or acquire real estate assets or (2) risk of currency fluctuations with respect to any item of income or gain that would be qualifying income under the REIT 75% or 95% gross income tests, and such instrument is properly identified under applicable regulations of the U.S. Treasury. Income from hedging transactions entered into prior to July 31, 2008 that hedge interest rate risk on liabilities incurred to carry or acquire real estate assets will be excluded from gross income for purposes of the REIT 95% gross income test, but will not be qualifying income for purposes of the REIT 75% gross income test. Income from hedging transactions that do not meet these requirements will generally constitute nonqualifying income for purposes of both the REIT 75% and 95% gross income tests. As a result of these rules, we may have to limit our use of hedging techniques that might otherwise be advantageous, which could result in greater risks associated with interest rate or other changes than we would otherwise incur.
The failure of MBS subject to a repurchase agreement to qualify as real estate assets would adversely affect our ability to qualify as a REIT.
We have entered and intend to continue to enter into repurchase agreements under which we will nominally sell certain of our MBS to a counterparty and simultaneously enter into an agreement to repurchase the sold assets. We believe that for U.S. federal income tax purposes these transactions will be treated as secured debt and we will be treated as the owner of the MBS that are the subject of any such agreement notwithstanding that such agreement may transfer record ownership of such assets to the counterparty during the term of the agreement. It is possible, however, that the Internal Revenue Service (“IRS”) could successfully assert that we do not own the MBS during the term of the repurchase agreement, in which case we could fail to qualify as a REIT.
Complying with REIT requirements may force us to liquidate otherwise attractive investments.
In order to maintain our qualification as a REIT, we must also ensure that at the end of each calendar quarter at least 75% of the value of our assets consists of cash, cash items, government securities and qualified REIT real estate assets. The remainder of our investment in securities (other than government securities and qualified real estate assets) generally cannot include more than 10% of the outstanding voting securities of any one issuer or more than 10% of the total value of the outstanding securities of any one issuer. In addition, in general, no more than 5% of the value of our assets (other than government securities and qualified real estate assets) can consist of the securities of any one issuer and no more than 25% of the value of our total securities can be represented by securities of one or more taxable REIT subsidiaries. If we fail to comply with these requirements at the end of any calendar quarter, we must correct such failure within 30 days after the end of the calendar quarter in order to avoid losing our REIT status and suffering adverse tax consequences. As a result, we may be required to liquidate otherwise attractive investments.
Complying with REIT requirements may force us to borrow to make distributions to shareholders or otherwise depend on external sources of capital to fund such distributions.
As a REIT, we must distribute at least 90% of our REIT taxable income (subject to certain adjustments) to our shareholders. To the extent that we satisfy the distribution requirement, but distribute less than 100% of our taxable income, we will be subject to federal corporate income tax on our undistributed taxable income. In addition, we will be subject to a 4% nondeductible excise tax if the actual amount that we pay out to our shareholders in a calendar year is less than a minimum amount specified under federal tax laws. While we generally intend to make distributions so that no income or excise taxes are due, we may from time to time, consistent with maintaining our REIT qualification, elect to pay taxes in lieu of making current distributions if we decide that strategy is more favorable to our shareholders.
From time to time, we may generate taxable income greater than our net income for financial reporting purposes due to, among other things, amortization of capitalized purchase premiums, or our taxable income may be greater than our cash flow available for distribution to shareholders. If we do not have other funds available in these situations, we could be required to borrow funds, sell a portion of our portfolio at disadvantageous prices or find another alternative source of funds in order to make distributions sufficient to enable us to pay out enough of our taxable income to satisfy the distribution requirement and to avoid corporate income tax and the 4% excise tax in a particular year. These alternatives could increase our costs or reduce our equity.
25
Because of the distribution requirement, it is unlikely that we will be able to fund all future capital needs, including capital needs in connection with investments, from cash retained from operations. As a result, to fund future capital needs, we likely will have to rely on third-party sources of capital, including both debt and equity financing, which may or may not be available on favorable terms or at all. Our access to third-party sources of capital will depend upon a number of factors, including the market’s perception of our growth potential and our current and potential future earnings and cash distributions and the market price of our stock.
Our ability to invest in and dispose of TBA contracts could be limited by our REIT status, and we could lose our REIT status as a result of these investments.
We regularly purchase agency securities through TBA contracts. In certain instances, rather than take delivery of the agency securities subject to a TBA contract, we will dispose of the TBA contract through a dollar roll transaction in which we agree to purchase similar securities in the future at a predetermined price or otherwise, which may result in the recognition of income or gains. We account for dollar roll transactions as purchases and sales. The law is unclear regarding whether TBA contracts will be qualifying assets for the 75% asset test and whether income and gains from dispositions of TBA contracts will be qualifying income for the 75% gross income test.
Until such time as we seek and receive a favorable private letter ruling from the IRS, or we are advised by counsel that TBA contracts should be treated as qualifying assets for purposes of the 75% asset test, we will limit our investment in TBA contracts and any non-qualifying assets to no more than 25% of our assets at the end of any calendar quarter. Further, until such time as we seek and receive a favorable private letter ruling from the IRS or we are advised by counsel that income and gains from the disposition of TBA contracts should be treated as qualifying income for purposes of the 75% gross income test, we will limit our gains from dispositions of TBA contracts and any non-qualifying income to no more than 25% of our gross income for each calendar year. Accordingly, our ability to purchase agency securities through TBA contracts and to dispose of TBA contracts, through dollar roll transactions or otherwise, could be limited.
Moreover, even if we are advised by counsel that TBA contracts should be treated as qualifying assets or that income and gains from dispositions of TBA contracts should be treated as qualifying income, it is possible that the IRS could successfully take the position that such assets are not qualifying assets and such income is not qualifying income. In that event, we could be subject to a penalty tax or we could fail to qualify as a REIT if (i) the value of our TBA contracts, together with our non-qualifying assets for the 75% asset test, exceeded 25% of our gross assets at the end of any calendar quarter or (ii) our income and gains from the disposition of TBA contracts, together with our non-qualifying income for the 75% gross income test, exceeded 25% of our gross income for any taxable year.
The tax on prohibited transactions will limit our ability to engage in certain methods of securitizing mortgage loans that would be treated as sales for federal income tax purposes.
A REIT’s net income from prohibited transactions is subject to a 100% tax. In general, prohibited transactions are sales or other dispositions of property, other than foreclosure property, but including mortgage loans, held primarily for sale to customers in the ordinary course of business. We might be subject to this tax if we were to securitize mortgage loans in a manner that was treated as a sale of the loans for federal income tax purposes (such as a securitization using a real estate mortgage investment conduit (“REMIC”) structure). Therefore, in order to avoid the prohibited transactions tax, we may limit the structures we utilize for our securitization transactions, even though such sales or structures might otherwise be beneficial to us.
Certain financing activities may subject us to federal income tax and could have negative tax consequences for our stockholders.
We could recognize “excess inclusion income” if we hold a residual interest in a REMIC. In addition, we could also generate excess inclusion income if we issue liabilities with two or more maturities and the terms of the payments of those liabilities bear a relationship to the payments that we receive on mortgage loans or MBS securing those liabilities.
We currently do not intend to hold any REMIC residual interests or to enter into any transactions that could result in our, or a portion of our assets, being treated as a taxable mortgage pool for federal income tax purposes. If we hold REMIC residual interests or enter into such a transaction in the future, we will be taxable at the highest corporate income tax rate on any excess inclusion income that is allocable to the percentage of our stock held in record name by disqualified organizations (generally tax-exempt entities that are exempt from the tax on unrelated business taxable income, such as state pension plans, charitable remainder trusts and government entities).
If we were to realize excess inclusion income, IRS guidance indicates that the excess inclusion income would be allocated among our stockholders in proportion to our dividends paid. Excess inclusion income cannot be offset by losses of our stockholders. If the stockholder is a tax-exempt entity and not a disqualified organization, then this income would be fully taxable as unrelated business taxable income under Section 512 of the Code. If the stockholder is a foreign person, it would be subject to federal income tax at the maximum tax rate and withholding will be required on this income without reduction or exemption pursuant to any otherwise applicable income tax treaty.
26
Item 1B.Unresolved Staff Comments
None.
We do not own any properties. Our executive and administrative office is located at 751 W. Fourth Street, Suite 400, Winston-Salem, NC 27101. As part of our management agreement, our manager is responsible for providing the office space required in rendering services to us, and accordingly, any direct rent responsibilities belong to our manager.
We and our manager are not currently subject to any material legal proceedings.
Item 4.Mine Safety Disclosures
Not applicable.
PART II
Item 5.Market for Registrant’s Common Equity, Related Stockholder Matters and Issuer Purchases of Equity Securities
Information about our equity compensation plans and other related shareholder matters is incorporated by reference to our definitive Proxy Statement for our 2016 Annual Shareholders’ Meeting.
Market Information
Our common stock has been listed on the NYSE under the symbol “HTS” since April 30, 2008. The following table presents the high and low sales prices for our common stock as reported by the NYSE for the periods indicated.
|
|
High |
|
|
Low |
|
||
|
Quarter ended March 31, 2014 |
$ |
19.85 |
|
|
$ |
16.82 |
|
|
Quarter ended June 30, 2014 |
|
20.40 |
|
|
|
18.74 |
|
|
Quarter ended September 30, 2014 |
|
19.90 |
|
|
|
17.96 |
|
|
Quarter ended December 31, 2014 |
|
19.29 |
|
|
|
18.14 |
|
|
Quarter ended March 31, 2015 |
|
18.82 |
|
|
|
17.58 |
|
|
Quarter ended June 30, 2015 |
|
18.79 |
|
|
|
16.30 |
|
|
Quarter ended September 30, 2015 |
|
17.17 |
|
|
|
15.07 |
|
|
Quarter ended December 31, 2015 |
|
15.95 |
|
|
|
13.15 |
|
The per-share closing price for our common stock, as reported by the NYSE on February 16, 2016, was $12.48.
Holders of Our Common Stock
As of February 17, 2016, there were approximately 30 record holders of our common stock, including shares held in “street name” by nominees who are record holders.
27
Dividends
We intend to continue to pay quarterly dividends to holders of shares of common stock. Future dividends will be at the discretion of our board of directors and will depend on our earnings and financial condition, maintenance of our REIT qualification, restrictions on making distributions under Maryland law and such other factors as our board of directors deems relevant. For 2015, we paid $1.90 per share of common stock in dividends, all of which represented ordinary income for tax purposes. For 2014, we paid $2.00 per share of common stock in dividends, all of which represented ordinary income for tax purposes. The following table sets forth, for the periods indicated, the dividends declared per share of common stock.
|
|
Common Dividends Declared Per Share |
|
|
|
Quarter ended March 31, 2014 |
$ |
0.50 |
|
|
Quarter ended June 30, 2014 |
|
0.50 |
|
|
Quarter ended September 30, 2014 |
|
0.50 |
|
|
Quarter ended December 31, 2014 |
|
0.50 |
|
|
Quarter ended March 31, 2015 |
|
0.50 |
|
|
Quarter ended June 30, 2015 |
|
0.50 |
|
|
Quarter ended September 30, 2015 |
|
0.45 |
|
|
Quarter ended December 31, 2015 |
|
0.45 |
|
Performance Graph
The following graph provides a comparison of the cumulative total return on our common stock from December 31, 2010 to the NYSE closing price per share on December 31, 2015 with the cumulative total return on the Standard & Poor’s 500 Composite Stock Price Index (the “S&P 500”) and the FTSE National Association of Real Estate Investment Trusts Mortgage REIT Index (the “FTSE NAREIT MREIT Index”). Total return values were calculated assuming a $100 investment on December 31, 2010 with reinvestment of all dividends in (i) the common stock, (ii) the S&P 500 and (iii) the FTSE NAREIT MREIT Index.
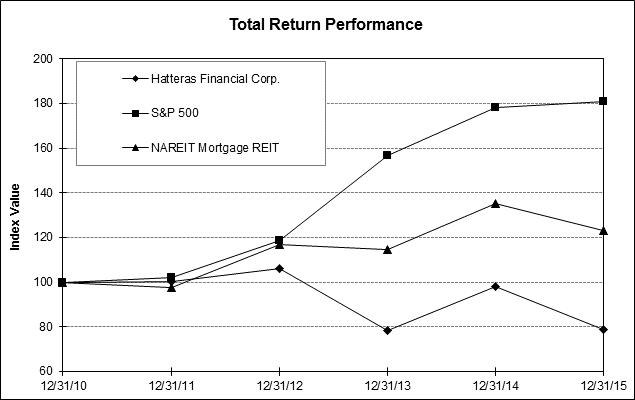
The actual returns shown on the graph above are as follows:
|
Index |
12/31/10 |
12/31/11 |
12/31/12 |
12/31/13 |
12/31/14 |
12/31/15 |
|
Hatteras Financial Corp. |
100.00 |
100.28 |
106.20 |
78.24 |
97.96 |
78.63 |
|
S&P 500 |
100.00 |
102.11 |
118.45 |
156.82 |
178.28 |
180.75 |
|
NAREIT Mortgage REIT |
100.00 |
97.58 |
116.99 |
114.70 |
135.21 |
123.21 |
28
Issuer Purchases of Equity Securities
On June 18, 2013, our board of directors authorized a share repurchase program (the “Repurchase Program”), which allowed us to repurchase up to 10,000,000 shares of our common stock as liquidity and market conditions permit. During the year ended December 31, 2015, we repurchased 1,443,283 shares of common stock under the Repurchase Program in at-the-market transactions at a total cost of approximately $20.8 million. From inception to December 31, 2015, we had repurchased 4,028,730 shares under the Repurchase Program for a total cost of $66.5 million. The timing, manner, price and actual number of shares repurchased will be subject to a variety of factors, including price, corporate and regulatory requirements, market conditions, applicable SEC rules and other corporate liquidity requirements and priorities. The Repurchase Program does not include specific price targets or an expiration date and may be suspended, modified or terminated at any time for any reason without prior notice. The Repurchase Program does not obligate us to acquire any specific number of shares, and all open market repurchases will be made in accordance with applicable rules and regulations setting forth certain restrictions on the method, timing, price and volume of open market share repurchases.
|
Period |
Total Number of Shares Purchased(1) |
|
Average Price Paid per Share(2) |
|
Total Number of Shares Purchased as Part of Publicly Announced Plans or Programs |
|
Maximum Number of Shares that May Yet Be Purchased Under the Plans or Programs(3) |
|
October 1, 2015 – October 31, 2015 |
- |
|
$ - |
|
- |
|
7,040,670 |
|
November 1, 2015 – November 30, 2015 |
197,400 |
|
$ 13.98 |
|
197,400 |
|
6,843,270 |
|
December 1, 2015 – December 31, 2015 |
872,000 |
|
$ 13.41 |
|
872,000 |
|
5,971,270 |
|
Total |
1,069,400 |
|
$ 13.51 |
|
1,069,400 |
|
5,971,270 |
|
|
(1) |
During the fourth quarter of 2015, we repurchased 1,069,400 shares of common stock under the Repurchase Program in at-the-market transactions at a total cost of $14,472. |
|
|
(2) |
Excludes commissions. |
|
|
(3) |
On June 18, 2013, we announced that our board of directors authorized the Repurchase Program to acquire up to 10,000,000 shares of our common stock as liquidity and market conditions permit. The timing, manner, price and actual number of shares repurchased will be subject to a variety of factors, including price, corporate and regulatory requirements, market conditions, applicable SEC rules and other corporate liquidity requirements and priorities. The Repurchase Program does not include specific price targets or an expiration date and may be suspended, modified or terminated at any time for any reason without prior notice. We are currently authorized by our board of trustees to repurchase or offer to repurchase shares of common stock under the Repurchase Program. |
Item 6.Selected Financial Data
The following table sets forth our selected historical operating and financial data. The selected historical operating and financial data for the five years ended December 31, 2015 have been derived from our historical financial statements.
The information presented below is only a summary and does not provide all of the information contained in our historical financial statements, including the related notes. You should read the information below in conjunction with “Management’s Discussion and Analysis of Financial Condition and Results of Operations” and our historical financial statements, including the related notes. This table includes non-GAAP financial measures. See the section on non-GAAP measures under “Management’s Discussion and Analysis of Financial Condition and Results of Operations—Results of Operations” for important information about these non-GAAP measures and reconciliations to the most comparable GAAP measures.
29
|
(Dollars in thousands, except share-related amounts) |
|
|
|
|
|
|
|
|
|
|
|
|
|
|
|
|
|
|
|
|
|
Years Ended December 31 |
|
|||||||||||||||||
|
|
2015 |
|
|
2014 |
|
|
2013 |
|
|
2012 |
|
|
2011 |
|
|||||
|
Statement of Income Data |
|
|
|
|
|
|
|
|
|
|
|
|
|
|
|
|
|
|
|
|
Interest income on securities |
$ |
305,717 |
|
|
$ |
354,436 |
|
|
$ |
450,708 |
|
|
$ |
504,800 |
|
|
$ |
424,713 |
|
|
Interest income on mortgage loans |
|
5,509 |
|
|
|
35 |
|
|
|
- |
|
|
|
- |
|
|
|
- |
|
|
Interest income on mortgage loans in securitization trusts |
|
446 |
|
|
|
- |
|
|
|
- |
|
|
|
- |
|
|
|
- |
|
|
Interest income on short-term cash investments |
|
1,367 |
|
|
|
1,283 |
|
|
|
1,560 |
|
|
|
1,508 |
|
|
|
1,407 |
|
|
Total interest expense |
|
(91,438 |
) |
|
|
(132,495 |
) |
|
|
(197,709 |
) |
|
|
(197,064 |
) |
|
|
(144,662 |
) |
|
Net interest margin |
|
221,601 |
|
|
|
223,259 |
|
|
|
254,559 |
|
|
|
309,244 |
|
|
|
281,458 |
|
|
|
|
|
|
|
|
|
|
|
|
|
|
|
|
|
|
|
|
|
|
|
Other income (loss): |
|
|
|
|
|
|
|
|
|
|
|
|
|
|
|
|
|
|
|
|
Servicing income |
|
20,111 |
|
|
|
- |
|
|
|
- |
|
|
|
- |
|
|
|
- |
|
|
Management fee income |
|
2,027 |
|
|
|
- |
|
|
|
- |
|
|
|
- |
|
|
|
- |
|
|
Net realized gain (loss) on sale of securities |
|
32,731 |
|
|
|
5,196 |
|
|
|
(283,012 |
) |
|
|
64,347 |
|
|
|
20,576 |
|
|
Impairment of MBS |
|
- |
|
|
|
- |
|
|
|
(8,102 |
) |
|
|
- |
|
|
|
- |
|
|
Net gain on mortgage loans, MSRs and other |
|
10,451 |
|
|
|
8 |
|
|
|
- |
|
|
|
- |
|
|
|
- |
|
|
Net gain (loss) on derivative instruments |
|
(188,416 |
) |
|
|
(141,433 |
) |
|
|
(69,715 |
) |
|
|
- |
|
|
|
- |
|
|
Total other income (loss) |
|
(123,096 |
) |
|
|
(136,229 |
) |
|
|
(360,829 |
) |
|
|
64,347 |
|
|
|
20,576 |
|
|
|
|
|
|
|
|
|
|
|
|
|
|
|
|
|
|
|
|
|
|
|
Expenses: |
|
|
|
|
|
|
|
|
|
|
|
|
|
|
|
|
|
|
|
|
Servicing expenses |
|
(3,022 |
) |
|
|
- |
|
|
|
- |
|
|
|
- |
|
|
|
- |
|
|
Securitization deal costs |
|
(1,473 |
) |
|
|
- |
|
|
|
- |
|
|
|
- |
|
|
|
- |
|
|
Other operating expenses |
|
(42,390 |
) |
|
|
(30,669 |
) |
|
|
(27,866 |
) |
|
|
(24,346 |
) |
|
|
(17,661 |
) |
|
Total expenses |
|
(46,885 |
) |
|
|
(30,669 |
) |
|
|
(27,866 |
) |
|
|
(24,346 |
) |
|
|
(17,661 |
) |
|
|
|
|
|
|
|
|
|
|
|
|
|
|
|
|
|
|
|
|
|
|
Net income (loss) |
|
51,620 |
|
|
|
56,361 |
|
|
|
(134,136 |
) |
|
|
349,245 |
|
|
|
284,373 |
|
|
Dividends on preferred stock |
|
(21,922 |
) |
|
|
(21,922 |
) |
|
|
(21,922 |
) |
|
|
(7,551 |
) |
|
|
- |
|
|
Net income (loss) available to common shareholders |
$ |
29,698 |
|
|
$ |
34,439 |
|
|
$ |
(156,058 |
) |
|
$ |
341,694 |
|
|
$ |
284,373 |
|
|
|
|
|
|
|
|
|
|
|
|
|
|
|
|
|
|
|
|
|
|
|
Comprehensive income (loss) available to common shareholders |
$ |
(77,409 |
) |
|
$ |
248,256 |
|
|
$ |
(426,964 |
) |
|
$ |
431,226 |
|
|
$ |
351,804 |
|
|
|
|
|
|
|
|
|
|
|
|
|
|
|
|
|
|
|
|
|
|
|
Earnings (loss) per share of common stock, basic and diluted |
$ |
0.31 |
|
|
$ |
0.36 |
|
|
$ |
(1.59 |
) |
|
$ |
3.67 |
|
|
$ |
3.97 |
|
|
|
|
|
|
|
|
|
|
|
|
|
|
|
|
|
|
|
|
|
|
|
Comprehensive income (loss) per share of common stock, basic and diluted |
$ |
(0.80 |
) |
|
$ |
2.57 |
|
|
$ |
(4.34 |
) |
|
$ |
4.63 |
|
|
$ |
4.91 |
|
|
|
|
|
|
|
|
|
|
|
|
|
|
|
|
|
|
|
|
|
|
|
Weighted average shares outstanding, basic and diluted |
|
96,665,489 |
|
|
|
96,603,634 |
|
|
|
98,337,362 |
|
|
|
93,185,520 |
|
|
|
71,708,058 |
|
|
|
|
|
|
|
|
|
|
|
|
|
|
|
|
|
|
|
|
|
|
|
Distributions per common share |
$ |
1.90 |
|
|
$ |
2.00 |
|
|
$ |
2.45 |
|
|
$ |
3.30 |
|
|
$ |
3.90 |
|
|
|
|
|
|
|
|
|
|
|
|
|
|
|
|
|
|
|
|
|
|
|
Selected Balance Sheet Data |
|
|
|
|
|
|
|
|
|
|
|
|
|
|
|
|
|
|
|
|
Interest-earning portfolio |
$ |
14,755,382 |
|
|
$ |
17,618,470 |
|
|
$ |
17,642,532 |
|
|
$ |
23,919,251 |
|
|
$ |
17,741,873 |
|
|
Total assets |
$ |
16,137,526 |
|
|
$ |
18,516,800 |
|
|
$ |
19,077,360 |
|
|
$ |
26,404,118 |
|
|
$ |
18,586,719 |
|
|
Total borrowings |
$ |
13,575,722 |
|
|
$ |
15,759,831 |
|
|
$ |
16,481,509 |
|
|
$ |
22,866,429 |
|
|
$ |
16,162,375 |
|
|
Shareholders' equity |
$ |
2,143,357 |
|
|
$ |
2,420,796 |
|
|
$ |
2,364,101 |
|
|
$ |
3,072,864 |
|
|
$ |
2,080,188 |
|
|
|
|
|
|
|
|
|
|
|
|
|
|
|
|
|
|
|
|
|
|
|
Key Statistics (1) |
|
|
|
|
|
|
|
|
|
|
|
|
|
|
|
|
|
|
|
|
Average interest-earning portfolio |
$ |
16,302,242 |
|
|
$ |
16,943,788 |
|
|
$ |
23,010,281 |
|
|
$ |
22,167,760 |
|
|
$ |
14,932,378 |
|
|
Average borrowings |
$ |
14,823,829 |
|
|
$ |
15,291,888 |
|
|
$ |
21,249,868 |
|
|
$ |
20,468,353 |
|
|
$ |
13,692,704 |
|
|
Average equity |
$ |
2,348,657 |
|
|
$ |
2,433,070 |
|
|
$ |
2,731,439 |
|
|
$ |
2,732,423 |
|
|
$ |
1,899,211 |
|
|
Average interest-earning portfolio yield (2) |
|
1.91 |
% |
|
|
2.09 |
% |
|
|
1.96 |
% |
|
|
2.28 |
% |
|
|
2.84 |
% |
|
Average cost of funds (3) |
|
0.62 |
% |
|
|
0.87 |
% |
|
|
0.93 |
% |
|
|
0.96 |
% |
|
|
1.06 |
% |
|
Interest rate spread (4) |
|
1.29 |
% |
|
|
1.22 |
% |
|
|
1.03 |
% |
|
|
1.32 |
% |
|
|
1.78 |
% |
|
TBA dollar roll income |
$ |
83,397 |
|
|
$ |
92,008 |
|
|
$ |
5,605 |
|
|
$ |
- |
|
|
$ |
- |
|
30
|
(Dollars in thousands, except share-related amounts) |
|
|
|
|
|
|
|
|
|
|
|
|
|
|
|
|
|
|
|
|
|
Years Ended December 31 |
|
|||||||||||||||||
|
|
2015 |
|
|
2014 |
|
|
2013 |
|
|
2012 |
|
|
2011 |
|
|||||
|
Average TBA dollar roll position |
$ |
3,652,988 |
|
|
$ |
3,320,499 |
|
|
$ |
185,451 |
|
|
$ |
- |
|
|
$ |
- |
|
|
Average interest-earning yield, including TBA dollar roll income (5) |
|
1.98 |
% |
|
|
2.20 |
% |
|
|
1.97 |
% |
|
|
2.28 |
% |
|
|
2.84 |
% |
|
Effective interest expense (6) |
$ |
163,907 |
|
|
$ |
166,315 |
|
|
$ |
204,366 |
|
|
$ |
197,064 |
|
|
$ |
144,662 |
|
|
Effective cost of funds (6) |
|
1.11 |
% |
|
|
1.09 |
% |
|
|
0.96 |
% |
|
|
0.96 |
% |
|
|
1.06 |
% |
|
Effective net interest margin (7) |
$ |
232,529 |
|
|
$ |
281,447 |
|
|
$ |
253,507 |
|
|
$ |
309,244 |
|
|
$ |
281,458 |
|
|
Effective interest rate spread (8) |
|
0.87 |
% |
|
|
1.11 |
% |
|
|
1.01 |
% |
|
|
1.32 |
% |
|
|
1.78 |
% |
|
Core earnings (9) |
$ |
188,501 |
|
|
$ |
228,856 |
|
|
$ |
203,719 |
|
|
$ |
277,347 |
|
|
$ |
263,797 |
|
|
Core earnings per share, basic and diluted (9) |
$ |
1.95 |
|
|
$ |
2.37 |
|
|
$ |
2.07 |
|
|
$ |
2.98 |
|
|
$ |
3.68 |
|
|
Average annual securities portfolio repayment rate (10) |
|
24.98 |
% |
|
|
20.93 |
% |
|
|
25.70 |
% |
|
|
26.39 |
% |
|
|
24.54 |
% |
|
Debt to equity (at period end) (11) |
6.3:1 |
|
|
6.5:1 |
|
|
7.0:1 |
|
|
7.4:1 |
|
|
7.8:1 |
|
|||||
|
Debt to paid-in capital (at period end) (12) |
5.0:1 |
|
|
5.8:1 |
|
|
6.0:1 |
|
|
8.2:1 |
|
|
8.5:1 |
|
|||||
|
Effective debt to equity (at period end) (13) |
7.6:1 |
|
|
8.0:1 |
|
|
7.3:1 |
|
|
7.4:1 |
|
|
7.8:1 |
|
|||||
|
|
(1) |
The averages presented herein are computed from our books and records, using daily weighted values. Percentages are annualized, as appropriate. |
|
|
(2) |
Average interest-earning portfolio yield was calculated by dividing our interest income on MBS, agency CRT securities and mortgage loans held for investment, net of amortization as applicable, by our average MBS, agency CRT securities and mortgage loans held for investment. |
|
|
(3) |
Average cost of funds was calculated by dividing our total interest expense (including hedges) by the sum of our average balance outstanding under our borrowings for the period. |
|
|
(4) |
Interest rate spread was calculated by subtracting our average cost of funds from our average interest-earning portfolio yield. |
|
|
(5) |
Average interest-earning portfolio yield, including TBA dollar roll income was calculated the same as average interest-earning portfolio yield other than to include TBA dollar roll income in the numerator and our average TBA dollar roll position in the denominator. |
|
|
(6) |
Effective interest expense includes certain interest rate swap adjustments and gains/losses on maturities of Eurodollar futures. Effective cost of funds is effective interest expense for the period divided by average borrowings for the period. See “Management’s Discussion and Analysis of Financial Condition and Results of Operations—Results of Operations” for more information, including reconciliations for 2015, 2014 and 2013. For 2011 through 2012, effective interest expense is identical to interest expense determined in accordance with GAAP. |
|
|
(7) |
Effective net interest margin includes certain interest rate swap adjustments, gains/losses on maturities of Eurodollar futures and TBA dollar roll income. See “Management’s Discussion and Analysis of Financial Condition and Results of Operations—Results of Operations” for more information including reconciliations for 2015, 2014 and 2013. For 2011 and 2012, effective net interest margin is identical to net interest margin determined in accordance with GAAP. |
|
|
(8) |
Effective interest rate spread was calculated by subtracting our effective cost of funds from our average interest-earning portfolio yield including TBA dollar roll income. |
|
|
(9) |
Core earnings consists of effective interest margin plus servicing income net of amortization, management fee income and gain from mortgage loans held for sale, reduced by adjusted operating expenses and dividends on preferred stock for the period. See “Management’s Discussion and Analysis of Financial Condition and Results of Operations—Results of Operations” for more information, including reconciliations for 2015, 2014 and 2013. For 2011 and 2012, core earnings consists of net interest margin determined in accordance with GAAP reduced by operating expenses and dividends on preferred stock, as applicable. |
|
|
(10) |
Our average annual portfolio repayment rate was calculated by dividing our total principal payments received during the year on securities (scheduled and unscheduled) by our average securities. |
|
|
(11) |
Our debt to equity ratio was calculated by dividing the amounts outstanding under our repurchase agreements and dollar roll liability at period end by our shareholders’ equity at period end. |
|
|
(12) |
Our debt to paid-in capital ratio was calculated by dividing the amounts outstanding under our repurchase agreements and dollar roll liability at period end by the sum of the carrying value of our preferred stock, the par value of our common stock and additional paid in capital at period end. |
|
|
(13) |
Our effective debt to equity ratio was calculated the same as our debt to equity ratio other than to include our off-balance sheet TBA dollar roll liability at period end in the numerator. Our off-balance sheet TBA dollar roll liability was $2,730,705, $3,518,289 and $684,484 as of December 31, 2015, 2014 and 2013, respectively. For 2011 and 2012, effective debt to equity is identical to our debt to equity ratio determined in accordance with GAAP. |
31
Item 7.Management’s Discussion and Analysis of Financial Condition and Results of Operations
The following discussion of our financial condition and results of operations should be read in conjunction with our financial statements and related notes included elsewhere in this report.
Dollar amounts other than share-related amounts are presented in thousands, unless otherwise noted.
Overview
We are an externally-managed mortgage REIT incorporated in Maryland in September 2007 to invest in single-family residential mortgage real estate assets. Currently, the majority of these assets consist of mortgage pass-through securities guaranteed or issued by a U.S. Government agency (such as Ginnie Mae), or by a U.S. Government-sponsored enterprise (such as Fannie Mae or Freddie Mac). Our principal goal is to generate net income for distribution to our shareholders through regular quarterly dividends and protect and grow our shareholders’ equity (which we also refer to as our “book value”) through prudent interest rate risk management. Our net income is determined primarily by the difference between the interest income we earn on our mortgage assets, net of premium or discount amortization as applicable and the cost of our borrowings and hedging activities, which we also refer to as our net interest spread or net interest margin. We utilize substantial borrowings in financing our investment portfolio, which can enhance potential returns but can also exacerbate losses. In general, our book value is most affected by our issuance or purchase of shares of our common stock, our retained earnings or losses, and changes in the value of our investment portfolio and our hedging instruments.
We define “earning assets” as the sum of our MBS, agency CRT securities, mortgage loans held for investment (including those held in securitization trusts) and MSR. The following table represents key quarterly data regarding our company for the three years ended December 31, 2015:
|
As of |
|
Earning Assets |
|
|
Borrowings |
|
|
Equity |
|
|
Shares Outstanding |
|
|
Book Value Per Share |
|
|
Earnings Per Share |
|
||||||
|
December 31, 2015 |
|
$ |
15,025,308 |
|
|
$ |
13,575,722 |
|
|
$ |
2,143,357 |
|
|
|
95,774 |
|
|
$ |
19.38 |
|
|
$ |
1.45 |
|
|
September 30, 2015 |
|
|
15,908,308 |
|
|
|
14,288,113 |
|
|
|
2,192,442 |
|
|
|
96,771 |
|
|
|
19.69 |
|
|
|
(0.93 |
) |
|
June 30, 2015 |
|
|
16,852,703 |
|
|
|
14,993,065 |
|
|
|
2,326,187 |
|
|
|
96,791 |
|
|
|
21.06 |
|
|
|
0.20 |
|
|
March 31, 2015 |
|
|
17,048,305 |
|
|
|
15,108,538 |
|
|
|
2,422,142 |
|
|
|
96,791 |
|
|
|
22.05 |
|
|
|
(0.41 |
) |
|
December 31, 2014 |
|
|
17,618,470 |
|
|
|
15,759,831 |
|
|
|
2,420,796 |
|
|
|
96,771 |
|
|
|
22.05 |
|
|
|
(0.32 |
) |
|
September 30, 2014 |
|
|
16,890,424 |
|
|
|
14,920,959 |
|
|
|
2,444,492 |
|
|
|
96,720 |
|
|
|
22.30 |
|
|
|
0.75 |
|
|
June 30, 2014 |
|
|
16,651,220 |
|
|
|
15,019,880 |
|
|
|
2,433,011 |
|
|
|
96,517 |
|
|
|
22.23 |
|
|
|
(0.19 |
) |
|
March 31, 2014 |
|
|
17,137,956 |
|
|
|
15,183,457 |
|
|
|
2,392,714 |
|
|
|
96,515 |
|
|
|
21.81 |
|
|
|
0.12 |
|
|
December 31, 2013 |
|
|
17,642,532 |
|
|
|
16,129,683 |
|
|
|
2,364,101 |
|
|
|
96,602 |
|
|
|
21.50 |
|
|
|
(0.16 |
) |
|
September 30, 2013 |
|
|
19,843,830 |
|
|
|
18,829,771 |
|
|
|
2,373,641 |
|
|
|
97,909 |
|
|
|
21.31 |
|
|
|
(2.72 |
) |
|
June 30, 2013 |
|
|
25,256,043 |
|
|
|
23,077,252 |
|
|
|
2,479,089 |
|
|
|
98,830 |
|
|
|
22.18 |
|
|
|
0.66 |
|
|
March 31, 2013 |
|
|
25,162,730 |
|
|
|
22,586,932 |
|
|
|
3,072,265 |
|
|
|
98,830 |
|
|
|
28.18 |
|
|
|
0.62 |
|
Factors that Affect our Results of Operations and Financial Condition
Our results of operations and financial condition are affected by various factors, many of which are beyond our control, including, among other things, our net interest margin, the market value of our assets and the supply of and demand for such assets. We invest in financial assets and markets, and recent events, including those discussed below, can affect our business in ways that are difficult to predict, and produce results outside of typical operating variances. Our net interest margin varies primarily as a result of changes in interest rates, borrowing costs and prepayment speeds, the behavior of which involves various risks and uncertainties. Prepayment rates, as reflected by the rate of principal paydown, and interest rates vary according to the type of investment, conditions in financial markets, government actions, competition and other factors, none of which can be predicted with any certainty. In general, as prepayment rates on our MBS purchased at a premium increase, related purchase premium amortization increases, thereby reducing the net yield on such assets. Because changes in interest rates may significantly affect our activities, our operating results depend, in large part, upon our ability to manage interest rate risks and prepayment risks effectively while maintaining our status as a REIT.
We anticipate that, for any period during which changes in the interest rates earned on our assets do not coincide with interest rate changes on our borrowings, such asset coupon rates will reprice more slowly than the corresponding borrowing rates for the liabilities used to finance those assets. Consequently, changes in interest rates, particularly short-term interest rates, may significantly influence our net interest margin. With the maturities of our assets generally being longer term than those of our liabilities, interest rate increases will tend to decrease our net interest margin and the market value of our assets (and therefore our book value). Such rate increases could possibly result in operating losses or adversely affect our ability to make distributions to our shareholders.
Prepayments on MBS and the underlying mortgage loans may be influenced by changes in market interest rates and a variety of economic, geographic and other factors beyond our control; and consequently such prepayment rates cannot be predicted with certainty.
32
To the extent we have acquired MBS at a premium or discount to par, or face value, changes in prepayment rates may impact our anticipated yield. In periods of declining interest rates, prepayments on our MBS will likely increase. If we are unable to reinvest the proceeds of these prepayments at comparable yields, our net interest margin may suffer. The current climate of government intervention in the mortgage market significantly increases the risk associated with prepayments.
While we intend to use hedging to mitigate some of our interest rate risk, we do not intend to hedge all of our exposure to changes in interest rates and prepayment rates, as there are practical limitations on our ability to insulate our portfolio from all potential negative consequences associated with changes in short-term interest rates in a manner that will allow us to seek attractive net spreads on our portfolio.
In addition, a variety of other factors relating to our business may also impact our financial condition and operating performance. These factors include:
|
|
· |
our degree of leverage; |
|
|
· |
our access to funding and borrowing capacity; |
|
|
· |
our borrowing costs; |
|
|
· |
our hedging activities; |
|
|
· |
the market value of our investments; and |
|
|
· |
the REIT requirements, the requirements to qualify for an exemption under the Investment Company Act and other regulatory and accounting policies related to our business. |
Our manager is entitled to receive a management fee that is based on our equity (as defined in our management agreement), regardless of the performance of our portfolio. Accordingly, the payment of our management fee may not decline in the event of a decline in our profitability and may cause us to incur losses.
For a discussion of additional risks relating to our business see Item 1A - “Risk Factors”.
Market and Interest Rate Trends and the Effect on our Portfolio
Interest Rates
Mortgage markets in general, and our strategy in particular, are interest rate sensitive. The relationship between several interest rates is generally determinant of the performance of our company. In the United States, interest rates are highly determined by the U.S. Federal Reserve actions and outlooks for setting their benchmark rate. Current speculation about when, and with what frequency, the U.S. Federal Reserve will change short-term interest rates has increased volatility in asset pricing and nervousness among interest rate investors. The lack of certainty about the rate environment tends to decrease the value of our assets.
Our borrowings in the repurchase market have historically closely tracked LIBOR and the U.S. Federal Funds Effective Rate. Significant volatility in these rates or a divergence from the historical relationship among these rates could negatively impact our ability to manage our portfolio. The investments we buy are affected by the shape of the yield curve, particularly along the area between two-year Treasury rates and 10-year Treasury rates. The values of the hedges we employ are affected by the interest rate spread over the corresponding Treasury rates of two-year, three-year and five-year swaps, with the two-year currently being most representative of our portfolio composition.
33
The following table shows the 30-day LIBOR as compared to these rates at each period end:
|
|
30- day LIBOR |
|
Fed Funds Effective Rate |
|
Two-Year |
|
10-Year |
|
Two-Year |
|
December 31, 2015 |
0.43% |
|
0.20% |
|
1.06% |
|
2.27% |
|
0.12% |
|
September 30, 2015 |
0.19% |
|
0.07% |
|
0.64% |
|
2.06% |
|
0.12% |
|
June 30, 2015 |
0.19% |
|
0.08% |
|
0.64% |
|
2.35% |
|
0.26% |
|
March 31, 2015 |
0.18% |
|
0.06% |
|
0.56% |
|
1.94% |
|
0.25% |
|
December 31, 2014 |
0.17% |
|
0.06% |
|
0.67% |
|
2.17% |
|
0.23% |
|
September 30, 2014 |
0.16% |
|
0.07% |
|
0.58% |
|
2.52% |
|
0.25% |
|
June 30, 2014 |
0.16% |
|
0.09% |
|
0.47% |
|
2.53% |
|
0.13% |
|
March 31, 2014 |
0.15% |
|
0.06% |
|
0.44% |
|
2.73% |
|
0.13% |
|
December 31, 2013 |
0.17% |
|
0.07% |
|
0.38% |
|
3.04% |
|
0.11% |
|
September 30, 2013 |
0.18% |
|
0.06% |
|
0.33% |
|
2.64% |
|
0.14% |
|
June 30, 2013 |
0.19% |
|
0.07% |
|
0.36% |
|
2.49% |
|
0.16% |
|
March 31, 2013 |
0.20% |
|
0.09% |
|
0.24% |
|
1.85% |
|
0.18% |
While short-term rates have been relatively stable over this period, long-term rates have been less so. This primarily affects the values of our investments and hedges, and prepayment rates on our investments. Swap spreads have been more volatile in recent years, with three-year and five-year swap spreads entering the single digits (in terms of basis points) and even turning negative at times. In periods where swap spreads tighten or widen, our hedges will be less effective in their ability to mitigate changes in the values of our investments.
Principal Repayment Rate
Our net interest margin is primarily a function of the difference between the yield on our interest-earning assets and the financing cost of owning those assets. Since we tend to purchase securities at a premium to par, the main item that can affect the yield on our securities after they are purchased is the rate at which the mortgage borrowers repay the loan. While the scheduled repayments, which are the principal portion of the homeowners’ regular monthly payments, are fairly predictable, the unscheduled repayments, which are generally refinancing of the mortgage, are less so. Estimates of repayment rates are critical to the management of our portfolio, not only for estimating current yield but also to consider the rate of reinvestment of those proceeds into new securities, the yields which those new securities may add to our portfolio, as well as the extent to which we extend the duration of our liabilities in connection with hedging activities.
The following table shows the weighted average principal repayment rate and the one-month constant prepayment rate (“CPR”) for our securities portfolio for the periods presented:
|
|
|
Weighted-Average Principal Repayment Rate (1) |
|
|
Weighted-Average Principal Repayment Rate Annualized (2) |
|
|
Weighted-Average One Month CPR (3) |
|
|||
|
December 31, 2015 |
|
|
5.85% |
|
|
|
23.40% |
|
|
|
17.2 |
|
|
September 30, 2015 |
|
|
7.24% |
|
|
|
28.96% |
|
|
|
21.1 |
|
|
June 30, 2015 |
|
|
6.65% |
|
|
|
26.60% |
|
|
|
19.5 |
|
|
March 31, 2015 |
|
|
5.26% |
|
|
|
21.04% |
|
|
|
15.4 |
|
|
December 31, 2014 |
|
|
5.16% |
|
|
|
20.63% |
|
|
|
15.4 |
|
|
September 30, 2014 |
|
|
6.33% |
|
|
|
25.31% |
|
|
|
19.0 |
|
|
June 30, 2014 |
|
|
5.09% |
|
|
|
20.36% |
|
|
|
15.4 |
|
|
March 31, 2014 |
|
|
4.42% |
|
|
|
17.66% |
|
|
|
13.0 |
|
|
December 31, 2013 |
|
|
4.89% |
|
|
|
19.55% |
|
|
|
14.2 |
|
|
September 30, 2013 |
|
|
6.93% |
|
|
|
27.72% |
|
|
|
19.7 |
|
|
June 30, 2013 |
|
|
7.03% |
|
|
|
28.10% |
|
|
|
20.8 |
|
|
March 31, 2013 |
|
|
6.50% |
|
|
|
26.01% |
|
|
|
19.0 |
|
|
|
(1) |
Scheduled and unscheduled principal payments as a percentage of the weighted average portfolio. |
|
|
(2) |
Weighted average principal repayment rate annualized. |
|
|
(3) |
CPR measures one month of unscheduled repayments as a percentage of principal on an annualized basis. |
Our investments in mortgage loans are also subject to prepayment risk. However, we account for our mortgage loans under the fair value option and recognize interest income thereon based on the contractual rate of the loans. Thus, the reported yield on our mortgage
34
loan portfolio is not impacted by prepayments, other than to the extent they impact the weighted-average contractual rate of the portfolio. Instead, prepayments (and forward-looking prepayment assumptions) impact our earnings through changes in the fair value of our mortgage loans.
Our investments in MSR are also subject to prepayment risk. Revenue on MSR consists primarily of a servicing fee expressed in a number of basis points on the unpaid principal balance (“UPB”) of the underlying mortgage loans. Prepayments in the underlying loans decrease future servicing revenue by reducing the UPB upon which servicing revenue is calculated. Because MSR essentially represent interest-only strips on the underlying loans, there is no early return of principal when prepayments occur, unlike investments in MBS and mortgage loans. This makes prepayment risk particularly important for MSR. Since we account for our MSR under the fair value option, prepayments primarily affect our fair value changes on MSR.
Book Value per Share
As of December 31, 2015, our book value per share of common stock (total shareholders’ equity less the aggregate liquidation preference for Series A Preferred Stock divided by shares of common stock outstanding) was $19.38, a decrease of $2.67, from $22.05 at December 31, 2014. In 2015, the decrease in our book value was primarily a result of our comprehensive loss along with dividends declared on common and preferred stock. Our comprehensive loss was driven by higher interest rates, which decreased the value of our assets, and by tightening in swap spreads that prevented our hedges from effectively mitigating the decline in the fair value of our investments. The following table shows the components of our book value on a per share basis at each period end:
|
As of |
|
Book Value Per Share |
|
|
|
December 31, 2015 |
|
$ |
19.38 |
|
|
September 30, 2015 |
|
|
19.69 |
|
|
June 30, 2015 |
|
|
21.06 |
|
|
March 31, 2015 |
|
|
22.05 |
|
|
December 31, 2014 |
|
|
22.05 |
|
|
September 30, 2014 |
|
|
22.30 |
|
|
June 30, 2014 |
|
|
22.23 |
|
|
March 31, 2014 |
|
|
21.81 |
|
|
December 31, 2013 |
|
|
21.50 |
|
|
September 30, 2013 |
|
|
21.31 |
|
|
June 30, 2013 |
|
|
22.18 |
|
|
March 31, 2013 |
|
|
28.18 |
|
Mortgage-backed Securities and Agency CRT Securities
We invest in both adjustable and fixed-rate agency securities, non-agency securities. which are not issued or guaranteed by a U.S. Government agency or a U.S. Government entity, and agency CRT securities issued by Fannie Mae and Freddie Mac (collectively, “securities”). While agency CRT securities are debt obligations of Fannie Mae and Freddie Mac, the payment of principal on these securities is not guaranteed and we may incur a loss if the loans in the associated reference pools experience delinquencies exceeding specified thresholds. We assess the credit risk associated with our investment in agency CRT securities by assessing the current performance of the loans in the associated reference pool. Over time, our investments in non-agency securities and agency CRT securities may increase further, depending on our view of the relative risk-return attributes of these instruments.
At December 31, 2015 and 2014, we owned $14.4 billion of securities. While our strategy focuses on ARM securities, we also own fixed-rate securities with estimated durations that we believe are beneficial to the overall mix of our assets. As of December 31, 2015 and 2014, our securities portfolio was purchased at a net premium to par, or face value, with a weighted-average amortized cost of 102.72 and 102.91, respectively, of face value. As of December 31, 2015 and 2014, we had approximately $379.6 million and $490.2 million, respectively, of unamortized premium included in the cost basis of our securities.
During the year ended December 31, 2015, we purchased approximately $3.6 billion of securities (at face amount) with a weighted average coupon of 2.85%. We also sold approximately $2.7 billion of securities (at face amount) with a weighted average coupon of 3.09%. During the year ended December 31, 2014, we purchased approximately $5.2 billion of securities with a weighted average coupon of 2.90%. We also sold approximately $1.7 billion of securities with a weighted average coupon of 2.83%. In 2014 the purchases and sales represented a sizable repositioning of our portfolio as well as a net reduction in overall size. These actions were taken to better position the portfolio for the expected risk environment by reducing our leverage ratio and the duration of our assets.
We typically want to own a higher percentage of Fannie Mae ARMs, than Freddie Mac ARMs as Fannie Mae has better cash flow to the security holder because Fannie Mae pays principal and interest sooner after accrual (54 days) as compared to Freddie Mac (75 days).
35
Our securities portfolio and consisted of the following at December 31, 2015:
|
|
Amortized Cost |
|
|
Gross Unrealized Loss |
|
|
Gross Unrealized Gain |
|
|
Estimated Fair Value |
|
|
% of Total |
|
|||||
|
Agency Securities |
|
|
|
|
|
|
|
|
|
|
|
|
|
|
|
|
|
|
|
|
Fannie Mae Certificates |
|
|
|
|
|
|
|
|
|
|
|
|
|
|
|
|
|
|
|
|
ARMs |
$ |
7,392,021 |
|
|
$ |
(14,465 |
) |
|
$ |
102,247 |
|
|
$ |
7,479,803 |
|
|
|
52.3 |
% |
|
Fixed-Rate |
|
1,005,458 |
|
|
|
(8,148 |
) |
|
|
- |
|
|
|
997,310 |
|
|
|
7.0 |
% |
|
Total Fannie Mae |
|
8,397,479 |
|
|
|
(22,613 |
) |
|
|
102,247 |
|
|
|
8,477,113 |
|
|
|
|
|
|
|
|
|
|
|
|
|
|
|
|
|
|
|
|
|
|
|
|
|
|
|
Freddie Mac Certificates |
|
|
|
|
|
|
|
|
|
|
|
|
|
|
|
|
|
|
|
|
ARMs |
|
5,806,425 |
|
|
|
(22,551 |
) |
|
|
41,243 |
|
|
|
5,825,117 |
|
|
|
40.7 |
% |
|
Fixed-Rate |
|
- |
|
|
|
- |
|
|
|
- |
|
|
|
- |
|
|
|
0.0 |
% |
|
Total Freddie Mac |
|
5,806,425 |
|
|
|
(22,551 |
) |
|
|
41,243 |
|
|
|
5,825,117 |
|
|
|
|
|
|
|
|
|
|
|
|
|
|
|
|
|
|
|
|
|
|
|
|
|
|
|
Total Agency MBS |
$ |
14,203,904 |
|
|
$ |
(45,164 |
) |
|
$ |
143,490 |
|
|
$ |
14,302,230 |
|
|
|
100.0 |
% |
|
|
|
|
|
|
|
|
|
|
|
|
|
|
|
|
|
|
|
|
|
|
Agency CRT Securities |
$ |
111,217 |
|
|
$ |
(1,830 |
) |
|
$ |
- |
|
|
$ |
109,387 |
|
|
|
|
|
|
|
|
|
|
|
|
|
|
|
|
|
|
|
|
|
|
|
|
|
|
Our securities portfolio consisted of the following at December 31, 2014:
|
|
Amortized Cost |
|
|
Gross Unrealized Loss |
|
|
Gross Unrealized Gain |
|
|
Estimated Fair Value |
|
|
% of Total |
|
|||||
|
Agency Securities |
|
|
|
|
|
|
|
|
|
|
|
|
|
|
|
|
|
|
|
|
Fannie Mae Certificates |
|
|
|
|
|
|
|
|
|
|
|
|
|
|
|
|
|
|
|
|
ARMs |
$ |
9,203,741 |
|
|
$ |
(13,737 |
) |
|
$ |
183,889 |
|
|
$ |
9,373,893 |
|
|
|
53.3 |
% |
|
Fixed-Rate |
|
1,111,288 |
|
|
|
- |
|
|
|
5,177 |
|
|
|
1,116,465 |
|
|
|
6.4 |
% |
|
Total Fannie Mae |
|
10,315,029 |
|
|
|
(13,737 |
) |
|
|
189,066 |
|
|
|
10,490,358 |
|
|
|
|
|
|
|
|
|
|
|
|
|
|
|
|
|
|
|
|
|
|
|
|
|
|
|
Freddie Mac Certificates |
|
|
|
|
|
|
|
|
|
|
|
|
|
|
|
|
|
|
|
|
ARMs |
|
6,805,885 |
|
|
|
(21,794 |
) |
|
|
76,790 |
|
|
|
6,860,881 |
|
|
|
39.0 |
% |
|
Fixed-Rate |
|
158,402 |
|
|
|
- |
|
|
|
1,767 |
|
|
|
160,169 |
|
|
|
0.9 |
% |
|
Total Freddie Mac |
|
6,964,287 |
|
|
|
(21,794 |
) |
|
|
78,557 |
|
|
|
7,021,050 |
|
|
|
|
|
|
|
|
|
|
|
|
|
|
|
|
|
|
|
|
|
|
|
|
|
|
|
Total Agency MBS |
|
17,279,316 |
|
|
|
(35,531 |
) |
|
|
267,623 |
|
|
|
17,511,408 |
|
|
|
99.6 |
% |
|
|
|
|
|
|
|
|
|
|
|
|
|
|
|
|
|
|
|
|
|
|
Total Non-Agency MBS (ARMs) |
|
75,454 |
|
|
|
- |
|
|
|
148 |
|
|
|
75,602 |
|
|
|
0.4 |
% |
|
|
|
|
|
|
|
|
|
|
|
|
|
|
|
|
|
|
|
|
|
|
Total MBS |
$ |
17,354,770 |
|
|
$ |
(35,531 |
) |
|
$ |
267,771 |
|
|
$ |
17,587,010 |
|
|
|
100.0 |
% |
36
Adjustable-rate securities
As of December 31, 2015 our investment portfolio included adjustable-rate securities as follows:
|
Months to Reset |
% of ARM Portfolio |
|
|
Current Face Value (1) |
|
|
Weighted Avg. Coupon (2) |
|
|
Wtd. Avg. Amortized Purchase Price (3) |
|
|
Amortized Cost (4) |
|
|
Weighted Avg. Market Price (5) |
|
|
Market Value (6) |
|
|||||||||||||||||||||
|
0-12 |
|
17.7 |
% |
|
$ |
2,257,422 |
|
|
|
2.84 |
% |
|
$ |
101.95 |
|
|
$ |
2,301,436 |
|
|
$ |
105.30 |
|
|
$ |
2,377,014 |
|
||||||||||||||
|
13-24 |
|
10.9 |
% |
|
|
1,405,584 |
|
|
|
2.69 |
% |
|
$ |
102.75 |
|
|
|
1,444,298 |
|
|
$ |
104.41 |
|
|
|
1,467,597 |
|
||||||||||||||
|
25-36 |
|
12.6 |
% |
|
|
1,626,999 |
|
|
|
2.87 |
% |
|
$ |
102.67 |
|
|
|
1,670,489 |
|
|
$ |
104.03 |
|
|
|
1,692,591 |
|
||||||||||||||
|
37-48 |
|
35.8 |
% |
|
|
4,679,280 |
|
|
|
2.50 |
% |
|
$ |
103.03 |
|
|
|
4,821,273 |
|
|
$ |
102.70 |
|
|
|
4,805,462 |
|
||||||||||||||
|
49-60 |
|
10.0 |
% |
|
|
1,311,237 |
|
|
|
2.43 |
% |
|
$ |
102.47 |
|
|
|
1,343,689 |
|
|
$ |
102.10 |
|
|
|
1,338,716 |
|
||||||||||||||
|
61-72 |
|
7.6 |
% |
|
|
986,205 |
|
|
|
2.95 |
% |
|
$ |
102.39 |
|
|
|
1,009,803 |
|
|
$ |
102.96 |
|
|
|
1,015,398 |
|
||||||||||||||
|
73-84 |
|
5.1 |
% |
|
|
670,062 |
|
|
|
2.73 |
% |
|
$ |
102.28 |
|
|
|
685,338 |
|
|
$ |
102.11 |
|
|
|
684,191 |
|
||||||||||||||
|
109-120 |
|
0.3 |
% |
|
|
32,772 |
|
|
|
2.85 |
% |
|
$ |
101.72 |
|
|
|
33,337 |
|
|
$ |
101.73 |
|
|
|
33,338 |
|
||||||||||||||
|
Total ARMS and Agency CRTs |
|
100.0 |
% |
|
$ |
12,969,561 |
|
|
|
2.67 |
% |
|
$ |
102.62 |
|
|
$ |
13,309,663 |
|
|
$ |
103.43 |
|
|
$ |
13,414,307 |
|
||||||||||||||
As of December 31, 2014, our investment portfolio included adjustable-rate securities as follows:
|
Months to Reset |
% of ARM Portfolio |
|
|
Current Face Value (1) |
|
|
Weighted Avg. Coupon (2) |
|
|
Wtd. Avg. Amortized Purchase Price (3) |
|
|
Amortized Cost (4) |
|
|
Weighted Avg. Market Price (5) |
|
|
Market Value (6) |
|
|||||||
|
0-12 |
|
14.0 |
% |
|
$ |
2,128,967 |
|
|
|
3.02 |
% |
|
$ |
102.24 |
|
|
$ |
2,176,760 |
|
|
$ |
106.76 |
|
|
$ |
2,272,988 |
|
|
13-24 |
|
11.0 |
% |
|
|
1,696,057 |
|
|
|
2.97 |
% |
|
$ |
102.44 |
|
|
|
1,737,488 |
|
|
$ |
106.09 |
|
|
|
1,799,368 |
|
|
25-36 |
|
12.4 |
% |
|
|
1,934,060 |
|
|
|
2.73 |
% |
|
$ |
102.78 |
|
|
|
1,987,805 |
|
|
$ |
104.77 |
|
|
|
2,026,261 |
|
|
37-48 |
|
13.9 |
% |
|
|
2,178,095 |
|
|
|
2.89 |
% |
|
$ |
102.69 |
|
|
|
2,236,582 |
|
|
$ |
104.16 |
|
|
|
2,268,665 |
|
|
49-60 |
|
35.9 |
% |
|
|
5,694,326 |
|
|
|
2.52 |
% |
|
$ |
103.06 |
|
|
|
5,868,751 |
|
|
$ |
102.83 |
|
|
|
5,855,524 |
|
|
61-72 |
|
5.4 |
% |
|
|
861,146 |
|
|
|
2.52 |
% |
|
$ |
102.65 |
|
|
|
883,954 |
|
|
$ |
102.19 |
|
|
|
880,039 |
|
|
73-84 |
|
7.4 |
% |
|
|
1,165,719 |
|
|
|
2.98 |
% |
|
$ |
102.40 |
|
|
|
1,193,740 |
|
|
$ |
103.59 |
|
|
|
1,207,531 |
|
|
Total ARMS |
|
100.0 |
% |
|
$ |
15,658,370 |
|
|
|
2.75 |
% |
|
$ |
102.73 |
|
|
$ |
16,085,080 |
|
|
$ |
104.16 |
|
|
$ |
16,310,376 |
|
|
|
(1) |
The current face is the current monthly remaining dollar amount of principal of a mortgage security. We compute current face by multiplying the original face value of the security by the current principal balance factor. The current principal balance factor is essentially a fraction, where the numerator is the current outstanding balance and the denominator is the original principal balance. |
|
|
(2) |
For a pass-through certificate, the coupon reflects the weighted average nominal rate of interest paid on the underlying mortgage loans, net of fees paid to the servicer and the agency. The coupon for a pass-through certificate may change as the underlying mortgage loans are prepaid. The percentages indicated in this column are the nominal interest rates that will be effective through the interest rate reset date and have not been adjusted to reflect the purchase price we paid for the face amount of security. |
|
|
(3) |
Amortized purchase price is the dollar amount, per $100 of current face, of our purchase price for the security, adjusted for amortization as a result of scheduled and unscheduled principal paydowns. |
|
|
(4) |
Amortized cost is our total purchase price for the mortgage security, adjusted for amortization as a result of scheduled and unscheduled principal paydowns. |
|
|
(5) |
Market price is the dollar amount of market value, per $100 of nominal, or face, value, of the mortgage security. |
|
|
(6) |
Market value is the total market value for the mortgage security. |
As of December 31, 2015, excluding any fixed-rate securities, the ARMs underlying our adjustable rate MBS had fixed interest rates for an average period of approximately 37 months after which time the interest rates reset and become adjustable annually. At December 31, 2015, 93.1% of our ARMs were still in their initial fixed-rate period and 6.9% of our ARMs have already reached their initial reset period and will reset annually for the life of the security. At December 31, 2015, an additional 10.9% of our ARMs will reach the end of their initial fixed-rate period in the next 12 months.
After the reset date, interest rates on our ARMs float based on spreads over various indices, usually LIBOR or the one-year CMT. These interest rate adjustments are subject to caps that limit the amount the applicable interest rate can increase during any year, known as an annual cap, and through the maturity of the security, known as a lifetime cap. Our ARMs typically have a maximum initial one-
37
time adjustment of 2% or 5%, and the average annual interest rate increase (or decrease) to the interest rates on our MBS is 2% per year. The average lifetime cap on increases (or decreases) to the interest rates on our MBS is 5% from the initial stated rate.
Fixed-rate securities
In addition to adjustable-rate securities, we also invest in fixed-rate securities. Until late 2015, all of our fixed-rate MBS purchased to date had been 10-year and 15-year amortizing fixed rate securities. At December 31, 2015, we owned $1.0 billion of 30-year fixed-rate MBS. The expected life of a 30-year fixed-rate MBS typically ranges from 4.5 to 7 years depending on market conditions. The following table details our fixed rate portfolio at December 31, 2015.
|
Wtd. Avg Months to Maturity |
% of Fixed-Rate Portfolio |
|
|
Current Face Value (1) |
|
|
Weighted Avg. Coupon (2) |
|
|
Wtd. Avg. Amortized Purchase Price (3) |
|
|
Amortized Cost (4) |
|
|
Weighted Avg. Market Price (5) |
|
|
Market Value (6) |
|
|||||||
|
349-360 |
|
100.0 |
% |
|
|
965,972 |
|
|
|
3.50 |
% |
|
$ |
104.09 |
|
|
|
1,005,458 |
|
|
$ |
103.24 |
|
|
|
997,310 |
|
|
Total Fixed-Rate |
|
100.0 |
% |
|
$ |
965,972 |
|
|
|
3.50 |
% |
|
$ |
104.09 |
|
|
$ |
1,005,458 |
|
|
$ |
103.24 |
|
|
$ |
997,310 |
|
The following table details our fixed rate portfolio at December 31, 2014.
|
Wtd. Avg Months to Maturity |
% of Fixed-Rate Portfolio |
|
|
Current Face Value (1) |
|
|
Weighted Avg. Coupon (2) |
|
|
Wtd. Avg. Amortized Purchase Price (3) |
|
|
Amortized Cost (4) |
|
|
Weighted Avg. Market Price (5) |
|
|
Market Value (6) |
|
|||||||
|
121-132 |
|
5.8 |
% |
|
$ |
69,483 |
|
|
|
3.50 |
% |
|
$ |
105.13 |
|
|
$ |
73,048 |
|
|
$ |
106.23 |
|
|
$ |
73,814 |
|
|
133-144 |
|
46.1 |
% |
|
|
555,754 |
|
|
|
3.50 |
% |
|
$ |
104.99 |
|
|
|
583,488 |
|
|
$ |
105.99 |
|
|
|
589,051 |
|
|
145-156 |
|
48.1 |
% |
|
|
580,976 |
|
|
|
3.43 |
% |
|
$ |
105.54 |
|
|
|
613,154 |
|
|
$ |
105.64 |
|
|
|
613,769 |
|
|
Total Fixed-Rate |
|
100.0 |
% |
|
$ |
1,206,213 |
|
|
|
3.47 |
% |
|
$ |
105.26 |
|
|
$ |
1,269,690 |
|
|
$ |
105.84 |
|
|
$ |
1,276,634 |
|
|
|
(1) |
The current face value is the current monthly remaining dollar amount of principal of a mortgage security. We compute current face value by multiplying the original face value of the security by the current principal balance factor. The current principal balance factor is essentially a fraction, where the numerator is the current outstanding balance and the denominator is the original principal balance. |
|
|
(2) |
For a pass-through certificate, the coupon reflects the weighted average nominal rate of interest paid on the underlying mortgage loans, net of fees paid to the servicer and the agency. The coupon for a pass-through certificate may change as the underlying mortgage loans are prepaid. The percentages indicated in this column have not been adjusted to reflect the purchase price we paid for the face amount of security. |
|
|
(3) |
Amortized purchase price is the dollar amount, per $100 of current face, of our purchase price for the security, adjusted for amortization as a result of scheduled and unscheduled principal paydowns. |
|
|
(4) |
Amortized cost is our total purchase price for the mortgage security, adjusted for amortization as a result of scheduled and unscheduled principal paydowns. |
|
|
(5) |
Market price is the dollar amount of market value, per $100 of nominal, or face value, of the mortgage security. |
|
|
(6) |
Market value is the total market value for the mortgage security. |
Forward Purchases
While most of our purchases of MBS are accounted for using trade date accounting, some forward purchases, such as certain TBA contracts, do not qualify for trade date accounting and are considered derivatives for financial statement purposes. Our accounting for these forward purchases depends on whether or not we intend to take physical delivery of the securities. In either case, the net fair value of the forward commitment is reported on the balance sheet as a derivative asset or liability. If we intend to take physical delivery of the securities, as is the case for forward purchase commitments to acquire TBA securities from mortgage originators, the commitment is designated as an all-in-one cash flow hedge and its unrealized gains and losses are recorded in other comprehensive income. If we do not intend to take physical delivery of the securities, as is the case with most of our TBA dollar roll transactions, the commitment is not designated as an accounting hedge and the unrealized gains and losses are recorded in “Loss on derivative instruments, net.”
38
The following table shows MBS forward purchases as of December 31, 2015.
|
|
Face |
|
|
Cost |
|
|
Fair Market Value |
|
|
Net Asset (Liability) |
|
||||
|
ARMs - originators |
$ |
145,246 |
|
|
$ |
147,749 |
|
|
$ |
147,914 |
|
|
$ |
165 |
|
|
Fixed-rate TBA dollar roll securities |
|
2,655,000 |
|
|
|
2,736,748 |
|
|
|
2,704,375 |
|
|
|
(32,373 |
) |
|
Total MBS purchase commitments |
$ |
2,800,246 |
|
|
$ |
2,884,497 |
|
|
$ |
2,852,289 |
|
|
$ |
(32,208 |
) |
The following table shows MBS forward purchases as of December 31, 2014.
|
|
Face |
|
|
Cost |
|
|
Fair Market Value |
|
|
Net Asset (Liability) |
|
||||
|
ARMs - originators |
$ |
376,936 |
|
|
$ |
384,673 |
|
|
$ |
388,829 |
|
|
$ |
4,156 |
|
|
ARMs - dealers |
|
20,095 |
|
|
|
20,553 |
|
|
|
20,517 |
|
|
|
(36 |
) |
|
Fixed-rate TBA dollar roll securities |
|
3,400,000 |
|
|
|
3,509,871 |
|
|
|
3,521,816 |
|
|
|
11,945 |
|
|
Total MBS purchase commitments |
$ |
3,797,031 |
|
|
$ |
3,915,097 |
|
|
$ |
3,931,162 |
|
|
$ |
16,065 |
|
Mortgage Loans
We invest in individual jumbo adjustable-rate whole mortgage loans with the intention of holding them as investments. Dependent on market conditions, our intent is to securitize the loans through the issuance of non-agency MBS. Our intention is to generally retain the related subordinated securities, representing the credit risk piece associated with these deals as well as a portion of the AAA tranches. Depending on our view of the securitization and secondary markets, we may decide to retain a portion of the whole loans as a direct investment, or to sell loans in the secondary market. During 2015, we completed our first securitization transaction. We consolidate the related securitization trust, because we are deemed to be its primary beneficiary.
As of December 31, 2015 we own mortgage loans with a fair value of $343,765, of which $226,908 are held in the securitization trust. See Note 6 of our consolidated financial statements included in this Form 10-K for further information, including activity rollforwards and portfolio characteristics.
Mortgage Servicing Rights
In the third quarter of 2015, and in conjunction with our acquisition of Pingora, we began investing in MSR. To date, all of our MSR relate to agency mortgage loans. As of December 31, 2105, we own MSR with a fair value of $269,926. The following table provides further information regarding our MSR portfolio:
|
Investor |
UPB |
|
|
|
Fannie Mae |
$10,865,110 |
|
|
Freddie Mac |
4,294,764 |
|
|
Ginnie Mae |
8,481,503 |
|
|
|
$23,641,377 |
|
|
|
|
|
Average Loan Size |
$ 246 |
|
|
|
|
|
|
Weighted Average Coupon |
4.00% |
|
|
|
<=3.5 |
11% |
|
|
3.5-4.0 |
43% |
|
|
4.0-4.5 |
40% |
|
|
>4.5% |
6% |
|
|
|
|
|
Average Loan-to-value |
82% |
|
|
|
|
|
|
Average FICO |
734 |
|
39
Liabilities
We have entered into repurchase agreements to finance most of our securities. Our repurchase agreements are secured by our securities and bear interest at rates that have historically moved in close relationship to LIBOR. As of December 31, 2015, we had established 36 borrowing relationships with various investment banking firms and other lenders. We had an outstanding balance under our repurchase agreements at December 31, 2015 of $13.4 billion with 25 counterparties. We had an outstanding balance of $15.8 billion at December 31, 2014 with 25 different counterparties.
During the third quarter of 2015, we began funding a portion of our securities with FHLB advances and a portion of our mortgage loans with warehouse lines of credit, as discussed further under “Liquidity Sources—Borrowings.” At December 31, 2015, we had $60,096 of borrowings outstanding under warehouse lines of credit, which are collateralized by the mortgage loans financed thereon. At December 31, 2015, we had $14,132 of borrowings outstanding with the FHLB, which was repaid in January 2016. Based on the current status of FHFA rulemaking, we will be required to surrender our membership in the FHLB in 2016. We do not expect the new regulations to materially adversely affect our core business and operations.
Hedging Instruments
We generally intend to hedge, on an economic basis, as much of our interest rate risk as our manager deems prudent in light of market conditions. No assurance can be given that our hedging activities will have the desired beneficial impact on our results of operations or financial condition. Our policies do not contain specific requirements as to the percentages or amount of interest rate risk that our manager is required to hedge.
Interest rate hedging may fail to protect or could adversely affect us because, among other things:
|
|
· |
available interest rate hedging may not correspond directly with the interest rate risk for which protection is sought; |
|
|
· |
the duration of the hedge may not match the duration of the related asset or liability; |
|
|
· |
fair value accounting rules could foster adverse valuation adjustments due to credit quality considerations that could impact both earnings and shareholder equity; |
|
|
· |
the party owing money in the hedging transaction may default on its obligation to pay; |
|
|
· |
the credit quality of the party owing money on the hedge may be downgraded to such an extent that it impairs our ability to sell or assign our side of the hedging transaction; and |
|
|
· |
the value of derivatives used for hedging is adjusted at each reporting date in accordance with accounting rules to reflect changes in fair value. Downward adjustments, or “mark-to-market losses,” would reduce our shareholders’ equity, and in the case of derivatives not subject to hedge accounting, our earnings as well. |
As of December 31, 2015, we had 24 interest rate swap agreements with 8 counterparties to hedge (on an economic basis) a benchmark interest rate – LIBOR. This portfolio of hedges is designed to lock in funding costs for specific funding activities associated with specific assets as a way to realize attractive net interest margins. This hedging strategy incorporates an assumed prepayment schedule, which, if not realized, will cause our results to differ from expectations. These swap agreements provide for fixed interest rates indexed off of one-month LIBOR and effectively fix the floating interest rates on $4.6 billion of borrowings under our repurchase agreements. We also use Eurodollar Futures Contracts (“Futures Contracts”), which are based on three month LIBOR, as part of our strategy to mitigate interest rate risk. The effective notional amounts and rates of our interest rate swaps and Futures Contracts as of December 31, 2015 were as follows:
|
Effective Dates |
Wtd -Avg. Futures Contract Notional |
|
|
Wtd-Avg Futures Contracts Rate |
|
|
Wtd.-Avg. Swap Notional |
|
|
Wtd-Avg Swap Rate |
|
|
Total |
|
|
Wtd-Avg Rate |
|
||||||
|
1Q 2016 |
|
9,689,000 |
|
|
|
1.41 |
% |
|
|
4,400,000 |
|
|
|
0.92 |
% |
|
|
14,089,000 |
|
|
|
1.26 |
% |
|
2Q 2016 |
|
9,447,000 |
|
|
|
1.68 |
% |
|
|
3,800,000 |
|
|
|
0.92 |
% |
|
|
13,247,000 |
|
|
|
1.46 |
% |
|
3Q 2016 |
|
8,528,000 |
|
|
|
1.91 |
% |
|
|
3,200,000 |
|
|
|
0.91 |
% |
|
|
11,728,000 |
|
|
|
1.63 |
% |
|
4Q 2016 |
|
8,390,000 |
|
|
|
2.15 |
% |
|
|
2,600,000 |
|
|
|
0.90 |
% |
|
|
10,990,000 |
|
|
|
1.86 |
% |
|
2017 |
|
7,613,250 |
|
|
|
2.73 |
% |
|
|
1,125,000 |
|
|
|
0.90 |
% |
|
|
8,738,250 |
|
|
|
2.49 |
% |
|
2018 |
|
5,903,500 |
|
|
|
3.27 |
% |
|
|
50,000 |
|
|
|
0.96 |
% |
|
|
5,953,500 |
|
|
|
3.25 |
% |
|
2019 |
|
2,317,250 |
|
|
|
3.33 |
% |
|
|
- |
|
|
|
- |
|
|
|
2,317,250 |
|
|
|
3.33 |
% |
|
2020 |
|
1,257,250 |
|
|
|
4.02 |
% |
|
|
- |
|
|
|
- |
|
|
|
1,257,250 |
|
|
|
4.02 |
% |
|
2021 |
|
292,000 |
|
|
|
3.98 |
% |
|
|
- |
|
|
|
- |
|
|
|
292,000 |
|
|
|
3.98 |
% |
40
If the rates on our repurchase agreements do not move in tandem with LIBOR, we will be less effective at fixing this cost and our results will differ from expectations.
We also enter into swaptions as a method to offset a portion of the volatility in the value of our interest-earning portfolio. As of December 31, 2015, we had six interest rate swaptions outstanding:
|
|
|
Options |
|
|
Underlying Swaps |
|
||||||||||||||||||||
|
Swaptions |
|
Original Cost |
|
|
Fair Value |
|
|
Wtd. Avg. Months to Expiration |
|
|
Notional |
|
|
Wtd. Avg. Fixed Pay Rate |
|
|
Receive Rate |
|
Wtd. Avg. Term (Years) |
|
||||||
|
Fixed payer |
|
$ |
10,813 |
|
|
$ |
727 |
|
|
|
6 |
|
|
$ |
3,065,000 |
|
|
|
3.23% |
|
|
3 month LIBOR |
|
|
6 |
|
As of December 31, 2014, we had four interest rate swaptions outstanding:
|
|
|
Options |
|
|
Underlying Swaps |
|
||||||||||||||||||||
|
Swaptions |
|
Original Cost |
|
|
Fair Value |
|
|
Wtd. Avg. Months to Expiration |
|
|
Notional |
|
|
Wtd. Avg. Fixed Pay Rate |
|
|
Receive Rate |
|
Wtd. Avg. Term (Years) |
|
||||||
|
Fixed payer |
|
$ |
20,080 |
|
|
$ |
4,561 |
|
|
|
6 |
|
|
$ |
992,300 |
|
|
|
2.74% |
|
|
3 month LIBOR |
|
|
7 |
|
On September 30, 2013, we discontinued hedge accounting for our interest rate swap agreements by de-designating the swaps as cash flow hedges. No swaps were terminated in conjunction with this action, and our risk management and hedging practices are unimpacted. However, our accounting for these transactions changed effective October 1, 2013. All of our swaps had previously been accounted for as cash flow hedges under ASC 815, Derivatives and Hedging. As a result of discontinuing hedge accounting, beginning October 1, 2013 changes in the fair value of our interest rate swap agreements have been recorded in “Loss on derivative instruments, net” in our consolidated statements of income, rather than in other comprehensive income. Also, net interest paid or received under the swaps, which up through September 30, 2013 was recognized in “interest expense,” is now recognized in “Loss on derivative instruments, net.”
Results of Operations
Use of GAAP and Non-GAAP Measures
In addition to our results presented in accordance with GAAP, the discussions of our results of operations and liquidity and capital resources include certain non-GAAP financial information. The non-GAAP measures we employ are 1) effective interest expense, 2) effective net interest margin, 3) core earnings and core earnings per share, and financial metrics derived from these non-GAAP measures, such as effective cost of funds and effective leverage. We use these measures internally to assess our results and financial condition. Therefore, we believe that providing these measures gives users of financial information additional clarity regarding our performance and financial condition and better enables them to see “through the eyes of management.”
We define effective interest expense as our interest expense determined in accordance with GAAP, adjusted to exclude reclassification of deferred swap losses included in interest expense subsequent to our termination of hedge accounting, to include interest rate swap monthly net settlements subsequent to our termination of hedge accounting, and to include swap equivalent gains and losses related to our Futures Contracts.
Amortization on MSR represents the portion of the change in MSR fair value that is attributable to the realization of cash flows, and is a non-GAAP measure because we account for MSR at fair value, not at amortized cost.
We similarly define effective net interest margin as our net interest margin determined in accordance with GAAP, adjusted to exclude reclassification of deferred swap losses included in interest expense subsequent to our termination of hedge accounting, to include interest rate swap monthly net settlements subsequent to our termination of hedge accounting, to include swap equivalent gains and losses related to our Futures Contracts, and to include TBA dollar roll income.
We define core earnings as our effective net interest margin (as defined above) further adjusted to deduct operating expenses and dividends on preferred stock.
Our interest expense and net interest margin determined in accordance with GAAP reflect monthly cash settlement under our interest rate swap agreements until September 30, 2013, but not thereafter. We believe that our presentation of effective interest expense, effective net interest margin and core earnings, all of which adjust for this difference after September 30, 2013, provide a better basis for comparison across the periods presented.
41
We define our average cost of funds as our total net interest expense (including hedges) determined in accordance with GAAP divided by our average balance outstanding under our repurchase agreements and dollar roll liability computed from our books and records, using daily weighted values. Similarly, we define effective cost of funds as our total effective interest expense divided by our average balance outstanding under our repurchase agreements and dollar roll liability computed from our books and records, using daily weighted values.
These measures involve differences from results computed in accordance with GAAP, and should be considered supplementary to, and not as a substitute for, our results computed in accordance with GAAP. None of the non-GAAP measures we present represents cash provided by operating activities determined in accordance with GAAP, and none is a measure of liquidity or an indicator of our ability to pay cash dividends. Further, our definitions of these non-GAAP measures may not be comparable to similarly-titled measures of other companies, and therefor comparative analysis may be difficult. Reconciliations of each non-GAAP measure to its nearest directly comparable measure calculated in accordance with GAAP are included below.
Please “Item 6. Selected Financial Data” for definitions of other metrics we use below, including average portfolio yield and average portfolio repayment rate.
Overview
Our results since 2013 have been largely dominated by U.S. Federal Reserve actions, primarily the discussion around the timing of the end of its quantitative easing program and the beginning of increases in the Fed Funds Target Rate. In 2013, speculation as to the imminence and pace of these events steepened the yield curve, leading to a significantly slower pace of home loan refinancings, benefiting our portfolio yield, but also causing the value of our securities to decline. More specifically, the market dislocation that occurred late in the second quarter of 2013 carried forward into the third quarter of 2013, resulting in significantly higher interest rates and a significant decrease in the value of our portfolio. In response to the elevated risk profile of our investments that existed at that time, in the second half of 2013 we rebalanced our portfolio to decrease the duration of our assets and our leverage. This generated sizable realized losses in net income, thus impacting 2014 versus 2013 variances in net income. In 2014, the yield curve generally flattened, leading to improved valuations of MBS early in the year, but also an increase in refinancings, particularly over the summer months. During 2015, interest rates rose, especially over the second half of year, and MBS spreads over treasury rates widened, decreasing the value of our interest-earning portfolio. Further exacerbating these conditions, interest rate spreads between our hedging instruments (interest rate swaps and Futures Contracts) and treasury rates tightened significantly, preventing our hedging portfolio from effectively mitigating the decline in the value of our investments.
During 2015, we made substantial progress in our efforts to diversify our investment portfolio to include jumbo ARM whole mortgage loans and MSRs. As of December 31, 2015, the unpaid principal balance and the fair value of our mortgage loans held for investment were $338.2 million and $343.8, respectively, inclusive of mortgage loans held by a consolidated financing entity (“CFE”). In December 2015, we completed our first securitization of jumbo whole loans. We retained approximately 75% of the beneficial interests issued by the securitization trust, thereby retaining the credit exposure therein within our portfolio. See Note 6 of our consolidated financial statements, contained in this Form 10-K, for further information regarding whole mortgage loans owned as of December 31, 2015 and December 31, 2014.
In August 2015, our wholly owned subsidiary, Wind River TRS LLC, purchased Pingora, a specialized asset manager focused on investing in new-production performing MSR and master-servicing residential mortgage loans sourced primarily from direct, ongoing relationships with loan originators. PAM is a registered investment advisor and PLS is an approved servicer with Fannie Mae, Freddie Mac and Ginnie Mae that is managed by PAM. Pingora currently manages an MSR portfolio of over $72 billion UPB including approximately $49 billion UPB managed for unrelated third-party investors.
In conjunction with our acquisition of Pingora, we began investing in MSR. During 2015, we purchased $259 million of MSR though Pingora. Over time, we expect that incorporating MSRs into our investment portfolio will benefit us in several ways, including further improvement to the risk profile of our balance sheet by providing an income generating asset with a fair value that is inversely correlated to interest rates and our interest-earning portfolio. See Note 7 of our consolidated financial statements for further information.
Even with the diversification activities described above, the primary drivers of our comprehensive income for the near term continue to be 1) our net investment income, and 2) the net impact of changes in the fair value of our earning assets and of our hedging instruments, both of which are driven primarily by changes in interest rates. However, we anticipate growth within our residential whole mortgage loan and MSR initiatives in the coming years, with servicing income, in particular, expected to become a larger percentage of our earnings.
42
Our summarized results of operations for the three years December 31, 2015, along with related key metrics, were as follows:
Comprehensive Income
|
|
Years Ended December 31 |
|
|
Change vs. Prior Year |
|
||||||||||||||
|
|
2015 |
|
|
2014 |
|
|
2013 |
|
|
2015 |
|
|
2014 |
|
|||||
|
Statement of Income Data |
|
|
|
|
|
|
|
|
|
|
|
|
|
|
|
|
|
|
|
|
Total interest income |
$ |
313,039 |
|
|
$ |
355,754 |
|
|
$ |
452,268 |
|
|
|
-12% |
|
|
|
-21% |
|
|
Interest expense |
|
(91,438 |
) |
|
|
(132,495 |
) |
|
|
(197,709 |
) |
|
|
-31% |
|
|
|
-33% |
|
|
Net interest margin |
|
221,601 |
|
|
|
223,259 |
|
|
|
254,559 |
|
|
|
-1% |
|
|
|
-12% |
|
|
|
|
|
|
|
|
|
|
|
|
|
|
|
|
|
|
|
|
|
|
|
Other income (loss): |
|
|
|
|
|
|
|
|
|
|
|
|
|
|
|
|
|
|
|
|
Servicing income |
|
20,111 |
|
|
|
- |
|
|
|
- |
|
|
NM |
|
|
NM |
|
||
|
Management fee income |
|
2,027 |
|
|
|
- |
|
|
|
- |
|
|
NM |
|
|
NM |
|
||
|
Net realized gain on sale of securities |
|
32,731 |
|
|
|
5,196 |
|
|
|
(283,012 |
) |
|
530% |
|
|
|
102% |
|
|
|
Impairment of MBS |
|
- |
|
|
|
- |
|
|
|
(8,102 |
) |
|
NM |
|
|
|
100% |
|
|
|
Net gain on mortgage loans, MSRs and other |
|
10,451 |
|
|
|
8 |
|
|
|
- |
|
|
NM |
|
|
NM |
|
||
|
Loss on derivative instruments, net |
|
(188,416 |
) |
|
|
(141,433 |
) |
|
|
(69,715 |
) |
|
|
33% |
|
|
|
103% |
|
|
Total other income (loss) |
|
(123,096 |
) |
|
|
(136,229 |
) |
|
|
(360,829 |
) |
|
|
-10% |
|
|
|
-62% |
|
|
|
|
|
|
|
|
|
|
|
|
|
|
|
|
|
|
|
|
|
|
|
Expenses: |
|
|
|
|
|
|
|
|
|
|
|
|
|
|
|
|
|
|
|
|
Servicing expenses |
|
(3,022 |
) |
|
|
- |
|
|
|
- |
|
|
NM |
|
|
|
NM |
|
|
|
Securitization deal costs |
|
(1,473 |
) |
|
|
- |
|
|
|
- |
|
|
NM |
|
|
|
NM |
|
|
|
Operating expenses |
|
(42,390 |
) |
|
|
(30,669 |
) |
|
|
(27,866 |
) |
|
|
38% |
|
|
|
10% |
|
|
Total expenses |
|
(46,885 |
) |
|
|
(30,669 |
) |
|
|
(27,866 |
) |
|
|
53% |
|
|
|
10% |
|
|
|
|
|
|
|
|
|
|
|
|
|
|
|
|
|
|
|
|
|
|
|
Net income (loss) |
|
51,620 |
|
|
|
56,361 |
|
|
|
(134,136 |
) |
|
|
8% |
|
|
|
142% |
|
|
Dividends on preferred stock |
|
(21,922 |
) |
|
|
(21,922 |
) |
|
|
(21,922 |
) |
|
|
0% |
|
|
|
0% |
|
|
Net income (loss) available to common shareholders |
$ |
29,698 |
|
|
$ |
34,439 |
|
|
$ |
(156,058 |
) |
|
|
-14% |
|
|
|
122% |
|
|
|
|
|
|
|
|
|
|
|
|
|
|
|
|
|
|
|
|
|
|
|
Earnings (loss) per share of common stock, basic and diluted |
$ |
0.31 |
|
|
$ |
0.36 |
|
|
$ |
(1.59 |
) |
|
|
-14% |
|
|
|
122% |
|
|
|
|
|
|
|
|
|
|
|
|
|
|
|
|
|
|
|
|
|
|
|
Other comprehensive income (loss) |
$ |
(107,107 |
) |
|
$ |
213,817 |
|
|
$ |
(270,906 |
) |
|
|
-150% |
|
|
|
179% |
|
|
|
|
|
|
|
|
|
|
|
|
|
|
|
|
|
|
|
|
|
|
|
Comprehensive income (loss) available to common shareholders |
$ |
(77,409 |
) |
|
$ |
248,256 |
|
|
$ |
(426,964 |
) |
|
|
-131% |
|
|
|
158% |
|
|
|
|
|
|
|
|
|
|
|
|
|
|
|
|
|
|
|
|
|
|
|
Comprehensive income (loss) available to common shareholders per share, basic and diluted |
$ |
(0.80 |
) |
|
$ |
2.57 |
|
|
$ |
(4.34 |
) |
|
|
-131% |
|
|
|
159% |
|
|
|
|
|
|
|
|
|
|
|
|
|
|
|
|
|
|
|
|
|
|
|
Core earnings |
$ |
188,501 |
|
|
$ |
228,856 |
|
|
$ |
203,719 |
|
|
|
-18% |
|
|
|
12% |
|
|
|
|
|
|
|
|
|
|
|
|
|
|
|
|
|
|
|
|
|
|
|
Core earnings per share, basic and diluted |
|
1.95 |
|
|
$ |
2.37 |
|
|
$ |
2.07 |
|
|
|
-18% |
|
|
|
14% |
|
|
|
|
|
|
|
|
|
|
|
|
|
|
|
|
|
|
|
|
|
|
|
Weighted average shares outstanding |
|
96,665,489 |
|
|
|
96,603,634 |
|
|
|
98,337,362 |
|
|
|
0% |
|
|
|
-2% |
|
NM – Not meaningful
2015 vs. 2014
Comprehensive income decreased due primarily to:
|
|
· |
Lower valuations of our investments in 2015 combined with tightening of swap spreads, which diminished the effectiveness of our hedging portfolio at mitigating the investment decline. The declines in the value of our investments were due to higher |
43
|
|
interest rates, particularly over the second half of 2015. See “Overview” above for further discussion of investment markets in each period; and |
|
|
· |
Lower core earnings. |
Core earnings decreased due primarily to:
|
|
· |
Lower effective net interest margin, driven by the smaller average size of our interest-earning portfolio and lower average interest-earning portfolio yield including TBA dollar roll income, stemming from a higher rate of premium amortization due to higher portfolio prepayments; and |
|
|
· |
Higher expenses. |
These decreases to core earnings were partially offset by:
|
|
· |
Servicing income and management fee income stemming from our acquisition of Pingora effective August 31, 2015. |
2014 vs. 2013
Comprehensive income increased due primarily to:
|
|
· |
The significant favorable swing in other comprehensive income driven by gains in MBS valuation during 2014 due to lower interest rates, versus significant declines in MBS valuation during 2013, as described in “Overview” above; and |
|
|
· |
The favorable swing in net realized gain (loss) on sale of MBS in net income, due to significant repositioning of the portfolio during 2013, as described in “Overview” above. |
These increases in comprehensive income were partially offset by:
|
|
· |
The unfavorable swing in loss on derivative instruments, net in the current period, which by design, generally moves in the opposite direction of MBS values. |
Core earnings increased due primarily to:
|
|
· |
Higher effective net interest margin, driven by higher average portfolio yield, including TBA dollar roll income, stemming from: |
|
|
o |
A lower rate of premium amortization due to lower portfolio prepayments compared to elevated 2013 levels; and |
|
|
o |
Incremental earnings from our TBA dollar roll position in excess of the interest rate spread that would have been achieved had we invested in similar securities financed with repurchase agreements. |
These increases to effective net interest margin were partially offset by:
|
|
· |
The smaller average size of our earning assets portfolio, which includes our off-balance sheet TBA dollar roll assets. |
Total Interest Income
|
|
Years Ended December 31 |
|
|
Change vs. Prior Year |
|
||||||||||||||
|
|
2015 |
|
|
2014 |
|
|
2013 |
|
|
2015 |
|
|
2014 |
|
|||||
|
Gross interest income |
$ |
430,693 |
|
|
$ |
457,733 |
|
|
$ |
618,192 |
|
|
|
-6% |
|
|
|
-26% |
|
|
Net premium amortization on MBS |
|
(117,654 |
) |
|
|
(101,979 |
) |
|
|
(165,924 |
) |
|
|
15% |
|
|
|
-39% |
|
|
Total interest income |
$ |
313,039 |
|
|
$ |
355,754 |
|
|
$ |
452,268 |
|
|
|
-12% |
|
|
|
-21% |
|
|
|
|
|
|
|
|
|
|
|
|
|
|
|
|
|
|
|
|
|
|
|
Average interest-earning portfolio |
$ |
16,302,242 |
|
|
$ |
16,943,788 |
|
|
$ |
23,010,281 |
|
|
|
-4% |
|
|
|
-26% |
|
|
Weighted-average coupon on securities |
|
2.70 |
% |
|
|
2.78 |
% |
|
|
2.76 |
% |
|
|
-3% |
|
|
|
1% |
|
|
Average interest-earning portfolio yield |
|
1.91 |
% |
|
|
2.09 |
% |
|
|
1.96 |
% |
|
|
-9% |
|
|
|
7% |
|
|
Average annual securities portfolio repayment rate |
|
24.98 |
% |
|
|
20.93 |
% |
|
|
25.70 |
% |
|
|
19% |
|
|
|
-19% |
|
44
The major drivers of our interest income are the coupon rates on the investments we own, the size of our portfolio, and the rate of principal repayments. The following are key components of the change between periods:
2015 vs. 2014
Total interest income decreased due primarily to:
|
|
· |
The smaller average size of our interest-earning portfolio, which was a result of carrying lower average leverage and our diversification into MSR investments; and |
|
|
· |
A higher rate of premium amortization, driven by higher prepayments in our securities portfolio. |
2014 vs. 2013
Total interest income decreased due primarily to:
|
|
· |
The smaller average size of our securities portfolio, which was a result of carrying lower average leverage. |
The decrease in total interest income was partially offset by:
|
|
· |
A lower rate of premium amortization as refinancings slowed, driven by lower prepayments in our securities portfolio. |
Interest Expense
|
|
Years Ended December 31 |
|
|
Change vs. Prior Year |
|
||||||||||||||
|
|
2015 |
|
|
2014 |
|
|
2013 |
|
|
2015 |
|
|
2014 |
|
|||||
|
Borrowings |
$ |
60,672 |
|
|
$ |
51,137 |
|
|
$ |
81,856 |
|
|
|
19% |
|
|
|
-38% |
|
|
Swaps settlements and amortization |
|
51 |
|
|
|
226 |
|
|
|
91,525 |
|
|
|
-77% |
|
|
|
-100% |
|
|
Reclassification of deferred hedge loss |
|
30,715 |
|
|
|
81,132 |
|
|
|
24,328 |
|
|
|
-62% |
|
|
|
233% |
|
|
Interest expense |
$ |
91,438 |
|
|
$ |
132,495 |
|
|
$ |
197,709 |
|
|
|
-31% |
|
|
|
-33% |
|
|
|
|
|
|
|
|
|
|
|
|
|
|
|
|
|
|
|
|
|
|
|
Effective interest expense |
$ |
163,907 |
|
|
$ |
166,315 |
|
|
$ |
204,366 |
|
|
|
-1% |
|
|
|
-19% |
|
|
|
|
|
|
|
|
|
|
|
|
|
|
|
|
|
|
|
|
|
|
|
Average borrowings |
$ |
14,823,829 |
|
|
$ |
15,291,888 |
|
|
$ |
21,249,868 |
|
|
|
-3% |
|
|
|
-28% |
|
|
Average rate on borrowings |
|
0.55 |
% |
|
|
0.33 |
% |
|
|
0.39 |
% |
|
|
65% |
|
|
|
-15% |
|
|
Average cost of funds |
|
0.62 |
% |
|
|
0.87 |
% |
|
|
0.93 |
% |
|
|
-29% |
|
|
|
-6% |
|
|
Effective cost of funds |
|
1.11 |
% |
|
|
1.09 |
% |
|
|
0.96 |
% |
|
|
1% |
|
|
|
13% |
|
The costs of financing we incur are primarily affected by the amount of our borrowings, the interest rates on those borrowings and the degree to which we hedge those rates. Note that our cessation of hedge accounting for our interest rate swaps caused changes in the classification of monthly swaps settlements, effective October 1, 2013. See “Reconciliations of Non-GAAP Measures” below for a reconciliation of interest expense to effective interest expense. The following are key components of the change between periods:
2015 vs. 2014
Interest expense decreased due primarily to:
|
|
· |
Lower reclassifications of deferred hedge loss out of accumulated other comprehensive income into interest expense; and |
|
|
· |
The decrease in our average borrowings, as a result of carrying lower average leverage in light of the prospect of rising interest rates and due to our investment diversification into MSR, which are not leveraged. |
These decreases in interest expense were partially offset by:
|
|
· |
The higher average rate of our borrowings. This increase was due to the general rise in short-term interest rates, but also due to the diversification of our financing sources, which now include warehouse lines of credit for the financing of mortgage loans as well as collateralized debt. |
Effective interest expense decreased slightly due primarily to:
|
|
· |
Lower average monthly net settlements on interest rate swaps in excess of higher losses on maturities of Futures Contracts, consistent with the continued run-off of our swap portfolio and our increased use of Futures Contracts; and |
|
|
· |
Lower average borrowings, partially offset by the slightly higher effective cost of funds, which was driven by a higher hedge ratio. |
45
These decreases in effective interest expense were partially offset by:
|
|
· |
The higher average rate of our borrowings, as described in the explanations of interest expense. |
2014 vs. 2013
Interest expense decreased due primarily to:
|
|
· |
The decrease in our average debt, as a result of lower average leverage in light of the prospect of rising interest rates and our increased use of TBA dollar roll financing (which is off balance sheet and is accounted for as a derivative); |
|
|
· |
The lower average rate on our debt (primarily repurchase agreements); and |
|
|
· |
Lower swap expenses classified in interest expense in the current period, due to our termination of hedge accounting. |
Effective interest expense decreased due primarily to:
|
|
· |
Lower average debt partially offset by the higher effective cost of funds, which was driven by a higher hedge ratio. |
Net Interest Margin and Interest Rate Spread
|
|
Years Ended December 31 |
|
|
Change vs. Prior Year |
|
||||||||||||||
|
|
2015 |
|
|
2014 |
|
|
2013 |
|
|
2015 |
|
|
2014 |
|
|||||
|
Net interest margin |
$ |
221,601 |
|
|
$ |
223,259 |
|
|
$ |
254,559 |
|
|
|
-1% |
|
|
|
-12% |
|
|
Effective net interest margin |
$ |
232,529 |
|
|
$ |
281,447 |
|
|
$ |
253,507 |
|
|
|
-17% |
|
|
|
11% |
|
|
|
|
|
|
|
|
|
|
|
|
|
|
|
|
|
|
|
|
|
|
|
Average interest-earning portfolio yield |
|
1.91 |
% |
|
|
2.09 |
% |
|
|
1.96 |
% |
|
|
-9% |
|
|
|
7% |
|
|
Average cost of funds |
|
0.62 |
% |
|
|
0.87 |
% |
|
|
0.93 |
% |
|
|
-29% |
|
|
|
-6% |
|
|
Average interest rate spread |
|
1.29 |
% |
|
|
1.22 |
% |
|
|
1.03 |
% |
|
|
6% |
|
|
|
18% |
|
|
|
|
|
|
|
|
|
|
|
|
|
|
|
|
|
|
|
|
|
|
|
Average interest-earning portfolio yield, including TBA dollar roll income |
|
1.98 |
% |
|
|
2.20 |
% |
|
|
1.97 |
% |
|
|
-10% |
|
|
|
12% |
|
|
Effective cost of funds |
|
1.11 |
% |
|
|
1.09 |
% |
|
|
0.96 |
% |
|
|
1% |
|
|
|
13% |
|
|
Effective interest rate spread |
|
0.87 |
% |
|
|
1.11 |
% |
|
|
1.01 |
% |
|
|
-21% |
|
|
|
10% |
|
The most important metric of our earnings power is our net interest margin, or our “spread” when referred to in percentage form. Our spread, combined with our leverage, largely indicate our ability to earn distributable income. Our interest rate spread increased versus the prior year. See the discussions of total interest income and interest expense above for the key drivers of these changes. Effective net interest margin and effective interest rate spread include earnings from our TBA dollar roll securities, which are discussed under “Other Income (Loss)” below.
46
Other Income (Loss)
|
|
Years Ended December 31 |
|
|
Change vs. Prior Year |
|
||||||||||||||
|
|
2015 |
|
|
2014 |
|
|
2013 |
|
|
2015 |
|
|
2014 |
|
|||||
|
Other income (loss): |
|
|
|
|
|
|
|
|
|
|
|
|
|
|
|
|
|
|
|
|
Servicing income |
$ |
20,111 |
|
|
$ |
- |
|
|
$ |
- |
|
|
NM |
|
|
- |
|
||
|
Management fee income |
|
2,027 |
|
|
|
- |
|
|
|
- |
|
|
NM |
|
|
- |
|
||
|
Net realized gain(loss) on sale of securities |
|
32,731 |
|
|
|
5,196 |
|
|
|
(283,012 |
) |
|
|
530% |
|
|
|
-102% |
|
|
Impairment of MBS |
|
- |
|
|
|
- |
|
|
|
(8,102 |
) |
|
- |
|
|
|
-100% |
|
|
|
Net gain on mortgage loans |
|
(1,034 |
) |
|
|
8 |
|
|
|
- |
|
|
NM |
|
|
NM |
|
||
|
Net gain on mortgage servicing rights |
|
10,711 |
|
|
|
- |
|
|
|
- |
|
|
NM |
|
|
- |
|
||
|
Net loss on derivative instruments |
|
(188,416 |
) |
|
|
(141,433 |
) |
|
|
(69,715 |
) |
|
|
33% |
|
|
|
103% |
|
|
Net miscellaneous gains |
|
774 |
|
|
|
- |
|
|
|
- |
|
|
NM |
|
|
- |
|
||
|
Total other income (loss) |
$ |
(123,096 |
) |
|
$ |
(136,229 |
) |
|
$ |
(360,829 |
) |
|
|
-10% |
|
|
|
-62% |
|
NM – Not meaningful
Our other income has historically consisted of realized gains and losses on our MBS and realized and unrealized gains and losses on derivative instruments. Beginning in the third quarter of 2015, other income also includes our earnings from MSR investments and other revenues from Pingora. With our election of the fair value option of accounting for mortgage loans in late 2014, and this same election for MSR and certain securities in 2015, fair value adjustments on these investments have become meaningful components of other income as well. Realized gains and losses on sale of securities and fair value adjustments on investments and derivatives tend to be uneven, varying with interest rates and other market movements and/or management actions to re-position our portfolio. The values of MSR and our derivative instruments are positively correlated with movements in interest rates, such that changes therein should serve to partially hedge changes in the value of our interest-earning portfolio. The following are key components of the change between periods:
2015 vs. 2014
Other income (loss) was a smaller loss due primarily to:
|
|
· |
Larger realized gains on sale of securities in 2015; and |
|
|
· |
Earnings from our investments in MSR via Pingora, beginning in the third quarter of 2015. See “Mortgage Servicing Rights” for discussion of our MSR investments. |
These favorable changes were partially offset by:
|
|
· |
Higher losses on derivative instruments, driven by an ($80,804) unfavorable swing in losses on TBA dollar roll securities due to higher interest rates in 2015. This decline was partially offset by favorable changes of $42,419 in the year-over-year earnings impacts of our hedging instruments (Futures Contracts, swaps and swaptions), driven by higher interest rates in 2015. |
2014 vs. 2013
Other income (loss) was a smaller loss due primarily to:
|
|
· |
Substantial realized losses on sale of securities in 2013, as described in “Overview.” |
This favorable change was partially offset by:
|
|
· |
Higher losses on derivative instruments, driven by losses on Futures Contracts. As interest rates trended lower in 2014, our Futures Contracts lost value. Net realized and unrealized losses on these contracts were $(206,339) and $(58,883) for 2014 and 2013, respectively. Note that a portion of the higher loss in 2014 was due to growth in the size of our Futures Contracts portfolio, as a product of our 2013 decision to switch to Futures Contracts as our primary hedging instrument. Our TBA dollar roll securities generated a net gain of $120,618 in 2014, consisting of realized and unrealized gains of $28,610 and TBA dollar roll income of $92,008, partially offsetting the losses from Futures Contracts. We did not begin financing TBA securities in the dollar roll markets until 4Q13. |
47
Expenses
We attempt to efficiently manage our expenses as they directly affect our return on investment. Our total expenses grew over the three year period due to initiatives to diversify our investment portfolio, as illustrated by the following:
|
|
Years Ended December 31 |
|
|
Change vs. Prior Year |
|
||||||||||||||
|
|
2015 |
|
|
2014 |
|
|
2013 |
|
|
2015 |
|
|
2014 |
|
|||||
|
Management fee |
$ |
16,235 |
|
|
$ |
16,532 |
|
|
$ |
18,180 |
|
|
|
-2% |
|
|
|
-9% |
|
|
Share-based compensation |
|
4,256 |
|
|
|
3,612 |
|
|
|
2,594 |
|
|
|
18% |
|
|
|
39% |
|
|
Servicing expenses |
|
3,022 |
|
|
|
- |
|
|
|
- |
|
|
NM |
|
|
NM |
|
||
|
General and administrative |
|
21,899 |
|
|
|
10,525 |
|
|
|
7,092 |
|
|
|
108% |
|
|
|
48% |
|
|
Securitization deal costs |
|
1,473 |
|
|
|
- |
|
|
|
- |
|
|
NM |
|
|
NM |
|
||
|
Total |
$ |
46,885 |
|
|
$ |
30,669 |
|
|
$ |
27,866 |
|
|
|
53% |
|
|
|
10% |
|
|
|
|
|
|
|
|
|
|
|
|
|
|
|
|
|
|
|
|
|
|
|
Average equity |
$ |
2,348,657 |
|
|
$ |
2,433,070 |
|
|
$ |
2,731,439 |
|
|
|
-3% |
|
|
|
-11% |
|
|
Expenses as a percentage of average equity, annualized |
|
2.00 |
% |
|
|
1.26 |
% |
|
|
1.02 |
% |
|
|
58% |
|
|
|
24% |
|
|
|
|
|
|
|
|
|
|
|
|
|
|
|
|
|
|
|
|
|
|
|
Expenses by Asset Class: |
|
|
|
|
|
|
|
|
|
|
|
|
|
|
|
|
|
|
|
|
Agency |
$ |
32,296 |
|
|
$ |
28,792 |
|
|
$ |
27,793 |
|
|
|
12% |
|
|
|
4% |
|
|
Non-Agency |
|
5,154 |
|
|
|
1,877 |
|
|
|
73 |
|
|
|
175% |
|
|
NM |
|
|
|
MSR |
|
9,435 |
|
|
|
- |
|
|
|
- |
|
|
NM |
|
|
NM |
|
||
|
Total |
$ |
46,885 |
|
|
$ |
30,669 |
|
|
$ |
27,866 |
|
|
|
53% |
|
|
|
10% |
|
2015 vs. 2014
Expenses increased due primarily to:
|
|
· |
Expenses of Pingora, which was acquired on August 31, 2015 (i.e. the MSR asset class in the table above) and which includes substantially all the servicing expenses in the table above; |
|
|
· |
Deal costs of $1,978 we incurred to affect the acquisition of Pingora, which are included in the agency asset class in the table above; and |
|
|
· |
Expenses incurred in connection with our non-agency mortgage loan conduit, which include $1,473 of deal costs incurred in executing our December 2015 securitization of mortgage loans. As described on “Overview,” the amount of mortgage loans held for investment grew substantially during 2015. |
2014 vs. 2013
Expenses increased due primarily to:
|
|
· |
Expenses related to additional employees, particularly those associated with developing our non-agency platform, increased technology (particularly software), insurance and professional fees. These increases are due in part to further enhancement of our risk management capabilities along with initiatives to add new asset classes and/or lines of business. |
The increase in expenses was partially offset by:
|
|
· |
The decline in our management fee. Our management fee is calculated as a percentage of our equity, adjusted to exclude unrealized gains and losses. Realized losses on securities in 2013 and realized losses on derivatives from 3Q13 and forward have served to reduce the equity base on which the management fee is calculated. |
48
Reconciliations of Non-GAAP Measures
The reconciliation of core earnings and effective net interest margin to their nearest comparable GAAP measure, net interest margin, is as follows for the three years ended December 31, 2015:
|
|
2015 |
|
|
2014 |
|
|
2013 |
|
|||
|
Net interest margin |
$ |
221,601 |
|
|
$ |
223,259 |
|
|
$ |
254,559 |
|
|
Reclassification of deferred swap losses included in interest expense (after hedge de-designation) |
|
30,715 |
|
|
|
81,132 |
|
|
|
24,328 |
|
|
Interest rate swaps – monthly net settlements (after hedge de-designation) |
|
(55,064 |
) |
|
|
(113,919 |
) |
|
|
(30,985 |
) |
|
Losses on maturing Futures Contracts |
|
(48,120 |
) |
|
|
(1,033 |
) |
|
|
- |
|
|
TBA dollar roll income |
|
83,397 |
|
|
|
92,008 |
|
|
|
5,605 |
|
|
Effective net interest margin |
|
232,529 |
|
|
|
281,447 |
|
|
|
253,507 |
|
|
Servicing income, net of amortization (1) |
|
17,224 |
|
|
|
- |
|
|
|
- |
|
|
Management fee income |
|
2,027 |
|
|
|
- |
|
|
|
- |
|
|
Net gain on mortgage loans held for sale (2) |
|
552 |
|
|
|
- |
|
|
|
- |
|
|
Net operating revenue |
|
252,332 |
|
|
|
281,447 |
|
|
|
253,507 |
|
|
Total expenses (3) |
|
(41,909 |
) |
|
|
(30,669 |
) |
|
|
(27,866 |
) |
|
Dividends on preferred stock |
|
(21,922 |
) |
|
|
(21,922 |
) |
|
|
(21,922 |
) |
|
Core earnings |
$ |
188,501 |
|
|
$ |
228,856 |
|
|
$ |
203,719 |
|
|
|
(1) |
Reduced by ($2,887) of MSR fair value change that represents estimated amortization of the MSR asset for the twelve months ended December 31, 2015. |
|
|
(2) |
Excludes gain (loss) on mortgage loans held for investment. |
|
|
(3) |
Excludes ($3,451) of expenses related to the Company’s acquisition of Pingora and the Company’s whole loan securitization, ($757) of amortization of intangible assets, and ($768) of change in representation and warranty reserve on MSR for the twelve months ended December 31, 2015. |
The reconciliation of effective interest expense to its nearest comparable GAAP measure, interest expense, along with their respective cost of funds measures, is as follows for the three years ended December 31, 2015:
|
|
2015 |
|
|
2014 |
|
|
2013 |
|
||||||||||||
|
|
Amount |
|
% (1) |
|
|
Amount |
|
% (1) |
|
|
Amount |
|
% (1) |
|
||||||
|
Interest expense and cost of funds |
$ |
91,438 |
|
|
0.62 |
% |
|
$ |
132,495 |
|
|
0.87 |
% |
|
$ |
197,709 |
|
|
0.93 |
% |
|
Less: reclassification of deferred swap losses included in interest expense (after hedge de-designation) |
|
(30,715 |
) |
|
-0.20 |
% |
|
|
(81,132 |
) |
|
-0.53 |
% |
|
|
(24,328 |
) |
|
-0.12 |
% |
|
Interest rate swaps – monthly net settlements (after hedge de-designation) |
|
55,064 |
|
|
0.37 |
% |
|
|
113,919 |
|
|
0.74 |
% |
|
|
30,985 |
|
|
0.15 |
% |
|
Losses on maturing Futures Contracts |
|
48,120 |
|
|
0.32 |
% |
|
|
1,033 |
|
|
0.01 |
% |
|
|
- |
|
|
0.00 |
% |
|
Effective interest expense and effective cost of funds |
$ |
163,907 |
|
|
1.11 |
% |
|
$ |
166,315 |
|
|
1.09 |
% |
|
$ |
204,366 |
|
|
0.96 |
% |
|
|
(1) |
Dollar amount as a percentage of our average repurchase agreements and dollar roll liability |
Contractual Obligations and Commitments
We had the following contractual obligations under repurchase agreements as of December 31, 2015:
|
|
|
December 31, 2015 |
|
|||||||||||||
|
|
|
Balance |
|
|
Weighted Average Contractual Rate |
|
|
Contractual Interest Payments |
|
|
Total Contractual Obligation |
|
||||
|
Within 30 days |
|
$ |
12,693,883 |
|
|
|
0.64 |
% |
|
$ |
4,629 |
|
|
$ |
12,698,512 |
|
|
30 days to 3 months |
|
|
- |
|
|
|
0.00 |
% |
|
|
- |
|
|
|
- |
|
|
Over 90 days |
|
|
750,000 |
|
|
|
0.75 |
% |
|
|
2,349 |
|
|
|
752,349 |
|
|
|
|
$ |
13,443,883 |
|
|
|
0.65 |
% |
|
$ |
6,979 |
|
|
$ |
13,450,862 |
|
In addition, we had contractual commitments under interest rate swap agreements as of December 31, 2015. These agreements were for a total notional amount of $4.6 billion, had a weighted-average rate of 0.91% and a weighted average term of 12 months.
49
From time to time we may make forward commitments to purchase agency securities. The commitments generally require physical settlement with the sellers on settlement date, usually between 30 and 90 days from the date of trade. We purchase ARM TBA contracts and fixed-rate TBA contracts from dealers. ARM TBA contracts are not a frequently-traded security and are generally used to acquire MBS for the portfolio. Fifteen-year fixed TBA securities are a highly liquid security, and may be physically settled, net settled or traded as an investment. Fifteen-year TBA contracts may also be financed in the dollar roll market. We also purchase ARM agency securities and mortgage loans directly from loan originators. Such purchase commitments are entered into on a “best-efforts” basis, which allows for the fact that such originators cannot guarantee that the loans in their pipelines (or the resulting agency securities such loans will be packaged into, if applicable) will actually come to fruition. As of December 31, 2015, we had the following contractual obligations related to such forward purchases of investments:
|
|
Face / UPB |
|
|
Cost |
|
|
Fair Market Value |
|
|
Due to Brokers / Originators |
|
||||
|
ARMs - originators |
$ |
145,246 |
|
|
$ |
147,749 |
|
|
$ |
147,914 |
|
|
$ |
147,749 |
|
|
Fixed-rate TBA dollar roll securities |
|
2,655,000 |
|
|
|
2,736,748 |
|
|
|
2,704,375 |
|
|
|
2,730,705 |
|
|
Whole mortgage loans |
|
26,523 |
|
|
|
26,700 |
|
|
|
26,725 |
|
|
|
26,700 |
|
|
Total purchase commitments |
$ |
2,826,769 |
|
|
$ |
2,911,197 |
|
|
$ |
2,879,014 |
|
|
$ |
2,905,154 |
|
Off-Balance Sheet Arrangements
As of December 31, 2015 and December 31, 2014, we did not maintain any relationships with unconsolidated entities or financial partnerships, such as structured finance, special purpose or variable interest entities, established for the purpose of facilitating off-balance sheet arrangements or other contractually narrow or limited purposes. Further, as of December 31, 2015 and December 31, 2014, we had not guaranteed any obligations of unconsolidated entities or entered into any commitment or intent to provide funding to any such entities.
As of December 31, 2015 and December 31, 2014, we had TBA dollar roll transactions outstanding with cost bases of $2,736,748 and $3,509,871, respectively. Forward purchase commitments and TBA dollar roll transactions represent off-balance sheet financing. Pursuant to ASC 815, Derivatives and Hedging, we account for these positions as derivative transactions and, consequently, they are not reflected in our on-balance sheet debt and leverage ratios.
Liquidity and Capital Resources
Our primary sources of funds are borrowings under repurchase arrangements, warehouse lines, dollar roll transactions, and monthly principal and interest payments on our investments. Other sources of funds may include proceeds from debt and equity offerings and asset sales. Since borrowings under most of our debt facilities are uncommitted, we maintain a large diverse set of counterparties in order to help increase our financial flexibility and ability to withstand periods of contracting liquidity in the credit markets. At December 31, 2015, we had uncommitted repurchase facilities with 36 lending counterparties to finance our portfolio, subject to certain conditions, and have borrowings outstanding with 25 of these counterparties. We also have three warehouse lines supporting our whole loan investment activities, as discussed further under “—Liquidity Sources—Borrowings—Warehouse Lines of Credit.”
We generally maintain liquidity to pay down our borrowings thereby reducing borrowing costs and otherwise efficiently managing our long-term investment capital. Because the level of these borrowings can be adjusted on a daily basis, the level of cash and cash equivalents carried on the balance sheet is significantly less important than our potential liquidity available under our borrowing arrangements. We currently believe that we have sufficient liquidity and capital resources available for the acquisition of additional investments, repayments on borrowings and the payment of cash dividends as required for continued qualification as a REIT.
Effects of Margin Requirements, Leverage and Credit Spreads
Our securities have values that fluctuate according to market conditions and, as discussed above, the market value of our securities will decrease as prevailing interest rates or credit spreads increase. When the value of the securities pledged to secure a loan decreases to the point where the positive difference between the collateral value and the loan amount fails to exceed a negotiated threshold (often referred to as the “haircut”), our lenders may issue a margin call, which means that the lender will require us to pay the margin call in cash or pledge additional collateral to meet that margin call. Under our borrowing facilities, our lenders have full discretion to determine the value of the collateral we pledge to them. Lenders also issue margin calls each month when the new factors (amount of principal remaining on the securities pledged as collateral) and scheduled and unscheduled paydowns are published by the issuing agency.
Similar to the valuation margin calls that we receive on our borrowing agreements, we also receive margin calls on our derivative instruments when their value declines. This typically occurs when prevailing market rates change adversely, with the severity of the change also dependent on the term of the derivatives involved. The amount of any margin call will generally be dollar for dollar, on a
50
daily basis. Our posting of collateral with our counterparties can be done in cash or securities, and is generally bilateral, which means that if the value of our interest rate hedges increases, our counterparty will post collateral with us.
We experience margin calls in the ordinary course of our business, and under certain conditions, such as during a period of declining market value for securities, we may experience margin calls daily. In seeking to manage effectively the margin requirements established by our lenders, we maintain a position of cash and unpledged securities. We refer to this position as our liquidity. The level of liquidity we have available to meet margin calls is directly affected by our leverage levels, our haircuts and the price changes on our investments. If interest rates increase as a result of a yield curve shift or for another reason, such as if credit spreads widen, the prices of our collateral (and our unpledged assets that constitute our liquidity) will decline, we will likely experience margin calls, and we will use our liquidity to meet the margin calls. There can be no assurance that we will maintain sufficient levels of liquidity to meet any margin calls. If our haircuts increase, our liquidity will proportionately decrease. In addition, if we increase our borrowings, our liquidity will decrease by the amount of additional haircut on the increased level of indebtedness.
We intend to maintain a level of liquidity in relation to our assets that enables us to meet reasonably anticipated margin calls but that also allows us to remain substantially invested. We may misjudge the appropriate amount of our liquidity by maintaining excessive liquidity, which would lower our investment returns, or by maintaining insufficient liquidity, which could force us to liquidate assets into unfavorable market conditions and harm our results of operations and financial condition.
Liquidity Sources—Borrowings
We have utilized repurchase facilities, lines of credit with financial institutions and advances from the FHLB as part of our financing strategy with the most significant being repurchase agreements.
The table below sets forth the average amount of borrowings outstanding during each quarter and the amount of borrowings outstanding as of the end of each quarter for the last three years. The amounts at a period end can be either above or below the average amounts for the quarter. We do not manage our portfolio to have a pre-designated amount of borrowings at quarter end. These numbers will differ as we implement our portfolio management strategies and risk management strategies over changing market conditions.
|
|
|
Average Daily Borrowings |
|
|
Borrowings at Period End |
|
|
Highest Daily Borrowing Balance During Quarter |
|
|
Lowest Daily Borrowing Balance During Quarter |
|
||||
|
December 31, 2015 |
|
$ |
13,963,798 |
|
|
$ |
13,575,722 |
|
|
$ |
14,982,707 |
|
|
$ |
13,520,444 |
|
|
September 30, 2015 |
|
|
14,807,631 |
|
|
|
14,288,113 |
|
|
|
15,098,710 |
|
|
|
14,266,407 |
|
|
June 30, 2015 |
|
|
15,071,081 |
|
|
|
14,993,065 |
|
|
|
15,273,283 |
|
|
|
14,961,293 |
|
|
March 31, 2015 |
|
|
15,482,427 |
|
|
|
15,108,538 |
|
|
|
15,873,532 |
|
|
|
14,982,204 |
|
|
December 31, 2014 |
|
|
15,235,739 |
|
|
|
15,759,831 |
|
|
|
15,817,877 |
|
|
|
14,920,959 |
|
|
September 30, 2014 |
|
|
14,806,602 |
|
|
|
14,920,959 |
|
|
|
15,034,614 |
|
|
|
14,607,060 |
|
|
June 30, 2014 |
|
|
15,349,322 |
|
|
|
15,019,880 |
|
|
|
15,641,652 |
|
|
|
15,019,880 |
|
|
March 31, 2014 |
|
|
15,685,392 |
|
|
|
15,183,457 |
|
|
|
16,129,683 |
|
|
|
15,085,150 |
|
|
December 31, 2013 |
|
|
17,464,981 |
|
|
|
16,129,683 |
|
|
|
18,832,650 |
|
|
|
16,119,555 |
|
|
September 30, 2013 |
|
|
21,989,907 |
|
|
|
18,829,771 |
|
|
|
23,495,767 |
|
|
|
18,829,771 |
|
|
June 30, 2013 |
|
|
22,701,463 |
|
|
|
23,077,252 |
|
|
|
23,429,222 |
|
|
|
22,383,758 |
|
|
March 31, 2013 |
|
|
22,342,818 |
|
|
|
22,586,932 |
|
|
|
23,017,196 |
|
|
|
21,337,947 |
|
Repurchase Facilities
With repurchase facilities being an integral part of our financing strategy, and thus our financial condition, full understanding of the repurchase market is necessary to understand the risks and drivers of our business. For example, we anticipate that, upon repayment of each borrowing under a repurchase agreement, we will use the collateral immediately for borrowing under a new repurchase agreement. While we have borrowing capacity under our repurchase facilities well in excess of what is required for our operations, these borrowing lines are uncommitted and generally do not provide long-term excess liquidity. Currently, we have not entered into any committed facilities under which the lender would be required to enter into new repurchase agreements during a specified period of time. As of December 31, 2015 and December 31, 2014, we had repurchase agreement borrowings outstanding of $13,443,883 and $15,759,831, respectively. As of December 31, 2015 and December 31, 2014, the weighted-average margin requirement, or the percentage amount by which the collateral value must exceed the loan amount (the haircut), under all our repurchase agreements, was approximately 4.4% and 4.5%, respectively (weighted by borrowing amount). This rate has remained fairly constant as lending conditions have been relatively stable.
We commonly receive margin calls from our lenders. We may receive margin calls daily, although we typically receive them once or twice per month. We receive margin calls under our repurchase agreements for two reasons. One of these is what is known as a
51
“factor call” which occurs each month when the new factors (amount of principal remaining on the security) are published by the issuing agency, such as Fannie Mae. The second type of margin call we may receive is a valuation margin call. Both factor and valuation margin calls occur whenever the total value of our pledged assets drops beyond a threshold amount, which is usually between $100,000 and $250,000. This threshold amount is generally set by each counterparty and does not vary based on the notional amount of the repurchase agreements outstanding with that counterparty. Both of these margin calls require a dollar for dollar restoration of the margin shortfall. The total amount of our unpledged cash and cash equivalents, plus any unpledged securities, is available to satisfy margin calls, if necessary. As of December 31, 2015 and December 31, 2014, we had approximately $1.1 billion and $1.5 billion, respectively in securities, short-term investments, cash and cash equivalents available to satisfy future margin calls. To date, we have maintained sufficient liquidity to meet margin calls, and we have never been unable to satisfy a margin call, although no assurance can be given that we will be able to satisfy requests from our lenders to post additional collateral in the future.
One risk to our liquidity is the collateral, or haircut, held by our lenders. In the event of insolvency by a repurchase agreement lender, our claim to our haircut becomes that of a general unsecured creditor. Because of this risk, we monitor the credit quality of our lenders and diversify our lenders to mitigate risk. Due to the varying stability of some sovereigns, part of our risk management includes regional monitoring. We have no direct exposure to any non-U.S. credit, but some of our lenders are subsidiaries of foreign-owned parents.
The following table shows our repurchase agreement counterparty exposure by region as of December 31, 2015:
|
|
Number of Counterparties |
|
|
Exposure (1) |
|
|
Exposure as a Percentage of Equity |
|
|||
|
Asia |
|
5 |
|
|
$ |
99,750 |
|
|
|
4.7 |
% |
|
Europe |
|
7 |
|
|
$ |
109,234 |
|
|
|
5.1 |
% |
|
North America |
|
13 |
|
|
$ |
439,823 |
|
|
|
20.5 |
% |
|
|
|
25 |
|
|
$ |
648,807 |
|
|
|
30.3 |
% |
(1) Exposure represent our total assets pledged as collateral in excess of our obligations, including any accrued interest receivable on the pledged asses.
We also have interest rate hedging relationships with subsidiaries of foreign-owned banks. We make cash payments or pledge securities as collateral as part of a margin arrangement in connection with these hedges that are in a loss position. In the event that a counterparty were to default on its obligation, we would be exposed to a loss to the extent that the amount of cash or securities pledged exceeded the unrealized loss on the associated swaps and we were not able to recover the excess collateral.
Management monitors our exposure to our repurchase agreement and interest rate swap counterparties on a regular basis, using various methods, including review of recent rating agency actions or other developments and by monitoring the amount of cash and securities collateral pledged and the associated loan amount under repurchase agreements and/or the fair value of the swaps with our counterparties. We intend to make reverse margin calls on our counterparties to recover excess collateral as permitted by the agreements governing our financing arrangements, or take other necessary actions to reduce the amount of our exposure to a counterparty when such actions are considered necessary.
An event of default or termination event under the standard master repurchase agreement would give our counterparty the option to terminate all repurchase transactions existing with us and require any amount due by us to the counterparty to be payable immediately. Our agreements for our repurchase facilities generally conform to the terms in the standard master repurchase agreement as published by the Securities Industry and Financial Markets Association (SIFMA) as to repayment, margin requirements and the segregation of all purchased securities covered by the repurchase agreement. In addition, each lender may require that we include supplemental terms and conditions to the standard master repurchase agreement that are generally required by the lender. Some of the typical terms which are included in such supplements and which supplement and amend terms contained in the standard agreement include changes to the margin maintenance requirements, purchase price maintenance requirements, the addition of a requirement that all controversies related to the repurchase agreement be litigated in a particular jurisdiction and cross default provisions. These provisions differ for each of our lenders.
Warehouse Lines of Credit
We maintain three warehouse lines of credit in support of our whole loan investment activities: one related to mortgage loans held for investment and two related to mortgage loans held for sale. These lines of credit are with three different counterparties. They expire within one year and are collateralized by mortgage loans that we own. These borrowings are charged interest at a specified margin over the one-month LIBOR interest rate. At December 31, 2015, we had $60,096 of borrowings outstanding under our warehouse lines of credit, and $239,904 of unused borrowing capacity under these lines. We did not utilize warehouse lines of credit in 2014.
52
If the value of the underlying collateral (as determined by the counterparty) securing these borrowings decreases, we may be subject to margin calls during the period the borrowing is outstanding. To satisfy these margin calls, we may have to pledge additional collateral or repay portions of the borrowings.
FHLB Advances
During the third quarter of 2015, one of our wholly-owned subsidiaries became a member of the FHLB. FHLB offers a variety of products and services, including secured advances, which charge interest and a specified margin over the one-month LIBOR interest rate. At December 31, 2015, we had $14,132 of borrowings outstanding with the FHLB, and $985,868 of unused borrowing capacity under this facility. Based on the current status of FHFA rulemaking, we will be required to surrender our membership in the FHLB in 2016. We have no plans to utilize our FHLB membership beyond January 2016.
Liquidity Sources—Dollar Roll Transactions
We also enter into dollar roll transactions as a source of financing for our investments. Dollar roll transactions represent a form of financing that may be on or off-balance sheet, depending on whether the financed security is a specified pool or a TBA contract. TBA contracts that are financed using dollar rolls transactions are accounted for as derivatives and shown on our balance sheet at net fair market value. Under certain market conditions it may be uneconomical for us to roll our TBA contracts and we may need to settle our obligations and take physical delivery of the underlying securities. If we were required to take physical delivery to settle a TBA contract, we would have to fund our total purchase commitment with cash or other financing sources and our liquidity position could be negatively impacted. Our TBA dollar roll transactions are also subject to margin requirements governed by our prime brokerage agreements. In the event of a margin call, we must generally provide additional collateral on the same business day. The table below sets forth information regarding the volume of dollar roll transactions (both specified pools and TBA contracts) during the quarters in which we have engaged in dollar roll transactions.
|
|
|
Average Daily Dollar Roll Liability |
|
|
Gross Dollar Roll Liability at Period End |
|
|
Highest Daily Dollar Roll Balance During Quarter |
|
|
Lowest Daily Dollar Balance During Quarter |
|
||||
|
December 31, 2015 |
|
$ |
2,732,180 |
|
|
$ |
2,730,705 |
|
|
$ |
2,737,774 |
|
|
$ |
2,723,165 |
|
|
September 30, 2015 |
|
|
3,559,674 |
|
|
|
2,723,165 |
|
|
|
3,846,630 |
|
|
|
2,723,165 |
|
|
June 30, 2015 |
|
|
4,307,588 |
|
|
|
3,846,630 |
|
|
|
4,455,020 |
|
|
|
3,846,630 |
|
|
March 31, 2015 |
|
|
4,027,774 |
|
|
|
4,455,020 |
|
|
|
4,681,289 |
|
|
|
3,518,289 |
|
|
December 31, 2014 |
|
|
3,687,748 |
|
|
|
3,518,289 |
|
|
|
3,741,918 |
|
|
|
3,518,289 |
|
|
September 30, 2014 |
|
|
3,257,935 |
|
|
|
3,718,924 |
|
|
|
3,718,924 |
|
|
|
2,961,749 |
|
|
June 30, 2014 |
|
|
3,393,046 |
|
|
|
2,961,749 |
|
|
|
3,549,363 |
|
|
|
2,961,749 |
|
|
March 31, 2014 |
|
|
2,935,689 |
|
|
|
3,159,801 |
|
|
|
3,699,859 |
|
|
|
1,037,879 |
|
|
December 31, 2013 |
|
|
1,275,595 |
|
|
|
1,037,879 |
|
|
|
2,134,370 |
|
|
|
- |
|
The above table shows all dollar rolls at gross amounts, including dollar roll liabilities for both specified pools and TBAs. As discussed above, TBA dollar rolls represent off-balance sheet financing.
Liquidity Sources—Capital Offerings
In addition to our repurchase facilities and dollar roll transactions, we also rely on follow-on securities offerings as a source of both short-term and long-term liquidity.
From time to time, we may sell shares of our common stock, preferred stock, debt securities, depositary shares or warrants under our Registration Statement on Form S-3 (No. 333-204935), which became effective upon filing with the SEC on June 12, 2015, including sales of common stock made in “at the market” offerings. In an “at the market” offering, sales of the shares of common stock, if any, may be made in private transactions, negotiated transactions or any method permitted by law deemed to be an “at the market” offering as defined in Rule 415 under the Securities Act, including sales made directly on the NYSE or to or through a market maker other than on an exchange.
No shares of common or preferred stock have been issued since 2012 other than shares issued under our equity incentive plans and in connection with our acquisition of Pingora.
Liquidity Uses—Share Buybacks
On June 18, 2013, our board of directors authorized the Repurchase Program to acquire up to 10,000,000 shares of our common stock. Over the remainder of 2013, we repurchased 2,485,447 shares of common stock in at-the-market transactions. During the first quarter of 2014, we repurchased 100,000 shares in at-the-market transactions at a total cost of $1,912. During 2015, we repurchased
53
1,443,283 shares in at-the-market transactions at a total cost of $20,752. As of December 31, 2015, there is repurchase capacity available under the Repurchase Program of 5,971,270 shares. We are authorized by our board of directors to repurchase or offer to repurchase shares of common stock under the Repurchase Program and may repurchase additional shares from time to time as liquidity and market conditions permit.
Forward-Looking Statements Regarding Liquidity
Based on our current portfolio, leverage rate and available borrowing arrangements, we believe that our cash flow from operations and available borrowing capacity will be sufficient to enable us to meet anticipated short-term (one year or less) liquidity requirements such as to fund our investment activities, to pay fees under our management agreement, to fund our distributions to shareholders and for general corporate expenses.
Our ability to meet our long-term (greater than one year) liquidity and capital resource requirements will be subject to obtaining additional debt financing and equity capital. We may increase our capital resources by obtaining long-term credit facilities or making public or private offerings of equity or debt securities, possibly including classes of preferred stock, common stock, and senior or subordinated notes. Such financing will depend on market conditions for capital raises and for the investment of any proceeds. If we are unable to renew, replace or expand our sources of financing on substantially similar terms, it may have an adverse effect on our business and results of operations.
We generally seek to borrow (on a recourse basis) between six and 12 times the amount of our shareholders’ equity. Some of our agreements with our derivative counterparties contain restrictive financial covenants, including covenants limiting our leverage levels, the most restrictive of which provide that if we exceed a leverage ratio of 10 to 1, then we could be declared in default on the applicable derivative obligations. At December 31, 2015 and December 31, 2014, our total on-balance sheet borrowings were approximately $13.6 billion and $15.8 billion (excluding accrued interest), respectively, which represented a leverage ratio of approximately 6.3:1 and 6.5:1, respectively. Our effective leverage ratio (defined as our debt-to-shareholders equity ratio, including the effects of off-balance sheet TBA dollar roll liability) was approximately 7.6:1 and 8.0:1 as of December 31, 2015 and December 31, 2014, respectively.
Critical Accounting Policies
Our financial statements are prepared in conformity with GAAP. In preparing the financial statements, management is required to make various judgments, estimates and assumptions that affect the reported amounts. Changes in these estimates and assumptions could have a material effect on our financial statements. The following is a summary of our policies most affected by management’s judgments, estimates and assumptions.
Interest Income: Interest income is earned and recognized based on the outstanding principal amount of the investment securities and their contractual terms. Premiums and discounts associated with the purchase of the investment securities are amortized or accreted into interest income over the actual lives of the securities using the effective interest method.
Market Valuation of Investments: We invest in MBS representing interests in or obligations backed by pools of single-family adjustable-rate mortgage loans. Guidance under FASB ASC Topic 320, Investments, requires us to classify our investments as either trading, available-for-sale or held-to-maturity securities. Management determines the appropriate classifications of the securities at the time they are acquired and evaluates the appropriateness of such classifications at each balance sheet date. We currently classify all of our MBS as available-for-sale. All assets that are classified as available-for-sale are carried at fair value and unrealized gains and losses are included in other comprehensive income.
The estimated fair values of securities are determined by management by obtaining valuations thereon from independent sources, which are then evaluated for reasonableness. Security purchase and sale transactions are recorded on the trade date. Gains or losses realized from the sale of securities are included in income and are determined using the specific identification method. Firm purchase commitments to acquire “when issued” or TBA securities are recorded at fair value in accordance with ASC 815, Derivatives and Hedging. The fair value of these purchase commitments is included in other assets or liabilities in the accompanying balance sheets.
We also invest in agency CRT securities, whole mortgage loans and MSR, all of which are accounted for under the fair value option. The estimated fair values of agency CRT securities and mortgage loans are determined by management by obtaining valuations thereon from independent sources, and evaluating such valuations for reasonableness including underlying assumptions, as applicable. MSR valuations are determined based on an internal, proprietary model with valuations from a third party used as an independent point of comparison.
Impairment of Assets: We assess our investment securities for other-than-temporary impairment on at least a quarterly basis. When the fair value of an investment is less than its amortized cost at the balance sheet date of the reporting period for which impairment is assessed, the impairment is designated as either “temporary” or “other-than-temporary.” In deciding on whether or not a security is other than temporarily impaired, we use a two-step evaluation process. First, we determine whether we have made any decision to sell a security that is in an unrealized loss position, or, if not is it more likely than not that we will be required to sell the security prior to recovering its amortized cost basis. If we determine that the answer to either of these questions is “yes” then the security is considered
54
other-than-temporarily impaired. We recorded $8,102 of impairment as of September 30, 2013, on securities that were sold at a loss in early October of 2013. There were no other impairment losses recognized during any of the other periods presented.
Derivative Instruments: We account for derivative instruments in accordance with the guidance included in the ASC 815, Derivatives and Hedging. This guidance establishes accounting and reporting standards for derivative instruments, including certain derivative instruments embedded in other contracts (collectively referred to as derivatives), and for hedging activities. The guidance requires that every derivative instrument be recorded in the balance sheet as either an asset or liability measured at its fair value, and that changes in the derivative’s fair value be recognized currently in earnings unless specific hedge accounting criteria are met. Special accounting for qualifying hedges allows a derivative’s gains and losses to either offset related results on the hedged item in the statement of income or be accumulated in other comprehensive income, and requires that a company formally document, designate, and assess the effectiveness of transactions that receive hedge accounting. We use derivative instruments to manage our exposure to changing interest rates, generally with Futures Contracts and interest rate swap agreements.
Inflation
Virtually all of our assets and liabilities are interest rate sensitive in nature. As a result, interest rates and other factors directly influence our performance far more than inflation. Although inflation is a primary factor in any interest rate, changes in interest rates do not necessarily correlate with changes in inflation rates, and these affects may be imperfect or lagging. Our financial statements are prepared in accordance with GAAP and any distributions we may make will be determined by our board of directors based in part on our REIT taxable income as calculated according to the requirements of the Code; in each case, our activities and balance sheet are measured with reference to fair value without considering inflation.
Item 7A.Quantitative and Qualitative Disclosures About Market Risk
We seek to manage our risks related to the credit quality of our assets, interest rates, liquidity, prepayment speeds and market value while providing an opportunity to shareholders to realize attractive risk-adjusted returns through ownership of our capital stock. While we do not seek to avoid risk completely, we believe the risk can be quantified from historical experience and we seek to actively manage that risk in order to earn sufficient compensation to justify taking the risks we undertake and to maintain capital levels consistent with taking such risks.
Interest Rate Risk
Interest rate risk is the primary component of our market risk. Interest rates are highly sensitive to many factors, including fiscal and monetary policies and domestic and international economic and political considerations, as well as other factors beyond our control. We are subject to interest rate risk in connection with our investments and our related financing obligations.
Interest Rate Effect on Net Interest Margin
Our operating results depend in large part on differences between the yields earned on our investments and the cost of our borrowing and hedging activities. The cost of our borrowings will generally be based on prevailing market interest rates. During periods of rising interest rates, our borrowing costs tend to increase while the income earned on our interest-earning portfolio may remain substantially unchanged until the interest rates reset. This results in a narrowing of the net interest spread between the assets and related borrowings and may even result in losses. The severity of any such decline would depend on our asset/liability composition at the time as well as the magnitude and duration of the interest rate increase. Further, an increase in short-term interest rates could also have a negative impact on the market value of our investments. If any of these events happen, we could experience a decrease in net income or incur a net loss during these periods, which could adversely affect our liquidity and results of operations.
We seek to mitigate interest rate risk through utilization of longer term repurchase agreements and hedging instruments, primarily interest rate swaps and Futures Contracts. These instruments are intended to serve as a hedge against future interest rate increases on our variable rate borrowings. Hedging techniques are partly based on assumed levels of prepayments of our interest-earning investments. If prepayments are slower or faster than assumed, the life of the investments will be longer or shorter, which would reduce the effectiveness of any hedging strategies we may use and may cause losses on such transactions. Hedging strategies involving the use of derivative securities are highly complex and may produce volatile returns. Hedging techniques are also limited by the rules relating to REIT qualification. In order to preserve our REIT status, we may be forced to terminate a hedging transaction at a time when the transaction is most needed.
Interest Rate Cap Risk
The ARMs that underlie our adjustable-rate MBS and the mortgage loans we invest in directly are typically subject to periodic and lifetime interest rate caps and floors, which limit the amount by which the security’s interest rate may change during any given period. However, our borrowing costs pursuant to our financing agreements will not be subject to similar restrictions. Therefore, in a period of
55
increasing interest rates, interest rate costs on our borrowings could increase without limitation, while the interest-rate increases on our adjustable-rate and hybrid MBS and mortgage loans could effectively be limited by caps. MBS backed by ARMs may be subject to periodic payment caps that result in some portion of the interest being deferred and added to the principal outstanding. This could result in our receipt of less cash from such investments than we would need to pay the interest cost on our related borrowings. These factors could lower our net interest margin or cause a net loss during periods of rising interest rates, which would harm our financial condition, cash flows and results of operations.
Interest Rate Mismatch Risk
We fund and hedge a substantial portion of our acquisition of interest-earnings investments with borrowings that are based on, or move similarly to, LIBOR. The interest rates on our adjustable-rate MBS and mortgage loans are generally indexed to LIBOR or another index rate, such as the one-year CMT rate. However, our borrowing rate may increase relative to LIBOR or one-year CMT rates thus resulting in an increase in our borrowing costs that is not matched by a corresponding increase in the interest earnings on these investments. Any such interest rate index mismatch could adversely affect our profitability, which may negatively impact distributions to our shareholders. To seek to mitigate interest rate mismatches, we may utilize the hedging strategies discussed above.
Our analysis of risks is based on our manager’s experience, estimates and assumptions, including estimates of fair value and interest rate sensitivity. Actual economic conditions or implementation of investment decisions by our manager may produce results that differ significantly from our manager’s estimates and assumptions.
Prepayment Risk
The majority of our assets are subject to prepayment risk. As we receive repayments of principal on our interest-bearing assets (MBS and mortgage loans) from prepayments and scheduled payments, premiums paid on such securities are amortized against interest income and discounts are accreted to interest income. Premiums arise when we acquire assets at prices in excess of the principal balance of these interest-bearing asset. Conversely, discounts arise when we acquire assets at prices below the principal balance of the asset. To date, most of our interest-bearing assets have been purchased at a premium.
For financial accounting purposes, interest income is accrued based on the outstanding principal balance of the investment securities and their contractual terms. In general, purchase premiums on investment securities are amortized against interest income over the lives of the securities using the effective yield method, adjusted for actual prepayment and cash flow activity. An increase in the principal repayment rate will typically accelerate the amortization of purchase premiums and a decrease in the repayment rate will typically slow the accretion of purchase discounts, thereby reducing the yield/interest income earned on such assets.
Our MSR assets are also subject to prepayment risk. The amount of servicing revenue that we receive is determined by multiplying the underlying UPB of the mortgage loans times the contractual servicing fee. When the mortgages underlying the MSR repay faster than our estimates, we will earn less than we expected when we purchased the MSR, and may even lose money. Conversely, when the underlying mortgage loans repay slower than our estimates, our rate of return on the MSR increases.
Extension Risk
We invest in MBS that are either fixed-rate or backed by hybrid ARMs and in mortgage loans which have interest rates that are fixed for the early years of the loan (typically three, five, seven or 10 years) and thereafter reset periodically. We compute the projected weighted-average life of our portfolio based on assumptions regarding the rate at which the borrowers will prepay the underlying mortgage loans. In general, when investments are acquired with borrowings, we may, but are not required to, enter into an interest rate swap agreement or other hedging instrument that effectively fixes our borrowing costs for a period close to the anticipated weighted-average life of the fixed-rate portion of the related investments. This strategy is designed to protect us from rising interest rates by fixing a portion of our borrowing costs for the duration of the fixed-rate period of the investment.
We may structure our interest rate hedges to expire in conjunction with the estimated weighted average life of the fixed period of the mortgage loans underlying our MBS. However, in a rising interest rate environment, the weighted average life of the mortgage loans underlying our MBS could extend beyond the term of the interest rate swap or other hedging instrument. This is sometimes referred to as “tail risk.” This could have a negative impact on our results from operations, as borrowing costs would no longer be fixed after the term of the hedging instrument while the income earned on the remaining MBS would remain fixed for a period of time. This situation may also cause the market value of our investments to decline, with little or no offsetting gain from the related hedging transactions. In extreme situations, we may be forced to sell assets to maintain adequate liquidity, which could cause us to incur losses.
Interest Rate Risk and Effect on Market Value Risk
Another component of interest rate risk is the effect changes in interest rates will have on the market value of our investments. We face the risk that the market value of our investments will increase or decrease at different rates than that of our liabilities, including our hedging instruments.
56
We primarily assess our market value interest rate risk by estimating the effective duration of our assets relative to the effective duration of our liabilities. Effective duration essentially measures the market price volatility of financial instruments as interest rates change. We generally estimate effective duration using various financial models and empirical data. Different models and methodologies can produce different effective duration estimates for the same securities.
The sensitivity analysis tables presented below show the estimated impact of an instantaneous parallel shift in the yield curve, up and down 50 and 100 basis points, on the market value of our interest rate-sensitive investments (“portfolio value”) and net annual interest margin, at December 31, 2015 and December 31, 2014, assuming a static portfolio. When evaluating the impact of changes in interest rates on net interest margin, prepayment assumptions and principal reinvestment rates are adjusted based on our manager’s expectations. The analysis presented utilized assumptions, models and estimates of the manager based on the manager’s judgment and experience.
December 31, 2015
|
Change in Interest rates |
|
Percentage Change in Projected Net Interest Margin |
|
Percentage Change in Projected Portfolio Value |
|
+ 1.00% |
|
18.32% |
|
(0.45%) |
|
+ 0.50% |
|
10.86% |
|
(0.17%) |
|
- 0.50% |
|
(2.78%) |
|
(0.04%) |
|
- 1.00% |
|
(4.93%) |
|
(0.24%) |
December 31, 2014
|
Change in Interest rates |
|
Percentage Change in Projected Net Interest Margin |
|
Percentage Change in Projected Portfolio Value |
|
+ 1.00% |
|
4.23% |
|
(0.35%) |
|
+ 0.50% |
|
2.83% |
|
(0.11%) |
|
- 0.50% |
|
3.74% |
|
(0.13%) |
|
- 1.00% |
|
(1.09%) |
|
(0.45%) |
While the charts above reflect the estimated immediate impact of interest rate increases and decreases on a static portfolio, we rebalance our portfolio from time to time either to seek to take advantage of or reduce the impact of changes in interest rates. It is important to note that the impact of changing interest rates on portfolio value and net interest margin can change significantly when interest rates change beyond 100 basis points from current levels. Therefore, the volatility in the market value of our assets could increase significantly when interest rates change beyond amounts shown in the table above. In addition, other factors impact the portfolio value of and net interest margin from our interest rate-sensitive investments and hedging instruments, such as the shape of the yield curve, market expectations as to future interest rate changes and other market conditions. Accordingly, portfolio value and net interest margin would likely differ from that shown above, and such difference might be material and adverse to our shareholders.
The above table quantifies the potential changes in net interest margin and portfolio value, which includes the value of interest rate swaps, interest rate swaptions, and Eurodollars Futures Contracts should interest rates immediately change. Given the low level of short-term interest rates at December 31, 2015 and December 31, 2014, we applied a floor of 0%, for all anticipated interest rates included in our assumptions. Due to presence of this floor, it is anticipated that any hypothetical interest rate decrease would have a limited positive impact on our funding costs beyond a certain level; however, because prepayments speeds are unaffected by this floor, it is expected that any increase in our prepayment speeds (occurring as a result of any interest rate decrease or otherwise) could result in an acceleration of our premium amortization and the reinvestment of such prepaid principal in lower yielding assets. As a result, the presence of this floor limits the positive impact of any interest rate decrease on our funding costs.
Risk Management
To the extent consistent with maintaining our REIT status, we seek to manage our interest rate risk exposure to protect our portfolio and related debt against the effects of major interest rate changes. We generally seek to manage our interest rate risk by:
|
|
· |
attempting to structure our borrowing agreements to have a range of different maturities, terms, amortizations and interest rate adjustment periods; |
|
|
· |
using derivatives, financial futures, swaps, options, caps, floors and forward sales to adjust the interest rate sensitivity of our investments and our borrowings; |
57
|
|
· |
actively managing, on an aggregate basis, the interest rate indices, interest rate adjustment periods, interest rate caps and gross reset margins of our investments and the interest rate indices and adjustment periods of our borrowings; and |
|
|
· |
monitoring and managing, on an aggregate basis, our liquidity and leverage to maintain tolerance for market value changes. |
Credit Risk
Although we do not believe that we are exposed to credit risk in our agency MBS portfolio, we are exposed to credit risk through our credit-sensitive residential mortgage investments, in particular non-agency MBS and residential whole loans, and to a lesser extent our investments in MSR and CRT securities. Our exposure to credit risk from our credit sensitive investments is discussed in more detail as follows:
Non-agency MBS and Residential Whole Loans – We are also exposed to credit risk from our investments in residential whole loans. We believe that our investment strategy will generally keep our risk of credit losses low to moderate. However, we intend to retain the risk of potential credit losses on all of the loans underlying the non-agency securities we originate and on our mortgage loans. With respect to our non-agency securities, credit support contained in MBS deal structures provide a level of protection from losses. We seek to manage the remaining credit risk through our pre-acquisition due diligence process, and by factoring assumed credit losses into the purchase prices we pay for non-agency securities and mortgage loans. In addition, with respect to any particular target asset, we evaluate relative valuation, supply and demand trends, the shape of yield curves, prepayment rates, delinquency and default rates, recovery of various sectors and vintage of collateral. We further mitigate credit risk in our mortgage loan portfolio through (1) selecting servicers whose specialties are well matched against the underlying attributes of the mortgage borrowers contained in the loan pools, and (2) an actively managed internal servicer oversight and surveillance program. At times, we may enter into credit default swaps or other derivative instruments in an attempt to manage our credit risk. Nevertheless, unanticipated credit losses could adversely affect our operating results.
CRT Securities – We are exposed to potential credit losses from our investments in CRT securities issued by Fannie Mae and Freddie Mac. While CRT securities are debt obligations of these GSEs, payment of principal on these securities is not guaranteed. As an investor in a CRT security, we may incur a loss if the loans in the associated reference pool experience delinquencies exceeding specified thresholds or other specified credit events occur. We assess the credit risk associated with our investment in CRT securities by assessing the current performance of the loans in the associated reference pool.
MSR – We are exposed to potential credit losses on our MSR. While the underlying loans are guaranteed by Fannie Mae, Freddie Mac or Ginnie Mae, when we take ownership of the MSR we inherit potential liabilities regarding the representation and warranties of the original loans. While we generally have recourse to the originator for these defects, there is no assurance that we can collect any amounts we are due. Further, if the borrower were to default during this process, we may be forced to purchase and service the loan pending our recovery from the originator. We manage these risks by maintaining a strong approval process for our originators, and by doing extensive oversight of their processes and our sub-servicers performance.
Item 8.Financial Statements and Supplementary Data
The required response under this Item is submitted in a separate section of this report. See our financial statements beginning on on page F-1.
Item 9.Changes in and Disagreements with Accountants on Accounting and Financial Disclosure
None.
Item 9A.Controls and Procedures
Evaluation of Disclosure Controls and Procedures
We maintain disclosure controls and procedures to ensure that material information relating to us is made known to the officers who certify our financial reports and to the members of senior management and the board of directors.
Based on management’s evaluation as of December 31, 2015, our principal executive officer and principal financial officer have concluded that our disclosure controls and procedures (as defined in Rules 13a-15(e) or 15d-15(e) under the Exchange Act) are effective to ensure that the information required to be disclosed by us in the reports that we file or submit under the Exchange Act, is recorded, processed, summarized and reported within the time periods specified in SEC rules and forms.
58
Management’s Report on Internal Control over Financial Reporting
Our management is responsible for establishing and maintaining adequate internal control over financial reporting, as such term is defined in 13a-15(f) and 15d-15(f) of the Exchange Act. Under the supervision and with the participation of our management, including our principal executive officer and principal financial officer, we conducted an evaluation of the effectiveness of our internal control over financial reporting based on the framework in Internal Control—Integrated Framework (2013) issued by the Committee of Sponsoring Organizations of the Treadway Commission. Due to the recency of their acquisition, the scope of our evaluation excluded the internal controls of Pingora Asset Management, LLC and Pingora Loan Servicing, LLC, which constituted $340.7 million and $125.6 million of total assets and shareholders’ equity, respectively, as of December 31, 2015, and $23.6 million and $8.7 million of other income and net income, respectively, for the year then ended. Based on our evaluation under the framework in Internal Control—Integrated Framework (2013), our management concluded that our internal control over financial reporting was effective as of December 31, 2015.
Ernst & Young LLP, a registered independent accounting firm, has audited our financial statements included in this annual report on Form 10-K and, as part of its audit, has issued a report on the effectiveness of our internal control over financial reporting as of December 31, 2015. This report appears on page F-37 of this Annual Report on Form 10-K.
Changes in Internal Control over Financial Reporting
There was no change to our internal control over financial reporting during the fourth quarter ended December 31, 2015 that has materially affected, or is reasonably likely to materially affect, our internal control over financial reporting.
None.
The information required by Item 10 is incorporated by reference to our definitive Proxy Statement for our 2016 Annual Shareholders’ meeting.
The information required by Item 11 is incorporated by reference to our definitive Proxy Statement for our 2016 Annual Shareholders’ meeting.
|
Item 12. |
Security Ownership of Certain Beneficial Owners and Management and Related Stockholder Matters |
The information required by Item 12 is incorporated by reference to our definitive Proxy Statement for our 2016 Annual Shareholders’ meeting.
The information required by Item 13 is incorporated by reference to our definitive Proxy Statement for our 2016 Annual Shareholders’ meeting.
The information required by Item 14 is incorporated by reference to our definitive Proxy Statement for our 2016 Annual Shareholders’ meeting.
|
1. |
Financial Statements |
Included herein at pages F-1 through F-36.
59
|
2. |
Financial Statement Schedules |
All schedules for which provision is made in Regulation S-X are either not required to be included herein under the related instructions or are inapplicable or the related information is included in the footnotes to the applicable financial statement and, therefore, have been omitted.
|
3. |
Exhibits |
The following exhibits are filed as part of this Annual Report on Form 10-K:
|
Exhibit |
|
Description of Exhibit |
|
3.1 |
|
Articles of Incorporation (including all articles of amendment and articles supplementary) (4) |
|
|
|
|
|
3.2 |
|
Bylaws (1) |
|
|
|
|
|
4.1 |
|
Form of Common Stock Certificate (2) |
|
|
|
|
|
4.2 |
|
Form of 7.625% Series A Cumulative Redeemable Preferred Stock Certificate (5) |
|
|
|
|
|
10.1 |
|
Management Agreement, by and among Hatteras Financial Corp. and Atlantic Capital Advisors, LLC dated February 23, 2012 (6) |
|
|
|
|
|
10.2 |
|
2010 Equity Incentive Plan* (3) |
|
|
|
|
|
10.3 |
|
2015 Equity Incentive Plan* (8) |
|
|
|
|
|
10.4 |
|
Form of Amended and Restated Restricted Stock Award Agreement for executive officers * (1) |
|
|
|
|
|
10.5 |
|
Form of Restricted Stock Award Agreement for independent directors * (1) |
|
|
|
|
|
10.6 |
|
Form of Indemnification Agreement * (1) |
|
|
|
|
|
10.7 |
|
First Addendum and Amendment to Restricted Stock Agreements between William H. Gibbs, Jr. and Hatteras Financial Corp. effective June 26, 2013 * (7) |
|
|
|
|
|
10.8 |
|
Consulting Agreement between William H. Gibbs, Jr. and Hatteras Financial Corp. effective June 26, 2013 * (7) |
|
|
|
|
|
12.1 |
|
Statement of computation of ratios of earnings to fixed charges and combined fixed charges and preferred stock dividends |
|
|
|
|
|
21.1 |
|
List of subsidiaries |
|
|
|
|
|
23.1 |
|
Consent of Ernst & Young LLP |
|
|
|
|
|
24.1 |
|
Power of Attorney (included on the signature page of this Annual Report on Form 10-K) |
|
|
|
|
|
31.1 |
|
Certification of Chief Executive Officer pursuant to Section 302 of the Sarbanes-Oxley Act of 2002 |
|
|
|
|
|
31.2 |
|
Certification of Chief Financial Officer pursuant to Section 302 of the Sarbanes-Oxley Act of 2002 |
|
|
|
|
|
32.1 |
|
Certification of Chief Executive Officer pursuant to 18 U.S.C. Section 1350, as adopted pursuant to Section 906 of the Sarbanes-Oxley Act of 2002 |
|
|
|
|
|
32.2 |
|
Certification of Chief Financial Officer pursuant to 18 U.S.C. Section 1350, as adopted pursuant to Section 906 of the Sarbanes-Oxley Act of 2002 |
|
|
|
|
|
101 |
|
Submitted electronically herewith as Exhibit 101 to this report are the following documents formatted in XBRL (Extensible Business Reporting Language): (i) Consolidated Balance Sheets at December 31, 2015 and 2014; (ii) Consolidated Statements of Income for the years ended December 31, 2015, 2014 and 2013; (iii) Consolidated Statements of Comprehensive Income for the years ended December 31, 2015, 2014 and 2013, (iv) Consolidated Statements of Changes in Shareholders’ Equity for the years ended December 31, 2015, 2014 and 2013; (v) Consolidated Statements of Cash Flows for the years ended December 31, 2015, 2014 and 2013; and (vi) Notes to Consolidated Financial Statements for the year ended December 31, 2015. |
|
* |
Represents management contract or compensatory plan or agreement. |
|
(1) |
Previously filed as an exhibit to the Registrant’s Registration Statement on Form S-11 (No. 333-149314) filed with the SEC on February 20, 2008 and incorporated herein by reference. |
|
(2) |
Previously filed as an exhibit to Amendment No. 3 to the Registrant’s Registration Statement on Form S-11 (No. 333-149314) filed with the SEC on April 22, 2008 and incorporated herein by reference. |
|
(3) |
Previously filed as an exhibit to the Registrant’s Current Report on Form 8-K filed with the SEC on May 6, 2010 and incorporated herein by reference. |
|
(4) |
Previously filed as an exhibit to the Registrant’s Quarterly Report on Form 10-Q filed with the SEC on October 30, 2012 and incorporated herein by reference. |
|
(5) |
Previously filed as an exhibit to the Registrant’s Registration Statement on Form 8-A filed with the SEC on August 23, 2012 and incorporated herein by reference. |
60
|
(6) |
Previously filed as an exhibit to the Registrant’s Annual Report on Form 10-K filed with the SEC on February 23, 2012 and incorporated herein by reference. |
|
(7) |
Previously filed as an exhibit to the Registrant’s Quarterly Report on Form 10-Q filed with the SEC on July 30, 2013 and incorporated herein by reference. |
|
(8) |
Previously filed as an exhibit to the Registrant’s Current Report on Form 8-K filed with the SEC on May 11, 2015 and incorporated herein by reference. |
61
SIGNATURES
Pursuant to the requirements of Section 13 or 15(d) of the Securities Exchange Act of 1934, the registrant has duly caused this report to be signed on its behalf by the undersigned, thereunto duly authorized.
|
|
HATTERAS FINANCIAL CORP. |
||
|
Dated: February 24, 2016 |
By: |
/s/ Michael R. Hough |
|
|
|
|
|
Michael R. Hough |
|
|
|
|
Chief Executive Officer and Chairman of the Board of Directors |
KNOW ALL MEN BY THESE PRESENTS, that we, the undersigned officers and directors of Hatteras Financial Corp., hereby severally constitute Michael R. Hough, Benjamin M. Hough and Kenneth A. Steele, and each of them singly, our true and lawful attorneys with full power to them, and each of them singly, to sign for us and in our names in the capacities indicated below, the Form 10-K filed herewith and any and all amendments to said Form 10-K, and generally to do all such things in our names and in our capacities as officers and directors to enable Hatteras Financial Corp. to comply with the provisions of the Securities Exchange Act of 1934, as amended and all requirements of the Securities and Exchange Commission, hereby ratifying and confirming our signatures as they may be signed by our said attorneys, or any of them, to said Form 10-K and any and all amendments thereto.
Pursuant to the requirements of the Securities Exchange Act of 1934, this report has been signed below by the following persons on behalf of the registrant and in the capacities and dates indicated.
|
Date |
|
Signature |
|
|
|
|
|
|
|
|
|
February 24, 2016 |
|
/s/ Michael R. Hough |
|
Chief Executive Officer (Principal Executive Officer) and Chairman of the Board of Directors |
|
|
|
Michael R. Hough |
|
|
|
February 24, 2016 |
|
/s/ Benjamin M. Hough |
|
President, Chief Operating Officer |
|
|
|
Benjamin M. Hough |
|
|
|
February 24, 2016 |
|
/s/ David W. Berson |
|
Director |
|
|
|
David W. Berson |
|
|
|
February 24, 2016 |
|
/s/ Ira G. Kawaller |
|
Director |
|
|
|
Ira G. Kawaller |
|
|
|
February 24, 2016 |
|
/a/ Vicki W. McElreath |
|
Director |
|
|
|
Vicki W. McElreath |
|
|
|
February 24, 2016 |
|
/a/ Jeffrey D. Miller |
|
Director |
|
|
|
Jeffrey D. Miller |
|
|
|
|
|
|
|
|
|
February 24, 2016 |
|
/s/ William V. Nutt, Jr. |
|
Director |
|
|
|
William V. Nutt, Jr. |
|
|
|
February 24, 2016 |
|
/s/ Thomas D. Wren |
|
Director |
|
|
|
Thomas D. Wren |
|
|
|
February 24, 2016 |
|
/s/ Kenneth A. Steele |
|
Chief Financial Officer (Principal Financial Officer and Principal Accounting Officer) |
|
|
|
Kenneth A. Steele |
|
62
Report of Independent Registered Public Accounting Firm
The Board of Directors and Shareholders of Hatteras Financial Corp.
We have audited the accompanying consolidated balance sheets of Hatteras Financial Corp. as of December 31, 2015 and 2014, and the related consolidated statements of income, comprehensive income, shareholders' equity and cash flows for each of the three years in the period ended December 31, 2015. These consolidated financial statements are the responsibility of the Company's management. Our responsibility is to express an opinion on these financial statements based on our audits.
We conducted our audits in accordance with the standards of the Public Company Accounting Oversight Board (United States). Those standards require that we plan and perform the audit to obtain reasonable assurance about whether the consolidated financial statements are free of material misstatement. An audit includes examining, on a test basis, evidence supporting the amounts and disclosures in the consolidated financial statements. An audit also includes assessing the accounting principles used and significant estimates made by management, as well as evaluating the overall financial statement presentation. We believe that our audits provide a reasonable basis for our opinion.
In our opinion, the consolidated financial statements referred to above present fairly, in all material respects, the financial position of Hatteras Financial Corp. at December 31, 2015 and 2014, and the results of its operations and its cash flows for each of the three years in the period ended December 31, 2015, in conformity with U.S. generally accepted accounting principles.
We also have audited, in accordance with the standards of the Public Company Accounting Oversight Board (United States), Hatteras Financial Corp.’s internal control over financial reporting as of December 31, 2015, based on criteria established in Internal Control-Integrated Framework issued by the Committee of Sponsoring Organizations of the Treadway Commission (2013 framework) and our report dated February 24, 2016 expressed an unqualified opinion thereon.
/s/ Ernst & Young LLP
February 24, 2016
Charlotte, North Carolina
F-1
Hatteras Financial Corp.
Consolidated Balance Sheets
|
(Dollars in thousands, except share related amounts) |
|
|
|
|
|
|
|
|
|
|
|
|
|
|
|
|
|
|
December 31, 2015 |
|
|
December 31, 2014 |
|
||
|
Assets |
|
|
|
|
|
|
|
|
Mortgage-backed securities, at fair value |
|
|
|
|
|
|
|
|
(including pledged assets of $13,932,415 and $16,538,214, respectively) |
$ |
14,302,230 |
|
|
$ |
17,587,010 |
|
|
Agency CRT securities, at fair value |
|
109,387 |
|
|
|
- |
|
|
Mortgage loans held for investment, at fair value |
|
|
|
|
|
|
|
|
(including pledged assets of $50,143 and $0, respectively) |
|
116,857 |
|
|
|
31,460 |
|
|
Mortgage loans held for investment in securitization trusts, at fair value |
|
226,908 |
|
|
|
- |
|
|
Mortgage loans held for sale, at fair value |
|
|
|
|
|
|
|
|
(including pledged assets of $17,542 and $0, respectively) |
|
17,542 |
|
|
|
- |
|
|
Mortgage servicing rights, at fair value |
|
269,926 |
|
|
|
- |
|
|
Cash and cash equivalents (including pledged cash of $376,081 and $323,791, respectively) |
|
816,715 |
|
|
|
627,595 |
|
|
Unsettled purchased mortgage-backed securities, at fair value |
|
12,582 |
|
|
|
24,792 |
|
|
Receivable for securities sold |
|
- |
|
|
|
5,197 |
|
|
Accrued interest receivable |
|
45,008 |
|
|
|
54,274 |
|
|
Principal payments receivable |
|
108,201 |
|
|
|
111,439 |
|
|
Other investments |
|
51,930 |
|
|
|
41,252 |
|
|
Derivative assets, at fair value |
|
2,914 |
|
|
|
27,151 |
|
|
Other assets |
|
57,326 |
|
|
|
6,630 |
|
|
Total assets (1) |
$ |
16,137,526 |
|
|
$ |
18,516,800 |
|
|
|
|
|
|
|
|
|
|
|
Liabilities and shareholders’ equity |
|
|
|
|
|
|
|
|
Borrowings: |
|
|
|
|
|
|
|
|
Repurchase agreements |
$ |
13,443,883 |
|
|
$ |
15,759,831 |
|
|
Warehouse lines of credit |
|
60,096 |
|
|
|
- |
|
|
Federal Home Loan Bank advances |
|
14,132 |
|
|
|
- |
|
|
Collateralized borrowings in securitization trusts, at fair value |
|
57,611 |
|
|
|
- |
|
|
Total borrowings |
|
13,575,722 |
|
|
|
15,759,831 |
|
|
Payable for unsettled securities |
|
12,582 |
|
|
|
24,750 |
|
|
Accrued interest payable |
|
4,938 |
|
|
|
6,968 |
|
|
Derivative liabilities, at fair value |
|
325,233 |
|
|
|
244,591 |
|
|
Dividends payable |
|
47,824 |
|
|
|
53,014 |
|
|
Other liabilities |
|
27,870 |
|
|
|
6,850 |
|
|
Total liabilities (1) |
|
13,994,169 |
|
|
|
16,096,004 |
|
|
|
|
|
|
|
|
|
|
|
Shareholders’ equity: |
|
|
|
|
|
|
|
|
7.625% Series A Cumulative Redeemable Preferred stock, $.001 par value, 25,000,000 shares authorized, 11,500,000 shares issued and outstanding, respectively ($287,500 aggregate liquidation preference) |
|
278,252 |
|
|
|
278,252 |
|
|
Common stock, $.001 par value, 200,000,000 shares authorized, 95,773,767 and 96,771,158 shares issued and outstanding, respectively |
|
96 |
|
|
|
97 |
|
|
Additional paid-in capital |
|
2,438,223 |
|
|
|
2,454,718 |
|
|
Accumulated deficit |
|
(671,872 |
) |
|
|
(518,036 |
) |
|
Accumulated other comprehensive income |
|
98,658 |
|
|
|
205,765 |
|
|
Total shareholders’ equity |
|
2,143,357 |
|
|
|
2,420,796 |
|
|
Total liabilities and shareholders’ equity |
$ |
16,137,526 |
|
|
$ |
18,516,800 |
|
|
|
(1) |
The consolidated balance sheet as of December 31, 2015 includes $227,444 of assets of a consolidated collateralized financing entity (“CFE”) that can only be used to settle obligations of the CFE as well as liabilities of $57,784 of the CFE for which creditors do not have recourse to Hatteras Financial Corp. |
See accompanying notes.
F-2
Hatteras Financial Corp.
Consolidated Statements of Income
For the years ended December 31, 2015, 2014, and 2013
|
(Dollars in thousands, except share related amounts) |
|
|
|
|
|
|
|
|
|
|
|
|
|
|
|
|
|
|
|
|
|
|
|
|
|
|
2015 |
|
|
2014 |
|
|
2013 |
|
|||
|
Interest income: |
|
|
|
|
|
|
|
|
|
|
|
|
Securities |
$ |
305,717 |
|
|
$ |
354,436 |
|
|
$ |
450,708 |
|
|
Mortgage loans |
|
5,509 |
|
|
|
35 |
|
|
|
- |
|
|
Mortgage loans in securitization trusts |
|
446 |
|
|
|
- |
|
|
|
- |
|
|
Short-term cash investments |
|
1,367 |
|
|
|
1,283 |
|
|
|
1,560 |
|
|
Total interest income |
|
313,039 |
|
|
|
355,754 |
|
|
|
452,268 |
|
|
|
|
|
|
|
|
|
|
|
|
|
|
|
Interest expense: |
|
|
|
|
|
|
|
|
|
|
|
|
Repurchase agreements |
|
90,744 |
|
|
|
132,495 |
|
|
|
197,709 |
|
|
Warehouse lines |
|
597 |
|
|
|
- |
|
|
|
- |
|
|
Collateralized borrowings in securitization trusts |
|
97 |
|
|
|
- |
|
|
|
- |
|
|
Total interest expense |
|
91,438 |
|
|
|
132,495 |
|
|
|
197,709 |
|
|
|
|
|
|
|
|
|
|
|
|
|
|
|
Net interest margin |
|
221,601 |
|
|
|
223,259 |
|
|
|
254,559 |
|
|
|
|
|
|
|
|
|
|
|
|
|
|
|
Other income (loss): |
|
|
|
|
|
|
|
|
|
|
|
|
Servicing income |
|
20,111 |
|
|
|
- |
|
|
|
- |
|
|
Management fee income |
|
2,027 |
|
|
|
- |
|
|
|
- |
|
|
Net realized gain on sale of securities |
|
32,731 |
|
|
|
5,196 |
|
|
|
(283,012 |
) |
|
Impairment of mortgage-backed securities |
|
- |
|
|
|
- |
|
|
|
(8,102 |
) |
|
Net gain (loss) on mortgage loans |
|
(1,034 |
) |
|
|
8 |
|
|
|
- |
|
|
Net gain on mortgage servicing rights |
|
10,711 |
|
|
|
- |
|
|
|
- |
|
|
Net gain (loss) on derivative instruments |
|
(188,416 |
) |
|
|
(141,433 |
) |
|
|
(69,715 |
) |
|
Net miscellaneous gains and losses |
|
774 |
|
|
|
- |
|
|
|
- |
|
|
Total other income (loss) |
|
(123,096 |
) |
|
|
(136,229 |
) |
|
|
(360,829 |
) |
|
|
|
|
|
|
|
|
|
|
|
|
|
|
Expenses: |
|
|
|
|
|
|
|
|
|
|
|
|
Management fee |
|
16,235 |
|
|
|
16,532 |
|
|
|
18,180 |
|
|
Share-based compensation |
|
4,256 |
|
|
|
3,612 |
|
|
|
2,594 |
|
|
Servicing expenses |
|
3,022 |
|
|
|
- |
|
|
|
- |
|
|
General and administrative |
|
21,899 |
|
|
|
10,525 |
|
|
|
7,092 |
|
|
Securitization deal costs |
|
1,473 |
|
|
|
- |
|
|
|
- |
|
|
Total expenses |
|
46,885 |
|
|
|
30,669 |
|
|
|
27,866 |
|
|
|
|
|
|
|
|
|
|
|
|
|
|
|
Net income (loss) |
|
51,620 |
|
|
|
56,361 |
|
|
|
(134,136 |
) |
|
Dividends on preferred stock |
|
21,922 |
|
|
|
21,922 |
|
|
|
21,922 |
|
|
Net income (loss) available to common shareholders |
$ |
29,698 |
|
|
$ |
34,439 |
|
|
$ |
(156,058 |
) |
|
|
|
|
|
|
|
|
|
|
|
|
|
|
Earnings (loss) per share - common stock, basic |
$ |
0.31 |
|
|
$ |
0.36 |
|
|
$ |
(1.59 |
) |
|
Earnings (loss) per share - common stock, diluted |
$ |
0.31 |
|
|
$ |
0.36 |
|
|
$ |
(1.59 |
) |
|
|
|
|
|
|
|
|
|
|
|
|
|
|
Dividends per share of common stock |
$ |
1.90 |
|
|
$ |
2.00 |
|
|
$ |
2.45 |
|
|
|
|
|
|
|
|
|
|
|
|
|
|
|
Weighted average common shares outstanding, basic |
|
96,665,489 |
|
|
|
96,603,634 |
|
|
|
98,337,362 |
|
|
Weighted average common shares outstanding, diluted |
|
96,665,489 |
|
|
|
96,603,634 |
|
|
|
98,337,362 |
|
See accompanying notes.
F-3
Hatteras Financial Corp
Consolidated Statements of Comprehensive Income
For the years ended December 31, 2015, 2014, and 2013
|
(Dollars in thousands) |
|
|
|
|
|
|
|
|
|
|
|
|
|
|
|
|
|
|
|
|
|
|
|
|
|
|
2015 |
|
|
2014 |
|
|
2013 |
|
|||
|
|
|
|
|
|
|
|
|
|
|
|
|
|
Net income (loss) |
$ |
51,620 |
|
|
$ |
56,361 |
|
|
$ |
(134,136 |
) |
|
|
|
|
|
|
|
|
|
|
|
|
|
|
Other comprehensive income (loss): |
|
|
|
|
|
|
|
|
|
|
|
|
|
|
|
|
|
|
|
|
|
|
|
|
|
Net unrealized gains (losses) on securities |
|
|
|
|
|
|
|
|
|
|
|
|
available for sale |
|
(133,867 |
) |
|
|
122,824 |
|
|
|
(391,590 |
) |
|
Net unrealized gains on derivative instruments |
|
26,760 |
|
|
|
90,993 |
|
|
|
120,684 |
|
|
Other comprehensive income (loss) |
|
(107,107 |
) |
|
|
213,817 |
|
|
|
(270,906 |
) |
|
|
|
|
|
|
|
|
|
|
|
|
|
|
Comprehensive income (loss) |
|
(55,487 |
) |
|
|
270,178 |
|
|
|
(405,042 |
) |
|
|
|
|
|
|
|
|
|
|
|
|
|
|
Dividends on preferred stock |
|
21,922 |
|
|
|
21,922 |
|
|
|
21,922 |
|
|
|
|
|
|
|
|
|
|
|
|
|
|
|
Comprehensive income (loss) available to |
|
|
|
|
|
|
|
|
|
|
|
|
common shareholders |
$ |
(77,409 |
) |
|
$ |
248,256 |
|
|
$ |
(426,964 |
) |
See accompanying notes.
F-4
Hatteras Financial Corp.
Consolidated Statements of Changes in Shareholders’ Equity
For the years ended December 31, 2015, 2014, and 2013
|
(Dollars in thousands) |
|
|
|
|
|
|
|
|
|
|
|
|
|
|
|
|
|
|
|
|
|
|
|
|
|
7.625% Series A Cumulative Redeemable Preferred Stock |
|
|
Common Stock |
|
|
Additional Paid-in Capital |
|
|
Accumulated Deficit |
|
|
Accumulated Other Comprehensive Income |
|
|
Total |
|
||||||
|
|
|
|
|
|
|
|
|
|
|
|
|
|
|
|
|
|
|
|
|
|
|
|
|
|
Balance at December 31, 2012 |
$ |
278,252 |
|
|
$ |
99 |
|
|
$ |
2,494,303 |
|
|
$ |
37,356 |
|
|
$ |
262,854 |
|
|
$ |
3,072,864 |
|
|
Repurchase of common stock |
|
- |
|
|
|
(2 |
) |
|
|
(43,879 |
) |
|
|
- |
|
|
|
- |
|
|
|
(43,881 |
) |
|
Share-based compensation expense |
|
- |
|
|
|
- |
|
|
|
2,594 |
|
|
|
- |
|
|
|
- |
|
|
|
2,594 |
|
|
Dividends declared on preferred stock |
|
- |
|
|
|
- |
|
|
|
- |
|
|
|
(21,922 |
) |
|
|
- |
|
|
|
(21,922 |
) |
|
Dividends declared on common stock |
|
- |
|
|
|
- |
|
|
|
- |
|
|
|
(240,512 |
) |
|
|
- |
|
|
|
(240,512 |
) |
|
Net loss |
|
- |
|
|
|
- |
|
|
|
- |
|
|
|
(134,136 |
) |
|
|
- |
|
|
|
(134,136 |
) |
|
Other comprehensive loss |
|
- |
|
|
|
- |
|
|
|
- |
|
|
|
- |
|
|
|
(270,906 |
) |
|
|
(270,906 |
) |
|
Balance at December 31, 2013 |
|
278,252 |
|
|
|
97 |
|
|
|
2,453,018 |
|
|
|
(359,214 |
) |
|
|
(8,052 |
) |
|
|
2,364,101 |
|
|
Repurchase of common stock |
|
- |
|
|
|
- |
|
|
|
(1,912 |
) |
|
|
- |
|
|
|
- |
|
|
|
(1,912 |
) |
|
Share-based compensation expense |
|
- |
|
|
|
- |
|
|
|
3,612 |
|
|
|
- |
|
|
|
- |
|
|
|
3,612 |
|
|
Dividends declared on preferred stock |
|
- |
|
|
|
- |
|
|
|
- |
|
|
|
(21,922 |
) |
|
|
- |
|
|
|
(21,922 |
) |
|
Dividends declared on common stock |
|
- |
|
|
|
- |
|
|
|
- |
|
|
|
(193,261 |
) |
|
|
- |
|
|
|
(193,261 |
) |
|
Net income |
|
- |
|
|
|
- |
|
|
|
- |
|
|
|
56,361 |
|
|
|
- |
|
|
|
56,361 |
|
|
Other comprehensive income |
|
- |
|
|
|
- |
|
|
|
- |
|
|
|
- |
|
|
|
213,817 |
|
|
|
213,817 |
|
|
Balance at December 31, 2014 |
$ |
278,252 |
|
|
$ |
97 |
|
|
$ |
2,454,718 |
|
|
$ |
(518,036 |
) |
|
$ |
205,765 |
|
|
$ |
2,420,796 |
|
|
Repurchase of common stock |
|
- |
|
|
|
(1 |
) |
|
|
(20,752 |
) |
|
|
- |
|
|
|
- |
|
|
|
(20,753 |
) |
|
Share-based compensation expense |
|
- |
|
|
|
- |
|
|
|
4,256 |
|
|
|
- |
|
|
|
- |
|
|
|
4,256 |
|
|
Dividends declared on preferred stock |
|
- |
|
|
|
- |
|
|
|
- |
|
|
|
(21,922 |
) |
|
|
- |
|
|
|
(21,922 |
) |
|
Dividends declared on common stock |
|
- |
|
|
|
- |
|
|
|
- |
|
|
|
(183,534 |
) |
|
|
- |
|
|
|
(183,534 |
) |
|
Net income |
|
- |
|
|
|
- |
|
|
|
- |
|
|
|
51,620 |
|
|
|
- |
|
|
|
51,620 |
|
|
Other comprehensive loss |
|
- |
|
|
|
- |
|
|
|
- |
|
|
|
- |
|
|
|
(107,107 |
) |
|
|
(107,107 |
) |
|
Balance at December 31, 2015 |
$ |
278,252 |
|
|
$ |
96 |
|
|
$ |
2,438,223 |
|
|
$ |
(671,872 |
) |
|
$ |
98,658 |
|
|
$ |
2,143,357 |
|
See accompanying notes.
F-5
Hatteras Financial Corp.
Consolidated Statements of Cash Flows
For the years ended December 31, 2015, 2014, and 2013
|
(Dollars in thousands) |
|
|
|
|
|
|
|
|
|
|
|
|
|
|
|
|
|
|
|
|||||
|
Operating activities |
2015 |
|
|
2014 |
|
|
2013 |
|
|||
|
Net income (loss) |
$ |
51,620 |
|
|
$ |
56,361 |
|
|
$ |
(134,136 |
) |
|
Adjustments to reconcile net income (loss) to net cash provided by operating activities: |
|
|
|
|
|
|
|
|
|
|
|
|
Net amortization of premium related to mortgage-backed securities |
|
117,654 |
|
|
|
101,979 |
|
|
|
165,924 |
|
|
Reclassification of deferred swap net loss |
|
30,715 |
|
|
|
81,132 |
|
|
|
25,816 |
|
|
Share-based compensation expense |
|
4,256 |
|
|
|
3,612 |
|
|
|
2,594 |
|
|
Net realized (gain) loss on sale of securities |
|
(32,731 |
) |
|
|
(5,196 |
) |
|
|
283,012 |
|
|
Net unrealized gain on MSR |
|
(10,711 |
) |
|
|
- |
|
|
|
- |
|
|
Net unrealized (gain) loss on mortgage loans held for investment |
|
1,065 |
|
|
|
(8 |
) |
|
|
- |
|
|
Purchase of mortgage loans held for sale |
|
(130,362 |
) |
|
|
- |
|
|
|
- |
|
|
Sale of mortgage loans held for sale |
|
117,664 |
|
|
|
- |
|
|
|
- |
|
|
Net loss on derivative instruments |
|
188,416 |
|
|
|
141,433 |
|
|
|
68,205 |
|
|
Impairment loss on mortgage-backed securities |
|
- |
|
|
|
- |
|
|
|
8,102 |
|
|
Other |
|
(753 |
) |
|
|
226 |
|
|
|
106 |
|
|
Changes in operating assets and liabilities: |
|
|
|
|
|
|
|
|
|
|
|
|
Decrease in accrued interest receivable |
|
9,266 |
|
|
|
882 |
|
|
|
21,957 |
|
|
Increase in other assets |
|
(19,318 |
) |
|
|
(2,963 |
) |
|
|
(2,432 |
) |
|
Increase (decrease) in accrued interest payable |
|
(2,030 |
) |
|
|
(1,311 |
) |
|
|
687 |
|
|
Increase in other liabilities |
|
13,480 |
|
|
|
2,336 |
|
|
|
572 |
|
|
Net cash provided by operating activities |
|
338,231 |
|
|
|
378,483 |
|
|
|
440,407 |
|
|
|
|
|
|
|
|
|
|
|
|
|
|
|
Investing activities |
|
|
|
|
|
|
|
|
|
|
|
|
Purchases of securities |
|
(3,764,409 |
) |
|
|
(5,126,375 |
) |
|
|
(10,180,894 |
) |
|
Principal repayments on securities |
|
3,920,850 |
|
|
|
3,423,756 |
|
|
|
5,782,709 |
|
|
Sales of securities |
|
2,796,515 |
|
|
|
1,993,707 |
|
|
|
11,280,146 |
|
|
Purchases of mortgage loans held for investment |
|
(357,996 |
) |
|
|
(31,462 |
) |
|
|
- |
|
|
Principal repayments on mortgage loans held for investment |
|
44,105 |
|
|
|
10 |
|
|
|
- |
|
|
Purchases of mortgage servicing rights |
|
(259,181 |
) |
|
|
- |
|
|
|
- |
|
|
Acquisition of Pingora, net of cash acquired |
|
(21,473 |
) |
|
|
- |
|
|
|
- |
|
|
Net payments on derivative instruments |
|
(87,933 |
) |
|
|
(53,192 |
) |
|
|
(67,656 |
) |
|
Purchase of equity investment |
|
- |
|
|
|
(6,000 |
) |
|
|
- |
|
|
Purchase of broker/dealer |
|
- |
|
|
|
(1,349 |
) |
|
0 |
|
|
|
Net cash provided by investing activities |
|
2,270,478 |
|
|
|
199,095 |
|
|
|
6,814,305 |
|
|
|
|
|
|
|
|
|
|
|
|
|
|
|
Financing activities |
|
|
|
|
|
|
|
|
|
|
|
|
Repurchase of common stock |
|
(20,752 |
) |
|
|
(1,912 |
) |
|
|
(43,881 |
) |
|
Cash dividends paid |
|
(210,646 |
) |
|
|
(215,098 |
) |
|
|
(283,309 |
) |
|
Proceeds from borrowings |
|
157,899,476 |
|
|
|
151,439,951 |
|
|
|
226,824,755 |
|
|
Principal repayments on borrowings |
|
(160,145,185 |
) |
|
|
(151,809,803 |
) |
|
|
(233,561,501 |
) |
|
Proceeds from collateralized trust borrowing |
|
59,466 |
|
|
|
- |
|
|
|
- |
|
|
Repayments on collateralized trust borrowing |
|
(1,948 |
) |
|
|
- |
|
|
|
- |
|
|
Proceeds from dollar roll financing |
|
- |
|
|
|
241,121 |
|
|
|
1,784,998 |
|
|
Repayments on dollar roll financing |
|
- |
|
|
|
(592,947 |
) |
|
|
(1,433,172 |
) |
|
Payment on termination of interest rate swaps and swaptions |
|
- |
|
|
|
- |
|
|
|
(3,342 |
) |
|
Net cash used in financing activities |
|
(2,419,589 |
) |
|
|
(938,688 |
) |
|
|
(6,715,452 |
) |
|
|
|
|
|
|
|
|
|
|
|
|
|
|
Net increase (decrease) in cash and cash equivalents |
|
189,120 |
|
|
|
(361,110 |
) |
|
|
539,260 |
|
|
Cash and cash equivalents, beginning of period |
|
627,595 |
|
|
|
988,705 |
|
|
|
449,445 |
|
|
Cash and cash equivalents, end of period |
$ |
816,715 |
|
|
$ |
627,595 |
|
|
$ |
988,705 |
|
|
|
|
|
|
|
|
|
|
|
|
|
|
F-6
|
Supplemental disclosure of cash flow information |
|
|
|
|
|
|
|
|
|
|
|
|
Cash paid for interest |
$ |
117,767 |
|
|
$ |
166,368 |
|
|
$ |
197,022 |
|
|
|
|
|
|
|
|
|
|
|
|
|
|
|
Supplemental schedule of non-cash investing and financing activities |
|
|
|
|
|
|
|
|
|
|
|
|
Obligation to brokers for unsettled purchases of securities |
$ |
12,582 |
|
|
$ |
24,750 |
|
|
$ |
- |
|
|
Receivable for securities sold |
$ |
- |
|
|
$ |
5,197 |
|
|
$ |
231,214 |
|
|
Dividends accrued on preferred stock, not yet paid |
$ |
4,628 |
|
|
$ |
4,628 |
|
|
$ |
4,628 |
|
|
Dividends accrued on common stock, not yet paid |
$ |
43,196 |
|
|
$ |
48,386 |
|
|
$ |
48,301 |
|
See accompanying notes.
F-7
Hatteras Financial Corp.
Notes to Consolidated Financial Statements
December 31, 2015
(Dollars in thousands except per share amounts)
|
1. |
Organization and Business Description |
Hatteras Financial Corp. (the “Company”) was incorporated in Maryland on September 19, 2007. The Company invests in single-family residential mortgage assets, such as mortgage-backed securities (“MBS”), and other financial assets. To date, the Company has primarily invested in MBS issued or guaranteed by a U.S. Government agency, such as Ginnie Mae, or by a U.S. Government-sponsored entity, such as Fannie Mae and Freddie Mac (“agency securities”).
The Company is externally managed and advised by its manager, Atlantic Capital Advisors LLC (“ACA”).
The Company has elected to be taxed as a real estate investment trust (“REIT”) under the Internal Revenue Code of 1986, as amended (the “Code”). As a result, the Company does not pay federal income taxes on taxable income distributed to shareholders if certain REIT qualification tests are met. It is the Company’s policy to distribute 100% of its taxable income, after application of available tax attributes, within the time limits prescribed by the Code, which may extend into the subsequent taxable year. However, the Company may conduct certain activities that cause it to earn income which will not be qualifying income for REIT purposes. The Company has designated certain of its subsidiaries as taxable REIT subsidiaries (“TRSs”) as defined in the Code to engage in such activities, and the Company may in the future form additional TRSs.
On August 31, 2015, the Company closed on its acquisition of the voting interests of Pingora Asset Management, LLC (“PAM”) and Pingora Loan Servicing, LLC (“PLS,” and together, “Pingora”), a specialized asset manager focused on investing in new-production performing mortgage servicing rights (“MSR”) and master-servicing residential mortgage loans sourced primarily from direct, ongoing relationships with loan originators. PAM is a registered investment advisor and PLS is an approved servicer with Fannie Mae, Freddie Mac and Ginnie Mae that is managed by PAM. The acquisition provides the Company with MSR portfolio management and master-servicing oversight capabilities to the Company, accelerating the Company’s entry into investing in MSR. The impact of the Company’s investments in MSR is not reflected in the opening balance sheet below (see Note 7 for further discussion). In addition to being an income-producing investment, the Company expects that MSR will serve as a natural hedge against the impact of changes in interest rates on the fair value of the Company’s interest-earning portfolio. The Company acquired 100% of the voting interests of Pingora for cash consideration of approximately $23.5 million. In conjunction with the transaction, the Company also issued approximately $4.4 million of equity interests to Pingora management, a significant portion of which is subject to future vesting. The Company has accounted for the transaction as a business combination in accordance with Financial Accounting Standards Board (“FASB”) Accounting Standards Codification (“ASC”) Topic 805, Business Combinations. The acquired operations generated other income of $23.6 million and net income of $8.7 million during the period from the acquisition date through December 31, 2015.
The opening balance sheet of Pingora as of the acquisition date consisted of the following assets and liabilities:
|
|
Assets / (Liabilities) |
|
|
|
Mortgage loans held for sale, at fair value |
$ |
4,292 |
|
|
Cash and cash equivalents |
|
1,937 |
|
|
Ascent software platform |
|
2,000 |
|
|
Customer relationships intangible |
|
16,000 |
|
|
Licenses |
|
2,000 |
|
|
Goodwill |
|
3,498 |
|
|
Warehouse lines of credit |
|
(3,989 |
) |
|
Deferred tax liabilities |
|
(2,060 |
) |
|
Other net liabilities |
|
(215 |
) |
|
Net assets |
$ |
23,463 |
|
The acquisition is subject to certain post-closing adjustments and the Company’s allocation of the purchase price to the assets and liabilities acquired may be adjusted accordingly. The goodwill recorded is representative of the value of the assembled workforce along with operating synergies the Company expects to achieve.
F-8
|
2. |
Summary of Significant Accounting Policies |
Basis of Presentation and Use of Estimates
The accompanying consolidated financial statements have been prepared in accordance with U.S. generally accepted accounting principles (“GAAP”). The preparation of financial statements in conformity with GAAP requires management to make estimates and assumptions that affect the reported amounts of assets and liabilities and disclosure of contingent assets and liabilities at the date of the financial statements and the reported amounts of revenues and expenses during the reporting period. Actual results could differ from those estimates. Significant estimates affecting the accompanying consolidated financial statements include the valuation of investments and derivative instruments.
Certain prior period amounts have been reclassified to conform to the current period classification.
Principles of Consolidation
The consolidated financial statements include the accounts of the Company and all of its subsidiaries. The Company also considers the provisions of FASB ASC Topic 810, Consolidation, in determining whether consolidation is appropriate for any interests held in variable interest entities. All significant intercompany balances and transactions have been eliminated.
The Company consolidates a securitization trust, also known as a collateralized financing entity (“CFE”) that purchased individual whole mortgage loans from one of the Company’s subsidiaries and issued MBS that are backed by the loans. This securitization occurred in December 2015. An owner of a variable interest in a variable interest entity (“VIE”) must consolidate the VIE if that owner has: (i) the power to direct the activities that most significantly impact the VIE’s economic performance (“power”), and (ii) the obligation to absorb losses of, or to receive benefits from, the VIE that could potentially be significant to the VIE. Because the Company purchased the majority of the MBS that were issued by the CFE, including all the subordinate tranches, and because a subsidiary of the Company continues to be the named servicer of the loans in the trust, the criteria for consolidation of the CFE are met. See Note 3 for further information related to the CFE.
PLS, which meets the definition of a business pursuant to GAAP, has also been determined to be a VIE. Further, PLS has structured its operations, and the funding and capitalization thereof, into three pools of assets and liabilities referred to as “silos.” Owners of variable interests in a given PLS silo are entitled to all of the returns and risk of loss on the investments and operations in that silo and have no substantive recourse to assets contained in any other silo. While the Company has power over all PLS silos because it owns 100% of the voting interests of PLS, it only has variable interests in two of the three silos. In the two silos in which it has a variable interest, the Company holds 100% of the variable interests, making it the primary beneficiary thereof. These silos have been included in the Company’s consolidated financial statements. The Company’s consolidated financial statements exclude the PLS silo in which the Company has no variable interest.
The Company is required to reassess the consolidation of VIEs quarterly, and changes in facts and circumstances may change the Company’s determination. This could result in a material impact to the Company’s consolidated financial statements during subsequent reporting periods.
Cash and Cash Equivalents
The Company considers all highly liquid investments with original maturities of three months or less to be cash equivalents. The carrying amounts of cash equivalents approximate their fair value. Cash and cash equivalents includes cash pledged to derivative counterparties, which is held in margin accounts at various counterparties as collateral related to interest rate swaps, Eurodollar Futures Contracts (“Futures Contracts”) and forward commitments to purchase to-be-announced (“TBA”) securities.
Financial Instruments
The Company considers its cash and cash equivalents, MBS and agency credit risk transfer (“CRT”) securities (settled and unsettled), mortgage loans, forward purchase commitments, debt security held-to-maturity, receivable for securities sold, accrued interest receivable, principal payments receivable, payable for unsettled securities, derivative instruments, borrowings and accrued interest payable to meet the definition of financial instruments. The carrying amount of cash and cash equivalents, receivable for securities sold, accrued interest receivable and payable for unsettled securities approximate their fair value due to the short maturities of these instruments and would be valued using Level 1 inputs. The carrying amount of repurchase agreements is deemed to approximate fair value given their short-term duration and would be valued using Level 2 inputs. See Note 5 for discussion of the fair value of MBS and agency CRT securities. See Note 6 for discussion of the fair value of mortgage loans. See Note 8 for discussion of the fair value of the held-to-maturity debt security. See Note 10 for discussion of the fair value of derivative instruments, including forward purchase commitments.
The Company limits its exposure to credit losses on its portfolio of securities by purchasing predominantly agency securities. In addition, the Company’s portfolio is diversified to avoid undue exposure to loan originator, geographic and other types of concentration. The Company manages the risk of prepayments of the underlying mortgages by creating a diversified portfolio with a variety of expected prepayment characteristics. See Note 5 for additional information on MBS.
F-9
The Company is engaged in various trading and brokerage activities including repurchase agreements, dollar roll transactions, interest rate swap agreements, interest rate swaptions and Futures Contracts in which counterparties primarily include broker-dealers, banks, and other financial institutions. In the event counterparties do not fulfill their obligations, the Company may be exposed to risk of loss. The risk of default depends on the creditworthiness of the counterparty and/or issuer of the instrument. It is the Company’s policy to review, as necessary, the credit standing for each counterparty and retain collateral when appropriate. See Note 9 for additional information on repurchase agreements and Note 10 for additional information on dollar roll transactions, interest rate swap agreements, interest rate swaptions and Futures Contracts.
Mortgage-Backed Securities and Agency CRT Securities
The Company invests primarily in MBS representing interests in or obligations backed by pools of single-family residential mortgage loans. GAAP requires the Company to classify its investments as either trading, available-for-sale or held-to-maturity securities. Management determines the appropriate classifications of the securities at the time they are acquired and evaluates the appropriateness of such classifications at each balance sheet date. The Company currently classifies all of its MBS as available-for-sale. All assets that are classified as available-for-sale are carried at fair value and unrealized gains and losses are included in other comprehensive income (loss). Agency CRT securities are credit risk transfer securities issued by government sponsored entities, which are designed to synthetically transfer mortgage credit risk from Fannie Mae and Freddie Mac to private investors. The Company has elected to account for agency CRT securities under the fair value option, which simplifies accounting for these particular securities due to the potential for embedded derivatives therein. The estimated fair values of MBS and agency CRT securities are determined by management utilizing valuations obtained from independent sources. Security purchase and sale transactions are recorded on the trade date. Gains or losses realized from the sale of securities are included in income and are determined using the specific identification method.
Forward purchase commitments to acquire “when issued” or TBA securities are recorded at fair value in accordance with FASB ASC Topic 815, Derivatives and Hedging (“ASC 815”). The fair value of these forward purchase commitments is included in derivative assets or derivative liabilities in the accompanying consolidated balance sheets. If the Company intends to take physical delivery of the securities, as is the case for forward purchase commitments to acquire TBA securities from mortgage originators, the commitment is designated as an all-in-one cash flow hedge and its unrealized gains and losses are recorded in other comprehensive income. If the Company does not intend to take physical delivery of the securities, as is the case with most TBA dollar roll transactions, the commitment is not designated as an accounting hedge and unrealized gains and losses are recorded in “Gain (loss) on derivative instruments, net.” See Note 10 for additional information on forward purchase commitments.
The Company assesses its available-for-sale securities for other-than-temporary impairment on at least a quarterly basis. When the fair value of an investment is less than its amortized cost at the balance sheet date the impairment is designated as either “temporary” or “other-than-temporary.” In deciding on whether or not a security is other-than-temporarily impaired, the Company uses a two-step evaluation process. First, the Company determines whether it has made any decision to sell a security that is in an unrealized loss position, or, if not, the Company determines whether it is more likely than not that the Company will be required to sell the security prior to recovering its amortized cost basis. If the answer to either of these questions is “yes” then the security is considered other-than-temporarily impaired. See Note 5 for discussion of an other-than temporary impairment recognized during the year ended December 31, 2013.
Mortgage Loans Held for Investment
The Company does not originate any loans, but purchases individual prime jumbo adjustable-rate whole mortgage loans with the intention of holding them as investments. In order to finance its investment in the loans, the Company may securitize the loans into MBS not issued or guaranteed by a U.S. Government agency or U.S. Government-sponsored entity. The Company would then purchase the majority of the MBS that the securitization trusts would issue, and would expect to consolidate the trusts pursuant to GAAP. The Company completed such a securitization transaction during 2015.
The Company has elected to account for these loans under the fair value option, pursuant to FASB ASC Topic 825, Financial Instruments (“ASC 825’). As a result of electing the fair value option, the mortgage loans are carried at fair value with changes therein reflected in consolidated net income (loss), consistent with the accounting for the related hedging instruments, thereby enhancing the usefulness of the Company’s financial statements. See “Interest Income” below for discussion of the recognition of the interest income on mortgage loans. Other changes in fair value are reported in “Net gain (loss) on mortgage loans” in the consolidated statements of income Given the Company’s intent to hold the mortgage loans as investments, purchases and sales or paydowns of mortgage loans held for investment are classified as investing cash flows in the consolidated statements of cash flows.
Mortgage Loans Held for Investment in Securitization Trusts
As discussed under “Principles of Consolidation,” the Company consolidates a CFE that securitized individual prime jumbo adjustable-rate whole mortgage loans it had purchased from a subsidiary of the Company. These securitized mortgage loans are legally isolated from the Company, are beyond the reach of the Company’s creditors, and may only be used to settle obligations of the CFE. The Company has elected to account for the assets and liabilities of the CFE under the fair value option, pursuant to ASC 825. As a result,
F-10
mortgage loans held for investment in securitization trusts are carried at fair value. See “Interest Income” below for discussion of the recognition of the interest income on mortgage loans. Paydowns on these mortgage loans are classified as investing cash flows in the consolidated statements of cash flows. See Note 3 for further information regarding the CFE.
Mortgage Loans Held for Sale
The Company purchases certain individual whole loans with the intention of selling them to Ginnie Mae for inclusion in securitizations. The Company has elected to account for these loans under the fair value option, pursuant to ASC 825, because it better reflects the short-term nature of the Company’s holdings in these loans. As a result of electing the fair value option, the mortgage loans are carried at fair value with changes therein reflected in consolidated net income (loss). Changes in fair value are reported in “Net gain (loss) on mortgage loans” in the consolidated statements of income. Cash flows related to mortgage loans held for sale are classified as operating cash flows in the consolidated statements of cash flows.
Mortgage Servicing Rights
The Company purchases MSR with the intention of holding them as investments. The Company and its subsidiaries do not originate or directly service mortgage loans. Rather, it utilizes duly licensed subservicers to perform substantially all servicing functions for the loans underlying the MSR. The Company has elected to account for its investments in MSR at fair value pursuant to FASB ASC Topic 860, Transfers and Servicing. As a result, MSR are carried at fair value with changes therein reported in “Net gain on mortgage servicing rights” in the consolidated statements of income. Servicing income and expenses are reported on a gross basis in the consolidated statements of income.
Derivative Instruments
The Company manages economic risks, including interest rate, liquidity and credit risks, primarily by managing the amount, sources, cost and duration of its debt funding. The objectives of the Company’s risk management strategy are 1) to attempt to mitigate the risk of the cost of its variable rate liabilities increasing during a period of rising interest rates, and 2) to reduce fluctuations in net book value over a range of interest rate scenarios. The principal instruments that the Company uses to achieve these objectives are interest rate swaps and Eurodollar Futures Contracts (“Futures Contracts”). The Company uses Futures Contracts to approximate the economic hedging results achieved with interest rate swaps. The Company does not enter into any of these transactions for speculative purposes.
The Company accounts for derivative instruments in accordance with ASC 815, which requires an entity to recognize all derivatives as either assets or liabilities and to measure those instruments at fair value. The accounting for changes in the fair value of derivative instruments depends on whether the instruments are designated and qualify as part of a hedging relationship pursuant to ASC 815. Changes in fair value related to derivatives not in hedge designated relationships are recorded in “Gain (loss) on derivative instruments, net” in the Company’s consolidated statements of income, whereas changes in fair value related to derivatives in hedge designated relationships are initially recorded in other comprehensive income (loss) and later reclassified to income at the time that the hedged transactions affect earnings. Any portion of the changes in fair value due to hedge ineffectiveness is immediately recognized in the income statement.
Derivative instruments in a gain position are reported as derivative assets and derivative instruments in a loss position are reported as derivative liabilities in the Company’s consolidated balance sheets. In the Company’s consolidated statements of cash flows, cash receipts and payments related to derivative instruments are classified according to the underlying nature or purpose of the derivative transaction, generally in the operating section if the derivatives are designated as accounting hedges and in the investing section otherwise. The use of derivatives creates exposure to credit risk relating to potential losses that could be recognized in the event that the counterparties to these instruments in an asset position fail to perform their obligations under the contracts. The Company attempts to minimize this risk by limiting its counterparties to major financial institutions with acceptable credit ratings, monitoring positions with individual counterparties and adjusting posted collateral as required.
The Company’s interest rate swaps have historically been accounted for as cash flow hedges under ASC 815. However, on September 30, 2013, the Company discontinued hedge accounting for its interest rate swap agreements by de-designating the interest rate swaps as cash flow hedges. No interest rate swaps were terminated in conjunction with this action, and the Company’s risk management and hedging practices were not impacted. As a result of discontinuing hedge accounting, beginning October 1, 2013 changes in the fair value of the Company's interest rate swap agreements are recorded in “Gain (loss) on derivative instruments, net” in the Company's consolidated statements of income, rather than in other comprehensive income (loss). Also, net interest paid or received under the interest rate swaps, which up through September 30, 2013 was recognized in “interest expense,” is instead recognized in “Gain (loss) on derivative instruments, net.” These interest rate swaps continue to be reported as assets or liabilities on the Company's consolidated balance sheets at their fair value.
As long as the forecasted transactions that were being hedged (i.e. rollovers of the Company’s repurchase agreement borrowings) are still expected to occur, the balance in accumulated other comprehensive income (AOCI) from interest rate swap activity up through
F-11
September 30, 2013 remains in AOCI and is recognized in the Company's consolidated statements of income as "interest expense" over the remaining term of the interest rate swaps. See Note 10 for further information.
The Company may also enter into forward purchase commitments as a means of investing in and financing agency securities via TBA dollar roll transactions. TBA dollar roll transactions involve moving the settlement of a TBA contract out to a later date by entering into an offsetting short position (referred to as a "pair off"), net settling the paired-off positions for cash, and simultaneously purchasing a similar TBA contract for a later settlement date. The agency securities purchased at the later settlement date are typically priced at a discount to securities for settlement in the current month. This difference is referred to as the “price drop.” The price drop represents compensation to the Company for foregoing net interest margin (interest income less repurchase agreement financing cost) and is referred to as “dollar roll income,” which the Company classifies in “Gain (loss) on derivative instruments, net.” Realized and unrealized gains and losses related to TBA dollar roll transactions are also recognized in “Gain (loss) on derivative instruments, net.” TBA dollar roll transactions represent off-balance sheet financing.
Repurchase Agreements
The Company finances the acquisition of its MBS through the use of repurchase agreements. Under these repurchase agreements, the Company sells securities to a lender and agrees to repurchase the same securities in the future for a price that is higher than the original sales price. The difference between the sale price that the Company receives and the repurchase price that the Company pays represents interest paid to the lender. Although structured as a sale and repurchase obligation, a repurchase agreement operates as a financing under which the Company pledges its securities as collateral to secure a loan which is equal in value to a specified percentage of the estimated fair value of the pledged collateral. The Company records repurchase agreements on the consolidated balance sheets at the amount of cash received (or contract value), with accrued interest recorded separately. The Company retains beneficial ownership of the pledged collateral. At the maturity of a repurchase agreement, the Company is required to repay the loan and concurrently receives back its pledged collateral from the lender or, with the consent of the lender, the Company may renew such agreement at the then-prevailing financing rate. These repurchase agreements may require the Company to pledge additional assets to the lender in the event the estimated fair value of the existing pledged collateral declines.
Warehouse Lines of Credit
Warehouse lines of credit include borrowings under mortgage loan warehouse facilities with various counterparties that expire within one year. These borrowings are collateralized by mortgage loans. If the value of the underlying collateral (as determined by the counterparty) securing these borrowings decreases, the Company may be subject to margin calls during the period the borrowing is outstanding. To satisfy these margin calls, the Company may have to pledge additional collateral or repay portions of the borrowings.
Federal Home Loan Bank Advances
During the third quarter of 2015, a wholly-owned subsidiary of the Company became a member of the Federal Home Loan Bank of Atlanta (the “FHLB”). The FHLB offers a variety of products and services, including short-term and long-term secured advances. FHLB advances are carried at their contractual amounts. Based on the current status of recent rulemaking by the Federal Housing Finance Agency (“FHFA”), the Company will need to surrender its membership in the FHLB in 2016.
Collateralized Borrowings in Securitization Trusts, at Fair Value
As discussed under “Principles of Consolidation,” the Company consolidates a CFE that securitized individual prime jumbo adjustable-rate whole mortgage loans it had purchased from a subsidiary of the Company. Investors in the collateralized borrowings issued by the CFE have recourse against the assets within the CFE, but have no recourse against the Company itself. The Company has elected to account for the assets and liabilities of the CFE under the fair value option, pursuant to ASC 825. As a result, collateralized borrowings in securitization trusts are carried at fair value. The debt certificates issued by the CFE are tradeable MBS, and the fair value of the debt is determined by management by obtaining valuations from independent sources, consistent with how the Company values its investment portfolio. Paydowns on this debt are classified as financing cash flows in the consolidated statements of cash flows. See Note 3 for further information regarding the CFE.
Offsetting of Assets and Liabilities
The Company’s derivative agreements and repurchase agreements generally contain provisions that allow for netting or the offsetting of receivables and payables with each counterparty. The Company reports amounts in its consolidated balance sheets on a gross basis without regard for such rights of offset or master netting arrangements.
Interest Income
Interest income on MBS and agency CRT securities is earned and recognized based on the outstanding principal amount of the investment securities and their contractual terms. Premiums and discounts associated with the purchase of MBS are amortized or
F-12
accreted into interest income over the actual lives of the securities using the effective interest method. Interest income on agency CRT securities, which are accounted for under the fair-value option, is recognized based on their stated coupon rates.
The Company recognizes interest income on mortgage loans held for investment and mortgage loans held for investment in securitization trusts based on their stated coupon rates. If a loan becomes 90 days past due, it is considered non-performing and is placed in non-accrual status. Accrual of interest income ceases and any existing interest receivables are reversed. Any cash received while a loan is in non-accrual status is first applied to unpaid principal and then to unpaid interest. In general, non-performing loans are only restored to accrual status when no principal or interest remains due and unpaid.
Income Taxes
The Company has elected to be taxed as a REIT under the Code. The Company will generally not be subject to federal income tax to the extent that it distributes 100% of its taxable income, after application of available tax attributes, within the time limits prescribed by the Code and as long as it satisfies the ongoing REIT requirements including meeting certain asset, income and stock ownership tests. The Company has made an election to treat certain of its subsidiaries as TRSs. These TRSs are taxable as domestic C corporations and are subject to federal, state and local income taxes based upon their taxable income.
Share-Based Compensation
Share-based compensation is accounted for under the guidance included in FASB ASC Topic 718, Stock Compensation. For share and share-based awards issued to employees, a compensation charge is recorded in earnings based on the fair value of the award. For transactions with non-employees in which services are performed in exchange for the Company’s common stock or other equity instruments, the transactions are recorded on the basis of the fair value of the service received or the fair value of the equity instruments issued, whichever is more readily measurable at the date of issuance. The Company’s share-based compensation transactions resulted in compensation expense of $4,256, $3,612, and $2,594 for the years ended December 31, 2015, 2014, and 2013, respectively.
Earnings Per Common Share (EPS)
Basic EPS is computed by dividing net income less preferred stock dividends to arrive at net income available to holders of common stock by the weighted average number of shares of common stock outstanding during the period. Diluted EPS is computed using the two class method, as described in FASB ASC Topic 260, Earnings Per Share, which takes into account certain adjustments related to participating securities. Participating securities are unvested share-based awards that contain rights to receive nonforfeitable dividends, such as those awarded under the Company’s equity incentive plans. Net income available to holders of common stock after deducting dividends on unvested participating securities if antidilutive, is divided by the weighted average shares of common stock and common equivalent shares outstanding during the period. For the diluted EPS calculation, common equivalent shares outstanding includes the weighted average number of shares of common stock outstanding adjusted for the effect of dilutive unexercised stock options, if any.
Other Comprehensive Income
Other comprehensive income refers to revenue, expenses, gains, and losses that are recorded directly as an adjustment to shareholders’ equity. Other comprehensive income for the Company generally arises from unrealized gains or losses generated from changes in market values of the securities held as available-for-sale and derivative instruments that have been designated as accounting hedges.
Recent Accounting Pronouncements
In February 2015, the FASB issued ASU 2015-02, Consolidation (Topic 810): Amendments to the Consolidation Analysis (“ASU 2015-02”). ASU 2015-02 modifies the principals for consolidation of limited partnerships and similar legal entities (such as limited liability companies) including whether such entities represent variable interest entities or voting interest entities. ASU 2015-02 eliminates the presumption that a general partner (or a managing member, in the case of an LLC) should consolidate a limited partnership. It also changes the conditions under which fees paid to a decision maker or a service provider by a legal entity represent a variable interest in that legal entity. ASU 2015-02 is effective January 1, 2016 for calendar year companies and early adoption is permitted. The Company early adopted this standard effective July 1, 2015. The adoption of this standard did not have any impact on previous consolidation evaluations.
In August 2014, the FASB issued ASU 2014-13, Consolidation (Topic 810): Measuring the Financial Assets and the Financial Liabilities of a Consolidated Collateralized Financing Entity (“ASU 2014-13”). ASU 2014-13 provides a practical expedient that allows an entity to measure both the financial assets and financial liabilities of a CFE it consolidates using the fair value of either the CFE’s financial assets or the financial liabilities, whichever is more observable. This approach eliminates the potential for a non-economic accounting mismatch that could arise if the financial assets and the financial liabilities were valued independently. ASU 2014-13 is effective January 1, 2016 for calendar year companies and early adoption is permitted. The Company is still assessing the potential impacts of ASU 2014-13.
F-13
In January 2016, the FASB issued ASU 2016-1, Financial Instruments—Overall (Subtopic 825-10): Recognition and Measurement of Financial Assets and Financial Liabilities (“ASU 2016-1”). Among other things, ASU 2016-1 modifies accounting and impairment assessments for equity investments, eliminates certain disclosures related to financial instruments carried at amortized cost, and requires separate presentation of financial assets and financial liabilities by measurement category and form of financial asset. ASU 2016-1 is effective January 1, 2018 for calendar year companies and early adoption is permitted. The Company is still assessing the potential impacts of ASU 2016-1, but it is not expected to have a material impact on the Company’s consolidated financial statements.
|
3. |
Collateralized Financing Entity |
As discussed under “Principles of Consolidation” above, the Company consolidates a CFE that purchased individual whole mortgage loans from one of the Company’s subsidiaries and issued MBS that are backed by the loans. The Company purchased most of the MBS issued by the CFE. The Company has elected the fair value option for the financial assets and liabilities of the CFE in order to avoid an accounting mismatch and more accurately present the economics of the securitization. The underlying loans are classified as “Mortgage loans held for investment in securitization trusts, at fair value” and the portion of the related debt that is not eliminated in consolidation is classified as “Collateralized borrowings in securitization trusts, at fair value” in the consolidated balance sheets. The securitized mortgage loans are legally isolated from the Company, are beyond the reach of the Company’s creditors, and may only be used to settle obligations of the CFE. Similarly, investors in the collateralized borrowings issued by the CFE have recourse against the assets within the CFE, but have no recourse against the Company itself. The Company is not contractually required to provide and has not provided any form of financial support to the CFE.
The following table presents the carrying amounts and classifications of the CFE’s assets and liabilities as reflected in the Company’s consolidated balance sheets:
|
|
December 31, 2015 |
|
|
|
Mortgage loans held-for-investment in securitization trusts |
$ |
225,285 |
|
|
Accrued interest receivable and other assets |
|
2,955 |
|
|
Total assets |
$ |
228,240 |
|
|
Collateralized borrowings in securitization trusts |
$ |
57,611 |
|
|
Accrued interest payable |
|
133 |
|
|
Other liabilities |
|
40 |
|
|
Total liabilities |
$ |
57,784 |
|
The following table presents the statement of income of the CFE as reflected in the Company’s consolidated statements of income:
|
|
For the Period from |
|
|
|
|
December 10, 2015 |
|
|
|
|
to December 31, 2015 |
|
|
|
Interest income |
$ |
446 |
|
|
Interest expense |
|
(97 |
) |
|
Net interest margin |
|
349 |
|
|
Gain on mortgage loans |
|
3,571 |
|
|
Operating expenses |
|
(8 |
) |
|
Net income |
$ |
3,912 |
|
|
4. |
Fair Value Measurements |
The Company’s valuation techniques for financial instruments are based on observable and unobservable inputs. Observable inputs reflect readily obtainable data from independent sources, while unobservable inputs reflect the Company’s market assumptions. FASB Topic 820, Fair Value Measurements, classifies these inputs into the following hierarchy:
Level 1 Inputs– Quoted prices for identical instruments in active markets.
Level 2 Inputs– Quoted prices for similar instruments in active markets; quoted prices for identical or similar instruments in markets that are not active; and model-derived valuations whose inputs are observable or whose significant value drivers are observable.
Level 3 Inputs– Instruments with primarily unobservable value drivers.
F-14
The Company’s Futures Contracts were valued using Level 1 inputs. The Company’s MBS, mortgage loans held for sale and derivatives other than Futures Contracts were valued using Level 2 inputs. Mortgage loans held for investment along with related purchase commitments and MSR were valued using Level 3 inputs. See Notes 5, 6, 7 and 10, respectively, for a discussion of the valuation of MBS, mortgage loans, MSR and derivatives.
The carrying values and fair values of all the Company’s financial instruments as of December 31, 2015 and 2014 were as follows:
|
|
December 31, 2015 |
|
|
December 31, 2014 |
|
||||||||||
|
|
Carrying Value |
|
|
Fair Value |
|
|
Carrying Value |
|
|
Fair Value |
|
||||
|
Assets |
|
|
|
|
|
|
|
|
|
|
|
|
|
|
|
|
MBS |
$ |
14,302,230 |
|
|
$ |
14,302,230 |
|
|
$ |
17,587,010 |
|
|
$ |
17,587,010 |
|
|
Agency CRT securities |
|
109,387 |
|
|
|
109,387 |
|
|
|
- |
|
|
|
- |
|
|
Mortgage loans held for investment |
|
116,857 |
|
|
|
116,857 |
|
|
|
31,460 |
|
|
|
31,460 |
|
|
Mortgage loans held for investment in securitization trusts |
|
226,908 |
|
|
|
226,908 |
|
|
|
- |
|
|
|
- |
|
|
Mortgage loans held for sale |
|
17,542 |
|
|
|
17,542 |
|
|
|
- |
|
|
|
- |
|
|
MSR |
|
269,926 |
|
|
|
269,926 |
|
|
|
- |
|
|
|
- |
|
|
Cash and cash equivalents |
|
816,715 |
|
|
|
816,715 |
|
|
|
627,595 |
|
|
|
627,595 |
|
|
Unsettled purchased MBS |
|
12,582 |
|
|
|
12,582 |
|
|
|
24,792 |
|
|
|
24,792 |
|
|
Receivable for securities sold |
|
- |
|
|
|
- |
|
|
|
5,197 |
|
|
|
5,197 |
|
|
Accrued interest receivable |
|
45,008 |
|
|
|
45,008 |
|
|
|
54,274 |
|
|
|
54,274 |
|
|
Principal payments receivable |
|
108,201 |
|
|
|
108,201 |
|
|
|
111,439 |
|
|
|
111,439 |
|
|
Debt security, held-to-maturity (1) |
|
15,000 |
|
|
|
14,871 |
|
|
|
15,000 |
|
|
|
14,853 |
|
|
Short-term investments (1) |
|
30,327 |
|
|
|
30,327 |
|
|
|
20,252 |
|
|
|
20,252 |
|
|
Interest rate swaps and swaptions (2) |
|
2,031 |
|
|
|
2,031 |
|
|
|
11,050 |
|
|
|
11,050 |
|
|
Futures Contracts asset (2) |
|
693 |
|
|
|
693 |
|
|
|
- |
|
|
|
- |
|
|
Forward purchase commitments (2) |
|
190 |
|
|
|
190 |
|
|
|
16,101 |
|
|
|
16,101 |
|
|
Liabilities |
|
|
|
|
|
|
|
|
|
|
|
|
|
|
|
|
Repurchase agreements |
$ |
13,443,883 |
|
|
|
13,443,883 |
|
|
$ |
15,759,831 |
|
|
$ |
15,759,831 |
|
|
Warehouse lines of credit |
|
60,096 |
|
|
|
60,096 |
|
|
|
- |
|
|
|
- |
|
|
FHLB advances |
|
14,132 |
|
|
|
14,132 |
|
|
|
- |
|
|
|
- |
|
|
Collateralized borrowings in securitization trusts |
|
57,611 |
|
|
|
57,611 |
|
|
|
- |
|
|
|
- |
|
|
Payable for unsettled securities |
|
12,582 |
|
|
|
12,582 |
|
|
|
24,750 |
|
|
|
24,750 |
|
|
Accrued interest payable |
|
4,938 |
|
|
|
4,938 |
|
|
|
6,968 |
|
|
|
6,968 |
|
|
Interest rate swap liability (3) |
|
6,802 |
|
|
|
6,802 |
|
|
|
42,052 |
|
|
|
42,052 |
|
|
Futures Contracts liability (3) |
|
286,058 |
|
|
|
286,058 |
|
|
|
202,501 |
|
|
|
202,501 |
|
|
Forward purchase commitments (3) |
|
32,373 |
|
|
|
32,373 |
|
|
|
38 |
|
|
|
38 |
|
(1)Included in other investments on the consolidated balance sheets.
(2)Included in derivative assets on the consolidated balance sheets.
(3)Included in derivative liabilities on the consolidated balance sheets.
|
5. |
Mortgage-Backed Securities and Agency CRT securities |
All of the Company’s securities, other than its agency CRT securities, are classified as available-for-sale and are reported at their estimated fair value. The agency CRT securities are accounted for under the fair value option as discussed in Note 2. The MBS market is primarily an over-the-counter market. As such, there are no standard, public market quotations for individual MBS. The Company estimates the fair value of its securities based on a market approach by obtaining values for its securities from third-party pricing services. The third-party pricing services gather trade data and use pricing models that incorporate such factors as coupons, primary mortgage rates, prepayment speeds, spread to the U.S. Treasury and interest rate swap curves, periodic and life caps and other similar factors. The third party pricing services also receive data from traders at broker-dealers that participate in the active markets for these securities and directly observe numerous trades of securities similar to the securities owned by the Company.
The Company regularly reviews the prices obtained and the methods used to derive those prices. As part of this evaluation, the Company considers security-specific factors such as coupon, prepayment experience, fixed/adjustable rate, annual and life caps, coupon index, time to next reset and issuing agency, among other factors to ensure that estimated fair values are appropriate. The Company’s analysis
F-15
of pricing information obtained also includes comparing the data received to other available information, such as other independent pricing services, repurchase agreement pricing, discounted cash flow analysis, matrix pricing, option adjusted spread models and other fundamental analysis of observable market factors.
In addition to agency securities, the Company at times invests in MBS not issued or guaranteed by a U.S. Government agency or a U.S. Government-sponsored entity (“non-agency” securities). The following table presents the composition of the Company’s securities portfolio at December 31, 2015.
|
|
Amortized Cost |
|
|
Gross Unrealized Loss |
|
|
Gross Unrealized Gain |
|
|
Estimated Fair Value |
|
||||
|
Agency Securities |
|
|
|
|
|
|
|
|
|
|
|
|
|
|
|
|
Fannie Mae Certificates |
|
|
|
|
|
|
|
|
|
|
|
|
|
|
|
|
ARMs |
$ |
7,392,021 |
|
|
$ |
(14,465 |
) |
|
$ |
102,247 |
|
|
$ |
7,479,803 |
|
|
Fixed-Rate |
|
1,005,458 |
|
|
|
(8,148 |
) |
|
|
- |
|
|
|
997,310 |
|
|
Total Fannie Mae |
|
8,397,479 |
|
|
|
(22,613 |
) |
|
|
102,247 |
|
|
|
8,477,113 |
|
|
|
|
|
|
|
|
|
|
|
|
|
|
|
|
|
|
|
Freddie Mac Certificates |
|
|
|
|
|
|
|
|
|
|
|
|
|
|
|
|
ARMs |
|
5,806,425 |
|
|
|
(22,551 |
) |
|
|
41,243 |
|
|
|
5,825,117 |
|
|
Fixed-Rate |
|
- |
|
|
|
- |
|
|
|
- |
|
|
|
- |
|
|
Total Freddie Mac |
|
5,806,425 |
|
|
|
(22,551 |
) |
|
|
41,243 |
|
|
|
5,825,117 |
|
|
|
|
|
|
|
|
|
|
|
|
|
|
|
|
|
|
|
Total Agency MBS |
$ |
14,203,904 |
|
|
$ |
(45,164 |
) |
|
$ |
143,490 |
|
|
$ |
14,302,230 |
|
|
|
|
|
|
|
|
|
|
|
|
|
|
|
|
|
|
|
Agency CRT Securities |
$ |
111,217 |
|
|
$ |
(1,830 |
) |
|
$ |
- |
|
|
$ |
109,387 |
|
The following table presents the composition of the Company’s securities portfolio at December 31, 2014.
|
|
Amortized Cost |
|
|
Gross Unrealized Loss |
|
|
Gross Unrealized Gain |
|
|
Estimated Fair Value |
|
||||
|
Agency Securities |
|
|
|
|
|
|
|
|
|
|
|
|
|
|
|
|
Fannie Mae Certificates |
|
|
|
|
|
|
|
|
|
|
|
|
|
|
|
|
ARMs |
$ |
9,203,741 |
|
|
$ |
(13,737 |
) |
|
$ |
183,889 |
|
|
$ |
9,373,893 |
|
|
Fixed-Rate |
|
1,111,288 |
|
|
|
- |
|
|
|
5,177 |
|
|
|
1,116,465 |
|
|
Total Fannie Mae |
|
10,315,029 |
|
|
|
(13,737 |
) |
|
|
189,066 |
|
|
|
10,490,358 |
|
|
|
|
|
|
|
|
|
|
|
|
|
|
|
|
|
|
|
Freddie Mac Certificates |
|
|
|
|
|
|
|
|
|
|
|
|
|
|
|
|
ARMs |
|
6,805,885 |
|
|
|
(21,794 |
) |
|
|
76,790 |
|
|
|
6,860,881 |
|
|
Fixed-Rate |
|
158,402 |
|
|
|
- |
|
|
|
1,767 |
|
|
|
160,169 |
|
|
Total Freddie Mac |
|
6,964,287 |
|
|
|
(21,794 |
) |
|
|
78,557 |
|
|
|
7,021,050 |
|
|
|
|
|
|
|
|
|
|
|
|
|
|
|
|
|
|
|
Total Agency MBS |
|
17,279,316 |
|
|
|
(35,531 |
) |
|
|
267,623 |
|
|
|
17,511,408 |
|
|
|
|
|
|
|
|
|
|
|
|
|
|
|
|
|
|
|
Total Non-Agency MBS (ARMs) |
|
75,454 |
|
|
|
- |
|
|
|
148 |
|
|
|
75,602 |
|
|
|
|
|
|
|
|
|
|
|
|
|
|
|
|
|
|
|
Total MBS |
$ |
17,354,770 |
|
|
$ |
(35,531 |
) |
|
$ |
267,771 |
|
|
$ |
17,587,010 |
|
F-16
The components of the carrying value of the Company’s securities at December 31, 2015 and 2014 are presented below.
|
|
December 31, |
|
|
December 31, |
|
||
|
|
2015 |
|
|
2014 |
|
||
|
Principal balance |
$ |
13,935,533 |
|
|
$ |
16,864,583 |
|
|
Unamortized premium |
|
381,851 |
|
|
|
490,187 |
|
|
Unamortized discount |
|
(2,263 |
) |
|
|
- |
|
|
Gross unrealized gains |
|
143,490 |
|
|
|
267,771 |
|
|
Gross unrealized losses |
|
(46,994 |
) |
|
|
(35,531 |
) |
|
Carrying value/estimated fair value |
$ |
14,411,617 |
|
|
$ |
17,587,010 |
|
The following table presents components of interest income on the Company’s securities for the three years ended December 31, 2015:
|
|
Years Ended December 31 |
|
|||||||||
|
|
2015 |
|
|
2014 |
|
|
2013 |
|
|||
|
Coupon interest |
$ |
423,371 |
|
|
$ |
456,415 |
|
|
$ |
616,632 |
|
|
Net premium amortization |
|
(117,654 |
) |
|
|
(101,979 |
) |
|
|
(165,924 |
) |
|
Interest income |
$ |
305,717 |
|
|
$ |
354,436 |
|
|
$ |
450,708 |
|
Gross gains and losses from sales of available-for sale MBS and agency CRT securities for the three years ended December 31, 2015 were as follows:
|
|
Years Ended December 31 |
|
|||||||||
|
|
2015 |
|
|
2014 |
|
|
2013 |
|
|||
|
Gross gains |
$ |
36,805 |
|
|
$ |
15,821 |
|
|
$ |
18,717 |
|
|
Gross losses |
|
(4,074 |
) |
|
|
(10,625 |
) |
|
|
(301,729 |
) |
|
Net gain (loss) |
$ |
32,731 |
|
|
$ |
5,196 |
|
|
$ |
(283,012 |
) |
The Company monitors the performance and market value of its MBS portfolio on an ongoing basis, and on a quarterly basis reviews its MBS for impairment. At December 31, 2015 and 2014, the Company had the following securities in a loss position as presented in the following two tables:
|
|
As of December 31, 2015 |
|
|||||||||||||||||||||
|
|
Less than 12 Months |
|
|
Greater than 12 Months |
|
|
Total |
|
|||||||||||||||
|
|
Fair Market |
|
|
Unrealized |
|
|
Fair Market |
|
|
Unrealized |
|
|
Fair Market |
|
|
Unrealized |
|
||||||
|
|
Value |
|
|
Loss |
|
|
Value |
|
|
Loss |
|
|
Value |
|
|
Loss |
|
||||||
|
Fannie Mae Certificates |
|
|
|
|
|
|
|
|
|
|
|
|
|
|
|
|
|
|
|
|
|
|
|
|
ARMs |
|
1,712,043 |
|
|
$ |
(7,922 |
) |
|
$ |
511,884 |
|
|
$ |
(6,542 |
) |
|
$ |
2,223,927 |
|
|
$ |
(14,464 |
) |
|
Fixed-Rate |
|
997,310 |
|
|
|
(8,148 |
) |
|
|
- |
|
|
|
- |
|
|
|
997,310 |
|
|
|
(8,148 |
) |
|
Freddie Mac Certificates |
|
|
|
|
|
|
|
|
|
|
|
|
|
|
|
|
|
|
|
|
|
|
|
|
ARMs |
|
1,814,773 |
|
|
|
(9,246 |
) |
|
|
861,198 |
|
|
|
(13,306 |
) |
|
|
2,675,971 |
|
|
|
(22,552 |
) |
|
Fixed-Rate |
|
- |
|
|
|
- |
|
|
|
- |
|
|
|
- |
|
|
|
- |
|
|
|
- |
|
|
Total temporarily impaired securities |
$ |
4,524,126 |
|
|
$ |
(25,316 |
) |
|
$ |
1,373,082 |
|
|
$ |
(19,848 |
) |
|
$ |
5,897,208 |
|
|
$ |
(45,164 |
) |
|
Number of securities in an unrealized loss position |
|
|
|
|
|
223 |
|
|
|
|
|
|
|
52 |
|
|
|
|
|
|
|
275 |
|
F-17
|
|
As of December 31, 2014 |
|
|||||||||||||||||||||
|
|
Less than 12 Months |
|
|
Greater than 12 Months |
|
|
Total |
|
|||||||||||||||
|
|
Fair Market |
|
|
Unrealized |
|
|
Fair Market |
|
|
Unrealized |
|
|
Fair Market |
|
|
Unrealized |
|
||||||
|
|
Value |
|
|
Loss |
|
|
Value |
|
|
Loss |
|
|
Value |
|
|
Loss |
|
||||||
|
Fannie Mae Certificates |
|
|
|
|
|
|
|
|
|
|
|
|
|
|
|
|
|
|
|
|
|
|
|
|
ARMs |
$ |
806,600 |
|
|
$ |
(1,240 |
) |
|
$ |
1,306,153 |
|
|
$ |
(12,497 |
) |
|
$ |
2,112,753 |
|
|
$ |
(13,737 |
) |
|
Fixed-Rate |
|
- |
|
|
|
- |
|
|
|
- |
|
|
|
- |
|
|
|
- |
|
|
|
- |
|
|
Freddie Mac Certificates |
|
|
|
|
|
|
|
|
|
|
|
|
|
|
|
|
|
|
|
|
|
|
|
|
ARMs |
|
498,994 |
|
|
|
(792 |
) |
|
|
1,737,760 |
|
|
|
(21,002 |
) |
|
|
2,236,754 |
|
|
|
(21,794 |
) |
|
Fixed-Rate |
|
- |
|
|
|
- |
|
|
|
- |
|
|
|
- |
|
|
|
- |
|
|
|
- |
|
|
Total temporarily impaired securities |
$ |
1,305,594 |
|
|
$ |
(2,032 |
) |
|
$ |
3,043,913 |
|
|
$ |
(33,499 |
) |
|
$ |
4,349,507 |
|
|
$ |
(35,531 |
) |
|
Number of securities in an unrealized loss position |
|
|
|
|
|
56 |
|
|
|
|
|
|
|
108 |
|
|
|
|
|
|
|
164 |
|
The Company did not make the decision to sell the above securities as of December 31, 2015 and 2014, nor was it deemed more likely than not the Company would be required to sell these securities before recovery of their amortized cost basis. The unrealized losses on the above securities are the result of market interest rates and are not considered to be credit related. The Company recognized an other-than-temporary impairment of $8,102 as of September 30, 2013 on three securities the Company had decided to sell as of that date, prior to the recovery of their amortized cost. These securities were disposed of in early October 2013. There were no other impairment losses recognized during the three year period presented herein.
The contractual maturity of the Company’s MBS and agency CRT securities ranges from 15 to 30 years. Because of prepayments on the underlying mortgage loans, the actual weighted-average life is expected to be significantly less than the stated maturity. The following table presents certain information about the Company’s adjustable rate securities that will reprice or amortize based on contractual terms, which do not consider prepayment assumptions, at December 31, 2015 and 2014.
|
|
|
December 31, 2015 |
|
|
December 31, 2014 |
|
||||||||||||||||||
|
|
|
|
|
|
|
|
|
|
|
Weighted |
|
|
|
|
|
|
|
|
|
|
Weighted |
|
||
|
|
|
|
|
|
|
|
|
|
|
Average |
|
|
|
|
|
|
|
|
|
|
Average |
|
||
|
|
|
Fair Value |
|
|
% of Total |
|
|
Coupon |
|
|
Fair Value |
|
|
% of Total |
|
|
Coupon |
|
||||||
|
Wtd Average Months to Reset |
|
|
|
|
|
|
|
|
|
|
|
|
|
|
|
|
|
|
|
|
|
|
|
|
|
0 - 12 |
|
$ |
2,377,014 |
|
|
|
17.7 |
% |
|
|
2.84 |
% |
|
$ |
2,272,988 |
|
|
|
14.0 |
% |
|
|
3.02 |
% |
|
13 - 24 |
|
|
1,467,597 |
|
|
|
10.9 |
% |
|
|
2.69 |
% |
|
|
1,799,368 |
|
|
|
11.0 |
% |
|
|
2.97 |
% |
|
25 - 36 |
|
|
1,692,591 |
|
|
|
12.6 |
% |
|
|
2.87 |
% |
|
|
2,026,261 |
|
|
|
12.4 |
% |
|
|
2.73 |
% |
|
37 - 48 |
|
|
4,805,462 |
|
|
|
35.8 |
% |
|
|
2.50 |
% |
|
|
2,268,665 |
|
|
|
13.9 |
% |
|
|
2.89 |
% |
|
49 - 60 |
|
|
1,338,716 |
|
|
|
10.0 |
% |
|
|
2.43 |
% |
|
|
5,855,524 |
|
|
|
35.9 |
% |
|
|
2.52 |
% |
|
61 - 72 |
|
|
1,015,398 |
|
|
|
7.6 |
% |
|
|
2.95 |
% |
|
|
880,039 |
|
|
|
5.4 |
% |
|
|
2.52 |
% |
|
73 - 84 |
|
|
684,191 |
|
|
|
5.1 |
% |
|
|
2.73 |
% |
|
|
1,207,531 |
|
|
|
7.4 |
% |
|
|
2.98 |
% |
|
109 - 120 |
|
|
33,338 |
|
|
|
0.3 |
% |
|
|
2.85 |
% |
|
|
- |
|
|
|
- |
|
|
|
- |
|
|
Total ARMS and Agency CRTs |
|
$ |
13,414,307 |
|
|
|
100.0 |
% |
|
|
2.67 |
% |
|
$ |
16,310,376 |
|
|
|
100.0 |
% |
|
|
2.75 |
% |
The following table presents certain information about the Company’s fixed rate MBS that will reprice or amortize based on contractual terms, which do not consider prepayment assumptions, at December 31, 2015 and 2014.
|
|
|
December 31, 2015 |
|
|
December 31, 2014 |
|
||||||||||||||||||
|
|
|
|
|
|
|
|
|
|
|
Weighted |
|
|
|
|
|
|
|
|
|
|
Weighted |
|
||
|
|
|
|
|
|
|
|
|
|
|
Average |
|
|
|
|
|
|
|
|
|
|
Average |
|
||
|
Wtd Average Months to Maturity |
|
Fair Value |
|
|
% of Total |
|
|
Coupon |
|
|
Fair Value |
|
|
% of Total |
|
|
Coupon |
|
||||||
|
121-132 |
|
$ |
- |
|
|
|
- |
|
|
|
- |
|
|
$ |
73,814 |
|
|
|
5.8 |
% |
|
|
3.50 |
% |
|
133-144 |
|
|
- |
|
|
|
- |
|
|
|
- |
|
|
|
589,051 |
|
|
|
46.1 |
% |
|
|
3.50 |
% |
|
145-156 |
|
|
- |
|
|
|
- |
|
|
|
- |
|
|
|
613,769 |
|
|
|
48.1 |
% |
|
|
3.43 |
% |
|
349-360 |
|
|
997,310 |
|
|
|
100 |
% |
|
|
3.50 |
% |
|
|
- |
|
|
|
- |
|
|
|
- |
|
|
Total Fixed-Rate Securities |
|
$ |
997,310 |
|
|
|
100.0 |
% |
|
|
3.50 |
% |
|
$ |
1,276,634 |
|
|
|
100.0 |
% |
|
|
3.47 |
% |
F-18
|
6. |
Mortgage Loans |
The Company classifies its mortgage loans held for investment and mortgage loans held for investment in securitization trusts as Level 3 in the fair value hierarchy. Prices for these instruments are obtained from third party pricing providers which use significant unobservable inputs in their valuations. These valuations are prepared on an instrument-by-instrument basis and primarily use discounted cash flow models that include unobservable market data inputs including prepayment speeds, delinquency levels, and credit losses. Model valuations are then compared to external indicators such as market price quotations from market makers for similar instruments and recent transactions in the same or similar instruments. These valuations may also be discounted to reflect illiquidity and/or non-transferability, with the amount of such discount estimated by the third-party pricing provider in the absence of market information. The valuation of these mortgage loans requires significant judgment by the third-party pricing provider and management. Assumptions used by the third-party pricing provider due to lack of observable inputs may significantly impact the resulting fair value and therefore the Company’s financial statements. Management reviews the valuations received from the third-party pricing provider. As part of this review, prices are compared against other pricing along with internal valuation expertise to ensure assumptions and pricing is reasonable.
Mortgage Loans Held for Investment, at Fair Value
The Company purchases individual jumbo whole mortgage loans with the intention of securitizing them. These loans are considered held for investment because the Company expects to consolidate the securitization trusts and are accounted for under the fair value option. See Note 2 for further discussion. As of December 31, 2015, the unpaid principal balance and the fair value of the Company’s mortgage loans held for investment were $114,997 and $116,857, respectively. As of December 31, 2014, the unpaid principal balance and the fair value of the Company’s mortgage loans held for investment were $30,792 and $31,460, respectively. The following table provides the geographic distribution of mortgage loans held for investment at December 31, 2015 and December 31, 2014, based on the unpaid principal balance.
|
|
December 31, 2015 |
|
|
December 31, 2014 |
|
||
|
California |
|
68 |
% |
|
|
82 |
% |
|
Washington |
|
6 |
% |
|
|
2 |
% |
|
Texas |
|
5 |
% |
|
|
3 |
% |
|
Illinois |
|
3 |
% |
|
|
2 |
% |
|
All other |
|
18 |
% |
|
|
11 |
% |
|
Total |
|
100 |
% |
|
|
100 |
% |
The following table provides additional data on the Company’s mortgage loan portfolio at December 31, 2015 and 2014.
|
|
December 31, 2015 |
|
|
December 31, 2014 |
|
||||||
|
|
|
|
Portfolio |
|
|
|
|
Portfolio |
|
||
|
|
Portfolio Range |
|
Weighted Average |
|
|
Portfolio Range |
|
Weighted Average |
|
||
|
Unpaid principal balance |
$116 to $1,987 |
|
$ |
804 |
|
|
$447 to $1,332 |
|
$ |
790 |
|
|
Interest rate |
2.63% to 4.00% |
|
|
3.48% |
|
|
2.75% to 3.75% |
|
|
3.43% |
|
|
Maturity |
11/2044 to 2/2046 |
|
10/2045 |
|
|
6/2044 to 12/2044 |
|
9/2044 |
|
||
|
FICO score at loan origination |
701 to 811 |
|
763 |
|
|
705 to 813 |
|
762 |
|
||
|
Loan-to-value ratio at loan origination |
20% to 80% |
|
|
71% |
|
|
28% to 80% |
|
|
65% |
|
No loans were 90 days or more past due and none were on nonaccrual status at December 31, 2015 or December 31, 2014.
The following table presents the rollforward of mortgage loans held for investment for the periods presented. The Company did not invest in mortgage loans prior to 2014.
|
|
Twelve Months Ended December 31 |
|
|||||||||
|
|
2015 |
|
|
2014 |
|
|
2013 |
|
|||
|
Fair value, beginning of period |
$ |
31,460 |
|
|
$ |
- |
|
|
$ |
- |
|
|
Purchased |
|
357,996 |
|
|
|
31,463 |
|
|
|
- |
|
|
Repaid |
|
(42,286 |
) |
|
|
- |
|
|
|
- |
|
|
Sold to securitization trust |
|
(223,278 |
) |
|
|
- |
|
|
|
- |
|
|
Change in fair value |
|
(7,035 |
) |
|
|
(3 |
) |
|
|
- |
|
|
Fair value, end of period |
$ |
116,857 |
|
|
$ |
31,460 |
|
|
$ |
- |
|
F-19
None of the change in the fair value of the mortgage loans was attributable to changes in credit risk. The portion of the change in fair value included in the Company’s consolidated statements of income that were attributable to mortgage loan held for investment that were held at December 31, 2015 and 2014 was ($106) and ($3), respectively.
The following table provides information about the significant unobservable inputs used in the Level 3 valuation of the Company’s mortgage loans held for investment at December 31, 2015 and 2014.
|
|
|
December 31, 2015 |
|
December 31, 2014 |
||||||||||
|
|
|
|
|
Weighted- |
|
|
|
Weighted- |
||||||
|
Unobservable Input |
|
Range |
|
Average |
|
Range |
|
Average |
||||||
|
Discount rate |
|
3.0% - 3.5% |
|
|
3.3 |
% |
|
|
3.6% - 3.9% |
|
|
3.8 |
% |
|
|
Conditional refinance rate |
|
13.6% - 21.7% |
|
|
16.4 |
% |
|
|
12.4% - 19.3% |
|
|
15.3 |
% |
|
|
Default rate |
|
0% - 2.1% |
|
|
0.7 |
% |
|
|
0% - 1.5% |
|
|
0.4 |
% |
|
|
Loss severity |
|
10.5% - 22.2% |
|
|
14.9 |
% |
|
|
10.2% - 19.9% |
|
|
13.8 |
% |
|
A significant increase or decrease in any of the above unobservable inputs, in isolation, would likely result in a significantly lower or higher fair value measurement.
Mortgage Loans Held for Investment in Securitization Trusts, at Fair Value
As discussed in Notes 2 and 3, the Company consolidates a CFE that owns whole mortgage loans it purchased from a subsidiary of the Company. These securitized mortgage loans are legally isolated from the Company, are beyond the reach of the Company’s creditors, and may only be used to settle obligations of the CFE. These loans are carried at fair value as a result of a fair value option election. As of December 31, 2015, the unpaid principal balance and the fair value of the Company’s mortgage loans held for investment in securitization trusts was $223,205 and $226,908, respectively. The following table provides the geographic distribution of mortgage loans held for investment in securitization trusts at December 31, 2015 based on the unpaid principal balance.
|
|
December 31, 2015 |
|
|
|
California |
|
49 |
% |
|
Texas |
|
10 |
% |
|
Illinois |
|
6 |
% |
|
Washington |
|
5 |
% |
|
All other |
|
30 |
% |
|
Total |
|
100 |
% |
The following table provides additional data on mortgage loans held for investment in in securitization trusts at December 31, 2015.
|
|
December 31, 2015 |
|
|||
|
|
|
|
Portfolio |
|
|
|
|
Portfolio Range |
|
Weighted Average |
|
|
|
Unpaid principal balance |
$291 to $1,933 |
|
$ |
742 |
|
|
Interest rate |
2.50% to 4.13% |
|
|
3.38% |
|
|
Maturity |
6/2044 to 11/2045 |
|
3/2045 |
|
|
|
FICO score at loan origination |
700 to 815 |
|
769 |
|
|
|
Loan-to-value ratio at loan origination |
24% to 80% |
|
|
69% |
|
No loans were 90 days or more past due and none were on nonaccrual status at December 31, 2015.
The following table presents the rollforward of mortgage loans held for investment in securitization trusts for the period presented.
|
|
2015 |
|
|
|
Fair value, beginning of period |
$ |
- |
|
|
Purchased |
|
223,278 |
|
|
Repaid |
|
(1,822 |
) |
|
Change in fair value |
|
5,452 |
|
|
Fair value, end of period |
$ |
226,908 |
|
F-20
None of the change in the fair value of these mortgage loans was attributable to changes in credit risk. The portion of the change in fair value included in the Company’s consolidated statements of income that were attributable to mortgage loan held for investment in securitization trusts that were held at December 31, 2015 was ($1,079), adjusted for the effects of the transfer of these loans into the CFE.
The following table provides information about the significant unobservable inputs used in the Level 3 valuation of the Company’s mortgage loans held for investment in securitization trusts at December 31, 2015.
|
|
|
December 31, 2015 |
|||||
|
|
|
|
|
Weighted- |
|||
|
Unobservable Input |
|
Range |
|
Average |
|||
|
Discount rate |
|
2.2% - 3.6% |
|
|
3.3 |
% |
|
|
Conditional refinance rate |
|
0.0% - 21.3% |
|
|
16.4 |
% |
|
|
Default rate |
|
0.0% - 2.0% |
|
|
0.5 |
% |
|
|
Loss severity |
|
0.0% - 22.9% |
|
|
14.4 |
% |
|
Mortgage Loans Held for Sale, at Fair Value
The Company purchases individual whole mortgage loans with the intention of selling them to Ginnie Mae for inclusion in securitizations. As of December 31, 2015, the unpaid principal balance and the fair value of the Company’s mortgage loans held for sale were $16,629 and $17,542, respectively. The Company did not invest in mortgage loans held for sale prior to the acquisition of Pingora on August 31, 2015.
The Company classifies its mortgage loans held for sale as Level 2 in the fair value hierarchy. Prices for these instruments are obtained from third-party pricing providers and other applicable market data. If observable market prices are not available or insufficient to determine fair value due principally to illiquidity in the marketplace, then fair value is based upon cash flow models that are primarily based on observable market-based inputs but may also include unobservable market data inputs, including prepayment speeds, delinquency levels, and credit losses. No unobservable inputs were significant to the December 31, 2015 valuation.
|
7. |
Mortgage Servicing Rights |
In connection with its acquisition of Pingora, as discussed in Note 1, the Company entered agreements with PLS to begin investing in MSR during the third quarter of 2015. As discussed in Note 2, MSR are carried at fair value. The following table presents the rollforward of MSR for the year ended December 31, 2015.
|
Fair value, beginning of period |
$ |
- |
|
|
Purchases |
|
259,215 |
|
|
Change in fair value due to: |
|
|
|
|
Changes in valuation inputs or assumptions |
|
13,598 |
|
|
Other changes, including realization of cash flows |
|
(2,887 |
) |
|
Fair value, end of period |
$ |
269,926 |
|
The Company classifies its MSR as Level 3 in the fair value hierarchy. Prices for these instruments are obtained from internal models and third-party pricing providers, both of which use significant unobservable inputs in their valuations. These valuations are prepared on an instrument-by-instrument basis and primarily use discounted cash flow models that include unobservable market data inputs including prepayment rates, delinquency levels, and discount rates. Model valuations are then compared to external indicators such as market price quotations from market makers for similar instruments and recent transactions in the same or similar instruments. These valuations may also be discounted to reflect illiquidity and/or non-transferability, with the amount of such discount estimated by the third-party pricing provider in the absence of market information. The valuation of MSR requires significant judgment by management and the third-party pricing provider. Assumptions used for which there is a lack of observable inputs may significantly impact the resulting fair value and therefore the Company’s financial statements. Management reviews the valuations received from the third-party pricing provider and uses them as a point of comparison to its internally modeled values. As part of this review, prices are compared against other pricing indicators to ensure assumptions and pricing are reasonable.
F-21
The following table provides information about the significant unobservable inputs used in the Level 3 valuation of the Company’s MSR at December 31, 2015 and December 31, 2014.
|
|
|
December 31, 2015 |
|||||
|
|
|
|
|
Weighted- |
|||
|
Unobservable Input |
|
Range |
|
Average |
|||
|
Discount rate |
|
10%-15% |
|
|
10.4 |
% |
|
|
Prepayment rate |
|
5.6%-30.7% |
|
|
11.9 |
% |
|
|
Delinquency rate |
|
0%-6.03% |
|
|
1.4 |
% |
|
|
Annual cost to service |
|
$80-$101 |
|
$ |
88 |
|
|
The Company’s mortgage servicing income consisted of the following for the years ended December 31, 2015:
|
Servicing income |
$ |
19,897 |
|
|
Ancillary income |
|
214 |
|
|
Servicing income |
$ |
20,111 |
|
A decline in interest rates could lead to higher-than-expected prepayments of mortgages underlying the Company’s MSR, which would result in a decline in the value of the MSR. The Company’s investment in MBS mitigates the impact of such a decline on the Company’s total portfolio as a decline in interest rates generally leads to an increase in the value of the Company’s MBS.
|
8. |
Other Investments |
Other investments consisted of the following items as of December 31, 2015 and December 31, 2014:
|
|
December 31, 2015 |
|
|
December 31, 2014 |
|
||
|
Short-term investments |
$ |
30,327 |
|
|
$ |
20,252 |
|
|
Debt security, held-to-maturity |
|
15,000 |
|
|
|
15,000 |
|
|
Equity investments |
|
6,603 |
|
|
|
6,000 |
|
|
Total other investments |
$ |
51,930 |
|
|
$ |
41,252 |
|
The Company owns both a $15,000 debt security and a $6,000 equity investment in a non-public repurchase lending counterparty. The debt security matures on March 24, 2019. The Company has designated this debt security as a held-to-maturity investment, and as such it is carried at its cost basis. The debt security pays interest quarterly at the rate of 4.0% above the three-month London Interbank Offered Rate (“LIBOR”). The Company estimates the fair value of this debt security to be approximately $14,871 and $14,853 at December 31, 2015 and 2014, respectively, which was determined by calculating the present value of the projected future cash flows using a discount rate from a similar issuer and security (which represent Level 2 inputs). The Company accounts for the equity investment in the non-public repurchase lending counterparty under the cost method and concluded there have been no identified events or circumstance that would have a significant adverse effect on the fair value of the investment since the purchase date. As a member of the FHLB, the Company also has an equity investment of $603 in FHLB. The amount of investment required is partially dependent on the level of advances taken. This investment is accounted for under the cost method, because the stock can only be sold at its par value, and only to the FHLB.
|
9. |
Borrowings |
Repurchase Agreements
The Company uses repurchase agreements to finance purchases of securities. These repurchase agreements are collateralized by the Company’s securities and typically bear interest at rates that are closely related to LIBOR. At December 31, 2015 and 2014, the Company had repurchase indebtedness outstanding with 25 counterparties, with a weighted-average remaining contractual maturity of 0.9 and 1.0 months, respectively.
F-22
The following table presents the contractual maturity information regarding the Company’s repurchase agreements:
|
|
December 31, 2015 |
|
|
December 31, 2014 |
|
||||||||||
|
|
|
|
|
|
Weighted Average |
|
|
|
|
|
|
Weighted Average |
|
||
|
|
Balance |
|
|
Contractual Rate |
|
|
Balance |
|
|
Contractual Rate |
|
||||
|
Within 30 days |
$ |
12,693,883 |
|
|
|
0.64 |
% |
|
$ |
13,770,099 |
|
|
|
0.35 |
% |
|
30 days to 3 months |
|
- |
|
|
|
0.00 |
% |
|
|
1,489,732 |
|
|
|
0.36 |
% |
|
3 months to 36 months |
|
750,000 |
|
|
|
0.75 |
% |
|
|
500,000 |
|
|
|
0.53 |
% |
|
|
$ |
13,443,883 |
|
|
|
0.65 |
% |
|
$ |
15,759,831 |
|
|
|
0.36 |
% |
The fair value of securities, and accrued interest the Company had pledged under repurchase agreements at December 31, 2015 and 2014 was $14,072,647 and $16,575,106, respectively.
Warehouse Lines of Credit
Beginning in 2015, the Company has access to warehouse lines of credit with three financial institutions to finance purchases of whole mortgage loans. Borrowings under these facilities are charged interest at a specified margin over the one-month LIBOR interest rate. At December 31, 2015, the Company has outstanding borrowings with two counterparties totaling $60,096 with maturity dates between March 2016 and September 2016. The Company has pledged mortgage loans with a fair value of $67,685 as collateral pursuant to these lines of credit. The borrowing limit under these lines of credit is $300 million.
Federal Home Loan Bank Advances
As discussed in Note 2, during 2015, a subsidiary of the Company became a member of the FHLB. As of December 31, 2015, the Company had $14,132 in advances outstanding with the FHLB at a borrowing rate of 0.4% with a maturity date of January 2016. The advances are secured by the pledge of agency MBS with a fair value of $15,714. The Company’s aggregate borrowing capacity with the FHLB is $1 billion. Unused capacity may be adjusted at the sole discretion of the FHLB. The ability to borrow from the FHLB is subject to the Company’s continued creditworthiness, pledging of sufficient eligible collateral to secure advances, and compliance with certain covenants. Each advance requires approval by the FHLB and is secured by collateral in accordance with the FHLB’s credit and collateral guidelines, which the FHLB may revise from time to time. Based on the current status of recent FHFA rulemaking, the Company will need to surrender its membership in the FHLB in 2016.
Collateralized Borrowing in Securitization Trusts
As discussed in Notes 2 and 3, the Company consolidates a CFE that has issued MBS backed by mortgage loans. The portion of the CFE’s collateralized borrowings that is not eliminated in consolidation is carried at fair value as a result of a fair value option election. Investors in the collateralized borrowings issued by the CFE have recourse against the assets within the CFE, but have no recourse against the Company itself. As of December 31, 2015, the collateralized borrowings has an outstanding principal amount of $58,052 and a weighted-average interest rate of 2.75%. The final scheduled distribution date thereof is November 2045. The actual maturity of the collateralized borrowing is based on the principal repayments of the underlying mortgage loans. As a result, the actual maturity of the borrowing may be substantially sooner than the final scheduled distribution date.
|
10. |
Derivatives and Other Hedging Instruments |
In connection with the Company’s risk management strategy, the Company hedges a portion of its interest rate risk by entering into derivative contracts. The Company may enter into agreements for interest rate swaps, interest rate swaptions, interest rate cap or floor contracts and futures or forward contracts. The Company’s risk management strategy attempts to manage the overall risk of the portfolio, reduce fluctuations in book value and generate additional income distributable to shareholders. For additional information regarding the Company’s derivative instruments and its overall risk management strategy, please refer to the discussion of derivative instruments in Note 2.
F-23
The fair values of interest rate swaps are determined using the market standard methodology of netting the discounted future fixed cash receipts (or payments) and the discounted expected variable cash payments (or receipts). The variable cash payments (or receipts) are based on an expectation of future interest rates (forward curves) derived from observable market interest rate curves. The fair values of interest rate swaptions are based on the fair value of the underlying interest rate swaps that the Company has the option to enter, and are based on inputs from the counterparty and pricing models. The fair value of Futures Contracts is based on quoted prices from the exchange on which they trade. The fair value of MBS forward purchase commitments was determined using the same methodology as MBS as described in Note 5. The fair value of forward purchase commitments for whole loans was determined using the same methodologies as mortgage loans as described in Note 6. The Company applies fallout assumptions to the third-party pricing of forward purchase commitments regarding loans that the counterparties may not successfully issue. The table below presents the fair value of the Company’s derivative instruments as well as their classification on the consolidated balance sheets as of December 31, 2015 and 2014, respectively.
|
Derivative Instruments |
Balance Sheet Location |
December 31, 2015 |
|
|
December 31, 2014 |
|
||
|
|
|
|
|
|
|
|
|
|
|
Interest rate swaps and swaptions |
Derivative assets |
$ |
2,031 |
|
|
$ |
11,050 |
|
|
Futures contracts |
Derivative assets |
|
693 |
|
|
|
- |
|
|
Forward purchase commitments - MBS |
Derivative assets |
|
165 |
|
|
|
16,101 |
|
|
Forward purchase commitments - mortgage loans |
Derivative assets |
|
25 |
|
|
|
- |
|
|
|
|
$ |
2,914 |
|
|
$ |
27,151 |
|
|
|
|
|
|
|
|
|
|
|
|
|
|
|
|
|
|
|
|
|
|
Interest rate swaps |
Derivative liabilities |
$ |
6,802 |
|
|
$ |
42,052 |
|
|
Futures contracts |
Derivative liabilities |
|
286,058 |
|
|
|
202,501 |
|
|
Forward purchase commitments - MBS |
Derivative liabilities |
|
32,373 |
|
|
|
36 |
|
|
Forward purchase commitments - mortgage loans |
Derivative liabilities |
|
- |
|
|
|
2 |
|
|
|
|
$ |
325,233 |
|
|
$ |
244,591 |
|
Interest Rate Swaps and Swaptions
The Company finances its activities primarily through repurchase agreements, which are generally settled on a short-term basis, usually from one to three months. At each settlement date, the Company refinances each repurchase agreement at the market interest rate at that time. Since the Company is exposed to interest rates on its borrowings that change on a short-term basis, it enters into hedging agreements to mitigate the effect of these changes. Interest rate swaps involve the receipt of variable-rate amounts from a counterparty in exchange for the Company making fixed-rate payments over the life of the agreements without exchange of the underlying notional amount. The effect of these hedges is to synthetically lockup interest rates on a portion of the Company’s repurchase agreements for the terms of the interest rate swaps. Although the Company’s objective is to hedge the risk associated with changing repurchase agreement rates, the Company’s interest rate swaps are benchmark interest rate swaps which perform with reference to LIBOR. Therefore, the Company remains at risk to the variability of the spread between repurchase agreement rates and LIBOR interest rates.
Until September 30, 2013, the Company elected cash flow hedge accounting for its interest rate swaps. Under cash flow hedge accounting, effective hedge gains or losses are initially recorded in AOCI and subsequently reclassified into net income in the period that the hedged forecasted transaction affects earnings. Ineffective hedge gains and losses are recorded on a current basis in earnings. The hedge ineffectiveness is attributable primarily to differences in the reset dates on the Company’s interest rate swaps versus the refinancing dates of its repurchase agreements. See “Financial Statement Presentation” below for quantification of gains and losses on interest rate swaps for the three years ended December 31, 2015.
On September 30, 2013, the Company de-designated its interest rate swaps as cash flow hedges, thus terminating cash flow hedge accounting. As long as the forecasted rollovers of the related repurchase agreements are still expected to occur, amounts in AOCI related to the cash flow hedges through September 30, 2013 will remain in AOCI and will continue to be reclassified to interest expense as interest is accrued and paid on the related repurchase agreements. During the next 12 months, the Company estimates that an additional $1,864 will be reclassified out of AOCI as an increase to interest expense.
The Company continues to hedge its exposure to variability in future funding costs via interest rate swaps and other derivative instruments. As a result of discontinuing hedge accounting, beginning October 1, 2013, changes in the fair value of the Company’s interest rate swaps are recorded in “Loss on derivative instruments, net” in the consolidated statements of income, consistent with the
F-24
Company’s historical accounting for Futures Contracts, as described below. Monthly net cash settlements under the interest rate swaps are also recorded in “Loss on derivative instruments, net” beginning October 1, 2013.
The volume of activity for the Company’s interest rate swap instruments is shown in the table below.
|
|
Notional Value |
|
|||||
|
|
Years Ended December 31 |
|
|||||
|
|
2015 |
|
|
2014 |
|
||
|
Beginning of period |
$ |
8,300,000 |
|
|
$ |
10,500,000 |
|
|
Additions |
|
- |
|
|
|
- |
|
|
Expirations and terminations |
|
(3,700,000 |
) |
|
|
(2,200,000 |
) |
|
End of period |
$ |
4,600,000 |
|
|
$ |
8,300,000 |
|
During 2015, the Company terminated swaps with $1,400,000 of notional value for a payment of $5,210. The terminated swaps had original maturities extending through December 31, 2015.
Information regarding the Company’s interest rate swaps as of December 31, 2015 follows.
|
|
|
|
|
|
|
Wtd. Avg. |
|
|
|
|
|
|
|
|
|
|
|
|
|
Remaining |
|
|
Wtd. Avg. |
|
||
|
|
|
Notional |
|
|
Term |
|
|
Fixed Interest |
|
|||
|
Maturity |
|
Amount |
|
|
in Months |
|
|
Rate in Contract |
|
|||
|
|
|
|
|
|
|
|
|
|
|
|
|
|
|
12 months or less |
|
$ |
2,400,000 |
|
|
|
6 |
|
|
|
0.92% |
|
|
Over 12 months to 24 months |
|
|
1,800,000 |
|
|
|
17 |
|
|
|
0.89% |
|
|
Over 24 months to 36 months |
|
|
400,000 |
|
|
|
26 |
|
|
|
0.96% |
|
|
|
|
|
|
|
|
|
|
|
|
|
|
|
|
Total |
|
$ |
4,600,000 |
|
|
|
12 |
|
|
|
0.91% |
|
A swaption is a derivative instrument that gives the holder the option to enter into a pay-fixed interest rate swap in the future, if it so desires. As of December 31, 2015, the Company had six interest rate swaptions outstanding, all of which were entered into during 2015:
|
|
|
Options |
|
|
Underlying Swaps |
|
||||||||||||||||||||
|
Swaptions |
|
Original Cost |
|
|
Fair Value |
|
|
Wtd. Avg. Months to Expiration |
|
|
Notional |
|
|
Wtd. Avg. Fixed Pay Rate |
|
|
Receive Rate |
|
Wtd. Avg. Term (Years) |
|
||||||
|
Fixed payer |
|
$ |
10,813 |
|
|
$ |
727 |
|
|
|
6 |
|
|
$ |
3,065,000 |
|
|
|
3.23% |
|
|
3 month LIBOR |
|
|
6 |
|
As of December 31, 2014, the Company had four interest rate swaptions outstanding:
|
|
|
Options |
|
|
Underlying Swaps |
|
||||||||||||||||||||
|
Swaptions |
|
Original Cost |
|
|
Fair Value |
|
|
Wtd. Avg. Months to Expiration |
|
|
Notional |
|
|
Wtd. Avg. Fixed Pay Rate |
|
|
Receive Rate |
|
Wtd. Avg. Term (Years) |
|
||||||
|
Fixed payer |
|
$ |
20,080 |
|
|
$ |
4,561 |
|
|
|
6 |
|
|
$ |
992,300 |
|
|
|
2.74% |
|
|
3 month LIBOR |
|
|
7 |
|
During 2015, the Company terminated the swaptions held as of December 31, 2014 and received proceeds of $2,049
F-25
Eurodollar Futures Contracts
The Company uses Futures Contracts to 1) synthetically replicate an interest rate swap, or 2) offset the changes in value of its forward purchases of certain MBS and mortgage loans. The following tables present the composition of the Company’s Futures Contracts as of December 31, 2015 and 2014, respectively.
|
|
Fair Value |
|
|||||
|
|
December 31, 2015 |
|
|
December 31, 2014 |
|
||
|
Futures Contracts designed to replicate swaps |
$ |
(285,711 |
) |
|
$ |
(202,202 |
) |
|
Futures Contracts designed to hedge value changes in forward purchases |
|
346 |
|
|
|
(299 |
) |
|
Total fair value of Futures Contracts |
$ |
(285,365 |
) |
|
$ |
(202,501 |
) |
The volume of activity for the Company’s Futures Contracts is shown in the table below.
|
|
Number of Contracts |
|
|||||
|
|
Years Ended December 31 |
|
|||||
|
|
2015 |
|
|
2014 |
|
||
|
Beginning of period |
|
130,074 |
|
|
|
95,327 |
|
|
New positions opened |
|
55,494 |
|
|
|
136,610 |
|
|
Early settlements |
|
(41,813 |
) |
|
|
(93,053 |
) |
|
Settlements at maturity |
|
(34,931 |
) |
|
|
(8,810 |
) |
|
End of period |
|
108,824 |
|
|
|
130,074 |
|
Each Futures Contract embodies $1 million of notional value and corresponds to a Eurodollar contract for a specific three month timeframe. The effective dates of the Eurodollar contracts underlying the Company’s Futures Contracts range from 2015 through 2021.
The Company has not designated its Futures Contracts as hedges for accounting purposes. As a result, realized and unrealized changes in fair value thereon are recognized in net income in the period in which the changes occur. See “Financial Statement Presentation” below for quantification of gains and losses on Futures Contracts for the years ended December 31, 2015 and 2014.
To-Be-Announced Securities Purchases and Mortgage Loan Commitments
The Company purchases certain of its investment securities in the forward market. The Company purchases ARM TBA contracts and fixed-rate TBA contracts from dealers. ARM TBA contracts are not a frequently-traded security and are generally used to acquire MBS for the portfolio. Fixed-rate TBA contracts are a highly liquid security, and may be physically settled, net settled or traded as an investment. The Company also has commitments with various mortgage origination companies to purchase their production as it becomes securitized. Forward purchases do not qualify for trade date accounting and are considered derivatives for financial statement purposes, as described in Note 2. The net fair value of the forward commitment is reported on the balance sheet as an asset or liability. Whether the unrealized gain (or loss) recognized in net income or other comprehensive income depends on whether or not the commitment has been designated as an accounting hedge, as discussed in Note 2. Forward purchase commitments on ARMs are designated as all-in-one cash flow hedges and the related unrealized gain or loss is recorded in other comprehensive income. Unrealized gains and losses on forward purchase commitments on mortgage loans and fixed-rate TBA dollar roll securities are recorded in net income.
The following table summarizes the Company’s forward purchase commitments as of December 31, 2015.
|
|
Face / UPB |
|
|
Cost |
|
|
Fair Market Value |
|
|
Net Asset (Liability) |
|
||||
|
ARMs - originators |
$ |
145,246 |
|
|
$ |
147,749 |
|
|
$ |
147,914 |
|
|
$ |
165 |
|
|
Fixed-rate TBA dollar roll securities |
|
2,655,000 |
|
|
|
2,736,748 |
|
|
|
2,704,375 |
|
|
|
(32,373 |
) |
|
Whole mortgage loans |
|
26,523 |
|
|
|
26,700 |
|
|
|
26,725 |
|
|
|
25 |
|
|
Total purchase commitments |
$ |
2,826,769 |
|
|
$ |
2,911,197 |
|
|
$ |
2,879,014 |
|
|
$ |
(32,183 |
) |
F-26
The following table summarizes the Company’s forward purchase commitments as of December 31, 2014.
|
|
Face / UPB |
|
|
Cost |
|
|
Fair Market Value |
|
|
Net Asset (Liability) |
|
||||
|
ARMs - originators |
$ |
376,936 |
|
|
$ |
384,673 |
|
|
$ |
388,829 |
|
|
$ |
4,156 |
|
|
ARMs - dealers |
|
20,095 |
|
|
|
20,553 |
|
|
|
20,517 |
|
|
|
(36 |
) |
|
Fixed-rate TBA dollar roll securities |
|
3,400,000 |
|
|
|
3,509,871 |
|
|
|
3,521,816 |
|
|
|
11,945 |
|
|
Whole mortgage loans |
|
11,656 |
|
|
|
11,937 |
|
|
|
11,935 |
|
|
|
(2 |
) |
|
Total purchase commitments |
$ |
3,808,687 |
|
|
$ |
3,927,034 |
|
|
$ |
3,943,097 |
|
|
$ |
16,063 |
|
Financial Statement Presentation
The Company does not use either offsetting or netting to present any of its derivative assets or liabilities. The following table shows the gross amounts associated with the Company’s derivative financial instruments and the impact if netting were used as of December 31, 2015.
|
|
Assets/(Liabilities) |
|
|
Cash Collateral Posted (Held) |
|
|
Net Asset/(Liability) |
|
|||
|
Interest rate swaps |
$ |
1,304 |
|
|
$ |
- |
|
|
$ |
1,304 |
|
|
Interest rate swaptions |
|
727 |
|
|
|
(1,106 |
) |
|
|
(379 |
) |
|
Futures Contracts |
|
693 |
|
|
|
- |
|
|
|
693 |
|
|
Forward purchase commitments |
|
190 |
|
|
|
- |
|
|
|
190 |
|
|
|
|
|
|
|
|
|
|
|
|
|
|
|
Interest rate swaps |
$ |
(6,802 |
) |
|
$ |
14,626 |
|
|
$ |
7,824 |
|
|
Futures Contracts |
|
(286,058 |
) |
|
|
335,084 |
|
|
|
49,026 |
|
|
Forward purchase commitments |
|
(32,373 |
) |
|
|
25,687 |
|
|
|
(6,686 |
) |
The following table shows the gross amounts associated with the Company’s derivative financial instruments and the impact if netting were used as of December 31, 2014.
|
|
Assets/(Liabilities) |
|
|
Cash Collateral Posted (Held) |
|
|
Net Asset/(Liability) |
|
|||
|
Interest rate swaps |
$ |
6,489 |
|
|
$ |
- |
|
|
$ |
6,489 |
|
|
Interest rate swaptions |
|
4,561 |
|
|
|
(1,558 |
) |
|
|
3,003 |
|
|
Futures Contracts |
|
- |
|
|
|
- |
|
|
|
- |
|
|
Forward purchase commitments |
|
16,101 |
|
|
|
- |
|
|
|
16,101 |
|
|
|
|
|
|
|
|
|
|
|
|
|
|
|
Interest rate swaps |
$ |
(42,052 |
) |
|
$ |
66,653 |
|
|
$ |
24,601 |
|
|
Forward purchase commitments |
|
(38 |
) |
|
|
5,585 |
|
|
|
5,547 |
|
|
Futures Contracts |
|
(202,501 |
) |
|
|
251,553 |
|
|
|
49,052 |
|
F-27
The following table shows the components of “Loss on derivative instruments, net” for the three years ended December 31, 2015, 2014 and 2013. Impacts from the Company’s interest rate swaps subsequent to the September 30, 2013 hedge de-designation are included herein.
|
|
Years Ended December 31 |
|
|||||||||
|
|
2015 |
|
|
2014 |
|
|
2013 |
|
|||
|
Interest rate swaps – net realized and unrealized gains |
$ |
24,851 |
|
|
$ |
73,729 |
|
|
$ |
25,036 |
|
|
Interest rate swaptions – net realized and unrealized losses |
|
(12,597 |
) |
|
|
(15,520 |
) |
|
|
- |
|
|
Interest rate swaps – monthly net settlements |
|
(55,064 |
) |
|
|
(113,919 |
) |
|
|
(30,985 |
) |
|
Futures Contracts – fair value adjustments |
|
(82,864 |
) |
|
|
(176,916 |
) |
|
|
(25,585 |
) |
|
Futures Contracts – losses from maturities |
|
(48,120 |
) |
|
|
- |
|
|
|
- |
|
|
Futures Contracts – other realized losses |
|
(45,836 |
) |
|
|
(29,423 |
) |
|
|
(33,298 |
) |
|
Mortgage loan purchase commitments - fair value adjustments |
|
11 |
|
|
|
(2 |
) |
|
|
- |
|
|
TBA dollar roll income |
|
83,397 |
|
|
|
92,008 |
|
|
|
5,605 |
|
|
TBA dollar rolls - net realized and unrealized gains (losses) |
|
(52,194 |
) |
|
|
28,610 |
|
|
|
(10,488 |
) |
|
Net gain (loss) on derivative instruments |
$ |
(188,416 |
) |
|
$ |
(141,433 |
) |
|
$ |
(69,715 |
) |
See Note 2 for a discussion of TBA dollar roll transactions and TBA dollar roll income.
As discussed above, effective September 30, 2013, the Company discontinued cash flow hedge accounting for its interest rate swaps. The table below presents the effect of the interest rate swaps that were previously designated as cash flow hedges on the Company’s net income and other comprehensive income for the years ended December 31, 2015, 2014 and 2013.
|
|
Years Ended December 31 |
|
|||||||||
|
|
2015 |
|
|
2014 |
|
|
2013 |
|
|||
|
Amount of gain recognized in OCI (effective portion) |
$ |
- |
|
|
$ |
- |
|
|
$ |
15,030 |
|
|
Amount of loss reclassified from OCI into net |
|
(30,715 |
) |
|
|
(81,132 |
) |
|
|
(116,847 |
) |
|
Amount of loss recognized in net income as interest expense (ineffective portion) |
|
- |
|
|
|
- |
|
|
|
(205 |
) |
The following table presents the impact of the Company’s interest rate swap agreements on the Company’s AOCI for the years ended December 31, 2015, 2014 and 2013.
|
|
Years Ended December 31 |
|
|||||||||
|
|
2015 |
|
|
2014 |
|
|
2013 |
|
|||
|
Beginning balance |
$ |
(30,042 |
) |
|
$ |
(111,174 |
) |
|
$ |
(243,051 |
) |
|
Unrealized gain on interest rate swaps |
|
- |
|
|
|
- |
|
|
|
15,030 |
|
|
Reclassification of net losses included in income statement |
|
30,715 |
|
|
|
81,132 |
|
|
|
116,847 |
|
|
Ending balance |
$ |
673 |
|
|
$ |
(30,042 |
) |
|
$ |
(111,174 |
) |
Credit-risk-related Contingent Features
The Company has agreements with its interest rate swap and swaption counterparties that contain a provision where if the Company defaults on any of its indebtedness, including default where repayment of the indebtedness has not been accelerated by the lender, then the Company could also be declared in default on its derivative obligations.
The Company has agreements with certain of its derivative counterparties that contain a provision where if the Company’s GAAP shareholders’ equity declines by a specified percentage over a specified time period, or if the Company fails to maintain a minimum shareholders’ equity threshold, then the Company could be declared in default on its derivative obligations. The Company also has agreements with several of those counterparties that contain provisions regarding maximum leverage ratios. At December 31, 2015, the Company was in compliance with these requirements.
F-28
As of December 31, 2015, the fair value of derivatives in a net liability position related to these agreements was $6,802. The Company has collateral posting requirements with each of its counterparties and all interest rate swap agreements were fully collateralized as of December 31, 2015.
|
11. |
Capital Stock |
Issuance of Preferred Stock
The Company’s charter authorizes 25,000,000 shares of preferred stock, par value $0.001 per share. The board of directors has the authority to increase the authorized amounts, or to classify any unissued shares by setting or changing in any one or more respects the preferences, conversion or other rights, voting powers, restrictions, limitations as to dividends, qualifications or terms or conditions of redemption of such shares.
In 2012, the Company issued 11,500,000 shares (including 1,500,000 shares issued pursuant to the full exercise of the underwriters’ overallotment option) of its 7.625% Series A Cumulative Redeemable Preferred Stock (“Series A Preferred Stock”), with a par value of $0.001 per share and a liquidation preference of $25.00 per share (total liquidation preference of $287,500) plus accrued and unpaid dividends (whether or not declared). Holders of shares of the Series A Preferred Stock are entitled to cumulative cash dividends at the rate of 7.625% per year of the $25.00 liquidation preference per share (equivalent to the fixed annual rate of $1.90625 per share). The Company may not redeem the Series A Preferred Stock before August 27, 2017, except in limited circumstances relating to the Company’s ability to qualify as a REIT and except as described in the Company’s articles supplementary upon the occurrence of a change of control (as defined in the articles supplementary). After August 27, 2017, the shares are redeemable at the Company’s option. The Series A Preferred Stock ranks senior to the Company’s common stock with respect to dividend rights and rights upon the voluntary or involuntary liquidation, dissolution, or winding-up of the Company’s affairs. Holders of shares of the Series A Preferred stock generally have no voting rights, unless dividends are in arrears for six or more consecutive quarters. Through December 31, 2015, the Company has declared and paid all required quarterly dividends on the Series A Preferred Stock.
Stock Repurchase Program
On June 18, 2013, the Company’s board of directors authorized a stock repurchase program (the “Repurchase Program”) to acquire up to 10,000,000 shares of the Company’s common stock. For the years ended December 31, 2015 and 2014, the Company repurchased 1,443,283 and 100,000, respectively, of shares of common stock under the Repurchase Program in at-the-market transactions at a total cost of $20,753 and $1,912, respectively. As of December 31, 2015, there are 6,345,153 shares of repurchase capacity available under the Repurchase Program.
|
12. |
Earnings per Share |
The following table details the Company’s calculation of earnings per share for the three years ended December 31, 2015, 2014 and 2013:
|
|
2015 |
|
|
2014 |
|
|
2013 |
|
|||
|
Basic earnings per share: |
|
|
|
|
|
|
|
|
|
|
|
|
Net income (loss) |
$ |
51,620 |
|
|
$ |
56,361 |
|
|
$ |
(134,136 |
) |
|
Less preferred stock dividends |
|
(21,922 |
) |
|
|
(21,922 |
) |
|
|
(21,922 |
) |
|
Net income (loss) available to common shareholders |
$ |
29,698 |
|
|
$ |
34,439 |
|
|
$ |
(156,058 |
) |
|
|
|
|
|
|
|
|
|
|
|
|
|
|
Weighted average shares |
|
96,665,489 |
|
|
|
96,603,634 |
|
|
|
98,337,362 |
|
|
|
|
|
|
|
|
|
|
|
|
|
|
|
Basic earnings (loss) per share |
$ |
0.31 |
|
|
$ |
0.36 |
|
|
$ |
(1.59 |
) |
|
|
|
|
|
|
|
|
|
|
|
|
|
|
Diluted earnings per share: |
|
|
|
|
|
|
|
|
|
|
|
|
Net income (loss) |
$ |
51,620 |
|
|
$ |
56,361 |
|
|
$ |
(134,136 |
) |
|
Less preferred stock dividends |
|
(21,922 |
) |
|
|
(21,922 |
) |
|
|
(21,922 |
) |
|
Net income (loss) available to common shareholders |
$ |
29,698 |
|
|
$ |
34,439 |
|
|
$ |
(156,058 |
) |
|
|
|
|
|
|
|
|
|
|
|
|
|
|
Weighted average shares |
|
96,665,489 |
|
|
|
96,603,634 |
|
|
|
98,337,362 |
|
|
Potential dilutive shares from exercise of stock options |
|
- |
|
|
|
- |
|
|
|
- |
|
|
Diluted weighted average shares |
|
96,665,489 |
|
|
|
96,603,634 |
|
|
|
98,337,362 |
|
|
|
|
|
|
|
|
|
|
|
|
|
|
|
Diluted earnings (loss) per share |
$ |
0.31 |
|
|
$ |
0.36 |
|
|
$ |
(1.59 |
) |
F-29
There were no potentially dilutive shares for the three years ended December 31, 2015.
|
13. |
Equity Incentive Plans |
The Company’s shareholders approved the 2015 Equity Incentive Plan (the “2015 Plan”) at the 2015 annual meeting of shareholders held on May 6, 2015, which provides for the grant of awards to all employees, officers, directors and other individuals providing bona fide services to the Company, the Company’s manager, or any affiliate of the Company or its manager. Awards may consist of stock options (including incentive stock options qualifying under Code section 422 and nonstatutory stock options), stock appreciation rights, restricted stock awards, phantom stock, other stock-based awards, or any combination of the foregoing. The awards granted under the 2015 Plan typically vest over a period of five years from grant date. The 2015 Plan is administered by the compensation and governance committee or by any other committee appointed by the board of directors or, in the absence of such a committee, by the board of directors. At December 31, 2015, 1,176,333 awards relating to shares of common stock remained available for grant under the 2015 Plan. Unless previously terminated by the board of directors, awards may be granted under the 2015 Plan until the tenth anniversary of the date that the Company’s board of directors adopted such plan. Upon the approval of the 2015 Plan by the shareholders on May 6, 2015, the 2015 Plan replaced the 2010 Equity Incentive Plan (the “2010 Plan”). The Company will no longer make any grants under the 2010 Plan (although awards previously made under the 2010 Plan that are outstanding will remain in effect in accordance with the terms of that plan and the applicable award agreements).
Restricted Stock Awards
During the year ended December 31, 2015, the Company issued an aggregate of 19,383 shares of restricted common stock to independent directors of the Company under the 2010 Plan, an aggregate of 323,667 shares of restricted common stock to executive officers and employees of the Company and its manager under the 2015 Plan, and 102,462 shares of restricted common stock to certain employees of PAM as employment inducement awards in accordance with New York Stock Exchange standards. For the year ended December 31, 2015, the Company issued an aggregate of 445,512 shares of restricted common stock, including the 102,462 shares issued in conjunction with the Pingora acquisition, and recognized an expense of $408 related to the vesting of these shares. The outstanding share grants vest over a five year period. The fair market value of the shares granted was determined by the closing stock market price on the date of grant. The Company also recognized $3,848 of compensation expense in the current year related to restricted shares issued in prior years. At December 31, 2015, the Company had unrecorded compensation expense of $15,080 related to the unvested shares of restricted common stock granted. This expense is expected to be recognized over a weighted average remaining period of 3.8 years as of December 31, 2015. The following table presents information about the Company’s restricted stock awards for the periods presented:
|
|
2015 |
|
|
2014 |
|
||||||||||
|
|
|
|
|
|
Weighted |
|
|
|
|
|
|
Weighted |
|
||
|
|
Shares of |
|
|
Average |
|
|
Shares of |
|
|
Average |
|
||||
|
|
Restricted |
|
|
Price on |
|
|
Restricted |
|
|
Price on |
|
||||
|
|
Stock |
|
|
Grant Date |
|
|
Stock |
|
|
Grant Date |
|
||||
|
Shares non-vested at beginning of year |
|
653,291 |
|
|
$ |
21.37 |
|
|
|
542,248 |
|
|
$ |
23.22 |
|
|
Granted |
|
445,512 |
|
|
|
15.68 |
|
|
|
269,635 |
|
|
|
19.30 |
|
|
Cancelled/forfeited |
|
- |
|
|
|
- |
|
|
|
- |
|
|
|
- |
|
|
Vested |
|
(187,661 |
) |
|
|
22.77 |
|
|
|
(140,592 |
) |
|
|
24.32 |
|
|
Shares non-vested at end of year |
|
911,142 |
|
|
$ |
18.30 |
|
|
|
653,291 |
|
|
$ |
21.37 |
|
The total fair value of restricted stock awards vested during the years ended December 31, 2015, 2014 and 2013 were $2,961, $2,658 and $1,871, respectively, based upon the fair market value of the Company’s common stock on the vesting date.
14.Transactions with Related Parties
Management Fees
The Company is externally managed by ACA pursuant to a management agreement (the “Management Agreement”). All of the Company’s executive officers are also employees of ACA. ACA manages the Company’s day-to-day operations, subject to the direction and oversight of the Company’s board of directors which includes six independent directors. The Management Agreement expires on February 23, 2017 and is thereafter automatically renewed for an additional one-year term unless terminated under certain circumstances. ACA must be provided 180 days prior notice of any such termination and will be paid a termination fee equal to four times the average
F-30
annual management fee earned by ACA during the two year period immediately preceding termination, calculated as of the end of the most recently completed fiscal quarter prior to the date of termination.
Under the terms of the Management Agreement, the Company reimburses ACA for certain operating expenses of the Company that are borne by ACA. ACA is entitled to receive a management fee payable monthly in arrears in an amount equal to 1/12th of an amount determined as follows:
|
|
· |
for the Company’s equity up to $250 million, 1.50% (per annum) of equity; plus |
|
|
· |
for the Company’s equity in excess of $250 million and up to $500 million, 1.10% (per annum) of equity; plus |
|
|
· |
for the Company’s equity in excess of $500 million and up to $750 million, 0.80% (per annum) of equity; plus |
|
|
· |
for the Company’s equity in excess of $750 million, 0.50% (per annum) of equity. |
For purposes of calculating the management fee, equity is defined as the value, computed in accordance with GAAP, of shareholders’ equity, adjusted to exclude the effects of unrealized gains or losses. The following table presents amounts incurred for management fee, reimbursable expenses and share-based compensation expense related to the restricted common shares granted to management.
|
|
Years Ended December 31 |
|
|||||||||
|
|
2015 |
|
|
2014 |
|
|
2013 |
|
|||
|
Management fee |
$ |
16,235 |
|
|
$ |
16,532 |
|
|
$ |
18,180 |
|
|
Reimbursable expenses |
|
5,110 |
|
|
|
4,239 |
|
|
|
3,200 |
|
|
Total |
$ |
21,345 |
|
|
$ |
20,771 |
|
|
$ |
21,380 |
|
|
|
|
|
|
|
|
|
|
|
|
|
|
|
Share-based compensation |
$ |
4,256 |
|
|
$ |
3,612 |
|
|
$ |
2,594 |
|
None of the reimbursement payments were specifically attributable to the compensation of the Company’s executive officers. Reimbursable expenses above includes rent paid by ACA for the Company’s office space. As of October 2014, the Company’s office space is rented from a real estate partnership in which some of the Company’s executive officers have a financial interest, at an annual rate of approximately $300. At December 31, 2015 and 2014, the Company owed ACA $3,063 and $3,198, respectively, for the management fee and reimbursable expenses, which is included in other liabilities.
|
15. |
Accumulated Other Comprehensive Income |
The Company records unrealized gains and losses on its MBS and its forward purchase commitments securities as described in Note 5 and Note 10. As discussed in Note 10, the Company ceased hedge accounting for its interest rate swaps effective September 30, 2013. Beginning October 1, 2013, changes in the fair value of interest rate swaps are recorded directly to net income. The cumulative unrealized loss on interest rate swaps in AOCI as of September 30, 2013 is being amortized to net income as the hedged forecasted transactions occur.
F-31
The following table rolls forward the components of AOCI, including reclassification adjustments, for the year ended December 31, 2015.
|
|
Unrealized gain/(loss) on available for sale MBS |
|
|
Unrealized gain/(loss) on unsettled MBS |
|
|
Unrealized gain/(loss) on other investments |
|
|
Unrealized gain/(loss) on derivative instruments |
|
|
Total |
|
|||||
|
|
|
|
|
|
|
|
|
|
|
|
|
|
|
|
|
|
|
|
|
|
Accumulated other comprehensive income (loss) at January 1, 2015 |
$ |
232,240 |
|
|
$ |
42 |
|
|
$ |
(595 |
) |
|
$ |
(25,922 |
) |
|
$ |
205,765 |
|
|
|
|
|
|
|
|
|
|
|
|
|
|
|
|
|
|
|
|
|
|
|
Other comprehensive income (loss) before reclassification |
|
(101,141 |
) |
|
|
875 |
|
|
|
48 |
|
|
|
8,275 |
|
|
|
(91,943 |
) |
|
|
|
|
|
|
|
|
|
|
|
|
|
|
|
|
|
|
|
|
|
|
Balance Sheet Reclassification: |
|
|
|
|
|
|
|
|
|
|
|
|
|
|
|
|
|
|
|
|
Amount reclassified to MBS available for sale |
|
- |
|
|
|
(918 |
) |
|
|
- |
|
|
|
(12,230 |
) |
|
|
(13,148 |
) |
|
|
|
|
|
|
|
|
|
|
|
|
|
|
|
|
|
|
|
|
|
|
Income Statement Reclassification: |
|
|
|
|
|
|
|
|
|
|
|
|
|
|
|
|
|
|
|
|
Amounts reclassified to net gain on the sale of MBS |
|
(32,731 |
) |
|
|
- |
|
|
|
- |
|
|
|
- |
|
|
|
(32,731 |
) |
|
Amounts reclassified to interest expense |
|
- |
|
|
|
- |
|
|
|
- |
|
|
|
30,715 |
|
|
|
30,715 |
|
|
|
|
|
|
|
|
|
|
|
|
|
|
|
|
|
|
|
|
|
|
|
Net current period other comprehensive income (loss) |
|
(133,872 |
) |
|
|
(43 |
) |
|
|
48 |
|
|
|
26,760 |
|
|
|
(107,107 |
) |
|
|
|
|
|
|
|
|
|
|
|
|
|
|
|
|
|
|
|
|
|
|
Accumulated other comprehensive income (loss) at December 31, 2015 |
$ |
98,368 |
|
|
$ |
(1 |
) |
|
$ |
(547 |
) |
|
$ |
838 |
|
|
$ |
98,658 |
|
F-32
The following table rolls forward the components of AOCI, including reclassification adjustments, for the year ended December 31, 2014.
|
|
Unrealized gain/(loss) on available for sale MBS |
|
|
Unrealized gain/(loss) on unsettled MBS |
|
|
Unrealized gain/(loss) on other investments |
|
|
Unrealized gain/(loss) on derivative instruments |
|
|
Total |
|
|||||
|
|
|
|
|
|
|
|
|
|
|
|
|
|
|
|
|
|
|
|
|
|
Accumulated other comprehensive income (loss) at January 1, 2014 |
$ |
109,490 |
|
|
$ |
- |
|
|
$ |
(627 |
) |
|
$ |
(116,915 |
) |
|
$ |
(8,052 |
) |
|
|
|
|
|
|
|
|
|
|
|
|
|
|
|
|
|
|
|
|
|
|
Other comprehensive income (loss) before reclassification |
|
127,946 |
|
|
|
558 |
|
|
|
32 |
|
|
|
11,789 |
|
|
|
140,325 |
|
|
|
|
|
|
|
|
|
|
|
|
|
|
|
|
|
|
|
|
|
|
|
Balance Sheet Reclassification: |
|
|
|
|
|
|
|
|
|
|
|
|
|
|
|
|
|
|
|
|
Amount reclassified to MBS available for sale |
|
- |
|
|
|
(516 |
) |
|
|
- |
|
|
|
(7,011 |
) |
|
|
(7,527 |
) |
|
|
|
|
|
|
|
|
|
|
|
|
|
|
|
|
|
|
|
|
|
|
Income Statement Reclassification: |
|
|
|
|
|
|
|
|
|
|
|
|
|
|
|
|
|
|
|
|
Amounts reclassified to net gain on the sale of MBS |
|
(5,196 |
) |
|
|
- |
|
|
|
- |
|
|
|
- |
|
|
|
(5,196 |
) |
|
Amounts reclassified for termination of all- in-one cash flow hedge accounting on dollar roll TBAs |
|
- |
|
|
|
- |
|
|
|
- |
|
|
|
5,083 |
|
|
|
5,083 |
|
|
Amounts reclassified to interest expense |
|
- |
|
|
|
- |
|
|
|
- |
|
|
|
81,132 |
|
|
|
81,132 |
|
|
|
|
|
|
|
|
|
|
|
|
|
|
|
|
|
|
|
|
|
|
|
Net current period other comprehensive income (loss) |
|
122,750 |
|
|
|
42 |
|
|
|
32 |
|
|
|
90,993 |
|
|
|
213,817 |
|
|
|
|
|
|
|
|
|
|
|
|
|
|
|
|
|
|
|
|
|
|
|
Accumulated other comprehensive income (loss) at December 31, 2014 |
$ |
232,240 |
|
|
$ |
42 |
|
|
$ |
(595 |
) |
|
$ |
(25,922 |
) |
|
$ |
205,765 |
|
F-33
The following table rolls forward the components of AOCI, including reclassification adjustments, for the year ended December 31, 2013.
|
|
Unrealized gain/(loss) on available for sale MBS |
|
|
Unrealized gain/(loss) on unsettled MBS |
|
|
Unrealized gain/(loss) on other investments |
|
|
Unrealized gain/(loss) on derivative instruments |
|
|
Total |
|
|||||
|
|
|
|
|
|
|
|
|
|
|
|
|
|
|
|
|
|
|
|
|
|
Accumulated other comprehensive income (loss) at January 1, 2013 |
$ |
499,343 |
|
|
$ |
1,217 |
|
|
$ |
(107 |
) |
|
$ |
(237,599 |
) |
|
$ |
262,854 |
|
|
|
|
|
|
|
|
|
|
|
|
|
|
|
|
|
|
|
|
|
|
|
Other comprehensive income (loss) before reclassification |
|
(680,967 |
) |
|
|
642 |
|
|
|
(520 |
) |
|
|
(21,054 |
) |
|
|
(701,899 |
) |
|
|
|
|
|
|
|
|
|
|
|
|
|
|
|
|
|
|
|
|
|
|
Balance Sheet Reclassification: |
|
|
|
|
|
|
|
|
|
|
|
|
|
|
|
|
|
|
|
|
Amount reclassified to MBS available for sale |
|
- |
|
|
|
(1,859 |
) |
|
|
- |
|
|
|
24,891 |
|
|
|
23,032 |
|
|
|
|
|
|
|
|
|
|
|
|
|
|
|
|
|
|
|
|
|
|
|
Income Statement Reclassification: |
|
|
|
|
|
|
|
|
|
|
|
|
|
|
|
|
|
|
|
|
Amounts reclassified to net loss on the sale of MBS |
|
283,012 |
|
|
|
- |
|
|
|
- |
|
|
|
- |
|
|
|
283,012 |
|
|
Amounts reclassified for impairment loss on mortgage-backed securities |
|
8,102 |
|
|
|
- |
|
|
|
- |
|
|
|
- |
|
|
|
8,102 |
|
|
Amounts reclassified to interest expense |
|
- |
|
|
|
- |
|
|
|
- |
|
|
|
116,847 |
|
|
|
116,847 |
|
|
|
|
|
|
|
|
|
|
|
|
|
|
|
|
|
|
|
|
|
|
|
Net current period other comprehensive income (loss) |
|
(389,853 |
) |
|
|
(1,217 |
) |
|
|
(520 |
) |
|
|
120,684 |
|
|
|
(270,906 |
) |
|
|
|
|
|
|
|
|
|
|
|
|
|
|
|
|
|
|
|
|
|
|
Accumulated other comprehensive income (loss) at December 31, 2013 |
$ |
109,490 |
|
|
$ |
- |
|
|
$ |
(627 |
) |
|
$ |
(116,915 |
) |
|
$ |
(8,052 |
) |
F-34
16.Summarized Quarterly Financial Results
The following is a presentation of the quarterly results of operations for the years ended December 31, 2015 and 2014.
|
|
For the Three Months Ended |
|
|||||||||||||
|
|
Dec. 31, |
|
|
Sept. 30, |
|
|
June 30, |
|
|
March 31, |
|
||||
|
|
2015 |
|
|
2015 |
|
|
2015 |
|
|
2015 |
|
||||
|
(Dollars in thousands, except share related amounts) |
(Unaudited) |
|
|
(Unaudited) |
|
|
(Unaudited) |
|
|
(Unaudited) |
|
||||
|
|
|
|
|
|
|
|
|
|
|
|
|
|
|
|
|
|
Interest income: |
|
|
|
|
|
|
|
|
|
|
|
|
|
|
|
|
Securities |
$ |
72,211 |
|
|
$ |
70,874 |
|
|
$ |
76,270 |
|
|
$ |
86,362 |
|
|
Mortgage loans |
|
2,168 |
|
|
|
1,786 |
|
|
|
1,088 |
|
|
|
467 |
|
|
Mortgage loans in securitization trusts |
|
446 |
|
|
|
- |
|
|
|
- |
|
|
|
- |
|
|
Short-term cash investments |
|
433 |
|
|
|
328 |
|
|
|
318 |
|
|
|
288 |
|
|
Total interest income |
|
75,258 |
|
|
|
72,988 |
|
|
|
77,676 |
|
|
|
87,117 |
|
|
|
|
|
|
|
|
|
|
|
|
|
|
|
|
|
|
|
Interest expense: |
|
|
|
|
|
|
|
|
|
|
|
|
|
|
|
|
Repurchase agreements |
|
18,724 |
|
|
|
20,956 |
|
|
|
23,750 |
|
|
|
27,314 |
|
|
Warehouse lines |
|
305 |
|
|
|
292 |
|
|
|
- |
|
|
|
- |
|
|
Collateralized borrowings in securitization trusts |
|
97 |
|
|
|
- |
|
|
|
- |
|
|
|
- |
|
|
Total interest expense |
|
19,126 |
|
|
|
21,248 |
|
|
|
23,750 |
|
|
|
27,314 |
|
|
|
|
|
|
|
|
|
|
|
|
|
|
|
|
|
|
|
Net interest margin |
|
56,132 |
|
|
|
51,740 |
|
|
|
53,926 |
|
|
|
59,803 |
|
|
|
|
|
|
|
|
|
|
|
|
|
|
|
|
|
|
|
Other income (loss): |
|
|
|
|
|
|
|
|
|
|
|
|
|
|
|
|
Servicing income |
|
15,549 |
|
|
|
4,562 |
|
|
|
- |
|
|
|
- |
|
|
Management fee income |
|
1,503 |
|
|
|
524 |
|
|
|
- |
|
|
|
- |
|
|
Net realized gain on sale of securities |
|
15,371 |
|
|
|
1,216 |
|
|
|
(309 |
) |
|
|
16,453 |
|
|
Net gain (loss) on mortgage loans |
|
(1,950 |
) |
|
|
1,361 |
|
|
|
(689 |
) |
|
|
244 |
|
|
Net gain on mortgage servicing rights |
|
11,250 |
|
|
|
(539 |
) |
|
|
- |
|
|
|
- |
|
|
Net gain (loss) on derivative instruments |
|
64,085 |
|
|
|
(130,301 |
) |
|
|
(19,415 |
) |
|
|
(102,785 |
) |
|
Net miscellaneous gains and losses |
|
1,686 |
|
|
|
(912 |
) |
|
|
- |
|
|
|
- |
|
|
Total other income (loss) |
|
107,494 |
|
|
|
(124,089 |
) |
|
|
(20,413 |
) |
|
|
(86,088 |
) |
|
|
|
|
|
|
|
|
|
|
|
|
|
|
|
|
|
|
Expenses: |
|
|
|
|
|
|
|
|
|
|
|
|
|
|
|
|
Management fee |
|
4,020 |
|
|
|
4,037 |
|
|
|
4,083 |
|
|
|
4,095 |
|
|
Share-based compensation |
|
1,211 |
|
|
|
966 |
|
|
|
1,034 |
|
|
|
1,045 |
|
|
Servicing expenses |
|
2,268 |
|
|
|
754 |
|
|
|
- |
|
|
|
- |
|
|
General and administrative |
|
9,163 |
|
|
|
5,786 |
|
|
|
3,840 |
|
|
|
3,110 |
|
|
Securitization deal costs |
|
1,473 |
|
|
|
- |
|
|
|
- |
|
|
|
- |
|
|
Total expenses |
|
18,135 |
|
|
|
11,543 |
|
|
|
8,957 |
|
|
|
8,250 |
|
|
|
|
|
|
|
|
|
|
|
|
|
|
|
|
|
|
|
Net income (loss) |
|
145,491 |
|
|
|
(83,892 |
) |
|
|
24,556 |
|
|
|
(34,535 |
) |
|
Dividends on preferred stock |
|
5,481 |
|
|
|
5,480 |
|
|
|
5,480 |
|
|
|
5,481 |
|
|
Net income (loss) available to common shareholders |
$ |
140,010 |
|
|
$ |
(89,372 |
) |
|
$ |
19,076 |
|
|
$ |
(40,016 |
) |
|
|
|
|
|
|
|
|
|
|
|
|
|
|
|
|
|
|
Earnings (loss) per share - common stock, basic |
$ |
1.45 |
|
|
$ |
(0.93 |
) |
|
$ |
0.20 |
|
|
$ |
(0.41 |
) |
|
Earnings (loss) per share - common stock, diluted |
$ |
1.45 |
|
|
$ |
(0.93 |
) |
|
$ |
0.20 |
|
|
$ |
(0.41 |
) |
|
|
|
|
|
|
|
|
|
|
|
|
|
|
|
|
|
|
Dividends per share of common stock |
$ |
0.45 |
|
|
$ |
0.45 |
|
|
$ |
0.50 |
|
|
$ |
0.50 |
|
|
|
|
|
|
|
|
|
|
|
|
|
|
|
|
|
|
|
Weighted average common shares outstanding, basic |
|
96,546,219 |
|
|
|
96,545,913 |
|
|
|
96,790,541 |
|
|
|
96,783,199 |
|
|
Weighted average common shares outstanding, diluted |
|
96,546,219 |
|
|
|
96,545,913 |
|
|
|
96,790,541 |
|
|
|
96,783,199 |
|
F-35
|
|
For the Three Months Ended |
|
|||||||||||||
|
|
Dec. 31, |
|
|
Sept. 30, |
|
|
June 30, |
|
|
March 31, |
|
||||
|
|
2014 |
|
|
2014 |
|
|
2014 |
|
|
2014 |
|
||||
|
(Dollars in thousands, except share related amounts) |
(Unaudited) |
|
|
(Unaudited) |
|
|
(Unaudited) |
|
|
(Unaudited) |
|
||||
|
|
|
|
|
|
|
|
|
|
|
|
|
|
|
|
|
|
Interest income: |
|
|
|
|
|
|
|
|
|
|
|
|
|
|
|
|
Securities |
$ |
87,702 |
|
|
$ |
80,969 |
|
|
$ |
89,458 |
|
|
$ |
96,307 |
|
|
Mortgage loans |
|
35 |
|
|
|
- |
|
|
|
- |
|
|
|
- |
|
|
Mortgage loans in securitization trusts |
|
- |
|
|
|
- |
|
|
|
- |
|
|
|
- |
|
|
Short-term cash investments |
|
324 |
|
|
|
330 |
|
|
|
347 |
|
|
|
282 |
|
|
Total interest income |
|
88,061 |
|
|
|
81,299 |
|
|
|
89,805 |
|
|
|
96,589 |
|
|
|
|
|
|
|
|
|
|
|
|
|
|
|
|
|
|
|
Interest expense: |
|
|
|
|
|
|
|
|
|
|
|
|
|
|
|
|
Repurchase agreements |
|
26,966 |
|
|
|
31,950 |
|
|
|
35,128 |
|
|
|
38,451 |
|
|
Warehouse lines |
|
- |
|
|
|
- |
|
|
|
- |
|
|
|
- |
|
|
Collateralized borrowings in securitization trusts |
|
- |
|
|
|
- |
|
|
|
- |
|
|
|
- |
|
|
Total interest expense |
|
26,966 |
|
|
|
31,950 |
|
|
|
35,128 |
|
|
|
38,451 |
|
|
|
|
|
|
|
|
|
|
|
|
|
|
|
|
|
|
|
Net interest margin |
|
61,095 |
|
|
|
49,349 |
|
|
|
54,677 |
|
|
|
58,138 |
|
|
|
|
|
|
|
|
|
|
|
|
|
|
|
|
|
|
|
Other income (loss): |
|
|
|
|
|
|
|
|
|
|
|
|
|
|
|
|
Servicing income |
|
- |
|
|
|
- |
|
|
|
- |
|
|
|
- |
|
|
Management fee income |
|
- |
|
|
|
- |
|
|
|
- |
|
|
|
- |
|
|
Net realized gain on sale of securities |
|
2,107 |
|
|
|
237 |
|
|
|
(4,584 |
) |
|
|
7,436 |
|
|
Net gain (loss) on mortgage loans |
|
8 |
|
|
|
- |
|
|
|
- |
|
|
|
- |
|
|
Net gain on mortgage servicing rights |
|
- |
|
|
|
- |
|
|
|
- |
|
|
|
- |
|
|
Net gain (loss) on derivative instruments |
|
(79,988 |
) |
|
|
35,430 |
|
|
|
(55,260 |
) |
|
|
(41,615 |
) |
|
Net miscellaneous gains and losses |
|
- |
|
|
|
- |
|
|
|
- |
|
|
|
- |
|
|
Total other income (loss) |
|
(77,873 |
) |
|
|
35,667 |
|
|
|
(59,844 |
) |
|
|
(34,179 |
) |
|
|
|
|
|
|
|
|
|
|
|
|
|
|
|
|
|
|
Expenses: |
|
|
|
|
|
|
|
|
|
|
|
|
|
|
|
|
Management fee |
|
4,112 |
|
|
|
4,122 |
|
|
|
4,144 |
|
|
|
4,154 |
|
|
Share-based compensation |
|
1,020 |
|
|
|
890 |
|
|
|
842 |
|
|
|
860 |
|
|
Servicing expenses |
|
- |
|
|
|
- |
|
|
|
- |
|
|
|
- |
|
|
General and administrative |
|
3,941 |
|
|
|
2,113 |
|
|
|
2,324 |
|
|
|
2,147 |
|
|
Securitization deal costs |
|
- |
|
|
|
- |
|
|
|
- |
|
|
|
- |
|
|
Total expenses |
|
9,073 |
|
|
|
7,125 |
|
|
|
7,310 |
|
|
|
7,161 |
|
|
|
|
|
|
|
|
|
|
|
|
|
|
|
|
|
|
|
Net income (loss) |
|
(25,851 |
) |
|
|
77,891 |
|
|
|
(12,477 |
) |
|
|
16,798 |
|
|
Dividends on preferred stock |
|
5,481 |
|
|
|
5,480 |
|
|
|
5,481 |
|
|
|
5,480 |
|
|
Net income (loss) available to common shareholders |
$ |
(31,332 |
) |
|
$ |
72,411 |
|
|
$ |
(17,958 |
) |
|
$ |
11,318 |
|
|
|
|
|
|
|
|
|
|
|
|
|
|
|
|
|
|
|
Earnings (loss) per share - common stock, basic |
$ |
(0.32 |
) |
|
$ |
0.75 |
|
|
$ |
(0.19 |
) |
|
$ |
0.12 |
|
|
Earnings (loss) per share - common stock, diluted |
$ |
(0.32 |
) |
|
$ |
0.75 |
|
|
$ |
(0.19 |
) |
|
$ |
0.12 |
|
|
|
|
|
|
|
|
|
|
|
|
|
|
|
|
|
|
|
Dividends per share of common stock |
$ |
0.50 |
|
|
$ |
0.50 |
|
|
$ |
0.50 |
|
|
$ |
0.50 |
|
|
|
|
|
|
|
|
|
|
|
|
|
|
|
|
|
|
|
Weighted average common shares outstanding, basic |
|
96,728,821 |
|
|
|
96,563,132 |
|
|
|
96,515,599 |
|
|
|
96,606,081 |
|
|
Weighted average common shares outstanding, diluted |
|
96,728,821 |
|
|
|
96,563,132 |
|
|
|
96,515,599 |
|
|
|
96,606,081 |
|
F-36
Report of Independent Registered Public Accounting Firm
The Board of Directors and Shareholders of Hatteras Financial Corp.
We have audited Hatteras Financial Corp.’s internal control over financial reporting as of December 31, 2015, based on criteria established in Internal Control—Integrated Framework issued by the Committee of Sponsoring Organizations of the Treadway Commission (2013 framework) (the COSO criteria). Hatteras Financial Corp.’s management is responsible for maintaining effective internal control over financial reporting, and for its assessment of the effectiveness of internal control over financial reporting included in the accompanying Management’s Report on Internal Control over Financial Reporting. Our responsibility is to express an opinion on the company’s internal control over financial reporting based on our audit.
We conducted our audit in accordance with the standards of the Public Company Accounting Oversight Board (United States). Those standards require that we plan and perform the audit to obtain reasonable assurance about whether effective internal control over financial reporting was maintained in all material respects. Our audit included obtaining an understanding of internal control over financial reporting, assessing the risk that a material weakness exists, testing and evaluating the design and operating effectiveness of internal control based on the assessed risk, and performing such other procedures as we considered necessary in the circumstances. We believe that our audit provides a reasonable basis for our opinion.
A company’s internal control over financial reporting is a process designed to provide reasonable assurance regarding the reliability of financial reporting and the preparation of financial statements for external purposes in accordance with generally accepted accounting principles. A company’s internal control over financial reporting includes those policies and procedures that (1) pertain to the maintenance of records that, in reasonable detail, accurately and fairly reflect the transactions and dispositions of the assets of the company; (2) provide reasonable assurance that transactions are recorded as necessary to permit preparation of financial statements in accordance with generally accepted accounting principles, and that receipts and expenditures of the company are being made only in accordance with authorizations of management and directors of the company; and (3) provide reasonable assurance regarding prevention or timely detection of unauthorized acquisition, use or disposition of the company’s assets that could have a material effect on the financial statements.
Because of its inherent limitations, internal control over financial reporting may not prevent or detect misstatements. Also, projections of any evaluation of effectiveness to future periods are subject to the risk that controls may become inadequate because of changes in conditions, or that the degree of compliance with the policies or procedures may deteriorate.
As indicated in the accompanying Management’s Report on Internal Control over Financial Reporting, management’s assessment of and conclusion on the effectiveness of internal control over financial reporting did not include the internal controls of Pingora Asset Management, LLC (“PAM”) and Pingora Loan Servicing, LLC (“PLS”, and together, “Pingora”), which is included in the 2015 consolidated financial statements of Hatteras Financial Corp. and constituted $340.7 million and $125.6 million of total assets and shareholders’ equity, respectively, as of December 31, 2015 and $23.6 million and $8.7 million of total other income and net income, respectively, for the year then ended. Our audit of internal control over financial reporting of Hatteras Financial Corp. also did not include an evaluation of the internal control over financial reporting of Pingora.
In our opinion, Hatteras Financial Corp. maintained, in all material respects, effective internal control over financial reporting as of December 31, 2015, based on the COSO criteria.
We also have audited, in accordance with the standards of the Public Company Accounting Oversight Board (United States), the consolidated balance sheets of Hatteras Financial Corp. as of December 31, 2015 and 2014, and the related consolidated statements of income, comprehensive income, shareholders' equity and cash flows for each of the three years in the period ended December 31, 2015 of Hatteras Financial Corp. and our report dated February 24, 2016 expressed an unqualified opinion thereon.
/s/ Ernst & Young LLP
February 24, 2016
Charlotte, North Carolina
F-37