Attached files
| file | filename |
|---|---|
| EX-23.1 - EXHIBIT 23.1 - PWC CONSENT - Gigamon Inc. | a231pwcconsent02242016.htm |
| EX-32.2 - EXHIBIT 32.2 - Gigamon Inc. | gimoex322201510-k.htm |
| EX-31.2 - EXHIBIT 31.2 - Gigamon Inc. | gimoex312201510-k.htm |
| EX-32.1 - EXHIBIT 32.1 - Gigamon Inc. | gimoex321201510-k.htm |
| EX-10.25 - EXHIBIT 10.25 - GCI - Gigamon Inc. | exhibit1025gci.htm |
| EX-31.1 - EXHIBIT 31.1 - Gigamon Inc. | gimoex311201510-k.htm |
UNITED STATES
SECURITIES AND EXCHANGE COMMISSION
Washington, D.C. 20549
FORM 10-K |
(Mark One)
ý | ANNUAL REPORT PURSUANT TO SECTION 13 OR 15(d) OF THE SECURITIES EXCHANGE ACT OF 1934 |
For the fiscal year ended December 26, 2015
OR
¨ | TRANSITION REPORT PURSUANT TO SECTION 13 OR 15(d) OF THE SECURITIES EXCHANGE ACT OF 1934 FOR THE TRANSITION PERIOD FROM TO |
Commission File Number 001-35957

Gigamon Inc. (Exact name of Registrant as specified in its Charter) |
Delaware | 26-3963351 | |
(State or other jurisdiction of incorporation or organization) | (I.R.S. Employer Identification No.) | |
3300 Olcott Street, Santa Clara, California | 95054 | |
(Address of principal executive offices) | (Zip Code) | |
Registrant’s telephone number, including area code: (408) 831-4000
Securities registered pursuant to Section 12(b) of the Act: Common Stock, Par Value $0.0001 Per Share; Common stock traded on the New York Stock Exchange LLC
Securities registered pursuant to Section 12(g) of the Act: None
Indicate by check mark if the Registrant is a well-known seasoned issuer, as defined in Rule 405 of the Securities Act. YES ý NO ¨
Indicate by check mark if the Registrant is not required to file reports pursuant to Section 13 or 15(d) of the Act. YES ¨ NO ý
Indicate by check mark whether the Registrant: (1) has filed all reports required to be filed by Section 13 or 15(d) of the Securities Exchange Act of 1934 during the preceding 12 months (or for such shorter period that the Registrant was required to file such reports), and (2) has been subject to such filing requirements for the past 90 days. YES ý NO ¨
Indicate by check mark whether the Registrant has submitted electronically and posted on its corporate Web site, if any, every Interactive Data File required to be submitted and posted pursuant to Rule 405 of Regulation S-T (§232.405 of this chapter) during the preceding 12 months (or for such shorter period that the Registrant was required to submit and post such files). YES ý NO ¨
Indicate by check mark if disclosure of delinquent filers pursuant to Item 405 of Regulation S-K (§229.405) is not contained herein, and will not be contained, to the best of Registrant’s knowledge, in definitive proxy or information statements incorporated by reference in Part III of this Form 10-K or any amendment to this Form 10-K. ¨
Indicate by check mark whether the Registrant is a large accelerated filer, an accelerated filer, a non-accelerated filer, or a smaller reporting company. See the definition of “large accelerated filer”, “accelerated filer”, and “smaller reporting company” in Rule 12b-2 of the Exchange Act. (Check one):
Large accelerated filer x | Accelerated filer ¨ | Non-accelerated filer ¨ | Smaller reporting company ¨ | |||
(Do not check if a smaller reporting company) | ||||||
Indicate by check mark whether the Registrant is a shell company (as defined in Rule 12b-2 of the Exchange Act). YES ¨ NO ý
The aggregate market value of the voting and non-voting common equity held by non-affiliates of the Registrant, based on the closing price of the shares of common stock on the New York Stock Exchange on June 27, 2015, was $988.1 million.
The number of shares of Registrant’s Common Stock outstanding as of February 15, 2016 was 34,452,344 shares.
Portions of the Registrant’s Definitive Proxy Statement relating to the Annual Meeting of Stockholders, which will be filed with the Securities and Exchange Commission no later than 120 days after the Registrant’s fiscal year ended on December 26, 2015, are incorporated by reference into Part III of this Annual Report.
Gigamon Inc.
TABLE OF CONTENTS
Page No. | ||
Item 1. | ||
Item 1A. | ||
Item 1B. | ||
Item 2. | ||
Item 3. | ||
Item 4. | ||
Item 5. | ||
Item 6. | ||
Item 7. | ||
Item 7A. | ||
Item 8. | ||
Item 9. | ||
Item 9A. | ||
Item 9B. | ||
Item 10. | ||
Item 11. | ||
Item 12. | ||
Item 13. | ||
Item 14. | ||
Item 15. | ||
PART I
SPECIAL NOTE REGARDING FORWARD-LOOKING STATEMENTS
This Annual Report on Form 10-K, including the sections titled “Business,” “Risk Factors” and “Management’s Discussion and Analysis of Financial Condition and Results of Operations,” contains forward-looking statements within the meaning of the federal securities laws, which statements involve substantial risks and uncertainties. Forward-looking statements generally relate to future events or our future financial or operating performance. In some cases you can identify forward-looking statements because they contain words such as “may,” “will,” “should,” “expects,” “plans,” “anticipates,” “could,” “intends,” “target,” “projects,” “contemplates,” “believes,” “estimates,” “predicts,” “potential” or “continue” or the negative of these words or other similar terms or expressions that concern our expectations, strategy, plans or intentions. Forward-looking statements contained in this Annual Report on Form 10-K include, but are not limited to, statements about:
• | our expectations regarding our results of operations and financial condition; |
• | anticipated trends and challenges in our business and in the markets in which we operate; |
• | the impact of seasonality on our business; |
• | our anticipated growth strategies; |
• | maintaining and expanding our end-user customer base and our relationships with our channel partners; |
• | our ability to anticipate market needs and develop new and enhanced products and services to meet those needs; |
• | our ability to manage the introduction of new products including products jointly developed with third party joint development and original design manufacturing partners and the effects of such new product introductions on our existing product portfolio; |
• | our sales cycles and the results of our sales efforts; |
• | our relationships with our third party manufacturers and suppliers; |
• | our management of inventory and backlog; |
• | the evolution of technology affecting our products, services and markets; |
• | our ability to retain and hire necessary employees and to staff our operations appropriately; |
• | our liquidity and working capital requirements; |
• | our need to obtain additional funding and our ability to obtain future funding on acceptable terms; |
• | our valuation allowance on deferred tax assets and the assumptions and estimates underpinning our determination; |
• | our ability to stay abreast of new or modified laws and regulations that currently apply or become applicable to our business both in the United States and internationally; and |
• | the estimates and estimate methodologies used in preparing our consolidated financial statements. |
We caution you that the foregoing list may not contain all of the forward-looking statements made in this Annual Report on Form 10-K.
You should not rely upon forward-looking statements as projections of future events. We have based the forward-looking statements contained in this Annual Report on Form 10-K primarily on our current expectations and projections about future events and trends that we believe may affect our business, financial condition, results of operations and prospects. The outcome of the events described in these forward-looking statements is subject to risks, uncertainties and other factors described in the section titled “Risk Factors” and elsewhere in this Annual Report on Form 10-K. Moreover, we operate in a very competitive and rapidly changing environment. New risks and uncertainties emerge from time to time, and it is not possible for us to predict all risks and uncertainties that could have an impact on the forward-looking statements contained in this Annual Report on Form 10-K. We cannot assure you that the results, events and circumstances reflected in the forward-looking statements will be achieved or occur, and actual results, events or circumstances could differ materially from those described in the forward-looking statements.
1
The forward-looking statements made in this Annual Report on Form 10-K relate only to events as of the date on which the statements are made. We undertake no obligation to update any forward-looking statements made in this Annual Report on Form 10-K to reflect events or circumstances after the date of this Annual Report on Form 10-K or to reflect new information or the occurrence of unanticipated events, except as required by law. We may not actually achieve the plans, intentions or expectations disclosed in our forward-looking statements and you should not place undue reliance on our forward-looking statements. Our forward-looking statements do not reflect the potential impact of any future acquisitions, mergers, dispositions, joint ventures or investments we may make.
GIGAMON®, Flow Mapping®, Visibility Fabric™, GigaSMART®, GigaSECURE® and GigaVUE® and all related trademarks, names and logos are the property of Gigamon Inc. in the United States and other countries. All rights reserved.
2
Item 1. Business
Overview
We have developed innovative solutions that deliver pervasive and dynamic intelligent visibility and control of traffic across networks. Our Visibility Fabric consists of a distributed system of nodes that enable an advanced level of visibility, modification, enhancement and control of network traffic. Our Visibility Fabric solution is comprised of data center and central office physical appliances, virtual nodes in virtualized or private cloud environments, and small form-factor remote site appliances that in combination enable pervasive visibility of network infrastructures. We believe our Visibility Fabric enables:
• | organizations to significantly improve their cyber-security posture by leveraging the power of network visibility to establish visibility within the perimeter of their IT infrastructure; |
• | mobile service providers to gain subscriber-aware visibility into their IT infrastructure enabling them to reduce operational costs, increase revenue generating opportunities and provide improved services for the subscribers; and |
• | IT departments to significantly increase the effectiveness, efficiency and performance of their network management, analysis and compliance tools. |
Our GigaSECURE Security Delivery Platform, which we announced in July 2015 leverages our Visibility Fabric to streamline security operations by providing comprehensive visibility across the network to a variety of security tools including those typically used by enterprises. Our solution enables security teams and IT personnel to gain advanced visibility into their IT infrastructure by dynamically forwarding selected traffic of interest from network, server and remote location infrastructure to security, management, analysis and compliance tools in a manner that is optimized for specific uses or functions. Given the inherent asymmetric relationship between the role of an attacker and a defender with respect to cyber-security, we believe that this visibility-centric security approach significantly reduces the window of threat exposure for an organization.
The GigaSECURE Security Delivery Platform approach enables the delivery of network "Data as a Service” concurrently for multiple security tools. Unlike current approaches that, at best, provide partial views into the network and virtualized infrastructure, our approach provides an expanded perspective into the threat detection, prevention and analysis tools used in organizations thereby empowering security teams to understand malicious and suspicious activity at different stages of an attacker's life cycle and protect the organization before serious damage is inflicted. The GigaSECURE Security Delivery Platform is comprised of six key building blocks:
• | Visibility Fabric nodes, deployed physically or virtually, that are distributed throughout the infrastructure to gain access to network traffic at key locations; |
• | a metadata (NetFlow/IPFIX) record generation engine to summarize network traffic into flow records for consumption by the tools; |
• | an SSL decryption engine that enables receivers to inspect SSL encrypted traffic for malware |
• | an Application Session Filtering engine that extracts entire application sessions containing specific patterns of interest to be delivered to the tools; |
• | an advanced set of capabilities that allows multiple security tools to be placed either inline with the network or out-of-band without compromising network availability; and |
• | a management and orchestration platform that exposes a rich set of application programmer interfaces (APIs) to facilitate tighter integration between the GigaSECURE Security Delivery Platform and network security tools. |
These optimizations enable network security tools to gain visibility into the flows of interest for each tool while providing a broad perspective across the entire organization.
Our patented Flow Mapping technology - that exists within the software on all of our appliances - identifies and directs incoming traffic to single or multiple tools based on user-defined rules that can be managed from a centralized management console. Our GigaSMART technology extends the value and intelligence of the Visibility Fabric by providing a range of software applications to modify, manipulate, transform, filter, correlate and sample network traffic.
Our Visibility Fabric is designed to help organizations optimize the reliability, performance and security of their physical and virtual network infrastructure, minimize capital investment in management, analysis, compliance and
3
security tools, reduce operating expenses and realize greater value from existing tools that are deployed throughout their networks.
Security, virtualization and cloud computing, software defined networking or "SDN", and network functions virtualization or "NFV" are fundamentally reshaping the way enterprises and service providers manage their infrastructure. As these forces combine to enable significant benefits to be realized from IT innovation, they also create major challenges in how enterprises and service providers design, operate, secure and manage their networks. For example, the increasing number of security breaches and continuing threats facing enterprises has significantly increased the need of security practitioners to obtain intelligent visibility to traffic flowing through networks. Empowered with such visibility, security architects can implement architectures that increase the effectiveness of the security appliances and strategies they deploy. Likewise, the disaggregation of hardware and software, as well as separation of control plane intelligence and packet forwarding in SDN and NFV models, enhances the need for visibility and control of network infrastructure without degrading network performance or reliability. As networks migrate to 10, 40 and 100 Gigabit speeds, traditional approaches to deploying operational tools are constrained by their limited throughput.
Together, these challenges have forced organizations to rethink traditional approaches that have created operational complexity without delivering either the desired intelligence or security in the management of network infrastructure.
Our solution is deployed by enterprise data center operators, private cloud administrators, Software-as-a-Service (SaaS) providers and service providers as a highly scalable infrastructure layer. Historically, our solution has typically operated “out of band,” or in parallel to, the production network that is supporting primary business activities, and facilitates the transmission of network traffic between the network infrastructure and one or more network management, analysis, compliance or security tools. In 2014, we launched a new product called GigaVUE-HC2, which has significantly expanded the ability of customers to deploy our solution "in-line". In an in-line deployment, the Visibility Fabric node is placed in the production network and enables intelligent distribution of traffic to multiple in-line and out-of-band tools concurrently.
In addition to meeting the security, monitoring and performance needs of modern IT organizations, our Visibility Fabric solution has been enhanced to provide mobile service providers with the ability to gain subscriber-aware visibility into their infrastructure. As 4G/LTE deployments gather momentum, mobile providers are grappling with the deluge of traffic flowing through their infrastructure and the corresponding costs of monitoring that infrastructure. Our solution allows service providers to correlate traffic to specific devices and subscribers as well as deliver them to the multiple tool sets used in a typical mobile provider. Additional optimizations, including sampling and filtering can be executed on their network traffic, enabling a mobile provider to significantly reduce the cost of monitoring their networks.
The Visibility Fabric is deployed using our GigaVUE family of products. GigaVUE products are both purpose-built physical appliances that are integrated with our custom software, and also an increasing breadth of software-only products. Our products enable our end-user customers to design Visibility Fabric architectures optimized for a range of scale and performance requirements from monitoring in virtualized server environments, and from 1 Gigabit appliances to multi-Terabit chassis-based solutions. The majority of our GigaVUE products are modular and extensible, enabling our Visibility Fabric to be deployed on any size network and to scale as the network grows.
We sell our products directly through our own sales force and indirectly through our channel partners. As of December 26, 2015, our end-user customers included 78 of the Fortune 100 and we had sold products to over 1,900 end-user customers across many vertical markets.
Our Solution
We offer both purpose-built physical appliances that are integrated with our custom software and a range of software-only products. They enable our end-user customers to design their security architecture using our Security Delivery Platform or Management and Performance visibility architectures using our Visibility Fabric that are optimized for a range of scale and performance requirements. The key benefits of our solution include:
• | Enhanced Network Security. Our GigaSECURE Security Delivery Platform is a key enabler for multi-tiered security architecture deployment. Our solution provides a common architecture for security administrators to obtain intelligent, non-obtrusive access to real-time network traffic and flow records anywhere in their infrastructure enabling them to identify security violations beyond perimeter defenses. We believe security operations and architects are increasingly adopting a "zero-trust" model in their approach to securing their networks, which will require an expanded scope of visibility within the enterprise perimeter in order to provide pervasive security. |
4
• | Providing Pervasive Visibility and Control. Our Visibility Fabric inspects and intelligently filters network traffic from concurrent traffic streams in accordance with a set of user-defined criteria before delivering the traffic to management, analysis, compliance and security tools. This provides IT organizations with pervasive visibility and intelligent control over how traffic from the network is selected, transformed and delivered to management, analysis, compliance and security tools, and what modification or manipulation of the traffic is required to improve the performance and efficiency of the management, analysis, compliance or security tools. |
• | Delivering Scalable, High-Throughput Capacity. Our Visibility Fabric provides increased visibility and intelligent traffic filtering without impeding the delivery of traffic to management, analysis, compliance or security tools. At the top end of our GigaVUE family of products, we offer modular chassis products that deliver multi-Terabit performance enabling the Visibility Fabric to effectively extend to networks of significant scale and performance requirements. |
• | Improving Network Efficiency and Economy. Our Visibility Fabric improves the longevity and associated return on investment of existing tools by both obviating their need to examine all network traffic and increasing their network coverage. Our solution reduces capital and operating costs by decreasing the necessary outlays associated with new or more advanced tools, limiting the infrastructure footprints in space-constrained data centers and curtailing the staff required to monitor and maintain such infrastructure. |
• | Enhancing Network Reliability. By reducing the need for tools to process non-relevant traffic, which can lead to discarded network traffic and as a result a compromised analysis, our solution increases the effectiveness of attached tools and the associated management of critical business processes running on production networks. In the majority of cases, and unlike many security and monitoring solutions, modifications to the configuration of the Visibility Fabric do not require network downtime while changes are implemented, helping organizations achieve or maintain 99.999% uptime. Specifically, when deployed inline, our solution enhances an organization's ability to rapidly manage upgrades of security appliances or add/remove security appliances for maintenance. |
• | Agility to Enable Rapid Response to Dynamic Change. Our solution significantly improves network flexibility by enabling static tools to connect to virtualized applications, dynamic infrastructure and mobile machines, which allows our end-user customers to efficiently and securely address their business needs. Our solution is designed to have full interoperability with a broad range of tools, allowing IT organizations maximum architectural flexibility in the design, modification and evolution of their infrastructure. |
• | Ease of Deployment and Use. We have designed our solution to be easy to install, configure and maintain. Our Visibility Fabric can be composed of a single appliance or multiple appliances controlled locally or remotely from a simple centralized interface, enabling our end-user customers to reduce management and maintenance of unmanned, or dark, data centers. |
• | Evolution to Next-Generation Infrastructure. As enterprises embark on initiatives to transition to next-generation infrastructure, they have a business imperative to maintain visibility through this evolution. Examples of such transitions include outsourcing to a private or public cloud for an enterprise, the migration to a highly virtualized infrastructure, or the adoption of SDN or NFV. Our solution provides the framework to allow organizations to monitor key performance indicators of interest to maintain visibility through and following such a transformation. |
• | Enhanced subscriber-aware visibility: Mobile service providers are increasingly faced with a deluge of data traffic in their networks and are grappling with the associated costs of monitoring their infrastructure. Our subscriber-aware visibility solution addresses this problem by using GTP (GPRS Tunneling Protocol) correlation to first reconstruct entire user sessions and then apply sampling and whitelisting techniques (as part of the “FlowVUE” GigaSMART application) to scale the traffic to match the capacity of the tools. |
5
Growth Strategy
Our goal is to continue to develop the nascent market for network traffic visibility solutions, enhance the functionality of both our GigaSECURE Security Delivery Platform and the Visibility Fabric products, extend our market leadership position and support the ongoing adoption of these solutions by enterprises and service providers. Key elements of our growth strategy include:
• | Solutions Development with Partners. We work closely with both solution integrators and ecosystem partners in order to realize the full benefits of our platforms and take these solutions to market with joint go-to-market activities and ready-to-implement solutions. As of December 26, 2015, we had active partnerships with over 60 solution integrators and ecosystem partners. |
• | Continuous Innovation. We intend to enhance the functionality and scalability of our Visibility Fabric to address new use cases, tool capabilities, deployment environments, performance levels and the drive for greater software definition of network infrastructure. We will continue to invest in our technology to maintain our competitive advantage and market leadership, and we will build on our consistent track record of technical innovation. In 2015, we announced the industry’s first Security Delivery Platform. We also introduced a new GigaSMART application (Application Session Filtering) tailored to extract entire application sessions of interest to security tools. We also introduced a new traffic visibility solution for OpenStack/KVM-powered clouds, which provides tenants and administrators extended traffic visibility into private and service provider cloud environments. |
• | Increase Awareness of Our Value Proposition. We believe awareness of the value proposition of our GigaSECURE Security Delivery Platform and its technological capabilities in the cyber-security market will help us grow our business and market opportunity. We plan to invest in our brand and develop awareness of the benefits of GigaSECURE by expanding our presence online and at major trade events, extending our relationship with key ecosystem partners, industry analysts and increasing investment in our channel-partner marketing efforts. |
• | Expand Our Relationships with Existing End-User Customers. We have over 1,900 end-user customers and intend to increase the depth of these existing relationships by offering new products that help them increase the value of their new and existing management, analysis, security and compliance tools, adopt virtualization and cloud technologies and efficiently secure and scale their infrastructure. |
• | Invest in our Global Distribution Network and Value Added Reseller partners. Our sales and marketing strategy consists of a hybrid, two-tier sales model that combines a high-touch direct sales force with fulfillment and incremental demand creation handled by active channel partners that distribute or resell our products. We will continue to invest in our sales and marketing strategy both domestically and internationally to further strengthen our existing relationships with channel partners and expand our network by adding new channel partners to target new end-user customers and broaden our reach. |
Technology
Our GigaSECURE Security Delivery Platform and Visibility Fabric solution combine purpose-built hardware with custom software that together provide an advanced level of network traffic intelligence. The traffic intelligence capabilities provide advanced controls for traffic selection, forwarding, manipulation, modification, de-duplication, SSL decryption, correlation, sampling and generation of flow records. We design physical appliances based upon a combination of commercially available hardware components, processing resources and storage devices. The vast majority of our intellectual property is found in our custom software that provides the full benefits of our solution. Centralized control across the Security Delivery Platform and Visibility Fabric is provided by GigaVUE-FM, our multi-node Visibility Fabric management system, or node-based management solution.
At the heart of the GigaSECURE Security Delivery Platform are physical or virtual Visibility Fabric nodes that are distributed throughout the infrastructure to gain access to traffic at key locations. The GigaSECURE Security Delivery Platform also features additional software and hardware elements that are specifically customized for security deployments.
We have developed our products to provide our end-user customers with a solution to not only meet the demands of today’s infrastructure, but also enable the evolution of infrastructure that embraces digital business and the adoption of cloud technologies. The core technology of our solution leverages the following primary elements:
6
• | Traffic Control. At the core of our Visibility Fabric is our patented traffic selection and filtering technology called Flow Mapping. Flow Mapping allows incoming traffic to be forwarded to single or multiple egress ports based on a set of user-defined map rules. Each map rule consists of a combination of packet selection criteria that can include certain protocol fields or packet “bit patterns” in ISO layer 2, 3 or 4 of the packet, and a required action to be performed on the packet. This allows the replication of traffic to a second destination, or egress port, even though the traffic has been selected and forwarded to another egress port. Actions can include the forwarding of the packet, across the Visibility Fabric, the duplication of the packet or, in some cases, the intentional discarding of the packet. The Visibility Fabric, and the associated appliances, can support many complex and concurrent maps that execute when ingress traffic is received into any port on the Visibility Fabric. One primary value of Flow Mapping is that it enables management and analysis tools that have lower packet processing capacity to monitor higher bandwidth network connections through the intelligent selection of traffic that is forwarded to the tool. For example, a 10 Gigabit network can be monitored by a collection of 1 Gigabit tools through the segregation of traffic based upon a range of criteria and forwarding of traffic to different tools depending on those criteria. |
We also offer additional traffic control technology with our GigaStream technology that provides a traffic-distribution capability enabling traffic to be spread across a number of egress ports based on an operator-selected distribution algorithm. Furthermore, an inter-site traffic ‘tunneling’ capability is available to allow traffic to be captured at a remote location, and then tunneled to a central location for analysis, inspection and/or monitoring.
• | Traffic Intelligence. Our GigaSMART technology extends the intelligence and value of our Visibility Fabric by allowing the intelligent modification of network packets, optimization of flows, identification and extraction of application sessions, and correlation of user sessions. A range of GigaSMART applications are available to perform these functions, including: |
◦ | Packet Slicing reduces the size of a packet by eliminating trailing packet components that are not relevant to the management, analysis, compliance or security tool. |
◦ | Source Port Labeling adds labels to network traffic to enable the easy identification of the associated ingress port. |
◦ | Masking allows for specific portions of the network packet to be replaced or modified, thus masking the contents from any tools or employees reviewing or analyzing the traffic. With the increasing focus and compliance demand for credit card and personal records to be protected, masking allows for sensitive data to be protected while still allowing for full analysis to be undertaken. |
◦ | Tunneling encapsulates and forwards network traffic to monitoring tools between networks on separate routed paths, enabling routing of traffic from ‘lights-out’ facilities to centralized monitoring locations. |
◦ | Header Stripping enables third party proprietary packet headers (such as Cisco FabricPath, VXLAN, GTP-U) to be removed from each individual packet for tools that are unable to interpret these format headers so that the network traffic can be appropriately processed by the tools. Furthermore, GigaSMART has the ability to replace removed headers with non-proprietary fields to enable subsequent analysis by network tools. |
◦ | Time stamping adds a precise time stamp to a packet, which is an essential traffic characteristic required for successful latency measurement and analysis, and together with ingress port labeling, allows a permanent record to be added to a packet as it arrives at a specific GigaVUE appliance in the Visibility Fabric, enabling deeper analysis by network tools. |
◦ | Adaptive Packet Filtering provides enhanced visibility into tunneled, encapsulated traffic flows such as those deployed in virtualized environments, using flexible pattern-matching regular expression filters to make routing decisions based on application-level packet content, and not just packet headers. |
◦ | Packet De-Duplication establishes a time window during which any duplicates of a packet that ingress the Visibility Fabric are discarded. By eliminating network traffic not relevant to the analysis being completed, an organization can significantly reduce wasted bandwidth, storage capacity and associated tool processing resources. |
7
◦ | GTP (GPRS Tunneling Protocol) Correlation correlates mobile subscriber sessions (control and data) to increase analytics accuracy, enable reliable accounting, billing and subscriber management, improve end user quality of experience, and proactively identify service-affecting issues in 3G/4G/LTE mobile service provider environments. |
◦ | FlowVUE provides flow-aware sampling of active subscriber devices to selectively reduce the volume of traffic delivered to monitoring and analytic tools without negatively impacting the quality of the resulting analysis. Network operators can use this application to enhance end-users’ quality of experience, optimize pricing strategies based on subscriber usage patterns and extend the life of existing tools. |
The following GigaSMART applications enable security and management tools connected to the GigaSECURE Security Delivery Platform to extract additional value:
◦ | NetFlow/IPFIX Generation improves both the performance of the production network, and the volume, quality and availability of accurate NetFlow data delivered to the tools, by offloading NetFlow Generation from the production network switches and routers and generating NetFlow data directly from the Fabric nodes. The higher compute capacity within our GigaSMART technology allows unsampled NetFlow records to be generated, increasing the fidelity, value and predictability of these records. Additional information elements (e.g. URL information from HTTP traffic or HTTP response codes) inserted into these records can be used by security tools to efficiently detect attacker "Command & Control" activity to determine whether a location has been compromised and is redirecting a user to a malicious website or if a server is simply unavailable because it is the target of a DoS/DDoS attack. |
◦ | SSL Decryption provides a decryption capability to security and operational tools that either cannot perform decryption or incur a severe performance penalty in doing so. Existing solutions that decrypt SSL traffic on tools are expensive and adversely impact performance. Offloading SSL Decryption not only allows the tool to return to full performance, but also eliminates the need to have multiple decryption licenses for multiple tools. By delivering SSL Decryption as a common capability in our Visibility Fabric to the connected monitoring and security tools, the overall efficiency, security and performance of the infrastructure can be maximized. |
◦ | Application Session Filtering provides a powerful filtering engine that identifies applications based on signatures or patterns that can appear across any part of the packet payload. Once identified, Application Session Filtering can be used to extract entire sessions corresponding to a specific application. Readily available scripts for popular applications can be used by administrators to accelerate implementation of Application Session Filtering. |
• | Visibility Fabric Performance. Our appliances are designed around a core of packet-forwarding hardware components. When forwarding traffic through the Visibility Fabric and depending upon the configuration, topology and requirements, network traffic can move from an ingress network port to an egress tool port at line rate through the hardware even when complex selection and filtering is applied during the transit process. Our GigaVUE products support packet ingress and egress at speeds of 10 Megabit, 100 Megabit, 1 Gigabit, 10 Gigabit, 40 Gigabit and 100 Gigabit concurrently, and the GigaVUE H Series has a back-plane design allowing concurrent traffic packet transfer from any line card to any other line card at multi-Terabit performance. Our GigaVUE products are designed with failover protection mechanisms that include dual power-supplies and dual fan trays, and our GigaVUE H Series utilizes back-to-front airflow to comply with data center cooling design requirements. |
• | Visibility Fabric Scalability. Our custom software, GigaVUE-OS, provides several "Fabric services" for the Visibility Fabric. One such Visibility Fabric service is a capability called clustering that allows multiple appliances in the Visibility Fabric to be combined to form a larger scale "logical unit" while maintaining line rate processing performance of traffic flowing through the Visibility Fabric. Traffic can enter at an ingress port on one of our appliances and be forwarded to one or more egress ports on the Visibility Fabric. Our software allows a master-subordinate control architecture to be configured, where one Visibility Fabric appliance is designated as the “master” and all other appliances assume the role of “subordinate.” The Visibility Fabric can be configured and managed by the operator through the “master” using GigaVUE-FM, our Visibility Fabric management system or our node-based management solution. This architecture assures the ability |
8
to add additional subordinates, or appliances, in order to scale the Visibility Fabric, without needing complex configuration changes.
• | Access and Reporting. Our Visibility Fabric provides granular access controls that can be applied to support compliance with applicable regulations such as the Sarbanes-Oxley Act of 2002 ("Sarbanes-Oxley Act"). Our solution enables network segmentation, segregation of duties imposed via role-based access control, auditing of network activities and the tracking of access rights and privileges associated with individual users. In addition, the Visibility Fabric management system GigaVUE-FM also provides several summarized and customizable dashboards that are useful for administrators to generate reports or a summary of traffic processed by the Visibility Fabric. The enhanced reporting enables administrators to visualize the most/least utilized network/tool ports and traffic maps across the Visibility Fabric, audit trail support for security compliance and the ability to export reports for offline review. |
• | Bypass Protection. The GigaSECURE Security Delivery Platform features a capability called “Inline Bypass” that simplifies the inline deployment of security tools. Network administrators are often resistant to deploy inline security tools because of performance and resiliency concerns. The bypass capability maximizes the performance of inline security tools by delivering only the traffic of interest. As an example, the performance of a Web Application Firewall would be maximized when it has to only process Web traffic instead of all network traffic. Additionally, the bypass capability incorporates heartbeat functions to continuously test the health of a connected inline tool and bypass a tool that is overloaded or has failed, thereby maximizing availability. |
Products
Our product portfolio enables customers to deploy an architecture that delivers pervasive and active visibility to traffic across their infrastructure. The product portfolio has several key components including a distributed set of physical and virtual Visibility Fabric nodes that collect and move traffic, GigaSMART software applications that provide traffic intelligence and a Visibility Fabric management software layer called GigaVUE-FM.
GigaVUE Visibility Fabric nodes are high-performance appliances that form the foundation of a distributed fabric. The Visibility Fabric nodes are modular and extensible for a range of scale and performance requirements from 1 Gigabit 1RU nodes to 2.4 Terabit chassis-based solutions.
In larger visibility infrastructures, these nodes are typically organized into an edge-core architecture. The core layer of visibility is characterized by scale and intelligence capabilities that are essential to operators as network traffic diversity, complexity and volume continues to increase. Typically, this function is provided by the GigaVUE H Series products which, when combined with the traffic intelligence and flow processing provided by GigaSMART, power the core of any visibility architecture. The edge layer is characterized by form factor (either physical or virtual) and provides the ‘reach’ of the management, monitoring and security instrumentation. This virtual edge layer in the visibility infrastructure is provided by the GigaVUE-VM family and the physical edge layer is provided by the GigaVUE-TA family. To further simplify the management of these edge-core layers, we offer the ability to “cluster” multiple nodes in the edge and core layers. Our proprietary “clustering” software allows all the traffic intelligence offered by a core node, including GigaSMART, to be extended to any port on the edge, even if the edge device does not natively have the resources required for such intelligence. This ability to mix-and-match multiple nodes allows flexible designs that maximize the reach of visibility without compromising the intelligence required for rich visibility.
The GigaVUE H Series was introduced in 2011 and utilizes a robust Linux-based operating platform called GigaVUE-OS that enables high-density, high-scale configurations. The series includes both large blade-based modular chassis products such as the GigaVUE-HC-2, GigaVUE-HD-4, and GigaVUE-HD-8, as well as fixed-configuration appliances such as the GigaVue-HB-1. Line cards in our modular systems come in multiple variants including a range of physical media (copper and fiber optic), a range of connection speeds from 10 Megabit to 100 Gigabit, and a GigaSMART processing blade. The H Series supports hundreds of network port connections and multiple appliances that can be clustered together creating a fabric containing thousands of network and tool connections. In 2013, we introduced the GigaVUE-HB1 platform, a small form-factor Visibility Fabric node that extends traffic visibility to more remote portions of the network and provides the Visibility Fabric solution to smaller environments, including mid-size enterprises and branch locations.
In 2014, we expanded the GigaVUE H Series portfolio with the addition of the GigaVUE-HC2 product. The GigaVUE-HC2 is a compact 2 RU modular appliance that has an attractive package of traffic intelligence powered by GigaSMART and all the Visibility Fabric services offered by GigaVUE-OS visibility software. Unlike our traditional visibility deployments that are typically deployed out-of-band, customers can purchase modules to enable this
9
appliance to be deployed in-line. The bypass protection is designed to support two-way traffic communications and allow traffic to be distributed to multiple inline security appliances. The GigaVUE-HC2 also features integrated (internal) TAP modules that consolidate access points for secure backplane connectivity. Internal TAP modules prevent unauthorized users from attaching local packet capture devices to capture or view traffic.
We provide customers with products that deliver visibility in a variety of form factors:
• | The GigaVUE-TA series forms the physical edge of the visibility infrastructure. The GigaVUE-TA-1 has a low profile 1RU design intended to be deployed at the top of rack or end of row in data centers with multiple low utilization links for aggregating traffic into H Series and G Series nodes. Although the GigaVUE-TA series appliances do not natively support GigaSMART functionality in the hardware, the clustering capability in the software allows the intelligence in the GigaVUE H Series appliances to be extended to ports on a GigaVUE-TA series. In 2015, we expanded the GigaVUE-TA Series with the introduction of GigaVUE-TA40, a 1RU traffic aggregation node optimized for high-density 40Gb networks. |
• | GigaVUE-VM forms the virtual edge of the visibility infrastructure and extends visibility within virtual networks and monitors traffic between virtual machines. The GigaVUE-VM resides within the virtualized server and is able to extract traffic that matches the filtering criteria and forward it to the physical Visibility Fabric for delivery to management, analysis and security tools. This software-only product provides intelligent selection, filtering and forwarding of traffic from within a server to an external GigaVUE appliance. GigaVUE-VM, together with GigaSMART applications such as Adaptive Packet Filtering and Header Stripping, provides visibility into network virtualization deployments powered by the latest VMware hypervisor solution, NSX, and enables VMware NSX customers to extend the value of their physical tools to virtual networks. GigaVUE-VM is sold as a licensed product, and customers can buy packs of 10, 50, 100, 250 and 1,000 licenses (where each license allows for the installation of one GigaVUE-VM instance). GigaVUE-VM supports VMware ESXi, VMware NSX and in 2015 was expanded to support OpenStack/KVM infrastructure. In 2015, in addition to OpenStack/KVM support we introduced Service Composer integration with VMware NSX. |
• | The GigaVUE-HB1 is a low cost, entry level visibility appliance that can extend traffic visibility to more remote portions of the network running critical applications where GigaSMART intelligence may be required. |
Our G-TAP series of TAPs provide non-intrusive access to physical traffic at various network interface speeds-1Gb (Copper or Fiber), 10Gb, 40Gb (including Cisco 40Gb BiDi) and 100Gb. Customers can deploy our G-TAP series products to provide economical connectivity between network traffic and the Visibility Fabric. In 2015, we introduced a new series of modular, high-density 10Gb/40Gb/100Gb TAPs called the G-TAP M Series to address the growing demand for high-density TAP deployments.
The GigaVUE G Series was introduced in 2005 and is the original series of visibility appliances introduced by Gigamon. The series is comprised of a range of purpose-built, small form-factor traffic visibility appliances. Each chassis is modular, providing support for optional line cards (port modules), TAP modules or advanced traffic intelligence blades (GigaSMART modules). Our G-SECURE products were introduced in 2011 and provide in-line packet distribution specifically designed for use with security-based tools such as Intrusion Prevention Systems, or IPS.
Together, the Visibility Fabric nodes provide traffic aggregation, filtering, replication, and traffic intelligence capabilities to optimize traffic for the tools that manage, analyze and secure the network. Changes can be made dynamically without impacting the production network so IT organizations can be agile and responsive to threats, events or anomalies on the network.
GigaVUE-FM is a software application that provides centralized management and a common policy framework for the Visibility Fabric or Security Delivery Platform deployments. GigaVUE-FM delivers a single pane-of-glass view of all the physical and virtual nodes across the Visibility Fabric, while also providing an easy-to-use wizard-based approach for configuring patented Flow Mapping and GigaSMART traffic policies.
In addition to centralized management and control, GigaVUE-FM features fabric-wide reporting, scheduling capabilities, backup and restore functions and enhanced monitoring capabilities to proactively monitor and troubleshoot hot spots in the visibility infrastructure. GigaVUE-FM is sold as a licensed product available at multiple tiers and can manage up to 250 discrete physical GigaVUE Visibility Fabric appliances.
10
To complement our Visibility Fabric nodes and software applications, we offer a range of supplemental components and accessories including modules, cables and transceivers. The transceivers are offered in a variety of form factors, including SFP, SFP+, QSFP+ and CFP.
Customer Support
We offer ongoing technical support with our hardware and software products, including those sold directly to our end-user customers and through our channel partners. Our primary support offering provides two-tiered support levels, including premium-level support coverage. Certain channel partners offer their own additional support services to the end-user customer and then rely on our support organization for more complex support requests. We offer our end-user customers ongoing maintenance services for both hardware and software, which enable them to receive ongoing software updates, bug fixes and repairs. These services are sold to end-user customers typically for one-year terms at the time of the initial product sale, and customers may choose to renew for successive annual or multi-year periods. We also provide end-user customers with expedited replacement for any defective hardware. All of our hardware products are sold with a limited 5-year warranty service. Our support personnel are based in Santa Clara, California, Bracknell, United Kingdom, and Hong Kong.
End-User Customers
As of December 26, 2015, we had over 1,900 end-user customers, including 78 of the Fortune 100. Our Visibility Fabric can be used in a broad range of applications and has been adopted across many vertical markets including finance, high-speed trading, insurance, healthcare, higher education, government, e-commerce, technology, telecom and service providers.
Sales and Marketing
We sell our products through our direct sales force and a network of channel partners. We do not grant a general right of return or any refund terms to our channel partners, except to two of our North American distributors that have stock rotation rights. For these distributors, we defer revenue recognition from product sales until sell-through to value-add resellers and/or end-user customers has occurred.
We market and sell our products through a hybrid sales model, which combines a high-touch sales organization and an overlay channel sales team that actively assists our extensive network of channel partners throughout the sales process. We also provide our channel partners with marketing assistance, technical training and support. Our direct sales teams are typically comprised of a combination of one or more field sales representatives and a systems engineer. These teams also have access to a pool of shared inside sales and telemarketing representatives. Each sales team is responsible for a geographical territory, has responsibility for a number of major direct end-user customer accounts or has assigned accounts in a specific vertical market.
Our demand generation activities are focused primarily on Fortune 1000 organizations, federal agencies, large service providers and large and mid-sized enterprises where we continue to see increased demand for our GigaSECURE Security Delivery Platform and our Visibility Fabric. We also focus on ongoing account management for existing end-user customers and the development of follow-on sales as our existing end-user customers continue to expand and enhance their network infrastructure, increasing their demand for our solution. The majority of our North American sales are fulfilled by two of our existing channel partners, Global Convergence, Inc., or GCI, formerly Interlink Communications Systems, Inc., and Arrow Enterprise Computing Solutions, Inc., or Arrow, which we engaged as a distributor in February 2013.
For fiscal 2015, 2014, and 2013, GCI accounted for 40%, 47%, and 52% of our revenue, respectively. For fiscal 2015 and 2014 Arrow accounted for 21% and 16% of our revenues, respectively. No other channel partner represented more than 10% of our revenue in 2013.
To access potential end-user customers worldwide, our direct sales force is distributed across our offices in the United States, Australia, Brazil, Canada, China, France, Germany, Hong Kong, Italy, India, Japan, Mexico, Russia, Singapore, South Korea, the United Kingdom, the United Arab Emirates, and through a localized presence in many other countries.
Our marketing strategy is focused on increasing the awareness of, and driving end-user customer demand for, our GigaSECURE Security Delivery Platform and our Visibility Fabric. We execute on this strategy by leveraging a combination of internal marketing professionals, external marketing agencies and a network of ecosystem and channel partners to effectively communicate the value proposition, differentiation and advantages of our solution, thereby generating qualified leads for our sales force and channel partners. We focus our resources on a variety of marketing vehicles, including trade shows, online advertising, content syndication, public relations, industry research, our website and collaborative relationships with technology vendors.
11
For additional information about revenue and assets by geographic region, refer to Note 12 to Consolidated Financial Statements included in Part II, Item 8 of this Annual Report on Form 10-K.
Backlog
Product backlog includes orders for products scheduled to be shipped within 90 days to customers with approved credit status, and is net of service revenue allocations and any rebates and discounts. Because of the generally short cycle between order and shipment and occasional customer changes in delivery schedules or cancellation of orders (which are made without significant penalty), we do not believe that our product backlog, as of any particular date, is necessarily indicative of actual product revenue for any future period. A significant portion of our product revenue comes from orders that are received and shipped in the same quarter. Our product backlog at December 26, 2015, the last day of fiscal 2015, was $8.4 million. Our product backlog as of December 27, 2014, the last day of fiscal 2014, was $12.2 million.
Technology Partners
We have ongoing non-exclusive relationships with a number of leading vendors of network management, analysis, compliance and security tools, including arrangements with Blue Coat Systems, Inc., Check Point Software Technologies Inc., Cisco Systems, Inc., CA, Inc., Dynatrace Corporation, Empirix Inc., ForeScout Technologies, Inc., Fortinet, Inc., FireEye, Inc., Imperva, Inc., LogRhythm, Inc., Palo Alto Networks, Inc., Plixer International, Inc., RSA (the Security Division of EMC Corporation), Riverbed Technology, Inc., Savvius, Inc., SevOne, Inc., SolarWinds Inc., Splunk Inc, VMware, Inc., and Viavi Solutions Inc., some of which include the joint development of use-case and reference architectures that enhance the performance and efficiency of the end-user customer’s infrastructure. We expect to continue adding more technology partners and to publish joint case studies with these partners following end-user deployment and approval. In addition to joint development of reference designs and case studies, we have undertaken various joint-marketing activities and events to drive interest and awareness of the combined solution as well as the power of visibility in our solution. As our solution helps optimize the efficiency of our tool partners’ management, analysis, compliance and security tools, we believe these vendors improve awareness at end-user customers of our solution and create new deployment opportunities.
Research and Development
We believe continued investment in research and development is critical to our business. Our research and development efforts focus on improving and enhancing our existing products and services, as well as developing new products, features and functionality. We believe that our custom software is critical to expanding our leadership position within the traffic visibility market. As a result, we devote the majority of our research and development resources to software development. Our engineering team has deep expertise in key areas related to our research and development efforts, including network security, network analysis and management technologies, virtualization, network protocol and Ethernet system design. We work closely with our end-user customers to understand their current and future needs and have designed a product development process that captures and integrates feedback from our end-user customers.
We believe the timely development of new products is essential to maintaining our competitive position. As of December 26, 2015, we had 171 employees in our research and development organization, with the majority located at our headquarters in California. We also test our products to certify and ensure interoperability with third party hardware and software products. We plan to prioritize and dedicate significant resources to these continued research and development efforts. Our research and development expenses were $49.6 million, or 22% of our revenue in fiscal 2015, $42.8 million, or 27% of our revenue, in fiscal 2014, and $42.1 million, or 30% of our revenue, in fiscal 2013. Stock-based compensation of $9.1 million, $8.1 million, and $11.5 million was included in our research and development expenses in fiscal 2015, 2014, and 2013, respectively. In fiscal 2013, our research and development expenses also included a $5.2 million expense related to our performance units which we recorded upon the completion of our initial public offering, or IPO, in June 2013.
Manufacturing and Suppliers
We outsource the manufacturing, systems assembly, testing and order fulfillment of our hardware products to third party contract manufacturers and original design manufacturers Jabil Circuit, Inc., or Jabil and Delta Networks International Ltd., or DNI. During fiscal 2015, we worked with Jabil to transition its manufacturing of our products from Jabil’s facilities in Santa Clara, California to Jabil’s facilities in Guadalajara, Mexico. In the assembly of our products, we utilize components from many suppliers. Whenever possible, we strive to have multiple sources for these components to ensure continuous supply. However, we have limited sources of supply for certain components that are technically unique or in high demand, and we have not entered into supply agreements with many of these suppliers. In such cases, we seek to maintain a close direct relationship with the suppliers to ensure
12
supply is adequate and that the components meet our quality requirements. In certain instances, we have entered into license agreements with sole-source suppliers, allowing us to incorporate certain of their components into our hardware products.
We entered into our updated manufacturing services agreement with Jabil in April 2015, pursuant to which Jabil manufactures, tests, configures, assembles, packages and ships our products. The initial term was one year, with the term automatically renewing for additional one-year terms, unless terminated by either party by giving at least six months written notice before the end of the then-current term. In addition, either party may terminate the agreement (i) for convenience upon nine months written notice by Jabil or six months written notice by us, (ii) for cause upon written notice of a material breach and if the other party does not cure such breach within 30 days of such notice, (iii) immediately upon the bankruptcy or insolvency of the other party, or (iv) upon a change of control of either party, subject to applicable notice periods.
Finally, we have entered into a license and services agreement with Tall Maple Systems, Inc., or Tall Maple, pursuant to which we have been granted a perpetual, non-exclusive, worldwide license to certain software code of Tall Maple which we integrate into the software component of our H Series products and which can be integrated into our other products and applications. In return, we paid Tall Maple a license fee. The agreement can only be terminated for cause upon written notice of a material breach and if the other party does not cure such breach within 30 days of such notice.
Competition
The markets in which we compete are highly competitive. We expect competition to intensify in the future as existing competitors bundle new and more competitive offerings with their existing products and services, and as new market entrants introduce new products into our markets.
We compete either directly or indirectly with certain Ethernet switch vendors, such as Cisco Systems, Inc., Brocade Communications Systems, Inc. and Arista Networks, Inc., and network management, analysis, compliance and security tool vendors that offer point solutions that address a portion of the issues that we solve. In the future, we expect to compete with new market entrants, which may include our joint-development partners or other current technology partners.
The principal competitive factors applicable to our products include:
•functionality and performance;
•price and total cost of ownership;
•ease of use;
•flexibility and scalability of deployment;
•brand awareness;
•product reliability and quality;
•interoperability with other products;
•the extent and speed of user adoption; and
•quality of service, support and fulfillment.
Although we believe that we compete favorably with respect to the above factors, we believe that other competitors will emerge that may have greater name recognition, longer operating histories, well-established relationships with end-user customers or channel partners in our markets, broader product portfolios and the ability to bundle competitive offerings with other products and services, larger intellectual property portfolios and substantially greater financial, technical, personnel and other resources than we have. We expect competition and competitive pressure, from both new and existing competitors, to increase in the future.
Intellectual Property
To protect our intellectual property, we rely primarily on patent, trademark, copyright and trade secret laws. As of December 26, 2015, we had 28 issued patents that expire between 2025 and 2033, 27 pending patent applications in the United States and two corresponding Patent Cooperation Treaty patent applications. The claims for which we have sought patent protection relate primarily to system architecture, traffic visibility technology, traffic control and management, and filtering technology we have developed. We also license software from third parties for integration into our products, including open source software and other commercially available software.
13
As part of our strategy to protect our proprietary technologies and our intellectual property rights from unauthorized parties that may attempt to copy aspects of our products or obtain and use our trade secrets or other confidential information, we generally enter into confidentiality agreements with our employees, consultants, channel partners and end-user customers, and generally limit access to and distribution of our proprietary information and proprietary technology.
Employees
As of December 26, 2015, we had 482 employees, including 171 in research and development, 225 in sales and marketing, 36 in manufacturing and support and 50 in general and administrative functions. None of our employees is represented by a labor union or is a party to any collective bargaining arrangement in connection with his or her employment with us. We have never experienced any work stoppages, and we consider our relations with our employees to be good.
Corporate Background and Information
Our business was founded in 2004 and originally operated by a California limited liability company, Gigamon Systems LLC. In January 2009, Gigamon Systems LLC contributed substantially all of its assets and certain of its liabilities to us in exchange for all of our common stock. In January 2010, entities affiliated with Highland Capital Partners invested in our company through the purchase of our preferred stock. On May 31, 2013, we converted from a Delaware limited liability company into a Delaware corporation and changed our name from Gigamon LLC to Gigamon Inc., pursuant to the LLC Conversion described in Note 8 of our notes to consolidated financial statements.
Our principal executive offices are located at 3300 Olcott Street, Santa Clara, California 95054, and our telephone number is (408) 831-4000. Our website address is www.gigamon.com. We make available our Annual Report on Form 10-K, Quarterly Reports on Form 10-Q, Current Reports on Form 8-K, and any amendments to those reports filed or furnished pursuant to Section 13(a) or 15(d) of the Securities Exchange Act of 1934, as amended, or the Exchange Act, on the Investor section of our website as soon as reasonably practicable after they are electronically filed with or furnished to the Securities and Exchange Commission, or the SEC. All such filings are available free of charge. Information contained on, or that can be accessed through, our website, does not constitute part of this Annual Report on Form 10-K and the inclusion of our website address in this Annual Report is an inactive textual reference only.
14
Item 1A. Risk Factors
Investing in our common stock involves a high degree of risk. You should carefully consider the risks and uncertainties described below, together with all of the other information in this Annual Report on Form 10-K, before making a decision to invest in our common stock. The risks and uncertainties described below may not be the only ones we face. If any of the risks actually occur, our business, financial condition, operating results and prospects could be materially and adversely affected. In that event, the trading price of our common stock could decline, and you could lose part or all of your investment.
Risks Related to Our Business
The network traffic visibility market is rapidly evolving and difficult to predict. If the network traffic visibility market does not evolve as we anticipate or if our target end-user customers do not adopt our Unified Visibility Fabric or our Security Delivery Platform, our sales will not grow as quickly as anticipated and our stock price could decline.
We are in a new, rapidly evolving category within the network infrastructure industry that focuses on providing organizations with enhanced visibility and control over their networks through the efficient collection and analysis of network traffic. As such, it is difficult to predict important market trends, including how large the network traffic visibility market will be, or when and what products end-user customers will adopt. For example, organizations that currently use traditional approaches may believe that these approaches already provide them with sufficient visibility and control to secure and manage their network traffic. Therefore, they may continue spending their network infrastructure budgets on these products and may not adopt our Unified Visibility Fabric or Security Delivery Platform in addition to or in lieu of such products.
If the market for network traffic visibility does not evolve in the way we anticipate, if organizations do not recognize the benefits of our solution or if we are unable to sell our family of products to end-user customers, or if we are not able to effectively expand into new or adjacent markets, then our revenue may not grow as expected or may decline, and our stock price could decline.
New or existing technologies that are perceived to address network traffic visibility or address the need for network traffic visibility in different ways could gain wide adoption and supplant our products, thereby weakening our sales and our financial results.
The introduction of products and services embodying new technologies could render our existing products obsolete or less attractive to end-user customers. Other network traffic visibility technologies exist and could be developed in the future, and our business could be materially negatively affected if such technologies are widely adopted. We may not be able to successfully anticipate or adapt to changing technology or customer requirements on a timely basis, or at all. If we fail to keep up with technological changes or to convince our end-user customers and potential end-user customers of the value of our solution even in light of new technologies, our business, operating results and financial condition could be materially and adversely affected.
If we are unable to introduce new products successfully and to make enhancements to existing products, our growth rates would likely decline and our business, operating results and competitive position could suffer.
Our continued success depends on our ability to identify and develop new products and to enhance and improve our existing products, and the acceptance of those products by our existing and target end-user customers. Our growth would likely be adversely affected if:
• | we fail to introduce these new products or product enhancements; |
• | our new products or product enhancements are not timely introduced or do not function as expected; |
• | we fail to successfully manage the transition to new products from the products they are replacing; |
• | we do not invest our development efforts in appropriate products or enhancements for markets in which we now compete and expect to compete; |
• | we fail to predict the demand for new products following their introduction to market; or |
• | these new products or enhancements do not attain market acceptance. |
We invest substantial amounts of time and resources in researching and developing new products and enhancing existing products by incorporating additional features, improving functionality and adding other improvements to meet end-user customers’ rapidly evolving demands in our highly competitive industry. Our
15
research and development expenses were $49.6 million, or 22% of our revenue in fiscal 2015, $42.8 million, or 27% of our revenue, in fiscal 2014, and $42.1 million, or 30% of our revenue, in fiscal 2013.
Our future plans contemplate significant investments in research and development and related product opportunities. In addition, we plan to increasingly use third party joint development and original design manufacturing partners for the development of future products in our road map. We believe that we must continue to dedicate a significant amount of resources to our research and development efforts and increase our investment in joint development relationships to maintain our competitive position. We have limited experience in joint development of products and our increasing use of third party joint development and original design manufacturers reduces our control over the design, as well as the timing and delivery, of products to the market. If we do not manage these joint design relationships successfully, future products may be delayed or the features and quality of the products may not meet our expectations or that of our customers. We have invested and continue to invest in our internal research and development capabilities and third party design and manufacturing relationships as well as our other internal research and development efforts without being certain that they will result in products that the market will accept or that will expand our share of those markets.
The introduction of new products or product enhancements may shorten the life cycle of our existing products, or replace sales of some of our current products, thereby offsetting the benefit of even a successful product introduction, and may cause end-user customers to defer purchasing our existing products in anticipation of the new products.
Failure to successfully introduce new products in our portfolio could harm our operating results by decreasing sales, increasing our inventory levels of older products and exposing us to greater risk of product obsolescence. We have also experienced, and may in the future experience, delays in developing and releasing new products and product enhancements. This has led to, and may in the future lead to, delayed sales, deferred revenue, increased expenses and lower than anticipated quarterly revenue. In addition, complexity and difficulties in managing product transitions at the end-of-life stage of a product can create excess inventory of components associated with the outgoing products that can lead to increased expenses. Any or all of the above problems could materially harm our business and operating results.
Our quarterly and annual operating results may vary significantly and be difficult to predict, which may cause our stock price to fluctuate.
Our quarterly and annual operating results have varied historically from period to period, and we expect that they will continue to fluctuate due to a variety of factors, many of which are outside of our control, including:
• | fluctuations in demand for our products and services, the timing of orders from our channel partners and end-user customers, and our ability to accurately forecast end-user customer demand; |
• | the timing of our product shipments of products, which may depend on many factors such as inventory and logistics and our ability to ship new products on schedule and accurately forecast inventory requirements; |
• | the budgeting cycles and internal purchasing priorities of our end-user customers; |
• | seasonal buying patterns of our end-user customers; |
• | changes in end-user customer or channel partner requirements or market needs; |
• | the mix of products sold and the mix of revenue between products and services; |
• | changes in the growth rate of the network traffic visibility market, the cyber-security market and related markets, such as the network infrastructure market, and the market for network management, analysis, compliance and security tools; |
• | our ability to control costs, including operating expenses, the costs of hardware and software components, and other manufacturing costs; |
• | our ability to timely develop, introduce and gain market acceptance for new products, technologies and services; |
• | price competition; |
• | any significant changes in the competitive environment, including the entry of new competitors, and any related discounting of products or services; |
16
• | the timing and execution of product transitions or new product introductions, and related inventory costs; |
• | deferral of orders from end-user customers in anticipation of new products or product enhancements announced by us or our competitors; |
• | decisions by potential end-user customers to purchase alternative network traffic visibility solutions or cyber-security solutions from their existing network infrastructure and security vendors or other third parties; |
• | our ability to establish and manage our distribution channels, and the effectiveness of any changes we make to our distribution model; |
• | the ability of our suppliers and contract manufacturers to provide component parts and finished products in a timely manner; |
• | changes in end-user customer renewal rates for our services and our ability to up-sell additional products; |
• | general economic conditions, both domestically and in our foreign markets; |
• | the timing of revenue recognition for our sales, which may be affected by the mix of sales by our channel partners; and |
• | future accounting pronouncements or changes in our accounting policies. |
Any one of the factors above or the cumulative effect of some of the factors referred to above may result in significant fluctuations in our quarterly and annual operating results, including fluctuations in our key performance indicators. This variability and unpredictability could result in our failure to meet our internal operating plan or the expectations of securities analysts or investors for any period. In addition, a significant percentage of our operating expenses are fixed in nature in the short term and based on forecasted revenue trends. Accordingly, in the event of revenue shortfalls, we are generally unable to mitigate the negative impact on margins in the short term. If we fail to meet or exceed such expectations for these or any other reasons, the market price of our shares could fall substantially and we could face costly lawsuits, including securities class action suits.
We compete in highly competitive markets, and competitive pressures from existing and new companies may adversely impact our business and operating results.
The markets in which we compete are highly competitive. We expect competition to intensify in the future as existing competitors bundle new and more competitive offerings with their existing products and services, and as new market entrants introduce new products into our markets. This competition could result in increased pricing pressure, reduced profit margins, increased sales and marketing expenses and our failure to increase, or the loss of, market share, any of which would likely seriously harm our business, operating results and financial condition. We also expect that competition will continue to increase as a result of advancements in networking technology and architecture. If we do not keep pace with product and technology advances and otherwise keep our product offerings competitive, there could be a material and adverse effect on our competitive position, revenue and prospects for growth.
We compete either directly or indirectly with certain large Ethernet switch vendors, such as Cisco Systems Inc., Brocade Systems Communications, Inc. and Arista Networks, Inc., and network management, analysis, compliance and security tool vendors, such as Netscout and Ixia, that offer point solutions that address a portion of the issues that we solve. The principal competitive factors in our markets include functionality and performance, price and total cost of ownership, ease of use, flexibility and scalability of deployment, brand awareness, breadth of portfolio, product reliability and quality, interoperability with other products, the extent and speed of user adoption and quality of service, support and fulfillment.
Many of our current and potential competitors are substantially larger and have greater financial, technical, research and development, sales and marketing, manufacturing, distribution and other resources and greater name recognition. We could also face competition from new market entrants, including our other current technology partners. In addition, many of our existing and potential competitors enjoy substantial competitive advantages, such as:
• | longer operating histories; |
• | the capacity to leverage their sales efforts and marketing expenditures across a broader portfolio of products; |
17
• | broader distribution and established relationships with channel partners; |
• | access to larger customer bases; |
• | greater resources to make acquisitions; |
• | larger intellectual property portfolios; |
• | the ability to bundle competitive offerings with other products and services; and |
• | greater customer support. |
As a result, increased competition could result in fewer customer orders, price reductions, reduced operating margins and loss of market share. Our competitors also may be able to provide end-user customers with capabilities or benefits different from or greater than those we can provide in areas such as technical qualifications or geographic presence, or to provide end-user customers a broader range of products, services and prices. In addition, some of our larger potential competitors have substantially broader product offerings and could leverage their relationships based on other products or incorporate functionality into existing products to gain business in a manner that discourages users from purchasing our products, including through selling at zero or negative margins, product bundling or closed technology platforms. These larger potential competitors may also have more extensive relationships within existing and potential end-user customers that provide them with an advantage in competing for business with those end-user customers. In addition, to the extent that one of our competitors establishes or strengthens a cooperative relationship with, or acquires one or more of the network management, analysis, compliance and security tool vendors that we have relationships with, it could adversely affect our ability to compete. Our ability to compete will depend upon our ability to provide a better solution than our competitors at a competitive price. To remain competitive, we may be required to make substantial additional investments in research, development, marketing and sales in order to respond to competition, and there is no assurance that these investments will achieve any returns for us or that we will be able to compete successfully in the future.
We also expect increased competition if our market continues to expand. Conditions in our market could change rapidly and significantly as a result of technological advancements or other factors. In addition, current or potential competitors may be acquired by third parties that have greater resources available. As a result of these acquisitions, our current or potential competitors might take advantage of the greater resources of the larger organization to compete more aggressively against us.
We depend on growth in markets relating to network security, management and analysis, and lack of growth or contraction in one or more of these markets could have a material adverse effect on our sales and financial condition.
Demand for our products is linked to, among other things, growth in the size and complexity of network infrastructures and the demand for networking technologies addressing the security, management and analysis of such infrastructures. If this demand declines or if we do not effectively adapt our technology to next generation network infrastructure deployments, our sales, profitability and financial condition would be materially adversely affected. Segments of the network infrastructure industry have in the past experienced significant economic downturns. The occurrence of any of these factors in the markets relating to network security, management and analysis could materially adversely affect our sales, profitability and financial condition. Furthermore, these markets are dynamic and evolving. Our future financial performance will depend in large part on continued growth in the number of organizations investing in their network infrastructure and the amount they commit to such investments. The market for network infrastructure may not continue to grow at historic rates, or at all. If this market fails to grow, or grows more slowly than we currently anticipate, our sales and profitability could be adversely affected.
Our sales cycles can be long and unpredictable, and our sales efforts require considerable time and expense.
We have experienced difficulty managing lengthening and increasingly unpredictable sales cycles in the past. Our sales efforts involve educating our end-user customers about the use and benefits of our solution, including their technical capabilities. End-user customers often undertake an evaluation and testing process that can result in a lengthy sales cycle. Also, as our distribution strategy has evolved into more of a channel model, utilizing distributors, the level of variability in the length of sales cycle across transactions has increased and made it more difficult to predict the timing of many of our sales transactions. We spend substantial time and resources on our sales efforts without any assurance that our efforts will produce any sales or a material amount of revenue from such sales. In addition, product purchases are frequently subject to budget constraints, multiple approvals and unplanned administrative, processing and other delays. These factors, among others, have in the past led to, and could continue to result in, long and unpredictable sales cycles.
18
We sell our products primarily to enterprise IT departments and service providers. The length of our sales cycles typically ranges from three to six months and is generally longer the larger the size of the transaction. Often times, our larger transactions are part of larger data center projects or upgrades by our customers and we have little ability to influence the timing of these transactions. As a result, our sales cycles can often be more than six months, with sales cycles involving service providers taking significantly longer to complete. To the extent that the mix of our future sales shifts to include relatively more revenue from service providers, the average length of our sales cycles will likely increase. Furthermore, our sales to federal, state and local governmental agency end-user customers have increased in recent periods, and we may in the future increase sales to governmental entities. Selling to governmental entities can be highly competitive, expensive and time consuming, often requiring significant upfront time and expense without any assurance that some of these efforts will generate a sale. As a result of these lengthy and uncertain sales cycles and the increasing size of our transactions, it is difficult for us to predict when end-user customers may purchase solutions and accept products from us. If we are unable to effectively manage the sales cycle or if we fail to close a large transaction or multiple smaller transactions that we expect to close in a given period, our operating results may vary significantly from period to period and may be materially adversely affected.
Our limited operating history makes it difficult for you to evaluate our current business and future prospects, and may increase the risk of your investment.
We were founded in 2004 and sold our first products commercially in 2005. We have experienced rapid growth since our inception, and we have been increasing the breadth and scope of our product offerings. The majority of our revenue growth, however, has occurred over the past five years. This limited operating history, as well as the early stage of our relationships with many of our channel partners, makes financial forecasting and evaluation of our business difficult. Furthermore, because we depend in part on the market’s acceptance of our products, it is difficult to evaluate trends that may affect our business. We have encountered and will continue to encounter risks and difficulties frequently experienced by growing companies in rapidly changing industries. If we do not address these risks successfully, our business and operating results would be adversely affected, and our stock price could decline.
Some of the components and technologies used in our products are purchased and licensed from a single source or a limited number of sources. The loss of any of these suppliers might cause us to incur additional transition costs, result in delays in the manufacturing and delivery of our products, or cause us to carry excess or obsolete inventory and could require us to redesign our products.
Although supplies of our components are generally available from a variety of sources, we currently depend on a single source or a limited number of sources for most components included in our products. For example, the processors and connectors that we use in the products manufactured by Broadcom Corp., Freescale Semiconductor, Ltd., Cavium, Inc., Tilera Corporation and Molex Inc. are currently available only from a limited number of sources, and neither we nor, to our knowledge, these manufacturers have entered into supply agreements with such sources. As there are no other sources for identical components and technologies, if we lost any of these suppliers or were unable to acquire these components or license these technologies, we may not be able to sell our products for a significant period of time, and we could incur significant costs to redesign our hardware and software to incorporate components or technologies from alternative sources or to qualify alternative suppliers. Our reliance on a single source or a limited number of suppliers involves a number of additional risks, including risks related to:
• | supplier capacity constraints; |
• | price increases; |
• | timely delivery; |
• | component quality; |
• | failure of a key supplier to remain in business and adjust to market conditions; |
• | delays in, or the inability to execute on, a supplier roadmap for components and technologies; and |
• | natural disasters. |
In addition, for certain components for which there are multiple sources, we are subject to potential price increases and limited availability as a result of market demand for these components. In the past, unexpected demand for computer and network products has caused worldwide shortages of certain electronic parts. If similar shortages occur in the future, our business would be adversely affected. Although we carry some finished goods inventory of our products, we and our manufacturers rely on our suppliers to deliver necessary components in a timely manner. We and our manufacturers rely on purchase orders rather than long-term contracts with these
19
suppliers, and as a result we or our manufacturers might not be able to secure sufficient components, even if they were available, at reasonable prices or of acceptable quality to build products in a timely manner and, therefore, might not be able to meet end-user customer demands for our products, which would have a material and adverse effect on our business, operating results and financial condition.
We rely on third party channel partners for a substantial portion of our revenue. If our partners fail to perform, our ability to sell our products and services would be limited, and if we fail to optimize our channel partner model going forward, our operating results would be harmed.
A substantial portion of our revenue is generated through sales by our channel partners, which include distributors and resellers. We depend upon our channel partners to assist with the sales process through introduction to accounts and to manage the fulfillment of orders and the distribution of our products. In North America we rely on two distributors, GCI and Arrow, which we engaged as a distributor in February 2013. GCI accounted for 40%, 47% and 52% of our revenue in fiscal years 2015, 2014, and 2013, respectively. Arrow accounted for 21% and 16% of our revenue for in fiscal years 2015 and 2014, respectively. To the extent our channel partners are unable to generate an increasing amount of our sales opportunities, are unsuccessful in selling our products, or we are unable to enter into arrangements with, and retain, a sufficient number of high quality channel partners in each of the regions in which we sell products, and keep them motivated to sell our products, our ability to sell our products and operating results would be harmed. The termination of our relationship with any significant channel partner may adversely impact our sales, operating results and revenue growth. If we fail to optimize our channel partner model or fail to manage existing sales channels, our business and operating results could be materially and adversely affected.
Managing inventory of our products and product components is complex. Insufficient inventory may result in lost sales opportunities or delayed revenue, while excess inventory may harm our gross margins.
Managing inventory of our products and product components is complex with many critical components requiring long lead times from the component manufacturer. These long lead times place added importance on our ability to effectively forecast customer demand so that we have the right amount of product or product components available. Managing inventory is further complicated as our channel partners may increase orders during periods of product shortages, cancel orders if their inventory is too high, return product or take advantage of price protection (if any) or delay orders in anticipation of new products. They also may adjust their orders in response to the supply of our products and the products of our competitors that are available to them and in response to seasonal fluctuations in customer demand. Furthermore, if the time required to manufacture certain products or ship products increases for any reason, this could result in inventory shortfalls. In addition, for those channel partners that have rights of return, inventory held by such channel partners affects our operating results. Managing our inventory depends significantly on our ability to accurately forecast end-user customer demand for our products. Our inventory management and demand planning systems and related supply chain visibility tools may be inadequate to enable us to effectively manage inventory. Inventory management remains an area of focus as we balance the need to maintain inventory levels that are sufficient to ensure competitive lead times against the risk of inventory obsolescence because of rapidly changing technology and customer requirements. If we ultimately determine that we have excess inventory, we may have to reduce our prices or write-down inventory, which in turn could result in lower gross margins. Alternatively, insufficient inventory levels may lead to shortages that result in delayed revenue or loss of sales opportunities altogether as potential end-user customers turn to competitors’ products that are readily available. If we are unable to effectively manage our inventory and that of our distribution partners, our operating results could be adversely affected.
We currently rely on a single contract manufacturer to manufacture a substantial majority of our products, and our failure to manage our relationship with our contract manufacturer successfully could negatively impact our business.
We rely on Jabil Circuit, Inc., or Jabil, to manufacture a substantial majority of our products. We transitioned our manufacturing to Jabil in an effort to expand and upgrade our manufacturing, systems assembly, testing and order fulfillment capabilities. We entered into a manufacturing services agreement with Jabil in April 2013 and amended and restated the agreement in April 2015. Our amended agreement with Jabil has an initial term of two years, and the agreement automatically renews for additional one-year terms, unless it is terminated by either party by giving written notice of non-renewal at least six months before the end of the then-current term. In addition, the agreement may be terminated (i) upon mutual written consent of both parties, (ii) for convenience upon nine months written notice by Jabil or six months written notice by us, (iii) for cause upon written notice of a material breach and if the other party does not cure such breach within 30 days of such notice, (iv) immediately upon the bankruptcy or insolvency of the other party, or (v) upon a change of control of either party, subject to applicable notice periods.
20
Our reliance on Jabil reduces our control over the assembly process, exposing us to risks, including reduced control over quality assurance, production costs and product supply. If we fail to effectively manage our relationship with Jabil, or if Jabil experiences delays, disruptions, capacity constraints or quality control problems in their operations, our ability to ship products to our end-user customers could be impaired and our competitive position and reputation could be harmed. Furthermore, Jabil manufactures our products in their facility in Guadalajara, Mexico. As such, these manufacturing operations may be subject to changes in the economic, security and political conditions in Mexico which might interrupt manufacturing operations. In addition, any adverse change in Jabil’s financial or business condition could disrupt our ability to supply quality products to our end-user customers. If we are required to change our contract manufacturer or cannot find a suitable alternative in a timely manner, we may lose revenue, incur increased costs and damage our relationships with our channel partners and end-user customers. In addition, qualifying a new contract manufacturer and commencing production can be an expensive and lengthy process. If we experience increased demand that Jabil is unable to fulfill, or if Jabil is unable to provide us with an adequate supply of high-quality products for any reason, we could experience a delay in our order fulfillment, and our business, operating results and financial condition would be adversely affected.
Defects, errors or vulnerabilities in our products, or the failure of our solution to improve network security, could harm our reputation and business.
Our products are complex and have contained and may contain undetected defects or errors, especially when first introduced or when new versions are released. Defects in our products may impede or block network traffic or cause our products to fail to provide network traffic visibility as intended. Further, defects in our products may impair the functionality or performance of the appliances and applications that rely on the data provided by our products. Defects in our products may lead to product returns and require us to implement design changes or software updates. Additionally, defects or vulnerabilities in our products or services may cause the networks of our end-user customers to be vulnerable to security attacks, cause them to fail to help secure networks, or temporarily interrupt the networking traffic of our end-user customers. Because the techniques used by computer hackers to access or sabotage networks change frequently and generally are not recognized until launched against a target, we may be unable to anticipate these techniques and provide a solution in time to fix the defect or vulnerability in our products or services. Furthermore, as we increasingly design and market our products with specific security related features, our networks, products, and services could be targeted by attacks specifically designed to disrupt our business and harm our reputation. Any successful security attack on our network or on the network of one of our end-user customers that could be traced to a defect or vulnerability in one of our products or services could lead to significant liability or reputational harm that could have a material adverse impact on our operating results.
Any defects or errors in our products, or the perception of such defects or errors, could result in:
• | expenditure of significant financial and product development resources in efforts to analyze, correct, eliminate or work around errors or defects; |
• | loss of existing or potential end-user customers or channel partners; |
• | delayed or lost revenue; |
• | delay or failure to attain market acceptance; |
• | delay in the development or release of new products or services; |
• | negative publicity, which will harm our reputation; |
• | warranty claims against us, which could result in an increase in our provision for doubtful accounts; |
• | an increase in collection cycles for accounts receivable or the expense and risk of litigation; and |
• | harm to our operating results. |
Although we have limitation of liability provisions in our standard terms and conditions of sale, they may not fully or effectively protect us from claims as a result of federal, state or local laws or ordinances or unfavorable judicial decisions in the United States or other countries. The sale and support of our products also entail the risk of product liability claims. We maintain insurance to protect against certain claims associated with the use of our products, but our insurance coverage may not adequately cover any claim asserted against us. In addition, even claims that ultimately are unsuccessful could result in our expenditure of funds in litigation and divert management’s time and other resources.
We rely on the availability of licenses to third party software and other intellectual property.
21
Many of our products and services include software or other intellectual property licensed from third parties, and we otherwise use software and other intellectual property licensed from third parties in our business. This exposes us to risks over which we may have little or no control. For example, a licensor may have difficulties keeping up with technological changes or may stop supporting the software or other intellectual property that it licenses to us. Also, it will be necessary in the future to renew certain licenses, expand the scope of certain existing licenses or seek new licenses, relating to various aspects of these products and services, or otherwise relating to our business, which may result in increased license fees. There can be no assurance that the necessary licenses will be available on acceptable terms, if at all. In addition, a third party may assert that we or our end-user customers, are in breach of the terms of a license, which could, among other things, give such third party the right to terminate a license, seek damages from us, or both. The inability to obtain or maintain certain licenses or other rights or to obtain or maintain such licenses or rights on favorable terms, or the need to engage in litigation regarding these matters, could result in delays in releases of products and services, and could otherwise disrupt our business, until equivalent technology can be identified, licensed or developed, if at all, and integrated into our products and services or otherwise in the conduct of our business. Any of these events could have a material adverse effect on our business, operating results and financial condition. Moreover, the inclusion in our products and services of software or other intellectual property licensed from third parties on a nonexclusive basis may limit our ability to differentiate our products from those of our competitors.
Furthermore, we have a license and services agreement with Tall Maple Systems, Inc., or Tall Maple, pursuant to which we have been granted a perpetual, non-exclusive, worldwide license to certain software code of Tall Maple, which we integrate into the software component of our H Series products and which can be integrated into our other products and applications. In return, we paid Tall Maple a license fee. The agreement can only be terminated for cause upon written notice of a material breach and if the other party does not cure such breach within 30 days of such notice. We were notified in 2013 that the assets of Tall Maple were acquired by a third party. If our agreement with Tall Maple is terminated as a result of a material breach by us that we do not timely cure, we may need to identify, license or develop equivalent software, and integrate such replacement software into the software component of our H Series products, which could impede our ability to sell our H Series products until equivalent software is identified, licensed or developed, and integrated. These delays, if they occur, could adversely affect our business, operating results and financial condition.
Failure to protect our proprietary technology and intellectual property rights could substantially harm our business and operating results.
The success of our business depends on our ability to protect and enforce our trade secrets, trademarks, copyrights, patents and other intellectual property rights. We attempt to protect our intellectual property under patent, trademark, copyright and trade secret laws, and through a combination of confidentiality procedures, contractual provisions and other methods, all of which offer only limited protection.
As of December 26, 2015, we had 28 issued patents in the United States, but this number is relatively small in comparison to some of our competitors and potential competitors. Additionally, as of December 26, 2015, we had 27 pending U.S. patent applications. Internationally, as of December 26, 2015, we have two issued patents and a number of pending patent applications. We may file additional patent applications in the future. The process of obtaining patent protection is expensive and time-consuming, and we may not be able to prosecute all necessary or desirable patent applications at a reasonable cost or in a timely manner. We may choose not to seek patent protection for certain innovations and may choose not to pursue patent protection in certain jurisdictions. Furthermore, it is possible that our patent applications may not issue as granted patents, that the scope of our issued patents will be insufficient or not have the coverage originally sought, that our issued patents will not provide us with any competitive advantages, and that our patents and other intellectual property rights may be challenged by others or invalidated through administrative process or litigation. In addition, issuance of a patent does not guarantee that we have an absolute right to practice the patented invention, or that we have the right to exclude others from practicing the claimed invention. As a result, we may not be able to obtain adequate patent protection or to enforce our issued patents effectively.
In addition to patented technology, we rely on our unpatented proprietary technology and trade secrets. Despite our efforts to protect our proprietary technology and trade secrets, unauthorized parties may attempt to misappropriate, reverse engineer or otherwise obtain and use them. The contractual provisions that we enter into with employees, consultants, partners, vendors and customers may not prevent unauthorized use or disclosure of our proprietary technology or intellectual property rights and may not provide an adequate remedy in the event of unauthorized use or disclosure of our proprietary technology or intellectual property rights. Moreover, policing unauthorized use of our technologies, products and intellectual property is difficult, expensive and time-consuming, particularly in foreign countries where the laws may not be as protective of intellectual property rights as those in
22
the United States and where mechanisms for enforcement of intellectual property rights may be weak. For example, the laws of India, where we are establishing a research and development facility, do not protect our proprietary rights to the same extent as the laws of the United States. We may be unable to determine the extent of any unauthorized use or infringement of our products, technologies or intellectual property rights.
From time to time, we may need to take legal action to enforce our patents and other intellectual property rights, to protect our trade secrets, to determine the validity and scope of the intellectual property rights of others or to defend against claims of infringement or invalidity. Such litigation could result in substantial costs and diversion of resources and could negatively affect our business, operating results, financial condition and cash flows. If we are unable to adequately protect our intellectual property rights, we may find ourselves at a competitive disadvantage to others who need not incur the additional expense, time and effort required to create the innovative products that have enabled us to be successful to date.
Assertions by third parties of infringement or other violations by us of their intellectual property rights, or other lawsuits asserted against us, could result in significant costs and substantially harm our business and operating results.
Patent and other intellectual property disputes are common in the network infrastructure industry. Some companies in the network infrastructure industry, including some of our competitors, own large numbers of patents, copyrights, trademarks and trade secrets, which they may use to assert claims against us. Third parties may in the future assert claims of infringement, misappropriation or other violations of intellectual property rights against us. They may also assert such claims against our end-user customers or channel partners whom we typically indemnify against claims that our products infringe, misappropriate or otherwise violate the intellectual property rights of third parties. As the number of products and competitors in our market increase and overlaps occur, claims of infringement, misappropriation and other violations of intellectual property rights may increase. Any claim of infringement, misappropriation or other violation of intellectual property rights by a third party, even those without merit, could cause us to incur substantial costs defending against the claim and could distract our management from our business.
The patent portfolios of our most significant competitors and potential competitors are larger than ours. This disparity between our patent portfolio and the patent portfolios of our most significant competitors may increase the risk that they may sue us for patent infringement and may limit our ability to counterclaim for patent infringement or settle through patent cross-licenses. In addition, future assertions of patent rights by third parties, and any resulting litigation, may involve patent holding companies or other adverse patent owners who have no relevant product revenue and against whom our own patents may therefore provide little or no deterrence or protection. We cannot assure you that we are not infringing or otherwise violating any third party intellectual property rights.
An adverse outcome of a dispute may require us to, among other things, pay substantial damages, including treble damages, if we are found to have willfully infringed a third party’s patents or copyrights; cease making, licensing or using solutions that are alleged to infringe or misappropriate the intellectual property of others; expend additional development resources to attempt to redesign our products or services or otherwise to develop non-infringing technology, which may not be successful; enter into potentially unfavorable royalty or license agreements in order to obtain the right to use necessary technologies or intellectual property rights; and indemnify our partners and other third parties. Any damages or royalty obligations we may become subject to, and any third party indemnity we may need to provide, as a result of an adverse outcome could harm our operating results. Royalty or licensing agreements, if required or desirable, may be unavailable on terms acceptable to us, or at all, and may require significant royalty payments and other expenditures. In addition, some licenses may be non-exclusive, and therefore our competitors may have access to the same technology licensed to us. Any of these events could seriously harm our business, financial condition and operating results.
Under the indemnification provisions of our standard sales contracts, we agree to defend our customers against third party claims asserting infringement of certain intellectual property rights, which may include patents, copyrights, trademarks or trade secrets, and to pay judgments entered on such claims. Our exposure under these indemnification provisions is generally limited to the total amount paid by our customer under the agreement. However, certain agreements include indemnification provisions that could potentially expose us to losses in excess of the amount received under the agreement. We have not incurred any material costs in the past as a result of such indemnification obligations, and have not accrued any liabilities related to such obligations in our consolidated financial statements.
In addition, we may, from time to time, be a party to other lawsuits in the normal course of our business. Litigation in general, and intellectual property and securities litigation in particular, can be expensive, lengthy and disruptive to normal business operations. Moreover, the results of complex legal proceedings are difficult to predict.
23
Responding to lawsuits is likely to be expensive and time consuming for us, and could divert our management’s attention from our business. An unfavorable resolution of any lawsuit could adversely affect our business, operating results or financial condition.
Our use of open source and third party technology could impose limitations on our ability to commercialize our software.
We use open source software in our products, and although we monitor our use of open source software to avoid subjecting our products to conditions we do not intend, the terms of many open source licenses have not been interpreted by U.S. courts. As a result, there is a risk that these licenses could be construed in a way that could impose unanticipated conditions or restrictions on our ability to commercialize our products. In such an event, or if we fail to adequately monitor our use of open source software, we could be required to seek licenses from third parties to continue offering our products, to make our proprietary code generally available in source code form, to re-engineer our products or to discontinue the sale of our products if re-engineering could not be accomplished on a timely basis, any of which could adversely affect our business, operating results and financial condition.
We are dependent on a single product family comprised of a limited number of products.
Our product offering is limited to a single product family comprised of our GigaVUE, GigaSECURE, GigaSMART and G-TAP products. Historically, we have derived a substantial portion of our revenue from sales of our GigaVUE appliances and related services, and we expect to continue to derive a significant portion of our revenue from sales of our GigaVUE appliances and related services for the foreseeable future. A decline in the price of these products and related services, whether due to competition or otherwise, or our inability to increase sales of these products, would harm our business and operating results more seriously than it would if we derived significant revenue from a variety of product lines and services. We expect that this concentration of revenue from a single product family comprised of a limited number of products will continue for the foreseeable future. As a result, our future growth and financial performance will depend heavily on our ability to develop and sell enhanced versions of our GigaVUE appliances and related family of products and services. If we fail to deliver product enhancements, new releases or new products that end-user customers want, it will be more difficult for us to succeed.
Adverse economic conditions or reduced information technology and network infrastructure spending may adversely impact our business and operating results.
Our business depends on the overall demand for information technology, network infrastructure and the market for network security analysis, compliance and monitoring tools. In addition, the purchase of our products and services is often discretionary and may involve a significant commitment of capital and other resources. Weak global economic conditions, or a reduction in information technology and network infrastructure spending even if economic conditions improve, could adversely impact our business, financial condition and operating results in a number of ways, including longer sales cycles, lower prices for our products and services, higher default rates among our distributors, reduced unit sales and lower or no growth. As global or regional economic conditions continue to be volatile or economic uncertainty remains, trends in information technology and network infrastructure spending also remain unpredictable and subject to reductions due to credit constraints and uncertainties about the future. Unfavorable economic conditions may lead end-customers to delay or reduce purchases of our solution. Demand for our solution may not reach our sales targets, or may decline, when there is an economic downturn or economic uncertainty. Our sensitivity to economic cycles and any related fluctuation in demand may have a material adverse effect on our business, financial condition and operating results.
The market for cloud-based and cloud-focused solutions is accelerating and if it does not continue to develop or develops more slowly than we expect, our business could be harmed.
We expect to expand the range of our cloud-focused offerings in the future. Many factors may affect the market acceptance of cloud-based and cloud-focused solutions, including:
•perceived security capabilities and reliability;
•perceived concerns about the ability to scale operations for large enterprise customers;
•concerns with entrusting a third party to store and manage critical data; and
•the level of configurability or customizability of the solution.
If organizations that establish a presence in the cloud do not perceive the benefits of our cloud-focused solutions, or if our competitors or new market entrants are able to develop cloud-focused solutions that are or are
24
perceived to be more effective than ours, this portion of our business may not grow further or may develop more slowly than we expect, either of which would adversely affect our business and operating results.
The average selling price of our products has decreased from time to time, and may decrease in the future, which may negatively impact gross profits.
From time to time, the average selling price of our products has decreased. In the future, it is possible that the average selling prices of our products will decrease in response to competitive pricing pressures, increased sales discounts, new product introductions by us or our competitors or other factors. Such pricing pressures may also be dependent upon the mix of products sold, the mix of revenue between products and services and the degree to which products and services are bundled and sold together for a package price. Therefore, in order to maintain our profitability, we must develop and introduce new products and product enhancements on a timely basis and continually reduce our product costs. Our failure to do so would likely cause our revenue and gross profits to decline, which would harm our business and operating results. In addition, we may experience substantial period-to-period fluctuations in future operating results in the event we experience an erosion of our average selling prices.
We rely on revenue from support services which may decline, and because we recognize revenue from support services over the term of the relevant service period, downturns or upturns in sales of support services are not immediately reflected in full in our operating results.
Our service revenue has become a more meaningful part of revenue in recent periods. Starting in the quarter ending September 26, 2015, we began to sell first year maintenance and support as an additional offering. Prior to that time, the first year of maintenance and support was bundled as part of the initial contract to purchase our products. Sales of new or renewal services contracts may decline and fluctuate as a result of a number of factors, including end-user customers’ level of satisfaction with our products and services, the prices of our products and services, the prices of products and services offered by our competitors or reductions in our end-user customers’ spending levels. If our sales of new or renewal services contracts decline, our revenue and revenue growth may decline and our business will suffer. In addition, we recognize service revenue over the term of the relevant service period, which is typically twelve months. As a result, some of the revenue we report each quarter is the recognition of deferred revenue from services contracts entered into during previous quarters. Consequently, a decline in new or renewed service contracts in any one quarter will not be fully reflected in revenue in that quarter but will negatively affect our revenue in future quarters. Accordingly, the effect of significant downturns in new or renewed sales of our services is not reflected in full in our operating results until future periods. Our service revenue also makes it difficult for us to rapidly increase our revenue through additional service sales in any period, as revenue from new and renewal service contracts must be recognized over the applicable service period. Furthermore, increases in the average term of services contracts would result in revenue for services contracts being recognized over longer periods of time.
Seasonality may cause fluctuations in our revenue and operating results.
We have experienced seasonality in our product revenue and operating results in the past, and we believe that we will continue to experience such seasonality in the future. The first quarter of each year is usually our lowest revenue quarter during the year and product revenue typically declines sequentially from the prior fourth quarter. We believe that this results in part from the procurement, budgeting and deployment cycles of many of our end-user customers. We generally expect an increase in sales in the second half of each year as budgets of our end-user customers for annual capital purchases are being fully utilized. We expect that seasonality will continue to affect our revenue and operating results in the future.
Our business and operations have experienced rapid growth, and if we do not appropriately manage any future growth, or are unable to improve our systems and processes, our operating results will be negatively affected.
We have experienced rapid growth over the last several years, which has placed a strain on our management, administrative, operational and financial infrastructure. In addition, some of the members of our current management team have only been working together for a short period of time. We also anticipate that additional investments in key channel partnerships and direct-sales personnel, as well as infrastructure and research and development spending, will be required to:
• | scale our operations and increase productivity; |
• | address the needs of our end-user customers; |
• | further develop and enhance our products and services; |
• | develop new technology; and |
25
• | expand our markets and opportunity under management, including into new industry verticals and geographic areas. |
Our success will depend in part upon our ability to manage our growth effectively. To do so, we must continue to increase the productivity of our existing employees and to hire, train and manage new employees as needed. To manage domestic and international growth of our operations and personnel, we will need to continue to improve our operational, financial and management controls and our reporting processes and procedures, and implement more extensive and integrated financial and business information systems. These additional investments will increase our operating costs, which will make it more difficult for us to offset any future revenue shortfalls by reducing expenses in the short term. Moreover, if we fail to scale our operations successfully, our business and operating results could be materially and adversely affected.
If we are unable to implement and maintain effective internal control over financial reporting, the accuracy and timeliness of our financial reporting may be adversely affected.
We must maintain effective internal control over financial reporting in order to accurately and timely report our results of operations and financial condition. In addition, the Sarbanes-Oxley Act requires, among other things, that we assess the effectiveness of our internal control over financial reporting and the effectiveness of our disclosure controls and procedures quarterly. If we are not able to comply with the requirements of the Sarbanes-Oxley Act in a timely manner, the market price of our stock could decline and we could be subject to sanctions or investigations by the New York Stock Exchange, the SEC or other regulatory authorities, which would diminish investor confidence in our financial reporting and require additional financial and management resources, each of which may adversely affect our business and operating results.
We have reported material weaknesses in our financial reporting in the past. Although prior material weaknesses have been recently remediated, there can be no assurance that control deficiencies or other significant deficiencies or material weaknesses in our financial reporting will not occur in the future. Any failure to maintain or implement required new or improved controls, or difficulties we encounter in their implementation, could result in significant deficiencies or material weaknesses, or cause us to fail to meet our future reporting obligations. Internal control deficiencies could also result in a restatement of our financial statements in the future or cause investors to lose confidence in our reported financial information, which could cause a decline in the market price of our common stock.
We are dependent on the continued services and performance of our senior management and other key employees, the loss of any of whom could adversely affect our business, operating results and financial condition.
Our future performance depends on the continued services and contributions of our senior management and other key employees to execute on our business plan, and to identify and pursue new opportunities and product innovations. The loss of services of senior management or other key employees could significantly delay or prevent the achievement of our development and strategic objectives. In addition, most of the members of our current management team have only been working together for a short period of time. The loss of the services of our senior management or other key employees for any reason could adversely affect our business, financial condition and operating results.
If we are unable to hire, retain and motivate qualified personnel, our business would suffer.
Our future success depends, in part, on our ability to continue to attract and retain highly skilled personnel. The loss of the services of any of our key personnel, the inability to attract or retain qualified personnel or delays in hiring required personnel, particularly in engineering and sales, may seriously harm our business, financial condition and operating results. None of our key employees has an employment agreement for a specific term, and any of our employees may terminate their employment at any time. Our ability to continue to attract and retain highly skilled personnel will be critical to our future success. Competition for highly skilled personnel is frequently intense, especially in the San Francisco Bay Area, the location in which we have a substantial presence and need for highly-skilled personnel. We intend to continue to issue stock options and restricted stock units as a key component of our overall compensation and employee attraction and retention efforts. In addition, we are required under GAAP to recognize compensation expense in our operating results for employee stock-based compensation under our equity grant programs, which may negatively impact our operating results and may increase the pressure to limit stock-based compensation. We may not be successful in attracting, assimilating or retaining qualified personnel to fulfill our current or future needs. Also, to the extent we hire personnel from competitors, we may be subject to allegations that they have been improperly solicited or divulged proprietary or other confidential information.
26
Our long-term success depends, in part, on our ability to expand the sales of our products to end-user customers located outside of the United States, and therefore our business will be susceptible to risks associated with international operations.
While we currently maintain limited operations outside of the United States, we intend to expand these operations in the future. For example, we have opened a research and development facility in India and have transitioned our primary manufacturing operations, through Jabil, to Mexico. We have limited experience operating in foreign jurisdictions. Our inexperience in operating our business outside of the United States increases the risk that any international expansion efforts we may undertake will not be successful. In addition, conducting and expanding international operations subjects us to new risks that we have not generally faced in the United States. These include:
• | exposure to foreign currency exchange rate risk; |
• | difficulties in managing and staffing international operations; |
• | the increased travel, infrastructure and legal compliance costs associated with multiple international locations; |
• | potentially adverse tax consequences; |
• | the burdens of complying with a wide variety of foreign laws, including trade barriers, and different legal standards; |
• | increased financial accounting and reporting burdens and complexities; |
• | political, social and economic instability abroad, terrorist attacks and security concerns in general; and |
• | reduced or varied protection for intellectual property rights in some countries. |
The occurrence of any one of these risks could negatively affect our international business and, consequently, our business, operating results and financial condition.
A portion of our revenue is generated by sales to government entities, which are subject to a number of challenges and risks.
Sales to U.S. and foreign, federal, state and local governmental agency end-user customers have accounted for an increasingly significant amount of our revenue, and we may in the future increase sales to government entities. Sales to government entities are subject to a number of risks. Selling to government entities can be highly competitive, expensive, and time-consuming, often requiring significant upfront time and expense without any assurance that these efforts will generate a sale. Government certification requirements for products like ours may change, thereby restricting our ability to sell into the federal government sector until we have attained the revised certification. Government demand and payment for our products and services may be impacted by public sector budgetary cycles and funding authorizations, with funding reductions or delays adversely affecting public sector demand for our products and services. Our sales to date to government entities have been made indirectly through our channel partners. Government entities may have statutory, contractual or other legal rights to terminate contracts with our distributors and resellers for convenience or due to a default, and any such termination may adversely impact our operating results. We have contractual obligations to provide certain channel partners that sell to the government with certain pricing information that they may pass on to governmental entities. Governments routinely investigate and audit government contractors’ administrative processes and compliance, and any unfavorable audit could result in the government refusing to continue buying our products and services, a reduction of revenue, or fines or civil or criminal liability if the audit uncovers improper or illegal activities, which could adversely impact our operating results in a material way. Finally, for purchases by the U.S. government, the government may require that certain products to be manufactured in the United States and other relatively high cost manufacturing locations, and we may not manufacture all products in locations that meet such requirements, affecting our ability to sell these products to the U.S. government.
Our use of and reliance on research and development resources in India may expose us to unanticipated costs or events.
We opened a research and development center in India during the second quarter of fiscal 2015 and, in the future expect to increase our headcount and development activity at this facility. There is no assurance that our reliance upon research and development resources in India will enable us to achieve our research and development goals or greater resource efficiency. Further, our research and development efforts in India involve significant risks, including:
27
• | difficulty hiring and retaining appropriate engineering personnel due to intense competition for such resources and resulting wage inflation; |
• | the knowledge transfer related to our technology and resulting exposure to misappropriation of intellectual property or information that is proprietary to us, our customers and other third parties; |
• | heightened exposure to change in the economic, security and political conditions in India; |
• | fluctuations in currency exchange rates and regulatory compliance in India; and |
• | interruptions to our operations in India as a result of floods and other natural catastrophic events as well as manmade problems such as power disruptions or terrorism. |
Difficulties resulting from the factors above and other risks related to our research and development activities in India could increase our research and development expenses, delay the introduction of new products, or impact our product quality, the occurrence of which could adversely affect our business and operating results.
We are dependent on various IT systems, and failures of or interruptions to those systems could harm our business.
Many of our business processes depend upon our IT systems, the systems and processes of third parties and on interfaces with the systems of third parties. For example, we rely on Microsoft AX Dynamics for our ERP system and Salesforce.com, Inc. for our customer relationship management system. If those systems fail or are interrupted, or if our ability to connect to or interact with one or more networks is interrupted, our processes may function at a diminished level or not at all. This would harm our ability to ship products, and our financial results would likely be harmed.
In addition, reconfiguring our IT systems or other business processes in response to changing business needs may be time consuming and costly. To the extent this impacts our ability to react timely to specific market or business opportunities, our financial results would likely be harmed.
Failure to comply with laws and regulations could harm our business.
Our business is subject to regulation by various federal, state, local and foreign governmental agencies, including agencies responsible for monitoring and enforcing employment and labor laws, workplace safety, product safety, environmental laws, consumer protection laws, anti-bribery laws, import/export controls, federal securities laws and tax laws and regulations. For example, our products are subject to various U.S. and foreign governmental regulations limiting the electromagnetic interference that our products can safely emit. If our products do not meet these regulatory standards, we may be required to stop shipping or recall non-compliant products until we are able to meet the applicable standards. Noncompliance with applicable regulations or requirements could subject us to investigations, sanctions, mandatory product recalls, enforcement actions, disgorgement of profits, fines, damages, civil and criminal penalties or injunctions. If any governmental sanctions are imposed, or if we do not prevail in any possible civil or criminal litigation, our business, operating results and financial condition could be materially adversely affected. In addition, responding to any action will likely result in a significant diversion of management’s attention and resources and an increase in professional fees. Enforcement actions and sanctions could harm our business, operating results and financial condition.
Governmental regulations affecting the import or export of products could negatively affect our revenue.
The U.S. and various foreign governments have imposed controls, export license requirements and restrictions on the import or export of some technologies, especially encryption technology, that apply to our products. In addition, from time to time, governmental agencies have proposed additional regulation of encryption technology, such as requiring the escrow and governmental recovery of private encryption keys. Governmental regulation of encryption technology and regulation of imports or exports, or our failure to obtain required import or export approval for our products, could harm our international and domestic sales and adversely affect our revenue. In addition, failure to comply with such regulations could result in penalties, costs and restrictions on export privileges, which would harm our operating results.
Due to the global nature of our business, we could be adversely affected by violations of the U.S. Foreign Corrupt Practices Act, the U.K. Bribery Act, or similar anti-bribery laws in other jurisdictions in which we operate, and various international trade and export laws.
The global nature of our business creates various domestic and local regulatory challenges. The U.S. Foreign Corrupt Practices Act, or the FCPA, the U.K. Bribery Act 2010, or the U.K. Bribery Act, and similar anti-bribery laws in other jurisdictions generally prohibit U.S.-based companies and their intermediaries from making improper
28
payments to non-U.S. officials for the purpose of obtaining or retaining business. In addition, U.S. based companies are required to maintain records that accurately and fairly represent their transactions and have an adequate system of internal accounting controls. We operate in areas of the world that experience corruption by government officials to some degree and, in certain circumstances, compliance with anti-bribery laws may conflict with local customs and practices. Our global operations require us to import and export to and from several countries, which geographically stretches our compliance obligations. In addition, changes in such laws could result in increased regulatory requirements and compliance costs which could adversely affect our business, financial condition and results of operations. We cannot assure that our employees or other agents will not engage in prohibited conduct and render us responsible under the FCPA or the U.K. Bribery Act. If we are found to be in violation of the FCPA, the U.K. Bribery Act or other anti-bribery laws (either due to acts or inadvertence of our employees, or due to the acts or inadvertence of others), we could suffer criminal or civil penalties or other sanctions, which could have a material adverse effect on our business.
We may expand through acquisitions of, or investments in, other companies, each of which may divert our management’s attention, resulting in additional dilution to our stockholders and consumption of resources that are necessary to sustain and grow our business.
Our business strategy may, from time to time, include acquiring complementary products, technologies or businesses. We also may enter into relationships with other businesses in order to expand our product offerings, which could involve preferred or exclusive licenses, additional channels of distribution or discount pricing or investments in other companies. Negotiating these transactions can be time consuming, difficult and expensive, and our ability to close these transactions may be subject to third party approvals, such as government regulation, which are beyond our control. Consequently, we can make no assurance that these transactions, once undertaken and announced, will close.
An acquisition or investment may result in unforeseen operating difficulties and expenditures. In particular, we may encounter difficulties assimilating or integrating the businesses, technologies, products, personnel or operations of the acquired companies, particularly if the key personnel of the acquired business choose not to work for us, and we may have difficulty retaining the customers of any acquired business. Acquisitions may also disrupt our ongoing business, divert our resources and require significant management attention that would otherwise be available for development of our business. Any acquisition or investment could expose us to unknown liabilities. Moreover, we cannot assure you that the anticipated benefits of any acquisition or investment would be realized or that we would not be exposed to unknown liabilities. An acquisition could also result in dilutive issuances of our equity securities, the incurrence of debt, contingent liabilities, amortization expenses or the write-off of goodwill. These challenges related to acquisitions or investments could adversely affect our business, operating results and financial condition.
If our estimates or judgments relating to our critical accounting policies are based on assumptions that change or prove to be incorrect, our operating results could fall below expectations of securities analysts and investors, resulting in a decline in our stock price.
The preparation of financial statements in conformity with GAAP requires management to make estimates and assumptions that affect the amounts reported in the consolidated financial statements and accompanying notes. We base our estimates on historical experience and on various other assumptions that we believe to be reasonable under the circumstances, as provided in the section titled “Management’s Discussion and Analysis of Financial Condition and Results of Operations,” the results of which form the basis for making judgments about the carrying values of assets, liabilities and equity, and the amount of revenue and expenses that are not readily apparent from other sources. Our operating results may be adversely affected if our assumptions change or if actual circumstances differ from those in our assumptions, which could cause our operating results to fall below the expectations of securities analysts and investors, resulting in a decline in our stock price. Significant assumptions and estimates used in preparing our consolidated financial statements include, or may in the future include, those related to revenue recognition, stock-based compensation expense, long-lived assets, excess and obsolete inventory write-downs, warranty reserves and accounting for income taxes including deferred tax assets and liabilities.
If we fail to comply with environmental requirements, our business, financial condition, operating results and reputation could be adversely affected.
We are subject to various environmental laws and regulations including laws governing the hazardous material content of our products and laws relating to the collection of and recycling of electrical and electronic equipment. Examples of these laws and regulations include the European Union, or the EU, Restrictions of Hazardous Substances Directive, or the RoHS Directive, and the EU Waste Electrical and Electronic Equipment Directive, or
29
the WEEE Directive, as well as the implementing legislation of the EU member states. Similar laws and regulations have been passed or are pending in China, South Korea, Norway and Japan and may be enacted in other regions, including in the United States, and we are, or may in the future be, subject to these laws and regulations.
The RoHS Directive and the similar laws of other jurisdictions ban the use of certain hazardous materials such as lead, mercury and cadmium in the manufacture of electrical equipment, including our products. We rely on our contract manufacturers to ensure that the manufacturer of our physical appliances and major component part suppliers comply with the RoHS Directive requirements. In addition, if there are changes to this or other laws (or their interpretation) or if new similar laws are passed in other jurisdictions, we may be required to reengineer our products to use components compatible with these regulations. This reengineering and component substitution could result in additional costs to us or disrupt our operations or logistics.
The WEEE Directive requires electronic goods producers to be responsible for the collection, recycling and treatment of such products. Changes in the interpretation of the WEEE Directive may cause us to incur costs or have additional regulatory requirements to meet in the future in order to comply with this directive, or with any similar laws adopted in other jurisdictions.
Our failure to comply with past, present and future similar laws could result in reduced sales of our products, substantial product inventory write-offs, reputational damage, penalties and other sanctions, which could harm our business and financial condition. We also expect that our products will be affected by new environmental laws and regulations on an ongoing basis. To date, our expenditures for environmental compliance have not had a material impact on our results of operations or cash flows and, although we cannot predict the future impact of such laws or regulations, they will likely result in additional costs and may increase penalties associated with violations or require us to change the content of our products or how they are manufactured, which could have a material adverse effect on our business, operating results and financial condition.
Changes in our valuation allowance of deferred tax assets may affect our future financial results
We record a valuation allowance to reduce our net deferred tax assets to the amount that we believe is more-likely-than-not to be realized. In assessing the need for a valuation allowance, we consider historical levels of income, expectations and risks associated with estimates of future taxable income and ongoing prudent and practical tax planning strategies. On a periodic basis we evaluate our deferred tax asset balance for realizability. To the extent we believe it is more-likely-than-not that some portion of our deferred tax assets will not be realized, we will increase the valuation allowance against the deferred tax assets. Realization of our deferred tax assets is primarily upon future taxable income in related tax jurisdictions. If our assumptions and consequently our estimates change in the future, the valuation allowances may be increased or decreased, resulting in a respective increase or decrease in income tax expense.
As of December 26, 2015, we assessed that it is more-likely-than-not that we will not realize our federal and state deferred tax assets based on the absence of sufficient positive objective evidence that we would generate sufficient taxable income in our U.S. tax jurisdiction to realize the deferred tax assets. Accordingly, we recorded a valuation allowance on our federal and state deferred tax assets (see Note 10 of the Notes to Condensed Consolidated Financial Statements in Part II - Item 8 of this Annual Report on Form 10-K).
New regulations related to conflict minerals may cause us to incur additional expenses and could limit the supply and increase the costs of certain metals used in the manufacturing of our products.
As a public company, we are subject to new requirements under the Dodd-Frank Wall Street Reform and Consumer Protection Act of 2010, or the Dodd-Frank Act, which will require us to diligence, disclose, and report whether or not our products contain conflict minerals. As a recently public company, we will file our initial report with respect to conflict minerals on or prior to May 31, 2016 for the 2015 calendar year. The implementation of these new requirements could adversely affect the sourcing, availability and pricing of the materials used in the manufacture of components used in our products. In addition, we will incur additional costs to comply with the disclosure requirements, including costs related to conducting diligence procedures to determine the sources of conflict minerals that may be used or necessary to the production of our products and, if applicable, potential changes to products, processes or sources of supply as a consequence of such verification activities. It is also possible that we may face reputational harm if we determine that certain of our products contain minerals not determined to be conflict free or if we are unable to alter our products, processes or sources of supply to avoid such materials.
The requirements of being a public company may strain our resources, divert management’s attention and affect our ability to attract and retain executive management and qualified board members.
30
As a public company, we are subject to the reporting requirements of the Exchange Act, the Sarbanes-Oxley Act, the Dodd-Frank Act, the listing requirements of the New York Stock Exchange and other applicable securities rules and regulations. Compliance with these rules and regulations has increased and may continue to increase our legal and financial compliance costs, make some activities more difficult, time-consuming or costly and increase demand on our systems and resources, particularly as we ceased to be an “emerging growth company,” as defined in the Jumpstart Our Business Startups Act of 2012 on December 26, 2015. The Exchange Act requires, among other things, that we file annual, quarterly and current reports with respect to our business and operating results. The Sarbanes-Oxley Act requires, among other things, that we maintain effective disclosure controls and procedures and internal control over financial reporting. In order to maintain and, if required, improve our disclosure controls and procedures and internal control over financial reporting to meet this standard, significant resources and management oversight will be required. As a result, management’s attention may be diverted from other business concerns, which could adversely affect our business and operating results. Additionally, beginning with this Annual Report on Form 10-K, our independent registered public accounting firm is required to attest to the effectiveness of our internal control over financial reporting pursuant to Section 404 of the Sarbanes-Oxley Act. Although we have already hired additional employees to comply with these requirements, we may need to hire more employees in the future or engage outside consultants, which will increase our costs and expenses.
In addition, changing laws, regulations and standards relating to corporate governance and public disclosure are creating uncertainty for public companies, increasing legal and financial compliance costs and making some activities more time consuming. These laws, regulations and standards are subject to varying interpretations, in many cases due to their lack of specificity, and, as a result, their application in practice may evolve over time as new guidance is provided by regulatory and governing bodies. This could result in continuing uncertainty regarding compliance matters and higher costs necessitated by ongoing revisions to disclosure and governance practices. We intend to invest resources to comply with evolving laws, regulations and standards, and this investment may result in increased general and administrative expenses and a diversion of management’s time and attention from revenue-generating activities to compliance activities. If our efforts to comply with new laws, regulations and standards differ from the activities intended by regulatory or governing bodies due to ambiguities related to their application and practice, regulatory authorities may initiate legal proceedings against us and our business may be adversely affected.
Our business is subject to the risks of earthquakes, fire, power outages, floods and other catastrophic events, and to interruption by manmade problems such as terrorism.
A significant natural disaster, such as an earthquake, fire or a flood, or a significant power outage could have a material adverse impact on our business, operating results and financial condition. Our corporate headquarters are located in the San Francisco Bay Area, a region known for seismic activity. In addition, natural disasters could affect our manufacturing vendors or logistics providers’ ability to perform services such as manufacturing products on a timely basis and assisting with shipments on a timely basis. In the event our service providers’ information technology systems or manufacturing or logistics abilities are hindered by any of the events discussed above, shipments could be delayed, resulting in missing financial targets, such as revenue and shipment targets, for a particular quarter. Further, if a natural disaster occurs in a region from which we derive a significant portion of our revenue, end-user customers in that region may delay or forego purchases of our products, which may materially and adversely impact our operating results for a particular period. In addition, acts of terrorism could cause disruptions in our business or the business of our manufacturer, logistics providers, partners, end-user customers or the economy as a whole. Given our typical concentration of sales at each quarter end, any disruption in the business of our manufacturer, logistics providers, partners or customers that impacts sales at the end of our quarter could have a significant adverse impact on our quarterly results. All of the aforementioned risks may be augmented if the disaster recovery plans for us and our suppliers prove to be inadequate. To the extent that any of the above results in delays or cancellations of customer orders, or delays in the manufacture, deployment or shipment of our products, our business, financial condition and operating results would be adversely affected.
Risks Relating to Owning Our Common Stock
Our actual operating results may differ significantly from our guidance.
From time to time, we have released, and may continue to release guidance in our quarterly earnings conference call, quarterly earnings releases, or otherwise, regarding our future performance that represents our management’s estimates as of the date of release. This guidance, which includes forward-looking statements, has been and will be based on projections prepared by our management. These projections are not prepared with a view toward compliance with published guidelines of the American Institute of Certified Public Accountants, and neither our registered public accountants nor any other independent expert or outside party compiles or examines
31
the projections. Accordingly, no such person expresses any opinion or any other form of assurance with respect to the projections.
Projections are based upon a number of assumptions and estimates that, while presented with numerical specificity, are inherently subject to significant business, economic and competitive uncertainties and contingencies, many of which are beyond our control and are based upon specific assumptions with respect to future business decisions, some of which will change. We intend to state possible outcomes as high and low ranges which are intended to provide a sensitivity analysis as variables are changed but are not intended to imply that actual results could not fall outside of the suggested ranges. The principal reason that we release guidance is to provide a basis for our management to discuss our business outlook with analysts and investors. We do not accept any responsibility for any projections or reports published by any such third parties.
Guidance is necessarily speculative in nature, and it can be expected that some or all of the assumptions underlying the guidance furnished by us will not materialize or will vary significantly from actual results. Accordingly, our guidance is only an estimate of what management believes is realizable as of the date of release. Actual results may vary from our guidance and the variations may be material. For example, in the first and second quarters of fiscal 2014, we announced results that fell below our guidance and below analyst expectations, both of which events resulted in sharp declines in our stock price. If we fail to meet such expectations in the future, the market price of our common stock could again fall substantially and we could face costly lawsuits, including securities class action litigation. We undertake no obligation to make revisions or publicly update our guidance in advance of actual results unless required by law. In light of the foregoing, investors are urged to consider all of the information we make publicly available in making an investment decision regarding our common stock and not rely solely upon our guidance.
Any failure to successfully implement our operating strategy or the occurrence of any of the events or circumstances set forth in this “Risk Factors” section could result in the actual operating results being different from our guidance, and the differences may be adverse and material.
Our share price has been and may continue to be volatile, and you could lose all or part of your investment.
Technology stocks have historically experienced high levels of volatility. The trading price of our common stock has been and is likely to continue to be highly volatile and subject to wide fluctuations in response to various factors, some of which are beyond our control and may not be related to our operating performance. Since shares of our common stock were sold in our IPO in June 2013 at a price of $19.00 per share, the reported high and low sales prices of our common stock have ranged from $9.95 to $41.81 through December 26, 2015. These fluctuations could cause you to lose all or part of your investment in our common stock. Factors that may cause the market price of our common stock to fluctuate include:
• | price and volume fluctuations in the overall stock market from time to time; |
• | significant volatility in the market price and trading volume of technology companies in general, and of companies in our industry; |
• | actual or anticipated changes in our results of operations or fluctuations in our operating results; |
• | whether our operating results meet the expectations of securities analysts or investors; |
• | actual or anticipated changes in the expectations of investors or securities analysts; |
• | actual or anticipated developments in our competitors’ businesses or the competitive landscape generally; |
• | litigation involving us, our industry or both; |
• | regulatory developments in the United States, foreign countries or both; |
• | general economic conditions and trends; |
• | major catastrophic events; |
• | sales of large blocks of our stock; and |
• | departures of key personnel. |
In addition, if the market for technology stocks, or the stock market in general, experiences a loss of investor confidence, the trading price of our common stock could decline for reasons unrelated to our business, operating
32
results or financial condition. The trading price of our common stock might also decline in reaction to events that affect other companies in our industry even if these events do not directly affect us.
In the past, following periods of volatility in the market price of a company’s securities, securities class action litigation has often been brought against that company. If our stock price is volatile, we may become the target of securities litigation. Securities litigation could result in substantial costs and divert our management’s attention and resources from our business, and this could have a material adverse effect on our business, operating results and financial condition.
Sales of outstanding shares of our common stock into the market in the future could cause the market price of our common stock to drop significantly.
If our existing stockholders sell, or indicate an intention to sell, substantial amounts of our common stock in the public market, the trading price of our common stock could decline. For example, if Highland Capital, a venture capital fund and one of our largest investors, distributes all or a significant portion of its shares to its limited partners, the trading price of our common stock could decline. There were 34,323,457 shares of common stock outstanding as of December 26, 2015, all of which are freely tradable, unless such shares are held by “affiliates,” as that term is defined in Rule 144 of the Securities Act of 1933, as amended.
In addition, we have filed a registration statement to register all shares subject to options or restricted stock units that are currently outstanding or that are reserved for future issuance under our equity compensation plans. If these additional shares are sold, or if it is perceived that they will be sold, in the public market, the trading price of our common stock could decline.
If securities analysts do not publish research or reports about our business, or if they downgrade our stock, the price of our stock could decline.
The trading market for our common stock could be influenced by any research and reports that securities or industry analysts publish about us or our business. Securities and industry analysts have only recently commenced research coverage of us. In the event securities or industry analysts who cover our company downgrade our stock or publish inaccurate or unfavorable research about our business, our stock price would likely decline. If one or more of these analysts cease coverage of our company or fail to publish reports on us regularly, demand for our stock could decrease, which could cause our stock price and trading volume to decline.
We do not intend to pay dividends in the foreseeable future.
We intend to retain any earnings to finance the operation and expansion of our business, and we do not anticipate paying any cash dividends on our common stock for the foreseeable future. As a result, you may only receive a return on your investment in our common stock if the market price of our common stock increases.
Provisions in our certificate of incorporation and bylaws and certain provisions under Delaware law might discourage, delay or prevent a change of control of our company or changes in our management and, therefore, depress the trading price of our common stock.
Our certificate of incorporation and bylaws contain provisions that could depress the trading price of our common stock by acting to discourage, delay or prevent a change of control of our company or changes in our management that the stockholders of our company may deem advantageous. These provisions:
• | establish a classified board of directors so that not all members of our board of directors are elected at one time; |
• | authorize the issuance of “blank check” preferred stock that our board of directors could issue to increase the number of outstanding shares to discourage a takeover attempt; |
• | prohibit stockholder action by written consent, which requires all stockholder actions to be taken at a meeting of our stockholders; |
• | prohibit stockholders from calling a special meeting of our stockholders; |
• | provide that the board of directors is expressly authorized to make, alter or repeal our bylaws; and |
• | establish advance notice requirements for nominations for elections to our board of directors or for proposing matters that can be acted upon by stockholders at stockholder meetings. |
Additionally, we are subject to Section 203 of the Delaware General Corporation Law, which generally prohibits a Delaware corporation from engaging in any of a broad range of business combinations with any “interested”
33
stockholder for a period of three years following the date on which the stockholder became an “interested” stockholder and which may discourage, delay or prevent a change of control of our company.
Any provision of our certificate of incorporation or bylaws or Delaware law that has the effect of delaying or deterring a change in control could limit the opportunity for our stockholders to receive a premium for their shares of our common stock, and could also affect the price that some investors are willing to pay for our common stock.
Item 1B. Unresolved Staff Comments
None.
Item 2. Properties
Our worldwide headquarters are located in Santa Clara, California and occupy approximately 105,600 square feet of office space under a sublease arrangement that expires in March 2018 for an aggregate net base rent of $10.7 million. In addition to the base rent, we are responsible for payment of certain operating expenses, including utilities and real estate taxes.
We have additional office locations in the United States and we lease space in various international locations for operations and sales personnel in Australia, Brazil, Canada, China, France, Germany, Hong Kong, Italy, Japan, Mexico, Russia, Singapore, South Korea, the United Kingdom, and the United Arab Emirates. Additionally, we have a research and development facility in Chennai, India. Our current facilities are adequate to meet our existing needs. However, to the extent we meet our current growth expectations, we will need to expand our facilities. We believe that we will be able to obtain additional or substitute facilities on commercially reasonable terms. However, we expect to incur additional expenses in connection with any such new or expanded facilities.
Item 3. Legal Proceedings
We may, from time to time, be subject to legal proceedings and claims arising from the normal course of business activities, and an unfavorable resolution of any of these matters could materially affect our future business, results of operations, financial condition or cash flows.
Item 4. Mine Safety Disclosures
Not applicable.
34
PART II
Item 5. Market for Registrant’s Common Equity, Related Stockholder Matters and Issuer Purchases of Equity Securities
Market Information
Our common stock, $0.0001 par value per share, has been listed on the New York Stock Exchange under the symbol “GIMO” since June 12, 2013. Prior to that date, there was no public trading market for our common stock.
Holders of Record
As of February 15, 2016, there were 141 holders of record of our common stock. Because many of our shares of common stock are held by brokers and other institutions on behalf of stockholders, we are unable to estimate the total number of stockholders represented by these record holders.
Price Range of Our Common Stock
The following table sets forth for the periods indicated the high and low sales prices per share of our common stock as reported on the New York Stock Exchange:
High | Low | |||||
Fiscal 2014: | ||||||
First Quarter | $ | 36.75 | $ | 27.13 | ||
Second Quarter | $ | 31.78 | $ | 14.75 | ||
Third Quarter | $ | 19.76 | $ | 10.11 | ||
Fourth Quarter | $ | 17.88 | $ | 9.95 | ||
Fiscal 2015: | ||||||
First Quarter | $ | 21.99 | $ | 15.10 | ||
Second Quarter | $ | 34.80 | $ | 20.51 | ||
Third Quarter | $ | 33.80 | $ | 21.00 | ||
Fourth Quarter | $ | 29.52 | $ | 18.93 | ||
On December 24, 2015, the last reported sale price of our common stock on the New York Stock Exchange was $26.82 per share.
Dividend Policy
We intend to retain any future earnings and do not currently anticipate paying any cash dividends on our common stock. Any future determination to declare cash dividends will be made at the discretion of our board of directors, subject to applicable laws, and will depend on our financial condition, results of operations, capital requirements, general business conditions and other factors that our board of directors may deem relevant.
Stock Price Performance Graph
This performance graph shall not be deemed “filed” for purposes of Section 18 of the Exchange Act, or incorporated by reference into any filing of Gigamon Inc. under the Securities Act of 1933, as amended, or the Securities Act, except as shall be expressly set forth by specific reference in such filing. The stock price performance on this performance graph is not necessarily indicative of future stock price performance.
This performance graph compares the cumulative total return on our common stock with that of the NYSE Composite Index and the NASDAQ Telecommunications Index. The initial public offering price of our common stock was $19.00 per share and the closing price was $28.47 per share on June 12, 2013. This performance graph assumes $100 was invested in the common stock of Gigamon Inc. at the closing price of $28.47 per share on June 12, 2013 as required by SEC rules and $100 was invested in each of the NYSE Composite Index and the NASDAQ Telecommunications Index on May 31, 2013.
35
COMPARISON OF 30 MONTH CUMULATIVE TOTAL RETURN*
Among Gigamon Inc., the NYSE Composite Index,
and the NASDAQ Telecommunications Index
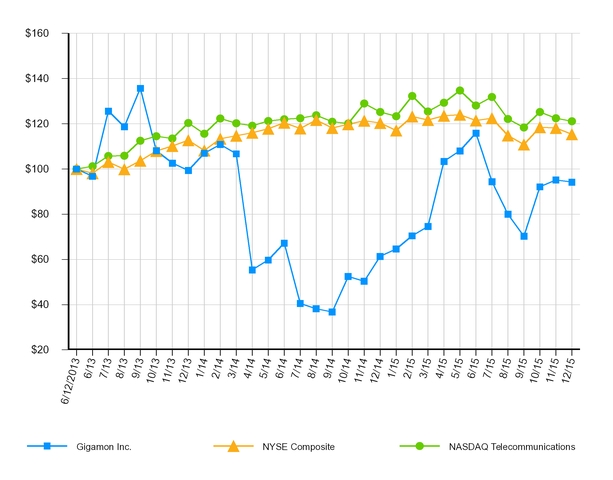
* $100 invested on 6/12/13 in stock or 5/31/13 in index, including reinvestment of dividends. Fiscal year ending December 26, 2015
Recent Sales of Unregistered Securities
None
Issuer Purchases of Equity Securities
None.
Item 6. Selected Consolidated Financial Data
Effective January 1, 2013, we changed our reporting period from a calendar year ending on December 31 of each year to a 52- or 53-week fiscal year that ends on the last Saturday in December. Fiscal years 2015, 2014, and 2013 were 52-week fiscal years that ended on December 26, 2015, December 27, 2014, and December, 28, 2013, respectively. Each quarter in these fiscal years was a 13-week quarter.
The following tables summarize our historical consolidated financial data. We have derived the summary consolidated statement of operations data for fiscal 2015, 2014, and 2013, and the selected consolidated balance sheet data as of December 26, 2015 and December 27, 2014, from our audited consolidated financial statements included elsewhere in this Annual Report on Form 10-K. The consolidated statement of operations data for fiscal 2012 and 2011, and the selected consolidated balance sheet data as of December 28, 2013, and December 31, 2012 and 2011, are derived from our audited consolidated financial statements not included in this Annual Report on Form 10-K. Our historical results are not necessarily indicative of the results that may be expected in the future. The following summary consolidated financial and other data should be read in conjunction with the section titled “Management’s Discussion and Analysis of Financial Condition and Results of Operations” and our consolidated financial statements and related notes included elsewhere in this Annual Report on Form 10-K.
36
Fiscal Year Ended | |||||||||||||||
December 26, 2015 | December 27, 2014 | December 28, 2013 | December 31, 2012 | December 31, 2011 | |||||||||||
(in thousands, except per share amounts) | |||||||||||||||
Consolidated Statement of Operations Data: | |||||||||||||||
Revenue: | |||||||||||||||
Product | $ | 152,734 | $ | 105,594 | $ | 101,717 | $ | 69,516 | $ | 51,308 | |||||
Service | 69,241 | 51,536 | 38,578 | 27,199 | 16,797 | ||||||||||
Total revenue | 221,975 | 157,130 | 140,295 | 96,715 | 68,105 | ||||||||||
Cost of revenue: | |||||||||||||||
Product | 38,878 | 31,001 | 26,103 | 18,039 | 12,528 | ||||||||||
Service | 6,917 | 6,447 | 4,727 | 2,246 | 1,900 | ||||||||||
Total cost of revenue(1) | 45,795 | 37,448 | 30,830 | 20,285 | 14,428 | ||||||||||
Gross profit | 176,180 | 119,682 | 109,465 | 76,430 | 53,677 | ||||||||||
Operating expenses: | |||||||||||||||
Research and development(1) | 49,571 | 42,806 | 42,067 | 17,730 | 12,530 | ||||||||||
Sales and marketing(1) | 87,541 | 76,063 | 72,024 | 39,359 | 19,358 | ||||||||||
General and administrative(1) | 27,459 | 20,683 | 25,575 | 11,665 | 4,766 | ||||||||||
Total operating expenses | 164,571 | 139,552 | 139,666 | 68,754 | 36,654 | ||||||||||
Income (loss) from operations | 11,609 | (19,870 | ) | (30,201 | ) | 7,676 | 17,023 | ||||||||
Interest income | 446 | 308 | 95 | 64 | 4 | ||||||||||
Other expense, net | (191 | ) | (94 | ) | (94 | ) | (70 | ) | (16 | ) | |||||
Income (loss) before income tax(provision) benefit | 11,864 | (19,656 | ) | (30,200 | ) | 7,670 | 17,011 | ||||||||
Income tax (provision) benefit | (5,678 | ) | (21,134 | ) | 20,663 | (139 | ) | (80 | ) | ||||||
Net income (loss) | 6,186 | (40,790 | ) | (9,537 | ) | 7,531 | 16,931 | ||||||||
Accretion of preferred units to redemption value and issuance costs | — | — | (1,088 | ) | (2,236 | ) | (2,078 | ) | |||||||
Loss (earnings) distributable to preferred stock holders | — | — | 1,107 | (1,690 | ) | (4,741 | ) | ||||||||
Net income (loss) attributable to common stockholders | $ | 6,186 | $ | (40,790 | ) | $ | (9,518 | ) | $ | 3,605 | $ | 10,112 | |||
Net income (income) per share attributable to common stockholders: | |||||||||||||||
Basic | $ | 0.18 | $ | (1.27 | ) | $ | (0.39 | ) | $ | 0.21 | $ | 0.58 | |||
Diluted | $ | 0.17 | $ | (1.27 | ) | $ | (0.39 | ) | $ | 0.21 | $ | 0.58 | |||
Weighted average shares used in computing net income (loss) per share attributable to common stockholders: | |||||||||||||||
Basic | 33,618 | 32,200 | 24,722 | 17,300 | 17,300 | ||||||||||
Diluted | 35,866 | 32,200 | 24,722 | 17,303 | 17,300 | ||||||||||
(1)The following tables present stock-based compensation and related payroll tax expense and expenses related to our performance units and related payroll taxes included in each expense category:
Fiscal Year Ended | |||||||||||||||
December 26, 2015 | December 27, 2014 | December 28, 2013 | December 31, 2012 | December 31, 2011 | |||||||||||
(in thousands) | |||||||||||||||
Stock-based compensation and related payroll tax expenses: | |||||||||||||||
Cost of revenue | $ | 1,940 | $ | 1,743 | $ | 3,496 | $ | 153 | $ | — | |||||
Research and development | 9,533 | 8,523 | 11,467 | 542 | 8 | ||||||||||
Sales and marketing | 9,792 | 8,433 | 11,034 | 893 | 2 | ||||||||||
General and administrative | 9,445 | 6,780 | 6,546 | 2,011 | 2 | ||||||||||
Total stock-based compensation and related payroll tax expenses | $ | 30,710 | $ | 25,479 | $ | 32,543 | $ | 3,599 | $ | 12 | |||||
37
Fiscal Year Ended | |||||||||||||||
December 26, 2015 | December 27, 2014 | December 28, 2013 | December 31, 2012 | December 31, 2011 | |||||||||||
(in thousands) | |||||||||||||||
Performance units and related payroll tax expenses: | |||||||||||||||
Cost of revenue | $ | — | $ | — | $ | 353 | $ | — | $ | — | |||||
Research and development | — | — | 5,188 | — | — | ||||||||||
Sales and marketing | — | — | 7,991 | — | — | ||||||||||
General and administrative | — | — | 6,839 | — | — | ||||||||||
Total performance unit and related payroll tax expenses | $ | — | $ | — | $ | 20,371 | $ | — | $ | — | |||||
As of | |||||||||||||||
December 26, 2015 | December 27, 2014 | December 28, 2013 | December 31, 2012 | December 31, 2011 | |||||||||||
(in thousands) | |||||||||||||||
Consolidated Balance Sheet Data: | |||||||||||||||
Cash and cash equivalents | $ | 120,212 | $ | 38,941 | $ | 79,908 | $ | 18,675 | $ | 13,102 | |||||
Short-term investments | 90,001 | 110,465 | 58,242 | — | — | ||||||||||
Working capital | 166,288 | 122,697 | 111,468 | 647 | 183 | ||||||||||
Total assets | 279,911 | 197,986 | 195,517 | 51,497 | 43,995 | ||||||||||
Redeemable convertible preferred units | — | — | — | 28,344 | 26,108 | ||||||||||
Total stockholders’ equity (members’ deficit) | 155,356 | 115,435 | 123,438 | (30,045 | ) | (27,809 | ) | ||||||||
38
Item 7. Management’s Discussion and Analysis of Financial Condition and Results of Operations
The following discussion and analysis of our financial condition and results of operations should be read in conjunction with our consolidated financial statements and related notes included elsewhere in this Annual Report on Form 10-K. In addition to historical financial information, this discussion contains forward-looking statements that reflect our plans, estimates and beliefs. The words “believe,” “may,” “will,” “estimate,” “continue,” “anticipate,” “intend,” “expect,” and similar expressions are intended to identify forward-looking statements. Our actual results could differ materially from those contained in or implied by any forward-looking statements. Factors that could cause or contribute to those differences include, but are not limited to, those identified below and those discussed above in the section titled “Risk Factors” and elsewhere in this Annual Report on Form 10-K.
Overview
We have developed an innovative solution that delivers pervasive and dynamic intelligent visibility and control of traffic across networks. Our Visibility Fabric consists of a distributed system of nodes that enable an advanced level of visibility, modification and control of network traffic. Our Visibility Fabric solution is comprised of data center and central office physical appliances, virtual nodes in virtualized or private cloud environments, and small form-factor remote site appliances that in combination enable pervasive visibility of network infrastructures. We believe our Visibility Fabric enables organizations to significantly improve their cyber-security posture by leveraging the power of network visibility to establish visibility within the perimeter of their IT infrastructure; mobile service providers to gain subscriber-aware visibility into their IT infrastructure enabling them to reduce operational costs, increase revenue generating opportunities and provide improved services for the subscribers; and IT departments to significantly increase the effectiveness, efficiency and performance of their network management, analysis and compliance tools.
We generate product revenue primarily from sales of perpetual software licenses installed on physical appliances for our Visibility Fabric solution to channel partners, including distributors and resellers, as well as directly to end-user customers. We sell our products directly through our own sales force and indirectly through our channel partners. We provide our channel partners with marketing assistance, technical training and support.
We generate service revenue primarily from the sale of maintenance and support services for our products. Starting in the quarter ending September 26, 2015, we began to sell first year maintenance and support as an additional offering. Prior to that time, the first year of maintenance and support services was generally bundled or purchased with the initial contract to purchase our products. Following expiration of this one-year contract, our end-user customers typically purchase maintenance and support contracts that generally have one-year terms.
We have experienced significant growth since our inception in 2004. Our revenue increased from $68.1 million in fiscal 2011 to $222.0 million in fiscal 2015, representing a compounded annual growth rate, or CAGR, of 27%. In fiscal 2015, we had more than 1,900 customers as compared to approximately 1,600 customers in fiscal 2014. Our net income was $6.2 million in fiscal 2015, and our net loss was $40.8 million and $9.5 million in fiscal 2014 and 2013, respectively. Our net loss in fiscal 2013 included a one-time cash charge of $20.4 million relating to performance unit payments as a result of our IPO in June 2013. We generated cash from operations of $63.4 million, $11.1 million, and $23.3 million in fiscal 2015, 2014 and 2013, respectively. We operate as a single reportable segment.
Key Performance Indicators of Our Business
We monitor a variety of key performance indicators to help us evaluate growth trends, establish budgets, measure the effectiveness of our sales and marketing efforts and assess operational efficiencies. These key performance indicators include the following (dollars in thousands):
Fiscal Year Ended | |||||||||
December 26, 2015 | December 27, 2014 | December 28, 2013 | |||||||
Key Performance Indicators: | |||||||||
Revenue | $ | 221,975 | $ | 157,130 | $ | 140,295 | |||
Gross margin | 79 | % | 76 | % | 78 | % | |||
Income (loss) from operations | $ | 11,609 | $ | (19,870 | ) | $ | (30,201 | ) | |
Deferred service revenue | $ | 73,454 | $ | 51,699 | $ | 40,329 | |||
Revenue. We monitor our revenue to assess the acceptance of our products and services by our end-user customers and growth in the markets we serve.
39
Gross margin. We monitor our gross margin to assess the impact on our current and forecasted financial results from any changes to the pricing and mix of products we are selling to our customers.
Income (loss) from operations. We monitor our income (loss) from operations to assess how effectively we are conducting our operations as well as controlling our operating expenses, which are primarily driven by headcount.
Deferred service revenue. Our deferred service revenue consists of the unamortized portion of service revenue from maintenance and support contracts. We monitor our deferred service revenue balance because it represents a significant portion of the revenue that we will recognize in future periods. We assess the change in our deferred service revenue balance which, taken together with revenue, is an indication of sales activity in a given period.
Initial Public Offering and Follow-On Public Offering
On June 17, 2013, we completed our IPO, in which 7,762,500 shares of common stock were sold at a public offering price of $19.00 per share. We issued and sold 5,512,500 shares of common stock, inclusive of the 1,012,500 shares of common stock sold in connection with the full exercise of the overallotment option of shares granted to the underwriters, at a public offering price of $19.00 per share. We received proceeds of $93.4 million, net of underwriting discounts and commissions and offering expenses. In addition, our selling stockholders sold 2,250,000 shares of common stock at a public offering price of $19.00 per share. We did not receive any proceeds from the sale of shares by the selling stockholders.
On October 28, 2013, we completed a follow-on public offering, in which 5,100,000 shares of our common stock were sold at a public offering price of $38.50 per share. We issued and sold 300,000 shares of common stock, for which we received proceeds of $10.2 million, net of underwriting discounts and commissions and offering expenses. In addition, our selling stockholders sold 4,800,000 shares of common stock, which included 293,718 shares of common stock issued upon the exercise of options by certain selling stockholders with an aggregate exercise price of $1.3 million, at a public offering price of $38.50 per share. We did not receive any proceeds from the sale of shares by the selling stockholders.
Financial Overview
Revenue
We generate revenue from the sale of products and related services, including maintenance and support. We present revenue net of discounts, rebates and sales taxes. Our revenue is comprised of the following:
Product revenue. We generate product revenue primarily from sales of perpetual software licenses installed on physical appliances for our Visibility Fabric. We generally recognize product revenue at the time of product delivery, provided that all other revenue recognition criteria have been met. As a percentage of revenue, we expect our product revenue to vary from quarter-to-quarter based on, among other things, the timing of orders, the delivery of products, and seasonal and cyclical factors discussed under the section titled “Results of Operations”.
We have experienced seasonality in the sale of our products. The first quarter of each year is usually our lowest revenue quarter during the year and product revenue typically declines sequentially from the prior fourth quarter. We generally expect an increase in sales in the second half of the year relative to the first half, primarily due to the buying habits of many of our end-user customers as budgets for annual capital purchases are being fully utilized.
We expect our product revenue to increase as we continue to add new end-user customers, expand the volume of shipments to our current end-user customers and introduce new products.
Service revenue. We generate service revenue from sales of maintenance and support contracts, which may be bundled with sales of products, and from sales and subsequent renewals of maintenance and support contracts. We offer tiered maintenance and support services under our renewable, fee-based maintenance and support contracts, which include technical support, bug fixes, patches and unspecified upgrades on a when-and-if-available basis. We recognize service revenue ratably over the duration of the contract, which is typically one year and can be for multiple years depending on the customer contract. As a result, the impact on service revenue will lag any shift in product revenue because product revenue is recognized when a product is sold and revenue criteria are satisfied, whereas service revenue is recognized ratably over the contract term. We expect our service revenue to increase as we expand our installed base by selling more products and adding more end-user customers.
Cost of revenue
Our cost of revenue consists of the following:
40
Cost of product revenue. Cost of product revenue is comprised primarily of the costs associated with manufacturing our products, including third party hardware manufacturing costs; personnel costs for salary, benefits, bonuses and stock-based compensation expense; shipping costs; allocated costs of facilities and information technology; any inventory write-downs; and warranty costs and other related expenses. We expect cost of product revenue to increase in connection with the anticipated increase in product revenue.
Cost of service revenue. Cost of service revenue is comprised primarily of personnel costs for salary, benefits, bonuses and stock-based compensation expense related to our customer support organization, as well as allocated costs of facilities, information technology and engineering. We expect cost of service revenue to increase in connection with the anticipated increase in service revenue.
Gross profit and gross margin
Gross profit has been and will continue to be affected by a variety of factors including shipment volumes, changes in the mix of products and services sold, changes in our product costs including any inventory write-downs, new product introductions and upgrades to existing products, changes in customer mix, changes in pricing and the extent of customer rebates and incentive programs. We expect our gross margin to fluctuate over time depending on a variety of factors, including those described above.
Operating expenses
Operating expenses consist of research and development, sales and marketing and general and administrative expenses. Personnel costs comprise a significant component of our operating expenses, and consist of salaries, benefits, bonuses and stock-based compensation expense; and with respect to our sales organization, personnel costs also include sales commissions. The number of employees attributable to our operating expenses increased to 446 as of December 26, 2015, compared to 340 as of December 27, 2014 and 326 as of December 28, 2013. We expect to continue to hire new employees to support our anticipated growth, particularly with respect to an anticipated increase in sales and marketing and research and development employees in fiscal 2016. We expect operating expenses to increase as we continue to grow. However, we generally expect these increases to be at a lower rate than our increase in revenue.
Research and development. Our research and development efforts are focused on new product development and on developing additional functionality for our existing products. Research and development expenses consist primarily of personnel costs, and to a lesser extent, prototype materials, allocated costs of facilities and information technology and product certification. We expense research and development costs as incurred. We expect our research and development expenses to increase as we continue to develop new products and enhance our existing products. However, we generally expect these increases to be at a lower rate than our increase in revenue.
Sales and marketing. Sales and marketing expenses are the largest component of our operating expenses and consist primarily of personnel costs, as well as travel expenses, trade shows, marketing and promotional activities, and allocated costs of facilities and information technology. We sell our products through our global sales organization, which is divided into three geographic regions: (i) the Americas (which includes the United States, Canada and Latin America), (ii) Europe, the Middle East and Africa (EMEA) and (iii) Asia Pacific. We expect our sales and marketing expenses to increase as we expand our sales and marketing efforts internationally and domestically to help drive increased revenue. However, we generally expect these increases to be at a lower rate than our increase in revenue.
General and administrative. General and administrative expenses consist of personnel costs and allocated costs of facilities and information technology related to our executive, finance, human resources and legal functions, as well as professional services costs. Professional services costs consist primarily of outside legal and accounting services. We have incurred and expect to continue to incur expenses as a result of operating as a public company, including costs to comply with the rules and regulations applicable to companies listed on a national securities exchange and costs related to compliance and reporting obligations. However, we generally expect any increases to be at a lower rate than our increase in revenue.
Interest income and other income (expense), net
Interest income consists primarily of income earned on our invested cash, cash equivalents and short-term investments. Historically, interest income has not been material, but it has increased with the level of invested cash.
Other income (expense), net consists primarily of foreign currency exchange gains (losses) related to transactions denominated in currencies other than the U.S. dollar, which have not been material to date.
(Provision) benefit for income taxes
41
Prior to May 31, 2013, we conducted our operations through Gigamon LLC, a pass through entity that filed its income tax return as a partnership for federal and state income tax purposes. As a result, prior to May 31, 2013, we were not subject to U.S. federal or state income taxes as our taxable income was reported by our individual members.
On May 31, 2013, we converted from a Delaware limited liability company (a pass through entity not subject to U.S. federal and state income taxes) to a Delaware corporation. Accordingly, following such conversion, we elected to be treated as a corporation under Subchapter C of Chapter 1 of the United States Internal Revenue Code, as amended, or the Code, and, therefore, are subject to both federal and state income taxes. As a result of this tax election, we recorded a one-time non-cash income tax benefit of $14.8 million in fiscal 2013, for the deferred tax asset amount recorded upon our change in entity status from a Delaware limited liability company to a Delaware corporation. The provision for income taxes in fiscal 2014, was primarily related to the establishment of a valuation allowance against the deferred tax assets in the United States during the second quarter of fiscal 2014 and for taxes assessed by foreign jurisdictions. As of June 28, 2014 it was assessed that it is more-likely-than-not that we will not realize our federal and state deferred tax assets based on the absence of sufficient positive objective evidence that we would generate sufficient taxable income in our United States tax jurisdiction to realize the deferred tax assets. Accordingly, a valuation allowance on our federal and state deferred tax assets for an amount of $24.6 million was charged to the income tax provision.
The recording of this valuation allowance was primarily due to ongoing losses and the uncertainty regarding future results adjusted for permanent differences which resulted in a more likely than not determination that our deferred tax assets would not be realized. In making this determination, we considered all available evidence, both positive and negative. Such evidence included, among other factors, our history of profitability and losses, jurisdictional income recognition trends, pretax losses adjusted for certain other items, and future forecasted income by jurisdiction. The benefit from income taxes for the six months ended June 29, 2013 was $25.0 million. This was the initial recognition of deferred tax assets, upon the conversion of the limited liability company to a corporation, partially offset by current foreign taxes. We are also subject to state taxes in certain states that may assess capital taxes or taxes based on gross receipts. We also have subsidiaries in foreign jurisdictions, which are subject to income taxes in the jurisdictions in which they operate.
Stock-based compensation expense and other compensation charges
Prior to the formation of our company in 2009, Gigamon Systems LLC, our majority stockholder prior to the LLC Conversion, issued options to purchase its common units to some of its employees. As these employees became our employees upon the contribution of all of the assets and liabilities of Gigamon Systems LLC to us in January 2009, we assumed all of the necessary tax obligations and recorded a relatively small stock-based compensation expense related to these options in our consolidated statement of operations. Between January 1, 2009 and December 31, 2011, instead of granting stock options to our employees, we granted performance units to our employees under our 2009 Performance Unit Plan. The vested performance units were satisfied by us with a cash payment to the holders of performance units in connection with the completion of our IPO. Accordingly, the grant of performance units did not result in stock-based compensation expense or compensation charges in any period prior to the completion of our IPO, but, upon the completion of our IPO, we recorded cash-based compensation expense and related payroll taxes of $20.4 million for our performance units based on our IPO price of $19.00 per share, which is reflected in cost of revenue and operating expenses in the second quarter of fiscal 2013.
We began granting stock options in April 2012 and began granting restricted stock units, or RSUs, in August 2012. Prior to the second quarter of fiscal 2013, we did not record any stock-based compensation expense associated with stock options and RSUs that did not begin to vest until the completion of our IPO, or the IPO Awards. Upon the completion of our IPO in fiscal 2013, we recorded stock-based compensation expense of $5.5 million, net of estimated forfeitures, related to these IPO Awards and began offering eligible employees the opportunity to purchase shares under our 2013 Employee Stock Purchase Plan. Total stock-based compensation expense, net of estimated forfeitures, was $29.8 million, $24.7 million, and $32.5 million in fiscal 2015, 2014, and 2013, respectively. As of December 26, 2015, unrecognized stock-based compensation expense, net of estimated forfeitures, was $22.9 million. To the extent actual forfeiture rates are different from what we have anticipated, stock-based compensation expense related to these awards will be different from our expectations.
Reporting Calendar
Effective January 1, 2013, we changed our reporting period from a calendar year ending on December 31 of each year to a 52- or 53-week fiscal year ending on the last Saturday in December. Fiscal 2015, 2014 and 2013 were each a 52-week fiscal year ending on December 26, 2015, December 27, 2014, and December 28, 2013,
42
respectively and each quarter was a 13-week quarter. Fiscal year 2016 will be a 53-week fiscal year ending on December 31, 2016, with the first quarter being a 14-week quarter ending on April 2, 2016 and each subsequent quarter being a 13-week quarter.
Results of Operations
The following tables set forth our results of operations for the fiscal years presented in dollars and as a percentage of our revenue (in thousands, except percentages):
Fiscal Year Ended | |||||||||
December 26, 2015 | December 27, 2014 | December 28, 2013 | |||||||
Consolidated Statement of Operations Data: | |||||||||
Revenue: | |||||||||
Product | $ | 152,734 | $ | 105,594 | $ | 101,717 | |||
Service | 69,241 | 51,536 | 38,578 | ||||||
Total revenue | 221,975 | 157,130 | 140,295 | ||||||
Cost of revenue: | |||||||||
Product | 38,878 | 31,001 | 26,103 | ||||||
Service | 6,917 | 6,447 | 4,727 | ||||||
Total cost of revenue | 45,795 | 37,448 | 30,830 | ||||||
Gross profit | 176,180 | 119,682 | 109,465 | ||||||
Operating expenses: | |||||||||
Research and development | 49,571 | 42,806 | 42,067 | ||||||
Sales and marketing | 87,541 | 76,063 | 72,024 | ||||||
General and administrative | 27,459 | 20,683 | 25,575 | ||||||
Total operating expenses | 164,571 | 139,552 | 139,666 | ||||||
Income (loss) from operations | 11,609 | (19,870 | ) | (30,201 | ) | ||||
Interest income | 446 | 308 | 95 | ||||||
Other expense, net | (191 | ) | (94 | ) | (94 | ) | |||
Income (loss) before income tax (provision) benefit | 11,864 | (19,656 | ) | (30,200 | ) | ||||
Income tax (provision) benefit | (5,678 | ) | (21,134 | ) | 20,663 | ||||
Net income (loss) | $ | 6,186 | $ | (40,790 | ) | $ | (9,537 | ) | |
Net income (loss) includes stock-based compensation expense and performance units expense allocated as follows: | |||||||||
Stock-based compensation and related payroll tax expenses: | |||||||||
Cost of revenue | $ | 1,940 | $ | 1,743 | $ | 3,496 | |||
Research and development | 9,533 | 8,523 | 11,467 | ||||||
Sales and marketing | 9,792 | 8,433 | 11,034 | ||||||
General and administrative | 9,445 | 6,780 | 6,546 | ||||||
Total stock-based compensation and related payroll tax expenses | $ | 30,710 | $ | 25,479 | $ | 32,543 | |||
Performance unit and related payroll tax expenses: | |||||||||
Cost of revenue | $ | — | $ | — | $ | 353 | |||
Research and development | — | — | 5,188 | ||||||
Sales and marketing | — | — | 7,991 | ||||||
General and administrative | — | — | 6,839 | ||||||
Total performance unit and related payroll tax expenses | $ | — | $ | — | $ | 20,371 | |||
43
Fiscal Year Ended | ||||||
December 26, 2015 | December 27, 2014 | December 28, 2013 | ||||
Percentage of Revenue: | ||||||
Revenue: | ||||||
Product | 69 | % | 67 | % | 73 | % |
Service | 31 | % | 33 | % | 27 | % |
Total revenue | 100 | % | 100 | % | 100 | % |
Cost of revenue | 21 | % | 24 | % | 22 | % |
Gross margin | 79 | % | 76 | % | 78 | % |
Operating expenses: | ||||||
Research and development | 22 | % | 27 | % | 30 | % |
Sales and marketing | 40 | % | 49 | % | 51 | % |
General and administrative | 12 | % | 13 | % | 19 | % |
Total operating expenses | 74 | % | 89 | % | 100 | % |
Income (loss) from operations | 5 | % | (13 | )% | (22 | )% |
Interest income | — | % | — | % | — | % |
Other expense, net | — | % | — | % | — | % |
Income (loss) before income tax (provision) benefit | 5 | % | (13 | )% | (22 | )% |
Income tax (provision) benefit | (2 | )% | (13 | )% | 15 | % |
Net income (loss) | 3 | % | (26 | )% | (7 | )% |
Comparison of Fiscal 2015 and Fiscal 2014
Revenue
Fiscal Year Ended | |||||||||||
December 26, 2015 | December 27, 2014 | Increase | % Increase | ||||||||
(dollars in thousands) | |||||||||||
Revenue: | |||||||||||
Product | $ | 152,734 | $ | 105,594 | $ | 47,140 | 45 | % | |||
Service | 69,241 | 51,536 | 17,705 | 34 | % | ||||||
Total revenue | $ | 221,975 | $ | 157,130 | $ | 64,845 | 41 | % | |||
Product revenue increased $47.1 million in fiscal 2015 as compared to fiscal 2014, primarily due to the increase in sales of our high density H Series products, along with incremental revenue from our software and security product offerings.
Service revenue increased $17.7 million in fiscal 2015, compared to fiscal 2014, primarily due to the growth in our installed base of end-user customers under maintenance and support contracts.
44
Cost of revenue and gross margin
Fiscal Year Ended | |||||||||||
December 26, 2015 | December 27, 2014 | Increase | % Increase | ||||||||
(dollars in thousands) | |||||||||||
Cost of revenue: | |||||||||||
Product | $ | 38,878 | $ | 31,001 | $ | 7,877 | 25 | % | |||
Service | 6,917 | 6,447 | 470 | 7 | % | ||||||
Total cost of revenue | $ | 45,795 | $ | 37,448 | $ | 8,347 | 22 | % | |||
Gross margin: | |||||||||||
Product | 75 | % | 71 | % | |||||||
Service | 90 | % | 87 | % | |||||||
Total gross margin | 79 | % | 76 | % | |||||||
Stock-based compensation and related payroll tax expense included in cost of revenue | $ | 1,940 | $ | 1,743 | |||||||
Total gross margin increased to 79% in fiscal 2015 from 76% in fiscal 2014. This improvement was driven by a $1.9 million net decrease in inventory write downs, product cost reductions from our contract manufacturers, pricing improvements, favorable product mix with higher software content, and efficiency gains associated with supporting a larger installed base of end-user customers under maintenance and support contracts.
Product gross margin increased to 75% in fiscal 2015 from 71% in fiscal 2014. This improvement was driven by a net decrease in inventory write-downs, product cost reductions from our contract manufacturers, pricing improvements, and favorable product mix with higher software content.
Service gross margin increased to 90% in fiscal 2015 from 87% in fiscal 2014, primarily due to increased operating efficiencies associated with supporting a larger installed base of end-user customers under maintenance and support contracts.
Operating expenses
Fiscal Year Ended | |||||||||||
December 26, 2015 | December 27, 2014 | Increase | % Increase | ||||||||
(dollars in thousands) | |||||||||||
Operating expenses: | |||||||||||
Research and development | $ | 49,571 | $ | 42,806 | $ | 6,765 | 16 | % | |||
Sales and marketing | 87,541 | 76,063 | 11,478 | 15 | % | ||||||
General and administrative | 27,459 | 20,683 | 6,776 | 33 | % | ||||||
Total operating expenses | $ | 164,571 | $ | 139,552 | $ | 25,019 | 18 | % | |||
Stock-based compensation and related payroll tax expense included in: | |||||||||||
Research and development | $ | 9,533 | $ | 8,523 | $ | 1,010 | 12 | % | |||
Sales and marketing | 9,792 | 8,433 | 1,359 | 16 | % | ||||||
General and administrative | 9,445 | 6,780 | 2,665 | 39 | % | ||||||
Total stock-based compensation expense | $ | 28,770 | $ | 23,736 | $ | 5,034 | 21 | % | |||
Research and development expenses increased $6.8 million in fiscal 2015 compared to fiscal 2014.This increase was primarily driven by $5.3 million of additional employee costs, which were primarily comprised of a $2.8 million increase in bonus expenses, $1.5 million additional payroll and contractor related expenses and $1.0 million increase in stock-based compensation and related payroll tax expenses. The remaining research and development expense increase was driven by a $0.8 million increase in facilities and IT related expenses and $0.4 million increase in depreciation expense.
Sales and marketing expenses increased $11.5 million in fiscal 2015 compared to fiscal 2014.This increase was driven by a $9.5 million increase in employee costs, which were largely comprised of increased commission
45
expenses and incentive expenses of $4.9 million, increased stock-based compensation expenses and related payroll tax expenses of $1.4 million and an increase in bonus expenses of $1.1 million.
General and administrative expenses increased $6.8 million in fiscal 2015 compared to fiscal 2014. This increase was primarily driven by a $6.4 million increase in employee costs, which included a $2.7 million increase in stock based compensation and related payroll tax expenses and a $2.2 million increase in bonus expenses.
Income Tax Provision
Fiscal Year Ended | % Change | ||||||||||
December 26, 2015 | December 27, 2014 | Change | |||||||||
(dollars in thousands) | |||||||||||
Income tax provision | $ | (5,678 | ) | $ | (21,134 | ) | $ | 15,456 | (73 | )% | |
We account for income taxes under the asset and liability approach. This process involves estimating our actual current tax exposure and including assessing the risks associated with tax audits, and assessing temporary differences resulting from different treatment of items for tax and accounting purposes. These differences result in deferred tax assets and liabilities. We then assess the likelihood that our deferred tax assets will be recovered from future taxable income and, to the extent we believe that recovery is not likely, we establish a valuation allowance. Significant judgment is required in determining whether the valuation allowance should be recorded against deferred tax assets. In assessing the need for a valuation allowance, we consider all available evidence including past operating results and estimates of future forecasted taxable income or losses.
The provision for income taxes for the year ended December 26, 2015, was primarily related to taxable income in the United States with additional taxes assessed by foreign jurisdictions. As of December 26, 2015, we assessed that it is more-likely-than-not that we will not realize our federal and state deferred tax assets based on the absence of sufficient positive objective evidence that we would generate sufficient income in the United States to realize the deferred tax assets. Accordingly, we recorded a valuation allowance on our federal and state deferred tax assets. In making this determination, we considered all available evidence, both positive and negative. Such evidence included, among others, our history of profitability and losses, jurisdictional income recognition trends, pretax losses adjusted for certain other items, and forecasted income by jurisdiction.
The provision for income taxes for fiscal 2014 was primarily related to the establishment of a valuation allowance against the deferred tax assets in the United States and the taxes assessed by foreign jurisdictions. As of June 28, 2014 we assessed that it was more-likely-than-not that we would not realize our federal and state deferred tax assets based on the absence of sufficient positive objective evidence that we would generate sufficient taxable income in our United States tax jurisdiction to realize the deferred tax assets. Accordingly, we recorded a valuation allowance on our federal and state deferred tax assets for an amount of $24.6 million which was charged to the income tax provision.
Comparison of Fiscal 2014 and Fiscal 2013
Revenue
Fiscal Year Ended | |||||||||||
December 27, 2014 | December 28, 2013 | Increase | % Increase | ||||||||
(dollars in thousands) | |||||||||||
Revenue: | |||||||||||
Product | $ | 105,594 | $ | 101,717 | $ | 3,877 | 4 | % | |||
Service | 51,536 | 38,578 | 12,958 | 34 | % | ||||||
Total revenue | $ | 157,130 | $ | 140,295 | $ | 16,835 | 12 | % | |||
Product revenue increased $3.9 million in fiscal 2014 as compared to fiscal 2013, primarily due to a $22.4 million increase in sales of our high density, H-Series products offset in part by a decrease in the volume of sales of our G-Series products of $18.5 million.
46
Service revenue increased $13.0 million in fiscal 2014, compared to fiscal 2013, primarily due to the growth in our installed base of end-user customers under maintenance and support contracts.
Cost of revenue and gross margin
Fiscal Year Ended | |||||||||||
December 27, 2014 | December 28, 2013 | Increase/ (decrease) | % Increase/ (decrease) | ||||||||
(dollars in thousands) | |||||||||||
Cost of revenue: | |||||||||||
Product | $ | 31,001 | $ | 26,103 | $ | 4,898 | 19 | % | |||
Service | 6,447 | 4,727 | 1,720 | 36 | % | ||||||
Total cost of revenue | $ | 37,448 | $ | 30,830 | $ | 6,618 | 21 | % | |||
Gross margin: | |||||||||||
Product | 71 | % | 74 | % | |||||||
Service | 87 | % | 88 | % | |||||||
Total gross margin | 76 | % | 78 | % | |||||||
Stock-based compensation expense included in cost of revenue | $ | 1,743 | $ | 3,496 | (1,753 | ) | (50 | )% | |||
Performance units expense included in cost of revenue | $ | — | $ | 353 | (353 | ) | (100 | )% | |||
Total gross margin decreased to 76% in fiscal 2014 from 78% in fiscal 2013 primarily due to a net increase in inventory write-downs offset in part by a decrease in stock-based compensation expense and Performance Unit Plan or "PUP" expenses.
Product gross margin decreased to 71% in fiscal 2014 from 74% in fiscal 2013, primarily attributable to a net increase of inventory write-downs, offset in part by a decrease in stock-based compensation and PUP expenses.
Service gross margin decreased to 87% in fiscal 2014 from 88% in fiscal 2013, primarily due toincreased personnel costs and allocated expenses to support the higher number of maintenance and support contracts, partially offset by reduced stock-based compensation and PUP expenses.
Operating expenses
Fiscal Year Ended | |||||||||||
December 27, 2014 | December 28, 2013 | Increase/ (decrease) | % Increase/ (decrease) | ||||||||
(dollars in thousands) | |||||||||||
Operating expenses: | |||||||||||
Research and development | $ | 42,806 | $ | 42,067 | $ | 739 | 2 | % | |||
Sales and marketing | 76,063 | 72,024 | 4,039 | 6 | % | ||||||
General and administrative | 20,683 | 25,575 | (4,892 | ) | (19 | )% | |||||
Total operating expenses | $ | 139,552 | $ | 139,666 | $ | (114 | ) | * | |||
Stock-based compensation and related payroll tax expense included in: | |||||||||||
Research and development | $ | 8,523 | $ | 11,467 | $ | (2,944 | ) | (26 | )% | ||
Sales and marketing | 8,433 | 11,034 | $ | (2,601 | ) | (24 | )% | ||||
General and administrative | 6,780 | 6,546 | $ | 234 | 4 | % | |||||
Total stock-based compensation expense | $ | 23,736 | $ | 29,047 | $ | (5,311 | ) | (18 | )% | ||
Performance units and related payroll tax expense included in: | |||||||||||
Research and development | — | 5,188 | $ | (5,188 | ) | (100 | )% | ||||
Sales and marketing | — | 7,991 | $ | (7,991 | ) | (100 | )% | ||||
General and administrative | — | 6,839 | $ | (6,839 | ) | (100 | )% | ||||
Total performance units expense | $ | — | $ | 20,018 | $ | (20,018 | ) | (100 | )% | ||
* Not meaningful
47
Research and development expenses increased $0.7 million in fiscal 2014 compared to fiscal 2013. This increase in research and development expenses was primarily due to increased facilities rent and depreciation costs of $2.7 million and were partially offset by a $2.1 million decrease in personnel related costs largely associated with decreased stock-based compensation and PUP related costs. Net of stock-based compensation expense and expenses related to our performance units, research and development expenses increased $8.9 million, primarily attributable to increased facilities rent and depreciation costs of $2.7 million combined with a $6.0 million increase in personnel related and benefit related costs.
Sales and marketing expenses increased $4.0 million in fiscal 2014 compared to fiscal 2013.The increase in sales and marketing expenses was primarily due to an increased number of employees and personnel related costs of $12.0 million, combined with increased facilities costs of $1.9 million and increased marketing related spending of $0.9 million. These increases were offset by a $10.6 million decrease in stock based compensation and PUP related costs. Net of stock-based compensation expense and expenses related to our performance units, sales and marketing expenses increased $14.6 million, primarily attributable to increased employees and personnel related costs of $10.0 million, combined with increased facilities costs of $1.9 million and increased marketing related spending of $0.9 million.
General and administrative expenses decreased $4.9 million in fiscal 2014 compared to fiscal 2013. This decrease in general and administrative expenses was primarily due to a $6.6 million decrease in stock based compensation expenses and PUP related costs. Net of expenses related to our performance units and stock-based compensation expense, general and administrative expenses increased $1.7 million. This increase was primarily due to increases in facilities rent, general office related expenses including business insurance, and depreciation expenses of $1.2 million. Additionally, we had an increase in personnel related expenses of $0.4 million.
Income Tax (Provision) Benefit
Fiscal Year Ended | % Change | ||||||||||
December 27, 2014 | December 28, 2013 | Change | |||||||||
(dollars in thousands) | |||||||||||
Income tax (provision) benefit | $ | (21,134 | ) | $ | 20,663 | $ | (41,797 | ) | (202 | )% | |
We account for income taxes under the asset and liability approach. This process involves estimating our actual current tax exposure and including assessing the risks associated with tax audits, and assessing temporary differences resulting from different treatment of items for tax and accounting purposes. These differences result in deferred tax assets and liabilities. We then assess the likelihood that our deferred tax assets will be recovered from future taxable income and, to the extent we believe that recovery is not likely, we establish a valuation allowance. Significant judgment is required in determining whether the valuation allowance should be recorded against deferred tax assets. In assessing the need for a valuation allowance, we consider all available evidence including past operating results and estimates of future forecasted taxable income or losses.
The provision for income taxes for fiscal 2014 was primarily related to the establishment of a valuation allowance against the deferred tax assets in the United States and the taxes assessed by foreign jurisdictions. As of June 28, 2014 we have assessed that it is more-likely-than-not that we will not realize our federal and state deferred tax assets based on the absence of sufficient positive objective evidence that we would generate sufficient taxable income in our United States tax jurisdiction to realize the deferred tax assets. Accordingly, we recorded a valuation allowance on our federal and state deferred tax assets for an amount of $24.6 million which was charged to the income tax provision. The recording of the valuation allowance was mainly due to ongoing losses and uncertainty regarding future results adjusted for permanent differences which has resulted in a more likely than not determination that the deferred tax assets would not be realized. In making this determination, we considered all available evidence, both positive and negative. Such evidence included, among other factors, our history of profitability and losses, jurisdictional income recognition trends, pretax losses adjusted for certain other items, and forecasted income by jurisdiction. The benefit from income taxes for the six months ended June 29, 2013 was $25.0 million. This was the initial recognition of deferred tax assets, upon the conversion of the limited liability company to a corporation, partially offset by current foreign taxes.
Non-GAAP Financial Measures
We report all financial information required in accordance with GAAP but we believe that evaluating our ongoing operating results may be difficult to understand if limited to reviewing only GAAP financial measures. Many of our investors have requested that we disclose non-GAAP information because it is useful in understanding our
48
performance as it excludes amounts that many investors feel may obscure our true operating results. Likewise, management uses non-GAAP measures to manage and assess the profitability of our business going forward and does not consider stock-based compensation expense or expenses related to our performance units and related taxes in managing our operations. Specifically, management does not consider these expenses or benefits when developing and monitoring our budgets and spending. As a result, we use calculations of non-GAAP net income and non-GAAP net income per share, which exclude these expenses when evaluating our ongoing operations and allocating resources within the organization.
Reconciliations of our GAAP and non-GAAP financial measures were as follows (in thousands, except per share amounts):
Fiscal Year Ended | |||||||||
December 26, 2015 | December 27, 2014 | December 28, 2013 | |||||||
GAAP net income (loss) attributable to common stockholders | $ | 6,186 | $ | (40,790 | ) | $ | (9,518 | ) | |
Stock-based compensation | 29,768 | 24,658 | 32,543 | ||||||
Stock-based compensation related payroll taxes | 942 | 821 | — | ||||||
Performance unit expense | — | — | 20,371 | ||||||
Accretion of preferred stock to redemption value and issuance costs | — | — | 1,088 | ||||||
(Loss) earnings distributable to preferred stockholders | — | — | (1,107 | ) | |||||
Tax benefit upon conversion of LLC to a C corporation | — | — | (14,811 | ) | |||||
Income tax effect of non-GAAP adjustments | (7,913 | ) | 19,271 | (12,673 | ) | ||||
Non-GAAP net income | $ | 28,983 | $ | 3,960 | 15,893 | ||||
Basic GAAP net income (loss) per share attributable to common stockholders | $ | 0.18 | $ | (1.27 | ) | $ | (0.39 | ) | |
Diluted GAAP net income (loss) per share attributable to common stockholders | $ | 0.17 | $ | (1.27 | ) | $ | (0.39 | ) | |
Basic Non-GAAP net income per share | $ | 0.86 | $ | 0.12 | $ | 0.64 | |||
Diluted Non-GAAP net income per share | $ | 0.80 | $ | 0.12 | $ | 0.53 | |||
GAAP and Non-GAAP weighted average number of shares - Basic | 33,618 | 32,200 | 24,722 | ||||||
GAAP weighted average number of shares - Diluted | 35,866 | 32,200 | 24,722 | ||||||
Stock-based compensation impact on weighted average number of shares | 491 | 1,394 | 5,323 | ||||||
Non-GAAP weighted average number of shares - Diluted | 36,357 | 33,594 | 30,045 | ||||||
** Non-GAAP tax provision excludes the tax benefits upon conversion of LLC to a C corporation, the recording of a valuation allowance on the deferred tax assets, and the tax benefit relating to stock-based compensation expense.
Liquidity and Capital Resources
As of December 26, 2015, our principal sources of liquidity, which consisted of cash, cash equivalents and investments of $210.2 million, were held primarily in the United States. Our liquidity requirements are primarily to fund our working capital and operating expenses. As of December 26, 2015, we had no material commitments for capital expenditures.
On June 17, 2013, we completed our IPO, in which we received proceeds of $93.4 million, net of underwriting discounts, commissions and offering expenses. We used a portion of the proceeds that we received from our IPO to satisfy our obligations to holders of vested performance units and related payroll taxes of $20.4 million.
On October 28, 2013, we completed our follow-on public offering, in which we received proceeds of $10.2 million, net of underwriting discounts, commissions and offering expenses.
Our future capital requirements will depend on many factors, including our results of operations and the expansion of our research and development, sales and marketing and general and administrative functions. Based on our current operating plan, we believe our existing cash, cash equivalents and investments, combined with cash generated from operations, will be sufficient to fund our working capital and operating expenses for at least the next 12 months. If we require additional capital resources to grow our business internally or to acquire complementary technologies and businesses at any time in the future, we may seek to sell additional equity, or raise funds through debt financing or other sources. The sale of additional equity could result in additional dilution to our stockholders. If
49
we raise additional funds by obtaining loans from third parties, the terms of those financing arrangements may include negative covenants or other restrictions on our business that could impair our operating flexibility, and would also require us to incur interest expense. We can provide no assurance that additional financing will be available at all or, if available, that we would be able to obtain financing on terms favorable to us.
Cash flows
The following table summarizes our cash flows for the periods indicated (in thousands):
Fiscal Year Ended | |||||||||
December 26, 2015 | December 27, 2014 | December 28, 2013 | |||||||
Cash provided by operating activities | $ | 63,433 | $ | 11,095 | $ | 23,308 | |||
Cash provided by (used in) investing activities | 13,813 | (59,695 | ) | (61,767 | ) | ||||
Cash provided by financing activities | 4,025 | 7,633 | 99,692 | ||||||
Our cash provided by operating activities is generated from sales of our products and, to a lesser extent, by upfront payments from customers under maintenance and support contracts. Our primary uses of cash from operating activities have been for personnel related expenses, manufacturing costs, expenses related to marketing and promotional activities and costs related to our facilities. Our cash flows from operating activities will continue to be affected principally by our working capital requirements and increased spending on personnel, facilities and sales and marketing activities to meet our anticipated business growth.
In fiscal 2015, our operating activities provided cash of $63.4 million. This consisted of $6.2 million net income adjusted for $33.0 million of non-cash charges and $24.2 million cash provided by changes in our operating assets and liabilities. The non-cash charges included $29.8 million stock-based compensation expenses, depreciation and amortization expenses of $5.6 million and $1.9 million of inventory write-downs, changes in the deferred and other income tax assets of $0.2 million. The $24.2 million of cash provided by changes in operating assets and liabilities were largely due to an increase of $26.6 million in deferred revenue, increased accounts payables and accrued liabilities of $19.2 million, and decreased inventory of $1.0 million, partially offset by an increase in accounts receivables of $19.6 million.
In fiscal 2014, our operating activities provided cash of $11.1 million. The $40.8 million net loss and $2.6 million used for changes in our operating assets and liabilities was more than offset by $54.5 million of non-cash charges. These non-cash charges included changes in the deferred tax assets of $20.8 million, $24.7 million stock-based compensation expenses, depreciation and amortization expenses of $5.3 million and $3.8 million of inventory write-downs. The $2.6 million of cash used for changes in operating assets and liabilities were largely used for an $8.2 million inventory increase, a $4.2 million accounts receivable increase, and a $1.0 million increase in prepaid expenses. This was partially offset by increases in deferred revenue of $8.0 million and increased accounts payable and other accrued liabilities of $2.7 million.
In fiscal 2013, our operating activities provided cash of $23.3 million. We incurred a net loss of $9.5 million, which included net non-cash expenses of $15.4 million. Non-cash expenses primarily consisted of stock-based compensation expenses of $32.5 million and depreciation and amortization expenses of $2.9 million, offset in part by a deferred income tax benefit of $20.9 million. Our operating activities provided cash of $23.3 million primarily due to an increase in deferred revenue of $16.7 million driven by an increase in billings for products and services as a result of our larger installed base; a $8.3 million increase in accrued and other liabilities primarily attributable to a $3.9 million increase in employee related accruals and $3.6 million withheld for purchases under our Employee Stock Purchase Plan, or ESPP; and a $3.1 million decrease in inventory due to higher inventory turnover in fiscal 2013. These changes were partially offset by a $3.9 million increase in accounts receivable primarily attributable to an increase in the amount of billings and a $3.3 million increase in prepaid expenses, other current assets and other assets. Our days sales outstanding, or DSO, decreased to 52 days as of December 28, 2013 from 60 days as of December 31, 2012.
Cash flows from investing activities
In fiscal 2015, cash provided by investing activities of $13.8 million primarily consisted of net purchases and sales of short-term investments of $20.1 million offset by purchases of property and equipment of $6.3 million to support the growth of our business.
50
In fiscal 2014, cash used in investing activities of $59.7 million primarily consisted of net purchases and sales of short-term investments of $52.1 million and purchases of property and equipment of $7.6 million to support the growth of our business.
In fiscal 2013, cash used in investing activities of $61.8 million consisted of short-term investment purchases of $59.7 million and property and equipment purchases of $4.0 million, offset by $2.0 million in proceeds from the sale of short-term investments.
Cash flows from financing activities
In fiscal 2015, cash provided by financing activities was $4.0 million and was primarily due to cash proceeds of $5.1 million from the issuance of common stock pursuant to our ESPP, $4.7 million in excess tax benefits from employee stock-based compensation, $4.4 million from stock option exercises, which was partially offset by $10.2 million in shares repurchased due to tax withholdings upon vesting of RSUs.
In fiscal 2014, cash provided by financing activities was $7.6 million and was primarily due to cash proceeds of $5.9 million from the issuance of common stock pursuant to our ESPP and $5.4 million from stock option exercises, partially offset by $3.1 million in shares repurchased due to tax withholdings upon vesting of RSUs. We also made the final payout of $0.5 million to Gigamon LLC members pursuant to the Restated Limited Liability Company Agreement by and among Gigamon LLC and certain of its members, dated January 20, 2010, as amended, in effect prior to the LLC Conversion, or the LLC Agreement.
In fiscal 2013, cash provided by financing activities was $99.7 million primarily due to net cash proceeds of $95.3 million and $10.2 million from our sale and issuance of common stock in our IPO and follow-on public offering, respectively. We also generated $1.7 million from stock option exercises in fiscal 2013. In addition, we distributed $7.0 million in fiscal 2013 to Gigamon LLC members pursuant to the LLC Agreement.
Contractual Obligations
The following summarizes our contractual obligations as of December 26, 2015:
Payments Due by Period | |||||||||||||||
Less than 1 year | 1 to 3 years | 4 to 5 years | More than 5 years | Total | |||||||||||
(in thousands) | |||||||||||||||
Operating lease obligations (1) | $ | 3,763 | $ | 4,317 | $ | 82 | $ | — | $ | 8,162 | |||||
Purchase commitments (2) | 12,018 | — | — | — | 12,018 | ||||||||||
Total | $ | 15,781 | $ | 4,317 | $ | 82 | $ | — | $ | 20,180 | |||||
(1)Operating lease obligations represent our obligations to make payments under the lease agreements for our facilities and office equipment leases.
(2)Purchase commitments primarily represent the total non-cancelable purchase commitments our contract manufacturers make on our behalf.
As of December 26, 2015, we had no tax liabilities recorded related to uncertainty in income tax positions.
Off-Balance Sheet Arrangements
We do not have any relationships with unconsolidated entities or financial partnerships, such as entities often referred to as structured finance or special purpose entities, which would have been established for the purpose of facilitating off-balance sheet arrangements or other contractually narrow or limited purposes.
51
Indemnification Obligations
Under the indemnification provisions of our standard sales related contracts, we agree to defend our customers against third party claims asserting infringement of certain intellectual property rights, which may include patents, copyrights, trademarks, or trade secrets, and to pay judgments entered on such claims. Our exposure under these indemnification provisions is generally limited to the total amount paid by our customer under the agreement. However, certain agreements include indemnification provisions that could potentially expose us to losses in excess of the amount received under the agreement. We have not incurred any costs as a result of such indemnifications and have not accrued any liabilities related to such obligations in our consolidated financial statements. In addition, we indemnify our officers, directors, and certain key employees while they are serving in good faith in the Company's capacities. To date, there have been no claims under any indemnification provisions.
Critical Accounting Policies and Estimates
Our consolidated financial statements are prepared in accordance with GAAP. The preparation of these financial statements requires us to make estimates and assumptions that affect the reported amounts of assets, liabilities, revenue, operating expenses and related disclosures. On an ongoing basis, we evaluate our estimates and assumptions. We base our estimates and assumptions on historical experience and on various other factors that we believe to be reasonable under the circumstances. Accordingly, actual results could differ significantly from the estimates made by our management. To the extent that there are material differences between our estimates and actual results, our future financial statement presentation, financial condition, results of operations and cash flows would be affected.
We believe that of our significant accounting policies, which are described in the notes to our consolidated financial statements, the accounting policies discussed below involve the greatest degree of judgment and complexity and have the most significant impact on our consolidated financial statements. Accordingly, these are the policies we believe are most critical to aid in understanding and evaluating our financial condition and results of operations.
Revenue Recognition
We recognize revenue when (1) persuasive evidence of an arrangement exists, (2) delivery has occurred or services have been rendered, (3) sales price is fixed or determinable and (4) collectability is reasonably assured.
When sales arrangements contain multiple elements and software and non-software components that function together to deliver the products’ essential functionality, we allocate revenue to each element based on a selling price hierarchy: vendor-specific objective evidence or VSOE, if available, third party evidence or TPE, of the selling price if VSOE is not available, or best estimated selling prices or BESP, if neither VSOE nor TPE is available.
When we enter into arrangements to provide more than one product or service or what we refer to as “multiple deliverables”, these arrangements are evaluated to determine if the multiple elements consist of more than one unit of accounting and can be separated accordingly. Based on separation criteria under the guidance, deliverables in multiple element arrangements can be segregated into separate units of accounting if they have value to the customer on a standalone basis. If deliverables can be separated into individual units of accounting, then the arrangement consideration is allocated among deliverables based on their relative selling price. Revenue from each deliverable is recognized when all requirements are met for that specific deliverable. If deliverables cannot be separated into separate units of accounting, then the arrangement will be accounted for as a single unit of accounting and revenue will be recognized when all requirements are met for all deliverables within the arrangement. We have established VSOE for maintenance and support contracts since the majority of selling prices fall within a narrow range when sold separately. TPE is not used since this information is not widely available in the market and we do not consider our products to be similar to or interchangeable with our competitors’ products in standalone sales to similarly situated customers. For deliverables with no established VSOE, such as standard product offerings, we determine the standalone selling price for such deliverables by establishing BESP, which incorporates historical selling prices, the effect of market conditions, gross margin objectives and pricing practices, as well as entity specific factors. We monitor and evaluate BESP on a regular basis to ensure that changes in circumstances are accounted for in a timely manner.
Service revenue is recognized ratably over the contractual support period, which is typically one year and can be up to ten years.
In accordance with contractual provisions, we may offer cooperative marketing funds based on a fixed dollar percentage of product sales to certain channel partners or to fund specific marketing activities for these partners. We record such amounts as a reduction to revenue or, if we have evidence of fair value of the separable and identifiable benefit received, as marketing expense.
52
Inventories
Inventory is valued at the lower of cost computed on a first-in, first-out basis, or market value. We write down inventory in excess of forecasted demand over a certain period, as a component of cost of revenue. In these cases, inventory is reduced to estimated realizable value based on historical usage and expected demand. At the point of inventory write-down, a new lower-cost basis for that inventory is established and subsequent changes in facts and circumstances do not result in the restoration or increase in that newly established cost basis. Inherent in our estimates of market value in determining inventory valuation are estimates related to economic trends, future demand for our products, and technical obsolescence of products. We use contract manufacturers to provide manufacturing services for our products. During the normal course of business, in order to manage manufacturing lead times and help ensure adequate component supply, we enter into agreements with the contract manufacturers that either allow them to procure inventory based upon criteria as defined by us, or establish the parameters defining our requirements. A portion of our reported purchase commitments arising from these agreements consists of non-cancelable commitments. We record a liability for firm, non-cancelable and unconditional purchase commitments for quantities in excess of its future demand forecasts consistent with the valuation of our excess and obsolete inventory.
Warranty
We provide our end-user customers with five-year warranties on our products against defects in manufacturing. We accrue for potential liability claims as a component of cost of product revenue based on historical trends of product failure rates and the expected material and labor costs to provide warranty services. The accrued warranty balance is reviewed periodically for adequacy and is included in accrued liabilities and in other non-current liabilities on the consolidated balance sheets.
Stock-based compensation expense
Stock-based compensation expense related to stock-based transactions, including employee and director awards, as well as employee stock purchase plan purchase rights (“ESPP purchase rights”), is measured and recognized in the consolidated financial statements based on fair value of the award on the grant date. Stock-based compensation expense related to equity awards that can be settled in cash is measured based on the fair value on each balance sheet date until the settlement dates. The fair value of option awards and ESPP purchase rights is estimated using the Black-Scholes option-pricing model. This model requires assumptions including the market value of our common stock, expected volatility, expected term of the award, expected dividend yield and risk-free interest rate. Expected term for stock option awards is determined based on the mid-point of the vest period and the contractual period of each option award due to our limited historical stock option exercise data. Expected volatility is established based on the historical volatility of the common stock of a peer group of publicly traded companies. The stock-based compensation expense, net of estimated forfeitures, is recognized on a graded-vesting basis over the requisite service periods of the awards, unless a performance-based condition exists. Expense for performance-based awards are recognized when the issuance of the underlying awards is probable. Expense for consultant awards is measured based on the fair value on the vest date. Expenses related to the option grants to consultants that have not been vested as of the reporting date are marked to market until the earlier of the commitment or the completion of the underlying performance. We estimate a forfeiture rate to calculate the stock-based compensation for our awards based on an analysis of our historical experience, analysis of employee turnover and other related factors.
Income Taxes
We are subject to U.S. federal income taxes as well as state taxes. In addition, we are subject to taxes in the foreign jurisdictions where we operate.
Prior to the LLC Conversion in May 2013, we were a Delaware limited liability company that passed through income and losses to our members. As a result, we were not subject to any U.S. federal or state income taxes as the related tax consequences were reported by the individual members.
Effective upon the completion of the LLC Conversion, we account for income taxes using the asset and liability method, which requires the recognition of deferred tax assets and liabilities for the expected future tax consequences of events that have been recognized in its financial statements or tax returns. In addition, deferred tax assets are recorded for the future benefit of utilizing net operating losses and research and development credit carry forwards. Valuation allowances are provided when necessary to reduce deferred tax assets to the amount expected to be realized. Accordingly, we assess the need for a valuation allowance based on the Accounting Standards Codification (ASC) 740 more-likely-than-not realization threshold criterion. Consideration was given to all positive and negative evidence related to the realization of the deferred tax assets. This assessment considered,
53
among other matters, the nature, frequency and severity of current and cumulative losses, forecasts of future profitability, the duration of statutory carryforward periods, experience with operating loss and tax credit carryforwards expiring, and tax planning alternatives. Significant judgment was required to determine whether a valuation allowance was necessary and the amount of such valuation allowance, if appropriate. As discussed in Note 10 to the consolidated financial statements, we recorded a valuation allowance against our federal and state deferred tax assets as of December 27, 2014. The Company intends to continue maintaining a full valuation allowance on its deferred tax assets until there is sufficient evidence to support the reversal of all or some portion of these allowances. If the Company continues to maintain profitability, there is a reasonable possibility that, within the next year, sufficient positive evidence may become available to reach a conclusion that a significant portion, or all, of the valuation allowance will no longer be needed. In the event that we change our determination as to the amount of deferred tax assets that can be realized, we will adjust our valuation allowance with a corresponding impact to the provision for income taxes in the period in which such determination is made.
We apply the authoritative accounting guidance prescribing a threshold and measurement attribute for the financial recognition and measurement of a tax position taken or expected to be taken in a tax return. We recognize liabilities for uncertain tax positions based on a two-step process. The first step is to evaluate the tax position for recognition by determining if the weight of available evidence indicates that it is more-likely-than-not that the position will be sustained on audit, including resolution of related appeals or litigation processes, if any. The second step requires us to estimate and measure the tax liability as the largest amount that is more-likely-than-not to be realized upon ultimate settlement. We also account for any related interest and penalty charges as a component of income taxes.
Recent Accounting Pronouncements
In May 2014, the Financial Accounting Standards Board (the "FASB") issued an Accounting Standards Update related to revenue from contracts with customers, which supersedes the revenue recognition requirements in the current Accounting Standards Codification. This standard is based on the principle that revenue is recognized to depict the transfer of goods or services to customers in an amount that reflects the consideration to which the entity expects to be entitled in exchange for those goods or services. This standard also requires additional disclosure about the nature, amount, timing and uncertainty of revenue and cash flows arising from customer contracts, including significant judgments and changes in judgments and assets recognized from costs incurred to obtain or fulfill a contract. In August 2015 the FASB voted to defer the effective date by one year. The effective date of this standard will be the first quarter of fiscal 2019 using one of two retrospective application methods. We are currently evaluating the potential impact, if any, of this accounting standard update on our future consolidated financial statements.
In June 2014, the FASB issued an authoritative standard related to stock compensation Accounting for Share-Based Payments When the Terms of an Award Provide That a Performance Target Could Be Achieved after the Requisite Service Period. This standard requires that a performance target that affects vesting and that could be achieved after the requisite service period be treated as a performance condition. A company should apply the existing guidance as it relates to awards with performance conditions that affect vesting to account for such awards. Compensation cost should be recognized in the period in which it becomes probable that the performance target will be achieved and should represent the compensation cost attributable to the periods for which the requisite service has already been rendered. The amendments in this update are effective for annual periods and interim periods within annual periods beginning after December 15, 2015 and early adoption is permitted. The adoption of this guidance is not currently expected to have a material impact on our consolidated financial statements.
In August 2014, the FASB issued an authoritative standard related to the disclosure of Uncertainties about an Entity’s Ability to Continue as a Going Concern, to provide guidance on management’s responsibility in evaluating whether there is a substantial doubt about a company’s ability to continue as a going concern and to provide related footnote disclosures. The effective date of this standard will be for annual periods ending after December 15, 2016 with early adoption permitted. The adoption of this guidance is not currently expected to have a material impact on our consolidated financial statements.
In June 2015, the FASB issued an authoritative standard related to Technical Corrections and Improvements. The standard covers a wide range of topics including guidance clarification and reference corrections, simplification and minor improvements. Transition guidance varies based on the specific topic included in this standard. The topics that require transition guidance are effective for all entities for fiscal years, and interim periods within those fiscal years, beginning after December 15, 2015. Early adoption is permitted. All other topics were effective upon the issuance of this standard. We are currently evaluating the impact, if any, of this guidance on our consolidated financial statements.
54
In July 2015, the FASB issued an authoritative standard related to disclosure of inventory, to provide guidance on management’s responsibility to measure inventory at the lower of cost and net realizable value. The effective date will be for annual periods ending after December 15, 2016 with early adoption permitted. We are currently evaluating the impact, if any, of this guidance on our consolidated financial statements.
In November 2015, the FASB issued an authoritative standard related to Balance Sheet classification of Deferred Tax Assets to provide guidance regarding balance sheet classification of deferred taxes. The guidance requires companies to classify all deferred tax assets and liabilities as non-current on the balance sheet instead of separating deferred taxes into current and non-current amounts. This guidance is effective for public business entities for financial statements issued for annual periods beginning after December 15, 2016, and interim periods within those annual periods. The amendments can be applied retrospectively or prospectively with earlier application permitted as of the beginning of an interim or annual reporting period. We have chosen to early adopt on a prospective basis and the statement of financial position as of December 26, 2015 reflects the revised classification of current deferred tax assets and liabilities as non-current.
Item 7A. Quantitative and Qualitative Disclosures about Market Risk
We are exposed to market risks in the ordinary course of our business. These risks primarily include risk related to interest rate and foreign currency exchange rate sensitivities.
Interest rate sensitivity
We had cash, cash equivalents and investments of $210.2 million and $149.4 million as of December 26, 2015 and December 27, 2014, respectively. We hold our cash, cash equivalents and investments for working capital purposes. Our cash and cash equivalents are primarily held in cash deposits and money market funds. We have invested a portion of our funds in short-term investments that are focused on preservation of capital and supporting our liquidity requirements. Our investments are held in U.S. Treasury securities, U.S. agency debt securities and corporate debt securities. Due to the short-term nature of these instruments, we believe that we do not have any material exposure to changes in the fair value of our investment portfolio as a result of changes in interest rates. Declines in interest rates, however, would reduce future interest income. The effect of a hypothetical 10% increase or decrease in overall interest rates would not have had a material impact on the fair value of our available-for-sale securities as of December 26, 2015 and December 27, 2014, or our interest income for fiscal 2015, 2014 and 2013.
Foreign currency exchange rate sensitivity
The U.S. dollar is the functional currency for our subsidiary and our sales to international customers are denominated in U.S. dollars. Because the U.S. dollar is our functional currency, monetary accounts denominated in non-U.S. currencies, such as cash or payables to vendors, are remeasured to U.S. dollars and all gains and losses resulting from remeasurement are recorded in other expense, net in our consolidated statements of operations. Non-monetary assets and liabilities are translated at historical rates. To date, our operating costs have been denominated primarily in U.S. dollars, although we incur a limited amount of operating expenses in non-U.S. currencies such as British pounds, Euros and Hong Kong dollars. As a result, we have limited exposure to foreign currency exchange rates, and therefore we do not currently enter into foreign currency hedging transactions. If our international operations increase, our exposure to foreign currency exchange rate fluctuations may increase. In fiscal 2015, 2014 and 2013, the effect of a hypothetical 10% change in foreign currency exchange rates applicable to our business would not have had a material impact on our consolidated financial statements.
55
Item 8. Financial Statements and Supplementary Data
INDEX TO CONSOLIDATED FINANCIAL STATEMENTS
Consolidated Statements of Comprehensive Income (Loss) | |
56
Report of Independent Registered Public Accounting Firm
To the Board of Directors and Stockholders of Gigamon Inc.
In our opinion, the accompanying consolidated balance sheets and the related consolidated statements of operations, of comprehensive income (loss), of redeemable convertible preferred units and stockholders’ equity, and of cash flows present fairly, in all material respects, the financial position of Gigamon Inc. and its subsidiaries at December 26, 2015 and December 27, 2014, and the results of their operations and their cash flows for each of the three years in the period ended December 26, 2015 in conformity with accounting principles generally accepted in the United States of America. Also in our opinion, the Company maintained, in all material respects, effective internal control over financial reporting as of December 26, 2015, based on criteria established in Internal Control - Integrated Framework (2013) issued by the Committee of Sponsoring Organizations of the Treadway Commission (COSO). The Company's management is responsible for these financial statements, for maintaining effective internal control over financial reporting and for its assessment of the effectiveness of internal control over financial reporting, included in Management's Report on Internal Control Over Financial Reporting appearing under Item 9A. Our responsibility is to express opinions on these financial statements and on the Company's internal control over financial reporting based on our audits (which was an integrated audit in 2015). We conducted our audits in accordance with the standards of the Public Company Accounting Oversight Board (United States). Those standards require that we plan and perform the audits to obtain reasonable assurance about whether the financial statements are free of material misstatement and whether effective internal control over financial reporting was maintained in all material respects. Our audits of the financial statements included examining, on a test basis, evidence supporting the amounts and disclosures in the financial statements, assessing the accounting principles used and significant estimates made by management, and evaluating the overall financial statement presentation. Our audit of internal control over financial reporting included obtaining an understanding of internal control over financial reporting, assessing the risk that a material weakness exists, and testing and evaluating the design and operating effectiveness of internal control based on the assessed risk. Our audits also included performing such other procedures as we considered necessary in the circumstances. We believe that our audits provide a reasonable basis for our opinions.
A company’s internal control over financial reporting is a process designed to provide reasonable assurance regarding the reliability of financial reporting and the preparation of financial statements for external purposes in accordance with generally accepted accounting principles. A company’s internal control over financial reporting includes those policies and procedures that (i) pertain to the maintenance of records that, in reasonable detail, accurately and fairly reflect the transactions and dispositions of the assets of the company; (ii) provide reasonable assurance that transactions are recorded as necessary to permit preparation of financial statements in accordance with generally accepted accounting principles, and that receipts and expenditures of the company are being made only in accordance with authorizations of management and directors of the company; and (iii) provide reasonable assurance regarding prevention or timely detection of unauthorized acquisition, use, or disposition of the company’s assets that could have a material effect on the financial statements.
Because of its inherent limitations, internal control over financial reporting may not prevent or detect misstatements. Also, projections of any evaluation of effectiveness to future periods are subject to the risk that controls may become inadequate because of changes in conditions, or that the degree of compliance with the policies or procedures may deteriorate.
/s/ PricewaterhouseCoopers LLP
San Jose, California
February 24, 2016
57
Gigamon Inc.
Consolidated Balance Sheets
(In thousands)
December 26, 2015 | December 27, 2014 | |||||
ASSETS | ||||||
CURRENT ASSETS: | ||||||
Cash and cash equivalents | $ | 120,212 | $ | 38,941 | ||
Short-term investments | 90,001 | 110,465 | ||||
Accounts receivable, net of allowance for doubtful accounts of $309 and $0 as of December 26, 2015 and December 27, 2014, respectively | 47,947 | 28,686 | ||||
Inventories | 3,813 | 6,551 | ||||
Deferred tax assets | — | 150 | ||||
Prepaid expenses and other current assets | 7,621 | 5,316 | ||||
Total current assets | 269,594 | 190,109 | ||||
Property and equipment, net | 9,416 | 7,387 | ||||
Deferred tax assets, non-current | 135 | 64 | ||||
Other assets, non-current | 766 | 426 | ||||
TOTAL ASSETS | $ | 279,911 | $ | 197,986 | ||
LIABILITIES AND STOCKHOLDERS’ EQUITY | ||||||
CURRENT LIABILITIES: | ||||||
Accounts payable | $ | 3,724 | $ | 2,391 | ||
Accrued liabilities | 37,334 | 22,838 | ||||
Deferred revenue | 62,248 | 42,183 | ||||
Total current liabilities | 103,306 | 67,412 | ||||
Deferred revenue, non current | 19,883 | 13,322 | ||||
Deferred and other tax liabilities, non-current | 279 | 150 | ||||
Other liabilities, non-current | 1,087 | 1,667 | ||||
TOTAL LIABILITIES | 124,555 | 82,551 | ||||
Commitments and Contingencies (Note 6) | ||||||
STOCKHOLDERS’ EQUITY | ||||||
Preferred stock—$0.0001 par value; 20,000 shares authorized, no shares issued or outstanding as of December 26, 2015 and December 27, 2014 | — | — | ||||
Common stock—$0.0001 par value; 1,000,000 shares authorized, 34,323 and 32,642 shares issued and outstanding as of December 26, 2015 and December 27, 2014, respectively | 3 | 3 | ||||
Treasury stock—No par value; 8,110 shares authorized and outstanding as of December 26, 2015 and December 27, 2014 | (12,469 | ) | (12,469 | ) | ||
Additional paid-in capital | 211,402 | 177,714 | ||||
Accumulated other comprehensive loss | (47 | ) | (94 | ) | ||
Accumulated deficit | (43,533 | ) | (49,719 | ) | ||
TOTAL STOCKHOLDERS’ EQUITY | 155,356 | 115,435 | ||||
TOTAL LIABILITIES AND STOCKHOLDERS’ EQUITY | $ | 279,911 | $ | 197,986 | ||
The accompanying notes are an integral part of these consolidated financial statements.
58
Gigamon Inc.
Consolidated Statements of Operations
(In thousands, except per share amounts)
Fiscal Year Ended | |||||||||
December 26, 2015 | December 27, 2014 | December 28, 2013 | |||||||
Revenue: | |||||||||
Product | $ | 152,734 | $ | 105,594 | $ | 101,717 | |||
Service | 69,241 | 51,536 | 38,578 | ||||||
Total revenue | 221,975 | 157,130 | 140,295 | ||||||
Cost of revenue: | |||||||||
Product | 38,878 | 31,001 | 26,103 | ||||||
Service | 6,917 | 6,447 | 4,727 | ||||||
Total cost of revenue | 45,795 | 37,448 | 30,830 | ||||||
Gross profit | 176,180 | 119,682 | 109,465 | ||||||
Operating expenses: | |||||||||
Research and development | 49,571 | 42,806 | 42,067 | ||||||
Sales and marketing | 87,541 | 76,063 | 72,024 | ||||||
General and administrative | 27,459 | 20,683 | 25,575 | ||||||
Total operating expenses | 164,571 | 139,552 | 139,666 | ||||||
Income (loss) from operations | 11,609 | (19,870 | ) | (30,201 | ) | ||||
Interest income | 446 | 308 | 95 | ||||||
Other expense, net | (191 | ) | (94 | ) | (94 | ) | |||
Income (loss) before income tax (provision) benefit | 11,864 | (19,656 | ) | (30,200 | ) | ||||
Income tax (provision) benefit | (5,678 | ) | (21,134 | ) | 20,663 | ||||
Net Income (loss) | 6,186 | (40,790 | ) | (9,537 | ) | ||||
Accretion of preferred stock to redemption value and issuance costs | — | — | (1,088 | ) | |||||
Earnings distributable to preferred stockholders | — | — | 1,107 | ||||||
Net income (loss) attributable to common stockholders | $ | 6,186 | $ | (40,790 | ) | $ | (9,518 | ) | |
Net income (loss) per share attributable to common stockholders: | |||||||||
Basic | $ | 0.18 | $ | (1.27 | ) | $ | (0.39 | ) | |
Diluted | $ | 0.17 | $ | (1.27 | ) | $ | (0.39 | ) | |
Weighted average shares used in computing net income (loss) per share attributable to common stockholders: | |||||||||
Basic | 33,618 | 32,200 | 24,722 | ||||||
Diluted | 35,866 | 32,200 | 24,722 | ||||||
The accompanying notes are an integral part of these consolidated financial statements.
59
Gigamon Inc.
Consolidated Statements of Comprehensive Income (Loss)
(In thousands)
Fiscal Year Ended | |||||||||
December 26, 2015 | December 27, 2014 | December 28, 2013 | |||||||
Net income (loss) | $ | 6,186 | $ | (40,790 | ) | $ | (9,537 | ) | |
Other comprehensive income (loss): | |||||||||
Change in unrealized gain (loss) on available-for-sale investments | 47 | (117 | ) | 23 | |||||
Comprehensive income (loss) | 6,233 | (40,907 | ) | (9,514 | ) | ||||
Accretion of preferred units to redemption value and issuance costs | — | — | (1,088 | ) | |||||
Earnings distributable to preferred stockholders | — | — | 1,107 | ||||||
Comprehensive income (loss) attributable to common stockholders | $ | 6,233 | $ | (40,907 | ) | $ | (9,495 | ) | |
The accompanying notes are an integral part of these consolidated financial statements.
60
Gigamon Inc.
Consolidated Statements of Redeemable Convertible Preferred Units and Stockholders’ Equity
(In thousands)
The accompanying notes are an integral part of these consolidated financial statements.
Preferred Units | Common Units | Common Stock | Treasury Stock | Additional Paid-In Capital | Accumulated Other Comprehensive (Loss) Income | Accumulated Deficit | Total Stockholders’ Equity | |||||||||||||||||||||
Units | Amount | Shares | Amount | Shares | Amount | |||||||||||||||||||||||
Balance as of December 31, 2012 | 8,110 | 28,344 | 17,300 | 1,625 | — | — | (12,469 | ) | 1,522 | — | (20,723 | ) | (30,045 | ) | ||||||||||||||
Distribution to Gigamon LLC members | — | — | — | — | — | — | — | — | — | (2,676 | ) | (2,676 | ) | |||||||||||||||
Stock-based compensation expense | — | — | — | — | — | — | — | 32,543 | — | — | 32,543 | |||||||||||||||||
Conversion from LLC to corporation | — | — | (17,300 | ) | (1,625 | ) | 16,852 | 1 | — | (22,383 | ) | — | 24,007 | — | ||||||||||||||
Conversion of preferred stock to common stock | (8,110 | ) | (29,432 | ) | — | — | 8,110 | 1 | — | 29,431 | — | — | 29,432 | |||||||||||||||
Issuance of common stock upon initial public offering, net of issuance costs | — | — | — | — | 5,513 | 1 | — | 93,360 | — | — | 93,361 | |||||||||||||||||
Issuance of common stock upon follow-on public offering, net of issuance costs | — | — | — | — | 300 | — | — | 10,224 | — | — | 10,224 | |||||||||||||||||
Issuance of common stock upon exercise of stock options | — | — | — | — | 344 | — | — | 1,719 | — | — | 1,719 | |||||||||||||||||
Issuance of common stock upon vesting of RSUs | — | — | — | — | 51 | — | — | — | — | — | — | |||||||||||||||||
Shares repurchased for tax withholdings on vesting of RSUs | — | — | — | — | (18 | ) | — | — | (518 | ) | — | — | (518 | ) | ||||||||||||||
Net loss | — | — | — | — | — | — | — | — | — | (9,537 | ) | (9,537 | ) | |||||||||||||||
Other comprehensive income | — | — | — | — | — | — | — | — | 23 | — | 23 | |||||||||||||||||
Accretion of preferred units to redemption value and issuance costs | — | 1,088 | — | — | — | — | — | (1,088 | ) | — | — | (1,088 | ) | |||||||||||||||
Balance as of December 28, 2013 | — | — | — | — | 31,152 | 3 | (12,469 | ) | 144,810 | 23 | (8,929 | ) | 123,438 | |||||||||||||||
Stock-based compensation expense | — | — | — | — | — | — | — | 24,800 | — | — | 24,800 | |||||||||||||||||
Issuance of common stock upon exercise of stock options | — | — | — | — | 791 | — | — | 5,351 | — | — | 5,351 | |||||||||||||||||
Issuance of common stock related to employee stock purchase plan | — | — | — | — | 458 | — | — | 5,878 | — | — | 5,878 | |||||||||||||||||
Issuance of common stock upon vesting of RSUs | — | — | — | — | 397 | — | — | — | — | — | — | |||||||||||||||||
Shares repurchased for tax withholdings on vesting of RSUs | — | — | — | — | (156 | ) | — | — | (3,125 | ) | — | — | (3,125 | ) | ||||||||||||||
Net loss | — | — | — | — | — | — | — | — | — | (40,790 | ) | (40,790 | ) | |||||||||||||||
Other comprehensive loss | — | — | — | — | — | — | — | — | (117 | ) | — | (117 | ) | |||||||||||||||
Balance as of December 27, 2014 | — | — | — | — | 32,642 | $ | 3 | $ | (12,469 | ) | $ | 177,714 | $ | (94 | ) | $ | (49,719 | ) | $ | 115,435 | ||||||||
Stock-based compensation expense | — | — | — | — | — | — | — | 29,663 | — | — | 29,663 | |||||||||||||||||
Issuance of common stock upon exercise of stock options | — | — | — | — | 523 | — | — | 4,403 | — | — | 4,403 | |||||||||||||||||
Issuance of common stock upon vesting of RSUs | — | — | — | — | 1,011 | — | — | — | — | — | — | |||||||||||||||||
Shares repurchased for tax withholdings on vesting of RSUs | — | — | — | — | (380 | ) | — | — | (10,183 | ) | — | — | (10,183 | ) | ||||||||||||||
Issuance of common stock related to employee stock purchase plan | — | — | — | — | 527 | — | — | 5,099 | — | — | 5,099 | |||||||||||||||||
Excess tax benefit from employee stock-based compensation plans | — | — | — | — | — | — | — | 4,706 | — | — | 4,706 | |||||||||||||||||
Net income | — | — | — | — | — | — | — | — | — | 6,186 | 6,186 | |||||||||||||||||
Other comprehensive income | — | — | — | — | — | — | — | — | 47 | — | 47 | |||||||||||||||||
Balance as of December 26, 2015 | — | — | — | — | 34,323 | $ | 3 | $ | (12,469 | ) | $ | 211,402 | $ | (47 | ) | $ | (43,533 | ) | $ | 155,356 | ||||||||
61
Gigamon Inc.
Consolidated Statements of Cash Flows
(In thousands)
Fiscal Year Ended | |||||||||
December 26, 2015 | December 27, 2014 | December 28, 2013 | |||||||
CASH FLOWS FROM OPERATING ACTIVITIES: | |||||||||
Net income (loss) | $ | 6,186 | $ | (40,790 | ) | $ | (9,537 | ) | |
Adjustments to reconcile net income (loss) to net cash provided by operating activities: | |||||||||
Depreciation and amortization | 5,577 | 5,278 | 2,850 | ||||||
Stock-based compensation expense | 29,768 | 24,658 | 32,543 | ||||||
Deferred and other income taxes | 208 | 20,825 | (20,889 | ) | |||||
Excess tax benefit from employee stock-based compensation | (4,706 | ) | — | — | |||||
Inventory write-down | 1,859 | 3,760 | 852 | ||||||
(Gain) loss on disposal of fixed assets | (17 | ) | — | 14 | |||||
Provision for doubtful accounts | 309 | — | — | ||||||
Changes in operating assets and liabilities: | |||||||||
Accounts receivable | (19,570 | ) | (4,158 | ) | (3,851 | ) | |||
Inventories | 950 | (8,229 | ) | 1,400 | |||||
Prepaid expenses and other assets | (2,988 | ) | (950 | ) | (3,274 | ) | |||
Accounts payable | 1,265 | 963 | (1,758 | ) | |||||
Accrued liabilities and other liabilities | 17,966 | 1,709 | 8,302 | ||||||
Deferred revenue | 26,626 | 8,029 | 16,656 | ||||||
Net cash provided by operating activities | 63,433 | 11,095 | 23,308 | ||||||
CASH FLOWS FROM INVESTING ACTIVITIES: | |||||||||
Purchase of short-term investments | (61,725 | ) | (87,698 | ) | (59,725 | ) | |||
Proceeds from sales of short-term investments | 2,006 | 3,010 | 2,000 | ||||||
Proceeds from maturities of short-term investments | 79,821 | 32,607 | — | ||||||
Purchase of property and equipment | (6,289 | ) | (7,614 | ) | (4,042 | ) | |||
Net cash provided by (used in) investing activities | 13,813 | (59,695 | ) | (61,767 | ) | ||||
CASH FLOWS FROM FINANCING ACTIVITIES: | |||||||||
Proceeds from employee stock purchase plan | 5,099 | 5,878 | — | ||||||
Proceeds from exercise of stock options | 4,403 | 5,364 | 1,719 | ||||||
Proceeds from (costs paid for) initial public offering, net | — | (8 | ) | 95,280 | |||||
Proceeds from follow-on public offering, net | — | — | 10,232 | ||||||
Shares repurchased for tax withholdings on vesting of restricted stock units | (10,183 | ) | (3,125 | ) | (518 | ) | |||
Excess tax benefit from employee stock-based compensation | 4,706 | — | — | ||||||
Distribution of income to Gigamon LLC members | — | (476 | ) | (7,021 | ) | ||||
Net cash provided by financing activities | 4,025 | 7,633 | 99,692 | ||||||
NET INCREASE (DECREASE) IN CASH AND CASH EQUIVALENTS | 81,271 | (40,967 | ) | 61,233 | |||||
CASH AND CASH EQUIVALENTS — Beginning of period | 38,941 | 79,908 | 18,675 | ||||||
CASH AND CASH EQUIVALENTS — End of period | $ | 120,212 | $ | 38,941 | $ | 79,908 | |||
SUPPLEMENTAL DISCLOSURES OF CASH FLOW INFORMATION: | |||||||||
Income taxes paid during the period | $ | 738 | $ | 484 | $ | 173 | |||
NONCASH INVESTING AND FINANCING ACTIVITIES: | |||||||||
Conversion of preferred stock into common stock | $ | — | $ | — | $ | 29,432 | |||
Accretion of preferred units to redemption value and issuance costs discount | $ | — | $ | — | $ | 1,088 | |||
Unpaid property and equipment purchases | $ | 756 | $ | 207 | $ | 558 | |||
Unpaid public offering costs | $ | — | $ | — | $ | 8 | |||
The accompanying notes are an integral part of these consolidated financial statements.
62
Gigamon Inc.
Notes to Consolidated Financial Statements
1. Description of the Company
The Company
Gigamon Inc. (the “Company”) designs, develops and sells products and services that together provide customers with visibility and control of network traffic. The Company serves global enterprises and service providers that seek to maintain and improve the security, reliability and performance of their network infrastructure.
The business was founded in 2004 and was originally operated by Gigamon Systems LLC, a California limited liability company or Gigamon Systems. In January 2009, the Company was formed as a limited liability company or Gigamon LLC, in the state of Delaware and Gigamon Systems contributed substantially all of its assets and liabilities to Gigamon LLC in exchange for all of Gigamon LLC’s common units. On May 31, 2013, the Company converted from a Delaware limited liability company into a Delaware corporation and changed the Company’s name from Gigamon LLC to Gigamon Inc. (the LLC Conversion).
63
2. Summary of Significant Accounting Policies
Basis of Presentation and Consolidation
The Company prepared its consolidated financial statements in accordance with U.S. generally accepted accounting principles or GAAP and applicable rules and regulations of the Securities and Exchange Commission or the SEC. The consolidated financial statements include the accounts of the Company and its wholly owned subsidiaries. All intercompany accounts and transactions have been eliminated in consolidation.
Change in Fiscal Year End
Effective January 1, 2013, the Company changed its reporting period from a calendar year ending on December 31 of each year to a 52- or 53-week fiscal year that ends on the last Saturday in December. Fiscal years 2015, 2014, and 2013 were each 52-week fiscal years ending on December 26, 2015, December 27, 2014, and December 28, 2013, respectively, with each quarter in these fiscal years a 13-week quarter.
Out-of-Period Adjustments
During the year ended December 26, 2015 the Company recorded $0.6 million of out-of-period adjustments that are primarily related to sales and marketing expenses for fiscal 2015. The Company has concluded that these out-of-period adjustments were not material to the previously issued consolidated financial statements or current financial statements.
Use of Estimates
The preparation of consolidated financial statements in conformity with GAAP requires management to make certain estimates and assumptions that affect the reported amounts of assets and liabilities and disclosure of contingent assets and liabilities at the date of the financial statements, and the reported amounts of revenues and expenses during the reported periods. On an ongoing basis, the Company evaluates its estimates, including but not limited to those related to revenue recognition, provision for doubtful accounts, warranty reserve, excess and obsolete inventory write-downs, stock-based compensation expense, depreciable lives, and income taxes. The Company bases its estimates on historical experience, projections for future performance and other assumptions that it believes to be reasonable under the circumstances. Actual results could differ materially from those estimates.
Reverse Stock Split
Effective May 20, 2013, the Company completed a one-for-three reverse stock split, as approved by its Board of Directors (the “Board”). All shares and per share amounts set forth herein give effect to this reverse stock split.
Foreign Currency
The Company uses the U.S. dollar as its functional currency. Foreign currency assets and liabilities are remeasured into U.S. dollars using the end-of-period exchange rates except for nonmonetary assets and liabilities, which are remeasured using historical exchange rates. Expenses are remeasured using an average exchange rate for the respective period. Gains or losses from foreign currency transactions are included in other expense, net. Foreign currency transaction gains and losses have not been material to the consolidated financial statements for all periods presented.
Cash Equivalents and Marketable Securities
All highly liquid marketable securities with original maturities of less than three months at the date of purchase are considered to be cash equivalents. Marketable securities are generally classified as available-for-sale for use in current operations, if required, and are reported at fair value, with unrealized gains and losses, net of tax, presented as a separate component of stockholders’ equity within accumulated other comprehensive income (loss). All realized gains and losses and unrealized losses resulting from declines in fair value that are other-than-temporary are recorded in other income (expense), net, in the period of occurrence. The Company uses the specific identification method to determine the realized gains and losses on investments. For all investments in marketable securities, the Company assesses whether the impairment is other-than-temporary. If the fair value of a security is less than its amortized cost basis, an impairment is considered other-than-temporary if (i) the Company has the intent to sell the security or it is more likely than not that the Company will be required to sell the security before recovery of its entire amortized cost basis, or (ii) the Company does not expect to recover the entire amortized cost of the security. If an impairment is considered other-than-temporary based on condition (i), the entire difference between the amortized cost and the fair value of the security is recognized in earnings. If an impairment is considered other-than-temporary based on condition (ii), the amount representing credit losses, defined as the difference between the present value of the cash flows expected to be collected and the amortized cost basis of the
64
security, will be recognized in earnings, and the amount relating to all other factors will be recognized in accumulated other comprehensive income (loss). The Company evaluates both qualitative and quantitative factors such as duration and severity of the unrealized losses, credit ratings, default and loss rates of the underlying collateral, structure and credit enhancements to determine if a credit loss may exist.
Fair Value of Financial Instruments
The Company records its financial assets and liabilities at fair value. The accounting guidance for fair value provides a framework for measuring fair value, clarifies the definition of fair value, and expands disclosures regarding fair value measurements. Fair value is defined as the price that would be received to sell an asset or paid to transfer a liability (an exit price) in an orderly transaction between market participants at the reporting date. The accounting guidance establishes a three-tiered hierarchy, which prioritizes the inputs used in the valuation methodologies in measuring fair value:
Level 1 – Quoted prices in active markets for identical assets or liabilities.
Level 2 – Inputs other than Level 1 that are observable, either directly or indirectly, such as quoted prices in markets that are not active; or other inputs that are observable or can be corroborated by observable market data for substantially the full term of the assets or liabilities.
Level 3 – Unobservable inputs that are supported by little or no market activity and that are significant to the fair value of the assets or liabilities.
The Company recognizes transfers among Level 1, Level 2 and Level 3 classifications as of the actual date of the events or change in circumstances that caused the transfers.
The Company’s financial instruments, including cash equivalents, accounts receivable, accounts payable and accrued liabilities have carrying amounts which approximate fair value due to the short-term maturity of these instruments.
Accounts Receivable
Accounts receivable, which represent trade accounts receivable from both channel partners and direct customers, are recorded at the invoiced amounts and do not bear interest. The Company extends credit to its customers in the normal course of business and performs ongoing credit evaluations of its customers. The Company generally requires no collateral from its customers. The Company reviews its accounts receivable to determine if it needs to establish an allowance for doubtful accounts for estimated losses resulting from the customer’s inability to make payments. Management determines the collectability of specific customer accounts by their past transaction history. If financial conditions of the Company’s customers were to deteriorate, adversely affecting their ability to make payments, additional allowances would be required. Estimates for allowance for doubtful accounts are charged to operating expenses and a credit to a valuation allowance. As of December 26, 2015 and December 27, 2014 the Company recorded an allowance for doubtful accounts of $0.3 million, and zero, respectively.
Concentrations
The Company operates in highly competitive and rapidly changing markets that could negatively impact the Company’s operating results. A number of components that meet the Company’s manufacturing requirements are available only from single source suppliers. In addition, the Company relies on one contract manufacturer to manufacture substantially all of its products. The inability of its single source suppliers and contract manufacturer to provide the Company with adequate supplies of high-quality components and products could cause a delay in order fulfillment, which could adversely affect the Company’s revenue, cost of revenue and operating results.
Financial instruments that potentially subject the Company to significant concentrations of credit risk consist principally of cash, cash equivalents, short-term investments and accounts receivable. The majority of the Company's cash, cash equivalents and short-term investments are held in or managed by a limited number of major financial institutions in the United States that management believes are creditworthy. Such deposits may exceed the insured limits provided on them. The Company mitigates credit risk associated with its accounts receivable by performing ongoing credit evaluations of its customers and determines if it needs to establish an allowance for doubtful accounts for estimated losses based on management’s assessment of the collectability of customer accounts.
The Company sells its products primarily through channel partners, including distributors and resellers, and occasionally directly to end-user customers. For fiscal 2015, 2014 and 2013, no end-user customer accounted for 10% or more of revenue.
65
Customers that represented more than 10% of total revenue and accounts receivable are:
Fiscal Year Ended | ||||||
December 26, 2015 | December 27, 2014 | December 28, 2013 | ||||
Percent of Revenue: | ||||||
Customer A (distributor) | 40 | % | 47 | % | 52 | % |
Customer B (distributor) | 21 | % | 16 | % | * | |
* Represents less than 10% of total revenue
As of | ||||
December 26, 2015 | December 27, 2014 | |||
Percent of Accounts Receivable: | ||||
Customer A (distributor) | 19 | % | * | |
Customer B (distributor) | 30 | % | 36 | % |
Customer C (end-user) | 11 | % | * | |
* Represents less than 10% of total accounts receivable
Inventories
Inventory is valued at the lower of cost computed on a first-in, first-out basis, or market value. The Company writes down inventory in excess of forecasted demand over a certain period, as a component of cost of revenue. In these cases, inventory is reduced to estimated realizable value based on historical usage and expected demand. At the point of inventory write-down, a new lower-cost basis for that inventory is established and subsequent changes in facts and circumstances do not result in the restoration or increase in that newly established cost basis. Inherent in the Company’s estimates of market value in determining inventory valuation are estimates related to economic trends, future demand for the Company’s products, and technical obsolescence of products. The Company uses a contract manufacturer to provide manufacturing services for its products. During the normal course of business, in order to manage manufacturing lead times and help ensure adequate component supply, the Company enters into agreements with the contract manufacturer that either allow it to procure inventory based upon criteria as defined by the Company, or establish the parameters defining the Company’s requirements. A portion of the Company’s reported purchase commitments arising from these agreements consists of non-cancelable commitments. The Company records a liability for firm, non-cancelable and unconditional purchase commitments for quantities in excess of its future demand forecasts consistent with the valuation of the Company’s excess and obsolete inventory.
In fiscal 2015, the Company recognized $1.9 million of inventory write-downs within cost of revenue and $0.9 million in recoveries from the sale of previously written-down inventory. The Company recorded inventory write-downs of $3.8 million and $0.9 million in fiscal 2014 and fiscal 2013, respectively, as a component of cost of revenue.
Property and Equipment
Property and equipment are stated at cost and depreciated using the straight–line method over the estimated useful lives of the assets. Leasehold improvements are amortized over the lesser of the useful life of these improvements or the remaining term of the lease. Maintenance and repairs are charged to operations as incurred.
The useful lives of the property and equipment are as follows:
Furniture and fixtures | 5 years |
Software | 3 to 5 years |
Equipment and machinery | 1.5 to 3 years |
Leasehold improvements | Shorter of lease term or estimated useful life |
Research and Development and Software Development Costs
Research and development costs are expensed as incurred. The Company's software development process is essentially completed concurrent with the establishment of technological feasibility. To-date, software development
66
costs qualifying for capitalization have not been material. Accordingly, the Company has not capitalized any software development costs.
Impairment of Long-Lived Assets
The Company reviews long-lived assets for impairment whenever events or changes in circumstances indicate that the carrying amount of an asset may not be recoverable. Recoverability is measured by comparison of the anticipated future net undiscounted cash flows to the related assets’ carrying values.
If such assets are considered to be impaired, the impairment to be recognized is measured by the amount by which the carrying amount of the assets exceeds the projected discounted future net cash flows arising from the asset. No assets were determined to be impaired during any of the periods presented.
Revenue Recognition
The Company generates product revenue from sales of traffic visibility solutions to customers as well as service revenue from sales of maintenance and support contracts and other billable services. The Company typically sells products and services in a single transaction. The deliverables consist of traffic visibility solutions, maintenance and support, and other billable services. The Company’s typical arrangement includes the sale of one or multiple products that may include first year maintenance and support as well as standard warranty. Other arrangements consist of the sale of products together with maintenance and support or a renewal of maintenance and support contracts. Billable services are billed in advance or when service is provided and performed as requested by customers. Under maintenance and support contracts, services are provided as needed by customers over the fixed arrangement term. The Company does not grant its customers a general right of return or any refund terms, except to two of the Company’s distributors which have stock rotation rights and in that case, revenue is deferred until sell-through has occurred. Revenue from distributors is reported net of rebates, discounts and any other sales incentives.
The Company recognizes revenue when (1) persuasive evidence of an arrangement exists, (2) delivery has occurred or services have been rendered, (3) the sales price is fixed or determinable and (4) collectability is reasonably assured.
When sales arrangements contain multiple elements and software and non-software components that function together to deliver the products’ essential functionality, the Company allocates revenue to each element based on a selling price hierarchy: vendor-specific objective evidence or VSOE, if available, third party evidence or TPE, of the selling price if VSOE is not available, or best estimated selling prices or BESP if neither VSOE nor TPE is available.
When the Company enters into arrangements to provide more than one product or service, or what the Company refers to as multiple deliverables, these arrangements are evaluated to determine if the multiple elements consist of more than one unit of accounting and can be separated accordingly. Based on separation criteria under the guidance, deliverables in multiple element arrangements can be segregated into separate units of accounting if they have value to the customer on a standalone basis. If deliverables can be separated into individual units of accounting, then the arrangement consideration is allocated among deliverables based on their relative selling price. Revenue from each deliverable is recognized when all requirements are met for that specific deliverable. If deliverables cannot be separated into separate units of accounting, then the arrangement will be accounted for as a single unit of accounting and revenue will be recognized when all requirements are met for all deliverables within the arrangement. The Company has established VSOE for maintenance and support contracts since the majority of selling prices fall within a narrow range when sold separately. TPE is not used since this information is not widely available in the market and the Company does not consider its products to be similar to or interchangeable with its competitors’ products in standalone sales to similarly situated customers. For deliverables with no established VSOE, such as standard product offerings, the Company determines the standalone selling price for such deliverables by establishing BESP, which incorporates historical selling prices, the effect of market conditions, gross margin objectives and pricing practices, as well as entity specific factors. The Company monitors and evaluates BESP on a regular basis to ensure that changes in circumstances are accounted for in a timely manner.
Service revenue is recognized ratably over the contractual support period, which is typically one year but can be up to ten years.
In accordance with contractual provisions, the Company may offer cooperative marketing funds based on a fixed dollar percentage of product sales to certain of its channel partners or to fund specific marketing activities for these partners. The Company records such amounts as a reduction to revenue or, if the Company has evidence of fair value of the separable and identifiable benefit received, as a marketing expense.
67
Revenue is recorded net of sales taxes. Costs of products not yet recognized as revenue are deferred and included as a component of prepaid expenses and other current assets in the consolidated balance sheets. As of December 26, 2015 and December 27, 2014, deferred cost of product revenue was $1.6 million and $0.8 million, respectively.
Shipping and Handling Charges
Shipping and handling costs are recorded in cost of revenue in the period products are shipped to customers.
Warranty
The Company provides five-year warranties on its hardware products against defects in manufacturing. The Company accrues for potential liability claims as a component of cost of product revenue based on historical trends of product failure rates and the expected material and labor costs to provide warranty services. The accrued warranty balance is reviewed periodically for adequacy and is included in accrued liabilities and in other non-current liabilities on the consolidated balance sheets.
Stock-Based Compensation
Stock-based compensation expense related to stock-based transactions, including employee and director awards, as well as employee stock purchase plan purchase rights (“ESPP purchase rights”), is measured and recognized in the consolidated financial statements based on fair value of the award on the grant date. Stock-based compensation expense related to equity awards that can be settled in cash is measured based on the fair value on each balance sheet date until the settlement dates. The fair value of option awards and ESPP purchase rights is estimated using the Black-Scholes option-pricing model. This model requires assumptions including the market value of the Company’s common stock, expected volatility, expected term of the award, expected dividend yield and risk-free interest rate. Expected term for stock option awards is determined based on the mid-point of the vest period and the contractual period of each option award due to the Company’s limited historical stock option exercise data. Expected volatility is established based on the historical volatility of the common stock of a peer group of publicly traded companies. The stock-based compensation expense, net of estimated forfeitures, is recognized on a graded-vesting basis over the requisite service periods of the awards, unless a performance-based condition exists. Expense for performance-based awards are recognized when the issuance of the underlying awards are probable. Expense for consultant awards are measured based on the fair value on the vest date. Expenses related to the option grants to consultants that have not been vested as of the reporting date are marked to market until the earlier of the commitment or the completion of the underlying performance. The Company estimates a forfeiture rate to calculate the stock-based compensation for its awards based on an analysis of its historical experience, analysis of employee turnover and other related factors.
Advertising Costs
Expenses related to advertising of products are charged to sales and marketing expense as incurred. For all periods presented, advertising expenses were not material.
Income Taxes
The Company is subject to U.S. federal income taxes as well as state taxes. In addition, the Company is subject to taxes in the foreign jurisdictions where it operates.
Prior to the LLC Conversion in May 2013, the Company was a Delaware limited liability company that passed through income and losses to its members. As a result, the Company was not subject to any U.S. federal or state income taxes as the related tax consequences were reported by the individual members.
Effective upon the completion of the LLC Conversion, the Company accounts for income taxes using the asset and liability method, which requires the recognition of deferred tax assets and liabilities for the expected future tax consequences of events that have been recognized in its financial statements or tax returns. In addition, deferred tax assets are recorded for the future benefit of utilizing net operating losses and research and development credit carry forwards. Valuation allowances are provided when necessary to reduce deferred tax assets to the amount expected to be realized. Accordingly, the Company assessed the need for a valuation allowance based on the ASC 740 more-likely-than-not realization threshold criterion. Consideration was given to all positive and negative evidence related to the realization of the deferred tax assets. This assessment considered, among other matters, the nature, frequency and severity of recent and cumulative losses, forecasts of future profitability, the duration of statutory carryforward periods, experience with operating loss and tax credit carryforwards expiring, and tax planning alternatives. Significant judgment was required to determine whether a valuation allowance was necessary and the amount of such valuation allowance, if appropriate. In the event that the Company changes its determination as to the amount of deferred tax assets that can be realized, the Company will adjust its valuation
68
allowance with a corresponding impact to the provision for income taxes in the period in which such determination is made.
The Company applies the authoritative accounting guidance prescribing a threshold and measurement attribute for the financial recognition and measurement of a tax position taken or expected to be taken in a tax return. The Company recognizes liabilities for uncertain tax positions based on a two-step process. The first step is to evaluate the tax position for recognition by determining if the weight of available evidence indicates that it is more-likely-than-not that the position will be sustained on audit, including resolution of related appeals or litigation processes, if any. The second step requires the Company to estimate and measure the tax liability as the largest amount that is more-likely-than-not to be realized upon ultimate settlement. The Company also accounts for any related interest and penalty charges as a component of income taxes.
Comprehensive Income (Loss)
Comprehensive income (loss) is defined as a change in equity of a business enterprise during a period, resulting from transactions from non-owner sources. Comprehensive income (loss) is comprised of all components of net income (loss) and all components of other comprehensive income (loss) within stockholders’ equity. The Company’s other comprehensive income (loss) includes unrealized gains and losses from its available-for-sale securities that are not considered other-than-temporarily impaired, net of taxes.
Earnings Per Share
Basic net income (loss) per share attributable to common stockholders is calculated by dividing the net income (loss) attributable to common stock holders by the weighted-average number of common shares outstanding for the period.
Diluted net income per share attributable to common stockholders is computed by giving effect to all potential dilutive common stock outstanding during the period, including options, restricted stock units, or RSUs, and ESPP purchase rights. The computation of diluted net income does not assume conversion or exercise of potentially dilutive securities that would have an anti-dilutive effect on earnings. The dilutive effect of outstanding options is computed using the treasury stock method. In periods when the Company has incurred a net loss, potential dilutive common securities outstanding have been excluded from the calculation of diluted net loss per share attributable to common stockholders as their effect is antidilutive.
Prior to the conversion of its redeemable convertible Series A preferred stock (the “Series A preferred stock”) to common stock, effective June 17, 2013, the Company applied the two-class method for calculating and presenting earnings per share as the Series A preferred stock was considered a participating security due to the rights of cumulative preferred return. Participating securities are defined as securities that participate in dividends with common units according to a pre-determined formula or a contractual obligation to share in the income of the entity. Under the two-class method, net income (loss) is allocated between common stock and other participating securities based on their participating rights. Accordingly, earnings allocated or distributed to the Series A preferred stock as well as the related number of outstanding shares of the Series A preferred stock have been excluded from the computation of basic and diluted net income (loss) per share attributable to common stockholders.
Dilutive securities that were subject to the Company’s IPO were excluded from the Company’s diluted net income (loss) per share calculation for the periods before the close of the Company’s IPO in June 2013.
Recent Accounting Pronouncements
In May 2014, the Financial Accounting Standards Board (the "FASB") issued an Accounting Standards Update related to revenue from contracts with customers, which supersedes the revenue recognition requirements in the current Accounting Standards Codification. This standard is based on the principle that revenue is recognized to depict the transfer of goods or services to customers in an amount that reflects the consideration to which the entity expects to be entitled in exchange for those goods or services. This standard also requires additional disclosure about the nature, amount, timing and uncertainty of revenue and cash flows arising from customer contracts, including significant judgments and changes in judgments and assets recognized from costs incurred to obtain or fulfill a contract. In August 2015 the FASB voted to defer the effective date by one year. The effective date of this standard will be the first quarter of fiscal 2019 using one of two retrospective application methods. The Company is currently evaluating the potential impact, if any, of this accounting standard update on its future consolidated financial statements.
In June 2014, the FASB issued an authoritative standard related to stock compensation Accounting for Share-Based Payments When the Terms of an Award Provide That a Performance Target Could Be Achieved after the Requisite Service Period. This standard requires that a performance target that affects vesting and that could be
69
achieved after the requisite service period be treated as a performance condition. A company should apply the existing guidance as it relates to awards with performance conditions that affect vesting to account for such awards. Compensation cost should be recognized in the period in which it becomes probable that the performance target will be achieved and should represent the compensation cost attributable to the periods for which the requisite service has already been rendered. The amendments in this update are effective for annual periods and interim periods within annual periods beginning after December 15, 2015 and early adoption is permitted. The adoption of this guidance is not currently expected to have a material impact on the Company’s consolidated financial statements.
In August 2014, the FASB issued an authoritative standard related to the disclosure of Uncertainties about an Entity’s Ability to Continue as a Going Concern, to provide guidance on management’s responsibility in evaluating whether there is a substantial doubt about a company’s ability to continue as a going concern and to provide related footnote disclosures. The effective date of this standard will be for annual periods ending after December 15, 2016 with early adoption permitted. The adoption of this guidance is not currently expected to have a material impact on the Company’s consolidated financial statements.
In June 2015, the FASB issued an authoritative standard related to Technical Corrections and Improvements. The standard covers a wide range of topics including guidance clarification and reference corrections, simplification and minor improvements. Transition guidance varies based on the specific topic included in this standard. The topics that require transition guidance are effective for all entities for fiscal years, and interim periods within those fiscal years, beginning after December 15, 2015. Early adoption is permitted. All other topics were effective upon the issuance of this standard. The Company is currently evaluating the impact, if any, of this guidance on the Company’s consolidated financial statements.
In July 2015, the FASB issued an authoritative standard related to disclosure of inventory, to provide guidance on management’s responsibility to measure inventory at the lower of cost and net realizable value. The effective date of this standard will be for annual periods ending after December 15, 2016 with early adoption permitted. The Company is currently evaluating the impact, if any, of this guidance on the Company’s consolidated financial statements.
In November 2015, the FASB issued an authoritative standard to provide guidance regarding balance sheet classification of deferred taxes. The guidance requires companies to classify all deferred tax assets and liabilities as non-current on the balance sheet instead of separating deferred taxes into current and non-current amounts. This guidance is effective for public business entities for financial statements issued for annual periods beginning after December 15, 2016, and interim periods within those annual periods. The amendments can be applied retrospectively or prospectively with earlier application permitted as of the beginning of an interim or annual reporting period. The Company has chosen to early adopt, on a prospective basis, and as such has recorded all of its deferred tax assets and liabilities as non-current as of December 26, 2015.
3. Fair Value Measurements
Cash, Cash Equivalent and Investments
The components of the Company’s cash, cash equivalents and investments are as follows (in thousands):
70
Fair Value Measured Using | ||||||||||||
December 26, 2015 | Quoted Prices in Active Markets for Identical Assets (Level 1) | Significant Other Observable Inputs (Level 2) | Significant Unobservable Inputs (Level 3) | |||||||||
Cash and cash equivalents: | ||||||||||||
Money market funds | $ | 83,852 | $ | 83,852 | $ | — | $ | — | ||||
Commercial paper | 4,497 | — | 4,497 | |||||||||
Total cash equivalents | 88,349 | 83,852 | 4,497 | — | ||||||||
Cash | 31,863 | |||||||||||
Total cash and cash equivalents | $ | 120,212 | ||||||||||
Short-term investments: | ||||||||||||
Corporate debt securities | $ | 14,560 | $ | — | $ | 14,560 | $ | — | ||||
Commercial paper | 8,986 | — | 8,986 | — | ||||||||
U.S. agency debt securities | 29,008 | — | 29,008 | — | ||||||||
U.S. government securities | 37,447 | — | 37,447 | — | ||||||||
Total short-term investments | $ | 90,001 | $ | — | $ | 90,001 | $ | — | ||||
Fair Value Measured Using | ||||||||||||
December 27, 2014 | Quoted Prices in Active Markets for Identical Assets (Level 1) | Significant Other Observable Inputs (Level 2) | Significant Unobservable Inputs (Level 3) | |||||||||
Cash and cash equivalents: | ||||||||||||
Money market funds | $ | 15,976 | $ | 15,976 | $ | — | $ | — | ||||
Total cash equivalents | 15,976 | 15,976 | — | — | ||||||||
Cash | 22,965 | |||||||||||
Total cash and cash equivalents | $ | 38,941 | ||||||||||
Short-term investments: | ||||||||||||
Corporate debt securities | $ | 58,707 | $ | — | $ | 58,707 | $ | — | ||||
U.S. agency debt securities | 31,779 | — | 31,779 | — | ||||||||
U.S. government securities | 19,979 | — | 19,979 | — | ||||||||
Total short-term investments | $ | 110,465 | $ | — | $ | 110,465 | $ | — | ||||
The Company considers all highly liquid investments with maturity of three months or less at the time of purchase to be cash equivalents. The Company holds money market funds that invest primarily in high-quality short-term money-market instruments, and these funds are not insured or guaranteed by the Federal Deposit Insurance Corporation or any other government agency. The Company presents available-for-sale investments as current assets as they are available for the Company's current operations.
Money market funds have been classified as Level 1 because these securities are valued based upon quoted prices in active markets. The Company’s Level 2 assets are priced using quoted market prices for similar instruments or non-binding market prices that are corroborated by observable market data. The Company uses inputs such as actual trade data, benchmark yields, broker/dealer quotes or alternative pricing sources with reasonable levels of price transparency which are obtained from quoted market prices, independent pricing vendors, or other sources, to determine the ultimate fair value of these assets. The Company’s policy is to recognize transfers among Level 1, Level 2 and Level 3 classifications as of the actual date of the events or change in circumstances that caused the transfers. The Company did not have any transfers between Level 1 and Level 2 in the fiscal years ended December 26, 2015 and December 27, 2014.
As of December 26, 2015 and December 27, 2014, the Company had no liabilities measured at fair value.
71
Financial instruments measured at amortized costs, gross unrealized gain, gross unrealized loss and fair value by significant investment categories are summarized as follows (in thousands):
December 26, 2015 | ||||||||||||
Amortized Costs | Gross Unrealized Gains | Gross Unrealized Losses | Fair Value | |||||||||
Cash and cash equivalents: | ||||||||||||
Money market funds | $ | 83,852 | $ | — | $ | — | $ | 83,852 | ||||
Commercial paper | 4,497 | — | — | 4,497 | ||||||||
Cash | 31,863 | — | — | 31,863 | ||||||||
Total cash and cash equivalents | $ | 120,212 | $ | — | $ | — | $ | 120,212 | ||||
Short-term investments: | ||||||||||||
Corporate debt securities | $ | 14,570 | $ | — | $ | (10 | ) | $ | 14,560 | |||
Commercial paper | 8,986 | — | — | 8,986 | ||||||||
U.S. agency debt securities | 29,031 | — | (23 | ) | 29,008 | |||||||
U.S. government securities | 37,461 | 3 | (17 | ) | 37,447 | |||||||
Total short-term investments | $ | 90,048 | $ | 3 | $ | (50 | ) | $ | 90,001 | |||
December 27, 2014 | ||||||||||||
Amortized Costs | Gross Unrealized Gains | Gross Unrealized Losses | Fair Value | |||||||||
Cash and cash equivalents: | ||||||||||||
Money market funds | $ | 15,976 | $ | — | $ | — | $ | 15,976 | ||||
Cash | 22,965 | — | — | 22,965 | ||||||||
Total cash and cash equivalents | $ | 38,941 | $ | — | $ | — | $ | 38,941 | ||||
Short-term investments: | ||||||||||||
Corporate debt securities | $ | 58,777 | $ | 4 | $ | (74 | ) | $ | 58,707 | |||
U.S. agency debt securities | 31,800 | 1 | (22 | ) | 31,779 | |||||||
U.S. government securities | 19,982 | 7 | (10 | ) | 19,979 | |||||||
Total short-term investments | $ | 110,559 | $ | 12 | $ | (106 | ) | $ | 110,465 | |||
The Company’s realized gain was immaterial in the twelve months ended December 26, 2015. There were no securities in a material continuous loss position for 12 months or longer as of December 26, 2015 or December 27, 2014.
The contractual maturity date of the cash, cash equivalents and short-term investments was as follows (in thousands):
As of | ||||||
December 26, 2015 | December 27, 2014 | |||||
Due within one year | $ | 177,852 | $ | 90,555 | ||
Due between one and five years | 498 | 35,886 | ||||
Total | 178,350 | 126,441 | ||||
Cash | 31,863 | 22,965 | ||||
Total | $ | 210,213 | $ | 149,406 | ||
4. Balance Sheet Components
Inventories
Inventories are comprised of the following (in thousands):
72
As of | ||||||
December 26, 2015 | December 27, 2014 | |||||
Raw materials | $ | 76 | $ | 433 | ||
Finished goods | 3,737 | 6,118 | ||||
Total inventories, net | $ | 3,813 | $ | 6,551 | ||
Property and equipment, net
Property and equipment, net, are comprised of the following (in thousands):
As of | ||||||
December 26, 2015 | December 27, 2014 | |||||
Equipment and machinery | $ | 14,932 | $ | 12,189 | ||
Furniture and fixtures | 308 | 430 | ||||
Leasehold improvements | 2,248 | 2,256 | ||||
Software | 1,963 | 1,824 | ||||
Total property and equipment | 19,451 | 16,699 | ||||
Less accumulated depreciation and amortization | (10,035 | ) | (9,312 | ) | ||
Total property and equipment, net | $ | 9,416 | $ | 7,387 | ||
Depreciation expense was $4.8 million, $4.3 million and $2.6 million for fiscal 2015, 2014 and 2013, respectively.
Accrued Liabilities
Accrued liabilities are comprised of the following (in thousands):
As of | ||||||
December 26, 2015 | December 27, 2014 | |||||
Accrued employee related costs | $ | 25,392 | $ | 16,021 | ||
Accrued inventory and other purchases | 2,452 | 1,830 | ||||
Accrued taxes payable | 1,918 | 1,183 | ||||
Accrued professional services | 1,655 | 761 | ||||
Other accruals | 5,917 | 3,043 | ||||
Total accrued liabilities | $ | 37,334 | $ | 22,838 | ||
Accrued Warranty
Accrued Warranty is comprised of (in thousands):
Fiscal Year Ended | |||||||||
December 26, 2015 | December 27, 2014 | December 28, 2013 | |||||||
Accrued warranty balance at beginning of period | $ | 875 | $ | 686 | $ | 350 | |||
Accrual for warranty during the period | 984 | 949 | 970 | ||||||
Actual costs incurred | (1,052 | ) | (760 | ) | (634 | ) | |||
Accrued warranty balance at end of period | $ | 807 | $ | 875 | $ | 686 | |||
As of | ||||||
Warranty accrual reported as: | December 26, 2015 | December 27, 2014 | ||||
Current | $ | 490 | $ | 484 | ||
Non-current | 317 | 391 | ||||
Total accrued warranty | $ | 807 | $ | 875 | ||
73
Deferred Revenue
Deferred revenue is comprised of the following (in thousands):
As of | ||||||
December 26, 2015 | December 27, 2014 | |||||
Deferred service revenue | $ | 73,454 | $ | 51,699 | ||
Deferred product revenue | $ | 8,677 | $ | 3,806 | ||
Total deferred revenue | $ | 82,131 | $ | 55,505 | ||
Accumulated Other Comprehensive Income (Loss)
Accumulated other comprehensive income (loss) consists of unrealized gains and losses from available-for-sale securities. The following summarizes the activity within accumulated other comprehensive income (loss) (in thousands):
Accumulated Other Comprehensive Income (Loss) | |||
Net Unrealized Gains (loss) | |||
Balance as of December 31, 2012 | $ | — | |
Available-for-sale securities: | |||
Unrealized gains, net | $ | 23 | |
Total other comprehensive income | $ | 23 | |
Balance as of December 28, 2013 | $ | 23 | |
Available-for-sale securities: | |||
Unrealized losses | $ | (117 | ) |
Total other comprehensive loss | $ | (117 | ) |
Balance as of December 27, 2014 | $ | (94 | ) |
Available-for-sale securities: | |||
Unrealized gains, net | 47 | ||
Total other comprehensive income | 47 | ||
Balance as of December 26, 2015 | $ | (47 | ) |
There were no reclassifications out of accumulated other comprehensive income (loss) into the consolidated statements of operations in fiscal 2015 and 2014.
5. Related Party Transactions
Gigamon LLC Members’ Distribution Payable
Prior to the LLC Conversion, in accordance with the LLC Agreement, the Company distributed to the holders of Series A preferred units and common units (hereafter referred to as the members) pro rata net income or losses based upon the number of units held by the members. The Series A preferred units allocation was based on an as-converted to common units basis.
During fiscal 2015, 2014 and 2013, the Company distributed $0.0 million, $0.5 million and $7.0 million, respectively; such distribution amounts included no income taxes for fiscal 2015, 2014 and 2013. The undistributed amount was recorded as Gigamon LLC members’ distribution payable within accrued liabilities in the consolidated balance sheets. As of December 26, 2015 and December 27, 2014, the members’ distribution payable was zero.
6. Commitments and Contingencies
Lease Commitments
On July 2, 2013, the Company entered into a sublease agreement to lease 105,664 square feet of office space, located in Santa Clara, California, with a term of 51 months from January 2014 through March 2018, for an aggregate net base rent of $10.7 million. In addition to the monthly base rent, the Company is responsible for
74
payment of certain operating expenses, including utilities and real estate taxes. The Company is using the leased space as its worldwide corporate headquarters. In addition, the Company leases office space for its United Kingdom subsidiary under a non-cancelable operating lease that expires in December 2017.
The Company has also entered into lease agreements for additional office space for sales offices in Australia, Brazil, Canada, China, France, Germany, Hong Kong, Italy, India, Japan, Mexico, Russia, Singapore, South Korea, and the United Arab Emirates. The Company recognizes rent expense on a straight-line basis over the lease period.
Rent expense related to the Company’s operating leases was approximately $3.2 million, $2.9 million and $1.1 million for fiscal 2015, 2014 and 2013, respectively.
Future minimum lease payments under non-cancelable operating leases as of December 26, 2015 were as follows (in thousands):
Fiscal Year: | |||
2016 | 3,763 | ||
2017 | 3,360 | ||
2018 | 957 | ||
2019 | 82 | ||
Total | $ | 8,162 | |
Purchase Commitments
The Company has agreements with contract manufacturers for the manufacturing of its products. The agreement with its primary contract manufacturer allows the contract manufacturer to procure components on the Company’s behalf based upon a production forecast provided by the Company. The Company may be obligated to purchase component inventory that is non-cancellable. As of December 26, 2015 and December 27, 2014, the Company’s non-cancellable purchase commitments for such component inventory was $12.0 million and $3.7 million, respectively.
Legal Proceedings
From time to time, the Company may become involved in legal proceedings arising in the ordinary course of business. The Company is not currently a party to any legal proceedings the outcome of which, if determined adversely to the Company, would individually or in the aggregate be expected to have a material adverse effect on its business, operating results, financial condition or cash flows.
Indemnification Obligations
Under the indemnification provisions of its standard sales related contracts, the Company agrees to defend its customers against third party claims asserting infringement of certain intellectual property rights, which may include patents, copyrights, trademarks, or trade secrets, and to pay judgments entered on such claims. The Company’s exposure under these indemnification provisions is generally limited to the total amount paid by its customer under the agreement. However, certain agreements include indemnification provisions that could potentially expose the Company to losses in excess of the amount received under the agreement. The Company has not incurred any costs as a result of such indemnifications and has not accrued any liabilities related to such obligations in its consolidated financial statements. In addition, the Company indemnifies its officers, directors, and certain key employees while they are serving in good faith in the company capacities. To date, there have been no claims under any indemnification provisions.
7. Performance Unit Plan
In fiscal 2009, the Company adopted the 2009 Performance Unit Plan (the “2009 Plan”). The 2009 Plan was not an equity plan and was intended to provide an incentive payment to employees, consultants and Board members by providing payment based on the appreciation in value of the Company at the time of a change in control event, such as a business acquisition, merger or an IPO (each performance unit a “PUP”). PUPs did not constitute ownership units or interests of the Company.
The distribution amount was defined as the difference between the redemption value of the units received at the time of the change of control and the base value of the PUP, which was $0.15 as determined by the Board at each award date. While the distributable amount may be satisfied in either cash or stock at the time of a change in control, the Company elected to make such distribution in cash.
75
Under existing accounting guidance, the compensation expense associated with the 2009 Plan is not required to be reflected in the consolidated financial statements until Change of Control is deemed probable. Accordingly, the Company had not recorded any liabilities or compensation expense associated with the PUPs in its consolidated financial statements until the period in which a change of control occurred. Accordingly, the Company recorded compensation and related payroll tax expenses of $20.4 million in its consolidated financial statements in fiscal 2013, for the 1,057,772 PUPs vested upon the completion of the IPO on June 17, 2013. The Company did not record any related compensation expense in fiscal 2014 and 2015. The 2009 Plan was terminated in June 2013, in connection with the completion of the IPO.
The following table summarizes the Company’s PUP activity:
PUPS Outstanding | |||||||||
PUPS Available for Grant | Number of PUPS | Weighted- Average Base Price | |||||||
Balances — | December 31, 2012 | 218,160 | 1,404,812 | 0.15 | |||||
Settled | — | (1,057,772 | ) | 0.15 | |||||
Cancelled | 347,040 | (347,040 | ) | 0.15 | |||||
Termination of the Plan | (565,200 | ) | — | 0.15 | |||||
Balances — | December 28, 2013 | — | — | ||||||
8. Preferred Stock and Stockholders’ Equity
LLC Conversion
On May 31, 2013, the Company converted from a Delaware limited liability company into a Delaware corporation and changed the Company’s name from Gigamon LLC to Gigamon Inc. Effective May 31, 2013, all of the Company’s outstanding common units and preferred units were converted into shares of common stock and preferred stock. Immediately following the LLC Conversion, certain entities affiliated with Highland Capital Partners that held the Company’s Series A preferred stock were merged with and into the Company, and the entities affiliated with Highland Capital Partners that merged with and into the Company received preferred stock in exchange for their equity interests. Further, in connection with the LLC Conversion, Gigamon Systems LLC, the holder of all of the Company’s outstanding common units prior to the LLC Conversion, exchanged all of the interests that it held in the Company for 16,851,635 shares of common stock of Gigamon Inc. In addition, all outstanding options to purchase shares in Gigamon Systems LLC were substituted for fully vested options to purchase 448,349 shares of the Company’s common stock, at a weighted average exercise price of $0.02 per share, for which the Company recognized related stock-based compensation expense of $8.5 million in fiscal 2013. Additionally, upon completion of the conversion, the Company recorded a net adjustment to deferred income tax assets of $14.8 million and reclassified $24.0 million from accumulated deficit to additional paid-in capital.
Initial Public Offering and Conversion of Preferred Stock
On June 17, 2013, the Company completed its initial public offering (“IPO”), in which 7,762,500 shares of its common stock were sold at a public offering price of $19.00 per share. The Company sold 5,512,500 shares of common stock, inclusive of 1,012,500 shares of common stock sold upon the exercise in full of the overallotment option by the underwriters. In addition, certain selling stockholders sold 2,250,000 shares of common stock at a public offering price of $19.00 per share. In connection with its IPO, all of the Company’s then-outstanding redeemable convertible preferred stock was converted into 8.1 million shares of common stock.
Follow-On Public Offering
On October 28, 2013, the Company completed its follow-on public offering, in which 5,100,000 shares of its common stock were sold at a public offering price of $38.50 per share. The Company sold 300,000 shares of common stock and the Company’s selling stockholders sold 4,800,000 shares of common stock, which included 293,718 shares of common stock issued upon the exercise of options by certain selling stockholders, with an aggregate exercise price of $1.3 million, at a public offering price of $38.50 per share.
Redeemable Convertible Series A Preferred Units
The LLC Agreement authorized the Company to issue 8,109,848 Series A preferred units (“Series A”) at no par value. Upon the LLC Conversion, all of the then-outstanding Series A were converted into shares of Series A
76
preferred stock. Furthermore, in connection with the closing of the Company’s IPO, all of the Company’s then-outstanding shares of Series A preferred stock were converted into shares of common stock on June 17, 2013 (the “Series A Conversion”). As of December 26, 2015 and December 27, 2014, the Company had zero Series A units outstanding.
The rights, privileges and restrictions of Series A units as set forth in the LLC Agreement as in effect prior to the LLC Conversion are summarized as follows:
Voting
Each unit of Series A had voting rights equal to an equivalent number of common units into which it was convertible and voted together as one class with the common units.
Liquidation
Upon a liquidation or a deemed liquidation event, the Company was obligated to distribute the net proceeds or assets available for distribution, whether in cash or in other property, to the holders of Series A and common units as follows:
•First, to the holders of Series A on a pari passu basis, and
•Next, to the holders of common units, pro rata in proportion to the number of common units held by such holders.
A merger or consolidation of the Company into another entity in which the members of the Company would own less than 50% of the voting stock/units of the surviving company or the sale or transfer of substantially all of the assets would be deemed a liquidation of the Company.
Conversion
Conversion was either at the option of the holder or was automatic upon the written consent of the requisite Series A Preferred Holders. “Requisite Series A Preferred Holders” was defined as holders of a majority of the Series A units then issued and outstanding, voting as a separate class.
Each Series A unit was convertible into a common unit by dividing $2.81 by the conversion price in effect. The initial conversion price of $2.81 was subject to adjustments for subdivisions or combinations of common units, reclassification, exchange and substitution and dilutive issuances. As of December 31, 2012, the conversion price in effect was the same as the issuance price. In connection with the LLC Conversion, the Series A units were converted into shares of Series A preferred stock at a ratio of 1-to-1.
Redemption
The holders of Series A units were entitled to elect to require the Company to purchase all of the outstanding Series A, after January 20, 2015, at $2.81 per unit plus accrued preferred return at 8% per annum, payable in three equal annual installments. Prior to the redemption upon the completion of the IPO, the Company was accreting to the January 20, 2015 redemption value of $33.5 million. For fiscal 2013 the company recorded $1.0 million for the accretion of the Series A units to their redemption value using the effective interest method.
The Company initially recorded the Series A units at their issuance price net of issuance costs, which represented the carrying value. The difference between the initial carrying value of Series A units and their total redemption value was accreted from the issuance date through the first redemption date, January 20, 2015, using the effective interest rate method. The Company recorded no accretion of issuance costs of for fiscal 2015 and 2014. The Company recorded accretion of issuance costs of $0.1 million for fiscal 2013.
Preferred Stock
The Company has authorized 20,000,000 shares of undesignated preferred stock, $0.0001 par value per share. As of December 26, 2015 and December 27, 2014, the Company had no shares of preferred stock issued or outstanding.
Common Units
Prior to the LLC Conversion, the Company had 33,333,333 common units authorized. Each holder of common units was entitled to one vote for each common unit held. Upon the LLC Conversion, all of the then-outstanding common units were converted into shares of common stock. As of December 26, 2015 and December 27, 2014, the Company had no common units outstanding.
Common Stock
77
The Company has authorized 1,000,000,000 shares of common stock, $0.0001 par value per share. Each holder of common stock is entitled to one vote for each share of common stock held. Cumulative voting for the election of directors is not provided in the Company’s amended and restated certificate of incorporation. The Company’s common stock is not entitled to preemptive rights, and is not subject to conversion, redemption or sinking fund provisions. Subject to preferences that may apply to any shares of preferred stock outstanding at the time, the holders of common stock are entitled to receive dividends out of funds legally available if the Board, in its discretion, determines to issue dividends and then only at the times and in the amounts that the Board may determine.
As of December 26, 2015 and December 27, 2014, the Company had 34,323,457 and 32,641,500 shares of common stock issued and outstanding, respectively.
Treasury Stock
As of December 26, 2015 and December 27, 2014, the Company had 8,109,848 shares of treasury stock outstanding, with a carrying value of $12.5 million, or $1.53 per share, within stockholders’ equity on its consolidated balance sheet. The treasury stock was repurchased in fiscal 2010 pursuant to a purchase and redemption agreement.
Equity Award Plans
Unit Option Plan
In March 2012, the Company adopted the 2012 Unit Option Plan (the “Option Plan”). The Option Plan authorized the Company to grant options and RSUs, up to a maximum of 3,300,505 shares, to employees, members and consultants of the Company. The Option Plan was terminated in connection with the Company’s IPO but will continue to govern the terms and conditions of outstanding awards granted thereunder. Prior to its termination, the Option Plan authorized the Company to grant options and RSUs up to a maximum of 4,967,172 units to employees, directors and consultants of the Company.
The following table summarizes the activity under the Option Plan prior to its termination (in shares):
Number of shares | ||
Shares available for future grant at December 31, 2012 | 732,267 | |
Additional authorization | 1,666,667 | |
Options granted | (1,426,849 | ) |
RSUs granted | (507,264 | ) |
Options cancelled | 64,653 | |
RSUs cancelled | 3,234 | |
Transferred to 2013 Equity Incentive Plan upon termination | (532,708 | ) |
Shares available for future grant at December 28, 2013 | — | |
Under the Option Plan, stock options granted to new hires are generally subject to a four-year vesting period whereby options become 25% vested on the first anniversary from the grant date and then ratably monthly thereafter through the end of the vesting period. Vested options may be exercised up to ten years from the vesting commencement date, as defined in the Option Plan. Vested but unexercised options, under the Option Plan, expire 30 days after termination of employment with the Company. Prior to the IPO, vesting of certain options under the Option Plan was also subject to the completion of the IPO (the “IPO Stock Options”).
2013 Equity Incentive Plan
In May 2013, the Company adopted the 2013 Equity Incentive Plan (the “2013 Equity Plan”). All authorized but unissued shares of the Company’s Option Plan were added to the 2013 Equity Plan’s authorized pool in June 2013. The Company is authorized to issue up to a maximum of 2,929,481 shares of common stock for future issuance, plus up to an additional 4,967,172 shares upon termination of awards under the Option Plan. In addition, the 2013 Equity Plan is subject to increase annually on the first day of each of the Company’s fiscal years beginning with fiscal 2014, by an amount equal to the least of (i) 1,464,740 shares, (ii) 5% of the outstanding shares of common stock as of the last day of the immediately preceding fiscal year, or (iii) such other amount as determined by the Board. Vested but unexercised options, under the 2013 Equity Plan, expire three months after termination of service with the Company. As of December 26, 2015, outstanding awards under the 2013 Equity Plan and the Option Plan covered 2,825,746 shares and 1,127,757 shares of the Company's common stock, respectively.
78
The 2013 Equity Plan permits the granting of stock options, stock appreciation rights, restricted stock, RSUs, performance units and performance shares to employees, directors and consultants of the Company.
Employee Stock Purchase Plan
In conjunction with the completion of its IPO in June 2013, the Company adopted the 2013 Employee Stock Purchase Plan (the “ESPP”). A maximum of 439,422 shares were initially authorized for future issuance and the number of authorized shares under the ESPP is subject to increase on an annual basis. In the twelve months ended December 26, 2015 and December 27, 2014, the Board authorized an additional 439,422 shares of common stock for future issuance under the ESPP. Eligible employees can purchase shares of the Company’s common stock at a discount through payroll deductions of up to 15% of their eligible compensation, subject to plan limitations. Employees are able to purchase shares at 85% of the lower of the fair market value of the Company’s common stock (i) at the date of commencement of the offering period or (ii) at the last day of the purchase period. The ESPP provides for a 24-month offering period comprised of four purchase periods of approximately six months. The offering periods are scheduled to start on the first trading day on or after February 15 and August 15 of each year, except for the first offering period, which commenced on the first trading day upon the completion of the Company’s IPO, or June 12, 2013, and ended on August 17, 2015. In fiscal 2015, 2014, and 2013, the Company recorded stock-based compensation expense of $2.7 million, $4.2 million and $4.7 million, respectively for its ESPP. During fiscal 2015 there were two purchase periods that resulted in the issuance of 527,588 shares of common stock at a weighted average purchase price of 9.77 per share.
Stock Options
Stock options granted under the 2013 Equity Plan and formerly under the 2012 Plan (together, the “Option Plans”), are generally subject to a four-year vesting period whereby stock options become 25% vested on the first anniversary of the grant date and then ratably monthly thereafter through the end of the vesting period. Vested stock options may be exercised up to ten years from the vesting commencement date. Under the 2012 Plan, vested but unexercised stock options expire 30 days after termination of service with the Company. Under the 2013 Equity Plan, vested but unexercised stock options expire three months after termination of service with the Company.
In fiscal 2012 the Company granted 66,663 shares subject to performance-based options. These options vest based upon the achievement of sales goals for each individual grantee. As of December 26, 2015 there were 2,611 performance based common stock awards outstanding, all of which were unvested. As of December 27, 2014 there were 20,135 performance based common stock awards outstanding, of which 9,830 were unvested. The Company recognized approximately $51,000, $40,000, and $134,400 in stock-based compensation expense related to performance-based options during fiscal 2015, 2014, and 2013, respectively. The Company did not issue any performance-based options in fiscal 2015 or 2014.
In fiscal 2013, the Company granted 448,349 shares subject to fully-vested options to certain employees, with an average exercise price of $0.02 per share, as substitute options to purchase our common stock in connection with the LLC Conversion. Stock-based compensation expense recognized in fiscal 2013 in connection with these fully vested options was $8.5 million. The Company did not issue any fully-vested options in fiscal 2015 or 2014.
In fiscal 2012, the Company granted a total of 1,143,413 shares subject to the IPO Stock Options, for which the Company recorded $3.8 million of stock-based compensation expense in fiscal 2013 upon the completion of its IPO in June 2013.
79
The following table summarizes the stock option activity related to shares of common stock under the Company’s Option Plans:
Number of Stock Options Outstanding | Weighted- Average Exercise Price | Weighted- Average Remaining Contractual Life (Years) | Aggregate Intrinsic Value | ||||||
(in thousands) | |||||||||
Balance — December 31, 2012 | 2,402,398 | $ | 7.92 | 9.40 | $ | 12,527 | |||
Options granted | 1,604,847 | $ | 11.34 | ||||||
Options exercised | (344,592 | ) | $ | 4.99 | |||||
Options cancelled | (295,016 | ) | $ | 8.85 | |||||
Balance — December 28, 2013 | 3,367,637 | $ | 9.77 | 8.78 | $ | 62,725 | |||
Options granted | 646,444 | $ | 20.21 | ||||||
Options exercised | (790,147 | ) | $ | 6.73 | |||||
Options cancelled | (843,966 | ) | $ | 11.75 | |||||
Balance — December 27, 2014 | 2,379,968 | $ | 12.91 | 7.50 | $ | 14,368 | |||
Options granted | 408,000 | $ | 21.44 | ||||||
Options exercised | (523,398 | ) | $ | 8.42 | |||||
Options cancelled | (93,850 | ) | $ | 9.76 | |||||
Balance — December 26, 2015 | 2,170,720 | $ | 15.73 | 7.14 | $ | 24,910 | |||
Vested and expected to vest — December 28, 2013 | 3,216,818 | $ | 9.68 | 8.64 | $ | 60,034 | |||
Exercisable — December 28, 2013 | 972,268 | $ | 6.34 | 8.65 | $ | 21,344 | |||
Vested and expected to vest — December 27, 2014 | 2,230,425 | $ | 12.71 | 8.17 | $ | 13,754 | |||
Exercisable — December 27, 2014 | 936,061 | $ | 9.71 | 7.85 | $ | 7,643 | |||
Vested and expected to vest — December 26, 2015 | 2,066,613 | $ | 15.55 | 7.14 | $ | 24,088 | |||
Exercisable — December 26, 2015 | 1,114,119 | $ | 13.23 | 7.20 | $ | 15,536 | |||
Aggregate intrinsic value represents the difference between the exercise price of the awards and the Company’s fair value per share of $26.82, $17.47 and $28.29 as of December 26, 2015, December 27, 2014, and December 28, 2013, respectively, for the total number of underlying options.
During fiscal 2014, the Company accelerated the vesting of 31,211 shares of common stock pursuant to outstanding stock options and 9,347 RSUs, of certain employees, pursuant to the terms of their severance agreements. This accelerated vesting resulted in a net expense reversal of $0.4 million during the fiscal year since the fair value of the accelerated options and RSUs on the date of modification was lower than the previously recognized stock-based compensation expense.
During fiscal 2014, the Company entered into a consulting agreement with a departing executive. Pursuant to the agreement the executive continued to vest stock options and RSU’s as a consultant until the termination of the agreement. The terms of the consulting agreement resulted in a net expense reversal of $0.3 million since the total compensation cost previously recognized exceeded the fair market value of the stock options and RSU’s expected to vest as a result of the consulting agreement.
During fiscal 2014, the Company modified certain stock option grants covering 10,666 shares of common stock to restrict these options to cash settlement upon future exercises, for which these stock options are marked-to-market as of each balance sheet date until their settlement dates. Stock-based compensation recognized in connection with these modified stock options was immaterial in fiscal 2014.
Additional information regarding the Company’s outstanding stock options and vested and exercisable stock options is summarized below:
80
As of December 26, 2015 | |||||||||||
Options Outstanding | Options Vested and Exercisable | ||||||||||
Exercise Prices | Number of Stock Options Outstanding | Weighted- Average Remaining Contractual Life (Years) | Weighted- Average Exercise Price per Share | Shares Subject to Stock Options | Weighted- Average Exercise Price per Share | ||||||
$0.00 - $10.85 | 508,423 | 6.9 | $ | 6.32 | 355,089 | $ | 5.31 | ||||
$11.02 - $13.11 | 523,706 | 7.1 | $ | 12.26 | 353,950 | $ | 12.33 | ||||
$14.70 - $19.00 | 477,619 | 7.8 | $ | 17.05 | 284,017 | $ | 17.07 | ||||
$21.44 - $29.36 | 446,000 | 6.3 | $ | 22.11 | 19,791 | $ | 29.36 | ||||
$29.47 - $30.51 | 214,972 | 8.1 | $ | 30.27 | 101,272 | $ | 30.23 | ||||
2,170,720 | 7.1 | $ | 15.73 | 1,114,119 | $ | 13.23 | |||||
Restricted Stock Unit Activity
RSUs generally vest over a period of one to four years. RSUs vest on the vesting dates determined by the Company. The vesting is subject to the employee’s continuing service with the Company over that period. Until vested, RSUs do not have the voting or dividend participation rights of the Company’s common stock and the shares of the Company’s common stock underlying the awards are not considered issued and outstanding. The cost of RSUs is determined using the fair value of the Company’s common stock on the date of the grant. Prior to our IPO, vesting of RSUs was subject to the occurrence of a liquidity event, and in certain instances additional vesting criteria. The liquidity event was defined as the earliest of (i) the closing of a sale event of the Company, or (ii) six months following the IPO of the Company’s common stock.
The following table summarizes the RSU activity under the Company’s Option Plans:
Number of RSUs Outstanding | Weighted- Average Grant Date Fair Value | Weighted- Average Remaining Contractual Life (Years) | Aggregate Intrinsic Value | |||||||
(in thousands) | ||||||||||
Balance - December 31, 2012 | 149,841 | $ | 11.12 | 1.98 | 1,965 | |||||
RSUs granted | 764,509 | $ | 22.13 | |||||||
RSUs vested | (50,849 | ) | $ | 11.06 | ||||||
RSUs canceled | (22,552 | ) | $ | 16.16 | ||||||
Balance - December 28, 2013 | 840,949 | $ | 21.00 | 1.40 | 23,790 | |||||
RSUs granted | 1,668,228 | $ | 19.58 | |||||||
RSUs vested | (397,239 | ) | $ | 21.18 | ||||||
RSUs canceled | (378,713 | ) | $ | 24.64 | ||||||
Balance - December 27, 2014 | 1,733,225 | $ | 18.79 | 1.27 | $ | 30,245 | ||||
RSUs granted | 1,364,465 | |||||||||
RSUs vested | (1,010,609 | ) | ||||||||
RSUs canceled | (307,742 | ) | ||||||||
Balance - December 26,2015 | 1,779,339 | $ | 22.64 | 1.53 | $ | 47,722 | ||||
Vested and expected to vest — December 28, 2013 | 783,633 | $ | 20.89 | 1.35 | $ | 22,169 | ||||
Vested and expected to vest — December 27, 2014 | 1,521,264 | $ | 18.66 | 1.18 | $ | 26,580 | ||||
Vested and expected to vest — December 26, 2015 | 1,510,440 | $ | 22.53 | 1.43 | $ | 40,510 | ||||
Aggregate intrinsic value for RSUs represents the Company’s fair market value per share of $26.82, $17.47, and $28.29 as of December 26, 2015, December 27, 2014, and December 28, 2013, respectively, for the total number of underlying RSUs.
Stock-Based Compensation Expense
The fair value of stock options is estimated on the grant date using the Black-Scholes option-pricing model. It is based on the “simplified method” for developing the estimate of the expected life of a “plain vanilla” stock option.
81
Under this approach, the expected term is presumed to be the midpoint between the average vesting date and the end of the contractual term of the option. The risk-free interest rate for the period covering the expected life of the option is based on the U.S. Treasury yield curve in effect at the time of grant. The expected volatility was determined based on historical volatility of the common stock of publicly traded comparable companies and the expected life of the options since the Company has not had sufficient public trading history of its common stock. The dividend yield assumption is based on the Company’s historical dividend payouts. The Company uses the graded vesting method for expense attribution.
Prior to the IPO, determining the market value of the Company’s common stock required complex and subjective judgment and estimates. There was inherent uncertainty in making these judgments and estimates. The absence of an active market for the Company’s common units or common stock prior to the IPO required the Board to estimate the fair value of its common stock for purposes of setting the exercise price of the options and estimating the fair value of common stock at each meeting at which options were granted based on factors such as the valuations of comparable companies, the status of the Company’s development and sales efforts, revenue growth and additional objective and subjective factors relating to the Company’s business. The Company performed its analysis in accordance with applicable elements of the practice aid issued by the American Institute of Certified Public Accountants entitled Valuation of Privately Held Company Equity Securities Issued as Compensation.
The fair value of the option awards and ESPP purchase rights granted and the assumptions used in the Black-Scholes option pricing model are summarized as follows:
Fiscal Year Ended | |||
December 26, 2015 | December 27, 2014 | December 28, 2013 | |
Stock option awards: | |||
Expected term (in years) | 4.6 | 5.27 - 6.08 | 5.00 - 6.08 |
Risk-free interest rate | 1.6% | 1.69% - 1.90% | 0.89% - 1.84% |
Expected volatility | 56.04% | 58.9% - 61.9% | 62.1% - 65.3% |
Expected dividend rate | —% | —% | —% |
Grant date fair value per award | $10.11 | $5.94 - $17.67 | $9.44 - $23.29 |
ESPP purchase right: | |||
Expected term (in years) | 0.5 - 2.0 | 0.5 - 2.0 | 0.68 - 2.18 |
Risk-free interest rate | 0.07% - 0.72% | 0.05% - 0.42% | 0.08% - 0.20% |
Expected volatility | 37.6% - 59.9% | 53.1% - 63.1% | 53.6% - 63.1% |
Expected dividend rate | —% | —% | —% |
Grant date fair value per share | $5.48 - $12.64 | $3.48 - $13.06 | $12.11 - $15.68 |
The cost of RSUs is determined using the fair value of the Company’s common stock on the date of the grant. In fiscal 2015, the Company granted 1,364,465 RSUs with a grant date fair value per share ranging from $16.31 to $33.95. In fiscal 2014, the Company granted 1,668,228 RSUs with a grant date fair value per share ranging from $10.75 to $34.26. In fiscal 2013, the Company granted 764,509 RSUs with a grant date fair value per share ranging from $15.57 to $38.33.
As of December 26, 2015, unrecognized compensation expense related to stock options, RSUs and ESPP purchase rights, net of estimated forfeitures, was $3.3 million, $18.2 million, and $1.4 million, respectively, with a weighted-average remaining amortization period of 1.0 year, 1.5 years and 0.9 years, respectively. As of December 27, 2014, unrecognized compensation expense related to unvested stock options, RSUs and ESPP purchase rights net of estimated forfeitures, was $5.1 million, $16.2 million, and $3.5 million, respectively with a weighted-average remaining amortization period of 1.1 years, 1.3 years, and 0.7 years, respectively. As of December 28, 2013 unrecognized compensation expense related to unvested stock options, RSUs and ESPP purchase rights net of estimated forfeitures, was $10.3 million, $10.9 million, and $5.1 million, respectively with a weighted-average remaining amortization period of 1.4 years, 1.4 years, and 0.9 years, respectively. As of December 26, 2015 and December 27, 2014 there was $0.1 million and $0.2 million capitalized stock-based compensation expense, respectively within the Company's inventory balance.
The following table summarizes the stock-based compensation expense recorded in the Company’s consolidated statement of operations (in thousands):
82
Fiscal Year Ended | |||||||||
December 26, 2015 | December 27, 2014 | December 28, 2013 | |||||||
Cost of revenue | $ | 1,872 | $ | 1,679 | $ | 3,496 | |||
Research and development | 9,126 | 8,102 | 11,467 | ||||||
Sales and marketing | 9,466 | 8,212 | 11,034 | ||||||
General and administrative | 9,304 | 6,665 | 6,546 | ||||||
Total stock-based compensation expense | $ | 29,768 | $ | 24,658 | $ | 32,543 | |||
Common Stock Reserved for Future Issuance
The Company had the following shares of common stock reserved for future issuance (in shares):
As of | ||||
December 26, 2015 | December 27, 2014 | |||
Option Plan: | ||||
Common stock subject to options outstanding | 1,068,808 | 1,640,500 | ||
RSUs outstanding | 58,949 | 197,448 | ||
Shares available for future grants | — | — | ||
2013 Equity Plan: | ||||
Common stock subject to options outstanding | 1,105,356 | 745,912 | ||
RSUs outstanding | 1,720,390 | 1,533,777 | ||
Shares available for future grants | 3,753,018 | 3,656,706 | ||
ESPP | 332,351 | 420,517 | ||
Common stock reserved for future issuances | 8,038,872 | 8,194,860 | ||
9. Defined Contribution Plans
The Company sponsors a 401(k) defined contribution plan providing a matching contribution of 50% of each participant’s contribution, up to the lesser of 3% of the participant’s annual compensation or $7,950 for fiscal 2015, $7,650 for fiscal 2014, and $7,500 for fiscal 2013.
The Company’s contributions to the 401(k) defined contribution plan were $1.8 million, $2.0 million and $1.6 million for fiscal 2015, 2014 and 2013, respectively.
83
10. Income Tax
Income (loss) before income tax (provision) benefit consisted of the following (in thousands):
Fiscal Year Ended | |||||||||
December 26, 2015 | December 27, 2014 | December 28, 2013 | |||||||
United States | $ | 10,326 | $ | (20,682 | ) | $ | (31,024 | ) | |
Foreign | 1,538 | 1,026 | 824 | ||||||
Total income (loss) before income tax (provision) benefit | $ | 11,864 | $ | (19,656 | ) | $ | (30,200 | ) | |
The income tax (provision) benefit consisted of the following (in thousands):
Fiscal Year Ended | |||||||||
December 26, 2015 | December 27, 2014 | December 28, 2013 | |||||||
Federal: | |||||||||
Current | $ | (4,162 | ) | $ | — | — | |||
Deferred | — | (19,504 | ) | 19,504 | |||||
State: | |||||||||
Current | (926 | ) | (24 | ) | (10 | ) | |||
Deferred | — | (1,373 | ) | 1,373 | |||||
Foreign: | |||||||||
Current | (661 | ) | (285 | ) | (216 | ) | |||
Deferred | 71 | 52 | 12 | ||||||
Total income tax (provision) benefit | $ | (5,678 | ) | $ | (21,134 | ) | $ | 20,663 | |
The items accounting for the difference between income taxes computed at the federal statutory income tax rate and the income tax (provision) benefit consisted of the following (dollars in thousands):
Fiscal Year Ended | |||||||||
December 26, 2015 | December 27, 2014 | December 28, 2013 | |||||||
Federal statutory rate | 35 | % | 35 | % | 35 | % | |||
Effect of: | |||||||||
Tax (provision) benefit at federal statutory rate | $ | (4,153 | ) | $ | 6,881 | $ | 10,570 | ||
State tax (provision) benefit, net of federal tax (provision) benefit | (405 | ) | 515 | 376 | |||||
ESPP | (723 | ) | (1,106 | ) | (1,760 | ) | |||
Other permanent items | (305 | ) | (215 | ) | (281 | ) | |||
Impact of foreign operations | (8 | ) | 132 | 37 | |||||
Tax credits | 3,205 | 2,106 | 240 | ||||||
LLC income flow-through | — | — | (3,319 | ) | |||||
Recognition of deferred tax assets | — | — | 14,800 | ||||||
Change in valuation allowance | (3,289 | ) | (29,447 | ) | — | ||||
Total income tax (provision) benefit | $ | (5,678 | ) | $ | (21,134 | ) | 20,663 | ||
The Company recognizes interest and penalties related to uncertain tax positions as part of the income tax provision. To date, no such interest and penalties have been accrued.
84
The components of the Company’s deferred tax assets and liabilities are as follows (in thousands):
As of | ||||||
December 26, 2015 | December 27, 2014 | |||||
Deferred tax assets: | ||||||
Stock-based compensation | $ | 12,895 | $ | 10,672 | ||
Fixed assets | 3,938 | 4,272 | ||||
Net operating loss | — | 432 | ||||
Accruals and reserves | 6,750 | 4,761 | ||||
Deferred revenue | 4,895 | 3,896 | ||||
Inventory reserve | 971 | 1,231 | ||||
Credits | 3,825 | 2,651 | ||||
Gross deferred tax assets | 33,274 | 27,915 | ||||
Valuation allowance | (33,139 | ) | (27,851 | ) | ||
Total deferred tax assets | 135 | 64 | ||||
Deferred tax liabilities | — | — | ||||
Total | $ | 135 | $ | 64 | ||
The provision for income taxes for the year ended December 26, 2015, was primarily related to taxable income in the United States, with additional taxes assessed by foreign jurisdictions. As of December 26, 2015 the Company assessed that it is more-likely-than-not that it will not realize its federal and state deferred tax assets based on the absence of sufficient positive objective evidence that it would generate sufficient taxable income in its United States tax jurisdiction to realize the deferred tax assets. The Company intends to continue maintaining a full valuation allowance on its deferred tax assets until there is sufficient evidence to support the reversal of all or some portion of these allowances. If the Company continues to maintain profitability, there is a reasonable possibility that, within the next year, sufficient positive evidence may become available to reach a conclusion that a significant portion, or all, of the valuation allowance will no longer be needed. As such, the Company may release a significant portion, or all, of its valuation allowance against its deferred tax assets within the next 12 months. This release would result in the recognition of certain deferred tax assets and a decrease to income tax provision for the period such release is recorded.
The following table presents the activity in the valuation allowance:
Fiscal Year Ended | |||||||||
December 26, 2015 | December 27, 2014 | December 28, 2013 | |||||||
Balance at the beginning of period | $ | 27,851 | $ | — | $ | — | |||
Additions | 5,288 | 27,851 | — | ||||||
Balance at End of Period | $ | 33,139 | $ | 27,851 | $ | — | |||
As of December 26, 2015, the Company had federal and state net operating loss carryforwards of approximately $6.6 million and $1.1 million, respectively, available to reduce any future taxable income. If not utilized, the federal and state net operating loss carryforwards will expire between fiscal 2033 and 2035, while the California credit will carry forward indefinitely.
The Company also has federal and state research and development tax credit carryforwards of approximately $1.1 million and $4.1 million, respectively. The federal credit will start to expire between fiscal 2033 and 2035 while the state credit will carry forward indefinitely.
Utilization of the net operating loss carryforwards and credits may be subject to a substantial annual limitation due to the ownership change limitations provided by the Internal Revenue Code of 1986, as amended, and similar state provisions. The annual limitation may result in the expiration of net operating losses and credits before utilization. The Company uses the with-and-without approach described in guidance which has been incorporated into ASC 740, Income Taxes, to determine the recognition and measurement of excess tax benefits. Accordingly, the Company has elected to recognize excess income tax benefits from share-based awards in additional paid-in capital only if an incremental income tax benefit would be realized after considering all other tax attributes presently
85
available to the Company. As of December 26, 2015, the amount of excess tax benefits from stock options included in federal and state net operating losses was $6.6 million and $1.1 million, respectively. The impact of this excess tax benefit is recognized as additional paid-in capital when it reduces taxes payable. In addition, the Company has elected to account for the indirect effects of share-based awards on other tax attributes, such as the research and alternative minimum tax credits, through the consolidated statement of operations.
Uncertain Income Tax Positions
The Company has adopted ASC 740-10 "Accounting for Uncertainty in Income Taxes (formerly FIN 48). ASC 740-10 prescribes a recognition threshold and measurement attribute for the financial statement recognition and measurement of uncertain tax positions taken or expected to be taken in the Company's income tax return, and also provides guidance on derecognition, classification, interest and penalties, accounting in interim periods, disclosure, and transition.
As of December 26, 2015 and December 27, 2014, the Company had $3.2 million and $2.3 million of unrecognized tax benefits, respectively which represented an increase in unrecognized tax benefits by $1.0 million during 2015. If recognized, all of these unrecognized tax benefits (net of federal benefit) would be recorded as a reduction of future income tax provision for the years ending December 26, 2015 and December 27, 2014, respectively.
A reconciliation of the beginning and ending amount of the unrecognized income tax benefits during the tax periods ended December 26, 2015 and December 27, 2014 are as follows (in thousands):
Fiscal Year Ended | |||||||||
December 26, 2015 | December 27, 2014 | December 28, 2013 | |||||||
Unrecognized tax benefits at the beginning of the period | $ | 2,258 | $ | 186 | $ | — | |||
Additions for tax positions related to the current year | 1,424 | 1,824 | 186 | ||||||
Additions for tax positions related to the prior year | 112 | 248 | — | ||||||
Reductions for tax positions related to the prior year | (547 | ) | — | — | |||||
Unrecognized tax benefits at the end of the period | $ | 3,247 | $ | 2,258 | $ | 186 | |||
The Company does not anticipate a material change in unrecognized tax benefits within the next twelve months.
The Company's policy is to account for interest and penalties related to income tax expense as income tax expense. As of December 26, 2015 and December 27, 2014, the Company had accrued no interest and penalties related to unrecognized tax benefits.
As of December 26, 2015, the Company had not recorded any tax provision for U.S. federal and state income taxes on approximately $2.7 million of undistributed earnings in foreign subsidiaries, which it expects to reinvest outside of the U.S. indefinitely. If the Company were to repatriate these earnings to the U.S., it would be subject to U.S. income taxes, an adjustment for foreign tax credits, and foreign withholding taxes. The determination of the amount of unrecognized deferred income tax liability related to these earnings is not practicable.
The Company files income tax returns in the U.S. federal jurisdiction, certain U.S. states, and the United Kingdom. The Company is subject to U.S. federal income tax examination from calendar years 2013 to 2014, from 2009 to 2014 for state purposes, and 2012 to 2014 for the United Kingdom. The U.S. federal and U.S. state taxing authorities may choose to audit tax returns for tax years beyond the statute of limitation period due to significant tax attribute carryforwards from prior years, making adjustments only to carryforward attributes.
On December 18, 2015, The Consolidated Appropriations Act of 2014 was signed into law, which retroactively reinstated and made permanent the federal research tax credit provisions form January 1, 2015 through December 31, 2015.
In November 2015, the FASB issued ASU 2015-17, Balance Sheet Classification of Deferred Taxes. The ASU requires that deferred tax assets and liabilities be classified as noncurrent in the statement of financial position, thereby simplifying the current guidance that requires an entity to separate deferred assets and liabilities into current and noncurrent amounts. The ASU will be effective for the Company beginning in the first quarter of fiscal year 2018 though early adoption is permitted. The Company early-adopted the ASU on a prospective basis, as of December 26, 2015, and the statement of financial position as of December 26, 2015 reflects the revised classification of current deferred tax assets and liabilities as noncurrent.
11. Net Income (Loss) per Share
86
The net income (loss) per share and weighted-average shares information presented in the consolidated financial statements reflect the Company’s one-for-three reverse stock split completed on May 20, 2013. Effective June 17, 2013, all shares of the then-outstanding redeemable convertible preferred stock were converted to common stock and are included in the weighted-average shares used to compute net income (loss) per share starting from the conversion date. Due to the net loss incurred in fiscal 2014 and 2013, potential dilutive securities were excluded from the calculation of diluted net loss per share attributable to common stockholders for such period as their effect was anti-dilutive.
The following table presents the computation of basic and diluted net income (loss) per share attributable to common stockholders (in thousands, except per share data):
Fiscal Year Ended | |||||||||
December 26, 2015 | December 27, 2014 | December 28, 2013 | |||||||
Numerator: | |||||||||
Net income (loss) attributable to common stockholders | $ | 6,186 | $ | (40,790 | ) | $ | (9,518 | ) | |
Denominator: | |||||||||
Weighted average shares used for basic net income (loss) per share computation | 33,618 | 32,200 | 24,722 | ||||||
Weighted average effect of dilutive securities: | |||||||||
Stock options | 2,248 | — | — | ||||||
Weighted average shares used for diluted net income (loss) per share computation | 35,866 | 32,200 | 24,722 | ||||||
Net income (loss) per share attributable to common stockholders : | |||||||||
Basic | $ | 0.18 | $ | (1.27 | ) | $ | (0.39 | ) | |
Diluted | $ | 0.17 | $ | (1.27 | ) | $ | (0.39 | ) | |
The following shares of potentially dilutive securities were excluded from the computation of diluted net income (loss) per share for the periods presented (in thousands):
Fiscal Year Ended | ||||||
December 26, 2015 | December 27, 2014 | December 28, 2013 | ||||
Equity awards to purchase common stock | 654 | 6,339 | 5,073 | |||
12. Segment Information
Operating segments are defined as components of an enterprise that engage in business activities for which separate financial information is available and evaluated by the chief operating decision maker in deciding how to allocate resources and assessing performance. The Company’s chief operating decision maker is its chief executive officer. The chief executive officer reviews financial information presented on a consolidated basis, for purposes of allocating resources and evaluating financial performance. The Company has one business activity and there are no segment managers who are held accountable for operations, or plans for levels or components below the consolidated unit level. Accordingly, the Company operates as a single reportable segment.
The following table summarizes the Company’s revenue by geographic region, based on the location to where the product was shipped (in thousands):
Fiscal Year Ended | |||||||||
December 26, 2015 | December 27, 2014 | December 28, 2013 | |||||||
United States | $ | 163,283 | $ | 116,921 | $ | 103,257 | |||
Rest of Americas | 10,696 | 8,499 | 5,846 | ||||||
Europe, Middle East and Africa | 32,167 | 21,769 | 19,753 | ||||||
Asia Pacific | 15,829 | 9,941 | 11,439 | ||||||
Total | $ | 221,975 | $ | 157,130 | $ | 140,295 | |||
87
The Company’s long-lived assets by geographic region are summarized as follows (in thousands):
As of | ||||||
December 26, 2015 | December 27, 2014 | |||||
United States | $ | 9,148 | $ | 7,218 | ||
Other | 268 | 169 | ||||
Total | $ | 9,416 | $ | 7,387 | ||
88
Supplementary Quarterly Financial Data (Unaudited)
The following table sets forth selected unaudited consolidated statement of operations data for each quarter of the two fiscal years ended December 26, 2015 (in thousands, except per share amounts):
Three Months Ended | ||||||||||||||||||||||||
Dec 26, 2015 | Sept 26, 2015 | June 27, 2015 | March 28, 2015 | Dec 27, 2014 | Sept 27, 2014 | June 28, 2014 | March 29, 2014 | |||||||||||||||||
Consolidated Statement of Operations Data: | ||||||||||||||||||||||||
Revenue: | ||||||||||||||||||||||||
Product | $ | 47,051 | $ | 38,717 | $ | 34,814 | $ | 32,152 | $ | 36,790 | $ | 26,180 | $ | 22,544 | $ | 20,080 | ||||||||
Service | 19,973 | 17,935 | 16,632 | 14,701 | 14,461 | 13,088 | 12,307 | 11,680 | ||||||||||||||||
Total revenue | 67,024 | 56,652 | 51,446 | 46,853 | 51,251 | 39,268 | 34,851 | 31,760 | ||||||||||||||||
Cost of revenue: | ||||||||||||||||||||||||
Product | 10,262 | 9,613 | 9,558 | 9,445 | 10,319 | 7,396 | 6,281 | 7,005 | ||||||||||||||||
Service | 1,669 | 1,708 | 1,763 | 1,777 | 1,722 | 1,601 | 1,544 | 1,580 | ||||||||||||||||
Total cost of revenue | 11,931 | 11,321 | 11,321 | 11,222 | 12,041 | 8,997 | 7,825 | 8,585 | ||||||||||||||||
Gross profit | 55,093 | 45,331 | 40,125 | 35,631 | 39,210 | 30,271 | 27,026 | 23,175 | ||||||||||||||||
Research and development | 13,171 | 12,677 | 12,227 | 11,496 | 10,922 | 10,086 | 10,860 | 10,938 | ||||||||||||||||
Sales and marketing | 26,150 | 21,388 | 21,171 | 18,832 | 20,387 | 17,948 | 19,558 | 18,170 | ||||||||||||||||
General and administrative | 7,788 | 6,950 | 6,702 | 6,019 | 5,015 | 5,217 | 4,446 | 6,005 | ||||||||||||||||
Total operating expenses | 47,109 | 41,015 | 40,100 | 36,347 | 36,324 | 33,251 | 34,864 | 35,113 | ||||||||||||||||
Income (loss) from operations | 7,984 | 4,316 | 25 | (716 | ) | 2,886 | (2,980 | ) | (7,838 | ) | (11,938 | ) | ||||||||||||
Interest income | 116 | 106 | 105 | 119 | 92 | 82 | 73 | 61 | ||||||||||||||||
Other (expense) income, net | (119 | ) | (69 | ) | 7 | (10 | ) | (31 | ) | (28 | ) | 6 | (41 | ) | ||||||||||
Income (loss) before income tax (provision) benefit | 7,981 | 4,353 | 137 | (607 | ) | 2,947 | (2,926 | ) | (7,759 | ) | (11,918 | ) | ||||||||||||
Income tax (provision) benefit | (5,418 | ) | (73 | ) | (99 | ) | (88 | ) | (41 | ) | (66 | ) | (24,727 | ) | 3,700 | |||||||||
Net income (loss) | 2,563 | 4,280 | 38 | (695 | ) | 2,906 | (2,992 | ) | (32,486 | ) | (8,218 | ) | ||||||||||||
Net income (loss) per share attributable to common stockholders: | ||||||||||||||||||||||||
Basic | $ | 0.07 | $ | 0.13 | $ | — | $ | (0.02 | ) | $ | 0.09 | $ | (0.09 | ) | $ | (1.01 | ) | $ | (0.26 | ) | ||||
Diluted | $ | 0.07 | $ | 0.12 | $ | — | $ | (0.02 | ) | $ | 0.09 | $ | (0.09 | ) | $ | (1.01 | ) | $ | (0.26 | ) | ||||
89
Item 9. Changes in and Disagreements with Accountants on Accounting and Financial Disclosure
None.
9 A. Control and Procedures
Evaluation of Disclosure Controls and Procedures
The phrase “disclosure controls and procedures” refers to controls and other procedures designed to ensure that information required to be disclosed in our reports filed or submitted under the Securities Exchange Act of 1934, as amended (the Exchange Act), such as this Annual Report on Form 10-K, is recorded, processed, summarized and reported within the time periods specified in the rules and forms of the U.S. Securities and Exchange Commission (SEC). Disclosure controls and procedures are also designed to ensure that such information is accumulated and communicated to our management, including our Chief Executive Officer (CEO) and our Chief Financial Officer (CFO), as appropriate to allow timely decisions regarding required disclosure.
Under the supervision and with the participation of our management, including our CEO and CFO, we carried out an evaluation of the effectiveness of our disclosure controls and procedures, as defined in Rules 13a-15(e) and 15d-15(e) under the Exchange Act, as of December 26, 2015, the end of the fiscal period covered by this Annual Report on Form 10-K (the Evaluation Date). Based on this evaluation, our CEO and CFO concluded as of the Evaluation Date that our disclosure controls and procedures were effective such that the information required to be disclosed in our SEC reports (i) is recorded, processed, summarized and reported within the time periods specified in SEC rules and forms and (ii) is accumulated and communicated to our management, including our CEO and CFO, as appropriate to allow timely decisions regarding required disclosure.
Management’s Report on Internal Control Over Financial Reporting
Our management is responsible for establishing and maintaining adequate internal control over financial reporting, as such term is defined in Exchange Act Rules 13a-15(f) and 15d-15(f). Our internal control over financial reporting is a process designed to provide reasonable assurance regarding the reliability of financial reporting and the preparation of financial statements for external purposes in accordance with generally accepted accounting principles. Because of its inherent limitations, internal control over financial reporting may not prevent or detect misstatements. Also, projections of any evaluation of effectiveness to future periods are subject to the risk that controls may become inadequate because of changes in conditions, or that the degree of compliance with the policies or procedures may deteriorate.
Under the supervision and with the participation of our management, including our CEO and CFO, we conducted an evaluation of the effectiveness of our internal control over financial reporting based on the criteria established in Internal Control - Integrated Framework (2013) issued by the Committee of Sponsoring Organizations of the Treadway Commission. Based on this assessment, our management concluded that, as of December 26, 2015, our internal control over financial reporting was effective based on those criteria.
The effectiveness of our internal control over financial reporting as of December 26, 2015 has been audited by PricewaterhouseCoopers LLP, an independent registered public accounting firm, as stated in their report, which is included in Part II, Item 8 of this Annual Report on Form 10-K.
Prior Material Weakness and Remediation
As of December 26, 2015, we had completed our remediation of the prior material weaknesses in our internal control over financial reporting. As previously disclosed in Item 9A of our Annual report Form 10-K for the fiscal year ended December 27, 2014, (the “prior year Form 10K”) and for each interim period in Item 4 of our Quarterly Reports on Form 10-Q for fiscal year 2015, we previously did not maintain effective internal control over financial reporting, specifically related to 1) accuracy of the accounting for income taxes related to ESPP-related expenses and 2) completeness and accuracy of the complex spreadsheets that are utilized in the accounting for revenue allocation and inventory write-down. We have implemented measures and new controls and have remediated the control deficiencies that constituted these prior material weaknesses by implementing changes to our internal control over financial reporting in prior quarters. These measures included the following:
•Increased additional internal controls related to the accuracy of the accounting for the income taxes related to ESPP-related expenses including stock-based compensation expense through enhanced preparation procedures and reviews; and
•Enhanced procedures around complex spreadsheets and implemented guidelines for how to conduct and document the reviews of the complex spreadsheets specific to the revenue allocation and inventory write-downs.
90
Based on the remediation measures tested, which were found to be effective, the Company concluded that the material weaknesses as described above were remediated as of December 26, 2015.
Changes in Internal Control Over Financial Reporting
There has been no change in our internal control over financial reporting identified in connection with our evaluation required by paragraph (d) of rules 13a-15 and 15d-15 under the Exchange Act that occurred during the fourth quarter of fiscal 2015 that has materially affected, or is reasonably likely to materially affect, our internal control over financial reporting.
Item 9B. Other Information
None.
PART III
Item10. Directors, Executive Officers and Corporate Governance
The information required by this item is incorporated by reference to Gigamon's Proxy Statement for its Annual Meeting of Stockholders to be filed with the SEC within 120 days after the end of the fiscal year ended December 26, 2015
Item 11. Executive Compensation
The information required by this item is incorporated by reference to Gigamon's Proxy Statement for its Annual Meeting of Stockholders to be filed with the SEC within 120 days after the end of the fiscal year ended December 26, 2015.
Item 12. Security Ownership of Certain Beneficial Owners and Management and Related Stockholder Matters
The information required by this item is incorporated by reference to Gigamon's Proxy Statement for its Annual Meeting of Stockholders to be filed with the SEC within 120 days after the end of the fiscal year ended December 26, 2015.
Item 13. Certain Relationships and Related Transactions, and Director Independence
The information required by this item is incorporated by reference to Gigamon's Proxy Statement for its Annual Meeting of Stockholders to be filed with the SEC within 120 days after the end of the fiscal year ended December 26, 2015.
Item 14. Principal Accounting Fees and Services
The information required by this item is incorporated by reference to Gigamon's Proxy Statement for its Annual Meeting of Stockholders to be filed with the SEC within 120 days after the end of the fiscal year ended December 26, 2015.
PART IV
Item 15. Exhibits and Financial Statement Schedules
Documents filed as part of this report are as follows:
(a) Consolidated Financial Statements
Our Consolidated Financial Statements are listed in the “Index to Consolidated Financial Statements” Under Part II, Item 8 of this report.
(b) Financial Statement Schedules
All financial statement schedules are omitted because the information called for is not required or is shown either in the consolidated financial statements or in the notes thereto.
(c) Exhibits
91
The documents listed in the Exhibit Index of this report are incorporated by reference or are filed with this report, in each case as indicated therein (numbered in accordance with Item 601 of Regulation S-K).
92
EXHIBIT INDEX
Exhibit Number | Description | Incorporated by Reference | |||
Form | File No. | Exhibit | Filing Date | ||
2.1 | Conversion Agreement dated as of May 31, 2013, between the registrant and the other parties thereto | S-1/A | 333-182662 | 2.1 | June 4, 2013 |
2.2 | Agreement and Plan of Merger dated as of May 31, 2013, between the registrant and the other parties thereto | S-1/A | 333-182662 | 2.2 | June 4, 2013 |
2.3 | Transfer Agreement and Plan of Reorganization dated as of May 31, 2013, between the registrant and the parties thereto | S-1/A | 333-182662 | 2.3 | June 4, 2013 |
3.1 | Restated Limited Liability Company Agreement dated as of January 20, 2010, between the registrant and the other parties thereto, as amended by Amendment No. 1 to Restated Limited Liability Company Agreement dated as of April 26, 2011 | S-1 | 333-182662 | 3.1 | July 13, 2012 |
3.2 | Amended and Restated Certificate of Incorporation of registrant, as currently in effect | 10-Q | 001-35957 | 3.1 | August 12, 2013 |
3.3 | Amended and Restated Bylaws of registrant, as currently in effect | 10-Q | 001-35957 | 3.2 | August 12, 2013 |
4.1 | Specimen common stock certificate of the registrant | S-1/A | 333-182662 | 4.1 | June 4, 2013 |
4.2 | Investor Rights Agreement dated as of January 20, 2010, between the registrant and the other parties thereto | S-1 | 333-182662 | 4.2 | July 13, 2012 |
10.1+ | Form of Indemnification Agreement between the registrant and its directors and officers | S-1/A | 333-182662 | 10.1 | May 29, 2013 |
10.2+ | 2012 Unit Option Plan | S-1 | 333-182662 | 10.4 | July 13, 2012 |
10.3+ | Form of Unit Option Agreement and Restricted Stock Unit Agreement under 2012 Unit Option Plan | S-1/A | 333-182662 | 10.5 | May 1, 2013 |
10.4+ | 2013 Equity Incentive Plan | S-1/A | 333-182662 | 10.6 | May 29, 2013 |
10.5+ | Form of Stock Option Agreement and Restricted Stock Unit Agreement under 2013 Equity Incentive Plan | S-1/A | 333-182662 | 10.7 | May 29, 2013 |
10.6+ | 2013 Employee Stock Purchase Plan | S-1/A | 333-182662 | 10.1 | June 7, 2013 |
10.7+ | Gigamon Inc. 2013 Corporate Bonus Plan | 8-K | 001-35957 | 10.1 | July 29, 2013 |
10.8+ | Offer Letter, between the registrant and Michael C. Ruettgers, dated November 4, 2010 | S-1 | 333-182662 | 10.8 | July 13, 2012 |
10.9+ | Offer Letter, between the registrant and Mike Burns, dated July 20, 2014 | 8-K | 001-35957 | 10.1 | July 22, 2014 |
10.10+ | Offer Letter, between the registrant and Paul B. Shinn, dated April 24, 2012 | S-1/A | 333-182662 | 10.2 | March 25, 2013 |
10.11+ | Offer Letter, between the registrant and Paul A. Hooper, dated December 19, 2012 | S-1/A | 333-182662 | 10.2 | March 25, 2013 |
10.12+ | Offer Letter, between the registrant and Shehzad Merchant, dated March 8, 2013 | S-1/A | 333-182662 | 10.3 | May 1, 2013 |
10.13+ | Offer Letter, between the registrant and John H. Kispert, dated November 20, 2013 | 8-K | 001-35957 | 10.1 | December 12, 2013 |
10.14+ | Offer Letter, between the registrant and Paul J. Milbury, dated January 10, 2014 | 8-K | 001-35957 | 10.1 | January 30, 2014 |
10.15+ | Offer Letter, between the registrant and Sachi Sambandan, dated April 25, 2014 | 10-Q | 001-35957 | 10.1 | May 6, 2015 |
10.16+ | Offer Letter, between the registrant and Helmut G. Wilke, dated August 3, 2014 | 10-Q | 001-35957 | 10.1 | May 6, 2015 |
93
Exhibit Number | Description | Incorporated by Reference | |||
Form | File No. | Exhibit | Filing Date | ||
10.17+ | Change in Control Severance Agreement, between registrant and Paul A. Hooper, dated September 17, 2012, as amended | S-1/A | 333-182662 | 10.2 | March 25, 2013 |
10.18+ | Change in Control Severance Agreement, between registrant and Mike Burns, dated July 29, 2014 | 8-K/A | 0001-35957 | 10.1 | August 1, 2014 |
10.19+ | Change in Control Severance Agreement, between registrant and Paul B. Shinn, dated March 11, 2013 | S-1/A | 333-182662 | 10.2 | March 25, 2013 |
10.20+ | Change in Control Severance Agreement, between registrant and Shehzad Merchant, dated April 29, 2013 | S-1/A | 333-182662 | 10.3 | May 1, 2013 |
10.21+ | Change in Control Severance Agreement, between registrant and Sachi Sambandan, dated May 15, 2014 | 10-Q | 001-35957 | 10.2 | May 6, 2015 |
10.22+ | Change in Control Severance Agreement, between registrant and Helmut G. Wilke, dated March 30, 2015 | 10-Q | 001-35957 | 10.4 | May 6, 2015 |
10.24† | Sublease dated as of July 2, 2013 between the registrant and Palo Alto Networks, Inc., as amended | 10-Q | 001-35957 | 10.1 | August 12, 2013 |
10.25† | Distribution Agreement dated as of December 28, 2010, between the registrant and Global Convergence Inc., (formerly Interlink Communication Systems, Inc.), as amended | ||||
10.26† | License and Services Agreement dated as of November 12, 2009, between the registrant and Tall Maple Systems, Inc. | S-1/A | 333-182662 | 10.3 | May 1, 2013 |
10.27† | Manufacturing Services Agreement dated as of April 20, 2015, between the registrant and Jabil Circuit, Inc. | 8-K | 001-359 | 10.1 | April 24, 2015 |
21.1 | List of subsidiaries of registrant | S-1 | 333-182662 | 21.1 | July 13, 2012 |
23.1 | Consent of PricewaterhouseCoopers LLP, Independent Registered Public Accounting Firm | ||||
31.1 | Certification of Chief Executive Officer pursuant to Rule 13a-14 (a) of the Securities Exchange Act of 1934 | ||||
31.2 | Certification of Chief Financial Officer pursuant to Rule 13a-14 (a) of the Securities Exchange Act of 1934 | ||||
32.1** | Certification of Chief Executive Officer pursuant to Section 906 of the Sarbanes-Oxley Act of 2002 | ||||
32.2** | Certification of Chief Financial Officer pursuant to Section 906 of the Sarbanes-Oxley Act of 2002 | ||||
101.INS* | XBRL Instance Document | ||||
101.SCH | XBRL Taxonomy Extension Schema Document | ||||
101.CAL* | XBRL Taxonomy Extension Calculation Linkbase Document | ||||
101.DEF | XBRL Taxonomy Extension Definition Linkbase Document | ||||
101.LAB* | XBRL Taxonomy Extension Labels Linkbase Document | ||||
101.PRE | XBRL Taxonomy Extension Presentation Linkbase Document | ||||
94
+ | Indicates a management contract or compensatory plan. |
† | Registrant has omitted portions of the relevant exhibit and filed such exhibit separately with the Securities and Exchange Commission pursuant to a grant of confidential treatment under Rule 406 promulgated under the Securities Act. |
* | XBRL (Extensible Business Reporting Language) information is furnished and not filed or a part of a registration statement or prospectus for purposes of sections 11 or 12 of the Securities Act of 1933, as amended, is deemed not filed for purposes of section 18 of the Securities Exchange Act of 1934, as amended, and is otherwise not subject to liability under these sections. |
** | The certifications furnished in Exhibit 32.1 and Exhibit 32.2 hereto are deemed to accompany this Annual Report of Form 10-K and will not be deemed "filed" for purposes of Section 18 of the Securities Exchange Act of 1934, as amended. Such certifications will not be deemed to be incorporated by reference into any filings under the Securities Act of 1933, as amended or the Securities Act of 1934, as amended, except to the extent that the registrant specifically incorporates it by reference. |
95
SIGNATURES
Pursuant to the requirements of Section 13 or 15(d) of the Securities and Exchange Act of 1934, the Registrant has duly caused this report to be signed on its behalf by the undersigned, thereunto duly authorized, on February 24, 2016.
GIGAMON INC. | |
By: | /s/ Paul A. Hooper |
Paul A. Hooper | |
Chief Executive Officer | |
96
POWER OF ATTORNEY
Each person whose individual signature appears below hereby authorizes and appoints Paul A. Hooper and Mike Burns, and each of them, with full power of substitution and resubstitution and full power to act without the other, as his or her true and lawful attorney-in-fact and agent to act in his or her name, place and stead and to execute in the name and on behalf of each person, individually and in each capacity stated below, and to file any and all amendments to this Annual Report on Form 10-K and to file the same with all exhibits thereto, and other documents in connection therewith, with the Securities and Exchange Commission, granting unto said attorneys-in-fact and agents, and each of them, full power and authority to do and perform each and every act and thing ratifying and confirming all that said attorneys-in-fact and agents or any of them or their or his substitute or substitutes may lawfully do or cause to be done by virtue thereof.
Pursuant to the requirements of the Securities and Exchange Act of 1934, this Annual Report on Form 10-K has been signed by the following persons in the capacities and on the dates indicated.
Signature | Title | Date | ||
/s/ Paul A. Hooper | Chief Executive Officer and Director (Principal Executive Officer) | February 24, 2016 | ||
Paul A. Hooper | ||||
/s/ Mike Burns | Chief Financial Officer (Principal Financial and Accounting Officer) | February 24, 2016 | ||
Mike Burns | ||||
/s/ Ted Ho | Director | February 24, 2016 | ||
Ted Ho | ||||
/s/ John Kispert | Director | February 24, 2016 | ||
John H. Kispert | ||||
/s/ Paul J. Milbury | Director | February 24, 2016 | ||
Paul J. Milbury | ||||
/s/ Corey M. Mulloy | Director | February 24, 2016 | ||
Corey M. Mulloy | ||||
/s/ Michael C. Ruettgers | Director | February 24, 2016 | ||
Michael C. Ruettgers | ||||
/s/ Robert E. Switz | Director | February 24, 2016 | ||
Robert E. Switz | ||||
97