Attached files
UNITED STATES
SECURITIES AND EXCHANGE COMMISSION
Washington, D.C. 20549
FORM 10-K
(Mark One)
x | ANNUAL REPORT PURSUANT TO SECTION 13 OR 15(d) OF THE SECURITIES EXCHANGE ACT OF 1934 |
For the fiscal year ended December 31, 2015 | |
OR
o | TRANSITION REPORT PURSUANT TO SECTION 13 OR 15(d) OF THE SECURITIES EXCHANGE ACT OF 1934 |
For the transition period from to | |
Commission File Number 1-8864
USG CORPORATION
(Exact name of Registrant as Specified in its Charter)
Delaware | 36-3329400 | |
(State or Other Jurisdiction of Incorporation or Organization) | (I.R.S. Employer Identification No.) | |
550 W. Adams Street, Chicago, Illinois | 60661-3676 | |
(Address of Principal Executive Offices) | (Zip Code) | |
Registrant’s Telephone Number, Including Area Code: (312) 436-4000
Securities Registered Pursuant to Section 12(b) of the Act:
Title of Each Class | Name of Exchange on Which Registered | |
New York Stock Exchange | ||
Common Stock, $0.10 par value | Chicago Stock Exchange | |
Preferred Stock Purchase Rights (subject to Rights | New York Stock Exchange | |
Agreement dated December 21, 2006, as amended) | Chicago Stock Exchange | |
Indicate by check mark whether the registrant is a well-known seasoned issuer, as defined in Rule 405 of the Securities Act. Yes x No o
Indicate by check mark if the registrant is not required to file reports pursuant to Section 13 or 15(d) of the Exchange Act. Yes o No x
Indicate by check mark whether the registrant (1) has filed all reports required to be filed by Section 13 or 15(d) of the Securities Exchange Act of 1934 during the preceding 12 months (or for such shorter period that the registrant was required to file such reports), and (2) has been subject to such filing requirements for the past 90 days. Yes x No o
Indicate by check mark whether the registrant has submitted electronically and posted on its corporate Web site, if any, every Interactive Data File required to be submitted and posted pursuant to Rule 405 of Regulation S-T (§232.405 of this chapter) during the preceding 12 months (or for such shorter period that the registrant was required to submit and post such files). Yes x No o
Indicate by check mark if disclosure of delinquent filers pursuant to Item 405 of Regulation S-K is not contained herein, and will not be contained, to the best of registrant’s knowledge, in definitive proxy or information statements incorporated by reference in Part III of this Form 10-K or any amendment to this Form 10-K. x
Indicate by check mark whether the registrant is a large accelerated filer, an accelerated filer, a non-accelerated filer, or a smaller reporting company. See the definitions of “large accelerated filer,” “accelerated filer” and “smaller reporting company” in Rule 12b-2 of the Exchange Act.
Large accelerated filer | x | Accelerated filer | o | |||
Non-accelerated filer | o | Smaller reporting company | o | |||
Indicate by check mark whether the registrant is a shell company (as defined in Exchange Act Rule 12b-2). Yes o No x
The aggregate market value of the registrant’s common stock held by non-affiliates computed by reference to the New York Stock Exchange closing price on June 30, 2015 (the last business day of the registrant’s most recently completed second fiscal quarter) was approximately $2,397,161,732. Solely for this purpose, directors, executive officers and greater than 10% record shareholders are considered the affiliates of the registrant.
The number of shares of the registrant’s common stock outstanding as of January 31, 2016 was 145,669,400.
Documents Incorporated By Reference: Certain sections of USG Corporation’s definitive Proxy Statement for use in connection with its 2016 annual meeting of stockholders, to be filed subsequently, are incorporated by reference into Part III of this Form 10-K Report where indicated.
TABLE OF CONTENTS
Page | ||
Item 1. | ||
Item 1A. | ||
Item 1B. | ||
Item 2. | ||
Item 3. | ||
Item 4. | ||
Item 5. | ||
Item 6. | ||
Item 7. | ||
Item 7A. | ||
Item 8. | ||
Item 9. | ||
Item 9A. | ||
Item 9B. | ||
Item 10. | ||
Item 11. | ||
Item 12. | ||
Item 13. | ||
Item 14. | ||
Item 15. | ||
PART I
Item 1. | BUSINESS |
In this annual report on Form 10-K, “USG,” “we,” “our” and “us” refer to USG Corporation, a Delaware corporation, and its subsidiaries included in the consolidated financial statements, except as otherwise indicated or as the context otherwise requires.
General
USG, through its subsidiaries, is a leading manufacturer and distributor of building materials. We produce a wide range of products for use in new residential, new nonresidential, and residential and nonresidential repair and remodel construction as well as products used in certain industrial processes. Our businesses are cyclical in nature and sensitive to changes in general economic conditions, including conditions in the North American housing and construction-based markets and the markets in Asia and Australasia. Our expansion via two 50/50 joint ventures we formed in 2014 with Boral Limited, referred to as USG Boral Building Products into the markets of Asia, Australasia, and the Middle East has significantly increased our exposure to the economic conditions in those areas.
The effects of market conditions on our operations are discussed in Part II, Item 7, Management’s Discussion and Analysis of Financial Condition and Results of Operations.
Recent Developments
In December 2015, we completed the sale of our 50% interest in Knauf/USG Verwaltungs GmbH and Knauf/USG Systems GmbH & Co. KG, collectively the Knauf-USG joint venture, to our joint venture partner, Knauf Aquapanel GmbH, or Knauf, for €48 million in cash, or approximately $52 million. Also during 2015, we completed the exit of our shipping operations, Gypsum Transportation Limited, or GTL, and sold the two ships it owned for $42 million and repaid the outstanding loan balance under its secured loan facility agreement. See Notes 3 and 13, respectively, in Part II, Item 8 of this report for further information.
Segments
Our operations are organized into four reportable segments: Gypsum, Ceilings, Distribution and USG Boral Building Products, or UBBP. The net sales of Gypsum, Ceilings, and Distribution accounted for approximately 55%, 12% and 33%, respectively, of our 2015 consolidated net sales. UBBP is accounted for as equity method investments, and thus, net sales of UBBP are not included in consolidated net sales.
Gypsum
BUSINESS
Our Gypsum segment manufactures and markets gypsum and related products in the United States, Canada, Mexico and Latin America. It includes United States Gypsum Company, or U.S. Gypsum, in the United States, CGC Inc., or CGC, in Canada, USG Mexico, S.A. de C.V., or USG Mexico, and subsidiaries in Latin America. U.S. Gypsum is the largest manufacturer of gypsum wallboard in the United States and accounted for approximately 26% of total industry shipments of gypsum board (which includes gypsum wallboard, other gypsum-related paneling products and imports) in the United States in 2015. CGC is the largest manufacturer of gypsum wallboard in eastern Canada. USG Mexico is the largest manufacturer of gypsum wallboard in Mexico with more than 55% market share in 2015.
PRODUCTS
Gypsum’s products are used in a variety of building applications to construct walls, ceilings, roofs and floors of residential, commercial and institutional buildings, as well as in certain industrial applications. We also produce gypsum-based products for agricultural and industrial customers to use in a wide variety of applications, including soil conditioning, road repair, fireproofing and ceramics. The major product lines within the Gypsum segment are:
1
WALLBOARD | |
Sheetrock® brand gypsum wallboard and Securock® brand glass mat sheathing portfolios | Gypsum panels that provide aesthetic as well as sound-dampening, fire-retarding, abuse-resistance and moisture-control value |
SURFACES | |
Sheetrock® brand joint compound portfolio, as well as corner bead, joint tape, and plaster | Used for finishing wallboard joints |
SUBSTRATES | |
Durock® brand cement board | Provides water and fire-resistant assemblies for both interior and exterior applications |
Fiberock® brand backerboard | Includes abuse-resistant interior wall panels, tile backer boards, and flooring underlayments |
Levelrock® brand systems of poured gypsum flooring | Provides surface leveling and enhanced sound-dampening performance for residential and commercial flooring applications |
Securock® brand roof board, ExoAir® 430 brand air-water barrier system and industrial gypsum | Engineered gypsum panels, designed for high performance building envelope solutions, providing structural performance, fire-resistance, and moisture and air control |
Construction plaster products, sold under the brand names Red Top®, Imperial®, Diamond® and Supremo® | Used to provide a custom finish for residential and commercial interiors and provide aesthetic, sound-dampening, fire-retarding and abuse-resistance value |
As the leader in lightweight innovation, we offer the industry's broadest portfolio of lightweight gypsum panels. In 2010, we introduced USG Sheetrock® Brand UltraLight Panels, the industry's first lightweight gypsum wallboard panel for use in interior wall and ceiling applications and have continued to extend our lightweight portfolio with the introductions of:
• | USG Sheetrock® Brand UltraLight Panels Firecode 30® and Firecode X® for fire rated assemblies; |
• | USG Sheetrock® Brand UltraLight Panels Mold Tough®, the industry's first lighweight moisture- and mold-resistant wallboard; and, |
• | USG Sheetrock® Brand MH UltraLight Gypsum Panels for manufactured housing and Gypsum Base Imperial® for veneer plaster systems. |
USG Sheetrock® Brand UltraLight Panels accounted for 65% of all of our wallboard shipments in the United States in 2015 and 63% in 2014.
MANUFACTURING
Gypsum manufactures products at 44 plants located throughout the United States, Canada, Mexico, and Latin America.
Gypsum rock is mined or quarried at 13 company-owned locations in North America. Our mines and quarries provided approximately 49% of the gypsum used by our plants in North America in 2015.
Some of our manufacturing plants purchase or acquire synthetic gypsum and natural gypsum rock from outside sources. In 2015, outside purchases of synthetic gypsum and natural gypsum rock accounted for approximately 42% and 9%, respectively, of the gypsum used in our plants.
Synthetic gypsum is a byproduct of flue gas desulphurization carried out by electric generation or industrial plants that burn coal as a fuel. The suppliers of this kind of gypsum are primarily power companies, which are required to operate scrubbing equipment for their coal-fired generating plants under federal environmental regulations. We have entered into a number of long-term supply agreements to acquire synthetic gypsum. Six of our 21 gypsum wallboard plants in operation use synthetic gypsum for all of their needs, while another six use it for a portion of their needs. The U.S. Environmental Protection Agency currently classifies synthetic gypsum as a non-hazardous waste. Certain power companies have recently switched to using natural gas instead of coal for their electric generation needs. In the event more power companies switch to using natural gas instead of coal, the availability of synthetic gypsum may decrease. See Item 1A, Risk Factors.
We produce wallboard paper at four company-owned production facilities located in the United States. Vertical integration in paper helps to ensure a continuous supply of high-quality paper that is tailored to the specific needs of our production processes. We augment our paper needs through purchases from outside suppliers when necessary. We did not make any material purchases of paper from outside suppliers in 2015.
2
MARKETING AND DISTRIBUTION
Our gypsum products are distributed through L&W Supply locations, other specialty wallboard distributors, building materials dealers, home improvement centers and other retailers and contractors. Sales of gypsum products are seasonal in the sense that sales are generally greater from spring through the middle of autumn than during the remaining part of the year.
Based on our estimates using publicly available data, internal surveys and industry shipment data for gypsum board, as reported by the Gypsum Association, we estimate that during 2015 volume demand for gypsum board was generated by:
• | residential and nonresidential repair and remodel activity of about 52%, |
• | new residential construction of about 36%, |
• | new nonresidential construction of about 7%, and |
• | other activities, such as exports and temporary construction of about 5%. |
COMPETITION
Industry shipments of gypsum board in the United States (including gypsum wallboard, other gypsum-related paneling products and imports), as reported by the Gypsum Association, were an estimated 22.3 billion square feet in 2015, up approximately 2% from 21.8 billion square feet in 2014. U.S. Gypsum’s share of the gypsum board market in the United States, which includes for comparability its shipments of USG Sheetrock® brand gypsum wallboard, Fiberock® brand gypsum fiber panels and Securock® brand glass mat sheathing, was approximately 26% in 2015, unchanged from 2014.
The principal methods of competition are quality of products, service, pricing, compatibility of systems and product design features. Our principal competitors are as follows:
United States | Canada | Mexico | |||
National Gypsum Company | x | ||||
CertainTeed Corporation (a subsidiary of Compagnie de Saint-Gobain SA) | x | x | |||
Georgia-Pacific (a subsidiary of Koch Industries, Inc.) | x | x | |||
American Gypsum Company LLC (a unit of Eagle Materials Inc.) | x | ||||
Continental Building Products, Inc. | x | ||||
PABCO Gypsum (a division of PABCO Building Products) | x | ||||
Cabot Gypsum Company | x | ||||
Panel Rey, S.A. (a Grupo Promax Company) | x | ||||
Plaka (a unit of Comex) | x | ||||
Ceilings
BUSINESS
Our Ceilings segment manufactures and markets interior systems products in the United States, Canada, Mexico, and Latin America. Ceilings includes USG Interiors, LLC, or USG Interiors in the United States, CGC, USG Mexico and subsidiaries in Latin America. Ceilings is a leading supplier of interior ceilings products used primarily in commercial applications. We estimate that we are the second-largest manufacturer of ceiling grid and acoustical ceiling tile worldwide.
As discussed below under USG Boral Building Products, or UBBP, on February 27, 2014, we invested with Boral Limited in UBBP and, in connection therewith, contributed to UBBP our operations in the Asia-Pacific region. As such, our Ceilings reportable segment included the results and activities of our subsidiaries in the Asia-Pacific region through February 27, 2014 within USG International.
PRODUCTS
Ceilings manufactures ceiling tile in the United States and ceiling grid in the United States, Canada and, through February 27, 2014, the Asia-Pacific region. It markets ceiling tile and ceiling grid in the United States, Canada, Mexico, Latin America, and through February 27, 2014, the Asia-Pacific region. Our integrated line of ceilings products provides qualities such as sound absorption, fire retardation and convenient access to the space above the ceiling for electrical and mechanical systems, air distribution and maintenance. Ceilings’ significant brand names include the Radar™, Eclipse™, Mars™, and Halcyon™ brands of ceiling tile and the Donn®, DX®, Fineline®, Centricitee™, Identitee® DXI™, Curvatura™ and Compasso® brands of ceiling grid.
3
MANUFACTURING
Ceilings manufactures products at 8 plants located in North America. Principal raw materials used to produce Ceilings’ products include mineral fiber, steel, perlite and starch. We produce some of these raw materials and obtain others from outside suppliers.
MARKETING AND DISTRIBUTION
Ceilings sells products primarily in markets related to the construction and renovation of nonresidential buildings. During 2015, approximately:
• | 71% of Ceilings’ net sales were from repair and remodel activity, primarily nonresidential, |
• | 27% of its net sales were from new nonresidential construction, and |
• | 2% of its net sales were from new residential construction. |
Products are marketed and distributed through a network of distributors, installation contractors, L&W Supply locations and home improvement centers. Sales of Ceilings’ products are seasonal in nature. Sales are generally weaker in the fourth quarter of the calendar year as compared to the preceding three quarters.
COMPETITION
Principal methods of competition are quality of products, service, pricing, compatibility of systems and product design features.
Our principal competitors in our Ceilings business are:
United States | Canada | Mexico | |||
Ceiling Tile | |||||
Armstrong World Industries, Inc., | x | x | x | ||
Rockfon (a subsidiary of Rockwool International A/S) | x | x | |||
CertainTeed Corporation (a subsidiary of Compagnie de Saint-Gobain SA) | x | x | x | ||
Knauf AMF GmbH & Co. KG | x | x | |||
Odenwald Faserplattenwerk GmbH (OWA) | x | x | |||
Ceiling Grid | |||||
WAVE (a joint venture between Armstrong World Industries, Inc. and Worthington Industries) | x | x | |||
Chicago Metallic Corporation (a subsidiary of Rockwool International A/S) | x | x | |||
CertainTeed Corporation (a subsidiary of Compagnie de Saint-Gobain SA) | x | x | x | ||
Distribution
BUSINESS
Our Distribution segment consists of L&W Supply Corporation and its subsidiaries, or L&W Supply, a leading distributor of gypsum wallboard and other building materials in the United States. In 2015, L&W Supply distributed approximately 7% of all gypsum board in the United States, including approximately 30% of U.S. Gypsum’s gypsum board production. During 2015, approximately:
• | 35% of L&W Supply’s net sales were from residential and nonresidential repair and remodel activity, |
• | 40% of its net sales were from new nonresidential construction, and |
• | 25% of its net sales were from new residential construction. |
MARKETING AND DISTRIBUTION
L&W Supply is a service-oriented business that stocks a wide range of construction materials. It delivers less-than-truckload quantities of construction materials to job sites and places them in areas where work is being done, thereby reducing the need for handling by contractors. L&W Supply specializes in the distribution of gypsum wallboard (which accounted for 37% of its 2015 net sales) and joint compound manufactured by U.S. Gypsum as well as other manufacturers. Further, L&W Supply distributes products manufactured by USG Interiors, such as acoustical ceiling tile and grid, as well as products of other manufacturers, including drywall metal, insulation, roofing, fasteners and exterior insulation finishing systems. Sales of L&W Supply’s products are seasonal in nature and are generally greater from spring through autumn when access to job sites is easier and construction activity is at its peak. L&W Supply leases nearly all of its facilities from third parties. Typical leases have terms of five years and include renewal options.
As of December 31, 2015, L&W Supply served its customers from 142 distribution branches in the United States. It operated 145 branches as of December 31, 2014 and 143 branches as of December 31, 2013. In 2015, we closed 4 distribution branches and opened one new branch. Two new branches were opened in 2014 and none were closed.
4
COMPETITION
L&W Supply competes with a number of specialty wallboard distributors, lumber dealers, hardware stores, home improvement centers and acoustical ceiling tile distributors. Its principal competitors include Gypsum Management Supply, a national supplier of building materials, Foundation Building Materials and KCG, Inc., both of which are multi-regional suppliers in the United States, and Allied Building Products Corporation in the northeastern, southern and western United States. Principal methods of competition are location, service, range of products and pricing.
USG Boral Building Products
BUSINESS
On February 27, 2014, we and certain of our subsidiaries formed 50/50 joint ventures, USG Boral Building Products Pte. Limited, a company organized under the laws of Singapore, and USG Boral Building Products Pty Limited, a company organized under the laws of Australia, with Boral Limited, or Boral. These joint ventures are referred to as USG Boral Building Products, or UBBP. UBBP manufactures, distributes and sells certain building products, mines raw gypsum and sells natural and synthetic gypsum throughout Asia, Australasia and the Middle East. UBBP is a leader in most of the markets it serves. As part of the consideration for our 50% ownership in UBBP, we contributed to UBBP our subsidiaries and joint venture investments in Asia-Pacific, India and Oman. Our investments in UBBP are accounted for as equity method investments. Our existing wholly owned subsidiaries and consolidated variable interest entities that were contributed into the joint venture were deconsolidated as of February 27, 2014. See Note 3 to the consolidated financial statements in Part II, Item 8 of this report for additional information related to our equity method investments.
PRODUCTS
UBBP manufactures and distributes products for wall, ceiling, floor lining and exterior systems that utilize gypsum wallboard, referred to as plasterboard in the region in which UBBP operates, mineral fiber ceiling tiles, steel grid and joint compound. UBBP's significant brand names include USG Boral Sheetrock® premium plasterboard, USG Boral NextGen®, Elephant®, Jayaboard®, Durock® and Donn® DX®, the world’s most widely specified and installed ceiling suspension system. UBBP launched USG Boral Sheetrock® products, which leverages the technology in USG Sheetrock®, in Australia, South Korea, Indonesia, Vietnam, China and Thailand. UBBP is able to sell USG Boral Sheetrock® at a premium price and, in some markets, conversion rates have surpassed 10%, while in Australia the conversion rate is above 30%.
MANUFACTURING
UBBP has 25 plasterboard lines, 3 gypsum mines and 37 other non-board lines for metal products, metal ceiling grid, ceiling tile, joint compound, and cornice throughout twelve countries in Asia, Australasia and the Middle East.
Executive Officers of the Registrant
See Part III, Item 10, Directors, Executive Officers and Corporate Governance - Executive Officers of the Registrant (as of February 10, 2016).
Other Information
RESEARCH AND DEVELOPMENT
To contribute to our high standards and our leadership in the building materials industry, we perform extensive research and development at the USG Corporate Innovation Center in Libertyville, Illinois, using open innovation models and outside partnerships. Research team members collaborate with suppliers, universities and national research laboratories to provide product support and to develop new products and technologies for our operating units. With fire, acoustical, structural and environmental testing capabilities, the research center allows us to conduct our own on-site evaluation of products and systems. Chemical analysis and materials characterization support product development and safety/quality assessment programs. Development activities can be taken to an on-site pilot plant before being transferred to a full-size plant. Research and development activities have been focused on customer preferred system solutions. We expense research and development expenditures as incurred. These expenditures amounted to $23 million, $23 million and $21 million in 2015, 2014 and 2013, respectively.
SUSTAINABILITY
The adoption of green building codes and standards such as the Leadership in Energy and Environmental Design, or LEED, rating system established by the U.S. Green Building Council to encourage the design and construction of buildings that are environmentally friendly, combined with an increase in customer preference for products that can assist in obtaining LEED credit or are otherwise environmentally preferable, has increased demand for products, systems and services that contribute to building sustainable spaces. Many of our products meet the requirements for the awarding of LEED credits, and we continue to develop new products and systems to address market demand for products that enable construction of buildings that require
5
fewer natural resources to build, operate and maintain. Our competitors also have developed and introduced to the market more environmentally responsible products.
We expect that there will be increased demand over time for products, systems and services that meet regulatory and customer sustainability standards and preferences and decreased demand for products that produce significant greenhouse gas emissions. We also believe that our ability to continue to provide these products and systems to our customers will be necessary to maintain our competitive position in the marketplace.
ENERGY
Our primary supplies of energy have been adequate, and we have not been required to curtail operations as a result of insufficient supplies. Supplies are likely to remain sufficient for our projected requirements. Currently, we are using swap contracts to hedge a significant portion of our anticipated purchases of natural gas to be used in our manufacturing operations over the next 12 months and beyond. We review our positions regularly and make adjustments as market conditions warrant.
SIGNIFICANT CUSTOMER
On a worldwide basis, The Home Depot, Inc. accounted for approximately 16%, 16% and 15% of our consolidated net sales in 2015, 2014 and 2013, respectively. Our Gypsum, Ceilings and Distribution segments all had net sales to The Home Depot, Inc. in each of those years.
INTELLECTUAL PROPERTY
We consider patents, copyrights, trademarks, trade secrets, proprietary technology and similar intellectual property as critical to our success. We hold numerous patents and have registered numerous trademarks of varying duration in multiple legal jurisdictions. Further, we have filed patent applications and applications for the registration of trademarks in the United States and internationally. Although we consider our patents, licenses and trade secrets to constitute valuable assets, we do not regard any of our businesses as being materially dependent upon individual patents, trade secrets, or licenses.
OTHER
Because we fill orders upon receipt, no segment has any significant order backlog.
None of our segments has any special working capital requirements.
No material part of our business is subject to renegotiation of profits or termination of contracts or subcontracts at the election of any government.
As of December 31, 2015, we had approximately 8,900 employees worldwide.
See Note 14 to the consolidated financial statements in Part II, Item 8 of this report for financial information pertaining to revenue and assets by geographic region and our segments, and Item 1A, Risk Factors, for information regarding the risks associated with conducting business in international locations, as well as the possible effects that compliance with environmental laws and regulations may have on our businesses and operating results.
Available Information
We maintain a website at www.usg.com and make available at this website our annual report on Form 10-K, quarterly reports on Form 10-Q, current reports on Form 8-K and all amendments to those reports as soon as reasonably practicable after they are electronically filed with or furnished to the Securities and Exchange Commission, or SEC. The information on our website is not, and will not be deemed to be, a part of this Annual Report on Form 10-K, or incorporated into any of our other filings with the SEC, except where we expressly incorporated such information. If you wish to receive a paper copy of any exhibit to our reports filed with or furnished to the SEC, the exhibit may be obtained, upon payment of reasonable expenses, by writing to: Corporate Secretary, USG Corporation, 550 West Adams Street, Chicago, Illinois 60661-3676.
6
Item 1A. | RISK FACTORS |
Our business, financial condition, operating results and cash flows are subject to various risks and uncertainties. We have described below significant factors that may adversely affect our industry and our business, financial condition, operating results and cash flows. You should carefully consider these factors, together with all of the other information in this annual report on Form 10-K and in other documents that we file with the SEC, before making any investment decision about our securities.
Our businesses are cyclical and seasonal in nature, and are particularly dependent on the housing and construction-based markets. Stalled momentum, or future downturns or delays in the recovery of these markets, may have a material adverse effect on our business, financial condition, operating results and cash flows.
Our businesses are cyclical and sensitive to changes in general economic conditions, including, in particular, conditions in the North American housing and construction-based markets. Housing starts and new nonresidential construction in the United States gained momentum in 2015 but still remain low by historical standards, with approximately 1.1 million housing starts in 2015 according to preliminary data reported by the U.S. Census Bureau compared to a historical annual rate of approximately 1.5 million prior to the 2008 economic downturn. Further, the residential and non-residential repair and remodel market has only experienced modest year over year increases after years of substantial decline. We cannot predict the conditions of the housing and construction-based markets, which may depend on broader economic issues including employment, household formation, home ownership rate, existing home price trends, availability of mortgage financing, interest rates, consumer confidence, job growth and discretionary business investment. We also cannot provide any assurances that the housing and construction-based markets will continue to recover. Adverse conditions in these markets, or the failure of these markets to return to historical levels, may have a material adverse effect on our business, financial condition, operating results and cash flows.
In addition, our businesses are seasonal, which has caused in the past, and will likely cause in the future, our quarterly results to vary significantly. Unfavorable weather conditions, such as snow or heavy rainfall, may also reduce construction activity and adversely affect demand for our products. In particular, unfavorable weather conditions during peak construction periods could have a disproportionate impact on our operating results for the full year. In the event of climate change, the effects of adverse weather patterns may increase in severity.
We may not be able to maintain current price levels, or achieve price increases, for our products, which may have a material adverse effect on our business, financial condition, operating results and cash flows.
Prices for our products are affected by overall supply and demand in the markets for our products. Market prices of building products historically have been volatile and cyclical. Currently, there is significant excess wallboard production capacity industry wide in the United States. Any increases in the production capacity of any of our competitors, or the entry of new competitors in our markets, could increase the overall supply in the markets for our products potentially leading to a reduction in prices. A prolonged period of weak demand or excess supply in any of our businesses may have a material adverse effect on our business, financial condition, operating results and cash flows. We implemented a not-to-exceed price increase for wallboard with the new price being set for January 1, 2015, which has been extended into 2016. It is uncertain that we will be able to achieve or maintain an increase in our selling prices, including with respect to gypsum wallboard. If we are unable to achieve or maintain price increases, our net sales, operating results and cash flows may be materially and adversely impacted.
Our substantial indebtedness may adversely affect our business, financial condition, operating results and cash flows.
As of December 31, 2015, we had $2.175 billion of total debt, consisting of senior notes and industrial revenue bonds. Our substantial indebtedness may have material adverse effects on our business, financial condition, operating results and cash flows, including to:
• | make it more difficult, or increase the cost, to satisfy our debt service obligations or refinance our indebtedness on commercially reasonable terms; |
• | require us to dedicate a substantial portion of our cash flows from operations to payments on our indebtedness, thereby reducing the availability of our cash flows to fund working capital, capital expenditures, research and development and other general operating requirements; |
• | limit our ability to obtain additional financing to fund our working capital requirements, capital expenditures, research and development, acquisitions, investments, debt service obligations and other general corporate requirements; |
7
• | place us at a relative competitive disadvantage compared to our competitors that have proportionately less debt; |
• | limit our flexibility to plan for, or react to, changes in our businesses and the industries in which we operate; and |
• | increase our vulnerability to the current and potentially more severe adverse general economic and industry conditions. |
Under the terms of our debt instruments, we are permitted to incur substantial additional indebtedness. If we incur additional indebtedness, the risks related to our indebtedness may intensify.
We require a significant amount of liquidity to service our indebtedness and fund operations, capital expenditures, research and development efforts, acquisitions and other corporate expenditures.
Our ability to fund operations, capital expenditures, research and development efforts, acquisitions and other corporate expenditures, including repayment of our indebtedness, depends on our ability to generate cash through future operating performance, which is subject to economic, financial, competitive, legislative, regulatory and other factors. Many of these factors are beyond our control. We cannot ensure that our businesses will generate sufficient cash flow from operations or that future borrowings or other financing will be available to us in an amount sufficient to pay our indebtedness or to fund our other needs.
We are required to post letters of credit or cash as collateral primarily in connection with our hedging transactions, insurance programs and bonding activities. The amounts of collateral we are required to post may vary based on our financial position and credit ratings. Use of letters of credit as collateral reduces our borrowing availability under our domestic revolving credit agreement and, therefore, like the use of cash as collateral, reduces our overall liquidity and our ability to fund other business activities.
If we are unable to generate sufficient cash flow to fund our needs, we may need to pursue one or more alternatives, such as to:
• | curtail our operations; |
• | reduce or delay planned capital expenditures, research and development or acquisitions; |
• | seek additional financing or restructure or refinance all or a portion of our indebtedness at or before maturity; |
• | sell assets or businesses; or |
• | sell additional equity. |
Any curtailment of operations, reduction or delay in planned capital expenditures, research and development or acquisitions, or any sales of assets or businesses, may materially and adversely affect our future revenue prospects. In addition, we cannot ensure that we will be able to raise additional equity capital, restructure or refinance any of our indebtedness or obtain additional financing on commercially reasonable terms or at all.
We face competition in each of our businesses. If we cannot effectively compete in the marketplace, our business, financial condition, operating results and cash flows may be materially and adversely affected.
We face competition in each of our businesses. Principal methods of competition include quality and range of products, service, location, pricing, compatibility of systems and product design features. Actions of our competitors, or the entry of new competitors in our markets, could lead to lower pricing by us in an effort to maintain market share and could also lead to lower sales volumes. To achieve and/or maintain leadership positions in key product categories, we must continue to develop brand recognition and loyalty, enhance product quality and performance, introduce new products and develop our manufacturing and distribution capabilities. In addition, several of our plants are dedicated to specific products. If any of those plants are unable to operate for a prolonged period it would reduce our ability to effectively compete, which may materially and adversely affect our business, financial condition, operating results and cash flows.
We also compete through our use and improvement of information technology. In order to remain competitive, we need to provide customers with timely, accurate, easy-to-access information about product availability, orders and delivery status using state-of-the-art systems. While we have provided manual processes for short-term failures and disaster recovery capability, a prolonged disruption of systems or other failure to meet customers’ expectations regarding the capabilities and reliability of our systems may materially and adversely affect our operating results.
8
We have remained a market leader in part through innovation. We intend to continue making investments in research and development to develop new and improved products and more efficient production methods in order to maintain our market leadership position. If we do not make these investments, or our investments are not successful, our revenues, operating results and market share could be materially and adversely affected. In addition, there can be no assurance that revenue from new products or enhancements will be sufficient to recover the research and development expenses associated with their development.
Certain of our customers have significant buying power, which may materially and adversely affect our revenues, financial condition, operating results and cash flows.
Certain of our important customers are large companies with significant buying power. In addition, potential further consolidation in our distribution channels could enhance the ability of certain of our customers to seek more favorable terms, including pricing, for the products that they purchase from us. Accordingly, our ability to maintain or raise prices in the future may be limited, including during periods of raw material and other cost increases. If we are forced to reduce prices or to maintain prices during periods of increased costs, or if we lose customers because of pricing or other methods of competition, our revenues, financial condition, operating results and cash flows may be materially and adversely affected.
Our customers and suppliers are exposed to risks associated with economic and financial conditions that could adversely affect us.
A number of our customers and suppliers have been and may continue to be adversely affected by weak financial conditions in their markets, disruptions to the capital and credit markets and decreased demand for their products and services. In the event that any of our large customers, or a significant number of smaller customers, are adversely affected by these risks, we may face reductions in demand for our products and services, failure of customers to pay invoices when due and other adverse effects that may have a material adverse effect on our business, financial condition, operating results and cash flows. Similarly, in the event that any of our large suppliers, or a significant number of smaller suppliers, are adversely affected by these risks, we may face disruptions in supply and other adverse effects that may have a material adverse effect on our business, financial condition, operating results and cash flows.
The loss of sales to one or more of our major customers may have a material adverse effect on our business, financial condition, operating results and cash flows.
We face strong competition for our major customers. As is customary in our industry, we do not enter into long-term contracts with our customers, who may choose to reduce, delay or cancel purchases of our products at any time. If one or more of our major customers reduces, delays or cancels substantial orders, our business, financial condition, operating results and cash flows may be materially and adversely affected, particularly for the period in which the reduction, delay or cancellation occurs and also possibly for subsequent periods.
If costs of key raw materials or energy increase, or the availability of key raw materials or energy decreases, our cost of products sold will increase and our operating results or cash flows may be materially and adversely affected.
The cost and availability of raw materials and energy are critical to our operations. For example, we use substantial quantities of gypsum, wastepaper, mineral fiber, steel, perlite and starch. The cost of certain of these items has been volatile, and availability has sometimes been limited. We obtain some of these materials from a limited number of suppliers, which increases the risk of unavailability. We may not be able to pass increased raw material prices on to our customers in the future if the market or existing agreements with our customers do not allow us to raise the prices of our finished products. If price adjustments for our finished products significantly trail the increase in raw material prices, or if we cannot effectively hedge against price increases, our operating results or cash flows may be materially and adversely affected.
Approximately half of the gypsum used in our wallboard plants is synthetic gypsum, which is a coal-combustion byproduct resulting primarily from flue gas desulphurization carried out by electric generation or industrial plants burning coal as a fuel. Six of our 21 gypsum wallboard plants in operation use synthetic gypsum for all of their needs, while another six use it for some of their needs. The suppliers of synthetic gypsum are primarily power companies, and certain power companies have recently switched to using natural gas instead of coal for their electric generation needs. In addition, existing or future changes in environmental regulations may make it more difficult or costly for power companies to burn coal, including the U.S. EPA’s final Clean Power Plan issued in 2015, which may result in a further shift away from coal-based sources of energy to natural gas and renewable energy sources. In the event more power companies switch to using natural gas instead of coal, the availability of synthetic gypsum may decrease. We could incur substantial costs in connection with any significant reduction in the availability of synthetic gypsum, including to convert our plants to use natural gypsum, which may materially and adversely
9
affect our business, financial condition, operating results or cash flows. Further, although the U.S. EPA issued a final rule in December 2014 providing that there are no additional regulatory requirements on the use of synthetic gypsum, legal challenges to this final rule, or subsequent state legislation, could result in laws or regulations that adversely affect the classification, use, storage and disposal of synthetic gypsum, which may result in a material adverse effect on our business, financial condition, operating results and cash flows.
Energy costs also are affected by various market factors, including the availability of supplies of particular forms of energy, energy prices and local and national regulatory decisions. Prices for natural gas and electrical power, which are significant components of the costs associated with production of our gypsum and interior systems products, have been volatile in recent years. There may be substantial increases in the price, or a decline in the availability, of energy in the future, especially in light of instability or possible dislocations in some energy markets. We are not always able to pass on increases in energy costs to our customers through increases in product prices.
We use natural gas extensively in the production of gypsum and interior systems products in the United States, Canada and Mexico. In an attempt to reduce our price risk related to fluctuations in natural gas prices, we enter into hedging agreements using swaps. We benefit from the hedge agreements when spot prices exceed contractually specified prices. We are disadvantaged by the hedge agreements when spot prices are less than contractually specified prices.
In addition, the results of our hedging agreements could be negative in any period depending on price changes in the hedged exposures. Further, changes to the price of natural gas, including as a result of environmental or other legislation, could result in changes to the value of our hedging contracts, which could impact our results of operations for a particular period. Our hedging activities are not designed to mitigate long-term natural gas price fluctuations and, therefore, will not protect us from long-term natural gas price increases.
Any substantial or extended decline in prices of, or demand for, natural gas that has been hedged could cause our production costs to be greater than those of our competitors. A significant production cost differential could have a material adverse effect on our business, financial condition, operating results and cash flows.
Our exposure to the risks of operating internationally could adversely affect our business, financial condition, operating results and cash flows.
International business operations, including through UBBP, and our operations in Canada, Mexico, and Latin America, are becoming increasingly important to our future operations, growth and prospects. Further, it is a strategic priority of ours to continue to grow and diversify our earnings by expanding in select emerging markets. Our foreign operations and our international expansion strategy are subject to a number of risks, including:
• | compliance with United States laws affecting operations outside of the United States, such as the Foreign Corrupt Practices Act or similar anti-bribery laws and regulations; |
• | compliance with a variety of local regulations and laws; |
• | changes in tax laws and the interpretation of those laws; |
• | fluctuations in currency values; |
• | sudden changes in foreign currency exchange controls; |
• | discriminatory or conflicting fiscal policies; |
• | difficulties enforcing intellectual property and contractual rights in certain jurisdictions; |
• | greater risk of uncollectible accounts and longer collection cycles; |
• | effective and immediate implementation of control environment processes across our diverse operations and employee base; |
• | nationalization of properties by foreign governments; and |
• | imposition of more or new tariffs, quotas, trade barriers, and similar restrictions on our sales outside the United States. |
Moreover, political and economic changes or volatility, geopolitical regional conflicts, terrorist activity, political unrest, civil strife, acts of war, epidemics, public corruption and other economic or political uncertainties could interrupt and negatively affect our business operations. All of these factors could result in increased costs or decreased revenues, and could materially and adversely affect our business, financial condition, operating results and cash flows.
10
USG Boral Building Products reduces our control over certain assets and could give rise to disputes with Boral that could adversely affect our business, financial condition, operating results and cash flows.
UBBP involves risks not otherwise present when we operate our business through wholly-owned entities. For example:
• | Certain major decisions with respect to UBBP require the majority or unanimous approval of the joint ventures’ boards or shareholders. Boral may have economic or other business interests or goals that are or become inconsistent with our interests or goals. Accordingly, we may not be able to obtain approval of certain matters that would be in our best interests. In addition, we may become engaged in a dispute with Boral that could require us to spend additional resources to resolve such dispute and have an adverse impact on the operations and profitability of UBBP. |
• | A deadlock with respect to certain fundamental decisions may result in the triggering of a sale process of UBBP. In such a case, the terms of the sale may be less attractive than if we had held onto our investments. |
• | UBBP is operated in accordance with the terms of a shareholders agreement, or the Shareholders Agreement, that limits our ability to transfer our interest in UBBP. As a result, we may be unable to sell our interest in UBBP when we would otherwise like. |
• | UBBP may not pay dividends if such payments are, among other things, restricted pursuant to the terms of the credit facilities maintained by UBBP, inconsistent with the then-applicable strategic plan, or illegal. Accordingly, we may not receive dividend payments from UBBP in the amounts that we currently anticipate or at all, which may adversely impact our ability to receive any economic benefit from UBBP. |
• | If we or Boral, or certain of our respective affiliates, are subject to a change of control, or if certain other events of default under the Shareholders Agreement occur with respect to us or Boral, we or Boral, as applicable, may be required to sell our or Boral's, as applicable, entire interest in UBBP at fair market value, as determined in accordance with the Shareholders Agreement. In the event we are forced to sell our interest in UBBP, it may be under terms that are not advantageous to us. In the event Boral is forced to sell its interest in UBBP, and we are unable to acquire Boral's interest due to lack of funding or otherwise, we would not have the right to select the third party to which Boral would sell its interest. |
• | In certain circumstances, a capital call may be issued to the shareholders of UBBP in order to obtain additional funding for the joint ventures' operations. If we do not provide capital and Boral does, Boral may receive additional shares in UBBP, thereby diluting our interest and diminishing our rights under the Shareholders Agreement. |
• | Boral may become insolvent, refuse to make additional capital contributions or fail to meet its obligations under the two share sale and subscription agreements or the Shareholders Agreement, which may result in certain liabilities to us. |
• | In the event we exit UBBP, we may be restricted from competing in certain markets, many of which we anticipate to be high-growth markets, until the later of the third anniversary of our exit and ten years from the commencement of UBBP. |
If any of these risks were to materialize, our business, financial condition, operating results and cash flows could be materially and adversely impacted.
Significant changes in discount rates used to measure our defined benefit plan obligations, actual investment returns on pension assets and other factors could negatively impact our business, financial condition, operating results and cash flows.
We maintain defined benefit pension plans as well as other postretirement benefit plans for eligible employees. Our profit margins are affected by costs related to maintaining these plans for active employees and retirees. The recognition of costs and liabilities associated with these plans for financial reporting purposes is affected by the level of interest rates and assumptions made by management and used by actuaries engaged by us to calculate the projected and accumulated benefit obligations and the annual expense recognized for these plans. The assumptions used in developing the required estimates primarily include discount rates, expected return on plan assets for the funded plans, compensation increase rates, retirement rates, mortality rates and, for postretirement benefits, retirement rates and levels of a company-provided subsidy. Economic and market factors and conditions could affect any of these assumptions and may affect our estimated and actual employee benefit plan costs and our business, financial condition, operating results and cash flows.
Our pension plans were underfunded by approximately $263 million as of December 31, 2015 and $346 million as of December 31, 2014. In recent years, the declining interest rates and changes to mortality assumptions have negatively impacted the funded status of our pension plans. The asset performance has been volatile since 2008, with plan assets outperforming in some years and underperforming in other years versus the assumed rate of return used to determine pension expense. If the
11
discount rates and actual asset returns increase or decrease, the funded status of our plan as well as the future pension expense and funding obligations will decrease and increase, respectively.
Our business, financial condition, operating results and cash flows could be materially and adversely affected by infringement or misappropriation of our intellectual property and other proprietary rights.
Our success depends, in part, upon our intellectual property rights. We rely on a combination of contractual rights, copyright, trademark and trade secret laws to establish and protect our intellectual property. We also maintain patents for certain of our technologies. We customarily require our employees and independent contractors to execute confidentiality agreements or otherwise to agree to keep our proprietary information confidential when their relationship with us begins. In addition, we have entered into certain contractual intellectual property protections in connection with the licensure and use of our intellectual property by UBBP.
Despite our efforts, the steps we have taken to protect our intellectual property may be inadequate. Existing trade secret, patent, trademark and copyright laws offer only limited protection. Our patents could be invalidated or circumvented. In addition, others may develop substantially equivalent or superseding proprietary technology, or competitors may offer similar competing products that do not infringe on our intellectual property rights, thereby substantially reducing the value of our proprietary rights.
Moreover, the laws of some foreign countries in which our products are or may be manufactured or sold may not protect our products or intellectual property rights to the same extent as do the laws of the United States. This risk may be heightened in connection with our investments in UBBP, because it results in the use of our intellectual property in additional foreign jurisdictions, some of which lack robust or accessible intellectual property protection enforcement mechanisms.
From time to time, litigation may be necessary to defend and enforce our proprietary rights. As a result, we could incur substantial costs and divert management resources, which could harm our business, regardless of the final outcome. Despite our efforts to safeguard and maintain our intellectual property rights, both in the United States and abroad, we may be unsuccessful in doing so, which could materially and adversely affect our business, financial condition, operating results and cash flows.
A security breach of customer, employee, supplier or company information may have a material adverse effect on our business, financial condition, operating results and cash flows.
In the conduct of our business we collect, use, transmit and store data on information systems, which are vulnerable to an increasing threat of continually evolving cybersecurity risks. Any security breach or compromise of our information systems could significantly damage our reputation, cause the disclosure of confidential customer, employee, supplier or company information, including our intellectual property, and result in significant losses, litigation, fines and costs. While we have implemented processes to protect against unauthorized access to our information systems and data, there is no guarantee that these procedures are adequate or will be able to prevent breaches. The regulatory environment related to information security, data collection and privacy is evolving, with new and constantly changing requirements applicable to our business, and compliance with those requirements could result in additional costs.
We are subject to environmental and safety laws and regulations that may change. These laws and regulations could cause us to make modifications to how we manufacture and price our products. They could also require that we make significant capital investments or otherwise increase our costs.
We are subject to federal, state, local and foreign laws and regulations governing the protection of the environment and occupational health and safety, including laws regulating air emissions, wastewater discharges, the management and disposal of hazardous materials and wastes, and the health and safety of our employees. We are also required to obtain permits from governmental authorities for certain operations. If we were to fail to comply with these laws, regulations or permits, we could incur fines, penalties or other sanctions. In addition, in the past we have been, and in the future could be, held responsible for costs and damages arising from any contamination at our past or present facilities or at third-party waste disposal sites. We cannot completely eliminate the risk of contamination or injury resulting from hazardous materials. Environmental laws and regulations tend to become more stringent over time, and we could incur material expenses relating to compliance with future environmental laws. Further, new environmental and safety legislation may have a material and adverse impact on our operations and results. The Occupational Safety and Health Administration has proposed a comprehensive occupational health standard for crystalline silica, which is found in most of our products, which would, among other things, lower the permissible occupational exposure limits. We could incur substantial costs in connection with complying with this rule as proposed.
The price and availability of certain of the raw materials that we use may vary in the future as a result of environmental laws and regulations affecting our suppliers. An increase in the price of our raw materials, a decline in their availability or
12
future costs relating to our compliance with environmental laws and regulations may materially and adversely affect our operating margins or result in reduced demand for our products.
The U.S. Congress, several states and the international community are considering measures to reduce emission of greenhouse gases, or GHGs, including carbon dioxide and methane. Some states and provinces have already adopted GHG regulation or legislation. Following a finding by the U.S. EPA that certain GHGs represent an endangerment to human health, the U.S. EPA adopted two sets of rules regulating GHG emissions under the Clean Air Act, one that requires a reduction in emissions of GHGs from motor vehicles and another that regulates emissions of GHGs from certain large stationary sources, and in 2015 issued its final Clean Power Plan, under which the U.S. EPA will set state-specific goals for GHG emissions reductions. These rules, if they withstand legal challenge, could affect future expansions or modifications at all of our U.S. wallboard and ceiling tile plants and paper mills and would require that we incur significant costs to satisfy permitting requirements. In addition, enactment of new climate control legislation, regulatory initiatives or treaties impacting the locations where we conduct business could have a materially adverse effect on our operations and demand for our services or products. For example, any new legislation, such as a “carbon tax” on energy use or establishing a “cap and trade”, could materially and adversely increase the cost of energy used in our manufacturing processes. If energy becomes more expensive, we may not be able to pass these increased costs on to purchasers of our products. Further, stricter regulation of emissions might require us to install emissions controls or other equipment at some or all of our manufacturing facilities, requiring significant additional capital investments.
Our financial results may be affected by various legal and governmental proceedings, including those involving antitrust, tax, environmental, or other matters.
We are subject to litigation and governmental proceedings in the normal course of business and could become subject to additional claims in the future, some of which could become material, including, but not limited to, a federal grand jury investigation of the gypsum drywall industry. The outcome of existing legal and governmental proceedings may differ from our expectations because the outcomes of litigation and governmental proceedings are often difficult to predict reliably. Various developments can lead to changes in current estimates of liabilities and related insurance receivables, where applicable. Those developments include judicial rulings or judgments, settlements, or regulatory developments or changes in applicable law. A future adverse ruling, settlement or unfavorable development could result in charges that could have a material adverse effect on our results of operations in any particular period. For a more detailed discussion of certain of the legal proceedings in which we are involved, see Item 3, Legal Proceedings, below.
Covenant restrictions under the agreements governing our indebtedness may limit our ability to pursue business activities or otherwise operate our business.
The agreements governing our indebtedness contain covenants that may limit our ability to finance future operations or capital needs or to engage in other business activities, including, among other things, our ability to:
• | incur additional indebtedness; |
• | pay dividends; |
• | make guarantees; |
• | sell assets or make other fundamental changes; |
• | engage in mergers, acquisitions and dispositions; |
• | make investments; |
• | enter into transactions with affiliates; |
• | change our business purposes; and |
• | enter into sale and lease-back transactions. |
In addition, we are subject to agreements that may require us to meet and maintain certain financial ratios and tests, which may require that we take action to reduce our debt or to act in a manner contrary to our current or future business plans. General business and economic conditions may affect our ability to comply with these covenants or meet those financial ratios and tests.
A breach of any of our credit agreement or indenture covenants or failure to maintain a required ratio or meet a required test may result in an event of default under those agreements. This may allow the counterparties to those agreements to declare all amounts outstanding thereunder, together with accrued interest, to be immediately due and payable. If this occurs, we may not be able to refinance the accelerated indebtedness on favorable terms, or at all, or repay the accelerated indebtedness.
13
If we experience an “ownership change” within the meaning of the Internal Revenue Code, utilization of our net operating loss, or NOL, carryforwards would be subject to an annual limitation.
The Internal Revenue Code imposes limitations on a corporation’s ability to utilize NOLs if it experiences an “ownership change”, which may result from transactions increasing the ownership of certain stockholders in the stock of a corporation by more than 50 percentage points over a three-year period. If we were to experience an ownership change, utilization of our NOLs would be subject to an annual limitation that may be carried over to later years within the allowed NOL carryforward period. Notwithstanding, over the entire carryforward period, we may not be able to use all our NOLs due to the aforementioned annual limitation. If an ownership change had occurred as of December 31, 2015, our annual U.S. federal NOL utilization would have been limited to approximately $92 million per year.
These NOL carryforwards are a substantial asset for us. We have a stockholder rights plan, or the Rights Agreement, which was initially intended to protect our stockholders from coercive takeover practices or takeover bids that are inconsistent with their best interests. However, on March 22, 2013, February 11, 2015 and November 16, 2015, we entered into amendments to the Rights Agreement in an effort to protect our NOLs. In addition, our Restated Certificate of Incorporation includes an amendment, the Protective Amendment, which restricts certain transfers of our common stock. The Protective Amendment is intended to protect the tax benefits of our NOLs and expires on May 9, 2016 unless our stockholders vote to extend its protections at our 2016 annual meeting of stockholders. See Note 17 to the consolidated financial statements in Part II, Item 8 of this report for a description of the amendments to the Rights Agreement and the Protective Amendment. Although the amendments to the Rights Agreement and Protective Amendment are intended to reduce the likelihood of an “ownership change” that could adversely affect us, we cannot provide assurance that the restrictions on transferability in the amendments to the Rights Agreement and Protective Amendment will prevent all transfers that could result in such an “ownership change.” There also can be no assurance that the transfer restrictions in the Protective Amendment will be extended by our stockholders at the 2016 annual meeting or be enforceable against all of our stockholders absent a court determination confirming such enforceability. The transfer restrictions may be subject to challenge on legal or equitable grounds.
A small number of our stockholders could significantly influence our business, affairs and stock price.
Based on filings made with the SEC, we believe that, as of January 31, 2016, two stockholders collectively controlled nearly 40% of our common stock. Accordingly, a small number of our stockholders could affect matters requiring approval by stockholders, including the election of directors and the approval of potential business combination transactions. One or more of these stockholders may have interests that differ from other stockholders and may vote on such matters in a way that is adverse to the interests of those other stockholders. In addition, if one or more of these stockholders sell a large number of our shares, our share price may decline, and could then continue to trade at lower prices, and could limit our ability to raise capital through the sale of additional equity securities.
We may pursue acquisitions, joint ventures and other transactions that are intended to complement or expand our businesses. We may not be able to complete proposed transactions, and even if completed, the transactions may involve a number of risks that may result in a material adverse effect on our business, financial condition, operating results and cash flows.
As business conditions warrant and our financial resources permit, we may pursue opportunities to acquire businesses or technologies and to form joint ventures that we believe could complement, enhance or expand our current businesses or product lines or that might otherwise offer us growth opportunities. We may have difficulty identifying appropriate opportunities, or if we do identify opportunities, we may not be successful in completing transactions for a number of reasons. Any transactions that we are able to identify and complete may involve one or more of a number of risks, including:
• | the diversion of management’s attention from our existing businesses to integrate the operations and personnel of the acquired business or joint venture; |
• | possible adverse effects on our operating results during the integration process; |
• | failure of the acquired business or joint venture to achieve expected operational, profitability and investment return objectives; |
• | the incurrence of significant charges, such as asset devaluation or restructuring charges; |
• | the incurrence of unanticipated liabilities and costs for which indemnification is unavailable or inadequate; and |
• | the inability to achieve other intended objectives of the transaction. |
14
In addition, we may not be able to successfully or profitably integrate, operate, maintain and manage our newly acquired operations or their employees. We may not be able to maintain uniform standards, controls, procedures and policies, which may lead to operational inefficiencies. In addition, future acquisitions may result in dilutive issuances of equity securities or the incurrence of additional indebtedness.
We do not expect to pay cash dividends on our common stock for the foreseeable future.
We have not paid a dividend on our common stock since the first quarter of 2001 and have no plans to do so in the foreseeable future. Further, our credit agreement limits our ability to pay a dividend or repurchase our stock unless specified borrowing availability and fixed charge coverage ratio tests are met, and it prohibits payment of a dividend if a default exists under the agreement. Because we do not expect to pay dividends on our common stock in the foreseeable future, investors in our common stock will have to rely on the possibility of stock appreciation and sell their shares to realize a return on their investment.
Item 1B. | UNRESOLVED STAFF COMMENTS |
None
15
Item 2.PROPERTIES
We operate plants, mines, quarries, and other facilities in North America and South America. U.S. Gypsum’s Sheetrock® brand gypsum wallboard plants operated at approximately 57% of capacity during 2015. USG Interiors’ ceiling tile plants operated at approximately 88% of capacity during 2015. The locations of our production properties in operation as of December 31, 2015, grouped by reportable segment, are as follows (plants are owned unless otherwise indicated):
Gypsum
Gypsum wallboard and other gypsum products | Joint compound (surface preparation and joint treatment products) | Cement board | Gypsum rock (mines and quarries) | Paper for gypsum wallboard | ||||||
Alabaster (Tawas City), Michigan | x | |||||||||
Aliquippa, Pennsylvania* | x | |||||||||
Auburn, Washington | x | |||||||||
Baltimore, Maryland** | x | x | x | |||||||
Bridgeport, Alabama* | x | x | ||||||||
Buenos Aires, Argentina*** | x | |||||||||
Calgary, Alberta, Canada*** | x | |||||||||
Chamblee, Georgia | x | |||||||||
Dallas, Texas | x | |||||||||
Detroit (River Rouge), Michigan | x | |||||||||
East Chicago, Indiana* | x | x | ||||||||
Fort Dodge, Iowa | x | x | ||||||||
Galena Park, Texas* | x | x | x | |||||||
Gypsum, Ohio | x | |||||||||
Hagersville, Ontario, Canada** | x | x | x | |||||||
Jacksonville, Florida** | x | x | ||||||||
Lima, Peru | x | |||||||||
Little Narrows, Nova Scotia, Canada | x | |||||||||
Monterrey, Nuevo Leon, Mexico | x | x | x | x | ||||||
Montreal, Quebec, Canada ** | x | x | ||||||||
New Orleans, Louisiana | x | |||||||||
Norfolk, Virginia* | x | |||||||||
North Kansas City, Missouri | x | |||||||||
Oakfield, New York | x | |||||||||
Otsego, Michigan | x | |||||||||
Phoenix (Glendale), Arizona | x | |||||||||
Plaster City, California | x | x | ||||||||
Port Reading, New Jersey | x | |||||||||
Puebla, Puebla, Mexico | x | x | ||||||||
Rainier, Oregon | x | |||||||||
Saltillo, Coahuila, Mexico | x | |||||||||
San Luis Potosi, San Luis Potosi, Mexico | x | x | ||||||||
Shoals, Indiana** | x | x | ||||||||
Sigurd, Utah | x | x | x | |||||||
Southard, Oklahoma | x | |||||||||
16
Sperry, Iowa** | x | x | ||||||||
Surrey, British Columbia, Canada*** | x | |||||||||
Sweetwater, Texas | x | x | ||||||||
Tecoman, Colima, Mexico | x | x | ||||||||
Torrance, California | x | |||||||||
Washingtonville, Pennsylvania* | x | |||||||||
* | Plants supplied fully by synthetic gypsum |
** | Plants supplied partially by synthetic gypsum |
*** | Leased |
OTHER PRODUCTS
We operate a mica-processing plant at Spruce Pine, North Carolina. We manufacture metal lath, plaster and drywall accessories and light gauge steel framing products at Monterrey, Nuevo Leon, Mexico, and Puebla, Puebla, Mexico. We produce plaster products at Southard, Oklahoma; Puebla, Puebla, Mexico; Saltillo, Coahuila, Mexico; and San Luis Potosi, San Luis Potosi, Mexico. We manufacture paper-faced metal corner bead at Auburn, and Weirton, West Virginia (leased). We also manufacture cement panels at a manufacturing facility in Delavan, Wisconsin (leased).
Ceilings
Ceiling Grid | Ceiling Tile | |||
Cartersville, Georgia | x | |||
Cloquet, Minnesota | x | |||
Greenville, Mississippi | x | |||
Oakville, Ontario, Canada | x | |||
Stockton, California | x | |||
Walworth, Wisconsin | x | |||
Westlake, Ohio | x | |||
A coil coater and slitter plant used in the production of ceiling grid is located in Westlake, Ohio. A slitter plant is located in Stockton, California (leased).
OTHER PRODUCTS
We manufacture mineral fiber products at Red Wing, Minnesota, and Walworth, Wisconsin, and metal specialty systems at Oakville, Ontario, Canada.
Distribution
L&W Supply leases nearly all of its facilities from third parties. Typical leases have terms of five years and include renewal options. As of December 31, 2015, L&W Supply served its customers from 142 distribution branches in the United States.
Item 3. | LEGAL PROCEEDINGS |
See Part II, Item 8, Financial Statements and Supplementary Data - Notes to Consolidated Financial Statements, Note 19, Litigation, for information on legal proceedings, which information is incorporated herein by reference.
Item 4. | MINE SAFETY DISCLOSURES |
The information concerning mine safety violations or regulatory matters required by Section 1503(a) of the Dodd-Frank Wall Street Reform and Consumer Protection Act and Item 104 of Regulation S-K promulgated by the SEC is included in Exhibit 95 to this report.
17
PART II
Item 5. | MARKET FOR THE REGISTRANT’S COMMON EQUITY, RELATED STOCKHOLDER MATTERS AND ISSUER PURCHASES OF EQUITY SECURITIES |
Our common stock trades on the New York Stock Exchange, or NYSE, and the Chicago Stock Exchange under the symbol USG. The NYSE is the principal market for our common stock. As of January 31, 2016, there were 2,315 record holders of our common stock. We currently do not pay dividends on our common stock. Our credit facility restricts our ability to pay cash dividends on, or repurchase, our common stock. See Item 8, Financial Statements and Supplementary Data, Note 6, Debt, for more information regarding these restrictions.
We did not purchase any of our equity securities during the fourth quarter of 2015.
See Part III, Item 12, Security Ownership of Certain Beneficial Owners and Management and Related Stockholder Matters, for information regarding common stock authorized for issuance under equity compensation plans.
Pursuant to our Deferred Compensation Program for Non-Employee Directors, five of our non-employee directors deferred the $120,000 annual grant, and one of our non-employee directors deferred the quarterly retainer, they were entitled to receive on December 31, 2015 under our Non-Employee Director Compensation Program, into a total of 25,812 deferred stock units. These units will increase or decrease in value in direct proportion to the market value of our common stock and will be paid in cash or shares of common stock, at each director’s option, following termination of service as a director. The issuance of these deferred stock units was effected through a private placement under Section 4(a)(2) of the Securities Act and was exempt from registration under Section 5 of the Securities Act.
COMMON STOCK PRICES
The high and low sales prices of our common stock in 2015 and 2014 were as follows:
2015 | 2014 | ||||||||||||||
High | Low | High | Low | ||||||||||||
First quarter | $ | 30.99 | $ | 25.39 | $ | 35.85 | $ | 28.41 | |||||||
Second quarter | 29.08 | 26.00 | 33.16 | 29.20 | |||||||||||
Third quarter | 32.73 | 25.89 | 30.04 | 26.45 | |||||||||||
Fourth quarter | 28.00 | 22.91 | 29.65 | 24.55 | |||||||||||
18
PERFORMANCE GRAPH
The following graph and table compare the cumulative total stockholder return on our common stock with the Standard and Poor’s 500 Index, or S&P 500, and the Dow Jones U.S. Construction and Materials Index, or DJUSCN, in each case assuming an initial investment of $100 and full dividend reinvestment, for the five-year period ended December 31, 2015.
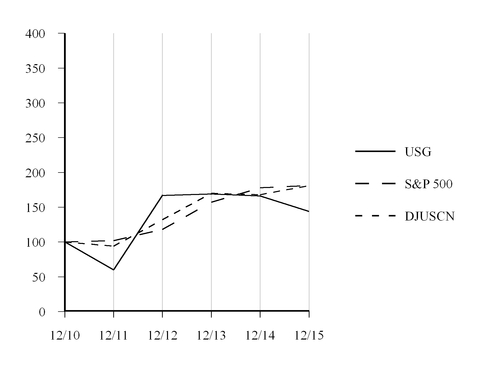
Value of Investment as of December 31 | |||||||||||||||||||||||
2010 | 2011 | 2012 | 2013 | 2014 | 2015 | ||||||||||||||||||
USG | $ | 100 | $ | 60 | $ | 167 | $ | 169 | $ | 166 | $ | 144 | |||||||||||
S&P 500 | 100 | 102 | 118 | 157 | 178 | 181 | |||||||||||||||||
DJUSCN | 100 | 94 | 132 | 170 | 168 | 181 | |||||||||||||||||
All amounts are rounded to the nearest dollar.
19
Item 6. | SELECTED FINANCIAL DATA |
(millions, except per-share and employee data) | Years Ended December 31, | ||||||||||||||||||
2015 | 2014 | 2013 | 2012 | 2011 (a) | |||||||||||||||
Statement of Operations Data: | |||||||||||||||||||
Net sales | $ | 3,776 | $ | 3,724 | $ | 3,570 | $ | 3,224 | $ | 2,910 | |||||||||
Cost of products sold | 3,085 | 3,070 | 2,989 | 2,829 | 2,752 | ||||||||||||||
Gross profit | 691 | 654 | 581 | 395 | 158 | ||||||||||||||
Selling and administrative expenses | 317 | 339 | 320 | 304 | 289 | ||||||||||||||
Litigation settlement charge (b) | — | 48 | — | — | — | ||||||||||||||
Long-lived asset impairment charges (c) | — | 90 | — | 8 | 53 | ||||||||||||||
Contract termination charge and (recovery) loss on receivable (d) | (6 | ) | 15 | — | — | — | |||||||||||||
Gain on disposal of shipping operations, net | (1 | ) | — | — | — | — | |||||||||||||
Restructuring charges | — | — | 3 | 10 | 22 | ||||||||||||||
Operating profit (loss) | 381 | 162 | 258 | 73 | (206 | ) | |||||||||||||
Income (loss) from equity method investments (e) | 48 | 33 | (1 | ) | (3 | ) | (2 | ) | |||||||||||
Interest expense | (163 | ) | (179 | ) | (203 | ) | (206 | ) | (211 | ) | |||||||||
Interest income | 2 | 1 | 3 | 4 | 6 | ||||||||||||||
Income and gain from sale of equity method investment to related party (e) (f) | 13 | 2 | 2 | 3 | 3 | ||||||||||||||
Gain on deconsolidation of subsidiaries and consolidated joint ventures (g) | — | 27 | — | — | — | ||||||||||||||
Loss on extinguishment of debt | (19 | ) | — | — | (41 | ) | — | ||||||||||||
Income (loss) from continuing operations before income taxes | 262 | 46 | 59 | (170 | ) | (410 | ) | ||||||||||||
Income tax (expense) benefit (h) | 729 | (7 | ) | (11 | ) | (12 | ) | 14 | |||||||||||
Income (loss) from continuing operations | 991 | 39 | 48 | (182 | ) | (396 | ) | ||||||||||||
Income (loss) from discontinued operations, net of tax | — | (1 | ) | (2 | ) | 2 | 6 | ||||||||||||
Gain on sale of discontinued operations, net of tax (a) | — | — | — | 55 | — | ||||||||||||||
Net income (loss) | 991 | 38 | 46 | (125 | ) | (390 | ) | ||||||||||||
Less: Net income (loss) attributable to noncontrolling interest | — | 1 | (1 | ) | 1 | — | |||||||||||||
Net income (loss) attributable to USG | $ | 991 | $ | 37 | $ | 47 | $ | (126 | ) | $ | (390 | ) | |||||||
Income (loss) from continuing operations per common share: | |||||||||||||||||||
Basic | 6.81 | 0.27 | 0.45 | (1.72 | ) | (3.81 | ) | ||||||||||||
Diluted | 6.73 | 0.26 | 0.44 | (1.72 | ) | (3.81 | ) | ||||||||||||
Balance Sheet Data (as of the end of the year): | |||||||||||||||||||
Working capital (i) | $ | 409 | $ | 546 | $ | 1,080 | $ | 796 | $ | 723 | |||||||||
Current ratio (i) | 1.41 | 1.97 | 2.90 | 2.50 | 2.41 | ||||||||||||||
Cash and cash equivalents | 442 | 228 | 810 | 546 | 365 | ||||||||||||||
Property, plant and equipment, net | 1,788 | 1,908 | 2,103 | 2,100 | 2,104 | ||||||||||||||
Total assets (i) (j) | 4,736 | 3,936 | 4,051 | 3,691 | 3,697 | ||||||||||||||
Long-term debt (j) (k) | 1,675 | 2,191 | 2,275 | 2,284 | 2,281 | ||||||||||||||
Total stockholders’ equity | 1,436 | 408 | 662 | 19 | 156 | ||||||||||||||
Other Information: | |||||||||||||||||||
Capital expenditures | $ | 94 | $ | 132 | $ | 124 | $ | 70 | $ | 54 | |||||||||
Closing stock price per common share as of December 31 | $ | 24.29 | $ | 27.99 | $ | 28.38 | $ | 28.07 | $ | 10.16 | |||||||||
Average number of employees (l) | 8,954 | 8,928 | 8,732 | 8,758 | 8,880 | ||||||||||||||
(a) | Results for 2011 have been adjusted from the originally reported amounts to reflect our European businesses, which were sold on December 27, 2012, as discontinued operations. We recorded a gain of $55 million on the sale of the businesses. |
(b) | Reflects a charge related to the settlement of the U.S. wallboard pricing class action lawsuit. See Note 19 to our consolidated financial statements in Part II, Item 8 of this report. |
(c) | Reflects long-lived asset impairment charges on certain manufacturing facilities, capitalized costs for the construction of future facilities and ocean vessels. See Note 12 and Note 13 to our consolidated financial statements in Part II, Item 8 of this report. |
(d) | Item relates to our GTL operations. See Note 13 to our consolidated financial statements in Part II, Item 8 of this report. |
(e) | Equity method income from our Knauf-USG joint venture has been reclassified for all periods to "income and gain from sale of equity method investment to related party." |
(f) | Reflects the gain recorded on the sale of our equity method investment in our Knauf-USG joint venture to our 50/50 joint venture partner in 2015 and our share of the net income from the equity method investment for all periods presented. See Note 3 to our consolidated financial statements in Part II, Item 8 of this report. |
20
(g) | Reflects the gain recorded on the deconsolidation and contribution to UBBP of our wholly-owned subsidiaries in Singapore, Malaysia, New Zealand, and Australia and our consolidated joint ventures in Oman. See Note 3 to our consolidated financial statements in Part II, Item 8 of this report. |
(h) | Income tax (expense) benefit for 2015 includes the reversal of a tax valuation allowance of $731 million. See Note 15 to our consolidated financial statements in Part II, Item 8 of this report. |
(i) | Amounts for 2011-2014 have been retrospectively adjusted to reflect the change in presentation of current deferred tax assets and liabilities to noncurrent. See Note 2 to our consolidated financial statements in Part II, Item 8 of this report. |
(j) | Amounts for 2011-2014 have been retrospectively adjusted to reflect the change in presentation of unamortized debt issuance costs from other assets to debt. See Note 2 to our consolidated financial statements in Part II, Item 8 of this report. |
(k) | Amounts reflected exclude currently maturing portion of long-term debt. |
(l) | As of December 31, 2015, we had approximately 8,900 employees worldwide. For 2011, the average number of employees includes employees from both our discontinued operations and our entities contributed to UBBP. For 2012 and 2013, the average number of employees includes employees from our entities contributed to UBBP. |
21
Item 7. | MANAGEMENT’S DISCUSSION AND ANALYSIS OF FINANCIAL CONDITION AND RESULTS OF OPERATIONS |
OVERVIEW
USG, through its subsidiaries, is a leading manufacturer and distributor of innovative, high-performance building systems. We produce a wide range of products under recognized brand names including Sheetrock®, Durock®, Fiberock®, and Securock® serving the commercial, residential, and repair and remodel construction markets, enabling our customers to build the outstanding spaces where people live, work and play. Our products also are distributed through building materials dealers, home improvement centers and other retailers, specialty wallboard distributors, and contractors.
KEY STRATEGIES
We continue to focus on the following strategic priorities:
• | strengthen our core businesses, |
• | diversify our earnings by expanding in select markets and growing our adjacent product lines, |
• | differentiate USG from our competitors through innovation. |
MARKET CONDITIONS AND OUTLOOK
Our businesses are cyclical in nature and sensitive to changes in general economic conditions, including conditions in the North American housing and construction-based markets and the markets in Asia and Australasia. Our expansion via two 50/50 joint ventures we formed with Boral Limited, referred to as USG Boral Building Products, or UBBP, into the markets of Asia, Australasia, and the Middle East has significantly increased our exposure to the economic conditions in those areas. However, the UBBP investment has helped diversify USG’s overall exposure to changes in the North American economic conditions. The markets we serve can be broadly categorized as new residential construction, new nonresidential construction and repair and remodel activity, which includes both residential and nonresidential construction.
For the new residential construction market, housing starts are a very good indicator of demand for our gypsum products. Installation of our gypsum products into a single family home typically follows a housing start by 90 to 120 days. Based on preliminary data reported by the U.S. Census Bureau, housing starts in the United States increased 11% in 2015 to 1,111,400 compared with 1,003,300 in 2014. This followed an 9% increase in 2014 compared with 2013. For December 2015, the seasonally-adjusted annualized rate of housing starts was reported by the U.S. Census Bureau to be 1,149,000 units. While housing starts increased for the sixth consecutive year in 2015, they are still low by historical standards. Most industry analysts believe that the recovery in new residential construction will continue, although the recovery over the next few years may be uneven and modest, and that over the longer term housing starts will begin to reach historical averages. Industry analysts’ forecasts for 2016 housing starts in the United States included in the most recent Blue Chip Economic Indicators are 1,170,000 to 1,350,000 units, based upon the average of the bottom ten and top ten forecasts included in the report, respectively. We currently estimate that 2016 housing starts in the United States will be 1,200,000.
Demand for our products from new nonresidential construction is determined by floor space for which contracts are signed. Installation of gypsum and ceilings products typically follows signing of construction contracts by about 12 to 18 months. According to the most recent construction market forecast from Dodge Data & Analytics (formerly known as McGraw Hill Construction), total floor space for which new nonresidential construction contracts were signed in the United States decreased 3% in 2015 compared with 2014. This followed a 13% increase in 2014 compared with 2013 and a 12% increase in 2013 compared with 2012. Dodge Data & Analytics forecasts that total floor space for which new nonresidential construction contracts in the United States are signed will increase approximately 9% in 2016 from the 2015 level. Dodge Data & Analytics' forecast includes several building types which do not generate significant demand for our products; therefore, we anticipate new nonresidential construction growth in our business sectors in 2016 compared to 2015 will increase 1%.
The repair and remodel market includes renovation of both residential and nonresidential buildings. As a result of the low levels of new home construction in recent years, this market currently accounts for the largest portion of our sales. Many buyers begin to remodel an existing home within two years of purchase. According to the National Association of Realtors, sales of existing homes in the United States increased to 5.26 million units in 2015, reflecting a 6% increase from the 2014 level of 4.94 million units, which was a 3% decrease from 2013. The generally rising or flat levels of existing home sales and home resale values in recent years have contributed to an increase in demand for our products from the residential repair and remodel market. We currently estimate that overall repair and remodel spending in 2015 increased approximately 2% over the 2014 level and that overall repair and remodel spending growth in 2016, compared to 2015, will increase 2 to 3%.
22
The rate of recovery in the new residential construction market, new nonresidential construction market and the repair and remodel market still remains uncertain and will depend on broader economic issues including employment, household formation, home ownership rate, existing home price trends, availability of mortgage financing, interest rates, consumer confidence, job growth and discretionary business investment. An increase in interest rates, high levels of unemployment, restrictive lending practices, a decrease in consumer confidence or other adverse economic conditions could have a material adverse effect on our business, financial condition, operating results and cash flows. Our businesses are also affected by a variety of other factors beyond our control, including the inventory of unsold homes, the level of foreclosures, home resale rates, housing affordability, office and retail vacancy rates and foreign currency exchange rates. Since we operate in a variety of geographic markets, our businesses are subject to the economic conditions in each of these geographic markets. General economic downturns or localized downturns or financial concerns in the regions where we have operations may have a material adverse effect on our business, financial condition, results of operations and cash flows.
We expect modest improvement over the next twelve months in the construction industries of Canada and Mexico. Emerging markets, including those that are within the UBBP territory, provide opportunities for our operations to serve the increasing demand for products in these regions. Several market forecasters have predicted that China will lead construction materials demand growth over the next several years. Several other countries, including South Korea and Australia, are forecast to experience steady growth as well. Although the rate of growth in certain emerging markets has slowed, we expect the growth in these markets to exceed the improvements in North America with demand growth in the mid-single digits. We anticipate that the results from UBBP will enable us to counteract some of the potential cyclicality in our North American business.
Our Gypsum segment has improved with the modest recovery in residential housing over the last three years, although it continues to be adversely affected by the low level of residential and other construction activity compared to historical averages. Our Ceilings segment, which primarily serves the commercial markets, and our Distribution segment, which serves the residential and commercial markets, have both showed some improvements. However, they continue to be adversely affected by the low levels of new commercial construction activity.
Industry shipments of gypsum board in the United States (including gypsum wallboard, other gypsum-related paneling products and imports), as reported by the Gypsum Association, were an estimated 22.3 billion square feet in 2015, up approximately 2% from 21.8 billion square feet in 2014.
U.S. Gypsum shipped 5.44 billion square feet of Sheetrock® brand gypsum wallboard in 2015, a 2% increase from 5.33 billion square feet in 2014. USG Sheetrock® Brand UltraLight Panels accounted for approximately 65% and 63% of that volume in 2015 and 2014, respectively. U.S. Gypsum’s share of the gypsum board market in the United States, which includes, for comparability, its shipments of Sheetrock® brand gypsum wallboard, Fiberock® brand gypsum fiber panels and Securock® brand glass mat sheathing, was approximately 26% in 2015, unchanged from 2014.
There is excess wallboard production capacity industry-wide in the United States. Industry capacity in the United States was approximately 32.8 billion square feet as of January 1, 2016. We estimate that the industry capacity utilization rate was approximately 70% and 74% during the fourth quarters of 2015 and 2014, respectively and approximately 68% and 66% during the full years 2015 and 2014, respectively. Based on current industry trends and forecasts, demand for gypsum wallboard is expected to increase in 2016, but the magnitude of any increase will depend on the levels of housing starts and repair and remodel activity. We project that the industry capacity utilization rate will experience a modest increase in 2016 compared to 2015.
Despite our realization of improvement in our average wallboard selling price, we could experience pressure on gypsum wallboard selling prices and our gross margins at such low levels of capacity utilization. U.S. Gypsum implemented a not-to-exceed price increase for wallboard with the new price being set for January 1, 2015 which has been extended into 2016. However, it is uncertain that we will be able to maintain the increase or obtain additional price increases in our selling prices, including with respect to gypsum wallboard. If we are unable to maintain price increases or obtain additional price increases, our net sales and operating profit may be materially and adversely impacted.
SEGMENTS
Effective April 1, 2014, we changed the composition of our reportable segments to reflect the change in management over our businesses in Mexico and Latin America. Additionally, with the contribution of our businesses in the Asia-Pacific region, India and Oman into the 50/50 joint ventures, USG Boral Building Products, or UBBP, we determined UBBP to be our fourth reportable segment. See further discussion below under Ceilings and UBBP. As a result of these changes, our Mexico and Latin America businesses have been combined, and their Gypsum results have been included within our Gypsum segment, previously referred to as North American Gypsum, and their Ceiling results have been included within our Ceilings segment, previously referred to as Worldwide Ceilings. Our 2013 results have been recast to reflect these changes and present comparative year-over-year results.
23
Our operations are organized into four segments: Gypsum, Ceilings, Distribution, and USG Boral Building Products.
Gypsum: Our Gypsum segment manufactures and markets gypsum and related products in the United States, Canada, Mexico and Latin America. Gypsum’s products are used in a variety of building applications to finish walls, ceilings and floors in residential, commercial and institutional construction and in certain industrial applications.
Ceilings: Our Ceilings segment manufactures and markets interior systems products in the United States, Canada, Mexico and Latin America. In addition, through February 27, 2014, it also included our businesses in the Asia-Pacific region (see paragraph below regarding UBBP), which were included in USG International. Ceilings is a leading supplier of interior ceilings products used primarily in commercial applications. Ceilings manufactures ceiling tile in the United States and ceiling grid in the United States, Canada and, through February 27, 2014, in the Asia-Pacific region. It markets ceiling tile and ceiling grid in the United States, Canada, Mexico, Latin America and, through February 27, 2014, in the Asia-Pacific region.
As discussed below under USG Boral Building Products, on February 27, 2014, we invested with Boral Limited, or Boral, in UBBP, and in connection therewith contributed to UBBP our operations in the Asia-Pacific region.
Distribution: Our Distribution segment consists of L&W Supply Corporation and its subsidiaries, a leading distributor of gypsum wallboard and other building materials in the United States. It is a service-oriented business that stocks a wide range of construction materials. It delivers less-than-truckload quantities of construction materials to job sites and places them in areas where work is being done, thereby reducing the need for handling by contractors.
USG Boral Building Products (UBBP): On February 27, 2014, we and certain of our subsidiaries formed 50/50 joint ventures with Boral. UBBP manufactures, distributes and sells certain building products, mines raw gypsum and sells natural and synthetic gypsum throughout Asia, Australasia and the Middle East (the "Territory"). UBBP manufactures and distributes products for wall, ceiling, floor lining and exterior systems that utilize gypsum wallboard, referred to as plasterboard in the region, mineral fiber ceiling tiles, steel grid and joint compound.
As consideration for our 50% ownership in UBBP, we (i) made a $515 million cash payment to Boral, which includes a $500 million base price and $15 million of customary estimated working capital and net debt adjustments, (ii) contributed to UBBP our subsidiaries and joint venture investments in China, Singapore, India, Malaysia, New Zealand, Australia, the Middle East and Oman, and (iii) granted to UBBP a license to use certain of our intellectual property rights in the Territory. In the event certain performance targets are satisfied by UBBP, we will be obligated to pay Boral scheduled earnout payments in an aggregate amount up to $75 million, comprised first of $25 million based on performance during the first three years and then up to $50 million based on performance during the first five years. See Note 3 to our consolidated financial statements in Part II, Item 8 of this report for further discussion of the accounting for the earnout payments.
UBBP is currently targeting the distribution of at least 50% of combined after tax profits to USG and Boral in proportion to the respective ownership interests, however, the dividend policy may be adjusted by the UBBP Board of Directors with unanimous resolution; provided, however, that UBBP will not pay dividends if such payments are, among other things, restricted pursuant to the terms of the credit facilities maintained by UBBP, inconsistent with the then-applicable strategic plan, or illegal. Through December 31, 2015, cash dividends of $77 million have been declared by UBBP's Board of Directors and paid by UBBP. Our share of these dividends is $38 million, which we intend to use to fund potential obligations under the earnout described above.
Since formation, UBBP has been funded from its net cash flows from operations and third-party financing, and it is our intent that as an ongoing operation, UBBP will continue to self-fund.
As a result of the contribution of our wholly-owned subsidiaries in Singapore, India, Malaysia, New Zealand and Australia and our consolidated joint ventures in Oman, the net sales and operating profit attributable to these entities are no longer included in those corresponding line items on our consolidated statement of operations subsequent to February 27, 2014. Instead, our share of the equity income from UBBP is shown within income from equity method investments.
Our investments in UBBP are accounted for as equity method investments and were initially measured at cost. Our existing wholly-owned subsidiaries and consolidated variable interest entities that were contributed into the joint ventures were deconsolidated, which resulted in a gain of $27 million during the first quarter of 2014. Our investments in UBBP were consummated on February 27, 2014, and as a result, only ten months of our share of equity income from UBBP is included in our accompanying consolidated statement of operations for the twelve months ended December 31, 2014.
Geographic Information: In 2015, 85% of our consolidated net sales were attributable to the United States. Canada accounted for 10% of our net sales, and other foreign countries accounted for the remaining 5%.
24
In 2015, 34% of UBBP's net sales were attributable to Australia, 20% to South Korea, 14% to Thailand, 12% to China, and other foreign countries accounted for the remaining 20%.
CURRENCY IMPACT
Currency impacts on consolidated and segment results have been derived by translating current period results at the quarter-to-date and year-to-date average foreign currency rates for the period ending December 31, 2014, as applicable.
Consolidated Results of Operations
Favorable (Unfavorable) | |||||||||||||||||||||||||
2015 vs. 2014 | 2014 vs. 2013 | ||||||||||||||||||||||||
(millions, except per-share data) | 2015 | 2014 | 2013 | $ | % | $ | % | ||||||||||||||||||
Net sales | $ | 3,776 | $ | 3,724 | $ | 3,570 | $ | 52 | 1 | % | $ | 154 | 4 | % | |||||||||||
Cost of products sold | 3,085 | 3,070 | 2,989 | (15 | ) | — | % | (81 | ) | (3 | )% | ||||||||||||||
Gross profit | 691 | 654 | 581 | 37 | 6 | % | 73 | 13 | % | ||||||||||||||||
Selling and administrative expenses | 317 | 339 | 320 | 22 | 6 | % | (19 | ) | (6 | )% | |||||||||||||||
Litigation settlement charge | — | 48 | — | 48 | 100 | % | (48 | ) | * | ||||||||||||||||
Long-lived asset impairment charges | — | 90 | — | 90 | 100 | % | (90 | ) | * | ||||||||||||||||
Contract termination charge and (recovery) loss on receivable | (6 | ) | 15 | — | 21 | * | (15 | ) | * | ||||||||||||||||
Gain on disposal of shipping operations, net | (1 | ) | — | — | 1 | * | — | * | |||||||||||||||||
Restructuring charges | — | — | 3 | — | * | 3 | 100 | % | |||||||||||||||||
Operating profit | 381 | 162 | 258 | 219 | * | (96 | ) | (37 | )% | ||||||||||||||||
Income (loss) from equity method investments | 48 | 33 | (1 | ) | 15 | 45 | % | 34 | * | ||||||||||||||||
Interest expense | (163 | ) | (179 | ) | (203 | ) | 16 | 9 | % | 24 | 12 | % | |||||||||||||
Interest income | 2 | 1 | 3 | 1 | 100 | % | (2 | ) | (67 | )% | |||||||||||||||
Income and gain on sale from equity method investment to related party | 13 | 2 | 2 | 11 | * | — | * | ||||||||||||||||||
Gain on deconsolidation of subsidiaries and consolidated joint ventures | — | 27 | — | (27 | ) | * | 27 | * | |||||||||||||||||
Loss on extinguishment of debt | (19 | ) | — | — | (19 | ) | * | — | * | ||||||||||||||||
Income from continuing operations before income taxes | 262 | 46 | 59 | 216 | * | (13 | ) | (22 | )% | ||||||||||||||||
Income tax benefit (expense) | 729 | (7 | ) | (11 | ) | 736 | * | 4 | 36 | % | |||||||||||||||
Income from continuing operations | 991 | 39 | 48 | 952 | * | (9 | ) | (19 | )% | ||||||||||||||||
Loss from discontinued operations, net of tax | — | (1 | ) | (2 | ) | 1 | 100 | % | 1 | 50 | % | ||||||||||||||
Net income | 991 | 38 | 46 | 953 | * | (8 | ) | (17 | )% | ||||||||||||||||
Less: Net income (loss) attributable to noncontrolling interest | — | 1 | (1 | ) | 1 | (100 | )% | (2 | ) | * | |||||||||||||||
Net income attributable to USG | $ | 991 | $ | 37 | $ | 47 | $ | 954 | * | $ | (10 | ) | (21 | )% | |||||||||||
Diluted earnings per share - continuing operations | $ | 6.73 | $ | 0.26 | $ | 0.44 | $ | 6.47 | $ | (0.18 | ) | ||||||||||||||
* not meaningful | |||||||||||||||||||||||||
NET SALES
Consolidated net sales in 2015 increased $52 million, or 1%, compared with 2014. This was our sixth consecutive year-on-year increase. The increase in net sales was driven by our Distribution business, contributing an additional $83 million to net sales over the prior year, largely driven by volume and price improvement on sales of gypsum wallboard. This increase was offset by a slight net decline in the Gypsum segment due to the elimination of shipping revenues of $71 million due to the exit of our shipping business in the second quarter of 2015, which was largely offset by increases in volume and average selling prices for nearly all wallboard, surfaces and substrates products. Ceilings revenues declined by $14 million. Ceilings revenues in 2014 included nearly two months of revenue for USG International, or $7 million, prior to its contribution into the UBBP joint venture on February 27, 2014, with further declines in sales driven by the strengthening of the U.S. Dollar, offset by higher selling prices for ceiling tile. On a consolidated basis, we estimate that the strengthening of the U.S. Dollar negatively impacted our net sales by approximately $65 million compared with 2014.
Consolidated net sales in 2014 increased $154 million, or 4%, compared with 2013. Net sales increased 6% for our Gypsum segment and 8% for our Distribution segment, offset by a decrease of 10% for our Ceilings segment. The higher levels of net sales for Gypsum and Distribution primarily reflected increased selling prices and higher volume for USG Sheetrock® brand gypsum wallboard. The decrease in net sales for Ceilings primarily reflected the absence of net sales from our subsidiaries in Asia-Pacific, India, and Oman that were contributed to UBBP on February 27, 2014. Net sales for our Ceiling segment also decreased 2% due to lower volumes on ceiling tile and grid.
25
GROSS PROFIT
Gross profit was $691 million in 2015 compared to $654 million in 2014. The increase was primarily due to increases in volume and average selling prices for nearly all wallboard, surfaces and substrates products, and increases in volume and price for gypsum wallboard sold through our Distribution business. As a percentage of net sales, gross profit was 18.3% in 2015 and 17.6% in 2014. The increase for 2015 compared with 2014 was primarily driven by higher average selling prices and higher volumes.
As a percentage of net sales, gross profit was 17.6% in 2014 and 16.3% in 2013. The increase for 2014 compared with 2013 was primarily driven by higher selling prices for USG Sheetrock®.
SELLING AND ADMINISTRATIVE EXPENSES
Selling and administrative expenses totaled $317 million in 2015, $339 million in 2014 and $320 million in 2013. As a percentage of net sales, selling and administrative expenses decreased to 8.4% in 2015 compared to 9.1% in 2014 and 9.0% in 2013. The reduction in selling and administrative expenses from 2015 to 2014 was driven by management's focus on reducing discretionary spending, partially offset by higher salary, pension and incentive compensation, the absence of a $13 million pension settlement charge recorded in 2014 for our previously frozen U.K. pension plan and lower stock compensation expense driven by lower grant date fair values. Selling and administrative expenses as a percentage of net sales remained consistent at 9.1% in 2014 with 9.0% in 2013.
LITIGATION SETTLEMENT CHARGE
In the third quarter of 2014, we recorded a litigation settlement charge of $48 million related to the settlement of the U.S. wallboard pricing class action lawsuit. See Note 19 to the consolidated financial statements in Part II, Item 8 of this report for additional detail.
LONG-LIVED ASSET IMPAIRMENT CHARGES
Long-lived asset impairment charges were $90 million in 2014. There were no impairment charges on long-lived assets in 2015 or 2013. The charges in 2014 reflect the impairment of $30 million on certain manufacturing facilities and capitalized costs for the construction of future facilities, which we do not anticipate will be built within our planning horizon, and of $60 million on two vessels owned by Gypsum Transportation Limited (GTL). See Notes 12 and 13 to our consolidated financial statements in Part II, Item 8 of this report for additional information related to long-lived asset impairment charges.
CONTRACT TERMINATION CHARGE AND (RECOVERY) LOSS ON RECEIVABLE
In the fourth quarter of 2014, we recorded a charge of $15 million for contract costs related to a lease of an ocean vessel that were to be incurred over the remaining term without economic benefit to us and for a loss on an uncollectible receivable owed to GTL by its trading partner.
In 2015, we recovered $6 million of the previously deemed uncollectible receivable through a settlement agreement. See Note 13 to the consolidated financial statements in Part II, Item 8 of this report for additional information.
GAIN ON DISPOSAL OF SHIPPING OPERATIONS, NET
During the second quarter of 2015, we recorded a net gain on the disposal of our shipping operations of $1 million. This reflects a gain on sale of our two self-unloading vessels of $7 million and charges to wind down our shipping operations of $6 million.
RESTRUCTURING CHARGES
In prior years, we implemented restructuring activities and as a result, recorded restructuring charges of $3 million in 2013. There were no restructuring charges recorded in 2015 or 2014. These charges in 2013 primarily related to salaried workforce reductions.
INCOME (LOSS) FROM EQUITY METHOD INVESTMENTS
Income (loss) from equity method investments was $48 million in 2015, $33 million in 2014, and $(1) million in 2013. The increase from 2014 to 2015 primarily reflects an increase in our share of the net income of UBBP driven by both growth in the business year-over-year and twelve months of equity method income in 2015 and only ten months in 2014. Our share of equity earnings in 2015 was negatively impacted by approximately $8 million due to the strengthening of the U.S. dollar.
The increase from 2013 to 2014 primarily reflects ten months of equity income of $33 million attributable to our share of the net income of UBBP, which commenced on February 27, 2014.
INTEREST EXPENSE
Interest expense was $163 million in 2015, $179 million in 2014 and $203 million in 2013. Lower interest expense in 2015 as compared to 2014 primarily reflects lower debt levels and lower interest rates on our outstanding debt. The decline was driven
26
by the April 2014 conversion of $75 million of our 10% convertible senior notes into common stock, the August 2014 repayment of $59 million of our 9.75% Senior Notes, the February 2015 repurchase of our 8.375% Senior Notes due 2018, the repayment of our ship mortgage facility and lower amortization of deferred financing fees and debt discounts, offset by the issuance of our 5.5% Senior Notes due 2025.
Lower interest expense in 2014 as compared to 2013 primarily reflects the conversion of $325 million and $75 million of our 10% convertible senior notes into common stock in December 2013 and April 2014, respectively, and the repayment of $59 million of our 2014 Notes in August 2014 offset by additional interest expense related to our $350 million of 5.875% senior notes that were issued in October 2013.
INCOME AND GAIN ON SALE FROM EQUITY METHOD INVESTMENT TO RELATED PARTY
On December 22, 2015, we completed the disposition of our 50% share of the Knauf-USG joint venture to Knauf for a total price of €48 million in cash, or approximately $52 million. We recorded a gain of $11 million, or $6 million net of tax, on the disposition of the equity method investment. Our share of the income from the equity method investment from January 1, 2015 through December 22, 2015 amounted to $2 million, which was flat with 2014 and 2013. See Note 3 to our consolidated financial statements in Part II, Item 8 of this report for additional information.
GAIN ON DECONSOLIDATION OF SUBSIDIARIES
In the first quarter of 2014, we recognized a gain of $27 million on the deconsolidation of subsidiaries as a result of our contribution of our wholly-owned subsidiaries in Singapore, India, Malaysia, New Zealand and Australia and our consolidated joint ventures in Oman into UBBP.
LOSS ON EXTINGUISHMENT OF DEBT
In the first quarter of 2015, we recorded a $19 million loss on the extinguishment of debt, including premiums and a write-off of unamortized debt issuance costs, in connection with the tender offer and repurchase of our 8.375% Senior Notes due 2018.
INCOME TAX EXPENSE
Income tax benefit was $729 million in 2015 compared with income tax expense of $7 million in 2014. The income tax benefit in 2015 primarily resulted from the reversal of a substantial portion of our deferred tax asset valuation allowance of $731 million. In addition, tax benefits of $5 million were recorded for recently enacted Federal law changes related to alternative minimum tax credit monetization, or AMT credits. These benefits recorded were offset slightly by tax expense for certain foreign, state and local jurisdictions of $7 million. Due to the effects of reversing our deferred tax asset valuation allowance, our effective tax rate for 2015 is abnormally low. See further discussion of the release of our valuation allowance below under "Realization of Deferred Tax Asset". In 2016, our income tax provision on our domestic earnings in our consolidated statement of operations will not be offset by a corresponding change in the valuation allowance. Thus, our income tax provision will result in a charge to earnings.
Income tax expense was $7 million in 2014 compared with $11 million in 2013. Our effective tax rate in 2014 was 15.3%. Income tax expense in 2014 primarily reflects income taxes for certain foreign, state and local jurisdictions of $9 million, which includes $2 million of withholding taxes between foreign jurisdictions, offset by an income tax benefit of $2 million from accumulated other comprehensive income (loss) related to the settlement of a pension plan for which we recorded a $13 million charge in 2014.
The effective tax rate based on our income (loss) from continuing operations was 18.6% for 2013. Income tax expense in 2013 primarily reflects income taxes for certain foreign, state and local jurisdictions of $14 million, including $6 million of withholding taxes on dividends between foreign jurisdictions, partially offset by an income tax benefit of $3 million recorded in the first quarter of 2013, which primarily related to the release of the valuation allowance against a portion of our alternative minimum tax, or AMT, credits. This change in the realizability of those credits was due to the enactment of the American Taxpayer Relief Act of 2012.
27
Segment Results of Operations
GYPSUM
Net sales and operating profit (loss) for the businesses comprising our Gypsum segment were as follows:
Favorable (Unfavorable) | |||||||||||||||||||||||||
2015 vs. 2014 | 2014 vs. 2013 | ||||||||||||||||||||||||
(millions) | 2015 (a) | 2014(b) | 2013(c) | $ | % | $ | % | ||||||||||||||||||
Net Sales: | |||||||||||||||||||||||||
United States | $ | 2,012 | $ | 1,920 | $ | 1,765 | $ | 92 | 5 | % | $ | 155 | 9 | % | |||||||||||
Canada | 321 | 344 | 348 | (23 | ) | (7 | )% | (4 | ) | (1 | )% | ||||||||||||||
Mexico / Latin America | 187 | 195 | 197 | (8 | ) | (4 | )% | (2 | ) | (1 | )% | ||||||||||||||
Gypsum Transportation Limited | 10 | 81 | 81 | (71 | ) | (88 | )% | — | * | ||||||||||||||||
Canadian Mining | 6 | 5 | 8 | 1 | 20 | % | (3 | ) | (38 | )% | |||||||||||||||
Eliminations | (139 | ) | (142 | ) | (137 | ) | 3 | 2 | % | (5 | ) | (4 | )% | ||||||||||||
Total | $ | 2,397 | $ | 2,403 | $ | 2,262 | $ | (6 | ) | — | % | $ | 141 | 6 | % | ||||||||||
Operating Profit (Loss): | |||||||||||||||||||||||||
United States | $ | 316 | $ | 192 | $ | 214 | $ | 124 | 65 | % | $ | (22 | ) | (10 | )% | ||||||||||
Canada | 7 | 13 | 17 | (6 | ) | (46 | )% | (4 | ) | (24 | )% | ||||||||||||||
Mexico / Latin America | 24 | 19 | 21 | 5 | 26 | % | (2 | ) | (10 | )% | |||||||||||||||
Gypsum Transportation Limited | 7 | (52 | ) | 20 | 59 | * | (72 | ) | * | ||||||||||||||||
Canadian Mining | (6 | ) | (3 | ) | (10 | ) | (3 | ) | (100 | )% | 7 | * | |||||||||||||
Eliminations | — | — | (1 | ) | — | * | 1 | 100 | % | ||||||||||||||||
Total | $ | 348 | $ | 169 | $ | 261 | $ | 179 | * | $ | (92 | ) | (35 | )% | |||||||||||
* | Not meaningful |
(a) | Operating profit in 2015 includes $1 million for the net gain on sale of the ships and costs to wind-up the Gypsum Transportation Limited business, a $6 million recovery of a portion of the receivable deemed uncollectible in 2014 and a pre-tax gain on the sale of assets in Mexico of $10 million ($7 million net of tax). |
(b) | Operating profit in 2014 included a litigation charge of $48 million, which relates to the United States, long-lived asset impairment charges of $90 million, of which $30 million relates to United States and $60 million relates to Gypsum Transportation Limited, and contract termination and loss on receivable of $15 million, which relates to Gypsum Transportation Limited. |
(c) | Operating profit in 2013 included restructuring charges of $3 million, which all related to United States, and pension settlement charges of $9 million, which primarily related to United States. |
UNITED STATES
2015 COMPARED WITH 2014
Net sales in 2015 increased $92 million, or 5%, compared with 2014. The net sales increase was due to the following:
Sales | Volume | Price | |||||||||||||
(millions) | $ | % | $ | % | $ | % | |||||||||
Change to 2015 from 2014 | |||||||||||||||
Sheetrock® brand gypsum wallboard | 33 | 4 | % | 19 | 2 | % | 14 | 2 | % | ||||||
Sheetrock® brand joint compound | 19 | 6 | % | 14 | 5 | % | 5 | 1 | % | ||||||
Durock® brand cement board | 10 | 9 | % | 4 | 4 | % | 6 | 5 | % | ||||||
Roof board | 8 | 18 | % | 8 | 18 | % | — | — | |||||||
Levelrock® brand poured flooring | 8 | 18 | % | 8 | 18 | % | — | — | |||||||
Other | 14 | 10 | % | ||||||||||||
Total increase in net sales | $ | 92 | 5 | % | |||||||||||
Net sales of USG Sheetrock® brand gypsum wallboard increased $33 million, or 4%, reflecting 2% increases in both volume and average gypsum wallboard selling prices. The increase in volume was driven by higher demand in nearly all channels, with the increase in average selling prices driven by the price increase put in place on January 1, 2015.
28
Sales of Sheetrock® brand joint compound increased $19 million driven largely by increased volume to specialty dealers and big box retailers and a 1% increase in average selling prices due to the price increase that was effective in the first quarter of 2015. Durock® brand cement board sales increased $10 million which reflected both higher volumes through big box retailers, flooring customers and specialty dealers and higher average selling price due to the price increase that was effective in the first quarter of 2015. Sales of roof board and Levelrock® increased by $16 million primarily driven by higher volume for Gyp-Fiber roof boards, Glass-Mat roof boards and Levelrock® poured flooring. The increase in Other reflected higher sales of other products of $14 million, which was due to product mix and other surfaces and substrates products, none of which were individually significant.
Operating profit was $316 million in 2015 and $192 million in 2014, or a $124 million increase. Of this increase, $66 million reflects the absence from 2015 of certain items recorded in 2014 and further discussed below. The remaining operating profit increase of $58 million reflects the following:
Operating Profit | Volume | Price | Cost | ||||||||||||
(millions) | $ | $ | $ | $ | |||||||||||
Change to 2015 from 2014 | |||||||||||||||
Sheetrock® brand gypsum wallboard | $ | 37 | $ | 8 | $ | 14 | $ | 15 | |||||||
Sheetrock® brand joint compound | 11 | 3 | 5 | 3 | |||||||||||
Durock® brand cement board | 2 | 1 | 5 | (4 | ) | ||||||||||
Roof board | 4 | 2 | — | 2 | |||||||||||
Other gypsum products | 4 | ||||||||||||||
Other | 66 | ||||||||||||||
Total increase in operating profit | $ | 124 | |||||||||||||
Of the increase of $124 million, $66 million was driven by the absence in 2015 of a litigation charge of$48 million due to the settlement of the U.S. wallboard pricing class action lawsuit, long-lived asset impairment charges of $30 million related to certain manufacturing facilities and capitalized costs for the construction of future facilities, which we do not anticipate will be built within our planning horizon, and a gain of $12 million on the sale of surplus property.
The remaining $58 million improvement in operating profit in 2015 was driven by gross profit improvement of the products reflected above, with:
• | Higher volume of 2%, driven by big box retailers and specialty dealers, higher selling prices for USG Sheetrock® brand gypsum wallboard, and lower per unit costs; |
• | Higher volume of 5%, driven by specialty dealers and big box retailers, and higher selling prices for USG Sheetrock® brand joint compound and lower per unit costs of 1%; |
• | 4% higher volumes for Durock® brand cement board through big box retailers, flooring customers and specialty dealers and higher selling prices, including freight, largely offset by an increase of per unit costs of 5%; |
• | Gyp-Fiber and Glass-Mat roof board higher volumes and per unit cost improvement. |
Manufacturing costs per unit improved for USG Sheetrock® brand gypsum wallboard driving $15 million of increased operating profit. The improved operating profit was largely driven by a reduction in energy costs led the decline in per dekatherm ("Dth") cost of natural gas. The reduction in energy costs was also driven by lower usage as a result of operational initiatives. Higher conversion and fixed costs, largely attributable to increased employee costs offset some of these energy savings. Durock® cost per unit was up from 2014 driven by increases in prices of raw materials and increased transportation costs. Per unit manufacturing costs for joint compound declined driven by a decrease in costs of raw materials, primarily in packaging where the cost of resin declined due to the continued decrease in the price of oil, and an increase in volumes, offset by increased employee costs.
As a percentage of sales, selling and administrative expenses declined by 20 basis points, with management’s continued focus to reduce spending which offset higher employee, salary and incentive compensation expense compared to 2014.
New housing construction increased in 2015, resulting in increased demand for gypsum wallboard, as discussed above. U.S. Gypsum shipped 5.44 billion square feet of USG Sheetrock® brand gypsum wallboard in 2015, a 2% increase from 5.33 billion square feet in 2014. During 2015, USG Sheetrock® Brand UltraLight Panels accounted for 65% of all of our wallboard shipments in the United States. We estimate that industry capacity utilization rates averaged approximately 68% during 2015, while U.S. Gypsum’s capacity utilization rate averaged 57%.
29
2014 COMPARED WITH 2013
Net sales in 2014 increased $155 million, or 9%, compared with 2013. Net sales of USG Sheetrock® brand gypsum wallboard increased $91 million, or 11%, reflecting an 8% increase in average gypsum wallboard selling prices, which increased sales by $62 million, and a 4% increase in gypsum wallboard shipments, which contributed $29 million to net sales. Net sales of Sheetrock® brand joint compound were up $16 million due to a 4% increase in volume and a 1% increase in selling prices. Net sales of Durock® brand cement board increased $6 million due to a 7% increase in volume offset by a 1% decrease in price. Net sales of other products, including freight, increased an aggregate of $45 million compared with 2013. Offsetting these increases are lower sales of Fiberock® brand gypsum fiber panels of $2 million primarily due to a 4% decrease in volume and a 2% decrease in price and an increase in sales discounts of $1 million due primarily to higher sales.
Operating profit was $192 million in 2014 and $214 million in 2013. The decrease includes a litigation settlement charge of $48 million due to the settlement of the U.S. wallboard pricing class action lawsuit and impairment charges of $30 million related to certain manufacturing facilities and capitalized costs for the construction of future facilities, which we do not anticipate will be built within our planning horizon. The decrease also includes a $9 million charge from the mark-to-market of our natural gas hedges due to the decrease in natural gas price and additional cost and overhead expenses, including $16 million of employee related costs, $3 million of professional fees, $2 million in marketing costs, $3 million of depreciation and accretion, $4 million of freight charges, $3 million of other plant costs and $4 million of other miscellaneous costs. Offsetting these costs is an increase in gross profit of $78 million due to the following: (a) a gross profit increase of $68 million for USG Sheetrock® brand gypsum wallboard primarily due to higher volume and selling prices of 4% and 8%, respectively, partially offset by higher per unit costs of 1%, (b) a gross profit increase of $3 million for Sheetrock® brand joint compound primarily due to higher volume of 4% and selling prices of 1%, partially offset by higher per unit costs of 1%, (c) a gross profit increase of $1 million for Durock® brand cement board primarily due to increased volume of 7% offset by decreased price of 1% and unchanged per unit costs, and (d) a gross profit increase of $7 million for our other gypsum products, offset by a decrease of $1 million in Fiberock® brand gypsum fiber panels due to the decreased volume of 4% and price of 2% offset by lower per unit costs of 1%. Also contributing to the offset of the increased costs were lower information technology costs of $1 million, the absence of a pension settlement charge of $9 million that was recorded in 2013 and a gain of $12 million on sale of surplus property.
New housing construction increased in 2014, resulting in increased demand for gypsum wallboard, as discussed above. U.S. Gypsum shipped 5.33 billion square feet of USG Sheetrock® brand gypsum wallboard in 2014, a 4% increase from 5.14 billion square feet in 2013. During 2014, USG Sheetrock® Brand UltraLight Panels accounted for 63% of all of our wallboard shipments in the United States. We estimate that industry capacity utilization rates averaged approximately 66% during 2014, while U.S. Gypsum’s capacity utilization rate averaged 56%.
Manufacturing costs per unit increased 1% for USG Sheetrock® brand gypsum wallboard in 2014 compared with 2013, due primarily to an increase of 6% for conversion costs primarily due to labor costs partially offset by lower man hour usage and 5% for energy due primarily to increased cost of energy in the first quarter due to colder than normal weather offset by per unit cost decreases of 6% for fixed costs reflecting favorable impact from higher volumes.
CANADA
2015 COMPARED WITH 2014
Net sales in 2015 were $321 million compared to net sales in 2014 of $344 million. This reduction in net sales was driven by a $41 million negative impact due to the strengthening of the U.S. Dollar. The foreign currency impact was partially offset by an increase in net sales of wallboard of $26 million driven by increases in volume and selling prices of 6%.
Operating profit was $7 million in 2015 compared with $13 million in 2014. This $6 million decline is driven by a $13 million unfavorable impact of foreign currency, $3 million lower joint treatment profit driven by a reduction in volume and 13% higher cost offset by an improvement in wallboard volume and selling prices as noted above. Also contributing to the decline in operating profit is the increase in miscellaneous costs driven by higher employee costs. Selling and administrative expenses remained flat as a percentage of sales.
30
2014 COMPARED WITH 2013
Net sales in 2014 were $344 million compared to net sales in 2013 of $348 million. This decrease of $4 million includes an unfavorable impact of currency translation of $23 million due to the weakening of the Canadian Dollar to the U.S. Dollar and an unfavorable change in cash discounts recorded of $1 million. Offsetting this decrease are $17 million of higher net sales for Sheetrock® brand gypsum wallboard due to a 6% increase in volume offset by a 4% decrease in price, higher net sales of other non-wallboard products of $1 million and increased outbound freight of $2 million.
Operating profit was $13 million in 2014 compared with $17 million in 2013. This $4 million decrease reflects $2 million of lower gross profit for joint treatment products, $1 million of lower gross profit for other non-wallboard products and an unfavorable impact due to currency translation of $1 million.
MEXICO / LATIN AMERICA
2015 COMPARED WITH 2014
Net sales in Mexico and Latin America were $187 million in 2015 compared with $195 million in 2014. The decrease of $8 million in sales was driven by the strengthening of the U.S. Dollar, which negatively impacted net sales by approximately $16 million, which was offset by an increase in both wallboard volume and price.
Operating profit was $24 million in 2015 compared with $19 million in 2014. The increase of $5 million is driven by the realization of a pre-tax gain of $10 million ($7 million net of tax) on the disposition of surplus property in Mexico that was completed in December 2015, improvement in energy pricing and operational efficiencies derived from Lean Six Sigma projects. Offsetting this increase was the unfavorable impact of foreign currency of approximately $6 million.
2014 COMPARED WITH 2013
Net sales for business in Mexico and Latin America were $195 million in 2014 compared with $197 million in 2013. The decrease of $2 million in sales includes an unfavorable impact due to currency translation of $7 million primarily due to the weakening of the Mexican Peso to the U.S. Dollar and a decrease in gypsum wallboard of $6 million due to lower volumes in Mexico and a decrease in price in Latin America. Offsetting these decreases is a $2 million increase in Durock® due to increased volume and price, a $2 million increase in joint treatment due to increased volume and price, and a $7 million increase in other non-wallboard products due primarily to higher volume of industrial gypsum and Fiberock®.
Operating profit was $19 million in 2014 compared with $21 million in 2013. The decrease of $2 million includes unfavorable currency translation of $1 million. Also contributing to the decline in operating profit was a $4 million decrease in gypsum wallboard and a $1 million decrease in drywall steel. These declines were offset by a $1 million increase in joint treatment, a $2 million increase in Durock®, and a $1 million increase in other products. Selling and administrative expenses were unchanged year over year.
GYPSUM TRANSPORTATION LIMITED
Net sales for our shipping company, Gypsum Transportation Limited, or GTL, were $10 million in 2015 as compared to $81 million in 2014. The decrease of $71 million reflects the cancellation of a contract of affreightment in the fourth quarter of 2014 when our trading partner ceased performing under the contract. In 2015, we were party to a short term shipping contract prior to the sale of our two self-unloading vessels in April 2015.
Operating profit went from a loss of $52 million in 2014 to operating profit of $7 million in 2015. The profit in 2015 includes $1 million of operating profit recorded in second quarter of 2015 reflecting the gain on the sale of our ships offset by charges incurred to wind down our shipping operations and a $6 million recovery of a portion of the receivable owed to GTL by its trading partner that was fully reserved for in 2014. See Note 13 to the consolidated financial statements in Part II, Item 8 of this report for additional information.
Net sales were flat in 2014 compared with 2013. Operating profit decreased $72 million from $20 million in 2013 to an operating loss of $52 million in 2014. The decrease reflects the 2014 long-lived asset impairment charge of $60 million on the two shipping vessels owned by GTL and a $15 million charge for contract costs related to a lease of an ocean vessel that were to be incurred over the remaining term without economic benefit to us and a loss on an uncollectible receivable owed to GTL by its trading partner which has since been partially recovered.
CANADIAN MINING
Net sales for our mining operation in Little Narrows, Nova Scotia, Canada, were $6 million in 2015, $5 million in 2014, and $8 million in 2013. Operating loss was $6 million in 2015, $3 million in 2014, and $10 million in 2013. 2014 included a reduction to the estimates of reclamation activities required for our mining operations in Canada that did not recur in 2015.
31
CEILINGS
Net sales and operating profit for the businesses comprising our Ceilings segment were as follows:
Favorable (Unfavorable) | |||||||||||||||||||||||||
2015 vs. 2014 | 2014 vs. 2013 | ||||||||||||||||||||||||
(millions) | 2015 | 2014 | 2013(b) | $ | % | $ | % | ||||||||||||||||||
Net Sales: | |||||||||||||||||||||||||
United States | $ | 467 | $ | 464 | $ | 471 | $ | 3 | 1 | % | $ | (7 | ) | (1 | )% | ||||||||||
USG International (a) | — | 7 | 51 | (7 | ) | (100 | )% | (44 | ) | (86 | )% | ||||||||||||||
Canada | 51 | 57 | 61 | (6 | ) | (11 | )% | (4 | ) | (7 | )% | ||||||||||||||
Mexico / Latin America | 36 | 39 | 39 | (3 | ) | (8 | )% | — | * | ||||||||||||||||
Eliminations | (55 | ) | (54 | ) | (54 | ) | (1 | ) | (2 | )% | — | * | |||||||||||||
Total | $ | 499 | $ | 513 | $ | 568 | $ | (14 | ) | (3 | )% | $ | (55 | ) | (10 | )% | |||||||||
Operating Profit: | |||||||||||||||||||||||||
United States | $ | 81 | $ | 74 | $ | 81 | $ | 7 | 9 | % | $ | (7 | ) | (9 | )% | ||||||||||
USG International (a) | — | — | (3 | ) | — | * | 3 | 100 | % | ||||||||||||||||
Canada | 3 | 6 | 11 | (3 | ) | (50 | )% | (5 | ) | (45 | )% | ||||||||||||||
Mexico / Latin America | 5 | 7 | 9 | (2 | ) | (29 | )% | (2 | ) | (22 | )% | ||||||||||||||
Total | $ | 89 | $ | 87 | $ | 98 | $ | 2 | 2 | % | $ | (11 | ) | (11 | )% | ||||||||||
* not meaningful | |||||||||||||||||||||||||
(a) | USG International’s net sales and operating profit for the year ended December 31, 2014 include the results of our wholly-owned subsidiaries and consolidated joint ventures that were contributed to UBBP through February 27, 2014. The comparative 2013 period include the results of those entities for the full year presented. |
(b) | Operating profit for 2013 included a pension settlement charge of $2 million. |
UNITED STATES
2015 COMPARED WITH 2014
Net sales for our domestic ceilings business increased to $467 million in 2015, a $3 million, or 1%, increase from $464 million in 2014. The increase reflected the following:
Sales | Volume | Price | |||||||||||||||
(millions) | $ | % | $ | % | $ | % | |||||||||||
Change to 2015 from 2014 | |||||||||||||||||
Ceiling grid | $ | 1 | 1 | % | $ | 1 | 1 | % | $ | — | — | % | |||||
Ceiling tile | 2 | 1 | % | (1 | ) | — | % | 3 | 1 | % | |||||||
Total increase in net sales | $ | 3 | 1 | % | |||||||||||||
The increase in sales for ceiling tile was driven by a price increase implemented in the first quarter of 2015 which was partially offset by a reduction in volume.
32
Operating profit of $81 million in 2015 increased $7 million, or 9%, The increase reflected the following:
Operating Profit | Volume | Price | Cost | ||||||||||||
(millions) | $ | $ | $ | $ | |||||||||||
Change to 2015 from 2014 | |||||||||||||||
Ceiling grid | $ | 1 | $ | 1 | $ | — | $ | — | |||||||
Ceiling tile | 5 | (1 | ) | 3 | 3 | ||||||||||
Other | 1 | ||||||||||||||
Total increase in operating profit | $ | 7 | |||||||||||||
The increase in operating profit reflects the improvement in price and cost for ceiling tile with the price contribution driven primarily by the implementation of an increase in average selling price during the first quarter of 2015. The reduction in cost is largely driven by lower per unit cost for ceiling tile reflecting lower energy costs, raw material and fixed costs lead by decreases in natural gas prices and wool costs, partially offset by increases in employee costs. Other includes savings from lower selling and administrative expenses, which as a percentage of sales declined by 40 basis points, driven by management’s continued focus to reduce spending which offset higher employee salary and incentive compensation expense compared to 2014.
2014 COMPARED WITH 2013
Net sales for our domestic ceilings business decreased to $464 million in 2014, a $7 million, or 1%, decrease from $471 million in 2013. This decrease reflected lower sales of $7 million for ceiling grid and $2 million for other product lines offset by increased sales of $2 million for ceiling tile. The decrease in sales of ceiling grid was primarily attributable to an decrease in volume of 8%, or $12 million, offset by an improvement in average realized selling prices of 4%, which favorably affected sales by $5 million. The decrease in sales volume for ceiling grid reflects the impact of extreme weather conditions in the United States during the early part of 2014 and the unfavorable impact of higher sales related to demand pull-forward in the fourth quarter of 2013. The increase in sales of ceiling tile reflected higher average realized selling prices of 4%, which favorably affected sales by $9 million, partially offset by a 3% decrease in ceiling tile volume, which adversely affected sales by $7 million.
Operating profit of $74 million in 2014 declined $7 million, or 9%. The decrease in operating profit was attributable to a $3 million and $4 million decrease in gross profit for ceiling grid and ceiling tile, respectively, $2 million in plant costs and $6 million for miscellaneous and overhead costs. The decrease in gross profit for ceiling grid reflects a 8% decrease in volume and a 2% increase in per unit cost offset by a 4% increase in price. The decrease in gross profit for ceiling tile reflects a decrease in volume of 3% and an increase in per unit cost of 6% offset by an increase in price of 4%. The increase in per unit cost for both ceiling tile and grid reflect higher conversion and energy costs due to lower volume and seasonal gas usage and non-routine maintenance. Offsetting the decrease was the absence of $6 million of environmental charges and $2 million of pension settlement charges recorded in 2013.
USG INTERNATIONAL
Net sales in 2014 for USG International, which consists only of the results of our wholly-owned subsidiaries in the Asia-Pacific region and India and our consolidated joint ventures in Oman, were $7 million, a decrease of $44 million, or 86%, compared to 2013. The decrease reflects the contribution of these entities as part of our investments in UBBP in February 2014. Therefore, results for USG International represent the net sales and operating profit (loss) for those entities for two months in 2014 and a full year for 2013. Operating profit for USG International was $0 million in 2014 compared to a $3 million operating loss in 2013 which is also reflective of the contribution of our subsidiaries and consolidated joint ventures as part of our investments in UBBP.
CANADA
2015 COMPARED WITH 2014
Net sales in 2015 were $51 million, a decrease of $6 million, or 11%, compared with 2014. The decrease includes an unfavorable currency impact of $6 million due to the strengthening of the U.S. Dollar. Net sales also included a decrease in ceiling grid sales of approximately $2 million offset by an increase of $3 million in sales of ceiling tile and outbound freight.
Operating profit was $3 million in 2015 and $6 million in 2014, a decrease of $3 million, which primarily reflected declines in operating profit of $1 million for ceiling grid due to decline in grid volumes and an increase in grid cost and $1 million for ceiling tile driven by foreign currency which was partially offset by a 2% increase in tile volume. Selling and administrative expenses as a percentage of sales remained flat from 2015 as compared to 2014.
33
2014 COMPARED WITH 2013
Net sales in 2014 were $57 million, a decrease of $4 million, or 7%, compared with 2013. The decrease includes an unfavorable currency translation of $4 million due to the weakening of the Canadian Dollar as compared to the U.S. Dollar. Net sales also included a decrease in ceiling grid sales of approximately $1 million offset by an increase of $1 million in outbound freight.
Operating profit was $6 million in 2014 and $11 million in 2013, a decrease of $5 million, which primarily reflected increased costs and lower gross margins of $2 million for ceiling grid and $2 million for ceiling tile. The decrease also includes an unfavorable currency translation of $1 million. Selling and administrative expenses were unchanged from 2014 as compared to 2013.
MEXICO / LATIN AMERICA
2015 COMPARED WITH 2014
Net sales in 2015 declined $3 million from 2014 to $36 million which primarily reflects a negative impact of foreign currency due to the strengthening of the U.S. Dollar.
Operating profit in 2015 decreased $2 million from $7 million in 2014. This decrease reflects a negative impact of foreign currency due to the strengthening of the U.S. Dollar, partially offset by improvement in energy pricing and operational efficiencies derived from Lean projects. Selling and administrative expenses remained unchanged as a percentage of sales.
2014 COMPARED WITH 2013
Net sales in 2014 were unchanged from 2013 at $39 million which reflects an increase of $1 million in ceiling grid due to increases in both volume and price offset by unfavorable currency translation of $1 million.
Operating profit in 2014 decreased $2 million from $9 million in 2013. This decrease reflects increase cost for ceiling grid of approximately $2 million. Selling and administrative expenses remained unchanged from 2013 to 2014.
DISTRIBUTION
Net sales and operating profit for our Distribution segment, which consists of L&W Supply, were as follows:
Favorable (Unfavorable) | |||||||||||||||||||||||||
2015 vs. 2014 | 2014 vs. 2013 | ||||||||||||||||||||||||
(millions) | 2015 | 2014 | 2013(a) | $ | % | $ | % | ||||||||||||||||||
Net sales | $ | 1,428 | $ | 1,345 | $ | 1,245 | $ | 83 | 6 | % | $ | 100 | 8 | % | |||||||||||
Operating profit | 27 | 16 | 6 | 11 | 69 | % | 10 | * | |||||||||||||||||
* not meaningful | |||||||||||||||||||||||||
(a) | The operating profit for 2013 includes a $1 million reduction to previously accrued restructuring charges and $3 million of pension settlement charges. |
2015 COMPARED WITH 2014
Net sales in 2015 increased $83 million compared with 2014. Net sales of gypsum wallboard increased $44 million reflecting a 2% increase in average gypsum wallboard selling prices and a 6% increase in gypsum wallboard shipments. The improvement also included an increase of $9 million, or 4%, for metal products, $5 million, or 7%, for joint treatment products, $2 million, or 1%, for ceilings products, and $23 million, or 8%, for other products. Same-location net sales for 2015 were up 6% compared with 2014.
Operating profit was $27 million in 2015 compared with $16 million in 2014. The improvement of $11 million was primarily attributed to an increase in gross profit of $12 million, or 11%, for gypsum wallboard due to increases in volume of 6% and selling price of 2%, partially offset by an increase in cost. Although both delivery and branch overhead expenses were up year over year, as a percentage of net sales, they remained flat. Selling and administrative expenses were slightly down, although as a percentage of sales, they remained at 1%.
2014 COMPARED WITH 2013
Net sales in 2014 increased $100 million compared with 2013. Net sales of gypsum wallboard increased $60 million, or 14%, reflecting a 8% increase in average gypsum wallboard selling prices and a 6% increase in gypsum wallboard shipments. The improvement also included an increase of $11 million, or 5%, for ceilings products, $6 million, or 2%, for metal products, $5 million, or 8%, for joint treatment products, and $18 million, or 7%, for other products. Same-location net sales for 2014 were up 7% compared with 2013.
34
Operating profit was $16 million in 2014 compared with $6 million in 2013. The improvement of $10 million was primarily attributed to an increase in gross profit of $10 million, or 5%, for gypsum wallboard due to an increase in volume and selling price partially offset by an increase in cost. Also increasing operating profit is a reimbursement of $2 million from Knauf Plasterboard for Chinese wallboard claims and the absence of $3 million of pension settlement charges offset by other overhead costs of $5 million. As a percentage of sales, selling and administrative expenses remained at 1%.
USG BORAL BUILDING PRODUCTS
UBBP is the 50/50 joint ventures with Boral and is accounted for as equity method investments, as such net sales and operating profit are not recorded in the consolidated financial statements of USG. The following reflects the net sales and operating profit as recorded by UBBP and the equity income recorded by USG:
Favorable (Unfavorable) | ||||||||||||||||||||
2015 vs. 2014 | 2014 vs. 2013 | |||||||||||||||||||
(millions) | 2015 | 2014 (a) | 2013 | $ | % | $ | % | |||||||||||||
Net sales | $ | 1,003 | $ | 927 | N/A | $ | 76 | 8 | % | * | * | |||||||||
Operating profit | 124 | 95 | N/A | 29 | 31 | % | * | * | ||||||||||||
Income from equity method investments - UBBP | 48 | 33 | N/A | 15 | 45 | % | * | * | ||||||||||||
* not meaningful | ||||||||||||||||||||
(a) | Operating results are presented for UBBP for the ten months ended December 31, 2014. |
Operations commenced on February 27, 2014, as such, our 2015 consolidated statement of operations is the first full year of our share of equity method income, while 2014 includes our share of 10 months of equity method income. See Note 3 to our consolidated financial statements included in Part II, Item 8 of this report.
2015 COMPARED WITH 2014
Net sales for UBBP in 2015 surpassed $1 billion, plasterboard shipments were 4.4 billion square feet, operating profit was $124 million and net income attributable to UBBP was $96 million, compared to 2014 where sales, shipments, operating profit and net income attributable to UBBP were $927 million, 3.83 billion square feet, $95 million and $67 million, respectively. The strengthening of the U.S. Dollar from 2014 to 2015 negatively impacted UBBP's net sales and net income by $105 million and $16 million, respectively.
UBBP's results included sales of USG Boral Sheetrock®, which leverages the technology in USG Sheetrock®, in Australia, South Korea, Indonesia, Vietnam, China and Thailand. UBBP is able to sell USG Boral Sheetrock® at a premium price and, in some markets, conversion rates have surpassed 10%, while in Australia the conversion rate is above 30%. Net sales in Asia and Australasia made up approximately 66% and 34%, respectively, of total net sales for UBBP. Net sales in China, Indonesia, South Korea and Thailand represented approximately 81% of Asia's net sales. Net sales in Australia represented almost all of Australasia's net sales.
Our share of equity income from USG Boral was $48 million in 2015 compared to $33 million in 2014. The increase from 2014 to 2015 primarily is driven by both growth in the business year over year and twelve months of equity method income in 2015 compared to ten months in 2014. The increase from 2014 was negatively impacted by approximately $8 million due to the strengthening of the U.S. Dollar.
2014
Income from equity method investments in our consolidated statement of operations for the year ended December 31, 2014 included $33 million representing 10 months of our share of the net income of UBBP. Our income from equity method investments for the year ended December 31, 2014 included approximately $2 million, net of tax, of costs representing our share of UBBP's restructuring charges.
For the ten month period from February 27, 2014 to December 31, 2014, net sales for UBBP were $927 million, plasterboard shipments were 3.83 billion square feet, operating profit was $95 million and net income attributable to UBBP was $67 million. UBBP's results included sales from the launch of USG Boral Sheetrock®, which leverages the technology in USG Sheetrock®, in Australia, South Korea and Thailand. UBBP is able to sell USG Boral Sheetrock® at a premium price and, in some markets, conversion rates have surpassed 10%. Net sales in Asia and Australasia made up approximately 65% and 35%, respectively, of total net sales for UBBP. Net sales in China, Indonesia, South Korea and Thailand represented approximately 83% of Asia's net sales and plasterboard revenue accounted for approximately 70% of Asia's net sales. Net sales in Australia represented almost all of Australasia's net sales. Results for UBBP included $7 million ($5 million, net of tax) of restructuring costs incurred in the second quarter of 2014.
35
CORPORATE
Operating expenses for Corporate were $95 million in 2015, $109 million in 2014 and $93 million in 2013. The decrease in 2015 compared to 2014 reflects the absence of a pension settlement charge of $13 million for our previously frozen U.K. pension plan recorded in 2014 with further reductions driven by management’s continued focus to reduce spending, lower stock compensation expense due to lower grant date fair value offset by higher employee salary, benefit and incentive compensation expense compared to 2014.
The increase in expenses in 2014 compared to 2013 primarily reflected a pension settlement charge of $13 million recorded in 2014 for our previously frozen pension plan at our subsidiary in the U.K. compared to a $1 million settlement charge recorded in 2013 for the U.S. plan. Also impacting operating expenses for Corporate were increases in stock compensation expense related to higher fair value of awards on grant date and in expenses related to upgrades to our information technology which were offset by a decrease in incentive compensation.
Liquidity and Capital Resources
LIQUIDITY
As of December 31, 2015, we had $672 million of cash and cash equivalents and marketable securities compared with $382 million as of December 31, 2014. Our total liquidity was $967 million as of December 31, 2015 (including $295 million of borrowing availability under our credit facility) compared to $673 million as of December 31, 2014 (including $291 million of borrowing availability under our credit facility). The increase is attributable to our improved operating results in 2015, the disposition of non-core assets and lower interest expense relative to 2014.
We invest in cash equivalents and marketable securities pursuant to an investment policy that has preservation of principal as its primary objective. The policy includes provisions regarding diversification, credit quality and maturity profile that are designed to minimize the overall risk profile of our investment portfolio. The securities in the portfolio are subject to normal market fluctuations. See Note 4 to the consolidated financial statements in Part II, Item 8 of this report for additional information regarding our investments in marketable securities.
Total debt, as of December 31, 2015, consisted of senior notes and industrial revenue bonds and, as of December 31, 2014, our outstanding borrowings under our ship mortgage facility. Total debt amounted to $2.175 billion ($2.189 billion in aggregate principal amount less $14 million of unamortized original issue discount and debt issuance costs) as of December 31, 2015 and $2.195 billion ($2.210 billion in aggregate principal amount less $15 million of unamortized original issue discount and debt issuance costs) as of December 31, 2014. As of December 31, 2015 and during the year then ended, there were no borrowings under our revolving credit facility. See Note 6 to the consolidated financial statements in Part II, Item 8 of this report for additional information about our debt.
Our senior notes and industrial revenue bonds are rated by the three major credit-rating agencies: Moody’s Investors Service (Moody’s), Standard & Poor’s Financial Services LLC (S&P), and Fitch Ratings, Inc. (Fitch). The ratings are typically monitored by stockholders, creditors, or suppliers as an indicator of the company's viability. Additionally, the ratings of Moody’s and S&P impact the interest rate on our 7.75% senior notes maturing in 2018. See Note 6 to the consolidated financial statements in Part II, Item 8, of this report for additional information regarding the impact of changes to our credit ratings on interest rates. Below is a summary of the ratings published by the three agencies as of the date indicated:
S&P | Moody's | Fitch | ||||
Corporate/Family rating | BB- | B1 | B+ | |||
Outlook | Stable | Positive | Stable | |||
Guaranteed senior notes | BB+ | B1 | BB | |||
All other notes and bonds | B | B3 | B+ | |||
Report date | December 8, 2015 | August 8, 2015 | November 8, 2015 | |||
In 2014, we amended and restated our credit facility in order to, among other things, join CGC as a party and to increase the maximum borrowing limit under the credit agreement from $400 million to $450 million (including a $50 million borrowing sublimit for CGC). As amended and restated, the credit agreement allows for the borrowing of revolving loans and issuance of letters of credit (up to a maximum of $200 million at any time outstanding, in aggregate) to USG and its subsidiaries. The maximum principal amount of revolving loans and letters of credit that may be borrowed by USG may not exceed the lesser of (1) $450 million less the amount of outstanding loans and letters of credit owed by CGC and (2) the excess of (a) the domestic borrowing base determined by reference to the trade receivables and inventory of USG and its significant domestic subsidiaries minus (b) the amount, if any, by which the outstanding balance of loans and letters of credit owed by CGC exceeds the CGC borrowing base determined by reference to the trade receivables and inventory of CGC and certain
36
Canadian subsidiaries at such time. The maximum principal amount of revolving loans and letters of credit that may be borrowed by CGC at any time may not exceed the lesser of (1) $50 million and (2) the sum of the CGC borrowing base determined by reference to the trade receivables and inventory of CGC and certain Canadian subsidiaries, plus the domestic borrowing base determined by reference to the trade receivables and inventory of USG and its significant domestic subsidiaries, minus the amount of outstanding loans and letters of credit owed by USG at such time.
USG's obligations under the credit facility are guaranteed by USG and its significant domestic subsidiaries and secured by their and USG’s trade receivables and inventory. CGC's obligations under the credit facility are secured by trade receivables and inventory of certain subsidiaries. The credit facility matures on October 22, 2019 unless terminated earlier in accordance with its terms. The credit facility is available to fund working capital needs and for other general corporate purposes.
The credit agreement contains a financial covenant that would require us to maintain a minimum fixed charge coverage ratio of not less than 1.0 to 1.0 if the excess of the availability (as defined in the credit agreement) is less than an amount equal to 10% of the lesser of (a) the aggregate revolving commitment at such time and (b) the aggregate borrowing base at such time. We would be required to continue to comply with such financial covenant until the availability under the credit agreement exceeds such minimum threshold for 30 consecutive calendar days thereafter. As of December 31, 2015, our fixed charge coverage ratio was 2.01-to-1.0. Because we currently satisfy the required fixed charge coverage ratio, we are not required to maintain a minimum borrowing availability under the credit facility. Taking into account the most recent borrowing base calculation, borrowings available under the credit facility were approximately $295 million.
CASH FLOWS
The following table presents a summary of our cash flows:
(millions) | 2015 | 2014 | 2013 | ||||||||
Net cash provided by (used for): | |||||||||||
Operating activities - Continuing operations | $ | 331 | $ | 173 | $ | 80 | |||||
Investing activities - Continuing operations | (63 | ) | (683 | ) | (157 | ) | |||||
Financing activities - Continuing operations | (44 | ) | (66 | ) | 350 | ||||||
Discontinued operations | — | (1 | ) | (2 | ) | ||||||
Effect of exchange rate changes on cash | (10 | ) | (5 | ) | (7 | ) | |||||
Net increase (decrease) in cash and cash equivalents | $ | 214 | $ | (582 | ) | $ | 264 | ||||
Operating Activities: Higher cash flows from operating activities in 2015 compared to 2014 primarily reflected improved gross profit in 2015, lower selling and administrative expenses and cash dividends from UBBP of $38 million. As of December 31, 2015, working capital (current assets less current liabilities) amounted to $409 million, and the ratio of current assets to current liabilities was 1.41-to-1. As of December 31, 2014, working capital amounted to $546 million, and the ratio of current assets to current liabilities was 1.97-to-1.
Higher cash flows from operating activities in 2014 compared to 2013 primarily reflected improved gross profit in 2014 offset by higher cash outflows for working capital of receivables, inventory, payables and accrued expenses. As of December 31, 2014, working capital (current assets less current liabilities) amounted to $546 million and the ratio of current assets to current liabilities was 1.97 to-1. As of December 31, 2013, working capital, which included the working capital of our wholly-owned subsidiaries and consolidated joint ventures that were contributed to UBBP, amounted to $1.080 billion and the ratio of current assets to current liabilities was 2.90-to-1. Higher working capital at December 31, 2013 includes the net proceeds of $344 million received for the October 2013 issuance of 5.875% senior notes as described in Financing Activities below.
Investing Activities: Net cash used for investing activities in 2015 was $63 million compared to $683 million during 2014. Included in 2014 was a $560 million outflow for our investments in UBBP, consisting of $500 of million of base price, $15 million of customary estimated working capital and net debt adjustments, $22 million of transaction costs, and $23 million of cash held by the wholly-owned subsidiaries that we contributed to UBBP.
Net cash used for investing activities in 2015 included higher net purchases of marketable securities of $76 million compared to $14 million in 2014. Capital expenditures for 2015 were lower at $94 million as compared to $132 million in 2014. The net increase in cash outflows related to marketable securities and capital expenditures were offset by the cash inflow for the net proceeds of asset dispositions of $61 million primarily due to the sale of a surplus property in Mexico and of our ships owned by GTL and $52 million for the disposition of our Knauf USG joint venture.
37
Net cash used for investing activities in 2014 was $683 million compared to $157 million during 2013. The primary drivers of the $526 million variation included (a) a $560 million outflow for our investments in UBBP, consisting of $500 million of base price, $15 million of customary estimated working capital and net debt adjustments, $22 million of transaction costs, and $23 million of cash held by the wholly-owned subsidiaries that we contributed to UBBP; (b) an increase in the cash inflow due to the net proceeds of asset dispositions of $16 million primarily due to the sale of a surplus property; and (c) an increase in the outflow of capital expenditures of $8 million, to $132 million in 2014 compared with $124 million in 2013.
Financing Activities: The net cash used for financing activities in 2015 included $365 million paid to repurchase $350 million of our 8.375% senior notes due 2018 plus tender premium offset by the $344 million of proceeds received from the issuance of $350 million of 5.5% senior notes, net of debt issuance costs and $21 million used to repay our ship mortgage facility.
The net cash used for financing activities in 2014 primarily reflected the repayment of $59 million of principal balance of our 9.75% senior notes and the expenses paid for the amendment of our credit facility as discussed above. The net cash provided by financing activities in 2013 reflected the net proceeds of $344 million from the October 2013 issuance of $350 million of 5.875% senior notes and $11 million of borrowings under the credit facilities of our Oman consolidated joint ventures.
LIQUIDITY OUTLOOK
In 2016, we plan to spend approximately $100 million on capital expenditures in the normal course of our business. We expect to fund these capital expenditures with cash from operations or cash on hand, and, if determined to be appropriate and available, borrowings under our revolving credit facility.
Estimated future spending on approved capital expenditures for the replacement, modernization and expansion of operations totaled $33 million as of December 31, 2015 compared with $96 million as of December 31, 2014.
Interest payments for 2016 are expected to decrease to $156 million from $158 million in 2015. The $500 million of 6.3% senior notes due 2016 (the "6.3% Notes") are classified in the current portion of long-term debt on our consolidated balance sheets. We expect to retire all or a portion of these notes with cash on hand.
Our undistributed foreign earnings as of December 31, 2015 are considered permanently reinvested with the exception of earnings associated with our former shipping operations and those associated with the equity method investment in the Knauf-USG joint venture that was sold in December 2015. The amount of cash and cash equivalents held by our foreign subsidiaries was $166 million as of December 31, 2015 and would be subject to material repatriation tax effects.
We believe that cash on hand, cash equivalents, marketable securities, cash available from future operations and our credit facility will provide sufficient liquidity to fund our operations for at least the next 12 months. Cash requirements include, among other things, capital expenditures, working capital needs, employee retirement plans funding, debt repayment, including the 6.3% Notes and other contractual obligations.
UBBP was funded from its net cash flows from operations and third-party financing, and it is our intent that as an ongoing operation, UBBP will continue to self-fund. UBBP is targeting the distribution of 50% of combined after tax profits to USG and Boral, however, this dividend may be adjusted by the USG Boral board with unanimous resolution. During the second and fourth quarters of 2015, UBBP's Board of Directors declared and UBBP paid cash dividends on earnings through September 30, 2015 of $77 million. Our share of these dividends is $38 million. We intend to use the dividends received to fund the potential obligations under the earnout described in Note 3 to the consolidated financial statements in Part II, Item 8 of this report.
Realization of Deferred Tax Asset
As of December 31, 2015, we had federal Net Operating Loss (“NOL”) carryforwards of approximately $1.755 billion that are available to offset future federal taxable income and will expire in the years 2026 through 2032. In addition, as of that date, we had federal alternative minimum tax credit carryforwards of approximately $40 million that are available to reduce future regular federal income taxes over an indefinite period.
As of December 31, 2015, we had a deferred tax asset related to our state NOLs and tax credit carryforwards of $230 million, of which $27 million will expire in 2016. The remainder will expire if unused in years 2017 through 2035. We also had NOL and tax credit carryforwards in various foreign jurisdictions in the amount of $1 million as of December 31, 2015 of which we have maintained a valuation allowance.
A reduction of the carrying amounts of deferred tax assets by a valuation allowance is required if, based on all available evidence, it is more likely than not that such assets will not be realized. The need to establish valuation allowances for deferred
38
tax assets is assessed at each reporting date. In assessing the requirement for, and amount of, a valuation allowance in accordance with the more-likely-than-not standard, we give appropriate consideration to all positive and negative evidence related to the realization of the deferred tax assets. This assessment considers, among other matters, the nature, frequency and severity of current and cumulative losses, forecasts of future profitability, the duration of statutory carryforward periods, our experience with operating loss and tax credit carryforwards not expiring unused and tax planning strategies.
A history of cumulative losses for a certain threshold period is a significant form of negative evidence used in the assessment, and we are required to have a policy regarding the duration of the threshold period. We believe the historical cyclical nature of our operations show economic cycles ranging from 7 to 10 years with demand troughs historically showing recovery over four years. Accordingly, we have a policy of four years as our threshold period for cumulative losses.
At December 31, 2015, consistent with the above process, we evaluated the need for a valuation allowance against our deferred tax assets and determined that it was more likely than not that most of our deferred tax assets would be realized. As a result, during the fourth quarter of 2015, we recognized a $731 million income tax benefit related to the reversal of our deferred tax asset valuation allowance. As of December 31, 2015 our deferred tax assets of $723 million were offset by a valuation allowance of $75 million. The components of the valuation allowance remaining primarily relate to certain state net operating losses that we anticipate will not be used prior to their expiration.
In determining the need for the valuation allowance, we considered all positive and negative evidence. We give more weight to evidence that is objective in nature as compared to subjective evidence. Significant weight is given to evidence that directly relates to our current financial performance. As of December 31, 2015, we emerged from a four-year cumulative pre-tax loss. In addition to meeting this threshold, there have been five consecutive quarters of domestic pre-tax earnings amounting to $194 million. The recent operating earnings is a significant, principal piece of positive evidence, along with underlying momentum in the business and generally improved market and economic conditions that lead to the determination that the quarter ended December 31, 2015 is the appropriate time to reverse a significant portion of the valuation allowance. Below is a description of the other principal evidence we considered in our evaluation at December 31, 2015.
• | Recovery period of deferred tax assets. For federal income tax purposes, NOLs can be carried forward 20 years. We plan to carry forward our NOLs and apply the losses to future taxable domestic income allowing us to realize our deferred tax assets. We believe we will realize all of our federal deferred tax assets. Based on NOL carryforward periods allowed in each state’s tax code, apportionment rules and income levels, a portion of our state NOL carryforwards will remain in a valuation allowance as it is more likely that not the state NOL carryforwards will expire prior to their utilization. |
• | Industry outlook. There are positive economic and industry trends and outlooks. Annual housing starts increased from 1,003,300 units in 2014 to 1,111,400 units in 2015. Repair and remodel increased by 2% and there are strong indicators, such as aging residential and commercial stock, that leads us to believe that this market will continue to achieve growth in the future. Both of these indicators are expected to be higher in 2016 and 2017, and we are forecasting the same growth in nonresidential construction. A gradual climb to the long term mean of 1,500,000 housing starts per year and a 1% growth of nonresidential construction is expected to occur in future years. |
• | Recent results. We have generated domestic pre-tax income in 2014 and 2015, including five consecutive quarters of domestic pretax earnings totaling $194 million as of December 31, 2015, leading to the emergence from a four year cumulative loss as discussed above. We have generated year-over-year improvement in key financial metrics such as adjusted operating margins, adjusted operating profit and a reduction in selling and administration expenses. |
• | Strategic actions. There are improvements in revenue year over year along with incremental operating profit of approximately $146 million in 2015 as compared to 2014. Strategic actions taken within the company has led to selling and administrative expenses to decrease year over year with a further decrease expected decrease in 2016. This is below our historical averages as a percent of sales. Further, we have reduced our operating costs by over $500 million since the downturn in the industry in 2007, as such we are able to achieve higher levels of EBITDA on approximately two thirds of the demand opportunity. Cost management continues to be a key part in the company’s strategic plan. This focus has significantly dampened the likelihood of future losses that would rise to historic levels. |
Prior to December 31, 2015, we gave significant weight to the negative, objective evidence of the four year cumulative pre-tax loss. Achieving a four-year cumulative pre-tax income position as of December 31, 2015 is considered to be significant, positive evidence.
39
Based on all the positive and negative evidence at December 31, 2015, we conclude that the positive evidence outweighs the negative evidence and that it is more likely than not that a substantial portion of our deferred tax assets will be realized. The most significant changes in our evaluation of the realizability of our deferred tax assets at December 31, 2015 compared to earlier periods were the significant, positive evidence of our five consecutive quarters of domestic pre-tax earnings, positive four-year cumulative pretax income position, and improved operating profit margins. As such, in the quarter ended December 31, 2015 we reversed the valuation allowance on all of our federal deferred tax assets and a significant portion of our state deferred tax assets.
See Note 15 to the consolidated financial statements in Part II, Item 8 for additional information regarding income tax matters.
Contractual Obligations and Other Commitments
As of December 31, 2015, our contractual obligations and commitments were as follows:
Payments Due by Period | |||||||||||||||||||
(millions) | Total | 2016 | 2017 - 2018 | 2019 - 2020 | Thereafter | ||||||||||||||
Debt obligations (a) | $ | 2,189 | $ | 500 | $ | 500 | $ | 250 | $ | 939 | |||||||||
Other long-term liabilities (b) | 627 | 23 | 14 | 30 | 560 | ||||||||||||||
Interest payments (c) | 777 | 156 | 222 | 139 | 260 | ||||||||||||||
Purchase obligations (d) | 522 | 142 | 175 | 72 | 133 | ||||||||||||||
Capital expenditures (e) | 33 | 24 | 9 | — | — | ||||||||||||||
Operating leases | 288 | 72 | 118 | 66 | 32 | ||||||||||||||
Unrecognized tax benefits (f) | 18 | — | — | — | 18 | ||||||||||||||
Earnout payment (g) | 75 | — | 25 | 50 | — | ||||||||||||||
Total | $ | 4,529 | $ | 917 | $ | 1,063 | $ | 607 | $ | 1,942 | |||||||||
(a) | Excludes debt discount of $1 million and unamortized deferred issuance costs of $13 million. |
(b) | Other long-term liabilities primarily consist of asset retirement obligations that principally extend over a 50-year period. The majority of associated payments are payable toward the latter part of that period. |
(c) | Reflects estimated interest payments on debt obligations as of December 31, 2015. |
(d) | Purchase obligations primarily consist of contracts to purchase energy, certain raw materials and finished goods. |
(e) | Reflects estimates of future spending on active capital projects that were approved prior to December 31, 2015 but were not completed by that date. |
(f) | Reflects estimated payments (if required) of gross unrecognized tax benefits. |
(g) | Reflects contractual earnout payments for our investments in UBBP of $25 million based on performance during the first three years and up to $50 million based on performance during the first five years. See discussion of accounting for these earnouts in Note 3 to the consolidated financial statements in Part II, Item 8 of this report. |
The table above excludes liabilities related to both our defined benefit pension plans and postretirement benefits (retiree health care and life insurance). For 2015, our defined benefit pension plans had no minimum funding requirements under the Employee Retirement Income Security Act of 1974. We are evaluating our level of funding for pension plans and currently estimate that we will contribute approximately $65 million to our pension plans in 2016. We voluntarily provide postretirement benefits for eligible employees and retirees. See Note 9 to the consolidated financial statements in Part II, Item 8 for additional information on future expected cash payments for pension and other postretirement benefits.
OFF-BALANCE-SHEET ARRANGEMENTS
With the exception of letters of credit, it is not our business practice to use off-balance-sheet arrangements, such as third-party special-purpose entities.
GUARANTEES
We are party to a variety of agreements under which we may be obligated to indemnify a third party with respect to certain matters. We do not consider the maximum potential amount of future payments that we could be required to make under these agreements to be material.
Legal Contingencies
We are named as defendants in litigation arising from our operations, including lawsuits arising from the operation of our vehicles and lawsuits arising from product performance or warranties, personal injury, and commercial disputes.
USG Corporation, United States Gypsum Company and CGC Inc., or CGC, have been named as defendants in class action lawsuits brought on behalf of direct and indirect wallboard purchasers alleging that North American wallboard manufacturers conspired to fix the price of wallboard sold in the United States and Canada. In 2014, we entered into settlement
40
agreements to resolve the U.S. class action wallboard pricing lawsuits, for which USG recorded a $48 million charge in the third quarter of 2014 ($39.25 million for the direct purchaser class settlement and $8.75 million for the indirect purchaser class settlement). In 2015, the court entered final judgment orders approving both the direct and indirect purchaser settlements. No member of the direct purchaser class appealed from the final judgment order approving the direct purchaser settlement, and therefore that settlement is final. One person appealed from the final judgment order approving the indirect purchaser settlement, and therefore that settlement is not yet final. We believe that the appeal is without merit and that the indirect purchaser settlement order will be affirmed on appeal, but the indirect purchaser settlement will not become final unless and until the appeal is favorably resolved.
The settlements do not include the Canadian lawsuits to which CGC is a party. At this stage of the Canadian lawsuits, we are not able to estimate the amount, if any, of any reasonably possible loss or range of reasonably possible losses. We believe, however, that these Canadian lawsuits will not have a material adverse effect on our business, financial position, liquidity or results of operations.
In addition to the class action lawsuits, in 2015, USG, United States Gypsum Company, L&W Supply Corporation, and seven other wallboard manufacturers were named as defendants in a lawsuit filed by twelve homebuilders asserting individual claims similar to the claims asserted in the U.S. class action lawsuits. We believe that the cost, if any, of resolving these homebuilders’ claims will not materially increase our exposure above the $48 million agreed to in the U.S. class action settlements.
In the third quarter of 2015, United States Gypsum Company was served with a federal grand jury subpoena requesting the production of company records in connection with a federal investigation of the gypsum drywall industry. We believe the investigation, although a separate proceeding, is related to the same events at issue in the litigation discussed above. We intend to fully cooperate with the grand jury investigation We believe we acted in full compliance with the law, and we do not expect the resolution of this matter to result in any material adverse effect on our business, financial position, liquidity or results of operations; however, we can provide no assurances as to the scope, timing, or outcome of any such investigation.
See Note 19 to the consolidated financial statements in Part II, Item 8 of this report for additional information regarding litigation matters. See, also, Part I, Item 1A, Risk Factors, for information regarding the possible effects of environmental laws and regulations on our businesses.
Critical Accounting Policies
In preparing our consolidated financial statements in conformity with accounting principles generally accepted in the United States, we make decisions that impact the reported amounts of assets, liabilities, revenues and expenses, and related disclosures. Such decisions include the selection of the appropriate accounting principles to be applied and the assumptions on which to base accounting estimates. In reaching such decisions, we apply judgments based on our understanding and analysis of the relevant circumstances, current developments and historical experience. Actual amounts could differ materially from those estimated at the time the consolidated financial statements are prepared.
Our significant accounting policies are described in Note 1 to the consolidated financial statements in Part II, Item 8 of this report. Some of these significant accounting policies require us to make difficult, subjective or complex judgments or estimates. An accounting estimate is considered to be critical if it meets both of the following criteria: (1) the estimate requires assumptions about matters that are highly uncertain at the time the accounting estimate is made and (2) different estimates reasonably could have been used, or changes in the estimate are reasonably likely to occur from period to period, that would have a material impact on the presentation of our financial condition, changes in financial condition, results of operations or cash flows. Our critical accounting estimates are as follows:
IMPAIRMENTS
We assess our property, plant and equipment for possible impairment whenever events or changes in circumstances indicate that the carrying values of the assets may not be recoverable or a revision of remaining useful lives is necessary. Such indicators may include changes in our business plans or management's intentions regarding future utilization of the assets or economic and competitive conditions. An asset impairment would be indicated if the sum of the expected future net pretax cash flows from the use of an asset (undiscounted and without interest charges) is less than the carrying amount of the asset. An impairment loss would be measured based on the difference between the fair value of the asset and its carrying value. The determination of fair value is based on a discounted cash flow technique, in which multiple cash flow scenarios that reflect a range of possible outcomes and a risk-free rate of interest are used to estimate fair value, or on a market appraisal.
Determination as to whether and how much an asset is impaired involves significant management judgment involving highly uncertain matters, including estimating the future success of product lines, future sales volumes, future selling prices and costs, alternative uses for the assets, and estimated proceeds from disposal of the assets. However, the impairment reviews and
41
calculations are based on estimates and assumptions that take into account our business plans and long-term investment decisions.
We assess our equity method investments for impairment whenever factors indicate an other than temporary loss in value. Such indicators may include the fair value of an investment that is less than its carrying value, absence of an ability to recover the carrying value or the equity method investment's inability to generate income sufficient to justify our carrying value. If we conclude a loss in value is other than temporary, an impairment charge is recognized for the difference between the investment’s carrying value and its estimated fair value. Determination as to whether and how much an equity method investment is impaired involves significant management judgment and assumptions. Differing assumptions could affect the timing and the amount of an impairment of an investment in any period.
See Notes 12 and 13 to our consolidated financial statements in Part II, Item 8 of this report for discussion of asset impairments during the year ended December 31, 2014 .
EMPLOYEE RETIREMENT PLANS
We maintain defined benefit pension plans for most of our employees. Most of these plans require employee contributions in order to accrue benefits. We also maintain plans that provide postretirement benefits (retiree health care and life insurance) for eligible existing retirees and for eligible active employees who may qualify for coverage in the future. The accounting for these plans depend on assumptions made by management, which are used by actuaries we engage to calculate the projected and accumulated benefit obligations and the annual expense recognized for these plans. The assumptions used in developing the required estimates primarily include discount rates, expected return on plan assets for the funded plans, compensation increase rates, retirement rates, mortality rates and, for postretirement benefits, retirement rates and levels of a company-provided subsidy.
We determined the assumed discount rate based on a hypothetical AA yield curve represented by a series of annualized individual discount rates. Each underlying bond issue is required to have a credit rating of Aa or better by Moody’s Investors Service or a credit rating of AA or better by Standard & Poor’s Financial Services LLC. We consider the underlying types of bonds and our projected cash flows of the plans in evaluating the yield curve selected. The use of a different discount rate would impact net pension and postretirement benefit costs and benefit obligations. In determining the expected return on plan assets, we use a “building block” approach, which incorporates historical experience, our pension plan investment guidelines, asset allocation, and expectations for long-term rates of return. The use of a different rate of return would impact net pension costs. A one-half percentage point change in the assumed discount rate and return on plan asset rate would have the following effects (dollars in millions):
Increase (Decrease) in | |||||||||
Assumptions | Percentage Change | 2016 Net Annual Benefit Cost | 2015 Projected Benefit Obligation | ||||||
Pension Benefits: | |||||||||
Discount rate | 0.5% increase | $ | (8 | ) | $ | (89 | ) | ||
Discount rate | 0.5% decrease | 9 | 99 | ||||||
Expected return on plan assets | 0.5% increase | (7 | ) | N/A | |||||
Expected return on plan assets | 0.5% decrease | 7 | N/A | ||||||
Postretirement Benefits: | |||||||||
Discount rate | 0.5% increase | $ | — | $ | (8 | ) | |||
Discount rate | 0.5% decrease | 1 | 10 | ||||||
Compensation increase rates are based on historical experience and anticipated future management actions. Retirement rates are based primarily on actual plan experience, while standard actuarial tables are used to estimate mortality rates.
We no longer have significant exposure to health care cost trend rates due to the modifications we made to our U.S. postretirement health care plan to limit the increase in the annual amount we pay for retiree health care coverage for certain current and future retirees to 3% and to require retiree medical plan participants to begin purchasing individual coverage in the Affordable Insurance Exchanges or individual Medicare marketplace beginning January 1, 2016 using a company-funded subsidy based upon years of service at retirement.
Results that differ from these assumptions are accumulated and amortized over future periods and, therefore, generally affect the net benefit cost of future periods. The sensitivity of assumptions reflects the impact of changing one assumption at a
42
time and is specific to conditions at the end of 2015. Economic factors and conditions could affect multiple assumptions simultaneously, and the effects of changes in assumptions are not necessarily linear.
See Note 9 to our consolidated financial statements in Part II, Item 8 of this report for additional information regarding costs, plan obligations, plan assets discount rates and other assumptions.
INCOME TAXES
We record income taxes (benefit) under the asset and liability method. Under this method, deferred tax assets and liabilities are recognized based on the future tax consequences to temporary differences between the financial statement carrying amounts of existing assets and liabilities and their respective tax bases. Deferred tax assets and liabilities are measured using enacted tax rates expected to apply in the years in which the temporary differences are expected to be recovered or paid. The effect on deferred tax assets and liabilities of a change in tax rates is recognized in earnings in the period when the change is enacted.
A reduction of the carrying amounts of deferred tax assets by a valuation allowance is required if, based on the available evidence, it is more likely than not that such assets will not be realized. The need to establish valuation allowances for deferred tax assets is assessed periodically. In assessing the requirement for, and amount of, a valuation allowance in accordance with the more-likely-than-not standard, we give appropriate consideration to all positive and negative evidence related to the realization of the deferred tax assets. This assessment considers, among other matters, the nature, frequency and severity of current and cumulative losses, forecasts of future profitability, the duration of statutory carryforward periods, our experience with operating loss and tax credit carryforwards not expiring unused and tax planning strategies. A history of cumulative losses for a certain threshold period is a significant form of negative evidence used in the assessment, and we are required to have a policy regarding the duration of the threshold period. We believe the historical cyclical nature of our operations show economic cycles ranging from 7 to 10 years with demand troughs historically showing recovery over four years. Accordingly, we have a policy of four years as our threshold period for cumulative losses.
We weigh, based upon the level of objectivity, all available evidence in our assessment related to the realization of the deferred tax assets and whether to release the valuation allowance. We will continue to assess the realizability of the state net operating losses that remain in a partial valuation allowance. Our ability to generate sufficient taxable income in the future, taking into consideration state laws on NOL expirations, will determine the need for a valuation allowance. See further discussion regarding our valuation allowance in Part I, Item 7, Realization of Deferred Tax Asset.
We recognize the tax benefits of an uncertain tax position only if those benefits are more likely than not to be sustained upon examination by the relevant taxing authorities. Unrecognized tax benefits are subsequently recognized at the time the more-likely-than-not recognition threshold is met, the tax matter is effectively settled or the statute of limitations for the relevant taxing authority to examine and challenge the tax position has expired, whichever is earlier.
See Note 15 to our consolidated financial statements in Part II, Item 8 of this report for additional information on deferred income taxes and valuation allowances.
Recently Issued Accounting Pronouncements
See Note 2, Recent Accounting Pronouncements, to the consolidated financial statements in Part II, Item 8 of this report for information related to new accounting standards.
43
Forward-Looking Statements
This report contains forward-looking statements within the meaning of the Private Securities Litigation Reform Act of 1995 related to management’s expectations about future conditions. Forward-looking statements include, but are not limited to, statements under the following headings:
• | “Business” about: (a) the availability of synthetic gypsum and energy supplies; (b) the seasonality of our businesses; (c) the development of, and demand for, new products and systems; (d) our ability to provide products and services to maintain our competitive position; (e) our conclusions on the probability of satisfaction by UBBP of earnout performance targets described in Note 3 to our consolidated financial statements; and (f) the impact of regulatory and customer sustainability standards and preferences; |
• | “Risk Factors” about significant factors that may adversely affect our industry and our business, financial condition, operating results and cash flows; |
• | “Legal Proceedings” about the outcome and effect of ongoing and future legal and governmental proceedings, including the matters described in Note 19 to our consolidated financial statements; |
• | “Management’s Discussion and Analysis” about: (a) market conditions and outlook, including anticipated growth in new residential and nonresidential construction and repair and remodel spending, and the construction industries in Canada, Mexico and the UBBP territory; (b) demand for gypsum wallboard and industry capacity utilization rate, including the impact on our selling prices and gross margins; (c) UBBP’s dividend policy and our intended use of dividend funds received, including UBBP’s ability to self-fund; (d) long-lived asset impairment charges; (e) our liquidity and capital resources, including our capital expenditure plans, cash requirements and adequacy of resources to fund them, and the actual maturities of marketable securities described in Note 4 to our consolidated financial statements; (f) our intention and ability to retire outstanding debt; (g) the availability of our federal NOL and federal alternative minimum tax credit carryforwards, including the related deferred tax asset and our determination regarding the need for a valuation allowance and the impact of an “ownership change” under the Code and resolution of tax examinations described in Note 15 to our consolidated financial statements; (h) future contributions to our pension plans, including cash payments to postretirement plans and costs, plan obligations, plan assets discount rates and other assumptions described in Note 9 to our consolidated financial statements; (i) the planned repatriation of certain undistributed foreign earnings as described in Note 15 to our consolidated financial statements; (j) the impact of potential future payments that may be required under guarantees; (k) the outcome and effect of ongoing and future legal and governmental proceedings, including the matters described in Note 19 to our consolidated financial statements; (l) the impact of significant accounting policies and recent accounting pronouncements on our financial statements, including the information incorporated described in Note 1 to our consolidated financial statements; (m) determination as to whether and how much an asset is impaired; (n) the impact of assumptions, including discount rates and expected return on plan assets, on employee retirement plan costs and obligations; and (o) the realizability of state NOLs that remain in partial valuation allowance and our ability to generate sufficient taxable income; and |
• | “Quantitative and Qualitative Disclosures about Market Risk” about: (a) the impact of commodity price risks, including our hedging activities; (b) the impact of foreign currency exchange risks, including our hedging activities; and (c) the impact of interest rate risk. Any forward-looking statements represent our views only as of today and should not be relied upon as representing our views as of any subsequent date. |
Some of the risk factors that affect our business and financial results are discussed in “Risk Factors.” We wish to caution the reader that actual business, market or other conditions, including the risk factors discussed in “Risk Factors” and those described elsewhere in this report or in our other Securities and Exchange Commission filings, could cause our actual results to differ materially from those stated in the forward-looking statements.
44
Item 7A. | QUANTITATIVE AND QUALITATIVE DISCLOSURES ABOUT MARKET RISK |
We use derivative instruments to manage selected commodity price and foreign currency exposures. We do not use derivative instruments for speculative trading purposes, and we typically do not hedge beyond three years.
COMMODITY PRICE RISK
We use natural gas swap and option contracts to manage our exposure to fluctuations in commodity prices associated with anticipated purchases of natural gas. Currently, a significant portion of our anticipated purchases of natural gas is hedged for 2016. The aggregate notional amount of these hedge contracts in place as of December 31, 2015 was 22 million mmBTUs. We review our positions regularly and make adjustments as market and business conditions warrant. The fair value of these contracts was a $21 million unrealized loss as of December 31, 2015.
A sensitivity analysis was prepared to estimate the potential change in the fair value of our natural gas hedge contracts assuming a hypothetical 10% change in market prices. Based on the results of this analysis, which may differ from actual results, the potential change in the fair value of our natural gas hedge contracts as of December 31, 2015 and 2014 was $6 million and $9 million, respectively. This analysis does not consider the underlying exposure.
FOREIGN CURRENCY EXCHANGE RISK
We have foreign exchange forward contracts to hedge forecasted purchases of products and services denominated in foreign currencies. The notional amount of these contracts was $114 million as of December 31, 2015, and they mature by December 27, 2017. The fair value of these contracts was an $8 million unrealized gain as of December 31, 2015.
A sensitivity analysis was prepared to estimate the potential change in the fair value of our foreign exchange forward contracts assuming a hypothetical 10% change in foreign exchange rates. Based on the results of this analysis, which may differ from actual results, the potential change in the fair value of our foreign exchange forward contracts as of December 31, 2015 and 2014 was $11 million and $8 million, respectively. This analysis does not consider the underlying exposure.
INTEREST RATE RISK
As of December 31, 2015, all of our outstanding debt was fixed-rate debt. Consequently, our debt is not subject to risk from changing interest rates.
A sensitivity analysis was prepared to estimate the potential change in fair value of our marketable securities portfolio assuming a hypothetical 100-basis-point increase in interest rates. Based on the results of this analysis, which may differ from actual results, the potential change in fair value of our marketable securities as of both December 31, 2015 and 2014 would be approximately $1 million.
See Notes 1 and 7 to the consolidated financial statements in Part II, Item 8 for additional information regarding our financial exposures.
45
Item 8.FINANCIAL STATEMENTS AND SUPPLEMENTARY DATA
Page | ||
CONSOLIDATED FINANCIAL STATEMENTS: | ||
1. | ||
2. | ||
3. | ||
4. | ||
5. | ||
6. | ||
7. | ||
8. | ||
9. | ||
10. | ||
11. | ||
12. | ||
13. | ||
14. | ||
15. | ||
16. | ||
17. | ||
18. | ||
19. | ||
20. | ||
All other schedules have been omitted because they are not required or applicable or the information is included in the consolidated financial statements or notes thereto.
46
USG CORPORATION
CONSOLIDATED STATEMENTS OF OPERATIONS
(millions, except share and per-share data) | Years Ended December 31, | ||||||||||
2015 | 2014 | 2013 | |||||||||
Net sales | $ | 3,776 | $ | 3,724 | $ | 3,570 | |||||
Cost of products sold | 3,085 | 3,070 | 2,989 | ||||||||
Gross profit | 691 | 654 | 581 | ||||||||
Selling and administrative expenses | 317 | 339 | 320 | ||||||||
Litigation settlement charge | — | 48 | — | ||||||||
Long-lived asset impairment charges | — | 90 | — | ||||||||
Contract termination charge and (recovery) loss on receivable | (6 | ) | 15 | — | |||||||
Gain on disposal of shipping operations, net | (1 | ) | — | — | |||||||
Restructuring charges | — | — | 3 | ||||||||
Operating profit | 381 | 162 | 258 | ||||||||
Income (loss) from equity method investments | 48 | 33 | (1 | ) | |||||||
Interest expense | (163 | ) | (179 | ) | (203 | ) | |||||
Interest income | 2 | 1 | 3 | ||||||||
Income and gain from the sale of equity method investment to related party | 13 | 2 | 2 | ||||||||
Gain on deconsolidation of subsidiaries and consolidated joint ventures | — | 27 | — | ||||||||
Loss on extinguishment of debt | (19 | ) | — | — | |||||||
Income from continuing operations before income taxes | 262 | 46 | 59 | ||||||||
Income tax benefit (expense) | 729 | (7 | ) | (11 | ) | ||||||
Income from continuing operations | 991 | 39 | 48 | ||||||||
Loss from discontinued operations, net of tax | — | (1 | ) | (2 | ) | ||||||
Net income | 991 | 38 | 46 | ||||||||
Less: Net income (loss) attributable to noncontrolling interest | — | 1 | (1 | ) | |||||||
Net income attributable to USG | $ | 991 | $ | 37 | $ | 47 | |||||
Earnings per common share - basic: | |||||||||||
Income from continuing operations | $ | 6.81 | $ | 0.27 | $ | 0.45 | |||||
Loss from discontinued operations | — | (0.01 | ) | (0.02 | ) | ||||||
Net income | $ | 6.81 | $ | 0.26 | $ | 0.43 | |||||
Earnings per common share - diluted: | |||||||||||
Income from continuing operations | $ | 6.73 | $ | 0.26 | $ | 0.44 | |||||
Loss from discontinued operations | — | (0.01 | ) | (0.02 | ) | ||||||
Net income | $ | 6.73 | $ | 0.25 | $ | 0.42 | |||||
Average common shares | 145,457,208 | 141,722,616 | 108,891,703 | ||||||||
Average diluted common shares | 147,246,600 | 144,296,316 | 111,434,543 | ||||||||
See accompanying Notes to Consolidated Financial Statements
47
USG CORPORATION
CONSOLIDATED STATEMENTS OF COMPREHENSIVE INCOME (LOSS)
(millions) | Years Ended December 31, | ||||||||||
2015 | 2014 | 2013 | |||||||||
Net income | $ | 991 | $ | 38 | $ | 46 | |||||
Other comprehensive income (loss), net of tax: | |||||||||||
Derivatives qualifying as cash flow hedges: | |||||||||||
Gain (loss) on derivatives qualifying as cash flow hedges, net of tax of $4, $0, and $0, respectively | (5 | ) | (15 | ) | 4 | ||||||
Less: Reclassification adjustment for (loss) gain on derivatives included in net income, net of tax of $2, $0, and $0, respectively | (9 | ) | 4 | 1 | |||||||
Derivatives qualifying as cash flow hedges, net of tax of $2, $0, and $0, respectively | 4 | (19 | ) | 3 | |||||||
Pension and postretirement benefits: | |||||||||||
Changes in pension and postretirement benefits, net of tax (benefit) of $6, ($2) and $10, respectively | 74 | (272 | ) | 247 | |||||||
Less: Amortization of prior service benefit cost included in net periodic pension cost, net of tax (benefit) of ($1), ($1) and ($2), respectively | (7 | ) | (2 | ) | (24 | ) | |||||
Pension and postretirement benefits, net of tax (benefit) of $7, ($1) and $12, respectively | 81 | (270 | ) | 271 | |||||||
Foreign currency translation: | |||||||||||
Changes in foreign currency translation, net of tax of $0 in all periods | (67 | ) | (68 | ) | (17 | ) | |||||
Less: Translation (loss) gain realized upon sale of foreign entities, net of tax of $0 in all periods | (6 | ) | 5 | — | |||||||
Foreign currency translation, net of tax of $0 in all periods | (61 | ) | (73 | ) | (17 | ) | |||||
Other comprehensive income (loss), net of tax | 24 | (362 | ) | 257 | |||||||
Comprehensive income (loss) | $ | 1,015 | $ | (324 | ) | $ | 303 | ||||
See accompanying Notes to Consolidated Financial Statements
48
USG CORPORATION
CONSOLIDATED BALANCE SHEETS
(millions, except share and per share data) | As of December 31, | |||||||
2015 | 2014 | |||||||
Assets | ||||||||
Current Assets: | ||||||||
Cash and cash equivalents | $ | 442 | $ | 228 | ||||
Short-term marketable securities | 194 | 96 | ||||||
Restricted cash | 9 | 1 | ||||||
Receivables (net of reserves: 2015 - $14; 2014 - $22) | 391 | 404 | ||||||
Inventories | 314 | 329 | ||||||
Income taxes receivable | 5 | 3 | ||||||
Other current assets | 45 | 48 | ||||||
Total current assets | 1,400 | 1,109 | ||||||
Long-term marketable securities | 36 | 58 | ||||||
Property, plant and equipment, net | 1,788 | 1,908 | ||||||
Deferred income taxes | 728 | 18 | ||||||
Equity method investments | 682 | 735 | ||||||
Other assets | 102 | 108 | ||||||
Total assets | $ | 4,736 | $ | 3,936 | ||||
Liabilities and Stockholders’ Equity | ||||||||
Current Liabilities: | ||||||||
Accounts payable | $ | 259 | $ | 290 | ||||
Accrued expenses | 214 | 220 | ||||||
Current portion of long-term debt | 500 | 4 | ||||||
Income taxes payable | 9 | 1 | ||||||
Litigation settlement accrual | 9 | 48 | ||||||
Total current liabilities | 991 | 563 | ||||||
Long-term debt | 1,675 | 2,191 | ||||||
Deferred income taxes | 5 | 17 | ||||||
Pension and other postretirement benefits | 392 | 491 | ||||||
Other liabilities | 237 | 266 | ||||||
Total liabilities | 3,300 | 3,528 | ||||||
Stockholders’ Equity: | ||||||||
Preferred stock | – $1 par value, authorized 36,000,000 shares; outstanding - none | — | — | |||||
Common stock | – $0.10 par value; authorized 200,000,000 shares; issued: 2015 - 145,667,000 shares; 2014 - 144,768,000 shares | 15 | 14 | |||||
Additional paid-in capital | 3,027 | 3,014 | ||||||
Accumulated other comprehensive income (loss) | (314 | ) | (338 | ) | ||||
Retained earnings (accumulated deficit) | (1,292 | ) | (2,283 | ) | ||||
Stockholders' equity of parent | 1,436 | 407 | ||||||
Noncontrolling interest | — | 1 | ||||||
Total stockholders’ equity including noncontrolling interest | 1,436 | 408 | ||||||
Total liabilities and stockholders’ equity | $ | 4,736 | $ | 3,936 | ||||
See accompanying Notes to Consolidated Financial Statements
49
Years Ended December 31, | |||||||||||
(millions) | 2015 | 2014 | 2013 | ||||||||
Operating Activities | |||||||||||
Net income | $ | 991 | $ | 38 | $ | 46 | |||||
Less: Loss from discontinued operations, net of tax | — | (1 | ) | (2 | ) | ||||||
Income from continuing operations | 991 | 39 | 48 | ||||||||
Adjustments to reconcile net income to net cash: | |||||||||||
Depreciation, depletion, and amortization | 142 | 154 | 155 | ||||||||
Loss on extinguishment of debt | 19 | — | — | ||||||||
Litigation settlement charge | — | 48 | — | ||||||||
Long-lived asset impairment charges | — | 90 | — | ||||||||
Contract termination charge and (recovery) loss on receivable | (6 | ) | 15 | — | |||||||
Share-based compensation expense | 15 | 21 | 19 | ||||||||
Deferred income taxes | (731 | ) | 4 | 2 | |||||||
Provision for bad debt | — | 1 | — | ||||||||
Gain on asset dispositions | (15 | ) | (12 | ) | (1 | ) | |||||
Gain from the sale of equity method investment to related party | (6 | ) | — | — | |||||||
Income from equity method investments | (50 | ) | (35 | ) | (1 | ) | |||||
Dividends received from equity method investments | 38 | — | — | ||||||||
Pension settlement | 1 | 13 | 16 | ||||||||
Gain on deconsolidation of subsidiaries and consolidated joint ventures | — | (27 | ) | — | |||||||
(Increase) decrease in working capital, net of deconsolidation of subsidiaries and consolidated joint ventures: | |||||||||||
Receivables | 10 | (49 | ) | (44 | ) | ||||||
Income taxes receivable | (3 | ) | 3 | (1 | ) | ||||||
Inventories | 14 | (9 | ) | (28 | ) | ||||||
Other current assets | 2 | 2 | (4 | ) | |||||||
Payables | (15 | ) | 10 | (4 | ) | ||||||
Accrued expenses | (60 | ) | (12 | ) | (23 | ) | |||||
Decrease (increase) in other assets | 5 | 3 | (6 | ) | |||||||
Decrease in pension and other postretirement benefits | (28 | ) | (55 | ) | (63 | ) | |||||
Decrease in other liabilities | (12 | ) | (13 | ) | (6 | ) | |||||
Other, net | 20 | (18 | ) | 21 | |||||||
Net cash provided by operating activities | 331 | 173 | 80 | ||||||||
Investing Activities | |||||||||||
Purchases of marketable securities | (246 | ) | (204 | ) | (205 | ) | |||||
Sales or maturities of marketable securities | 170 | 190 | 194 | ||||||||
Capital expenditures | (94 | ) | (132 | ) | (124 | ) | |||||
Acquisition of mining rights | — | — | (17 | ) | |||||||
Net proceeds from asset dispositions | 61 | 16 | 2 | ||||||||
Net proceeds from the sale of equity method investment to related party | 52 | — | — | ||||||||
Investments in joint ventures, including $23 of cash of contributed subsidiaries in 2014 | — | (560 | ) | (5 | ) | ||||||
Insurance proceeds | 2 | 3 | 2 | ||||||||
Return (deposit) of restricted cash | (8 | ) | 4 | (4 | ) | ||||||
Net cash used for investing activities | (63 | ) | (683 | ) | (157 | ) | |||||
Financing Activities | |||||||||||
Issuance of debt | 350 | 3 | 361 | ||||||||
Repayment of debt | (386 | ) | (63 | ) | (4 | ) | |||||
Payment of debt issuance fees | (6 | ) | (3 | ) | (6 | ) | |||||
Loan from venture partner | — | — | 4 | ||||||||
Issuances of common stock | 6 | 4 | 4 | ||||||||
Repurchases of common stock to satisfy employee tax withholding obligations | (8 | ) | (7 | ) | (9 | ) | |||||
Net cash (used for) provided by financing activities | (44 | ) | (66 | ) | 350 | ||||||
(continued on the next page) | |||||||||||
50
Years Ended December 31, | |||||||||||
(millions) | 2015 | 2014 | 2013 | ||||||||
Effect of exchange rate changes on cash | (10 | ) | (5 | ) | (7 | ) | |||||
Net cash used for operating activities - discontinued operations | — | (1 | ) | (2 | ) | ||||||
Net increase (decrease) in cash and cash equivalents | 214 | (582 | ) | 264 | |||||||
Cash and cash equivalents at beginning of period | 228 | 810 | 546 | ||||||||
Cash and cash equivalents at end of period | $ | 442 | $ | 228 | $ | 810 | |||||
Supplemental Cash Flow Disclosures: | |||||||||||
Interest paid, net of interest capitalized | $ | 158 | $ | 172 | $ | 192 | |||||
Income taxes paid, net of refunds received | — | 7 | 10 | ||||||||
Noncash Investing and Financing Activities: | |||||||||||
Amount in accounts payable for capital expenditures | 5 | 15 | 13 | ||||||||
Contribution of wholly-owned subsidiaries and joint venture investments as consideration for investment in USG Boral Building Products | — | 121 | — | ||||||||
Conversion of $75 million and $325 million, respectively, of 10% convertible senior notes due 2018, net of discount | — | (73 | ) | (314 | ) | ||||||
Issuance of common stock upon conversion of debt | — | 75 | 313 | ||||||||
Acceleration of deferred financing fee amortization to additional paid-in capital | — | — | 1 | ||||||||
Accrued interest on debt conversion | — | (2 | ) | — | |||||||
See accompanying Notes to Consolidated Financial Statements
51
USG CORPORATION
CONSOLIDATED STATEMENTS OF STOCKHOLDERS’ EQUITY
(millions, except share data) | Common Shares Issued (000) | Treasury Shares (000) | Common Stock | Treasury Stock | Additional Paid-in Capital | Retained Earnings (Deficit) | Accumulated Other Comprehensive Income (Loss) | Stockholders' Equity | Non-controlling Interest | Total | |||||||||||||||||||||||||||
Balance as of January 1, 2013 | 107,851 | (1 | ) | $ | 11 | $ | — | $ | 2,595 | $ | (2,367 | ) | $ | (233 | ) | $ | 6 | $ | 13 | $ | 19 | ||||||||||||||||
Net income (loss) | 47 | 47 | (1 | ) | 46 | ||||||||||||||||||||||||||||||||
Other comprehensive income | 257 | 257 | 257 | ||||||||||||||||||||||||||||||||||
Share-based compensation | 19 | 19 | 19 | ||||||||||||||||||||||||||||||||||
Stock issuances | 954 | 314 | — | 9 | (4 | ) | 5 | 5 | |||||||||||||||||||||||||||||
Stock issuances upon debt conversion | 28,509 | 3 | 310 | 313 | 313 | ||||||||||||||||||||||||||||||||
Repurchase of common stock | (313 | ) | (9 | ) | (9 | ) | (9 | ) | |||||||||||||||||||||||||||||
Changes in noncontrolling interest | — | 12 | 12 | ||||||||||||||||||||||||||||||||||
Balance as of December 31, 2013 | 137,314 | — | $ | 14 | $ | — | $ | 2,920 | $ | (2,320 | ) | $ | 24 | $ | 638 | $ | 24 | $ | 662 | ||||||||||||||||||
Net income | 37 | 37 | 1 | 38 | |||||||||||||||||||||||||||||||||
Other comprehensive loss | (362 | ) | (362 | ) | (362 | ) | |||||||||||||||||||||||||||||||
Share-based compensation | 21 | 21 | 21 | ||||||||||||||||||||||||||||||||||
Stock issuances | 947 | 166 | — | 4 | 1 | 5 | 5 | ||||||||||||||||||||||||||||||
Stock issuances upon debt conversion | 6,507 | 72 | — | 3 | 72 | 75 | 75 | ||||||||||||||||||||||||||||||
Repurchase of common stock | (238 | ) | (7 | ) | (7 | ) | (7 | ) | |||||||||||||||||||||||||||||
Changes in noncontrolling interest | — | (24 | ) | (24 | ) | ||||||||||||||||||||||||||||||||
Balance as of December 31, 2014 | 144,768 | — | $ | 14 | $ | — | $ | 3,014 | $ | (2,283 | ) | $ | (338 | ) | $ | 407 | $ | 1 | $ | 408 | |||||||||||||||||
Net income | 991 | 991 | — | 991 | |||||||||||||||||||||||||||||||||
Other comprehensive income | 24 | 24 | 24 | ||||||||||||||||||||||||||||||||||
Share-based compensation | 15 | 15 | 15 | ||||||||||||||||||||||||||||||||||
Stock issuances | 899 | 283 | 1 | 8 | (2 | ) | 7 | 7 | |||||||||||||||||||||||||||||
Repurchases of common stock | (283 | ) | (8 | ) | (8 | ) | (8 | ) | |||||||||||||||||||||||||||||
Changes in noncontrolling interest | — | (1 | ) | (1 | ) | ||||||||||||||||||||||||||||||||
Balance as of December 31, 2015 | 145,667 | — | $ | 15 | $ | — | $ | 3,027 | $ | (1,292 | ) | $ | (314 | ) | $ | 1,436 | $ | — | $ | 1,436 | |||||||||||||||||
See accompanying Notes to Consolidated Financial Statements
52
NOTES TO CONSOLIDATED FINANCIAL STATEMENTS
In the following Notes to Consolidated Financial Statements, “USG,” “we,” “our” and “us” refer to USG Corporation and its subsidiaries included in the consolidated financial statements, except as otherwise indicated or as the context otherwise requires.
1. | Significant Accounting Policies |
Nature of Operations
USG, through its subsidiaries, is a leading manufacturer and distributor of building materials. We produce a wide range of products for use in new residential, new nonresidential, and residential and nonresidential repair and remodel construction as well as products used in certain industrial processes. Our products also are distributed through building materials dealers, home improvement centers and other retailers, specialty wallboard distributors, and contractors.
Segments
Our segments are structured around our key products and business units: Gypsum, Ceilings, Distribution and UBBP.
Our Gypsum reportable segment is an aggregation of the operating segments of the gypsum businesses in the United States, Canada, Mexico, and Latin America, our mining operation in Little Narrows, Nova Scotia, Canada, and our shipping company, which we exited in 2015. Gypsum manufactures products throughout the United States, Canada, and Mexico. These products include USG Sheetrock® brand gypsum wallboard and related products including Sheetrock® brand joint compound, Durock® brand cement board, Levelrock® brand of poured gypsum flooring, Fiberock® brand backerboard, and Securock® brand glass mat sheathing used for building exteriors and gypsum fiber and glass mat panels used as roof cover board. Ceilings manufactures ceiling tile in the United States and ceiling grid in the United States, Canada and through February 27, 2014, the Asia-Pacific region. Distribution delivers gypsum wallboard, drywall metal, ceilings products, joint compound and other building products throughout the United States. UBBP manufactures, distributes and sells certain building products, mines raw gypsum and sells natural and synthetic gypsum throughout Asia, Australasia and the Middle East.
Consolidation and Presentation
Our consolidated financial statements include the accounts of USG Corporation, its majority-owned subsidiaries and through February 27, 2014, variable interest entities. Entities in which we have more than a 20% but not more than 50% ownership interest are accounted for using the equity method of accounting. All intercompany balances and transactions are eliminated in consolidation. On our consolidated statements of operations for the year ended December 31, 2013, income from equity method investments, which was previously included in "Other income, net," is reflected as "Income (loss) from equity method investments" and long-lived asset impairment charges, which was previously included in "Restructuring and long-lived asset impairment charges," are reflected as "Long-lived asset impairment charges" to conform to the current year presentation. On our consolidated statements of cash flows for the year ended December 31, 2013, income from equity method investments previously included in "Other, net" has been reclassified to "Income (loss) from equity method investments."
On September 15, 2015, we entered into an agreement to sell our 50% interest in the Knauf-USG joint venture to our joint venture partner and completed the sale in December 2015. On our consolidated statements of operations for the years ended December 31, 2014 and 2013, income from this equity method investment, which was previously included in "Income from equity method investments" is reflected as "Income and gain from the sale of equity method investment to related party" to conform to the current year presentation. Presentation of this income on the consolidated statement of cash flows is within "Income from equity method investments."
Our investments with Boral in the 50/50 joint ventures, UBBP, commenced on February 27, 2014, and as a result, our share of ten months of the results of UBBP were recorded in our accompanying consolidated statement of operations for the year ended December 31, 2014. See Note 3 for further description of our investments in UBBP.
Use of Estimates
The preparation of our consolidated financial statements in conformity with accounting principles generally accepted in the United States of America requires management to make estimates and assumptions. These estimates and assumptions affect the reported amounts of assets, liabilities, revenues and expenses. Actual results could differ from these estimates.
Revenue Recognition
We recognize revenue when substantially all the risks and rewards of ownership transfer to the customer. We record provisions for discounts to customers based on the terms of sale in the same period in which the related sales are recorded. We record
53
estimated reductions to revenue for customer programs and incentive offerings, including promotions and other volume-based incentives, in the period in which the sale occurs.
Shipping and Handling Costs
Shipping and handling costs are included in cost of products sold.
Advertising
Advertising expenses consist of media advertising and related production costs and sponsorships. We charge advertising expenses to earnings as incurred. These expenses amounted to $17 million, $23 million and $22 million for the years ended December 31, 2015, 2014 and 2013, respectively.
Research and Development
We charge research and development expenditures to earnings as incurred. These expenditures amounted to $23 million, $23 million and $21 million for the years ended December 31, 2015, 2014 and 2013, respectively.
Litigation Costs
We expense litigation costs as incurred.
Income Taxes
We record income tax expense (benefit) under the asset and liability method. Under this method, deferred tax assets and liabilities are recognized based on temporary differences between the financial statement carrying amounts of existing assets and liabilities and their respective tax bases. Deferred tax assets and liabilities are measured using enacted tax rates expected to apply in the years in which the temporary differences are expected to be recovered or paid. The effect on deferred tax assets and liabilities of a change in tax rates is recognized in earnings in the period when the change is enacted. Valuation allowances are recorded to reduce deferred tax assets when it is more likely than not that a tax benefit will not be realized.
Inventory Valuation
All of our inventories are stated at the lower of cost or market. Virtually all of our inventories are valued under the average cost method with the remainder valued under the first-in, first-out cost method. Our manufactured inventories include materials, labor and applicable factory overhead costs whereas our distribution inventories are valued at their cost. Depreciation associated with manufacturing assets is excluded from inventory cost, but is included in cost of products sold.
Earnings per Share
Basic earnings per share is based on the weighted average number of common shares outstanding. Diluted earnings per share is based on the weighted average number of common shares outstanding plus the dilutive effect, if any, of market share units, or MSUs, restricted stock units, or RSUs, and performance shares, and the potential exercise of outstanding stock options. Prior to the conversion of our 10% convertible senior notes, the dilutive effect of the potential conversion of the 10% convertible senior notes was included for the appropriate time periods when these instruments were outstanding.
Cash and Cash Equivalents
Cash and cash equivalents include highly liquid investments, primarily money market funds, with maturities of three months or less at the time of purchase.
Marketable Securities
Marketable securities are classified as available-for-sale securities and reported at fair value, with unrealized gains and losses excluded from earnings and reported in accumulated other comprehensive income (loss), or AOCI. If it is deemed that marketable securities have unrealized losses that are other than temporary, these losses will be recorded in earnings immediately. Situations in which losses may be considered other than temporary include when we have decided to sell a security or when it is more likely than not that we will be required to sell the security before we recover its amortized cost basis. Cost basis for securities sold are determined on a first-in-first-out basis.
Receivables
We include trade receivables in receivables on our consolidated balance sheets. Receivables are recorded at net realizable value, which includes allowances for cash discounts and doubtful accounts. We review the collectability of receivables on an ongoing basis. We reserve for receivables determined to be uncollectible. This determination is based on the delinquency of the account, the financial condition of the customer and our collection experience.
54
We include short-term financing receivables in receivables and long-term financing and loan receivables in other assets on our consolidated balance sheets. Financing and loan receivables are recorded at net realizable value which includes an allowance for credit losses. We review the collectability of financing and loan receivables on an ongoing basis. We reserve for financing and loan receivables determined to be uncollectible. This determination is based on the delinquency of the account and the financial condition of the other party. As of December 31, 2015, the allowance for credit losses was immaterial.
Investments in Unconsolidated Joint Ventures
The equity method of accounting is used for investments in joint ventures that we do not consolidate, but over which we have the ability to exercise significant influence. Profits resulting from sales with equity method investees are eliminated until realized by the investee. Losses in the value of an investment in an unconsolidated joint venture that are other than temporary, are recognized when the current fair value of the investment is less than its carrying value.
Property, Plant and Equipment
Property, plant and equipment is recorded at cost. We record depreciation of property, plant and equipment on a straight-line basis over the expected useful lives of the assets. We have determined estimated useful lives to be 50 years for buildings and improvements, a range of 10 to 25 years for machinery and equipment, and a range of 5 to 7 years for computer software and systems development costs. Leasehold improvements are capitalized and amortized over the shorter of the remaining lease term or remaining economic useful life. We compute depletion on a basis calculated to spread the cost of gypsum and other applicable resources over the estimated quantities of material recoverable.
We capitalize interest during the active construction period of major capital projects. Capitalized interest is added to the cost of the underlying assets and is depreciated over the useful lives of those assets. We recorded $3 million of capitalized interest in each of the three years ended December 31, 2015. Facility start-up costs that cannot be capitalized are expensed as incurred and recorded in cost of products sold.
Property, plant and equipment is reviewed for impairment when indicators of a potential impairment are present by comparing the carrying values of the assets with their estimated future undiscounted cash flows. If we determine an impairment exists, the asset is written down to estimated fair value.
Intangible Assets
We perform impairment tests for intangible assets with indefinite useful lives as of October 31 of each year, or more frequently if events occur or circumstances change that would more likely than not reduce the fair value of an intangible asset below its carrying value. The impairment test for assets with indefinite lives consists of a comparison of the fair value of the asset with its carrying amount. If the carrying amount of an intangible asset exceeds its fair value, an impairment loss is recognized in an amount equal to that excess. Intangible assets determined to have indefinite useful lives, primarily comprised of trade names, are not amortized. An income approach is used for valuing trade names. Assumptions used in the income approach include projected revenues and assumed royalty, long-term growth and discount rates.
We perform impairment tests on definite lived intangible assets, such as customer relationships, upon identification of events or circumstances that may indicate the carrying amount of the assets might be unrecoverable by comparing their undiscounted cash flows with their carrying value. If we determine impairment exists, the assets are written down to estimated fair value. As of December 31, 2015, we had no intangible assets in other current assets on the consolidated balance sheet classified as assets held for sale. As of December 31, 2014, we had $5 million of intangible assets classified as assets held for sale.
Share-Based Compensation
We award share-based compensation to employees in the form of stock options, restricted stock units, market share units, and performance shares and to non-employee directors in the form of shares of our common stock. All grants under share-based payment programs are accounted for at fair value at the date of grant. We recognize expense on all share-based awards to employees expected to vest over the service period, which is the shorter of the period until the employees’ retirement eligibility dates or the service period of the award.
Derivative Instruments
We use derivative instruments to manage selected commodity price and foreign currency exposures. We do not use derivative instruments for speculative trading purposes, and we typically do not hedge beyond three years. All derivative instruments are recorded on the balance sheet at fair value. For derivatives designated as fair value hedges, the changes in the fair values of both the derivative instrument and the hedged item are recognized in earnings in the current period. For derivatives designated as cash flow hedges, the effective portion of changes in the fair value of the derivative is recorded to AOCI, and is reclassified to earnings when the underlying forecasted transaction affects earnings. The ineffective portion of changes in the fair value of
55
the derivative is reported in cost of products sold in the current period. We periodically reassess the probability of the underlying forecasted transaction occurring. For derivatives designated as net investment hedges, we record changes in fair value to AOCI. For derivatives not designated as hedging instruments, all changes in fair value are recorded to earnings in the current period.
Currently, we are using swaps to hedge a significant portion of our anticipated purchases of natural gas to be used in our manufacturing operations. Generally, we hedge the cost of a majority of our anticipated purchases of natural gas over the next 12 months. However, we review our positions regularly and make adjustments as market conditions warrant. The majority of contracts currently in place are designated as cash flow hedges and the remainder are not designated as hedging instruments.
We have operations outside of the United States and use forward contracts from time-to-time to hedge the risk of changes in cash flows resulting from selected forecasted intercompany and third-party sales or purchases, as well as intercompany loans, denominated in non-U.S. currencies, or to hedge the risk of selected changes in our net investment in foreign subsidiaries. These contracts are designated as either cash flow or net investment hedges or are not designated as hedging instruments.
Foreign Currency Translation
We translate foreign-currency-denominated assets and liabilities into U.S. Dollars at the exchange rates existing as of the respective balance sheet dates. We translate income and expense items at the average exchange rates during the respective periods. We record translation adjustments resulting from fluctuations in exchange rates to AOCI on our consolidated balance sheets and our share of the translation adjustments recorded by our equity method investments to AOCI.
We record transaction gains and losses to earnings. The total transaction loss was $7 million in 2015, $6 million in 2014 and $4 million in 2013.
Fair Value Measurements
Certain assets and liabilities are required to be recorded at fair value. The estimated fair values of those assets and liabilities have been determined using market information and valuation methodologies. Changes in assumptions or estimation methods could affect the fair value estimates. However, we do not believe any such changes would have a material impact on our financial condition, results of operations or cash flows. There are three levels of inputs that may be used to measure fair value:
• | Level 1 – Quoted prices for identical assets and liabilities in active markets; |
• | Level 2 – Quoted prices for similar assets and liabilities in active markets; quoted prices for identical or similar assets and liabilities in markets that are not active; and model-derived valuations in which all significant inputs and significant value drivers are observable in active markets; and |
• | Level 3 – Valuations derived from valuation techniques in which one or more significant inputs or significant value drivers are unobservable. |
Certain assets and liabilities are measured at fair value on a nonrecurring basis rather than on an ongoing basis, but are subject to fair value adjustments in certain circumstances, such as when there is evidence of impairment or when a new liability is being established that requires fair value measurement.
56
2. | Recent Accounting Pronouncements |
In January 2016, the Financial Accounting Standards Board, or FASB, issued Accounting Standard Update, or ASU, 2016-01 “Recognition and Measurement of Financial Assets and Financial Liabilities,” which requires that most equity instruments be measured at fair value, with subsequent changes in fair value recognized in net income. The pronouncement also impacts the financial liabilities under the fair value option and the presentation and disclosure requirements for financial instruments. The ASU does not apply to equity method investments or investments in consolidated subsidiaries. The new standard will be effective for us for the year ended December 31, 2018, with early adoption permitted and amendments to be applied as a cumulative-effect adjustment to the balance sheet in the year of adoption. We are currently in the process of assessing the impact of the ASU on our consolidated financial statements and disclosures.
In November 2015, the FASB issued ASU 2015-17, "Balance Sheet Classification of Deferred Taxes", which requires entities to present all deferred tax assets and liabilities as noncurrent. We early adopted the standard as of December 31, 2015 and have reclassified our current deferred tax assets and liabilities to long-term. For the year ended December 31, 2014, our consolidated balance sheet has been retrospectively adjusted to conform with the new presentation, which resulted in a reclassification of $1 million from current assets to long-term assets and $44 million from current assets to long-term liabilities.
In July 2015, the FASB issued ASU 2015-11, "Simplifying the Measurement of Inventory", which changes the measurement principle for inventory from the lower of cost or market to the lower of cost or net realizable value for entities that measure inventory using the first-in, first-out (FIFO) or average cost method. The ASU defines net realizable value as estimated selling prices in the ordinary course of business, less reasonably predictable costs of completion, disposal, and transportation. The standard will be effective for us in the first quarter of 2017, with early adoption permitted. We do not expect the adoption of ASU 2015-11 will have a significant impact to our consolidated financial statements or disclosures.
In May 2015, the FASB issued ASU 2015-07, "Disclosures for Investments in Certain Entities That Calculate Net Asset Value per Share (or Its Equivalent)," which updates the disclosure requirements for investments that are measured at net asset value using the practical expedient. These investments are to be removed from the fair value hierarchy and shown as a reconciling item. The standard will be effective for us in the first quarter of 2016. The adoption will not have a significant impact to our disclosures.
In April 2015, the FASB issued ASU 2015-03, "Simplifying the Presentation of Debt Issuance Costs", which requires costs related to a recognized debt liability to be presented on the consolidated balance sheet as a direct deduction from the debt liability rather than as an asset. In August 2015, the FASB issued ASU 2015-15, "Presentation and Subsequent Measurement of Debt Issuance Costs Associated with Line-of-Credit Arrangements", which clarifies that the SEC staff would not object to an entity deferring and presenting debt issuance costs as an asset, regardless of whether there are any outstanding borrowings on the line-of-credit. We adopted these standards as of December 31, 2015 and have reclassified our deferred debt issuance costs associated with our debt other than our line-of-credit from other assets to debt. For the year ended December 31, 2014, our consolidated balance sheet has been adjusted to conform with the new presentation, which resulted in a reclassification of $14 million from other assets to debt.
In August 2014, the FASB issued ASU 2014-15, "Disclosure of Uncertainties about an Entity's Ability to Continue as a Going Concern," which requires, in connection with preparing financial statements for each annual and interim reporting period, management to evaluate whether there are conditions or events that raise substantial doubts about the entity's ability to continue as a going concern within one year after the date that the financial statements are issued and provide related disclosures. The standard will be effective for us in the first quarter of 2016. We do not expect that the adoption of ASU 2014-15 will have a significant impact to our disclosures.
In May 2014, the FASB issued ASU 2014-09, “Revenue from Contracts with Customers,” which supersedes the revenue recognition requirements in “Revenue Recognition (Topic 605),” and requires entities to recognize revenue in a way that depicts the transfer of promised goods or services to customers in an amount that reflects the consideration to which the entity expects to be entitled to in exchange for those goods or services. There are two transition methods available under the new standard, either cumulative effect or retrospective. The standard will be effective for us in the first quarter of 2018. We will adopt the new standard using the modified retrospective approach, which requires the standard be applied only to the most current period presented, with the cumulative effect of initially applying the standard recognized at the date of initial application. We are evaluating the effect of adopting this standard, but we do not expect that the adoption of ASU 2014-09 will have a significant impact to our consolidated financial statements or disclosures.
57
3. Equity Method Investments
Equity method investments were as follows:
December 31, 2015 | December 31, 2014 | |||||||||||
(millions) | Carrying Value | Ownership Percentage | Carrying Value | Ownership Percentage | ||||||||
USG Boral Building Products | $ | 675 | 50% | $ | 689 | 50% | ||||||
Other equity method investments (a) | 7 | 33% - 50% | $ | 46 | 33% - 50% | |||||||
Total equity method investments | $ | 682 | $ | 735 | ||||||||
(a) | As of December 31, 2014, our investment in the Knauf-USG joint venture was $38 million. |
Investments in USG Boral Building Products (UBBP)
On February 27, 2014, we formed the 50/50 joint ventures, USG Boral Building Products Pte. Limited, a company organized under the laws of Singapore, and USG Boral Building Products Pty Limited, a company organized under the laws of Australia, with Boral Limited, or Boral. These joint ventures are herein referred to as USG Boral Building Products, or UBBP. UBBP manufactures, distributes and sells certain building products, mines raw gypsum and sells natural and synthetic gypsum throughout Asia, Australasia and the Middle East (the "Territory"). The products that UBBP manufactures and distributes include products for wall, ceiling, floor lining and exterior systems that utilize gypsum wallboard, referred to as plasterboard in the Territory, mineral fiber ceiling tiles, steel grid and joint compound.
As consideration for our 50% ownership in UBBP, we (i) made a cash payment of $515 million to Boral, which includes a $500 million base price and $15 million of customary estimated working capital and net debt adjustments, (ii) contributed to UBBP our subsidiaries and joint venture investments in China, Singapore, India, Malaysia, New Zealand, Australia, the Middle East and Oman and (iii) granted to UBBP licenses to use certain of our intellectual property rights in the Territory. We funded our cash payment with the net proceeds from our October 2013 issuance of $350 million of 5.875% senior notes and cash on hand.
In the event certain performance targets are satisfied by UBBP, we will be obligated to pay Boral scheduled earnout payments in an aggregate amount up to $75 million, comprised first of $25 million based on performance during the first three years and then up to $50 million based on performance during the first five years. We recorded a liability representing the present value of the first earnout payment. If our conclusion on the probability were to change, we would reduce the liability with a corresponding reduction to our investment. We have not recorded a liability for the second earnout payment as we have concluded that it is currently not probable that the five-year performance target will be achieved. If our conclusion on the probability of achievement were to change, we will record a liability representing the present value of the second earnout payment with a corresponding increase to our investment. As of December 31, 2015 and 2014, our liability for the earnout payments totaled $24 million and $23 million, respectively, and is included in other liabilities on our accompanying consolidated balance sheets.
We account for our 50% investments in UBBP using the equity method of accounting, and we initially measured its carrying value at cost of approximately $676 million as of February 27, 2014. Our existing wholly-owned subsidiaries and consolidated variable interest entities that were contributed into the joint venture were deconsolidated resulting in a gain of $27 million, which is included in our consolidated statement of operations for the year ended December 31, 2014. Approximately $11 million of the gain relates to the remeasurement of our retained investment in the contributed subsidiaries to fair value, determined using a discounted cash flow model with several inputs, including a weighted-average discount rate of approximately 11% and a weighted-average long-term growth rate of approximately 2%.
All of our investments accounted for under the equity method of accounting are initially recorded at cost and subsequently adjusted for our share of the net income or loss and cash contributions and distributions to or from these entities. Because the underlying net assets in our investments are denominated in a foreign currency, translation gains or losses will impact the recorded value of our investments. Translation gains or losses recorded in other comprehensive income were as follows:
(millions) | 2015 | 2014 | 2013 | ||||||||
Translation loss | $ | (23 | ) | $ | (34 | ) | $ | — | |||
During 2015, UBBP paid cash dividends on earnings through October 2015 of which our 50% share totaled $38 million. We recorded the cash dividend in operating activities on our statements of cash flows and intend to use the cash dividends to
58
fund the potential obligations under the earnout. As of December 31, 2015, the amount of consolidated retained earnings which represents undistributed earnings from UBBP is $42 million.
Investment in Knauf-USG Joint Venture
On September 15, 2015, we entered into an agreement to sell our 50% interest in Knauf/USG Verwaltungs GmbH and Knauf/USG Systems GmbH & Co. KG, or collectively the Knauf-USG joint venture, to our joint venture partner, Knauf Aquapanel GmbH, a subsidiary of Gebr. Knauf Verwaltungsgesellschaft KG (Knauf) for €48 million in cash, or approximately $52 million. The Knauf-USG joint venture manufactured and distributed Aquapanel® brand cement-based panels in Europe (excluding Turkey) and all countries that were part of the former Soviet Union. Affiliates of Knauf are the beneficial owners of approximately 10% of USG's outstanding shares of common stock.
On December 22, 2015 the sale was completed and we recorded a gain of approximately $6 million, which is net of $5 million for income taxes payable on the sale. The gross gain and our equity method income in the Knauf-USG joint venture was $13 million for the year ended December 31, 2015 and $2 million for each of the years ended December 31, 2014 and 2013 and is recorded in "Income and gain from the sale of equity method investment to related party" in our consolidated statement of operations.
Summarized Financial Information
Summarized financial information for our equity method investments is as follows:
Statement of Operations
For the year ended December 31, | ||||||||||
(millions) | 2015 | 2014 (a) | 2013 | |||||||
USG Boral Building Products: | ||||||||||
Net sales | $ | 1,003 | $ | 927 | N/A | |||||
Gross profit | 278 | 251 | N/A | |||||||
Operating profit | 124 | 95 | N/A | |||||||
Net income from continuing operations | 101 | 72 | N/A | |||||||
Net income | 101 | 72 | N/A | |||||||
Net income attributable to USG Boral Building Products | 96 | 67 | N/A | |||||||
USG share of income from USG Boral Building Products | 48 | 33 | N/A | |||||||
Other equity method investments(b): | ||||||||||
USG share of income from other investments accounted for using the equity method | 2 | 2 | 1 | |||||||
Total income from equity method investments | 50 | 35 | 1 | |||||||
(a) | Operating results are presented for UBBP for the ten months months ended December 31, 2014. |
(b) | Amounts represent our share of income or loss from all equity method investments, other than UBBP. For the twelve months ended December 31, 2014, the amount reflected includes two months of our share of income from equity method investments from the joint ventures which we owned prior to being contributed to UBBP on February 27, 2014. |
Balance Sheet
(millions) | December 31, 2015 | December 31, 2014 | |||||
USG Boral Building Products: | |||||||
Current assets | $ | 368 | $ | 446 | |||
Non-current assets | 935 | 989 | |||||
Current liabilities(c) | 197 | 245 | |||||
Long-term debt(d) | 40 | 46 | |||||
Other non-current liabilities | 17 | 21 | |||||
Shareholders' equity(e) | 1,049 | 1,123 | |||||
(c) | Includes the current portion of long-term debt of $16 million and $35 million as of December 31, 2015 and 2014, respectively. |
(d) Includes term loans and credit facilities for the joint ventures in Oman which were contributed to UBBP in February 2014. The loans and credit facilities are guaranteed by us and the Zawawi Group in Oman.
(e) | Shareholders' equity includes $60 million and $70 million related to non-controlling interests as of December 31, 2015 and 2014, respectively. |
59
4. | Marketable Securities |
Our investments in marketable securities as of December 31, 2015 and 2014 consisted of the following:
2015 | 2014 | ||||||||||||||
(millions) | Amortized Cost | Fair Value | Amortized Cost | Fair Value | |||||||||||
Corporate debt securities | $ | 134 | $ | 134 | $ | 93 | $ | 93 | |||||||
U.S. government and agency debt securities | 57 | 57 | 22 | 22 | |||||||||||
Asset-backed debt securities | 21 | 21 | 17 | 17 | |||||||||||
Certificates of deposit | 15 | 15 | 18 | 18 | |||||||||||
Municipal debt securities | 3 | 3 | 4 | 4 | |||||||||||
Total marketable securities | $ | 230 | $ | 230 | $ | 154 | $ | 154 | |||||||
The realized and unrealized gains and losses as of and for the years ended December 31, 2015, 2014 and 2013 were immaterial.
Contractual maturities of marketable securities as of December 31, 2015 were as follows:
(millions) | Amortized Cost | Fair Value | |||||
Due in 1 year or less | $ | 194 | $ | 194 | |||
Due in 1-5 years | 36 | 36 | |||||
Total marketable securities | $ | 230 | $ | 230 | |||
Actual maturities may differ from the contractual maturities because issuers of the securities may have the right to prepay them.
5. | Intangible Assets |
Intangible assets are included in other assets on the consolidated balance sheets. Intangible assets with definite lives are amortized. These assets are summarized as follows:
As of December 31, 2015 | As of December 31, 2014 | ||||||||||||||||||||||
(millions) | Gross Carrying Amount | Accumulated Amortization | Net | Gross Carrying Amount | Accumulated Amortization | Net | |||||||||||||||||
Intangible Assets with Definite Lives: | |||||||||||||||||||||||
Customer relationships | $ | 70 | $ | (61 | ) | $ | 9 | $ | 70 | $ | (54 | ) | $ | 16 | |||||||||
Other | 9 | (8 | ) | 1 | 9 | (7 | ) | 2 | |||||||||||||||
Total | $ | 79 | $ | (69 | ) | $ | 10 | $ | 79 | $ | (61 | ) | $ | 18 | |||||||||
The weighted average amortization periods are 10 years for customer relationships and 11 years for other intangible assets with definite lives. Total amortization expense was $8 million in 2015 and $7 million in 2014 and 2013, respectively. Estimated annual amortization expense is as follows:
(millions) | 2016 | 2017 | 2018 and thereafter | ||||||||
Estimated annual amortization expense | $ | 7 | $ | 2 | $ | 1 | |||||
60
Intangible assets with indefinite lives are not amortized. The gross carry amounts of these assets as of December 31 are as follows:
(millions) | 2015 | 2014 | |||||
Intangible Assets with Indefinite Lives: | |||||||
Trade names | $ | 22 | $ | 22 | |||
Other | 8 | 8 | |||||
Total | $ | 30 | $ | 30 | |||
In 2015, 2014 and 2013, there was no impairment for any of our intangible assets.
As of December 31, 2014, approximately $5 million of other indefinite-lived intangible assets met the criteria to be classified as held for sale and therefore were included in other current assets on our consolidated balance sheet. As of December 31, 2015, these indefinite-lived intangible assets were no longer recorded as held for sale.
6. Debt
Total debt as of December 31 consisted of the following:
(millions) | 2015 | 2014 | |||||
5.5% senior notes due 2025 | $ | 350 | $ | — | |||
5.875% senior notes due 2021 | 350 | 350 | |||||
6.3% senior notes due 2016 | 500 | 500 | |||||
7.75% senior notes due 2018 | 500 | 500 | |||||
7.875% senior notes due 2020 (net of discount: 2015 - $1; 2014 - $1) | 249 | 249 | |||||
8.375% senior notes due 2018 | — | 350 | |||||
Ship mortgage facility (includes current portion of long-term debt: 2015 - $0; 2014 - $4) | — | 21 | |||||
Industrial revenue bonds (due 2028 through 2034) | 239 | 239 | |||||
Total | $ | 2,188 | $ | 2,209 | |||
Less unamortized debt issuance costs (a) | $ | 13 | $ | 14 | |||
Total | $ | 2,175 | $ | 2,195 | |||
(a) | Reflects the change in presentation of unamortized debt issuance costs from other assets to a reduction in debt. See Note 2. |
Repurchase of 8.375% Senior Notes and Issuance of 5.5% Senior Notes
In the first quarter of 2015, we repurchased $350 million of our 8.375% senior notes due in 2018 through both a cash tender offer and a subsequent notice of redemption. On February 24, 2015, we completed a cash tender offer pursuant to which we repurchased $126 million of the 8.375% senior notes for aggregate consideration, including tender offer premium and accrued and unpaid interest, of $135 million. On March 26, 2015, we repurchased the remaining $224 million of the 8.375% senior notes for aggregate consideration, including premiums and accrued and unpaid interest, of $242 million. As a result of the repurchases, we recorded a loss on early extinguishment of debt of $19 million including the write-off of unamortized debt issuance costs. Also on February 24, 2015, we issued $350 million of 5.5% senior notes due March 1, 2025. The net proceeds from the issuance of these notes and cash on hand were used to fund the repurchases of the 8.375% senior notes and all related costs and expenses. We deferred approximately $6 million of debt issuance costs that are being amortized to interest expense over the term of the notes. As of December 31, 2015, these notes were recorded on the accompanying consolidated balance sheet at $344 million.
61
Senior Notes
All of the senior notes are senior unsecured obligations and rank equally with all of our other existing and future unsecured senior indebtedness. The indentures governing the notes contain events of default, covenants and restrictions that are customary for similar transactions, including a limitation on our ability and the ability of certain of our subsidiaries to create or incur secured indebtedness.
Interest rate (a) | 6.30% | 7.75% | 5.500% | 7.875% | 5.875% |
Principal net of discount (in millions) (b) | $500 | $500 | $350 | $249 | $350 |
Maturity | November 15, 2016 | January 15, 2018 | March 1, 2025 | March 30, 2020 | November 1, 2021 |
Call date | Any time (c) | Any time (c) | March 1, 2020 (d) | March 30, 2016 (d) | November 1, 2016 (d) |
Mandatory redemption | at 101% plus accrued and unpaid interest in the event of a change in control and a related downgrade below investment grade by both Moody’s Investors Service and Standard & Poor’s Financial Services LLC | at 101% plus accrued and unpaid interest in the event of a change in control | |||
(a) | The 7.75% senior notes currently have an effective interest rate of 9.75%. The rate is subject to an adjustment of up to 2% if the debt rating is downgraded or subsequently upgraded by Moody's Investors Service and Standard & Poor's Financial Services LLC. |
(b) | Principal amounts do not include unamortized debt issuance costs that have been reclassified from other assets to a reduction in debt. See Note 2. |
(c) | Callable at any time at a price equal to the greater of (1) 100% of the principal and (2) the sum of the present value of the remaining scheduled payments of principal and interest discounted to the redemption date on a semi-annual basis at the applicable U.S. Treasury rate plus a spread (as outlined in the respective indentures), plus any accrued and unpaid interest on the principal amount being called. |
(d) | Callable at any time prior to the call date at a price equal to 100% of the principal plus a premium (as outlined in the respective indentures), plus any accrued and unpaid interest on the principal amount being called. Callable after the call date at stated redemption prices (as outlined in the respective indentures), plus any accrued and unpaid interest on the principal amount being called. |
Credit Facility
Our credit facility allows for a maximum borrowing limit under the credit agreement of $450 million (including a $50 million borrowing sublimit for CGC, Inc.). The agreement allows for the borrowing of revolving loans and issuance of letters of credit (up to a maximum of $200 million at any time outstanding, in aggregate) to USG and its subsidiaries. The maximum allowable borrowings may be increased at our request with the agreement of the lenders providing increased or new lending commitments, provided that the maximum allowable borrowings after giving effect to the increase may not exceed $650 million.
Our obligations under the credit facility are guaranteed by USG and its significant domestic subsidiaries and secured by trade receivables and inventory. The credit facility matures on October 22, 2019 unless terminated earlier in accordance with its terms. The credit facility is available to fund working capital needs and for other general corporate purposes.
The credit agreement contains a financial covenant that would require us to maintain a minimum fixed charge coverage ratio. Because we currently satisfy the required fixed charge coverage ratio, we are not required to maintain a minimum borrowing availability under the credit facility. The credit agreement contains other covenants and events of default that are customary for similar agreements and may limit our ability to take various actions including our ability to pay a dividend or repurchase our stock.
Taking into account the most recent borrowing base calculation delivered under the credit facility, which reflects trade receivables and inventory as of December 31, 2015, and outstanding letters of credit, borrowings available under the credit facility were approximately $295 million, including $50 million for CGC. As of December 31, 2015 and during the year then-ended, there were no borrowings under the facility. Had there been any borrowings as of that date, the applicable interest rate would have been 1.86% for loans in the US and 2.12% for loans in Canada. Outstanding letters of credit totaled $49 million, including $1 million for CGC, as of December 31, 2015.
Ship Mortgage Facility
Our subsidiary, Gypsum Transportation Limited, or GTL, had a secured loan facility agreement with DVB Bank SE, as lender, agent and security trustee which was repaid during 2015 in connection with the sale of two self-unloading vessels. See Note 13 for discussion of GTL.
Industrial Revenue Bonds
Our $239 million of industrial revenue bonds have fixed interest rates ranging from 5.5% to 6.4%. The weighted average rate of interest on our industrial revenue bonds is 5.875%. These bonds mature during the years 2028 through 2034.
62
OTHER INFORMATION
The fair value of our debt was $2.295 billion and $2.338 billion as of December 31, 2015 and 2014, respectively, and was determined using the fair value hierarchy of inputs described in Note 1. The fair values were based on quoted prices for identical or similar liabilities in markets that are not active or valuation models in which all significant inputs and value drivers are observable and, as a result, are classified as Level 2.
Interest accrued on our debt as of December 31, 2015 and December 31, 2014 was $45 million for both periods.
As of December 31, 2015, we were in compliance with the financial covenants contained in our credit facility.
As of December 31, 2015, the amounts of total debt outstanding maturing in each of the next five years and beyond were as follows:
(millions) | 2016 | 2017 | 2018 | 2019 | 2020 | After 2020 | |||||||||||||||||
Debt maturities (principal amounts) | $ | 500 | $ | — | $ | 500 | $ | — | $ | 250 | $ | 939 | |||||||||||
7. Derivative Instruments
COMMODITY DERIVATIVE INSTRUMENTS
As of December 31, 2015, we had 22 million mmBTUs (millions of British Thermal Units) in aggregate notional amount of outstanding natural gas swap contracts to hedge forecasted purchases. All of these contracts mature by December 31, 2017. For contracts designated as cash flow hedges, the unrealized loss that remained in AOCI as of December 31, 2015 was $19 million and as of December 31, 2014 was $20 million. No ineffectiveness was recorded on contracts designated as cash flow hedges in 2015, 2014, or 2013.
Changes in fair value on contracts not designated as cash flow hedges are recorded to earnings. The fair value of those contracts not designated as cash flow hedges was a $2 million unrealized loss as of December 31, 2015 and a $5 million unrealized loss as of December 31, 2014.
FOREIGN EXCHANGE DERIVATIVE INSTRUMENTS
We have foreign exchange forward contracts to hedge forecasted purchases of products and services denominated in foreign currencies. The notional amount of these contracts was $114 million as of December 31, 2015, and they mature by December 27, 2017. These forward contracts are designated as cash flow hedges and no ineffectiveness was recorded in 2015, 2014, or 2013. The fair value of these contracts that remained in AOCI was an unrealized gain of $8 million and $3 million as of December 31, 2015 and December 31, 2014, respectively.
During the third quarter of 2015, we entered into foreign exchange forward contracts to hedge a portion of our net investment in our Knauf-USG joint venture. The notional amount of these contracts was $35 million and they matured on November 16, 2015. In November 2015, we entered into a similar foreign exchange forward contract with the same critical terms that was scheduled to mature on January 31, 2016. These forward contracts were designated as net investment hedges and no ineffectiveness was recorded. On December 22, 2015, we completed the sale and, as a result, we terminated the outstanding foreign exchange forward contract and reclassified the $1 million net gain realized for these contracts from AOCI to earnings which increased the gain on the sale of the equity method investment. See Note 3 for further discussion on the sale.
COUNTERPARTY RISK, MASTER NETTING ARRANGEMENTS AND BALANCE SHEET OFFSETTING
We are exposed to credit losses in the event of nonperformance by the counterparties to our derivative instruments. As of December 31, 2015, our derivatives were in a $13 million net liability position. All of our counterparties have investment grade credit ratings; accordingly, we anticipate that they will be able to fully satisfy their obligations under the contracts.
All of our derivative contracts are governed by master netting agreements negotiated between us and the counterparties that reduce our counterparty credit exposure. The agreements outline the conditions (such as credit ratings and net derivative fair values) upon which we, or the counterparties, are required to post collateral. As required by certain of our agreements, we had $21 million of collateral posted with our counterparties related to our derivatives as of December 31, 2015. Amounts paid as cash collateral are included in receivables on our consolidated balance sheets.
We have not adopted an accounting policy to offset fair value amounts related to derivative contracts under our master netting arrangements; therefore, individual derivative contracts are reflected on a gross basis, as either assets or liabilities, on our consolidated balance sheets, based on their fair value as of the balance sheet date.
63
FINANCIAL STATEMENT INFORMATION
The following are the pretax effects of derivative instruments on the consolidated statements of operations and the consolidated statements of comprehensive income (loss) for the years ended December 31, 2015, 2014 and 2013:
Amount of Gain or (Loss) Recognized in Other Comprehensive Income (Loss) on Derivatives (Effective Portion) | Location of Gain or (Loss) Reclassified from AOCI into Income (Effective Portion) | Amount of Gain or (Loss) Reclassified from AOCI into Income (Effective Portion) | |||||||||||||||||||||||
(millions) | 2015 | 2014 | 2013 | 2015 | 2014 | 2013 | |||||||||||||||||||
Derivatives in Cash Flow Hedging Relationships | |||||||||||||||||||||||||
Commodity contracts | $ | (14 | ) | $ | (19 | ) | $ | 1 | Cost of products sold | $ | (15 | ) | $ | 2 | $ | (2 | ) | ||||||||
Foreign exchange contracts | 12 | 4 | 3 | Cost of products sold | 7 | 2 | 3 | ||||||||||||||||||
Foreign exchange contracts | 1 | — | — | Income and gain from the sale of equity method investment to related party | 1 | — | — | ||||||||||||||||||
Total | $ | (1 | ) | $ | (15 | ) | $ | 4 | $ | (7 | ) | $ | 4 | $ | 1 | ||||||||||
Location of Gain or (Loss) Recognized in Income on Derivatives | Amount of Gain or (Loss) Recognized in Income on Derivatives | |||||||||||||
(millions) | 2015 | 2014 | 2013 | |||||||||||
Derivatives Not Designated as Hedging Instruments | ||||||||||||||
Commodity contracts | Cost of products sold | $ | (3 | ) | $ | (4 | ) | $ | 2 | |||||
Foreign exchange contracts | Other (income) expense, net | 2 | — | — | ||||||||||
Total | $ | (1 | ) | $ | (4 | ) | $ | 2 | ||||||
As of December 31, 2015, we had no derivatives designated as net investment or fair value hedges.
The following are the fair values of derivative instruments on the consolidated balance sheets as of December 31, 2015 and 2014:
Balance Sheet Location | Fair Value | Balance Sheet Location | Fair Value | ||||||||||||||
(millions) | 12/31/15 | 12/31/14 | 12/31/15 | 12/31/14 | |||||||||||||
Derivatives in Cash Flow Hedging Relationships | |||||||||||||||||
Commodity contracts | Other current assets | $ | 1 | $ | 1 | Accrued expenses | $ | 15 | $ | 14 | |||||||
Commodity contracts | Other assets | — | — | Other liabilities | 5 | 7 | |||||||||||
Foreign exchange contracts | Other current assets | 8 | 3 | Accrued expenses | — | — | |||||||||||
Total derivatives in hedging relationships | $ | 9 | $ | 4 | $ | 20 | $ | 21 | |||||||||
Balance Sheet Location | Fair Value | Balance Sheet Location | Fair Value | ||||||||||||||
(millions) | 12/31/15 | 12/31/14 | 12/31/15 | 12/31/14 | |||||||||||||
Derivatives Not Designated as Hedging Instruments | |||||||||||||||||
Commodity contracts | Other current assets | $ | — | $ | — | Accrued expenses | $ | 2 | $ | 4 | |||||||
Commodity contracts | Other assets | — | — | Other liabilities | — | 1 | |||||||||||
Total derivatives not designated as hedging instruments | $ | — | $ | — | $ | 2 | $ | 5 | |||||||||
Total derivatives | Total assets | $ | 9 | $ | 4 | Total liabilities | $ | 22 | $ | 26 | |||||||
64
8. | Fair Value Measurements |
Certain assets and liabilities are required to be recorded at fair value. The fair values of our cash equivalents, equity mutual funds, marketable securities and derivatives were determined using the fair value hierarchy of inputs described in Note 1. The cash equivalents, primarily consisting of money market funds, and equity mutual funds are valued based on quoted prices in active markets and, as a result, are classified as Level 1. Instruments classified as Level 2 are valued using income approach or market approach. We employ an income approach, such as discounted cash-flow method and use readily observable market data and internally developed valuation models when valuing our derivatives. The inputs for the valuation models are obtained from data providers and include end-of-period spot and forward natural gas prices and foreign currency exchange rates, natural gas price volatility and LIBOR and swap rates for discounting the cash flows implied from the derivative contracts. Marketable securities are valued using market value approaches, for example, pricing based on recent transactions. These values are based on quoted prices or other observable market inputs received from data providers.
Our assets and liabilities measured at fair value on a recurring basis were as follows:
Quoted Prices in Active Markets for Identical Assets (Level 1) | Significant Other Observable Inputs (Level 2) | Significant Unobservable Inputs (Level 3) | Total | ||||||||||||||||||||||||||||
(millions) | 12/31/15 | 12/31/14 | 12/31/15 | 12/31/14 | 12/31/15 | 12/31/14 | 12/31/15 | 12/31/14 | |||||||||||||||||||||||
Cash equivalents | $ | 223 | $ | 93 | $ | 25 | $ | 32 | $ | — | $ | — | $ | 248 | $ | 125 | |||||||||||||||
Equity mutual funds | 4 | 4 | — | — | — | — | 4 | 4 | |||||||||||||||||||||||
Marketable securities: | |||||||||||||||||||||||||||||||
Corporate debt securities | — | — | 134 | 93 | — | — | 134 | 93 | |||||||||||||||||||||||
U.S. government and agency debt securities | — | — | 57 | 22 | — | — | 57 | 22 | |||||||||||||||||||||||
Asset-backed debt securities | — | — | 21 | 17 | — | — | 21 | 17 | |||||||||||||||||||||||
Certificates of deposit | — | — | 15 | 18 | — | — | 15 | 18 | |||||||||||||||||||||||
Municipal debt securities | — | — | 3 | 4 | — | — | 3 | 4 | |||||||||||||||||||||||
Derivative assets | — | — | 9 | 4 | — | — | 9 | 4 | |||||||||||||||||||||||
Derivative liabilities | — | — | (22 | ) | (26 | ) | — | — | (22 | ) | (26 | ) | |||||||||||||||||||
Certain assets and liabilities are measured at fair value on a nonrecurring basis rather than on an ongoing basis, but are subject to fair value adjustments in certain circumstances, such as when there is evidence of impairment or when a new liability is being established that requires fair value measurement. As disclosed in Note 12, during 2014, we recorded asset impairment charges of $90 million.
During 2014, we reviewed the carrying value of the ocean vessels owned by GTL for potential impairment by comparing the carrying value of those assets with their fair values. To determine the estimated fair value for the ocean vessels, we engaged a third-party ship broker. Management developed our estimate of fair value by considering comparable sales for similar asset types and incorporating an adjustment for the specialized nature of these assets. This fair value measurement is classified as Level 3, and, as disclosed in Notes 12 and 13, we recorded a long-lived asset impairment charge of $60 million during the fourth quarter of 2014.
Also during 2014, we reviewed our property, plant and equipment for potential impairment by comparing the carrying values of those assets with their fair values as estimated using the future undiscounted cash flows for their remaining useful lives. We measured the fair value of the machinery, equipment and buildings using measurements classified as Level 3, and, as disclosed in Note 12, we recorded long-lived asset impairment charges of $30 million.
65
9. Employee Retirement Plans
We maintain defined benefit pension plans for most of our employees. Most of these plans require employee contributions in order to accrue benefits. Benefits payable under the plans are based on employees’ years of service and compensation during specified years of employment. Effective December 31, 2010, we amended the USG Corporation defined benefit pension plan to replace the final average pay formula with a cash balance formula for employees hired after that date.
In 2013, we communicated to certain terminated vested participants in our USG Corporation Retirement Plan an option to receive a lump sum payment for their accrued benefits. The option commenced on October 1, 2013 and expired on November 15, 2013. For participants who elected this option, payments were made in December 2013, and we incurred a settlement charge of approximately $15 million, with a corresponding reduction in accumulated other comprehensive income (loss).
We had maintained a pension plan for our subsidiary USG (U.K.) Ltd which had been previously frozen to permanently eliminate future benefit accruals. In December 2014, we irrevocably purchased annuities for the remaining deferred members of the plan relieving us of the responsibility of the pension benefit obligation, or PBO. Consequently, we recorded a settlement charge in selling and administrative expenses in the amount of $13 million and removed the net pension asset from our consolidated balance sheet.
We also maintain plans that provide postretirement benefits (retiree health care and life insurance) for eligible employees. Employees hired before January 1, 2002 generally become eligible for the postretirement benefit plans when they meet minimum retirement age and service requirements. The cost of providing most postretirement benefits is shared with retirees.
In 2011 and 2014, we amended our U.S. postretirement benefit plan to require retiree medical plan participants to begin purchasing individual coverage in the Affordable Insurance Exchanges or individual Medicare marketplace beginning January 1, 2016 using a company-funded subsidy. The subsidy will be determined based upon years of service at retirement and Medicare eligibility. The subsidy provided to retirees eligible for Medicare will end December 31, 2019. As a result of the amendments, the measurement of the accumulated postretirement benefit obligation, or APBO, was reduced and a credit to unrecognized prior service cost is being amortized into the statement of operations over the average remaining service of active plan participants to retirement eligibility.
The components of net pension and postretirement benefit costs are summarized in the following table:
(millions) | 2015 | 2014 | 2013 | ||||||||
Pension Benefits: | |||||||||||
Service cost of benefits earned | $ | 49 | $ | 37 | $ | 38 | |||||
Interest cost on projected benefit obligation | 66 | 65 | 63 | ||||||||
Expected return on plan assets | (83 | ) | (79 | ) | (76 | ) | |||||
Settlement (a) | 1 | 13 | 16 | ||||||||
Net amortization | 39 | 24 | 43 | ||||||||
Net pension cost | $ | 72 | $ | 60 | $ | 84 | |||||
Postretirement Benefits: | |||||||||||
Service cost of benefits earned | $ | 2 | $ | 3 | $ | 3 | |||||
Interest cost on projected benefit obligation | 6 | 7 | 7 | ||||||||
Net amortization | (31 | ) | (35 | ) | (34 | ) | |||||
Net postretirement benefit | $ | (23 | ) | $ | (25 | ) | $ | (24 | ) | ||
(a) | In 2014, the settlement charge related to the elimination of the benefit obligation of the UK pension plan due to the purchase of annuities. In 2013, the settlement charge primarily related to lump sum payments made to certain terminated vested participants in our U.S. Plan. |
We use a December 31 measurement date for our plans. The accumulated benefit obligation, or ABO, for the defined benefit pension plans was $1.354 billion as of December 31, 2015 and $1.429 billion as of December 31, 2014.
66
As of December 31, | |||||||
(millions) | 2015 | 2014 | |||||
Selected information for pension plans with accumulated benefit obligations in excess of plan assets: | |||||||
Accumulated benefit obligation | $ | (1,182 | ) | $ | (1,230 | ) | |
Fair value of plan assets | 1,097 | 1,113 | |||||
Selected information for pension plans with benefit obligations in excess of plan assets: | |||||||
Benefit obligation | $ | (1,365 | ) | $ | (1,686 | ) | |
Fair value of plan assets | 1,099 | 1,340 | |||||
The following table summarizes projected benefit obligations, plan assets and funded status as of December 31:
Pension | Postretirement | ||||||||||||||
(millions) | 2015 | 2014 | 2015 | 2014 | |||||||||||
Change in Benefit Obligation: | |||||||||||||||
Benefit obligation as of January 1 | $ | 1,686 | $ | 1,376 | $ | 167 | $ | 166 | |||||||
Service cost | 49 | 37 | 2 | 3 | |||||||||||
Interest cost | 66 | 65 | 6 | 7 | |||||||||||
Curtailment/settlements | (4 | ) | (24 | ) | — | — | |||||||||
Participant contributions | 11 | 10 | 3 | 8 | |||||||||||
Benefits paid | (86 | ) | (81 | ) | (11 | ) | (20 | ) | |||||||
Plan amendment | — | — | — | 4 | |||||||||||
Actuarial (gain) loss | (119 | ) | 327 | (14 | ) | 4 | |||||||||
Foreign currency translation | (39 | ) | (24 | ) | (9 | ) | (5 | ) | |||||||
Benefit obligation as of December 31 | $ | 1,564 | $ | 1,686 | $ | 144 | $ | 167 | |||||||
Change in Plan Assets: | |||||||||||||||
Fair value as of January 1 | $ | 1,340 | $ | 1,262 | $ | — | $ | — | |||||||
Actual return on plan assets | 17 | 132 | — | — | |||||||||||
Employer contributions | 61 | 64 | 8 | 12 | |||||||||||
Participant contributions | 11 | 10 | 3 | 8 | |||||||||||
Benefits paid | (86 | ) | (81 | ) | (11 | ) | (20 | ) | |||||||
Curtailment/settlements | (4 | ) | (24 | ) | — | — | |||||||||
Foreign currency translation | (38 | ) | (23 | ) | — | — | |||||||||
Fair value as of December 31 | $ | 1,301 | $ | 1,340 | $ | — | $ | — | |||||||
Funded status | $ | (263 | ) | $ | (346 | ) | $ | (144 | ) | $ | (167 | ) | |||
Components on the Consolidated Balance Sheets: | |||||||||||||||
Noncurrent assets | $ | 3 | $ | — | $ | — | $ | — | |||||||
Current liabilities | (9 | ) | (9 | ) | (9 | ) | (13 | ) | |||||||
Noncurrent liabilities | (257 | ) | (337 | ) | (135 | ) | (154 | ) | |||||||
Net liability as of December 31 | $ | (263 | ) | $ | (346 | ) | $ | (144 | ) | $ | (167 | ) | |||
Pretax Components in AOCI: | |||||||||||||||
Net actuarial loss | $ | 387 | $ | 490 | $ | 7 | $ | 24 | |||||||
Prior service credit | (1 | ) | (1 | ) | (108 | ) | (140 | ) | |||||||
Total as of December 31 | $ | 386 | $ | 489 | $ | (101 | ) | $ | (116 | ) | |||||
For our defined benefit pension plans, the 2015 actuarial gain of $119 million was primarily due to an increase in the discount rates and the adoption of the new mortality tables published by the Society of Actuaries used to determine the benefit obligation. The weighted-average discount rate increased from 4.10% at December 31, 2014 to 4.43% at December 31, 2015 and decreased from 4.90% at December 31, 2013 to 4.10% at December 31, 2014.
67
For the defined benefit pension plans, we estimate that during 2016 we will amortize from AOCI into net pension cost a net actuarial loss of $19 million and no prior service cost. For the postretirement benefit plans, we estimate that during 2016 we will amortize from AOCI into net postretirement cost a net actuarial loss of $1 million and a prior service credit of $28 million.
ASSUMPTIONS
The following tables reflect the assumptions used in the accounting for our plans:
Pension | Postretirement | ||||||||||
2015 | 2014 | 2015 | 2014 | ||||||||
Weighted average assumptions used to determine benefit obligations as of December 31: | |||||||||||
Discount rate | 4.43 | % | 4.10 | % | 4.24 | % | 3.70 | % | |||
Compensation increase rate | 3.55 | % | 3.60 | % | N/A | N/A | |||||
Weighted average assumptions used to determine net cost for years ended December 31: | |||||||||||
Discount rate | 4.10 | % | 4.90 | % | 3.70 | % | 4.60 | % | |||
Expected return on plan assets | 6.70 | % | 7.00 | % | N/A | N/A | |||||
Compensation increase rate | 3.50 | % | 3.50 | % | N/A | N/A | |||||
We no longer have significant exposure to health care cost trend rates due to the modifications we made to our U.S. postretirement health care plan to limit the increase in the annual amount we pay for retiree health care coverage for certain current and future retirees to 3% and to require retiree medical plan participants to begin purchasing individual coverage in the Affordable Insurance Exchanges or individual Medicare marketplace beginning January 1, 2016 using a company-funded subsidy based upon years of service at retirement.
For the measurement of the APBO at December 31, 2015 for our Canadian postretirement health care plan, the assumed health care cost trend rates start with an 8% increase in 2016, followed by a gradual decline in increases to 4% for 2032. For the measurement of the APBO at December 31, 2014, the assumed health care cost trend rates started with a 8.25% increase in 2015, followed by a gradual decline in increases to 4% for 2032 and beyond.
A one percentage point change in the assumed health care cost trend rates would have the following effects on our U.S. and Canadian plans:
(millions) | One-Percentage- Point Increase | One-Percentage- Point Decrease | |||||
Effect on total service and interest cost | $ | 1 | $ | — | |||
Effect on postretirement benefit obligation | 10 | (8 | ) | ||||
RETIREMENT PLAN ASSETS
Investment Policies and Strategies: We have established investment policies and strategies for the defined benefit pension plans’ assets with a long-term objective of maintaining the plans’ assets at a level equal to or greater than that of their liabilities (as measured by a funded ratio of 100% or more of the ABO) and maximizing returns on the plans’ assets consistent with our moderate tolerance for risk. Contributions are made to the plans periodically as needed to meet funding targets or requirements. Factors influencing our determination to accept a moderate degree of risk include the timing of plan participants’ retirements and the resulting disbursement of retirement benefits, the liquidity requirements of the plans and our financial condition.
Our overall long-term objective is to achieve a 6.7% rate of return on plan assets with a moderate level of risk as indicated by the volatility of investment returns. This rate of return target was established using a “building block” approach. In this approach, ranges of long-term expected returns for the various asset classes in which the plans invest are estimated. The estimated ranges are primarily based on observations of historical asset returns and their historical volatility. In determining the expected returns, we also consider consensus forecasts of certain market and economic factors that influence returns, such as inflation, gross domestic product trends and dividend yields. We then calculate an overall range of likely expected rates of return by applying the expected asset returns to the plans’ target asset allocation. The most likely rate of return is then determined and is adjusted to account for investment management fees.
Our investment strategy is to invest in a diversified mix of asset classes in accordance with an asset allocation that we believe is likely to achieve our long-term target return while prudently considering risk. In order to manage risk, the plans’ pension and investment committees periodically rebalance the asset allocations as outlined by our investment policy statements. Our investment policy statements include glide paths which outline how our asset allocation would increase the portion of liability-hedging assets, such as fixed income, as our funded status improves in the future. This liability-driven investing
68
approach is carried out by professional investment managers who help the committees in this process. The committees also monitor the investment performance of the individual investment managers compared to their benchmark returns and investment guidelines on an ongoing basis, in part through the use of quarterly investment portfolio reviews and compliance reporting by investment managers. The pension and investment committees also evaluate risk by periodically conducting asset/liability studies to assess the correlation of the plans’ assets and liabilities and the degree of risk in the target asset allocations. The plans limit the use of leverage to select investment strategies where leverage is typically employed, such as private equity and real estate. Certain investment managers utilize derivatives, such as swaps, bond futures, and options, as part of their investment strategies. This is done primarily to gain a desired market exposure or manage factors such as interest rate risk or duration of a bond portfolio.
The following table shows the aggregate target asset allocation on a weighted average basis for all the plans and the acceptable ranges around the targets as of December 31, 2015.
Investment Policy | |||||
Target | Range | ||||
Asset Categories: | Asset Category Description | ||||
Equity | Institutional commingled/pooled equity funds, equity mutual funds and direct holdings of the common stock of U.S. and non-U.S. companies; equity funds and direct holdings are invested in companies with a range of market capitalizations | 40 | % | 36% - 42% | |
Fixed income | U.S. Treasury securities, non-U.S. government debt securities such as Canadian federal bonds, corporate bonds of companies from diversified industries and mortgage-backed securities | 49 | % | 46% - 52% | |
Limited partnerships | Investments in funds that follow any of several different strategies, including investing in distressed debt, energy development, infrastructure, and hedge funds. These investments use strategies with returns normally expected to have a reduced correlation to the return of equities as compared to other asset classes and often provide a current income component that is a meaningful portion of the investment’s total return. | 5 | % | 2% -8% | |
Other real assets | Primarily investments in large core, private real estate funds that directly own a diverse portfolio of properties located in the United States. It also includes an allocation to funds investing in equities of real estate and infrastructure companies | 6 | % | 3% - 9% | |
Cash equivalents and short-term investments | Primarily held in short-term investment funds or registered money market funds with daily liquidity | — | % | 0% - 5% | |
Total | 100 | % | |||
Fair Values of Plan Assets: Pension assets are classified based on the valuation methodologies and inputs used to determine the fair value as described in Note 1.
Level 1 investments include mutual funds, or direct investments in common stocks of U.S. and non-U.S. companies that trade on liquid exchanges. These investments are valued based on the closing price on these exchanges.
Level 2 investments include primarily fixed income securities such as corporate, or government debentures, mortgage- and asset-backed securities. They are valued primarily using income and market approaches, such as pricing based on recent market transactions, and values are based on quoted prices or other observable market inputs received from data providers. Commingled funds not traded on an exchange, even though their underlying investments are common stocks traded on liquid exchanges, are also included in the Level 2 category. The net asset value of commingled funds investing in either stocks or fixed income securities is calculated by subtracting the value of any liabilities from the market value of all securities owned by a fund.
Level 3 investments include real estate, infrastructure, or direct energy investments as well as distressed securities or hedge funds. These are valued using income approach methodologies such as discounted cash flows, or market approach methodologies such as relative value (specific to equity securities), direct capitalization and comparable sales (specific to real estate investments). Some of the key inputs used to value these securities include discount rate, EBITDA multiple, yield-to-worst, yield-to-maturity, and cap rate (specific to real estate investments).
69
The fair values by hierarchy of inputs as of December 31 were as follows:
Quoted Prices in Active Markets for Identical Assets (Level 1) | Significant Other Observable Inputs (Level 2) | Significant Unobservable Inputs (Level 3) | Total | ||||||||||||||||||||||||||||
(millions) | 2015 | 2014 | 2015 | 2014 | 2015 | 2014 | 2015 | 2014 | |||||||||||||||||||||||
Asset Categories: | |||||||||||||||||||||||||||||||
Equity: (a) | |||||||||||||||||||||||||||||||
Common and preferred stock | $ | 55 | $ | 74 | $ | — | $ | — | $ | — | $ | — | $ | 55 | $ | 74 | |||||||||||||||
Commingled/pooled/mutual funds | 54 | 53 | 448 | 470 | — | — | 502 | 523 | |||||||||||||||||||||||
Total equity | 109 | 127 | 448 | 470 | — | — | 557 | 597 | |||||||||||||||||||||||
Fixed income: | |||||||||||||||||||||||||||||||
U.S. government and agency debt securities | — | — | 177 | 195 | — | — | 177 | 195 | |||||||||||||||||||||||
Non-U.S. government and agency debt securities | — | — | 32 | 30 | — | — | 32 | 30 | |||||||||||||||||||||||
Investment-grade debt securities | — | — | 199 | 184 | — | — | 199 | 184 | |||||||||||||||||||||||
High-yield debt securities | — | — | 36 | 39 | — | — | 36 | 39 | |||||||||||||||||||||||
Commingled/pooled funds | — | — | 129 | 114 | — | — | 129 | 114 | |||||||||||||||||||||||
Other | — | — | 3 | 8 | 1 | 1 | 4 | 9 | |||||||||||||||||||||||
Total fixed income | — | — | 576 | 570 | 1 | 1 | 577 | 571 | |||||||||||||||||||||||
Limited partnerships | — | — | — | — | 106 | 103 | 106 | 103 | |||||||||||||||||||||||
Other real estate assets | — | — | 15 | 20 | 37 | 35 | 52 | 55 | |||||||||||||||||||||||
Cash equivalents and short-term investments | — | — | 10 | 17 | — | — | 10 | 17 | |||||||||||||||||||||||
Total | $ | 109 | $ | 127 | $ | 1,049 | $ | 1,077 | $ | 144 | $ | 139 | $ | 1,302 | $ | 1,343 | |||||||||||||||
Cash on hand | — | — | |||||||||||||||||||||||||||||
Receivables | 9 | 1 | |||||||||||||||||||||||||||||
Accounts payable | (10 | ) | (4 | ) | |||||||||||||||||||||||||||
Total | $ | 1,301 | $ | 1,340 | |||||||||||||||||||||||||||
(a) | Certain investments in commingled/pooled equity funds have been classified as Level 2 in 2015 and 2014 because observable quoted prices for these institutional funds are not available. |
A reconciliation of the change in the fair value measurement of the defined benefit plans’ consolidated assets using significant unobservable inputs (Level 3) between January 1, 2014 and December 31, 2015 is as follows:
(millions) | Fixed Income | Other Real Estate Assets | Limited Partnerships | Total | |||||||||||
Balance as of January 1, 2014 | $ | 1 | $ | 35 | $ | 39 | $ | 75 | |||||||
Realized gains | — | 1 | — | 1 | |||||||||||
Unrealized gains (losses) | — | 1 | (2 | ) | (1 | ) | |||||||||
Purchases, sales and settlements: | |||||||||||||||
Purchases | — | — | 67 | 67 | |||||||||||
Sales | — | (2 | ) | (1 | ) | (3 | ) | ||||||||
Settlements | — | — | — | — | |||||||||||
Net transfers into (out of) Level 3 | — | — | — | — | |||||||||||
Balance as of December 31, 2014 | $ | 1 | $ | 35 | $ | 103 | $ | 139 | |||||||
Realized losses | — | (1 | ) | — | (1 | ) | |||||||||
Unrealized gains | — | 5 | 1 | 6 | |||||||||||
Purchases, sales and settlements: | |||||||||||||||
Purchases | — | — | 2 | 2 | |||||||||||
Sales | — | (2 | ) | — | (2 | ) | |||||||||
Settlements | — | — | — | — | |||||||||||
Net transfers into (out of) Level 3 | — | — | — | — | |||||||||||
Balance as of December 31, 2015 | $ | 1 | $ | 37 | $ | 106 | $ | 144 | |||||||
70
CASH FLOWS
For 2016, our defined benefit pension plans have no minimum funding requirements under the Employee Retirement Income Security Act of 1974. We are evaluating our level of funding for pension plans and currently estimate that we will contribute approximately $65 million to our pension plans in 2016. Our cash payments for postretirement plans are estimated to be $9 million in 2016.
Total benefit payments we expect to make to participants, which include payments funded from USG’s assets as well as payments from our pension plans' assets, are as follows (in millions):
Years ended December 31 | Pension Benefits | Postretirement Benefits | |||||
2016 | $ | 105 | $ | 9 | |||
2017 | 84 | 9 | |||||
2018 | 94 | 10 | |||||
2019 | 95 | 10 | |||||
2020 | 128 | 8 | |||||
2021 - 2025 | 585 | 43 | |||||
DEFINED CONTRIBUTION PLANS
Total charges for our defined contribution plans amounted to approximately $7 million, $6 million and $3 million for the years ended December 31, 2015, 2014 and 2013, respectively. These charges primarily consisted of contributions to our U.S. plan, commonly known as a 401(k) plan. The U.S. plan provides participating employees the opportunity to invest 1% to 75% of their compensation on a pretax and/or Roth after-tax basis. Effective January 1, 2014, participants earn a guaranteed company match of 25% on employee contributions up to 6% of their eligible compensation. During 2013 the company match was 10% on contributions up to 6% of their eligible compensation. Employees are fully vested in company matching contributions after three years of participation in the plan. USG’s contributions are charged to cost of products sold and selling and administrative expenses.
71
10. | Share-Based Compensation |
We grant share-based compensation to eligible participants under our Long-Term Incentive Plan, or LTIP. The LTIP was approved by our Board of Directors and stockholders. As of December 31, 2015, a total of 12.7 million shares of common stock were authorized for grants under the LTIP, of which 3 million shares were reserved for future grants. The LTIP authorizes the Board, or the Board’s Compensation and Organization Committee, to provide equity-based compensation in the form of stock options, stock appreciation rights, or SARs, restricted stock, restricted stock units, or RSUs, market share units, or MSUs, performance shares and units, and other cash and share-based awards for the purpose of providing our non-employee directors, officers and other employees incentives and rewards for performance. We may issue common shares upon option exercises and upon the vesting or grant of other awards under the LTIP from our authorized but unissued shares or from treasury shares.
Our expense for share-based arrangements was $15 million in 2015, $21 million in 2014 and $19 million in 2013 and is included in selling and administrative expense in our consolidated statements of operations. No income tax benefits were recognized for share-based arrangements in the consolidated statements of operations in 2015, 2014 and 2013. We recognize expense on all share-based awards over the service period, which is the shorter of the period until the employees’ retirement eligibility dates or the service period of the award for awards expected to vest. For awards with graded vesting that only contain a service condition, we recognize expense on a straight-line basis over the service period. Expense is generally reduced for estimated forfeitures. Forfeitures are estimated at the time of grant and revised, if necessary, in subsequent periods if actual forfeitures differ from those estimates.
Excess tax benefits related to share based compensation are the difference between the amount of deductible compensation expense reported for tax purposes and the compensation expense recorded for financial reporting purposes for a stock award. Excess tax benefits that are not realized are not reflected in additional paid-in-capital until there is a reduction to taxes payable. As a result of the NOL carryforwards for federal tax purposes in 2015, 2014 and 2013, none of the excess tax benefits with respect to exercised stock options and vestings of RSUs, MSUs and performance shares for those years has been reflected in additional paid-in-capital as of December 31, 2015. Included in our federal tax NOL carryforwards is $68 million of unrealized excess tax benefits for which a tax benefit of $24 million will be recorded in additional paid-in-capital if the loss carryforward is fully utilized.
STOCK OPTIONS
We last granted stock options in 2012. Stock options generally become exercisable in four equal annual installments beginning one year from the date of grant, although they may become exercisable earlier in the event of death, disability, retirement or a change in control. The stock options generally expire ten years from the date of grant, or earlier in the event of death, disability or retirement.
A summary of stock options outstanding as of December 31, 2015 and of stock option activity during 2015 is presented below:
Number of Options (000) | Weighted Average Exercise Price | Weighted Average Remaining Contractual Term (years) | Aggregate Intrinsic Value (millions) | |||||||||
Outstanding at January 1, 2015 | 3,982 | $ | 26.77 | 4.17 | $ | 31 | ||||||
Exercised | (410 | ) | 14.61 | |||||||||
Canceled | (67 | ) | 41.50 | |||||||||
Forfeited | (9 | ) | 14.76 | |||||||||
Outstanding at December 31, 2015 | 3,496 | $ | 28.00 | 3.06 | $ | 19 | ||||||
Exercisable at December 31, 2015 | 3,363 | $ | 28.51 | 2.93 | $ | 18 | ||||||
Vested or expected to vest at December 31, 2015 | 3,496 | $ | 28.00 | 2.99 | $ | 19 | ||||||
Intrinsic value for stock options is defined as the difference between the current market value of our common stock and the exercise price of the stock options. The total intrinsic value of stock options exercised was $6 million in 2015, $8 million in 2014 and $7 million in 2013 and cash received from the exercise of stock options was $6 million in 2015, $4 million in 2014 and $4 million in 2013.
The total fair value of stock options vested was $1 million during 2015, $2 million during 2014 and $10 million during 2013.
72
MARKET SHARE UNITS
We granted market share units, or MSUs, during 2015, 2014, and 2013 with weighted average grant date fair values of $30.06, $40.20, and $34.55, respectively. MSUs generally vest after a three-year period based on our actual stock price performance during such period. The number of MSUs earned will vary from zero to 150% of the number of MSUs awarded depending on the actual performance of our stock price. In the case of termination of employment due to death, disability or retirement during the performance period, vesting will be pro-rated based on the number of full months employed in 2015. Awards earned will be issued at the end of the three-year period. MSUs may vest earlier in the case of a change in control in most circumstances only if there is also a related loss of employment or diminution of duties. Each MSU earned will be settled in common stock.
We estimated the fair value of each MSU granted on the date of grant using a Monte Carlo simulation that used the assumptions noted in the following table. Volatility was based on stock price history immediately prior to grant for a period commensurate with the expected term. The risk-free rate was based on zero-coupon U.S. government issues at the time of grant. The expected term represents the period from the valuation date to the end of the performance period.
Assumptions: | 2015 | 2014 | 2013 | |||||
Expected volatility | 42.70 | % | 54.93 | % | 60.97 | % | ||
Risk-free rate | 1.09 | % | 0.63 | % | 0.35 | % | ||
Expected term (in years) | 2.95 | 2.94 | 2.38 | |||||
Expected dividends | — | — | — | |||||
Nonvested MSUs outstanding as of December 31, 2015 and MSU activity during 2015 were as follows:
Weighted Number of Shares (000) | Weighted Average Grant Date Fair Value | |||||
Nonvested at January 1, 2015 | 511 | $ | 38.43 | |||
Granted | 474 | 30.06 | ||||
Vested | (156 | ) | 34.80 | |||
Forfeited | (86 | ) | 34.34 | |||
Nonvested at December 31, 2015 | 743 | 34.33 | ||||
Half of the MSUs granted in 2013 vested after a three-year performance period ended December 31, 2015. Of those MSUs granted with a three-year performance period, 155,595 vested for approximately 119,808 common shares based on the actual performance of our stock price. The remaining MSUs with a three-year performance period granted in 2013 were forfeited.
Total unrecognized compensation cost related to nonvested share-based compensation awards represented by MSUs granted under the LTIP was $4 million as of December 31, 2015. We expect that cost to be recognized over a weighted average period of 1.7 years.
RESTRICTED STOCK UNITS
We granted RSUs during 2015, 2014 and 2013 with weighted average grant date fair values of $28.56, $32.50 and $29.44, respectively. RSUs granted as special retention awards, including those granted in 2015, generally vest after a specified number of years from the date of grant or at a specified date and RSUs granted with performance goals vest if those goals are attained. RSUs may vest earlier in the case of death, disability, retirement or a change in control. Each RSU is settled in a share of our common stock after the vesting period. The fair value of each RSU granted is equal to the closing market price of our common stock on the date of grant.
In 2015, we granted RSUs as special retention awards with respect to 94,000 shares of common stock that generally vest in three years from the date of grant.
73
RSUs outstanding as of December 31, 2015 and RSU activity during 2015 were as follows:
Number of Shares (000) | Weighted Average Grant Date Fair Value | |||||
Nonvested at January 1, 2015 | 423 | $ | 20.12 | |||
Granted | 94 | 28.56 | ||||
Vested | (220 | ) | 17.84 | |||
Forfeited | (27 | ) | 24.36 | |||
Nonvested at December 31, 2015 | 270 | 24.49 | ||||
As of December 31, 2015, there was $3 million of total unrecognized compensation cost related to nonvested share-based compensation awards represented by RSUs granted under the LTIP. We expect that cost to be recognized over a weighted average period of 2.6 years. The total fair value of RSUs that vested was $4 million during 2015, $6 million during 2014 and $7 million during 2013.
PERFORMANCE SHARES
We granted performance shares during 2015, 2014 and 2013. The weighted average grant date fair value was $30.63 for 2015, $46.46 in 2014, and $38.89 in 2013. The performance shares generally vest after a period of three years based on our total stockholder return relative to the performance of the Dow Jones U.S. Construction and Materials Index, with adjustments to that index in certain circumstances, for the three-year period. The number of performance shares earned will vary from zero to 200% of the number of performance shares awarded depending on that relative performance. Vesting will be pro-rated based on the number of full months employed during the performance period in the case of death, disability, retirement or a change in control, and pro-rated awards earned will be settled in common stock at the end of the three-year period.
We estimated the fair value of each performance share granted on the date of grant using a Monte Carlo simulation that uses the assumptions noted in the following table. Volatility was based on stock price history immediately prior to grant for a period commensurate with the expected term. The risk-free rate was based on zero coupon U.S. government issues at the time of grant. The expected term represents the period from the grant date to the end of the three-year performance period.
Assumptions: | 2015 | 2014 | 2013 | |||||
Expected volatility | 42.70 | % | 54.93 | % | 59.98 | % | ||
Risk-free rate | 1.09 | % | 0.63 | % | 0.43 | % | ||
Expected term (in years) | 2.95 | 2.94 | 2.88 | |||||
Expected dividends | — | — | — | |||||
Nonvested performance shares outstanding as of December 31, 2015 and performance share activity during 2015 were as follows:
Weighted Number of Shares (000) | Weighted Average Grant Date Fair Value | |||||
Nonvested at January 1, 2015 | 203 | $ | 42.82 | |||
Granted | 147 | 30.63 | ||||
Vested | (89 | ) | 38.89 | |||
Forfeited | (39 | ) | 24.12 | |||
Nonvested at December 31, 2015 | 222 | 37.20 | ||||
With respect to the performance shares granted in 2013, for which the three-year performance period ended December 31, 2015, 89,040 of the performance shares vested for no common shares. The remaining performance shares with a three-year performance period granted in 2013 were forfeited.
Total unrecognized compensation cost related to nonvested share-based compensation awards represented by performance shares granted under the LTIP was $4 million as of December 31, 2015. We expect that cost to be recognized over a weighted average period of 1.7 years.
74
NON-EMPLOYEE DIRECTOR DEFERRED STOCK UNITS
Our non-employee directors may elect to receive a portion of their compensation as deferred stock units that increase or decrease in value in direct relation to the market price of our common stock. Deferred stock units earned through December 31, 2007 will be paid in cash upon termination of board service. Deferred stock units earned thereafter will be paid in cash or shares of USG common stock, at the election of the director, upon termination of board service.
The number of deferred stock units held by non-employee directors was approximately 193,117 as of December 31, 2015, 164,235 as of December 31, 2014 and 182,632 as of December 31, 2013. We recorded expense related to these deferred stock units of $1 million in 2015, 2014 and 2013, respectively.
11. Supplemental Balance Sheet Information
INVENTORIES
Inventories as of December 31 consisted of the following:
(millions) | 2015 | 2014 | |||||
Finished goods | $ | 210 | $ | 232 | |||
Work in progress | 36 | 35 | |||||
Raw materials | 68 | 62 | |||||
Total | $ | 314 | $ | 329 | |||
PROPERTY, PLANT AND EQUIPMENT
Property, plant and equipment as of December 31 consisted of the following:
(millions) | 2015 | 2014 | |||||
Land and mineral deposits | $ | 131 | $ | 135 | |||
Buildings and improvements | 1,088 | 1,095 | |||||
Machinery and equipment | 2,505 | 2,563 | |||||
3,724 | 3,793 | ||||||
Reserves for depreciation and depletion | (1,936 | ) | (1,885 | ) | |||
Total | $ | 1,788 | $ | 1,908 | |||
Annual depreciation and depletion expense | $ | 130 | $ | 134 | |||
ACCRUED EXPENSES
Accrued expenses as of December 31 consisted of the following:
(millions) | 2015 | 2014 | |||||
Self-insurance reserves | $ | 20 | $ | 21 | |||
Employee compensation | 40 | 42 | |||||
Interest | 45 | 45 | |||||
Restructuring | — | 1 | |||||
Derivatives | 17 | 18 | |||||
Pension and other postretirement benefits | 18 | 22 | |||||
Environmental | 16 | 16 | |||||
Other | 58 | 55 | |||||
Total | $ | 214 | $ | 220 | |||
75
ACCUMULATED OTHER COMPREHENSIVE INCOME (LOSS)
Changes in the balances of each component of accumulated other comprehensive income (loss), or AOCI, are summarized in the following table:
(millions) | Derivatives | Pension and Other Postretirement Benefit Plans | Foreign Currency Translation | Total AOCI | |||||||||||
Balance as of January 1, 2013 | $ | 32 | $ | (303 | ) | $ | 38 | $ | (233 | ) | |||||
Other comprehensive income (loss) before reclassifications | 4 | 247 | (17 | ) | 234 | ||||||||||
Less: Amounts reclassified from AOCI, net of tax | 1 | (24 | ) | — | (23 | ) | |||||||||
Other comprehensive income (loss), net of tax | 3 | 271 | (17 | ) | 257 | ||||||||||
Balance as of December 31, 2013 | $ | 35 | $ | (32 | ) | $ | 21 | $ | 24 | ||||||
Other comprehensive loss before reclassifications | (15 | ) | (272 | ) | (68 | ) | (355 | ) | |||||||
Less: Amounts reclassified from AOCI, net of tax | 4 | (2 | ) | 5 | 7 | ||||||||||
Other comprehensive loss, net of tax | (19 | ) | (270 | ) | (73 | ) | (362 | ) | |||||||
Balance as of December 31, 2014 | $ | 16 | $ | (302 | ) | $ | (52 | ) | $ | (338 | ) | ||||
Other comprehensive (loss) income before reclassifications | (5 | ) | 74 | (67 | ) | 2 | |||||||||
Less: Amounts reclassified from AOCI, net of tax | (9 | ) | (7 | ) | (6 | ) | (22 | ) | |||||||
Other comprehensive income (loss), net of tax | 4 | 81 | (61 | ) | 24 | ||||||||||
Balance as of December 31, 2015 | $ | 20 | $ | (221 | ) | $ | (113 | ) | $ | (314 | ) | ||||
Amounts reclassified from AOCI, net of tax, for the years ended December 31, 2015 and 2014, were as follows:
(millions) | 2015 | 2014 | |||||||
Derivatives | |||||||||
Net reclassification from AOCI for cash flow hedges included in cost of products sold | $ | (8 | ) | $ | 4 | ||||
Net reclassification from ACOI for cash flow hedges included in income and gain from the sale of equity method investment to related party | 1 | — | |||||||
Less: Income tax expense on reclassification from AOCI included in income tax expense | 2 | — | |||||||
Net amount reclassified from AOCI | $ | (9 | ) | $ | 4 | ||||
Pension and postretirement benefits | |||||||||
Net reclassification from AOCI for amortization of prior service (benefit) cost included in cost of products sold | $ | (5 | ) | $ | 7 | ||||
Net reclassification from AOCI for amortization of prior service (benefit) cost included in selling and administrative expenses | (3 | ) | (10 | ) | |||||
Less: Income tax expense on reclassification from AOCI included in income tax expense (benefit) | (1 | ) | (1 | ) | |||||
Net amount reclassified from AOCI | $ | (7 | ) | $ | (2 | ) | |||
Foreign Currency Translation | |||||||||
Net reclassification from AOCI for translation (loss) gain realized upon the sale of foreign entities | $ | (6 | ) | $ | 5 | ||||
Less: Income tax expense on reclassification from AOCI included in income tax expense (benefit) | — | — | |||||||
Net amount reclassified from AOCI | $ | (6 | ) | $ | 5 | ||||
We estimate that we will reclassify a net $9 million after-tax loss on derivatives from AOCI to earnings within the next 12 months.
76
ASSET RETIREMENT OBLIGATIONS
Changes in our liability for asset retirement obligations during 2015 and 2014 consisted of the following:
(millions) | 2015 | 2014 | |||||
Balance as of January 1 | $ | 123 | $ | 132 | |||
Accretion expense | 7 | 7 | |||||
Liabilities incurred | 1 | 2 | |||||
Changes in estimated cash flows (a) | (5 | ) | (13 | ) | |||
Liabilities settled | (2 | ) | (2 | ) | |||
Foreign currency translation | (5 | ) | (3 | ) | |||
Balance as of December 31 | $ | 119 | $ | 123 | |||
(a) | Changes in estimated cash flows for the year ended December 31, 2014 includes changes in estimates primarily for our gypsum quarry and ship loading facility in Windsor, Nova Scotia, Canada, which we permanently closed during the third quarter of 2011, and our mining operation in Little Narrows, Nova Scotia, Canada as a result of receiving regulatory approval of a revised reclamation plan in 2014. |
Our asset retirement obligations include reclamation requirements as regulated by government authorities related principally to assets such as our mines, quarries, landfills, ponds and wells. The accounting for asset retirement obligations requires estimates by management about the timing of asset retirements, the cost of retirement obligations, discount and inflation rates used in determining fair values and the methods of remediation associated with our asset retirement obligations. We generally use assumptions and estimates that reflect the most likely remediation method on a site-by-site basis. Our estimated liability for asset retirement obligations is revised annually, and whenever events or changes in circumstances indicate that a revision to the estimate is necessary.
In instances where a decrease in the asset retirement obligation is in excess of the related remaining net book value of the asset retirement costs, the excess is recorded to the consolidated statement of operations as a reduction in cost of products sold. Asset retirement obligations are included in other liabilities on the consolidated balance sheets.
12. Long-Lived Asset Impairment Charges
We continuously evaluate our manufacturing needs by considering the capacity of existing and idled plants and production lines, as well as capital projects for manufacturing facilities, relative to the demand assumptions included in our long-range plan. Although industry and economic factors have improved and we believe that the overall economic recovery is intact, they are improving at a slower pace than expected, which required us to reconsider the future utilization of idled plants and production lines, and capital projects for manufacturing facilities. In 2014, we recorded the following impairment charges:
(millions) | 2014 | ||
Ocean vessels | $ | 60 | |
Wallboard lines or facilities | 16 | ||
Previously incurred costs related to construction of future facilities | 12 | ||
Other | 2 | ||
Total long-lived asset impairment charges | $ | 90 | |
There were no impairment charges recorded in 2015 or 2013.
In 2014, the long-lived asset impairment charges totaling $90 million included the following:
(a) $60 million related to two self-unloading ocean vessels that were subsequently sold in the second quarter of 2015. See Note 13 for further discussion.
(b) $16 million related to the carrying values of machinery, equipment and buildings at our temporarily idled gypsum quarry and wallboard production facility in Empire, Nevada and at our previously idled and now permanently closed gypsum wallboard line in New Orleans, Louisiana. In addition, in the third quarter of 2014 we permanently closed our wallboard line in Detroit, Michigan. No impairment charge was recorded with respect to our wallboard line in Detroit, Michigan, as these assets were previously impaired at the time the plant was originally idled.
(c) $12 million related to previously incurred and capitalized costs for the construction of two future facilities which we do not anticipate will be built within our planning horizon.
77
(d) $2 million related to the carrying values of machinery, equipment and buildings at our previously idled and now permanently closed paper production line in Gypsum, Ohio.
The carrying values of the machinery, equipment and buildings at our temporarily idled facility in Empire, Nevada exceeded the estimated future undiscounted cash flows for the remaining useful lives of the assets due to slower than expected acceleration in the markets served by this facility and our forecasts regarding the timing and future rate of recovery in those markets. Based on these conditions, we do not anticipate that the carrying values of the assets at this facility would be recovered prior to end of the assets’ useful lives, and therefore fully impaired these assets. For the production line in Gypsum, Ohio that we deemed to be permanently closed, we fully impaired the long-lived assets specific to that line.
The long-lived asset impairment charges relate solely to our Gypsum segment.
13. Gypsum Transportation Limited
Gypsum Transportation Limited, or GTL, owned two self-unloading ocean vessels. The two previously owned vessels and the third previously leased vessel were used to transship iron ore in and around Sierra Leone in accordance with a contract of affreightment. During 2014, our trading partner ceased performing under the contract, and consequently, we terminated the agreement. As a result of the contract termination, we assessed the recoverability of the two owned vessels and recorded an impairment charge of $60 million. Also in 2014, we recorded a contract termination charge of $6 million for costs to be incurred for the remaining term without economic benefit to us under the lease of the third vessel and we recorded a $9 million provision for bad debt for the trade receivable from our trading partner that we deemed uncollectible.
The impairment charge for the two owned vessels is recorded within "Long-lived asset impairment charges" on our consolidated statement of operations. The contract termination charge and provision for bad debt are recorded within "Contract termination and (recovery) loss on receivable" on our consolidated statements of operations.
In April 2015, we completed the sale of our two self-unloading ocean vessels owned by GTL for $42 million and recorded a gain of $7 million on the disposition. With a portion of the proceeds from the sale, GTL repaid the outstanding loan balance under GTL’s secured loan facility agreement with DVB Bank SE and paid applicable selling costs. Additionally, we returned the third vessel leased by GTL and paid $7 million of early termination costs which were previously accrued for in 2014. In the second quarter of 2015, GTL incurred charges of $6 million to exit our shipping operations. The net impact of the gain on the sale of the vessels and charges incurred to exit the shipping operations of $1 million is recorded in “Gain on disposal of shipping operations, net” on the consolidated statement of operations.
In November 2015, we entered into a release and debt settlement agreement (Settlement Agreement) to recover a portion of our loss incurred when our former trading partner ceased performing under the contract in the fourth quarter of 2014. The Settlement Agreement requires payments beginning in December 2015 for a total of $14 million. For the payments received that are meant to settle the $9 million loss on the trade receivable, we will record the benefit to our statement of operations when we determine the payments to be probable. For the remaining $5 million we will record the benefit to the statement of operations when realization is assured beyond a reasonable doubt, which is generally when the payments are received. For the year ended December 31, 2015, we have recorded a recovery of $6 million and it is presented within the "Contract termination and (recovery) loss on receivable" on our consolidated statement of operations.
GTL recorded operating profit (loss) of $7 million in 2015, ($52) million in 2014, and $20 million in 2013.
78
14. Segments
Our operations are organized into four reportable segments: Gypsum, Ceilings, Distribution and USG Boral Building Products, or UBBP. Segment results were as follows:
GYPSUM, CEILINGS AND DISTRIBUTION
For the year ended December 31, | |||||||||||
(millions) | 2015 | 2014 | 2013 | ||||||||
Net Sales: | |||||||||||
Gypsum | $ | 2,397 | $ | 2,403 | $ | 2,262 | |||||
Ceilings | 499 | 513 | 568 | ||||||||
Distribution | 1,428 | 1,345 | 1,245 | ||||||||
Eliminations | (548 | ) | (537 | ) | (505 | ) | |||||
Total | $ | 3,776 | $ | 3,724 | $ | 3,570 | |||||
Operating Profit (Loss): | |||||||||||
Gypsum | $ | 348 | $ | 169 | $ | 261 | |||||
Ceilings | 89 | 87 | 98 | ||||||||
Distribution | 27 | 16 | 6 | ||||||||
Corporate | (95 | ) | (109 | ) | (93 | ) | |||||
Eliminations | 12 | (1 | ) | (14 | ) | ||||||
Total | $ | 381 | $ | 162 | $ | 258 | |||||
Depreciation, Depletion and Amortization: | |||||||||||
Gypsum | $ | 106 | $ | 116 | $ | 115 | |||||
Ceilings | 16 | 14 | 14 | ||||||||
Distribution | 11 | 12 | 12 | ||||||||
Corporate | 9 | 12 | 14 | ||||||||
Total | $ | 142 | $ | 154 | $ | 155 | |||||
Capital Expenditures: | |||||||||||
Gypsum | $ | 86 | $ | 96 | $ | 66 | |||||
Ceilings | 3 | 30 | 54 | ||||||||
Distribution | 5 | 5 | 3 | ||||||||
Corporate | — | 1 | 1 | ||||||||
Total | $ | 94 | $ | 132 | $ | 124 | |||||
Assets: | December 31, 2015 | December 31, 2014 | |||||||||
Gypsum | $ | 1,991 | $ | 2,106 | |||||||
Ceilings | 276 | 285 | |||||||||
Distribution | 376 | 412 | |||||||||
Corporate | 1,487 | 489 | |||||||||
Equity method investments | 682 | 735 | |||||||||
Eliminations | (76 | ) | (91 | ) | |||||||
Total | $ | 4,736 | $ | 3,936 | |||||||
79
GEOGRAPHIC INFORMATION
For the year ended December 31, | |||||||||||
(millions) | 2015 | 2014 | 2013 | ||||||||
Net Sales: | |||||||||||
United States | $ | 3,387 | $ | 3,220 | $ | 3,029 | |||||
Canada | 379 | 406 | 417 | ||||||||
Other Foreign | 196 | 283 | 309 | ||||||||
Geographic transfers | (186 | ) | (185 | ) | (185 | ) | |||||
Total | $ | 3,776 | $ | 3,724 | $ | 3,570 | |||||
Long-lived assets, consisting of property, plant and equipment, net, by geographic location were as follows: | |||||||||||
(millions) | December 31, 2015 | December 31, 2014 | |||||||||
Long-Lived Assets: | |||||||||||
United States | $ | 1,622 | $ | 1,665 | |||||||
Canada | 90 | 112 | |||||||||
Other Foreign | 76 | 131 | |||||||||
Total | $ | 1,788 | $ | 1,908 | |||||||
UBBP | For the year ended December 31, | ||||||||
(millions) | 2015 | 2014 (a) | |||||||
Net sales | $ | 1,003 | $ | 927 | |||||
Operating profit | 124 | 95 | |||||||
Net income attributable to UBBP | 96 | 67 | |||||||
Depreciation, depletion, and amortization | 43 | 31 | |||||||
Capital expenditures | 49 | 40 | |||||||
December 31, 2015 | December 31, 2014 | ||||||||
Assets | $ | 1,303 | $ | 1,435 | |||||
UBBP GEOGRAPHIC INFORMATION | For the year ended December 31, | ||||||||
(millions) | 2015 | 2014 (a) | |||||||
Net Sales: | |||||||||
Australia | $ | 345 | $ | 312 | |||||
South Korea | 200 | 197 | |||||||
China | 120 | 122 | |||||||
Thailand | 145 | 133 | |||||||
Other | 234 | 206 | |||||||
Geographic Transfers | (41 | ) | (43 | ) | |||||
Total | $ | 1,003 | $ | 927 | |||||
(a) | Operating results are presented for UBBP for the ten months ended December 31, 2014. |
80
Long-lived assets, consisting of property, plant and equipment, net, by geographic location for UBBP were as follows: | |||||||||
(millions) | December 31, 2015 | December 31, 2014 | |||||||
Long-Lived Assets: | |||||||||
Australia | $ | 216 | $ | 245 | |||||
South Korea | 106 | 113 | |||||||
China | 116 | 127 | |||||||
Oman | 103 | 96 | |||||||
Thailand | 72 | 72 | |||||||
Other | 67 | 78 | |||||||
Total | $ | 680 | $ | 731 | |||||
OTHER SEGMENT INFORMATION
Segment operating profit (loss) includes all costs and expenses directly related to the segment involved and an allocation of expenses that benefit more than one segment.
Revenues are attributed to geographic areas based on the location of the assets producing the revenues. Transactions between reportable segments and geographic areas are accounted for at transfer prices that are approximately equal to market value. Intercompany transfers between segments (shown above as eliminations) largely reflect intercompany sales from U.S. Gypsum to L&W Supply. Geographic transfers largely reflect intercompany sales from U.S. Gypsum and USG Interiors, LLC to CGC and USG Mexico, S.A. de C.V.
The Home Depot, Inc. accounted for approximately 16% of our consolidated net sales in both 2015 and 2014 and approximately 15% of our sales in 2013. Our Gypsum, Ceilings and Distribution segments had net sales to The Home Depot, Inc. in each of those years.
81
15. Income Taxes
Income from continuing operations before income taxes consisted of the following:
(millions) | 2015 | 2014 | 2013 | ||||||||
U.S. | $ | 178 | $ | 27 | $ | 17 | |||||
Foreign | 84 | 19 | 42 | ||||||||
Total | $ | 262 | $ | 46 | $ | 59 | |||||
Income tax expense (benefit) on continuing operations consisted of the following:
(millions) | 2015 | 2014 | 2013 | ||||||||
Current: | |||||||||||
Federal | $ | — | $ | — | $ | — | |||||
Foreign | 12 | 2 | 10 | ||||||||
State | 1 | 1 | 1 | ||||||||
13 | 3 | 11 | |||||||||
Deferred: | |||||||||||
Federal | (621 | ) | — | (2 | ) | ||||||
Foreign | (4 | ) | 4 | 2 | |||||||
State | (117 | ) | — | — | |||||||
(742 | ) | 4 | — | ||||||||
Total | $ | (729 | ) | $ | 7 | $ | 11 | ||||
For our continuing operations, differences between actual provisions for income taxes and provisions for income taxes at the U.S. federal statutory rate (35%) were as follows:
(millions) | 2015 | 2014 | 2013 | ||||||||
Taxes on income from continuing operations at U.S. federal statutory rate | $ | 92 | $ | 16 | $ | 21 | |||||
Foreign earnings subject to different tax rates (a) | (3 | ) | 16 | (6 | ) | ||||||
State income tax, net of federal benefit | 9 | 1 | 1 | ||||||||
Change in valuation allowance | (827 | ) | (9 | ) | (8 | ) | |||||
Income from equity method investments (b) | (16 | ) | (12 | ) | — | ||||||
Withholding taxes | — | 2 | 6 | ||||||||
Other, net | 2 | (1 | ) | (3 | ) | ||||||
Tax release from AOCI | — | (2 | ) | — | |||||||
Gain on deconsolidation | — | (7 | ) | — | |||||||
Benefits from unrecognized tax positions | (6 | ) | — | — | |||||||
Tax benefit not realized on pension loss | — | 3 | — | ||||||||
Tax on distribution of foreign earnings | 20 | — | — | ||||||||
Provision for income tax expense | $ | (729 | ) | $ | 7 | $ | 11 | ||||
Effective income tax rate | (277.7 | )% | 15.3 | % | 18.6 | % | |||||
(a) | Foreign earnings subject to different tax rates includes amounts related to impairments and other charges associated with our GTL business. |
(b) | Included in income from equity method investments are taxes associated with that income. These taxes, which are predominately foreign statutory rates, are at rates that are lower than the U.S. federal statutory rate. |
82
Significant components of deferred tax assets and liabilities as of December 31 were as follows:
(millions) | 2015 | 2014 | |||||
Deferred Tax Assets: | |||||||
Net operating loss and tax credit carryforwards | $ | 779 | $ | 944 | |||
Pension and postretirement benefits | 150 | 196 | |||||
Goodwill and other intangible assets | 24 | 29 | |||||
Reserves not deductible until paid | 29 | 47 | |||||
Self insurance | 11 | 15 | |||||
Capitalized interest | 13 | 15 | |||||
Inventories | 8 | 8 | |||||
Share-based compensation | 33 | 37 | |||||
Other | 5 | 11 | |||||
Deferred tax assets before valuation allowance | 1,052 | 1,302 | |||||
Valuation allowance | (75 | ) | (1,023 | ) | |||
Total deferred tax assets | $ | 977 | $ | 279 | |||
Deferred Tax Liabilities: | |||||||
Property, plant and equipment | 254 | 278 | |||||
Other | — | — | |||||
Total deferred tax liabilities | 254 | 278 | |||||
Net deferred tax assets | $ | 723 | $ | 1 | |||
A reduction of the carrying amounts of deferred tax assets by a valuation allowance is required if, based on all available evidence, it is more likely than not that such assets will not be realized. The need to establish valuation allowances for deferred tax assets is assessed at each reporting period. In assessing the requirement for, and amount of, a valuation allowance in accordance with the more-likely-than-not standard, we give appropriate consideration to all positive and negative evidence related to the realization of the deferred tax assets. This assessment considers, among other matters, the nature, frequency and severity of current and cumulative losses, forecasts of future profitability, the duration of statutory carryforward periods, our experience with operating loss and tax credit carryforwards not expiring unused and tax planning strategies.
A history of cumulative losses for a certain threshold period is a significant form of negative evidence used in the assessment, and we are required to have a policy regarding the duration of the threshold period. We have a policy of four years as our threshold period for cumulative losses.
In determining the need for the valuation allowance, we considered all positive and negative evidence. We give more weight to evidence that is objective in nature as compared to subjective evidence. Significant weight is given to evidence that directly relates to our current financial performance. As of December 31, 2015, we emerged from a four-year cumulative pre-tax loss. In addition to meeting this threshold, there have been five consecutive quarters of domestic pre-tax earnings amounting to $194 million. The recent domestic pre-tax operating earnings is a significant, principal piece of positive evidence, which was weighed with the underlying momentum in the business, and generally improved market and economic conditions. Other evidence included strategic actions taken by management to lower costs and our expected utilization of deferred tax assets. All of this positive evidence lead to the determination that December 31, 2015 is the appropriate time to reverse a significant portion of the valuation allowance.
During the current year, we recorded a decrease in the valuation allowance against our deferred tax assets of $948 million as of December 31, 2015. Of this decrease, $731 million was related to our evaluation for the need for a valuation allowance against our deferred tax assets and determination that it was more likely than not that most of our deferred tax assets would be realized. In addition, the remaining $217 million decrease included the decrease in the underlying deferred tax assets based upon current earnings and the use of NOL carryforwards offsetting those earnings, the planned repatriation of undistributed foreign earnings for our shipping operations and equity method investment in the Knauf-USG joint venture, the expiration of certain deferred tax assets, the decrease in our deferred tax assets for postretirement liabilities due to changes in AOCI and changes in the federal impact of our state deferred tax assets.
As of December 31, 2015, our deferred tax assets of $723 million were offset by a valuation allowance of $75 million, consisting of $74 million for state deferred tax assets and $1 million for foreign deferred tax assets. The components of the valuation allowance remaining primarily relate to certain state Net Operating Loss (“NOL”) carryforwards that we anticipate will not be used prior to their expiration.
83
As of December 31, 2015, we had federal NOL carryforwards of approximately $1.755 billion that are available to offset future federal taxable income and will expire in the years 2026 through 2032. In addition, as of that date, we had federal alternative minimum tax credit carryforwards of approximately $40 million that are available to reduce future regular federal income taxes over an indefinite period. In order to fully realize the U.S. federal net deferred tax assets, taxable income of approximately $1.870 billion would need to be generated during the period before their expiration.
As of December 31, 2015, we had a gross deferred tax asset of $230 million related to state NOLs and tax credit carryforwards, of which $27 million will expire in 2016. The remainder will expire if unused in years 2017 through 2035. To the extent that we do not generate sufficient state taxable income within the statutory carryforward periods to utilize the NOL and tax credit carryforwards in these states, they will expire unused. See previous discussion above on the valuation allowance.
We also had NOL and tax credit carryforwards in various foreign jurisdictions in the amount of $1 million as of December 31, 2015, against which we have maintained a valuation allowance.
The Internal Revenue Code imposes limitations on a corporation’s ability to utilize NOLs if it experiences an “ownership change” which can result from transactions increasing the ownership of certain stockholders in the stock of a corporation by more than 50 percentage points over a three-year period. If we were to experience an ownership change, utilization of our NOLs would be subject to an annual limitation that may be carried over to later years within the allowed NOL carryforward period. Over the entire carryforward period, we may not be able to use all our NOLs due to the aforementioned annual limitation. If an ownership change had occurred as of December 31, 2015, our annual U.S. federal NOL utilization would have been limited to approximately $92 million per year.
A reconciliation of the beginning and ending amount of unrecognized tax benefits is as follows:
(millions) | 2015 | 2014 | 2013 | ||||||||
Balance as of January 1 | $ | 22 | $ | 22 | $ | 16 | |||||
Tax positions related to the current period: | |||||||||||
Gross increase | 4 | 2 | 4 | ||||||||
Gross decrease | — | — | — | ||||||||
Tax positions related to prior periods: | |||||||||||
Gross increase | — | — | 2 | ||||||||
Gross decrease | (1 | ) | — | — | |||||||
Settlements | (6 | ) | (2 | ) | — | ||||||
Lapse of statutes of limitations | (1 | ) | — | — | |||||||
Balance as of December 31 | $ | 18 | $ | 22 | $ | 22 | |||||
We classify interest expense and penalties related to unrecognized tax benefits and interest income on tax overpayments as components of income taxes (benefit). The total amounts of interest expense and penalties recognized on our consolidated balance sheets were $1 million and $3 million, respectively, as of December 31, 2015 and 2014. The total amounts of interest and penalties recognized in our consolidated statements of operations was zero in 2015, zero for 2014 and zero for 2013. The total amounts of unrecognized tax benefit that, if recognized, would affect our effective tax rate were $17 million for 2015, $5 million for 2014 and $7 million for 2013.
Our federal income tax returns for 2008 and prior years have been examined by the Internal Revenue Service. The U.S. federal statute of limitations remains open for 2006 and later years. We are under examination in various U.S. state and foreign jurisdictions. It is possible that these examinations may be resolved within the next 12 months. We do not believe our gross unrecognized tax benefits will change as a result. Foreign and U.S. state jurisdictions have statutes of limitations generally ranging from three to five years.
We do not provide for U.S. income taxes on the portion of undistributed earnings of foreign subsidiaries that is intended to be permanently reinvested. The cumulative amount of such undistributed earnings totaled approximately $682 million as of December 31, 2015. These earnings could become taxable in the United States upon the sale or liquidation of these foreign subsidiaries or upon the remittance of dividends. It is not practical to calculate the residual income tax which would result if these basis differences reversed due to the complexities of the tax law and the hypothetical nature of the calculations.
84
16. Earnings Per Share
The reconciliation of basic income per share to diluted income per share is shown in the following table:
(millions, except per-share data) | 2015 | 2014 | 2013 | ||||||||
Income from continuing operations | $ | 991 | $ | 39 | $ | 48 | |||||
Net income (loss) attributable to noncontrolling interest | — | 1 | $ | (1 | ) | ||||||
Income from continuing operations attributable to USG | $ | 991 | $ | 38 | $ | 49 | |||||
Loss from discontinued operations | — | (1 | ) | (2 | ) | ||||||
Net income attributable to USG | $ | 991 | $ | 37 | $ | 47 | |||||
Effect of dilutive securities - Deferred compensation program for non-employee directors | (1 | ) | — | — | |||||||
Income available to shareholders | $ | 990 | $ | 37 | $ | 47 | |||||
Average common shares | 145.5 | 141.7 | 108.9 | ||||||||
Dilutive RSUs, MSUs, performance shares and stock options | 1.6 | 2.4 | 2.5 | ||||||||
Deferred shares associated with a deferred compensation program for non-employee directors | 0.1 | 0.2 | — | ||||||||
Average diluted common shares | 147.2 | 144.3 | 111.4 | ||||||||
Basic earnings (loss) per average common share: | |||||||||||
Income from continuing operations attributable to USG | $ | 6.81 | $ | 0.27 | $ | 0.45 | |||||
Loss from discontinued operations | — | (0.01 | ) | (0.02 | ) | ||||||
Net income attributable to USG | $ | 6.81 | $ | 0.26 | $ | 0.43 | |||||
Diluted earnings (loss) per average common share: | |||||||||||
Income from continuing operations attributable to USG | $ | 6.73 | $ | 0.26 | $ | 0.44 | |||||
Loss from discontinued operations | — | (0.01 | ) | (0.02 | ) | ||||||
Net income attributable to USG | $ | 6.73 | $ | 0.25 | $ | 0.42 | |||||
Stock options, RSUs, MSUs, performance shares, common shares issuable upon conversion of our 10% convertible senior notes and deferred shares associated with our deferred compensation program for non-employee directors that were not included in the computation of diluted earnings (loss) per share for those periods because their inclusion was anti-dilutive were as follows:
(millions, common shares) | 2015 | 2014 | 2013 | |||||
Stock options, RSUs, MSUs and performance shares | 1.9 | 2.1 | 2.2 | |||||
10% convertible senior notes due 2018 (a) | — | — | 6.6 | |||||
Deferred shares associated with a deferred compensation program for non-employee directors | — | — | 0.2 | |||||
(a) | In December 2013 and April 2014, we converted $325 million and $75 million, respectively, of our 10% convertible senior notes due 2018 into common shares. |
85
17. Stockholder Rights Plan
We have a stockholder rights plan, or the Rights Plan, established under the terms of a rights agreement dated December 21, 2006, as amended, with Computershare Trust Company N.A., as Rights Agent, or the Rights Agreement. The Rights Plan was initially intended to protect our stockholders from coercive takeover practices or takeover bids that are inconsistent with their best interests. However, in 2013 and 2015, the Board of Directors adopted amendments to the Rights Agreement, discussed below, intended to protect our substantial NOL carryforwards and related tax benefits. The Board of Directors also recommended, and on May 9, 2013 our stockholders approved, an amendment to our Restated Certificate of Incorporation, or the Protective Amendment, also intended to protect our NOL carryforwards and related tax benefits.
NOL Protective Amendments to our Rights Plan
On March 22, 2013, our Board of Directors approved an amendment to the Rights Agreement in an effort to protect our NOL carryforwards and related tax benefits. Our ability to use our NOLs could be substantially reduced if we experience an “ownership change,” as defined under Section 382 of the Internal Revenue Code of 1986, as amended (the "Code"), and the Rights Agreement has been designed to prevent such an “ownership change.” “Ownership changes” generally relate to the cumulative change in ownership among stockholders with an ownership interest of 5% or more (as determined under the Code’s rules) over a rolling three-year period. Our stockholders ratified, on an advisory basis, the March 22, 2013 amendment to our Rights Agreement at our 2013 annual meeting of stockholders. The Rights Agreement, as amended, provides that if any person becomes the beneficial owner of 4.9% or more of our common stock, stockholders other than the 4.9% triggering stockholder will have the right to purchase additional shares of our common stock at half the market price, thereby diluting the triggering stockholder; provided that stockholders whose beneficial ownership, as defined in Section 383 of the Code, exceeded 4.9% of our common stock outstanding on February 11, 2015 will not be deemed to have triggered the Rights Agreement, as amended, so long as they do not thereafter acquire additional common stock other than in certain specified exempt transactions. The Board of Directors approved an amendment to the Rights Agreement in February 2015 to align the definition of “Beneficial Owner” and “Beneficially Own” with Section 382 of the Code.
The NOL protective provisions in the Rights Agreement adopted in 2013 were scheduled to expire on March 22, 2016 and the Rights Agreement was scheduled to expire on January 2, 2017. In connection with a required triennial review of the Rights Agreement, the Board of Directors approved, and on November 16, 2015 the Company entered into, another amendment to the Rights Agreement to extend the term of the Rights Agreement, as well as the NOL protective provisions adopted in 2013, to May 31, 2019, subject to other earlier termination events as described therein. Accordingly, the 4.9% threshold described above is now effective until the earlier of (i) May 31, 2019, (ii) the date on which our Board of Directors determines that the amendment is no longer necessary for the provision of certain tax benefits because of the repeal of Section 382 of the Code, (iii) the first day of a taxable year as to which our Board of Directors determines that no tax benefits may be carried forward, or (iv) such other date as our Board determines that the amendment is no longer necessary for the preservation of tax benefits.
The rights issued pursuant to the Rights Agreement will expire on May 31, 2019. However, our Board of Directors has the power to accelerate or extend the expiration date of the rights. In addition, a board committee composed solely of independent directors reviews the Rights Agreement at least once every three years to determine whether to modify the Rights Plan in light of all relevant factors. This review was most recently conducted in November 2015. The next review is required by the end of 2018.
Protective Amendment to Charter
On May 9, 2013, we filed an amendment to our Restated Certificate of Incorporation, or the Protective Amendment, that restricts certain transfers of our common stock. The Protective Amendment is intended to protect the tax benefits of our NOL carryforwards. See Note 15 for a description of our NOL carryforwards. Subject to certain limited exceptions, the Protective Amendment's transfer restrictions restrict any person from transferring our common stock (or any interest in our common stock) if the transfer would result in a stockholder (or several stockholders, in the aggregate, who hold their stock as a “group” under Section 382 of the Code) owning 4.9% or more of our common stock. Any direct or indirect transfer attempted in violation of the Protective Amendment would be void as of the date of the prohibited transfer as to the purported transferee, and the purported transferee would not be recognized as the owner of the shares attempted to be owned in violation of the Protective Amendment for any purpose, including for purposes of voting and receiving dividends or other distributions in respect of that common stock, or in the case of options, receiving our common stock in respect of their exercise. The Protective Amendment is effective until the earlier of (i) May 9, 2016, (ii) the repeal of Section 382 of the Code if our Board of Directors determines that the Protective Amendment is no longer necessary for the preservation of tax benefits, (iii) the first day of a taxable year as to which our Board of Directors determines that no tax benefits may be carried forward, or (iv) such other date as determined by our Board of Directors pursuant to the Protective Amendment. On November 12, 2015, our Board of
86
Directors also recommended that stockholders vote to extend the Protective Amendment until May 31, 2019 (subject to other earlier termination events as described in the Protective Amendment).
Treatment of Berkshire Hathaway under Rights Agreement and Protective Amendment
Berkshire Hathaway and certain of its affiliates may acquire beneficial ownership of up to 50% of our voting stock on a fully-diluted basis without triggering the ownership thresholds in the Protective Amendment or Rights Agreement, and may acquire beneficial ownership of more than 50% of our voting stock on a fully-diluted basis without triggering the ownership thresholds in the Protective Amendment or Rights Agreement through an offer to purchase all of our common stock that remains open for at least 60 days, in each case subject to specified exceptions.
18. Lease Commitments
We lease some of our offices, buildings, machinery and equipment, and autos under noncancelable operating leases. These leases have various terms and renewal options. Lease expense amounted to $75 million in 2015, $75 million in 2014 and $73 million in 2013. Future minimum lease payments required under operating leases with initial or remaining noncancelable terms in excess of one year as of December 31, 2015 were as follows:
(millions) | 2016 | 2017 | 2018 | 2019 | 2020 | After 2020 | |||||||||||||||||
Future minimum lease payments | $ | 72 | $ | 65 | $ | 53 | $ | 40 | $ | 26 | $ | 32 | |||||||||||
19. Litigation
WALLBOARD PRICING CLASS ACTION LAWSUITS
In late 2012, USG Corporation and United States Gypsum Company were named as defendants in putative class action lawsuits alleging that since at least September 2011, U.S. wallboard manufacturers conspired to fix and raise the price of gypsum wallboard sold in the United States and to effectuate the alleged conspiracy by ending the practice of providing job quotes on wallboard. These lawsuits, brought on behalf of direct and indirect wallboard purchasers in the U.S., were consolidated for pretrial proceedings in multi-district litigation in the United States District Court for the Eastern District of Pennsylvania, under the title In re: Domestic Drywall Antitrust Litigation, MDL No. 2437. Similar lawsuits have been filed in Quebec, Ontario and British Columbia courts on behalf of purchasers of wallboard in Canada. The Canadian lawsuits also name as defendants CGC Inc., our Canadian operating subsidiary, as well as other Canadian and U.S. wallboard manufacturers.
USG has denied the allegations made in these wallboard pricing lawsuits, believes these cases are without merit, and that USG’s pricing and selling policies were and are made independently and in full compliance with the law. Class action antitrust litigation in the United States, however, is expensive, protracted, and carries the risk of triple damages and joint and several liability. To avoid the expense, risk and further distraction of management, in late 2014, we agreed to a settlement of the U.S. class actions, and in the third quarter of 2014, we recorded a $48 million charge for the settlements ($39.25 million for the direct purchaser settlement and $8.75 million for the indirect purchaser settlement). In 2015, the court entered final judgment orders approving both the direct and indirect purchaser settlements. No member of the direct purchaser class appealed from the final judgment order approving the direct purchaser settlement, and therefore, that settlement is final. One person appealed from the final judgment order approving the indirect purchaser settlement, and therefore that settlement is not yet final. We believe that the appeal is without merit and that the indirect purchaser settlement order will be affirmed on appeal, but the indirect purchaser settlement will not become final unless and until the appeal is favorably resolved.
The settlement of the U.S. class action lawsuits described above does not include the Canadian lawsuits. At this stage of the Canadian lawsuits, we are not able to estimate the amount, if any, of any reasonably possible loss or range of reasonably possible losses. We believe, however, that these Canadian lawsuits will not have a material effect on our business, financial condition, operating results or cash flows.
In addition to the class action lawsuits, in the first quarter of 2015, USG, United States Gypsum Company, L&W Supply Corporation, and seven other wallboard manufacturers were named as defendants in a lawsuit filed in federal court in California by twelve homebuilders asserting individual claims similar to the claims asserted in the U.S. class action lawsuits. The lawsuit has been transferred to the United States District Court for the Eastern District of Pennsylvania that is presiding over the U.S. class action lawsuits. We believe that the cost, if any, of resolving these homebuilders’ claims will not materially increase our exposure above the $48 million agreed to in the U.S. class action settlements.
87
ENVIRONMENTAL LITIGATION
We have been notified by state and federal environmental protection agencies of possible involvement as one of numerous “potentially responsible parties” in a number of Superfund sites in the United States. As a potentially responsible party, we may be responsible to pay for some part of the cleanup of hazardous waste at those sites. In most of these sites, our involvement is expected to be minimal. In addition, we are involved in environmental cleanups of other property that we own or owned. As of December 31, 2015 and December 31, 2014, we had an accrual of $16 million for our probable and reasonably estimable liability in connection with these matters. Our accruals take into account all known or estimated undiscounted costs associated with these sites, including site investigations and feasibility costs, site cleanup and remediation, certain legal costs, and fines and penalties, if any. However, we continue to review these accruals as additional information becomes available and revise them as appropriate. Based on the information known to us, we believe these environmental matters will not have a material effect on our results of operations, financial position or cash flows.
OTHER LITIGATION
We are named as defendants in other claims and lawsuits arising from our operations, including claims and lawsuits arising from the operation of our vehicles, product performance or warranties, personal injury and commercial disputes. We believe that we have properly accrued for our probable liability in connection with these claims and suits, taking into account the probability of liability, whether our exposure can be reasonably estimated and, if so, our estimate of our liability or the range of our liability. We do not expect these or any other litigation matters involving USG to have a material effect on our results of operations, financial position or cash flows.
20. Quarterly Financial Data (unaudited)
Quarter | |||||||||||||||
(millions, except per-share data) | First | Second | Third | Fourth | |||||||||||
2015 | |||||||||||||||
Net sales | $ | 909 | $ | 970 | $ | 972 | $ | 925 | |||||||
Gross profit | 153 | 183 | 183 | 172 | |||||||||||
Operating profit | 76 | 105 | 102 | 98 | |||||||||||
Income from continuing operations (b) | 24 | 79 | 76 | 812 | |||||||||||
Loss from discontinued operations, net of tax | — | — | — | — | |||||||||||
Net income attributable to USG (b) | 24 | 79 | 76 | 812 | |||||||||||
Income from continuing operations per common share: | |||||||||||||||
Basic (a) | 0.16 | 0.54 | 0.52 | 5.58 | |||||||||||
Diluted (a) | 0.16 | 0.54 | 0.52 | 5.51 | |||||||||||
2014 | |||||||||||||||
Net sales | $ | 850 | $ | 948 | $ | 972 | $ | 954 | |||||||
Gross profit | 143 | 175 | 176 | 160 | |||||||||||
Operating profit (loss) (c) | 66 | 98 | 22 | (24 | ) | ||||||||||
Income (loss) from continuing operations (c) | 45 | 58 | (11 | ) | (53 | ) | |||||||||
Loss from discontinued operations, net of tax | — | (1 | ) | — | — | ||||||||||
Net income (loss) attributable to USG (c) | 45 | 57 | (12 | ) | (53 | ) | |||||||||
Income (loss) from continuing operations per common share: | |||||||||||||||
Basic (a) | 0.33 | 0.40 | (0.09 | ) | (0.36 | ) | |||||||||
Diluted (a) | 0.32 | 0.39 | (0.09 | ) | (0.36 | ) | |||||||||
(a) | The sum of the four quarters is not necessarily the same as the total for the year. |
(b) | Income from continuing operations and net income attributable to USG for the fourth quarter of 2015 included a reversal of an income tax valuation allowance of $731 million. |
(c) | Operating profit (loss), income (loss) from continuing operations, and net income (loss) attributable to USG for the third quarter of 2014 included a litigation settlement charge of $48 million and long-lived asset impairment charges of $30 million and for the fourth quarter of 2014 included a long-lived asset impairment charge of $60 million, contract termination charge and loss of receivable of $15 million, and pension settlement charges of $13 million. |
88
REPORT OF INDEPENDENT REGISTERED PUBLIC ACCOUNTING FIRM
To the Board of Directors and Stockholders of USG Corporation:
We have audited the accompanying consolidated balance sheets of USG Corporation and subsidiaries (the “Corporation”) as of December 31, 2015 and 2014, and the related consolidated statements of operations, comprehensive income (loss), stockholders’ equity, and cash flows for each of the three years in the period ended December 31, 2015. Our audits also included the financial statement Schedule II-Valuation and Qualifying Accounts. These consolidated financial statements and financial statement schedule are the responsibility of the Corporation’s management. Our responsibility is to express an opinion on the financial statements and financial statement schedule based on our audits.
We conducted our audits in accordance with the standards of the Public Company Accounting Oversight Board (United States). Those standards require that we plan and perform the audit to obtain reasonable assurance about whether the financial statements are free of material misstatement. An audit includes examining, on a test basis, evidence supporting the amounts and disclosures in the financial statements. An audit also includes assessing the accounting principles used and significant estimates made by management, as well as evaluating the overall financial statement presentation. We believe that our audits provide a reasonable basis for our opinion.
In our opinion, such consolidated financial statements present fairly, in all material respects, the financial position of USG Corporation and subsidiaries as of December 31, 2015 and 2014, and the results of their operations and their cash flows for each of the three years in the period ended December 31, 2015, in conformity with accounting principles generally accepted in the United States of America. Also, in our opinion, such financial statement schedule, when considered in relation to the basic consolidated financial statements taken as a whole, presents fairly, in all material respects, the information set forth therein.
We have also audited, in accordance with the standards of the Public Company Accounting Oversight Board (United States), the Corporation’s internal control over financial reporting as of December 31, 2015, based on the criteria established in Internal Control — Integrated Framework (2013) issued by the Committee of Sponsoring Organizations of the Treadway Commission and our report dated February 10, 2016 expressed an unqualified opinion on the Corporation’s internal control over financial reporting.
/s/ DELOITTE & TOUCHE LLP
Chicago, Illinois
February 10, 2016
89
USG CORPORATION
SCHEDULE II - VALUATION AND QUALIFYING ACCOUNTS
Additions | |||||||||||||||
(millions) | Balance at beginning of period | Charged to costs and expenses | Charged to other accounts | Deductions (a) | Balance at end of period | ||||||||||
Year ended December 31, 2015: | |||||||||||||||
Doubtful accounts | $ | 20 | (6 | ) | — | (3 | ) | 11 | |||||||
Cash discounts | 2 | 49 | — | (48 | ) | 3 | |||||||||
Income tax valuation allowance | 1,023 | — | — | (948 | ) | 75 | |||||||||
Year ended December 31, 2014: | |||||||||||||||
Doubtful accounts | 10 | 9 | 1 | — | 20 | ||||||||||
Cash discounts | 2 | 45 | — | (45 | ) | 2 | |||||||||
Income tax valuation allowance | 995 | 1 | 112 | (85 | ) | 1,023 | |||||||||
Year ended December 31, 2013: | |||||||||||||||
Doubtful accounts | 14 | — | 1 | (5 | ) | 10 | |||||||||
Cash discounts | 2 | 42 | — | (42 | ) | 2 | |||||||||
Income tax valuation allowance | 1,125 | (2 | ) | — | (128 | ) | 995 | ||||||||
(a) | Reflects receivables written off as related to doubtful accounts, discounts allowed as related to cash discounts and reductions in the income tax valuation allowance. |
90
Item 9. | CHANGES IN AND DISAGREEMENTS WITH ACCOUNTANTS ON ACCOUNTING AND FINANCIAL DISCLOSURE |
None
Item 9A. | CONTROLS AND PROCEDURES |
Evaluation of Disclosure Controls and Procedures
Our Chief Executive Officer and Chief Financial Officer, after evaluating the effectiveness of our “disclosure controls and procedures” (as defined in Rule 13a-15(e) promulgated under the Securities Exchange Act of 1934, or the Act), have concluded that, as of the end of the fiscal year covered by this report, our disclosure controls and procedures were effective to provide reasonable assurance that information required to be disclosed by us in the reports that we file or submit under the Act is recorded, processed, summarized and reported within the time periods specified in the Securities and Exchange Commission’s rules and forms. Disclosure controls and procedures include, without limitation, controls and procedures designed to ensure that information required to be disclosed by an issuer in the reports that it files or submits under the Act is accumulated and communicated to the issuer’s management, including its principal executive officer or officers and principal financial officer or officers, or persons performing similar functions, as appropriate to allow timely decisions regarding required disclosure.
(a) | MANAGEMENT REPORT ON INTERNAL CONTROL OVER FINANCIAL REPORTING |
Our management is responsible for establishing and maintaining adequate internal control over financial reporting. Our internal control system was designed to provide reasonable assurance to management and our Board of Directors regarding the preparation and fair presentation of published financial statements.
All internal control systems, no matter how well designed, have inherent limitations. Therefore, even those systems determined to be effective can provide only reasonable assurance with respect to financial statement preparation and presentation.
Management assessed the effectiveness of our internal control over financial reporting as of December 31, 2015. In making this assessment, management used the criteria established in Internal Control - Integrated Framework (2013) issued by the Committee of Sponsoring Organizations of the Treadway Commission. Based on its assessment, management believes that, as of December 31, 2015, our internal control over financial reporting is effective based on those criteria.
Our independent registered public accounting firm has issued an attestation report on our internal control over financial reporting. This report appears below.
February 10, 2016
91
REPORT OF INDEPENDENT REGISTERED PUBLIC ACCOUNTING FIRM
To the Board of Directors and Stockholders of USG Corporation:
We have audited the internal control over financial reporting of USG Corporation and subsidiaries (the “Corporation”) as of December 31, 2015, based on criteria established in Internal Control — Integrated Framework (2013) issued by the Committee of Sponsoring Organizations of the Treadway Commission. The Corporation’s management is responsible for maintaining effective internal control over financial reporting and for its assessment of the effectiveness of internal control over financial reporting, included in the accompanying Management Report on Internal Control Over Financial Reporting. Our responsibility is to express an opinion on the Corporation’s internal control over financial reporting based on our audit.
We conducted our audit in accordance with the standards of the Public Company Accounting Oversight Board (United States). Those standards require that we plan and perform the audit to obtain reasonable assurance about whether effective internal control over financial reporting was maintained in all material respects. Our audit included obtaining an understanding of internal control over financial reporting, assessing the risk that a material weakness exists, testing and evaluating the design and operating effectiveness of internal control based on the assessed risk, and performing such other procedures as we considered necessary in the circumstances. We believe that our audit provides a reasonable basis for our opinion.
A corporation’s internal control over financial reporting is a process designed by, or under the supervision of, the corporation’s principal executive and principal financial officers, or persons performing similar functions, and effected by the corporation’s board of directors, management, and other personnel to provide reasonable assurance regarding the reliability of financial reporting and the preparation of financial statements for external purposes in accordance with generally accepted accounting principles. A corporation’s internal control over financial reporting includes those policies and procedures that (1) pertain to the maintenance of records that, in reasonable detail, accurately and fairly reflect the transactions and dispositions of the assets of the corporation; (2) provide reasonable assurance that transactions are recorded as necessary to permit preparation of financial statements in accordance with generally accepted accounting principles, and that receipts and expenditures of the corporation are being made only in accordance with authorizations of management and directors of the corporation; and (3) provide reasonable assurance regarding prevention or timely detection of unauthorized acquisition, use, or disposition of the corporation’s assets that could have a material effect on the financial statements.
Because of the inherent limitations of internal control over financial reporting, including the possibility of collusion or improper management override of controls, material misstatements due to error or fraud may not be prevented or detected on a timely basis. Also, projections of any evaluation of the effectiveness of the internal control over financial reporting to future periods are subject to the risk that the controls may become inadequate because of changes in conditions, or that the degree of compliance with the policies or procedures may deteriorate.
In our opinion, the Corporation maintained, in all material respects, effective internal control over financial reporting as of December 31, 2015, based on the criteria established in Internal Control — Integrated Framework (2013) issued by the Committee of Sponsoring Organizations of the Treadway Commission.
We have also audited, in accordance with the standards of the Public Company Accounting Oversight Board (United States), the consolidated financial statements and financial statement schedule as of and for the year ended December 31, 2015 of the Corporation and our report dated February 10, 2016 expressed an unqualified opinion on those financial statements and financial statement schedule.
/s/ DELOITTE & TOUCHE LLP
Chicago, Illinois
February 10, 2016
92
(c) | CHANGES IN INTERNAL CONTROL OVER FINANCIAL REPORTING |
There were no changes in our “internal control over financial reporting” (as defined in Rule 13a-15(f) promulgated under the Act) identified in connection with the evaluation required by Rule 13a-15(d) promulgated under the Act that occurred during the fiscal quarter ended December 31, 2015 that have materially affected, or are reasonably likely to materially affect, our internal control over financial reporting.
Item 9B. | OTHER INFORMATION |
On February 10, 2016, our Board of Directors (the "Board") approved our 2016 Annual Management Incentive Program (the "2016 Program"), upon the recommendation of the Compensation and Organization Committee of the Board. Under the 2016 Program, 50% of the par incentive award for each of USG’s named executive officers is based on a formula related to adjusted consolidated net earnings and 50% is based on specified operating and financial targets. The Board also approved the following operating and financial targets for USG’s named executive officers under the 2016 Program: Adjusted operating margin for consolidated, Gypsum, Ceilings and L&W Supply operations, USG Boral Building Products adjusted equity income, wallboard cost, working capital/cash conversion cycle and selling, general and administrative expenses. Each named executive officer has been assigned two to five of these targets, as applicable.
93
PART III
Item 10. | DIRECTORS, EXECUTIVE OFFICERS AND CORPORATE GOVERNANCE |
Executive Officers of the Registrant (as of February 10, 2016):
Name | Age | Position | ||
James S. Metcalf | 58 | Chairman of the Board of Directors, President and Chief Executive Officer | ||
Matthew F. Hilzinger | 52 | Executive Vice President and Chief Financial Officer | ||
Brian J. Cook | 58 | Senior Vice President and Chief Administrative Officer | ||
Dominic A. Dannessa | 59 | Senior Vice President, Operations and Chief Technology Officer | ||
Jennifer F. Scanlon | 49 | Senior Vice President, President, International and President, L&W Supply Corporation | ||
Michelle M. Warner | 49 | Senior Vice President, General Counsel and Corporate Secretary | ||
Kenneth R. Banas | 41 | Vice President and Treasurer | ||
Mary A. Martin | 60 | Vice President and Associate General Counsel | ||
Jeanette A. Press | 40 | Vice President and Controller | ||
Chris A. Rosenthal | 52 | Vice President, Human Resources | ||
Gregory D. Salah | 53 | Vice President and General Manager, North America | ||
Srinivas Veeramasuneni | 51 | Vice President, Corporate Innovation Center | ||
Business Experience During the Last Five Years:
James S. Metcalf has served as Chairman of the Board of Directors since December 2011 and as President and Chief Executive Officer since January 2011. Prior thereto Mr. Metcalf was President and Chief Operating Officer of the Company.
Matthew F. Hilzinger joined USG as Executive Vice President in April 2012 and became Chief Financial Officer in May 2012. Prior to joining USG, he held various positions at Exelon Corporation, a utility services holding company engaged in the energy generation and delivery businesses, including serving as Executive Vice President and Chief Integration Officer in March 2012 and Senior Vice President and Chief Financial Officer prior thereto.
Brian J. Cook has served as Senior Vice President and Chief Administrative Officer since September 2015. He previously held a variety of human resources and labor relations positions at USG, including Senior Vice President, Human Resources and Communications from May 2013 to August 2015 and Senior Vice President, Human Resources prior thereto.
Dominic A. Dannessa has served as Senior Vice President, Operations and Chief Technology Officer since September 2015. He also oversees USG’s Corporate Innovation Center in Libertyville, IL. Prior thereto Mr. Dannessa served as Senior Vice President and Chief Technology Officer.
Jennifer F. Scanlon has served as Senior Vice President since October 2013 and President, International since September 2010. Ms. Scanlon was appointed as President of L&W Supply Corporation in July 2015 and has served as the chairman of the board of USG Boral Building Products since its inception.
Michelle M. Warner joined USG as Senior Vice President, General Counsel and Corporate Secretary in January 2016. Prior to joining USG, she served in various roles at Motorola Solutions, Inc., a provider of communication infrastructure, devices, accessories, software and services, including Corporate Vice President, Deputy General Counsel and Secretary from June 2013 to December 2015 and Corporate Vice President, Law, Corporate, Securities and Transactions prior thereto.
Kenneth R. Banas has served as Vice President and Treasurer since January 2015. He previously served in various roles at USG, including Treasurer from April 2013 to December 2014, Senior Director, Investor Relations from December 2011 to March 2013 and Senior Director EPMO from May 2010 to November 2011.
Mary A. Martin has served as Vice President and Associate General Counsel since July 2009.
94
Jeanette A. Press has served as Vice President and Controller since January 2015. She previously served as Controller from September 2012 to December 2014 and Senior Director, Accounting and Reporting from March 2011 to August 2012. Prior to joining USG she served as Audit Senior Manager at KPMG LLP, a professional services company that provides audit, tax and advisory services.
Chris A. Rosenthal has served as Vice President, Human Resources since September 2015. He previously held various roles at USG, including Vice President, Compensation, Benefits and Corporate Services from January 2015 to August 2015, Senior Director Compensation, Benefits and Corporate Services from March 2014 to December 2014, Senior Director HR Operations from September 2012 to February 2014 and Vice President, HR, L&W Supply Corporation prior thereto.
Gregory D. Salah has served as Vice President and General Manager, North America since August 2015. Previously he served in various roles at USG, including Senior Vice President & General Manager, North American Wallboard & Surfaces, United States Gypsum Company, from December 2014 to July 2015, General Manager, US Wallboard & Surfaces from January 2013 to November 2014 and Senior Vice President, Sales and Marketing, Building Systems prior thereto.
Srinivas Veeramasuneni has served as Vice President, Corporate Innovation Center since January 2015. He previously served in various roles at USG, including Senior Director, Corporate Innovation Center from December 2013 to December 2014 and Senior Director, Research prior thereto.
Committee Charters and Code of Business Conduct
Our Corporate Code of Business Conduct (applicable to directors, officers and employees), our Corporate Governance Guidelines and the charters of the committees of our Board of Directors, including the Audit Committee, Governance Committee, Compensation and Organization Committee and Finance Committee, are available through the “Investor Relations” and “Corporate Governance” links in the “Company Information” section of our Web site at www.usg.com. We will post any amendments to the Corporate Code of Business Conduct, and any waivers that are required to be disclosed by the rules of the Securities and Exchange Commission, the NYSE or the Chicago Stock Exchange, on our Web site.
Other information required by this Item 10 is included under the headings “Director Nominees and Directors Continuing in Office,” “Committees of the Board of Directors,” “Audit Committee” and “Section 16(a) Beneficial Ownership Reporting Compliance” in the definitive Proxy Statement for our annual meeting of stockholders scheduled to be held on May 11, 2016, which information is incorporated herein by reference.
Item 11. | EXECUTIVE COMPENSATION |
Information required by this Item 11 is included under the heading “Compensation of Executive Officers and Directors” in the definitive Proxy Statement for our annual meeting of stockholders scheduled to be held on May 11, 2016, which information is incorporated herein by reference.
95
Item 12. | SECURITY OWNERSHIP OF CERTAIN BENEFICIAL OWNERS AND MANAGEMENT AND RELATED STOCKHOLDER MATTERS |
The following table sets forth information as of December 31, 2015 about equity securities that may be issued upon exercise of options under our Long-Term Incentive Plan, which was approved by our stockholders, and deferred stock units issued under our Non-Employee Director Compensation Program. The features of these plans are discussed further in Part II, Item 8, Financial Statements and Supplementary Data, Note 10, Share-Based Compensation.
Plan Category | Number of securities to be issued upon exercise of outstanding options and rights (a) | Weighted average exercise price of outstanding options and rights (b) | Number of securities remaining available for future issuance under equity compensation plans (excluding securities reported in column one) | ||||||
Equity compensation plans approved by stockholders | 3,362,576 | $ | 28.51 | 2,903,962 | |||||
Equity compensation plans not approved by stockholders | 193,117 | — | — | ||||||
Total | 3,555,693 | $ | 28.51 | 2,903,962 | |||||
(a) | Equity compensation plans not approved by stockholders includes an aggregate of 192,506 fully vested deferred stock units granted to our non-employee directors that are payable in cash or shares of common stock, at each director’s option, following termination of service as a director. Amount does not include an aggregate of 611 fully vested deferred stock units granted to our non-employee directors that must be settled in cash. |
(b) | Weighted-average exercise price calculation for equity compensation plans not approved by stockholders does not reflect the inclusion of fully-vested deferred stock units granted to our non-employee directors because that type of award does not have an exercise feature. |
Other information required by this Item 12 is included under the heading "Securities Ownership” in the definitive Proxy Statement for our annual meeting of stockholders scheduled to be held on May 11, 2016, which information is incorporated herein by reference.
Item 13. | CERTAIN RELATIONSHIPS AND RELATED TRANSACTIONS, AND DIRECTOR INDEPENDENCE |
Information required by this Item 13 is included under the heading “Certain Relationships and Related Transactions” and “Director Independence” in the definitive Proxy Statement for our annual meeting of stockholders scheduled to be held on May 11, 2016, which information is incorporated herein by reference.
Item 14. | PRINCIPAL ACCOUNTING FEES AND SERVICES |
Information required by this Item 14 is included under the heading “Independent Registered Public Accounting Firm Fees and Services” in the definitive Proxy Statement for our annual meeting of stockholders scheduled to be held on May 11, 2016, which information is incorporated herein by reference.
96
PART IV
Item 15. | EXHIBITS AND FINANCIAL STATEMENT SCHEDULES |
(a) | 1 and 2. See Part II, Item 8, Financial Statements and Supplementary Data, for an index of our consolidated financial statements and supplementary data schedule. |
3. The information in the Exhibit Index of this Annual Report on Form 10-K is incorporated into this Item 15(a)3 by reference.
(b) | The information in the Exhibit Index of this Annual Report on Form 10-K is incorporated into this Item 15(b) by reference. |
(c) | Separate financial statements of subsidiaries not consolidated and fifty percent or less owned persons. |
(i) The consolidated financial statements of USG Boral Building Products Pte. as of and for the year ended June 30, 2015 and as of and for the period from January 14, 2014 to June 30, 2014, including the report of Deloitte & Touche, independent certified public accountants, as of and for the period from January 14, 2014 to June 30, 2014, filed pursuant to Rule 3-09 of Regulation S-X, are incorporated by reference to Exhibit 99.1.
(ii) The consolidated financial statements of USG Boral Building Products Pty Limited as of and for the year ended June 30, 2015 and 2014, including the report of KPMG, independent auditors, as of and for the year ended June 30, 2014, filed pursuant to Rule 3-09 of Regulation S-X, are incorporated by reference to Exhibit 99.2.
97
SIGNATURES
Pursuant to the requirements of Section 13 or 15(d) of the Securities Exchange Act of 1934, the Registrant has duly caused this report to be signed on its behalf by the undersigned, thereunto duly authorized.
USG CORPORATION | ||
February 10, 2016 | ||
By: | /s/ Matthew F. Hilzinger | |
Matthew F. Hilzinger | ||
Executive Vice President and | ||
Chief Financial Officer | ||
Pursuant to the requirements of the Securities Exchange Act of 1934, this report has been signed below by the following persons on behalf of the Registrant and in the capacities and on the date indicated.
/s/ James S. Metcalf | February 10, 2016 | |
JAMES S. METCALF | ||
Director, Chairman, President and | ||
Chief Executive Officer | ||
(Principal Executive Officer) | ||
/s/ Matthew F. Hilzinger | February 10, 2016 | |
MATTHEW F. HILZINGER | ||
Executive Vice President and | ||
Chief Financial Officer | ||
(Principal Financial Officer) | ||
/s/ Jeanette A. Press | February 10, 2016 | |
JEANETTE A. PRESS | ||
Vice President and Controller | ||
(Principal Accounting Officer) | ||
JOSE ARMARIO, THOMAS A. BURKE, | By: | /s/ Matthew F. Hilzinger |
MATTHEW CARTER JR., | Matthew F. Hilzinger | |
GRETCHEN R. HAGGERTY, | Attorney-in-fact | |
WILLIAM H. HERNANDEZ, BRIAN A. KENNEY, | February 10, 2016 | |
RICHARD P. LAVIN, STEVEN F. LEER | ||
Directors | ||
98
EXHIBIT INDEX
Exhibit Number | Exhibit | |
2.1 | Share Sale and Subscription Agreement, dated as of October 17, 2013, by and among USG Corporation, USG Netherlands Global Holdings B.V., Boral Limited, Boral International Pty Limited, and Boral Gypsum Asia Sdn Bhd (incorporated by reference to Exhibit 2.1 to USG Corporation's Current Report on Form 8-K dated October 16, 2013) † | |
2.2 | Share Sale and Subscription Agreement, dated as of October 17, 2013, by and among USG Corporation, USG Foreign Investments, Ltd., USG Netherlands Global Holdings B.V., Boral Limited, Boral Building Materials Pty Limited, and Boral Australian Gypsum Limited (incorporated by reference to Exhibit 2.2 to USG Corporation's Current Report on Form 8-K dated October 16, 2013) † | |
3.1 | Restated Certificate of Incorporation of USG Corporation (incorporated by reference to Exhibit 3.01 to USG Corporation’s Current Report on Form 8-K filed June 21, 2006) | |
3.2 | Certificate of Correction of the Restated Certificate of Incorporation of USG Corporation (incorporated by reference to Exhibit 4.1 to USG Corporation’s Quarterly Report on Form 10-Q dated August 3, 2011) | |
3.3 | Amendment to Restated Certificate of Incorporation of USG (incorporated by reference to Exhibit 3.1 to USG Corporation's Current Report on Form 8-K dated May 10, 2013) | |
3.4 | Amended and Restated By-Laws of the Company, dated as of November 13, 2014 (incorporated by reference to Exhibit 3.1 to USG Corporation’s Current Report on Form 8-K dated November 18, 2014) | |
4.1 | Form of Common Stock certificate (incorporated by reference to Exhibit 4.1 to USG Corporation’s Annual Report on Form 10-K dated February 16, 2007, or the 2006 Form 10-K) | |
4.2 | Rights Agreement, dated as of December 21, 2006, between USG Corporation and Computershare Investor Services, LLC, as Rights Agent (incorporated by reference to Exhibit 4.1 to USG Corporation’s Registration Statement on Form 8-A dated December 21, 2006) | |
4.3 | Amendment No. 1 to Rights Agreement, dated as of December 5, 2008, to the Rights Agreement, dated as of December 21, 2006, by and between USG Corporation and Computershare Investor Services, LLC, as Rights Agent (incorporated by reference to Exhibit 4.1 to USG Corporation’s Amendment No. 1 to Form 8-A dated December 5, 2008) | |
4.4 | Amendment No. 2 to Rights Agreement, dated as of March 22, 2013, between USG Corporation and Computershare Trust Company, N.A., as rights agent (successor-in-interest to Computershare Investor Services LLC) (incorporated by reference to Exhibit 4.1 to USG Corporation’s Amendment No. 2 to Form 8-A dated March 22, 2013) | |
4.5 | Amendment No. 3 to Rights Agreement, dated as of February 11, 2015 between USG Corporation and Computershare Trust Company, N.A., as rights agent (successor-in-interest to Computershare Investor Services LLC) (incorporated by reference to Exhibit 4.1 to USG Corporation’s Amendment No. 3 to Form 8-A dated February 11, 2015) | |
4.6 | Amendment No. 4 to Rights Agreement, dated as of November 16, 2015 between USG Corporation and Computershare Trust Company, N.A., as rights agent (successor-in-interest to Computershare Investor Services LLC) (incorporated by reference to Exhibit 4.1 to USG Corporation’s Amendment No. 4 to Form 8-A dated November 16, 2015) | |
4.7 | Indenture, dated as of November 1, 2006, by and between USG Corporation and Wells Fargo Bank, National Association, as trustee (incorporated by reference to Exhibit 4.01 to USG Corporation’s Current Report on Form 8-K dated November 20, 2006, or the November 2006 8-K) | |
4.8 | Supplemental Indenture No. 1, dated as of November 17, 2006, by and between USG Corporation and Wells Fargo Bank, National Association, as trustee (incorporated by reference to Exhibit 4.02 to the November 2006 8-K) | |
4.9 | Form of 7.750% Senior Note due 2018 (incorporated by reference to USG Corporation’s Current Report on Form 8-K dated September 26, 2007) | |
4.10 | Agreement of Resignation, Appointment and Acceptance, dated as of October 18, 2011, by and among USG Corporation, U.S. Bank National Association and HSBC Bank USA, National Association (incorporated by reference to Exhibit 4.1 to USG Corporation’s Quarterly Report on Form 10-Q dated October 31, 2011) | |
4.11 | Supplemental Indenture No. 4, dated as of April 12, 2012, by and among USG Corporation, each of United States Gypsum Company, L&W Supply Corporation, USG Foreign Investments, Ltd. and USG Interiors, LLC, as guarantors, and U.S. Bank National Association, as trustee (incorporated by reference to Exhibit 4.1 to USG Corporation's Current Report on Form 8-K dated April 12, 2012) | |
4.12 | Supplemental Indenture No. 5, dated as of October 31, 2013, by and among USG Corporation, each of United States Gypsum Company, L&W Supply Corporation, USG Foreign Investments, Ltd. and USG Interiors, LLC, as guarantors, and U.S. Bank National Association, as trustee (incorporated by reference to Exhibit 4.1 to USG Corporation's Current Report on Form 8-K dated October 31, 2013) | |
4.13 | Supplemental Indenture No. 6, dated as of February 24, 2015, by and among USG Corporation, each of United States Gypsum Company, L&W Supply Corporation, USG Foreign Investments, Ltd. and USG Interiors, LLC, as guarantors, and U.S. Bank National Association, as trustee (incorporated by reference to Exhibit 4.1 to USG Corporation’s Current Report on Form 8-K dated February 24, 2015) | |
USG Corporation and certain of its consolidated subsidiaries are parties to other long-term debt instruments under which the total amount of securities authorized does not exceed 10% of the total assets of USG Corporation and its subsidiaries on a consolidated basis. Pursuant to paragraph (b)(4)(iii)(A) of Item 601 of Regulation S-K, USG Corporation agrees to furnish a copy of such instruments to the Securities and Exchange Commission upon request. | ||
10.1 | Amendment and Restatement of USG Corporation Supplemental Retirement Plan, effective as of January 1, 2007 and dated December 10, 2008 (incorporated by reference to Exhibit 10.1 to USG Corporation’s Annual Report on Form 10-K dated February 20, 2009, or the 2008 10-K) * | |
10.2 | Form of Employment Agreement (incorporated by reference to Exhibit 10.1 to USG Corporation’s Current Report on Form 8-K dated October 2, 2008, or the First October 2008 8-K) * | |
10.3 | Form of Employment Agreement (form used since January 1, 2015) (incorporated by reference to Exhibit 10.3 to USG Corporation's Quarterly Report on Form 10-Q dated July 23, 2015) * | |
10.4 | Form of Change in Control Severance Agreement (Tier 1 Benefits) (incorporated by reference to Exhibit 10.2 to the First October 2008 8-K) * | |
10.5 | Form of Change in Control Severance Agreement (Tier 2 Benefits) (incorporated by reference to Exhibit 10.3 to the First October 2008 8-K) * | |
10.6 | Form of Change in Control Severance Agreement (form used since August 1, 2015) (incorporated by reference to Exhibit 10.1 to USG Corporation's Quarterly Report on Form 10-Q dated October 22, 2015, or the third quarter 2015 10-Q) * | |
10.7 | Form of Indemnification Agreement (incorporated by reference to Exhibit 10.14 to USG Corporation’s Annual Report on Form 10-K dated February 15, 2008, or the 2007 10-K) * | |
10.8 | Employment Agreement, effective as of April 16, 2012, between USG Corporation and Matthew Hilzinger (incorporated by reference to Exhibit 10.1 to USG Corporation's Current Report on Form 8-K dated March 26, 2012, or the March 2012 8-K) * | |
10.9 | Change in Control Severance Agreement, dated as of April 16, 2012, between USG Corporation and Matthew Hilzinger (incorporated by reference to Exhibit 10.2 to the March 2012 8-K) * | |
10.10 | Agreement and General Release, dated as of August 4, 2015, by and between USG Corporation and Christopher R. Griffin (incorporated by reference to Exhibit 10.3 to the third quarter 2015 10-Q) * | |
10.11 | USG Corporation Stock Compensation Program for Non-Employee Directors (as Amended and Restated Effective as of January 1, 2005) (incorporated by reference to Exhibit 10.2 to USG Corporation’s Current Report on Form 8-K dated November 14, 2005) * | |
10.12 | Amendment No. 1 to the USG Corporation Stock Compensation Program for Non-Employee Directors (as Amended and Restated as of January 1, 2005) (incorporated by reference to Exhibit 10.1 to USG Corporation’s Quarterly Report on Form 10-Q dated August 3, 2006, or the second quarter 2006 10-Q) * | |
10.13 | Amendment No. 2 to the USG Corporation Stock Compensation Program for Non-Employee Directors (as Amended and Restated as of January 1, 2005) (incorporated by reference to Exhibit 10.8 to USG Corporation’s Quarterly Report on Form 10-Q dated April 30, 2007) * | |
10.14 | USG Corporation Non-Employee Director Compensation Program (Amended and Restated February 13, 2008) (incorporated by reference to Exhibit 10.18 to the 2007 10-K) * | |
10.15 | Amendment No. 1 to USG Corporation Non-Employee Director Compensation Program (as Amended and Restated February 13, 2008) (incorporated by reference to Exhibit 10.10 to USG Corporation’s Annual Report on Form 10-K dated February 11, 2011) * | |
10.16 | Amendment No. 2 to USG Corporation Non-Employee Director Compensation Program (as Amended and Restated February 13, 2008 and amended November 12, 2010) (incorporated by reference to Exhibit 10.11 to USG Corporation's Annual Report on Form 10-K dated February 14, 2012, or the 2011 10-K)* | |
10.17 | Amendment No. 3 to USG Corporation Non-Employee Director Compensation Program (as Amended and Restated February 13, 2008 and amended November 12, 2010 and November 10, 2011) (incorporated by reference to Exhibit 10.14 to USG Corporation’s Annual Report on Form 10-K dated March 3, 2014) * | |
10.18 | Amendment No. 4 to USG Corporation Non-Employee Director Compensation Program (as Amended and Restated February 13, 2008 and amended November 12, 2010, November 10, 2011 and November 14, 2013) (incorporated by reference to Exhibit 10.16 to USG Corporation’s Annual Report on Form 10-K dated February 12, 2015, or the 2014 10-K) * | |
10.19 | USG Corporation Deferred Compensation Program for Non-Employee Directors (as Amended and Restated effective December 31, 2008) (incorporated by reference to Exhibit 10.10 to the 2008 10-K) * | |
10.20 | Fourth Amendment and Restatement Agreement, dated as of October 22, 2014, among USG Corporation and CGC Inc., as borrowers, and JP Morgan Chase Bank, N.A. and JP Morgan Chase Bank, N.A., Toronto Branch, as administrative agents, and the lenders party thereto (incorporated by reference to Exhibit 10.18 to the 2014 10-K) | |
10.21 | Fourth Amended and Restated Credit Agreement, dated as of October 22, 2014, among USG Corporation and CGC Inc., as borrowers, JPMorgan Chase Bank, N.A. and JP Morgan Chase Bank, N.A., Toronto Branch, as administrative agents, the lenders party thereto and Bank of America, N.A. and Wells Fargo Bank, N.A., as co-syndication agents (incorporated by reference to Exhibit 10.19 to the 2014 10-K) | |
10.22 | Amended and Restated Guarantee Agreement dated as of October 22, 2014 among USG Corporation, CGC Inc., the subsidiary guarantors party thereto and JP Morgan Chase Bank, N.A., as administrative agent (incorporated by reference to Exhibit 10.20 to the 2014 10-K) | |
10.23 | U.S. Pledge and Security Agreement dated as of January 7, 2009 among USG Corporation, the other grantors party thereto and JPMorgan Chase Bank, N.A., as administrative agent (incorporated by reference to Exhibit 10.21 to the 2014 10-K) | |
10.24 | Canadian Pledge and Security Agreement dated as of October 22, 2014 among CGC Inc., the other grantors party thereto and JPMorgan Chase Bank, N.A., as administrative agent (incorporated by reference to Exhibit 10.22 to the 2014 10-K) | |
10.25 | 2015 Annual Management Incentive Program of USG Corporation (Executive Officers Only) (incorporated by reference to Exhibit 10.24 to the 2014 10-K) * | |
10.26 | 2016 Annual Management Incentive Program of USG Corporation (Executive Officers Only) * ** | |
10.27 | USG Corporation Deferred Compensation Plan (incorporated by reference to Exhibit 10.31 to the 2006 Form 10-K) * | |
10.28 | First Amendment of USG Corporation Deferred Compensation Plan, effective as of April 1, 2007 and dated December 10, 2008 (incorporated by reference to Exhibit 10.25 to the 2008 10-K) * | |
10.29 | Second Amendment of USG Corporation Deferred Compensation Plan, effective as of April 1, 2007 and dated September 5, 2012 (incorporated by reference to Exhibit 10.1 to USG Corporation's Quarterly Report on Form 10-Q dated October 23, 2014) * | |
10.30 | Third Amendment of USG Corporation Deferred Compensation Plan, effective as of April 1, 2007 and dated November 21, 2014 (incorporated by reference to Exhibit 10.28 to the 2014 10-K) * | |
10.31 | USG Corporation Long-Term Incentive Plan (as amended effective May 13, 2015) (incorporated by reference to Annex C to the Proxy Statement for the Annual Meeting of Stockholders of USG Corporation held on May 13, 2015, or the 2015 Proxy Statement) * | |
10.32 | Form of USG Corporation Nonqualified Stock Option Agreement (incorporated by reference to Exhibit 10.9 to the second quarter 2006 10-Q) * | |
10.33 | Form of USG Corporation Nonqualified Stock Option Agreement (incorporated by reference to Exhibit 10.1 to USG Corporation’s Current Report on Form 8-K dated March 28, 2007, or the March 2007 8-K) * | |
10.34 | Form of USG Corporation Restricted Stock Units Agreement (Annual Grant) (incorporated by reference to Exhibit 10.2 to the March 2007 8-K) * | |
10.35 | Form of USG Corporation Restricted Stock Units Agreement (Retention Grant) (incorporated by reference to Exhibit 10.3 to the March 2007 8-K) * | |
10.36 | Form of USG Corporation Nonqualified Stock Option Agreement (incorporated by reference to Exhibit 10.36 to the 2008 10-K) * | |
10.37 | Form of USG Corporation Restricted Stock Units Agreement (incorporated by reference to Exhibit 10.37 to the 2008 10-K) * | |
10.38 | Form of USG Corporation Nonqualified Stock Option Agreement (incorporated by reference to Exhibit 10.30 to USG Corporation’s Annual Report on Form 10-K dated February 12, 2010, or the 2009 10-K) * | |
10.39 | Form of USG Corporation Restricted Stock Units Agreement (incorporated by reference to Exhibit 10.31 to the 2009 10-K) * | |
10.40 | Form of Restricted Stock Units Agreement (incorporated by reference to Exhibit 10.7 to USG Corporation's Quarterly Report on Form 10-Q dated October 29, 2010) * | |
10.41 | Form of Amended and Restated Performance Based Restricted Stock Units Agreement (incorporated by reference to Exhibit 10.36 to the 2011 10-K) * | |
10.42 | Form of USG Corporation Performance Based Restricted Stock Units Agreement (incorporated by reference to Exhibit 10.2 to USG Corporation's Quarterly Report on Form 10-Q dated October 26, 2012, or the third quarter 2012 10-Q) * | |
10.43 | Form of USG Corporation Market Share Units Agreement (incorporated by reference to Exhibit 10.40 to USG Corporation's Annual Report on Form 10-K dated February 15, 2013, or the 2012 10-K) * | |
10.44 | Form of USG Corporation Performance Shares Agreement (incorporated by reference to Exhibit 10.41 to the 2012 10-K) * | |
10.45 | Form of USG Corporation Market Share Units Agreement (incorporated by reference to Exhibit 10.2 to USG Corporation's Current Report on Form 8-K dated February 13, 2014, or the February 2014 8-K) * | |
10.46 | Form of USG Corporation Performance Shares Agreement (incorporated by reference to Exhibit 10.3 to the February 2014 8-K) * | |
10.47 | Form of Restricted Stock Units Agreement (incorporated by reference to Exhibit 10.1 to USG Corporation's Quarterly Report on Form 10-Q dated July 24, 2014) * | |
10.48 | Form of USG Corporation Market Share Units Agreement (incorporated by reference to Exhibit 10.46 to the 2014 10-K) * | |
10.49 | Form of USG Corporation Performance Shares Agreement (incorporated by reference to Exhibit 10.47 to the 2014 10-K) * | |
10.50 | Changes to Equity Awards for Compliance With Section 409A (incorporated by reference to Exhibit 10.39 to the 2008 10-K) * | |
10.51 | USG Corporation Management Incentive Plan (as amended and restated effective May 13, 2015 (incorporated by reference to Annex B to the 2015 Proxy Statement) * | |
10.52 | Shareholder’s Agreement, entered into as of January 30, 2006, by and between USG Corporation and Berkshire Hathaway Inc. (incorporated by reference to Exhibit 10.3 to USG Corporation's Current Report on Form 8-K dated January 30, 2006) | |
10.53 | Amended and Restated Registration Rights Agreement, dated as of November 26, 2008, by and between USG Corporation and Berkshire Hathaway Inc. (incorporated by reference to Exhibit 10.1 to USG Corporation's Current Report on Form 8-K dated November 26, 2008) | |
10.54 | Direct Purchaser Settlement Agreement, dated February 11, 2015 (incorporated by reference to Exhibit 10.1 to USG Corporation’s Current Report on Form 8-K dated February 13, 2015, or the February 2015 8-K) | |
10.55 | Indirect Purchaser Settlement Agreement, dated February 11, 2015 (incorporated by reference to Exhibit 10.2 to the February 2015 8-K) | |
10.56 | Interest and Share Purchase Agreement, dated as of September 15, 2015, by and among USG Corporation, USG Ventures-Europe GmbH, Knauf Aquapanel GmbH, Knauf/USG Verwaltungs GmbH and Knauf/USG Systems GmbH & Co. KG (incorporated by reference to Exhibit 10.2 to the third quarter 2015 10-Q) | |
10.57 | Share and Asset Purchase Agreement, dated as of August 7, 2012, by and between USG Corporation and its indirect wholly owned subsidiaries, USG Foreign Investments, Ltd. and USG (U.K.) Ltd., and Knauf International GmbH and Knauf AMF Ceilings Ltd. (incorporated by reference to Exhibit 10.1 to the third quarter 2012 10-Q) | |
10.58 | Shareholders Agreement, dated as of February 28, 2014, by and among USG Corporation, Boral International Pty Limited, Boral Building Materials Pty Limited, USG Netherlands Global Holdings B.V., USG Boral Building Products Pte Limited, USG Boral Building Products Pty Limited, and Boral Limited (incorporated by reference to Exhibit 10.1 to USG Corporation's Current Report on Form 8-K filed February 28, 2014) (Note: Portions of this document have been omitted pursuant to a Request for Confidential Treatment filed with the Securities and Exchange Commission on February 28, 2014) | |
99.1 | Financial statements as of and for the year ended June 30, 2015 and audited financial statements as of and for the period from January 14, 2014 to June 30, 2014 of USG Boral Building Products Pte. ** | |
99.2 | Financial statements as of and for the year ended June 30, 2015 and audited financial statements as of and for the year ended June 30, 2014 of USG Boral Building Products Pty Limited ** | |
Other: | ||
21 | Subsidiaries ** | |
23.1 | Consent of Independent Registered Public Accounting Firm, Deloitte & Touche LLP ** | |
23.2 | Consent of Independent Registered Public Accounting Firm, Deloitte Malaysia** | |
23.3 | Consent of Independent Auditors, KPMG ** | |
24 | Power of Attorney ** | |
31.1 | Rule 13a - 14(a) Certifications of USG Corporation’s Chief Executive Officer ** | |
31.2 | Rule 13a - 14(a) Certifications of USG Corporation’s Chief Financial Officer ** | |
32.1 | Section 1350 Certifications of USG Corporation’s Chief Executive Officer ** | |
32.2 | Section 1350 Certifications of USG Corporation’s Chief Financial Officer ** | |
95 | Mine Safety Disclosures ** | |
101 | The following financial information from USG Corporation’s Annual Report on Form 10-K for the year ended December 31, 2015, formatted in XBRL (Extensible Business Reporting Language): (1) the consolidated statements of operations for the years ended December 31, 2015, 2014 and 2013, (2) the consolidated statements of other comprehensive income (loss) for the years ended December 31, 2015, 2014 and 2013, (3) the consolidated balance sheets as of December 31, 2015 and 2014, (4) the consolidated statements of cash flows for the years ended December 31, 2015, 2014 and 2013, (5) the consolidated statements of stockholders’ equity for the years ended December 31, 2015, 2014 and 2013 and (6) notes to the consolidated financial statements. ** | |
* | Management contract or compensatory plan or arrangement |
** | Filed or furnished herewith |
† | Schedules and other similar attachments have been omitted pursuant to Item 601(b)(2) of Regulation S-K. The registrant hereby undertakes to furnish supplementally copies of any of the omitted schedules and other similar attachments upon request by the Securities and Exchange Commission, provided that the registrant may request confidential treatment for any schedule or other similar attachment so furnished. |