Attached files
| file | filename |
|---|---|
| EX-21.1 - EXHIBIT 21.1 - Waste Connections US, Inc. | v429675_ex21-1.htm |
| EX-32.2 - EXHIBIT 32.2 - Waste Connections US, Inc. | v429675_ex32-2.htm |
| EX-31.1 - EXHIBIT 31.1 - Waste Connections US, Inc. | v429675_ex31-1.htm |
| EX-23.1 - EXHIBIT 23.1 - Waste Connections US, Inc. | v429675_ex23-1.htm |
| EX-12.1 - EXHIBIT 12.1 - Waste Connections US, Inc. | v429675_ex12-1.htm |
| EX-32.1 - EXHIBIT 32.1 - Waste Connections US, Inc. | v429675_ex32-1.htm |
| EX-31.2 - EXHIBIT 31.2 - Waste Connections US, Inc. | v429675_ex31-2.htm |
| EX-10.36 - EXHIBIT 10.36 - Waste Connections US, Inc. | v429675_ex10-36.htm |
| EX-10.37 - EXHIBIT 10.37 - Waste Connections US, Inc. | v429675_ex10-37.htm |
| EX-10.38 - EXHIBIT 10.38 - Waste Connections US, Inc. | v429675_ex10-38.htm |
UNITED STATES
SECURITIES AND EXCHANGE COMMISSION
Washington, D.C. 20549
FORM 10-K
(Mark One)
þ ANNUAL REPORT PURSUANT TO SECTION 13 OR 15(d) OF THE SECURITIES EXCHANGE ACT OF 1934
For the fiscal year ended December 31, 2015
OR
¨ TRANSITION REPORT PURSUANT TO SECTION 13 OR 15(d) OF THE SECURITIES EXCHANGE ACT OF 1934
For the transition period from ___________ to ___________
Commission File No. 1-31507

WASTE CONNECTIONS, INC.
(Exact name of registrant as specified in its charter)
| Delaware | 94-3283464 |
| (State or other jurisdiction | (I.R.S. Employer Identification No.) |
| of incorporation or organization) | |
| 3 Waterway Square Place, Suite 110 | |
| The Woodlands, Texas | 77380 |
| (Address of principal executive offices) | (Zip Code) |
(832) 442-2200
(Registrant's telephone number, including area code)
Securities registered pursuant to Section 12(b) of the Act:
| Common Stock, par value $0.01 per share (Title of each class) |
New York Stock Exchange (Name of each exchange on which registered) |
Securities registered pursuant to Section 12(g) of the Act: None
Indicate by check mark if the registrant is a well-known seasoned issuer, as defined in Rule 405 of the Securities Act.
Yes þ No ¨
Indicate by check mark if the registrant is not required to file reports pursuant to Section 13 or Section 15(d) of the Act.
Yes ¨ No þ
Indicate by check mark whether the registrant (1) has filed all reports required to be filed by Section 13 or 15(d) of the Securities Exchange Act of 1934 during the preceding 12 months (or for such shorter period that the registrant was required to file such reports), and (2) has been subject to such filing requirements for the past 90 days.
Yes þ No ¨
Indicate by check mark whether the registrant has submitted electronically and posted on its corporate Web site, if any, every Interactive Data File required to be submitted and posted pursuant to Rule 405 of Regulation S-T (§232.405 of this chapter) during the preceding 12 months (or for such shorter period that the registrant was required to submit and post such files).
Yes þ No ¨
Indicate by check mark if disclosure of delinquent filers pursuant to Item 405 of Regulation S-K is not contained herein, and will not be contained, to the best of registrant's knowledge, in definitive proxy or information statements incorporated by reference in Part III of this Form 10-K or any amendment to this Form 10-K. ¨
Indicate by check mark whether the registrant is a large accelerated filer, an accelerated filer, a non-accelerated filer, or a smaller reporting company. See the definitions of “large accelerated filer,” “accelerated filer” and “smaller reporting company” in Rule 12b-2 of the Exchange Act. (Check one):
| þ Large accelerated filer | ¨ Accelerated filer | ¨ Non-accelerated filer | ¨ Smaller reporting company |
Indicate by check mark whether the registrant is a shell company (as defined in Rule 12b-2 of the Exchange Act).
Yes ¨ No þ
As of June 30, 2015, the aggregate market value of voting and non-voting common stock held by non-affiliates of the registrant, based on the closing sales price for the registrant’s common stock, as reported on the New York Stock Exchange, was $5,778,923,129.
Number of shares of common stock outstanding as of January 29, 2016: 122,395,994
DOCUMENTS INCORPORATED BY REFERENCE
Portions of the registrant's definitive Proxy Statement for the 2016 Annual Meeting of Stockholders (which will be filed with the SEC pursuant to Regulation 14A of the Securities Exchange Act of 1934, as amended, or the Exchange Act, within 120 days after the end of our 2015 fiscal year) are incorporated by reference into Part III hereof.
WASTE CONNECTIONS, INC.
ANNUAL REPORT ON FORM 10-K
TABLE OF CONTENTS
| i |
Our Company
Waste Connections, Inc. is an integrated municipal solid waste, or MSW, services company that provides solid waste collection, transfer, disposal and recycling services primarily in exclusive and secondary markets in the U.S. and a leading provider of non-hazardous exploration and production, or E&P, waste treatment, recovery and disposal services in several of the most active natural resource producing areas of the U.S. We also provide intermodal services for the rail haul movement of cargo and solid waste containers in the Pacific Northwest through a network of intermodal facilities.
As of December 31, 2015, we served residential, commercial, industrial and E&P customers in 32 states: Alabama, Alaska, Arizona, Arkansas, California, Colorado, Idaho, Illinois, Iowa, Kansas, Kentucky, Louisiana, Massachusetts, Michigan, Minnesota, Mississippi, Montana, Nebraska, Nevada, New Mexico, New York, North Carolina, North Dakota, Oklahoma, Oregon, South Carolina, South Dakota, Tennessee, Texas, Utah, Washington and Wyoming. As of December 31, 2015, we owned or operated a network of 155 solid waste collection operations; 69 transfer stations; seven intermodal facilities, 37 recycling operations, 62 active MSW, E&P and/or non-MSW landfills, 24 E&P liquid waste injection wells and 20 E&P waste treatment and oil recovery facilities. Non-MSW landfills accept construction and demolition, industrial and other non-putrescible waste.
Our senior management team has extensive experience in operating, acquiring and integrating non-hazardous waste services businesses, and we intend to continue to focus our efforts on balancing internal and acquisition-based growth. As described below, we recently entered into an agreement providing for a business combination with Progressive Waste Solutions Ltd. We anticipate that a part of our future growth will come from acquiring additional MSW and E&P waste businesses and, therefore, we expect that additional acquisitions beyond the transaction currently pending could continue to affect period-to-period comparisons of our operating results.
Waste Connections, Inc. is a Delaware corporation organized in 1997.
On January 18, 2016, Waste Connections entered into an Agreement and Plan of Merger (the “Merger Agreement”) with Progressive Waste Solutions Ltd., a corporation organized under the laws of Ontario (“Progressive Waste”) and Water Merger Sub LLC, a Delaware limited liability company and wholly-owned subsidiary of Progressive Waste (“Merger Sub”). Subject to the terms and conditions of the Merger Agreement, Merger Sub will merge with and into Waste Connections (the “Merger”), with Waste Connections surviving the Merger as a wholly-owned subsidiary of Progressive Waste.
The transaction is expected to close in the second quarter of 2016. Upon closing, the combined company will use the Waste Connections name and it is anticipated that its shares will trade on the New York Stock Exchange and the Toronto Stock Exchange. Upon completion of the transaction, the combined company will be led by Waste Connections’ current management team. The Board of Directors for the combined company will include the five current members of Waste Connections’ Board and two members from Progressive Waste’s current Board.
Under the terms of the Merger Agreement, Waste Connections’ stockholders will receive 2.076843 Progressive Waste shares for each Waste Connections share they own. Subject to the approval of Progressive Waste’s shareholders, Progressive Waste expects to implement, immediately following the Merger, a share consolidation whereby every 2.076843 shares will be consolidated into one Progressive Waste share on the basis of 0.4815 (1 divided by the 2.076843 ratio above) of a share on a post-consolidation basis for each one share outstanding on a pre-consolidation basis. If the share consolidation is approved by Progressive Waste’s shareholders and effected, Waste Connections’ stockholders will receive one share of the combined company for each existing Waste Connections share. Upon the completion of the transaction and regardless of whether or not the share consolidation occurs, Waste Connections’ stockholders will own approximately 70% of the combined company, and Progressive Waste shareholders will own approximately 30%.
The transaction is subject to customary closing conditions, including the approval of both companies’ shareholders, U.S. antitrust approval and the approval of the Toronto Stock Exchange.
The remainder of this Annual Report on Form 10-K, other than the discussion of certain risks related to the Merger in the section entitled “Risk Factors” on page 20 of this Annual Report, excludes any impact that results or may result from the Merger.
| 1 |
Our Operating Strategy
Our operating strategy seeks to improve financial returns and deliver superior stockholder value creation within the solid waste industry. We seek to avoid highly competitive, large urban markets and instead target markets where we can attain high market share either through exclusive contracts, vertical integration or asset positioning. We also target niche markets, like E&P waste treatment and disposal services, with similar characteristics and, we believe, higher comparative growth potential. We are a leading provider of waste services in most of our markets, and the key components of our operating strategy, which are tailored to the competitive and regulatory factors that affect our markets, are as follows:
Target Secondary and Rural Markets. By targeting secondary and rural markets, we believe that we are able to garner a higher local market share than would be attainable in more competitive urban markets, which we believe reduces our exposure to customer churn and improves financial returns. In certain niche markets, like E&P waste treatment and disposal, early mover advantage in certain rural basins may improve market positioning and financial returns given the limited availability of existing third-party-owned waste disposal alternatives.
Control the Waste Stream. In markets where waste collection services are provided under exclusive arrangements, or where waste disposal is municipally owned or funded or available at multiple sources, we believe that controlling the waste stream by providing collection services under exclusive arrangements is often more important to our growth and profitability than owning or operating landfills. In addition, in certain E&P markets with “no pit” rules or other regulations that limit on-site storage or treatment of waste, control of the waste stream allows us to generate additional service revenue from the transportation of waste, as well as the waste treatment and disposal, thus increasing the overall scope and value of the services provided.
Optimize Asset Positioning. We believe that the location of disposal sites within competitive markets is a critical factor to success in both MSW and E&P waste services. Given the importance of and costs associated with the transportation of waste to treatment and disposal sites, having disposal capacity proximate to the waste stream may provide a competitive advantage and serve as a barrier to entry.
Provide Vertically Integrated Services. In markets where we believe that owning landfills is a strategic advantage to a collection operation because of competitive and regulatory factors, we generally focus on providing integrated services, from collection through disposal of solid waste in landfills that we own or operate. Similarly, we see this strategic advantage in E&P waste services where we offer closed loop systems for liquid and solid waste storage, transportation, treatment, and disposal.
Manage on a Decentralized Basis. We manage our operations on a decentralized basis. This places decision-making authority close to the customer, enabling us to identify and address customers’ needs quickly in a cost-effective manner. We believe that decentralization provides a low-overhead, highly efficient operational structure that allows us to expand into geographically contiguous markets and operate in relatively small communities that larger competitors may not find attractive. We believe that this structure gives us a strategic competitive advantage, given the relatively rural nature of many of the markets in which we operate, and makes us an attractive buyer to many potential acquisition candidates.
As of December 31, 2015, we delivered our services from over 225 operating locations grouped into four operating segments: our Western segment is comprised of operating locations in Alaska, California, Idaho, Montana, Nevada, Oregon, Washington and western Wyoming; our Central segment is comprised of operating locations in Arizona, Colorado, Kansas, Louisiana, Minnesota, Nebraska, New Mexico, Oklahoma, South Dakota, Texas, Utah and eastern Wyoming; our Eastern segment is comprised of operating locations in Alabama, Illinois, Iowa, Kentucky, Massachusetts, Michigan, Mississippi, New York, North Carolina, South Carolina and Tennessee; and, our E&P segment includes the majority of our E&P waste service operations in Arkansas, Louisiana, New Mexico, North Dakota, Oklahoma, Texas, Wyoming and along the Gulf of Mexico. Some E&P revenues are also included in other operating segments, where we accept E&P waste at some of our MSW landfills. In addition, a small amount of solid waste revenue is included in our E&P segment.
We manage and evaluate our business on the basis of the operating segments’ geographic characteristics, interstate waste flow, revenue base, employee base, regulatory structure, and acquisition opportunities. Each operating segment has a regional vice president and a regional controller reporting directly to our corporate management. These regional officers are responsible for operations and accounting in their operating segments and supervise their regional staff. See Note 14 to the consolidated financial statements included in Item 8 of this Annual Report for further information on our segment reporting of our operations.
Each operating location has a district or site manager who has a high degree of decision-making authority for his or her operations and is responsible for maintaining service quality, promoting safety, implementing marketing programs and overseeing day-to-day operations, including contract administration. Local managers also help identify acquisition candidates and are responsible for integrating acquired businesses into our operations and obtaining the permits and other governmental approvals required for us to operate.
| 2 |
Implement Operating Standards. We develop company-wide operating standards, which are tailored for each of our markets based on industry norms and local conditions. We implement cost controls and employee training and safety procedures and establish a sales and marketing plan for each market. By internalizing the waste stream of acquired operations, we can further increase operating efficiencies and improve capital utilization. We use a wide-area information system network, implement financial controls and consolidate certain accounting, personnel and customer service functions. While regional and district management operate with a high degree of autonomy, our executive officers monitor regional and district operations and require adherence to our accounting, purchasing, safety, marketing and internal control policies, particularly with respect to financial matters. Our executive officers regularly review the performance of regional officers, district managers and operations. We believe we can improve the profitability of existing and newly acquired operations by establishing operating standards, closely monitoring performance and streamlining certain administrative functions.
Our Growth Strategy
We tailor the components of our growth strategy to the markets in which we operate and into which we hope to expand.
Obtain Additional Exclusive Arrangements. Our operations include market areas where we have exclusive arrangements, including franchise agreements, municipal contracts and governmental certificates, under which we are the exclusive service provider for a specified market. These exclusive rights and contractual arrangements create a barrier to entry that is usually obtained through the acquisition of a company with such exclusive rights or contractual arrangements or by winning a competitive bid.
We devote significant resources to securing additional franchise agreements and municipal contracts through competitive bidding and by acquiring other companies. In bidding for franchises and municipal contracts and evaluating acquisition candidates holding governmental certificates, our management team draws on its experience in the waste industry and knowledge of local service areas in existing and target markets. Our district management and sales and marketing personnel maintain relationships with local governmental officials within their service areas, maintain, renew and renegotiate existing franchise agreements and municipal contracts, and secure additional agreements and contracts while targeting acceptable financial returns. Our sales and marketing personnel also expand our presence into areas adjacent to or contiguous with our existing markets, and market additional services to existing customers. We believe our ability to offer comprehensive rail haul disposal services in the Pacific Northwest improves our competitive position in bidding for such contracts in that region.
Generate Internal Growth. To generate internal revenue growth, our district management and sales and marketing personnel focus on increasing market penetration in our current and adjacent markets, soliciting new customers in markets where such customers have the option to choose a particular waste collection service and marketing upgraded or additional services (such as compaction or automated collection) to existing customers. We also seek price increases necessary to offset increased costs, to improve operating margins and to obtain adequate returns on our deployed capital. Where possible, we intend to leverage our franchise-based platforms to expand our customer base beyond our exclusive market territories. As customers are added in existing markets, our revenue per routed truck increases, which generally increases our collection efficiencies and profitability. In markets in which we have exclusive contracts, franchises and governmental certificates, we expect internal volume growth generally to track population and business growth.
In niche disposal markets, like E&P, our focus is on increasing market penetration, and providing additional service offerings in existing markets where appropriate. In addition, we focus on developing and permitting new treatment and disposal sites in new and existing E&P markets to position ourselves to capitalize on current and future drilling activity in those areas.
Expand Through Acquisitions. We intend to expand the scope of our operations by continuing to acquire MSW and E&P waste facilities and companies in new markets and in existing or adjacent markets that are combined with or “tucked in” to our existing operations. We focus our acquisition efforts on markets that we believe provide significant growth opportunities for a well-capitalized market entrant and where we can create economic and operational barriers to entry by new competitors. This focus typically highlights markets in which we can: (1) provide waste collection services under exclusive arrangements such as franchise agreements, municipal contracts and governmental certificates; (2) gain a leading market position and provide vertically integrated collection and disposal services; or (3) gain a leading market position in a niche market through the provision of treatment and disposal services. We believe that our experienced management, decentralized operating strategy, financial strength, size and public company status make us an attractive buyer to certain waste collection and disposal acquisition candidates. We have developed an acquisition discipline based on a set of financial, market and management criteria to evaluate opportunities. Once an acquisition is closed, we seek to integrate it while minimizing disruption to our ongoing operations and those of the acquired business.
| 3 |
In new markets, we often use an initial acquisition as an operating base and seek to strengthen the acquired operation's presence in that market by providing additional services, adding new customers and making “tuck-in” acquisitions of other waste companies in that market or adjacent markets. We believe that many suitable “tuck-in” acquisition opportunities exist within our current and targeted market areas that may provide us with opportunities to increase our market share and route density.
The U.S. solid waste services industry has experienced significant consolidation over the past decade, most notably with the merger between Republic Services, Inc. and Allied Waste Industries, Inc. in 2008, the merger between IESI-BFC Ltd. and Waste Services, Inc. in 2010, the sale of the U.S. solid waste business of Veolia Environnement S.A. to Advanced Disposal Services, Inc. in 2012, and our announcement of our entry into the Merger Agreement with Progressive Waste on January 18, 2016. In spite of this consolidation, the solid waste services industry remains regional in nature, with acquisition opportunities available in select markets. The E&P waste services industry is similarly regional in nature and is also highly fragmented, with acquisition opportunities available in several active natural resource basins. In some markets in both MSW and E&P waste, independent landfill, collection or service providers lack the capital resources, management skills and/or technical expertise necessary to comply with stringent environmental and other governmental regulations and to compete with larger, more efficient, integrated operators. In addition, many of the remaining independent operators may wish to sell their businesses to achieve liquidity in their personal finances or as part of their estate planning.
During the year ended December 31, 2015, we completed 14 acquisitions, none of which individually accounted for greater than 10% of our total assets. The total fair value of consideration transferred for the 14 acquisitions completed during the year ended December 31, 2015 was approximately $348.7 million. During the year ended December 31, 2014, we completed nine acquisitions, none of which individually accounted for greater than 10% of our total assets. The total fair value of consideration transferred for the nine acquisitions completed during the year ended December 31, 2014 was approximately $168.7 million. During the year ended December 31, 2013, we completed eight acquisitions, none of which individually accounted for greater than 10% of our total assets. The total fair value of consideration transferred for the eight acquisitions completed during the year ended December 31, 2013 was approximately $64.2 million.
WASTE SERVICES
Collection Services
We provide collection services to residential, commercial, industrial and E&P customers. Our services are generally provided under one of the following arrangements: (1) governmental certificates; (2) exclusive franchise agreements; (3) exclusive municipal contracts; (4) residential subscriptions; (5) residential contracts; or (6) commercial, industrial and E&P service agreements.
Governmental certificates, exclusive franchise agreements and exclusive municipal contracts grant us rights to provide MSW services within specified areas at established rates and are long-term in nature. Governmental certificates, or G Certificates, are unique to the State of Washington and are awarded by the Washington Utilities and Transportation Commission, or WUTC, to solid waste collection service providers in unincorporated areas and electing municipalities. These certificates typically grant the holder the exclusive and perpetual right to provide specific residential, commercial and/or industrial waste services in a defined territory at specified rates subject to divestiture and/or overlap or cancellation by the WUTC on specified, limited grounds. Franchise agreements typically provide an exclusive period of seven years or longer for a specified territory; they specify a broad range of services to be provided, establish rates for the services and often give the service provider a right of first refusal to extend the term of the agreement. Municipal contracts typically provide a shorter service period and a more limited scope of services than franchise agreements and generally require competitive bidding at the end of the contract term. In markets where exclusive arrangements are not available, we may enter into residential contracts with homeowners’ associations, apartment owners and mobile home park operators, or work on a subscription basis with individual households. In such markets, we may also provide commercial and industrial services under customer service agreements generally ranging from one to five years in duration. Finally, in certain E&P markets with “no pit” rules or other regulations that limit on-site storage or treatment of waste, we offer containers and collection services to provide a closed loop system for the collection of drilling wastes at customers’ well sites and subsequent transportation of the waste to our facilities for treatment and disposal.
Landfill Disposal Services
As of December 31, 2015, we owned or operated 44 MSW landfills, nine E&P waste landfills, which only accept E&P waste and nine non-MSW landfills, which only accept construction and demolition, industrial and other non-putrescible waste. Eleven of our MSW landfills also received E&P waste during 2015. We generally own landfills to achieve vertical integration in markets where the economic and regulatory environments make landfill ownership attractive. We also own landfills in certain markets where it is not necessary to provide collection services because we believe that we are able to attract volume to our landfills, given our location or other market dynamics. Over time, MSW landfills generate a greenhouse gas, methane, which can be converted into a valuable source of clean energy. We deploy gas recovery systems at 33 of our landfills to collect methane, which can then be used to generate electricity for local households, fuel local industrial power plants, power alternative fueled vehicles, or qualify for carbon emission credits.
| 4 |
Our developed and operational landfill facilities consisted of the following at December 31, 2015:
| Owned and operated landfills | 52 | |||
| Operated landfills under life-of-site agreements | 5 | |||
| Operated landfills under limited-term operating agreements | 5 | |||
| 62 |
Under landfill operating agreements, the owner of the property, generally a municipality, usually owns the permit and we operate the landfill for a contracted term, which may be the life of the landfill. Where the contracted term is not the life of the landfill, the property owner is generally responsible for final capping, closure and post-closure obligations. We are responsible for all final capping, closure and post-closure obligations at our operated landfills for which we have life-of-site agreements.
The expiration dates of two of our operating agreements for which the contracted term is less than the life of the landfill occur in 2017. These two landfills contributed $1.4 million of revenue during the year ended December 31, 2015. The expiration dates of the remaining three operating agreements for which the contracted term is less than the life of the landfill range from 2018 to 2024. These three landfills contributed $5.2 million of revenue during the year ended December 31, 2015. We intend to seek renewal of these contracts prior to, or upon, their expiration.
Based on remaining permitted capacity as of December 31, 2015, and projected annual disposal volumes, the average remaining landfill life for our owned and operated landfills and landfills operated, but not owned, under life-of-site agreements, is estimated to be approximately 32 years. Many of our existing landfills have the potential for expanded disposal capacity beyond the amount currently permitted. We regularly consider whether it is advisable, in light of changing market conditions and/or regulatory requirements, to seek to expand or change the permitted waste streams or to seek other permit modifications. We also monitor the available permitted in-place disposal capacity of our landfills on an ongoing basis and evaluate whether to seek capacity expansion using a variety of factors.
We are currently seeking to expand permitted capacity at nine of our landfills, for which we consider expansions to be probable. Although we cannot be certain that all future expansions will be permitted as designed, the average remaining landfill life for our owned and operated landfills and landfills operated, but not owned, under life-of-site agreements is estimated to be approximately 38 years when considering remaining permitted capacity, probable expansion capacity and projected annual disposal volume.
The following table reflects estimated landfill capacity and airspace changes, as measured in tons, for owned and operated landfills and landfills operated, but not owned, under life-of-site agreements (in thousands):
| 2015 | 2014 | |||||||||||||||||||||||
| Permitted | Probable Expansion | Total | Permitted | Probable Expansion | Total | |||||||||||||||||||
| Balance, beginning of year | 714,155 | 105,498 | 819,653 | 668,052 | 146,933 | 814,985 | ||||||||||||||||||
| Acquired landfills | 40,343 | 41,432 | 81,775 | 19,994 | - | 19,994 | ||||||||||||||||||
| Permits granted | 9,846 | (9,846 | ) | - | 31,265 | (31,265 | ) | - | ||||||||||||||||
| Airspace consumed | (21,331 | ) | - | (21,331 | ) | (20,486 | ) | - | (20,486 | ) | ||||||||||||||
| Expansions initiated | - | 21,731 | 21,731 | - | - | - | ||||||||||||||||||
| Changes in engineering estimates | 12,583 | 4,643 | 17,226 | 15,330 | (10,170 | ) | 5,160 | |||||||||||||||||
| Balance, end of year | 755,596 | 163,458 | 919,054 | 714,155 | 105,498 | 819,653 | ||||||||||||||||||
The estimated remaining operating lives for the landfills we own and landfills we operate under life-of-site agreements, based on remaining permitted and probable expansion capacity and projected annual disposal volume, in years, as of December 31, 2015, and December 31, 2014, are shown in the tables below. The estimated remaining operating lives include assumptions that the operating permits are renewed.
| 5 |
| 2015 | ||||||||||||||||||||||||||||
| 0 to 5 | 6 to 10 | 11 to 20 | 21 to 40 | 41 to 50 | 51+ | Total | ||||||||||||||||||||||
| Owned and operated landfills | 1 | 1 | 8 | 24 | 8 | 10 | 52 | |||||||||||||||||||||
| Operated landfills under life-of-site agreements | - | - | 2 | 1 | 1 | 1 | 5 | |||||||||||||||||||||
| 1 | 1 | 10 | 25 | 9 | 11 | 57 | ||||||||||||||||||||||
| 2014 | ||||||||||||||||||||||||||||
| 0 to 5 | 6 to 10 | 11 to 20 | 21 to 40 | 41 to 50 | 51+ | Total | ||||||||||||||||||||||
| Owned and operated landfills | 1 | 3 | 4 | 17 | 6 | 16 | 47 | |||||||||||||||||||||
| Operated landfills under life-of-site agreements | 1 | - | 3 | 1 | - | 1 | 6 | |||||||||||||||||||||
| 2 | 3 | 7 | 18 | 6 | 17 | 53 | ||||||||||||||||||||||
The disposal tonnage that we received in 2015 and 2014 at all of our landfills is shown in the tables below (tons in thousands):
| Three months ended | ||||||||||||||||||||||||||||||||||||
March 31, 2015 | June 30, 2015 | September 30, 2015 | December 31, 2015 | Twelve months ended | ||||||||||||||||||||||||||||||||
| Number of Sites | Total Tons | Number of Sites | Total Tons | Number of Sites | Total Tons | Number of Sites | Total Tons | December 31, 2015 | ||||||||||||||||||||||||||||
| Owned operational landfills and landfills operated under life-of-site agreements | 54 | 4,566 | 54 | 5,429 | 55 | 5,821 | 57 | 5,515 | 21,331 | |||||||||||||||||||||||||||
| Operated landfills | 5 | 116 | 5 | 121 | 5 | 153 | 5 | 125 | 515 | |||||||||||||||||||||||||||
| 59 | 4,682 | 59 | 5,550 | 60 | 5,974 | 62 | 5,640 | 21,846 | ||||||||||||||||||||||||||||
| Three months ended | ||||||||||||||||||||||||||||||||||||
March 31, 2014 | June 30, 2014 | September 30, 2014 | December 31, 2014 | Twelve months ended | ||||||||||||||||||||||||||||||||
| Number of Sites | Total Tons | Number of Sites | Total Tons | Number of Sites | Total Tons | Number of Sites | Total Tons | December 31, 2014 | ||||||||||||||||||||||||||||
| Owned operational landfills and landfills operated under life-of-site agreements | 50 | 4,545 | 50 | 5,139 | 51 | 5,562 | 53 | 5,240 | 20,486 | |||||||||||||||||||||||||||
| Operated landfills | 5 | 116 | 5 | 124 | 5 | 130 | 5 | 121 | 491 | |||||||||||||||||||||||||||
| 55 | 4,661 | 55 | 5,263 | 56 | 5,692 | 58 | 5,361 | 20,977 | ||||||||||||||||||||||||||||
Transfer Station and Intermodal Services
As of December 31, 2015, we owned or operated 64 MSW transfer stations and five E&P waste transfer stations with marine access. Transfer stations receive, compact and/or load waste to be transported to landfills or treatment facilities via truck, rail or barge. They extend our direct-haul reach and link collection operations or waste generators with distant disposal or treatment facilities by concentrating the waste stream from a wider area and thus providing better utilization rates and operating efficiencies.
Intermodal logistics is the movement of containers using two or more modes of transportation, usually including a rail or truck segment. We entered the intermodal services business in the Pacific Northwest through the acquisition of Northwest Container Services, Inc., which provides repositioning, storage, maintenance and repair of cargo containers for international shipping companies. We provide these services for containerized cargo primarily to international shipping companies importing and exporting goods through the Pacific Northwest. We also operate two intermodal facilities primarily for the shipment of waste by rail to distant disposal facilities that we do not own. As of December 31, 2015, we owned or operated seven intermodal operations in Washington and Oregon. Our fleet of double-stack railcars provides dedicated direct-line haul services among terminals in Portland, Tacoma and Seattle. We have a contract with Union Pacific railroad for the movement of containers among our seven intermodal operations. We also provide our customers container and chassis sales and leasing services.
| 6 |
We intend to further expand our intermodal business through cross-selling efforts with our solid waste services operations. We believe that a significant amount of solid waste is transported currently by truck, rail and barge from primarily the Seattle-Tacoma and Metro Portland areas to remote landfills in Eastern Washington and Eastern Oregon. We believe our ability to market both intermodal and disposal services will enable us to more effectively compete for these volumes.
Recycling Services
We offer residential, commercial, industrial and municipal customers recycling services for a variety of recyclable materials, including compost, cardboard, office paper, plastic containers, glass bottles and ferrous and aluminum metals. We own or operate 37 recycling operations and sell other collected recyclable materials to third parties for processing before resale. The majority of the recyclables we process for sale are paper products and are shipped primarily to customers in Asia. Changes in end market demand as well as other factors can cause fluctuations in the prices for such commodities, which can affect revenue, operating income and cash flows. To reduce our exposure to commodity price volatility and risk with respect to recycled materials, we have adopted a pricing strategy of charging collection and processing fees for recycling volumes collected from third parties. We believe that recycling will continue to be an important component of local and state solid waste management plans due to the public’s increasing environmental awareness and expanding regulations that mandate or encourage recycling.
E&P Waste Treatment, Recovery and Disposal Services
E&P waste is a broad term referring to the by-products resulting from oil and natural gas exploration and production activity. These generally include: waste created throughout the initial drilling and completion of an oil or natural gas well, such as drilling fluids, drill cuttings, completion fluids and flowback water; production wastes and produced water during a well’s operating life; contaminated soils that require treatment during site reclamation; and substances that require clean-up after a spill, reserve pit clean-up or pipeline rupture. E&P customers are oil and natural gas exploration and production companies operating in the areas that we serve. E&P revenue is therefore driven by vertical and horizontal drilling, hydraulic fracturing, production and clean-up activity; it is complemented by other services including closed loop collection systems and the sale of recovered products. E&P activity varies across market areas which are tied to the natural resource basins in which the drilling activity occurs and reflects the regulatory environment, pricing and disposal alternatives available in any given market.
Our customers are generally responsible for the delivery of their waste streams to us. We receive flowback water, produced water and other drilling and production wastes at our facilities in vacuum trucks, dump trucks or containers deposited by roll-off trucks. In certain markets, we offer bins and rails systems that capture and separate liquid and solid oilfield waste streams at our customers’ well sites and deliver the drilling and production wastes to our facilities. Waste generated by offshore drilling is delivered by supply vessel from the drilling rig to one of our transfer stations, where the waste is then transferred to our network of barges for transport to our treatment facilities.
As of December 31, 2015, we provided E&P waste treatment, recovery and/or disposal services from a network of nine E&P waste landfills, eleven MSW landfills that also received E&P waste during 2015, 24 E&P liquid waste injection wells and 20 E&P waste treatment and oil recovery facilities. Treatment processes vary by site and regulatory jurisdiction. At certain treatment facilities, loads of flowback and produced water and other drilling and production wastes delivered by our customers are sampled, assessed and tested by third parties according to state regulations. Solids contained in a waste load are deposited into a land treatment cell where liquids are removed from the solids and are sent through an oil recovery system before being injected into saltwater disposal injection wells or placed in evaporation cells that utilize specialized equipment to accelerate evaporation of liquids. In certain locations, fresh water is then added to the remaining solids in the cell to “wash” the solids several times to remove contaminants, including oil and grease, chlorides and other contaminants, to ensure the solids meet specific regulatory criteria that, in certain areas, are administered by third-party labs and submitted to the regulatory authorities.
After the washing or treatment process, the treated solids are designated “reuse materials,” and are no longer considered a waste product by state regulation. These materials are dried, removed from the treatment cells, stockpiled and compacted in designated stockpile areas on site and at certain locations are available for use as feedstock for roadbase. At certain of our facilities, during the treatment process we reclaim oil for resale and we treat and recycle liquids for re-use in our operations or for sale to third parties as fresh or brine water.
| 7 |
COMPETITION
The U.S. municipal solid waste services industry is highly competitive and requires substantial labor and capital resources. Besides Waste Connections, the industry includes: two national, publicly held solid waste companies – Waste Management, Inc. and Republic Services, Inc.; several regional, publicly held and privately owned companies; and several thousand small, local, privately owned companies. Certain of the markets in which we compete or will likely compete are served by one or more large, national solid waste companies, as well as by numerous regional and local solid waste companies of varying sizes and resources, some of which we believe have accumulated substantial goodwill in their markets. We compete for collection, transfer and disposal volume based primarily on the price and, to a lesser extent, quality of our services. We also compete with operators of alternative disposal facilities, including incinerators, and with counties, municipalities and solid waste districts that maintain their own waste collection and disposal operations. Public sector operators may have financial and other advantages over us because of their access to user fees and similar charges, tax revenues, tax-exempt financing and the ability to flow-control waste streams to publicly owned disposal facilities.
From time to time, competitors may reduce the price of their services in an effort to expand their market shares or service areas or to win competitively bid municipal contracts. These practices may cause us to reduce the price of our services or, if we elect not to do so, to lose business. We provide a significant amount of our residential, commercial and industrial collection services under exclusive franchise and municipal contracts and G Certificates. Exclusive franchises and municipal contracts may be subject to periodic competitive bidding.
The U.S. municipal solid waste services industry has undergone significant consolidation, and we encounter competition in our efforts to acquire collection operations, transfer stations and landfills. We generally compete for acquisition candidates with publicly owned regional and national waste management companies. Accordingly, it may become uneconomical for us to make further acquisitions or we may be unable to locate or acquire suitable acquisition candidates at price levels and on terms and conditions that we consider appropriate, particularly in markets we do not already serve. Competition in the disposal industry is also affected by the increasing national emphasis on recycling and other waste reduction programs, which may reduce the volume of waste deposited in landfills.
Competition for E&P waste comes primarily from smaller regional companies that utilize a variety of disposal methods and generally serve specific geographic markets. We also compete in certain markets with publicly held and privately owned companies such as Waste Management, Inc., Republic Services, Inc., Clean Harbors, Inc., Secure Energy Services Inc., Nuverra Environmental Solutions, Trinity Environmental Services, LLC and Ecoserv. In addition, customers in many markets have the option of using internal disposal methods or outsourcing to another third-party disposal company. The principal competitive factors in this business include: gaining customer approval of treatment and disposal facilities; location of facilities in relation to customer activity; reputation; reliability of services; track record of environmental compliance; ability to accept multiple waste types at a single facility; and price.
The intermodal services industry is also highly competitive. We compete against other intermodal rail services companies, trucking companies and railroads, many of which have greater financial and other resources than we do. Competition is based primarily on price, reliability and quality of service.
REGULATION
Introduction
Our operations, including landfills, solid waste transportation, transfer stations, intermodal operations, vehicle maintenance shops, fueling facilities, and oilfield waste treatment, recovery and disposal operations, are all subject to extensive and evolving federal, state and local environmental, health, and safety laws and regulations, the enforcement of which has become increasingly stringent. These laws and regulations may, among other things, require the acquisition of permits or other authorizations for regulated activities; govern the amounts and types of substances that may be released into the environment in connection with our operations; impose clean-up or corrective action responsibility for releases of regulated substances into the environment; restrict the way we handle or dispose of wastes; limit or prohibit our or our customers’ activities in sensitive areas such as wetlands, wilderness areas or areas inhabited by endangered or threatened species; require investigatory and remedial actions to mitigate pollution conditions caused by our operations or attributable to former operations; and impose specific standards addressing worker protection and health. Compliance is often costly or difficult, and the violation of these laws and regulations may result in the denial or revocation of permits, issuance of corrective action orders, assessment of administrative and civil penalties and even criminal prosecution. In many instances, liability is often “strict,” meaning it is imposed without a requirement of intent or fault on the part of the regulated entity. The environmental regulations that affect us are administered by the Environmental Protection Agency, or the EPA, and numerous other federal, state and local agencies having jurisdiction over our operations including environmental, health and safety, zoning and other areas. For example, the WUTC regulates the portion of our collection business in Washington performed under G Certificates.
| 8 |
With regard to any permit or authorization issued by a regulatory agency necessary for our operations, there are no assurances that we will be able to obtain or maintain all necessary permits or authorizations. With regard to any permit or authorization that has been issued, it remains subject to removal, modification, suspension or revocation by the agency with jurisdiction.
We currently comply in all material respects with applicable federal, state and local environmental and occupational health and safety laws, permits, orders and regulations. In addition, we attempt to anticipate future regulatory requirements and plan in advance as necessary to comply with them. We do not presently anticipate incurring any material costs to bring our operations into environmental compliance with existing or expected future regulatory requirements, although we can give no assurance that this will not change in the future. It is possible that substantial costs for compliance or penalties for non-compliance may be incurred in the future. It is also possible that other developments, such as the adoption of additional or stricter environmental laws, regulations and enforcement policies, could result in additional costs or liabilities that we cannot currently quantify. Moreover, changes in environmental laws or regulations could reduce the demand for our services and adversely impact our business. For example, changes in environmental laws or regulations could limit our customers’ oil and natural gas E&P businesses or encourage our customers to handle and dispose of oil and natural gas E&P wastes in other ways.
Various federal and state laws impose clean-up or remediation liability on responsible parties, which are discussed in more detail below. Substances subject to clean-up liability have been or may have been disposed of or released on or under certain of our sites, including our E&P sites. At some of our facilities, we have conducted and continue to conduct monitoring or remediation of known soil and groundwater contamination, and we will continue to perform such monitoring and remediation of known contamination, including any post-remediation groundwater monitoring that may be required, until the appropriate regulatory standards have been achieved. These monitoring and remediation efforts are usually overseen by state environmental regulatory agencies. Further, it is not uncommon for neighboring landowners and other third parties to file claims for personal injury and property damage allegedly caused by the release of hazardous substances or other pollutants into the environment.
In addition, from time to time our intermodal services business transports hazardous materials in substantial compliance with federal transportation requirements.
A number of the major federal, state and local statutes and regulations that apply to our operations are described generally below. Certain of the statutes described below contain provisions that authorize, under certain circumstances, lawsuits by private citizens to enforce the provisions of the statutes. In addition to penalties, some of those statutes authorize an award of attorneys' fees to parties that successfully bring such an action. Enforcement actions under these statutes may include both civil and criminal penalties, as well as injunctive relief in some instances.
The Resource Conservation and Recovery Act of 1976, or RCRA
RCRA regulates the generation, treatment, storage, handling, transportation and disposal of solid waste and requires states to develop programs to ensure the safe disposal of solid waste. RCRA generally divides solid waste into two groups, hazardous and nonhazardous. Wastes are generally classified as hazardous if they either: (1) are specifically included on a list of hazardous wastes or (2) exhibit certain characteristics defined as hazardous. Household wastes are specifically designated as nonhazardous. Wastes classified as hazardous under RCRA are subject to much stricter regulation than wastes classified as nonhazardous, and businesses that deal with hazardous waste are subject to regulatory obligations in addition to those imposed on handlers of nonhazardous waste. Some of our ancillary operations, such as vehicle maintenance operations, may generate hazardous wastes. We manage these wastes in substantial compliance with applicable laws.
In October 1991, the EPA adopted the Subtitle D Regulations governing solid waste landfills. The Subtitle D Regulations, which generally became effective in October 1993, include location restrictions, minimum facility design and performance standards, operating criteria, closure and post-closure requirements, financial assurance requirements, groundwater monitoring requirements, groundwater remediation standards and corrective action requirements. In addition, the Subtitle D Regulations require that new landfill sites meet more stringent liner design criteria (typically, composite soil and synthetic liners or two or more synthetic liners) intended to keep leachate out of groundwater and have extensive collection systems to carry away leachate for treatment prior to disposal. Groundwater monitoring wells must also be installed at virtually all landfills to monitor groundwater quality and, indirectly, the effectiveness of the leachate collection system. The Subtitle D Regulations also require, where certain regulatory thresholds are exceeded, that facility owners or operators control emissions of methane gas generated at landfills in a manner intended to protect human health and the environment. Each state is required to revise its landfill regulations to meet these requirements or such requirements will be imposed by the EPA on landfill owners and operators in that state. Each state is also required to adopt and implement a permit program or other appropriate system to ensure that landfills in the state comply with the Subtitle D Regulations. Accordingly, we are required to obtain permits for landfills that we operate. Moreover, various states in which we operate or may operate in the future have adopted regulations or programs as stringent as, or more stringent than, the Subtitle D Regulations.
| 9 |
Most E&P waste is exempt from stringent regulation as a hazardous waste under RCRA. None of our oilfield waste recycling, treatment, and disposal facilities are currently permitted to accept hazardous wastes for disposal, and we take precautions to mitigate the potential that hazardous wastes could enter or be disposed of at these facilities. Some wastes handled by us that currently are exempt from treatment as hazardous wastes may in the future be designated as “hazardous wastes” under RCRA or other applicable statutes. For example, in September 2010, a nonprofit environmental group filed a petition with the EPA requesting reconsideration of the RCRA E&P waste exemption. Although the EPA has not yet formally responded to the petition, if the RCRA E&P waste exemption is repealed or modified, we could become subject to more rigorous and costly operating and disposal requirements.
We are required to obtain permits for the land treatment and disposal of E&P waste as part of our operations. The construction, operation and closure of E&P waste land treatment and disposal operations are generally regulated at the state level. These regulations vary widely from state to state.
In the course of our E&P waste operations, some of our equipment may be exposed to naturally occurring radiation associated with oil and gas deposits, and this exposure may result in the generation of wastes containing naturally occurring radioactive materials, or NORM. NORM wastes exhibiting trace levels of naturally occurring radiation in excess of established state standards are subject to special handling and disposal requirements, and any storage vessels, piping and work area affected by NORM may be subject to remediation or restoration requirements. It is possible that we may incur costs or liabilities associated with elevated levels of NORM.
With respect to any of our permitted facilities, permits can impose various requirements and may restrict the size and location of disposal operations, impose limits on the types and amount of waste a facility may receive and the overall capacity of a waste disposal facility. States may add additional restrictions on the operations of a disposal facility when a permit is renewed or amended. As these regulations change, our permit requirements could become more stringent and may require material expenditures at our facilities or impose significant restraints, or new or additional financial assurances on our operations.
RCRA also regulates underground storage of petroleum and other materials it defines as “regulated substances.” RCRA requires registration, compliance with technical standards for tanks, release detection and reporting, and corrective action, among other things. Certain of our facilities and operations are subject to these requirements and these requirements are typically implemented at the state level.
The Federal Water Pollution Control Act of 1972, or the Clean Water Act
The Clean Water Act regulates the discharge of pollutants from a variety of sources, including, without limitation, solid waste disposal sites, transfer stations, and oilfield waste facilities, into waters of the United States, including surface and ground waters. If run-off or other contaminants from our owned or operated transfer stations or oilfield waste facilities or run-off, collected leachate or other contaminants from our owned or operated landfills is discharged into streams, rivers or other surface waters, the Clean Water Act would require us to respond, apply for and obtain a discharge permit, conduct sampling and monitoring and, under certain circumstances, reduce the quantity of pollutants in such discharge. Also, virtually all landfills are required to comply with the EPA's storm water regulations issued in November 1990, which are designed to prevent contaminated landfill storm water run-off from flowing into surface waters. Spill prevention, control and countermeasure requirements of federal laws require appropriate containment berms and similar structures to help prevent the contamination of regulated waters in the event of a hydrocarbon storage tank spill, rupture or leak. We believe that our facilities comply in all material respects with the Clean Water Act requirements. Various states in which we operate or may operate in the future have been delegated authority to implement the Clean Water Act and its permitting requirements, and some of these states have adopted regulations that are more stringent than the federal Clean Water Act requirements. For example, states often require permits for discharges that may impact ground water as well as surface water. Federal and state regulatory agencies can impose administrative, civil and criminal penalties for non-compliance with discharge permits or other requirements of the Clean Water Act and analogous state laws and regulations. We believe that compliance with existing permits and regulatory requirements under the Clean Water Act and state counterparts will not have a material adverse effect on our business. Future changes to permits or regulatory requirements under the Clean Water Act, however, could adversely affect our business.
| 10 |
Safe Drinking Water Act, or SDWA
Our E&P underground injection operations are subject to the SDWA, as well as analogous state laws and regulations. Under the SDWA, the EPA established the underground injection control or UIC program, which includes requirements for permitting, testing, monitoring, record keeping, and reporting of injection well activities, as well as a prohibition against the migration of fluid containing any contaminant into underground sources of drinking water. State regulations require us to obtain a permit from the applicable regulatory agencies to operate our underground injection wells. We believe that we have obtained the necessary permits from these agencies for our underground injection wells and that we are in substantial compliance with permit conditions and state rules. Although we monitor the injection process of our wells, any leakage from the subsurface portions of the injection wells could cause degradation of fresh groundwater resources, potentially resulting in suspension of our UIC permit, issuance of fines and penalties from governmental agencies, incurrence of expenditures for remediation of the affected resource and imposition of liability by third parties for property damages and personal injuries. In addition, our sales of residual crude oil collected as part of the saltwater injection process could impose liability on us in the event that the entity to which the oil was transferred fails to manage and, as necessary, dispose of residual crude oil in accordance with applicable environmental and occupational health and safety laws.
Oil Pollution Act of 1990, or OPA
The OPA, as amended, establishes strict liability for owners and operators of facilities that are the site of a release of oil into the waters of the U.S. The OPA also imposes ongoing requirements on owners or operators of facilities that handle certain quantities of oil, including the preparation of oil spill response plans and proof of financial responsibility to cover environmental clean-up and restoration costs that could be incurred in conjunction with an oil spill. We handle oil at many of our facilities, and if a release of oil into the waters of the U.S. occurred at one of our facilities, we could be liable for clean-up costs and damages under the OPA.
The Comprehensive Environmental Response, Compensation, and Liability Act of 1980, or CERCLA
CERCLA, which is also known as the “Superfund” law, established a regulatory and remedial program intended to provide for the investigation and clean-up of facilities where, or from which, a release of any hazardous substance into the environment has occurred or is threatened. CERCLA’s primary mechanism to address such a release or threatened release is to impose strict joint and several liability for clean-up of facilities on responsible parties. Responsible parties are current owners and operators of the site, former owners and operators of the site at the time of the disposal of the hazardous substances, any person who arranged for the transportation, disposal or treatment of the hazardous substances, and the transporters who selected the disposal and/or treatment facilities, regardless of the intent or care exercised by such persons. CERCLA also imposes liability for the cost of evaluating and remedying any damage to natural resources. The costs of CERCLA investigation and clean-up can be very substantial. Liability under CERCLA does not depend on the existence or disposal of “hazardous waste” as defined by RCRA; it can also be based on the release of even very small amounts of the more than 700 “hazardous substances” listed by the EPA, many of which can be found in household waste. In addition, the definition of “hazardous substances” in CERCLA incorporates substances designated as hazardous or toxic under the federal Clean Water Act, Clear Air Act and Toxic Substances Control Act.
We may handle hazardous substances within the meaning of CERCLA, or similar state statutes, in the course of our ordinary operations and, as a result, may be jointly and severally liable under CERCLA for all or part of the costs required to clean up sites if and where these hazardous substances have been released into the environment. If we were found to be a responsible party for a CERCLA clean-up, the enforcing agency could hold us, or any other responsible party liable for all investigative and all response costs, even if others were also liable. Under such laws, we could be required to remove previously disposed substances and wastes (including substances disposed of or released by prior owners or operators) or remediate contaminated property (including groundwater contamination, whether from prior owners or operators or other historic activities or spills). These laws may also require us to conduct natural resource damage assessments and pay penalties for such damages. These laws and regulations may also expose us to liability for our acts that were in compliance with applicable laws at the time the acts were performed.
CERCLA also authorizes the imposition of a lien in favor of the United States on all real property subject to, or affected by, a remedial action for all costs for which a party is liable. Subject to certain procedural restrictions, CERCLA gives a responsible party the right to bring a contribution or cost recovery action against other responsible parties for their allocable shares of investigative and remedial costs. Our ability to obtain reimbursement from others for their allocable shares of such costs would be limited by our ability to find other responsible parties and prove the extent of their responsibility, their financial resources, and other procedural requirements. Various state laws also impose liability, which is typically strict and joint and several, for investigation, clean-up and other damages associated with the release of hazardous or other regulated substances.
The Clean Air Act, or CAA
The CAA generally regulates emissions of air pollutants from emissions sources, including certain landfills and oilfield waste facilities, based on factors such as the date of the construction and tons per year of emissions of regulated pollutants. Typically, federal requirements are implemented at the state level. The CAA and analogous state laws require permits for and impose other restrictions on facilities that have the potential to emit pollutants into the atmosphere above certain specified quantities or in a manner that could adversely affect environmental quality. Failure to obtain a permit or to comply with permit requirements could result in the imposition of substantial administrative, civil and even criminal penalties.
| 11 |
Larger landfills and landfills located in areas where the ambient air does not meet certain air quality standards called for by the CAA may be subject to even more extensive air pollution controls and emission limitations. In addition to the potential CAA permitting of landfill facilities, CAA permitting may be required for the construction of gas collection and flaring systems, composting and other operations. In some instances, operating permits may be required depending on the nature and volume of air emissions. Further, in those situations where major source permitting is not required, typically state laws and rules will require permitting or authorization as a type of minor source.
Additional or more stringent regulations of our facilities may occur in the future, which could increase operating costs or impose additional compliance burdens. In July 2014, the EPA proposed “Subpart XXX,” a New Source Performance Standard, or NSPS, that would apply to newly constructed or modified municipal solid waste, or MSW, landfills. Subpart XXX would reduce the non-methane organic compounds, or NMOC, emission threshold at which MSW landfills must install controls, require compliance even during periods of start-up, shutdown, and malfunction, and impose other requirements. In August 2015, the EPA proposed a supplemental proposal for the Standard of Performance for MSW landfills. This “supplemental” proposal would address the NMOC emission rate threshold at which gas collection and controls must be installed at an MSW landfill. Further, in July 2014, the EPA used an Advanced Notice of Proposed Rule Making (“ANPRM”) seeking input on methods to reduce emissions from existing MSW landfills. This ANPRM was used to determine if additional changes to existing landfill NSPS were required beyond the proposed Subpart XXX. Based upon this ANPRM, the EPA proposed in August 2015 a new Subpart Cf that updates existing Emission Guidelines and Compliance Times for MSW landfills. The proposal would generally apply to landfills that accepted waste after November 8, 1987 and commenced construction or modification on or before July 17, 2014. The proposal would be expected to result in the reduction of landfill gas emissions, including methane, by lowering the thresholds where an MSW landfill must install a gas collection and control system. It is expected that, if implemented, the proposed Subpart Cf would ultimately affect existing sources that may not have been affected by proposed Subpart XXX. State air regulatory programs may impose additional restrictions beyond federal requirements. For example, some state air programs uniquely regulate odor and the emission of toxic air pollutants.
In addition, the EPA recently modified, or is in the process of modifying, other standards promulgated under the CAA in a manner which could increase our compliance costs. For example, the EPA has recently modified or discussed modifying national ambient air quality standards applicable to particulate matter, carbon monoxide, and oxides of sulfur and nitrogen, and other standards to make them more stringent.
In addition, our customers’ operations may be subject to existing and future CAA permitting and regulatory requirements that could have a material effect on their operations, which could have an adverse effect on our business. For example, on April 17, 2012, the EPA approved new CAA rules requiring additional emissions controls and practices for oil and natural gas production wells, including wells that are the subject of hydraulic fracturing operations. These rules may increase the costs to our customers of developing and producing hydrocarbons, and as a result, may have an indirect and adverse effect on the amount of oilfield waste delivered to our facilities by our customers.
Climate Change Laws and Regulations
Generally, the promulgation of climate change laws or rules restricting greenhouse gas emissions could increase our costs to operate. For example, the EPA’s current and proposed regulation of greenhouse gas, or GHG, emissions may impact our operations. In 2009, the EPA made an endangerment finding allowing GHGs to be regulated under the CAA. The CAA requires stationary sources of air pollution to obtain New Source Review, or NSR, permits prior to construction and, in some cases, Title V operating permits. Pursuant to the EPA’s rulemakings and interpretations, certain Title V and NSR Prevention of Significant Deterioration, or PSD, permits issued on or after January 2, 2011, must address GHG emissions. As a result, new or modified emissions sources may be required to install Best Available Control Technology to limit GHG emissions. The EPA’s proposed Subpart XXX would also require the reduction of GHG emissions from new or modified landfills, and the EPA published in July 2014 an Advanced Notice of Proposed Rulemaking, or ANPRM, that sought public comment on rules that would reduce GHG emissions from existing landfills. In addition, the EPA’s Mandatory Greenhouse Gas Reporting Rule sets monitoring, recordkeeping, and reporting requirements applicable to certain landfills and other entities.
At the state level, on September 27, 2006, California enacted AB 32, the Global Warming Solutions Act of 2006, which established the first statewide program in the United States to limit GHG emissions and impose penalties for non-compliance. Because landfill and collection operations emit GHGs, our operations in California are subject to regulations issued under AB 32. The California Air Resources Board, or CARB, has taken, and plans to take, various actions to implement AB 32. CARB approved a landfill methane control measure, which became effective in June 2010, and this measure requires that certain uncontrolled landfills install gas collection and control systems and also sets operating standards for gas collection and control systems. In addition, CARB implemented a GHG cap-and-trade program, which began imposing compliance obligations in January 2013.
| 12 |
State climate change laws could also affect our non-California operations. For example, the Western Climate Initiative, which once included seven states and four Canadian provinces, has developed GHG reduction strategies, among them a GHG cap-and-trade program.
Heightened regulation of our customers’ operations, could also adversely affect our business. The regulation of GHG emissions from oil and gas E&P operations may increase the costs to our customers of developing and producing hydrocarbons and, as a result, may have an indirect and adverse effect on the amount of oilfield waste delivered to our facilities by our customers. On August 18, 2015, the EPA proposed measures to cut methane and volatile organic compounds, or VOC, emissions from the oil and natural gas industry. The measures include proposed NSPS Subpart OOOO, which sets methane and VOC requirements for certain new and modified sources, including hydraulically fractured oil wells, pneumatic pumps, compressors and pneumatic controllers. The State of Colorado adopted rules in February 2014 that would directly regulate methane emissions from the oil and gas sector, and other states have subsequently adopted or considered similar regulations, including Wyoming, California and Ohio.
These statutes and regulations increase the costs of our and our customers’ operations, and future climate change statutes and regulations may have an impact as well. If we are unable to pass such higher costs through to our customers, or if our customers’ costs of developing and producing hydrocarbons increase, our business, financial condition and operating results could be adversely affected.
The Occupational Safety and Health Act of 1970, or the OSH Act
The OSH Act is administered by the Occupational Safety and Health Administration, or OSHA, and many state agencies whose programs have been approved by OSHA. The OSH Act establishes employer responsibilities for worker health and safety, including the obligation to maintain a workplace free of recognized hazards likely to cause death or serious injury, comply with adopted worker protection standards, maintain certain records, provide workers with required disclosures and implement certain health and safety training programs. Various OSHA standards may apply to our operations, including standards concerning notices of hazards, safety in excavation and demolition work, the handling of asbestos and asbestos-containing materials and worker training and emergency response programs. Moreover, the Department of Transportation, OSHA and other agencies regulate and have jurisdiction concerning the transport, movement, and related safety of hazardous and other regulated materials. In some instances, state and local agencies also regulate the safe transport of such materials to the extent not preempted by federal law.
Hydraulic Fracturing Regulation
We do not conduct hydraulic fracturing operations, but we do provide treatment, recovery and disposal services with respect to the fluids used and wastes generated by our customers in such operations, which are often necessary to drill and complete new wells and maintain existing wells. Recently, there has been increased public concern regarding the alleged potential for hydraulic fracturing to adversely affect drinking water supplies, and proposals have been made to enact separate federal legislation or legislation at the state and local government levels that would increase the regulatory burden imposed on hydraulic fracturing. Bills and regulations have been proposed and/or adopted at the federal, state and local levels that would regulate, restrict or prohibit hydraulic fracturing operations or require the reporting and public disclosure of chemicals used in the hydraulic fracturing process. Additionally, the EPA is currently studying the environmental impacts of hydraulic fracturing on drinking water. The EPA released its Draft Assessment outlining its findings in June 2015. In 2014, the EPA proposed or discussed new rules that would regulate hydraulic fracturing and the treatment and disposal of E&P wastes associated with fracturing.
Hydraulic fracturing is regulated extensively at the state level, typically by state oil and natural gas commissions and similar agencies. Certain states and localities have placed moratoria or bans on hydraulic fracturing or the disposal of waste therefrom, or have considered the same. For example, in December 2014, New York announced its intention to ban hydraulic fracturing, and bans or moratoria are in effect in localities in California, Colorado, Ohio, Pennsylvania and Texas, as well as in other states. Several states, including Louisiana, New Mexico, North Dakota, Oklahoma, Texas and Wyoming, where we conduct business, have adopted or proposed laws and/or regulations to require oil and natural gas operators to disclose information concerning their operations, which could result in increased public scrutiny.
| 13 |
As part of its efforts to regulate hydraulic fracturing, the EPA developed a proposed rule to amend the Effluent Limitations Guidelines and Standards, or ELGs, to address discharges of wastewater pollutants from onshore unconventional oil and gas extraction facilities to publicly-owned treatment works, or POTWs. The EPA sent the proposed rule to the White House Office of Management & Budget in November 2014 for pre-publication review and published the proposed rule in April 2015. The EPA is currently conducting a detailed study of centralized waste treatment, or CWT, facilities accepting oil and gas extraction wastewater to ensure that current controls are adequate and to analyze the environmental impacts of discharges from CWTs, available treatment technologies and their costs. In May 2014, the EPA issued an ANPR under the Toxic Substances Control Act, or TSCA, seeking comment on whether and how the EPA should regulate the reporting or disclosure of the use of hydraulic fracturing chemical substances and mixtures. The EPA also released in 2014 guidance concerning the applicability of the SDWA to hydraulic fracturing operations. The impacts of these rules that the EPA is proposing or considering will be uncertain until the rules are finalized.
If the EPA’s newly proposed or discussed rules, or other new federal, state or local laws or regulations that significantly restrict hydraulic fracturing, are adopted, such legal requirements could result in delays, eliminate certain drilling and injection activities and make it more difficult or costly for our customers to perform hydraulic fracturing. Any such regulations limiting or prohibiting hydraulic fracturing could reduce oil and natural gas exploration and production activities by our customers and, therefore, adversely affect our business. Such laws or regulations could also materially increase our costs of compliance.
Flow Control/Interstate Waste Restrictions
Certain permits and approvals and state and local regulations may limit a landfill’s or transfer station’s ability to accept waste that originates from specified geographic areas, import out-of-state waste or wastes originating outside the local jurisdictions or otherwise discriminate against non-local waste. These restrictions, generally known as flow control restrictions, are controversial, and some courts have held that some state and local flow control schemes violate constitutional limits on state or local regulation of interstate commerce, while other state and local flow control schemes do not. Certain state and local jurisdictions may seek to enforce flow control restrictions through local legislation or contractually. These actions could limit or prohibit the importation of wastes originating outside of local jurisdictions or direct that wastes be handled at specified facilities. Such actions could adversely affect our transfer stations and landfills. These restrictions could also result in higher disposal costs for our collection operations. If we were unable to pass such higher costs through to our customers, our business, financial condition and operating results could be adversely affected. Additionally, certain local jurisdictions have sought or may seek to impose extraterritorial obligations on our operations in an effort to affect flow control and enforce tax and fee arrangements on behalf of such jurisdictions.
Disposal of Drilling Fluids
Certain of our facilities accept drilling fluids and other E&P wastes for disposal via underground injection. While generally regulated at the state level, claims, including some regulatory actions, have been brought against some owners or operators of these types of facilities for nuisance, seismic disturbances, and other claims in relation to the operation of underground injection facilities. To date, our facilities have not been subject to any such litigation.
State and Local Regulations
Each state in which we now operate or may operate in the future has laws and regulations governing the management, generation, storage, treatment, handling, transportation and disposal of solid waste, oilfield waste, occupational safety and health, water and air pollution and, in most cases, the siting, design, operation, maintenance, corrective action, closure and post-closure maintenance of landfills and transfer stations. State and local permits and approval for these operations may be required and may be subject to periodic renewal, modification or revocation by the issuing agencies. In addition, many states have adopted statutes comparable to, and in some cases more stringent than, their federal counterparts, including CERCLA. State law analogous to CERCLA typically impose requirements for investigation and clean-up of contaminated sites and liability for costs and damages associated with such sites, and some provide for the imposition of liens on property owned by responsible parties.
Many municipalities also have enacted or could enact ordinances, local laws and regulations affecting our operations. These include zoning and health measures that limit solid waste management activities to specified sites or activities, flow control provisions that direct or restrict the delivery of solid wastes to specific facilities, laws that grant the right to establish franchises for collection services and bidding for such franchises, and bans or other restrictions on the movement of solid wastes into a municipality.
Various jurisdictions have enacted “fitness” regulations which allow agencies with authority over waste service contracts or permits to deny or revoke such contracts or permits based on the compliance history of the provider. Some jurisdictions also consider the compliance history of the parent, subsidiaries, or affiliated companies of the provider in making these decisions.
Permits or other land use approvals with respect to a landfill, as well as state or local laws and regulations, may specify the quantity of waste that may be accepted at the landfill during a given time period and/or the types of waste that may be accepted at the landfill. Once an operating permit for a landfill is obtained, it generally must be renewed periodically.
| 14 |
There has been an increasing trend at the state and local level to mandate and encourage waste reduction at the source and waste recycling, and to prohibit or restrict the disposal in landfills of certain types of solid wastes, such as food waste, yard waste, leaves, tires, computers and other electronic equipment waste, and painted wood and other construction and demolition debris. The enactment of regulations reducing the volume and types of wastes available for transport to and disposal in landfills could prevent us from operating our facilities at their full capacity.
Some state and local authorities enforce certain federal requirements in addition to state and local laws and regulations. For example, in some states, local or state authorities enforce requirements of RCRA, the OSH Act and parts of the CAA and the Clean Water Act instead of the EPA or OSHA, as applicable, and in some states such laws are enforced jointly by state or local and federal authorities.
E&P waste treatment, recovery and disposal operations are also regulated at the state level. For example, in Louisiana, the Louisiana Department of Natural Resources, or LDNR is responsible for regulating and permitting all oil and natural gas activities in the state, including E&P waste treatment and disposal operations, such as injection wells, land treatment and disposal facilities and transfer stations. As an example of the impact state regulations can have, in November 2009, the LDNR amended its regulations allowing operators to reuse certain E&P waste in hydraulic fracturing operations one time before the operators must dispose of the waste, and on June 20, 2010, the LDNR amended its regulations to allow operators to reuse E&P waste from hydraulic fracturing as many times as reasonably feasible. This regulatory action allows operators to, in some cases, forego sending their E&P waste to commercial disposal facilities such as ours, directly impacting our operations in Louisiana. State environmental laws and regulations require that we obtain permits and authorizations prior to the development and operation of E&P waste treatment and storage facilities and in connection with the disposal and transportation of certain types of waste. The applicable regulatory agencies strictly monitor production and disposal practices at all of our facilities. As part of our permitting process, we participate in annual monitoring, internal testing and third-party testing. A breach of such laws or regulations may result in suspension or revocation of necessary permits and authorizations, civil liability and imposition of fines and penalties. Moreover, if we experience a delay in obtaining, are unable to obtain, or suffer the revocation of required permits, we may be unable to serve our customers, our operations may be interrupted, and our growth and revenue may be limited.
Public Utility Regulation
In some states, public authorities regulate the rates that landfill operators may charge. The adoption of rate regulation or the reduction of current rates in states in which we own or operate landfills could adversely affect our business, financial condition and operating results.
Solid waste collection services in all unincorporated areas of Washington and in electing municipalities in Washington are provided under G Certificates awarded by the WUTC. In association with the regulation of solid waste collection service levels in these areas, the WUTC also reviews and approves rates for regulated solid waste collection and transportation service.
RISK MANAGEMENT, INSURANCE AND FINANCIAL SURETY BONDS
Risk Management
We maintain environmental and other risk management programs that we believe are appropriate for our business. Our environmental risk management program includes evaluating existing facilities and potential acquisitions for environmental law compliance. We do not presently expect environmental compliance costs to increase materially above current levels, but we cannot predict whether future acquisitions will cause such costs to increase. We also maintain a worker safety program that encourages safe practices in the workplace. Operating practices at our operations emphasize minimizing the possibility of environmental contamination and litigation. Our facilities comply in all material respects with applicable federal and state regulations.
Insurance
We have a high deductible or self-insured retention insurance program for automobile liability, general liability, employer’s liability claims, environmental liability, cyber liability, employment practices liability and directors’ and officers’ liability as well as for employee group health insurance, property and workers’ compensation. Our loss exposure for insurance claims is generally limited to per incident deductibles or self-insured retentions. Losses in excess of deductible or self-insured retention levels are insured subject to policy limits. Under our current insurance program, we carry per incident deductibles or self-insured retentions of $2 million for automobile liability claims, $1.5 million for workers’ compensation and employer’s liability claims, $1 million for general liability claims, $1 million for directors’ and officers’ liability claims, $250,000 for employee group health insurance and employment practices liability, and primarily $100,000 for property claims, subject to certain additional terms and conditions. We also have a policy covering risks associated with cyber liability that has a $50,000 self-insured retention. Additionally, we have umbrella policies with insurance companies for automobile liability, general liability and employer’s liability. Since workers’ compensation is a statutory coverage limited by the various state jurisdictions, the umbrella coverage is not applicable. Also, our umbrella policy does not cover property claims, as the insurance limits for these claims are in accordance with the replacement values of the insured property. From time to time, actions filed against us include claims for punitive damages, which are generally excluded from coverage under our liability insurance policies.
| 15 |
We carry environmental protection insurance which has a $250,000 per incident deductible. This insurance policy covers all owned or operated landfills, certain transfer stations and other facilities, subject to the policy terms and conditions. Our policy provides insurance for new pollution conditions that originate after the commencement of our coverage. Pollution conditions existing prior to the commencement of our coverage, if found, could be excluded from coverage.
Financial Surety Bonds
We use financial surety bonds for a variety of corporate guarantees. The financial surety bonds are primarily used for guaranteeing municipal contract performance and providing financial assurances to meet asset closure and retirement requirements under certain environmental regulations. In addition to surety bonds, such guarantees and obligations may also be met through alternative financial assurance instruments, including insurance, letters of credit and restricted asset deposits. At December 31, 2015 and 2014, we had provided customers and various regulatory authorities with surety bonds in the aggregate amount of approximately $353.8 million and $342.6 million, respectively, to secure our asset closure and retirement requirements and $121.7 million and $94.4 million, respectively, to secure performance under collection contracts and landfill operating agreements.
We own a 9.9% interest in a company that, among other activities, issues financial surety bonds to secure landfill final capping, closure and post-closure obligations for companies operating in the solid waste sector, including a portion of our own.
EMPLOYEES
At December 31, 2015, we had 7,227 employees, of which 797, or approximately 11.0% of our workforce, were employed under collective bargaining agreements, primarily with the Teamsters Union. These collective bargaining agreements are renegotiated periodically. We have 11 collective bargaining agreements covering 358 employees that have expired or are set to expire during 2016. We do not expect any significant disruption in our overall business in 2016 as a result of labor negotiations, employee strikes or organizational efforts.
SEASONALITY
We expect our operating results to vary seasonally, with revenues typically lowest in the first quarter, higher in the second and third quarters and lower in the fourth quarter than in the second and third quarters. This seasonality reflects (a) the lower volume of solid waste generated during the late fall, winter and early spring because of decreased construction and demolition activities during winter months in the U.S., and (b) reduced E&P activity during harsh weather conditions, with expected fluctuation due to such seasonality between our highest and lowest quarters of approximately 12% to 15%. In addition, some of our operating costs may be higher in the winter months. Adverse winter weather conditions slow waste collection activities, resulting in higher labor and operational costs. Greater precipitation in the winter increases the weight of collected municipal solid waste, resulting in higher disposal costs, which are calculated on a per ton basis.
| 16 |
EXECUTIVE OFFICERS OF THE REGISTRANT
The following table sets forth certain information concerning our executive officers as of February 9, 2016:
| NAME | AGE | POSITIONS | ||
| Ronald J. Mittelstaedt (1) | 52 | Chief Executive Officer and Chairman | ||
| Steven F. Bouck | 58 | President | ||
| Darrell W. Chambliss | 51 | Executive Vice President and Chief Operating Officer | ||
| Worthing F. Jackman | 51 | Executive Vice President and Chief Financial Officer | ||
| David G. Eddie | 46 | Senior Vice President and Chief Accounting Officer | ||
| David M. Hall | 58 | Senior Vice President – Sales and Marketing | ||
| James M. Little | 54 | Senior Vice President – Engineering and Disposal | ||
| Patrick J. Shea | 45 | Senior Vice President, General Counsel and Secretary | ||
| Matthew S. Black | 43 | Vice President and Chief Tax Officer | ||
| Robert M. Cloninger | 43 | Vice President, Deputy General Counsel and Assistant Secretary | ||
| Eric O. Hansen | 50 | Vice President – Chief Information Officer | ||
| Susan R. Netherton | 46 | Vice President – People, Training and Development | ||
| Scott I. Schreiber | 59 | Vice President – Disposal Operations | ||
| Gregory Thibodeaux | 49 | Vice President – Maintenance and Fleet Management | ||
| Mary Anne Whitney | 52 | Vice President – Finance | ||
| Richard K. Wojahn | 58 | Vice President – Business Development |
| (1) | Member of the Executive Committee of the Board of Directors. |
Ronald J. Mittelstaedt has served as Chief Executive Officer and a director of Waste Connections since the company was formed, and was elected Chairman in January 1998. Mr. Mittelstaedt also served as President from Waste Connections’ formation through August 2004. Mr. Mittelstaedt has more than 26 years of experience in the solid waste industry. Mr. Mittelstaedt serves as a director of SkyWest, Inc. Mr. Mittelstaedt holds a B.A. degree in Business Economics with a finance emphasis from the University of California at Santa Barbara.
Steven F. Bouck has served as President of Waste Connections since September 1, 2004. From February 1998 to that date, Mr. Bouck served as Executive Vice President and Chief Financial Officer. Mr. Bouck held various positions with First Analysis Corporation from 1986 to 1998, focusing on financial services to the environmental industry. Mr. Bouck holds B.S. and M.S. degrees in Mechanical Engineering from Rensselaer Polytechnic Institute, and an M.B.A. in Finance from the Wharton School of Business.
Darrell W. Chambliss has served as Executive Vice President and Chief Operating Officer of Waste Connections since October 2003. From October 1, 1997, to that date, Mr. Chambliss served as Executive Vice President – Operations. Mr. Chambliss has more than 25 years of experience in the solid waste industry. Mr. Chambliss holds a B.S. degree in Business Administration from the University of Arkansas.
Worthing F. Jackman has served as Executive Vice President and Chief Financial Officer of Waste Connections since September 1, 2004. From April 2003 to that date, Mr. Jackman served as Vice President – Finance and Investor Relations. Mr. Jackman held various investment banking positions with Alex. Brown & Sons, now Deutsche Bank Securities, Inc., from 1991 through 2003, including most recently as a Managing Director within the Global Industrial & Environmental Services Group. In that capacity, he provided capital markets and strategic advisory services to companies in a variety of sectors, including solid waste services. Mr. Jackman serves as a director of Quanta Services, Inc. He holds a B.S. degree in Finance from Syracuse University and an M.B.A. from the Harvard Business School.
David G. Eddie has served as Senior Vice President and Chief Accounting Officer of Waste Connections since January 2011. From February 2010 to that date, Mr. Eddie served as Vice President – Chief Accounting Officer. From March 2004 to February 2010, Mr. Eddie served as Vice President – Corporate Controller. From April 2003 to February 2004, Mr. Eddie served as Vice President – Public Reporting and Compliance. From May 2001 to March 2003, Mr. Eddie served as Director of Finance. Mr. Eddie served as Corporate Controller for International Fibercom, Inc. from April 2000 to May 2001. From September 1999 to April 2000, Mr. Eddie served as Waste Connections’ Manager of Financial Reporting. From September 1994 to September 1999, Mr. Eddie held various positions, including Audit Manager, for PricewaterhouseCoopers LLP. Mr. Eddie is a Certified Public Accountant and holds a B.S. degree in Accounting from California State University, Sacramento.
| 17 |
David M. Hall has served as Senior Vice President – Sales and Marketing of Waste Connections since October 2005. From August 1998 to that date, Mr. Hall served as Vice President – Business Development. Mr. Hall has more than 30 years of experience in the solid waste industry with extensive operating and marketing experience in the Western U.S. Mr. Hall received a B.S. degree in Management and Marketing from Missouri State University.
James M. Little has served as Senior Vice President – Engineering and Disposal of Waste Connections since February 2009. From September 1999 to that date, Mr. Little served as Vice President – Engineering. Mr. Little held various management positions with Waste Management, Inc. (formerly USA Waste Services, Inc., which acquired Waste Management, Inc. and Chambers Development Co. Inc.) from April 1990 to September 1999, including Regional Environmental Manager and Regional Landfill Manager, and most recently Division Manager in Ohio, where he was responsible for the operations of ten operating companies in the Northern Ohio area. Mr. Little is a certified professional geologist and holds a B.S. degree in Geology from Slippery Rock University.
Patrick J. Shea has served as Senior Vice President, General Counsel and Secretary of Waste Connections since August 2014. From February 2009 to that date, Mr. Shea served as Vice President, General Counsel and Secretary. From February 2008 to February 2009, Mr. Shea served as General Counsel and Secretary. He served as Corporate Counsel from February 2004 to February 2008. Mr. Shea practiced corporate and securities law with Brobeck, Phleger & Harrison LLP in San Francisco from 1999 to 2003 and Winthrop, Stimson, Putnam & Roberts (now Pillsbury Winthrop Shaw Pittman LLP) in New York and London from 1995 to 1999. Mr. Shea holds a B.S. degree in Managerial Economics from the University of California at Davis and a J.D. degree from Cornell University.
Matthew S. Black has served as Vice President and Chief Tax Officer of Waste Connections since March 2012. From December 2006 to that date, Mr. Black served as Executive Director of Taxes. Mr. Black served as Tax Director for The McClatchy Company from April 2001 to November 2006, and served as Tax Manager from December 2000 to March 2001. From January 1994 to November 2000, Mr. Black held various positions, including Tax Manager, for PricewaterhouseCoopers LLP. Mr. Black is a Certified Public Accountant and holds a B.S. degree in Accounting and M.S. degree in Taxation from California State University, Sacramento.
Robert M. Cloninger has served as Vice President, Deputy General Counsel and Assistant Secretary of Waste Connections since August 2014. From February 2013 to that date, Mr. Cloninger served as Deputy General Counsel. He served as Corporate Counsel from February 2008 to February 2013. Mr. Cloninger practiced corporate, securities and mergers and acquisitions law with Schiff Hardin LLP in Chicago from 1999 to 2004 and Downey Brand LLP in Sacramento from 2004 to 2008. Mr. Cloninger holds a B.A. degree in History from Northwestern University and a J.D. degree from the University of California at Davis.
Eric O. Hansen has served as Vice President – Chief Information Officer of Waste Connections since July 2004. From January 2001 to that date, Mr. Hansen served as Vice President – Information Technology. From April 1998 to December 2000, Mr. Hansen served as Director of Management Information Systems. Mr. Hansen holds a B.S. degree from Portland State University.
Susan R. Netherton has served as Vice President – People, Training and Development since July 2013. From February 2007 to that date, Ms. Netherton served as Director of Human Resources and Employment Manager. From 1994 to 2007, Ms. Netherton held various human resources positions at Carpenter Technology Corporation, a publicly traded specialty metals and materials company. Ms. Netherton holds a B. S. in Elementary Education from Kutztown University and an M.B.A. from St. Mary’s College of California.
Scott I. Schreiber has served as Vice President – Disposal Operations of Waste Connections since February 2009. From October 1998 to that date, Mr. Schreiber served as Director of Landfill Operations. Mr. Schreiber has more than 35 years of experience in the solid waste industry. From September 1993 to September 1998, Mr. Schreiber served as corporate Director of Landfill Development and corporate Director of Environmental Compliance for Allied Waste Industries, Inc. From August 1988 to September 1993, Mr. Schreiber served as Regional Engineer (Continental Region) and corporate Director of Landfill Development for Laidlaw Waste Systems Inc. From June 1979 to August 1988, Mr. Schreiber held several managerial and technical positions in the solid waste and environmental industry. Mr. Schreiber holds a B.S. degree in Chemistry from the University of Wisconsin at Parkside.
Gregory Thibodeaux has served as Vice President – Maintenance and Fleet Management of Waste Connections since January 2011. From January 2000 to that date, Mr. Thibodeaux served as Director of Maintenance. Mr. Thibodeaux has more than 29 years of experience in the solid waste industry having held various management positions with Browning Ferris Industries, Sanifill, and USA Waste Services, Inc. Before coming to Waste Connections, Mr. Thibodeaux served as corporate Director of Maintenance for Texas Disposal Systems.
| 18 |
Mary Anne Whitney has served as Vice President - Finance of Waste Connections since March 2012. From November 2006 to that date, Ms. Whitney served as Director of Finance. Ms. Whitney held various finance positions for Wheelabrator Technologies from 1990 to 2001. Ms. Whitney holds a B.A. degree in Economics from Georgetown University and an M.B.A. in Finance from New York University Stern School of Business.
Richard K. Wojahn has served as Vice President – Business Development of Waste Connections since February 2009. From September 2005 to that date, Mr. Wojahn served as Director of Business Development. Mr. Wojahn served as Vice President of Operations for Mountain Jack Environmental Services, Inc. (which was acquired by Waste Connections in September 2005) from January 2004 to September 2005. Mr. Wojahn has more than 34 years of experience in the solid waste industry having held various management positions with Waste Management, Inc. and Allied Waste Industries, Inc. Mr. Wojahn attended Western Illinois University.
AVAILABLE INFORMATION
Our corporate website address is http://www.wasteconnections.com. The information on our website is not incorporated by reference in this annual report on Form 10-K. We make our reports on Forms 10-K, 10-Q and 8-K and any amendments to such reports available on our website free of charge as soon as reasonably practicable after we file them with or furnish them to the Securities and Exchange Commission, or SEC. The public may read and copy any materials we file with the SEC at the SEC’s Public Reference Room at 100 F Street, NE, Washington, DC, 20549. The public may obtain information on the operation of the Public Reference Room by calling the SEC at 1-800-SEC-0330. The SEC maintains an internet website at http://www.sec.gov that contains reports, proxy and information statements, and other information regarding issuers that file electronically with the SEC.
| 19 |
Certain statements contained in this Annual Report on Form 10-K are forward-looking in nature, including statements related to the impact of global economic conditions, including the price of crude oil, on our volume, business and results of operations; our ability to generate internal growth or expand permitted capacity at landfills we own or operate; our ability to grow through acquisitions and our expectations with respect to the impact of acquisitions on our expected revenues and expenses following the integration of such businesses; the competitiveness of our industry and how such competition may affect our operating results; our ability to provide adequate cash to fund our operating activities; our ability to draw on our credit agreement or raise additional capital; our ability to generate free cash flow and reduce our leverage; the effects of landfill special waste projects on volume results; the impact that price increases may have on our business and operating results; demand for recyclable commodities and recyclable commodity pricing; the effects of seasonality on our business and results of operations; our ability to obtain additional exclusive arrangements; increasing alternatives to landfill disposal; increases in labor and pension plan costs or the impact that labor union activity may have on our operating results; our expectations with respect to the purchase of fuel and fuel prices; our expectations with respect to capital expenditures; our expectations with respect to the outcomes of our legal proceedings; the impairment of our goodwill; insurance costs; disruptions to or breaches of our information systems; environmental, health and safety laws and regulations, including changes to the regulation of landfills, solid waste disposal, E&P waste disposal, or hydraulic fracturing; and the Merger Agreement, including the ability of the parties to consummate the proposed Merger. These statements can be identified by the use of forward-looking terminology such as “believes,” “expects,” “may,” “will,” “should,” or “anticipates,” or the negative thereof or comparable terminology, or by discussions of strategy. Our business and operations are subject to a variety of risks and uncertainties and, consequently, actual results may differ materially from those projected by any forward-looking statements. Factors that could cause actual results to differ from those projected include, but are not limited to, those listed below and elsewhere in this report. There may be additional risks of which we are not presently aware or that we currently believe are immaterial which could have an adverse impact on our business. We make no commitment to revise or update any forward-looking statements in order to reflect events or circumstances that may change.
Negative trends or volatility in crude oil prices may adversely affect the level of exploration, development and production activity of E&P companies and the demand for our E&P waste services.
The price of crude oil stayed lower in 2015 and has dropped again at the beginning of 2016. This sustained weakness is expected to affect the profitability and creditworthiness of many E&P companies and therefore may affect their level of investment and the amount of linear feet drilled in the basins where we operate. Lower crude oil prices and the volatility of such prices may impact the ability of E&P companies to access capital on economically advantageous terms or at all; in addition, E&P companies may elect to decrease investment in basins where the returns on investment are inadequate or uncertain due to lower crude oil prices or volatility in crude oil prices. Such reductions in capital spending would negatively impact E&P waste generation and therefore the demand for our services. Further, we cannot provide assurances that higher crude oil prices will result in increased capital spending and linear feet drilled by our customers in the basins where we operate.
Our results are vulnerable to economic conditions.
Our business and financial results would be harmed by downturns in the general economy, or in the economy of the regions in which we operate as well as other factors affecting those regions, including the price of crude oil. In an economic slowdown, we experience the negative effects of decreased waste generation, increased competitive pricing pressure, customer turnover, and reductions in customer service requirements. Two lines of business that could see a more immediate impact would be construction and demolition and E&P waste disposal. In addition, a weaker economy may result in declines in recycled commodity prices. Worsening economic conditions or a prolonged or recurring economic recession could adversely affect our operating results and expected seasonal fluctuations. Further, we cannot assure you that any improvement in economic conditions after such a downturn will result in an immediate, if at all positive, improvement in our operating results or cash flows.
Our financial and operating performance may be affected by the inability to renew landfill operating permits, obtain new landfills and expand existing ones.
We currently own and/or operate 62 landfills. Our ability to meet our financial and operating objectives may depend in part on our ability to acquire, lease, or renew landfill operating permits, expand existing landfills and develop new landfill sites, especially in our E&P waste business. It has become increasingly difficult and expensive to obtain required permits and approvals to build, operate and expand solid waste management facilities, including landfills and transfer stations. Although the process generally takes less time, the process of obtaining permits and approvals for E&P landfills has similar uncertainties. Operating permits for landfills in states where we operate must generally be renewed every five to ten years, although some permits are required to be renewed more frequently. These operating permits often must be renewed several times during the permitted life of a landfill. The permit and approval process is often time consuming, requires numerous hearings and compliance with zoning, environmental and other requirements, is frequently challenged by special interest and other groups, and may result in the denial of a permit or renewal, the award of a permit or renewal for a shorter duration than we believed was otherwise required by law, or burdensome terms and conditions being imposed on our operations. We may not be able to obtain new landfill sites or expand the permitted capacity of our landfills when necessary and may be required to expense up to the carrying value of the landfill or expansion project, less the recoverable value of the property and other amounts recovered. Obtaining new landfill sites is important to our expansion into new, non-exclusive solid waste markets and in our E&P waste business. If we do not believe that we can obtain a landfill site in a non-exclusive market, we may choose not to enter that market. Expanding existing landfill sites is important in those markets where the remaining lives of our landfills are relatively short. We may choose to forego acquisitions and internal growth in these markets because increased volumes would further shorten the lives of these landfills. Any of these circumstances could adversely affect our operating results.
| 20 |
A portion of our growth and future financial performance depends on our ability to integrate acquired businesses, and the success of our acquisitions.
A component of our growth strategy involves achieving economies of scale and operating efficiencies by growing through acquisitions. We may not achieve these goals unless we effectively combine the operations of acquired businesses with our existing operations. Similar risks may affect contracts that we are awarded to operate municipally-owned assets, such as landfills. In addition, we are not always able to control the timing of our acquisitions. Our inability to complete acquisitions within the time frames that we expect may cause our operating results to be less favorable than expected, which could cause our stock price to decline.
Even if we are able to make acquisitions on advantageous terms and are able to integrate them successfully into our operations and organization, some acquisitions may not fulfill our anticipated financial or strategic objectives in a given market due to factors that we cannot control, such as market conditions, including the price of crude oil, market position, competition, customer base, loss of key employees, third-party legal challenges or governmental actions. In addition, we may change our strategy with respect to a market or acquired businesses and decide to sell such operations at a loss, or keep those operations and recognize an impairment of goodwill and/or intangible assets. Similar risks may affect contracts that we are awarded to operate municipally-owned assets, such as landfills.
Each business that we acquire or have acquired may have liabilities or risks that we fail or are unable to discover, or that become more adverse to our business than we anticipated at the time of acquisition.
It is possible that the corporate entities or sites we have acquired, or which we may acquire in the future, have liabilities or risks in respect of former or existing operations or properties, or otherwise, which we have not been able to identify and assess through our due diligence investigations. As a successor owner, we may be legally responsible for those liabilities that arise from businesses that we acquire. Even if we obtain legally enforceable representations, warranties and indemnities from the sellers of such businesses, they may not cover the liabilities fully or the sellers may not have sufficient funds to perform their obligations. Some environmental liabilities, even if we do not expressly assume them, may be imposed on us under various regulatory schemes and other applicable laws. In addition, our insurance program may not cover such sites and will not cover liabilities associated with some environmental issues that may have existed prior to attachment of coverage. A successful uninsured claim against us could harm our financial condition or operating results. Additionally, there may be other risks of which we are unaware that could have an adverse effect on businesses that we acquire or have acquired. For example, interested parties may bring actions against us in connection with operations that we acquire or have acquired. Furthermore, risks or liabilities we judge to be not material or remote at the time of acquisition may develop into more serious risks to our business. Any adverse outcome resulting from such risks or liabilities could harm our operations and financial results and create negative publicity, which could damage our reputation, competitive position and stock price. For example, see the discussion regarding the Lower Duwamish Waterway Superfund Site Allocation Process under the “Legal Proceedings” section of Note 10 of our consolidated financial statements included in Item 8 of this report.
Competition for acquisition candidates, consolidation within the waste industry and economic and market conditions may limit our ability to grow through acquisitions.
We seek to grow through strategic acquisitions in addition to internal growth. Although we have and expect to continue to identify numerous acquisition candidates that we believe may be suitable, we may not be able to acquire them at prices or on terms and conditions favorable to us.
| 21 |
Other companies have adopted or may in the future adopt our strategy of acquiring and consolidating regional and local businesses. We expect that increased consolidation in the solid waste services industry will continue to reduce the number of attractive acquisition candidates. Moreover, general economic conditions and the environment for attractive investments may affect the desire of the owners of acquisition candidates to sell their companies. As a result, we may have fewer acquisition opportunities, and those opportunities may be on less attractive terms than in the past, which could cause a reduction in our rate of growth from acquisitions.
Our ability to access the capital markets may be severely restricted at a time when we would like, or need, to do so. While we expect we will be able to fund some of our acquisitions with our existing resources, additional financing to pursue additional acquisitions may be required. However, particularly if market conditions deteriorate, we may be unable to secure additional financing or any such additional financing may be available to us on unfavorable terms, which could have an impact on our flexibility to pursue additional acquisition opportunities. In addition, disruptions in the capital and credit markets could adversely affect our ability to draw on our credit agreement or raise other capital. Our access to funds under the credit agreement is dependent on the ability of the banks that are parties to the facility to meet their funding commitments. Those banks may not be able to meet their funding commitments if they experience shortages of capital and liquidity or if they experience excessive volumes of borrowing requests within a short period of time.
Our industry is highly competitive and includes larger and better capitalized companies, companies with lower prices, return expectations or other advantages, and governmental service providers, which could adversely affect our ability to compete and our operating results.
Our industry is highly competitive and requires substantial labor and capital resources. Some of the markets in which we compete or will seek to compete are served by one or more large, national companies, as well as by regional and local companies of varying sizes and resources, some of which we believe have accumulated substantial goodwill in their markets. Some of our competitors may also be better capitalized than we are, have greater name recognition than we do, or be able to provide or be willing to bid their services at a lower price than we may be willing to offer. In addition, existing and future competitors may develop or offer services or new technologies, new facilities or other advantages. Our inability to compete effectively could hinder our growth or negatively impact our operating results.
In our solid waste business, we also compete with counties, municipalities and solid waste districts that maintain or could in the future choose to maintain their own waste collection and disposal operations, including through the implementation of flow control ordinances or similar legislation. These operators may have financial advantages over us because of their access to user fees and similar charges, tax revenues and tax-exempt financing.
In our E&P waste business, we compete for disposal volumes with existing facilities owned by third parties, and we face potential competition from new facilities that are currently under development. Increased competition in certain markets may result in lower pricing and decreased volumes at our facilities. In addition, customers in certain markets may decide to use internal disposal methods for the treatment and disposal of their waste.
Our indebtedness could adversely affect our financial condition and limit our financial flexibility.
As of December 31, 2015, we had approximately $2.2 billion of total indebtedness outstanding, and we may incur additional debt in the future. This amount of indebtedness could:
| · | increase our vulnerability to general adverse economic and industry conditions; |
| · | expose us to interest rate risk since a majority of our indebtedness is at variable rates; |
| · | limit our ability to obtain additional financing or refinancings at attractive rates; |
| · | require the dedication of a substantial portion of our cash flow from operations to the payment of principal of, and interest on, our indebtedness, thereby reducing the availability of such cash flow to fund our growth strategy, working capital, capital expenditures, dividends, share repurchases and other general corporate purposes; |
| · | limit our flexibility in planning for, or reacting to, changes in our business and the industry; and |
| · | place us at a competitive disadvantage relative to our competitors with less debt. |
Further, our outstanding indebtedness is subject to financial and other covenants, which may be affected by changes in economic or business conditions or other events that are beyond our control. If we fail to comply with the covenants under any of our indebtedness, we may be in default under the loan, which may entitle the lenders to accelerate the debt obligations. A default under one of our loans could result in cross-defaults under our other indebtedness. In order to avoid defaulting on our indebtedness, we may be required to take actions such as reducing or delaying capital expenditures, reducing or eliminating dividends or stock repurchases, selling assets, restructuring or refinancing all or part of our existing debt, or seeking additional equity capital, any of which may not be available on terms that are favorable to us, if at all.
| 22 |
Price increases may not be adequate to offset the impact of increased costs, or may cause us to lose volume.
We seek price increases necessary to offset increased costs, to improve operating margins and to obtain adequate returns on our deployed capital. Contractual, general economic, competitive or market-specific conditions may limit our ability to raise prices. As a result of these factors, we may be unable to offset increases in costs, improve operating margins and obtain adequate investment returns through price increases. We may also lose volume to lower-price competitors.
Fluctuations in prices for recycled commodities that we sell and rebates we offer to customers may cause our revenues and operating results to decline.
We provide recycling services to some of our customers. The majority of the recyclables we process for sale are paper products that are shipped to customers in Asia. The sale prices of and demands for recyclable commodities, particularly paper products, are frequently volatile and when they decline, our revenues, operating results and cash flows will be affected. Many of our recycling operations offer rebates to customers based on the market prices of commodities we buy to process for resale. Therefore, if we recognize increased revenues resulting from higher prices for recyclable commodities, the rebates we pay to suppliers will also increase, which also may impact our operating results.
The seasonal nature of our business and “event-driven” waste projects cause our results to fluctuate.
Based on historic trends, we expect our operating results to vary seasonally, with revenues typically lowest in the first quarter, higher in the second and third quarters, and lower in the fourth quarter than in the second and third quarters. We expect the fluctuation in our revenues between our highest and lowest quarters to be approximately 12% to 15%. This seasonality reflects the lower volume of solid waste generated during the late fall, winter and early spring because of decreased construction and demolition activities during the winter months in the U.S., and reduced E&P activity during harsh weather conditions. Conversely, mild winter weather conditions may reduce demand for oil and natural gas, which may cause our customers to curtail their drilling programs, which could result in production of lower volumes of E&P waste.
Adverse winter weather conditions slow waste collection activities, resulting in higher labor and operational costs. Greater precipitation in the winter increases the weight of collected waste, resulting in higher disposal costs, which are calculated on a per ton basis. Certain weather conditions, including severe storms, may result in temporary suspension of our operations, which can significantly impact the operating results of the affected areas. Conversely, weather-related occurrences and other “event-driven” waste projects can boost revenues through heavier weight loads or additional work for a limited time period. These factors impact period-to-period comparisons of financial results, and our stock price may be negatively affected by these variations.
We may lose contracts through competitive bidding, early termination or governmental action.
We derive a significant portion of our revenues from market areas where we have exclusive arrangements, including franchise agreements, municipal contracts and G Certificates. Many franchise agreements and municipal contracts are for a specified term and are, or will be, subject to competitive bidding in the future. For example, we have approximately 265 contracts, representing approximately 2.5% of our annual revenues, which are set for expiration or automatic renewal on or before December 31, 2016. Although we intend to bid on additional municipal contracts and franchise agreements, we may not be the successful bidder. In addition, some of our customers, including municipalities, may terminate their contracts with us before the end of the terms of those contracts. Similar risks may affect contracts that we are awarded to operate municipally-owned assets, such as landfills. For example, see the discussion regarding the Madera County, California Materials Recovery Facility Contract Litigation under the “Legal Proceedings” section of Note 10 of our consolidated financial statements included in Item 8 of this report.
Governmental action may also affect our exclusive arrangements. Municipalities may annex unincorporated areas within counties where we provide collection services. As a result, our customers in annexed areas may be required to obtain services from competitors that have been franchised by the annexing municipalities to provide those services. In addition, municipalities in which we provide services on a competitive basis may elect to franchise those services. Unless we are awarded franchises by these municipalities, we will lose customers. Municipalities may also decide to provide services to their residents themselves, on an optional or mandatory basis, causing us to lose customers. Municipalities in Washington may, by law, annex any unincorporated territory, which could remove such territory from an area covered by a G Certificate issued to us by the WUTC. Such occurrences could subject more of our Washington operations to competitive bidding. Moreover, legislative action could amend or repeal the laws governing WUTC regulation, which could harm our competitive position by subjecting more areas to competitive bidding and/or overlapping service. If we are not able to replace revenues from contracts lost through competitive bidding or early termination or from the renegotiation of existing contracts with other revenues within a reasonable time period, our revenues could decline.
| 23 |
Alternatives to landfill disposal may cause our revenues and operating results to decline.
Counties and municipalities in which we operate landfills may be required to formulate and implement comprehensive plans to reduce the volume of municipal solid waste deposited in landfills through waste planning, composting, recycling or other programs. Some state and local governments prohibit the disposal of certain types of wastes, such as yard waste, at landfills. Although such actions are useful to protect our environment, these actions, as well as the actions of our customers to reduce waste or seek disposal alternatives, have reduced and may in the future further reduce the volume of waste going to landfills in certain areas, which may affect our ability to operate our landfills at full capacity and could adversely affect our operating results.
Increases in labor costs could impact our financial results.
Labor is one of our highest costs and relatively small increases in labor costs per employee could materially affect our cost structure. We compete with other businesses in our markets for qualified employees and the labor supply is sometimes tight in our markets. In our E&P waste business, for example, we are exposed to the cyclical variations in demand that are particular to the development and production of oil and natural gas in the U.S. A shortage of qualified employees would require us to incur additional costs related to wages and benefits, to hire more expensive temporary employees or to contract for services with more expensive third-party vendors.
Increases in the price of diesel or compressed natural gas fuel may adversely affect our collection business and reduce our operating margins.
The market price of diesel fuel is volatile. We generally purchase diesel fuel at market prices, and such prices have fluctuated significantly in recent years. A significant increase in market prices for fuel could adversely affect our waste collection business through a combination of higher fuel and disposal-related transportation costs and reduce our operating margins and reported earnings. To manage a portion of this risk, we have entered into fuel hedge agreements related to forecasted diesel fuel purchases and fixed-price fuel purchase contracts. During periods of falling diesel fuel prices, our hedge payable positions may increase and it may become more expensive to purchase fuel under fixed-price fuel purchase contracts than at market prices.
We utilize compressed natural gas, or CNG, in a small percentage of our fleet and may convert more of our fleet from diesel fuel to CNG over time. The market price of CNG is also volatile; a significant increase in such cost could adversely affect our operating margins and reported earnings.
Labor union activity could divert management attention and adversely affect our operating results.
From time to time, labor unions attempt to organize our employees. Some groups of our employees are represented by unions, and we have negotiated collective bargaining agreements with most of these unions. Additional groups of employees may seek union representation in the future. As a result of these activities, we may be subjected to unfair labor practice charges, complaints and other legal and administrative proceedings initiated against us by unions or the National Labor Relations Board, which could negatively impact our operating results. Negotiating collective bargaining agreements with these unions could divert management attention, which could also adversely affect operating results. If we are unable to negotiate acceptable collective bargaining agreements, we might have to wait through “cooling off” periods, which are often followed by union-initiated work stoppages, including strikes. Depending on the type and duration of any labor disruptions, our operating expenses could increase significantly, which could adversely affect our financial condition, results of operations and cash flows.
We could face significant withdrawal liability if we withdraw from participation in one or more multiemployer pension plans in which we participate and the accrued pension benefits are not fully funded.
We participate in two “multiemployer” pension plans administered by employee and union trustees. We make periodic contributions to these plans to fund pension benefits for our union employees pursuant to our various contractual obligations to do so. In the event that we withdraw from participation in or otherwise cease our contributions to one of these plans, then applicable law regarding withdrawal liability could require us to make additional contributions to the plan if the accrued benefits are not fully funded, and we would have to reflect that “withdrawal liability” as an expense in our consolidated statement of operations and as a liability on our consolidated balance sheet. Our withdrawal liability for any multiemployer plan would depend on the extent to which accrued benefits are funded. In the ordinary course of our renegotiation of collective bargaining agreements with labor unions that participate in these plans, we may decide to discontinue participation in a multiemployer plan, and in that event, we could face withdrawal liability. Some multiemployer plans in which we participate may from time to time have significant accrued benefits that are not funded. The size of our potential withdrawal liability may be affected by the level of unfunded accrued benefits, the actuarial assumptions used by the plan and the investment gains and losses experienced by the plan.
| 24 |
Pending or future litigation or governmental proceedings could result in material adverse consequences, including judgments or settlements.
We are, and from time to time become, involved in lawsuits, regulatory inquiries, and governmental and other legal proceedings arising out of the ordinary course of our business. Many of these matters raise complicated factual and legal issues and are subject to uncertainties and complexities, all of which makes the matters costly to address. For example, in recent years, wage and hour and employment laws have changed regularly and become increasingly complex, which has fostered litigation, including purported class actions. Similarly, citizen suits brought pursuant to environmental laws, such as those regulating the treatment of storm water runoff, have proliferated. The timing of the final resolutions to lawsuits, regulatory inquiries, and governmental and other legal proceedings is uncertain. Additionally, the possible outcomes or resolutions to these matters could include adverse judgments or settlements, either of which could require substantial payments, adversely affecting our consolidated financial condition, results of operations and cash flows. See discussion under the “Legal Proceedings” section of Note 10 of our consolidated financial statements included in Item 8 of this report.
We may be subject in the normal course of business to judicial, administrative or other third-party proceedings that could interrupt or limit our operations, require expensive remediation, result in adverse judgments, settlements or fines and create negative publicity.
Governmental agencies may, among other things, impose fines or penalties on us relating to the conduct of our business, attempt to revoke or deny renewal of our operating permits, franchises or licenses for violations or alleged violations of environmental laws or regulations or as a result of third-party challenges, require us to install additional pollution control equipment or require us to remediate potential environmental problems relating to any real property that we or our predecessors ever owned, leased or operated or any waste that we or our predecessors ever collected, transported, disposed of or stored. Individuals, citizens groups, trade associations or environmental activists may also bring actions against us in connection with our operations that could interrupt or limit the scope of our business. Any adverse outcome in such proceedings could harm our operations and financial results and create negative publicity, which could damage our reputation, competitive position and stock price.
Our financial results could be adversely affected by impairments of goodwill, indefinite-lived intangibles or property and equipment.
As a result of our acquisition strategy, we have a material amount of goodwill, indefinite-lived intangibles and property and equipment recorded in our financial statements. We do not amortize our existing goodwill or indefinite-lived intangibles and are required to test goodwill and indefinite-lived intangibles for impairment annually in the fourth quarter of the year and whenever events or changes in circumstances indicate that the carrying value of goodwill and/or indefinite-lived intangible assets may not be recoverable using the two-step process prescribed in the accounting guidance. The first step is a screen for potential impairment, using either a qualitative or quantitative assessment, while the second step measures the amount of the impairment, if any. We perform the first step of the required impairment tests of goodwill and indefinite-lived intangible assets using a quantitative assessment. The recoverability of property and equipment is tested for impairment whenever events or changes in circumstances indicate that their carrying amount may not be recoverable.
The decline in oil prices that began in late 2014, and continued during 2015, together with market expectations of a likely slow recovery in oil prices, reduced the expected future period cash flows of our E&P segment, causing the fair value of the E&P segment to decrease below its carrying value. During the year ended December 31, 2015, we recorded impairment charges of $411.8 million associated with goodwill, $38.4 million associated with indefinite-lived intangible assets and $67.6 million associated with property and equipment in our E&P segment. Following the impairment charge, at December 31, 2015, our E&P segment has remaining balances of $77.3 million in goodwill, $21.5 million in indefinite-lived intangible assets and $929.8 million in property and equipment. Continued declines in oil prices, and/or a slower recovery in oil prices relative to market expectations could result in additional impairment charges associated with goodwill, indefinite-lived intangible assets and/or property and equipment in our E&P segment, which could adversely affect our financial condition and results of operations.
| 25 |
Increases in insurance costs and the amount that we self-insure for various risks could reduce our operating margins and reported earnings.
We maintain high deductible insurance policies for automobile, general, employer’s, environmental, cyber, employment practices and directors’ and officers’ liability as well as for employee group health insurance, property insurance and workers’ compensation. We carry umbrella policies for certain types of claims to provide excess coverage over the underlying policies and per incident deductibles. The amounts that we effectively self-insure could cause significant volatility in our operating margins and reported earnings based on the event and claim costs of incidents, accidents, injuries and adverse judgments. Our insurance accruals are based on claims filed and estimates of claims incurred but not reported and are developed by our management with assistance from our third-party actuary and our third-party claims administrator. To the extent these estimates are inaccurate, we may recognize substantial additional expenses in future periods that would reduce operating margins and reported earnings. Furthermore, while we maintain liability insurance, our insurance is subject to coverage limitations. If we were to incur substantial liability, our insurance coverage may be inadequate to cover the entirety of such liability. This could have a material adverse effect on our financial position, results of operations and cash flows. One form of coverage limitation concerns claims for punitive damages, which are generally excluded from coverage under all of our liability insurance policies. A punitive damage award could have an adverse effect on our reported earnings in the period in which it occurs. Significant increases in premiums on insurance that we retain also could reduce our margins.
We rely on computer systems to run our business and disruptions or privacy breaches in these systems could impact our ability to service our customers and adversely affect our financial results, damage our reputation, and expose us to litigation risk.
Our businesses rely on computer systems to provide customer information, process customer transactions and provide other general information necessary to manage our businesses. We also rely on a payment card industry compliant third party to protect our customers’ credit card information. We have an active disaster recovery plan in place that we review and test. However, our computer systems are subject to damage or interruption due to system conversions, power outages, computer or telecommunication failures, catastrophic events such as fires, tornadoes and hurricanes and usage errors by our employees. Given the unpredictability of the timing, nature and scope of such disruptions, we could potentially be subject to operational delays and interruptions in our ability to provide services to our customers. Any disruption caused by the unavailability of our computer systems could adversely affect our revenues or could require significant investment to fix or replace them, and, therefore, could affect our operating results.
In addition, cyber-security attacks are evolving and include, but are not limited to, malicious software, attempts to gain unauthorized access to data and other electronic security breaches that could lead to disruptions in systems, unauthorized release of confidential or otherwise protected information and corruption of data. If the network of security controls, policy enforcement mechanisms or monitoring systems we use to address these threats to technology fail, the compromising of confidential or otherwise protected company, customer or employee information, destruction or corruption of data, security breaches or other manipulation or improper use of our systems and networks could result in financial losses from remedial actions, loss of business or potential liability and damage to our reputation.
Extensive and evolving environmental, health and safety laws and regulations may restrict our operations and growth and increase our costs.
Existing environmental laws and regulations have become more stringently enforced in recent years. In addition, our industry is subject to regular enactment of new or amended federal, state and local environmental and health and safety statutes, regulations and ballot initiatives, as well as judicial decisions interpreting these requirements, which have become more stringent over time. Citizen suits brought pursuant to environmental laws have proliferated. We expect these trends to continue, which could lead to material increases in our costs for future environmental, health and safety compliance. These requirements also impose substantial capital and operating costs and operational limitations on us and may adversely affect our business. In addition, federal, state and local governments may change the rights they grant to, the restrictions they impose on, or the laws and regulations they enforce against, solid waste and E&P waste services companies. These changes could adversely affect our operations in various ways, including without limitation, by restricting the way in which we manage storm water runoff, comply with health and safety laws, treat and dispose of E&P or other waste or our ability to operate and expand our business.
Governmental authorities and various interest groups have promoted laws and regulations that could or will limit GHG emissions due to concerns that GHGs are contributing to climate change. The State of California has already adopted a climate change law, and other states in which we operate are considering similar actions. In addition, the EPA made an endangerment finding in 2009 allowing certain GHGs to be regulated under the CAA. This finding allows the EPA to create regulations that will impact our operations – including imposing emission reporting, permitting, control technology installation, and monitoring requirements, although the materiality of the impacts will not be known until all applicable regulations are promulgated and finalized. Regulation of GHG emissions from oil and natural gas E&P operations may also increase the costs to our customers of developing and producing hydrocarbons, and as a result, may have an indirect and adverse effect on the amount of oilfield waste delivered to our facilities by our customers. These statutes and regulations increase the costs of our operations, and future climate change statutes and regulations may have an impact as well.
Our E&P waste business could be adversely affected by changes in laws regulating E&P waste.
We believe that the demand for our E&P waste services is directly related to the regulation of E&P waste. In particular, RCRA, which governs the disposal of solid and hazardous waste, currently exempts certain E&P wastes from classification as hazardous wastes. In recent years, proposals have been made to rescind this exemption from RCRA. If the exemption covering E&P wastes is repealed or modified, or if the regulations interpreting the rules regarding the treatment or disposal of this type of waste were changed, our operations could face significantly more stringent regulations, permitting requirements, and other restrictions, which could have a material adverse effect on our business.
| 26 |
Our E&P waste business depends on the willingness of E&P companies to outsource their waste services activities.
The demand for E&P waste services in the basins in which we operate may be adversely affected by the willingness of E&P companies to outsource their waste services activities. In certain basins, we are largely dependent on the willingness of E&P companies to outsource their waste services activities generally, and to us specifically, rather than to our competitors. To the extent that E&P companies, including our current customers, elect not to outsource their E&P waste services activities or market prices decline, our results may be affected. E&P companies have varying market shares within basins, and, depending on that share, the loss of any customer in a given basin could have an adverse effect on results of operations and cash flows in that market. Furthermore, while our E&P customers frequently require us to enter into master service agreements, such agreements typically do not include volume commitments from the customers and typically are terminable at the discretion of either party. These factors introduce greater volatility to our revenues and operating margins for this business, which could have a material adverse effect on our financial position, results of operations and cash flows.
Changes in laws or government regulations regarding hydraulic fracturing could increase our customers’ costs of doing business and reduce oil and gas production by our customers, which could adversely impact our business.
We do not conduct hydraulic fracturing operations, but we do provide treatment, recovery and disposal services with respect to the fluids used and wastes generated by our customers in such operations, which are often necessary to drill and complete new wells and maintain existing wells. Recently, there has been increased public concern regarding the alleged potential for hydraulic fracturing to adversely affect drinking water supplies, and proposals have been made to enact separate federal, state and local legislation that would increase the regulatory burden imposed on hydraulic fracturing. Bills and regulations have been proposed and/or adopted at the federal, state, and local levels that would regulate, restrict, or prohibit hydraulic fracturing operations or require the reporting and public disclosure of chemicals used in the hydraulic fracturing process. Additionally, the EPA is currently studying the environmental impacts of hydraulic fracturing, including the impacts resulting from the treatment and disposal of E&P wastes associated with the hydraulic fracturing process, which could result in increased regulation of hydraulic fracturing and new rules regarding the treatment and disposal of E&P wastes associated with fracturing.
If new federal, state, or local laws or regulations that significantly restrict hydraulic fracturing are adopted, such legal requirements could result in delays, eliminate certain drilling and injection activities, and make it more difficult or costly for our customers to perform fracturing. Any such regulations limiting or prohibiting hydraulic fracturing could reduce oil and natural gas E&P activities by our customers and, therefore, adversely affect our business. Such laws or regulations could also materially increase our costs of compliance and doing business by more strictly regulating how hydraulic fracturing wastes are handled or disposed. Conversely, any loosening of existing federal, state, or local laws or regulations regarding how such wastes are handled or disposed could adversely impact demand for our services.
Future changes in laws regulating the flow of solid waste in interstate commerce could adversely affect our operating results.
Various state and local governments have enacted, or are considering enacting, laws and regulations that restrict the disposal within the jurisdiction of solid waste generated outside the jurisdiction. In addition, some state and local governments have promulgated, or are considering promulgating, laws and regulations which govern the flow of waste generated within their respective jurisdictions. These “flow control” laws and regulations typically require that waste generated within the jurisdiction be directed to specified facilities for disposal or processing, which could limit or prohibit the disposal or processing of waste in our transfer stations and landfills. Such flow control laws and regulations could also require us to deliver waste collected by us within a particular jurisdiction to facilities not owned or controlled by us, which could increase our costs and reduce our revenues. In addition, such laws and regulations could require us to obtain additional costly licenses or authorizations to be deemed an authorized hauler or disposal facility. All such waste disposal laws and regulations are subject to judicial interpretation and review. Court decisions, legislation, and state and local regulation in the waste disposal area could adversely affect our operations.
Extensive regulations that govern the design, operation, expansion and closure of landfills may restrict our landfill operations or increase our costs of operating landfills.
If we fail to comply with state and federal regulations governing the design, operation, expansion, closure and financial assurance of MSW, non-MSW and E&P landfills, we could be required to undertake investigatory or remedial activities, curtail operations or close such landfills temporarily or permanently. Future changes to these regulations may require us to modify, supplement or replace equipment or facilities at substantial costs. If regulatory agencies fail to enforce these regulations vigorously or consistently, our competitors whose facilities are not forced to comply with the regulations may obtain an advantage over us. Our financial obligations arising from any failure to comply with these regulations could harm our business and operating results.
| 27 |
Our financial results are based upon estimates and assumptions that may differ from actual results.
In preparing our consolidated financial statements in accordance with U.S. generally accepted accounting principles, estimates and assumptions are made that affect the accounting for and recognition of assets, liabilities, revenues and expenses. These estimates and assumptions must be made because certain information that is used in the preparation of our financial statements is dependent on future events, cannot be calculated with a high degree of precision from data available or is not capable of being readily calculated based on generally accepted methodologies. In some cases, these estimates are particularly difficult to determine and we must exercise significant judgment. The most difficult, subjective and complex estimates and the assumptions that deal with the greatest amount of uncertainty are related to our accounting for landfills, self-insurance accruals, income taxes, allocation of acquisition purchase price, asset impairments and litigation, claims and assessments. Actual results for all estimates could differ materially from the estimates and assumptions that we use, which could have an adverse effect on our financial condition and results of operations.
Our accruals for our landfill site closure and post-closure costs may be inadequate.
We are required to pay capping, closure and post-closure maintenance costs for landfill sites that we own and operate. We are also required to pay capping, closure and post-closure maintenance costs for operated landfills for which we have life-of-site agreements. Our obligations to pay closure or post-closure costs may exceed the amount we have accrued and reserved and other amounts available from funds or reserves established to pay such costs. In addition, the completion or closure of a landfill site does not end our environmental obligations. After completion or closure of a landfill site, there exists the potential for unforeseen environmental problems to occur that could result in substantial remediation costs or potential litigation. Paying additional amounts for closure or post-closure costs and/or for environmental remediation and/or for litigation could harm our financial condition or operating results.
We depend significantly on the services of the members of our senior and regional management team, and the departure of any of those persons could cause our operating results to suffer.
Our success depends significantly on the continued individual and collective contributions of our senior and regional management team. Of particular importance to our success are the services of our founder, Chief Executive Officer and Chairman, Ronald J. Mittelstaedt. Key members of our management, including Mr. Mittelstaedt, have entered into employment agreements, but we may not be able to enforce these agreements. The loss of the services of any member of our senior and regional management or the inability to hire and retain experienced management personnel could harm our operating results.
Our decentralized decision-making structure could allow local managers to make decisions that may adversely affect our operating results.
We manage our operations on a decentralized basis. Local managers have the authority to make many decisions concerning their operations without obtaining prior approval from executive officers, subject to compliance with general company-wide policies. Poor decisions by local managers could result in the loss of customers or increases in costs, in either case adversely affecting operating results.
Liabilities for environmental damage may adversely affect our financial condition, business and earnings.
We may be liable for any environmental damage that our current or former operations cause, including damage to neighboring landowners or residents, particularly as a result of the contamination of soil, groundwater or surface water, and especially drinking water, or to natural resources. We may be liable for damage resulting from conditions existing before we acquired these operations. Even if we obtain legally enforceable representations, warranties and indemnities from the sellers of these operations, they may not cover the liabilities fully or the sellers may not have sufficient funds to perform their obligations.
We may also be liable for any on-site environmental contamination caused by pollutants or hazardous substances whose transportation, treatment or disposal we or our predecessors arranged or conducted. Some environmental laws and regulations may impose strict, joint and several liability in connection with releases of regulated substances into the environment. Therefore, in some situations we could be exposed to liability as a result of our conduct that was lawful at the time it occurred or the conduct of, or conditions caused by, third parties, including our predecessors. If we were to incur liability for environmental damage, environmental clean-ups, corrective action or damage not covered by insurance or in excess of the amount of our coverage, our financial condition or operating results could be materially adversely affected. For example, see the discussion regarding the Lower Duwamish Waterway Superfund Site Allocation Process under the “Legal Proceedings” section of Note 10 of our consolidated financial statements included in Item 8 of this report.
| 28 |
If we are not able to develop and protect intellectual property, or if a competitor develops or obtains exclusive rights to a breakthrough technology, our financial results may suffer.
Our existing and proposed service offerings to customers may require that we develop or license, and protect, new technologies. We may experience difficulties or delays in the research, development, production and/or marketing of new products and services which may negatively impact our operating results and prevent us from recouping or realizing a return on the investments required to bring new products and services to market. Further, protecting our intellectual property rights and combating unlicensed copying and use of intellectual property is difficult, and any inability to obtain or protect new technologies could impact our services to customers and development of new revenue sources. Additionally, a competitor may develop or obtain exclusive rights to a “breakthrough technology” that provides a revolutionary change in traditional waste management. If we have inferior intellectual property to our competitors, our financial results may suffer.
Risks Related to our Proposed Merger with Progressive Waste
The proposed Merger is subject to various closing conditions, including regulatory and stockholder approvals, as well as other uncertainties and there can be no assurances as to whether and when the Merger may be completed.
As previously announced, on January 18, 2016, we entered into the Merger Agreement with Progressive Waste and Merger Sub, a wholly-owned subsidiary of Progressive Waste, under which, subject to the terms and conditions of the Merger Agreement, Merger Sub will be merged with and into Waste Connections, with Waste Connections surviving the Merger as a wholly-owned subsidiary of Progressive Waste, which we refer to as the Merger. The consummation of the Merger is subject to various customary conditions, including the affirmative vote of holders of a majority of the outstanding shares of our common stock, the expiration or termination of the applicable waiting period under the Hart-Scott-Rodino Antitrust Improvements Act of 1976, as amended, and other regulatory clearances. If these conditions to the closing of the Merger are not fulfilled, some of which are not within our control, then the Merger cannot be consummated. If the Merger does not receive, or timely receive, the required regulatory approvals and clearances, or if another event occurs that delays or prevents the Merger, such delay or failure to complete the Merger may cause uncertainty and other negative consequences that may materially and adversely affect our business, financial position, and results of operations.
In addition, under certain circumstances in connection with a termination of the Merger Agreement, we may be required to pay a termination fee of up to $150 million to Progressive Waste. We can give you no assurance that the Merger will be consummated, in which case we would not realize the anticipated benefits of having completed the Merger, which may adversely affect us.
In the event that the proposed Merger is not completed, the trading price of our common stock and our future business and financial results may be negatively impacted.
As noted above, the conditions to the completion of the Merger with Progressive Waste may not be satisfied. If the Merger is not completed for any reason, including those not involving the payment by us of the termination fee to Progressive Waste, we would still be liable for significant transaction costs and the focus of our management would have been diverted from seeking other potential opportunities without realizing any benefits of the completed Merger. If we do not complete the Merger, the price of our common stock may decline from the current market price, which may reflect a market assumption that the Merger will be completed.
The proposed Merger may divert management attention and not achieve the intended benefits or may disrupt our operations.
The pendency of the Merger could cause the attention of our management to be diverted from the day-to-day operations and customers or suppliers may seek to modify or terminate their business relationships with us. These disruptions could be exacerbated by a delay in the completion of the Merger and could have an adverse effect on our business, operating results or prospects.
If and when the Merger closes, we may not achieve anticipated synergies, integration may result in unforeseen expenses, and we may not realize the anticipated benefits of the integration plan. Our business may be negatively impacted following the Merger if we are unable to effectively manage our expanded operations. The integration will require significant time and focus from our management and may disrupt achievement of other strategic objectives.
| 29 |
The exchange ratio is fixed and will not be adjusted in the event of any change in the price of either our common stock or Progressive Waste common shares.
At the effective time of the Merger, each share of our common stock issued and outstanding immediately prior to the Merger will be converted into the right to receive 2.076843 validly issued, fully paid and nonassessable common shares of Progressive Waste (or, if the anticipated consolidation of shares of Progressive Waste is approved by the shareholders of Progressive Waste and implemented, one common share of Progressive Waste on a post-consolidation basis). This exchange ratio will not be adjusted for changes in the market price of either our common stock or Progressive Waste common shares between the date of signing the Merger Agreement and completion of the Merger. Changes in the price of Progressive Waste common shares prior to the closing of the Merger will affect the value of Progressive Waste common shares that our stockholders will receive on the effective date. The exchange ratio will, however, be adjusted appropriately to fully reflect the effect of any reclassification, stock split, stock dividend or distribution, recapitalization or other similar transaction with respect to either our common stock or Progressive Waste common shares prior to the effective date of the Merger.
The prices of our common stock and Progressive Waste common shares on the effective date of the Merger may vary from their prices between the date the Merger Agreement was executed and the effective date of the Merger. As a result, the value represented by the exchange ratio will also vary. These variations could result from changes in the business, operations or prospects of either Waste Connections or Progressive Waste prior to or following the effective date of the Merger, regulatory considerations, general market and economic conditions and other factors both within and beyond the control of Waste Connections or Progressive Waste.
| 30 |
| ITEM 1B. | UNRESOLVED STAFF COMMENTS |
None.
| ITEM 2. | PROPERTIES |
As of December 31, 2015, we owned 155 solid waste collection operations, 52 transfer stations, 35 MSW landfills, nine E&P waste landfills, eight non-MSW landfills, 37 recycling operations, five intermodal operations, 24 E&P liquid waste injection wells and 20 E&P waste treatment and oil recovery facilities, and operated, but did not own, an additional 17 transfer stations, nine MSW landfills, one non-MSW landfill and two intermodal operations, in 32 states. Non-MSW landfills accept construction and demolition, industrial and other non-putrescible waste. We lease certain of the sites on which these facilities are located. We lease various office facilities, including our corporate offices in The Woodlands, Texas, where we occupy approximately 53,000 square feet of space. We also maintain regional administrative offices in each of our segments. We own a variety of equipment, including waste collection and transportation vehicles, related support vehicles, double-stack rail cars, carts, containers, chassis and heavy equipment used in landfill, collection, transfer station, waste treatment and intermodal operations. We believe that our existing facilities and equipment are adequate for our current operations. However, we expect to make additional investments in property and equipment for expansion and replacement of assets in connection with future acquisitions.
| ITEM 3. | LEGAL PROCEEDINGS |
Information regarding our legal proceedings can be found under the “Legal Proceedings” section of Note 10 of our consolidated financial statements included in Item 8 of this report and is incorporated herein by reference.
| ITEM 4. | MINE SAFETY DISCLOSURE |
None.
| 31 |
| ITEM 5. | MARKET FOR REGISTRANT'S COMMON EQUITY, RELATED STOCKHOLDER MATTERS AND ISSUER PURCHASES OF EQUITY SECURITIES |
Our common stock is listed on the New York Stock Exchange under the symbol “WCN”. The following table sets forth the high and low prices per share of our common stock, as reported on the New York Stock Exchange, and the cash dividends declared per share of common stock, for the periods indicated.
| HIGH | LOW | DIVIDENDS DECLARED(1) | ||||||||||
| 2016 | ||||||||||||
| First Quarter (through January 29, 2016) | $ | 60.24 | $ | 50.64 | $ | 0.145 | ||||||
| 2015 | ||||||||||||
| Fourth Quarter | $ | 57.65 | $ | 48.16 | $ | 0.145 | ||||||
| Third Quarter | 51.10 | 45.70 | 0.13 | |||||||||
| Second Quarter | 49.39 | 44.81 | 0.13 | |||||||||
| First Quarter | 48.96 | 42.05 | 0.13 | |||||||||
| 2014 | ||||||||||||
| Fourth Quarter | $ | 50.73 | $ | 42.86 | $ | 0.13 | ||||||
| Third Quarter | 50.93 | 46.60 | 0.115 | |||||||||
| Second Quarter | 48.80 | 41.76 | 0.115 | |||||||||
| First Quarter | 44.62 | 39.69 | 0.115 | |||||||||
(1) On February 8, 2016, we announced that our Board of Directors approved a regular quarterly cash dividend of $0.145 per share on our common stock. Our Board of Directors will review the cash dividend periodically, with a long-term objective of increasing the amount of the dividend. We cannot assure you as to the amounts or timing of future dividends. We have the ability under our credit agreement and master note purchase agreement to repurchase our common stock and pay dividends provided we maintain specified financial ratios.
As of January 29, 2016, there were 95 record holders of our common stock.
| 32 |
Performance Graph
The following performance graph compares the total cumulative stockholder returns on our common stock over the past five fiscal years with the total cumulative returns for the S&P 500 Index and the Dow Jones U.S. Waste and Disposal Services Index, or DJ Waste Services Index.
The graph assumes an investment of $100 in our common stock on December 31, 2010, and the reinvestment of all dividends. This chart has been calculated in compliance with SEC requirements and prepared by Capital IQ®.
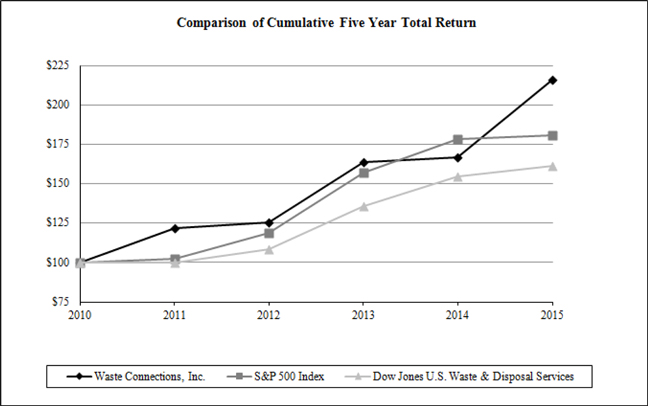
This graph and the accompanying text is not “soliciting material,” is not deemed filed with the SEC, and is not to be incorporated by reference in any filing by us under the Securities Act of 1933, as amended, or the Securities Exchange Act of 1934, as amended, whether made before or after the date hereof and irrespective of any general incorporation language in any such filing.
| Base Period | Indexed Returns Years Ending | |||||||||||||||||||||
| Company Name / Index | Dec10 | Dec11 | Dec12 | Dec13 | Dec14 | Dec15 | ||||||||||||||||
| Waste Connections, Inc. | $ | 100 | $121.56 | $ | 125.42 | $ | 163.63 | $ | 166.68 | $ | 215.73 | |||||||||||
| S&P 500 Index | $ | 100 | $102.11 | $ | 118.45 | $ | 156.82 | $ | 178.29 | $ | 180.75 | |||||||||||
| Dow Jones U.S. Waste & Disposal Services Index | $ | 100 | $100.18 | $ | 108.70 | $ | 135.80 | $ | 154.48 | $ | 160.95 | |||||||||||
THE STOCK PRICE PERFORMANCE INCLUDED IN THIS GRAPH IS NOT NECESSARILY INDICATIVE OF FUTURE STOCK PRICE PERFORMANCE.
| 33 |
| ITEM 6. | SELECTED FINANCIAL DATA |
This table sets forth our selected financial data for the periods indicated. This data should be read in conjunction with, and is qualified by reference to, “Management's Discussion and Analysis of Financial Condition and Results of Operations” included in Item 7 of this Annual Report on Form 10-K and our audited consolidated financial statements, including the related notes and our independent registered public accounting firm’s report and the other financial information included in Item 8 of this Annual Report on Form 10-K. The selected data in this section is not intended to replace the consolidated financial statements included in this report.
| YEARS ENDED DECEMBER 31, | ||||||||||||||||||||
| 2015 (a) | 2014 (a) | 2013 (a) | 2012 | 2011 | ||||||||||||||||
| (in thousands, except share and per share data) | ||||||||||||||||||||
| STATEMENT OF OPERATIONS DATA: | ||||||||||||||||||||
| Revenues | $ | 2,117,287 | $ | 2,079,166 | $ | 1,928,795 | $ | 1,661,618 | $ | 1,505,366 | ||||||||||
| Operating expenses: | ||||||||||||||||||||
| Cost of operations | 1,177,409 | 1,138,388 | 1,064,819 | 956,357 | 857,580 | |||||||||||||||
| Selling, general and administrative | 237,484 | 229,474 | 212,637 | 197,454 | 161,967 | |||||||||||||||
| Depreciation | 240,357 | 230,944 | 218,454 | 169,027 | 147,036 | |||||||||||||||
| Amortization of intangibles | 29,077 | 27,000 | 25,410 | 24,557 | 20,064 | |||||||||||||||
| Loss on prior office leases | - | - | 9,902 | - | - | |||||||||||||||
| Impairments and other operating items | 494,492 | 4,091 | 4,129 | (1,924 | ) | 1,657 | ||||||||||||||
| Operating income (loss) | (61,532 | ) | 449,269 | 393,444 | 316,147 | 317,062 | ||||||||||||||
| Interest expense | (64,236 | ) | (64,674 | ) | (73,579 | ) | (53,037 | ) | (44,520 | ) | ||||||||||
| Other income (expense), net | (518 | ) | 1,067 | 1,056 | 1,993 | 587 | ||||||||||||||
| Income (loss) before income tax provision | (126,286 | ) | 385,662 | 320,921 | 265,103 | 273,129 | ||||||||||||||
| Income tax (provision) benefit | 31,592 | (152,335 | ) | (124,916 | ) | (105,443 | ) | (106,958 | ) | |||||||||||
| Net income (loss) | (94,694 | ) | 233,327 | 196,005 | 159,660 | 166,171 | ||||||||||||||
| Less: Net income attributable to noncontrolling interests | (1,070 | ) | (802 | ) | (350 | ) | (567 | ) | (932 | ) | ||||||||||
| Net income (loss) attributable to Waste Connections | $ | (95,764 | ) | $ | 232,525 | $ | 195,655 | $ | 159,093 | $ | 165,239 | |||||||||
| Earnings (loss) per common share attributable to Waste Connections’ common stockholders: | ||||||||||||||||||||
| Basic | $ | (0.78 | ) | $ | 1.87 | $ | 1.58 | $ | 1.31 | $ | 1.47 | |||||||||
| Diluted | $ | (0.78 | ) | $ | 1.86 | $ | 1.58 | $ | 1.31 | $ | 1.45 | |||||||||
| Shares used in the per share calculations: | ||||||||||||||||||||
| Basic | 123,491,931 | 124,215,346 | 123,597,540 | 121,172,381 | 112,720,444 | |||||||||||||||
| Diluted | 123,491,931 | 124,787,421 | 124,165,052 | 121,824,349 | 113,583,486 | |||||||||||||||
| Cash dividends per common share | $ | 0.535 | $ | 0.475 | $ | 0.415 | $ | 0.37 | $ | 0.315 | ||||||||||
| Cash dividends paid | $ | 65,990 | $ | 58,906 | $ | 51,213 | $ | 44,465 | $ | 35,566 | ||||||||||
| (a) | For more information regarding this financial data, see the Management’s Discussion and Analysis of Financial Condition and Results of Operations section included in this report. |
| 34 |
| DECEMBER 31, | ||||||||||||||||||||
| 2015 | 2014 | 2013 | 2012 | 2011 | ||||||||||||||||
| (in thousands, except share and per share data) | ||||||||||||||||||||
| BALANCE SHEET DATA: | ||||||||||||||||||||
| Cash and equivalents | $ | 10,974 | $ | 14,353 | $ | 13,591 | $ | 23,212 | $ | 12,643 | ||||||||||
| Working capital surplus (deficit) | (15,847 | ) | 5,833 | (16,513 | ) | (55,086 | ) | (34,544 | ) | |||||||||||
| Property and equipment, net | 2,738,288 | 2,594,205 | 2,450,649 | 2,457,606 | 1,450,469 | |||||||||||||||
| Total assets | 5,121,798 | 5,245,267 | 5,057,617 | 5,067,199 | 3,325,633 | |||||||||||||||
| Long-term debt and notes payable | 2,147,127 | 1,971,152 | 2,060,955 | 2,196,140 | 1,170,386 | |||||||||||||||
| Total equity | 1,991,784 | 2,233,741 | 2,048,207 | 1,883,130 | 1,399,687 | |||||||||||||||
| 35 |
| ITEM 7. | MANAGEMENT'S DISCUSSION AND ANALYSIS OF FINANCIAL CONDITION AND RESULTS OF OPERATIONS |
As previously noted, the following discussion excludes any impact that may result from the Merger. The following discussion should be read in conjunction with the “Selected Financial Data” included in Item 6 of this Annual Report on Form 10-K, our consolidated financial statements and the related notes included elsewhere in this report.
Industry Overview
The municipal solid waste industry is a local and highly competitive business, requiring substantial labor and capital resources. The participants compete for collection accounts primarily on the basis of price and, to a lesser extent, the quality of service, and compete for landfill business on the basis of tipping fees, geographic location and quality of operations. The municipal solid waste industry has been consolidating and continues to consolidate as a result of a number of factors, including the increasing costs and complexity associated with waste management operations and regulatory compliance. Many small independent operators and municipalities lack the capital resources, management, operating skills and technical expertise necessary to operate effectively in such an environment. The consolidation trend has caused municipal solid waste companies to operate larger landfills that have complementary collection routes that can use company-owned disposal capacity. Controlling the point of transfer from haulers to landfills has become increasingly important as landfills continue to close and disposal capacity moves farther from the collection markets it serves.
Generally, the most profitable operators within the municipal solid waste industry are those companies that are vertically integrated or enter into long-term collection contracts. A vertically integrated operator will benefit from: (1) the internalization of waste, which is bringing waste to a company-owned landfill; (2) the ability to charge third-party haulers tipping fees either at landfills or at transfer stations; and (3) the efficiencies gained by being able to aggregate and process waste at a transfer station prior to landfilling.
The E&P waste services industry is regional in nature and is also highly fragmented, with acquisition opportunities available in several active natural resource basins. Competition for E&P waste comes primarily from smaller regional companies that utilize a variety of disposal methods and generally serve specific geographic markets, and other solid waste companies. In addition, customers in many markets have the option of using internal disposal methods or outsourcing to another third-party disposal company. The principal competitive factors in this business include: gaining customer approval of treatment and disposal facilities; location of facilities in relation to customer activity; reputation; reliability of services; track record of environmental compliance; ability to accept multiple waste types at a single facility; and price. The demand for our E&P waste services depends on the continued demand for, and production of, oil and natural gas. Crude oil and natural gas prices historically have been volatile and the substantial reductions in crude oil prices that began in October 2014, and continued through 2015 and into early 2016, have resulted in a decline in the level of drilling and production activity, reducing the demand for E&P waste services in the basins in which we operate. During the year ended December 31, 2015, we recorded charges totaling $517.8 million associated with the impairment of a portion of our goodwill, intangible assets and property and equipment within our E&P segment as a result of the sustained decline in oil prices in recent months, together with market expectations of a likely slow recovery in such prices, making it more likely than not that the fair value of these assets had decreased below their respective carrying values. A further reduction in crude oil and natural gas prices could lead to continued declines in the level of production activity and demand for our E&P waste services, which could result in the recognition of additional impairment charges on our goodwill, intangible assets and property and equipment associated with our E&P operations.
Executive Overview
We are an integrated municipal solid waste services company that provides solid waste collection, transfer, disposal and recycling services primarily in exclusive and secondary markets in the U.S. and a leading provider of non-hazardous exploration and production, or E&P, waste treatment, recovery and disposal services in several of the most active natural resource producing areas of the U.S. We also provide intermodal services for the rail haul movement of cargo and solid waste containers in the Pacific Northwest through a network of intermodal facilities.
We seek to avoid highly competitive, large urban markets and instead target markets where we can attain high market share either through exclusive contracts, vertical integration or asset positioning. In markets where waste collection services are provided under exclusive arrangements, or where waste disposal is municipally owned or funded or available at multiple municipal sources, we believe that controlling the waste stream by providing collection services under exclusive arrangements is often more important to our growth and profitability than owning or operating landfills. We also target niche markets, like E&P waste treatment and disposal services.
| 36 |
As of December 31, 2015, we served residential, commercial, industrial and E&P customers in 32 states: Alabama, Alaska, Arizona, Arkansas, California, Colorado, Idaho, Illinois, Iowa, Kansas, Kentucky, Louisiana, Massachusetts, Michigan, Minnesota, Mississippi, Montana, Nebraska, Nevada, New Mexico, New York, North Carolina, North Dakota, Oklahoma, Oregon, South Carolina, South Dakota, Tennessee, Texas, Utah, Washington and Wyoming. As of December 31, 2015, we owned or operated a network of 155 solid waste collection operations; 69 transfer stations; seven intermodal facilities, 37 recycling operations, 62 active MSW, E&P and/or non-MSW landfills, 24 E&P liquid waste injection wells and 20 E&P waste treatment and oil recovery facilities.
2015 Financial Performance
Operating Results
Revenues in 2015 increased 1.8% to $2.12 billion from $2.08 billion in 2014, as a result of growth in solid waste, partially offset by decreased E&P waste activity. Solid waste revenues increased 7.5%, due to internal growth and acquisitions. Solid waste internal growth decreased to 4.2% in 2015, from 4.3% in 2014. Pricing growth was 0.2 percentage points lower than in 2014, due to lower fuel, materials and environmental surcharges. Increases in landfill and hauling volumes contributed to total volume growth increasing to 2.2% in 2015 from 2.1% in 2014. A similar decrease in recycled commodity prices as in the prior year resulted in recycling contributing negative 0.6% to internal growth in 2015 and 2014. E&P waste revenues decreased to $215.4 million from $310.1 million in 2014, due to decreased activity at existing facilities partially offset by contributions from new facilities.
In 2015, adjusted earnings before interest, taxes, depreciation and amortization, or adjusted EBITDA, a non-GAAP financial measure (refer to page 62 of this report for a definition and reconciliation to Net income (loss)), decreased 0.9% to $710.6 million, from $717.1 million in 2014. As a percentage of revenue, adjusted EBITDA decreased from 34.5% in 2014, to 33.6% in 2015. This 0.9 percentage point decrease was primarily attributable to the decrease in higher margin E&P waste revenues. Adjusted net income attributable to Waste Connections, a non-GAAP financial measure (refer to page 63 of this report for a definition and reconciliation to Net income (loss) attributable to Waste Connections), in 2015 decreased 3.7% to $244.9 million from $254.2 million in 2014.
Adjusted Free Cash Flow
Net cash provided by operating activities increased 5.9% to $577.0 million in 2015, from $545.1 million in 2014, and capital expenditures decreased from $241.3 million in 2014 to $238.8 million in 2015, a decrease of $2.5 million, or 1.0%. This decrease in capital expenditures was primarily due to pulling forward into 2014 capital expenditures from 2015 to take advantage of bonus depreciation tax benefits available in 2014, and the construction of two new E&P waste disposal facilities and a new construction and demolition landfill in 2014. Adjusted free cash flow, a non-GAAP financial measure (refer to page 61 of this report for a definition and reconciliation to Net cash provided by operating activities), increased 6.7% to $343.0 million in 2015, from $321.4 million in 2014. Adjusted free cash flow as a percentage of revenues was 16.2% in 2015, compared to 15.5% in 2014. This increase as a percentage of revenues was primarily due to higher net cash provided by operating activities as noted above.
Return of Capital to Stockholders
In 2015, we returned $66.0 million to stockholders through cash dividends declared by our Board of Directors, which also increased the quarterly cash dividend by 11.5% from $0.13 to $0.145 per share of common stock in October 2015. Our Board of Directors intends to review the quarterly dividend during the fourth quarter of each year, with a long-term objective of increasing the amount of the dividend. In 2015, we also repurchased approximately 1.96 million shares of common stock at a cost of $91.2 million. We expect the amount of capital we return to stockholders through stock repurchases to vary depending on our financial condition and results of operations, capital structure, the amount of cash we deploy on acquisitions, the market price of our common stock, and overall market conditions. We cannot assure you as to the amounts or timing of future stock repurchases or dividends. We have the ability under our credit agreement and master note purchase agreement to repurchase our common stock and pay dividends provided that we maintain specified financial ratios.
Capital Position
We target a leverage ratio, as defined in our credit agreement, of approximately 2.75x – 3.0x total debt to EBITDA. We deployed $347.9 million during 2015 for acquisitions, and we increased our debt by $177.7 million. As a result, our leverage ratio increased to 2.88x at December 31, 2015, from 2.67x at December 31, 2014.
| 37 |
Critical Accounting Estimates and Assumptions
The preparation of financial statements in conformity with U.S. generally accepted accounting principles requires estimates and assumptions that affect the reported amounts of assets and liabilities, revenues and expenses and related disclosures of contingent assets and liabilities in the consolidated financial statements. As described by the SEC, critical accounting estimates and assumptions are those that may be material due to the levels of subjectivity and judgment necessary to account for highly uncertain matters or the susceptibility of such matters to change, and that have a material impact on the financial condition or operating performance of a company. Such critical accounting estimates and assumptions are applicable to our reportable segments. Based on this definition, we believe the following are our critical accounting estimates.
Insurance liabilities. We maintain high deductible or self-insured retention insurance policies for automobile, general, employer’s, environmental, cyber, employment practices and directors’ and officers’ liability as well as for employee group health insurance, property insurance and workers’ compensation. We carry umbrella policies for certain types of claims to provide excess coverage over the underlying policies and per incident deductibles or self-insured retentions. Our insurance accruals are based on claims filed and estimates of claims incurred but not reported and are developed by our management with assistance from our third-party actuary and third-party claims administrator. The insurance accruals are influenced by our past claims experience factors, which have a limited history, and by published industry development factors. If we experience insurance claims or costs above or below our historically evaluated levels, our estimates could be materially affected. The frequency and amount of claims or incidents could vary significantly over time, which could materially affect our self-insurance liabilities. Additionally, the actual costs to settle the self-insurance liabilities could materially differ from the original estimates and cause us to incur additional costs in future periods associated with prior year claims.
Income taxes. Deferred tax assets and liabilities are determined based on differences between the financial reporting and income tax bases of assets and liabilities and are measured using the enacted tax rates and laws that are expected to be in effect when the differences are expected to reverse. If our judgment and estimates concerning assumptions made in calculating our expected future income tax rates are incorrect, our deferred tax assets and liabilities would change. Based on our net deferred tax liability balance at December 31, 2015, each 0.1 percentage point change to our expected future income tax rate would change our net deferred tax liability balance and income tax expense by approximately $1.1 million.
Accounting for landfills. We recognize landfill depletion expense as airspace of a landfill is consumed. Our landfill depletion rates are based on the remaining disposal capacity at our landfills, considering both permitted and probable expansion airspace. We calculate the net present value of our final capping, closure and post-closure commitments by estimating the total obligation in current dollars, inflating the obligation based upon the expected date of the expenditure and discounting the inflated total to its present value using a credit-adjusted risk-free rate. Any changes in expectations that result in an upward revision to the estimated undiscounted cash flows are treated as a new liability and are inflated and discounted at rates reflecting current market conditions. Any changes in expectations that result in a downward revision (or no revision) to the estimated undiscounted cash flows result in a liability that is inflated and discounted at rates reflecting the market conditions at the time the cash flows were originally estimated. This policy results in our final capping, closure and post-closure liabilities being recorded in “layers.” The resulting final capping, closure and post-closure obligation is recorded on the balance sheet along with an offsetting addition to site costs, which is amortized to depletion expense as the remaining landfill airspace is consumed. Interest is accreted on the recorded liability using the corresponding discount rate. The accounting methods discussed below require us to make certain estimates and assumptions. Changes to these estimates and assumptions could have a material effect on our financial condition and results of operations. Any changes to our estimates are applied prospectively.
Landfill development costs. Landfill development costs include the costs of acquisition, construction associated with excavation, liners, site berms, groundwater monitoring wells, gas recovery systems and leachate collection systems. We estimate the total costs associated with developing each landfill site to its final capacity. Total landfill costs include the development costs associated with expansion airspace. Expansion airspace is described below. Landfill development costs depend on future events and thus actual costs could vary significantly from our estimates. Material differences between estimated and actual development costs may affect our cash flows by increasing our capital expenditures and thus affect our results of operations by increasing our landfill depletion expense.
Final capping, closure and post-closure obligations. We accrue for estimated final capping, closure and post-closure maintenance obligations at the landfills we own, and the landfills that we operate, but do not own, under life-of-site agreements. We could have additional material financial obligations relating to final capping, closure and post-closure costs at other disposal facilities that we currently own or operate or that we may own or operate in the future. Our discount rate assumption for purposes of computing 2015 and 2014 “layers” for final capping, closure and post-closure obligations was 4.75% and 5.75%, respectively, which reflects our long-term credit adjusted risk free rate as of the end of 2014 and 2013. Our inflation rate assumption was 2.5% for the years ended December 31, 2015 and 2014. Significant reductions in our estimates of the remaining lives of our landfills or significant increases in our estimates of the landfill final capping, closure and post-closure maintenance costs could have a material adverse effect on our financial condition and results of operations. Additionally, changes in regulatory or legislative requirements could increase our costs related to our landfills, resulting in a material adverse effect on our financial condition and results of operations.
| 38 |
We own two landfills for which the prior owners are obligated to reimburse us for certain costs we incur for final capping, closure and post-closure activities on the portion of the landfill utilized by the prior owners. We accrue the prior owner’s portion of the final capping, closure and post-closure obligation within the balance sheet classification of Other long-term liabilities, and a corresponding receivable from the prior owner in long-term Other assets.
Disposal capacity. Our internal and third-party engineers perform surveys at least annually to estimate the remaining disposal capacity at our landfills. Our landfill depletion rates are based on the remaining disposal capacity, considering both permitted and probable expansion airspace, at the landfills that we own and at landfills that we operate, but do not own, under life-of-site agreements. Our landfill depletion rate is based on the term of the operating agreement at our operated landfill that has capitalized expenditures. Expansion airspace consists of additional disposal capacity being pursued through means of an expansion that has not yet been permitted. Expansion airspace that meets the following criteria is included in our estimate of total landfill airspace:
| 1) | whether the land where the expansion is being sought is contiguous to the current disposal site, and we either own the expansion property or have rights to it under an option, purchase, operating or other similar agreement; |
| 2) | whether total development costs, final capping costs, and closure/post-closure costs have been determined; |
| 3) | whether internal personnel have performed a financial analysis of the proposed expansion site and have determined that it has a positive financial and operational impact; |
| 4) | whether internal personnel or external consultants are actively working to obtain the necessary approvals to obtain the landfill expansion permit; and |
| 5) | whether we consider it probable that we will achieve the expansion (for a pursued expansion to be considered probable, there must be no significant known technical, legal, community, business or political restrictions or similar issues existing that we believe are more likely than not to impair the success of the expansion). |
We may be unsuccessful in obtaining permits for expansion disposal capacity at our landfills. In such cases, we will charge the previously capitalized development costs to expense. This will adversely affect our operating results and cash flows and could result in greater landfill depletion expense being recognized on a prospective basis.
We periodically evaluate our landfill sites for potential impairment indicators. Our judgments regarding the existence of impairment indicators are based on regulatory factors, market conditions and operational performance of our landfills. Future events could cause us to conclude that impairment indicators exist and that our landfill carrying costs are impaired. Any resulting impairment loss could have a material adverse effect on our financial condition and results of operations.
Goodwill and indefinite-lived intangible assets testing. Goodwill and indefinite-lived intangible assets are tested for impairment on at least an annual basis in the fourth quarter of the year. In addition, we evaluate our reporting units for impairment if events or circumstances change between annual tests indicating a possible impairment. Examples of such events or circumstances include, but are not limited to, the following:
| · | a significant adverse change in legal factors or in the business climate; |
| · | an adverse action or assessment by a regulator; |
| · | a more likely than not expectation that a segment or a significant portion thereof will be sold; |
| · | the testing for recoverability of a significant asset group within the segment; or |
| · | current period or expected future operating cash flow losses. |
In the first step (“Step 1”) of testing for goodwill impairment, we estimate the fair value of each reporting unit, which we have determined to be our three geographic operating segments and our E&P segment, and compare the fair value with the carrying value of the net assets assigned to each reporting unit. If the fair value of a reporting unit is greater than the carrying value of the net assets, including goodwill, assigned to the reporting unit, then no impairment results. If the fair value is less than its carrying value, then we would perform a second step (“Step 2”) and determine the fair value of the goodwill. In Step 2, the fair value of goodwill is determined by deducting the fair value of a reporting unit’s identifiable assets and liabilities from the fair value of the reporting unit as a whole, as if that reporting unit had just been acquired and the purchase price were being initially allocated. If the fair value of the goodwill is less than its carrying value for a reporting unit, an impairment charge would be recorded to earnings in our Consolidated Statements of Net Income (Loss). In testing indefinite-lived intangible assets for impairment, we compare the estimated fair value of each indefinite-lived intangible asset to its carrying value. If the fair value of the indefinite-lived intangible asset is less than its carrying value, an impairment charge would be recorded to earnings in our Consolidated Statements of Net Income (Loss).
| 39 |
During the third quarter of 2015, we determined that sufficient indicators of potential impairment existed to require an interim goodwill and indefinite-lived intangible assets impairment analysis for our E&P segment as a result of the sustained decline in oil prices in the recent months, together with market expectations of a likely slow recovery in such prices. We, therefore, performed a Step 1 assessment of our E&P segment during the third quarter of 2015. The Step 1 assessment involved measuring the recoverability of goodwill by comparing the E&P segment’s carrying amount, including goodwill, to the fair value of the reporting unit. The fair value was estimated using an income approach employing a discounted cash flow (“DCF”) model. The DCF model incorporated projected cash flows over a forecast period based on the remaining estimated lives of the operating locations comprising the E&P segment. This was based on a number of key assumptions, including, but not limited to, a discount rate of 11.6%, annual revenue projections based on E&P waste resulting from projected levels of oil and natural gas exploration and production activity during the forecast period, gross margins based on estimated operating expense requirements during the forecast period and estimated capital expenditures over the forecast period, all of which were classified as Level 3 in the fair value hierarchy. As a result of the Step 1 assessment, we determined that the E&P segment did not pass the Step 1 test because the carrying value exceeded the estimated fair value of the reporting unit. We then performed the Step 2 test to determine the fair value of goodwill for our E&P segment. Based on the Step 1 and Step 2 analyses, we recorded a goodwill impairment charge to Impairments and other operating items in the Consolidated Statements of Net Income (Loss) within our E&P segment of $411.8 million in the third quarter of 2015. Additionally, we evaluated the recoverability of the E&P segment’s indefinite-lived intangible assets (other than goodwill) by comparing the estimated fair value of each indefinite-lived intangible asset to its carrying value. We estimated the fair value of the indefinite-lived intangible assets using an excess earnings approach. Based on the result of the recoverability test, we determined that the carrying value of certain indefinite-lived intangible assets within the E&P segment exceeded their fair value and were therefore not recoverable. We recorded an impairment charge to Impairments and other operating items in the Consolidated Statements of Net Income (Loss) on certain indefinite-lived intangible assets within our E&P segment of $38.4 million in the third quarter and fourth quarter of 2015. We did not record an impairment charge to our E&P segment as a result of our goodwill and indefinite-lived intangible assets impairment tests in 2014.
During our annual impairment analysis, we determined the fair value of each of our three geographic operating segments as a whole and each indefinite-lived intangible asset within those segments using discounted cash flow analyses, which require significant assumptions and estimates about the future operations of each reporting unit and the future discrete cash flows related to each indefinite-lived intangible asset. Significant judgments inherent in these analyses include the determination of appropriate discount rates, the amount and timing of expected future cash flows and growth rates. The cash flows employed in our 2015 discounted cash flow analyses of our three geographic operating segments were based on ten-year financial forecasts, which in turn were based on the 2016 annual budget developed internally by management. These forecasts reflect operating profit margins that were consistent with 2015 results and annual revenue growth rates of 3.3% in perpetuity. Our discount rate assumptions are based on an assessment of our weighted average cost of capital which approximated 5.0%. In assessing the reasonableness of our determined fair values of our reporting units, we evaluate our results against our current market capitalization. We did not record an impairment charge to our three geographic operating segments as a result of our goodwill and indefinite-lived intangible assets impairment tests in 2015 and 2014.
Business Combination Accounting. We recognize, separately from goodwill, the identifiable assets acquired and liabilities assumed at their estimated acquisition date fair values. We measure and recognize goodwill as of the acquisition date as the excess of: (a) the aggregate of the fair value of consideration transferred, the fair value of any noncontrolling interest in the acquiree (if any) and the acquisition date fair value of our previously held equity interest in the acquiree (if any), over (b) the fair value of net assets acquired and liabilities assumed. At the acquisition date, we measure the fair values of all assets acquired and liabilities assumed that arise from contractual contingencies. We measure the fair values of all noncontractual contingencies if, as of the acquisition date, it is more likely than not that the contingency will give rise to an asset or liability.
General
Our revenues consist mainly of fees we charge customers for collection, transfer, recycling and disposal of non-hazardous solid waste and treatment, recovery and disposal of non-hazardous E&P waste. Our collection business also generates revenues from the sale of recyclable commodities, which have significant variability. A large part of our collection revenues comes from providing residential, commercial and industrial services. We frequently perform these services under service agreements, municipal contracts or franchise agreements with governmental entities. Our existing franchise agreements and most of our existing municipal contracts give us the exclusive right to provide specified waste services in the specified territory during the contract term. These exclusive arrangements are awarded, at least initially, on a competitive bid basis and subsequently on a bid or negotiated basis. We also provide residential collection services on a subscription basis with individual households.
| 40 |
We typically determine the prices of our solid waste collection services by the collection frequency and level of service, route density, volume, weight and type of waste collected, type of equipment and containers furnished, the distance to the disposal or processing facility, the cost of disposal or processing, and prices charged by competitors for similar services. The terms of our contracts sometimes limit our ability to pass on price increases. Long-term solid waste collection contracts often contain a formula, generally based on a published price index, that automatically adjusts fees to cover increases in some, but not all, operating costs, or that limit increases to less than 100% of the increase in the applicable price index.
We charge transfer station and landfill customers a tipping fee on a per ton and/or per yard basis for disposing of their solid waste at our transfer stations and landfill facilities. Many of our transfer station and landfill customers have entered into one to ten year disposal contracts with us, most of which provide for annual indexed price increases.
Our revenues from E&P waste services consist mainly of fees that we charge for the treatment and disposal of liquid and solid waste derived from the drilling of wells for the production of oil and natural gas. We also generate income from the transportation of waste to the disposal facility in certain markets and the sale of reclaimed oil, roadbase and processed and treated waters.
Our revenues from recycling services consist of proceeds generated from selling recyclable materials (including compost, cardboard, office paper, plastic containers, glass bottles and ferrous and aluminum metals) collected from our residential customers and at our recycling operations to third parties for processing before resale.
Our revenues from intermodal services consist mainly of fees we charge customers for the movement of cargo and solid waste containers between our intermodal facilities. We also generate revenue from the storage, maintenance and repair of cargo and solid waste containers and the sale or lease of containers and chassis.
No single contract or customer accounted for more than 10% of our total revenues at the consolidated or reportable segment level during the periods presented. The following tables reflect a breakdown of our revenue and inter-company eliminations for the periods indicated (dollars in thousands):
| Year Ended December 31, 2015 | ||||||||||||||||
| Revenue | Intercompany Revenue | Reported Revenue | % of Reported Revenue | |||||||||||||
| Solid waste collection | $ | 1,378,679 | $ | (4,623 | ) | $ | 1,374,056 | 64.9 | % | |||||||
| Solid waste disposal and transfer | 670,369 | (255,200 | ) | 415,169 | 19.6 | |||||||||||
| Solid waste recycling | 47,292 | (924 | ) | 46,368 | 2.2 | |||||||||||
| E&P waste treatment, recovery and disposal | 228,529 | (13,156 | ) | 215,373 | 10.2 | |||||||||||
| Intermodal and other | 66,321 | - | 66,321 | 3.1 | ||||||||||||
| Total | $ | 2,391,190 | $ | (273,903 | ) | $ | 2,117,287 | 100.0 | % | |||||||
| Year Ended December 31, 2014 | ||||||||||||||||
| Revenue | Intercompany Revenue | Reported Revenue | % of Reported Revenue | |||||||||||||
| Solid waste collection | $ | 1,289,906 | $ | (3,593 | ) | $ | 1,286,313 | 61.9 | % | |||||||
| Solid waste disposal and transfer | 617,161 | (235,851 | ) | 381,310 | 18.3 | |||||||||||
| Solid waste recycling | 58,226 | (2,118 | ) | 56,108 | 2.7 | |||||||||||
| E&P waste treatment, recovery and disposal | 326,934 | (16,862 | ) | 310,072 | 14.9 | |||||||||||
| Intermodal and other | 46,291 | (928 | ) | 45,363 | 2.2 | |||||||||||
| Total | $ | 2,338,518 | $ | (259,352 | ) | $ | 2,079,166 | 100.0 | % | |||||||
| 41 |
| Year Ended December 31, 2013 | ||||||||||||||||
| Revenue | Intercompany Revenue | Reported Revenue | % of Reported Revenue | |||||||||||||
| Solid waste collection | $ | 1,219,091 | $ | (4,304 | ) | $ | 1,214,787 | 63.0 | % | |||||||
| Solid waste disposal and transfer | 579,379 | (226,897 | ) | 352,482 | 18.3 | |||||||||||
| Solid waste recycling | 71,831 | (6,101 | ) | 65,730 | 3.4 | |||||||||||
| E&P waste treatment, recovery and disposal | 262,286 | (11,462 | ) | 250,824 | 13.0 | |||||||||||
| Intermodal and other | 46,038 | (1,066 | ) | 44,972 | 2.3 | |||||||||||
| Total | $ | 2,178,625 | $ | (249,830 | ) | $ | 1,928,795 | 100.0 | % | |||||||
Cost of operations includes labor and benefits, tipping fees paid to third-party disposal facilities, vehicle and equipment maintenance, workers’ compensation, vehicle and equipment insurance, insurance and employee group health claims expense, third-party transportation expense, fuel, the cost of materials we purchase for recycling, district and state taxes and host community fees and royalties. Our significant costs of operations in 2015 were labor, third-party disposal and transportation, vehicle and equipment maintenance, taxes and fees, insurance and fuel. We use a number of programs to reduce overall cost of operations, including increasing the use of automated routes to reduce labor and workers’ compensation exposure, utilizing comprehensive maintenance and health and safety programs, and increasing the use of transfer stations to further enhance internalization rates. We carry high-deductible or self-insured retention insurance for automobile liability, general liability, employer’s liability, environmental liability, cyber liability, employment practices liability and directors’ and officers’ liability as well as for employee group health claims, property and workers’ compensation. If we experience insurance claims or costs above or below our historically evaluated levels, our estimates could be materially affected.
Selling, general and administrative, or SG&A, expense includes management, sales force, clerical and administrative employee compensation and benefits, legal, accounting and other professional services, acquisition expenses, bad debt expense and rent expense for our corporate headquarters.
Depreciation expense includes depreciation of equipment and fixed assets over their estimated useful lives using the straight-line method. Depletion expense includes depletion of landfill site costs and total future development costs as remaining airspace of the landfill is consumed. Remaining airspace at our landfills includes both permitted and probable expansion airspace. Amortization expense includes the amortization of finite-lived intangible assets, consisting primarily of long-term franchise agreements and contracts, customer lists and non-competition agreements, over their estimated useful lives using the straight-line method. Goodwill and indefinite-lived intangible assets, consisting primarily of certain perpetual rights to provide solid waste collection and transportation services in specified territories, are not amortized.
We capitalize some third-party expenditures related to development projects, such as legal, engineering and interest expenses. We expense all third-party and indirect acquisition costs, including third-party legal and engineering expenses, executive and corporate overhead, public relations and other corporate services, as we incur them. We charge against net income any unamortized capitalized expenditures and advances (net of any portion that we believe we may recover, through sale or otherwise) that may become impaired, such as those that relate to any operation that is permanently shut down and any landfill development project that we believe will not be completed. We routinely evaluate all capitalized costs, and expense those related to projects that we believe are not likely to succeed. For example, if we are unsuccessful in our attempts to obtain or defend permits that we are seeking or have been awarded to operate or expand a landfill, we will no longer generate anticipated income from the landfill and we will be required to expense in a future period up to the carrying value of the landfill or expansion project, less the recoverable value of the property and other amounts recovered.
| 42 |
Results of Operations
The following table sets forth items in our Consolidated Statements of Net Income (Loss) in thousands and as a percentage of revenues for the periods indicated:
| Years Ended December 31, | ||||||||||||||||||||||||
| 2015 | % of Revenues | 2014 | % of Revenues | 2013 | % of Revenues | |||||||||||||||||||
| Revenues | $ | 2,117,287 | 100.0 | % | $ | 2,079,166 | 100.0 | % | $ | 1,928,795 | 100.0 | % | ||||||||||||
| Cost of operations | 1,177,409 | 55.6 | 1,138,388 | 54.8 | 1,064,819 | 55.2 | ||||||||||||||||||
| Selling, general and administrative | 237,484 | 11.2 | 229,474 | 11.0 | 212,637 | 11.0 | ||||||||||||||||||
| Depreciation | 240,357 | 11.3 | 230,944 | 11.1 | 218,454 | 11.4 | ||||||||||||||||||
| Amortization of intangibles | 29,077 | 1.4 | 27,000 | 1.3 | 25,410 | 1.3 | ||||||||||||||||||
| Loss on prior office leases | - | - | - | - | 9,902 | 0.5 | ||||||||||||||||||
| Impairments and other operating items | 494,492 | 23.4 | 4,091 | 0.2 | 4,129 | 0.2 | ||||||||||||||||||
| Operating income (loss) | (61,532 | ) | (2.9 | ) | 449,269 | 21.6 | 393,444 | 20.4 | ||||||||||||||||
| Interest expense | (64,236 | ) | (3.1 | ) | (64,674 | ) | (3.1 | ) | (73,579 | ) | (3.8 | ) | ||||||||||||
| Other income (expense), net | (518 | ) | (0.0 | ) | 1,067 | 0.0 | 1,056 | 0.0 | ||||||||||||||||
| Income tax (provision) benefit | 31,592 | 1.5 | (152,335 | ) | (7.3 | ) | (124,916 | ) | (6.5 | ) | ||||||||||||||
| Net income (loss) | (94,694 | ) | (4.5 | ) | 233,327 | 11.2 | 196,005 | 10.1 | ||||||||||||||||
| Net income attributable to noncontrolling interests | (1,070 | ) | (0.0 | ) | (802 | ) | (0.0 | ) | (350 | ) | (0.0 | ) | ||||||||||||
| Net income (loss) attributable to Waste Connections | $ | (95,764 | ) | (4.5 | )% | $ | 232,525 | 11.2 | % | $ | 195,655 | 10.1 | % | |||||||||||
Years Ended December 31, 2015 and 2014
Revenues. Total revenues increased $38.1 million, or 1.8%, to $2.117 billion for the year ended December 31, 2015, from $2.079 billion for the year ended December 31, 2014.
During the year ended December 31, 2015, incremental revenue from acquisitions closed during, or subsequent to, the year ended December 31, 2014, increased revenues by approximately $58.6 million. Operations divested during, or subsequent to, the year ended December 31, 2014, decreased revenues by approximately $1.0 million.
During the year ended December 31, 2015, the net increase in prices charged to our customers was $46.4 million, consisting of $50.0 million of core price increases, partially offset by a decrease of $3.6 million from fuel, materials and environmental surcharges.
During the year ended December 31, 2015, volume increases in our existing business increased solid waste revenues by $39.5 million from increases in roll off collection, transfer station volumes and landfill volumes resulting from increased construction and general economic activity in our markets. E&P disposal facilities which opened subsequent to December 31, 2014, increased E&P revenues by $3.9 million. E&P revenues at facilities owned and fully-operated in each of the comparable periods decreased by $120.0 million due to the substantial reductions in crude oil prices that began in October 2014, and continued through 2015 and into early 2016, which resulted in a decline in the level of drilling and production activity thereby reducing the demand for E&P waste services in the basins in which we operate.
During the year ended December 31, 2015, the closure of a recycling operation in our Western segment in April 2014 decreased revenues by $2.0 million. Revenues from sales of recyclable commodities at all other facilities owned during the year ended December 31, 2015 and 2014 decreased $7.9 million due primarily to decreased recyclable commodity prices.
During the year ended December 31, 2015, intermodal revenues increased $21.8 million due to cargo volume from a new large intermodal customer and higher cargo volume with existing customers.
Other revenues decreased by $1.2 million during the year ended December 31, 2015 due primarily to contracted landfill construction services we performed in the prior year period at a landfill we operate that did not recur in the current year, partially offset by an increase in equipment rental revenue.
| 43 |
Cost of Operations. Total cost of operations increased $39.0 million, or 3.4%, to $1.178 billion for the year ended December 31, 2015, from $1.138 billion for the year ended December 31, 2014. The increase was primarily the result of $34.7 million of additional operating costs from solid waste and E&P acquisitions closed during, or subsequent to, the year ended December 31, 2014 and an increase in operating costs at our existing solid waste operations of $26.9 million, less a decrease in operating costs at our existing and internally developed E&P operations of $22.6 million.
The increase in operating costs at our existing solid waste and intermodal operations of $26.9 million for the year ended December 31, 2015 was comprised of an increase in labor and employee benefits expenses of $15.6 million due primarily to employee pay rate and headcount increases to support volume increases, an increase in rail transportation expenses at our intermodal operations of $9.6 million due to increased rail cargo volume, an increase in truck, container, equipment and facility maintenance and repair expenses of $6.8 million due to variability in the timing and severity of major repairs, an increase in third-party disposal expense of $6.5 million due to disposal rate increases and higher disposal costs associated with increased collection and transfer station volumes, an increase in taxes on revenues of $6.0 million due to increased revenues in our solid waste markets, an increase in third-party trucking and transportation expenses of $3.1 million due to increased transfer station and landfill volumes that require us to transport the waste to our disposal sites and $3.4 million of other net expense increases, partially offset by a decrease in fuel expense of $20.2 million due to lower market prices for diesel fuel not purchased under diesel fuel hedge agreements, a decrease of $2.0 million associated with the cost of contracted landfill construction services we performed during the prior year period and a decrease in auto, workers’ compensation and property claims expense under our high deductible insurance program of $1.9 million due primarily to adjustments to projected losses on prior period claims.
The decrease in operating costs at our existing and internally developed E&P operations of $22.6 million for the year ended December 31, 2015 was comprised of decreased fuel expenses of $4.0 million due primarily to decreases in the price of diesel fuel and the following changes attributable to a reduction in our operations resulting from the decline in the level of drilling and production activity: decreased third-party trucking and transportation expenses of $6.7 million, decreased site remediation work of $6.2 million, decreased employee wage and benefits expenses of $3.3 million, decreased equipment repair expenses of $2.9 million, decreased equipment rental expenses of $1.9 million, decreased royalties on revenues of $1.1 million, decreased landfill operating supplies of $0.5 million and $2.5 million of other expense decreases, partially offset by an increase of $5.0 million in expenses due to site clean-up and remediation work during the first quarter of 2015 associated with flooding and other surface damage at two of our E&P disposal sites in New Mexico resulting from heavy precipitation affecting the sites and an increase of $1.5 million due to start-up related expenses at two new E&P disposal facilities during the first quarter of 2015.
Cost of operations as a percentage of revenues increased 0.8 percentage points to 55.6% for the year ended December 31, 2015, from 54.8% for the year ended December 31, 2014. The increase as a percentage of revenues was primarily the result of a 2.4 percentage point increase at our existing and internally developed E&P operations, partially offset by a 1.6 percentage point decrease at our existing solid waste operations. The increase at our existing and internally developed E&P operations was due primarily to fixed operating expenses increasing as an overall percentage of revenues due to the aforementioned decline in E&P revenues. The decrease at our existing solid waste operations was comprised of a 1.4 percentage point decrease in fuel expense and a 0.2 percentage point net decrease in all other expenses.
SG&A. SG&A expenses increased $8.0 million, or 3.5%, to $237.5 million for the year ended December 31, 2015, from $229.5 million for the year ended December 31, 2014. The increase was primarily the result of $3.5 million of additional SG&A expenses from acquisitions closed during, or subsequent to, the year ended December 31, 2014, an increase in payroll and benefits expenses of $3.9 million primarily related to headcount increases and annual compensation increases, an increase in professional fees of $2.0 million due primarily to increased expenses for external accounting services, legal expenses and sales consulting services, an increase in employee meeting, training and travel expenses of $1.0 million, an increase in direct acquisition costs of $2.1 million attributable to acquisitions closed during the current year period, an increase of $0.8 million in equity-based compensation expenses associated with our annual recurring grant of restricted stock units to our personnel and a $0.6 million increase in credit card fees resulting from an increase in the total number of customer remitting payments for our services using credit cards, partially offset by a decrease in expenses for uncollectible accounts receivable of $3.0 million primarily related to improved collection results in the current year at our E&P segment and higher prior year expenses at our Western segment resulting from a receivables balance from a large customer that was deemed uncollectible, a decrease in accrued cash incentive compensation expense of $2.7 million as we are not projected to achieve the same level of certain financial targets that were met in the prior year period and $0.2 million of other net expense decreases.
SG&A expenses as a percentage of revenues increased 0.2% percentage points to 11.2% for the year ended December 31, 2015, from 11.0% for the year ended December 31, 2014, as a result of increases associated with higher payroll and benefit expenses, professional fees and direct acquisition costs being partially offset by decreased cash incentive compensation expense and decreased expenses for uncollectible accounts.
| 44 |
Depreciation. Depreciation expense increased $9.5 million, or 4.1%, to $240.4 million for the year ended December 31, 2015, from $230.9 million for the year ended December 31, 2014. The increase was primarily the result of an increase in depletion expense of $6.5 million at our existing solid waste landfills due primarily to an increase in volumes, additional depreciation and depletion expense of $8.6 million from acquisitions closed during, or subsequent to, the year ended December 31, 2014 and an increase in depreciation expense of $5.0 million associated with additions to our fleet and equipment purchased to support our existing operations, partially offset by a decrease in depletion expense of $10.6 million at our existing E&P landfills due to volume decreases resulting from a decline in the level of oil drilling and production activity due to reductions in crude oil prices.
Depreciation expense as a percentage of revenues increased 0.2 percentage points to 11.3% for the year ended December 31, 2015, from 11.1% for the year ended December 31, 2014. The increase as a percentage of revenues was due primarily to the impact of a decline in E&P revenues from operations owned in the comparable periods and depreciation expense associated with additions to our fleet and equipment purchased to support our existing operations, partially offset by the decrease in depletion expense at our existing E&P landfills.
Amortization of Intangibles. Amortization of intangibles expense increased $2.1 million, or 7.7%, to $29.1 million for the year ended December 31, 2015, from $27.0 million for the year ended December 31, 2014. Amortization expense as a percentage of revenues increased 0.1 percentage points to 1.4% for the year ended December 31, 2015, from 1.3% for the year ended December 31, 2014.
The dollar amount and percentage of revenues increases were attributable to additional amortization expense during the year ended December 31, 2015 from acquisitions closed during, or subsequent to, the year ended December 31, 2014.
Impairments and Other Operating Items. Impairments and other operating items increased $490.4 million, to $494.5 million for the year ended December 31, 2015, from $4.1 million for the year ended December 31, 2014.
The decline in oil prices that began in late 2014, and continued through 2015 and into early 2016, has resulted in decreased levels of oil and natural gas exploration and production activity and a corresponding decrease in demand for our E&P waste services. This decrease, together with market expectations of a likely slow recovery in oil prices, has reduced the expected future period cash flows of our E&P segment, causing the fair value of the E&P segment to decrease below its carrying value. During the third quarter of 2015, we recorded impairment charges of $411.8 million associated with goodwill and $38.4 million associated with indefinite-lived intangible assets in our E&P segment. Following the impairment charge, at December 31, 2015, our E&P segment has remaining balances of $77.3 million in goodwill and $21.5 million in indefinite-lived intangible assets. The fair value of the E&P segment was estimated using an income approach employing a discounted cash flow, or DCF, model. The DCF model incorporated projected cash flows over a forecast period based on the estimated remaining lives of the operating locations comprising the E&P segment. One of the key assumptions in the DCF model was the estimated EBITDA contribution from each operating location. If the estimated EBITDA in the DCF model for each operating location was reduced an additional 10%, the goodwill and indefinite-lived intangible asset impairment charge would have increased by $5.4 million and $0.8 million, respectively. We also recorded impairment charges of $67.6 million related to property and equipment at certain E&P operating locations during the third quarter and fourth quarter of 2015 based on an assessment that the carrying value of certain asset groups exceeded the undiscounted cash flows and were therefore not recoverable. The fair value of the unrecoverable asset groups was calculated using the aforementioned DCF model and the impairment charge was based on the amount the asset groups’ carrying values exceeded their fair value. Each asset group that was assessed as being impaired had an insignificant fair value due primarily to the estimated discounted cash outflows exceeding the estimated discounted cash inflows over the remaining estimated lives of the asset groups. Following the impairment charge, our E&P segment has a remaining balance in property and equipment of $929.8 million at December 31, 2015. If the estimated EBITDA in the DCF model for each asset group was reduced an additional 10%, the property and equipment impairment charge would have been unchanged.
The aforementioned impairment charges were partially offset by $20.6 million of adjustments recorded during the year ended December 31, 2015 to reduce the fair value of amounts payable under liability-classified contingent consideration arrangements associated with the acquisition of an E&P business in 2014 as it was determined that the decline in E&P waste services at acquired facilities subject to contingent consideration payments based on the earnings of the acquired facilities would reduce the amount ultimately payable by us upon the completion of the contingent consideration assessment period.
Other expense charges associated with changes to the fair value of certain long-term liabilities associated with prior year acquisitions and losses on the disposal of operating assets increased $1.6 million during the year ended December 31, 2015.
During the year ended December 31, 2014, we recorded an $8.4 million impairment charge at an E&P disposal facility as a result of projected operating losses resulting from the migration of the majority of the facility’s customers to a new E&P facility that we own and operate.
| 45 |
Operating Income (Loss). Operating income (loss) decreased $510.8 million to a loss of $61.5 million for the year ended December 31, 2015, from income of $449.3 million for the year ended December 31, 2014. The decrease was attributable to the $490.4 million increase in impairments and other operating items, $39.0 million increase in costs of operations, $9.5 million increase in depreciation expense, $8.0 million increase in SG&A expense and $2.1 million increase in amortization of intangibles expense, partially offset by the $38.1 million increase in revenues.
Operating income (loss) as a percentage of revenues decreased 24.5 percentage points to negative 2.9% for the year ended December 31, 2015, from positive 21.6% for the year ended December 31, 2014. The decrease as a percentage of revenues was comprised of a 23.2 percentage point increase in impairments and other operating items, a 0.8 percentage point increase in cost of operations, a 0.2 percentage point increase in SG&A expense, a 0.2 percentage point increase in depreciation expense and a 0.1 percentage point increase in amortization expense.
Interest Expense. Interest expense decreased $0.5 million, or 0.7%, to $64.2 million for the year ended December 31, 2015, from $64.7 million for the year ended December 31, 2014. The decrease was primarily attributable to a decrease of $2.7 million for the redemption of our 2015 Notes in October 2015, a decrease of $3.8 million from the net change in the combined average outstanding borrowings under our revolving credit and term loan agreement and a decrease of $1.4 million due to refinancing and replacing our prior term loan agreement and prior credit agreement with our new revolving credit and term loan agreement resulting in a reduction in the applicable margin above the base rate or LIBOR rate for outstanding borrowings, partially offset by an increase of $6.0 million from the August 2015 issuance of our 2022 Notes and 2025 Notes and an increase of $1.4 million resulting from interest accretion expense recorded on long-term liabilities recorded at fair value associated with acquisitions closed in the fourth quarter of 2014.
Other Income (Expense), Net. Other income (expense), net, decreased $1.6 million, to an expense total of $0.5 million for the year ended December 31, 2015, from an income total of $1.1 million for the year ended December 31, 2014. The decrease was primarily attributable to an expense charge of $0.6 million for the write off of a portion of unamortized debt issuance costs resulting from refinancing our prior term loan agreement and prior credit agreement, a $0.8 million decrease in investment income and $0.2 million of other net changes.
Income Tax Provision (Benefit). Income taxes decreased $183.9 million, to a benefit total of $31.6 million for the year ended December 31, 2015, from an expense total of $152.3 million for the year ended December 31, 2014.
Our effective tax benefit rate for the year ended December 31, 2015 was 25.0%. The impairment of a portion of the goodwill, indefinite-lived intangible assets and property and equipment within our E&P segment impacted the geographical apportionment of our state income taxes primarily resulting in an adjustment to our deferred tax liabilities that increased our income tax benefit and increased our effective tax benefit rate during the year ended December 31, 2015 by $3.9 million and 3.1 percentage points, respectively. Additionally, a portion of the aforementioned goodwill impairment within our E&P segment that was not deductible for tax purposes, resulted in a decrease to our income tax benefit and our effective tax benefit rate of $15.5 million and 12.3 percentage points, respectively.
Our effective tax expense rate for the year ended December 31, 2014 was 39.5%. During the year ended December 31, 2014, an adjustment in deferred tax liabilities resulting from the enactment of New York State’s 2014-2015 Budget Act increased our income tax expense and our effective tax expense rate by $1.2 million and 0.3 percentage points, respectively.
Years Ended December 31, 2014 and 2013
Revenues. Total revenues increased $150.4 million, or 7.8%, to $2.079 billion for the year ended December 31, 2014, from $1.929 billion for the year ended December 31, 2013.
During the year ended December 31, 2014, incremental revenue from acquisitions closed during, or subsequent to, the year ended December 31, 2013, increased solid waste revenues and E&P revenues by approximately $28.0 million and $3.8 million, respectively. Operations divested during, or subsequent to, the year ended December 31, 2013, decreased solid waste revenues by approximately $10.0 million.
During the year ended December 31, 2014, the net increase in prices charged to our solid waste customers was $47.3 million, consisting of $46.6 million of core price increases and $0.7 million of fuel, materials and environmental surcharges.
| 46 |
During the year ended December 31, 2014, volume increases in our existing business increased solid waste revenues and E&P revenues by $35.1 million and $55.8 million, respectively. The increase in solid waste volumes was primarily attributable to increases in roll off collection, landfill special waste projects, landfill MSW volumes and transfer station volumes resulting from increased construction and general economic activity in our markets. The increase in E&P volumes was primarily attributable to $23.9 million of revenue from new facilities opened subsequent to December 31, 2013 and $31.9 million of volume increases at facilities owned and operated in each of the comparable periods.
During the year ended December 31, 2014, the closure of two recycling operations in our Western segment decreased revenues by $10.2 million. Revenues from sales of recyclable commodities at all other facilities owned during the year ended December 31, 2014 and 2013 increased $0.4 million due primarily to an increase in volumes processed and sold.
Other revenues increased by $0.2 million during the year ended December 31, 2014, consisting of $2.0 million of contracted landfill construction services we performed at a landfill we operate and $0.5 million of other revenue increases, partially offset by a $2.3 million decrease from lower cargo volumes at our intermodal operations due primarily to the loss of a large intermodal customer.
Cost of Operations. Total cost of operations increased $73.6 million, or 6.9%, to $1.138 billion for the year ended December 31, 2014, from $1.065 billion for the year ended December 31, 2013. The increase was primarily the result of $17.0 million of additional operating costs from acquisitions closed during, or subsequent to, the year ended December 31, 2013, partially offset by a decrease in operating costs of $7.8 million resulting from operations divested during, or subsequent to, the year ended December 31, 2013, and the following changes at operations owned in comparable periods in 2013 and 2014: an increase in third-party trucking and transportation expenses of $14.6 million due to increased transfer station, landfill and E&P volumes that require us to transport the waste to our disposal sites, an increase in labor expenses of $14.3 million due primarily to employee pay rate and headcount increases, an increase in taxes and royalties on revenues of $9.4 million due primarily to increased revenues, an increase in truck, container, equipment and facility maintenance and repair expenses of $8.6 million due to an increase in the cost of parts and services and variability in the timing and severity of major repairs, an increase in third-party disposal expense of $8.1 million due to disposal rate increases and higher disposal associated with increased collection volumes, an increase in third-party subcontractor expenses of $4.2 million at our E&P facilities to perform processing and remediation services resulting from higher E&P disposal volumes, an increase in auto and workers’ compensation claims expense under our high deductible insurance program of $3.3 million due primarily to adjustments to projected losses on prior period claims, an increase of $2.7 million related to an increase in the volume of waste solidification materials needed to treat higher E&P waste volumes at our facilities and regulatory changes requiring use of higher cost waste solidification materials at one of our landfills, an increase of $2.0 million associated with the cost of contracted landfill construction services we performed at a landfill we operate, an increase in employee benefits expenses of $1.4 million due to increased employee participation in our benefits program and increased medical claim costs, and $0.9 million of other net increases, partially offset by a decrease in equipment rental expense of $2.3 million resulting from capital purchases replacing certain equipment that was previously rented at our E&P facilities, a decrease in the cost of recyclable commodities of $1.8 million due to declines in commodity prices and decreased commodity volumes resulting from the closure of two of our recyclable processing centers subsequent to December 31, 2013 and a decrease in fuel expense of $1.0 million resulting from the net of lower market prices for diesel fuel not purchased under diesel fuel hedge agreements offsetting an increase in total diesel fuel gallons consumed.
Cost of operations as a percentage of revenues decreased 0.4 percentage points to 54.8% for the year ended December 31, 2014, from 55.2% for the year ended December 31, 2013. The decrease as a percentage of revenues was comprised of a 0.4 percentage point decrease in labor expenses and a 0.4 percentage point decrease in fuel expense due to lower prices for diesel fuel, a 0.2 percentage point decrease from lower equipment rental expenses and a 0.1 percentage point decrease in disposal expense resulting from the increased internalization of certain collection and transfer station volumes as well as increased landfill and E&P revenues not resulting in increased disposal expenses, partially offset by a 0.5 percentage point increase from higher third-party trucking expenses and a 0.2 percentage point increase in third party subcontractor expenses at our E&P facilities.
SG&A. SG&A expenses increased $16.9 million, or 7.9%, to $229.5 million for the year ended December 31, 2014, from $212.6 million for the year ended December 31, 2013. The increase was primarily the result of $2.8 million of additional SG&A expenses from acquisitions closed during, or subsequent to, the year ended December 31, 2013, partially offset by a decrease in SG&A expenses of $0.9 million resulting from operations divested during, or subsequent to, the year ended December 31, 2013, and the following changes at operations owned in comparable periods in 2013 and 2014: an increase in accrued cash incentive compensation expense of $6.2 million resulting from the achievement of certain financial targets in the current period, an increase in payroll and payroll-related expenses of $3.1 million primarily related to annual compensation increases, an increase in equity-based compensation expense of $3.0 million associated with a decrease in our estimated pre-vesting forfeiture rate and an increase in the total fair value of our annual recurring grant of restricted stock units to our personnel, an increase in professional fees of $2.0 million due primarily to increased expenses for external legal and information technology services, a $1.2 million increase in expenses for uncollectible accounts receivable primarily in our E&P business due to the impact of the decline in crude oil prices at the end of 2014 impacting the solvency of certain E&P customers and $0.4 million of other net increases, partially offset by a decrease in deferred compensation expense of $0.9 million as a result of decreases in the market value of investments to which employee deferred compensation liability balances are tracked.
| 47 |
SG&A expenses as a percentage of revenues was unchanged at 11.0% for the years ended December 31, 2014 and 2013, resulting from a 0.2 percentage point increase from increased cash incentive compensation expense being offset by a 0.2 percentage point decrease from leveraging existing administrative functions to support increases in revenues.
Depreciation. Depreciation expense increased $12.4 million, or 5.7%, to $230.9 million for the year ended December 31, 2014, from $218.5 million for the year ended December 31, 2013. The increase was primarily the result of $2.0 million of additional depreciation expense and $0.1 million of additional depletion expense from acquisitions closed during, or subsequent to, the year ended December 31, 2013, partially offset by a decrease in depreciation expense of $0.9 million resulting from operations divested during, or subsequent to, the year ended December 31, 2013, and the following changes at operations owned in comparable periods in 2013 and 2014: an increase in depreciation expense of $7.2 million associated with additions to our fleet and equipment purchased to support our existing operations and an increase in depletion expense of $5.4 million due primarily to an increase in volumes at our existing landfill operations, partially offset by an adjustment to depletion expense of $1.4 million recorded during the year ended December 31, 2013 resulting from an adjustment to final capping obligations at one of our landfill operations.
Depreciation expense as a percentage of revenues decreased 0.3 percentage points to 11.1% for the year ended December 31, 2014, from 11.4% for the year ended December 31, 2013. The decrease as a percentage of revenues was due primarily to the aforementioned prior year adjustment to depletion expense resulting from an adjustment to final capping obligations at one of our landfill operations and leveraging existing equipment to support increases in revenues.
Amortization of Intangibles. Amortization of intangibles expense increased $1.6 million, or 6.3%, to $27.0 million for the year ended December 31, 2014, from $25.4 million for the year ended December 31, 2013. The increase was attributable to $2.0 million of additional amortization expense during the year ended December 31, 2014 from acquisitions closed during, or subsequent to, the year ended December 31, 2013, partially offset by a decrease in amortization expense of $0.4 million resulting from certain intangible assets becoming fully amortized subsequent to the year ended December 31, 2013.
Amortization expense as a percentage of revenues was unchanged at 1.3% for the years ended December 31, 2014 and 2013.
Loss on Prior Office Leases. During the year ended December 31, 2013, we recorded a $9.2 million expense charge associated with the cessation of use of our former corporate headquarters in Folsom, California, and subsequently remitted a payment to terminate our remaining lease obligation. Additionally, during the year ended December 31, 2013, we recorded a $0.7 million expense charge associated with the cessation of use of our E&P segment’s former regional offices in Houston, Texas.
Impairments and Other Operating Items. Impairments and other operating items was a loss of $4.1 million for the years ended December 31, 2014 and 2013.
During the year ended December 31, 2013, we recorded net losses totaling $2.5 million on the disposal of three operating locations, $1.3 million of expenses resulting from increases to the fair value of amounts payable under liability-classified contingent consideration arrangements associated with acquisitions closed prior to 2013 and a $0.8 million write-down in the carrying value of assets at an operating location that was closed in 2013, partially offset by $0.5 million of net gains on the disposal of certain operating assets.
During the year ended December 31, 2014, we recorded an $8.4 million impairment charge at an E&P disposal facility as a result of projected operating losses resulting from the migration of the majority of the facility’s customers to a new E&P facility that we own and operate, which was partially offset by $4.1 million of decreases to the fair value of amounts payable under liability-classified contingent consideration arrangements associated with acquisitions closed prior to 2014 and $0.2 million of net gains on the disposal of certain operating assets.
Operating Income. Operating income increased $55.9 million, or 14.2%, to $449.3 million for the year ended December 31, 2014, from $393.4 million for the year ended December 31, 2013. The increase was attributable to the $150.4 million increase in revenues and a $9.9 million decrease in loss on prior office leases, partially offset by the $73.6 million increase in cost of operations, $16.9 million increase in SG&A expense, $12.4 million increase in depreciation expense and $1.6 million increase in amortization of intangibles expense.
Operating income as a percentage of revenues increased 1.2 percentage points to 21.6% for the year ended December 31, 2014, from 20.4% for the year ended December 31, 2013. The increase as a percentage of revenues was comprised of a 0.4 percentage point decrease in cost of operations, a 0.5 percentage point decrease in loss on prior office leases and a 0.3 percentage point decrease in depreciation expense.
| 48 |
Interest Expense. Interest expense decreased $8.9 million, or 12.1%, to $64.7 million for the year ended December 31, 2014, from $73.6 million for the year ended December 31, 2013, due to the following changes: a decrease of $3.7 million due to a reduction in the applicable margin above the base rate or LIBOR rate for outstanding borrowings under our prior credit agreement and term loan agreement as a result of a reduction in our leverage ratio of total debt to EBITDA and amendments to the prior credit agreement and term loan agreement, a decrease of $2.8 million due to a reduction in the average outstanding balances on our prior credit agreement and term loan agreement, a decrease of $2.0 million due to the expiration in February 2014 of a $175 million interest rate swap with a fixed rate of 2.85% and the commencement of a new $175 million interest rate swap with a fixed rate of 1.60%, a decrease of $0.6 million resulting from a decrease in interest accretion expense recorded on liability-classified contingent consideration arrangements that were settled, or became fully accrued, subsequent to December 31, 2013 and a $0.6 million decrease from other net changes, partially offset by a $0.8 million increase resulting from the commencement in July 2014 of a new $100 million interest rate swap with a fixed rate of 1.80%.
Income Tax Provision. Income taxes increased $27.4 million, or 21.9%, to $152.3 million for the year ended December 31, 2014, from $124.9 million for the year ended December 31, 2013, as a result of increased pre-tax income and an adjustment in deferred tax liabilities resulting from the enactment of New York State’s 2014-2015 Budget Act that increased our income tax expense and our effective tax expense rate during the year ended December 31, 2014 by $1.2 million and 0.3 percentage points, respectively.
The reconciliation of the income tax provision to the 2012 federal and state tax returns, which were filed during 2013, decreased our tax expense by $0.8 million and reduced our effective tax expense rates by 0.3 percentage points for the year ended December 31, 2013.
Our effective tax expense rates for the years ended December 31, 2014 and 2013, were 39.5% and 38.9%, respectively.
Segment Reporting
Our Chief Operating Decision Maker evaluates operating segment profitability and determines resource allocations based on several factors, of which the primary financial measure is segment EBITDA. We define segment EBITDA as earnings before interest, taxes, depreciation, amortization, loss on prior office leases, impairments and other operating items and other income (expense). Segment EBITDA is not a measure of operating income, operating performance or liquidity under GAAP and may not be comparable to similarly titled measures reported by other companies. Our management uses segment EBITDA in the evaluation of segment operating performance as it is a profit measure that is generally within the control of the operating segments.
We manage our operations through three geographic operating segments (Western, Central and Eastern), and our E&P segment, which includes the majority of our E&P waste treatment and disposal operations. Our three geographic operating segments and our E&P segment comprise our reportable segments. Each operating segment is responsible for managing several vertically integrated operations, which are comprised of districts. Our Western segment is comprised of operating locations in Alaska, California, Idaho, Montana, Nevada, Oregon, Washington and western Wyoming; our Central segment is comprised of operating locations in Arizona, Colorado, Kansas, Louisiana, Minnesota, Nebraska, New Mexico, Oklahoma, South Dakota, Texas, Utah and eastern Wyoming; and our Eastern segment is comprised of operating locations in Alabama, Illinois, Iowa, Kentucky, Massachusetts, Michigan, Mississippi, New York, North Carolina, South Carolina and Tennessee. The E&P segment is comprised of our E&P operations in Arkansas, Louisiana, New Mexico, North Dakota, Oklahoma, Texas, Wyoming and along the Gulf of Mexico.
Revenues, net of intercompany eliminations, for our reportable segments are shown in the following table in thousands and as a percentage of total revenues for the periods indicated:
| Years Ended December 31, | ||||||||||||||||||||||||
| 2015 | % of Revenues | 2014 | % of Revenues | 2013 | % of Revenues | |||||||||||||||||||
| Western | $ | 880,393 | 41.6 | % | $ | 823,922 | 39.6 | % | $ | 805,790 | 41.8 | % | ||||||||||||
| Central | 589,667 | 27.8 | 561,480 | 27.0 | 510,928 | 26.5 | ||||||||||||||||||
| Eastern | 433,457 | 20.5 | 393,821 | 19.0 | 371,772 | 19.3 | ||||||||||||||||||
| E&P | 213,770 | 10.1 | 299,943 | 14.4 | 240,305 | 12.4 | ||||||||||||||||||
| $ | 2,117,287 | 100.0 | % | $ | 2,079,166 | 100.0 | % | $ | 1,928,795 | 100.0 | % | |||||||||||||
| 49 |
Segment EBITDA for our reportable segments is shown in the following table in thousands and as a percentage of segment revenues for the periods indicated:
| Years Ended December 31, | ||||||||||||||||||||||||
| 2015 | % of Revenues | 2014 | % of Revenues | 2013 | % of Revenues | |||||||||||||||||||
| Western | $ | 290,937 | 33.0 | % | $ | 258,126 | 31.3 | % | $ | 249,548 | 31.0 | % | ||||||||||||
| Central | 207,205 | 35.1 | 197,121 | 35.1 | 182,790 | 35.8 | ||||||||||||||||||
| Eastern | 132,774 | 30.6 | 116,230 | 29.5 | 108,173 | 29.1 | ||||||||||||||||||
| E&P | 69,545 | 32.5 | 147,261 | 49.1 | 111,056 | 46.2 | ||||||||||||||||||
| Corporate(a) | 1,933 | - | (7,434 | ) | - | (228 | ) | - | ||||||||||||||||
| $ | 702,394 | 33.2 | $ | 711,304 | 34.2 | $ | 651,339 | 33.8 | ||||||||||||||||
(a) Corporate functions include accounting, legal, tax, treasury, information technology, risk management, human resources, training and other administrative functions. Amounts reflected are net of allocations to the four operating segments.
A reconciliation of segment EBITDA to Income before income tax provision is included in Note 14 of our consolidated financial statements included in Item 8 of this report.
Significant changes in revenue and segment EBITDA for our reportable segments for the year ended December 31, 2015, compared to the year ended December 31, 2014, and for the year ended December 31, 2014, compared to the year ended December 31, 2013, are discussed below.
Segment Revenue
Revenue in our Western segment increased $56.5 million, or 6.9%, to $880.4 million for the year ended December 31, 2015, from $823.9 million for the year ended December 31, 2014. The components of the increase consisted of solid waste volume increases of $30.2 million associated with our residential, commercial and roll off collection operations, transfer stations and landfill special waste revenues being partially offset by lower landfill municipal solid waste revenues, intermodal revenue increases of $21.8 million due to a new large intermodal customer and higher cargo volume with existing customers, net price increases of $12.9 million, revenue growth from acquisitions closed during, or subsequent to, the year ended December 31, 2014, of $1.9 million and other revenue increases of $0.3 million, partially offset by recyclable commodity sales decreases of $2.0 million and $5.3 million resulting from the closure of a recycling operation in April 2014 and declines in the price of recyclable commodities, respectively, and decreases of $3.3 million from reduced E&P disposal volumes at our solid waste landfills.
Revenue in our Western segment increased $18.1 million, or 2.3%, to $823.9 million for the year ended December 31, 2014, from $805.8 million for the year ended December 31, 2013. The components of the increase consisted of volume increases of $21.4 million primarily in our collection operations, transfer stations and solid waste landfills, net price increases of $12.0 million, revenue growth from acquisitions closed during, or subsequent to, the year ended December 31, 2013, of $0.3 million and other revenue increases of $0.4 million, partially offset by decreases of $5.3 million from divested operations, recyclable commodity sales decreases of $8.4 million due primarily to the closure of two of our recycling operations subsequent to December 31, 2013 and intermodal revenue decreases of $2.3 million due to decreases in cargo volume resulting primarily from the loss of a large intermodal customer.
Revenue in our Central segment increased $28.2 million, or 5.0%, to $589.7 million for the year ended December 31, 2015, from $561.5 million for the year ended December 31, 2014. The components of the increase consisted of net price increases of $23.1 million, solid waste volume increases of $1.2 million associated with increases in roll off collection volumes, transfer station volumes, landfill MSW volumes and landfill special waste volumes exceeding declines in residential collection volumes, net revenue growth from acquisitions and divestitures closed during, or subsequent to, the year ended December 31, 2014, of $3.7 million and other revenue increases of $0.2 million.
Revenue in our Central segment increased $50.6 million, or 9.9%, to $561.5 million for the year ended December 31, 2014, from $510.9 million for the year ended December 31, 2013. The components of the increase consisted of revenue growth from acquisitions closed during, or subsequent to, the year ended December 31, 2013, of $24.2 million, net price increases of $22.0 million, volume increases of $5.6 million primarily in our roll off collection business, transfer station and solid waste landfills and $0.1 million of other revenue increases, partially offset by recyclable commodity sales decreases of $0.7 million and decreases of $0.6 million from divested operations.
| 50 |
Revenue in our Eastern segment increased $39.7 million, or 10.1%, to $433.5 million for the year ended December 31, 2015, from $393.8 million for the year ended December 31, 2014. The components of the increase consisted of revenue growth from acquisitions closed during, or subsequent to, the year ended December 31, 2014, of $25.3 million, net price increases of $10.3 million and solid waste volume increases of $8.4 million primarily from volume increases in our roll off collection business, transfer station volumes and landfill special waste volumes exceeding decreases in residential collection volumes, partially offset by recyclable commodity sales decreases of $2.4 million due primarily to declines in the price of recyclable commodities and other revenue decreases of $1.9 million due primarily to landfill construction services, contracted in the prior year, that we performed at a landfill we operate.
Revenue in our Eastern segment increased $22.0 million, or 5.9%, to $393.8 million for the year ended December 31, 2014, from $371.8 million for the year ended December 31, 2013. The components of the increase consisted of net price increases of $13.3 million, volume increases of $8.1 million primarily in our roll off collection business, transfer station and solid waste landfills, other revenue increases of $2.0 million primarily associated with contracted landfill construction services we performed at a landfill we operate and revenue growth from acquisitions closed during, or subsequent to, the year ended December 31, 2013, of $3.5 million, partially offset by decreases of $4.1 million from divested operations and recyclable commodity sales decreases of $0.8 million due to lower prices for recyclable commodities.
Revenue in our E&P segment decreased $86.1 million, or 28.7%, to $213.8 million for the year ended December 31, 2015, from $299.9 million for the year ended December 31, 2014. The components of the decrease consisted of $116.5 million of E&P revenue decreases at facilities owned and fully-operated in each of the comparable periods due to declines in both E&P waste volumes and prices charged for our services and $0.2 million of other revenue decreases, partially offset by revenue growth from acquisitions closed during, or subsequent to, the year ended December 31, 2014, of $26.7 million and $3.9 million of revenue from two new E&P disposal facilities opened subsequent to December 31, 2014. During the year ended December 31, 2015, our E&P segment was adversely affected by the substantial reductions in crude oil prices that began in October 2014, and continued through 2015 and into early 2016, resulting in a decline in the level of drilling and production activity, reducing the demand for E&P waste services in the basins in which we operate. The carryover impact from the aforementioned reduction in the price of crude oil, which has dropped again at the beginning of 2016, is expected to contribute to revenue at our E&P segment in 2016 declining between 20% and 30% from 2015.
Revenue in our E&P segment increased $59.6 million, or 24.8%, to $299.9 million for the year ended December 31, 2014, from $240.3 million for the year ended December 31, 2013. The components of the increase consisted of $23.9 million of revenue from new facilities opened subsequent to December 31, 2013, $31.9 million of volume increases at facilities owned and operated in each of the comparable periods and $3.8 million of revenue from acquisitions closed during the year ended December 31, 2014.
Segment EBITDA
Segment EBITDA in our Western segment increased $32.8 million, or 12.7%, to $290.9 million for the year ended December 31, 2015, from $258.1 million for the year ended December 31, 2014. The increase was due primarily to an increase in revenues of $56.5 million, a decrease in fuel expense of $9.5 million due to lower market prices for diesel fuel not purchased under diesel fuel hedge agreements, a decrease in current year expenses for uncollectible accounts receivable of $1.1 million due primarily to a prior year expense charge associated with receivables from a large customer that were deemed uncollectible and a decrease in auto, workers’ compensation and property claims expenses under our high deductible insurance program of $1.0 million due primarily to adjustments to projected losses on prior period claims, partially offset by an increase in rail transportation expenses at our intermodal operations of $9.6 million due to increased rail cargo volume, an increase in direct and administrative labor expenses of $9.3 million due primarily to employee pay rate increases and increased headcount to support revenue volume increases, an increase in third-party disposal expense of $4.3 million due to increased collection volumes and disposal rate increases, an increase in taxes on revenues of $3.6 million due to increased revenues, an increase in truck, container, equipment and facility maintenance and repair expenses of $2.5 million due to variability in the timing and severity of major repairs, an increase in third-party trucking and transportation expenses of $1.6 million due to increased disposal volumes that require transportation to our landfills, an increase in corporate overhead expense allocations of $1.4 million due primarily to revenue growth, a net $0.8 million increase in cost of operations and SG&A expenses attributable to acquired operations, a $0.5 million increase in legal fees associated with our dispute with the County of Madera, California, a $0.4 million increase in credit card fees resulting from an increase in the total number of customers remitting payments for our services using credit cards and $1.3 million of other net expense increases.
| 51 |
Segment EBITDA in our Western segment increased $8.6 million, or 3.4%, to $258.1 million for the year ended December 31, 2014, from $249.5 million for the year ended December 31, 2013. The increase was primarily due to an increase in revenues of $18.1 million, a net $4.9 million decrease in cost of operations and SG&A expenses attributable to divested operations, a decrease in the cost of recyclable commodities of $1.7 million due to a net decline in commodity volumes resulting from the closure of two of our recyclable processing centers subsequent to December 31, 2013, a decrease in fuel expense of $1.4 million resulting from the net of lower market prices for diesel fuel not purchased under diesel fuel hedge agreements offsetting an increase in total diesel fuel gallons consumed and $0.3 million of other net decreases, partially offset by an increase in taxes on revenues of $4.7 million due to increased revenues, an increase in third-party disposal expense of $4.4 million due to disposal rate increases and higher disposal associated with increased collection volumes, an increase in direct and administrative labor expenses of $2.4 million due primarily to employee pay rate increases, an increase in auto, workers’ compensation and property claims expense under our high deductible insurance program of $1.7 million due primarily to adjustments to projected losses on prior period claims, an increase in employee benefits expenses of $1.1 million due to increased employee participation in our benefits program and increased medical claim costs, an increase in truck, container, equipment and facility maintenance and repair expenses of $0.9 million due to variability in the timing and severity of major repairs, increases in expenses for uncollectible accounts receivable of $0.8 million associated with receivables from an individual customer that were deemed uncollectible, an increase in third party trucking and transportation expenses of $0.7 million due to increased volumes disposed of at our transfer stations that require further transportation to our landfills, an increase in corporate overhead expense allocations of $0.7 million due primarily to revenue growth and an increase in professional fee expenses primarily associated with business development opportunities of $0.4 million.
Segment EBITDA in our Central segment increased $10.1 million, or 5.1%, to $207.2 million for the year ended December 31, 2015, from $197.1 million for the year ended December 31, 2014. The increase was due primarily to an increase in revenues of $28.2 million and a decrease in fuel expense of $4.8 million due to lower market prices for diesel fuel not purchased under diesel fuel hedge agreements, partially offset by an increase in direct and administrative labor expenses of $6.7 million due primarily to employee pay rate increases, an increase in corporate overhead expense allocations of $4.8 million due primarily to revenue growth and an increase to the overhead allocation rate, an increase in third-party disposal expense of $3.7 million due to disposal rate increases, changes in internalization of collected waste volumes in certain markets and increased transfer station volumes, an increase in professional fees of $1.6 million due primarily to increased expenses for legal and sales consulting services, a net $1.6 million increase in cost of operations and SG&A expenses attributable to acquired operations, an increase in truck, container, equipment and facility maintenance and repair expenses of $1.6 million due to variability in the timing and severity of major repairs, an increase in taxes on revenues of $1.3 million due primarily to increased landfill revenues and $1.6 million of other net expense increases.
Segment EBITDA in our Central segment increased $14.3 million, or 7.8%, to $197.1 million for the year ended December 31, 2014, from $182.8 million for the year ended December 31, 2013. The increase was primarily due to an increase in revenues of $50.6 million, partially offset by a net $15.4 million increase in cost of operations and SG&A expenses attributable to acquired operations, an increase in labor expenses of $4.8 million due primarily to employee pay rate increases, an increase in third-party trucking and transportation expenses of $4.3 million due to increased volumes disposed of at our transfer stations that require further transportation to our landfills, an increase in third-party disposal expense of $3.5 million due to disposal rate increases and higher disposal associated with increased collection volumes, an increase in truck, container, equipment and facility maintenance and repair expenses of $1.8 million due to variability in the timing and severity of major repairs, an increase in corporate overhead expense allocations of $1.8 million due primarily to revenue growth, an increase in landfill solidification materials of $1.2 million due to regulatory changes requiring use of higher cost materials at one of our landfills, an increase in auto, workers’ compensation and property claims expense under our high deductible insurance program of $1.0 million due primarily to adjustments to projected losses on prior period claims, an increase in taxes on revenues of $0.9 million due to increased revenues, an increase in employee benefits expenses of $0.8 million due to increased employee participation in our benefits program and increased medical claim costs and $0.8 million of other net expense increases.
Segment EBITDA in our Eastern segment increased $16.6 million, or 14.2%, to $132.8 million for the year ended December 31, 2015, from $116.2 million for the year ended December 31, 2014. The increase was due primarily to an increase in revenues of $39.7 million, a decrease in fuel expense of $5.9 million due to lower market prices for diesel fuel not purchased under diesel fuel hedge agreements, a decrease of $2.0 million associated with the cost of contracted landfill construction services we performed during the prior year period at a landfill we operate and a decrease in disposal expenses of $1.5 million due primarily to increased internalization of collected waste volumes in our Albany, New York market, partially offset by a net $18.0 million increase in cost of operations and SG&A expenses attributable to acquired operations, an increase in corporate overhead expense allocations of $4.4 million due primarily to revenue growth, an increase in direct and administrative labor expenses of $4.2 million due primarily to employee pay rate increases and increased headcount to support internal growth, an increase in truck, container, equipment and facility maintenance and repair expenses of $2.5 million due to variability in the timing and severity of major repairs, an increase in third-party trucking and transportation expenses of $1.4 million due to increased volumes disposed of at our transfer stations that require further transportation to our landfills, an increase in taxes on revenues of $1.1 million at a new landfill site that commenced operations in 2015 and $0.9 million of other net expense increases.
| 52 |
Segment EBITDA in our Eastern segment increased $8.0 million, or 7.4%, to $116.2 million for the year ended December 31, 2014, from $108.2 million for the year ended December 31, 2013. The increase was primarily due to an increase in revenues of $22.0 million, a net $3.4 million decrease in cost of operations and SG&A expenses attributable to divested operations and a decrease in expenses for uncollectible accounts receivable of $1.2 million due to a charge recorded during the year ended December 31, 2013 associated with receivables from one large customer that were deemed uncollectible, partially offset by an increase in labor expenses of $3.8 million due primarily to employee pay rate increases, an increase in truck, container, equipment and facility maintenance and repair expenses of $2.9 million due to variability in the timing and severity of major repairs, an increase in taxes on revenues of $2.1 million due to both an increase in revenues and a prior year adjustment that decreased taxes on revenues expense, a net increase in cost of operations and SG&A expenses of $2.0 million attributable to acquisitions closed during the year ended December 31, 2014, an increase of $2.0 million associated with the cost of contracted landfill construction services we performed at a landfill we operate, an increase in leachate disposal expenses of $1.9 million at certain landfills we own and operate, an increase in auto and workers’ compensation expense under our high deductible insurance program of $0.8 million due to adjustments to projected losses on prior period claims, an increase in employee benefits expenses of $0.8 million due to increased employee participation in our benefits program and increased medical claim costs, an increase in corporate overhead expense allocations of $0.5 million due primarily to revenue growth, an increase in third-party trucking and transportation expenses of $0.4 million due to increased volumes disposed of at our transfer stations that require further transportation to our landfills, an increase in third-party disposal expense of $0.3 million due to disposal rate increases and higher disposal associated with increased roll off collection volumes and $1.1 million of other net expense increases.
Segment EBITDA in our E&P segment decreased $77.8 million, or 52.8%, to $69.5 million for the year ended December 31, 2015, from $147.3 million for the year ended December 31, 2014. The decrease was due primarily to an $86.1 million decrease in revenues, a net $17.8 million increase in cost of operations and SG&A expenses attributable to acquired operations, an increase of $5.0 million in expenses due to site clean-up and remediation work during the first quarter of 2015 associated with flooding and other surface damage at two of our E&P disposal sites in New Mexico resulting from heavy precipitation affecting the sites and an increase of $1.5 million due to start-up related expenses at two new E&P disposal facilities during the first quarter of 2015, partially offset by decreased fuel expenses of $4.0 million due primarily to decreases in the price of diesel fuel, a decrease in corporate overhead expense allocations of $1.9 million due to lower revenues, a decrease in expenses for uncollectible accounts receivable of $1.5 million due to improved collection results in the current year and the following changes attributable to a reduction in our operations resulting from the decline in the level of drilling and production activity: decreased third-party trucking and transportation expenses of $6.7 million, decreased site remediation work of $6.2 million, decreased employee wage and benefits expenses of $3.5 million, decreased equipment repair expenses of $2.9 million, decreased equipment rental expenses of $1.9 million, decreased royalties on revenues of $1.1 million, decreased landfill operating supplies of $0.5 million and $2.4 million of other expense decreases. We estimate that the expected decrease in revenue at our E&P segment in 2016 will result in EBITDA at our E&P segment in 2016 declining between 10% and 15% from 2015.
Segment EBITDA in our E&P segment increased $36.2 million, or 32.6%, to $147.3 million for the year ended December 31, 2014, from $111.1 million for the year ended December 31, 2013. The increase was primarily due to an increase in revenues of $59.6 million, a decrease in equipment rental expense of $1.7 million resulting from capital purchases replacing certain equipment that was previously rented and $0.7 million of other net expense decreases, partially offset by an increase in third-party trucking and transportation expenses of $9.2 million due to increased volumes that require us to transport the waste to our disposal sites, an increase in labor expenses of $4.8 million due primarily to employee pay rate increases and increased headcount to support new operating facilities, an increase of $4.1 million for third-party subcontractor processing and remediation services resulting from higher E&P volumes, an increase in truck, container, equipment and facility maintenance and repair expenses of $3.2 million due to variability in the timing and severity of major repairs, a net increase in cost of operations and SG&A expenses of $1.9 million attributable to acquisitions closed during the year ended December 31, 2014, an increase in landfill solidification materials of $1.4 million due to increased E&P volumes and an increase in expenses for uncollectible accounts receivable of $1.2 million due to the impact of the decline in crude oil prices at the end of 2014 impacting the solvency of certain E&P customers.
Segment EBITDA at Corporate increased $9.3 million, to income of $1.9 million for the year ended December 31, 2015, from a loss of $7.4 million for the year ended December 31, 2014. The increase was due to an increase in revenue-based corporate overhead expense allocations to our segments of $8.9 million due primarily to our revenue growth in our solid waste segments and an increase in the allocation rate to our Central and Eastern segments, a decrease in accrued cash incentive compensation expense of $2.9 million as we did not achieve the same level of certain financial targets that were met in the prior year period, a decrease in deferred compensation expense of $0.5 million resulting from deferred compensation liabilities to employees decreasing as a result of decreases in the market value of investments to which employee deferred compensation balances are tracked and $0.5 million of other net expense decreases, partially offset by an increase in direct acquisition expenses of $2.1 million attributable to acquisitions closed during the current year period, an increase of $0.8 million in equity-based compensation expenses associated with our annual recurring grant of restricted stock units to our personnel and an increase in payroll expenses of $0.6 million due primarily to pay rate increases.
| 53 |
Segment EBITDA at Corporate decreased $7.2 million, to a loss of $7.4 million for the year ended December 31, 2014, from a loss of $0.2 million for the year ended December 31, 2013. The increased loss was due to an increase in accrued cash incentive compensation expense of $5.7 million resulting from the achievement of certain financial targets in the current period, an increase in equity-based compensation expense of $3.1 million associated with a decrease in our estimated pre-vesting forfeiture rate and an increase in the total fair value of our annual recurring grant of restricted stock units to our personnel, an increase in professional fees of $2.2 million due primarily to increased expenses for external legal and information technology services and an increase in payroll expenses of $1.5 million due to headcount and pay rate increases, partially offset by an increase in revenue-based corporate overhead expense allocations to our segments of $3.2 million due primarily to our volume growth, a decrease in employee relocation expenses of $1.5 million primarily associated with our relocation of our corporate headquarters from Folsom, California to The Woodlands, Texas, which was completed in 2013 and a decrease in real estate lease expense of $0.6 million due primarily to the elimination of duplicate lease obligations for our former headquarters in Folsom, California and our E&P segment’s former regional offices in Houston, Texas.
Liquidity and Capital Resources
The following table sets forth certain cash flow information for the years ended December 31, 2015, 2014 and 2013 (in thousands):
| 2015 | 2014 | 2013 | ||||||||||
| Net cash provided by operating activities | $ | 576,999 | $ | 545,077 | $ | 484,061 | ||||||
| Net cash used in investing activities | (470,534 | ) | (363,408 | ) | (251,015 | ) | ||||||
| Net cash used in financing activities | (109,844 | ) | (180,907 | ) | (242,667 | ) | ||||||
| Net increase (decrease) in cash and equivalents | (3,379 | ) | 762 | (9,621 | ) | |||||||
| Cash and equivalents at beginning of year | 14,353 | 13,591 | 23,212 | |||||||||
| Cash and equivalents at end of year | $ | 10,974 | $ | 14,353 | $ | 13,591 | ||||||
Operating Activities Cash Flows
For the year ended December 31, 2015, net cash provided by operating activities was $577.0 million. For the year ended December 31, 2014, net cash provided by operating activities was $545.1 million. The $31.9 million increase was due primarily to the following:
| 1) | A decrease in net income of $328.0 million, adjusted for an increase in cash flows from operating assets and liabilities, net of effects from acquisitions, of $10.2 million. Cash provided by operating assets and liabilities, net of effects from acquisitions, was $10.6 million and $0.4 million for the year ended December 31, 2015 and 2014, respectively. The significant components of the $10.6 million in net cash inflows from changes in operating assets and liabilities, net of effects from acquisitions, for the year ended December 31, 2015, include the following: |
| a) | an increase in cash resulting from a $17.3 million decrease in accounts receivable due, in part, to improved collection results; |
| b) | an increase in cash resulting from an increase in accrued liabilities of $8.2 million due primarily to an increase in accrued interest due to the timing of semi-annual interest payments under our various long-term notes and an increase in accrued payroll-related expenses due to our pay cycle timing resulting in an additional day of accrual at December 31, 2015, partially offset by a decrease in accrued cash incentive compensation expense as we did not achieve the same level of certain financial targets that were met in the prior year period; |
| c) | an increase in cash resulting from a $4.4 million increase in deferred revenue due primarily to increased collection revenues and the timing of billing for services; less |
| d) | a decrease in cash resulting from a $16.7 million increase in accounts payable due primarily to an increase in the volume of vendor payments remitted using electronic payment processes that decrease the period of time from receipt until payment for vendor invoices; less |
| e) | a decrease in cash resulting from a $2.8 million increase in prepaid expenses and other current assets due primarily to an increase in prepaid income taxes; |
| 2) | An increase in the loss on disposal of assets and impairments of $510.4 million due primarily to the current year impairment of a portion of our goodwill, indefinite-lived intangible assets and property and equipment within our E&P segment; |
| 3) | An increase in depreciation expense of $9.4 million due primarily to increased depreciation expense resulting from increased capital expenditures; |
| 4) | An increase of $5.4 million attributable to a decrease in the excess tax benefits associated with equity-based compensation, due to a decrease in stock option exercises resulting in decreased taxable income recognized by employees that is tax deductible to us; and |
| 5) | An increase in interest accretion of $1.7 million from long-term liabilities recorded at fair value associated with acquisitions closed subsequent to December 31, 2014; less |
| 6) | A decrease in our provision for deferred taxes of $163.5 million due primarily to the aforementioned impairment charge in our E&P segment resulting in the reduction of corresponding deferred tax liabilities; less |
| 54 |
| 7) | A decrease of $18.7 million attributable to post-closing adjustments resulting in a net decrease in the fair value of amounts payable under liability-classified contingent consideration arrangements primarily associated with the 2014 acquisition of an E&P disposal company. |
For the year ended December 31, 2014, net cash provided by operating activities was $545.1 million. For the year ended December 31, 2013, net cash provided by operating activities was $484.1 million. The $61.0 million increase was due primarily to the following:
| 1) | An increase in net income of $37.3 million, adjusted for an increase in cash flows from operating assets and liabilities, net of effects from acquisitions, of $13.7 million. Cash provided by operating assets and liabilities, net of effects from acquisitions, was $0.4 million for the year ended December 31, 2014. Cash used for operating assets and liabilities, net of effects from acquisitions, was $13.3 million for the year ended December 31, 2013. The significant components of the $0.4 million in net cash inflows from changes in operating assets and liabilities, net of effects from acquisitions, for the year ended December 31, 2014, include the following: |
| a) | an increase in cash resulting from a $10.2 million increase in accounts payable due primarily to growth in our operations and the timing of vendor payments; |
| b) | an increase in cash resulting from a $8.6 million increase in deferred revenue due primarily to increased revenues and the timing of billing for services; |
| c) | an increase in cash resulting from an increase in accrued liabilities of $5.0 million due primarily to an increase in accrued cash incentive compensation and increased liabilities for auto and workers’ compensation claims; |
| d) | an increase in cash resulting from an increase in other long-term liabilities of $2.7 million due primarily to increased deferred compensation plan liabilities resulting from employee contributions and plan earnings; less |
| e) | a decrease in cash resulting from a $22.2 million increase in accounts receivable due to an increase in revenues remaining uncollected at the end of the comparable periods; less |
| f) | a decrease in cash resulting from a $3.9 million increase in prepaid expenses and other current assets due primarily to an increase in prepaid income taxes; |
| 2) | An increase in depreciation expense of $12.5 million due primarily to increased depletion expense resulting from higher landfill volumes and increased depreciation expense resulting from increased capital expenditures; |
| 3) | A decrease in payment of contingent consideration recorded in earnings of $4.0 million due primarily to the final contingent consideration payout in 2013 resulting from the completion of an earnings target for the 2012 acquisition of SKB exceeding the fair value of the contingent consideration liability recorded at the acquisition close date; |
| 4) | An increase in equity-based compensation expense of $3.0 million attributable to a decrease in our estimated pre-vesting forfeiture rate and an increase in the total fair value of our annual recurring grant of restricted stock units to our personnel; |
| 5) | An increase in the loss on disposal of assets and impairments of $5.4 million due primarily to an impairment charge recorded in 2014 at one of our E&P facilities being partially offset by a loss on the disposal of a solid waste collection operation in 2013; less |
| 6) | A decrease in our provision for deferred taxes of $7.6 million due primarily to tax deductible timing differences associated with prepaid expenses and equity-based compensation; less |
| 7) | A decrease of $4.7 million attributable to post-closing adjustments resulting in a net decrease in the fair value of amounts payable under liability-classified contingent consideration arrangements associated with acquisitions closed prior to 2014; less |
| 8) | A decrease of $3.8 million attributable to an increase in the excess tax benefit associated with equity-based compensation, due to an increase in the vesting of equity-based compensation resulting in increased taxable income recognized by employees that is tax deductible to us. |
As of December 31, 2015, we had a working capital deficit of $15.8 million, including cash and equivalents of $11.0 million. Our working capital deficit increased $21.6 million from a working capital surplus of $5.8 million at December 31, 2014, including cash and equivalents of $14.4 million. To date, we have experienced no loss or lack of access to our cash or cash equivalents; however, we can provide no assurances that access to our cash and cash equivalents will not be impacted by adverse conditions in the financial markets. Our strategy in managing our working capital is generally to apply the cash generated from our operations that remains after satisfying our working capital and capital expenditure requirements, along with stock repurchase and dividend programs, to reduce the unhedged portion of our indebtedness under our credit agreement and to minimize our cash balances.
| 55 |
Investing Activities Cash Flows
Net cash used in investing activities increased $107.1 million to $470.5 million for the year ended December 31, 2015, from $363.4 million for the year ended December 31, 2014. The significant components of the increase include the following:
| 1) | An increase in payments for acquisitions of $104.3 million due primarily to the acquisition of ten solid waste collection businesses, two integrated solid waste collection and disposal businesses, an E&P waste stream treatment and recycling business and a permitted, development stage E&P landfill site during the year ended December 31, 2015; less |
| 2) | A decrease in capital expenditures for property and equipment of $2.4 million due primarily to decreases in expenditures for trucks purchased for purposes of converting fleets at certain hauling operations to compressed natural gas and decreases in expenditures for equipment in our E&P segment, partially offset by increased expenditures resulting from acquisitions closed subsequent to December 31, 2014 and expenditures in 2015 for two new E&P liquid waste injection wells. |
Net cash used in investing activities increased $112.4 million to $363.4 million for the year ended December 31, 2014, from $251.0 million for the year ended December 31, 2013. The significant components of the increase include the following:
| 1) | An increase in payments for acquisitions of $62.0 million primarily due to the acquisition of six solid waste businesses, an E&P disposal business, two permitted development stage E&P landfill sites and a permitted development stage construction and demolition landfill site during the year ended December 31, 2014; |
| 2) | A cash receipt of $18.0 million during the year ended December 31, 2013 resulting from the settlement of the final closing date net working capital with the former owners of R360; and |
| 3) | An increase in capital expenditures for property and equipment of $31.4 million due primarily to expenditures for acquisitions closed subsequent to December 31, 2013, new facilities in our E&P segment, expenditures for trucks in our Houston location that operate on compressed natural gas, and increases in landfill site cost construction, vehicles and containers, partially offset by decreases in expenditures for equipment for our E&P segment and leasehold improvements associated with our new corporate headquarters in The Woodlands, Texas. |
Financing Activities Cash Flows
Net cash used in financing activities decreased $71.1 million to $109.8 million for the year ended December 31, 2015, from $180.9 million for the year ended December 31, 2014. The significant components of the decrease include the following:
| 1) | A decrease in net repayments of long-term borrowings of $153.7 million due primarily to increased proceeds from borrowings to fund increases in payments for acquisitions and payments to repurchase our common stock during the year ended December 31, 2015; |
| 2) | A decrease in payment of contingent consideration recorded at acquisition date of $22.7 million due primarily to the payout in 2013 of the fair value of a contingent liability recorded at the close date of the 2012 acquisition of R360 associated with the achievement of a permitted expansion at one of the acquired landfills; less |
| 3) | An increase in payments to repurchase our common stock of $83.8 million due to an increase in share repurchase activity during the year ended December 31, 2015; less |
| 4) | An increase in cash dividends paid of $7.1 million due primarily to an increase in our quarterly dividend rate to an annual total of $0.535 per share for the year ended December 31, 2015, from an annual total of $0.475 per share for the year ended December 31, 2014; less |
| 5) | An increase in payments for debt issuance costs of $6.7 million incurred in connection with our new revolving credit and term loan agreement that we entered into in January 2015 and our new 2022 Notes and 2025 Notes that we issued in August 2015; less |
| 6) | A decrease of $5.4 million attributable to a decrease in the excess tax benefits associated with equity-based compensation, due to a decrease in stock option exercises resulting in decreased taxable income recognized by employees that is tax deductible to us. |
Net cash used in financing activities decreased $61.8 million to $180.9 million for the year ended December 31, 2014, from $242.7 million for the year ended December 31, 2013. The significant components of the decrease include the following:
| 1) | A decrease in net repayments of long-term borrowings of $72.6 million due primarily to decreased repayments of our prior credit agreement as a result of the aforementioned increase in payments for acquisitions during the year ended December 31, 2014 and the cash receipt during the year ended December 31, 2013 resulting from the settlement of the final closing date net working capital with the former owners of R360; less |
| 56 |
| 2) | An increase of $3.8 million attributable to an increase in the excess tax benefit associated with equity-based compensation, due to an increase in the vesting of equity-based compensation resulting in increased taxable income recognized by employees that is tax deductible to us; less |
| 3) | An increase in cash dividends paid of $7.7 million due to an increase in our quarterly dividend rate to an annual total of $0.475 per share for the year ended December 31, 2014, from an annual total of $0.415 per share for the year ended December 31, 2013, and an increase in our total common shares outstanding; and |
| 4) | An increase in payments to repurchase our common stock of $7.3 million due to no shares being repurchased during the year ended December 31, 2013. |
Our business is capital intensive. Our capital requirements include acquisitions and capital expenditures for landfill cell construction, landfill development, landfill closure activities and intermodal facility construction in the future.
Our Board of Directors has authorized a common stock repurchase program for the repurchase of up to $1.2 billion of our common stock through December 31, 2017. Under the program, stock repurchases may be made in the open market or in privately negotiated transactions from time to time at management’s discretion. The timing and amounts of any repurchases will depend on many factors, including our capital structure, the market price of the common stock and overall market conditions. As of December 31, 2015 and 2014, we had repurchased in aggregate 42.0 million and 40.0 million shares, respectively, of our common stock at an aggregate cost of $882.5 million and $791.4 million, respectively. As of December 31, 2015, the remaining maximum dollar value of shares available for purchase under the program was approximately $317.5 million.
Our Board of Directors authorized the initiation of a quarterly cash dividend in October 2010 and has increased it on an annual basis. Cash dividends of $66.0 million and $58.9 million were paid during the years ended December 31, 2015 and 2014, respectively. In October 2015, our Board of Directors authorized an increase to our regular quarterly cash dividend of $0.015, from $0.13 to $0.145 per share. We cannot assure you as to the amounts or timing of future dividends.
We made $238.8 million in capital expenditures during the year ended December 31, 2015. We expect to make capital expenditures of approximately $230 million in 2016 in connection with our existing business. We intend to fund our planned 2016 capital expenditures principally through cash on hand, internally generated funds and borrowings under our credit agreement. In addition, we may make substantial additional capital expenditures in acquiring MSW and E&P waste businesses. If we acquire additional landfill disposal facilities, we may also have to make significant expenditures to bring them into compliance with applicable regulatory requirements, obtain permits or expand our available disposal capacity. We cannot currently determine the amount of these expenditures because they will depend on the number, nature, condition and permitted status of any acquired landfill disposal facilities. We believe that our cash and equivalents, credit agreement and the funds we expect to generate from operations will provide adequate cash to fund our working capital and other cash needs for the foreseeable future. However, disruptions in the capital and credit markets could adversely affect our ability to draw on our credit agreement or raise other capital. Our access to funds under the credit agreement is dependent on the ability of the banks that are parties to the agreement to meet their funding commitments. Those banks may not be able to meet their funding commitments if they experience shortages of capital and liquidity or if they experience excessive volumes of borrowing requests within a short period of time.
We are a well-known seasoned issuer with an effective shelf registration statement on Form S-3 filed in February 2015, which registers an unspecified amount of debt and equity securities, including preferred securities, warrants, stockholder rights and units. In the future, we may issue debt or equity securities under our shelf registration statement or in private placements from time to time on an opportunistic basis, based on market conditions and available pricing. We expect to use the proceeds from any such offerings for general corporate purposes, including repaying, redeeming or repurchasing debt, acquiring additional assets or businesses, capital expenditures and increasing our working capital.
We have a revolving credit and term loan agreement, or the credit agreement, with Bank of America, N.A., as Administrative Agent, and the other lenders from time to time party thereto, which consists of a $1.2 billion revolving credit facility and an $800 million term loan. Under the credit agreement, we may request increases in the aggregate commitments under the revolving credit facility and one or more additional term loans, provided that the aggregate principal amount of commitments and term loans never exceeds $2.3 billion. Under the credit agreement, swing line loans may be issued at our request in an aggregate amount not to exceed a $35 million sublimit and letters of credit may be issued at our request in an aggregate amount not to exceed a $250 million sublimit; however, the issuance of swing line loans and letters of credit both reduce the amount of total borrowings available. As of December 31, 2015, $800.0 million under the term loan and $390.0 million under the revolving credit facility were outstanding under our credit agreement, exclusive of outstanding standby letters of credit of $78.4 million. As of December 31, 2014, $660.0 million under the term loan and $680.0 million under the revolving credit facility were outstanding under our credit agreement, exclusive of outstanding standby letters of credit of $73.0 million
| 57 |
The credit agreement requires us to pay a commitment fee ranging from 0.090% per annum to 0.200% per annum of the unused portion of the facility. The borrowings under the credit agreement bear interest, at our option, at either the base rate plus the applicable base rate margin on base rate loans and swing line loans, or the LIBOR rate plus the applicable LIBOR margin on LIBOR loans. The base rate for any day is a fluctuating rate per annum equal to the highest of: (1) the federal funds rate plus one half of one percent (0.500%); (2) the LIBOR rate plus one percent (1.000%), and (3) the rate of interest in effect for such day as publicly announced from time to time by Bank of America as its “prime rate.” The LIBOR rate is determined by the administrative agent pursuant to a formula in the credit agreement. The applicable margins under the credit agreement vary depending on our leverage ratio, as defined in the credit agreement, and range from 1.000% per annum to 1.500% per annum for LIBOR loans and 0.000% per annum to 0.500% per annum for base rate and swing line loans. The borrowings under the credit agreement are not collateralized.
The credit agreement contains representations, warranties, covenants and events of default, including a change of control event of default and limitations on incurrence of indebtedness and liens, new lines of business, mergers, transactions with affiliates and restrictive payments. During the continuance of an event of default, the lenders may take a number of actions, including declaring the entire amount then outstanding under the credit agreement due and payable. The credit agreement contains cross-defaults if we default on the master note purchase agreement or certain other debt. The credit agreement requires that we maintain specified quarterly leverage and interest coverage ratios. The required leverage ratio cannot exceed 3.50x total debt to EBITDA (or 3.75x during material acquisition periods, subject to certain limitations). The required interest coverage ratio must be at least 2.75x total interest expense to EBIT. As of December 31, 2015 and 2014, our leverage ratio was 2.88x and 2.67x, respectively. As of December 31, 2015 and 2014, our interest coverage ratio was 7.88x and 7.94x, respectively. We expect to be in compliance with all applicable covenants under the credit agreement for the next 12 months. We use the credit agreement for acquisitions, capital expenditures, working capital, standby letters of credit and general corporate purposes
On January 18, 2016, in connection with the Merger Agreement executed on that same day with Progressive Waste, we entered into a Consent with Bank of America, N.A. and certain other financial institutions party to the credit agreement, whereby the lenders provided their consent to (a) the Merger and the change of control, as defined in the credit agreement, of Waste Connections resulting from the consummation of the Merger and (b) the joinder, upon consummation of the Merger, of Progressive Waste and certain of its subsidiaries as borrowers under the credit agreement.
On July 15, 2008, we entered into a master note purchase agreement with certain accredited institutional investors pursuant to which we issued and sold to the investors at a closing on October 1, 2008, $175 million of senior uncollateralized notes due October 1, 2015, or the 2015 Notes, in a private placement. We redeemed the 2015 Notes on October 1, 2015 using borrowings under our credit agreement.
On October 26, 2009, we entered into a first supplement to the master note purchase agreement with certain accredited institutional investors pursuant to which we issued and sold to the investors on that date $175 million of senior uncollateralized notes due November 1, 2019, or the 2019 Notes, in a private placement. The 2019 Notes bear interest at the fixed rate of 5.25% per annum with interest payable in arrears semi-annually on May 1 and November 1 beginning on May 1, 2010, and with principal payable at the maturity of the 2019 Notes on November 1, 2019.
On April 1, 2011, we entered into a second supplement to the master note purchase agreement with certain accredited institutional investors, pursuant to which we issued and sold to the investors on that date $250 million of senior uncollateralized notes at fixed interest rates with interest payable in arrears semi-annually on October 1 and April 1 beginning on October 1, 2011 in a private placement. Of these notes, $100 million will mature on April 1, 2016 with an annual interest rate of 3.30%, or the 2016 Notes, $50 million will mature on April 1, 2018 with an annual interest rate of 4.00%, or the 2018 Notes, and $100 million will mature on April 1, 2021 with an annual interest rate of 4.64%, or the 2021 Notes. The principal of each of the 2016 Notes, 2018 Notes and 2021 Notes is payable at the maturity of each respective note. We have the intent and ability to redeem the 2016 Notes on April 1, 2016 using borrowings under our credit agreement.
On June 11, 2015, we entered into a third supplement to the master note purchase agreement with certain accredited institutional investors, pursuant to which, on August 20, 2015, we issued and sold to the investors in a private placement $500 million of senior unsecured notes at fixed interest rates with interest payable in arrears semi-annually on February 20 and August 20 beginning on February 20, 2016. Of these notes, $125 million will mature on August 20, 2022 with an annual interest rate of 3.09%, or the 2022 Notes; and $375 million of the senior unsecured notes will mature on August 20, 2025 with an annual interest rate of 3.41%, or the 2025 Notes. The principal of each of the 2022 Notes and 2025 Notes is payable at the maturity of each respective note.
| 58 |
The 2016 Notes, 2018 Notes, 2019 Notes, 2021 Notes, 2022 Notes and 2025 Notes, or collectively, the Senior Notes, are uncollateralized obligations and rank equally in right of payment with each of the Senior Notes and the obligations under our credit agreement. The Senior Notes are subject to representations, warranties, covenants and events of default. The master note purchase agreement contains cross-defaults if we default on the credit agreement or certain other debt. The master note purchase agreement requires that we maintain specified quarterly leverage and interest coverage ratios. The required leverage ratio cannot exceed 3.75x total debt to EBITDA. The required interest coverage ratio must be at least 2.75x total interest expense to EBIT. As of December 31, 2015 and 2014, our leverage ratio was 2.88x and 2.67x, respectively. As of December 31, 2015 and 2014, our interest coverage ratio was 7.88x and 7.94x, respectively. We expect to be in compliance with all applicable covenants under the Senior Notes for the next 12 months.
Upon the occurrence of an event of default, payment of the Senior Notes may be accelerated by the holders of the respective notes. The Senior Notes may also be prepaid at any time in whole or from time to time in any part (not less than 5% of the then-outstanding principal amount) by us at par plus a make-whole amount determined in respect of the remaining scheduled interest payments on the Senior Notes, using a discount rate of the then current market standard for United States treasury bills plus 0.50%. In addition, we will be required to offer to prepay the Senior Notes upon certain changes in control as defined in the master note purchase agreement, including of Waste Connections as a result of the consummation of the Merger.
We may issue additional series of senior uncollateralized notes, including floating rate notes, pursuant to the terms and conditions of the master note purchase agreement, as amended, provided that the purchasers of the Senior Notes shall not have any obligation to purchase any additional notes issued pursuant to the master note purchase agreement and the aggregate principal amount of the outstanding notes and any additional notes issued pursuant to the master note purchase agreement shall not exceed $1.25 billion. We currently have $900 million of notes outstanding under the master note purchase agreement.
Contractual Obligations
As of December 31, 2015, we had the following contractual obligations:
| Payments Due by Period | ||||||||||||||||||||
| (amounts in thousands) | ||||||||||||||||||||
| Recorded Obligations | Total | Less Than 1 Year | 1 to 3 Years | 3 to 5 Years | Over 5 Years | |||||||||||||||
| Long-term debt | $ | 2,157,285 | $ | 2,127 | $ | 67,511 | $ | 1,466,415 | $ | 621,232 | ||||||||||
| Cash interest payments | 346,687 | 64,769 | 121,659 | 81,979 | 78,280 | |||||||||||||||
| Contingent consideration | 70,275 | 22,260 | 4,631 | 7,369 | 36,015 | |||||||||||||||
| Final capping, closure and post-closure | 820,085 | 5,517 | 2,838 | 7,798 | 803,932 | |||||||||||||||
Long-term debt payments include:
| 1) | $390.0 million in principal payments due January 2020 related to our revolving credit facility under our credit agreement. We may elect to draw amounts on our credit agreement in either base rate loans or LIBOR loans. At December 31, 2015, $385.0 million of the outstanding borrowings drawn under the revolving credit facility were in LIBOR loans, which bear interest at the LIBOR rate plus the applicable LIBOR margin (for a total rate of 1.44% at December 31, 2015) and $5.0 million of the outstanding borrowings drawn under the revolving credit facility were in swing line loans, which bear interest at the base rate plus the applicable base rate margin (for a total rate of 3.70% at December 31, 2015). |
| 2) | $800.0 million in principal payments due January 2020 related to our term loan under our credit agreement. Outstanding amounts on the term loan can be either base rate loans or LIBOR loans. At December 31, 2015, all amounts outstanding under the term loan were in LIBOR loans which bear interest at the LIBOR rate plus the applicable LIBOR margin (for a total rate of 1.44% at December 31, 2015). |
| 3) | $100.0 million in principal payments due 2016 related to our 2016 Notes. Holders of the 2016 Notes may require us to purchase their notes in cash at a purchase price of 100% of the principal amount of the 2016 Notes plus accrued and unpaid interest, if any, upon a change in control, as defined in the master note purchase agreement. We have recorded this obligation in the payments due in 3 to 5 years category in the table above as we have the intent and ability to redeem the 2016 Notes on April 1, 2016 using borrowings under our credit agreement. The 2016 Notes bear interest at a rate of 3.30%. |
| 59 |
| 4) | $50.0 million in principal payments due 2018 related to our 2018 Notes. Holders of the 2018 Notes may require us to purchase their notes in cash at a purchase price of 100% of the principal amount of the 2018 Notes plus accrued and unpaid interest, if any, upon a change in control, as defined in the master note purchase agreement. The 2018 Notes bear interest at a rate of 4.00%. |
| 5) | $175.0 million in principal payments due 2019 related to our 2019 Notes. Holders of the 2019 Notes may require us to purchase their notes in cash at a purchase price of 100% of the principal amount of the 2019 Notes plus accrued and unpaid interest, if any, upon a change in control, as defined in the master note purchase agreement. The 2019 Notes bear interest at a rate of 5.25%. |
| 6) | $100.0 million in principal payments due 2021 related to our 2021 Notes. Holders of the 2021 Notes may require us to purchase their notes in cash at a purchase price of 100% of the principal amount of the 2021 Notes plus accrued and unpaid interest, if any, upon a change in control, as defined in the master note purchase agreement. The 2021 Notes bear interest at a rate of 4.64%. |
| 7) | $125.0 million in principal payments due 2022 related to our 2022 Notes. Holders of the 2022 Notes may require us to purchase their notes in cash at a purchase price of 100% of the principal amount of the 2022 Notes plus accrued and unpaid interest, if any, upon a change in control, as defined in the master note purchase agreement. The 2022 Notes bear interest at a rate of 3.09%. |
| 8) | $375.0 million in principal payments due 2025 related to our 2025 Notes. Holders of the 2025 Notes may require us to purchase their notes in cash at a purchase price of 100% of the principal amount of the 2025 Notes plus accrued and unpaid interest, if any, upon a change in control, as defined in the master note purchase agreement. The 2025 Notes bear interest at a rate of 3.41%. |
| 9) | $31.4 million in principal payments related to our tax-exempt bonds, which bear interest at variable rates (0.05% at December 31, 2015). The tax-exempt bonds have maturity dates ranging from 2018 to 2033. |
| 10) | $10.9 million in principal payments related to our notes payable to sellers and other third parties. Our notes payable to sellers and other third parties bear interest at rates between 3.0% and 10.9% at December 31, 2015, and have maturity dates ranging from 2016 to 2036. |
The following assumptions were made in calculating cash interest payments:
| 1) | We calculated cash interest payments on the credit agreement using the LIBOR rate plus the applicable LIBOR margin at December 31, 2015. We assumed the credit agreement is paid off when it matures in January 2020. |
| 2) | We calculated cash interest payments on our interest rate swaps using the stated interest rate in the swap agreement less the LIBOR rate through the earlier expiration of the term of the swaps or the term of the credit facility. |
Contingent consideration payments include $49.4 million recorded as liabilities in our consolidated financial statements at December 31, 2015, and $20.9 million of future interest accretion on the recorded obligations.
The estimated final capping, closure and post-closure expenditures presented above are in current dollars.
| Amount of Commitment Expiration Per Period | ||||||||||||||||||||
| (amounts in thousands) | ||||||||||||||||||||
| Unrecorded Obligations(1) | Total | Less Than 1 Year | 1 to 3 Years | 3 to 5 Years | Over 5 Years | |||||||||||||||
| Operating leases | $ | 108,944 | $ | 16,416 | $ | 25,067 | $ | 16,983 | $ | 50,478 | ||||||||||
| Unconditional purchase obligations | 50,198 | 33,242 | 16,956 | - | - | |||||||||||||||
| (1) | We are party to operating lease agreements and unconditional purchase obligations as discussed in Note 10 to the consolidated financial statements. These lease agreements and purchase obligations are established in the ordinary course of our business and are designed to provide us with access to facilities and products at competitive, market-driven prices. At December 31, 2015, our unconditional purchase obligations consisted of multiple fixed-price fuel purchase contracts under which we have 19.1 million gallons remaining to be purchased for a total of $50.2 million. The current fuel purchase contracts expire on or before December 31, 2017. These arrangements have not materially affected our financial position, results of operations or liquidity during the year ended December 31, 2015, nor are they expected to have a material impact on our future financial position, results of operations or liquidity. |
We have obtained standby letters of credit as discussed in Note 7 to the consolidated financial statements and financial surety bonds as discussed in Note 10 to the consolidated financial statements. These standby letters of credit and financial surety bonds are generally obtained to support our financial assurance needs and landfill and E&P operations. These arrangements have not materially affected our financial position, results of operations or liquidity during the year ended December 31, 2015, nor are they expected to have a material impact on our future financial position, results of operations or liquidity.
| 60 |
From time to time, we evaluate our existing operations and their strategic importance to us. If we determine that a given operating unit does not have future strategic importance, we may sell or otherwise dispose of those operations. Although we believe our reporting units would not be impaired by such dispositions, we could incur losses on them.
New Accounting Pronouncements
See Note 1 to the consolidated financial statements for a description of the new accounting standards that are applicable to us.
Non-GAAP Financial Measures
Adjusted Free Cash Flow
We present adjusted free cash flow, a non-GAAP financial measure, supplementally because it is widely used by investors as a valuation and liquidity measure in the solid waste industry. Management uses adjusted free cash flow as one of the principal measures to evaluate and monitor the ongoing financial performance of our operations. We define adjusted free cash flow as net cash provided by operating activities, plus proceeds from disposal of assets, plus or minus change in book overdraft, plus excess tax benefit associated with equity-based compensation, less capital expenditures for property and equipment and distributions to noncontrolling interests. We further adjust this calculation to exclude the effects of items management believes impact the ability to assess the operating performance of our business. This measure is not a substitute for, and should be used in conjunction with, GAAP liquidity or financial measures. Other companies may calculate adjusted free cash flow differently. Our adjusted free cash flow for the years ended December 31, 2015, 2014 and 2013, are calculated as follows (amounts in thousands):
| Years Ended December 31, | ||||||||||||
| 2015 | 2014 | 2013 | ||||||||||
| Net cash provided by operating activities | $ | 576,999 | $ | 545,077 | $ | 484,061 | ||||||
| Less: Change in book overdraft | (89 | ) | (11 | ) | (110 | ) | ||||||
| Plus: Proceeds from disposal of assets | 2,883 | 9,421 | 11,019 | |||||||||
| Plus: Excess tax benefit associated with equity-based compensation | 2,069 | 7,518 | 3,765 | |||||||||
| Less: Capital expenditures for property and equipment | (238,833 | ) | (241,277 | ) | (209,874 | ) | ||||||
| Less: Distributions to noncontrolling interests | (42 | ) | (371 | ) | (198 | ) | ||||||
| Adjustments: | ||||||||||||
| Payment of contingent consideration recorded in earnings (a) | - | 1,074 | 5,059 | |||||||||
| Payment for termination of corporate lease (b) | - | - | 9,690 | |||||||||
| Corporate office relocation (c) | - | - | 2,159 | |||||||||
| Tax effect (d) | - | - | (3,992 | ) | ||||||||
| Adjusted free cash flow | $ | 342,987 | $ | 321,431 | $ | 301,579 | ||||||
| (a) | Reflects the addback of acquisition-related payments for contingent consideration that were recorded as expenses in earnings and a component of cash flow from operating activities as the amounts paid exceeded the fair value of the contingent consideration recorded at the acquisition date. |
| (b) | Reflects the addback for the payment to terminate the remaining lease obligations of our former headquarters in Folsom, California. |
| (c) | Reflects the addback of third-party expenses and reimbursable advances to employees associated with the relocation of our corporate headquarters from California to Texas. |
| (d) | The aggregate tax effect of the adjustments in footnotes (b) and (c) is calculated based on the applied tax rates for the respective periods. |
| 61 |
Adjusted EBITDA
We present adjusted EBITDA, a non-GAAP financial measure, supplementally because it is widely used by investors as a performance and valuation measure in the solid waste industry. Management uses adjusted EBITDA as one of the principal measures to evaluate and monitor the ongoing financial performance of our operations. We define adjusted EBITDA as net income (loss), plus or minus income tax provision (benefit), plus interest expense, plus depreciation and amortization expense, plus closure and post-closure accretion expense, plus or minus any loss or gain on impairments and other operating items, plus other expense, less other income. We further adjust this calculation to exclude the effects of other items management believes impact the ability to assess the operating performance of our business. This measure is not a substitute for, and should be used in conjunction with, GAAP financial measures. Other companies may calculate adjusted EBITDA differently. Our adjusted EBITDA for the years ended December 31, 2015, 2014 and 2013, are calculated as follows (amounts in thousands):
| Years Ended December 31, | ||||||||||||
| 2015 | 2014 | 2013 | ||||||||||
| Net income (loss) | $ | (94,694 | ) | $ | 233,327 | $ | 196,005 | |||||
| Plus (Less): Income tax provision (benefit) | (31,592 | ) | 152,335 | 124,916 | ||||||||
| Plus: Interest expense | 64,236 | 64,674 | 73,579 | |||||||||
| Plus: Depreciation and amortization | 269,434 | 257,944 | 243,864 | |||||||||
| Plus: Closure and post-closure accretion | 3,978 | 3,627 | 2,967 | |||||||||
| Plus: Impairments and other operating items (a) | 494,492 | 4,091 | 4,129 | |||||||||
| Less: Other expense (income), net | 518 | (1,067 | ) | (1,056 | ) | |||||||
| Adjustments: | ||||||||||||
| Plus: Loss on prior office leases (b) | - | - | 9,902 | |||||||||
| Plus: Acquisition-related costs (c) | 4,235 | 2,147 | 1,946 | |||||||||
| Plus: Corporate relocation expenses (d) | - | - | 750 | |||||||||
| Adjusted EBITDA | $ | 710,607 | $ | 717,078 | $ | 657,002 | ||||||
| (a) | Reflects the addback of impairments and other operating items. |
| (b) | Reflects the addback of the loss on prior office leases resulting primarily from the relocation of our corporate headquarters from California to Texas. |
| (c) | Reflects the addback of acquisition-related transaction costs. |
| (d) | Reflects the addback of costs associated with the relocation of our corporate headquarters from California to Texas. |
| 62 |
Adjusted Net Income and Adjusted Net Income per Diluted Share
We present adjusted net income and adjusted net income per diluted share, both non-GAAP financial measures, supplementally because they are widely used by investors as a valuation measure in the solid waste industry. Management uses adjusted net income and adjusted net income per diluted share as one of the principal measures to evaluate and monitor the ongoing financial performance of our operations. We provide adjusted net income to exclude the effects of items management believes impact the comparability of operating results between periods. Adjusted net income has limitations due to the fact that it excludes items that have an impact on our financial condition and results of operations. Adjusted net income and adjusted net income per diluted share are not a substitute for, and should be used in conjunction with, GAAP financial measures. Other companies may calculate adjusted net income and adjusted net income per diluted share differently. Our adjusted net income and adjusted net income per diluted share for the years ended December 31, 2015, 2014 and 2013, are calculated as follows (amounts in thousands, except per share amounts):
| Years Ended December 31, | ||||||||||||
| 2015 | 2014 | 2013 | ||||||||||
| Reported net income (loss) attributable to Waste Connections | $ | (95,764 | ) | $ | 232,525 | $ | 195,655 | |||||
| Adjustments: | ||||||||||||
| Amortization of intangibles (a) | 29,077 | 27,000 | 25,410 | |||||||||
| Acquisition-related costs (b) | 4,235 | 2,147 | 1,946 | |||||||||
| Impairments and other operating items (c) | 494,492 | 4,091 | 4,129 | |||||||||
| Loss on prior office leases (d) | - | - | 9,902 | |||||||||
| Corporate relocation expenses (e) | - | - | 750 | |||||||||
| Tax effect (f) | (182,945 | ) | (12,747 | ) | (16,117 | ) | ||||||
| Impact of deferred tax adjustments (g) | (4,198 | ) | 1,220 | - | ||||||||
| Adjusted net income attributable to Waste Connections | $ | 244,897 | $ | 254,236 | $ | 221,675 | ||||||
| Diluted earnings (loss) per common share attributable to Waste Connections common stockholders: | ||||||||||||
| Reported net income (loss) | $ | (0.78 | ) | $ | 1.86 | $ | 1.58 | |||||
| Adjusted net income | $ | 1.98 | $ | 2.04 | $ | 1.79 | ||||||
| Shares used in the per share calculations: | ||||||||||||
| Reported diluted shares | 123,491,931 | 124,787,421 | 124,165,052 | |||||||||
| Adjusted diluted shares (h) | 123,871,636 | 124,787,421 | 124,165,052 | |||||||||
| (a) | Reflects the elimination of the non-cash amortization of acquisition-related intangible assets. |
| (b) | Reflects the elimination of acquisition-related transaction costs. |
| (c) | Reflects the addback of impairments and other operating items. |
| (d) | Reflects the addback of the loss on prior office leases resulting primarily from the relocation of our corporate headquarters from California to Texas. |
| (e) | Reflects the addback of costs associated with the relocation of our corporate headquarters from California to Texas. |
| (f) | The aggregate tax effect of the adjustments in footnotes (a) through (e) is calculated based on the applied tax rates for the respective periods. |
| (g) | Reflects (1) the elimination in 2015 of an increase to the income tax benefit primarily associated with a decrease in our deferred tax liabilities resulting from the impairment of assets in our E&P segment that impacted the geographical apportionment of our state income taxes, and (2) the elimination in 2014 of an increase to the income tax provision associated with an increase in our deferred tax liabilities resulting from the enactment of New York State’s 2014-2015 Budget Act on March 31, 2014. |
| (h) | Reflects reported diluted shares adjusted for shares that were excluded from the reported diluted shares calculation due to reporting a net loss during the year ended December 31, 2015. |
Inflation
Other than volatility in fuel prices and labor costs in certain markets, inflation has not materially affected our operations in recent years. Consistent with industry practice, many of our contracts allow us to pass through certain costs to our customers, including increases in landfill tipping fees and, in some cases, fuel costs. Therefore, we believe that we should be able to increase prices to offset many cost increases that result from inflation in the ordinary course of business. However, competitive pressures or delays in the timing of rate increases under our contracts may require us to absorb at least part of these cost increases, especially if cost increases exceed the average rate of inflation. Management's estimates associated with inflation have an impact on our accounting for landfill liabilities.
| 63 |
| ITEM 7A. | QUANTITATIVE AND QUALITATIVE DISCLOSURES ABOUT MARKET RISK |
In the normal course of business, we are exposed to market risk, including changes in interest rates and prices of certain commodities. We use hedge agreements to manage a portion of our risks related to interest rates and fuel prices. While we are exposed to credit risk in the event of non-performance by counterparties to our hedge agreements, in all cases such counterparties are highly rated financial institutions and we do not anticipate non-performance. We do not hold or issue derivative financial instruments for trading purposes. We monitor our hedge positions by regularly evaluating the positions at market and by performing sensitivity analyses over the unhedged fuel and variable rate debt positions.
At December 31, 2015, our derivative instruments included six interest rate swap agreements that effectively fix the interest rate on the applicable notional amounts of our variable rate debt as follows (dollars in thousands):
| Date Entered | Notional Amount | Fixed Interest Rate Paid* | Variable Interest Rate Received | Effective Date | Expiration Date | |||||||||
| December 2011 | $ | 175,000 | 1.600 | % | 1-month LIBOR | February 2014 | February 2017 | |||||||
| April 2014 | $ | 100,000 | 1.800 | % | 1-month LIBOR | July 2014 | July 2019 | |||||||
| May 2014 | $ | 50,000 | 2.344 | % | 1-month LIBOR | October 2015 | October 2020 | |||||||
| May 2014 | $ | 25,000 | 2.326 | % | 1-month LIBOR | October 2015 | October 2020 | |||||||
| May 2014 | $ | 50,000 | 2.350 | % | 1-month LIBOR | October 2015 | October 2020 | |||||||
| May 2014 | $ | 50,000 | 2.350 | % | 1-month LIBOR | October 2015 | October 2020 | |||||||
* Plus applicable margin.
Under derivatives and hedging guidance, the interest rate swap agreements are considered cash flow hedges for a portion of our variable rate debt, and we apply hedge accounting to account for these instruments. The notional amounts and all other significant terms of the swap agreements are matched to the provisions and terms of the variable rate debt being hedged.
We have performed sensitivity analyses to determine how market rate changes will affect the fair value of our unhedged floating rate debt. Such an analysis is inherently limited in that it reflects a singular, hypothetical set of assumptions. Actual market movements may vary significantly from our assumptions. Fair value sensitivity is not necessarily indicative of the ultimate cash flow or earnings effect we would recognize from the assumed market rate movements. We are exposed to cash flow risk due to changes in interest rates with respect to the unhedged floating rate balances owed at December 31, 2015 and 2014, of $771.4 million and $946.4 million, respectively, including floating rate debt under our credit agreement and floating rate municipal bond obligations. A one percentage point increase in interest rates on our variable-rate debt as of December 31, 2015 and 2014, would decrease our annual pre-tax income by approximately $7.7 million and $9.5 million, respectively. All of our remaining debt instruments are at fixed rates, or effectively fixed under the interest rate swap agreements described above; therefore, changes in market interest rates under these instruments would not significantly impact our cash flows or results of operations, subject to counterparty default risk.
The market price of diesel fuel is unpredictable and can fluctuate significantly. We purchase approximately 34.2 million gallons of fuel per year; therefore, a significant increase in the price of fuel could adversely affect our business and reduce our operating margins. To manage a portion of this risk, we periodically enter into fuel hedge agreements related to forecasted diesel fuel purchases.
| 64 |
At December 31, 2015, our derivative instruments included two fuel hedge agreements as follows:
| Date Entered | Notional Amount (in gallons per month) | Diesel Rate Paid Fixed (per gallon) | Diesel Rate Received Variable | Effective Date | Expiration Date | |||||||||
| May 2015 | 300,000 | $ | 3.280 | DOE Diesel Fuel Index* | January 2016 | December 2017 | ||||||||
| May 2015 | 200,000 | $ | 3.275 | DOE Diesel Fuel Index* | January 2016 | December 2017 | ||||||||
*If the national U.S. on-highway average price for a gallon of diesel fuel, or average price, as published by the Department of Energy, exceeds the contract price per gallon, we receive the difference between the average price and the contract price (multiplied by the notional number of gallons) from the counterparty. If the average price is less than the contract price per gallon, we pay the difference to the counterparty.
Under derivatives and hedging guidance, the fuel hedges are considered cash flow hedges for a portion of our forecasted diesel fuel purchases, and we apply hedge accounting to account for these instruments.
We have performed sensitivity analyses to determine how market rate changes will affect the fair value of our unhedged diesel fuel purchases. Such an analysis is inherently limited in that it reflects a singular, hypothetical set of assumptions. Actual market movements may vary significantly from our assumptions. Fair value sensitivity is not necessarily indicative of the ultimate cash flow or earnings effect we would recognize from the assumed market rate movements. For the year ending December 31, 2016, we expect to purchase approximately 34.2 million gallons of fuel, of which 15.2 million gallons will be purchased at market prices, 13.0 million gallons will be purchased under our fixed price fuel purchase contracts and 6.0 million gallons are hedged at a fixed price under our fuel hedge agreements. With respect to the approximately 15.2 million gallons of unhedged fuel we expect to purchase in 2016 at market prices, a $0.10 per gallon increase in the price of fuel over the year would decrease our pre-tax income during this period by approximately $1.5 million.
We market a variety of recyclable materials, including cardboard, office paper, plastic containers, glass bottles and ferrous and aluminum metals. We own and operate 37 recycling operations and sell other collected recyclable materials to third parties for processing before resale. To reduce our exposure to commodity price risk with respect to recycled materials, we have adopted a pricing strategy of charging collection and processing fees for recycling volume collected from third parties. In the event of a decline in recycled commodity prices, a 10% decrease in average recycled commodity prices from the average prices that were in effect during the year ended December 31, 2015 and 2014, would have had a $4.6 million and $5.6 million impact on revenues for the year ended December 31, 2015 and 2014, respectively.
| 65 |
| ITEM 8. | FINANCIAL STATEMENTS AND SUPPLEMENTARY DATA |
INDEX TO CONSOLIDATED FINANCIAL STATEMENTS
WASTE CONNECTIONS, INC.
| 66 |
Report of Independent Registered Public Accounting Firm
To the Board of Directors and Stockholders of
Waste Connections, Inc.:
In our opinion, the consolidated financial statements listed in the accompanying index present fairly, in all material respects, the financial position of Waste Connections, Inc. and its subsidiaries at December 31, 2015 and 2014, and the results of their operations and their cash flows for each of the three years in the period ended December 31, 2015 in conformity with accounting principles generally accepted in the United States of America. In addition, in our opinion, the financial statement schedule listed in the accompanying index presents fairly, in all material respects, the information set forth therein when read in conjunction with the related consolidated financial statements. Also in our opinion, the Company maintained, in all material respects, effective internal control over financial reporting as of December 31, 2015, based on criteria established in Internal Control - Integrated Framework (2013) issued by the Committee of Sponsoring Organizations of the Treadway Commission (COSO). The Company's management is responsible for these financial statements and financial statement schedule, for maintaining effective internal control over financial reporting and for its assessment of the effectiveness of internal control over financial reporting, included in Management’s Report on Internal Control over Financial Reporting appearing under Item 9A. Our responsibility is to express opinions on these financial statements, on the financial statement schedule, and on the Company's internal control over financial reporting based on our integrated audits. We conducted our audits in accordance with the standards of the Public Company Accounting Oversight Board (United States). Those standards require that we plan and perform the audits to obtain reasonable assurance about whether the financial statements are free of material misstatement and whether effective internal control over financial reporting was maintained in all material respects. Our audits of the financial statements included examining, on a test basis, evidence supporting the amounts and disclosures in the financial statements, assessing the accounting principles used and significant estimates made by management, and evaluating the overall financial statement presentation. Our audit of internal control over financial reporting included obtaining an understanding of internal control over financial reporting, assessing the risk that a material weakness exists, and testing and evaluating the design and operating effectiveness of internal control based on the assessed risk. Our audits also included performing such other procedures as we considered necessary in the circumstances. We believe that our audits provide a reasonable basis for our opinions.
A company’s internal control over financial reporting is a process designed to provide reasonable assurance regarding the reliability of financial reporting and the preparation of financial statements for external purposes in accordance with generally accepted accounting principles. A company’s internal control over financial reporting includes those policies and procedures that (i) pertain to the maintenance of records that, in reasonable detail, accurately and fairly reflect the transactions and dispositions of the assets of the company; (ii) provide reasonable assurance that transactions are recorded as necessary to permit preparation of financial statements in accordance with generally accepted accounting principles, and that receipts and expenditures of the company are being made only in accordance with authorizations of management and directors of the company; and (iii) provide reasonable assurance regarding prevention or timely detection of unauthorized acquisition, use, or disposition of the company’s assets that could have a material effect on the financial statements.
Because of its inherent limitations, internal control over financial reporting may not prevent or detect misstatements. Also, projections of any evaluation of effectiveness to future periods are subject to the risk that controls may become inadequate because of changes in conditions, or that the degree of compliance with the policies or procedures may deteriorate.
| /s/ PricewaterhouseCoopers LLP |
| Houston, Texas |
| February 9, 2016 |
| 67 |
CONSOLIDATED BALANCE SHEETS
(IN THOUSANDS, EXCEPT SHARE AND PER SHARE AMOUNTS)
| December 31, | ||||||||
| 2015 | 2014 | |||||||
| ASSETS | ||||||||
| Current assets: | ||||||||
| Cash and equivalents | $ | 10,974 | $ | 14,353 | ||||
| Accounts receivable, net of allowance for doubtful accounts of $7,738 and $9,175 at December 31, 2015 and 2014, respectively | 255,192 | 259,969 | ||||||
| Deferred income taxes | 49,727 | 49,508 | ||||||
| Prepaid expenses and other current assets | 46,534 | 42,314 | ||||||
| Total current assets | 362,427 | 366,144 | ||||||
| Property and equipment, net | 2,738,288 | 2,594,205 | ||||||
| Goodwill | 1,422,825 | 1,693,789 | ||||||
| Intangible assets, net | 511,294 | 509,995 | ||||||
| Restricted assets | 46,232 | 40,841 | ||||||
| Other assets, net | 40,732 | 40,293 | ||||||
| $ | 5,121,798 | $ | 5,245,267 | |||||
| LIABILITIES AND EQUITY | ||||||||
| Current liabilities: | ||||||||
| Accounts payable | $ | 115,206 | $ | 120,717 | ||||
| Book overdraft | 12,357 | 12,446 | ||||||
| Accrued liabilities | 136,018 | 120,947 | ||||||
| Deferred revenue | 90,349 | 80,915 | ||||||
| Current portion of contingent consideration | 22,217 | 21,637 | ||||||
| Current portion of long-term debt and notes payable | 2,127 | 3,649 | ||||||
| Total current liabilities | 378,274 | 360,311 | ||||||
| Long-term debt and notes payable | 2,147,127 | 1,971,152 | ||||||
| Long-term portion of contingent consideration | 27,177 | 48,528 | ||||||
| Other long-term liabilities | 124,943 | 92,900 | ||||||
| Deferred income taxes | 452,493 | 538,635 | ||||||
| Total liabilities | 3,130,014 | 3,011,526 | ||||||
| Commitments and contingencies (Note 10) | ||||||||
| Equity: | ||||||||
| Preferred stock: $0.01 par value per share; 7,500,000 shares authorized; none issued and outstanding | - | - | ||||||
| Common stock: $0.01 par value per share; 250,000,000 shares authorized; 122,375,955 and 123,984,527 shares issued and outstanding at December 31, 2015 and 2014, respectively | 1,224 | 1,240 | ||||||
| Additional paid-in capital | 736,652 | 811,289 | ||||||
| Accumulated other comprehensive loss | (12,171 | ) | (5,593 | ) | ||||
| Retained earnings | 1,259,495 | 1,421,249 | ||||||
| Total Waste Connections’ equity | 1,985,200 | 2,228,185 | ||||||
| Noncontrolling interest in subsidiaries | 6,584 | 5,556 | ||||||
| Total equity | 1,991,784 | 2,233,741 | ||||||
| $ | 5,121,798 | $ | 5,245,267 | |||||
The accompanying notes are an integral part of these consolidated financial statements.
| 68 |
CONSOLIDATED STATEMENTS OF NET INCOME (LOSS)
(IN THOUSANDS, EXCEPT SHARE AND PER SHARE AMOUNTS)
| Years Ended December 31, | ||||||||||||
| 2015 | 2014 | 2013 | ||||||||||
| Revenues | $ | 2,117,287 | $ | 2,079,166 | $ | 1,928,795 | ||||||
| Operating expenses: | ||||||||||||
| Cost of operations | 1,177,409 | 1,138,388 | 1,064,819 | |||||||||
| Selling, general and administrative | 237,484 | 229,474 | 212,637 | |||||||||
| Depreciation | 240,357 | 230,944 | 218,454 | |||||||||
| Amortization of intangibles | 29,077 | 27,000 | 25,410 | |||||||||
| Loss on prior office leases | - | - | 9,902 | |||||||||
| Impairments and other operating items | 494,492 | 4,091 | 4,129 | |||||||||
| Operating income (loss) | (61,532 | ) | 449,269 | 393,444 | ||||||||
| Interest expense | (64,236 | ) | (64,674 | ) | (73,579 | ) | ||||||
| Other income (expense), net | (518 | ) | 1,067 | 1,056 | ||||||||
| Income (loss) before income tax provision | (126,286 | ) | 385,662 | 320,921 | ||||||||
| Income tax (provision) benefit | 31,592 | (152,335 | ) | (124,916 | ) | |||||||
| Net income (loss) | (94,694 | ) | 233,327 | 196,005 | ||||||||
| Less: Net income attributable to noncontrolling interests | (1,070 | ) | (802 | ) | (350 | ) | ||||||
| Net income (loss) attributable to Waste Connections | $ | (95,764 | ) | $ | 232,525 | $ | 195,655 | |||||
| Earnings (loss) per common share attributable to Waste Connections’ common stockholders: | ||||||||||||
| Basic | $ | (0.78 | ) | $ | 1.87 | $ | 1.58 | |||||
| Diluted | $ | (0.78 | ) | $ | 1.86 | $ | 1.58 | |||||
| Shares used in the per share calculations: | ||||||||||||
| Basic | 123,491,931 | 124,215,346 | 123,597,540 | |||||||||
| Diluted | 123,491,931 | 124,787,421 | 124,165,052 | |||||||||
| Cash dividends per common share | $ | 0.535 | $ | 0.475 | $ | 0.415 | ||||||
The accompanying notes are an integral part of these consolidated financial statements.
| 69 |
CONSOLIDATED STATEMENTS OF COMPREHENSIVE INCOME (LOSS)
(IN THOUSANDS, EXCEPT SHARE AND PER SHARE AMOUNTS)
| Years Ended December 31, | ||||||||||||
| 2015 | 2014 | 2013 | ||||||||||
| Net income (loss) | $ | (94,694 | ) | $ | 233,327 | $ | 196,005 | |||||
| Other comprehensive income (loss), before tax: | ||||||||||||
| Interest rate swap amounts reclassified into interest expense | 5,093 | 4,581 | 5,641 | |||||||||
| Fuel hedge amounts reclassified into cost of operations | 3,217 | (823 | ) | - | ||||||||
| Changes in fair value of interest rate swaps | (7,746 | ) | (6,448 | ) | 296 | |||||||
| Changes in fair value of fuel hedges | (11,138 | ) | (3,355 | ) | 1,012 | |||||||
| Other comprehensive income (loss), before tax | (10,574 | ) | (6,045 | ) | 6,949 | |||||||
| Income tax (expense) benefit related to items of other comprehensive income (loss) | 3,996 | 2,321 | (2,653 | ) | ||||||||
| Other comprehensive income (loss), net of tax | (6,578 | ) | (3,724 | ) | 4,296 | |||||||
| Comprehensive income (loss) | (101,272 | ) | 229,603 | 200,301 | ||||||||
| Less: Comprehensive income attributable to noncontrolling interests | (1,070 | ) | (802 | ) | (350 | ) | ||||||
| Comprehensive income (loss) attributable to Waste Connections | $ | (102,342 | ) | $ | 228,801 | $ | 199,951 | |||||
The accompanying notes are an integral part of these consolidated financial statements.
| 70 |
CONSOLIDATED STATEMENTS OF EQUITY
YEARS ENDED DECEMBER 31, 2013, 2014 AND 2015
(IN THOUSANDS, EXCEPT SHARE AMOUNTS)
| WASTE CONNECTIONS’ EQUITY | ||||||||||||||||||||||||||||
| COMMON STOCK | ADDITIONAL PAID-IN | ACCUMULATED OTHER COMPREHENSIVE INCOME | RETAINED | NONCONTROLLING | ||||||||||||||||||||||||
| SHARES | AMOUNT | CAPITAL | (LOSS) | EARNINGS | INTERESTS | TOTAL | ||||||||||||||||||||||
| Balances at December 31, 2012 | 123,019,494 | $ | 1,230 | $ | 779,904 | $ | (6,165 | ) | $ | 1,103,188 | $ | 4,973 | $ | 1,883,130 | ||||||||||||||
| Vesting of restricted stock units | 482,403 | 5 | (5 | ) | - | - | - | - | ||||||||||||||||||||
| Tax withholdings related to net share settlements of restricted stock units | (152,191 | ) | (1 | ) | (5,438 | ) | - | - | - | (5,439 | ) | |||||||||||||||||
| Equity-based compensation | - | - | 15,397 | - | - | - | 15,397 | |||||||||||||||||||||
| Exercise of stock options and warrants | 216,781 | 2 | 2,462 | - | - | - | 2,464 | |||||||||||||||||||||
| Excess tax benefit associated with equity-based compensation | - | - | 3,765 | - | - | - | 3,765 | |||||||||||||||||||||
| Cash dividends on common stock | - | - | - | - | (51,213 | ) | - | (51,213 | ) | |||||||||||||||||||
| Amounts reclassified into earnings, net of taxes | - | - | - | 3,483 | - | - | 3,483 | |||||||||||||||||||||
| Changes in fair value of cash flow hedges, net of taxes | - | - | - | 813 | - | - | 813 | |||||||||||||||||||||
| Distributions to noncontrolling interests | - | - | - | - | - | (198 | ) | (198 | ) | |||||||||||||||||||
| Net income | - | - | - | - | 195,655 | 350 | 196,005 | |||||||||||||||||||||
| Balances at December 31, 2013 | 123,566,487 | 1,236 | 796,085 | (1,869 | ) | 1,247,630 | 5,125 | 2,048,207 | ||||||||||||||||||||
| Vesting of restricted stock units | 492,695 | 5 | (5 | ) | - | - | - | - | ||||||||||||||||||||
| Restricted stock units released from deferred compensation plan | 10,665 | - | - | - | - | - | - | |||||||||||||||||||||
| Tax withholdings related to net share settlements of restricted stock units | (159,936 | ) | (1 | ) | (6,813 | ) | - | - | - | (6,814 | ) | |||||||||||||||||
| Equity-based compensation | - | - | 18,446 | - | - | - | 18,446 | |||||||||||||||||||||
| Exercise of stock options and warrants | 241,716 | 2 | 3,373 | - | - | - | 3,375 | |||||||||||||||||||||
| Excess tax benefit associated with equity-based compensation | - | - | 7,518 | - | - | - | 7,518 | |||||||||||||||||||||
| Repurchase of common stock | (167,100 | ) | (2 | ) | (7,315 | ) | - | - | - | (7,317 | ) | |||||||||||||||||
| Cash dividends on common stock | - | - | - | - | (58,906 | ) | - | (58,906 | ) | |||||||||||||||||||
| Amounts reclassified into earnings, net of taxes | - | - | - | 2,317 | - | - | 2,317 | |||||||||||||||||||||
| Changes in fair value of cash flow hedges, net of taxes | - | - | - | (6,041 | ) | - | - | (6,041 | ) | |||||||||||||||||||
| Distributions to noncontrolling interests | - | - | - | - | - | (371 | ) | (371 | ) | |||||||||||||||||||
| Net income | - | - | - | - | 232,525 | 802 | 233,327 | |||||||||||||||||||||
| Balances at December 31, 2014 | 123,984,527 | 1,240 | 811,289 | (5,593 | ) | 1,421,249 | 5,556 | 2,233,741 | ||||||||||||||||||||
| Vesting of restricted stock units | 432,165 | 4 | (4 | ) | - | - | - | - | ||||||||||||||||||||
| Restricted stock units released from deferred compensation plan | 14,082 | - | - | - | - | - | - | |||||||||||||||||||||
| Tax withholdings related to net share settlements of restricted stock units | (138,611 | ) | (1 | ) | (6,446 | ) | - | - | - | (6,447 | ) | |||||||||||||||||
| Equity-based compensation | - | - | 20,318 | - | - | - | 20,318 | |||||||||||||||||||||
| Exercise of stock options and warrants | 46,781 | 1 | 571 | - | - | - | 572 | |||||||||||||||||||||
| Excess tax benefit associated with equity-based compensation | - | - | 2,069 | - | - | - | 2,069 | |||||||||||||||||||||
| Repurchase of common stock | (1,962,989 | ) | (20 | ) | (91,145 | ) | - | - | - | (91,165 | ) | |||||||||||||||||
| Cash dividends on common stock | - | - | - | - | (65,990 | ) | - | (65,990 | ) | |||||||||||||||||||
| Amounts reclassified into earnings, net of taxes | - | - | - | 5,148 | - | - | 5,148 | |||||||||||||||||||||
| Changes in fair value of cash flow hedges, net of taxes | - | - | - | (11,726 | ) | - | - | (11,726 | ) | |||||||||||||||||||
| Distributions to noncontrolling interests | - | - | - | - | - | (42 | ) | (42 | ) | |||||||||||||||||||
| Net income (loss) | - | - | - | - | (95,764 | ) | 1,070 | (94,694 | ) | |||||||||||||||||||
| Balances at December 31, 2015 | 122,375,955 | $ | 1,224 | $ | 736,652 | $ | (12,171 | ) | $ | 1,259,495 | $ | 6,584 | $ | 1,991,784 | ||||||||||||||
The accompanying notes are an integral part of these consolidated financial statements.
| 71 |
CONSOLIDATED STATEMENTS OF CASH FLOWS
(IN THOUSANDS)
| Years Ended December 31, | ||||||||||||
| 2015 | 2014 | 2013 | ||||||||||
| CASH FLOWS FROM OPERATING ACTIVITIES: | ||||||||||||
| Net income (loss) | $ | (94,694 | ) | $ | 233,327 | $ | 196,005 | |||||
| Adjustments to reconcile net income (loss) to net cash provided by operating activities: | ||||||||||||
| Loss on disposal of assets and impairments | 518,657 | 8,239 | 2,853 | |||||||||
| Depreciation | 240,357 | 230,944 | 218,454 | |||||||||
| Amortization of intangibles | 29,077 | 27,000 | 25,410 | |||||||||
| Deferred income taxes, net of acquisitions | (132,454 | ) | 31,031 | 38,680 | ||||||||
| Amortization of debt issuance costs | 3,097 | 3,085 | 3,655 | |||||||||
| Equity-based compensation | 20,318 | 18,446 | 15,397 | |||||||||
| Interest income on restricted assets | (428 | ) | (446 | ) | (386 | ) | ||||||
| Interest accretion | 6,761 | 5,076 | 4,812 | |||||||||
| Excess tax benefit associated with equity-based compensation | (2,069 | ) | (7,518 | ) | (3,765 | ) | ||||||
| Payment of contingent consideration recorded in earnings | - | (1,074 | ) | (5,059 | ) | |||||||
| Adjustments to contingent consideration | (22,180 | ) | (3,450 | ) | 1,276 | |||||||
| Changes in operating assets and liabilities, net of effects from acquisitions: | ||||||||||||
| Accounts receivable, net | 17,348 | (22,168 | ) | 1,612 | ||||||||
| Prepaid expenses and other current assets | (2,780 | ) | (3,868 | ) | 1,696 | |||||||
| Accounts payable | (16,674 | ) | 10,173 | (26,993 | ) | |||||||
| Deferred revenue | 4,377 | 8,571 | 1,403 | |||||||||
| Accrued liabilities | 8,217 | 4,985 | 6,117 | |||||||||
| Other long-term liabilities | 69 | 2,724 | 2,894 | |||||||||
| Net cash provided by operating activities | 576,999 | 545,077 | 484,061 | |||||||||
| CASH FLOWS FROM INVESTING ACTIVITIES: | ||||||||||||
| Payments for acquisitions, net of cash acquired | (230,517 | ) | (126,181 | ) | (64,156 | ) | ||||||
| Proceeds from adjustments to acquisition consideration | - | - | 18,000 | |||||||||
| Capital expenditures for property and equipment | (238,833 | ) | (241,277 | ) | (209,874 | ) | ||||||
| Proceeds from disposal of assets | 2,883 | 9,421 | 11,019 | |||||||||
| Change in restricted assets, net of interest income | (2,225 | ) | (4,475 | ) | (646 | ) | ||||||
| Other | (1,842 | ) | (896 | ) | (5,358 | ) | ||||||
| Net cash used in investing activities | (470,534 | ) | (363,408 | ) | (251,015 | ) | ||||||
| CASH FLOWS FROM FINANCING ACTIVITIES: | ||||||||||||
| Proceeds from long-term debt | 1,489,500 | 432,500 | 327,600 | |||||||||
| Principal payments on notes payable and long-term debt | (1,429,195 | ) | (525,909 | ) | (493,560 | ) | ||||||
| Payment of contingent consideration recorded at acquisition date | (2,190 | ) | (24,847 | ) | (23,941 | ) | ||||||
| Change in book overdraft | (89 | ) | (11 | ) | (110 | ) | ||||||
| Proceeds from option and warrant exercises | 572 | 3,375 | 2,464 | |||||||||
| Excess tax benefit associated with equity-based compensation | 2,069 | 7,518 | 3,765 | |||||||||
| Payments for repurchase of common stock | (91,165 | ) | (7,317 | ) | - | |||||||
| Payments for cash dividends | (65,990 | ) | (58,906 | ) | (51,213 | ) | ||||||
| Tax withholdings related to net share settlements of restricted stock units | (6,447 | ) | (6,814 | ) | (5,439 | ) | ||||||
| Distributions to noncontrolling interests | (42 | ) | (371 | ) | (198 | ) | ||||||
| Debt issuance costs | (6,867 | ) | (125 | ) | (2,035 | ) | ||||||
| Net cash used in financing activities | (109,844 | ) | (180,907 | ) | (242,667 | ) | ||||||
| Net increase (decrease) in cash and equivalents | (3,379 | ) | 762 | (9,621 | ) | |||||||
| Cash and equivalents at beginning of year | 14,353 | 13,591 | 23,212 | |||||||||
| Cash and equivalents at end of year | $ | 10,974 | $ | 14,353 | $ | 13,591 | ||||||
The accompanying notes are an integral part of these consolidated financial statements.
| 72 |
SUPPLEMENTARY DISCLOSURES OF CASH FLOW INFORMATION AND NON-CASH TRANSACTIONS:
| Years Ended December 31, | ||||||||||||
| 2015 | 2014 | 2013 | ||||||||||
| Cash paid for income taxes | $ | 102,279 | $ | 116,239 | $ | 81,710 | ||||||
| Cash paid for interest | $ | 55,674 | $ | 60,224 | $ | 66,985 | ||||||
| In connection with its acquisitions, the Company assumed liabilities as follows: | ||||||||||||
| Fair value of assets acquired | $ | 433,227 | $ | 172,875 | $ | 67,271 | ||||||
| Cash paid for current year acquisitions | (230,517 | ) | (126,181 | ) | (64,156 | ) | ||||||
| Liabilities assumed and notes payable issued to sellers of businesses acquired | $ | 202,710 | $ | 46,694 | $ | 3,115 | ||||||
The accompanying notes are an integral part of these consolidated financial statements.
| 73 |
NOTES TO CONSOLIDATED FINANCIAL STATEMENTS
(DOLLAR AMOUNTS IN THOUSANDS, EXCEPT PER SHARE, PER TON AND PER GALLON AMOUNTS)
| 1. | ORGANIZATION, BUSINESS AND SUMMARY OF SIGNIFICANT ACCOUNTING POLICIES |
Organization and Business
Waste Connections, Inc. (“WCI” or the “Company”) was incorporated in Delaware on September 9, 1997, and commenced its operations on October 1, 1997, through the purchase of certain solid waste operations in the state of Washington. The Company is an integrated municipal solid waste services company that provides solid waste collection, transfer, disposal and recycling services in mostly exclusive and secondary markets in the U.S. and a leading provider of non-hazardous exploration and production (“E&P”) waste treatment, recovery and disposal services in several of the most active natural resource producing areas of the U.S. The Company also provides intermodal services for the rail haul movement of cargo and solid waste containers in the Pacific Northwest.
Basis of Presentation
These consolidated financial statements include the accounts of WCI and its wholly-owned and majority-owned subsidiaries. The consolidated entity is referred to herein as the Company. All significant intercompany accounts and transactions have been eliminated in consolidation.
As further discussed in Note 18 – “Subsequent Events,” the Company entered into the Merger Agreement on January 18, 2016, that, if consummated, would result in the Company becoming a wholly-owned subsidiary of Progressive Waste. The accompanying consolidated financial statements, of which these notes are an integral part, do not reflect any effects that would result if the transaction contemplated by the Merger Agreement is consummated.
Cash Equivalents
The Company considers all highly liquid investments with a maturity of three months or less at purchase to be cash equivalents. As of December 31, 2015 and 2014, cash equivalents consisted of demand money market accounts.
Concentrations of Credit Risk
Financial instruments that potentially subject the Company to concentrations of credit risk consist primarily of cash and equivalents, restricted assets and accounts receivable. The Company maintains cash and equivalents with banks that at times exceed applicable insurance limits. The Company reduces its exposure to credit risk by maintaining such deposits with high quality financial institutions. The Company’s restricted assets are invested primarily in U.S. government and agency securities. The Company has not experienced any losses related to its cash and equivalents or restricted asset accounts. The Company generally does not require collateral on its trade receivables. Credit risk on accounts receivable is minimized as a result of the large and diverse nature of the Company’s customer base. The Company maintains allowances for losses based on the expected collectability of accounts receivable.
Revenue Recognition and Accounts Receivable
Revenues are recognized when persuasive evidence of an arrangement exists, the service has been provided, the price is fixed or determinable and collection is reasonably assured. Certain customers are billed in advance and, accordingly, recognition of the related revenues is deferred until the services are provided. In accordance with revenue recognition guidance, any tax assessed by a governmental authority that is directly imposed on a revenue-producing transaction between a seller and a customer is presented in the Statements of Net Income (Loss) on a net basis (excluded from revenues).
The Company’s receivables are recorded when billed or accrued and represent claims against third parties that will be settled in cash. The carrying value of the Company’s receivables, net of the allowance for doubtful accounts, represents their estimated net realizable value. The Company estimates its allowance for doubtful accounts based on historical collection trends, type of customer such as municipal or non-municipal, the age of outstanding receivables and existing economic conditions. If events or changes in circumstances indicate that specific receivable balances may be impaired, further consideration is given to the collectability of those balances and the allowance is adjusted accordingly. Past-due receivable balances are written off when the Company’s internal collection efforts have been unsuccessful in collecting the amount due.
| 74 |
WASTE CONNECTIONS, INC.
NOTES TO CONSOLIDATED FINANCIAL STATEMENTS
(DOLLAR AMOUNTS IN THOUSANDS, EXCEPT PER SHARE, PER TON AND PER GALLON AMOUNTS)
Property and Equipment
Property and equipment are stated at cost. Improvements or betterments, not considered to be maintenance and repair, which add new functionality or significantly extend the life of an asset are capitalized. Third-party expenditures related to pending development projects, such as legal and engineering expenses, are capitalized. Expenditures for maintenance and repair costs, including planned major maintenance activities, are charged to expense as incurred. The cost of assets retired or otherwise disposed of and the related accumulated depreciation are eliminated from the accounts in the year of disposal. Gains and losses resulting from disposals of property and equipment are recognized in the period in which the property and equipment is disposed. Depreciation is computed using the straight-line method over the estimated useful lives of the assets or the lease term, whichever is shorter.
The estimated useful lives are as follows:
| Buildings | 10 – 20 years | |
| Leasehold and land improvements | 3 – 10 years | |
| Machinery and equipment | 3 – 12 years | |
| Rolling stock | 2 – 10 years | |
| Containers | 5 – 12 years |
Landfill Accounting
The Company utilizes the life cycle method of accounting for landfill costs. This method applies the costs to be capitalized associated with acquiring, developing, closing and monitoring the landfills over the associated consumption of landfill capacity. The Company utilizes the units of consumption method to amortize landfill development costs over the estimated remaining capacity of a landfill. Under this method, the Company includes future estimated construction costs using current dollars, as well as costs incurred to date, in the amortization base. When certain criteria are met, the Company includes expansion airspace, which has not been permitted, in the calculation of the total remaining capacity of the landfill.
| - | Landfill development costs. Landfill development costs include the costs of acquisition, construction associated with excavation, liners, site berms, groundwater monitoring wells, gas recovery systems and leachate collection systems. The Company estimates the total costs associated with developing each landfill site to its final capacity. This includes certain projected landfill site costs that are uncertain because they are dependent on future events and thus actual costs could vary significantly from estimates. The total cost to develop a site to its final capacity includes amounts previously expended and capitalized, net of accumulated depletion, and projections of future purchase and development costs, liner construction costs, and operating construction costs. Total landfill costs include the development costs associated with expansion airspace. Expansion airspace is addressed below. |
| - | Final capping, closure and post-closure obligations. The Company accrues for estimated final capping, closure and post-closure maintenance obligations at the landfills it owns and the landfills that it operates, but does not own, under life-of-site agreements. Accrued final capping, closure and post-closure costs represent an estimate of the current value of the future obligation associated with final capping, closure and post-closure monitoring of non-hazardous solid waste landfills currently owned or operated under life-of-site agreements by the Company. Final capping costs represent the costs related to installation of clay liners, drainage and compacted soil layers and topsoil constructed over areas of the landfill where total airspace capacity has been consumed. Closure and post-closure monitoring and maintenance costs represent the costs related to cash expenditures yet to be incurred when a landfill facility ceases to accept waste and closes. Accruals for final capping, closure and post-closure monitoring and maintenance requirements in the U.S. consider site inspection, groundwater monitoring, leachate management, methane gas control and recovery, and operating and maintenance costs to be incurred during the period after the facility closes. Certain of these environmental costs, principally capping and methane gas control costs, are also incurred during the operating life of the site in accordance with the landfill operation requirements of Subtitle D and the air emissions standards. Daily maintenance activities, which include many of these costs, are expensed as incurred during the operating life of the landfill. Daily maintenance activities include leachate disposal; surface water, groundwater, and methane gas monitoring and maintenance; other pollution control activities; mowing and fertilizing the landfill final cap; fence and road maintenance; and third-party inspection and reporting costs. Site specific final capping, closure and post-closure engineering cost estimates are prepared annually for landfills owned or landfills operated under life-of-site agreements by the Company. |
| 75 |
WASTE CONNECTIONS, INC.
NOTES TO CONSOLIDATED FINANCIAL STATEMENTS
(DOLLAR AMOUNTS IN THOUSANDS, EXCEPT PER SHARE, PER TON AND PER GALLON AMOUNTS)
The net present value of landfill final capping, closure and post-closure liabilities are calculated by estimating the total obligation in current dollars, inflating the obligation based upon the expected date of the expenditure and discounting the inflated total to its present value using a credit-adjusted risk-free rate. Any changes in expectations that result in an upward revision to the estimated undiscounted cash flows are treated as a new liability and are inflated and discounted at rates reflecting current market conditions. Any changes in expectations that result in a downward revision (or no revision) to the estimated undiscounted cash flows result in a liability that is inflated and discounted at rates reflecting the market conditions at the time the cash flows were originally estimated. This policy results in the Company’s final capping, closure and post-closure liabilities being recorded in “layers.” The Company’s discount rate assumption for purposes of computing 2015 and 2014 “layers” for final capping, closure and post-closure obligations was 4.75% and 5.75%, respectively, which reflects the Company’s long-term credit adjusted risk free rate as of the end of 2014 and 2013. The Company’s inflation rate assumption was 2.5% for the years ended December 31, 2015 and 2014.
In accordance with the accounting guidance on asset retirement obligations, the final capping, closure and post-closure liability is recorded on the balance sheet along with an offsetting addition to site costs which is amortized to depletion expense on a units-of-consumption basis as remaining landfill airspace is consumed. The impact of changes determined to be changes in estimates, based on an annual update, is accounted for on a prospective basis. Depletion expense resulting from final capping, closure and post-closure obligations recorded as a component of landfill site costs will generally be less during the early portion of a landfill’s operating life and increase thereafter. Owned landfills and landfills operated under life-of-site agreements have estimated remaining lives, based on remaining permitted capacity, probable expansion capacity and projected annual disposal volumes, that range from approximately 1 to 183 years, with an average remaining life of approximately 38 years. The costs for final capping, closure and post-closure obligations at landfills the Company owns or operates under life-of-site agreements are generally estimated based on interpretations of current requirements and proposed or anticipated regulatory changes.
The estimates for landfill final capping, closure and post-closure costs consider when the costs would actually be paid and factor in inflation and discount rates. Interest is accreted on the recorded liability using the corresponding discount rate. When using discounted cash flow techniques, reliable estimates of market premiums may not be obtainable. In the waste industry, there is no market for selling the responsibility for final capping, closure and post-closure obligations independent of selling the landfill in its entirety. Accordingly, the Company does not believe that it is possible to develop a methodology to reliably estimate a market risk premium and has therefore excluded any such market risk premium from its determination of expected cash flows for landfill asset retirement obligations. The possibility of changing legal and regulatory requirements and the forward-looking nature of these types of costs make any estimation or assumption less certain.
The following is a reconciliation of the Company’s final capping, closure and post-closure liability balance from December 31, 2013 to December 31, 2015:
| Final capping, closure and post-closure liability at December 31, 2013 | $ | 50,128 | ||
| Adjustments to final capping, closure and post-closure liabilities | 4,176 | |||
| Liabilities incurred | 3,846 | |||
| Accretion expense associated with landfill obligations | 3,408 | |||
| Closure payments | (178 | ) | ||
| Assumption of closure liabilities from acquisitions | 120 | |||
| Final capping, closure and post-closure liability at December 31, 2014 | 61,500 | |||
| Adjustments to final capping, closure and post-closure liabilities | 89 | |||
| Liabilities incurred | 4,690 | |||
| Accretion expense associated with landfill obligations | 3,759 | |||
| Closure payments | (72 | ) | ||
| Assumption of closure liabilities from acquisitions | 8,647 | |||
| Final capping, closure and post-closure liability at December 31, 2015 | $ | 78,613 |
The Adjustments to final capping, closure and post-closure liabilities for the year ended December 31, 2014, primarily consisted of the following changes at some of the Company’s landfills: increases in estimated future closure expenditures, changes in engineering estimates of total site capacities and increases in estimated annual tonnage consumption. The final capping, closure and post-closure liability is included in Other long-term liabilities in the Consolidated Balance Sheets. The Company performs its annual review of its cost and capacity estimates in the first quarter of each year.
| 76 |
WASTE CONNECTIONS, INC.
NOTES TO CONSOLIDATED FINANCIAL STATEMENTS
(DOLLAR AMOUNTS IN THOUSANDS, EXCEPT PER SHARE, PER TON AND PER GALLON AMOUNTS)
At December 31, 2015, $43,636 of the Company’s restricted assets balance was for purposes of securing its performance of future final capping, closure and post-closure obligations.
| - | Disposal capacity. The Company’s internal and third-party engineers perform surveys at least annually to estimate the remaining disposal capacity at its landfills. This is done by using surveys and other methods to calculate, based on the terms of the permit, height restrictions and other factors, how much airspace is left to fill and how much waste can be disposed of at a landfill before it has reached its final capacity. The Company’s landfill depletion rates are based on the remaining disposal capacity, considering both permitted and probable expansion airspace, at the landfills it owns, and landfills it operates, but does not own, under life-of-site agreements. The Company’s landfill depletion rate is based on the term of the operating agreement at its operated landfill that has capitalized expenditures. Expansion airspace consists of additional disposal capacity being pursued through means of an expansion that has not yet been permitted. Expansion airspace that meets the following criteria is included in the estimate of total landfill airspace: |
| 1) | whether the land where the expansion is being sought is contiguous to the current disposal site, and the Company either owns the expansion property or has rights to it under an option, purchase, operating or other similar agreement; |
| 2) | whether total development costs, final capping costs, and closure/post-closure costs have been determined; |
| 3) | whether internal personnel have performed a financial analysis of the proposed expansion site and have determined that it has a positive financial and operational impact; |
| 4) | whether internal personnel or external consultants are actively working to obtain the necessary approvals to obtain the landfill expansion permit; and |
| 5) | whether the Company considers it probable that the Company will achieve the expansion (for a pursued expansion to be considered probable, there must be no significant known technical, legal, community, business, or political restrictions or similar issues existing that the Company believes are more likely than not to impair the success of the expansion). |
It is possible that the Company’s estimates or assumptions could ultimately be significantly different from actual results. In some cases, the Company may be unsuccessful in obtaining an expansion permit or the Company may determine that an expansion permit that the Company previously thought was probable has become unlikely. To the extent that such estimates, or the assumptions used to make those estimates, prove to be significantly different than actual results, or the belief that the Company will receive an expansion permit changes adversely in a significant manner, the costs of the landfill, including the costs incurred in the pursuit of the expansion, may be subject to impairment testing, as described below, and lower profitability may be experienced due to higher amortization rates, higher capping, closure and post-closure rates, and higher expenses or asset impairments related to the removal of previously included expansion airspace.
The Company periodically evaluates its landfill sites for potential impairment indicators. The Company’s judgments regarding the existence of impairment indicators are based on regulatory factors, market conditions and operational performance of its landfills. Future events could cause the Company to conclude that impairment indicators exist and that its landfill carrying costs are impaired.
Cell Processing Reserves
The Company records a cell processing reserve related to its E&P segment for certain locations in Louisiana and Texas for the estimated amount of expenses to be incurred upon the treatment and excavation of oilfield waste received. The cell processing reserve is the future cost to properly treat and dispose of existing waste within the cells at the various facilities. The reserve generally covers estimated costs to be incurred over a period of time up to 24 months, with the current portion representing costs estimated to be incurred in the next 12 months. The estimate is calculated based on current estimated volume in the cells, estimated percentage of waste treated, and historical average costs to treat and excavate the waste. The processing reserve represents the estimated costs to process the volumes of oilfield waste on-hand for which revenue has been recognized. At December 31, 2015 and 2014, the current portion of cell processing reserves was $5,566 and $6,136, respectively, which is included in Accrued liabilities in the Consolidated Balance Sheets. At December 31, 2015 and 2014, the long-term portion of cell processing reserves was $2,157 and $2,409, respectively, which is included in Other long-term liabilities in the Consolidated Balance Sheets.
| 77 |
WASTE CONNECTIONS, INC.
NOTES TO CONSOLIDATED FINANCIAL STATEMENTS
(DOLLAR AMOUNTS IN THOUSANDS, EXCEPT PER SHARE, PER TON AND PER GALLON AMOUNTS)
Business Combination Accounting
The Company accounts for business combinations as follows:
| · | The Company recognizes, separately from goodwill, the identifiable assets acquired and liabilities assumed at their estimated acquisition date fair values. The Company measures and recognizes goodwill as of the acquisition date as the excess of: (a) the aggregate of the fair value of consideration transferred, the fair value of any noncontrolling interest in the acquiree (if any) and the acquisition date fair value of the Company’s previously held equity interest in the acquiree (if any), over (b) the fair value of net assets acquired and liabilities assumed. |
| · | At the acquisition date, the Company measures the fair values of all assets acquired and liabilities assumed that arise from contractual contingencies. The Company measures the fair values of all noncontractual contingencies if, as of the acquisition date, it is more likely than not that the contingency will give rise to an asset or liability. |
Finite-Lived Intangible Assets
The amounts assigned to franchise agreements, contracts, customer lists, permits and non-competition agreements are being amortized on a straight-line basis over the expected term of the related agreements (ranging from 1 to 56 years).
Goodwill and Indefinite-Lived Intangible Assets
The Company acquired indefinite-lived intangible assets in connection with certain of its acquisitions. The amounts assigned to indefinite-lived intangible assets consist of the value of certain perpetual rights to provide solid waste collection and transportation services in specified territories and to operate exploration and production waste treatment and disposal facilities. The Company measures and recognizes acquired indefinite-lived intangible assets at their estimated acquisition date fair values. Indefinite-lived intangible assets are not amortized. Goodwill represents the excess of: (a) the aggregate of the fair value of consideration transferred, the fair value of any noncontrolling interest in the acquiree (if any) and the acquisition date fair value of the Company’s previously held equity interest in the acquiree (if any), over (b) the fair value of assets acquired and liabilities assumed. Goodwill and intangible assets, deemed to have indefinite lives, are subject to annual impairment tests as described below.
Goodwill and indefinite-lived intangible assets are tested for impairment on at least an annual basis in the fourth quarter of the year. In addition, the Company evaluates its reporting units for impairment if events or circumstances change between annual tests indicating a possible impairment. Examples of such events or circumstances include, but are not limited to, the following:
| · | a significant adverse change in legal factors or in the business climate; |
| · | an adverse action or assessment by a regulator; |
| · | a more likely than not expectation that a segment or a significant portion thereof will be sold; |
| · | the testing for recoverability of a significant asset group within the segment; or |
| · | current period or expected future operating cash flow losses. |
In the first step (“Step 1”) of testing for goodwill impairment, the Company estimates the fair value of each reporting unit, which the Company has determined to be its three geographic operating segments and its E&P segment, and compares the fair value with the carrying value of the net assets assigned to each reporting unit. If the fair value of a reporting unit is greater than the carrying value of the net assets, including goodwill, assigned to the reporting unit, then no impairment results. If the fair value is less than the carrying value, then the Company would perform a second step and determine the fair value of the goodwill. In this second step (“Step 2”), the fair value of goodwill is determined by deducting the fair value of a reporting unit’s identifiable assets and liabilities from the fair value of the reporting unit as a whole, as if that reporting unit had just been acquired and the purchase price were being initially allocated. If the fair value of the goodwill is less than its carrying value for a reporting unit, an impairment charge would be recorded to Impairments and other operating items in the Company’s Consolidated Statements of Net Income (Loss).
| 78 |
WASTE CONNECTIONS, INC.
NOTES TO CONSOLIDATED FINANCIAL STATEMENTS
(DOLLAR AMOUNTS IN THOUSANDS, EXCEPT PER SHARE, PER TON AND PER GALLON AMOUNTS)
During the third quarter of 2015, the Company determined that sufficient indicators of potential impairment existed to require an interim goodwill and indefinite-lived intangible assets impairment analysis for its E&P segment as a result of the sustained decline in oil prices in the recent months, together with market expectations of a likely slow recovery in such prices. The Company, therefore, performed a Step 1 assessment of its E&P segment during the third quarter of 2015. The Step 1 assessment involved measuring the recoverability of goodwill by comparing the E&P segment’s carrying amount, including goodwill, to the fair value of the reporting unit. The fair value was estimated using an income approach employing a discounted cash flow (“DCF”) model. The DCF model incorporated projected cash flows over a forecast period based on the remaining estimated lives of the operating locations comprising the E&P segment. This was based on a number of key assumptions, including, but not limited to, a discount rate of 11.6%, annual revenue projections based on E&P waste resulting from projected levels of oil and natural gas exploration and production activity during the forecast period, gross margins based on estimated operating expense requirements during the forecast period and estimated capital expenditures over the forecast period, all of which were classified as Level 3 in the fair value hierarchy. As a result of the Step 1 assessment, the Company determined that the E&P segment did not pass the Step 1 test because the carrying value exceeded the estimated fair value of the reporting unit. The Company then performed the Step 2 test to determine the fair value of goodwill for its E&P segment. Based on the Step 1 and Step 2 analyses, the Company recorded a goodwill impairment charge within its E&P segment of $411,786 during the third quarter of 2015. Following the impairment charge, the Company’s E&P segment has a remaining balance in goodwill of $77,343 at December 31, 2015. Additionally, the Company evaluated the recoverability of the E&P segment’s indefinite-lived intangible assets (other than goodwill) by comparing the estimated fair value of each indefinite-lived intangible asset to its carrying value. The Company estimated the fair value of the indefinite-lived intangible assets using an excess earnings approach. Based on the result of the recoverability test, the Company determined that the carrying value of certain indefinite-lived intangible assets within the E&P segment exceeded their fair value and were therefore not recoverable. The Company recorded an impairment charge to Impairments and other operating items in the Consolidated Statements of Net Income (Loss) on certain indefinite-lived intangible assets within its E&P segment of $38,351 during the third quarter and fourth quarter of 2015. Following the impairment charge, the Company’s E&P segment has a remaining balance in indefinite-lived intangible assets of $21,504 at December 31, 2015. The Company did not record an impairment charge to its E&P segment as a result of its goodwill and indefinite-lived intangible assets impairment tests in 2014.
During the Company’s annual impairment analysis, the Company determined the fair value of each of its three geographic operating segments as a whole and each indefinite-lived intangible asset within those segments using discounted cash flow analyses, which require significant assumptions and estimates about the future operations of each reporting unit and the future discrete cash flows related to each indefinite-lived intangible asset. Significant judgments inherent in these analyses include the determination of appropriate discount rates, the amount and timing of expected future cash flows and growth rates. The cash flows employed in the Company’s 2015 discounted cash flow analyses were based on ten-year financial forecasts, which in turn were based on the 2016 annual budget developed internally by management. These forecasts reflect operating profit margins that were consistent with 2015 results and perpetual revenue growth rates of 3.3%. The Company’s discount rate assumptions are based on an assessment of the Company’s weighted average cost of capital which approximated 5.0%. In assessing the reasonableness of the Company’s determined fair values of its reporting units, the Company evaluates its results against its current market capitalization. The Company did not record an impairment charge to its three geographic operating segments as a result of its goodwill and indefinite-lived intangible assets impairment tests in 2015 and 2014.
Impairments of Property and Equipment and Finite-Lived Intangible Assets
Property, equipment and finite-lived intangible assets are carried on the Company’s consolidated financial statements based on their cost less accumulated depreciation or amortization. Finite-lived intangible assets consist of long-term franchise agreements, contracts, customer lists, permits and non-competition agreements. The recoverability of these assets is tested whenever events or changes in circumstances indicate that their carrying amount may not be recoverable.
Typical indicators that an asset may be impaired include, but are not limited to, the following:
| · | a significant adverse change in legal factors or in the business climate; |
| · | an adverse action or assessment by a regulator; |
| · | a more likely than not expectation that a segment or a significant portion thereof will be sold; |
| · | the testing for recoverability of a significant asset group within a segment; or |
| · | current period or expected future operating cash flow losses. |
If any of these or other indicators occur, a test of recoverability is performed by comparing the carrying value of the asset or asset group to its undiscounted expected future cash flows. If the carrying value is in excess of the undiscounted expected future cash flows, impairment is measured by comparing the fair value of the asset to its carrying value. Fair value is determined by an internally developed discounted projected cash flow analysis of the asset. Cash flow projections are sometimes based on a group of assets, rather than a single asset. If cash flows cannot be separately and independently identified for a single asset, the Company will determine whether an impairment has occurred for the group of assets for which the projected cash flows can be identified. If the fair value of an asset is determined to be less than the carrying amount of the asset or asset group, an impairment in the amount of the difference is recorded in the period that the impairment indicator occurs. Several impairment indicators are beyond the Company’s control, and whether or not they will occur cannot be predicted with any certainty. Estimating future cash flows requires significant judgment and projections may vary from cash flows eventually realized. There are other considerations for impairments of landfills, as described below.
| 79 |
WASTE CONNECTIONS, INC.
NOTES TO CONSOLIDATED FINANCIAL STATEMENTS
(DOLLAR AMOUNTS IN THOUSANDS, EXCEPT PER SHARE, PER TON AND PER GALLON AMOUNTS)
Prior to conducting Step 1 of the goodwill impairment test for the E&P segment, as described above, the Company first evaluated the recoverability of its long-lived assets, including finite-lived intangible assets. When indicators of impairment are present, as described above, the Company tests long-lived assets for recoverability by comparing the carrying value of an asset group to its undiscounted cash flows. The Company considered the sustained decline in oil prices in the recent months, together with market expectations of a likely slow recovery in such prices, to be indicators of impairment for the E&P segment’s long-lived assets. Based on the result of the recoverability test, the Company determined that the carrying value of certain asset groups within the E&P segment exceeded their undiscounted cash flows and were therefore not recoverable. The Company then compared the fair value of these asset groups to their carrying values. The Company estimated the fair value of the asset groups under an income approach, as described above. Based on the analysis, the Company recorded an impairment charge to Impairments and other operating items in the Consolidated Statements of Net Income (Loss) on certain long-lived assets within its E&P segment of $67,647 during the year ended December 31, 2015. Following the impairment charge, the Company’s E&P segment has a remaining balance in property and equipment of $929,839 at December 31, 2015.
In 2014, the Company recorded an $8,445 impairment charge, which is included in Impairments and other operating items in the Consolidated Statements of Net Income (Loss), for property and equipment at an E&P disposal facility as a result of projected operating losses resulting from the migration of the majority of the facility’s customers to a new E&P facility that the Company owns and operates. The fair value of the property and equipment was determined using a discounted cash flow model.
Landfills – There are certain indicators listed above that require significant judgment and understanding of the waste industry when applied to landfill development or expansion projects. A regulator or court may deny or overturn a landfill development or landfill expansion permit application before the development or expansion permit is ultimately granted. Management may periodically divert waste from one landfill to another to conserve remaining permitted landfill airspace. Therefore, certain events could occur in the ordinary course of business and not necessarily be considered indicators of impairment due to the unique nature of the waste industry.
Restricted Assets
Restricted assets held by trustees consist principally of funds deposited in connection with landfill final capping, closure and post-closure obligations and other financial assurance requirements. Proceeds from these financing arrangements are directly deposited into trust funds, and the Company does not have the ability to utilize the funds in regular operating activities. See Note 8 for further information on restricted assets.
| 80 |
WASTE CONNECTIONS, INC.
NOTES TO CONSOLIDATED FINANCIAL STATEMENTS
(DOLLAR AMOUNTS IN THOUSANDS, EXCEPT PER SHARE, PER TON AND PER GALLON AMOUNTS)
Fair Value of Financial Instruments
The Company’s financial instruments consist primarily of cash and equivalents, trade receivables, restricted assets, trade payables, debt instruments, contingent consideration obligations, interest rate swaps and fuel hedges. As of December 31, 2015 and 2014, the carrying values of cash and equivalents, trade receivables, restricted assets, trade payables and contingent consideration are considered to be representative of their respective fair values. The carrying values of the Company’s debt instruments, excluding certain notes as listed in the table below, approximate their fair values as of December 31, 2015 and 2014, based on current borrowing rates, current remaining average life to maturity and borrower credit quality for similar types of borrowing arrangements, and are classified as Level 2 within the fair value hierarchy. The carrying values and fair values of the Company’s debt instruments where the carrying values do not approximate their fair values as of December 31, 2015 and 2014, are as follows:
| Carrying Value at December 31, | Fair Value* at December 31, | |||||||||||||||
| 2015 | 2014 | 2015 | 2014 | |||||||||||||
| 6.22% Senior Notes due 2015 | $ | - | $ | 175,000 | $ | - | $ | 181,476 | ||||||||
| 3.30% Senior Notes due 2016 | $ | 100,000 | $ | 100,000 | $ | 100,536 | $ | 102,253 | ||||||||
| 4.00% Senior Notes due 2018 | $ | 50,000 | $ | 50,000 | $ | 51,860 | $ | 52,500 | ||||||||
| 5.25% Senior Notes due 2019 | $ | 175,000 | $ | 175,000 | $ | 190,985 | $ | 192,974 | ||||||||
| 4.64% Senior Notes due 2021 | $ | 100,000 | $ | 100,000 | $ | 107,613 | $ | 108,088 | ||||||||
| 3.09% Senior Notes due 2022 | $ | 125,000 | $ | - | $ | 123,516 | $ | - | ||||||||
| 3.41% Senior Notes due 2025 | $ | 375,000 | $ | - | $ | 370,245 | $ | - | ||||||||
*Senior Notes are classified as Level 2 within the fair value hierarchy. Fair value is based on quotes of bonds with similar ratings in similar industries.
For details on the fair value of the Company’s interest rate swaps, fuel hedges, restricted assets and contingent consideration, refer to Note 8.
Derivative Financial Instruments
The Company recognizes all derivatives on the balance sheet at fair value. All of the Company’s derivatives have been designated as cash flow hedges; therefore, the effective portion of the changes in the fair value of derivatives will be recognized in accumulated other comprehensive loss (“AOCL”) until the hedged item is recognized in earnings. The ineffective portion of the changes in the fair value of derivatives will be immediately recognized in earnings. The Company classifies cash inflows and outflows from derivatives within operating activities on the statement of cash flows.
One of the Company’s objectives for utilizing derivative instruments is to reduce its exposure to fluctuations in cash flows due to changes in the variable interest rates of certain borrowings issued under its credit agreement. The Company’s strategy to achieve that objective involves entering into interest rate swaps. The interest rate swaps outstanding at December 31, 2015 were specifically designated to the Company’s credit agreement and accounted for as cash flow hedges.
At December 31, 2015, the Company’s derivative instruments included six interest rate swap agreements as follows:
| Date Entered | Notional Amount | Fixed Interest Rate Paid* | Variable Interest Rate Received | Effective Date | Expiration Date | |||||||||
| December 2011 | $ | 175,000 | 1.600 | % | 1-month LIBOR | February 2014 | February 2017 | |||||||
| April 2014 | $ | 100,000 | 1.800 | % | 1-month LIBOR | July 2014 | July 2019 | |||||||
| May 2014 | $ | 50,000 | 2.344 | % | 1-month LIBOR | October 2015 | October 2020 | |||||||
| May 2014 | $ | 25,000 | 2.326 | % | 1-month LIBOR | October 2015 | October 2020 | |||||||
| May 2014 | $ | 50,000 | 2.350 | % | 1-month LIBOR | October 2015 | October 2020 | |||||||
| May 2014 | $ | 50,000 | 2.350 | % | 1-month LIBOR | October 2015 | October 2020 | |||||||
* Plus applicable margin.
| 81 |
WASTE CONNECTIONS, INC.
NOTES TO CONSOLIDATED FINANCIAL STATEMENTS
(DOLLAR AMOUNTS IN THOUSANDS, EXCEPT PER SHARE, PER TON AND PER GALLON AMOUNTS)
Another of the Company’s objectives for utilizing derivative instruments is to reduce its exposure to fluctuations in cash flows due to changes in the price of diesel fuel. The Company’s strategy to achieve that objective involves periodically entering into fuel hedges that are specifically designated to certain forecasted diesel fuel purchases and accounted for as cash flow hedges.
At December 31, 2015, the Company’s derivative instruments included two fuel hedge agreements as follows:
| Date Entered | Notional Amount (in gallons per month) | Diesel Rate Paid Fixed (per gallon) | Diesel Rate Received Variable | Effective Date | Expiration Date | |||||||||
| May 2015 | 300,000 | $ | 3.280 | DOE Diesel Fuel Index* | January 2016 | December 2017 | ||||||||
| May 2015 | 200,000 | $ | 3.275 | DOE Diesel Fuel Index* | January 2016 | December 2017 | ||||||||
* If the national U.S. on-highway average price for a gallon of diesel fuel (“average price”), as published by the Department of Energy (“DOE”), exceeds the contract price per gallon, the Company receives the difference between the average price and the contract price (multiplied by the notional number of gallons) from the counterparty. If the average price is less than the contract price per gallon, the Company pays the difference to the counterparty.
The fair values of derivative instruments designated as cash flow hedges as of December 31, 2015, were as follows:
| Derivatives Designated as Cash | Asset Derivatives | Liability Derivatives | ||||||||||||
| Flow Hedges | Balance Sheet Location | Fair Value | Balance Sheet Location | Fair Value | ||||||||||
| Interest rate swaps | $ | - | Accrued liabilities(a) | $ | (5,425 | ) | ||||||||
| Other long-term liabilities | (4,320 | ) | ||||||||||||
| Fuel hedges | - | Accrued liabilities(b) | (5,699 | ) | ||||||||||
| Other long-term liabilities | (4,201 | ) | ||||||||||||
| Total derivatives designated as cash flow hedges | $ | - | $ | (19,645 | ) | |||||||||
(a) Represents the estimated amount of the existing unrealized losses on interest rate swaps as of December 31, 2015 (based on the interest rate yield curve at that date), included in AOCL expected to be reclassified into pre-tax earnings within the next 12 months. The actual amounts reclassified into earnings are dependent on future movements in interest rates.
(b) Represents the estimated amount of the existing unrealized losses on fuel hedges as of December 31, 2015 (based on the forward DOE diesel fuel index curve at that date), included in AOCL expected to be reclassified into pre-tax earnings within the next 12 months. The actual amounts reclassified into earnings are dependent on future movements in diesel fuel prices.
The fair values of derivative instruments designated as cash flow hedges as of December 31, 2014, were as follows:
| Derivatives Designated as Cash | Asset Derivatives | Liability Derivatives | ||||||||||
| Flow Hedges | Balance Sheet Location | Fair Value | Balance Sheet Location | Fair Value | ||||||||
| Interest rate swaps | Other assets, net | $ | 250 | Accrued liabilities | $ | (4,044 | ) | |||||
| Other long-term liabilities | (3,300 | ) | ||||||||||
| Fuel hedges | Accrued liabilities | (1,979 | ) | |||||||||
| Total derivatives designated as cash flow hedges | $ | 250 | $ | (9,323 | ) | |||||||
| 82 |
WASTE CONNECTIONS, INC.
NOTES TO CONSOLIDATED FINANCIAL STATEMENTS
(DOLLAR AMOUNTS IN THOUSANDS, EXCEPT PER SHARE, PER TON AND PER GALLON AMOUNTS)
The following table summarizes the impact of the Company’s cash flow hedges on the results of operations, comprehensive income (loss) and AOCL for the years ended December 31, 2015, 2014 and 2013:
| Derivatives Designated as Cash Flow Hedges | Amount of Gain or (Loss) Recognized as AOCL on Derivatives, Net of Tax (Effective Portion)(a) | Statement of Net Income (Loss) Classification | Amount of (Gain) or Loss Reclassified from AOCL into Earnings, Net of Tax (Effective Portion)(b), (c) | |||||||||||||||||||||||
| Years Ended December 31, | Years Ended December 31, | |||||||||||||||||||||||||
| 2015 | 2014 | 2013 | 2015 | 2014 | 2013 | |||||||||||||||||||||
| Interest rate swaps | $ | (4,820 | ) | $ | (3,970 | ) | $ | 188 | Interest expense | $ | 3,155 | $ | 2,824 | $ | 3,483 | |||||||||||
| Fuel hedges | (6,906 | ) | (2,071 | ) | 625 | Cost of operations | 1,993 | (507 | ) | - | ||||||||||||||||
| Total | $ | (11,726 | ) | $ | (6,041 | ) | $ | 813 | $ | 5,148 | $ | 2,317 | $ | 3,483 | ||||||||||||
(a) In accordance with the derivatives and hedging guidance, the effective portions of the changes in fair values of interest rate swaps and fuel hedges have been recorded in equity as a component of AOCL. As the critical terms of the interest rate swaps match the underlying debt being hedged, no ineffectiveness is recognized on these swaps and, therefore, all unrealized changes in fair value are recorded in AOCL. Because changes in the actual price of diesel fuel and changes in the DOE index price do not offset exactly each reporting period, the Company assesses whether the fuel hedges are highly effective using the cumulative dollar offset approach.
(b) Amounts reclassified from AOCL into earnings related to realized gains and losses on interest rate swaps are recognized when interest payments or receipts occur related to the swap contracts, which correspond to when interest payments are made on the Company’s hedged debt.
(c) Amounts reclassified from AOCL into earnings related to realized gains and losses on the fuel hedges are recognized when settlement payments or receipts occur related to the hedge contracts, which correspond to when the underlying fuel is consumed.
The Company measures and records ineffectiveness on the fuel hedges in Cost of operations in the Consolidated Statements of Net Income (Loss) on a monthly basis based on the difference between the DOE index price and the actual price of diesel fuel purchased, multiplied by the notional number of gallons on the contracts. There was no significant ineffectiveness recognized on the fuel hedges during the years ended December 31, 2015, 2014 and 2013.
See Note 12 for further discussion on the impact of the Company’s hedge accounting to its consolidated Comprehensive income (loss) and AOCL.
Income Taxes
Deferred tax assets and liabilities are determined based on differences between the financial reporting and income tax bases of assets and liabilities and are measured using the enacted tax rates and laws that are expected to be in effect when the differences are expected to reverse. The Company records valuation allowances to reduce net deferred tax assets to the amount considered more likely than not to be realized.
The Company is required to evaluate whether the tax positions taken on its federal and state income tax returns will more likely than not be sustained upon examination by the appropriate taxing authority. If the Company determines that such tax positions will not be sustained, it records a liability for the related unrecognized tax benefits. The Company classifies its liability for unrecognized tax benefits as a current liability to the extent it anticipates making a payment within one year.
Equity-Based Compensation
The fair value of restricted stock units is determined based on the number of shares granted, the closing price of the Company’s common stock and an assumed forfeiture rate of 8%.
Compensation expense associated with outstanding performance-based restricted stock unit (“PSU”) awards is measured using the fair value of the Company’s common stock and is based on the estimated achievement of the established performance criteria at the end of each reporting period until the performance period ends, recognized ratably over the performance period. Compensation expense is only recognized for those awards that the Company expects to vest, which it estimates based upon an assessment of the probability that the performance criteria will be achieved. The Company assumed a forfeiture rate of 0% for PSU awards with three-year performance-based metrics granted to the Company’s executive officers during the years ended December 31, 2015 and 2014. The Company assumed a forfeiture rate of 8% for PSU awards, with a one-year performance-based metric and time-based vesting for the remaining three years of the four-year vesting period, granted to the Company’s executive officers and non-executive officers during the year ended December 31, 2015.
| 83 |
WASTE CONNECTIONS, INC.
NOTES TO CONSOLIDATED FINANCIAL STATEMENTS
(DOLLAR AMOUNTS IN THOUSANDS, EXCEPT PER SHARE, PER TON AND PER GALLON AMOUNTS)
All share-based compensation cost is measured at the grant date, based on the estimated fair value of the award, and is recognized on a straight-line basis as expense over the employee’s requisite service period. Under the stock-based compensation guidance, the Company elected to use the short-cut method to calculate the historical pool of windfall tax benefits. The Company elected to use the tax law ordering approach for purposes of determining whether an excess of tax benefit has been realized.
Warrants are valued using the Black-Scholes pricing model with a contractual life of five years, a risk free interest rate based on the 5-year U.S. treasury yield curve and expected volatility. The Company uses the historical volatility of its common stock over a period equivalent to the contractual life of the warrants to estimate the expected volatility. Warrants issued to consultants are recorded as an element of the related cost of landfill development projects or to expense for warrants issued in connection with acquisitions.
Equity-based compensation expense recognized during the years ended December 31, 2015, 2014 and 2013, was $20,318 ($12,587 net of taxes), $18,446 ($11,372 net of taxes) and $15,397 ($9,508 net of taxes), respectively, and consisted of restricted stock unit, PSU and warrant expense. The Company records equity-based compensation expense in Selling, general and administrative expenses in the Consolidated Statements of Net Income (Loss). The total unrecognized compensation cost at December 31, 2015, related to unvested restricted stock unit awards was $25,984 and this future expense will be recognized over the remaining vesting period of the restricted stock unit awards, which extends to 2019. The weighted average remaining vesting period of the restricted stock unit awards is 1.1 years. The total unrecognized compensation cost at December 31, 2015, related to unvested PSU awards was $6,965 and this future expense will be recognized over the remaining vesting period of the PSU awards, which extends to 2019. The weighted average remaining vesting period of PSU awards is 1.6 years.
Per Share Information
Basic net income (loss) per share attributable to Waste Connections’ common stockholders is computed using the weighted average number of common shares outstanding and vested and unissued restricted stock units deferred for issuance into the deferred compensation plan. Diluted net income (loss) per share attributable to Waste Connections’ common stockholders is computed using the weighted average number of common and potential common shares outstanding. Potential common shares are excluded from the computation if their effect is anti-dilutive.
Advertising Costs
Advertising costs are expensed as incurred. Advertising expense for the years ended December 31, 2015, 2014 and 2013, was $3,197, $3,479 and $3,704, respectively, which is included in Selling, general and administrative expense in the Consolidated Statements of Net Income (Loss).
Insurance Liabilities
As a result of its high deductible or self-insured retention insurance policies, the Company is effectively self-insured for automobile liability, general liability, employer’s liability, environmental liability, cyber liability, employment practices liability, and directors’ and officers’ liability as well as for employee group health insurance, property and workers’ compensation. The Company’s insurance accruals are based on claims filed and estimates of claims incurred but not reported and are developed by the Company’s management with assistance from its third-party actuary and its third-party claims administrator. The insurance accruals are influenced by the Company’s past claims experience factors, which have a limited history, and by published industry development factors. At December 31, 2015 and 2014, the Company’s total accrual for self-insured liabilities was $44,934 and $44,849, respectively, which is included in Accrued liabilities in the Consolidated Balance Sheets. For the years ended December 31, 2015, 2014 and 2013, the Company recognized $49,391, $51,702 and $48,032, respectively, of self-insurance expense which is included in Cost of operations and Selling, general and administrative expense in the Consolidated Statements of Net Income (Loss).
New Accounting Pronouncements
Reporting Discontinued Operations and Disclosures of Disposals of Components of an Entity. In April 2014, the Financial Accounting Standards Board (the “FASB”) issued guidance that changes the threshold for reporting discontinued operations and adds new disclosures. The new guidance defines a discontinued operation as a disposal of a component or group of components that is disposed of or is classified as held for sale and "represents a strategic shift that has (or will have) a major effect on an entity's operations and financial results." For disposals of individually significant components that do not qualify as discontinued operations, an entity must disclose pre-tax earnings of the disposed component. For public business entities, this guidance is effective prospectively for all disposals (or classifications as held for sale) of components of an entity that occur within annual periods beginning on or after December 15, 2014, and interim periods within those years. Early adoption is permitted, but only for disposals (or classifications as held for sale) that have not been reported in financial statements previously issued or available for issuance. The Company adopted this guidance as of January 1, 2015. The adoption of this guidance did not have a material impact on the Company’s financial position or results of operations.
| 84 |
WASTE CONNECTIONS, INC.
NOTES TO CONSOLIDATED FINANCIAL STATEMENTS
(DOLLAR AMOUNTS IN THOUSANDS, EXCEPT PER SHARE, PER TON AND PER GALLON AMOUNTS)
Revenue From Contracts With Customers. In May 2014, the FASB issued guidance to provide a single, comprehensive revenue recognition model for all contracts with customers. The revenue guidance contains principles that an entity will apply to determine the measurement of revenue and timing of when it is recognized. The underlying principle is that an entity will recognize revenue to depict the transfer of goods or services to customers at an amount that the entity expects to be entitled to in exchange for those goods or services. The standard will be effective for fiscal years, and interim periods within those fiscal years, beginning after December 15, 2017 for public entities, with early adoption permitted (but not earlier than the original effective date of the pronouncement). The Company does not expect the adoption of this guidance to have a material impact on the Company’s financial position or results of operations.
Accounting for Share-Based Payment When the Terms of an Award Provide That a Performance Target Could Be Achieved After the Requisite Service Period. In June 2014, the FASB issued guidance that applies to all reporting entities that grant their employees share-based payments in which the terms of the award provide that a performance target that affects vesting could be achieved after the requisite service period. It requires that a performance target that affects vesting and that could be achieved after the requisite service period be treated as a performance condition and follows existing accounting guidance for the treatment of performance conditions. The standard will be effective for annual periods and interim periods within those annual periods beginning after December 15, 2015, with early adoption permitted. The Company does not expect the adoption of this guidance to have a material impact on the Company’s financial position or results of operations.
Presentation of Debt Issuance Costs. In April 2015, the FASB issued guidance which requires debt issuance costs (other than those paid to a lender) to be presented in the balance sheet as a direct deduction from the carrying value of the associated debt liability, consistent with the presentation of a debt discount. The standard does not affect the recognition and measurement of debt issuance costs. Therefore, the amortization of such costs should continue to be calculated using the interest method and be reported as interest expense. The FASB updated this guidance in August 2015 to clarify that fees paid to lenders to secure revolving lines of credit are not in the scope of the new guidance and will continue to be recorded as an asset on the balance sheet. The standard is effective for financial statements issued for fiscal years beginning after December 15, 2015, and interim periods within those fiscal years. Early adoption is permitted for financial statements that have not been previously issued. The new guidance has been applied on a retrospective basis. The Company early adopted this guidance effective January 1, 2015. The adoption of this guidance did not have a material impact on the Company’s financial position or results of operations.
Accounting for Measurement-Period Adjustments. In September 2015, the FASB issued guidance that eliminates the requirement to restate prior period financial statements for measurement period adjustments. The new guidance requires that the cumulative impact of a measurement period adjustment (including the impact on prior periods) be recognized in the reporting period in which the adjustment is identified. This cumulative adjustment would be reflected within the respective financial statement line items affected. The new guidance does not change what constitutes a measurement period adjustment. The new standard should be applied prospectively to measurement period adjustments that occur after the effective date. The new standard is effective for interim and annual periods beginning after December 15, 2015, with early adoption permitted. The Company early adopted this guidance effective October 1, 2015. The adoption of this guidance did not have a material impact on the Company’s financial position or results of operations.
Balance Sheet Classification of Deferred Taxes. In November 2015, the FASB issued guidance that requires that all deferred tax assets and liabilities, along with any related valuation allowance, be classified as noncurrent on the balance sheet. As a result, each jurisdiction will now only have one net noncurrent deferred tax asset or liability. The guidance does not change the existing requirement that only permits offsetting within a jurisdiction. The new standard is effective in fiscal years beginning after December 15, 2016, including interim periods within those years, with early adoption permitted. The adoption of this guidance will result in the Company’s current deferred tax assets being recorded as noncurrent.
| 85 |
WASTE CONNECTIONS, INC.
NOTES TO CONSOLIDATED FINANCIAL STATEMENTS
(DOLLAR AMOUNTS IN THOUSANDS, EXCEPT PER SHARE, PER TON AND PER GALLON AMOUNTS)
Reclassification
Certain amounts reported in the Company’s prior year’s financial statements have been reclassified to conform with the 2015 presentation.
| 2. | USE OF ESTIMATES AND ASSUMPTIONS |
In preparing the Company’s consolidated financial statements, several estimates and assumptions are made that affect the accounting for and recognition of assets, liabilities, revenues and expenses. These estimates and assumptions must be made because certain of the information that is used in the preparation of the Company’s consolidated financial statements is dependent on future events, cannot be calculated with a high degree of precision from data available or is simply not capable of being readily calculated based on generally accepted methodologies. In some cases, these estimates are particularly difficult to determine and the Company must exercise significant judgment. The most difficult, subjective and complex estimates and the assumptions that deal with the greatest amount of uncertainty are related to the Company’s accounting for landfills, self-insurance accruals, income taxes, allocation of acquisition purchase price, contingent consideration accruals and asset impairments, which are discussed in Note 1. An additional area that involves estimation is when the Company estimates the amount of potential exposure it may have with respect to litigation, claims and assessments in accordance with the accounting guidance on contingencies. Actual results for all estimates could differ materially from the estimates and assumptions that the Company uses in the preparation of its consolidated financial statements.
| 3. | ACQUISITIONS |
The Company recognizes, separately from goodwill, the identifiable assets acquired and liabilities assumed at their estimated acquisition date fair values. The Company measures and recognizes goodwill as of the acquisition date as the excess of: (a) the aggregate of the fair value of consideration transferred, the fair value of any noncontrolling interest in the acquiree (if any) and the acquisition date fair value of the Company's previously held equity interest in the acquiree (if any), over (b) the fair value of assets acquired and liabilities assumed. If information about facts and circumstances existing as of the acquisition date is incomplete by the end of the reporting period in which a business combination occurs, the Company will report provisional amounts for the items for which the accounting is incomplete. The measurement period ends once the Company receives the information it was seeking; however, this period will not exceed one year from the acquisition date. Any material adjustments recognized during the measurement period will be reflected prospectively in the period the adjustment is identified in the consolidated financial statements. The Company recognizes acquisition-related costs as expense.
In January 2015, the Company acquired Shale Gas Services, LLC (“Shale Gas”), which owns two E&P waste stream treatment and recycling operations in Arkansas and Texas, for cash consideration of $41,000 and potential future contingent consideration. The contingent consideration would be paid to the former owners of Shale Gas based on the achievement of certain operating targets for the acquired operations, as specified in the membership purchase agreement, over a two-year period following the close of the acquisition. The Company used probability assessments of the expected future cash flows and determined that no liability for payment of future contingent consideration existed as of the acquisition close date. As of December 31, 2015, the assessment that no liability existed for payment of future contingent consideration has not changed.
In March 2015, the Company acquired DNCS Properties, LLC (“DNCS”), which owns land and permits to construct and operate an E&P waste facility in the Permian Basin, for cash consideration of $30,000 and a long-term note issued to the former owners of DNCS with a fair value of $5,088. The long-term note requires ten annual principal payments of $500, followed by an additional ten annual principal payments of $250, for total future cash payments of $7,500. The fair value of the long-term note was determined by applying a discount rate of 4.75% to the payments over the 20-year payment period.
In November 2015, the Company acquired Rock River Environmental Services, Inc. (“Rock River”), an integrated provider of solid waste collection, recycling, transfer and disposal services. The acquired operations service 19 counties in central and northern Illinois and include five collection operations, two landfills, one compost facility, one transfer station and one recycling facility. The Company paid cash consideration of $225,000 for this acquisition, using proceeds from borrowings under its credit agreement. The Company also paid an additional amount for the purchase of estimated working capital, which is subject to post-closing adjustments.
In addition to the acquisitions of Shale Gas, DNCS and Rock River, the Company also acquired 11 individually immaterial non-hazardous solid waste collection and disposal businesses during the year ended December 31, 2015.
| 86 |
WASTE CONNECTIONS, INC.
NOTES TO CONSOLIDATED FINANCIAL STATEMENTS
(DOLLAR AMOUNTS IN THOUSANDS, EXCEPT PER SHARE, PER TON AND PER GALLON AMOUNTS)
In March 2014, the Company acquired Screwbean Landfill, LLC (“Screwbean”), which owns land and permits to construct and operate an E&P waste facility, and S.A. Dunn & Company, LLC (“Dunn”), which owns land and permits to construct and operate a construction and demolition landfill, for aggregate total cash consideration of $27,020 and contingent consideration of $2,923. Contingent consideration represents the fair value of up to $3,000 of amounts payable to the former Dunn owners based on the successful modification of site construction permits that would enable increased capacity at the landfill. The fair value of the contingent consideration was determined using probability assessments of the expected future cash flows over the two-year period in which the obligations are expected to be settled, and applying discount rates ranging from 2.4% to 2.7%. As of December 31, 2015, the obligation recognized at the purchase date has not materially changed. Any changes in the fair value of the contingent consideration subsequent to the acquisition date will be charged or credited to expense until the contingency is settled.
In September 2014, the Company acquired Rumsey Environmental, LLC (“Rumsey”), which provides solid waste collection services in western Alabama, for aggregate total cash consideration of $16,000 and contingent consideration of $1,891. Contingent consideration represents the fair value of up to $2,000 of amounts payable to the former owners based on the achievement of certain operating targets specified in the asset purchase agreement. The fair value of the contingent consideration was determined using probability assessments of the expected future cash flows over the two-year period in which the obligation is expected to be settled, and applying a discount rate of 2.8%. As of December 31, 2015, the obligation recognized at the purchase date has not materially changed. Any changes in the fair value of the contingent consideration subsequent to the acquisition date will be charged or credited to expense until the contingency is settled.
In October 2014, the Company acquired Section 18, LLC (“Section 18”), which provides E&P disposal services in North Dakota, for aggregate total cash consideration of $64,425 and contingent consideration of $37,724. The contingent consideration recorded represented the estimated fair value at the acquisition close date of amounts payable to the former owners based on approval of up to four site construction permits for future facilities in North Dakota, Wyoming and Montana and the achievement of certain operating targets at one current facility and up to four future facilities as specified in the asset purchase agreement. The fair value of the contingent consideration was determined using probability assessments of the expected future cash flows over the one to four-year period in which the obligations are expected to be settled, and applying a discount rate of 5.2%. During the third quarter of 2015, the Company remeasured the fair value of the contingent consideration and determined that the fair value of amounts payable associated with the achievement of certain operating targets decreased by $20,642, which was credited to Impairments and other operating items in the Consolidated Statements of Net Income (Loss). The change in the fair value of the contingent consideration was due to an expected decrease in earnings of the future facilities as a result of the sustained decline in oil prices subsequent to the closing date of the acquisition, together with market expectations of a likely slow recovery in such prices. During the year ended December 31, 2015, $2,000 of the contingent consideration associated with the approval of one of the site permits was earned and paid to the former owners.
In addition to the acquisitions of Screwbean, Dunn, Rumsey and Section 18, the Company acquired five individually immaterial non-hazardous solid waste collection, transfer and disposal businesses during the year ended December 31, 2014.
The Company acquired eight individually immaterial non-hazardous solid waste collection businesses during the year ended December 31, 2013.
The total acquisition-related costs incurred for the acquisitions closed during the years ended December 31, 2015, 2014 and 2013 were $4,235, $2,147 and $1,946. These expenses are included in Selling, general and administrative expenses in the Company’s Consolidated Statements of Net Income (Loss).
The results of operations of the acquired businesses have been included in the Company’s consolidated financial statements from their respective acquisition dates. The Company expects these acquired businesses to contribute towards the achievement of the Company’s strategy to expand through acquisitions. Goodwill acquired is attributable to the synergies and ancillary growth opportunities expected to arise after the Company’s acquisition of these businesses.
| 87 |
WASTE CONNECTIONS, INC.
NOTES TO CONSOLIDATED FINANCIAL STATEMENTS
(DOLLAR AMOUNTS IN THOUSANDS, EXCEPT PER SHARE, PER TON AND PER GALLON AMOUNTS)
The following table summarizes the consideration transferred to acquire these businesses and the amounts of identifiable assets acquired and liabilities assumed at the acquisition date for acquisitions consummated in the years ended December 31, 2015, 2014 and 2013:
2015 Acquisitions | 2014 Acquisitions | 2013 Acquisitions | ||||||||||
| Fair value of consideration transferred: | ||||||||||||
| Cash | $ | 230,517 | $ | 126,181 | $ | 64,156 | ||||||
| Debt assumed | 111,324 | - | - | |||||||||
| Notes issued to sellers | 6,091 | - | - | |||||||||
| Contingent consideration | 815 | 42,538 | 40 | |||||||||
| 348,747 | 168,719 | 64,196 | ||||||||||
| Recognized amounts of identifiable assets acquired and liabilities assumed associated with businesses acquired: | ||||||||||||
| Accounts receivable | 12,571 | 3,785 | 211 | |||||||||
| Other current assets | 1,440 | 111 | 317 | |||||||||
| Property and equipment | 208,363 | 140,412 | 12,775 | |||||||||
| Long-term franchise agreements and contracts | 16,462 | 369 | 1,043 | |||||||||
| Indefinite-lived intangibles | 1,256 | - | - | |||||||||
| Customer lists | 12,504 | 9,420 | 13,024 | |||||||||
| Permits | 37,071 | - | - | |||||||||
| Other long-term assets | 2,738 | - | - | |||||||||
| Deferred revenue | (5,056 | ) | (427 | ) | (539 | ) | ||||||
| Accounts payable | (7,515 | ) | - | (735 | ) | |||||||
| Accrued liabilities | (1,822 | ) | (1,749 | ) | (1,034 | ) | ||||||
| Other long-term liabilities | (19,998 | ) | (1,980 | ) | (767 | ) | ||||||
| Deferred income taxes | (50,089 | ) | - | - | ||||||||
| Total identifiable net assets | 207,925 | 149,941 | 24,295 | |||||||||
| Goodwill | $ | 140,822 | $ | 18,778 | $ | 39,901 | ||||||
Goodwill acquired in 2015 totaling $40,863 is expected to be deductible for tax purposes. Goodwill acquired in 2014 totaling $18,778 is expected to be deductible for tax purposes. Goodwill acquired in 2013 totaling $39,731 is expected to be deductible for tax purposes.
The fair value of acquired working capital related to four individually immaterial acquisitions completed during the year ended December 31, 2015, is provisional pending receipt of information to support the fair value of the assets acquired and liabilities assumed. Any adjustments recorded relating to finalizing the working capital for these four acquisitions are not expected to be material to the Company’s financial position.
The gross amount of trade receivables due under contracts acquired during the year ended December 31, 2015, was $13,037, of which $466 was expected to be uncollectible. The gross amount of trade receivables due under contracts acquired during the year ended December 31, 2014, was $3,981, of which $196 was expected to be uncollectible. The gross amount of trade receivables due under contracts acquired during the year ended December 31, 2013, was $414, of which $203 was expected to be uncollectible. The Company did not acquire any other class of receivable as a result of the acquisition of these businesses.
| 88 |
WASTE CONNECTIONS, INC.
NOTES TO CONSOLIDATED FINANCIAL STATEMENTS
(DOLLAR AMOUNTS IN THOUSANDS, EXCEPT PER SHARE, PER TON AND PER GALLON AMOUNTS)
| 4. | INTANGIBLE ASSETS, NET |
Intangible assets, exclusive of goodwill, consisted of the following at December 31, 2015:
| Gross Carrying Amount | Accumulated Amortization | Accumulated Impairment Loss | Net Carrying Amount | |||||||||||||
| Finite-lived intangible assets: | ||||||||||||||||
| Long-term franchise agreements and contracts | $ | 210,384 | $ | (60,205 | ) | $ | - | $ | 150,179 | |||||||
| Customer lists | 173,855 | (96,941 | ) | - | 76,914 | |||||||||||
| Permits and non-competition agreements | 81,240 | (13,587 | ) | - | 67,653 | |||||||||||
| 465,479 | (170,733 | ) | - | 294,746 | ||||||||||||
| Indefinite-lived intangible assets: | ||||||||||||||||
| Solid waste collection and transportation permits | 152,761 | - | - | 152,761 | ||||||||||||
| Material recycling facility permits | 42,283 | - | - | 42,283 | ||||||||||||
| E&P facility permits | 59,855 | - | (38,351 | ) | 21,504 | |||||||||||
| 254,899 | - | (38,351 | ) | 216,548 | ||||||||||||
| Intangible assets, exclusive of goodwill | $ | 720,378 | $ | (170,733 | ) | $ | (38,351 | ) | $ | 511,294 | ||||||
The weighted-average amortization period of long-term franchise agreements and contracts acquired during the year ended December 31, 2015 was 10.0 years. The weighted-average amortization period of customer lists acquired during the year ended December 31, 2015 was 8.2 years. The weighted-average amortization period of finite-lived permits acquired during the year ended December 31, 2015 was 38.1 years.
Intangible assets, exclusive of goodwill, consisted of the following at December 31, 2014:
| Gross Carrying Amount | Accumulated Amortization | Net Carrying Amount | ||||||||||
| Finite-lived intangible assets: | ||||||||||||
| Long-term franchise agreements and contracts | $ | 195,676 | $ | (52,448 | ) | $ | 143,228 | |||||
| Customer lists | 161,463 | (77,931 | ) | 83,532 | ||||||||
| Permits and non-competition agreements | 41,369 | (11,777 | ) | 29,592 | ||||||||
| 398,508 | (142,156 | ) | 256,352 | |||||||||
| Indefinite-lived intangible assets: | ||||||||||||
| Solid waste collection and transportation permits | 151,505 | - | 151,505 | |||||||||
| Material recycling facility permits | 42,283 | - | 42,283 | |||||||||
| E&P facility permits | 59,855 | - | 59,855 | |||||||||
| 253,643 | - | 253,643 | ||||||||||
| Intangible assets, exclusive of goodwill | $ | 652,151 | $ | (142,156 | ) | $ | 509,995 | |||||
Estimated future amortization expense for the next five years relating to finite-lived intangible assets is as follows:
| For the year ending December 31, 2016 | $ | 27,434 | ||
| For the year ending December 31, 2017 | $ | 25,347 | ||
| For the year ending December 31, 2018 | $ | 24,440 | ||
| For the year ending December 31, 2019 | $ | 19,853 | ||
| For the year ending December 31, 2020 | $ | 17,947 |
| 89 |
WASTE CONNECTIONS, INC.
NOTES TO CONSOLIDATED FINANCIAL STATEMENTS
(DOLLAR AMOUNTS IN THOUSANDS, EXCEPT PER SHARE, PER TON AND PER GALLON AMOUNTS)
| 5. | PROPERTY AND EQUIPMENT, NET |
Property and equipment, net consists of the following:
| December 31, | ||||||||
| 2015 | 2014 | |||||||
| Landfill site costs | $ | 2,379,535 | $ | 2,209,749 | ||||
| Rolling stock | 754,662 | 669,133 | ||||||
| Land, buildings and improvements | 433,230 | 403,472 | ||||||
| Containers | 323,953 | 289,626 | ||||||
| Machinery and equipment | 377,488 | 335,376 | ||||||
| Construction in progress | 9,861 | 19,815 | ||||||
| 4,278,729 | 3,927,171 | |||||||
| Less accumulated depreciation and depletion | (1,540,441 | ) | (1,332,966 | ) | ||||
| $ | 2,738,288 | $ | 2,594,205 | |||||
The Company’s landfill depletion expense, recorded in Depreciation in the Consolidated Statements of Net Income (Loss), for the years ended December 31, 2015, 2014 and 2013, was $82,369, $84,308 and $80,227, respectively.
| 6. | ACCRUED LIABILITIES |
Accrued liabilities consist of the following:
| December 31, | ||||||||
| 2015 | 2014 | |||||||
| Insurance claims | $ | 44,934 | $ | 44,849 | ||||
| Payroll and payroll-related | 41,332 | 40,376 | ||||||
| Interest payable | 12,974 | 9,319 | ||||||
| Unrealized cash flow hedge losses | 11,124 | 6,023 | ||||||
| Cell processing reserve - current portion | 5,566 | 6,136 | ||||||
| Environmental remediation reserve - current portion | 2,328 | 3,023 | ||||||
| Other | 17,760 | 11,221 | ||||||
| $ | 136,018 | $ | 120,947 | |||||
| 90 |
WASTE CONNECTIONS, INC.
NOTES TO CONSOLIDATED FINANCIAL STATEMENTS
(DOLLAR AMOUNTS IN THOUSANDS, EXCEPT PER SHARE, PER TON AND PER GALLON AMOUNTS)
| 7. | LONG-TERM DEBT |
Long-term debt consists of the following:
| December 31, | ||||||||
| 2015 | 2014 | |||||||
| Revolver under credit agreement | $ | 390,000 | $ | 680,000 | ||||
| Term loan under credit agreement | 800,000 | 660,000 | ||||||
| 2015 Notes | - | 175,000 | ||||||
| 2016 Notes | 100,000 | 100,000 | ||||||
| 2018 Notes | 50,000 | 50,000 | ||||||
| 2019 Notes | 175,000 | 175,000 | ||||||
| 2021 Notes | 100,000 | 100,000 | ||||||
| 2022 Notes | 125,000 | - | ||||||
| 2025 Notes | 375,000 | - | ||||||
| Tax-exempt bonds | 31,430 | 31,430 | ||||||
| Notes payable to sellers and other third parties, bearing interest at 3.0% to 10.9%, principal and interest payments due periodically with due dates ranging from 2016 to 2036 | 10,855 | 8,135 | ||||||
| 2,157,285 | 1,979,565 | |||||||
| Less – current portion | (2,127 | ) | (3,649 | ) | ||||
| Less – debt issuance costs | (8,031 | ) | (4,764 | ) | ||||
| $ | 2,147,127 | $ | 1,971,152 | |||||
Revolving Credit and Term Loan Agreement
The Company has a revolving credit and term loan agreement (the “credit agreement”) with Bank of America, N.A., as Administrative Agent, and the other lenders from time to time party thereto (the “Lenders”). Pursuant to the credit agreement, the Lenders have committed to provide revolving advances up to an aggregate principal amount of $1,200,000 at any one time outstanding (the “revolver”). The Lenders have also provided a term loan in an aggregate principal amount of $800,000 (the “term loan”). The Company has the option to request increases in the aggregate commitments for revolving advances and one or more additional term loans, provided that the aggregate principal amount of commitments and term loans never exceeds $2,300,000. For any such increase, the Company may ask one or more Lenders to increase their existing commitments or provide additional term loans and/or invite additional eligible lenders to become Lenders under the credit agreement. As part of the aggregate commitments under the facility, the credit agreement provides for letters of credit to be issued at the request of the Company in an aggregate amount not to exceed $250,000 and for swing line loans to be issued at the request of the Company in an aggregate amount not to exceed the lesser of $35,000 and the aggregate commitments. As of December 31, 2015, $800,000 under the term loan and $390,000 under the revolver were outstanding under the credit agreement, exclusive of outstanding standby letters of credit of $78,373. As of December 31, 2014, $660,000 under the term loan and $680,000 under the revolver were outstanding under the credit agreement, exclusive of outstanding standby letters of credit of $73,031. The Company has $4,136 of debt issuance costs related to the credit agreement recorded in Other assets, net in the Consolidated Balance Sheets at December 31, 2015, which are being amortized through the maturity date, or January 2020.
Interest accrues on advances on the revolver, at the Company’s option, at a LIBOR rate plus the applicable LIBOR margin (for a total rate of 1.44% and 1.54% at December 31, 2015 and 2014, respectively) on LIBOR loans or a base rate plus an applicable margin (for a total rate of 3.70% and 3.63% at December 31, 2015 and 2014, respectively) on base rate and swing line loans for each interest period. The issuing fees for all letters of credit are also based on an applicable margin. The applicable margin used in connection with interest rates and fees is based on the Company’s consolidated leverage ratio. The applicable margin for LIBOR rate loans and letter of credit fees was 1.20% and 1.375% at December 31, 2015 and 2014, respectively, and the applicable margin for base rate loans and swing line loans was 0.50% and 0.50% at December 31, 2015 and 2014, respectively. As of December 31, 2015, $385,000 of the borrowings outstanding under the revolver were in LIBOR loans and $5,000 of the borrowings outstanding under the revolver were in swing line loans. As of December 31, 2014, $677,000 of the borrowings outstanding under the revolver were in LIBOR loans and $3,000 of the borrowings outstanding under the revolver were in swing line loans.
| 91 |
WASTE CONNECTIONS, INC.
NOTES TO CONSOLIDATED FINANCIAL STATEMENTS
(DOLLAR AMOUNTS IN THOUSANDS, EXCEPT PER SHARE, PER TON AND PER GALLON AMOUNTS)
Outstanding amounts on the term loan could be either base rate loans or LIBOR loans. At December 31, 2015 and 2014, all amounts outstanding under the term loan were in LIBOR loans which bear interest at the LIBOR rate plus the applicable LIBOR margin (for a total rate of 1.44% and 1.66% at December 31, 2015 and 2014, respectively). The applicable margin is based on the Company’s consolidated leverage ratio. The applicable margin for LIBOR rate loans was 1.20% and 1.375% at December 31, 2015 and 2014, respectively.
The Company will also pay a fee based on its consolidated leverage ratio on the actual daily unused amount of the aggregate revolving commitments (0.15% and 0.20% as of December 31, 2015 and 2014, respectively).
The borrowings under the credit agreement are not collateralized. The credit agreement contains representations, warranties, covenants and events of default, including a change of control event of default and limitations on incurrence of indebtedness and liens, limitations on new lines of business, mergers, transactions with affiliates and restrictive agreements. During the continuance of an event of default, the Lenders may take a number of actions, including declaring the entire amount then outstanding under the credit agreement due and payable. The credit agreement contains cross-defaults if the Company defaults on the master note purchase agreement or certain other debt. The credit agreement also includes covenants limiting, as of the last day of each fiscal quarter, (a) the ratio of the consolidated funded debt as of such date to the Consolidated EBITDA (as defined in the credit agreement), measured for the preceding 12 months, to not more than 3.50x (or 3.75x during material acquisition periods, subject to certain limitations) (“leverage ratio”) and (b) the ratio of Consolidated EBIT (as defined in the credit agreement) to consolidated interest expense, in each case, measured for the preceding 12 months, to not less than 2.75x (“interest coverage ratio”). As of December 31, 2015 and 2014, the Company’s leverage ratio was 2.88x and 2.67x, respectively. As of December 31, 2015 and 2014, the Company’s interest coverage ratio was 7.88x and 7.94x, respectively.
Master Note Purchase Agreement
Senior Notes due 2015
On July 15, 2008, the Company entered into a master note purchase agreement with certain accredited institutional investors pursuant to which the Company issued and sold to the investors at a closing on October 1, 2008, $175,000 of senior uncollateralized notes due October 1, 2015 in a private placement. The Company redeemed the 2015 Notes on October 1, 2015 using borrowings under its credit agreement.
Senior Notes due 2019
On October 26, 2009, the Company entered into a first supplement to the master note purchase agreement with certain accredited institutional investors pursuant to which the Company issued and sold to the investors on that date $175,000 of senior uncollateralized notes due November 1, 2019 in a private placement. The 2019 Notes bear interest at the fixed rate of 5.25% per annum with interest payable in arrears semi-annually on May 1 and November 1 beginning on May 1, 2010, and with principal payable at the maturity of the 2019 Notes on November 1, 2019. The Company is amortizing the $152 debt issuance costs over a 10-year term through the maturity date, or November 1, 2019.
Senior Notes due 2016, 2018 and 2021
On April 1, 2011, the Company entered into a second supplement to the master note purchase agreement with certain accredited institutional investors, pursuant to which the Company issued and sold to the investors on that date $250,000 of senior uncollateralized notes at fixed interest rates with interest payable in arrears semi-annually on October 1 and April 1 beginning on October 1, 2011 in a private placement. Of these notes, $100,000 will mature on April 1, 2016 with an annual interest rate of 3.30% (the “2016 Notes”), $50,000 will mature on April 1, 2018 with an annual interest rate of 4.00% (the “2018 Notes”), and $100,000 will mature on April 1, 2021 with an annual interest rate of 4.64% (the “2021 Notes”). The Company has the intent and ability to redeem the 2016 Notes on April 1, 2016 using borrowings under its credit agreement. The principal of each of the 2016 Notes, 2018 Notes and 2021 Notes is payable at the maturity of each respective note. The Company is amortizing the $1,489 debt issuance costs through the maturity dates of the respective notes.
| 92 |
WASTE CONNECTIONS, INC.
NOTES TO CONSOLIDATED FINANCIAL STATEMENTS
(DOLLAR AMOUNTS IN THOUSANDS, EXCEPT PER SHARE, PER TON AND PER GALLON AMOUNTS)
Senior Notes due 2022 and 2025
On June 11, 2015, the Company entered into a third supplement to the master note purchase agreement with certain accredited institutional investors, pursuant to which, on August 20, 2015, the Company issued and sold to the investors in a private placement $500,000 of senior uncollateralized notes at fixed interest rates with interest payable in arrears semi-annually on February 20 and August 20 beginning on February 20, 2016. Of these notes, $125,000 will mature on August 20, 2022 with an annual interest rate of 3.09% (the “2022 Notes”) and $375,000 will mature on August 20, 2025 with an annual interest rate of 3.41% (the “2025 Notes”). The principal of each of the 2022 Notes and 2025 Notes is payable at the maturity of each respective note. The Company is amortizing the $3,746 debt issuance costs through the maturity dates of the respective notes.
The 2016 Notes, 2018 Notes, 2019 Notes, 2021 Notes, 2022 Notes and 2025 Notes (collectively, the “Senior Notes”) are uncollateralized obligations and rank equally in right of payment with each of the Senior Notes and the obligations under the Company’s credit agreement. The Senior Notes are subject to representations, warranties, covenants and events of default. The master note purchase agreement contains cross-defaults if the Company defaults on the credit agreement or certain other debt. The master note purchase agreement requires that the Company maintain specified quarterly leverage and interest coverage ratios. The required leverage ratio cannot exceed 3.75x total debt to EBITDA. The required interest coverage ratio must be at least 2.75x total interest expense to EBIT. As of December 31, 2015 and 2014, the Company’s leverage ratio was 2.88x and 2.67x, respectively. As of December 31, 2015 and 2014, the Company’s interest coverage ratio was 7.88x and 7.94x, respectively.
Upon the occurrence of an event of default, payment of the Senior Notes may be accelerated by the holders of the respective notes. The Senior Notes may also be prepaid at any time in whole or from time to time in any part (not less than 5% of the then-outstanding principal amount) by the Company at par plus a make-whole amount determined in respect of the remaining scheduled interest payments on the Senior Notes, using a discount rate of the then current market standard for United States treasury bills plus 0.50%. In addition, the Company will be required to offer to prepay the Senior Notes upon certain changes in control.
The Company may issue additional series of senior uncollateralized notes, including floating rate notes, pursuant to the terms and conditions of the master note purchase agreement, as amended, provided that the purchasers of the Senior Notes shall not have any obligation to purchase any additional notes issued pursuant to the master note purchase agreement and the aggregate principal amount of the outstanding notes and any additional notes issued pursuant to the master note purchase agreement shall not exceed $1,250,000.
Tax-Exempt Bonds
The Company’s tax-exempt bond financings are as follows:
| Type of | Interest Rate on Bond at December 31, | Maturity Date of | Outstanding Balance at December 31, | Backed by Letter of Credit | ||||||||||||||||
| Name of Bond | Interest Rate | 2015 | Bond | 2015 | 2014 | (Amount) | ||||||||||||||
| West Valley Bond | Variable | 0.05 | % | August 1, 2018 | $ | 15,500 | $ | 15,500 | $ | 15,678 | ||||||||||
| LeMay Washington Bond | Variable | 0.05 | April 1, 2033 | 15,930 | 15,930 | 16,126 | ||||||||||||||
| $ | 31,430 | $ | 31,430 | $ | 31,804 | |||||||||||||||
The variable-rate bonds are all remarketed weekly by a remarketing agent to effectively maintain a variable yield. If the remarketing agent is unable to remarket the bonds, then the remarketing agent can put the bonds to the Company. The Company obtained standby letters of credit, issued under its credit agreement, to guarantee repayment of the bonds in this event. The Company classified these borrowings as long-term at December 31, 2015, because the borrowings were supported by standby letters of credit issued under the Company’s credit agreement.
| 93 |
WASTE CONNECTIONS, INC.
NOTES TO CONSOLIDATED FINANCIAL STATEMENTS
(DOLLAR AMOUNTS IN THOUSANDS, EXCEPT PER SHARE, PER TON AND PER GALLON AMOUNTS)
As of December 31, 2015, aggregate contractual future principal payments by calendar year on long-term debt are due as follows:
| 2016 * | $ | 2,127 | ||
| 2017 | 1,069 | |||
| 2018 | 66,442 | |||
| 2019 | 175,955 | |||
| 2020 | 1,290,460 | |||
| Thereafter | 621,232 | |||
| $ | 2,157,285 |
* The Company has recorded the 2016 Notes in the 2020 category in the table above as the Company has the intent and ability to redeem the 2016 Notes on April 1, 2016 using borrowings under its credit agreement.
| 8. | FAIR VALUE OF FINANCIAL INSTRUMENTS |
The Company uses a three-tier fair value hierarchy to classify and disclose all assets and liabilities measured at fair value on a recurring basis, as well as assets and liabilities measured at fair value on a non-recurring basis, in periods subsequent to their initial measurement. These tiers include: Level 1, defined as quoted market prices in active markets for identical assets or liabilities; Level 2, defined as inputs other than Level 1 that are observable, either directly or indirectly, such as quoted prices for similar assets or liabilities, quoted prices in markets that are not active, model-based valuation techniques for which all significant assumptions are observable in the market, or other inputs that are observable or can be corroborated by observable market data for substantially the full term of the assets or liabilities; and Level 3, defined as unobservable inputs that are not corroborated by market data.
The Company’s financial assets and liabilities recorded at fair value on a recurring basis include derivative instruments and restricted assets. The Company’s derivative instruments are pay-fixed, receive-variable interest rate swaps and pay-fixed, receive-variable diesel fuel hedges. The Company’s interest rate swaps are recorded at their estimated fair values based on quotes received from financial institutions that trade these contracts. The Company verifies the reasonableness of these quotes using similar quotes from another financial institution as of each date for which financial statements are prepared. The Company uses a discounted cash flow (“DCF”) model to determine the estimated fair value of the diesel fuel hedges. The assumptions used in preparing the DCF model include: (i) estimates for the forward DOE index curve; and (ii) the discount rate based on risk-free interest rates over the term of the hedge contracts. The DOE index curve used in the DCF model was obtained from financial institutions that trade these contracts and ranged from $2.21 to $2.64 at December 31, 2015 and from $2.96 to $3.41 at December 31, 2014. The weighted average DOE index curve used in the DCF model was $2.43 and $3.04 at December 31, 2015 and 2014, respectively. Significant increases (decreases) in the forward DOE index curve would result in a significantly higher (lower) fair value measurement. For the Company’s interest rate swaps and fuel hedges, the Company also considers the Company’s creditworthiness in its determination of the fair value measurement of these instruments in a net liability position and the banks’ creditworthiness in its determination of the fair value measurement of these instruments in a net asset position. The Company’s restricted assets are valued at quoted market prices in active markets for similar assets, which the Company receives from the financial institutions that hold such investments on its behalf. The Company’s restricted assets measured at fair value are invested primarily in U.S. government and agency securities.
| 94 |
WASTE CONNECTIONS, INC.
NOTES TO CONSOLIDATED FINANCIAL STATEMENTS
(DOLLAR AMOUNTS IN THOUSANDS, EXCEPT PER SHARE, PER TON AND PER GALLON AMOUNTS)
The Company’s assets and liabilities measured at fair value on a recurring basis at December 31, 2015 and 2014, were as follows:
| Fair Value Measurement at December 31, 2015 Using | ||||||||||||||||
| Total | Quoted Prices in Active Markets for Identical Assets (Level 1) | Significant Other Observable Inputs (Level 2) | Significant Unobservable Inputs (Level 3) | |||||||||||||
| Interest rate swap derivative instruments – net liability position | $ | (9,745 | ) | $ | - | $ | (9,745 | ) | $ | - | ||||||
| Fuel hedge derivative instruments –net liability position | $ | (9,900 | ) | $ | - | $ | - | $ | (9,900 | ) | ||||||
| Restricted assets | $ | 46,148 | $ | - | $ | 46,148 | $ | - | ||||||||
| Contingent consideration | $ | (49,394 | ) | $ | - | $ | - | $ | (49,394 | ) | ||||||
| Fair Value Measurement at December 31, 2014 Using | ||||||||||||||||
| Total | Quoted Prices in Active Markets for Identical Assets (Level 1) | Significant Other Observable Inputs (Level 2) | Significant Unobservable Inputs (Level 3) | |||||||||||||
| Interest rate swap derivative instruments – net liability position | $ | (7,094 | ) | $ | - | $ | (7,094 | ) | $ | - | ||||||
| Fuel hedge derivative instruments – net asset position | $ | (1,979 | ) | $ | - | $ | - | $ | (1,979 | ) | ||||||
| Restricted assets | $ | 40,870 | $ | - | $ | 40,870 | $ | - | ||||||||
| Contingent consideration | $ | (70,165 | ) | $ | - | $ | - | $ | (70,165 | ) | ||||||
The following table summarizes the changes in the fair value for Level 3 derivatives for the years ended December 31, 2015 and 2014:
| Years Ended December 31, | ||||||||
| 2015 | 2014 | |||||||
| Beginning balance | $ | (1,979 | ) | $ | 2,199 | |||
| Realized losses (gains) included in earnings | 3,217 | (823 | ) | |||||
| Unrealized losses included in AOCL | (11,138 | ) | (3,355 | ) | ||||
| Ending balance | $ | (9,900 | ) | $ | (1,979 | ) | ||
| 95 |
WASTE CONNECTIONS, INC.
NOTES TO CONSOLIDATED FINANCIAL STATEMENTS
(DOLLAR AMOUNTS IN THOUSANDS, EXCEPT PER SHARE, PER TON AND PER GALLON AMOUNTS)
The following table summarizes the changes in the fair value for Level 3 liabilities related to contingent consideration for the years ended December 31, 2015 and 2014:
| Years Ended December 31, | ||||||||
| 2015 | 2014 | |||||||
| Beginning balance | $ | 70,165 | $ | 55,550 | ||||
| Contingent consideration recorded at acquisition date | 815 | 42,538 | ||||||
| Payment of contingent consideration recorded at acquisition date | (2,190 | ) | (24,847 | ) | ||||
| Payment of contingent consideration recorded in earnings | - | (1,074 | ) | |||||
| Adjustments to contingent consideration | (22,180 | ) | (3,450 | ) | ||||
| Interest accretion expense | 2,784 | 1,448 | ||||||
| Ending balance | $ | 49,394 | $ | 70,165 | ||||
See Note 1 – “Goodwill and Indefinite-Lived Intangible Assets” regarding non-recurring fair value measurements.
| 9. | OFFICE RELOCATIONS |
In December 2011, the Company commenced a relocation of its corporate headquarters from Folsom, California to The Woodlands, Texas, which was substantially completed in 2012. Costs related to personnel and office relocation expenses are recorded in Selling, general and administrative expenses in the Consolidated Statements of Net Income (Loss). During the year ended December 31, 2013, the Company incurred losses on the cessation of use of prior office leases of $9,160 for its former corporate headquarters in Folsom, California, and $742 for its E&P segment’s former regional offices in Houston, Texas. In October 2013, the Company remitted a payment to terminate the remaining lease obligation of its former headquarters in Folsom, California. These costs are recorded in Loss on prior office leases in the Consolidated Statements of Net Income (Loss).
| 10. | COMMITMENTS AND CONTINGENCIES |
COMMITMENTS
Leases
The Company leases certain facilities and certain equipment under non-cancelable operating leases for periods ranging from one to 45 years, with renewal options for certain leases. The Company’s total rent expense under operating leases during the years ended December 31, 2015, 2014 and 2013, was $26,858, $27,466 and $30,893, respectively.
As of December 31, 2015, future minimum lease payments, by calendar year, are as follows:
| 2016 | $ | 16,416 | ||
| 2017 | 14,100 | |||
| 2018 | 10,967 | |||
| 2019 | 9,080 | |||
| 2020 | 7,903 | |||
| Thereafter | 50,478 | |||
| $ | 108,944 |
Financial Surety Bonds
The Company uses financial surety bonds for a variety of corporate guarantees. The two largest uses of financial surety bonds are for municipal contract performance guarantees and asset closure and retirement requirements under certain environmental regulations. Environmental regulations require demonstrated financial assurance to meet final capping, closure and post-closure requirements for landfills. In addition to surety bonds, these requirements may also be met through alternative financial assurance instruments, including insurance, letters of credit and restricted asset deposits.
| 96 |
WASTE CONNECTIONS, INC.
NOTES TO CONSOLIDATED FINANCIAL STATEMENTS
(DOLLAR AMOUNTS IN THOUSANDS, EXCEPT PER SHARE, PER TON AND PER GALLON AMOUNTS)
At December 31, 2015 and 2014, the Company had provided customers and various regulatory authorities with surety bonds in the aggregate amount of approximately $353,828 and $342,591, respectively, to secure its asset closure and retirement requirements and $121,687 and $94,385, respectively, to secure performance under collection contracts and landfill operating agreements.
The Company owns a 9.9% interest in a company that, among other activities, issues financial surety bonds to secure landfill final capping, closure and post-closure obligations for companies operating in the solid waste industry. The Company accounts for this investment under the cost method of accounting. There have been no identified events or changes in circumstances that may have a significant adverse effect on the carrying value of the investment. This investee company and the parent company of the investee have written financial surety bonds for the Company, of which $185,753 and $179,204 were outstanding as of December 31, 2015 and 2014, respectively. The Company’s reimbursement obligations under these bonds are secured by a pledge of its stock in the investee company.
Unconditional Purchase Obligations
At December 31, 2015, the Company’s unconditional purchase obligations consist of multiple fixed-price fuel purchase contracts under which it has 19.1 million gallons remaining to be purchased for a total of $50,198. These fuel purchase contracts expire on or before December 31, 2017.
As of December 31, 2015, future minimum purchase commitments, by calendar year, are as follows:
| 2016 | $ | 33,242 | ||
| 2017 | 16,956 | |||
| $ | 50,198 |
CONTINGENCIES
Environmental Risks
The Company expenses costs incurred to investigate and remediate environmental issues unless they extend the economic useful lives of the related assets. The Company records liabilities when it is probable that an obligation has been incurred and the amounts can be reasonably estimated. The remediation reserves cover anticipated costs, including remediation of environmental damage that waste facilities may have caused to neighboring landowners or residents as a result of contamination of soil, groundwater or surface water, including damage resulting from conditions existing prior to the Company’s acquisition of such facilities. The Company’s estimates are based primarily on investigations and remediation plans established by independent consultants, regulatory agencies and potentially responsible third parties. The Company does not discount remediation obligations. At December 31, 2015 and 2014, the current portion of remediation reserves was $2,328 and $3,023, respectively, which is included in Accrued liabilities in the Consolidated Balance Sheets. At December 31, 2015 and 2014, the long-term portion of remediation reserves was $12,049 and $725, respectively, which is included in Other long-term liabilities in the Consolidated Balance Sheets. The 2015 long-term remediation reserve amount includes $11,301 of remediation reserves which the Company established after assuming certain remedial liabilities in the Rock River acquisition during the year ending December 31, 2015. Any substantial increase in the liabilities for remediation of environmental damage incurred by the Company could have a material adverse effect on the Company’s financial condition, results of operations or cash flows.
Legal Proceedings
In the normal course of its business and as a result of the extensive governmental regulation of the solid waste and E&P waste industries, the Company is subject to various judicial and administrative proceedings involving federal, state or local agencies. In these proceedings, an agency may seek to impose fines on the Company or to revoke or deny renewal of an authorization held by the Company, including an operating permit. From time to time, the Company may also be subject to actions brought by special interest or other groups, adjacent landowners or residents in connection with the permitting and licensing of landfills, transfer stations, and E&P waste treatment, recovery and disposal operations, or alleging environmental damage or violations of the permits and licenses pursuant to which the Company operates.
| 97 |
WASTE CONNECTIONS, INC.
NOTES TO CONSOLIDATED FINANCIAL STATEMENTS
(DOLLAR AMOUNTS IN THOUSANDS, EXCEPT PER SHARE, PER TON AND PER GALLON AMOUNTS)
In addition, the Company is a party to various claims and suits pending for alleged damages to persons and property, alleged violations of certain laws and alleged liabilities arising out of matters occurring during the normal operation of the waste management business. Except as noted in the matters described below, as of December 31, 2015, there is no current proceeding or litigation involving the Company or its property that the Company believes could have a material adverse impact on its business, financial condition, results of operations or cash flows.
Madera County, California Materials Recovery Facility Contract Litigation
The Company’s subsidiary, Madera Disposal Systems, Inc. (“MDSI”) was named in a complaint captioned County of Madera vs. Madera Disposal Systems, Inc., et al, filed in Madera County Superior Court (Case No. MCV 059402) on March 5, 2012, and subsequently transferred to Fresno County Superior Court. Madera County (the “County”) alleged in the complaint that from 2007 through 2010, MDSI breached a contract with the County for the operation of a materials recovery facility by withholding profits from facility operations in excess of those authorized by the contract. The County further alleged that the breach gave the County the unilateral right to terminate all of its contracts with MDSI, including contracts for (1) the collection of residential and commercial waste in the unincorporated parts of the County, (2) operation of the materials recovery facility, (3) operation of the North Fork Transfer Station and (4) operation of the Fairmead Landfill. MDSI answered the complaint and asserted a claim against the County for wrongful termination of the contracts. On October 31, 2012, MDSI ceased providing services and vacated the County premises. In 2015 the County amended its complaint to add a claim for breach of the covenant of good faith and fair dealing and to amend its damage claim to cover the period from January 1, 2008 through November 1, 2012. The County sought monetary damages of $2,962 from MDSI, plus pre-judgment interest at 10% per annum.
The case was settled through mediation in January 2016. The settlement resolves all claims between the parties amicably without any admission of liability, includes full mutual releases of claims between the parties and deems the contracts between the MDSI and the County to have terminated by mutual agreement effective November 1, 2012. The Company also agreed to make an immaterial payment to the County that the Company estimates to be less than the cost of trial.
Lower Duwamish Waterway Superfund Site Allocation Process
The Company’s subsidiary, Northwest Container Services, Inc. (“NWCS”), has been named by the U.S. Environmental Protection Agency, Region 10 (the “EPA”), along with more than 100 others, as a potentially responsible party (“PRP”) under the Comprehensive Environmental Response, Compensation and Liability Act (also known as CERCLA or the “Superfund” law) with respect to the Lower Duwamish Waterway Superfund Site (the “LDW Site”). Listed on the National Priorities List in 2001, the LDW Site is a five-mile stretch of the Duwamish River flowing into Elliott Bay in Seattle, Washington. A group of PRPs known as the Lower Duwamish Working Group or the “LDWG” and consisting of the City of Seattle, King County, the Port of Seattle, and Boeing Company conducted a Remedial Investigation/Feasibility Study for the LDW Site. On December 2, 2014, the EPA issued its Record of Decision (“ROD”) describing the selected clean-up remedy, and therein estimated that clean-up costs (in present value dollars as of November 2014) would total about $342,000. However, it is possible that additional costs could be incurred based upon various factors. The EPA estimates that it will take seven years to implement the clean-up. The ROD also requires ten years of monitoring following the clean-up, and provides that if clean-up goals have not been met by the end of this period, then additional clean-up activities, at additional cost, may be required at that time. Implementation of the clean-up will not begin until after the ongoing Early Action Area (“EAA”) clean-ups have been completed. While three of the EAA clean-ups have been completed to date, some work remains to be done on three other EAAs. The EPA estimates that one of these three will be completed in mid-2016; for the other two, work remains to be done and the EPA has not estimated the dates of completion. Implementation of the clean-up also must await additional baseline sampling throughout the LDW Site and the preparation of a remedial design for performing the clean-up.
On September 30, 2015, the EPA formally initiated negotiations with the LDWG to amend the LDWG’s existing Administrative Order on Consent with the EPA (the “LDWG AOC”) a third time to require the LDWG to perform the additional baseline sediment sampling and certain technical studies needed to prepare the actual remedial design. The EPA calls this work “Phase 1 of the Remedial Design,” and the EPA’s proposed statement of work for it indicates that it will take at least two years to complete, or into early 2018. The EPA and the LDWG are reportedly negotiating this third amendment to the LDWG AOC. The EPA also has indicated that once the work under the third amendment to the LDWG AOC is complete, it plans to negotiate with all of the PRPs a “global settlement” to cover performance of the remainder of the remedial design not covered by the proposed amendment to the LDWG AOC and the clean-up itself. There is no assurance, however, that a global settlement will be reached.
| 98 |
WASTE CONNECTIONS, INC.
NOTES TO CONSOLIDATED FINANCIAL STATEMENTS
(DOLLAR AMOUNTS IN THOUSANDS, EXCEPT PER SHARE, PER TON AND PER GALLON AMOUNTS)
In August 2014, NWCS entered into an Alternative Dispute Resolution Memorandum of Agreement with several dozen other PRPs and a neutral allocator to conduct a confidential and non-binding allocation of certain past response costs allegedly incurred at the LDW Site as well as the anticipated future response costs associated with the clean-up. The allocation process is designed to develop evidence relating to each PRP’s nexus, if any, to the LDW Site (whether or not that PRP is participating in the allocation process), for the allocator to hear arguments as to how each PRP’s nexus affects the allocation of response costs, and to determine each PRP’s share of the past and future response costs. The goal of the allocation process is to reach agreement on a division of responsibility between and amongst the PRPs so that the PRPs then will be in a position to negotiate a global settlement with the EPA. NWCS is defending itself vigorously in this confidential allocation process. At this point the Company is not able to determine the likelihood of the allocation process being completed as intended by the participating PRPs nor the likelihood of the parties then negotiating a global settlement with the EPA, and thus cannot determine the likelihood of any outcome in this matter.
Chiquita Canyon Landfill Expansion Complaint
The Company’s subsidiary, Chiquita Canyon, LLC (“CCL”), is in the process of seeking approval to expand the lateral footprint and vertical height of its Chiquita Canyon Landfill in California. In response to its published draft environmental impact report (“EIR”) regarding the proposed expansion, on June 8, 2015 two individuals and two organizations filed an administrative complaint with the California Environmental Protection Agency, the California Department of Resources Recycling and Recovery and the California Air Resources Board against the County of Los Angeles, alleging that the county has committed racial discrimination under California law through its permitting policies and practices. Among other things, the complaint alleges that the County of Los Angeles failed to provide equal opportunities for residents of all races to participate in the draft EIR process. The complaint seeks, among other things, a suspension of the draft EIR process, the institution of hearings regarding the draft EIR that follow specified procedures and the implementation of certain surveys, notices and other hearings. CCL is not a party to this complaint, although CCL may participate in any hearing on the complaint if the agencies elect to schedule such a hearing. At this point the Company is not able to determine the likelihood of any outcome in this matter, including whether it may result in a delay of the permitting process for the proposed expansion of CCL’s facility.
Collective Bargaining Agreements
Eleven of the Company’s collective bargaining agreements have expired or are set to expire in 2016. The Company does not expect any significant disruption in its overall business in 2016 as a result of labor negotiations, employee strikes or organizational efforts.
| 11. | STOCKHOLDERS' EQUITY |
Cash Dividend
The Company’s Board of Directors authorized the initiation of a quarterly cash dividend in October 2010 and has increased it on an annual basis. In October 2015, the Company announced that its Board of Directors increased its regular quarterly cash dividend by $0.015, from $0.13 to $0.145 per share. Cash dividends of $65,990, $58,906 and $51,213 were paid during the years ended December 31, 2015, 2014 and 2013, respectively.
Share Repurchase Program
The Company’s Board of Directors has authorized a common stock repurchase program for the repurchase of up to $1,200,000 of common stock through December 31, 2017. Under the program, stock repurchases may be made in the open market or in privately negotiated transactions from time to time at management's discretion. The timing and amounts of any repurchases will depend on many factors, including the Company's capital structure, the market price of the common stock and overall market conditions. As of December 31, 2015 and 2014, the Company had repurchased in aggregate 41,995,355 and 40,032,366 shares, respectively, of its common stock at an aggregate cost of $882,521 and $791,357, respectively. As of December 31, 2015, the remaining maximum dollar value of shares available for repurchase under the program was approximately $317,479. The Company’s policy related to repurchases of its common stock is to charge any excess of cost over par value entirely to additional paid-in capital.
| 99 |
WASTE CONNECTIONS, INC.
NOTES TO CONSOLIDATED FINANCIAL STATEMENTS
(DOLLAR AMOUNTS IN THOUSANDS, EXCEPT PER SHARE, PER TON AND PER GALLON AMOUNTS)
Common Stock
Of the 127,624,045 shares of common stock authorized but unissued as of December 31, 2015, the following shares were reserved for issuance:
| For outstanding restricted stock units and warrants | 1,761,177 | |||
| For future grants under the 2014 Incentive Award Plan | 2,488,023 | |||
| 4,249,200 |
Restricted Stock Units, Performance-Based Restricted Stock Units, Stock Options and Stock Purchase Warrants
In 2004, the Company’s Board of Directors adopted the 2004 Equity Incentive Plan, currently referred to as the Third Amended and Restated 2004 Equity Incentive Plan (the “2004 Plan”), which was last approved by the Company’s stockholders on May 7, 2010. A total of 7,162,500 shares of the Company’s common stock were reserved for future issuance under the 2004 Plan, all of which may have been used for grants of stock options, restricted stock, and/or restricted stock units (“RSUs”). Participation in the 2004 Plan was limited to employees, officers, directors and consultants. Options granted under the 2004 Plan were nonqualified stock options and had a term of no longer than five years from the date they were granted. Restricted stock, RSUs, and options granted under the 2004 Plan generally vest in installments pursuant to a vesting schedule set forth in each agreement. The Board of Directors authorized the granting of awards under the 2004 Plan, and determined the employees and consultants to whom such awards were to be granted, the number of shares subject to each award, and the exercise price, term, vesting schedule and other terms and conditions of each award. The exercise prices of the options granted under the 2004 Plan were not less than the fair market value of the Company’s common stock on the date of grant. Restricted stock awards granted under the 2004 Plan may or may not have required a cash payment from a participant to whom an award was made; RSU awards granted under the plan did not require any cash payment from the participant to whom an award was made. No further grants may be made under the 2004 Plan as of May 16, 2014 pursuant to the Company’s stockholder approval of the 2014 Incentive Award Plan on such date.
In 2014, the Company’s Board of Directors adopted the 2014 Incentive Award Plan (the “2014 Plan”), which was approved by the Company’s stockholders on May 16, 2014. A total of 3,250,000 shares of the Company’s common stock were reserved for future issuance under the 2014 Plan, all of which may be used for grants of nonqualified stock options (“options”), warrants, restricted stock, RSUs, dividend equivalents and stock payment awards. The 2014 Plan also authorizes the granting of performance awards payable in the form of the Company’s common stock or cash, including equity awards and incentive cash bonuses that may be intended to qualify as “performance-based compensation” under Section 162(m) of the Internal Revenue Code of 1986, as amended (“Section 162(m)”). Participation in the 2014 Plan is limited to employees and consultants of the Company and its subsidiaries and non-employee directors. The 2014 Plan is administered by the Company’s Board of Directors with respect to awards to non-employee directors and by its Compensation Committee with respect to other participants, each of which may delegate its duties and responsibilities to committees of the Company’s directors and/or officers, subject to certain limitations (collectively, the “administrator”). The administrator has the authority to select the persons to whom awards are to be made, to determine the number of shares subject to awards and to determine the terms and conditions of awards, including the number of shares subject to each award, the exercise price, term, vesting schedule and other terms and conditions of the award.
Options and warrants granted under the 2014 Plan have a term of no longer than ten years from the date they are granted. Options, warrants, restricted stock and RSUs granted under the 2014 Plan generally vest in installments pursuant to a vesting schedule set forth in each award agreement. The exercise prices of the options and warrants shall not be less than the fair market value of the Company’s common stock on the date of grant. Restricted stock awards under the 2014 Plan may or may not require a cash payment from a participant to whom an award is made; RSU awards under the plan do not require any cash payment from the participant to whom an award is made. The vesting of performance awards, including performance-based restricted stock units (“PSUs”), is dependent on one or more performance criteria determined by the administrator on a specific date or dates or over any period or periods determined by the administrator.
| 100 |
WASTE CONNECTIONS, INC.
NOTES TO CONSOLIDATED FINANCIAL STATEMENTS
(DOLLAR AMOUNTS IN THOUSANDS, EXCEPT PER SHARE, PER TON AND PER GALLON AMOUNTS)
Restricted Stock Units
A summary of the Company’s RSU activity is presented below:
| Years Ended December 31, | ||||||||||||
| 2015 | 2014 | 2013 | ||||||||||
| Restricted stock units granted | 332,782 | 504,255 | 574,017 | |||||||||
| Weighted average grant-date fair value of restricted stock units granted | $ | 45.13 | $ | 42.54 | $ | 34.06 | ||||||
| Total fair value of restricted stock units granted | $ | 15,019 | $ | 21,449 | $ | 19,550 | ||||||
| Restricted stock units becoming free of restrictions | 478,686 | 563,117 | 543,921 | |||||||||
| Weighted average restriction period (in years) | 3.9 | 3.9 | 3.9 | |||||||||
A summary of activity related to RSUs during the year ended December 31, 2015, is presented below:
| Unvested Shares | Weighted-Average Grant Date Fair Value Per Share | |||||||
| Outstanding at December 31, 2014 | 1,200,884 | $ | 36.06 | |||||
| Granted | 332,782 | 45.13 | ||||||
| Forfeited | (47,679 | ) | 40.24 | |||||
| Vested and Issued | (432,165 | ) | 34.44 | |||||
| Vested and Unissued | (46,521 | ) | 30.93 | |||||
| Outstanding at December 31, 2015 | 1,007,301 | 39.74 | ||||||
Recipients of the Company’s RSUs who participate in the Company’s Nonqualified Deferred Compensation Plan may have elected in years prior to 2015 to defer some or all of their RSUs as they vest until a specified date or dates they choose. At the end of the deferral periods, the Company issues to recipients who deferred their RSUs shares of the Company’s common stock underlying the deferred RSUs. At December 31, 2015, 2014 and 2013, the Company had 256,191, 223,752 and 163,995 vested deferred RSUs outstanding, respectively.
Performance-Based Restricted Stock Units
A summary of activity related to PSUs during the year ended December 31, 2015, is presented below:
| Unvested Shares | Weighted-Average Grant Date Fair Value Per Share | |||||||
| Outstanding at December 31, 2014 | 54,723 | $ | 42.33 | |||||
| Granted | 238,690 | 44.96 | ||||||
| Outstanding at December 31, 2015 | 293,413 | 44.47 | ||||||
During the year ended December 31, 2015, the Compensation Committee granted PSUs to the Company’s executive officers with three-year performance-based metrics that the Company must meet before those awards may be earned, and the performance period for those grants ends on December 31, 2017. During the same period, the Compensation Committee also granted PSUs to the Company’s executive officers and non-executive officers with a new one-year performance-based metric that the Company must meet before those awards may be earned, with the awards then subject to time-based vesting for the remaining three years of their four-year vesting period. During the year ended December 31, 2014, the Compensation Committee granted PSUs to the Company’s executive officers with three-year performance-based metrics that the Company must meet before those awards may be earned, and the performance period for those grants ends December 31, 2016. The Compensation Committee will determine the achievement of performance results and corresponding vesting of PSUs for each performance period. At the end of the performance period, the number of shares awarded can range from 0% to 150% of the original granted amount, depending on the performance against the pre-established targets. The Company has assumed that 50% of the original granted amount will be awarded at the end of the performance periods, based on the current performance against the pre-established targets.
| 101 |
WASTE CONNECTIONS, INC.
NOTES TO CONSOLIDATED FINANCIAL STATEMENTS
(DOLLAR AMOUNTS IN THOUSANDS, EXCEPT PER SHARE, PER TON AND PER GALLON AMOUNTS)
Stock Options
The Company’s remaining stock options outstanding under equity-based compensation plans that expired in 2012 were exercised during 2015. A summary of the Company’s stock option activity and related information under these plans during the year ended December 31, 2015, is presented below:
| Number of Shares (Options) | Weighted Average Exercise Price | |||||||
| Outstanding as of December 31, 2014 | 37,000 | $ | 15.45 | |||||
| Exercised | (37,000 | ) | 15.45 | |||||
| Outstanding as of December 31, 2015 | - | - | ||||||
The total intrinsic value of stock options exercised during the years ended December 31, 2015, 2014 and 2013, was $1,241, $7,458 and $5,729, respectively. As of December 31, 2014 and 2013, a total of 37,000 and 274,902 options to purchase common stock, respectively, were exercisable under all stock option plans.
Stock Purchase Warrants
The Company has outstanding stock purchase warrants issued under an incentive plan which expired in 2012 as well as outstanding stock purchase warrants issued under the 2014 Plan. Warrants to purchase the Company’s common stock were issued to certain consultants to the Company. Warrants issued were fully vested and exercisable at the date of grant. Warrants outstanding at December 31, 2015, expire between 2016 and 2020.
A summary of warrant activity during the year ended December 31, 2015, is presented below:
| Warrants | Weighted-Average Exercise Price | |||||||
| Outstanding at December 31, 2014 | 133,591 | $ | 37.92 | |||||
| Granted | 91,179 | 53.07 | ||||||
| Forfeited | (17,206 | ) | 31.20 | |||||
| Exercised | (9,781 | ) | 30.62 | |||||
| Outstanding at December 31, 2015 | 197,783 | 45.85 | ||||||
The following table summarizes information about warrants outstanding as of December 31, 2015 and 2014:
| Warrants | Fair Value of Warrants | Outstanding at December 31, | ||||||||||||||||||
| Grant Date | Issued | Exercise Price | Issued | 2015 | 2014 | |||||||||||||||
| Throughout 2010 | 51,627 | $20.64 to $27.41 | $ | 351 | - | 1,886 | ||||||||||||||
| Throughout 2011 | 9,324 | $27.53 to $33.14 | 79 | 6,226 | 9,324 | |||||||||||||||
| Throughout 2012 | 71,978 | $30.52 to $33.03 | 628 | 49,975 | 71,978 | |||||||||||||||
| Throughout 2014 | 50,403 | $45.62 to $49.06 | 276 | 50,403 | 50,403 | |||||||||||||||
| Throughout 2015 | 91,179 | $42.45 to $54.48 | 1,333 | 91,179 | - | |||||||||||||||
| 197,783 | 133,591 | |||||||||||||||||||
| 102 |
WASTE CONNECTIONS, INC.
NOTES TO CONSOLIDATED FINANCIAL STATEMENTS
(DOLLAR AMOUNTS IN THOUSANDS, EXCEPT PER SHARE, PER TON AND PER GALLON AMOUNTS)
| 12. | OTHER COMPREHENSIVE INCOME (LOSS) |
Other comprehensive income (loss) includes changes in the fair value of interest rate swaps and fuel hedges that qualify for hedge accounting. The components of other comprehensive income (loss) and related tax effects for the years ended December 31, 2015, 2014 and 2013, are as follows:
| Year Ended December 31, 2015 | ||||||||||||
| Gross | Tax effect | Net of tax | ||||||||||
| Interest rate swap amounts reclassified into interest expense | $ | 5,093 | $ | (1,938 | ) | $ | 3,155 | |||||
| Fuel hedge amounts reclassified into cost of operations | 3,217 | (1,224 | ) | 1,993 | ||||||||
| Changes in fair value of interest rate swaps | (7,746 | ) | 2,926 | (4,820 | ) | |||||||
| Changes in fair value of fuel hedges | (11,138 | ) | 4,232 | (6,906 | ) | |||||||
| $ | (10,574 | ) | $ | 3,996 | $ | (6,578 | ) | |||||
| Year Ended December 31, 2014 | ||||||||||||
| Gross | Tax effect | Net of tax | ||||||||||
| Interest rate swap amounts reclassified into interest expense | $ | 4,581 | $ | (1,757 | ) | $ | 2,824 | |||||
| Fuel hedge amounts reclassified into cost of operations | (823 | ) | 316 | (507 | ) | |||||||
| Changes in fair value of interest rate swaps | (6,448 | ) | 2,478 | (3,970 | ) | |||||||
| Changes in fair value of fuel hedges | (3,355 | ) | 1,284 | (2,071 | ) | |||||||
| $ | (6,045 | ) | $ | 2,321 | $ | (3,724 | ) | |||||
| Year Ended December 31, 2013 | ||||||||||||
| Gross | Tax effect | Net of tax | ||||||||||
| Interest rate swap amounts reclassified into interest expense | $ | 5,641 | $ | (2,158 | ) | $ | 3,483 | |||||
| Changes in fair value of interest rate swaps | 296 | (108 | ) | 188 | ||||||||
| Changes in fair value of fuel hedges | 1,012 | (387 | ) | 625 | ||||||||
| $ | 6,949 | $ | (2,653 | ) | $ | 4,296 | ||||||
A rollforward of the amounts included in AOCL, net of taxes, is as follows:
| Fuel Hedges | Interest Rate Swaps | Accumulated Other Comprehensive Loss | ||||||||||
| Balance at December 31, 2013 | $ | 1,357 | $ | (3,226 | ) | $ | (1,869 | ) | ||||
| Amounts reclassified into earnings | (507 | ) | 2,824 | 2,317 | ||||||||
| Changes in fair value | (2,071 | ) | (3,970 | ) | (6,041 | ) | ||||||
| Balance at December 31, 2014 | (1,221 | ) | (4,372 | ) | (5,593 | ) | ||||||
| Amounts reclassified into earnings | 1,993 | 3,155 | 5,148 | |||||||||
| Changes in fair value | (6,906 | ) | (4,820 | ) | (11,726 | ) | ||||||
| Balance at December 31, 2015 | $ | (6,134 | ) | $ | (6,037 | ) | $ | (12,171 | ) | |||
| 103 |
WASTE CONNECTIONS, INC.
NOTES TO CONSOLIDATED FINANCIAL STATEMENTS
(DOLLAR AMOUNTS IN THOUSANDS, EXCEPT PER SHARE, PER TON AND PER GALLON AMOUNTS)
| 13. | INCOME TAXES |
The provision (benefit) for income taxes for the years ended December 31, 2015, 2014 and 2013, consists of the following:
| Years Ended December 31, | ||||||||||||
| 2015 | 2014 | 2013 | ||||||||||
| Current: | ||||||||||||
| Federal | $ | 86,053 | $ | 103,332 | $ | 73,243 | ||||||
| State | 14,809 | 17,972 | 12,993 | |||||||||
| 100,862 | 121,304 | 86,236 | ||||||||||
| Deferred: | ||||||||||||
| Federal | (117,549 | ) | 27,646 | 35,797 | ||||||||
| State | (14,905 | ) | 3,385 | 2,883 | ||||||||
| (132,454 | ) | 31,031 | 38,680 | |||||||||
| Provision (benefit) for income taxes | $ | (31,592 | ) | $ | 152,335 | $ | 124,916 | |||||
The significant components of deferred income tax assets and liabilities as of December 31, 2015 and 2014 are as follows:
| 2015 | 2014 | |||||||
| Deferred income tax assets: | ||||||||
| Accounts receivable reserves | $ | 2,968 | $ | 3,519 | ||||
| Accrued expenses | 37,465 | 34,377 | ||||||
| Compensation | 16,924 | 15,549 | ||||||
| Interest rate and fuel hedges | 7,475 | 3,479 | ||||||
| Leases | 990 | 1,178 | ||||||
| State taxes | 4,218 | 5,480 | ||||||
| Contingent liabilities | 17,636 | 25,071 | ||||||
| Other | 1,472 | 527 | ||||||
| Gross deferred income tax assets | 89,148 | 89,180 | ||||||
| Less: Valuation allowance | - | - | ||||||
| Net deferred income tax assets | 89,148 | 89,180 | ||||||
| Deferred income tax liabilities: | ||||||||
| Goodwill and other intangibles | (158,093 | ) | (280,828 | ) | ||||
| Property and equipment | (288,953 | ) | (255,512 | ) | ||||
| Landfill closure/post-closure | (37,185 | ) | (34,277 | ) | ||||
| Prepaid expenses | (7,683 | ) | (7,690 | ) | ||||
| Total deferred income tax liabilities | (491,914 | ) | (578,307 | ) | ||||
| Net deferred income tax liability | $ | (402,766 | ) | $ | (489,127 | ) | ||
During the years ended December 31, 2015, 2014 and 2013, the Company reduced its taxes payable by $8,369, $11,090 and $8,781 respectively, as a result of the exercise of non-qualified stock options, the vesting of restricted stock units, and the disqualifying disposition of incentive stock options. The excess tax benefit associated with equity-based compensation of $2,069, $7,518 and $3,765 for the years ended December 31, 2015, 2014 and 2013, respectively, was recorded in additional paid-in capital.
| 104 |
WASTE CONNECTIONS, INC.
NOTES TO CONSOLIDATED FINANCIAL STATEMENTS
(DOLLAR AMOUNTS IN THOUSANDS, EXCEPT PER SHARE, PER TON AND PER GALLON AMOUNTS)
The differences between the Company’s income tax provision (benefit) as presented in the accompanying Consolidated Statements of Net Income (Loss) and income tax provision (benefit) computed at the federal statutory rate consist of the items shown in the following table as a percentage of pre-tax income:
| Years Ended December 31, | ||||||||||||
| 2015 | 2014 | 2013 | ||||||||||
| Income tax provision (benefit) at the statutory rate | (35.0 | )% | 35.0 | % | 35.0 | % | ||||||
| State taxes, net of federal benefit | (0.3 | ) | 3.8 | 3.7 | ||||||||
| Deferred income tax liability adjustments | (3.1 | ) | 0.3 | - | ||||||||
| Noncontrolling interests | (0.3 | ) | (0.1 | ) | - | |||||||
| Goodwill impairment | 12.3 | - | - | |||||||||
| Other | 1.4 | 0.5 | 0.2 | |||||||||
| (25.0 | )% | 39.5 | % | 38.9 | % | |||||||
The comparability of the Company’s income tax provision (benefit) for the reported periods has been affected by variations in its income (loss) before income taxes.
During the year ended December 31, 2015, the Deferred income tax liability adjustments, due primarily to changes in the geographical apportionment of the Company’s state income taxes associated with the impairment of a portion of the goodwill, indefinite-lived intangible assets and property and equipment within its E&P segment, resulted in an increase to tax benefit of $3,869. Additionally, a portion of the aforementioned goodwill impairment within the Company’s E&P segment that was not deductible for tax purposes, resulted in a decrease to federal tax benefit of $15,546. During the year ended December 31, 2014, the Deferred income tax liability adjustments, due primarily to the enactment of New York State’s 2014-2015 Budget Act, resulted in an increase to tax expense of $1,220.
At December 31, 2015 and 2014, the Company did not have any significant federal or state net operating loss carryforwards.
The Company and its subsidiaries are subject to U.S. federal income tax as well as to income tax of multiple state jurisdictions. The Company has concluded all U.S. federal income tax matters for years through 2011. All material state and local income tax matters have been concluded for years through 2010. The Company is currently under U.S. federal examination for tax year 2013. The Company does not anticipate a significant assessment; however, such an assessment could have a material adverse effect on the Company’s financial position, results of operation or cash flows.
The Company did not have any unrecognized tax benefits recorded at December 31, 2015, 2014 or 2013. The Company does not anticipate the total amount of unrecognized tax benefits will significantly change by December 31, 2016. The Company recognizes interest and/or penalties related to income tax matters in income tax expense.
| 14. | SEGMENT REPORTING |
The Company’s revenues are generated from the collection, transfer, recycling and disposal of non-hazardous solid waste and the treatment, recovery and disposal of non-hazardous E&P waste. No single contract or customer accounted for more than 10% of the Company’s total revenues at the consolidated or reportable segment level during the periods presented.
The Company manages its operations through three geographic operating segments (Western, Central and Eastern), and its E&P segment, which includes the majority of the Company’s E&P waste treatment and disposal operations. The Company’s three geographic operating segments and its E&P segment comprise the Company’s reportable segments. Each operating segment is responsible for managing several vertically integrated operations, which are comprised of districts. The Company’s Western segment is comprised of operating locations in Alaska, California, Idaho, Montana, Nevada, Oregon, Washington and western Wyoming; the Company’s Central segment is comprised of operating locations in Arizona, Colorado, Kansas, Louisiana, Minnesota, Nebraska, New Mexico, Oklahoma, South Dakota, Texas, Utah and eastern Wyoming; and the Company’s Eastern segment is comprised of operating locations in Alabama, Illinois, Iowa, Kentucky, Massachusetts, Michigan, Mississippi, New York, North Carolina, South Carolina and Tennessee. The E&P segment is comprised of the Company’s E&P operations in Arkansas, Louisiana, New Mexico, North Dakota, Oklahoma, Texas, Wyoming and along the Gulf of Mexico.
| 105 |
WASTE CONNECTIONS, INC.
NOTES TO CONSOLIDATED FINANCIAL STATEMENTS
(DOLLAR AMOUNTS IN THOUSANDS, EXCEPT PER SHARE, PER TON AND PER GALLON AMOUNTS)
The Company’s Chief Operating Decision Maker evaluates operating segment profitability and determines resource allocations based on several factors, of which the primary financial measure is segment EBITDA. The Company defines segment EBITDA as earnings before interest, taxes, depreciation, amortization, loss on prior office leases, impairments and other operating items and other income (expense). Segment EBITDA is not a measure of operating income, operating performance or liquidity under generally accepted accounting principles and may not be comparable to similarly titled measures reported by other companies. The Company’s management uses segment EBITDA in the evaluation of segment operating performance as it is a profit measure that is generally within the control of the operating segments. A reconciliation of segment EBITDA to Income before income tax provision is included at the end of this Note 14.
Summarized financial information concerning the Company’s reportable segments for the years ended December 31, 2015, 2014 and 2013, is shown in the following tables:
| Year Ended December 31, 2015 | Revenue | Intercompany Revenue(b) | Reported Revenue | Segment EBITDA(c) | Depreciation and Amortization | Capital Expenditures | Total Assets(e) | |||||||||||||||||||||
| Western | $ | 984,283 | $ | (103,890 | ) | $ | 880,393 | $ | 290,937 | $ | 83,073 | $ | 82,118 | $ | 1,498,296 | |||||||||||||
| Central | 660,902 | (71,235 | ) | 589,667 | 207,205 | 76,719 | 70,872 | 1,216,985 | ||||||||||||||||||||
| Eastern | 520,691 | (87,234 | ) | 433,457 | 132,774 | 59,654 | 52,187 | 1,176,671 | ||||||||||||||||||||
| E&P | 225,314 | (11,544 | ) | 213,770 | 69,545 | 47,129 | 30,814 | 1,113,890 | ||||||||||||||||||||
| Corporate(a), (d) | - | - | - | 1,933 | 2,859 | 2,842 | 115,956 | |||||||||||||||||||||
| $ | 2,391,190 | $ | (273,903 | ) | $ | 2,117,287 | $ | 702,394 | $ | 269,434 | $ | 238,833 | $ | 5,121,798 | ||||||||||||||
| Year Ended December 31, 2014 | Revenue | Intercompany Revenue(b) | Reported Revenue | Segment EBITDA(c) | Depreciation and Amortization | Capital Expenditures | Total Assets(e) | |||||||||||||||||||||
| Western | $ | 920,116 | $ | (96,194 | ) | $ | 823,922 | $ | 258,126 | $ | 79,907 | $ | 65,227 | $ | 1,482,474 | |||||||||||||
| Central | 629,574 | (68,094 | ) | 561,480 | 197,121 | 69,037 | 77,500 | 1,187,505 | ||||||||||||||||||||
| Eastern | 473,983 | (80,162 | ) | 393,821 | 116,230 | 53,717 | 60,384 | 852,963 | ||||||||||||||||||||
| E&P | 314,845 | (14,902 | ) | 299,943 | 147,261 | 52,709 | 36,608 | 1,609,553 | ||||||||||||||||||||
| Corporate(a), (d) | - | - | - | (7,434 | ) | 2,574 | 1,558 | 112,772 | ||||||||||||||||||||
| $ | 2,338,518 | $ | (259,352 | ) | $ | 2,079,166 | $ | 711,304 | $ | 257,944 | $ | 241,277 | $ | 5,245,267 | ||||||||||||||
| Year Ended December 31, 2013 | Revenue | Intercompany Revenue(b) | Reported Revenue | Segment EBITDA(c) | Depreciation and Amortization | Capital Expenditures | Total Assets(e) | |||||||||||||||||||||
| Western | $ | 905,764 | $ | (99,974 | ) | $ | 805,790 | $ | 249,548 | $ | 81,164 | $ | 70,960 | $ | 1,487,409 | |||||||||||||
| Central | 573,366 | (62,438 | ) | 510,928 | 182,790 | 64,165 | 57,952 | 1,173,089 | ||||||||||||||||||||
| Eastern | 447,844 | (76,072 | ) | 371,772 | 108,173 | 51,546 | 39,703 | 807,124 | ||||||||||||||||||||
| E&P | 251,651 | (11,346 | ) | 240,305 | 111,056 | 44,099 | 34,916 | 1,484,501 | ||||||||||||||||||||
| Corporate(a), (d) | - | - | - | (228 | ) | 2,890 | 6,343 | 105,494 | ||||||||||||||||||||
| $ | 2,178,625 | $ | (249,830 | ) | $ | 1,928,795 | $ | 651,339 | $ | 243,864 | $ | 209,874 | $ | 5,057,617 | ||||||||||||||
(a) Corporate functions include accounting, legal, tax, treasury, information technology, risk management, human resources, training and other administrative functions. Amounts reflected are net of allocations to the four operating segments.
(b) Intercompany revenues reflect each segment’s total intercompany sales, including intercompany sales within a segment and between segments. Transactions within and between segments are generally made on a basis intended to reflect the market value of the service.
(c) For those items included in the determination of segment EBITDA, the accounting policies of the segments are the same as those described in Note 1.
(d) Corporate assets include cash, net deferred tax assets, debt issuance costs, equity investments, and corporate facility leasehold improvements and equipment.
(e) Goodwill is included within total assets for each of the Company’s four operating segments.
| 106 |
WASTE CONNECTIONS, INC.
NOTES TO CONSOLIDATED FINANCIAL STATEMENTS
(DOLLAR AMOUNTS IN THOUSANDS, EXCEPT PER SHARE, PER TON AND PER GALLON AMOUNTS)
The following table shows changes in goodwill during the years ended December 31, 2014 and 2015, by reportable segment:
| Western | Central | Eastern | E&P | Total | ||||||||||||||||
| Balance as of December 31, 2013 | $ | 372,915 | $ | 459,054 | $ | 380,570 | $ | 462,615 | $ | 1,675,154 | ||||||||||
| Goodwill acquired | - | 1,470 | 11,853 | 5,455 | 18,778 | |||||||||||||||
| Goodwill divested | - | (143 | ) | - | - | (143 | ) | |||||||||||||
| Balance as of December 31, 2014 | 372,915 | 460,381 | 392,423 | 468,070 | 1,693,789 | |||||||||||||||
| Goodwill acquired | 905 | 12,044 | 106,814 | 21,059 | 140,822 | |||||||||||||||
| Impairment loss | - | - | - | (411,786 | ) | (411,786 | ) | |||||||||||||
| Balance as of December 31, 2015 | $ | 373,820 | $ | 472,425 | $ | 499,237 | $ | 77,343 | $ | 1,422,825 | ||||||||||
A reconciliation of the Company’s primary measure of segment profitability (segment EBITDA) to Income (loss) before income tax provision in the Consolidated Statements of Net Income (Loss) is as follows:
| Years ended December 31, | ||||||||||||
| 2015 | 2014 | 2013 | ||||||||||
| Western segment EBITDA | $ | 290,937 | $ | 258,126 | $ | 249,548 | ||||||
| Central segment EBITDA | 207,205 | 197,121 | 182,790 | |||||||||
| Eastern segment EBITDA | 132,774 | 116,230 | 108,173 | |||||||||
| E&P segment EBITDA | 69,545 | 147,261 | 111,056 | |||||||||
| Subtotal reportable segments | 700,461 | 718,738 | 651,567 | |||||||||
| Unallocated corporate overhead | 1,933 | (7,434 | ) | (228 | ) | |||||||
| Depreciation | (240,357 | ) | (230,944 | ) | (218,454 | ) | ||||||
| Amortization of intangibles | (29,077 | ) | (27,000 | ) | (25,410 | ) | ||||||
| Loss on prior office leases | - | - | (9,902 | ) | ||||||||
| Impairments and other operating items | (494,492 | ) | (4,091 | ) | (4,129 | ) | ||||||
| Interest expense | (64,236 | ) | (64,674 | ) | (73,579 | ) | ||||||
| Other income (expense), net | (518 | ) | 1,067 | 1,056 | ||||||||
| Income (loss) before income tax provision | $ | (126,286 | ) | $ | 385,662 | $ | 320,921 | |||||
The following tables reflect a breakdown of the Company’s revenue and inter-company eliminations for the periods indicated:
| Year Ended December 31, 2015 | ||||||||||||||||
| Revenue | Intercompany Revenue | Reported Revenue | % of Reported Revenue | |||||||||||||
| Solid waste collection | $ | 1,378,679 | $ | (4,623 | ) | $ | 1,374,056 | 64.9 | % | |||||||
| Solid waste disposal and transfer | 670,369 | (255,200 | ) | 415,169 | 19.6 | |||||||||||
| Solid waste recycling | 47,292 | (924 | ) | 46,368 | 2.2 | |||||||||||
| E&P waste treatment, recovery and disposal | 228,529 | (13,156 | ) | 215,373 | 10.2 | |||||||||||
| Intermodal and other | 66,321 | - | 66,321 | 3.1 | ||||||||||||
| Total | $ | 2,391,190 | $ | (273,903 | ) | $ | 2,117,287 | 100.0 | % | |||||||
| 107 |
WASTE CONNECTIONS, INC.
NOTES TO CONSOLIDATED FINANCIAL STATEMENTS
(DOLLAR AMOUNTS IN THOUSANDS, EXCEPT PER SHARE, PER TON AND PER GALLON AMOUNTS)
| Year Ended December 31, 2014 | ||||||||||||||||
| Revenue | Intercompany Revenue | Reported Revenue | % of Reported Revenue | |||||||||||||
| Solid waste collection | $ | 1,289,906 | $ | (3,593 | ) | $ | 1,286,313 | 61.9 | % | |||||||
| Solid waste disposal and transfer | 617,161 | (235,851 | ) | 381,310 | 18.3 | |||||||||||
| Solid waste recycling | 58,226 | (2,118 | ) | 56,108 | 2.7 | |||||||||||
| E&P waste treatment, recovery and disposal | 326,934 | (16,862 | ) | 310,072 | 14.9 | |||||||||||
| Intermodal and other | 46,291 | (928 | ) | 45,363 | 2.2 | |||||||||||
| Total | $ | 2,338,518 | $ | (259,352 | ) | $ | 2,079,166 | 100.0 | % | |||||||
| Year Ended December 31, 2013 | ||||||||||||||||
| Revenue | Intercompany Revenue | Reported Revenue | % of Reported Revenue | |||||||||||||
| Solid waste collection | $ | 1,219,091 | $ | (4,304 | ) | $ | 1,214,787 | 63.0 | % | |||||||
| Solid waste disposal and transfer | 579,379 | (226,897 | ) | 352,482 | 18.3 | |||||||||||
| Solid waste recycling | 71,831 | (6,101 | ) | 65,730 | 3.4 | |||||||||||
| E&P waste treatment, recovery and disposal | 262,286 | (11,462 | ) | 250,824 | 13.0 | |||||||||||
| Intermodal and other | 46,038 | (1,066 | ) | 44,972 | 2.3 | |||||||||||
| Total | $ | 2,178,625 | $ | (249,830 | ) | $ | 1,928,795 | 100.0 | % | |||||||
| 15. | NET INCOME (LOSS) PER SHARE INFORMATION |
The following table sets forth the calculation of the numerator and denominator used in the computation of basic and diluted net income (loss) per common share attributable to the Company’s common stockholders for the years ended December 31, 2015, 2014 and 2013:
| Years Ended December 31, | ||||||||||||
| 2015 | 2014 | 2013 | ||||||||||
| Numerator: | ||||||||||||
| Net income (loss) attributable to Waste Connections for basic and diluted earnings per share | $ | (95,764 | ) | $ | 232,525 | $ | 195,655 | |||||
| Denominator: | ||||||||||||
| Basic shares outstanding | 123,491,931 | 124,215,346 | 123,597,540 | |||||||||
| Dilutive effect of stock options and warrants | - | 90,334 | 186,006 | |||||||||
| Dilutive effect of restricted stock units | - | 481,741 | 381,506 | |||||||||
| Diluted shares outstanding | 123,491,931 | 124,787,421 | 124,165,052 | |||||||||
| 16. | EMPLOYEE BENEFIT PLANS |
401K Plans: WCI has a voluntary savings and investment plan (the “WCI 401(k) Plan”), as do certain of its subsidiaries (together with the WCI 401(k) Plan, the “401(k) Plans”). The 401(k) Plans are available to all eligible employees of WCI and its subsidiaries. WCI and its subsidiaries make matching contributions under the 401(k) Plans of 50% to 100% of every dollar of a participating employee’s pre-tax contributions until the employee’s contributions equal from 3% to 6% of the employee’s eligible compensation, subject to certain limitations imposed by the U.S. Internal Revenue Code.
| 108 |
WASTE CONNECTIONS, INC.
NOTES TO CONSOLIDATED FINANCIAL STATEMENTS
(DOLLAR AMOUNTS IN THOUSANDS, EXCEPT PER SHARE, PER TON AND PER GALLON AMOUNTS)
Total employer expenses, including employer matching contributions, for the 401(k) Plans were $4,702, $4,765 and $4,024, respectively, during the years ended December 31, 2015, 2014 and 2013. These amounts include matching contributions WCI made under the Deferred Compensation Plan, described below.
Multiemployer Pension Plans: The Company also participates in two “multiemployer” pension plans. The Company does not administer these multiemployer plans. In general, these plans are managed by the trustees, with the unions appointing certain trustees, and other contributing employers of the plan appointing certain others. The Company is generally not represented on the board of trustees. The Company makes periodic contributions to these plans pursuant to its collective bargaining agreements. The Company’s participation in multiemployer pension plans is summarized as follows:
| Pension Protection Act Zone Status(a) | Company Contributions | Expiration Date of | |||||||||||||||||||||||
| Plan Name | EIN/Pension Plan Number | 2015 | 2014 | 2015 | 2014 | 2013 | Collective Bargaining Agreement | ||||||||||||||||||
| Western Conference of Teamsters Pension Trust | 91-6145047 - 001 | Green | Green | $ | 4,314 | $ | 3,852 | $ | 3,662 | 4/30/16 to 12/31/19 | |||||||||||||||
| Locals 302 & 612 of the IOUE - Employers Construction Industry Retirement Plan | 91-6028571 - 001 | Green | Green | 242 | 226 | 223 | 9/30/16 | ||||||||||||||||||
| $ | 4,556 | $ | 4,078 | $ | 3,885 | ||||||||||||||||||||
(a) The most recent Pension Protection Act zone status available in 2015 and 2014 is for the plans’ years ended December 31, 2014 and 2013, respectively.
The status is based on information that the Company received from the pension plans and is certified by the pension plans’ actuary. Plans with “green” status are at least 80% funded. The Company’s contributions to each individual multiemployer pension plan represent less than 5% of total contributions to such plan. Under current law regarding multiemployer benefit plans, a plan’s termination, the Company’s voluntary withdrawal, or the withdrawal of all contributing employers from any under-funded multiemployer pension plan would require the Company to make payments to the plan for its proportionate share of the multiemployer plan’s unfunded vested liabilities. The Company could have adjustments to its estimates for these matters in the near term that could have a material effect on its consolidated financial condition, results of operations or cash flows.
Deferred Compensation Plan: Effective for compensation paid on and after July 1, 2004, the Company established a Deferred Compensation Plan for eligible employees, which was amended and restated effective January 1, 2008, January 1, 2010, September 22, 2011 and December 1, 2014 (the “Deferred Compensation Plan”). The Deferred Compensation Plan is a non-qualified deferred compensation program under which the eligible participants, including officers and certain employees who meet a minimum salary threshold, may voluntarily elect to defer up to 80% of their base salaries and up to 100% of their bonuses, commissions and restricted stock unit grants. Effective as of December 1, 2014, the Board of Directors determined to discontinue the option to allow eligible participants to defer restricted stock unit grants pursuant to the Deferred Compensation Plan. Members of the Company’s Board of Directors are eligible to participate in the Deferred Compensation Plan with respect to their Director fees. Although the Company periodically contributes the amount of its obligation under the plan to a trust for the benefit of the participants, the amounts of any compensation deferred under the Deferred Compensation Plan constitute an unsecured obligation of the Company to pay the participants in the future and, as such, are subject to the claims of other creditors in the event of insolvency proceedings. Participants may elect certain future distribution dates on which all or a portion of their accounts will be paid to them, including in the case of a change in control of the Company. Their accounts will be distributed to them in cash, except for amounts credited with respect to deferred restricted stock unit grants, which will be distributed in shares of the Company’s common stock pursuant to the 2014 Incentive Award Plan, the Third Amended and Restated 2004 Equity Incentive Plan or any successor plan or plans. In addition to the amount of participants’ contributions, the Company will pay participants an amount reflecting a deemed return based on the returns of various mutual funds or measurement funds selected by the participants, except in the case of restricted stock units that are deferred, which are credited to their accounts as shares of Company common stock. The measurement funds are used only to determine the amount of return the Company pays to participants and participant funds are not actually invested in the measurement fund, nor are any shares of Company common stock acquired under the Deferred Compensation Plan. During each of the two years ended December 31, 2015 and 2014, the Company also made matching contributions to the Deferred Compensation Plan of 50% of every dollar of a participating employee’s pre-tax eligible contributions until the employee’s contributions equaled 6% of the employee’s eligible compensation, less the amount of any match the Company made on behalf of the employee under the WCI 401(k) Plan, and subject to certain deferral limitations imposed by the U.S. Internal Revenue Code on 401(k) plans, except that the Company’s matching contributions under the Deferred Compensation Plan were 100% vested when made. During the year ended December 31, 2013, the Company also made matching contributions to the Deferred Compensation Plan of 50% of every dollar of a participating employee’s pre-tax eligible contributions until the employee’s contributions equaled 5% of the employee’s eligible compensation, less the amount of any match the Company made on behalf of the employee under the WCI 401(k) Plan, and subject to certain deferral limitations imposed by the U.S. Internal Revenue Code on 401(k) plans, except that the Company’s matching contributions under the Deferred Compensation Plan were 100% vested when made. The Company’s total liability for deferred compensation at December 31, 2015 and 2014 was $19,387 and $18,614, respectively, which was recorded in Other long-term liabilities in the Consolidated Balance Sheets.
| 109 |
WASTE CONNECTIONS, INC.
NOTES TO CONSOLIDATED FINANCIAL STATEMENTS
(DOLLAR AMOUNTS IN THOUSANDS, EXCEPT PER SHARE, PER TON AND PER GALLON AMOUNTS)
| 17. | SELECTED QUARTERLY FINANCIAL DATA (UNAUDITED) |
The following table summarizes the unaudited consolidated quarterly results of operations for 2015:
| First Quarter | Second Quarter | Third Quarter | Fourth Quarter | |||||||||||||
| Revenues | $ | 506,100 | $ | 531,312 | $ | 547,938 | $ | 531,937 | ||||||||
| Operating income (loss) | 101,865 | 110,024 | (375,152 | ) | 101,730 | |||||||||||
| Net income (loss) | 52,081 | 57,641 | (256,805 | ) | 52,388 | |||||||||||
| Net income (loss) attributable to Waste Connections | 51,824 | 57,360 | (257,009 | ) | 52,061 | |||||||||||
| Basic income (loss) per common share attributable to Waste Connections’ common stockholders | 0.42 | 0.46 | (2.08 | ) | 0.42 | |||||||||||
| Diluted income (loss) per common share attributable to Waste Connections’ common stockholders | 0.42 | 0.46 | (2.08 | ) | 0.42 | |||||||||||
During the third quarter of 2015, the Company recorded impairment charges of $411,786 associated with goodwill and $38,300 associated with indefinite-lived intangible assets in its E&P segment. The Company also recorded impairment charges of $63,928 related to property and equipment at certain E&P operating locations during the third quarter of 2015. The aforementioned impairment charges were partially offset by $20,642 of adjustments recorded during the third quarter of 2015 to reduce the fair value of amounts payable under liability-classified contingent consideration arrangements associated with the acquisition of an E&P business in 2014.
The following table summarizes the unaudited consolidated quarterly results of operations for 2014:
| First Quarter | Second Quarter | Third Quarter | Fourth Quarter | |||||||||||||
| Revenues | $ | 481,710 | $ | 524,693 | $ | 546,551 | $ | 526,213 | ||||||||
| Operating income | 100,589 | 118,716 | 116,011 | 113,952 | ||||||||||||
| Net income | 49,223 | 62,900 | 60,284 | 60,921 | ||||||||||||
| Net income attributable to Waste Connections | 49,015 | 62,664 | 60,084 | 60,762 | ||||||||||||
| Basic income per common share attributable to Waste Connections’ common stockholders | 0.40 | 0.50 | 0.48 | 0.49 | ||||||||||||
| Diluted income per common share attributable to Waste Connections’ common stockholders | 0.39 | 0.50 | 0.48 | 0.49 | ||||||||||||
| 110 |
WASTE CONNECTIONS, INC.
NOTES TO CONSOLIDATED FINANCIAL STATEMENTS
(DOLLAR AMOUNTS IN THOUSANDS, EXCEPT PER SHARE, PER TON AND PER GALLON AMOUNTS)
During the third quarter of 2014, the Company recorded an $8,445 impairment charge for property and equipment at an E&P disposal facility as a result of projected operating losses resulting from the migration of the majority of the facility’s customers to a new E&P facility that the Company owns and operates.
| 18. | SUBSEQUENT EVENTS |
Progressive Waste Merger
On January 18, 2016, the Company entered into an Agreement and Plan of Merger (the “Merger Agreement”) with Progressive Waste Solutions Ltd., a corporation organized under the laws of Ontario (“Progressive Waste”) and Water Merger Sub LLC, a Delaware limited liability company and wholly-owned subsidiary of Progressive Waste (“Merger Sub”). Subject to the terms and conditions of the Merger Agreement, Merger Sub will merge with and into Waste Connections (the “Merger”), with Waste Connections surviving the Merger as a wholly-owned subsidiary of Progressive Waste.
The transaction is expected to close in the second quarter of 2016. Upon closing, the combined company will use the Waste Connections name and it is anticipated that its shares will trade on the New York Stock Exchange and the Toronto Stock Exchange. Upon completion of the transaction, the combined company will be led by the Company’s current management team. The Board of Directors for the combined company will include the five current members of the Company’s Board and two members from Progressive Waste’s current Board.
Under the terms of the Merger Agreement, the Company’s stockholders will receive 2.076843 Progressive Waste shares for each Company share they own. Subject to the approval of Progressive Waste’s shareholders, Progressive Waste expects to implement immediately following the Merger, a share consolidation whereby every 2.076843 shares will be consolidated into one Progressive Waste share on the basis of 0.4815 (1 divided by the 2.076843 ratio above) of a share on a post-consolidation basis for each one share outstanding on a pre-consolidation basis. If the share consolidation is approved by Progressive Waste’s shareholders and effected, the Company’s stockholders will receive one share of the combined company for each existing Company share. Upon the completion of the transaction and regardless of whether or not the share consolidation occurs, the Company’s stockholders will own approximately 70% of the combined company, and Progressive Waste shareholders will own approximately 30%.
The transaction is subject to customary closing conditions, including the approval of both companies’ shareholders, U.S. antitrust approval and the approval of the Toronto Stock Exchange.
Quarterly Dividend
On February 8, 2016, the Company announced that its Board of Directors approved a regular quarterly cash dividend of $0.145 per share on the Company’s common stock. The dividend will be paid on March 15, 2016, to stockholders of record on the close of business on March 1, 2016.
| 111 |
| ITEM 9. | CHANGES IN AND DISAGREEMENTS WITH ACCOUNTANTS ON ACCOUNTING AND FINANCIAL DISCLOSURE |
None.
| ITEM 9A. | CONTROLS AND PROCEDURES |
Disclosure Controls and Procedures
We carried out an evaluation, under the supervision and with the participation of our management, including our Chief Executive Officer and our Chief Financial Officer, of the effectiveness of the design and operation of our disclosure controls and procedures, as such term is defined in Rules 13a-15(e) and 15d-15(e) under the Securities Exchange Act of 1934, as amended. Based on this evaluation, our Chief Executive Officer and Chief Financial Officer concluded that our disclosure controls and procedures were effective as of December 31, 2015, at the reasonable assurance level such that information required to be disclosed in our Exchange Act reports: (1) is recorded, processed, summarized and reported within the time periods specified in the SEC’s rules and forms; and (2) is accumulated and communicated to our management, including our Chief Executive Officer and Chief Financial Officer, as appropriate to allow timely decisions regarding required disclosure.
Management’s Report on Internal Control over Financial Reporting
Our management is responsible for establishing and maintaining adequate internal control over financial reporting, as such term is defined in Rules 13a-15(f) and 15d-15(f) under the Securities Exchange Act of 1934, as amended. Internal control over financial reporting is a process designed to provide reasonable assurance regarding the reliability of financial reporting and the preparation of financial statements for external purposes in accordance with U.S. generally accepted accounting principles. This process includes policies and procedures that: (1) pertain to the maintenance of records that in reasonable detail accurately and fairly reflect our transactions and any dispositions of our assets; (2) provide reasonable assurance that transactions are recorded as necessary to permit preparation of financial statements in accordance with U.S. generally accepted accounting principles; (3) provide reasonable assurance that receipts and expenditures of ours are being made only in accordance with authorizations of our management; and (4) provide reasonable assurance that unauthorized acquisition, use or disposition of our assets that could have a material affect on our financial statements would be prevented or timely detected.
We carried out an evaluation, under the supervision and with the participation of our management, including our Chief Executive Officer and our Chief Financial Officer, of the effectiveness of the design and operation of our internal control over financial reporting as of December 31, 2015. In conducting our evaluation, we used the framework set forth in the report titled “Internal Control – Integrated Framework (2013)” published by the Committee of Sponsoring Organizations of the Treadway Commission. Based on the results of our evaluation, our management has concluded that our internal control over financial reporting was effective as of December 31, 2015.
The effectiveness of our internal control over financial reporting as of December 31, 2015, has been audited by PricewaterhouseCoopers LLP, our independent registered public accounting firm, as stated in its report which appears in Item 8 of this Annual Report on Form 10-K.
Changes in Internal Control Over Financial Reporting
Based on an evaluation under the supervision and with the participation of our management, including our Chief Executive Officer and Chief Financial Officer, there has been no change to our internal control over financial reporting that occurred during the three month period ended December 31, 2015, that has materially affected, or is reasonably likely to materially affect, our internal control over financial reporting.
| ITEM 9B. | OTHER INFORMATION |
None.
| 112 |
| ITEM 10. | DIRECTORS, EXECUTIVE OFFICERS AND CORPORATE GOVERNANCE |
Except as set forth above in Part I under “Executive Officers of the Registrant” and in the paragraph below, the information required by Item 10 has been omitted from this report, and is incorporated by reference to the sections “Election of Directors,” “Corporate Governance and Board Matters” and “Section 16(a) Beneficial Ownership Reporting Compliance” in our definitive Proxy Statement for the 2016 Annual Meeting of Stockholders, which we will file with the SEC pursuant to Regulation 14A within 120 days after the end of our 2015 fiscal year.
We have adopted a Code of Conduct and Ethics that applies to our officers, including our principal executive officer, principal financial officer, principal accounting officer and all other officers, directors and employees. We have also adopted Corporate Governance Guidelines to promote the effective functioning of our Board of Directors and its committees, to promote the interests of stockholders and to ensure a common set of expectations concerning how the Board, its committees and management should perform their respective functions. Our Code of Conduct and Ethics and our Corporate Governance Guidelines are available on our website at http://www.wasteconnections.com as are the charters of our Board’s Audit, Nominating and Corporate Governance and Compensation Committees. Information on or that can be accessed through our website is not incorporated by reference to this report. We intend to satisfy the disclosure requirement under Item 5.05 of Form 8-K regarding any amendments to, or waiver from, a provision of our Code of Conduct by posting such information on our website.
Stockholders may also obtain copies of the Corporate Governance documents discussed above by contacting our Secretary at the address or phone number listed on the cover page of this Annual Report on Form 10-K.
| ITEM 11. | EXECUTIVE COMPENSATION |
Information required by Item 11 has been omitted from this report and is incorporated by reference to the sections “Executive Compensation” and “Corporate Governance and Board Matters” in our definitive Proxy Statement for the 2016 Annual Meeting of Stockholders.
| ITEM 12. | SECURITY OWNERSHIP OF CERTAIN BENEFICIAL OWNERS AND MANAGEMENT AND RELATED STOCKHOLDER MATTERS |
Information required by Item 12 has been omitted from this report and is incorporated by reference to the sections “Principal Stockholders” and “Equity Compensation Plan Information” in our definitive Proxy Statement for the 2016 Annual Meeting of Stockholders.
| ITEM 13. | CERTAIN RELATIONSHIPS AND RELATED TRANSACTIONS, AND DIRECTOR INDEPENDENCE |
Information required by Item 13 has been omitted from this report and is incorporated by reference to the sections “Certain Relationships and Related Transactions” and “Corporate Governance and Board Matters” in our definitive Proxy Statement for the 2016 Annual Meeting of Stockholders.
| ITEM 14. | PRINCIPAL ACCOUNTING FEES AND SERVICES |
Information required by Item 14 has been omitted from this report and is incorporated by reference to the section “Appointment of Independent Registered Public Accounting Firm” in our definitive Proxy Statement for the 2016 Annual Meeting of Stockholders.
| 113 |
| ITEM 15. | EXHIBITS AND FINANCIAL STATEMENT SCHEDULES |
| (a) | See Index to Consolidated Financial Statements on page 66. The following Financial Statement Schedule is filed herewith on page 116 and made a part of this Report: |
Schedule II - Valuation and Qualifying Accounts
All other schedules for which provision is made in the applicable accounting regulations of the SEC are not required under the related instructions or are inapplicable, and therefore have been omitted.
| (b) | See Exhibit Index immediately following signature pages. |
| 114 |
Pursuant to the requirements of Sections 13 or 15(d) of the Securities Exchange Act of 1934, the Registrant has duly caused this report to be signed on its behalf by the undersigned, thereunto duly authorized.
| Waste Connections, Inc. | ||
| By: | /s/ Ronald J. Mittelstaedt | |
| Ronald J. Mittelstaedt | ||
| Date: February 9, 2016 | Chief Executive Officer and Chairman | |
POWER OF ATTORNEY
KNOW ALL PERSONS BY THESE PRESENTS, that each person whose signature appears below constitutes and appoints Ronald J. Mittelstaedt and Worthing F. Jackman, jointly and severally, his true and lawful attorneys-in-fact, each with the power of substitution, for him in any and all capacities to sign any amendments to this Annual Report on Form 10-K, and to file the same with all exhibits thereto and other documents in connection therewith, with the Securities and Exchange Commission, hereby ratifying and confirming all that each of said attorneys-in-fact, or his substitutes, may do or cause to be done by virtue hereof.
Pursuant to the requirements of the Securities Exchange Act of 1934, this report has been signed below by the following persons on behalf of the Registrant and in the capacities and on the dates indicated.
| Signature | Title | Date | ||
| /s/ Ronald J. Mittelstaedt | Chief Executive Officer and Chairman | |||
| Ronald J. Mittelstaedt | (principal executive officer) | February 9, 2016 | ||
| /s/ Worthing F. Jackman | Executive Vice President and Chief Financial Officer | |||
| Worthing F. Jackman | (principal financial officer) | February 9, 2016 | ||
| /s/ David G. Eddie | Senior Vice President and Chief Accounting Officer | |||
| David G. Eddie | (principal accounting officer) | February 9, 2016 | ||
| /s/ Michael W. Harlan | ||||
| Michael W. Harlan | Director | February 9, 2016 | ||
| /s/ William J. Razzouk | ||||
| William J. Razzouk | Director | February 9, 2016 | ||
| /s/ Robert H. Davis | ||||
| Robert H. Davis | Director | February 9, 2016 | ||
| /s/ Edward E. Guillet | ||||
| Edward E. Guillet | Director | February 9, 2016 |
| 115 |
SCHEDULE II - VALUATION AND QUALIFYING ACCOUNTS
Years Ended December 31, 2015, 2014 and 2013
(in thousands)
| Additions | Deductions | |||||||||||||||||||
| Description | Balance at Beginning of Year | Charged to Costs and Expenses | Charged to Other Accounts | (Write-offs, Net of Collections) | Balance at End of Year | |||||||||||||||
| Allowance for Doubtful Accounts: | ||||||||||||||||||||
| Year Ended December 31, 2015 | $ | 9,175 | $ | 5,423 | $ | - | $ | (6,860 | ) | $ | 7,738 | |||||||||
| Year Ended December 31, 2014 | 7,348 | 8,043 | - | (6,216 | ) | 9,175 | ||||||||||||||
| Year Ended December 31, 2013 | 6,548 | 6,617 | - | (5,817 | ) | 7,348 | ||||||||||||||
| 116 |
| Exhibit Number |
Description of Exhibits | |
| 2.1 | Agreement and Plan of Merger, dated as of January 18, 2016, by and among Progressive Waste Ltd., Water Merger Sub LLC, and the Registrant (incorporated by reference to Exhibit 2.1 of the Registrant’s Form 8-K filed on January 20, 2016) | |
| 3.1 | Amended and Restated Certificate of Incorporation of the Registrant, dated as of June 14, 2013 (incorporated by reference to Exhibit 3.1 of the Registrant’s Form 10-Q filed on July 24, 2013) | |
| 3.2 | Fourth Amended and Restated Bylaws of the Registrant, effective July 17, 2014 (incorporated by reference to Exhibit 3.2 of the Registrant’s Form 10-Q filed on July 21, 2014) | |
| 4.1 | Form of Common Stock Certificate (incorporated by reference to Exhibit 4.1 of the Registrant’s Form S-1/A filed on May 6, 1998) | |
| 4.2 | Master Note Purchase Agreement, dated July 15, 2008 (incorporated by reference to Exhibit 4.1 of the Registrant’s Form 8-K filed on July 18, 2008) | |
| 4.3 | Amendment No. 1 to Master Note Purchase Agreement, dated as of July 20, 2009 (incorporated by reference to Exhibit 4.2 of the Registrant’s Form 10-Q filed on August 5, 2009) | |
| 4.4 | First Supplement to Master Note Purchase Agreement, dated as of October 26, 2009 (incorporated by reference to Exhibit 4.2 of the Registrant’s Form 10-Q filed on October 27, 2009) | |
| 4.5 | Amendment No. 2 to Master Note Purchase Agreement, dated as of November 24, 2010 (incorporated by reference to Exhibit 4.1 of the Registrant’s Form 8-K filed on November 26, 2010) | |
| 4.6 | Second Supplement to Master Note Purchase Agreement, dated as of April 1, 2011 (incorporated by reference to Exhibit 4.5 of the Registrant’s Form 8-K filed on April 5, 2011) | |
| 4.7 | Amendment No. 3 to Master Note Purchase Agreement, dated as of October 12, 2011 (incorporated by reference to Exhibit 4.7 of the Registrant’s Form 10-K filed on February 8, 2012) | |
| 4.8 | Amendment No. 4 to Master Note Purchase Agreement, dated August 9, 2013 (incorporated by reference to Exhibit 4.1 of the Registrant’s Form 8-K filed on August 14, 2013) | |
| 4.9 | Amendment No. 5 to Master Note Purchase Agreement, dated February 20, 2015 (incorporated by reference to Exhibit 4.1 of the Registrant’s Form 8-K filed on February 26, 2015) | |
| 4.10 | Third Supplement to Master Note Purchase Agreement, dated as of June 11, 2015 (incorporated by reference to Exhibit 4.9 of the Registrant’s Form 8-K filed on June 12, 2015) | |
| 10.1 + | Employment Agreement between the Registrant and James M. Little, dated as of September 13, 1999 (incorporated by reference to Exhibit 10.42 of the Registrant’s Form 10-K filed on March 13, 2000) |
| 117 |
| Exhibit Number |
Description of Exhibits | |
| 10.2 + | Employment Agreement between the Registrant and Eric O. Hansen, dated as of January 1, 2001 (incorporated by reference to Exhibit 10.12 of the Registrant’s Form 10-Q filed on May 3, 2005) | |
| 10.3 + | First Amended and Restated Employment Agreement between the Registrant and David M. Hall, dated as of October 1, 2005 (incorporated by reference to Exhibit 10.1 of the Registrant’s Form 8-K filed on October 4, 2005) | |
| 10.4 + | First Amended and Restated Employment Agreement between the Registrant and David G. Eddie, dated as of October 1, 2005 (incorporated by reference to Exhibit 10.2 of the Registrant’s Form 8-K filed on October 4, 2005) | |
| 10.5 + | Form of Indemnification Agreement between the Registrant and each of its directors and officers (incorporated by reference to Exhibit 10.2 of the Registrant’s Form 10-Q filed on July 31, 2006) | |
| 10.6 + | Employment Agreement between the Registrant and Patrick J. Shea, dated as of February 1, 2008 (incorporated by reference to Exhibit 10.1 of the Registrant’s Form 10-Q filed on April 23, 2008) | |
| 10.7 + | Consultant Incentive Plan (incorporated by reference to Exhibit 10.2 of the Registrant’s Form 10-Q filed on April 23, 2008) | |
| 10.8 + | Form of Amendment to Employment Agreement between the Registrant and each of David G. Eddie, David M. Hall and Patrick J. Shea (incorporated by reference to Exhibit 10.24 of the Registrant’s Form 10-K filed on February 10, 2009) | |
| 10.9 + | Form of Amendment to Employment Agreement between the Registrant and James M. Little (incorporated by reference to Exhibit 10.25 of the Registrant’s Form 10-K filed on February 10, 2009) | |
| 10.10 + | Form of Amendment to Employment Agreement between the Registrant and Eric O. Hansen (incorporated by reference to Exhibit 10.26 of the Registrant’s Form 10-K filed on February 10, 2009) | |
| 10.11 + | Employment Agreement between the Registrant and Rick Wojahn, dated as of February 9, 2009 (incorporated by reference to Exhibit 10.1 of the Registrant’s Form 10-Q filed on May 8, 2009) | |
| 10.12 + | Employment Agreement between the Registrant and Scott Schreiber, dated as of February 9, 2009 (incorporated by reference to Exhibit 10.2 of the Registrant’s Form 10-Q filed on May 8, 2009) | |
| 10.13 + | Employment Agreement between the Registrant and Greg Thibodeaux, dated as of July 1, 2000 (incorporated by reference to Exhibit 10.29 of the Registrant’s Form 10-K filed on February 9, 2011) | |
| 10.14 + | Form of Amendment to Employment Agreement between the Registrant and Greg Thibodeaux (incorporated by reference to Exhibit 10.30 of the Registrant’s Form 10-K filed on February 9, 2011) | |
| 10.15 + | Waste Connections, Inc. Nonqualified Deferred Compensation Plan, amended and restated as of December 1, 2014 (incorporated by reference to Exhibit 10.17 of the Registrant’s Form 10-K filed on February 10, 2015) | |
| 118 |
| Exhibit Number |
Description of Exhibits | |
| 10.16 + | Waste Connections, Inc. Third Amended and Restated 2004 Equity Incentive Plan (incorporated by reference to Exhibit 10.30 of the Registrant’s Form 10-K filed on February 8, 2012) | |
| 10.17 + | Separation Benefits Plan and Employment Agreement by and between the Registrant and Ronald J. Mittelstaedt, effective February 13, 2012 (incorporated by reference to Exhibit 10.1 of the Registrant's Form 8-K/A filed on February 27, 2012) | |
| 10.18 + | Separation Benefits Plan, effective February 13, 2012 (incorporated by reference to Exhibit 10.2 of the Registrant's Form 8-K/A filed on February 27, 2012) | |
| 10.19 + | Separation Benefits Plan Participation Letter Agreement by and between the Registrant and Steven F. Bouck, effective February 13, 2012 (incorporated by reference to Exhibit 10.3 of the Registrant's Form 8-K/A filed on February 27, 2012) | |
| 10.20 + | Separation Benefits Plan Participation Letter Agreement by and between the Registrant and Worthing F. Jackman, effective February 13, 2012 (incorporated by reference to Exhibit 10.4 of the Registrant's Form 8-K/A filed on February 27, 2012) | |
| 10.21 + | Separation Benefits Plan Participation Letter Agreement by and between the Registrant and Darrell W. Chambliss, effective February 13, 2012 (incorporated by reference to Exhibit 10.5 of the Registrant's Form 8-K/A filed on February 27, 2012) | |
| 10.22 + | Employment Agreement between the Registrant and Matthew Black, dated as of March 1, 2012 (incorporated by reference to Exhibit 10.7 of the Registrant's Form 10-Q filed on April 26, 2012) | |
| 10.23 + | Employment Agreement between the Registrant and Mary Anne Whitney, dated as of March 1, 2012 (incorporated by reference to Exhibit 10.8 of the Registrant's Form 10-Q filed on April 26, 2012) | |
| 10.24 + | Employment Agreement between the Registrant and Susan Netherton, dated as of July 23, 2013 (incorporated by reference to Exhibit 10.1 of the Registrant's Form 10-Q filed on October 23, 2013) | |
| 10.25 + | Waste Connections, Inc. 2014 Incentive Award Plan (incorporated by reference to Exhibit 10.1 of the Registrant's Form 8-K filed on May 19, 2014) | |
| 10.26 + | Form Grant Agreement for Performance-Based Restricted Stock Units (incorporated by reference to Exhibit 10.2 of the Registrant's Form 8-K filed on May 19, 2014) | |
| 10.27 + | Form Warrant to Purchase Common Stock pursuant to 2014 Incentive Award Plan (incorporated by reference to Exhibit 10.3 of the Registrant's Form 10-Q filed on July 21, 2014) | |
| 10.28 + | Form Grant Agreement for Restricted Stock Units pursuant to 2014 Incentive Award Plan (incorporated by reference to Exhibit 10.1 of the Registrant's Form 10-Q filed on October 22, 2014) | |
| 10.29 + | Employment Agreement between the Registrant and Robert Cloninger, dated as of August 1, 2014 (incorporated by reference to Exhibit 10.2 of the Registrant's Form 10-Q filed on October 22, 2014) | |
| 119 |
| Exhibit Number |
Description of Exhibits | |
| 10.30 | Term Loan Agreement, dated as of October 25, 2012 (incorporated by reference to Exhibit 4.9 of the Registrant’s Form 10-K filed on March 1, 2013) | |
| 10.31 | First Amendment to Term Loan Agreement, dated as of May 6, 2013 (incorporated by reference to Exhibit 4.1 of the Registrant’s Form 10-Q filed on July 24, 2013) | |
| 10.32 | Second Amended and Restated Credit Agreement, dated as of May 6, 2013 (incorporated by reference to Exhibit 4.2 of the Registrant’s Form 10-Q filed on July 24, 2013) | |
| 10.33 | Second Amendment to Term Loan Agreement, dated as of May 15, 2014 (incorporated by reference to Exhibit 10.3 of the Registrant’s Form 8-K filed on May 19, 2014) | |
| 10.34 | Revolving Credit and Term Loan Agreement, dated as of January 26, 2015 (incorporated by reference to Exhibit 10.1 of the Registrant's Form 8-K filed on January 30, 2015) | |
| 10.35 + | Amendment to Separation Benefits Plan and Employment Agreement between Registrant and Ronald J. Mittelstaedt (incorporated by reference to Exhibit 10.1 of the Registrant’s Form 8-K filed on December 18, 2015) | |
| 10.36 + * | Amended and Restated Compensation Plan for Independent Directors, dated January 1, 2016 | |
| 10.37 + * | Form Grant Agreement for Restricted Stock Units for Non-employee Directors pursuant to 2014 Incentive Award Plan | |
| 10.38 + * | Form Grant Agreement for Restricted Stock Units (with One-Year Performance Period) pursuant to 2014 Incentive Award Plan | |
| 10.39 | Consent to Revolving Credit and Term Loan Agreement, dated as of January 18, 2016 (incorporated by reference to Exhibit 10.1 of the Registrant’s Form 8-K filed on January 22, 2016) | |
| 12.1 * | Statement regarding Computation of Ratios | |
| 21.1 * | Subsidiaries of the Registrant | |
| 23.1 * | Consent of Independent Registered Public Accounting Firm | |
| 24.1 * | Power of Attorney (see signature page of this Annual Report on Form 10-K) | |
31.1 * |
Certification of Chief Executive Officer | |
| 31.2 * | Certification of Chief Financial Officer | |
| 32.1 * | Certificate of Chief Executive Officer | |
| 32.2 * | Certificate of Chief Financial Officer | |
| 101.INS * | XBRL Instance Document | |
| 101.SCH * | XBRL Taxonomy Extension Schema Document | |
| 101.CAL * | XBRL Taxonomy Extension Calculation Linkbase Document | |
| 101.LAB * | XBRL Taxonomy Extension Labels Linkbase Document | |
| 101.PRE * | XBRL Taxonomy Extension Presentation Linkbase Document | |
| 101.DEF * | XBRL Taxonomy Extension Definition Linkbase Document |
* Filed herewith.
+ Management contract or compensatory plan, contract or arrangement.
| 120 |