Attached files
| file | filename |
|---|---|
| EX-12 - EXHIBIT 12 - HAWAIIAN HOLDINGS INC | a10kexhibit122015.htm |
| EX-32.2 - EXHIBIT 32.2 - HAWAIIAN HOLDINGS INC | a10k2015exhibit322.htm |
| EX-32.1 - EXHIBIT 32.1 - HAWAIIAN HOLDINGS INC | a10k2015exhibit321.htm |
| EX-21.1 - EXHIBIT 21.1 - HAWAIIAN HOLDINGS INC | a10k2015exhibit211.htm |
| EX-23.1 - EXHIBIT 23.1 - HAWAIIAN HOLDINGS INC | a10k2015exhibit231.htm |
| EX-31.2 - EXHIBIT 31.2 - HAWAIIAN HOLDINGS INC | a10k2015exhibit312.htm |
| EX-31.1 - EXHIBIT 31.1 - HAWAIIAN HOLDINGS INC | a10k2015exhibit311.htm |
SECURITIES AND EXCHANGE COMMISSION
Washington, DC 20549
_______________________________________
FORM 10-K
(Mark One) | ||
x | ANNUAL REPORT PURSUANT TO SECTION 13 OR 15(d) OF THE SECURITIES EXCHANGE ACT OF 1934 | |
For the fiscal year ended December 31, 2015 | ||
or | ||
o | TRANSITION REPORT PURSUANT TO SECTION 13 OR 15(d) OF THE SECURITIES EXCHANGE ACT OF 1934 | |
For the transition period from to . | ||
Commission file number 1-31443
HAWAIIAN HOLDINGS, INC.
(Exact name of registrant as specified in its charter)
Delaware (State or other jurisdiction of incorporation or organization) | 71-0879698 (I.R.S. employer identification no.) | |
3375 Koapaka Street, Suite G-350, Honolulu, Hawai'i (Address of principal executive offices) | 96819 (Zip code) | |
Registrant's telephone number, including area code: (808) 835-3700
Securities registered pursuant to Section 12(b) of the Act:
Title of each class | Name of each exchange on which registered | |
Common Stock ($0.01 par value) | NASDAQ Stock Market, LLC (NASDAQ Global Select Market) | |
Securities registered pursuant to Section 12(g) of the Act: None
Indicate by check mark if the registrant is a well-known seasoned issuer, as defined in Rule 405 of the Securities Act.
Yes x No o
Indicate by check mark if the registrant is not required to file reports pursuant to Section 13 or Section 15(d) of the Act. Yes o No x
Indicate by check mark whether the registrant: (1) has filed all reports required to be filed by Section 13 or 15(d) of the Securities Exchange Act of 1934 during the preceding 12 months (or for such shorter period that the registrant was required to file such reports), and (2) has been subject to such filing requirements for the past 90 days. Yes x No o
Indicate by check mark whether the registrant has submitted electronically and posted on its corporate Web site, if any, every Interactive Data File required to be submitted and posted pursuant to Rule 405 of Regulation S-T during the preceding 12 months (or for such shorter period that the registrant was required to submit and post such files). Yes x No o
Indicate by check mark if disclosure of delinquent filers pursuant to Item 405 of Regulation S-K is not contained herein, and will not be contained, to the best of registrant's knowledge, in definitive proxy or information statements incorporated by reference in Part III of this Form 10-K or any amendment to this Form 10-K. o
Indicate by check mark whether the registrant is a large accelerated filer, an accelerated filer, a non-accelerated filer, or a smaller reporting company. See the definitions of "large accelerated filer", "accelerated filer" and "smaller reporting company" in Rule 12b-2 of the Exchange Act.
Large accelerated filer x | Accelerated filer o | Non-accelerated filer o (Do not check if a smaller reporting company) | Smaller reporting company o | |||
Indicate by check mark whether the registrant is a shell company (as defined in Exchange Rule Act 12b-2). Yes o No x
The aggregate market value of the voting and non-voting common equity stock held by non-affiliates of the registrant was approximately $1.2 billion, computed by reference to the closing sale price of the Common Stock on the NASDAQ Global Select Market, on June 30, 2015, the last business day of the registrant's most recently completed second fiscal quarter.
As of January 22, 2016, 53,401,439 shares of Common Stock of the registrant were outstanding.
DOCUMENTS INCORPORATED BY REFERENCE
Portions of the registrant's Proxy Statement for Annual Meeting of Stockholders to be held on May 18, 2016 will be incorporated by reference into Part III of this Form 10-K.
___________________________________________________________________________________________ | ||||
TABLE OF CONTENTS
Page | ||
1
CAUTIONARY NOTE REGARDING FORWARD-LOOKING STATEMENTS
This annual report on Form 10-K contains "forward-looking statements" within the meaning of the Private Securities Litigation Reform Act of 1995 that reflect our current views with respect to certain current and future events and financial performance. Such forward-looking statements include, without limitation: any expectations of operating expenses, deferred revenue, interest rates, income taxes, deferred tax assets, valuation allowance or other financial items; expectations regarding available seat miles, operating revenue per available seat mile and operating cost per available seat mile for the first quarter of 2016; statements regarding factors that may affect our operating results; statements regarding our goals, mission and areas of focus; statements regarding factors that may affect our ability to fund our working capital, capital expenditures or other general purpose needs; statements related to the impact of our low-cost structure on funding our growth strategy and market opportunities; statements regarding our ability to pay taxes with working capital; estimates of fair value measurements; statements related to aircraft maintenance and repair costs and deposits and timing of maintenance activities; statements related to cash flow from operations and seasonality; estimates of required funding of and contributions to our defined benefit pension and disability plan; estimates of annual fuel expenses and measure of the effects of fuel prices on our business; statements regarding the availability and cost of fuel; statements regarding our wages and benefits and labor costs and agreements; statements regarding the implementation, effective date and costs of compliance with regulations promulgated by the FAA, DOT and other regulatory agencies; statements related to airport rent rates and landing fees; statements regarding aircraft rent expense; statements regarding the status of federal and state legislation; statements regarding our total capacity and yields on routes; statements regarding compliance with potential environmental regulations; statements regarding potential dilution of our securities; statements regarding cost liability and deferred revenue estimates related to the frequent flyer program; statements related to our hedging program; statements concerning the impact of, and changes to, accounting principles, policies and estimates; statements regarding our net operating loss carryforwards; statements regarding credit card holdback; statements regarding the availability of financing; statements regarding our capital expenditures; statements regarding potential violations under the our debt or lease obligations; statements regarding our intent to settle the principal amount of our convertible notes in cash; statements regarding our ability to comply with covenants under our financing arrangements; statements regarding our intention to obtain additional debt or lease financing for aircraft deliveries; statements related to capital expenditures impacting future debt levels and pre-delivery payments; statements regarding the expiration of aircraft leases; statements related to risk management, credit risks and air traffic liability; statements related to future U.S. and global economic conditions or performance; statements related to changes in our fleet plan and related cash outlays; statements related to expected delivery of new aircraft and associated costs for spare engines, replacement parts, maintenance, employee training and other implementation activities; statements projecting non-aircraft related capital expenditures; statements related to the effects of any litigation on our operations or business; statements related to the amount of competition on our routes by other domestic and foreign carriers; statements related to continuous investments in technology and systems; and statements as to other matters that do not relate strictly to historical facts or statements of assumptions underlying any of the foregoing. Words such as "expects," "anticipates," "projects," "intends," "plans," "believes," "estimates," variations of such words, and similar expressions are also intended to identify such forward- looking statements. These forward-looking statements are and will be, as the case may be, subject to many risks, uncertainties and factors relating to our operations and business environment, all of which may cause our actual results to be materially different from any future results, expressed or implied, in these forward-looking statements.
The risks, uncertainties and assumptions referred to above that could cause our results to differ materially from the results expressed or implied by such forward-looking statements include those discussed under the heading "Risk Factors" in Item 1A in this Annual Report on Form 10-K and the risks, uncertainties and assumptions discussed from time to time in our other public filings and public announcements. All forward-looking statements included in this document are based on information available to us as of the date hereof. We undertake no obligation to publicly update or revise any forward-looking statements to reflect events or circumstances that may arise after the date hereof.
2
PART I
ITEM 1. BUSINESS.
Overview
Hawaiian Holdings, Inc. (the Company, Holdings, we, us and our) is a holding company incorporated in the State of Delaware. The Company's primary asset is the sole ownership of all issued and outstanding shares of common stock of Hawaiian Airlines, Inc. (Hawaiian). Hawaiian was originally incorporated in January 1929 under the laws of the Territory of Hawai'i and became our indirect wholly-owned subsidiary pursuant to a corporate restructuring that was consummated in August 2002. Hawaiian became a Delaware corporation and the Company's direct wholly-owned subsidiary concurrent with its reorganization and reacquisition by the Company in June 2005.
Our Business
We are engaged in the scheduled air transportation of passengers and cargo amongst the Hawaiian Islands (the Neighbor Island routes), between the Hawaiian Islands and certain cities in the United States (the North America routes), and between the Hawaiian Islands and the South Pacific, Australia, New Zealand and Asia (the International routes), collectively referred to as our Scheduled Operations. We offer non-stop service to Hawai'i from more U.S. gateway cities (11) than any other airline, and also provide approximately 160 daily flights between the Hawaiian Islands. In addition, we also operate various charter flights.
We are the longest serving airline as well as the largest airline headquartered in the State of Hawai'i, and the 10th largest domestic airline in the United States based on revenue passenger miles (RPMs) reported by the Research and Innovative Technology Administration Bureau of Transportation Services as of October 2015, the latest data available.
At December 31, 2015, our fleet consisted of 18 Boeing 717-200 aircraft for the Neighbor Island routes and eight Boeing 767-300 aircraft and 22 Airbus A330-200 aircraft for the North America, International and charter routes. We also own three ATR42 turboprop aircraft for the "'Ohana by Hawaiian" Neighbor Island service. In 2015, we purchased three ATR72 turboprop aircraft for the expansion of our cargo service.
Our goal is to be the number one destination carrier serving Hawai'i. We are devoted to the travel needs of the residents and visitors of Hawai'i and offer a unique travel experience. We are strongly rooted in the culture and people of Hawai'i and seek to provide quality service to our customers that exemplifies the spirit of aloha.
Outlook
Our mission every year is to grow a profitable airline with a passion for excellence, our customers, our people and the spirit of Hawai'i. In 2016, we will continue to focus on strengthening our competitive position in the markets that we serve primarily by continuing to mature the routes we launched over the past several years, improving our sales distribution channels, maintaining a disciplined approach in controlling our costs, and growing our offering of value-added products and services.
Flight Operations
Our flight operations are based in Honolulu, Hawai'i. At December 31, 2015, we operated 213 scheduled flights with:
• | Daily service on our North America routes between the State of Hawai'i and Los Angeles, Oakland, Sacramento, San Diego, San Francisco and San Jose, California; Las Vegas, Nevada; Phoenix, Arizona; Portland, Oregon; and Seattle, Washington; and scheduled service between the State of Hawai'i and New York City, New York. |
• | Daily service on our Neighbor Island routes among the six major islands of the State of Hawai'i. |
• | Daily service on our International routes between the State of Hawai'i and Sydney, Australia; and Tokyo and Osaka, Japan and scheduled service between the State of Hawai'i and Pago Pago, American Samoa; Papeete, Tahiti; Brisbane, Australia; Auckland, New Zealand; Sapporo, Japan; Seoul, South Korea; and Beijing, China. |
• | Other ad hoc charters. |
3
Fuel
Our operations and financial results are significantly affected by the availability and price of jet fuel. The following table sets forth statistics about our aircraft fuel consumption and cost.
Year | Gallons consumed | Total cost, including taxes | Average cost per gallon | Percent of operating expenses | |||||||||
(in thousands) | |||||||||||||
2015 | 234,183 | $ | 417,728 | $ | 1.78 | 22.1 | % | ||||||
2014 | 230,199 | $ | 678,253 | $ | 2.95 | 32.8 | % | ||||||
2013 | 226,214 | $ | 698,802 | $ | 3.09 | 34.6 | % | ||||||
As illustrated by the table above, fuel costs constitute a significant portion of our operating expenses. We purchase aircraft fuel at prevailing market prices, but seek to manage market risk through the execution of a hedging strategy. To manage economic risks associated with fluctuations in aircraft fuel prices, we periodically enter into derivative financial instruments such as heating oil puts and swaps and crude oil call and put options and collars.
Aircraft Maintenance
Our aircraft maintenance programs consist of a series of phased or continuous checks for each aircraft type. These checks are performed at specified intervals measured by calendar months, time flown or by the number of takeoffs and landings, or cycles operated. In addition, we perform inspections, repairs and modifications of our aircraft in response to Federal Aviation Administration (FAA) directives. Checks range from "walk around" inspections before each flight's departure, to major overhauls of the airframes which can take several weeks to complete. Aircraft engines are subject to phased maintenance programs designed to detect and remedy potential problems before they occur. The service lives of certain airframe and engine parts and components are time or cycle controlled, and such parts and components are replaced or refurbished prior to the expiration of their time or cycle limits. We have contracts with third parties to provide certain maintenance on our aircraft and aircraft engines.
Marketing and Ticket Distribution
We utilize various distribution channels including our website, www.hawaiianairlines.com, primarily for our North America and Neighbor Island routes, and travel agencies and wholesale distributors primarily for our International routes.
Our website, now available in English, Japanese, Korean and Chinese, offers our customers information on our flight schedules, information on our HawaiianMiles frequent flyer program, the ability to book reservations on our flights or connecting flights with any of our code-share partners, the status of our flights as well as the ability to purchase hotels, cars and vacation packages. We also publish fares with web-based travel services such as Orbitz, Travelocity, Expedia, Hotwire and Priceline. These comprehensive travel planning websites provide customers with convenient online access to airline, hotel, car rental and other travel services.
Frequent Flyer Program
The HawaiianMiles frequent flyer program was initiated in 1983 to encourage and develop customer loyalty. HawaiianMiles allows passengers to earn mileage credits by flying with us and our partner carriers. In addition, members earn mileage credits for patronage with our other program partners, including credit card issuers, hotels, car rental firms and general merchants, pursuant to our exchange partnership agreements. We also sell mileage credits to other companies participating in the program.
HawaiianMiles members have a choice of various awards based on accumulated mileage credits, with most of the awards being for free air travel on Hawaiian.
HawaiianMiles accounts with no activity (frequent flyer miles earned or redeemed) for 18 months automatically expire (36 months for non-U.S. members). The number of free travel awards used for travel on Hawaiian was approximately 512,000 in 2015. The amount of free travel awards as a percentage of total revenue passengers was approximately 5% in 2015. We believe displacement of revenue passengers is minimal due to our ability to manage frequent flyer seat inventory, and the relatively low ratio of free award usage to total revenue passengers.
Code-Share and Other Alliances
We have marketing alliances with other airlines that provide reciprocal frequent flyer mileage accrual and redemption privileges and code-shares on certain flights (one carrier placing its name and flight numbers, or code, on flights operated by the other carrier). These programs enhance our revenue opportunities by:
4
• | increasing value to our customers by offering easier access to more travel destinations and better mileage accrual/redemption opportunities; |
• | gaining access to more connecting traffic from other airlines; and |
• | providing members of our alliance partners' frequent flyer programs an opportunity to travel on our system while earning mileage credit in the alliance partners' programs. |
Our marketing alliances with other airlines as of December 31, 2015 were as follows:
Hawaiian Miles Frequent Flyer Agreement | Other Airline Frequent Flyer Agreement | Code-share—Hawaiian Flight # on Flights Operated by Other Airline | Code-share—Other Airline Flight # on Flights Operated by Hawaiian | ||||
Air China | No | No | Yes | Yes | |||
All Nippon Airways (ANA) | Yes | Yes | Yes | Yes | |||
American Airlines (American) | Yes | Yes | No | Yes | |||
China Airlines | Yes | Yes | Yes | Yes | |||
Delta Air Lines (Delta) | No | Yes | No | Yes | |||
JetBlue | Yes | Yes | Yes | No | |||
Korean Air | Yes | Yes | Yes | Yes | |||
United Airlines (United) | No | Yes | No | Yes | |||
Virgin America (Virgin) | Yes | Yes | Yes | No | |||
Virgin Atlantic Airways | Yes | Yes | No | No | |||
Virgin Australia | Yes | Yes | No | Yes | |||
Although these programs and services increase our ability to be more competitive, they also increase our reliance on third parties.
Competition
The airline industry is extremely competitive. We believe that the principal competitive factors in the airline industry are:
• | Price; |
• | Flight frequency and schedule; |
• | On-time performance and reliability; |
• | Name recognition; |
• | Marketing affiliations; |
• | Frequent flyer benefits; |
• | Customer service; |
• | Aircraft type; and |
• | In-flight services. |
North America—We face multiple competitors on our North America routes including major network carriers such as Alaska Airlines, American, United, Delta and Virgin. Various charter companies also provide non scheduled service to Hawai'i mostly under public charter arrangements.
Neighbor Island—Our Neighbor Island competitors consist of regional carriers, which include Island Air, Mokulele Airlines and a number of other "air taxi" companies.
International—Currently, we are the only provider of direct service between Honolulu and each of Sapporo, Japan; Pago Pago, American Samoa; and Papeete, Tahiti. However, we face multiple competitors from both domestic and foreign carriers on our other International routes.
5
Employees
As of December 31, 2015, we had 5,548 active employees, and approximately 84% of our employees were covered by labor agreements with the following organized labor groups:
Employee Group | Represented by | Number of Employees | Agreement amendable on(*) | |||||
Flight deck crew members | Air Line Pilots Association (ALPA) | 606 | September 15, 2015 | |||||
Cabin crew members | Association of Flight Attendants (AFA) | 1,704 | January 1, 2017 | |||||
Maintenance and engineering personnel | International Association of Machinists and Aerospace Workers (IAM-M) | 782 | April 20, 2014 | ** | ||||
Clerical | IAM-C | 1,518 | January 1, 2014 | ** | ||||
Flight dispatch personnel | Transport Workers Union (TWU) | 39 | November 1, 2013 | |||||
(*) Our relations with our labor organizations are governed by Title II of the Railway Labor Act of 1926, pursuant to which the collective bargaining agreements between us and these organizations do not expire but instead become amendable as of a certain date if either party wishes to modify the terms of the agreement.
(**) These agreements were amended in January 2016 and become amendable again in January 2021.
Seasonality
Hawai'i is a popular vacation destination for travelers. For that reason, our operations and financial results are subject to substantial seasonal and cyclical volatility, primarily due to leisure and holiday travel patterns. Demand levels are typically weaker in the first quarter of the year with stronger demand periods occurring during June, July, August and December. We may adjust our pricing or the availability of particular fares to obtain an optimal passenger load factor depending on seasonal demand differences.
Customers
Our business is not dependent upon any single customer, or a few customers. The loss of any one customer would not have a material adverse effect on our business.
Regulation
Our business is subject to extensive and evolving federal, state and local laws and regulations. Many governmental agencies regularly examine our operations to monitor compliance with applicable laws and regulations. Governmental authorities can enforce compliance with applicable laws and regulations and obtain injunctions or impose civil or criminal penalties or modify, suspend or revoke our operating certificates in case of violations.
Industry Regulations
We are subject to the regulatory jurisdiction of the U.S. Department of Transportation (DOT) and the Federal Aviation Administration (FAA). The DOT has jurisdiction over international routes and fares for some countries (based upon treaty relations with those countries), consumer protection policies including baggage liability and denied boarding compensation, and unfair competitive practices as set forth in the Airline Deregulation Act of 1978. The FAA has regulatory jurisdiction over flight operations, including equipment, ground facilities, security systems, maintenance and other safety matters. Pursuant to these regulations, we have established, and the FAA has approved, a maintenance program for each type of aircraft we operate that provides for the ongoing maintenance of our aircraft, ranging from frequent routine inspections to major overhauls.
Maintenance Directives
The FAA approves all airline maintenance programs, including modifications to the programs. In addition, the FAA licenses the repair stations and mechanics that perform inspections, repairs and overhauls, as well as the inspectors who monitor the work.
The FAA frequently issues airworthiness directives, often in response to specific incidents or reports by operators or manufacturers, requiring operators of specified equipment types to perform prescribed inspections, repairs or modifications within stated time periods or numbers of cycles. In the last several years, the FAA has issued a number of maintenance directives and other regulations relating to, among other things, wiring requirement for aging aircraft, fuel tank flammability, cargo compartment fire detection/suppression systems, collision avoidance systems, airborne windshear avoidance systems, noise abatement and increased inspection requirements.
6
Airport Security
The Aviation and Transportation Security Act (ATSA) mandates that the Transportation Security Administration (TSA) provide for the screening of all passengers and property, including mail, cargo, carry-on and checked baggage, and other articles that will be carried aboard a passenger aircraft. Under the ATSA, substantially all security screeners at airports are federal employees and significant other elements of airline and airport security are now overseen and performed by federal employees, including security managers, law enforcement officers and Federal Air Marshals. The ATSA also provides for increased security on flight decks of aircraft and requires Federal Air Marshals to be present on certain flights, improved airport perimeter access security, airline crew security training, enhanced security screening of passengers, baggage, cargo, mail, employees and vendors, enhanced training and qualifications of security screening personnel, provision of passenger data to U.S. Customs and Border Protection and enhanced background checks.
The TSA also has the authority to impose additional fees on the air carriers, if necessary, to cover additional federal aviation security costs.
Environmental and Employee Safety and Health
We are subject to various laws and government regulations concerning environmental matters and employee safety and health in the U.S. and other countries in which we do business. Many aspects of airlines' operations are subject to increasingly stringent federal, state, local and foreign laws protecting the environment. U.S. federal laws that have a particular impact on us include the Airport Noise and Capacity Act of 1990, the Clean Air Act, the Resource Conservation and Recovery Act, the Clean Water Act, the Safe Drinking Water Act, and the Comprehensive Environmental Response, Compensation, and Liability Act. Certain of our operations are also subject to the oversight of the Occupational Safety and Health Administration (OSHA) concerning employee safety and health matters. The U.S. Environmental Protection Agency (EPA), OSHA, and other federal agencies have been authorized to promulgate regulations that affect our operations. In addition to these federal activities, various states have been delegated certain authority under the aforementioned federal statutes. Many state and local governments have adopted environmental and employee safety and health laws and regulations, some of which are similar to or stricter than federal requirements, such as California.
The EPA is authorized to regulate aircraft emissions and has historically implemented emissions control standards previously adopted by the International Civil Aviation Organization. Our aircraft comply with the existing EPA standards as applicable by engine design date.
We seek to minimize the impact of carbon emissions from our operations through reductions in our fuel consumption and other efforts. We have reduced the fuel needs of our aircraft fleet through the retirement and replacement of certain elements of our fleet and with newer, more fuel efficient aircraft. In addition, we have implemented fuel saving procedures in our flight and ground support operations that further reduce carbon emissions. In 2012, we earned the first-ever aviation based carbon credits, through the reduction of our carbon dioxide emissions with the use of an eco-friendly engine washing technology. We are also supporting efforts to develop alternative fuels and efforts to modernize the air traffic control system in the U.S. as part of our efforts to reduce our emissions and minimize our impact on the environment.
Noise Abatement
Under the Airport Noise and Capacity Act, the DOT allows local airport authorities to implement procedures designed to abate special noise problems, provided such procedures do not unreasonably interfere with interstate and foreign commerce, or the national transportation system. Certain airports, including the major airports at Los Angeles, San Diego, San Francisco, and San Jose, California, Sydney, Australia and Tokyo, Japan, have established airport restrictions to limit noise, including restrictions on aircraft types to be used and limits on the number of hourly or daily operations or the time of such operations. Local authorities at other airports could consider adopting similar noise regulations. In some instances, these restrictions have caused curtailments in services or increases in operating costs, and such restrictions could limit our ability to expand our operations.
Civil Reserve Air Fleet Program
The U.S. Department of Defense regulates the Civil Reserve Air Fleet (CRAF) and government charters. We have elected to participate in the CRAF program by agreeing to make aircraft available to the federal government for use by the U.S. military under certain stages of readiness related to national emergencies. The program is a standby arrangement that allows the U.S. Department of Defense U.S. Transportation Command to call on as many as 13 contractually committed Hawaiian aircraft and crews to supplement military airlift capabilities. None of our aircraft are presently mobilized under this program.
Other Regulations
The State of Hawai'i is uniquely dependent upon air transportation. The 2008 shutdowns of air carriers Aloha Airlines and ATA Airlines affected the State of Hawai'i, and its legislature responded by enacting legislation that reflects and attempts to address
7
its concerns. For example, House Bill 2250 HD1, Act 1 of the 2008 Special Session, establishes a statutory scheme for the regulation of Hawai'i neighbor island air carriers, provided that federal legislation is enacted to permit its implementation. Congress has not enacted any legislation that would allow this legislation to go into effect.
Additionally, several aspects of airline operations are subject to regulation or oversight by federal agencies other than the FAA and the DOT. Federal antitrust laws are enforced by the U.S. Department of Justice. The U.S. Postal Service has jurisdiction over certain aspects of the transportation of mail and related services provided by our cargo services. Labor relations in the air transportation industry are generally regulated under the Railway Labor Act. We and other airlines certificated prior to October 24, 1978 are also subject to preferential hiring rights granted by the Airline Deregulation Act to certain airline employees who have been furloughed or terminated (other than for cause). The Federal Communications Commission issues licenses and regulates the use of all communications frequencies assigned to us and the other airlines. There is increased focus on consumer protection both on the federal and state level. We cannot predict the cost of such requirements on our operations.
Additional laws and regulations are proposed from time to time, which could significantly increase the cost of airline operations by imposing additional requirements or restrictions. U.S. law restricts the ownership of U.S. airlines to corporations where no more than 25% of the voting stock may be held by non-U.S. citizens and the airline must be under the actual control of U.S. citizens. The President and two thirds of the Board of Directors and other managing officers must also be U.S. citizens. Regulations also have been considered from time to time that would prohibit or restrict the ownership and/or transfer of airline routes or takeoff and landing slots and authorizations. Also, the award of international routes to U.S. carriers (and their retention) is regulated by treaties and related agreements between the U.S. and foreign governments, which are amended from time to time. We cannot predict what laws and regulations will be adopted or what changes to international air transportation treaties will be adopted, if any, or how we will be affected by those changes.
Business Segment Data
We operate in a single industry segment. All required financial segment information can be found in the consolidated financial statements.
Information about Geographic Revenue and Foreign Operations
Information concerning revenues by geographic area is set forth in Note 14 to the consolidated financial statements.
Available Information
General information about us, including the charters for the committees of our Board of Directors, can be found at https://www.hawaiianairlines.com. Our annual reports on Form 10-K, quarterly reports on Form 10-Q and current reports on Form 8-K, as well as any amendments and exhibits to those reports, are available free of charge through our website as soon as reasonably practicable after we electronically file them with, or furnish them to, the Securities and Exchange Commission (SEC). The SEC maintains an Internet site that contains reports, proxy and information statements, and other information regarding issuers that file electronically with the SEC, which can be found at http://www.sec.gov. Information on our website is not incorporated into this Annual Report on Form 10-K or our other securities filings and is not a part of such filings.
ITEM 1A. RISK FACTORS.
In addition to the risks identified elsewhere in this report, the following risk factors apply to our business, results of operations and financial conditions:
ECONOMIC RISKS
Our business is affected by global economic volatility.
Our business and results of operations are significantly impacted by general world-wide economic conditions. Demand for discretionary purchases including air travel and vacations to Hawai'i remains unpredictable. Deterioration in demand resulting from economic uncertainty or another recession may result in a reduction in our passenger traffic and/or increased competitive pressure on fares in the markets we serve, resulting in a negative impact to our results of operations and financial condition. We cannot assure that we would be able to offset such revenue reductions by reducing our costs.
8
Our business is highly dependent on tourism to, from and amongst the Hawaiian Islands and our financial results could suffer if there is a downturn in tourism levels.
Our principal base of operations is in Hawai'i and our revenue is linked primarily to the number of travelers (mostly tourists) to, from and amongst the Hawaiian Islands. Hawai'i tourism levels are affected by, among other things, the political and economic climate in Hawai'i's main tourism markets, the availability of hotel accommodations, promotional spending by competing destinations, the popularity of Hawai'i as a tourist destination relative to other vacation destinations and other global factors, including natural disasters, safety and security. From time to time, various events and industry specific problems such as labor strikes have had a negative impact on tourism in Hawai'i. The occurrence of natural disasters, such as earthquakes and tsunamis, in Hawai'i or other parts of the world, could also have a material adverse effect on Hawai'i tourism. In addition, the potential or actual occurrence of terrorist attacks, wars, and the threat of other negative world events have had, and may in the future again have, a material adverse effect on Hawai'i tourism. No assurance can be given that the level of passenger traffic to Hawai'i will not decline in the future. A decline in the level of Hawai'i passenger traffic could have a material adverse effect on our results of operations and financial condition.
Our business is exposed to foreign currency exchange rate fluctuations.
Our business is expanding internationally with an increasing percentage of our passenger revenue generated from our International routes. Fluctuations in foreign currencies can significantly affect our results of operations and financial condition. To manage the effects of fluctuating exchange rates, we periodically enter into foreign currency forward contracts. There is no assurance that such agreements will protect us against foreign currency exchange rate fluctuations during unfavorable market conditions or that our counterparties will be able to perform under these hedge arrangements.
Our business is highly dependent on the price and availability of fuel.
Our results and operations are heavily impacted by the price and availability of jet fuel. While we have benefited recently from lower fuel costs, we cannot assure you that fuel costs will remain low in the future. The cost and availability of jet fuel remain volatile and are subject to political, economic and market factors that are generally outside of our control. Prices may be affected by many factors including, without limitation, the impact of political instability, crude oil production and refining capacity, unexpected changes in the availability of petroleum products due to disruptions at distribution systems or refineries, unpredicted increases in demand due to weather or the pace of global economic growth, inventory reserve levels of crude oil and other petroleum products, the relative fluctuation between the U.S. dollar and other major currencies and the actions of speculators in commodity markets. Because of the effects of these factors on the price and availability of jet fuel, the cost and future availability of fuel cannot be predicted with any degree of certainty. Also, due to the competitive nature of the airline industry, there can be no assurance that we will be able to increase our fares or other fees to sufficiently offset increased fuel prices.
We enter into derivative agreements to protect against the volatility of fuel costs. There is no assurance that such agreements will protect us during unfavorable market conditions or that our counterparties will be able to perform under these hedge arrangements. Also, if fuel prices fall significantly below the levels in existence at the time we enter into our hedging contracts, we may be required to post a significant amount of cash collateral, which could have an impact on the level of our unrestricted cash and cash equivalents and adversely affect our liquidity.
Also, see Item 7A, Quantitative and Qualitative Disclosures About Market Risk, for further information regarding our exposure to the price of fuel.
COMPETITIVE ENVIRONMENT RISKS
We operate in an extremely competitive environment.
The airline industry is characterized by low profit margins, high fixed costs and significant price competition. We currently compete with other airlines on our Neighbor Island, North America and International routes. The commencement of, or increase in, service on our routes by existing or new carriers could negatively impact our operating results. Many of our competitors on our North America and International routes are larger and have greater financial resources and brand recognition than we do. Aggressive marketing tactics or a prolonged fare war initiated by one or more of these competitors could adversely affect our financial resources and our ability to compete in these markets. Since airline markets have few natural barriers to entry, we also face the threat of new entrants in all of our markets. For example, Virgin launched flights from the West Coast to Hawai'i in the fourth quarter of 2015, and while Southwest Airlines has taken steps to enable it to provide service to Hawai'i in the future, it has yet to formally announce the service.
9
Furthermore, large network carriers have significantly reduced their costs and adjusted their routes to compete with low-cost carriers (LCC) in their existing markets by diverting resources to long-haul markets such as Hawai'i, where LCC competition has been less severe. Additional capacity to Hawai'i, whether from network carriers or LCCs, could decrease our share of the markets in which we operate, could cause a decline in our yields, or both, which could have a material adverse effect on our results of operations and financial condition.
Airline bankruptcy restructuring, strategic combinations or industry consolidation could have an impact on our competitive environment.
Many of our competitors have dramatically reduced operating costs through a combination of bankruptcy restructuring, industry consolidation and vendor and labor negotiations to increase market strength. Several domestic airlines were able to reduce labor costs, restructure debt and lease agreements and implement other financial improvements through the bankruptcy process. In addition, certain of our competitors have merged (for example, the American Airlines and US Airways merger in December 2013) to create larger and more financially sound airlines.
Through consolidation, carriers have the opportunity to achieve cost reductions by eliminating redundancy in their networks and operating structures. With reduced costs, these competitors are more capable of operating profitably in an environment of reduced fares and may, as a result, increase service in our primary markets or reduce fares to attract additional customers. Because airline customers are price sensitive, we cannot ensure that we will be able to attract a sufficient number of customers at sufficiently high fare levels to generate profitability, or that we will be able to reduce our operating costs sufficiently to remain competitive with these other airlines.
The concentration of our business in Hawai'i, and between Hawai'i and the U.S. mainland, provides little diversification of our revenue.
During fiscal year 2015, approximately 75% of our passenger revenue was generated from air transportation between the Hawaiian Islands and the U.S. mainland, and amongst the Hawaiian Islands. Many of our competitors, particularly major network carriers with whom we compete on our North America routes, enjoy greater geographical diversification of their revenue. A reduction in the level of demand for travel within Hawai'i, or to Hawai'i from the U.S. mainland, or an increase in the level of industry capacity on these routes may reduce the revenue we are able to generate and adversely affect our financial results. As these routes account for a significantly higher proportion of our revenue than they do for many of our competitors, such a reduction would have a relatively greater adverse effect on our financial results.
Our business is affected by the competitive advantages held by network carriers in the North America market.
During fiscal year 2015, over 50% of our passenger revenue was generated from our North America routes. The majority of competition on our North America routes is from network carriers such as Alaska, American, Delta and United that have a number of competitive advantages. Primarily, network carriers generate passenger traffic from and throughout the U.S. mainland, which enable them to attract higher customer traffic levels as compared to us.
In contrast, we lack a comparable direct network to feed passengers to our North America flights and are therefore more reliant on passenger demand in the specific cities we serve. We also rely on our code-share partner agreements (jetBlue, Virgin, America Airlines, etc.) to provide customers access to and from North America destinations currently unserved by us. Most network carriers operate from hubs, which can provide a built-in market of passengers, depending on the economic strength of the hub city and the size of the customer group that frequent the airline. Our Honolulu and Maui hubs do not originate a large proportion of North American travel, nor do they have the population or potential customer franchise of a larger city to provide us with a built-in market. Passengers in the North America market, for the most part, do not originate in Honolulu, but rather on the U.S. mainland, making Honolulu primarily a destination rather than an origin of passenger traffic.
Our Neighbor Island routes are affected by increased capacity provided by our competitors.
During fiscal year 2015, approximately 25% of our passenger revenue was generated from our Neighbor Island routes. Although we enjoy a strong competitive position on the Neighbor Island service, our competitors have increased capacity to Hawai'i either by introducing new routes or increasing the frequency of existing routes from North America to the Neighbor Islands. This additional capacity provided by our competitors has the effect of decreasing our share of traffic on our Neighbor Island routes, which could have a material adverse effect on our results of operations and financial condition.
10
Our International routes are affected by competition from domestic and foreign carriers.
During fiscal year 2015, approximately 20% of our revenue was generated from our International routes. Our competitors on these routes include both domestic and foreign carriers. Both domestic and foreign competitors have a number of competitive advantages that may enable them to attract higher customer traffic levels as compared to us.
Many of our domestic competitors have joined airline alliances, which provide customers access to each participating airline's international network, allowing for convenience and connectivity to their destinations. These alliances formed by our domestic competitors have increased in recent years. In some instances our domestic competitors have been granted antitrust exemptions to form joint venture arrangements in certain geographies, further deepening their cooperation on certain routes. We currently do not participate in a world-wide airline alliance or any joint ventures, which may negatively impact our market share and operations as capacity provided by our competitors increase. To mitigate this risk, we rely on code-share agreements with partner airlines to provide customers access to international destinations currently unserved by us.
Many of our foreign competitors are network carriers that benefit from network feed to support International routes on which we compete. In contrast, we lack a comparable direct network to feed passengers to our International flights, and are therefore more reliant on passenger demand in the specific destinations that we serve. Most network carriers operate from hubs, which can provide a built-in home base market of passengers. Passengers on our International routes, for the most part, do not originate in Hawai'i, but rather internationally, in these foreign markets' home base. We also rely on our code-share agreements and our relationships with travel agencies and wholesale distributors to provide customers access to and from International destinations currently unserved by us.
INFORMATION TECHNOLOGY AND THIRD-PARTY RISKS
If we do not maintain the privacy and security of customer-related information or fail to comply with applicable U.S. and foreign privacy or data security regulations or security standards imposed by our commercial partners, we could damage our reputation, incur substantial additional costs and become subject to litigation or regulatory penalties.
We receive, retain, and transmit certain personal information about our customers and we are subject to increasing legislative, regulatory and customer focus on privacy issues and data security. A number of our commercial partners, including credit card companies, have imposed data security standards that we are obligated to meet and these standards continue to evolve. We will continue our efforts to meet new and increasing privacy and security standards; however, it is possible that such new standards may prove difficult to meet and require us to expend additional resources. Additionally, any compromise of our technology systems could result in the loss, disclosure, misappropriation of or access to our customers’, employees’ or business partners’ information. Any such loss, disclosure, misappropriation or access could result in legal claims or proceedings, liability or regulatory penalties under laws protecting the privacy of personal information. Any significant data breach or our failure to comply with applicable U.S. and foreign privacy or data security regulations or security standards imposed by our commercial partners may adversely affect our reputation, business, results of operations and financial condition and may require that we expend significant additional resources related to the security of information systems.
We are increasingly dependent on technology and automated systems to operate our business.
We depend heavily on technology and automated systems to effectively operate our business. These systems include flight operations systems, communications systems, airport systems, reservations systems, management and accounting systems, commercial websites, including www.hawaiianairlines.com, and other systems, all of which must be able to accommodate high traffic volumes, maintain secure information and provide accurate flight information, as well as process critical financial related transactions. Any substantial or repeated failures of these systems could negatively affect our customer service, compromise the security of customer information, result in the loss of important data, loss of revenue and increased costs, and generally harm our business. Like other companies, our systems may be vulnerable to disruptions due to events beyond our control, including natural disasters, power disruptions, software or equipment failures, terrorist attacks, cybersecurity threats, computer viruses and hackers. There can be no assurance that the measures we have taken to reduce the adverse effects of certain potential failures or disruptions are adequate to prevent or remedy disruptions of our systems. In addition, we will need to continuously make significant investments in technology to periodically upgrade and replace existing systems. If we are unable to make these investments or fail to successfully implement, upgrade or replace our systems, our business could be adversely impacted.
11
We are highly reliant on third-party contractors to provide certain facilities and services for our operations, and termination of our third-party agreements could have a potentially adverse effect on our financial results.
We have historically relied on outside vendors for a variety of services and functions critical to our business, including aircraft maintenance and parts, code-sharing, reservations, computer services including hosting and software maintenance, accounting, frequent flyer programs, passenger processing, ground facilities, baggage and cargo handling, personnel training and the distribution and sale of airline seats. As part of our cost-control efforts, our reliance on outside vendors has increased and may continue to do so in the future.
The failure of any of our third-party service providers to adequately perform our service obligations, or other interruptions of services, may reduce our revenues, increase expenses, and prevent us from operating our flights and providing other services to our customers. In addition, our business and financial performance could be materially harmed if our customers believe that our services are unreliable or unsatisfactory.
LABOR RELATIONS AND RELATED COSTS RISKS
We are dependent on satisfactory labor relations.
Labor costs are a significant component of airline expenses and can substantially impact an airline's results of operations. A significant portion of our workforce is represented by labor unions. We may make strategic and operational decisions that require the consent of one or more of these labor unions, and these labor unions could demand additional wages, benefits or other consideration in return for their consent.
In addition, we have entered into collective bargaining agreements with our pilots, mechanical group employees, clerical group employees, flight attendants and dispatchers. We cannot ensure that future agreements with our employees' labor unions will be on terms in line with our expectations or comparable to agreements entered into by our competitors, and any future agreements may increase our labor costs or otherwise adversely affect our business. If we are unable to reach an agreement with any unionized work group, we may be subject to future work interruptions and/or stoppages, which may hamper or halt operations.
Our operations may be adversely affected if we are unable to attract and retain qualified personnel and key executives.
We are dependent on the knowledge and expertise of our key executives. Attracting and retaining such personnel in the airline industry is highly competitive. We cannot be certain that we will be able to retain our key executives or attract other qualified personnel in the future. Any inability to retain our key executives, or attract and retain additional qualified executives, could have a negative impact on our operations.
In addition, as we continue to expand our operations through the acquisition of new aircraft and introduction of service to new markets, it may be challenging to attract qualified personnel including pilots, mechanics and other skilled labor. As we compete with other carriers for qualified personnel we also face the challenge of attracting individuals who embrace our team-oriented, friendly and customer-driven corporate culture. Our inability to attract and retain qualified personnel who embrace our corporate culture could have a negative impact on our reputation and overall operations.
A higher than normal number of pilot retirements could adversely affect us.
We currently have a large number of pilots eligible for retirement. Among other things, the extension of pilot careers facilitated by the FAA’s 2007 modification of the mandatory retirement age from age 60 to age 65 has now been fully implemented, resulting in large numbers of pilots in the industry approaching the revised mandatory retirement age. If pilot retirements were to exceed normal levels in the future, and we are not able to replace these pilots in a timely fashion, it may adversely affect our operations.
STRATEGY AND BRAND RISKS
Our failure to successfully implement our route and network maturation strategy could harm our business.
Our route maturation strategy includes initiatives to increase revenue, decrease costs, mature our network, and improve our distribution sales channels. It is critical that we execute upon our planned strategy in order for our business to attain economies of scale and to sustain or improve our results of operations. If we are unable to utilize and fill increased capacity provided by additional aircraft entering our fleet, hire and retain skilled personnel, or secure the required equipment and facilities in a cost-
12
effective manner, we may be unable to successfully develop and grow our existing markets, which may adversely affect our business and operations.
We continue to strive toward aggressive cost-containment goals which are an important part of our business strategy to offer the best value to passengers through competitive fares while maintaining acceptable profit margins and return on capital. We believe a lower cost structure will better position us to fund our strategy and take advantage of market opportunities. If we are unable to adequately contain our non-fuel unit costs, our financial results may suffer.
Our reputation and financial results could be harmed in the event of adverse publicity, including the event of an aircraft accident or incident.
Our customer base is broad and our business activities have significant prominence, particularly in Hawai'i and other destinations we serve. Consequently, negative publicity resulting from real or perceived shortcomings in our customer service, employee relations, business conduct, or other events affecting our operations could negatively affect the public image of our company and the willingness of customers to purchase services from us, which could affect our financial results.
Additionally, we are exposed to potential losses that may be incurred in the event of an aircraft accident or incident. Any such accident or incident involving our aircraft or an aircraft operated by one of our code-share partners could involve not only the repair or replacement of a damaged aircraft and its consequential temporary or permanent loss of revenue, but also significant potential claims of injured passengers and others. We are required by the U.S. Department of Transportation (DOT) to carry liability insurance, and although we currently maintain liability insurance in amounts consistent with the industry, we cannot be assured that our insurance coverage will adequately cover us from all claims and we may be forced to bear substantial losses incurred with the accident. In addition, any aircraft accident or incident could cause a public perception that we are less safe or reliable than other airlines, which would harm our business.
AIRLINE INDUSTRY, REGULATION AND RELATED COSTS RISKS
The airline industry has substantial operating leverage and is affected by many conditions that are beyond its control, including delays, cancellations and other conditions, which could harm our financial condition and results of operations.
The airline industry has historically operated on low gross profit margins as a result of a high percentage of fixed costs. Due to these fixed costs, there is a disproportionate relationship between the cost of operating each flight and the number of passengers carried. However, the revenue generated from a particular flight is directly related to the number of passengers carried and the respective average fares applied. Accordingly, a decrease in the number of passengers carried would cause a corresponding decrease in revenue (if not offset by higher fares), and it may result in a disproportionately greater decrease in profits. Therefore, any general reduction in airline passenger traffic as a result of any of the following or other factors, which are largely outside of our control, could harm our business, financial condition and results of operations:
• | decline in general economic conditions; |
• | continued threat of terrorist attacks and conflicts overseas; |
• | actual or threatened war and political instability; |
• | increased security measures or breaches in security; |
• | adverse weather and natural disasters; |
• | changes in consumer preferences, perceptions or spending patterns; |
• | increased costs related to security and safety measures; |
• | increased fares as a result of increases in fuel costs; |
• | outbreak of contagious diseases or fear of contagion; and |
• | congestion at airports and actual or potential disruptions in the air traffic control system. |
13
Our results from operations may be volatile due to the conditions identified above. We cannot ensure that our financial resources will be sufficient to absorb the effects of any of these unexpected factors should they arise.
Our financial results and operations may be negatively affected by the State of Hawai'i's airport modernization plan.
The State of Hawai'i has begun to implement a modernization plan encompassing the airports we serve within the State. Our landing fees and airport rent rates have increased to fund the modernization program. Additionally, we expect the costs for our Neighbor Island operations to increase more than the costs related to our North America and International operations due to phased adjustments to the airport's funding mechanism. Therefore, costs related to the modernization program will have a greater impact on our operations as compared to our competitors, who do not have significant Neighbor Island operations. We can offer no assurance that we will be successful in offsetting these cost increases through other cost reductions or increases in our revenue and, therefore, can offer no assurance that our future financial results will not be negatively affected by them.
The construction work that is performed in connection with the State's modernization plan has temporarily narrowed the taxilanes used by our aircraft to depart and arrive at our assigned terminal at Honolulu International Airport. The temporary narrowing of the taxilanes has congested the aircraft traffic in these areas, which has resulted in the delay of the departure and arrival of our aircraft. Significant delays and potential displacement resulting from the State's modernization plan may have a negative impact on our operations and on-time performance.
Our operations may be disrupted if we are unable to obtain and maintain adequate facilities and infrastructure at airports within the State of Hawai'i.
We must be able to maintain and/or obtain adequate gates, office space, operations area and ticketing facilities at the airports within the State of Hawai'i to be able to operate our existing and proposed flight schedules. Failure to maintain such facilities and infrastructure may adversely impact our operations and financial performance.
Our business is subject to substantial seasonal and cyclical volatility.
Our results of operations will reflect the impact of seasonal volatility primarily due to passenger leisure and holiday travel patterns. As Hawai'i is a popular vacation destination, demand from North America, our largest source of visitors, is typically stronger during June, July, August and December and considerably weaker at other times of the year. Because of fluctuations in our results from seasonality, operating results for a historical period are not necessarily indicative of operating results for a future period and operating results for an interim period are not necessarily indicative of operating results for an entire year.
Terrorist attacks or international hostilities, or the fear of terrorist attacks or hostilities, even if not made directly on the airline industry, could negatively affect us and the airline industry.
Terrorist attacks, even if not made directly on the airline industry, or the fear of such attacks, hostilities or act of war, could adversely affect the airline industry, including us, and could result in a significant decrease in demand for air travel, increased security costs, increased insurance costs covering war-related risks, and increased flight operational loss due to cancellations and delays. Any future terrorist attacks or the implementation of additional security-related fees could have a material adverse effect on our business, financial condition and results of operations and on the airline industry in general.
The airline industry is subject to extensive government regulation, new regulations, and taxes which could have an adverse effect on our financial condition and results of operations.
Airlines are subject to extensive regulatory requirements that result in significant costs. Additional laws, regulations, taxes and airport rates and charges imposed by domestic and foreign governments have been proposed from time to time that could significantly increase the cost of airline operations or reduce revenue. For example, the ATSA, which became law in November 2001, mandates the federalization of certain airport security procedures and imposes additional security requirements on airlines. The FAA from time to time issues directives and other regulations relating to the maintenance and operation of aircraft that require significant expenditures. Some FAA requirements cover, among other things, retirement of older aircraft, security measures, collision avoidance systems, airborne windshear avoidance systems, noise abatement and other environmental concerns, commuter aircraft safety and increased inspections and maintenance procedures to be conducted on older aircraft. A failure to be in compliance, or a modification, suspension or revocation of any of our DOT/FAA authorizations or certificates would have a material adverse impact on our operations.
We cannot predict the impact that laws or regulations may have on our operations, nor can we ensure that laws or regulations enacted in the future will not adversely affect our business. Further we cannot guarantee that we will be able to obtain or
14
maintain necessary governmental approvals. Once obtained, operating permits are subject to modification and revocation by the issuing agencies. Compliance with these and any future regulatory requirements could require us to incur significant capital and operating expenditures.
In addition to extensive government regulations, the airline industry is dependent on certain services provided by government agencies (DOT, FAA, etc.). For example, spending restrictions due to federal sequestration of air traffic controllers in the United States subject to furlough may lead to a reduction in air traffic control services. A reduction in such services could have a material adverse effect on our results of operations.
Furthermore, because of significantly higher security and other costs incurred by airports since September 11, 2001, many airports have significantly increased their rates and charges to airlines, including us, and may do so again in the future.
The airline industry is required to comply with various environmental laws and regulations, which could inhibit our ability to operate and could also have an adverse effect on our results of operations.
Many aspects of airlines' operations are subject to increasingly stringent federal, state, local and foreign laws protecting the environment. U.S. federal laws that have a particular impact on us include the Airport Noise and Capacity Act of 1990, the Clean Air Act, the Resource Conservation and Recovery Act, the Clean Water Act, the Safe Drinking Water Act, the Comprehensive Environmental Response Act and the Compensation and Liability Act. Compliance with these and other environmental laws and regulations can require significant expenditures, and violations can lead to significant fines and penalties. Governments globally are increasingly focusing on the environmental impact caused by the consumption of fossil fuels and as a result have proposed or enacted legislation which may increase the cost of providing airline service or restrict its provision. We expect the focus on environmental matters to increase.
Concern about climate change and greenhouse gases may result in additional regulation of aircraft emissions in the U.S. and abroad. As a result, we may become subject to taxes, charges or additional requirements to obtain permits or purchase allowances or emission credits for greenhouse gas emissions in various jurisdictions, which could result in taxation or permitting requirements from multiple jurisdictions for the same operations.
Cap and trade restrictions have also been proposed in Congress. In addition, other legislative or regulatory action to regulate greenhouse gas emissions is possible. In particular, the EPA has found that greenhouse gases threaten the public health and welfare, which could result in regulation of greenhouse gas emissions from aircraft. In the event that legislation or regulation is enacted in the U.S. or in the event similar legislation or regulation is enacted in jurisdictions where we operate or where we may operate in the future, it could adversely affect operations and result in significant costs for us and the airline industry. At this time, we cannot predict whether any such legislation or regulation would apportion costs between one or more jurisdictions in which we operate flights. Under these systems, certain credits may be available to reduce the costs of permits in order to mitigate the impact of such regulations on consumers, but we cannot predict whether we or the airline industry in general will have access to offsets or credits. We are monitoring and evaluating the potential impact of such legislative and regulatory developments.
In addition to direct costs, such regulation may have a greater effect on the airline industry through increases in fuel costs that could result from fuel suppliers passing on increased costs that they incur under such a system. The impact to us and our industry from such actions is likely to be adverse and could be significant, particularly if regulators were to conclude that emissions from commercial aircraft cause significant harm to the upper atmosphere or have a greater impact on climate change than other industries.
Our operations may be adversely affected by our expansion into non-U.S. jurisdictions and the related increase in laws to which we are subject.
The expansion of our operations into non-U.S. jurisdictions has expanded the scope of the laws to which we are subject, both domestically and internationally. In addition, operations in non-U.S. jurisdictions are in many cases subject to the laws of those jurisdictions rather than U.S. law. Laws in some jurisdictions differ in significant respects from those in the United States, and these differences can affect our ability to react to changes in our business. Further, enforcement of laws in some jurisdictions can be inconsistent and unpredictable, which can affect our ability to enforce our rights and to undertake activities that we believe are beneficial to our business.
Our insurance costs are susceptible to significant increases and further increases in insurance costs or reductions in coverage could have an adverse effect on our financial results.
15
We carry types and amounts of insurance customary in the airline industry, including coverage for general liability, passenger liability, property damage, aircraft loss or damage, baggage and cargo liability and workers' compensation. We are required by the DOT to carry liability insurance on each of our aircraft. We currently maintain commercial airline insurance with a major group of independent insurers that regularly participate in world aviation insurance markets, including public liability insurance and coverage for losses resulting from the physical destruction or damage to our aircraft. However, there can be no assurance that the amount of such coverage will not change or that we will not bear substantial losses from accidents or damage to, or loss of, aircraft or other property due to other factors such as natural disasters. We could incur substantial claims resulting from an accident or damage to, or loss of, aircraft or other property due to other factors such as natural disasters in excess of related insurance coverage that could have a material adverse effect on our results of operations and financial condition.
Following the terrorist attacks on September 11, 2001, our insurance costs increased significantly and the availability of third-party war risk (terrorism) insurance decreased significantly. We have obtained third-party war risk (terrorism) insurance through a special program administered by the FAA. An extension of such authority will require legislation by the U.S. Congress. Should the government discontinue this coverage, obtaining comparable coverage from commercial underwriters could result in substantially higher premiums and more restrictive terms, if it is available at all. If we are unable to obtain adequate third-party war risk (terrorism) insurance, our business could be materially and adversely affected.
FLEET AND FLEET-RELATED RISKS
We are dependent on a limited number of suppliers for aircraft, aircraft engines and parts.
We are dependent on Airbus S.A.S. (Airbus) and The Boeing Company (Boeing) as our primary suppliers of aircraft and aircraft-related items. As a result, we are vulnerable to any problems associated with the supply of those aircraft and parts which could result in increased parts and maintenance costs in future years.
Our agreements to purchase Airbus A321neo aircraft and A330-800neo aircraft represent significant future financial commitments and operating costs.
As of December 31, 2015, we had the following firm order commitments and purchase rights for aircraft:
Aircraft Type | Firm Orders | Purchase Rights | Expected Delivery Dates | ||||
A321neo aircraft | 16 | 9 | Between 2017 and 2020 | ||||
A330-800neo aircraft | 6 | 6 | Between 2019 and 2021 | ||||
We have made substantial pre-delivery payments for Airbus aircraft under existing purchase agreements and are required to continue these pre-delivery payments as well as payments for the balance of the purchase price through delivery of each aircraft. These commitments substantially increase our future capital spending requirements and may require us to increase our level of debt in future years. There can be no assurance that we will be able to raise capital to finance these requirements or that such financing can be obtained on favorable terms, or at all.
Delays in scheduled aircraft deliveries or other loss of fleet capacity may adversely impact our operations and financial results.
The success of our business depends on, among other things, the ability to effectively operate a certain number and type of aircraft. As mentioned above, we have contractual commitments to purchase and integrate Airbus aircraft into our fleet. If for any reason we are unable to secure deliveries of the Airbus aircraft on contractually scheduled delivery dates and successfully introduce these aircraft into our fleet, then our business, operations and financial performance could be negatively impacted. Our failure to integrate newly purchased Airbus aircraft into our fleet as planned may require us to seek extensions on our existing leased aircraft. Such extensions may require us to operate existing aircraft beyond the point at which it is economically optimal to retire them, resulting in increased maintenance costs.
We may never realize the full value of our long-lived assets, resulting in impairment write-offs that may negatively impact our financial position and results of operations.
Economic and intrinsic triggers, which include extreme fuel price volatility, an uncertain economic and credit environment, unfavorable trends in historical or forecasted results of operations and cash flows, as well as other uncertainties, may cause us to record a material impairment over our long-lived assets. For example, the value of our aircraft may be affected by changes
16
in supply and demand for these aircraft in future periods. A material impairment charge could have an adverse effect on our financial position and results of operations in future periods.
COMMON STOCK RISKS
Our share price is subject to fluctuations and stockholders could have difficulty trading shares.
The market price of our stock is influenced by many factors, a number of which are outside of our control, and include the following:
• | operating results and financial condition; |
• | changes in the competitive environment in which we operate; |
• | fuel price volatility including the availability of fuel; |
• | announcements concerning our competitors including bankruptcy filings, mergers, restructurings or acquisitions by other airlines; |
• | increases or changes in government regulation; |
• | general and industry specific market conditions; |
• | changes in financial estimates or recommendations by securities analysts; and |
• | sales of our common stock or other actions by investors with significant shareholdings. |
In recent years the stock market has experienced volatile price and volume fluctuations that often have been unrelated to the operating performance of individual companies. These market fluctuations, as well as general economic conditions may affect the price of our common stock.
In the past, securities class action litigation has often been instituted against a company following periods of volatility in the company's stock price. This type of litigation, if filed against us, could result in substantial costs and divert our management's attention and resources. In addition, the future sale of a substantial number of shares of common stock by us or by our existing stockholders may have an adverse impact on the market price of the shares of common stock. There can be no assurance that the trading price of our common stock will remain at or near its current level.
LIQUIDITY RISKS
See Item 7, Management's Discussion and Analysis of Financial Condition and Results of Operations, for further information regarding our liquidity.
Our financial liquidity could be adversely affected by credit market conditions.
Our business requires access to capital markets to finance equipment purchases, including aircraft, and to provide liquidity in seasonal or cyclical periods of weaker revenue generation. In particular, we will face specific funding requirements with respect to our obligation under purchase agreements with Airbus to acquire new aircraft. We may finance these upcoming aircraft deliveries; however, the unpredictability of global credit market conditions may adversely affect the availability of financing or may result in unfavorable terms and conditions. We can offer no assurance that the financing we need will be available when required or that the economic terms on which it is available will not adversely affect our financial condition. If we cannot obtain financing or we cannot obtain financing on commercially reasonable terms, our business and financial condition will be adversely affected.
Our substantial debt could adversely affect our liquidity and financial condition, and include covenants that impose restrictions on our financial and business operations.
As of December 31, 2015, we had $677 million in outstanding debt. Our substantial debt and related covenants could:
• | expose us to general adverse economic and industry conditions; |
17
• | require us to dedicate a substantial portion of our cash flow from operations to payments on our debt, thereby reducing the availability of our cash flow for other operational purposes; |
• | limit our flexibility in planning for, or reacting to, changes in our business and the industry in which we operate; |
• | limit, along with the financial and other restrictive covenants in the agreements governing our debt, our ability to borrow additional funds; |
• | place us at a competitive disadvantage compared to other less leveraged competitors and competitors with debt agreements on more favorable terms than us; and |
• | adversely affect our ability to secure additional financing in the future on acceptable terms or at all, which would impact our ability to fund our working capital, capital expenditures, acquisitions or other general purpose needs. |
The terms of certain of our financing agreements restrict our ability to, among other things, incur additional indebtedness, issue preferred stock or pay dividends.
These agreements also require us to meet certain financial covenants. If we breach any of these covenants it could result in a default under these facilities, which could cause our outstanding obligations under these facilities to accelerate and become due and payable immediately, and could also cause us to default under our other debt or lease obligations and lead to an acceleration of the obligations related to such other debt or lease obligations. The existence of such a default could also preclude us from borrowing funds under our credit facilities.
Our ability to comply with the provisions of financing agreements can be affected by events beyond our control and a default under any such financing agreements if not cured or waived, could have a material adverse effect on us. In the event our debt is accelerated, we may not have sufficient liquidity to repay these obligations or to refinance our debt obligations, resulting in a material adverse effect on our financial condition.
We could be required to maintain reserves under our credit card processing agreements which could adversely affect our financial and business operations.
Under our bank-issued credit card processing agreements, certain proceeds from advance ticket sales may be held back to serve as collateral to cover any possible chargebacks or other disputed charges that may occur. These holdbacks totaled $5.0 million as of December 31, 2015. In the event of a material adverse change in our business, the holdback could incrementally increase to an amount up to 100% of the applicable credit card air traffic liability, which would also cause an increase in the level of restricted cash. If we are unable to obtain a waiver, or otherwise mitigate the increase in restricted cash, it could adversely affect our liquidity and also cause a covenant violation under other debt or lease obligations and have a material adverse effect on our financial condition.
Our obligations for funding our defined benefit pension plans are significant and are affected by factors beyond our control.
We sponsor three defined benefit pension plans, as well as a separate plan to administer pilots' disability benefits. As of December 31, 2015, the unfunded pension and disability obligation related to these plans was $201 million. The timing and amount of funding requirements depend upon a number of factors, including labor negotiations and changes to pension plan benefits as well as factors outside our control, such as the number and demographic data of qualified retiring employees, asset returns, interest rates and changes in pension laws. These factors, along with the impact of results that can vary significantly from estimates, may significantly impact our funding requirements and have an adverse effect on our financial condition.
Our ability to use our net operating loss (NOL) carryforwards to offset future taxable income for U.S. federal income tax purposes may be significantly limited due to various circumstances, including certain possible future transactions involving the sale or issuance of our common stock.
Our ability to use our NOL carryforwards may be limited if we experience an "ownership change" as defined in Section 382 (Section 382) of the Internal Revenue Code of 1986, as amended. An ownership change generally occurs if certain stockholders increase their aggregate percentage ownership of a corporation's stock by more than 50 percentage points over their lowest percentage ownership at any time during the testing period, which is generally the three-year period preceding any potential ownership change.
18
There is no assurance that we will not experience a future ownership change under Section 382 that may significantly limit or possibly eliminate our ability to use our NOL carryforwards. Potential future transactions involving the sale or issuance of our common stock, including the issuance of our common stock for cash and the acquisition or disposition of such stock by a stockholder owning 5% or more of our common stock, or a combination of such transactions, may increase the possibility that we will experience a future ownership change under Section 382.
Under Section 382, a future ownership change could subject us to additional annual limitations that apply to the amount of pre-ownership change NOL carryforwards that may be used to offset post-ownership change taxable income. This limitation is generally determined by multiplying the value of a corporation's stock immediately before the ownership change by the applicable long-term tax-exempt rate. Any unused annual limitation may, subject to certain limits, be carried over to later years, and the limitation may under certain circumstances be increased by built-in gains (for example, the amount by which the fair market value of an asset exceeds our adjusted basis) in the assets held by us at the time of the ownership change. This limitation could cause our U.S. federal income taxes to be greater, or to be paid earlier, than they otherwise would be, and could cause all or a portion of our NOL carryforwards to expire unused. Similar rules and limitations may apply for state income tax purposes.
ITEM 1B. UNRESOLVED STAFF COMMENTS.
None.
ITEM 2. PROPERTIES.
Aircraft
The table below summarizes our total fleet as of December 31, 2014, 2015 and expected 2016 (based on existing agreements):
December 31, 2014 | December 31, 2015 | December 31, 2016 | Seating Capacity (Per Aircraft) | Simple Average Age (In Years) | ||||||||||||||||||||||||||
Aircraft Type | Leased (4) | Owned | Total | Leased (4) | Owned | Total | Leased (4) | Owned | Total | |||||||||||||||||||||
A330-200(1) | 7 | 12 | 19 | 10 | 12 | 22 | 11 | 12 | 23 | 294 | 2.9 | |||||||||||||||||||
767-300(2) | 6 | 4 | 10 | 4 | 4 | 8 | 4 | 3 | 7 | 252 - 264 | 16.8 | |||||||||||||||||||
717-200 | 3 | 15 | 18 | 3 | 15 | 18 | 3 | 15 | 18 | 128 | 14.0 | |||||||||||||||||||
ATR turboprop(3) | — | 3 | 3 | — | 6 | 6 | — | 6 | 6 | 48 | 17.0 | |||||||||||||||||||
Total | 16 | 34 | 50 | 17 | 37 | 54 | 18 | 36 | 54 | |||||||||||||||||||||
(1) | During 2015, we took delivery and placed into revenue service three Airbus A330-200 aircraft for service on our North America and International routes. These aircraft were financed through purchase assignment and lease transactions. The increase in the number of leased aircraft in 2016 is due to the planned delivery of an aircraft financed through a six-year lease agreement. See Note 13 for further details. |
(2) | During 2015, we returned two Boeing 767-300 aircraft at the end of their lease term. The decrease in the number of owned Boeing 767-300 aircraft from 2015 to 2016 is due to the planned retirement of an aircraft at the end of its useful life. |
(3) | The ATR turboprop aircraft are owned by Airline Contract Maintenance & Equipment, Inc., a wholly-owned subsidiary of the Company. |
(4) | Leased aircraft include both aircraft under capital and operating leases. See Note 9 to the consolidated financial statements for further discussion regarding our aircraft leases. |
19
At December 31, 2015, we had firm aircraft orders as detailed below:
Delivery Year | A321neo Aircraft(1) | A330-800neo Aircraft(2) | Total | |||||
2017 | 3 | — | 3 | |||||
2018 | 6 | — | 6 | |||||
2019 | 6 | 2 | 8 | |||||
2020 | 1 | 2 | 3 | |||||
2021 | — | 2 | 2 | |||||
16 | 6 | 22 | ||||||
(1) | In 2013, Hawaiian executed a purchase agreement for the purchase of 16 new Airbus A321neo aircraft scheduled for delivery between 2017 and 2020. The A321neo narrow-body aircraft will be used to complement Hawaiian's existing fleet of wide-body aircraft for travel to and from the West Coast on its North America routes. |
(2) | In 2014, Hawaiian entered into an amendment (the Purchase Agreement Amendment) to the Airbus A330/A350XWB Purchase Agreement to convert its order for six firm A350XWB-800 aircraft with an additional six purchase rights into an order for six firm A330-800neo aircraft with an additional six purchase rights. The Purchase Agreement Amendment provides for delivery, subject to certain flexibility rights, of six A330-800neo aircraft starting in 2019. These fuel efficient, long-range aircraft will complement our existing fleet of wide-body, twin aisle aircraft used for long-haul flying on our North America and International routes. |
Hawaiian has purchase rights for an additional nine A321neo aircraft and six A330-800neo aircraft and can utilize these rights subject to production availability. Of the remaining Boeing 767-300 leased aircraft, one will expire by the end of 2017. See Note 9 to the consolidated financial statements for additional information regarding our aircraft lease agreements.
Ground Facilities
Our principal terminal facilities, cargo facilities and hangar and maintenance facilities are located at the Honolulu International Airport (HNL). The majority of the facilities at HNL are leased on a month-to-month basis. We are also charged for the use of terminal facilities at the four major Neighbor Island airports owned by the State of Hawai'i. Some terminal facilities, including gates and holding rooms, are considered by the State of Hawai'i to be common areas and thus are not exclusively controlled by us. Other facilities, including station managers' offices, Premier Club lounges and operations support space, are considered exclusive-use space by the State of Hawai'i.
20
The table below sets forth the airport locations we utilize pursuant to various agreements as of December 31, 2015:
Name of Airport | Location | |||
Phoenix Sky Harbor International Airport | Phoenix | Arizona | ||
Los Angeles International Airport | Los Angeles | California | ||
Oakland International Airport | Oakland | California | ||
Sacramento International Airport | Sacramento | California | ||
San Diego International Airport | San Diego | California | ||
San Francisco International Airport | San Francisco | California | ||
Norman Y. Mineta San Jose International Airport | San Jose | California | ||
Hilo International Airport | Hilo | Hawai'i | ||
Honolulu International Airport | Honolulu | Hawai'i | ||
Kahului Airport | Kahului | Hawai'i | ||
Kapalua Airport | Lahaina | Hawai'i | ||
Kona International Airport | Kona | Hawai'i | ||
Lana'i Airport | Lana'i | Hawai'i | ||
Lihu'e Airport | Lihu'e | Hawai'i | ||
Moloka'i Airport | Moloka'i | Hawai'i | ||
McCarran International Airport | Las Vegas | Nevada | ||
John F. Kennedy International Airport | New York | New York | ||
Portland International Airport | Portland | Oregon | ||
Seattle-Tacoma International Airport | Seattle | Washington | ||
Pago Pago International Airport | Pago Pago | American Samoa | ||
Faa'a International Airport | Papeete | Tahiti | ||
Brisbane International Airport | Brisbane | Australia | ||
Sydney International Airport | Sydney | Australia | ||
Auckland Airport | Auckland | New Zealand | ||
Kansai International Airport | Osaka | Japan | ||
Haneda International Airport | Tokyo | Japan | ||
New Chitose International Airport | Sapporo | Japan | ||
Incheon International Airport | Seoul | South Korea | ||
Beijing Capital International Airport | Beijing | China | ||
Our corporate headquarters are located in leased premises adjacent to the Honolulu International Airport.
ITEM 3. LEGAL PROCEEDINGS.
We are subject to legal proceedings arising in the normal course of our operations. We do not anticipate that the disposition of any currently pending proceeding will have a material effect on our operations, business or financial condition.
ITEM 4. MINE SAFETY DISCLOSURES.
Not applicable.
21
PART II
ITEM 5. MARKET FOR REGISTRANT'S COMMON EQUITY, RELATED STOCKHOLDER MATTERS AND ISSUER PURCHASES OF EQUITY SECURITIES.
Our common stock is traded on the NASDAQ Stock Market, LLC (NASDAQ) under the symbol "HA." The following table sets forth the range of high and low sales prices of our common stock as reported on the NASDAQ for the periods indicated.
High | Low | ||||||
2015 | |||||||
Fourth Quarter | $ | 40.13 | $ | 23.77 | |||
Third Quarter | 26.00 | 19.87 | |||||
Second Quarter | 26.10 | 20.75 | |||||
First Quarter | 27.66 | 18.01 | |||||
2014 | |||||||
Fourth Quarter | $ | 26.66 | $ | 12.52 | |||
Third Quarter | 16.08 | 12.67 | |||||
Second Quarter | 16.49 | 12.35 | |||||
First Quarter | 14.75 | 9.46 | |||||
Holders
There were 994 stockholders of record of our common stock as of January 22, 2016, which does not reflect those shares held beneficially or those shares held in "street" name.
Dividends and Other Restrictions
We paid no dividends in 2015 or 2014. Restrictions contained in our financing agreements and certain of our aircraft lease agreements limit our ability to pay dividends on our common stock. We do not anticipate paying periodic cash dividends on our common stock for the foreseeable future. See "Management's Discussion and Analysis of Financial Condition and Results of Operations—Liquidity and Capital Resources."
United States law prohibits non-U.S. citizens from owning more than 25% of the voting interest of a U.S. air carrier or controlling a U.S. air carrier. Our certificate of incorporation prohibits the ownership or control of more than 25% (to be increased or decreased from time to time, as permitted under the laws of the U.S.) of our issued and outstanding voting capital stock by persons who are not "citizens of the U.S." As of December 31, 2015, we believe we are in compliance with the law as it relates to voting stock held by non-U.S. citizens.
Purchases of Equity Securities by the Issuer and Affiliated Purchasers
The following table displays information with respect to our repurchases of shares of our common stock during the three months ended December 31, 2015:
Period | Total number of shares purchased (i) | Average price paid per share (ii) | Total number of shares purchased as part of publicly announced plans or programs (i) | Approximate dollar value of shares that may yet be purchased under the plans or programs (in millions) (i) | ||||||||||
October 1, 2015 - October 31, 2015 | 103,444 | $ | 24.32 | 103,444 | ||||||||||
November 1, 2015 - November 30, 2015 | — | — | — | |||||||||||
December 1, 2015 - December 31, 2015 | — | — | — | |||||||||||
Total | 103,444 | 103,444 | $ | 60 | ||||||||||
(i) | On April 23, 2015, we announced that our Board of Directors approved a stock repurchase program under which we may purchase up to $100 million of our outstanding common stock over a two-year period ending on April 24, 2017 through the open market, established plans or privately negotiated transactions in accordance with applicable securities laws, rules and regulations. The stock repurchase program is subject to modification or termination at any time. |
(ii) | Weighted average price paid per share is calculated on a settlement basis and excludes commission. |
22
Stockholder Return Performance Graph
The following graph compares cumulative total stockholder return on our common stock, the S&P 500 Index and the AMEX Airline Index from January 1, 2011 to December 31, 2015. The comparison assumes $100 was invested on January 1, 2011 in our common stock and each of the foregoing indices and assumes reinvestment of dividends before consideration of income taxes. We have paid no dividends on our common stock.
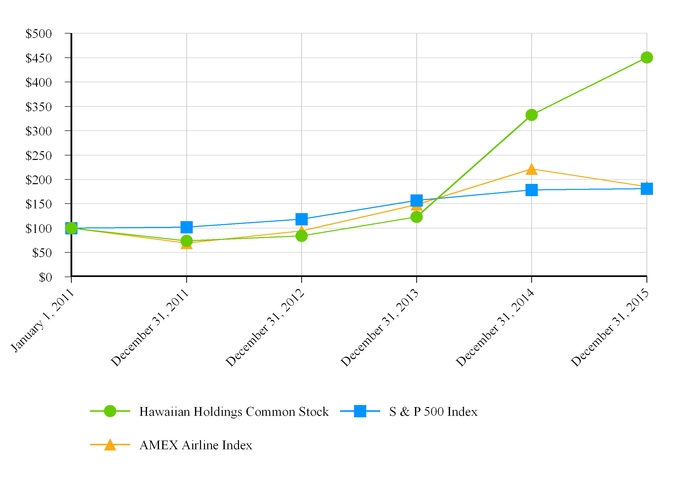
The stock performance depicted in the graph above is not to be relied upon as indicative of future performance. The stock performance graph shall not be deemed to be incorporated by reference into any of our filings under the Securities Act or the Exchange Act, except to the extent that we specifically incorporate the same by reference, nor shall it be deemed to be "soliciting material" or to be "filed" with the SEC or subject to Regulations 14A or 14C or to the liabilities of Section 18 of the Exchange Act.
23
ITEM 6. SELECTED FINANCIAL DATA.
The Selected Financial Data should be read in conjunction with our accompanying audited consolidated financial statements and the notes related thereto and "Management's Discussion and Analysis of Financial Condition and Results of Operations" below.
Hawaiian Holdings, Inc.
Selected Financial Data
Year ended December 31, | |||||||||||||||||||
2015 | 2014 | 2013 | 2012 | 2011 | |||||||||||||||
(in thousands, except per share data) | |||||||||||||||||||
Summary of Operations: | |||||||||||||||||||
Operating revenue | $ | 2,317,467 | $ | 2,314,879 | $ | 2,155,865 | $ | 1,962,353 | $ | 1,650,459 | |||||||||
Operating expenses | 1,891,364 | 2,069,747 | 2,022,118 | 1,832,955 | 1,630,176 | ||||||||||||||
Operating income | 426,103 | 245,132 | 133,747 | 129,398 | 20,283 | ||||||||||||||
Net Income (Loss) | 182,646 | 68,926 | 51,854 | 52,237 | (2,649 | ) | |||||||||||||
Net Income (Loss) Per Common Stock Share: | |||||||||||||||||||
Basic | $ | 3.38 | $ | 1.29 | $ | 1.00 | $ | 1.04 | $ | (0.05 | ) | ||||||||
Diluted | 2.98 | 1.10 | 0.98 | 1.01 | (0.05 | ) | |||||||||||||
Balance Sheet Items as of December 31: | |||||||||||||||||||
Total assets | $ | 2,509,710 | $ | 2,602,528 | $ | 2,164,261 | $ | 1,865,824 | $ | 1,487,529 | |||||||||
Long-term debt, less discount, and capital lease obligations, excluding current maturities (a) | 694,678 | 893,288 | 744,286 | 553,009 | 424,436 | ||||||||||||||
(a) | In 2015, we extinguished $123.9 million of existing debt under four secured financing agreements, which were originally scheduled to mature in 2018, 2023 and 2024. We also repurchased and converted $70.8 million in principal of our Convertible Notes. In 2014, we received proceeds of $368.4 million in connection with the EETC financing for the purchase of five Airbus A330-200 aircraft. In 2013, we borrowed $132.0 million to finance a portion of the purchase price of two Airbus A330-200 aircraft, and received proceeds of $76.1 million in connection with the EETC financing for the purchase of one Airbus A330-200 aircraft. In 2012, we borrowed $133.0 million to finance a portion of the purchase price of two Airbus A330-200 aircraft and took delivery of three aircraft (two Boeing 717 aircraft and one Airbus A330-200 aircraft) under capital leases. In 2011, we issued $86.25 million principal amount of convertible notes due March 2016 and used the proceeds to pay off our outstanding secured revolving credit facility, borrowed $192.8 million through secured loan agreements to finance a portion of the purchase price of 15 Boeing 717-200 aircraft and borrowed $132.0 million to finance a portion of the purchase price of two Airbus A330-200 aircraft. See further discussion at Note 8 to the consolidated financial statements. |
24
ITEM 7. MANAGEMENT'S DISCUSSION AND ANALYSIS OF FINANCIAL CONDITION AND RESULTS OF OPERATIONS.
Overview
The following Management's Discussion and Analysis of Financial Condition and Results of Operations (MD&A) is intended to help the reader understand the Company and its operations. This discussion and analysis of our financial condition and results of operations contains forward-looking statements that involve risks and uncertainties. We have based these forward-looking statements on our current expectations and projections of future events. However, our actual results could differ materially from those discussed herein as a result of the risks that we face, including but not limited to those risks stated in "Risk Factors." See "Cautionary Note Regarding Forward-Looking Statements," above. In addition, the following discussion should be read in conjunction with the audited consolidated financial statements and the related notes thereto included elsewhere in this report.
Year in Review
2015 Financial Highlights
• | Operating income grew to $426 million compared to $245 million in the prior-year period. |
• | Pre-tax income grew to $296 million compared to $113 million in the prior-year period. |
• | GAAP net income of $183 million or $2.98 per diluted share compared to $69 million or $1.10 per diluted share in the prior-year period. |
• | Adjusted net income of $189 million or $3.09 per diluted share compared to $97 million or $1.55 per share in the prior-year period. |
• | Unrestricted cash and cash equivalents and short-term investments of $560 million compared to $524 million in the prior year period. |
• | Extinguished $124 million of debt instruments that were originally scheduled to mature in 2018 through 2024. |
• | Repurchased and converted $71 million in principal of convertible notes. |
See "Non-GAAP Financial Measures" below for our reconciliation of non-GAAP measures.
Outlook
We expect our financial performance to improve in the first quarter of 2016 compared to the same quarter in 2015 as a result of favorable fuel prices. We expect available seat miles during the first quarter of 2016 to increase by 2.5% to 4.5% from the same prior year period. With the continued strengthening of the U.S. dollar, a decrease in fuel surcharges on our international routes, and an increase in industry capacity on our North America routes, operating revenue per available seat mile could increase or decrease by up to 1.5% from the same prior year period. We expect operating cost per available seat mile, excluding fuel, for the first quarter of 2016 to increase by 3% to 6% from the same prior year period due to the recent ratification of our labor agreements and an increase in the expected number of maintenance events.
25
Selected Consolidated Statistical Data
Below are the operating statistics we use to measure our operating performance.
Year ended December 31, | |||||||||||
2015 | 2014 | 2013 | |||||||||
(in thousands, except as otherwise indicated) | |||||||||||
Scheduled Operations (a) : | |||||||||||
Revenue passengers flown | 10,665 | 10,191 | 9,929 | ||||||||
Revenue passenger miles (RPM) | 14,450,564 | 13,910,804 | 13,658,072 | ||||||||
Available seat miles (ASM) | 17,710,309 | 17,062,264 | 16,761,761 | ||||||||
Passenger revenue per RPM (Yield) | 14.02 | ¢ | 14.70 | ¢ | 14.22 | ¢ | |||||
Passenger load factor (RPM/ASM) | 81.6 | % | 81.5 | % | 81.5 | % | |||||
Passenger revenue per ASM (PRASM) | 11.44 | ¢ | 11.99 | ¢ | 11.59 | ¢ | |||||
Total Operations (a) : | |||||||||||
Revenue passengers flown | 10,673 | 10,195 | 9,936 | ||||||||
RPM | 14,462,191 | 13,921,147 | 13,677,645 | ||||||||
ASM | 17,726,322 | 17,073,630 | 16,785,827 | ||||||||
Operating revenue per ASM (RASM) | 13.07 | ¢ | 13.56 | ¢ | 12.84 | ¢ | |||||
Operating cost per ASM (CASM) | 10.67 | ¢ | 12.12 | ¢ | 12.05 | ¢ | |||||
CASM excluding aircraft fuel (b) | 8.31 | ¢ | 8.15 | ¢ | 7.88 | ¢ | |||||
Aircraft fuel expense per ASM (c) | 2.36 | ¢ | 3.97 | ¢ | 4.17 | ¢ | |||||
Revenue block hours operated | 173,546 | 166,362 | 161,965 | ||||||||
Gallons of jet fuel consumed | 234,183 | 230,199 | 226,214 | ||||||||
Average cost per gallon of jet fuel (actual) (c) | $ | 1.78 | $ | 2.95 | $ | 3.09 | |||||
(a) | Includes the operations of our contract carrier under a capacity purchase agreement. |
(b) | Represents adjusted unit costs, a non-GAAP measure. We believe this is a useful measure because it better reflects our controllable costs. See "Non-GAAP Financial Measures" below for our reconciliation of non-GAAP measures. |
(c) | Includes applicable taxes and fees. |
Operating Revenue
Our revenue is derived primarily from transporting passengers on our aircraft. Revenue is recognized when either the transportation is provided or when the related ticket expires unused. We measure capacity in terms of available seat miles, which represent the number of seats available for passengers multiplied by the number of miles the seats are flown. Yield, or the average amount one passenger pays to fly one mile, is calculated by dividing passenger revenue by RPMs. We strive to increase passenger revenue primarily by increasing our yield per flight or by filling a higher proportion of available seats, which produces higher operating revenue per available seat mile. Other revenue primarily consists of baggage fees, cargo revenue, incidental services revenue, ticket change and cancellation fees, sale of frequent flyer miles, inflight revenue, contract services and charter services revenue.
Operating revenue was $2.32 billion, $2.31 billion and $2.16 billion for the years ended December 31, 2015, 2014 and 2013. The increase in operating revenue in 2014 from 2013 was driven primarily by an increase in passenger revenue.
26
2015 vs. 2014
Passenger Revenue
Passenger revenue was $2.03 billion and $2.05 billion for the years ended December 31, 2015 and 2014, respectively. Details of these changes are described in the table below:
Year Ended December 31, 2015 as compared to December 31, 2014 | ||||||||||||
Change in scheduled passenger revenue | Change in Yield | Change in RPM | Change in ASM | |||||||||
(in millions) | ||||||||||||
North America | $ | 52.9 | (2.6 | )% | 8.0 | % | 9.4 | % | ||||
Neighbor Island | 16.2 | 1.0 | 2.3 | 4.4 | ||||||||
International | (88.5 | ) | (12.8 | ) | (4.0 | ) | (6.0 | ) | ||||
Total scheduled | $ | (19.4 | ) | (4.6 | )% | 3.9 | % | 3.8 | % | |||
North America revenue increased by $52.9 million in 2015, as compared to 2014, primarily due to capacity increases on our North America routes, driven by the annualized impact of service introduced in 2014. This was slightly offset by a decrease in the yield generated from these routes, which was a result of the increase in industry capacity compared to the prior period.
Neighbor Island revenue increased by $16.2 million in 2015, as compared to 2014, due to the introduction of a new cabin configuration to our fleet of 717-200 aircraft and the launch of our turboprop operations in March 2014.
International revenue decreased by $88.5 million in 2015, as compared to 2014, due to decreased yield and capacity. The continued strengthening of the U.S. dollar combined with lower fuel surcharges resulted in decreased average fares for our International routes compared to the prior period. Decreased capacity was driven by changes we made to our network in 2014, including the suspension of our route from Honolulu to Taipei, Taiwan (March 2014) and Honolulu to Fukuoka, Japan (June 2014).
Other Operating Revenue
Other operating revenue increased by $22.0 million, or 8.2%, in 2015, as compared to 2014, due to $11.2 million generated by increased sales of frequent flyer miles under our co-branded credit card agreement, as compared to the prior year period. Additionally, a 9% increase in the number of passengers flown on our North America routes resulted in a $7.5 million increase in ancillary revenue compared to the prior year period.
27
Operating Expenses
The largest components of our operating expenses are wages and benefits provided to our employees, aircraft fuel (including taxes and delivery) and aircraft maintenance materials and repairs. Increases (decreases) in operating expenses are detailed below.
Changes for the year ended December 31, 2015 as compared to December 31, 2014 | ||||||
$ | % | |||||
(in thousands) | ||||||
Operating expense: | ||||||
Aircraft fuel, including taxes and delivery | $ | (260,525 | ) | (38.4 | )% | |
Wages and benefits | 52,060 | 11.6 | ||||
Aircraft rent | 9,231 | 8.7 | ||||
Maintenance materials and repairs | (971 | ) | (0.4 | ) | ||
Aircraft and passenger servicing | (5,331 | ) | (4.3 | ) | ||
Commissions and other selling | (2,772 | ) | (2.3 | ) | ||
Depreciation and amortization | 9,207 | 9.6 | ||||
Other rentals and landing fees | 7,153 | 8.1 | ||||
Purchased services | 8,452 | 11.5 | ||||
Other | 5,113 | 4.7 | ||||
Total | $ | (178,383 | ) | (8.6 | )% | |
The price and availability of aircraft fuel is extremely volatile due to global economic and geopolitical factors that we can neither control nor accurately predict. Decreases in aircraft fuel expense are illustrated in the following table:
Year Ended December 31, | ||||||||||
2015 | 2014 | % Change | ||||||||
(in thousands, except per-gallon amounts) | ||||||||||
Aircraft fuel expense, including taxes and delivery | $ | 417,728 | $ | 678,253 | (38.4 | )% | ||||
Fuel gallons consumed | 234,183 | 230,199 | 1.7 | % | ||||||
Average fuel price per gallon, including taxes and delivery | $ | 1.78 | $ | 2.95 | (39.7 | )% | ||||
The decrease in fuel expense from 2014 to 2015 is primarily due to a decrease in the average fuel price per gallon, partially offset by increased fuel consumption due to the additional aircraft in the fleet (three additional A330-200 offset by the return of two B767-300 aircraft at the end of its lease term).
We believe economic fuel expense is the best measure of the effect of fuel prices on our business as it most closely approximates the net cash outflow associated with the purchase of fuel for our operations in a period and is consistent with how management manages our business and assesses our operating performance. We define economic fuel expense as raw fuel expense plus (gains)/losses realized through actual cash payments to/(receipts from) hedge counterparties for fuel derivatives settled in the period inclusive of costs related to hedging premiums. Economic fuel expense is calculated as follows:
Year Ended December 31, | ||||||||||
2015 | 2014 | % Change | ||||||||
(in thousands, except per-gallon amounts) | ||||||||||
Aircraft fuel expense, including taxes and delivery | $ | 417,728 | $ | 678,253 | (38.4 | )% | ||||
Realized losses on settlement of fuel derivative contracts | 60,946 | 20,365 | 199.3 | % | ||||||
Economic fuel expense | $ | 478,674 | $ | 698,618 | (31.5 | )% | ||||
Fuel gallons consumed | 234,183 | 230,199 | 1.7 | % | ||||||
Economic fuel costs per gallon | $ | 2.04 | $ | 3.03 | (32.7 | )% | ||||
See Item 7A, Quantitative and Qualitative Disclosures about Market Risk, for additional discussion of our jet fuel costs and related derivative program.
28
Wages and benefits expense increased by $52.1 million, or 11.6%, in 2015 as compared to 2014, due to increased pension and postretirement benefit expenses and increased profit-sharing expense resulting from our improved financial performance as compared to the prior period.
Aircraft rent expense increased by $9.2 million, or 8.7%, in 2015 as compared to 2014, primarily due to the addition of three A330-200 aircraft under operating leases (one each in February 2015, May 2015, and October 2015), offset by the return of two Boeing 767-300 aircraft (one each in May 2015 and October 2015).
Depreciation and amortization expense increased by $9.2 million, or 9.6%, in 2015 as compared to 2014, primarily due to the annualized effect of owned aircraft added to the fleet in the prior year period.
Other rentals and landing fees expense increased by $7.2 million, or 8.1%, in 2015 as compared to 2014, primarily due to increased rates and landing frequencies.
Purchased services expense increased by $8.5 million, or 11.5%, in 2015 as compared to 2014, due to costs incurred in connection with our turboprop operations and increased IT infrastructure costs.
Nonoperating Expense
Net nonoperating expense decreased by $1.3 million in 2015, as compared to 2014, primarily due to reduced debt levels which resulted in an $8.6 million reduction in interest expense as compared to the prior year period. Also our fuel hedge portfolio generated losses of $59.9 million in the current period compared to losses of $63.5 million in the prior year period. These reductions in nonoperating expense were partially offset by an $8.2 million increase in losses generated from the early extinguishment of long-term debt.
2014 vs. 2013
Passenger Revenue
Passenger revenue was $2.05 billion and $1.94 billion for the years ended December 31, 2014 and 2013, respectively. Details of these changes are described in the table below:
Year Ended December 31, 2014 as compared to December 31, 2013 | ||||||||||||
Change in scheduled passenger revenue | Change in Yield | Change in RPM | Change in ASM | |||||||||
(in millions) | ||||||||||||
North America | $ | 111.4 | 5.1 | % | 6.9 | % | 10.2 | % | ||||
Neighbor Island | 35.7 | 6.0 | 1.8 | 3.7 | ||||||||
International | (44.8 | ) | (0.8 | ) | (6.9 | ) | (10.4 | ) | ||||
Total scheduled | $ | 102.3 | 3.4 | % | 1.9 | % | 1.8 | % | ||||
North America revenue increased by $111.4 million in 2014, as compared to 2013, due to an increase in the number of revenue passengers flown and the yield generated on these routes. The increase in the number of revenue passengers was driven by an increase in capacity provided by the addition of new Airbus A330-200 aircraft delivered during the year, the initiation of new routes from Honolulu to Oakland, California (January 2014) and from Maui to Los Angeles (May 2014) and San Francisco, California (November 2014), the reintroduction of the Honolulu to San Jose, California service (May 2014), and the introduction of our summer service from both Lihu'e, Kaua'i and Kona, Hawai'i Island to Oakland and Los Angeles, California.
Neighbor Island revenue increased by $35.7 million, in 2014, as compared to 2013, due to our turboprop operations which launched in March 2014, the impact of improved traffic mix, and a slight increase in average fares.
International revenue decreased by $44.8 million in 2014, as compared to 2013, due to a decrease in our international capacity which was a result of changes to our network during the year. These changes consisted of the suspension of our routes from Honolulu to Manila, Philippines (August 2013) and from Honolulu to Fukuoka, Japan (June 2014). Also, the continued strengthening of the U.S. Dollar resulted in decreased average fares from 2013.
Other Operating Revenue
Other operating revenue increased by $56.8 million, or 26.7%, in 2014, as compared to 2013, due to $29.1 million generated by increased sales of frequent flyer miles under our new co-branded credit card agreement and $13.1 million driven by an increase in the volume of cargo transported, as compared to the prior year period. The increase in volume was the result of additional cargo capacity and improved revenue generation on our existing routes.
29
Operating Expenses
Increases (decreases) in operating expenses are detailed below.
Changes for the year ended December 31, 2014 as compared to December 31, 2013 | ||||||
$ | % | |||||
(in thousands) | ||||||
Operating expense: | ||||||
Aircraft fuel, including taxes and delivery | $ | (20,549 | ) | (2.9 | )% | |
Wages and benefits | 20,008 | 4.7 | ||||
Aircraft rent | (2,112 | ) | (1.9 | ) | ||
Maintenance materials and repairs | 22,232 | 10.9 | ||||
Aircraft and passenger servicing | 2,145 | 1.8 | ||||
Commissions and other selling | (3,382 | ) | (2.7 | ) | ||
Depreciation and amortization | 13,324 | 16.0 | ||||
Other rentals and landing fees | 6,585 | 8.1 | ||||
Purchased services | 9,744 | 15.3 | ||||
Other | (366 | ) | (0.3 | ) | ||
Total | $ | 47,629 | 2.4 | % | ||
Decreases in aircraft fuel expense are illustrated in the following table:
Year Ended December 31, | ||||||||||
2014 | 2013 | % Change | ||||||||
(in thousands, except per-gallon amounts) | ||||||||||
Aircraft fuel expense, including taxes and delivery | $ | 678,253 | $ | 698,802 | (2.9 | )% | ||||
Fuel gallons consumed | 230,199 | 226,214 | 1.8 | % | ||||||
Average fuel price per gallon, including taxes and delivery | $ | 2.95 | $ | 3.09 | (4.5 | )% | ||||
The decrease in fuel expense from 2013 to 2014 is primarily due to a decrease in the average fuel price per gallon, partially offset by increased fuel consumption due to the additional aircraft in the fleet (five additional A330-200 offset by the retirement of two B767-300 aircraft).
Economic fuel expense is calculated as follows:
Year Ended December 31, | ||||||||||
2014 | 2013 | % Change | ||||||||
(in thousands, except per-gallon amounts) | ||||||||||
Aircraft fuel expense, including taxes and delivery | $ | 678,253 | $ | 698,802 | (2.9 | )% | ||||
Realized losses on settlement of fuel derivative contracts | 20,365 | 14,018 | 45.3 | % | ||||||
Economic fuel expense | $ | 698,618 | $ | 712,820 | (2.0 | )% | ||||
Fuel gallons consumed | 230,199 | 226,214 | 1.8 | % | ||||||
Economic fuel costs per gallon | $ | 3.03 | $ | 3.15 | (3.8 | )% | ||||
Wages and benefits expense increased by $20.0 million, or 4.7%, in 2014, as compared to 2013, due to a 2.5% increase in the number of employees as we continue to expand our operations with additional aircraft. Our profit-sharing expense also increased in 2014, which was driven by our improved financial performance from 2013.
Maintenance materials and repairs expense increased by $22.2 million, or 10.9%, in 2014, as compared to 2013, primarily due to the increase in the number and utilization of Airbus A330-200 aircraft in our fleet, partially offset by a decrease in the number and utilization of Boeing 767-300 aircraft in our fleet.
Depreciation and amortization expense increased by $13.3 million, or 16.0%, in 2014, as compared to 2013, primarily due to the increase in the number of owned aircraft (five A330-200 aircraft offset by the retirement of two B767-300 aircraft).
30
Other rentals and landing fees expense increased by $6.6 million, or 8.1%, in 2014 as compared to 2013, primarily due to increased rates and landing frequencies.
Purchased services expense increased by $9.7 million, or 15.3%, in 2014 as compared to 2013, primarily due to costs incurred in connection with our turboprop operations that began in March 2014.
Nonoperating Expense
Net nonoperating expense increased by $84.3 million in 2014, as compared to 2013, primarily due to our fuel hedge portfolio generating losses of $63.5 million in the current period compared to losses of $5.3 million in the prior year period. The strengthening of the US dollar resulted in foreign exchange loss of $8.7 million in the current period compared to a loss of $4.4 million in the prior period. The interest expense incurred in connection with the equipment notes under the EETC financing also contributed to the increase in nonoperating expense for the period.
Income Tax Expense
We recorded income tax expense of $113.0 million, $44.5 million and $34.6 million during the years ended December 31, 2015, 2014, and 2013, respectively. In 2015, 2014 and 2013, we had an effective tax rate of 38.2%, 39.2% and 40.0%, respectively.
See Note 10 to the consolidated financial statements for further discussion.
Liquidity and Capital Resources
Our liquidity is dependent on the cash we generate from operating activities, our existing cash resources and our debt financing arrangements. As of December 31, 2015, we had $281.5 million in cash and cash equivalents and $278.5 million in short-term investments, representing an increase of $35.8 million from December 31, 2014. As of December 31, 2015 and 2014, our restricted cash balance of $5.0 million and $6.6 million, respectively, primarily consisted of cash held as collateral by entities that process our credit card transactions for advanced ticket sales.
We have been able to generate sufficient funds from our operations to meet our working capital requirements and typically finance our aircraft through secured debt and lease financings. At December 31, 2015, Hawaiian had $772.1 million of debt and capital lease obligations, including $77.5 million classified as a current liability in the Consolidated Balance Sheets. As of December 31, 2015, our current liabilities exceeded our current assets by approximately $28.8 million. However, approximately $430.8 million of our current liabilities are related to our advanced ticket sales and frequent flyer deferred revenue, both of which largely represent revenue to be recognized for travel within the next 12 months and not actual cash outlays. The deficit in working capital does not have an adverse impact to our cash flows, liquidity or operations.
We also have access to a secured revolving credit and letter of credit facility (the Revolving Credit Facility) in an amount of up to $175 million, maturing in November 2017. As of December 31, 2015 we had no outstanding borrowings under the Revolving Credit Facility.
Cash Flows
Net cash provided by operating activities was $476.0 million, $300.4 million and $243.3 million in 2015, 2014 and 2013, respectively. The increase in 2015 was primarily due to the increased net income before deferred income tax expense, which does not impact our cash flows because our net operating loss carryforwards were used to satisfy this income tax obligation. The increase in 2014 was primarily due to increased net income before the expense associated with unrealized loss positions on our fuel derivative contracts, which do not immediately impact our cash flows from operating activities because the losses were unrealized as of December 31, 2014.
Net cash used in investing activities was $35.3 million, $686.8 million and $327.8 million for 2015, 2014 and 2013, respectively. The decrease in 2015 was due to acquisition of fewer aircraft during the year, which resulted in a $323.4 million reduction in capital expenditures. We also received $101.7 million from the purchase assignment and leaseback of three Airbus A330-200 aircraft during the year, and reduced our net purchases of investments by $240.2 million in 2015. The increase in 2014 was due to the $261.5 million in net purchases of investments, and the acquisition of five Airbus A330-200 aircraft during the year.
Net cash used in financing activities was $423.3 million for 2015 and net cash provided by financing activities was $227.1 million and $102.0 million for 2014 and 2013, respectively. The increase in cash used in financing activities in 2015 was due to the lack of long-term borrowings during the year, the early repayment of long-term debt, and the repurchase of convertible notes and common stock. This was partially offset by the net settlement of the convertible note call options and warrants. The
31
increase in 2014 was due to the receipt of $368.4 million in proceeds from the EETC financing, partially offset by $54.2 million of debt extinguishment in October 2014 and repurchase of $15.1 million of convertible notes.
Covenants under our Financing Arrangements
Under our bank-issued credit card processing agreements, certain proceeds from advance ticket sales may be held back to serve as collateral to cover any possible chargebacks or other disputed charges that may occur. These holdbacks, which are included in restricted cash in our Consolidated Balance Sheets, totaled $5.0 million as of December 31, 2015 and 2014.
In the event of a material adverse change in the business, the holdback could increase to an amount up to 100% of the applicable credit card air traffic liability, which would also result in an increase in the required level of restricted cash. If we are unable to obtain a waiver of, or otherwise mitigate the increase in the restriction of cash, it could have a material adverse impact on our operations.
Pension and Other Postretirement Benefit Plan Funding
As of December 31, 2015, the excess of the projected benefit obligations over the fair value of plan assets was approximately $375.8 million. We contributed $20.4 million, $8.9 million and $18.7 million, to our defined benefit pension plans and disability plan during 2015, 2014 and 2013, respectively. Future funding requirements for our defined benefit and other postretirement plans are dependent upon many factors such as interest rates, funded status, applicable regulatory requirements and the level and timing of asset returns. In 2016, our minimum required contribution to our defined benefit pension plans and disability plan is $5.3 million.
Income Tax Net Operating Loss Carryforwards
We have net operating loss (NOL) carryforwards for federal and state income tax purposes of $288.2 million as of December 31, 2015. The tax benefit of the NOL carryforwards as of December 31, 2015 is $38.3 million, substantially all of which will not begin to expire until 2031. We believe we will have sufficient working capital to pay income taxes as they become due.
Off-Balance Sheet Arrangements
An off-balance sheet arrangement is any transaction, agreement or other contractual arrangement involving an unconsolidated entity under which a company has (i) made guarantees, (ii) retained a contingent interest in transferred assets, (iii) an obligation under derivative instruments classified as equity or (iv) any obligation arising out of a material variable interest in an unconsolidated entity that provides financing, liquidity, market risk or credit risk support to the company, or that engages in leasing, hedging or research and development arrangements with the company. We have no arrangements of the types described in the first three categories that we believe may have a current or future material effect on our financial condition, liquidity or results of operations. We do have obligations arising out of variable interests in unconsolidated entities related to certain aircraft leases. To the extent our leases and related guarantees are with a separate legal entity other than a governmental entity, we are not the primary beneficiary because the lease terms are consistent with market terms at the inception of the lease, and the lease does not include a residual value guarantee, fixed price purchase option or similar feature.
Contractual Obligations
Our estimated contractual obligations as of December 31, 2015 are summarized in the following table:
Contractual Obligations | Total | Less than 1 Year | 1-3 Years | 3-5 Years | More than 5 Years | ||||||||||||||
(in thousands) | |||||||||||||||||||
Debt and capital lease obligations(1) | $ | 969,318 | $ | 116,531 | $ | 216,053 | $ | 190,032 | $ | 446,702 | |||||||||
Operating leases—aircraft and related equipment(2) | 785,079 | 112,647 | 213,943 | 190,749 | 267,740 | ||||||||||||||
Operating leases—non-aircraft | 44,574 | 5,247 | 9,050 | 8,220 | 22,057 | ||||||||||||||
Purchase commitments—Capital(3) | 1,625,220 | 85,349 | 618,122 | 713,581 | 208,168 | ||||||||||||||
Purchase commitments—Operating(4) | 589,336 | 66,654 | 124,218 | 110,964 | 287,500 | ||||||||||||||
Projected employee benefit contributions(5) | 43,600 | 5,500 | 38,100 | — | — | ||||||||||||||
Total contractual obligations | $ | 4,057,127 | $ | 391,928 | $ | 1,219,486 | $ | 1,213,546 | $ | 1,232,167 | |||||||||
(1) | Amounts represent contractual amounts due, including interest. Interest on variable-rate debt was estimated using rates in effect as of December 31, 2015. Amount reflects capital lease obligations for one Airbus A330-200 aircraft, two Boeing 717 aircraft, one A330 flight simulator and aircraft related equipment. |
32
(2) | Amounts reflect leases for nine Airbus A330-200 aircraft, four Boeing 767 aircraft, one Boeing 717 aircraft, three turboprop aircraft and aircraft-related equipment as of December 31, 2015. |
(3) | Amounts include our firm commitments for aircraft and aircraft related equipment. |
(4) | Amounts include commitments for services provided by third-parties for aircraft maintenance for our Airbus fleet, capacity purchases, accounting, IT and reservations. Total contractual obligations do not include long-term contracts where the commitment is variable in nature (with no minimum guarantee), such as aircraft maintenance deposits due under operating leases and fees due under certain other agreements such as aircraft maintenance power-by-the-hour, computer reservation systems and credit card processing agreements, or when the agreements contain short-term cancellation provisions. |
(5) | Amounts include our estimated contributions to our pension plans (based on actuarially determined estimates) and our pilots' disability plan. Amounts are subject to change based on numerous factors, including interest rate levels, the amount and timing of asset returns and the impact of future legislation. We are currently unable to estimate the projected contributions beyond 2018. |
Capital Commitments
As of December 31, 2015, we had the following capital commitments consisting of firm aircraft and engine orders and purchase rights:
Aircraft Type | Firm Orders | Purchase Rights | Expected Delivery Dates | ||||
A321neo aircraft | 16 | 9 | Between 2017 and 2020 | ||||
A330-800neo aircraft | 6 | 6 | Between 2019 and 2021 | ||||
Pratt & Whitney spare engines: | |||||||
A321neo spare engines | 2 | — | Between 2017 and 2018 | ||||
Rolls-Royce spare engines: | |||||||
A330-800neo spare engines | 2 | — | Between 2019 and 2020 | ||||
Committed expenditures for these aircraft, engines and related flight equipment are approximately $85 million in 2016, $221 million in 2017, $397 million in 2018, $484 million in 2019, and $230 million in 2020.
In order to complete the purchase of these aircraft and fund related costs, we may need to secure acceptable financing. We have backstop financing available from aircraft and engine manufacturers, subject to certain customary conditions. Financing may be necessary to satisfy our capital commitments for firm order aircraft and other related capital expenditures. We can provide no assurance that any financing not already in place for aircraft and spare engine deliveries will be available to us on acceptable terms when necessary or at all.
Non-GAAP Financial Measures
We believe the disclosure of non-GAAP financial measures is useful information to readers of our financial statements because:
• | We believe it is the basis by which we are evaluated by industry analysts and investors; |
• | These measures are often used in management and board of directors decision making analysis; |
• | It improves a reader's ability to compare our results to those of other airlines; and |
• | It is consistent with how we present information in our quarterly earnings press releases. |
See table below for reconciliation between GAAP consolidated net income to adjusted consolidated net income, including per share amounts (in thousands unless otherwise indicated). The adjustments are described below:
• | Changes in fair value of derivative contracts, net of tax, are based on market prices for open contracts as of the end of the reporting period. This line item includes the unrealized amounts of fuel derivatives (not designated as hedges) that will settle in future periods and the reversal of prior period unrealized amounts. Excluding the impact of these derivative adjustments allows investors to better analyze our operational performance and compare our results to other airlines in the periods presented below |
• | Loss on extinguishment of debt, net of tax, is excluded to allow investors to better analyze our core operational performance and compare our results to other airlines in the periods presented below. |
33
Year Ended December 31, | |||||||||||||||||||||||
2015 | 2014 | 2013 | |||||||||||||||||||||
Net Income | Diluted Net Income Per Share | Net Income | Diluted Net Income Per Share | Net Income | Diluted Net Income Per Share | ||||||||||||||||||
As reported—GAAP | $ | 182,646 | $ | 2.98 | $ | 68,926 | $ | 1.10 | $ | 51,854 | $ | 0.98 | |||||||||||
Add: changes in fair value of derivative contracts, net of tax | (609 | ) | (0.01 | ) | 25,864 | 0.41 | (5,210 | ) | (0.10 | ) | |||||||||||||
Add: loss on extinguishment of debt, net of tax | 7,235 | 0.12 | 2,331 | 0.04 | — | — | |||||||||||||||||
Adjusted net income | $ | 189,272 | $ | 3.09 | $ | 97,121 | $ | 1.55 | $ | 46,644 | $ | 0.88 | |||||||||||
Operating Costs per Available Seat Mile (CASM)
We have listed separately in the table below our fuel costs per ASM and our non-GAAP unit costs, excluding fuel. These amounts are included in CASM, but for internal purposes we consistently use unit cost metrics that exclude fuel and non-recurring items (if applicable) to measure and monitor our costs.
CASM and CASM, excluding fuel, are summarized in the table below:
Year Ended December 31, | |||||||||||
2015 | 2014 | 2013 | |||||||||
GAAP operating expenses | $ | 1,891,364 | $ | 2,069,747 | $ | 2,022,118 | |||||
Less: aircraft fuel, including taxes and delivery | (417,728 | ) | (678,253 | ) | (698,802 | ) | |||||
Adjusted operating expenses—excluding aircraft fuel | $ | 1,473,636 | $ | 1,391,494 | $ | 1,323,316 | |||||
Available Seat Miles | 17,726,322 | 17,073,630 | 16,785,827 | ||||||||
CASM—GAAP | 10.67 | ¢ | 12.12 | ¢ | 12.05 | ¢ | |||||
Less: aircraft fuel | (2.36 | ) | (3.97 | ) | (4.17 | ) | |||||
CASM—excluding aircraft fuel | 8.31 | ¢ | 8.15 | ¢ | 7.88 | ¢ | |||||
Critical Accounting Policies and Estimates
The discussion and analysis of our financial condition and results of operations are based upon financial statements that have been prepared in accordance with U.S. generally accepted accounting principles. The preparation of these financial statements requires management to make estimates and judgments that affect the reported amount of assets and liabilities, revenue and expenses, and related disclosure of contingent assets and liabilities as of the date of the financial statements.
Critical accounting policies and estimates are defined as those accounting policies and accounting estimates that are reflective of significant judgments and uncertainties, and that potentially result in materially different results under different assumptions and conditions.
Frequent Flyer Accounting
HawaiianMiles, Hawaiian's frequent flyer travel award program, provides a variety of awards to program members based on accumulated mileage. We utilize the incremental cost method of accounting for free travel awards earned by passengers issued from the HawaiianMiles program through flight activity. This method utilizes a number of estimates including the incremental cost per mile and breakage. We record a liability for the estimated incremental cost of providing travel awards that are expected to be redeemed on Hawaiian or the contractual rate of expected redemption on other airlines. We estimate the incremental cost of travel awards based on periodic studies of actual costs and apply these cost estimates to all issued miles, less an appropriate breakage factor for estimated miles that will not be redeemed. Incremental costs include the cost of fuel, meals and beverages, insurance and certain other passenger traffic-related costs, but does not include any costs for aircraft ownership and maintenance. The breakage factor is estimated based on an analysis of historical expirations.
We also sell mileage credits to companies participating in our frequent flyer program. These sales are accounted for as multiple-element arrangements, with one element representing the transportation that will ultimately be provided when the mileage credits are redeemed and the other elements consisting of marketing related activities that we conduct with the participating company.
34
In 2013, Hawaiian entered into a co-branded credit card agreement, which provides for the sale of frequent flyer miles to Barclays Bank Delaware (Barclays) which began in 2014. The agreement was a new multiple element arrangement subject to Accounting Standards Update 2009-13, Multiple Deliverable Revenue Arrangements — A consensus of the FASB Emerging Issues Task Force (ASU 2009-13), which was effective for new and materially modified revenue arrangements entered into by the Company after January 1, 2011. ASU 2009-13 requires the allocation of the overall consideration received to each deliverable using the estimated selling price. The objective of using estimated selling price based methodology is to determine the price at which the Company would transact a sale if the product or service were sold on a stand-alone basis.
The following four deliverables or elements were identified in the agreement: (i) travel miles; (ii) use of the Hawaiian brand and access to member lists; (iii) advertising elements; and (iv) other airline benefits including checked baggage services and travel discounts. We determined the relative fair value of each element by estimating the selling prices of the deliverables by considering discounted cash flows using multiple inputs and assumptions, including: (1) the expected number of miles to be awarded and redeemed; (2) the estimated weighted average equivalent ticket value, adjusted by a fulfillment discount; (3) the estimated total annual cardholder spend; (4) an estimated royalty rate for the Hawaiian portfolio; and (5) the expected use of each of the airline benefits. The overall consideration received is allocated to the deliverables based on their relative selling prices. The transportation element is deferred and recognized as passenger revenue over the period when the transportation is expected to be provided (24 months). The other elements are generally recognized as other revenue when earned.
In the previous co-branded credit card agreement, the estimated fair value of the transportation element was deferred and recognized as passenger revenue over the period the transportation was expected to be provided. Amounts received in excess of the transportation’s estimated fair value were recognized immediately as other revenue.
Under the programs of certain participating companies, credits are accumulated in accounts maintained by the participating company, then transferred into a member's HawaiianMiles account for immediate redemption of free travel awards. For those transactions, revenue is recognized over the period during which the mileage is projected to be used for travel (five months).
On an annual basis, we review the deferral period and deferral rate for mileage credits sold to participating companies (except for miles sold under our co-branded credit card agreement), as well as the breakage rate assumption for free travel awards earned in connection with the purchase of passenger tickets. The cost components of the incremental cost assumption are reviewed on a quarterly basis.
Pension and Other Postretirement and Postemployment Benefits
The calculation of pension and other postretirement and postemployment benefit expenses and its corresponding liabilities require the use of significant assumptions, including the assumed discount rate, the expected long-term rate of return on plan assets, expected mortality rates of the plan participants, and the expected health care cost trend rate. Changes in these assumptions will impact the expense and liability amounts, and future actual experience may differ from these assumptions. The significant assumptions as of December 31, 2015 are as follows:
Pension: | ||||
Discount rate to determine projected benefit obligation | 4.56 | % | ||
Expected return on plan assets | 6.89 | % | + | |
Postretirement: | ||||
Discount rate to determine projected benefit obligation | 4.72 | % | ||
Expected return on plan assets | N/A | |||
Expected health care cost trend rate: | ||||
Initial | 8.25 | % | ||
Ultimate | 4.75 | % | ||
Years to reach ultimate trend rate | 7 | |||
Disability: | ||||
Discount rate to determine projected benefit obligation | 4.61 | % | ||
Expected return on plan assets | 5.40 | % | + | |
N/A Not Applicable
+ | Expected return on plan assets used to determine the net periodic benefit expense for 2016 is 6.69% for the pension plans and 5.37% for the disability plan. |
35
The expected long-term rate of return assumption is developed by evaluating input from the trustee managing the plans' assets, including the trustee's review of asset class return expectations by several consultants and economists, as well as long-term inflation assumptions. Our expected long-term rate of return on plan assets is based on a target allocation of assets, which is based on our goal of earning the highest rate of return while maintaining risk at acceptable levels. The plan strives to sufficiently diversify assets so that adverse or unexpected results from one security class will not have an unduly detrimental impact on the entire portfolio. We believe that our long-term asset allocation on average will approximate the targeted allocation. We periodically review our actual asset allocation and rebalance the pension plan's investments to our targeted allocation when considered appropriate. Pension expense increases as the expected rate of return on plan assets decreases. Lowering the expected long-term rate of return will have the following effects on our estimated 2016 pension and disability benefit expense:
100 Basis Point Decrease | |||
(in millions) | |||
Increase in estimated 2016 pension expense | $ | 2.5 | |
Increase in estimated 2016 disability benefit expense | 0.2 | ||
We determine the appropriate discount rate for each of our plans based on current rates on high quality corporate bonds that would generate the cash flow necessary to pay plan benefits when due. The pension and other postretirement benefit liabilities and future expense both increase as the discount rate is reduced. Lowering the discount rate would have the following effects:
100 Basis Point Decrease | |||
(in millions) | |||
Increase in pension obligation as of December 31, 2015 | $ | 55.9 | |
Increase in other postretirement benefit obligation as of December 31, 2015 | 41.4 | ||
Increase in estimated 2016 pension expense | 2.8 | ||
Increase in estimated 2016 other postretirement benefit expense | 6.0 | ||
The health care cost trend rate is based upon an evaluation of the Company's historical trends and experience taking into account current and expected market conditions. Changes in the assumed health care cost trend rate would have the following annual effects:
100 Basis Point Increase | |||
(in millions) | |||
Increase in other postretirement benefit obligation as of December 31, 2015 | $ | 36.9 | |
Increase in estimated 2016 other postretirement benefit expense | 7.4 | ||
100 Basis Point Decrease | |||
(in millions) | |||
Decrease in other postretirement benefit obligation as of December 31, 2015 | $ | 28.8 | |
Decrease in estimated 2016 other postretirement benefit expense | 4.8 | ||
Aircraft Maintenance and Repair Costs
On a quarterly basis we complete a forecast of maintenance costs for the next scheduled event on applicable leased aircraft and compare these estimates to our forecasted nonrefundable deposits to identify costs not expected to be recoverable. Any costs not expected to be recoverable are considered to be not substantially and contractually related to maintenance of the leased asset. Therefore, we bifurcate and expense the proportionate share that is estimated to not be recoverable from existing and future nonrefundable deposits. In determining whether it is probable that maintenance deposits will be used to fund the cost of the maintenance events, we conduct the following analysis:
• | We evaluate the aircraft's condition, including the airframe, the engines, the auxiliary power unit and the landing gear. |
• | We then project future usage of the aircraft during the term of the lease based on our business and fleet plan. |
• | We estimate the cost of performing the next scheduled maintenance event. These estimates are based on the experience of our maintenance personnel and available industry data, including historical fleet operating statistic reports published by the aircraft and engine manufacturers. |
36
• | We compare the forecasted maintenance deposits to be paid at the time of the next scheduled maintenance event to the estimated cost of the next scheduled maintenance event. Those costs not expected to be recoverable are considered to be not substantially and contractually related to maintenance of the leased asset. |
• | We prospectively account for any changes in estimates. |
Our assessment of the recoverability of our maintenance deposits is subject to change in the event that key estimates and assumptions change over time. Those key estimates and assumptions include our fleet plan and the projected total cost and, to a lesser extent, anticipated timing of the major maintenance activities covered by the maintenance reserves.
Based on current market conditions, we believe that further significant changes in our fleet plan are unlikely. Furthermore, based on historical trends and future projections, including those published by the manufacturers of our aircraft and engines, we believe it is unlikely that future maintenance costs for our aircraft will decline to such an extent that the maintenance deposits currently recorded on our Consolidated Balance Sheets would not be used to fund the cost of future maintenance events and, therefore, not be recoverable.
ITEM 7A. QUANTITATIVE AND QUALITATIVE DISCLOSURES ABOUT MARKET RISK.
We are subject to certain market risks, including commodity price risk (i.e. jet fuel prices), interest rate risk and foreign currency risk. We have market-sensitive instruments in the form of variable-rate debt and financial derivatives used to offset Hawaiian's exposure to jet fuel price increases, and financial hedge instruments used to hedge Hawaiian's exposure to variable interest rate risk and foreign currency exchange risk. The adverse effects of potential changes in these market risks are discussed below.
The sensitivity analyses presented do not consider the effects that such adverse changes may have on overall economic activity nor do they consider additional actions we might undertake to mitigate our exposure to such changes. Actual results may differ.
Aircraft Fuel Costs
Aircraft fuel costs constitute a significant portion of our operating expense. Fuel costs represented 22% of our operating expenses for the year ended December 31, 2015. Approximately 70% of our fuel is based on Singapore jet fuel prices and 30% is based on U.S. West Coast jet fuel prices. Based on gallons expected to be consumed in 2016, for every one cent increase in the cost of a gallon of jet fuel, our fuel expense would increase by approximately $2.4 million, excluding the results of our fuel hedge program.
We periodically enter into derivative financial instruments to manage our exposure to changes in the price of jet fuel. During 2015, our fuel hedge program primarily consisted of heating oil puts and swaps. Put option contracts provide for a settlement in favor of the holder in the event the prices fall below a predetermined contractual level during a particular time period. Swaps provide for a settlement in our favor in the event the prices exceed a predetermined contractual level and are unfavorable in the event prices fall below a predetermined contractual level.
As of December 31, 2015, we hedged approximately 35% of our projected fuel requirements for 2016 with heating oil puts and swaps. As of December 31, 2015, the fair value of these fuel derivative agreements reflected a net liability of $39.5 million that is recorded in other accrued liabilities in the Consolidated Balance Sheets.
We expect to continue our program of offsetting some of our exposure to future changes in the price of jet fuel with a combination of fixed forward pricing contracts, swaps, puts and other option-based structures.
We do not hold or issue derivative financial instruments for trading purposes.
Interest Rates
Our results of operations are affected by fluctuations in interest rates due to our variable-rate debt and interest income earned on our cash deposits. Our variable-rate debt agreements include the Revolving Credit Facility and secured loan agreements, the terms of which are discussed in Note 8 to our consolidated financial statements.
At December 31, 2015, we had $51.0 million of variable-rate debt indexed to the following interest rate:
Index | Rate | |
Three-month LIBOR | 0.54 | % |
Changes in market interest rates have a direct and corresponding effect on our pre-tax earnings and cash flows associated with our variable-rate debt and interest-bearing cash accounts. Based on the balances of our cash and cash equivalents, restricted
37
cash, short-term investments, and variable-rate debt as of December 31, 2015, a change in interest rates is unlikely to have a material impact on our results of operations.
At December 31, 2015, we had $721 million of fixed-rate debt including aircraft capital lease obligations, a convertible note, facility agreements for aircraft purchases, and the outstanding equipment notes related to the EETC financing. Market risk for fixed-rate long-term debt is estimated as the potential increase in fair value resulting from a hypothetical 10% decrease in market rates, and amounted to approximately $15 million as of December 31, 2015.
In April 2013, we issued variable-rate debt to finance a portion of the purchase price of another Airbus A330-200 aircraft. The interest rate associated with this debt is based on a market index rate that resets every three months. To limit our exposure to significant increases in the applicable market index rates for this debt, we entered into a forward starting interest swap agreement, which had an immaterial impact on our financial statements.
Foreign Currency
We generate revenues and incur expenses in foreign currencies. Changes in foreign currency exchange rates impact our results of operations through changes in the dollar value of foreign currency-denominated operating revenues and expenses. Our most significant foreign currency exposures are the Japanese Yen and Australian Dollar. Based on expected 2016 revenues and expenses denominated in Japanese Yen and Australian Dollars, a 10% strengthening in value of the U.S. dollar, relative to the Japanese Yen and Australian Dollar, would result in a decrease in operating income of approximately $18 million and $9 million, respectively, which excludes the offset of the hedges discussed below. This potential impact to the results of our operation is driven by the inherent nature of our international operations, which requires us to accept a large volume of sales transactions denominated in foreign currencies while few expense transactions are settled in foreign currencies. This disparity is the primary factor in our exposure to foreign currency exchange rates.
As of December 31, 2015, the fair value of our foreign currency forwards reflected a net asset of $5.9 million that is recorded in prepaid expenses and other, and $0.4 million recorded in other liabilities and deferred credits reflected in the Consolidated Balance Sheets.
38
ITEM 8. FINANCIAL STATEMENTS AND SUPPLEMENTARY DATA.
INDEX TO FINANCIAL STATEMENTS
Page | |
Hawaiian Holdings, Inc. | |
39
REPORT OF INDEPENDENT REGISTERED PUBLIC ACCOUNTING FIRM
The Board of Directors and Shareholders of Hawaiian Holdings, Inc.
We have audited the accompanying consolidated balance sheets of Hawaiian Holdings, Inc. as of December 31, 2015 and 2014, and the related consolidated statements of operations, comprehensive income (loss), shareholders' equity, and cash flows for each of the three years in the period ended December 31, 2015. Our audits also included the financial statement schedule listed in the Index at Item 15(a). These financial statements and schedule are the responsibility of the Company's management. Our responsibility is to express an opinion on these financial statements and schedule based on our audits.
We conducted our audits in accordance with the standards of the Public Company Accounting Oversight Board (United States). Those standards require that we plan and perform the audit to obtain reasonable assurance about whether the financial statements are free of material misstatement. An audit includes examining, on a test basis, evidence supporting the amounts and disclosures in the financial statements. An audit also includes assessing the accounting principles used and significant estimates made by management, as well as evaluating the overall financial statement presentation. We believe that our audits provide a reasonable basis for our opinion.
In our opinion, the financial statements referred to above present fairly, in all material respects, the consolidated financial position of Hawaiian Holdings, Inc. at December 31, 2015 and 2014, and the consolidated results of its operations and its cash flows for each of the three years in the period ended December 31, 2015, in conformity with U.S. generally accepted accounting principles. Also, in our opinion, the related financial statement schedule, when considered in relation to the basic financial statements taken as a whole, presents fairly in all material respects the information set forth therein.
We also have audited, in accordance with the standards of the Public Company Accounting Oversight Board (United States), Hawaiian Holdings, Inc.'s internal control over financial reporting as of December 31, 2015, based on criteria established in Internal Control—Integrated Framework issued by the Committee of Sponsoring Organizations of the Treadway Commission (2013 framework) and our report dated February 8, 2016, expressed an unqualified opinion thereon.
/s/ ERNST & YOUNG LLP | ||
Honolulu, Hawai'i
February 8, 2016
40
Hawaiian Holdings, Inc.
Consolidated Statements of Operations
For the Years ended December 31, 2015, 2014 and 2013
2015 | 2014 | 2013 | |||||||||
(in thousands, except per share data) | |||||||||||
Operating Revenue: | |||||||||||
Passenger | $ | 2,025,610 | $ | 2,045,052 | $ | 1,942,829 | |||||
Other | 291,857 | 269,827 | 213,036 | ||||||||
Total | 2,317,467 | 2,314,879 | 2,155,865 | ||||||||
Operating Expenses: | |||||||||||
Aircraft fuel, including taxes and delivery | 417,728 | 678,253 | 698,802 | ||||||||
Wages and benefits | 499,506 | 447,446 | 427,438 | ||||||||
Aircraft rent | 115,653 | 106,422 | 108,534 | ||||||||
Maintenance materials and repairs | 224,648 | 225,619 | 203,387 | ||||||||
Aircraft and passenger servicing | 117,449 | 122,780 | 120,635 | ||||||||
Commissions and other selling | 119,746 | 122,518 | 125,900 | ||||||||
Depreciation and amortization | 105,581 | 96,374 | 83,050 | ||||||||
Other rentals and landing fees | 95,055 | 87,902 | 81,317 | ||||||||
Purchased services | 81,838 | 73,386 | 63,642 | ||||||||
Other | 114,160 | 109,047 | 109,413 | ||||||||
Total | 1,891,364 | 2,069,747 | 2,022,118 | ||||||||
Operating Income | 426,103 | 245,132 | 133,747 | ||||||||
Nonoperating Income (Expense): | |||||||||||
Interest expense and amortization of debt discounts and issuance costs | (55,678 | ) | (64,240 | ) | (50,453 | ) | |||||
Interest income | 2,811 | 1,684 | 639 | ||||||||
Capitalized interest | 3,261 | 8,024 | 12,625 | ||||||||
Losses on fuel derivatives | (59,931 | ) | (63,471 | ) | (5,334 | ) | |||||
Loss on extinguishment of debt | (12,058 | ) | (3,885 | ) | — | ||||||
Other, net | (8,820 | ) | (9,797 | ) | (4,814 | ) | |||||
Total | (130,415 | ) | (131,685 | ) | (47,337 | ) | |||||
Income Before Income Taxes | 295,688 | 113,447 | 86,410 | ||||||||
Income tax expense | 113,042 | 44,521 | 34,556 | ||||||||
Net Income | $ | 182,646 | $ | 68,926 | $ | 51,854 | |||||
Net Income Per Common Stock Share: | |||||||||||
Basic | $ | 3.38 | $ | 1.29 | $ | 1.00 | |||||
Diluted | $ | 2.98 | $ | 1.10 | $ | 0.98 | |||||
Weighted Average Number of Common Stock Shares Outstanding: | |||||||||||
Basic | 54,031 | 53,591 | 52,099 | ||||||||
Diluted | 61,256 | 62,822 | 53,155 | ||||||||
See accompanying Notes to Consolidated Financial Statements.
41
Hawaiian Holdings, Inc.
Consolidated Statements of Comprehensive Income (Loss)
For the Years ended December 31, 2015, 2014 and 2013
Year Ended December 31, | |||||||||||
2015 | 2014 | 2013 | |||||||||
(in thousands) | |||||||||||
Net Income | $ | 182,646 | $ | 68,926 | $ | 51,854 | |||||
Other comprehensive income (loss), net: | |||||||||||
Net change related to employee benefit plans, net of tax expense of $18,826 for 2015, tax benefit of $50,968 for 2014 and tax expense of $38,886 for 2013 | 31,655 | (83,461 | ) | 61,995 | |||||||
Net change in derivative instruments, net of tax benefit of $4,866 for 2015, tax expense of $2,188 and $5,696 for 2014 and 2013, respectively | (8,002 | ) | 3,589 | 9,373 | |||||||
Net change in available-for-sale investments, net of tax benefit of $72 and $154 for 2015 and 2014, respectively | (118 | ) | (254 | ) | — | ||||||
Total other comprehensive income (loss) | 23,535 | (80,126 | ) | 71,368 | |||||||
Total Comprehensive Income (Loss) | $ | 206,181 | $ | (11,200 | ) | $ | 123,222 | ||||
See accompanying Notes to Consolidated Financial Statements.
42
Hawaiian Holdings, Inc.
Consolidated Balance Sheets
December 31, 2015 and 2014
2015 | 2014 | ||||||
(in thousands, except share data) | |||||||
ASSETS | |||||||
Current Assets: | |||||||
Cash and cash equivalents | $ | 281,502 | $ | 264,087 | |||
Restricted cash | 5,000 | 6,566 | |||||
Short-term investments | 278,545 | 260,121 | |||||
Accounts receivable, net | 81,723 | 80,737 | |||||
Spare parts and supplies, net | 19,164 | 18,011 | |||||
Prepaid expenses and other | 75,050 | 53,382 | |||||
Total | 740,984 | 682,904 | |||||
Property and equipment, net | |||||||
Flight equipment | 1,737,435 | 1,741,444 | |||||
Pre-delivery deposits on flight equipment | 21,467 | 97,685 | |||||
Other property and equipment | 226,350 | 201,871 | |||||
1,985,252 | 2,041,000 | ||||||
Less accumulated depreciation and amortization | (432,510 | ) | (367,507 | ) | |||
Total | 1,552,742 | 1,673,493 | |||||
Other Assets: | |||||||
Long-term prepayments and other | 90,661 | 96,225 | |||||
Intangible assets, net | 18,660 | 21,300 | |||||
Goodwill | 106,663 | 106,663 | |||||
Total Assets | $ | 2,509,710 | $ | 2,580,585 | |||
LIABILITIES AND SHAREHOLDERS' EQUITY | |||||||
Current Liabilities: | |||||||
Accounts payable | $ | 101,310 | $ | 97,260 | |||
Air traffic liability | 430,766 | 424,336 | |||||
Other accrued liabilities | 160,258 | 141,919 | |||||
Current maturities of long-term debt, less discount, and capital lease obligations | 77,466 | 156,349 | |||||
Total | 769,800 | 819,864 | |||||
Long-Term Debt and Capital Lease Obligations | 694,678 | 893,288 | |||||
Other Liabilities and Deferred Credits: | |||||||
Accumulated pension and other postretirement benefit obligations | 372,700 | 407,864 | |||||
Other liabilities and deferred credits | 89,845 | 72,650 | |||||
Deferred tax liability, net | 136,625 | 19,686 | |||||
Total | 599,170 | 500,200 | |||||
Commitments and Contingent Liabilities | |||||||
Shareholders' Equity: | |||||||
Special preferred stock, $0.01 par value per share, three shares issued and outstanding at December 31, 2015 and 2014 | — | — | |||||
Common stock, $0.01 par value per share, 53,401,439 and 54,455,568 shares issued and outstanding as of December 31, 2015 and 2014, respectively. | 534 | 545 | |||||
Capital in excess of par value | 124,091 | 251,432 | |||||
Accumulated income | 420,714 | 238,068 | |||||
Accumulated other comprehensive loss, net | (99,277 | ) | (122,812 | ) | |||
Total | 446,062 | 367,233 | |||||
Total Liabilities and Shareholders' Equity | $ | 2,509,710 | $ | 2,580,585 | |||
See accompanying Notes to Consolidated Financial Statements.
43
Hawaiian Holdings, Inc.
Consolidated Statements of Shareholders' Equity
For the Years ended December 31, 2015, 2014 and 2013
Common Stock(*) | Special Preferred Stock(**) | Capital In Excess of Par Value | Accumulated Income | Accumulated Other Comprehensive Loss | Total | ||||||||||||||||||
Balance at December 31, 2012 | $ | 514 | $ | — | $ | 264,854 | $ | 117,288 | $ | (114,054 | ) | $ | 268,602 | ||||||||||
Net Income | — | — | — | 51,854 | — | 51,854 | |||||||||||||||||
Other comprehensive income | — | — | — | — | 71,368 | 71,368 | |||||||||||||||||
Issuance of 983,151 shares of common stock related to stock awards | 10 | — | 979 | — | — | 989 | |||||||||||||||||
Share-based compensation expense | — | — | 4,573 | — | — | 4,573 | |||||||||||||||||
Excess tax benefits from stock issuance | — | — | (522 | ) | — | — | (522 | ) | |||||||||||||||
Balance at December 31, 2013 | $ | 524 | $ | — | $ | 269,884 | $ | 169,142 | $ | (42,686 | ) | $ | 396,864 | ||||||||||
Net Income | — | — | — | 68,926 | — | 68,926 | |||||||||||||||||
Other comprehensive loss | — | — | — | — | (80,126 | ) | (80,126 | ) | |||||||||||||||
Issuance of 2,032,486 shares of common stock related to stock awards | 21 | — | 3,729 | — | — | 3,750 | |||||||||||||||||
Share-based compensation expense | — | — | 5,056 | — | — | 5,056 | |||||||||||||||||
Excess tax benefits from stock issuance | — | — | 387 | — | — | 387 | |||||||||||||||||
Reacquisition of equity component of convertible notes | — | — | (27,624 | ) | — | — | (27,624 | ) | |||||||||||||||
Balance at December 31, 2014 | $ | 545 | $ | — | $ | 251,432 | $ | 238,068 | $ | (122,812 | ) | $ | 367,233 | ||||||||||
Net Income | — | — | — | 182,646 | — | 182,646 | |||||||||||||||||
Other comprehensive income | — | — | — | — | 23,535 | 23,535 | |||||||||||||||||
Issuance of 660,271 shares of common stock related to stock awards | 6 | — | (5,489 | ) | — | — | (5,483 | ) | |||||||||||||||
Repurchase and retirement of 1,714,400 shares common stock | (17 | ) | — | (40,120 | ) | — | — | (40,137 | ) | ||||||||||||||
Share-based compensation expense | — | — | 5,075 | — | — | 5,075 | |||||||||||||||||
Excess tax benefits from stock issuance | — | — | 373 | — | — | 373 | |||||||||||||||||
Reacquisition of equity component of convertible notes | — | — | (109,301 | ) | — | — | (109,301 | ) | |||||||||||||||
Settlement of convertible note call options | — | — | 304,752 | — | — | 304,752 | |||||||||||||||||
Settlement of convertible note warrants | — | — | (282,631 | ) | — | — | (282,631 | ) | |||||||||||||||
Balance at December 31, 2015 | $ | 534 | $ | — | $ | 124,091 | $ | 420,714 | $ | (99,277 | ) | $ | 446,062 | ||||||||||
(*) Common Stock—$0.01 par value; 118,000,000 authorized as of December 31, 2015 and 2014.
(**) Special Preferred Stock—$0.01 par value; 2,000,000 shares authorized as of December 31, 2015 and 2014
See accompanying Notes to Consolidated Financial Statements.
44
Hawaiian Holdings, Inc.
Consolidated Statements of Cash Flows
For the Years ended December 31, 2015, 2014 and 2013
2015 | 2014 | 2013 | |||||||||
(in thousands) | |||||||||||
Cash Flows From Operating Activities: | |||||||||||
Net Income | $ | 182,646 | $ | 68,926 | $ | 51,854 | |||||
Adjustments to reconcile net income to net cash provided by operating activities: | |||||||||||
Amortization of intangible assets | 2,640 | 2,640 | 2,640 | ||||||||
Depreciation and amortization of property and equipment | 104,176 | 94,969 | 81,645 | ||||||||
Deferred income taxes, net | 102,446 | 43,084 | 34,106 | ||||||||
Stock compensation | 6,616 | 6,680 | 4,573 | ||||||||
Loss on extinguishment of debt | 12,058 | 3,885 | — | ||||||||
Amortization of debt discounts and issuance costs | 6,678 | 9,277 | 6,949 | ||||||||
Pension and postretirement benefit cost, net | 15,973 | 9,535 | 12,543 | ||||||||
Unrealized (gain) loss on fuel derivative contracts | (1,015 | ) | 43,107 | (8,684 | ) | ||||||
Other, net | (2,245 | ) | (7,071 | ) | (9,986 | ) | |||||
Changes in operating assets and liabilities: | |||||||||||
Accounts receivable, net | (1,850 | ) | (5,803 | ) | 1,318 | ||||||
Spare parts and supplies, net | (4,323 | ) | (1,436 | ) | 5,020 | ||||||
Prepaid expenses and other current assets | 7,065 | 2,493 | (6,391 | ) | |||||||
Accounts payable | 44 | 7,473 | 7,703 | ||||||||
Air traffic liability | 6,430 | 15,250 | 20,440 | ||||||||
Other accrued liabilities | 10,075 | 2,246 | 19,449 | ||||||||
Other assets and liabilities, net | 28,614 | 5,175 | 20,091 | ||||||||
Net cash provided by operating activities | 476,028 | 300,430 | 243,270 | ||||||||
Cash Flows From Investing Activities: | |||||||||||
Additions to property and equipment, including pre-delivery deposits, net | (118,828 | ) | (442,229 | ) | (410,180 | ) | |||||
Proceeds from purchase assignment and leaseback transactions | 101,738 | — | 67,952 | ||||||||
Net proceeds from disposition of equipment | 3,669 | 16,953 | 14,414 | ||||||||
Purchases of investments | (257,448 | ) | (458,592 | ) | — | ||||||
Sales of investments | 236,062 | 197,046 | — | ||||||||
Other | (500 | ) | — | — | |||||||
Net cash used in investing activities | (35,307 | ) | (686,822 | ) | (327,814 | ) | |||||
Cash Flows From Financing Activities: | |||||||||||
Long-term borrowings | — | 368,430 | 243,110 | ||||||||
Repayments of long-term debt and capital lease obligations | (216,157 | ) | (115,246 | ) | (113,592 | ) | |||||
Repurchases and conversion of convertible notes | (184,645 | ) | (42,754 | ) | — | ||||||
Repurchases of common stock | (40,138 | ) | — | — | |||||||
Proceeds from settlement of convertible note call options | 304,752 | — | — | ||||||||
Payment for settlement of convertible note warrants | (282,631 | ) | — | — | |||||||
Debt issuance costs | (572 | ) | (1,519 | ) | (13,846 | ) | |||||
Change in cash collateral for EETC financing | 1,566 | 14,434 | (16,000 | ) | |||||||
Other | (5,481 | ) | 3,750 | 2,376 | |||||||
Net cash provided by (used in) financing activities | (423,306 | ) | 227,095 | 102,048 | |||||||
Net increase (decrease) in cash and cash equivalents | 17,415 | (159,297 | ) | 17,504 | |||||||
Cash and cash equivalents—Beginning of Year | 264,087 | 423,384 | 405,880 | ||||||||
Cash and cash equivalents—End of Year | $ | 281,502 | $ | 264,087 | $ | 423,384 | |||||
See accompanying Notes to Consolidated Financial Statements.
45
Hawaiian Holdings, Inc.
Notes to Consolidated Financial Statements
1. Summary of Significant Accounting Policies
Basis of Presentation
Hawaiian Holdings, Inc. (the Company, Holdings, we, us and our) and its direct wholly-owned subsidiary, Hawaiian Airlines, Inc. (Hawaiian), are incorporated in the State of Delaware. The Company's primary asset is its sole ownership of all issued and outstanding shares of common stock of Hawaiian.
The consolidated financial statements include the accounts of the Company and its wholly-owned subsidiaries, including its principal subsidiary, Hawaiian, through which the Company conducts substantially all of its operations. All significant intercompany balances and transactions have been eliminated upon consolidation.
Certain prior period amounts were reclassified to conform to the current period presentation. None of these reclassifications had a material effect on the consolidated financial statements.
Cash Equivalents
Cash equivalents consist of short-term, highly liquid investments with an original maturity of three months or less at the date of purchase.
Restricted Cash
Restricted cash consists of cash held as collateral by institutions that process our credit card transactions for advanced ticket sales.
Spare Parts and Supplies
Spare parts and supplies are valued at average cost, and primarily consist of expendable parts for flight equipment and other supplies. An allowance for obsolescence of expendable parts is provided over the estimated useful lives of the related aircraft and engines for spare parts expected to be on hand at the date the aircraft are retired from service. These allowances are based on management's estimates and are subject to change.
Property, Equipment and Depreciation
Property and equipment are stated at cost and depreciated on a straight-line basis to their estimated residual values over the asset's estimated useful life. Depreciation begins when the asset is placed into service. Aircraft and related parts begin depreciating on the aircraft's first revenue flight.
Estimated useful lives and residual values of property and equipment are as follows:
Boeing 717-200 aircraft and engines | 7 - 11 years, 7 - 34% residual value |
Boeing 767-300 aircraft and engines | 7 - 20 years, 0 - 10% residual value |
Airbus A330-200 aircraft and engines | 25 years, 10% residual value |
ATR turboprop aircraft and engines | 10 years, 15% residual value |
Aircraft under capital leases | 8 - 12 years, no residual value |
Flight simulator under capital lease | 25 years, 10% residual value |
Major rotable parts | Average lease term or useful life for related aircraft, 10% - 15% residual value |
Improvements to leased flight equipment | Shorter of lease term or useful life |
Facility leasehold improvements | Shorter of lease term, including assumed lease renewals when renewal is economically compelled at key airports, or useful life |
Furniture, fixtures and other equipment | 3 - 7 years, no residual value |
Capitalized software | 3 - 7 years, no residual value |
Additions and modifications that significantly enhance the operating performance and/or extend the useful lives of property and equipment are capitalized and depreciated over the lesser of the remaining useful life of the asset or the remaining lease term, as applicable. Expenditures that do not improve or extend asset lives are charged to expense as incurred. Pre-delivery deposits are capitalized when paid.
46
Aircraft under capital leases are recorded at an amount equal to the present value of minimum lease payments utilizing the Company's incremental borrowing rate at lease inception and amortized on a straight-line basis over the lesser of the remaining useful life of the aircraft or the lease term. The amortization is recorded in depreciation and amortization expense on the Consolidated Statement of Operations. Accumulated amortization of aircraft and other capital leases was $43.4 million and $31.2 million as of December 31, 2015 and 2014, respectively.
The Company capitalizes certain costs related to the acquisition and development of computer software and amortizes these costs using the straight-line method over the estimated useful life of the software. The net book value of computer software, which is included in Other property and equipment on the consolidated balance sheets, was $31.7 million and $15.6 million at December 31, 2015 and 2014, respectively. Amortization expense related to computer software was $6.3 million, $5.5 million and $7.0 million for the years ended December 31, 2015, 2014 and 2013, respectively.
Aircraft Maintenance and Repair Costs
Maintenance and repair costs for owned and leased flight equipment, including the overhaul of aircraft components, are charged to operating expenses as incurred. Engine overhaul costs covered by power-by-the-hour arrangements are paid and expensed as incurred and are based on the amount of hours flown per contract. Under the terms of these power-by-the-hour agreements, the Company pays a set dollar amount per engine hour flown on a monthly basis and the third-party vendor assumes the obligation to repair the engines at no additional cost, subject to certain specified exclusions.
Additionally, although the Company's aircraft lease agreements specifically provide that it is responsible for maintenance of the leased aircraft, the Company pays maintenance reserves to the aircraft lessors that are applied towards the cost of future maintenance events. These reserves are calculated based on a performance measure, such as flight hours, and are available for reimbursement to the Company upon the completion of the maintenance of the leased aircraft. However, reimbursements are limited to the available reserves associated with the specific maintenance activity for which the Company requests reimbursement.
Under certain aircraft lease agreements, if there are excess amounts on deposit at the expiration of the lease, the lessor is entitled to retain any excess amounts; whereas at the expiration of certain other existing aircraft lease agreements any such excess amounts are returned to the Company, provided that it has fulfilled all of its obligations under the lease agreements. The maintenance reserves paid under the lease agreements do not transfer either the obligation to maintain the aircraft or the cost risk associated with the maintenance activities to the aircraft lessor. In addition, the Company maintains the right to select any third-party maintenance provider.
Maintenance reserve payments that are expected to be recovered from lessors are recorded as deposits in the Consolidated Balance Sheets as an asset until it is less than probable that any portion of the deposit is recoverable. In addition, payments of maintenance reserves that are not substantially and contractually related to the maintenance of the leased assets are expensed as incurred. Any costs that are substantially and contractually unrelated to the maintenance of the leased asset are considered to be unrecoverable. In order to properly account for the costs that are related to the maintenance of the leased asset, the Company bifurcates its maintenance reserves into two groups and expenses the proportionate share that is expected to be unrecoverable.
Goodwill and Indefinite-lived Intangible Assets
Goodwill and intangible assets with indefinite lives are not amortized, but are tested for impairment at least annually using a three-step process in accordance with Accounting Standard Codification (ASC) Intangibles—Goodwill and Other (ASC 350).
In the event that the Company determines that the values of goodwill or indefinite-lived intangible assets have become impaired, the Company will incur an accounting charge during the period in which such determination is made. No impairments were recorded in 2015.
Impairment of Long-Lived Assets and Finite-lived Intangible Assets
Long-lived assets used in operations, consisting principally of property and equipment and finite-lived intangible assets, are tested for impairment when events or changes in circumstances indicate, in management's judgment, that the assets might be impaired and the undiscounted cash flows estimated to be generated by those assets are less than its carrying amount. When testing for impairment, management considers market trends, the expected useful lives of the assets, changes in economic conditions, recent transactions involving sales of similar assets and, if necessary, estimates of future discounted cash flows. To determine whether an impairment exists for aircraft used in operations, assets are grouped at the fleet-type level (the lowest level for which there are identifiable cash flows) and future cash flows are estimated based on projections of capacity,
47
passenger mile yield, fuel costs, labor costs and other relevant factors. If, at any time, management determines the net carrying value of an asset is not recoverable, the amount is reduced to its fair value during the period in which such determination is made. Any changes in the estimated useful lives of these assets will be accounted for prospectively.
Operating Leases
The Company leases aircraft, engines, airport and terminal facilities, office space, and other equipment under operating leases. Some of these lease agreements include escalation clauses and renewal options. For scheduled rent escalation clauses during the lease terms or for rental payments commencing at a date other than the date of initial occupancy, the Company records minimum rental expenses on a straight-line basis over the terms of the leases in the Consolidated Statements of Operations. When lease renewals are considered to be reasonably assured, the rental payments that will be due during the renewal periods are included in the determination of rent expense over the life of the lease. Rental expense for operating leases totaled $174.9 million, $160.7 million, and $158.6 million for the years ended December 31, 2015, 2014 and 2013, respectively.
Leased Aircraft Return Costs
Costs associated with the return of leased aircraft are accrued when it is probable that a payment will be made and that amount is reasonably estimable. Any accrual is based on the time remaining on the lease, planned aircraft usage and the provisions included in the lease agreement, although the actual amount due to any lessor upon return will not be known with certainty until lease termination.
Revenue Recognition
Passenger revenue is recognized either when the transportation is provided or when tickets expire unused. The value of passenger tickets for future travel is included as air traffic liability.
Various taxes and fees assessed on the sale of tickets to end customers are collected by the Company as an agent and remitted to taxing authorities. These taxes and fees have been presented on a net basis in the accompanying Consolidated Statements of Operations and recorded as a liability until remitted to the appropriate taxing authority.
Other operating revenue includes checked baggage revenue, cargo revenue, ticket change and cancellation fees, charter revenue, ground handling fees, commissions and fees earned under certain joint marketing agreements with other companies, inflight revenue and other incidental sales.
Ticket change and cancellation fees are recognized at the time the fees are assessed. All other revenue is recognized as revenue when the related goods and services are provided.
Frequent Flyer Program
HawaiianMiles, Hawaiian's frequent flyer travel award program provides a variety of awards to program members based on accumulated mileage. The Company utilizes the incremental cost method of accounting for free travel awards earned by passengers issued from the HawaiianMiles program through flight activity. The Company records a liability for the estimated incremental cost of providing travel awards that are expected to be redeemed on Hawaiian or the contractual rate of expected redemption on other airlines. The Company estimates the incremental cost of travel awards based on periodic studies of actual costs and applies these cost estimates to all issued miles, less an appropriate breakage factor for estimated miles that will not be redeemed. Incremental cost includes the costs of fuel, meals and beverages, insurance and certain other passenger traffic-related costs, but does not include any costs for aircraft ownership and maintenance. The breakage factor is estimated based on an analysis of historical expirations.
The Company also sells mileage credits to companies participating in our frequent flyer program. These sales are accounted for as multiple-element arrangements, with one element representing the travel that will ultimately be provided when the mileage credits are redeemed and the other consisting of marketing related activities that we conduct with the participating company.
In 2013, Hawaiian entered into a co-branded credit card agreement, which provides for the sale of frequent flyer miles to Barclays Bank Delaware (Barclays) which began in 2014. The agreement was a new multiple element arrangement subject to Accounting Standards Update 2009-13, Multiple Deliverable Revenue Arrangements — A consensus of the FASB Emerging Issues Task Force (ASU 2009-13), which was effective for new and materially modified revenue arrangements entered into by the Company after January 1, 2011. ASU 2009-13 requires the allocation of the overall consideration received to each deliverable using the estimated selling price. The objective of using estimated selling price based methodology is to determine the price at which the Company would transact a sale if the product or service were sold on a stand-alone basis.
48
The following four deliverables or elements were identified in the agreement: (i) travel miles; (ii) use of the Hawaiian brand and access to member lists; (iii) advertising elements; and (iv) other airline benefits including checked baggage services and travel discounts. The Company determined the relative fair value of each element by estimating the selling prices of the deliverables by considering discounted cash flows using multiple inputs and assumptions, including: (1) the expected number of miles to be awarded and redeemed; (2) the estimated weighted average equivalent ticket value, adjusted by a fulfillment discount; (3) the estimated total annual cardholder spend; (4) an estimated royalty rate for the Hawaiian portfolio; and (5) the expected use of each of the airline benefits. The overall consideration received is allocated to the deliverables based on their relative selling prices. The transportation element is deferred and recognized as passenger revenue over the period when the transportation is expected to be provided (24 months). The other elements will generally be recognized as other revenue when earned.
The Company's total frequent flyer liability for future award redemptions is reflected as components of Air traffic liability and Other liabilities and deferred credits within the Consolidated Balance Sheets as follows:
As of December 31, | |||||||
2015 | 2014 | ||||||
(in thousands) | |||||||
Air traffic liability | $ | 56,833 | $ | 49,618 | |||
Other liabilities and deferred credits | 18,054 | 15,830 | |||||
Total frequent flyer liability | $ | 74,887 | $ | 65,448 | |||
Under the programs of certain participating companies, credits are accumulated in accounts maintained by the participating company and then transferred into a member's HawaiianMiles account for immediate redemption of free travel awards. For those transactions, revenue is recognized over the period during which the mileage is projected to be used for travel (five months).
On an annual basis, the Company reviews the deferral period and deferral rate for mileage credits sold to participating companies, as well as the breakage rate assumption for free travel awards earned in connection with the purchase of passenger tickets. The Company's incremental cost assumption is reviewed on a quarterly basis.
Pension and Postretirement and Postemployment Benefits
The Company accounts for its defined benefit pension and other postretirement and postemployment plans in accordance with ASC 715, Compensation—Retirement Benefits (ASC 715), which requires companies to measure their plans' assets and obligations to determine the funded status at fiscal year-end, reflect the funded status in the statement of financial position as an asset or liability, and recognize changes in the funded status of the plans in comprehensive income during the year in which the changes occur. Pension and other postretirement and postemployment benefit expenses are recognized on an accrual basis over each employee's service periods. Pension expense is generally independent of funding decisions or requirements.
The Company uses the corridor approach in the valuation of its defined benefit pension and other postretirement and postemployment plans. The corridor approach defers all actuarial gains and losses resulting from variances between actual results and actuarial assumptions. These unrecognized actuarial gains and losses re amortized when the net gains and losses exceed 10% of the greater of the market-related value of plan assets or the projected benefit obligation at the beginning of the year. The amount in excess of the corridor is amortized over the average remaining service period to retirement date of active plan participants.
Advertising Costs
Advertising costs are expensed when incurred. Advertising expense was $17.6 million, $15.6 million and $14.1 million for the years ended December 31, 2015, 2014, and 2013, respectively.
Capitalized Interest
Interest is capitalized upon the payment of predelivery deposits for aircraft and engines, and is depreciated over the estimated useful life of the asset from service inception date.
49
Stock Compensation Plans
The Company has a stock compensation plan for it and its subsidiaries' officers, consultants and non-employee directors. The Company accounts for stock compensation awards under ASC 718, Compensation—Stock Compensation, which requires companies to measure the cost of employee services received in exchange for an award of equity instruments based on the fair value of such awards on the dates they are granted. The fair value of the awards are estimated using the following: (1) option-pricing models for grants of stock options or (2) fair value at the measurement date (usually the grant date) for awards of stock subject to time and / or performance-based vesting. The resultant cost is recognized as compensation expense over the period of time during which an employee is required to provide services to the Company (the service period) in exchange for the award, the service period generally being the vesting period of the award.
Financial Derivative Instruments
The Company uses derivatives to manage risks associated with certain assets and liabilities arising from the potential adverse impact of fluctuations in global aircraft fuel prices, interest rates and foreign currency exchange rates.
The following table summarizes the accounting treatment of the Company's derivative contracts:
Classification of Unrealized Gains (Losses) | ||||||||
Derivative Type | Accounting Designation | Classification of Realized Gains and Losses | Effective Portion | Ineffective Portion | ||||
Interest rate contracts | Designated as cash flow hedges | Interest expense and amortization of debt discounts and issuance costs | AOCI | Nonoperating income (expense) | ||||
Foreign currency exchange contracts | Designated as cash flow hedges | Passenger revenue | AOCI | Nonoperating income (expense) | ||||
Fuel hedge contracts | Not designated as hedges | Gains (losses) on fuel derivatives | Change in fair value is recorded in nonoperating income (expense) | |||||
Foreign currency exchange contracts | Not designated as hedges | Nonoperating income (expense), Other | Change in fair value is recorded in nonoperating income (expense) | |||||
If the Company terminates a derivative prior to its contractual settlement date, then the cumulative gain or loss recognized in AOCI at the termination date remains in AOCI until the forecasted transaction occurs. In a situation where it becomes probable that a hedged forecasted transaction will not occur, any gains and/or losses that have been recorded to AOCI would be required to be immediately reclassified into earnings. All cash flows associated with purchasing and settling derivatives are classified as operating cash flows in the Consolidated Statements of Cash Flows.
Use of Estimates in the Preparation of Financial Statements
The preparation of financial statements in conformity with U.S. generally accepted accounting principles requires management to make estimates and assumptions that affect the amounts reported in the financial statements and accompanying notes. Actual results could differ significantly from those estimates.
Recently Adopted Accounting Pronouncements
In November 2015, the Financial Accounting Standards Board (FASB) issued Accounting Standards Update 2015-17, Balance Sheet Classification of Deferred Taxes (ASU 2015-17), requiring an entity to classify all deferred tax assets and liabilities as noncurrent in a classified statement of financial position. It is effective for annual reporting periods beginning after December 15, 2016, and interim periods within those annual periods. Early adoption is permitted in any interim or annual period. The Company adopted this guidance as of December 31, 2015 and retrospectively applied it to all periods presented in the consolidated balance sheets. The adoption of this ASU resulted in a $21.9 million reclassification of the Company's deferred tax assets from a current asset to a noncurrent asset in the consolidated balance sheet as of December 31, 2014.
In May 2015, the FASB issued Accounting Standards Update 2015-07, Disclosures for Investments in Certain Entities That Calculate Net Asset Value per Share (or Its Equivalent) (ASU 2015-07). Certain investments measured at fair value using the Net Asset Value (NAV) practical expedient are no longer required to be categorized within a level within the fair value hierarchy table. It is effective for interim and annual reporting periods beginning after December 15, 2015, but early adoption
50
is permitted. It is to be applied retrospectively in all periods presented in an entity's financial statements. The Company adopted this guidance as of December 31, 2015, and the adoption is reflected in Note 5 and Note 11 to the financial statements.
Recently Issued Accounting Pronouncements
In April 2015, the FASB issued Accounting Standards Update 2015-03, Simplifying the Presentation of Debt Issuance Costs (ASU 2015-03), requiring an entity to present its debt issuance costs on the balance sheet as a deduction from the carrying amount of the related debt liability instead of a deferred charge. It is effective for annual reporting periods beginning after December 15, 2015, but early adoption is permitted. The impact of ASU 2015-03 on the Company's consolidated balance sheet as of December 31, 2015 and 2014 would include an estimated reclassification of unamortized debt issuance costs of $23.9 million and $30.9 million, respectively, from long-term prepayments and other to long-term debt.
In May 2014, the FASB issued Accounting Standards Update 2014-09, Revenue from Contracts with Customers (ASU 2014-09), requiring an entity to recognize the amount of revenue to which it expects to be entitled for the transfer of promised goods or services to customers. ASU 2014-09 will replace most existing revenue recognition guidance in GAAP when it becomes effective. In July 2015, the FASB voted to defer the amendments in ASU 2014-09 by one year to December 15, 2017. The terms of ASU 2014-09 are effective for fiscal years, and interim periods within those fiscal years, beginning after the revised effective date, and allow for either full retrospective or modified retrospective adoption. Organizations are permitted to adopt the new revenue standard early, but not before December 15, 2016. The Company is currently evaluating the effect that the provisions of ASU 2014-09 will have on its consolidated financial statements and related disclosures. The Company has determined that the new standard, once effective, will preclude the Company from accounting for miles earned under its HawaiianMiles customer loyalty program using the incremental cost method, and will require use of the deferred revenue method. This change could have a significant impact on the Company's financial statements.
51
2. Accumulated Other Comprehensive Loss
Reclassifications out of accumulated other comprehensive loss by component is as follows:
Year ended December 31, | ||||||||||||||
Details about accumulated other comprehensive loss components | 2015 | 2014 | 2013 | Affected line items in the statement where net income is presented | ||||||||||
(in thousands) | ||||||||||||||
Derivatives designated as hedging instruments under ASC 815 | ||||||||||||||
Foreign currency derivative gains, net | $ | (17,443 | ) | $ | (9,943 | ) | $ | (9,016 | ) | Passenger revenue | ||||
Foreign currency derivative gains, net | — | — | (760 | ) | Other nonoperating expense | |||||||||
Interest rate derivative losses, net | 687 | 813 | 656 | Interest expense | ||||||||||
Total before tax | (16,756 | ) | (9,130 | ) | (9,120 | ) | ||||||||
Tax expense | 6,333 | 3,456 | 3,447 | |||||||||||
Total, net of tax | $ | (10,423 | ) | $ | (5,674 | ) | $ | (5,673 | ) | |||||
Amortization of defined benefit pension items | ||||||||||||||
Actuarial loss | $ | 11,407 | $ | 319 | $ | 8,660 | Wages and benefits | |||||||
Prior service credit | 227 | 226 | (4 | ) | Wages and benefits | |||||||||
Total before tax | 11,634 | 545 | 8,656 | |||||||||||
Tax benefit | (4,396 | ) | (206 | ) | (3,336 | ) | ||||||||
Total, net of tax | $ | 7,238 | $ | 339 | $ | 5,320 | ||||||||
Short-term investments | ||||||||||||||
Realized gain on sales of investments, net | (8 | ) | (22 | ) | — | Other nonoperating income | ||||||||
Total before tax | (8 | ) | (22 | ) | — | |||||||||
Tax expense | 3 | 8 | — | |||||||||||
Total, net of tax | (5 | ) | (14 | ) | — | |||||||||
Total reclassifications for the period | $ | (3,190 | ) | $ | (5,349 | ) | $ | (353 | ) | |||||
A rollforward of the amounts included in accumulated other comprehensive loss, net of taxes, is as follows:
Year ended December 31, 2015 | Interest Rate Derivative | Foreign Currency Derivatives | Defined Benefit Pension Items | Short-Term Investments | Total | ||||||||||||||
(in thousands) | |||||||||||||||||||
Beginning balance | $ | 254 | $ | 12,708 | $ | (135,520 | ) | $ | (254 | ) | $ | (122,812 | ) | ||||||
Other comprehensive income before reclassifications, net of tax | (595 | ) | 3,016 | 24,417 | (113 | ) | 26,725 | ||||||||||||
Amounts reclassified from accumulated other comprehensive income (loss), net of tax | 422 | (10,845 | ) | 7,238 | (5 | ) | (3,190 | ) | |||||||||||
Net current-period other comprehensive income, net of tax | (173 | ) | (7,829 | ) | 31,655 | (118 | ) | 23,535 | |||||||||||
Ending balance | $ | 81 | $ | 4,879 | $ | (103,865 | ) | $ | (372 | ) | $ | (99,277 | ) | ||||||
52
Year ended December 31, 2014 | Interest Rate Derivative | Foreign Currency Derivatives | Defined Benefit Pension Items | Short-Term Investments | Total | ||||||||||||||
(in thousands) | |||||||||||||||||||
Beginning balance | $ | 1,096 | $ | 8,277 | $ | (52,059 | ) | $ | — | $ | (42,686 | ) | |||||||
Other comprehensive income before reclassifications, net of tax | (1,340 | ) | 10,603 | (83,800 | ) | (240 | ) | (74,777 | ) | ||||||||||
Amounts reclassified from accumulated other comprehensive income (loss), net of tax | 498 | (6,172 | ) | 339 | (14 | ) | (5,349 | ) | |||||||||||
Net current-period other comprehensive income, net of tax | (842 | ) | 4,431 | (83,461 | ) | (254 | ) | (80,126 | ) | ||||||||||
Ending balance | $ | 254 | $ | 12,708 | $ | (135,520 | ) | $ | (254 | ) | $ | (122,812 | ) | ||||||
3. Earnings Per Share
Basic earnings per share, which excludes dilution, is computed by dividing net income available to common shareholders by the weighted average number of common shares outstanding for the period.
Diluted earnings per share reflects the potential dilution that could occur if securities or other contracts to issue common stock were exercised or converted into common stock.
Year Ended December 31, | |||||||||||
2015 | 2014 | 2013 | |||||||||
(in thousands, except for per share data) | |||||||||||
Numerator: | |||||||||||
Net Income | $ | 182,646 | $ | 68,926 | $ | 51,854 | |||||
Denominator: | |||||||||||
Weighted average common shares outstanding—Basic | 54,031 | 53,591 | 52,099 | ||||||||
Assumed exercise of stock options and awards | 438 | 960 | 884 | ||||||||
Assumed exercise of convertible note premium | 1,245 | 4,910 | 172 | ||||||||
Assumed conversion of warrants | 5,542 | 3,361 | — | ||||||||
Weighted average common shares outstanding—Diluted | 61,256 | 62,822 | 53,155 | ||||||||
Net Income Per Common Stock Share: | |||||||||||
Basic | $ | 3.38 | $ | 1.29 | $ | 1.00 | |||||
Diluted | $ | 2.98 | $ | 1.10 | $ | 0.98 | |||||
The table below summarized those common stock equivalents that could potentially dilute basic earnings per share in the future but were excluded from the computation of diluted earnings per share because the instruments were antidilutive.
Year Ended December 31, | ||||||||
2015 | 2014 | 2013 | ||||||
(in thousands) | ||||||||
Stock options | — | 3 | 392 | |||||
Deferred stock | — | — | 43 | |||||
Restricted stock | 6 | 2 | 1,345 | |||||
Warrants | — | — | 10,943 | |||||
53
Convertible Notes
As of December 31, 2015, the Company's 5% Convertible Notes due in 2016 (the Convertible Notes) had an outstanding balance of $0.3 million and can be redeemed with either cash or the Company’s common stock, or a combination thereof, at the Company’s option. The shares into which the remaining principal balance of the Convertible Notes could be converted does not impact the dilutive earnings per share calculation under the if-converted method, as the Company has the intent and ability to redeem the principal amount of the Convertible Notes with cash.
In 2015 and 2014, the Company repurchased and converted $70.8 million and $15.1 million in principal of the Convertible Notes, respectively.
During the years ended December 31, 2015 and 2014, the average share price of the Company’s common stock exceeded the conversion price of $7.88 per share. Therefore, shares related to the conversion premium of the Convertible Notes (for which share settlement is assumed for EPS purposes) are included in the Company's computation of diluted earnings per share for the period the related Notes were outstanding.
See Note 8 for further information over the Convertible Notes.
Convertible Note Call Options and Warrants
In connection with the issuance of the Convertible Notes, the Company entered into separate call option transactions and separate warrant transactions with certain financial investors to reduce the potential dilution of the Company’s common stock and to offset potential payments by the Company to holders of the Convertible Notes in excess of the principal of the Convertible Notes upon conversion.
During the quarter ended December 31, 2015, the Company settled the call options and warrants with its respective counterparties and received net settlement proceeds of $22.1 million, which was recognized as an increase to shareholders' equity. Gross proceeds from the settlement of the call options of $304.8 million and gross payments for the settlement of the warrants of $282.6 million are reflected in the Consolidated Statements of Shareholders' Equity and Consolidated Statements of Cash Flows.
For the years ended December 31, 2015 and 2014, the average share price of the Company's common stock exceeded the warrant strike price of $10.00 per share. Therefore, the impact of the assumed conversion of the warrants are included in the Company's computation of diluted earnings per share for the period they were outstanding. For the year ended December 31, 2013, the weighted common stock equivalents for warrants were excluded from the computation of diluted earnings per share because the warrant strike price exceeded the average share price of the Company's common stock.
Stock Repurchase Program
In April 2015, the Company's Board of Directors approved a stock repurchase program under which the Company may repurchase up to $100 million of its outstanding common stock over a two-year period through the open market, established plans or privately negotiated transactions in accordance with all applicable securities laws, rules and regulations. The stock repurchase program is subject to modification or termination at any time. The Company spent $40.2 million to repurchase approximately 1.7 million shares of the Company's common stock in open market transactions during the year ended December 31, 2015. As of December 31, 2015, the Company has $59.8 million remaining to spend under the stock repurchase program. See Part II, Item 2., “Unregistered Sales of Equity Securities and Use of Proceeds” of this report for additional information on the stock repurchase program.
54
4. Short-Term Investments
Debt securities that are not classified as cash equivalents are classified as available-for-sale investments and are stated at fair value. Realized gains and losses on sales of investments are reflected in nonoperating income (expense). Unrealized gains and losses on available-for-sale securities are reflected as a component of accumulated other comprehensive loss.
The following is a summary of short-term investments held as of December 31, 2015 and 2014:
December 31, 2015 | Amortized Cost | Gross Unrealized Gains | Gross Unrealized Losses | Fair Value | ||||||||||||
(in thousands) | ||||||||||||||||
Corporate debt | $ | 167,066 | $ | 13 | $ | (481 | ) | $ | 166,598 | |||||||
U.S. government and agency debt | 62,376 | 9 | (123 | ) | 62,262 | |||||||||||
Municipal bonds | 22,865 | 3 | (12 | ) | 22,856 | |||||||||||
Other fixed income securities | 26,835 | — | (6 | ) | 26,829 | |||||||||||
Total short-term investments | $ | 279,142 | $ | 25 | $ | (622 | ) | $ | 278,545 | |||||||
December 31, 2014 | Amortized Cost | Gross Unrealized Gains | Gross Unrealized Losses | Fair Value | ||||||||||||
(in thousands) | ||||||||||||||||
Corporate debt | $ | 180,794 | $ | 43 | $ | (394 | ) | $ | 180,443 | |||||||
U.S. government and agency debt | 38,268 | — | (40 | ) | 38,228 | |||||||||||
Municipal bonds | 23,849 | 4 | (16 | ) | 23,837 | |||||||||||
Other fixed income securities | 17,618 | — | (5 | ) | 17,613 | |||||||||||
Total short-term investments | $ | 260,529 | $ | 47 | $ | (455 | ) | $ | 260,121 | |||||||
Contractual maturities of short-term investments as of December 31, 2015 are shown below.
Under 1 Year | 1 to 5 Years | Total | ||||||||||
(in thousands) | ||||||||||||
Corporate debt | $ | 48,187 | $ | 118,411 | $ | 166,598 | ||||||
U.S. government and agency debt | 36,947 | 25,315 | 62,262 | |||||||||
Municipal bonds | 15,823 | 7,033 | 22,856 | |||||||||
Other fixed income securities | 23,541 | 3,288 | 26,829 | |||||||||
Total short-term investments | $ | 124,498 | $ | 154,047 | $ | 278,545 | ||||||
The Company classifies investments as current assets as these securities are available for use in its current operations.
5. Fair Value Measurements
ASC 820 defines fair value as an exit price, representing the amount that would be received to sell an asset or paid to transfer a liability in an orderly transaction between market participants. As such, fair value is a market-based measurement that should be determined based on assumptions that market participants would use in pricing an asset or liability. As a basis for considering such assumptions, ASC 820 establishes a three-tier fair value hierarchy, which prioritizes the inputs used in measuring fair value as follows:
55
Level 1—Observable inputs such as quoted prices in active markets for identical assets or liabilities; |
Level 2—Observable inputs other than Level 1 prices such as quoted prices for similar assets or liabilities; quoted prices in markets that are not active; or other inputs that are observable or can be corroborated by observable market data for substantially the full term for the assets or liabilities; and |
Level 3—Unobservable inputs in which there is little or no market data and that are significant to the fair value of the assets or liabilities. |
The tables below present the Company's financial assets and liabilities measured at fair value on a recurring basis:
Fair Value Measurements as of December 31, 2015 | |||||||||||||||
Total | Level 1 | Level 2 | Level 3 | ||||||||||||
(in thousands) | |||||||||||||||
Cash equivalents | $ | 5,665 | $ | 1,648 | $ | 4,017 | $ | — | |||||||
Cash equivalents measured at net asset value | 61,577 | — | — | — | |||||||||||
Restricted cash | 5,000 | 5,000 | — | — | |||||||||||
Short-term investments | 278,545 | — | 278,545 | — | |||||||||||
Fuel derivative contracts: | |||||||||||||||
Heating oil put options | 1,060 | — | 1,060 | — | |||||||||||
Foreign currency derivatives | 6,550 | — | 6,550 | — | |||||||||||
Total assets measured at fair value | $ | 358,397 | $ | 6,648 | $ | 290,172 | $ | — | |||||||
Fuel derivative contracts: | |||||||||||||||
Heating oil swaps | $ | 40,530 | $ | — | $ | 40,530 | $ | — | |||||||
Foreign currency derivatives | 1,049 | — | 1,049 | — | |||||||||||
Interest rate derivative | 312 | — | 312 | — | |||||||||||
Total liabilities measured at fair value | $ | 41,891 | $ | — | $ | 41,891 | $ | — | |||||||
Fair Value Measurements as of December 31, 2014 | |||||||||||||||
Total | Level 1 | Level 2 | Level 3 | ||||||||||||
(in thousands) | |||||||||||||||
Cash equivalents | $ | 24,523 | $ | 5,364 | $ | 19,159 | $ | — | |||||||
Cash equivalents measured at net asset value | 30,549 | — | — | — | |||||||||||
Restricted cash | 6,566 | 6,566 | — | — | |||||||||||
Short-term investments | 260,121 | — | 260,121 | — | |||||||||||
Fuel derivative contracts: | |||||||||||||||
Heating oil put options | 32,637 | — | 32,637 | — | |||||||||||
Foreign currency derivatives | 19,746 | — | 19,746 | — | |||||||||||
Total assets measured at fair value | $ | 374,142 | $ | 11,930 | $ | 331,663 | $ | — | |||||||
Fuel derivative contracts: | |||||||||||||||
Heating oil swaps | $ | 71,447 | $ | — | $ | 71,447 | $ | — | |||||||
Interest rate derivative | 129 | — | 129 | — | |||||||||||
Negative interest arbitrage derivative | 500 | — | — | 500 | |||||||||||
Total liabilities measured at fair value | $ | 72,076 | $ | — | $ | 71,576 | $ | 500 | |||||||
Cash equivalents. The Company’s cash equivalents consist of money market securities, U.S. agency bonds, foreign and domestic corporate bonds, and commercial paper. The instruments classified as Level 2 are valued using quoted prices for similar assets in active markets.
56
Cash equivalents measured at net asset value. Cash equivalents measured at net asset value consist of money market securities that are measured at fair value using the net asset value per share practical expedient. In accordance with ASC 820, these instruments are not included in the fair value hierarchy.
Restricted cash. The Company’s restricted cash consist of money market securities.
Short-term investments. Short-term investments include U.S. and foreign government notes and bonds, U.S. agency bonds, variable rate corporate bonds, asset backed securities, foreign and domestic corporate bonds, municipal bonds, and commercial paper. These instruments are valued using quoted prices for similar assets in active markets or other observable inputs.
Fuel derivative contracts. The Company’s fuel derivative contracts consist of heating oil puts and swaps which are not traded on a public exchange. The fair value of these instruments are determined based on inputs available or derived from public markets including contractual terms, market prices, yield curves and measures of volatility among others.
Foreign currency derivatives. The Company’s foreign currency derivatives consist of Japanese Yen and Australian Dollar forward contracts and are valued based primarily on data available or derived from public markets.
Interest rate derivative. The Company’s interest rate derivative consists of an interest rate swap and is valued based primarily on data available or derived from public markets.
The table below presents the Company's debt (excluding obligations under capital leases) measured at fair value:
Fair Value of Debt | ||||||||||||||||||||||||||||||||||||||
December 31, 2015 | December 31, 2014 | |||||||||||||||||||||||||||||||||||||
Carrying Amount | Fair Value | Carrying Amount | Fair Value | |||||||||||||||||||||||||||||||||||
Total | Level 1 | Level 2 | Level 3 | Total | Level 1 | Level 2 | Level 3 | |||||||||||||||||||||||||||||||
(in thousands) | (in thousands) | |||||||||||||||||||||||||||||||||||||
$ | 677,203 | $ | 665,507 | $ | — | $ | 283 | $ | 665,224 | $ | 947,897 | $ | 956,811 | $ | — | $ | 69,766 | $ | 887,045 | |||||||||||||||||||
The fair value estimates of the Company's debt were based on either market prices or the discounted amount of future cash flows using the Company's current incremental rate of borrowing for similar obligations.
The carrying amounts of cash, other receivables and accounts payable approximate fair value due to the short-term nature of these financial instruments.
6. Financial Derivative Instruments
The Company uses derivatives to manage risks associated with certain assets and liabilities arising from the potential adverse impact of fluctuations in global fuel prices, interest rates and foreign currencies.
Fuel Risk Management
The Company's operations are inherently dependent upon the price and availability of aircraft fuel. To manage economic risks associated with fluctuations in aircraft fuel prices, the Company periodically enters into derivative financial instruments. The Company primarily used heating oil puts and swaps to hedge its aircraft fuel expense. As of December 31, 2015, the Company had heating oil put and swap contracts, which were not designated as hedges under ASC Topic 815, Derivatives and Hedging (ASC 815), for hedge accounting treatment. As a result, any changes in fair value of these derivative instruments are adjusted through other nonoperating income (expense) in the period of change.
57
The following table reflects the amount of realized and unrealized gains and losses recorded as nonoperating income (expense) in the Consolidated Statements of Operations.
Year Ended December 31, | |||||||||||
2015 | 2014 | 2013 | |||||||||
(in thousands) | |||||||||||
Losses realized at settlement | $ | (60,946 | ) | $ | (20,365 | ) | $ | (14,018 | ) | ||
Reversal of prior period unrealized amounts | 41,583 | (2,331 | ) | 6,013 | |||||||
Unrealized gains (losses) that will settle in future periods | (40,568 | ) | (40,775 | ) | 2,671 | ||||||
Losses on fuel derivatives recorded as Nonoperating income (expense) | $ | (59,931 | ) | $ | (63,471 | ) | $ | (5,334 | ) | ||
Foreign Currency Exchange Rate Risk Management
The Company is subject to foreign currency exchange rate risk due to revenues and expenses denominated in foreign currencies, with the primary exposures being the Japanese Yen and Australian Dollar. To manage exchange rate risk, the Company executes its international revenue and expense transactions in the same foreign currency to the extent practicable. The Company enters into foreign currency forward contracts to further manage the effects of fluctuating exchange rates. The effective portion of the gain or loss is reported as a component of AOCI and reclassified into earnings in the same period in which the related sales are recognized as passenger revenue. The effective portion of the foreign currency forward contracts represents the change in fair value of the hedge that offsets the change in the fair value of the hedged item. To the extent the change in the fair value of the hedge does not perfectly offset the change in the fair value of the hedged item, the ineffective portion of the hedge is immediately recognized as nonoperating income (expense).
The Company believes that its foreign currency forward contracts will continue to be effective in offsetting changes in cash flow attributable to the hedged risk. The Company expects to reclassify a net gain of approximately $8.2 million into earnings over the next 12 months from AOCI based on the values at December 31, 2015.
The following tables present the gross fair value of asset and liability derivatives that are designated as hedging instruments under ASC 815 and derivatives that are not designated as hedging instruments under ASC 815, as well as the net derivative positions and location of the asset and liability balances within the Consolidated Balance Sheets.
Derivative positions as of December 31, 2015
______________________________________________
Balance Sheet Location | Notional Amount | Final Maturity Date | Gross fair value of assets | Gross fair value of (liabilities) | Net derivative position | ||||||||||||
(in thousands) | (in thousands) | ||||||||||||||||
Derivatives designated as hedges | |||||||||||||||||
Interest rate derivative | Other accrued liabilities | $51,000 U.S. dollars | April 2023 | $ | — | $ | (70 | ) | $ | (70 | ) | ||||||
Other liabilities and deferred credits(1) | — | (242 | ) | (242 | ) | ||||||||||||
Foreign currency derivatives | Prepaid expenses and other | 7,594,750 Japanese Yen 44,917 Australian Dollars | December 2016 | 6,461 | (525 | ) | 5,936 | ||||||||||
Other liabilities and deferred credits | 5,437,400 Japanese Yen 8,730 Australian Dollars | December 2017 | 78 | (493 | ) | (415 | ) | ||||||||||
Derivatives not designated as hedges | |||||||||||||||||
Foreign currency derivatives | Prepaid expenses and other | 2,762,000 Japanese Yen 3,303 Australian Dollars | August 2016 | 11 | — | 11 | |||||||||||
Other liabilities and deferred credits | 2,845 Australian Dollars | March 2017 | — | (31 | ) | (31 | ) | ||||||||||
Fuel derivative contracts | Other accrued liabilities | 84,067 gallons | December 2016 | 1,060 | (40,530 | ) | (39,470 | ) | |||||||||
(1) | Represents the noncurrent portion of the $51 million interest rate derivative with final maturity in April 2023. |
58
Derivative positions as of December 31, 2014
__________________________________________________________
Balance Sheet Location | Notional Amount | Final Maturity Date | Gross fair value of assets | Gross fair value of (liabilities) | Net derivative position | ||||||||||||
(in thousands) | (in thousands) | ||||||||||||||||
Derivatives designated as hedges | |||||||||||||||||
Interest rate derivative | Other accrued liabilities | $57,400 U.S. dollars | April 2023 | $ | — | $ | (26 | ) | $ | (26 | ) | ||||||
Other liabilities and deferred credits(1) | — | (103 | ) | (103 | ) | ||||||||||||
Foreign currency derivatives | Prepaid expenses and other | 6,909,050 Japanese Yen 51,380 Australian Dollars | December 2015 | 13,921 | — | 13,921 | |||||||||||
Long-term prepayments and other | 3,758,500 Japanese Yen 13,080 Australian Dollars | November 2016 | 4,565 | — | 4,565 | ||||||||||||
Derivatives not designated as hedges | |||||||||||||||||
Foreign currency derivatives | Prepaid expenses and other | 7,714,291 Japanese Yen 43,546 Australian Dollars | December 2015 | 1,191 | — | 1,191 | |||||||||||
Long-term prepayments and other | 2,762,000 Japanese Yen 3,500 Australian Dollars | August 2016 | 69 | — | 69 | ||||||||||||
Fuel derivative contracts | Other accrued liabilities | 90,994 gallons | December 2015 | 32,637 | (71,447 | ) | (38,810 | ) | |||||||||
Negative arbitrage derivative | Other accrued liabilities | $444,540 U.S. dollars | January 2015 | — | (500 | ) | (500 | ) | |||||||||
(1) Represents the noncurrent portion of the $57 million interest rate derivative with final maturity in April 2023.
The following table reflects the impact of cash flow hedges designated for hedge accounting treatment and their location within the Consolidated Statements of Comprehensive Income.
(Gain) Loss recognized in AOCI on derivatives (effective portion) | (Gain) Loss reclassified from AOCI into income (effective portion) | Gain recognized in nonoperating (income) expense (ineffective portion) | |||||||||||||||||||||||||||||||||
Year ended December 31, | Year ended December 31, | Year ended December 31, | |||||||||||||||||||||||||||||||||
2015 | 2014 | 2013 | 2015 | 2014 | 2013 | 2015 | 2014 | 2013 | |||||||||||||||||||||||||||
(in thousands) | |||||||||||||||||||||||||||||||||||
Foreign currency derivatives | $ | (4,854 | ) | $ | (17,295 | ) | $ | (22,781 | ) | $ | (17,443 | ) | $ | (9,943 | ) | $ | (9,016 | ) | $ | — | $ | — | $ | (760 | ) | ||||||||||
Interest rate derivatives | 182 | 1,249 | (1,593 | ) | 687 | 813 | 656 | — | — | — | |||||||||||||||||||||||||
Risk and Collateral
The financial derivative instruments expose the Company to possible credit loss in the event the counterparties to the agreements fail to meet their obligations. To manage such credit risks, the Company (1) selects its counterparties based on past experience and credit ratings, (2) limits its exposure to any single counterparty, and (3) periodically monitors the market position and credit rating of each counterparty. Credit risk is deemed to have a minimal impact on the fair value of the derivative instruments as cash collateral would be provided to or by the counterparties based on the current market exposure of the derivative.
The Company's agreements with its counterparties also requires the posting of cash collateral in the event the aggregate value of the Company's positions exceeds certain exposure thresholds that are based upon certain liquidity metrics of the Company. The aggregate fair value of the Company's derivative instruments that contain credit-risk related contingent features that are in a net liability position as of December 31, 2015 was $39.5 million.
ASC 815 requires a reporting entity to elect a policy of whether to offset rights to reclaim cash collateral or obligations to return cash collateral against derivative assets and liabilities executed with the same counterparty under a master netting agreement, or present such amounts on a gross basis. The Company's accounting policy is to present its derivative assets and liabilities on a net basis, including any collateral posted with the counterparty. The Company had no collateral posted with its counterparties as of December 31, 2015 and $0.6 million collateral posted with its counterparties as of December 31, 2014.
59
The Company is also subject to market risk in the event these financial instruments become less valuable in the market. However, changes in the fair value of the derivative instruments will generally offset the change in the fair value of the hedged item, limiting the Company's overall exposure.
7. Intangible Assets
The following tables summarize the gross carrying values of intangible assets less accumulated amortization, and the useful lives assigned to each asset.
As of December 31, 2015 | ||||||||||||||
Gross carrying value | Accumulated amortization | Net book value | Approximate useful life (years) | |||||||||||
(in thousands) | ||||||||||||||
Favorable aircraft maintenance contracts | $ | 18,200 | $ | (13,541 | ) | $ | 4,659 | 14 | (*) | |||||
Frequent flyer program—customer relations | 12,200 | (11,684 | ) | 516 | 11 | |||||||||
Hawaiian Airlines trade name | 13,000 | — | 13,000 | Indefinite | ||||||||||
Operating certificates | 3,660 | (3,175 | ) | 485 | 12 | |||||||||
Total intangible assets | $ | 47,060 | $ | (28,400 | ) | $ | 18,660 | |||||||
As of December 31, 2014 | |||||||||||
Gross carrying value | Accumulated amortization | Net book value | |||||||||
(in thousands) | |||||||||||
Favorable aircraft maintenance contracts | $ | 18,200 | $ | (12,305 | ) | $ | 5,895 | ||||
Frequent flyer program—customer relations | 12,200 | (10,580 | ) | 1,620 | |||||||
Hawaiian Airlines trade name | 13,000 | — | 13,000 | ||||||||
Operating certificates | 3,660 | (2,875 | ) | 785 | |||||||
Total intangible assets | $ | 47,060 | $ | (25,760 | ) | $ | 21,300 | ||||
_______________________________________________________________________________
(*) Weighted average is based on the gross carrying values and estimated useful lives as of June 2, 2005 (the date Hawaiian emerged from bankruptcy).
Amortization expense related to the above intangible assets was $2.6 million for the years ended December 31, 2015, 2014, and 2013. Amortization of the favorable aircraft maintenance contracts are included in maintenance materials and repairs in the accompanying Consolidated Statements of Operations. The estimated future amortization expense as of December 31, 2015 for the intangible assets subject to amortization is as follows (in thousands):
2016 | $ | 2,052 | |
2017 | 1,421 | ||
2018 | 1,236 | ||
2019 | 951 | ||
$ | 5,660 | ||
60
8. Debt
Long-term debt (including capital lease obligations) net of unamortized discounts is outlined as follows:
_______________________________________________________________________________
2015 | 2014 | ||||||
(in thousands) | |||||||
Class A EETC, fixed interest rate of 3.9%, semiannual principal and interest payments, remaining balance due at maturity in January 2026(1) | $ | 306,609 | $ | 328,260 | |||
Class B EETC, fixed interest rate of 4.95%, semiannual principal and interest payments, remaining balance of due at maturity in January 2022(1) | 108,014 | 116,280 | |||||
Airbus A330-200 Aircraft Facility Agreements, interest rates ranging from 5.37%- 6.46%, quarterly principal and interest payments, maturing in 2023 - 2024(2) | 144,593 | 270,154 | |||||
Boeing 717-200 Aircraft Facility Agreements, fixed interest rate of 8%, monthly principal and interest payments, remaining balance due at maturity in June 2019(2) | 117,699 | 136,792 | |||||
Five year 5% unsecured convertible notes, with interest only semiannual payments, remaining balance due at maturity in March 2016 | 289 | 71,120 | |||||
Boeing 767 Aircraft Facility Agreement, extinguished in December 2015(2) | — | 29,881 | |||||
Capital lease obligations (see Note 9) | 94,941 | 101,740 | |||||
Total debt and capital lease obligations | $ | 772,145 | $ | 1,054,227 | |||
Less: | |||||||
Unamortized discount on convertible note | (1 | ) | (4,590 | ) | |||
Current maturities | (77,466 | ) | (156,349 | ) | |||
Long-Term Debt, less discount, and Capital Lease Obligations | $ | 694,678 | $ | 893,288 | |||
(1)The equipment notes underlying these EETCs are the direct obligations of Hawaiian.
(2)Aircraft Facility Agreements are secured by aircraft.
Enhanced Equipment Trust Certificates (EETC)
In 2013, Hawaiian consummated an EETC financing, whereby it created two pass-through trusts, each of which issued pass-through certificates. The proceeds of the issuance of the pass-through certificates were used to purchase equipment notes issued by the Company to fund a portion of the purchase price for six Airbus aircraft, all of which were delivered in 2013 and 2014. The equipment notes are secured by a lien on the aircraft, and the payment obligations of Hawaiian under the equipment notes will be fully and unconditionally guaranteed by the Company. The Company issued the equipment notes to the trusts as aircraft were delivered to Hawaiian. Hawaiian received all proceeds from the pass-through trusts by 2014 and recorded the debt obligation upon issuance of the equipment notes rather than upon the initial issuance of the pass-through certificates.
Convertible Notes
On March 2011, the Company issued $86.25 million principal amount of the Convertible Notes due March 2016. The Convertible Notes were issued at par and bear interest at a rate of 5.00% per annum. Interest is paid semiannually, in arrears, on March 15 and September 15 each year.
During 2015, the Company repurchased and converted $70.8 million in principal of its Convertible Notes for $184.6 million. During 2014, the Company repurchased $15.1 million in principal of its Convertible Notes for $42.7 million. The cash consideration was allocated to the fair value of the liability component immediately before extinguishment and the remaining consideration was allocated to the equity component and recognized as a reduction of shareholders' equity.
During 2015 and 2014, the repurchase and conversion of the Convertible Notes resulted in a loss on extinguishment of $7.4 million and $1.4 million, respectively, which is reflected in nonoperating income (expense) in the Consolidated Statement of Operations.
61
Each $1,000 of principal of the Convertible Notes is convertible under certain circumstances, at an initial conversion rate of 126.8730 shares of the Company's common stock, which is the equivalent of approximately $7.8819 per share, subject to adjustment upon the occurrence of certain specified events as set forth in the indenture governing the terms of the Convertible Notes. Upon conversion, the Company will have the right, at the Company's election, to pay or deliver cash, shares of the Company's common stock or a combination thereof. As of December 31, 2015, the Company has the intent and ability to settle the principal balance of the Convertible Notes in cash.
Up through and including the second business day immediately preceding March 15, 2016, Holders may convert their Convertible Notes.
Holders may require the Company to repurchase all or a portion of their Convertible Notes upon a fundamental change, primarily a change in control or termination of trading, at a cash repurchase price equal to 100% of the principal amount of the Convertible Notes plus accrued and unpaid interest, if any. The Company may not redeem the Convertible Notes prior to their maturity date. The Convertible Notes do not limit the amount that the Company would be required to pay or the number of shares that would be required to be issued upon conversion.
Amortization of the discount allocated to the debt component of the Convertible Notes for the years ended December 31, 2015, 2014 and 2013 was $0.7 million, $4.1 million and $3.9 million, respectively, and interest expense for the years ended December 31, 2015, 2014, and 2013 was $0.9 million, $4.3 million and $4.8 million, respectively.
Debt Extinguishment
In December 2015, Hawaiian extinguished $123.9 million of existing debt under four secured financing agreements, which were originally scheduled to mature in 2018, 2023 and 2024. This debt extinguishment resulted in a loss of $4.7 million, which is reflected in nonoperating income (expense) in the Consolidated Statement of Operations.
In October 2014, Hawaiian extinguished $54.2 million of existing debt under a secured financing agreement, which was originally scheduled to mature in 2023. This debt extinguishment resulted in a loss of $2.3 million, which is reflected in nonoperating income (expense) in the Consolidated Statement of Operations.
Revolving Credit Facilities
In November 2014, Hawaiian entered into a credit agreement with Citigroup Global Markets Inc. providing for a secured revolving credit and letter of credit facility (the Revolving Credit Facility) in an amount of up to $175 million, maturing in November 2017. Hawaiian may, from time to time, grant liens on certain eligible account receivables, aircraft, spare engines, and ground support equipment, as well as cash and certain cash equivalents, in order to secure its outstanding obligations under the Revolving Credit Facility. Indebtedness under the Revolving Credit Facility will bear interest, at a per annum rate based on, at Hawaiian's option: (1) a variable rate equal to the London interbank offer rate plus a margin of 3.0%; or (2) another rate based on certain market interest rates plus a margin of 2.0%. Hawaiian is also subject to compliance and liquidity covenants under the Revolving Credit Facility.
As of December 31, 2015 the Company had no outstanding borrowing under the Revolving Credit Facility.
62
Schedule of Maturities of Long-Term Debt
As of December 31, 2015, the scheduled maturities of long-term debt are as follows (in thousands):
2016 | $ | 67,032 | |
2017 | 65,324 | ||
2018 | 63,973 | ||
2019 | 87,825 | ||
2020 | 36,508 | ||
Thereafter | 356,542 | ||
$ | 677,204 | ||
9. Leases
As of December 31, 2015, the Company had lease contracts for 17 of its 54 aircraft. Of the 17 lease contracts, 3 aircraft lease contracts were accounted for as capital leases, with the remaining 14 lease contracts accounted for as operating leases. These aircraft leases have remaining lease terms ranging from approximately 1 to 12 years.
During the year ended December 31, 2015, the Company took delivery of three Airbus A330-200 aircraft under operating leases with lease terms of 12 years.
As of December 31, 2015, the scheduled future minimum rental payments under capital leases and operating leases with non-cancellable basic terms of more than one year are as follows:
Capital Leases | Operating Leases | ||||||||||||||
Aircraft | Other | Aircraft | Other | ||||||||||||
(in thousands) | |||||||||||||||
2016 | $ | 13,698 | $ | 1,904 | $ | 112,647 | $ | 5,247 | |||||||
2017 | 13,803 | 1,776 | 108,346 | 4,560 | |||||||||||
2018 | 13,803 | 1,878 | 105,597 | 4,490 | |||||||||||
2019 | 13,803 | 2,009 | 105,452 | 4,198 | |||||||||||
2020 | 10,473 | 1,703 | 85,297 | 4,022 | |||||||||||
Thereafter | 35,269 | 7,824 | 267,740 | 22,057 | |||||||||||
100,849 | 17,094 | $ | 785,079 | $ | 44,574 | ||||||||||
Less amounts representing interest | (19,347 | ) | (3,655 | ) | |||||||||||
Present value of minimum capital lease payments | $ | 81,502 | $ | 13,439 | |||||||||||
63
10. Income Taxes
The significant components of income tax expense are as follows:
Years Ended December 31, | |||||||||||
2015 | 2014 | 2013 | |||||||||
(in thousands) | |||||||||||
Current | |||||||||||
Federal | $ | 5,008 | $ | — | $ | — | |||||
State | 5,588 | 1,437 | 450 | ||||||||
10,596 | 1,437 | 450 | |||||||||
Deferred | |||||||||||
Federal | $ | 94,457 | $ | 38,865 | $ | 30,542 | |||||
State | 7,989 | 4,219 | 3,564 | ||||||||
102,446 | 43,084 | 34,106 | |||||||||
Income tax expense | $ | 113,042 | $ | 44,521 | $ | 34,556 | |||||
The income tax expense differed from amounts computed at the statutory federal income tax rate as follows:
Years Ended December 31, | |||||||||||
2015 | 2014 | 2013 | |||||||||
(in thousands) | |||||||||||
Income tax expense computed at the statutory federal rate | $ | 103,491 | $ | 39,707 | $ | 30,243 | |||||
Increase (decrease) resulting from: | |||||||||||
State income taxes, net of federal tax effect | 8,825 | 3,677 | 2,631 | ||||||||
Nondeductible meals | 915 | 925 | 971 | ||||||||
Other | (189 | ) | 212 | 711 | |||||||
Income tax expense | $ | 113,042 | $ | 44,521 | $ | 34,556 | |||||
The ultimate realization of deferred tax assets is dependent upon the generation of future taxable income (including the reversal of deferred tax liabilities) during the periods in which those deferred tax assets will become deductible. The Company's management assesses the realizability of its deferred tax assets, and records a valuation allowance when it is more likely than not that a portion, or all, of the deferred tax assets will not be realized.
64
The components of the Company's deferred tax assets and liabilities were as follows:
December 31, | |||||||
2015 | 2014 | ||||||
(in thousands) | |||||||
Deferred tax assets: | |||||||
Accumulated pension and other postretirement benefits | $ | 142,188 | $ | 155,353 | |||
Leases | 7,708 | 7,674 | |||||
Air traffic liability | 13,401 | 11,951 | |||||
Federal and state net operating loss carryforwards | 38,279 | 125,530 | |||||
Alternative minimum tax credit carryforwards | 10,960 | 5,913 | |||||
Other accrued liabilities | 23,558 | 16,857 | |||||
Fuel derivative contracts | 15,032 | 15,847 | |||||
Other assets | 18,795 | 16,051 | |||||
Total gross deferred tax assets | 269,921 | 355,176 | |||||
Less: Valuation allowance | (3,912 | ) | (3,396 | ) | |||
Net deferred tax assets | $ | 266,009 | $ | 351,780 | |||
Deferred tax liabilities: | |||||||
Intangible assets | $ | (7,060 | ) | $ | (8,056 | ) | |
Plant and equipment, principally accelerated depreciation | (390,441 | ) | (358,717 | ) | |||
Other liabilities | (5,133 | ) | (4,693 | ) | |||
Total deferred tax liabilities | (402,634 | ) | (371,466 | ) | |||
Net deferred tax liability | $ | (136,625 | ) | $ | (19,686 | ) | |
As of December 31, 2015, the Company had available for federal income tax purposes an alternative minimum tax credit carryforward of approximately $11.0 million, which is available for an indefinite period, and net operating loss carryforwards of $288.2 million. The tax benefit of the net operating loss carryforwards as of December 31, 2015 was $38.3 million, substantially all of which will not begin to expire until 2031.
During the year ended December 31, 2015, the Company reduced its state taxes payable for the excess tax benefits from employee stock plan awards, which offset additional paid-in-capital. In addition, the Company has unrecorded excess tax benefits from stock option exercises and other employee stock programs of approximately $12.4 million as of December 31, 2015. These amounts will be credited to additional paid-in-capital when such amounts reduce income taxes payable.
In accordance with ASC 740, the Company reviews its uncertain tax positions on an ongoing basis. As of December 31, 2015, and 2014, the Company had no unrecognized tax benefits related to uncertain tax positions.
The Company records interest and penalties relating to unrecognized tax benefits in other nonoperating expense in its Consolidated Statements of Operations.
The Company files its tax returns as prescribed by the tax laws of the jurisdictions in which it operates. The Company's federal income tax returns for tax years 2012 and beyond remain subject to examination by the Internal Revenue Service.
65
11. Employee Benefit Plans
Defined Benefit Plans
Hawaiian sponsors various defined benefit pension plans covering the Air Line Pilots Association, International Association of Machinists and Aerospace Workers (AFL-CIO) (IAM) and other personnel (salaried, Transport Workers Union, Network Engineering Group). The plans for the IAM and other employees were frozen in September 1993. Effective January 1, 2008, benefit accruals for pilots under age 50 as of July 1, 2005 were frozen (with the exception of certain pilots who were both age 50 and older and participants of the plan on July 1, 2005) and Hawaiian began making contributions to an alternate defined contribution retirement program for its pilots. All of the pilots' accrued benefits under their defined benefit plan at the date of the freeze were preserved. In addition, Hawaiian sponsors four unfunded defined benefit postretirement medical and life insurance plans and a separate plan to administer the pilots' disability benefits.
The following tables summarize changes to projected benefit obligations, plan assets, funded status and applicable amounts included in the Consolidated Balance Sheets:
2015 | 2014 | ||||||||||||||
Pension | Other | Pension | Other | ||||||||||||
(in thousands) | |||||||||||||||
Change in benefit obligations | |||||||||||||||
Benefit obligations, beginning of year | $ | (480,211 | ) | $ | (215,998 | ) | $ | (397,209 | ) | $ | (154,864 | ) | |||
Service cost | (1,016 | ) | (15,335 | ) | (1,359 | ) | (10,868 | ) | |||||||
Interest cost | (19,788 | ) | (9,930 | ) | (19,125 | ) | (8,527 | ) | |||||||
Actuarial gains (losses) | 32,568 | 25,556 | (84,723 | ) | (42,964 | ) | |||||||||
Benefits paid | 22,828 | 4,051 | 22,205 | 3,736 | |||||||||||
less: federal subsidy on benefits paid | N/A | (60 | ) | N/A | (58 | ) | |||||||||
Plan amendments | — | — | — | (2,453 | ) | ||||||||||
Benefit obligation at end of year(a) | $ | (445,619 | ) | $ | (211,716 | ) | $ | (480,211 | ) | $ | (215,998 | ) | |||
Change in plan assets | |||||||||||||||
Fair value of assets, beginning of year | $ | 267,814 | $ | 17,665 | $ | 270,005 | $ | 15,129 | |||||||
Actual return on plan assets | (52 | ) | (369 | ) | 13,855 | 695 | |||||||||
Employer contribution | 14,692 | 8,648 | 6,159 | 5,577 | |||||||||||
Benefits paid | (22,828 | ) | (4,051 | ) | (22,205 | ) | (3,736 | ) | |||||||
Fair value of assets at end of year | $ | 259,626 | $ | 21,893 | $ | 267,814 | $ | 17,665 | |||||||
Unfunded status at December 31, | $ | (185,993 | ) | $ | (189,823 | ) | $ | (212,397 | ) | $ | (198,333 | ) | |||
Amounts recognized in the statement of financial position consist of: | |||||||||||||||
Current benefit liability | $ | (21 | ) | $ | (3,095 | ) | $ | (18 | ) | $ | (2,848 | ) | |||
Noncurrent benefit liability | (185,972 | ) | (186,728 | ) | (212,379 | ) | (195,485 | ) | |||||||
$ | (185,993 | ) | $ | (189,823 | ) | $ | (212,397 | ) | $ | (198,333 | ) | ||||
Amounts recognized in other comprehensive loss | |||||||||||||||
Unamortized actuarial loss | $ | 122,172 | $ | 23,475 | $ | 145,823 | $ | 50,078 | |||||||
Prior service cost (credit) | (50 | ) | 1,974 | (53 | ) | 2,203 | |||||||||
$ | 122,122 | $ | 25,449 | $ | 145,770 | $ | 52,281 | ||||||||
_______________________________________________________________________________
(a) | The accumulated pension benefit obligation as of December 31, 2015 and 2014 was $440.9 million and $475.4 million, respectively. |
66
The following table sets forth the net periodic benefit cost:
2015 | 2014 | 2013 | |||||||||||||||||||||
Pension | Other | Pension | Other | Pension | Other | ||||||||||||||||||
(in thousands) | |||||||||||||||||||||||
Components of Net Periodic Benefit Cost | |||||||||||||||||||||||
Service cost | $ | 1,016 | $ | 15,335 | $ | 1,359 | $ | 10,868 | $ | 2,555 | $ | 13,596 | |||||||||||
Interest cost | 19,788 | 9,930 | 19,125 | 8,527 | 17,389 | 7,888 | |||||||||||||||||
Expected return on plan assets | (17,753 | ) | (1,075 | ) | (18,337 | ) | (1,037 | ) | (15,348 | ) | (912 | ) | |||||||||||
Recognized net actuarial loss (gain) | 8,889 | 2,518 | 645 | (326 | ) | 6,246 | 2,414 | ||||||||||||||||
Prior service cost (credit) | (2 | ) | 229 | (2 | ) | 229 | (2 | ) | (2 | ) | |||||||||||||
Net periodic benefit cost | $ | 11,938 | $ | 26,937 | $ | 2,790 | $ | 18,261 | $ | 10,840 | $ | 22,984 | |||||||||||
Other Changes in Plan Assets and Benefit Obligations Recognized in Other Comprehensive Loss | |||||||||||||||||||||||
Current year actuarial (gain) loss | $ | (14,762 | ) | $ | (24,085 | ) | $ | 89,204 | $ | 43,318 | $ | (45,209 | ) | $ | (47,143 | ) | |||||||
Current year prior service cost | — | — | — | 2,453 | — | — | |||||||||||||||||
Amortization of actuarial gain (loss) | (8,889 | ) | (2,518 | ) | (645 | ) | 326 | (6,246 | ) | (2,414 | ) | ||||||||||||
Amortization of prior service credit (cost) | 2 | (229 | ) | 2 | (229 | ) | 2 | 2 | |||||||||||||||
Total recognized in other comprehensive loss | $ | (23,649 | ) | $ | (26,832 | ) | $ | 88,561 | $ | 45,868 | $ | (51,453 | ) | $ | (49,555 | ) | |||||||
Total recognized in net periodic benefit cost and other comprehensive loss | $ | (11,711 | ) | $ | 105 | $ | 91,351 | $ | 64,129 | $ | (40,613 | ) | $ | (26,571 | ) | ||||||||
The weighted average actuarial assumptions used to determine the net periodic benefit expense and the projected benefit obligation were as follows:
_______________________________________________________________________________
Pension | Postretirement | Disability | |||||||||||||||
2015 | 2014 | 2015 | 2014 | 2015 | 2014 | ||||||||||||
Discount rate to determine net periodic benefit expense | 4.19 | % | 5.01 | % | 4.30 | % | 5.21 | % | 4.16 | % | 4.99 | % | |||||
Discount rate to determine projected benefit obligation | 4.56 | % | 4.19 | % | 4.72 | % | 4.30 | % | 4.61 | % | 4.16 | % | |||||
Expected return on plan assets | 6.89 | % | 6.92 | % | N/A | N/A | 5.40 | % | 5.92 | % | |||||||
Rate of compensation increase | Various+ | Various+ | N/A | N/A | Various+ | Various+ | |||||||||||
Health care trend rate to determine net periodic benefit expense | N/A | N/A | 7.50 | % | 8.00 | % | N/A | N/A | |||||||||
Ultimate trend rate | N/A | N/A | 4.75 | % | 4.75 | % | N/A | N/A | |||||||||
Years to reach ultimate trend rate | N/A | N/A | 4 | 5 | N/A | N/A | |||||||||||
Health care trend rate to determine projected benefit obligation | N/A | N/A | 8.25 | % | 7.50 | % | N/A | N/A | |||||||||
Ultimate trend rate | N/A | N/A | 4.75 | % | 4.75 | % | N/A | N/A | |||||||||
Years to reach ultimate trend rate | N/A | N/A | 7 | 4 | N/A | N/A | |||||||||||
+ | Differs for each pilot based on current fleet and seat position on the aircraft and seniority service. Negotiated salary increases and expected changes in fleet and seat positions on the aircraft are included in the assumed rate of compensation increase, which ranged from 2.0% to 6.8% for 2015 (after considering estimated wage increases that are expected to be negotiated in the next labor agreement) and 1.8% to 6.5% for 2014. |
++ | Expected return on plan assets used to determine the net periodic benefit expense for 2016 is 6.69% for Pension and 5.37% for Disability. |
67
A change in the assumed health care cost trend rates would have the following effects:
100 Basis Point Increase | 100 Basis Point Decrease | ||||||
(in thousands) | |||||||
Effect on postretirement benefit obligation at December 31, 2015 | $ | 36,882 | $ | (28,761 | ) | ||
Effect on total service and interest cost for the year ended December 31, 2015 | 6,112 | (4,510 | ) | ||||
Estimated amounts that will be amortized from accumulated other comprehensive income into net periodic benefit cost in 2016 are as follows:
Pension | Other | ||||||
(in thousands) | |||||||
Actuarial loss | $ | 7,228 | $ | 432 | |||
Amortization of prior service cost (credit) | (2 | ) | 229 | ||||
To be recognized in net periodic benefit cost from accumulated other comprehensive loss | $ | 7,226 | $ | 661 | |||
Plan Assets
The Company develops the expected long-term rate of return assumption based on historical experience and by evaluating input from the trustee managing the plan's assets, including the trustee's review of asset class return expectations by several consultants and economists, as well as long-term inflation assumptions. The Company's expected long-term rate of return on plan assets is based on a target allocation of assets, which is based on the goal of earning the highest rate of return while maintaining risk at acceptable levels. The plan strives to have assets sufficiently diversified so that adverse or unexpected results from any one security class will not have an unduly detrimental impact on the entire portfolio. The actual allocation of our pension and disability plan assets and the target allocation of assets by category at December 31, 2015 are as follows:
Asset Allocation | |||||
2015 | Target | ||||
Equity securities | 59 | % | 60 | % | |
Fixed income securities | 36 | % | 35 | % | |
Real estate investment trusts | 5 | % | 5 | % | |
100 | % | 100 | % | ||
The table below presents the fair value of the Company's pension plan and other postretirement plan investments (excluding cash and receivables):
Fair Value Measurements as of December 31, | ||||||||
2015 | 2014 | |||||||
(in thousands) | ||||||||
Pension Plan Assets: | ||||||||
Equity index funds | $ | 154,670 | $ | 159,299 | ||||
Fixed income funds | 88,979 | 92,801 | ||||||
Real estate investment fund | 12,794 | 13,154 | ||||||
Insurance company pooled separate account | 2,719 | 2,113 | ||||||
Total | $ | 259,162 | $ | 267,367 | ||||
Postretirement Assets: | ||||||||
Common collective trust fund | $ | 18,959 | $ | 17,565 | ||||
The fair value of the investments in the table above have been estimated using the net asset value per share, and in accordance with subtopic 820-10, Fair Value Measurement and Disclosures, are not required to be presented in the fair value hierarchy.
68
Equity index funds. The investment objective of these funds are to obtain a reasonable rate of return while investing principally or entirely in foreign or domestic equity securities. There are currently no redemption restrictions on these investments.
Fixed income funds. The investment objective of these funds are to obtain a reasonable rate of return while principally investing in foreign and domestic bonds, mortgage-backed securities, and asset-backed securities . There are currently no redemption restrictions on these investments.
Real estate investment fund. The investment objective of this fund is to obtain a reasonable rate of return while principally investing in real estate investment trusts. There are currently no redemption restrictions on these investments.
Insurance Company Pooled Separate Account. The investment objective of the Insurance Company Pooled Separate Account is to invest in short-term cash equivalent securities to provide a high current income consistent with the preservation of principal and liquidity.
Common collective trust (CCT). The postretirement plan's CCT investment consists of a balanced profile fund and a conservative profile fund. These funds primarily invest in mutual funds and exchange-traded funds. The balanced profile fund is designed for participating trusts that seek substantial capital growth, place modest emphasis on short-term stability, have long-term investment objectives, and accept short-term volatility in the value of the fund's portfolio. The conservative profile fund is designed for participating trusts that place modest emphasis on capital growth, place moderate emphasis on short-term stability, have intermediate-to-long-term investment objectives, and accept moderate short-term volatility in the value of the fund's portfolio. There are currently no redemption restrictions on these investments.
Based on current legislation and current assumptions, the minimum required contribution that the Company is required to make to Hawaiian's defined benefit pension plans and disability plan during 2016 is $5.3 million. The Company projects that Hawaiian's pension plans and other postretirement benefit plans will make the following benefit payments, which reflect expected future service, during the years ending December 31:
Other Benefits | |||||||||||||
Pension Benefits | Gross | Expected Federal Subsidy | |||||||||||
(in thousands) | |||||||||||||
2016 | $ | 23,862 | $ | 4,651 | $ | (57 | ) | ||||||
2017 | 25,169 | 5,501 | (67 | ) | |||||||||
2018 | 26,423 | 6,285 | (77 | ) | |||||||||
2019 | 27,376 | 7,029 | (88 | ) | |||||||||
2020 | 28,149 | 7,887 | (99 | ) | |||||||||
2021 - 2025 | 146,727 | 54,186 | (709 | ) | |||||||||
$ | 277,706 | $ | 85,539 | $ | (1,097 | ) | |||||||
Defined Contribution Plans
The Company also sponsors separate defined contribution plans for its pilots, flight attendants and ground and salaried personnel. Contributions to the Company's defined contribution plans were $29.4 million, $27.3 million and $25.1 million for the years ended December 31, 2015, 2014 and 2013, respectively.
12. Capital Stock and Share-based Compensation
Common Stock
The Company has one class of common stock issued and outstanding. Each share of common stock is entitled to one vote per share.
No dividends were paid by the Company during the years ended December 31, 2015, 2014 or 2013. Provisions in certain of the Company's aircraft lease agreements restrict the Company's ability to pay dividends.
Special Preferred Stock
69
The IAM, AFA, and ALPA each hold one share of Special Preferred Stock, which entitles each union to nominate one director to the Company's Board of Directors. In addition, each series of the Special Preferred Stock, unless otherwise specified: (i) ranks senior to the Company's common stock and ranks pari passu with each other series of Special Preferred Stock with respect to liquidation, dissolution and winding up of the Company and will be entitled to receive $0.01 per share before any payments are made, or assets distributed to holders of any stock ranking junior to the Special Preferred Stock; (ii) has no dividend rights unless a dividend is declared and paid on the Company's common stock, in which case the Special Preferred Stock would be entitled to receive a dividend in an amount per share equal to two times the dividend per share paid on the common stock; (iii) is entitled to one vote per share of such series and votes with the common stock as a single class on all matters submitted to holders of the Company's common stock; and (iv) automatically converts into the Company's common stock on a 1:1 basis, at such time as such shares are transferred or such holders are no longer entitled to nominate a representative to the Company's Board of Directors pursuant to their respective collective bargaining agreements.
Share-Based Compensation
Total share-based compensation expense recognized by the Company under ASC 718 was $6.6 million, $6.7 million and $4.6 million for the years ended December 31, 2015, 2014 and 2013, respectively. As of December 31, 2015, $7.2 million of share-based compensation expense related to unvested stock options and other stock awards (inclusive of $0.4 million for stock options and other stock awards granted to non-employee directors) is attributable to future performance and has not yet been recognized. The related expense will be recognized over a weighted average period of approximately 0.9 years.
Stock Options
The aggregate intrinsic value of stock options outstanding as of December 31, 2015 and 2014 was $3.1 million and $7.6 million, respectively. The aggregate intrinsic value of stock options exercisable as of December 31, 2015 and 2014 was $3.0 million and $7.5 million, respectively. The intrinsic value of stock options exercised during the years ended December 31, 2015, 2014 and 2013 was $5.9 million, $15.9 million and $2.7 million, respectively.
Performance-Based Stock Awards
During 2015, the Company granted performance-based stock awards covering 183,827 shares of Company Common Stock (the Target Award) with a maximum payout of 296,429 shares of Common Stock (the Maximum Award) to employees pursuant to the Company's 2005 and 2015 Stock Incentive Plan. These awards vest over a period of three years. The Company valued the performance-based stock awards using grant date fair values equal to the Company's share price on the measurement date.
The following table summarizes information about performance-based stock awards:
Number of units | Weighted average grant date fair value | |||||
Non-vested at January 1, 2013 | 1,069,889 | $ | 6.09 | |||
Granted | 501,542 | 5.74 | ||||
Vested | (198,112 | ) | 6.96 | |||
Forfeited | (230,727 | ) | 5.59 | |||
Non-vested at December 31, 2013 | 1,142,592 | $ | 5.88 | |||
Granted | 348,009 | 10.04 | ||||
Vested | (353,344 | ) | 5.89 | |||
Forfeited | (133,628 | ) | 6.89 | |||
Non-vested at December 31, 2014 | 1,003,629 | $ | 7.19 | |||
Granted | 183,827 | 19.01 | ||||
Vested | (419,097 | ) | 6.41 | |||
Forfeited | (89,617 | ) | 9.76 | |||
Non-vested at December 31, 2015 | 678,742 | $ | 10.53 | |||
70
The fair value of performance-based stock awards vested in the years ended December 31, 2015, 2014 and 2013 was $10.5 million, $4.9 million and $1.3 million, respectively. Fair value of the awards are based on the stock price on date of vest.
Service-Based Stock Awards
During 2015, the Company awarded 149,138 service-based stock awards to employees and non-employee directors, pursuant to the Company's 2005 and 2015 Stock Incentive Plan. These stock awards vest over a period of one to three years and have a grant date fair value equal to the Company's share price on the measurement date.
The following table summarizes information about outstanding service-based stock awards:
Number of units | Weighted average grant date fair value | |||||
Non-vested at January 1, 2013 | 548,282 | $ | 6.19 | |||
Granted | 378,845 | 5.70 | ||||
Vested | (323,094 | ) | 6.20 | |||
Forfeited | (43,135 | ) | 6.03 | |||
Non-vested at December 31, 2013 | 560,898 | $ | 5.86 | |||
Granted | 337,333 | 12.50 | ||||
Vested | (376,408 | ) | 7.04 | |||
Forfeited | (83,862 | ) | 7.40 | |||
Non-vested at December 31, 2014 | 437,961 | $ | 9.66 | |||
Granted | 149,138 | 21.24 | ||||
Vested | (224,268 | ) | 9.01 | |||
Forfeited | (92,110 | ) | 14.25 | |||
Non-vested at December 31, 2015 | 270,721 | $ | 15.02 | |||
The fair value of service-based stock awards vested in 2015, 2014 and 2013 was $4.6 million, $3.1 million and $1.9 million, respectively. Fair value of the awards are based on the stock price on date of vest.
13. Commitments and Contingent Liabilities
Commitments
The Company has operating commitments with a third-party to provide aircraft maintenance services which include fixed payments as well as variable payments based on flight hours for our Airbus fleet through 2027. The Company also has operating commitments with third-party service providers for reservations, IT, and accounting services through 2024.
Committed capital and operating expenditures include escalation and variable amounts based on estimated forecasts. The gross committed expenditures for upcoming aircraft deliveries and committed financings for those deliveries for the next five years and thereafter are detailed below:
71
Capital | Operating | Total Committed Expenditures | |||||||||
(in thousands) | |||||||||||
2016 | $ | 85,349 | $ | 66,654 | $ | 152,003 | |||||
2017 | 221,236 | 65,231 | 286,467 | ||||||||
2018 | 396,886 | 58,987 | 455,873 | ||||||||
2019 | 483,534 | 54,567 | 538,101 | ||||||||
2020 | 230,047 | 56,397 | 286,444 | ||||||||
Thereafter | 208,168 | 287,500 | 495,668 | ||||||||
$ | 1,625,220 | $ | 589,336 | $ | 2,214,556 | ||||||
Aircraft Lease Commitment
Hawaiian entered into a six-year lease agreement for an Airbus A330-200 aircraft with an expected delivery date in the second quarter of 2016, which is not included in the table above. The Company will determine whether this lease will be classified as a capital or operating lease in the period it takes delivery of the aircraft.
The anticipated future minimum payments for this lease are $5.1 million in 2016, $8.9 million in each of the years 2017 through 2020, and $12.6 million thereafter.
Litigation and Contingencies
The Company is subject to legal proceedings arising in the normal course of its operations. Management does not anticipate that the disposition of any currently pending proceeding will have a material effect on the Company's operations, business or financial condition.
General Guarantees and Indemnifications
In the normal course of business, the Company enters into numerous aircraft financing and real estate leasing arrangements that have various guarantees included in the contract. It is common in such lease transactions for the lessee to agree to indemnify the lessor and other related third-parties for tort liabilities that arise out of or relate to the lessee's use of the leased aircraft or occupancy of the leased premises. In some cases, this indemnity extends to related liabilities arising from the negligence of the indemnified parties, but usually excludes any liabilities caused by their gross negligence or willful misconduct. Additionally, the lessee typically indemnifies such parties for any environmental liability that arises out of or relates to its use of the real estate leased premises. The Company believes that it is insured (subject to deductibles) for most tort liabilities and related indemnities described above with respect to the aircraft and real estate that it leases. The Company cannot estimate the potential amount of future payments, if any, under the foregoing indemnities and agreements.
Credit Card Holdback
Under the Company's bank-issued credit card processing agreements, certain proceeds from advance ticket sales may be held back to serve as collateral to cover any possible chargebacks or other disputed charges that may occur. These holdbacks, which are included in restricted cash in the Company's Consolidated Balance Sheets, totaled $5.0 million at December 31, 2015 and 2014.
In the event of a material adverse change in the business, the holdback could increase to an amount up to 100% of the applicable credit card air traffic liability, which would also cause an increase in the level of restricted cash.
14. Geographic Information
The Company's primary operations are that of its wholly-owned subsidiary, Hawaiian. Principally all operations of Hawaiian either originate and/or end in the State of Hawai'i. The management of such operations is based on a system-wide approach due to the interdependence of Hawaiian's route structure in its various markets. As Hawaiian offers only one significant line of business (i.e., air transportation), management has concluded that it has only one segment.
72
The Company's operating revenues by geographic region (as defined by the Department of Transportation, DOT) are summarized below:
Year Ended December 31, | |||||||||||
2015 | 2014 | 2013 | |||||||||
(in thousands) | |||||||||||
Domestic | $ | 1,775,355 | $ | 1,683,487 | $ | 1,493,295 | |||||
Pacific | 542,112 | 631,392 | 662,570 | ||||||||
Total operating revenue | $ | 2,317,467 | $ | 2,314,879 | $ | 2,155,865 | |||||
Hawaiian attributes operating revenue by geographic region based upon the origin and destination of each flight segment. Hawaiian's tangible assets consist primarily of flight equipment, which are mobile across geographic markets, and, therefore, have not been allocated to specific geographic regions.
15. Supplemental Cash Flow Information
Supplemental disclosures of cash flow information and non-cash investing and financing activities were as follows:
Year Ended December 31, | |||||||||||
2015 | 2014 | 2013 | |||||||||
(in thousands) | |||||||||||
Cash payments for interest (net of amounts capitalized) | $ | 45,519 | $ | 42,242 | $ | 36,574 | |||||
Cash payments (refunds) for income taxes | 4,664 | (1,882 | ) | 2 | |||||||
Investing and Financing Activities Not Affecting Cash: | |||||||||||
Property and equipment acquired through a capital lease | 2,791 | — | 11,840 | ||||||||
16. Condensed Consolidating Financial Information
The following condensed consolidating financial information is presented in accordance with Regulation S-X paragraph 210.3-10 because, in connection with the issuance by two pass-through trusts formed by Hawaiian (which is also referred to in this Note 16 as Subsidiary Issuer / Guarantor) of pass-through certificates, as discussed in Note 8, the Company (which is also referred to in this Note 16 as Parent Issuer / Guarantor), is fully and unconditionally guaranteeing the payment obligations of Hawaiian, which is a 100% owned subsidiary of the Company, under equipment notes to be issued by Hawaiian to purchase new aircraft.
73
Condensed consolidating financial statements are presented in the following tables:
Condensed Consolidating Statements of Operations and Comprehensive Income (Loss)
Year Ended December 31, 2015
Parent Issuer / Guarantor | Subsidiary Issuer / Guarantor | Non-Guarantor Subsidiaries | Eliminations | Consolidated | |||||||||||||||
(in thousands) | |||||||||||||||||||
Operating Revenue | $ | — | $ | 2,313,159 | $ | 4,645 | $ | (337 | ) | $ | 2,317,467 | ||||||||
Operating Expenses: | |||||||||||||||||||
Aircraft fuel, including taxes and delivery | — | 417,728 | — | — | 417,728 | ||||||||||||||
Wages and benefits | — | 499,506 | — | — | 499,506 | ||||||||||||||
Aircraft rent | — | 115,653 | — | — | 115,653 | ||||||||||||||
Maintenance materials and repairs | — | 223,135 | 1,513 | — | 224,648 | ||||||||||||||
Aircraft and passenger servicing | — | 117,449 | — | — | 117,449 | ||||||||||||||
Commissions and other selling | 5 | 119,749 | 103 | (111 | ) | 119,746 | |||||||||||||
Depreciation and amortization | — | 102,586 | 2,995 | — | 105,581 | ||||||||||||||
Other rentals and landing fees | — | 95,055 | — | — | 95,055 | ||||||||||||||
Purchased services | 985 | 80,775 | 141 | (63 | ) | 81,838 | |||||||||||||
Other | 4,927 | 108,594 | 802 | (163 | ) | 114,160 | |||||||||||||
Total | 5,917 | 1,880,230 | 5,554 | (337 | ) | 1,891,364 | |||||||||||||
Operating Income (Loss) | (5,917 | ) | 432,929 | (909 | ) | — | 426,103 | ||||||||||||
Nonoperating Income (Expense): | |||||||||||||||||||
Undistributed net income of subsidiaries | 191,959 | — | — | (191,959 | ) | — | |||||||||||||
Interest expense and amortization of debt discounts and issuance costs | (1,733 | ) | (53,945 | ) | — | — | (55,678 | ) | |||||||||||
Interest income | 220 | 2,591 | — | — | 2,811 | ||||||||||||||
Capitalized interest | — | 3,261 | — | — | 3,261 | ||||||||||||||
Losses on fuel derivatives | — | (59,931 | ) | — | — | (59,931 | ) | ||||||||||||
Loss on debt extinguishment | (7,387 | ) | (4,671 | ) | — | — | (12,058 | ) | |||||||||||
Other, net | — | (8,821 | ) | 1 | — | (8,820 | ) | ||||||||||||
Total | 183,059 | (121,516 | ) | 1 | (191,959 | ) | (130,415 | ) | |||||||||||
Income (Loss) Before Income Taxes | 177,142 | 311,413 | (908 | ) | (191,959 | ) | 295,688 | ||||||||||||
Income tax expense (benefit) | (5,504 | ) | 118,546 | — | — | 113,042 | |||||||||||||
Net Income (Loss) | $ | 182,646 | $ | 192,867 | $ | (908 | ) | $ | (191,959 | ) | $ | 182,646 | |||||||
Comprehensive Income (Loss) | $ | 206,181 | $ | 216,402 | $ | (908 | ) | $ | (215,494 | ) | $ | 206,181 | |||||||
74
Condensed Consolidating Statements of Operations and Comprehensive Loss
Year Ended December 31, 2014
Parent Issuer / Guarantor | Subsidiary Issuer / Guarantor | Non-Guarantor Subsidiaries | Eliminations | Consolidated | |||||||||||||||
(in thousands) | |||||||||||||||||||
Operating Revenue | $ | — | $ | 2,311,200 | $ | 4,029 | $ | (350 | ) | $ | 2,314,879 | ||||||||
Operating Expenses: | |||||||||||||||||||
Aircraft fuel, including taxes and delivery | — | 678,253 | — | — | 678,253 | ||||||||||||||
Wages and benefits | — | 447,446 | — | — | 447,446 | ||||||||||||||
Aircraft rent | — | 106,422 | — | — | 106,422 | ||||||||||||||
Maintenance materials and repairs | — | 223,783 | 1,836 | — | 225,619 | ||||||||||||||
Aircraft and passenger servicing | — | 122,780 | — | — | 122,780 | ||||||||||||||
Commissions and other selling | 49 | 122,480 | 76 | (87 | ) | 122,518 | |||||||||||||
Depreciation and amortization | — | 94,146 | 2,228 | — | 96,374 | ||||||||||||||
Other rentals and landing fees | 5 | 87,897 | — | — | 87,902 | ||||||||||||||
Purchased services | 285 | 73,063 | 101 | (63 | ) | 73,386 | |||||||||||||
Other | 4,973 | 103,403 | 871 | (200 | ) | 109,047 | |||||||||||||
Total | 5,312 | 2,059,673 | 5,112 | (350 | ) | 2,069,747 | |||||||||||||
Operating Income (Loss) | (5,312 | ) | 251,527 | (1,083 | ) | — | 245,132 | ||||||||||||
Nonoperating Income (Expense): | |||||||||||||||||||
Undistributed net income of subsidiaries | 78,702 | — | — | (78,702 | ) | — | |||||||||||||
Interest expense and amortization of debt discounts and issuance costs | (8,894 | ) | (55,346 | ) | — | — | (64,240 | ) | |||||||||||
Interest income | 185 | 1,499 | — | — | 1,684 | ||||||||||||||
Capitalized interest | — | 8,024 | — | — | 8,024 | ||||||||||||||
Losses on fuel derivatives | — | (63,471 | ) | — | — | (63,471 | ) | ||||||||||||
Loss on extinguishment of debt | (1,433 | ) | (2,452 | ) | (3,885 | ) | |||||||||||||
Other, net | — | (9,797 | ) | — | — | (9,797 | ) | ||||||||||||
Total | 68,560 | (121,543 | ) | — | (78,702 | ) | (131,685 | ) | |||||||||||
Income (Loss) Before Income Taxes | 63,248 | 129,984 | (1,083 | ) | (78,702 | ) | 113,447 | ||||||||||||
Income tax expense (benefit) | (5,678 | ) | 50,199 | — | — | 44,521 | |||||||||||||
Net Income (Loss) | $ | 68,926 | $ | 79,785 | $ | (1,083 | ) | $ | (78,702 | ) | $ | 68,926 | |||||||
Comprehensive Loss | $ | (11,200 | ) | $ | (341 | ) | $ | (1,083 | ) | $ | 1,424 | $ | (11,200 | ) | |||||
75
Condensed Consolidating Statements of Operations and Comprehensive Income
Year Ended December 31, 2013
Parent Issuer / Guarantor | Subsidiary Issuer / Guarantor | Non-Guarantor Subsidiaries | Eliminations | Consolidated | |||||||||||||||
(in thousands) | |||||||||||||||||||
Operating Revenue | $ | — | $ | 2,155,554 | $ | 647 | $ | (336 | ) | $ | 2,155,865 | ||||||||
Operating Expenses: | |||||||||||||||||||
Aircraft fuel, including taxes and delivery | — | 698,802 | — | — | 698,802 | ||||||||||||||
Wages and benefits | — | 427,438 | — | — | 427,438 | ||||||||||||||
Aircraft rent | — | 108,534 | — | — | 108,534 | ||||||||||||||
Maintenance materials and repairs | — | 203,387 | — | — | 203,387 | ||||||||||||||
Aircraft and passenger servicing | — | 120,635 | — | — | 120,635 | ||||||||||||||
Commissions and other selling | — | 125,962 | — | (62 | ) | 125,900 | |||||||||||||
Depreciation and amortization | — | 83,050 | — | — | 83,050 | ||||||||||||||
Other rentals and landing fees | — | 81,317 | — | — | 81,317 | ||||||||||||||
Purchased services | 32 | 63,555 | 116 | (61 | ) | 63,642 | |||||||||||||
Other | 7,740 | 101,546 | 340 | (213 | ) | 109,413 | |||||||||||||
Total | 7,772 | 2,014,226 | 456 | (336 | ) | 2,022,118 | |||||||||||||
Operating Income (Loss) | (7,772 | ) | 141,328 | 191 | — | 133,747 | |||||||||||||
Nonoperating Income (Expense): | |||||||||||||||||||
Undistributed net income of subsidiaries | 62,549 | — | — | (62,549 | ) | — | |||||||||||||
Interest expense and amortization of debt discounts and issuance costs | (8,710 | ) | (41,743 | ) | — | — | (50,453 | ) | |||||||||||
Interest income | 132 | 507 | — | — | 639 | ||||||||||||||
Capitalized interest | — | 12,625 | — | — | 12,625 | ||||||||||||||
Losses on fuel derivatives | — | (5,334 | ) | — | — | (5,334 | ) | ||||||||||||
Other, net | — | (4,814 | ) | — | — | (4,814 | ) | ||||||||||||
Total | 53,971 | (38,759 | ) | — | (62,549 | ) | (47,337 | ) | |||||||||||
Income Before Income Taxes | 46,199 | 102,569 | 191 | (62,549 | ) | 86,410 | |||||||||||||
Income tax expense (benefit) | (5,655 | ) | 40,211 | — | — | 34,556 | |||||||||||||
Net Income | $ | 51,854 | $ | 62,358 | $ | 191 | $ | (62,549 | ) | $ | 51,854 | ||||||||
Comprehensive Income | $ | 123,222 | $ | 133,726 | $ | 191 | $ | (133,917 | ) | $ | 123,222 | ||||||||
76
Condensed Consolidating Balance Sheets
December 31, 2015
Parent Issuer / Guarantor | Subsidiary Issuer / Guarantor | Non-Guarantor Subsidiaries | Eliminations | Consolidated | |||||||||||||||
(in thousands) | |||||||||||||||||||
ASSETS | |||||||||||||||||||
Current assets: | |||||||||||||||||||
Cash and cash equivalents | $ | 69,420 | $ | 203,406 | $ | 8,676 | $ | — | $ | 281,502 | |||||||||
Restricted cash | — | 5,000 | — | — | 5,000 | ||||||||||||||
Short-term investments | — | 278,545 | — | — | 278,545 | ||||||||||||||
Accounts receivable, net | 61 | 81,248 | 625 | (211 | ) | 81,723 | |||||||||||||
Spare parts and supplies, net | — | 19,164 | — | — | 19,164 | ||||||||||||||
Prepaid expenses and other | 7 | 74,948 | 95 | — | 75,050 | ||||||||||||||
Total | 69,488 | 662,311 | 9,396 | (211 | ) | 740,984 | |||||||||||||
Property and equipment at cost | — | 1,927,126 | 58,126 | — | 1,985,252 | ||||||||||||||
Less accumulated depreciation and amortization | — | (427,315 | ) | (5,195 | ) | — | (432,510 | ) | |||||||||||
Property and equipment, net | — | 1,499,811 | 52,931 | — | 1,552,742 | ||||||||||||||
Long-term prepayments and other | — | 90,161 | 500 | — | 90,661 | ||||||||||||||
Deferred tax assets, net | 26,059 | — | — | (26,059 | ) | — | |||||||||||||
Goodwill and other intangible assets, net | — | 125,323 | — | — | 125,323 | ||||||||||||||
Intercompany receivable | — | 242,248 | — | (242,248 | ) | — | |||||||||||||
Investment in consolidated subsidiaries | 596,570 | — | — | (596,570 | ) | — | |||||||||||||
TOTAL ASSETS | $ | 692,117 | $ | 2,619,854 | $ | 62,827 | $ | (865,088 | ) | $ | 2,509,710 | ||||||||
LIABILITIES AND SHAREHOLDERS' EQUITY | |||||||||||||||||||
Current liabilities: | |||||||||||||||||||
Accounts payable | $ | 755 | $ | 100,007 | $ | 759 | $ | (211 | ) | $ | 101,310 | ||||||||
Air traffic liability | — | 427,302 | 3,464 | — | 430,766 | ||||||||||||||
Other accrued liabilities | 530 | 159,583 | 145 | — | 160,258 | ||||||||||||||
Current maturities of long-term debt, less discount, and capital lease obligations | 288 | 77,178 | — | — | 77,466 | ||||||||||||||
Total | 1,573 | 764,070 | 4,368 | (211 | ) | 769,800 | |||||||||||||
Long-term debt and capital lease obligations | — | 694,678 | — | — | 694,678 | ||||||||||||||
Intercompany payable | 242,248 | — | — | (242,248 | ) | — | |||||||||||||
Other liabilities and deferred credits: | |||||||||||||||||||
Accumulated pension and other postretirement benefit obligations. | — | 372,700 | — | — | 372,700 | ||||||||||||||
Other liabilities and deferred credits | 2,234 | 86,861 | 750 | — | 89,845 | ||||||||||||||
Deferred tax liabilities, net | — | 162,684 | — | (26,059 | ) | 136,625 | |||||||||||||
Total | 2,234 | 622,245 | 750 | (26,059 | ) | 599,170 | |||||||||||||
Shareholders' equity | 446,062 | 538,861 | 57,709 | (596,570 | ) | 446,062 | |||||||||||||
TOTAL LIABILITIES AND SHAREHOLDERS' EQUITY | $ | 692,117 | $ | 2,619,854 | $ | 62,827 | $ | (865,088 | ) | $ | 2,509,710 | ||||||||
77
Condensed Consolidating Balance Sheets
December 31, 2014
Parent Issuer / Guarantor | Subsidiary Issuer / Guarantor | Non-Guarantor Subsidiaries | Eliminations | Consolidated | |||||||||||||||
(in thousands) | |||||||||||||||||||
ASSETS | |||||||||||||||||||
Current assets: | |||||||||||||||||||
Cash and cash equivalents | $ | 79,532 | $ | 179,676 | $ | 4,879 | $ | — | $ | 264,087 | |||||||||
Restricted cash | — | 6,566 | — | — | 6,566 | ||||||||||||||
Short-term investments | — | 260,121 | — | — | 260,121 | ||||||||||||||
Accounts receivable, net | 63 | 80,289 | 531 | (146 | ) | 80,737 | |||||||||||||
Spare parts and supplies, net | — | 18,011 | — | — | 18,011 | ||||||||||||||
Prepaid expenses and other | 12 | 53,281 | 89 | — | 53,382 | ||||||||||||||
Total | 79,607 | 597,944 | 5,499 | (146 | ) | 682,904 | |||||||||||||
Property and equipment at cost | — | 2,006,274 | 34,726 | — | 2,041,000 | ||||||||||||||
Less accumulated depreciation and amortization | — | (365,279 | ) | (2,228 | ) | — | (367,507 | ) | |||||||||||
Property and equipment, net | — | 1,640,995 | 32,498 | — | 1,673,493 | ||||||||||||||
Long-term prepayments and other | 537 | 95,688 | — | — | 96,225 | ||||||||||||||
Deferred tax assets, net | 20,556 | — | — | (20,556 | ) | — | |||||||||||||
Goodwill and other intangible assets, net | — | 127,963 | — | — | 127,963 | ||||||||||||||
Intercompany receivable | — | 15,081 | — | (15,081 | ) | — | |||||||||||||
Investment in consolidated subsidiaries | 351,391 | — | — | (351,391 | ) | — | |||||||||||||
TOTAL ASSETS | $ | 452,091 | $ | 2,477,671 | $ | 37,997 | $ | (387,174 | ) | $ | 2,580,585 | ||||||||
LIABILITIES AND SHAREHOLDERS' EQUITY | |||||||||||||||||||
Current liabilities: | |||||||||||||||||||
Accounts payable | $ | 514 | $ | 96,196 | $ | 696 | $ | (146 | ) | $ | 97,260 | ||||||||
Air traffic liability | — | 421,547 | 2,789 | — | 424,336 | ||||||||||||||
Other accrued liabilities | 1,686 | 140,088 | 145 | — | 141,919 | ||||||||||||||
Current maturities of long-term debt, less discount, and capital lease obligations | 66,530 | 89,819 | — | — | 156,349 | ||||||||||||||
Total | 68,730 | 747,650 | 3,630 | (146 | ) | 819,864 | |||||||||||||
Long-term debt and capital lease obligations | — | 893,288 | — | — | 893,288 | ||||||||||||||
Intercompany payable | 15,081 | — | — | (15,081 | ) | — | |||||||||||||
Other liabilities and deferred credits: | |||||||||||||||||||
Accumulated pension and other postretirement benefit obligations. | — | 407,864 | — | — | 407,864 | ||||||||||||||
Other liabilities and deferred credits | 1,047 | 70,853 | 750 | — | 72,650 | ||||||||||||||
Deferred tax liabilities, net | — | 40,242 | — | (20,556 | ) | 19,686 | |||||||||||||
Total | 1,047 | 518,959 | 750 | (20,556 | ) | 500,200 | |||||||||||||
Shareholders' equity | 367,233 | 317,774 | 33,617 | (351,391 | ) | 367,233 | |||||||||||||
TOTAL LIABILITIES AND SHAREHOLDERS' EQUITY | $ | 452,091 | $ | 2,477,671 | $ | 37,997 | $ | (387,174 | ) | $ | 2,580,585 | ||||||||
78
Condensed Consolidating Statements of Cash Flows
Year Ended December 31, 2015
Parent Issuer / Guarantor | Subsidiary Issuer / Guarantor | Non-Guarantor Subsidiaries | Eliminations | Consolidated | |||||||||||||||
(in thousands) | |||||||||||||||||||
Net Cash Provided By (Used In) Operating Activities: | $ | (4,084 | ) | $ | 477,310 | $ | 2,802 | $ | — | $ | 476,028 | ||||||||
Cash Flows From Investing Activities: | |||||||||||||||||||
Net payments to affiliates | (25,000 | ) | (220,538 | ) | — | 245,538 | — | ||||||||||||
Additions to property and equipment, including pre-delivery deposits | — | (95,252 | ) | (23,576 | ) | — | (118,828 | ) | |||||||||||
Proceeds from purchase assignment and leaseback transactions | — | 101,738 | — | — | 101,738 | ||||||||||||||
Proceeds from disposition of property and equipment | — | 3,598 | 71 | — | 3,669 | ||||||||||||||
Purchases of investments | — | (257,448 | ) | — | — | (257,448 | ) | ||||||||||||
Sales of investments | — | 236,062 | — | — | 236,062 | ||||||||||||||
Other | — | — | (500 | ) | — | (500 | ) | ||||||||||||
Net cash used in investing activities | (25,000 | ) | (231,840 | ) | (24,005 | ) | 245,538 | (35,307 | ) | ||||||||||
Cash Flows From Financing Activities: | |||||||||||||||||||
Repayments of long-term debt and capital lease obligations | — | (216,157 | ) | — | — | (216,157 | ) | ||||||||||||
Repurchases and conversion of Convertible Notes | (184,645 | ) | — | — | — | (184,645 | ) | ||||||||||||
Repurchases of common stock | (40,138 | ) | — | — | — | (40,138 | ) | ||||||||||||
Proceeds from settlement of convertible note call options | 304,752 | — | — | — | 304,752 | ||||||||||||||
Payment for settlement of convertible note warrants | (282,631 | ) | — | — | — | (282,631 | ) | ||||||||||||
Debt issuance costs | — | (572 | ) | — | — | (572 | ) | ||||||||||||
Net payments from affiliates | 220,538 | — | 25,000 | (245,538 | ) | — | |||||||||||||
Change in cash collateral for EETC financing | — | 1,566 | — | — | 1,566 | ||||||||||||||
Other | 1,096 | (6,577 | ) | — | — | (5,481 | ) | ||||||||||||
Net cash provided by (used in) financing activities | 18,972 | (221,740 | ) | 25,000 | (245,538 | ) | (423,306 | ) | |||||||||||
Net increase (decrease) in cash and cash equivalents | (10,112 | ) | 23,730 | 3,797 | — | 17,415 | |||||||||||||
Cash and cash equivalents—Beginning of Period | 79,532 | 179,676 | 4,879 | — | 264,087 | ||||||||||||||
Cash and cash equivalents—End of Period | $ | 69,420 | $ | 203,406 | $ | 8,676 | $ | — | $ | 281,502 | |||||||||
79
Condensed Consolidating Statements of Cash Flows
Year Ended December 31, 2014
Parent Issuer / Guarantor | Subsidiary Issuer / Guarantor | Non-Guarantor Subsidiaries | Eliminations | Consolidated | |||||||||||||||
(in thousands) | |||||||||||||||||||
Net Cash Provided By (Used In) Operating Activities: | $ | (8,303 | ) | $ | 305,969 | $ | 2,764 | $ | — | $ | 300,430 | ||||||||
Cash Flows From Investing Activities: | |||||||||||||||||||
Net payments from subsidiaries | 38,791 | — | — | (38,791 | ) | — | |||||||||||||
Additions to property and equipment, including pre-delivery deposits | — | (439,420 | ) | (2,809 | ) | — | (442,229 | ) | |||||||||||
Net proceeds from disposition of equipment | — | 16,953 | — | — | 16,953 | ||||||||||||||
Purchases of investments | — | (458,592 | ) | — | — | (458,592 | ) | ||||||||||||
Sales of investments | — | 197,046 | — | — | 197,046 | ||||||||||||||
Net cash provided by (used in) investing activities | 38,791 | (684,013 | ) | (2,809 | ) | (38,791 | ) | (686,822 | ) | ||||||||||
Cash Flows From Financing Activities: | |||||||||||||||||||
Long-term borrowings | — | 368,430 | — | — | 368,430 | ||||||||||||||
Repayments of long-term debt and capital lease obligations | — | (115,246 | ) | — | — | (115,246 | ) | ||||||||||||
Repurchases of convertible notes | (42,754 | ) | — | — | — | (42,754 | ) | ||||||||||||
Debt issuance costs | — | (1,519 | ) | — | — | (1,519 | ) | ||||||||||||
Net payments to parent company | — | (38,791 | ) | — | 38,791 | — | |||||||||||||
Change in cash collateral for EETC financing | — | 14,434 | — | — | 14,434 | ||||||||||||||
Other | 7,001 | (3,251 | ) | — | — | 3,750 | |||||||||||||
Net cash provided by (used in) financing activities | (35,753 | ) | 224,057 | — | 38,791 | 227,095 | |||||||||||||
Net decrease in cash and cash equivalents | (5,265 | ) | (153,987 | ) | (45 | ) | — | (159,297 | ) | ||||||||||
Cash and cash equivalents—Beginning of Period | 84,797 | 333,663 | 4,924 | — | 423,384 | ||||||||||||||
Cash and cash equivalents—End of Period | $ | 79,532 | $ | 179,676 | $ | 4,879 | $ | — | $ | 264,087 | |||||||||
80
Condensed Consolidating Statements of Cash Flows
Year Ended December 31, 2013
Parent Issuer / Guarantor | Subsidiary Issuer / Guarantor | Non-Guarantor Subsidiaries | Eliminations | Consolidated | |||||||||||||||
(in thousands) | |||||||||||||||||||
Net Cash Provided By (Used In) Operating Activities: | $ | (8,088 | ) | $ | 251,260 | $ | 98 | $ | — | $ | 243,270 | ||||||||
Cash Flows From Investing Activities: | |||||||||||||||||||
Net payments from subsidiaries | 6,883 | — | — | (6,883 | ) | — | |||||||||||||
Additions to property and equipment, including pre-delivery deposits | — | (396,719 | ) | (13,461 | ) | — | (410,180 | ) | |||||||||||
Proceeds from purchase assignment and lease transactions | — | 67,952 | 67,952 | ||||||||||||||||
Net proceeds from disposition of equipment | — | 14,414 | — | — | 14,414 | ||||||||||||||
Net cash provided by (used in) investing activities | 6,883 | (314,353 | ) | (13,461 | ) | (6,883 | ) | (327,814 | ) | ||||||||||
Cash Flows From Financing Activities: | |||||||||||||||||||
Long-term borrowings | — | 243,110 | — | — | 243,110 | ||||||||||||||
Repayments of long-term debt and capital lease obligations | — | (113,592 | ) | — | — | (113,592 | ) | ||||||||||||
Debt issuance costs | — | (13,846 | ) | — | — | (13,846 | ) | ||||||||||||
Net payments to parent company | — | (6,883 | ) | — | 6,883 | — | |||||||||||||
Change in cash collateral for EETC financing | — | (16,000 | ) | — | — | (16,000 | ) | ||||||||||||
Other | 2,376 | — | — | — | 2,376 | ||||||||||||||
Net cash provided by financing activities | 2,376 | 92,789 | — | 6,883 | 102,048 | ||||||||||||||
Net increase (decrease) in cash and cash equivalents | 1,171 | 29,696 | (13,363 | ) | — | 17,504 | |||||||||||||
Cash and cash equivalents—Beginning of Period | 83,626 | 303,967 | 18,287 | 405,880 | |||||||||||||||
Cash and cash equivalents—End of Period | $ | 84,797 | $ | 333,663 | $ | 4,924 | $ | — | $ | 423,384 | |||||||||
Certain Restrictions on Subsidiary Distributions, Dividends and Repurchases
The Company and Hawaiian are party to a Credit and Guaranty Agreement (Credit Agreement), dated as of November 7, 2014, that provides for a Revolving Credit Facility. Pursuant to the terms of the Credit Agreement, neither Hawaiian nor any other subsidiary of the Company will directly or indirectly declare or pay any dividend, or purchase, redeem or otherwise acquire or retire for value any equity interests of the Company unless certain conditions are met.
Long-Term Debt
The long-term debt included in the Parent Issuer / Guarantor column represents the Convertible Notes described in Note 8.
Income Taxes
The income tax expense (benefit) is presented as if each entity that is part of the consolidated group files a separate return.
81
17. Supplemental Financial Information (unaudited)
Unaudited Quarterly Financial Information:
First Quarter | Second Quarter | Third Quarter | Fourth Quarter | ||||||||||||
(in thousands, except per share data) | |||||||||||||||
2015: | |||||||||||||||
Operating revenue | $ | 540,280 | $ | 571,295 | $ | 631,738 | $ | 574,154 | |||||||
Operating income | 71,164 | 91,416 | 154,677 | 108,846 | |||||||||||
Nonoperating loss | (29,165 | ) | (12,155 | ) | (41,695 | ) | (47,400 | ) | |||||||
Net income | 25,883 | 48,834 | 70,029 | 37,900 | |||||||||||
Net Income Per Common Stock Share: | |||||||||||||||
Basic | $ | 0.47 | $ | 0.89 | $ | 1.30 | $ | 0.71 | |||||||
Diluted | 0.40 | 0.79 | 1.15 | 0.66 | |||||||||||
2014: | |||||||||||||||
Operating revenue | $ | 524,858 | $ | 575,720 | $ | 639,462 | $ | 574,839 | |||||||
Operating income | 10,037 | 51,594 | 106,169 | 77,332 | |||||||||||
Nonoperating loss | (18,329 | ) | (6,615 | ) | (47,805 | ) | (58,936 | ) | |||||||
Net income (loss) | (5,075 | ) | 27,327 | 35,575 | 11,099 | ||||||||||
Net Income (Loss) Per Common Stock Share: | |||||||||||||||
Basic | $ | (0.10 | ) | $ | 0.51 | $ | 0.66 | $ | 0.20 | ||||||
Diluted | (0.10 | ) | 0.43 | 0.56 | 0.17 | ||||||||||
The sum of the quarterly net income (loss) per common stock share amounts does not equal the annual amount reported since per share amounts are computed independently for each quarter and for the full year based on respective weighted-average common shares outstanding and other dilutive potential common shares.
The Company's quarterly financial results are subject to seasonal fluctuations. Historically its second and third quarter financial results, which reflect periods of higher travel demand, are better than its first and fourth quarter financial results.
ITEM 9. CHANGES IN AND DISAGREEMENTS WITH ACCOUNTANTS ON ACCOUNTING AND FINANCIAL DISCLOSURE.
None.
ITEM 9A. CONTROLS AND PROCEDURES.
Management's Evaluation of Disclosure Controls and Procedures
Our management, including our Chief Executive Officer (CEO) and Chief Financial Officer (CFO), performed an evaluation of our disclosure controls and procedures (as defined in Rules 13a-15(e) and 15d-15(e) under the Exchange Act). Based on that evaluation, our management, including our CEO and CFO, concluded that our disclosure controls and procedures were effective as of December 31, 2015, and provide reasonable assurance that the information required to be disclosed by the Company in reports it files under the Securities Exchange Act of 1934, as amended (the Exchange Act), is recorded, processed, summarized and reported within the time periods specified in the rules and forms of the SEC, and is accumulated and communicated to our management, including our CEO and CFO, to allow timely decisions regarding required disclosure.
Management's Report on Internal Control over Financial Reporting
Our management is responsible for establishing and maintaining effective internal control over financial reporting as defined in Rules 13a-15(f) and 15d-15(f) under the Exchange Act. Our internal control over financial reporting is designed to provide reasonable assurance regarding the reliability of financial reporting and the preparation of financial statements for external purposes in accordance with U.S. generally accepted accounting principles.
82
Under the supervision and with the participation of our management, including our CEO and CFO, an assessment of the effectiveness of our internal control over financial reporting as of December 31, 2015 was conducted. In making this assessment, management used the criteria set forth by the Committee of Sponsoring Organizations of the Treadway Commission (COSO) in Internal Control—Integrated Framework (2013 framework). Based on their assessment, we concluded that, as of December 31, 2015, the Company's internal control over financial reporting was effective to provide reasonable assurance regarding the reliability of financial reporting and the preparation of financial statements for external purposes in accordance with U.S. generally accepted accounting principles. We reviewed the results of management's assessment with the Audit Committee of our Board of Directors.
The effectiveness of our internal control over financial reporting as of December 31, 2015, has been audited by Ernst & Young LLP, the independent registered public accounting firm who also has audited the Company's consolidated financial statements included in this Annual Report on Form 10-K. Ernst & Young's report on the Company's internal control over financial reporting appears below.
Changes in Internal Control over Financial Reporting
There were no changes in our internal control over financial reporting during the quarter ended December 31, 2015 that materially affected, or are reasonably likely to materially affect, our internal control over financial reporting.
Inherent Limitations on Effectiveness of Controls
Our management, including our CEO and CFO, does not expect that our disclosure controls or our internal control over financial reporting will prevent or detect all error and all fraud. A control system, no matter how well designed and operated, can provide only reasonable, not absolute, assurance that the control system's objectives will be met. The design of a control system must reflect the fact that there are resource constraints, and the benefits of controls must be considered relative to their costs.
Further, because of the inherent limitations in all control systems, no evaluation of controls can provide absolute assurance that misstatements due to error or fraud will not occur or that all control issues and instances of fraud, if any, have been detected. These inherent limitations include the realities that judgments in decision-making can be faulty and that breakdowns can occur because of simple error or mistake. Controls can also be circumvented by the individual acts of some persons, by collusion of two or more people, or by management override of the controls. The design of any system of controls is based in part on certain assumptions about the likelihood of future events, and there can be no assurance that any design will succeed in achieving its stated goals under all potential future conditions. Projections of any evaluation of controls effectiveness to future periods are subject to risks. Over time, controls may become inadequate because of changes in conditions or deterioration in the degree of compliance with policies or procedures.
83
Report of Independent Registered Public Accounting Firm
The Board of Directors and Stockholders of Hawaiian Holdings, Inc.
We have audited Hawaiian Holdings, Inc.'s internal control over financial reporting as of December 31, 2015, based on criteria established in Internal Control—Integrated Framework issued by the Committee of Sponsoring Organizations of the Treadway Commission (2013 framework) (the COSO criteria). Hawaiian Holdings, Inc.'s management is responsible for maintaining effective internal control over financial reporting, and for its assessment of the effectiveness of internal control over financial reporting included in the accompanying Management's Report on Internal Control over Financial Reporting. Our responsibility is to express an opinion on the company's internal control over financial reporting based on our audit.
We conducted our audit in accordance with the standards of the Public Company Accounting Oversight Board (United States). Those standards require that we plan and perform the audit to obtain reasonable assurance about whether effective internal control over financial reporting was maintained in all material respects. Our audit included obtaining an understanding of internal control over financial reporting, assessing the risk that a material weakness exists, testing and evaluating the design and operating effectiveness of internal control based on the assessed risk, and performing such other procedures as we considered necessary in the circumstances. We believe that our audit provides a reasonable basis for our opinion.
A company's internal control over financial reporting is a process designed to provide reasonable assurance regarding the reliability of financial reporting and the preparation of financial statements for external purposes in accordance with generally accepted accounting principles. A company's internal control over financial reporting includes those policies and procedures that (1) pertain to the maintenance of records that, in reasonable detail, accurately and fairly reflect the transactions and dispositions of the assets of the company; (2) provide reasonable assurance that transactions are recorded as necessary to permit preparation of financial statements in accordance with generally accepted accounting principles, and that receipts and expenditures of the company are being made only in accordance with authorizations of management and directors of the company; and (3) provide reasonable assurance regarding prevention or timely detection of unauthorized acquisition, use or disposition of the company's assets that could have a material effect on the financial statements.
Because of its inherent limitations, internal control over financial reporting may not prevent or detect misstatements. Also, projections of any evaluation of effectiveness to future periods are subject to the risk that controls may become inadequate because of changes in conditions, or that the degree of compliance with the policies or procedures may deteriorate.
In our opinion, Hawaiian Holdings, Inc. maintained, in all material respects, effective internal control over financial reporting as of December 31, 2015, based on the COSO criteria.
We also have audited, in accordance with the standards of the Public Company Accounting Oversight Board (United States), the consolidated balance sheets of Hawaiian Holdings, Inc. as of December 31, 2015 and 2014 and the related consolidated statements of operations, comprehensive income, shareholders' equity, and cash flows for each of the three years in the period ended December 31, 2015 of Hawaiian Holdings, Inc. and our report dated February 8, 2016 expressed an unqualified opinion thereon.
/s/ ERNST & YOUNG LLP | |
Honolulu, Hawai'i
February 8, 2016
84
ITEM 9B. OTHER INFORMATION.
None.
PART III
ITEM 10. DIRECTORS, EXECUTIVE OFFICERS AND CORPORATE GOVERNANCE.
The information required by this item is incorporated herein by reference from our definitive proxy statement relating to our 2016 Annual Meeting of Stockholders.
ITEM 11. EXECUTIVE COMPENSATION.
The information required by this item is incorporated herein by reference from our definitive proxy statement relating to our 2016 Annual Meeting of Stockholders.
ITEM 12. SECURITY OWNERSHIP OF CERTAIN BENEFICIAL OWNERS AND MANAGEMENT AND RELATED STOCKHOLDER MATTERS.
The information required by this item is incorporated herein by reference from our definitive proxy statement relating to our 2016 Annual Meeting of Stockholders.
ITEM 13. CERTAIN RELATIONSHIPS AND RELATED TRANSACTIONS, AND DIRECTOR INDEPENDENCE.
The information required by this item is incorporated herein by reference from our definitive proxy statement relating to our 2016 Annual Meeting of Stockholders.
ITEM 14. PRINCIPAL ACCOUNTANT FEES AND SERVICES.
The information required by this item is incorporated herein by reference from our definitive proxy statement relating to our 2016 Annual Meeting of Stockholders.
PART IV
ITEM 15. EXHIBITS, FINANCIAL STATEMENT SCHEDULES.
(a) | Financial Statements and Financial Statement Schedules: |
(1)Financial Statements of Hawaiian Holdings, Inc.
i. Report of Ernst & Young LLP, Independent Registered Public Accounting Firm.
ii. Consolidated Statements of Operations for the Years ended December 31, 2015, 2014 and 2013.
iii. Consolidated Statements of Comprehensive Income, December 31, 2015, 2014 and 2013.
iv. Consolidated Balance Sheets, December 31, 2015 and 2014.
v. Consolidated Statements of Shareholders' Equity Years ended December 31, 2015, 2014 and 2013.
vi. Consolidated Statements of Cash Flows for the Years ended December 31, 2015, 2014 and 2013.
vii. Notes to Consolidated Financial Statements.
(2)Schedule of Valuation and Qualifying Accounts of Hawaiian Holdings, Inc.
The information required by Schedule I, "Condensed Financial Information of Registrant" has been provided in Note 16 to the consolidated financial statements. All other schedules have been omitted because they are not required.
(b) | Exhibits: |
85
2.1 | Third Amended Joint Plan of Reorganization of Joshua Gotbaum, as Chapter 11 Trustee for Hawaiian Airlines, Inc., the Official Committee of Unsecured Creditors, HHIC, Inc., Hawaiian Holdings, Inc., and RC Aviation, LLC, dated as of March 11, 2005 (filed as Exhibit 2.01 to the Form 8-K filed by Hawaiian Holdings, Inc. on June 7, 2005).* | |
2.2 | Order Confirming Third Amended Joint Plan of Joshua Gotbaum, as Chapter 11 Trustee for Hawaiian Airlines, The Official Committee of Unsecured Creditors, HHIC, Inc., the Company and RC Aviation, dated as of March 11, 2005, as amended (filed as Exhibit 2.02 to the Form 8-K filed by Hawaiian Holdings, Inc. on June 7, 2005).* | |
3.1 | Amended and Restated Certificate of Incorporation of Hawaiian Holdings, Inc. (filed as Exhibit 3.1 to the Form S-1, File No. 333-129503, filed by Hawaiian Holdings, Inc. on November 7, 2005).* | |
3.2 | Amended Bylaws of Hawaiian Holdings, Inc. (filed as Exhibit 3.2 to the Form 10-Q filed by Hawaiian Holdings, Inc. on November 7, 2007).* | |
4.1 | Indenture, dated March 23, 2011, between Hawaiian Holdings, Inc. and U.S. Bank National Association, as trustee (filed as Exhibit 4.1 to the Form 8-K filed by Hawaiian Holdings, Inc. on March 23, 2011).* | |
4.2 | Supplemental Indenture, dated March 23, 2011, between Hawaiian Holdings, Inc. and U.S. Bank National Association, as trustee (filed as Exhibit 4.2 to the Form 8-K filed by Hawaiian Holdings, Inc. on March 23, 2011).* | |
4.3 | Form of 5.00% Senior Convertible Note due 2016 (filed as Exhibit 4.3 to the Form 8-K filed by Hawaiian Holdings, Inc. on March 23, 2011 and incorporated by reference to Exhibit 4.2 thereto).* | |
10.1 | Form of Hawaiian Holdings, Inc. Stock Option Agreement for certain employees and executive officers (filed as Exhibit 10.14 to the Form 10-K filed by Hawaiian Holdings, Inc. on February 25, 2009).*+ | |
10.2 | Form of Hawaiian Holdings, Inc. Restricted Stock Agreement for certain employees and executive officers (filed as Exhibit 10.15 to the Form 10-K filed by Hawaiian Holdings, Inc. on February 25, 2009).*+ | |
10.3 | Form of Hawaiian Holdings, Inc. Restricted Stock Unit Award Agreement for certain employees and executive officers (filed as Exhibit 10.15.2 to the Form 10-K filed by Hawaiian Holdings, Inc. on February 11, 2011).*+ | |
10.4 | Form of Hawaiian Holdings, Inc. Performance-Based Restricted Stock Unit Award Agreement for certain employees and executive officers (filed as Exhibit 10.15.3 to the Form 10-K filed by Hawaiian Holdings, Inc. on February 11, 2011).*+ | |
10.5 | Form of Hawaiian Holdings, Inc. Deferred Stock Unit Agreement for certain employees and executive officers (filed as Exhibit 10.16 to the Form 10-K filed by Hawaiian Holdings, Inc. on February 25, 2009).*+ | |
10.6 | Form of Hawaiian Holdings, Inc. Award Agreement for directors (filed as Exhibit 10.17 to the Form 10-K filed by Hawaiian Holdings, Inc. on February 25, 2009).*+ | |
10.7 | Hawaiian Holdings, Inc. 2005 Stock Incentive Plan (incorporated by reference to the Registrant’s Definitive Proxy Statement on Schedule 14A as filed with the Commission on March 26, 2010, File No. 001-31443).*+ | |
10.8 | Hawaiian Holdings, Inc. 2006 Management Incentive Plan (filed as Exhibit 10.1 to the Form 8-K filed by Hawaiian Holdings, Inc. on June 6, 2006.*+ | |
10.9 | Amended and Restated Mark B. Dunkerley Employment Agreement, dated as of November 15, 2012, by and between Mark B. Dunkerley and each of Hawaiian Holdings, Inc. and its wholly-owned subsidiary Hawaiian Airlines, Inc. (filed as Exhibit 10.1 to the Form 8-K filed by Hawaiian Holdings, Inc. on November 21, 2012).*+ | |
10.10 | Employment Agreement, dated as of November 18, 2005, between Hawaiian Airlines, Inc. and Peter R. Ingram (filed as Exhibit 10.24 to the Form 10-K filed by Hawaiian Holdings, Inc. on March 23, 2006).*+ | |
10.10.1 | First Amendment to Employment Agreement, dated as of November 2008, by and between Peter R. Ingram and Hawaiian Airlines, Inc. (filed as Exhibit 10.23 to the Form 10-K filed by Hawaiian Holdings, Inc. on February 26, 2009).*+ | |
10.10.2 | Second Amendment to Employment Agreement, dated as of April 6, 2009, by and between Peter R. Ingram and Hawaiian Airlines, Inc. (filed as Exhibit 10.1 to the Form 10-Q filed by Hawaiian Holdings, Inc. on April 30, 2009).*+ | |
10.11 | Employment Agreement, dated as of July 11, 2005, between Hawaiian Airlines, Inc. and Barbara Falvey (filed as Exhibit 10.1 to the Form 10-Q filed by Hawaiian Holdings, Inc. on May 9, 2007).*+ | |
10.11.1 | First Amendment to Employment Agreement, dated as of April 6, 2009, between Hawaiian Airlines, Inc. and Barbara Falvey (filed as Exhibit 10.2 to the Form 10-Q filed by Hawaiian Holdings, Inc. on April 30, 2009).*+ | |
10.12 | Form of Hawaiian Holdings, Inc. Indemnification Agreement for directors and executive officers (filed as Exhibit 10.25 to the Form 10-K filed by Hawaiian Holdings, Inc. on February 11, 2011).*+ | |
86
10.13 | Form of Executive Severance Agreement for executive officers (filed as Exhibit 10.1 to the Form 10-Q filed by Hawaiian Holdings, Inc. on October 25, 2012).*+ | |
10.14 | Airbus A330/A350XWB Purchase Agreement, dated as of January 31, 2008, between Airbus S.A.S. and Hawaiian Airlines, Inc. (filed as Exhibit 10.52 to the Form 10-K filed by Hawaiian Holdings, Inc. on March 3, 2008 in redacted form since confidential treatment has been granted for certain provisions thereof pursuant to Rule 24b-2 of the Securities Exchange Act of 1934, as amended).*‡ | |
10.14.1 | Amendment No. 1 to the Airbus A330/A350XWB Purchase Agreement dated as of January 31, 2008 between Airbus S.A.S. and Hawaiian Airlines, Inc. (filed as Exhibit 10.1 to the Form 10-Q filed by Hawaiian Holdings, Inc. on August 6, 2008 in redacted form since confidential treatment has been granted for certain provisions thereof pursuant to Rule 24b-2 of the Securities Exchange Act of 1934, as amended).*‡ | |
10.14.2 | Amendment No. 2 to the Airbus A330/A350XWB Purchase Agreement dated as of January 31, 2008 between Airbus S.A.S. and Hawaiian Airlines, Inc. (filed as Exhibit 10.2 to the Form 10-Q filed by Hawaiian Holdings, Inc. on April 27, 2010).* | |
10.14.3 | Amendment No. 3 to the Airbus A330/A350XWB Purchase Agreement dated as of January 31, 2008 between Airbus S.A.S. and Hawaiian Airlines, Inc. (filed as Exhibit 10.3 to the Form 10-Q filed by Hawaiian Holdings, Inc. on April 27, 2010 in redacted form since confidential treatment has been granted for certain provisions thereof pursuant to Rule 24b-2 of the Securities Exchange Act of 1934, as amended).*‡ | |
10.14.4 | Amendment No. 4 to the Airbus A330/A350XWB Purchase Agreement dated as of January 31, 2008 between Airbus S.A.S. and Hawaiian Airlines, Inc. (filed as Exhibit 10.44.3 to the Form 10-K filed by Hawaiian Holdings, Inc. on February 11, 2011 in redacted form since confidential treatment has been granted for certain provisions thereof pursuant to Rule 24b-2 of the Securities Exchange Act of 1934, as amended).*‡ | |
10.14.5 | Amendment No. 5 to the Airbus A330/A350XWB Purchase Agreement dated as of January 31, 2008 between Airbus S.A.S. and Hawaiian Airlines, Inc. (filed as Exhibit 10.44.4 to the Form 10-K filed by Hawaiian Holdings, Inc. on February 11, 2011 in redacted form since confidential treatment has been granted for certain provisions thereof pursuant to Rule 24b-2 of the Securities Exchange Act of 1934, as amended).*‡ | |
10.14.6 | Amendment No. 6 to the Airbus A330/A350XWB Purchase Agreement dated as of January 31, 2008 between Airbus S.A.S. and Hawaiian Airlines, Inc. (filed as Exhibit 10.44.5 to the Form 10-K filed by Hawaiian Holdings, Inc. on February 9, 2012 in redacted form since confidential treatment has been granted for certain provisions thereof pursuant to Rule 24b-2 of the Securities Exchange Act of 1934, as amended).*‡ | |
10.14.7 | Amendment No. 7 to the Airbus A330/A350XWB Purchase Agreement dated as of January 31, 2008 between Airbus S.A.S. and Hawaiian Airlines, Inc. (filed as Exhibit 10.2 to the Form 10-Q filed by Hawaiian Holdings, Inc. on July 26, 2012 in redacted form since confidential treatment has been granted for certain provisions thereof pursuant to Rule 24b-2 of the Securities Exchange Act of 1934, as amended).*‡ | |
10.14.8 | Amendment No. 8 to the Airbus A330/A350XWB Purchase Agreement dated as of January 31, 2008 between Airbus S.A.S. and Hawaiian Airlines, Inc.‡ | |
10.14.9 | Amendment No. 9 to the Airbus A330/A350XWB Purchase Agreement dated as of January 31, 2008 between Airbus S.A.S. and Hawaiian Airlines, Inc.‡ | |
10.14.10 | Amended and Restated Letter Agreement No. 3 to the Airbus A330/A350XWB Purchase Agreement dated as of January 31, 2008 between Airbus S.A.S. and Hawaiian Airlines, Inc. (filed as Exhibit 10.44.5 to the Form 10-K filed by Hawaiian Holdings, Inc. on February 11, 2011 in redacted form since confidential treatment has been granted for certain provisions thereof pursuant to Rule 24b-2 of the Securities Exchange Act of 1934, as amended).*‡ | |
10.15 | General Terms Agreement, dated as of October 27, 2008, between Rolls- Royce PLC, Rolls-Royce TotalCare Services Limited and Hawaiian Airlines, Inc., relating to the purchase of Trent 772B engines (the Rolls-Royce Agreement) (filed as Exhibit 10.47 to the Form 10-K filed by Hawaiian Holdings, Inc. on February 26, 2009 in redacted form pursuant to a request for confidential treatment for certain provisions thereof pursuant to Rule 24b-2 of the Securities Exchange Act of 1934, as amended). Hawaiian Airlines, Inc. also entered into an Agreement, dated as of October 27, 2008, between Rolls- Royce PLC, Rolls-Royce TotalCare Services Limited and Hawaiian Airlines, Inc. relating to the purchase of Trent XWB engines, the terms of which are substantially identical to the terms contained in the Rolls-Royce Agreement, except with respect to engine identification information and specifications, delivery dates and certain other information as to which Hawaiian Airlines, Inc. has requested confidential treatment and pursuant to Regulation S-K Item 601, Instruction 2, this agreement was not filed.*‡ | |
10.15.1 | Amendment #1 to General Terms Agreement by and between Rolls- Royce PLC, Rolls-Royce TotalCare Services Limited and Hawaiian Airlines, Inc. dated October 27, 2008 (filed as Exhibit 10.10 to the Form 10-Q filed by Hawaiian Holdings, Inc. on April 26, 2011 in redacted form since confidential treatment has been granted for certain provisions thereof pursuant to Rule 24b-2 of the Securities Exchange Act of 1934, as amended).*‡ | |
87
10.15.2 | Amendment #2 to General Terms Agreement by and between Rolls- Royce PLC, Rolls-Royce TotalCare Services Limited and Hawaiian Airlines, Inc. dated October 27, 2008 (filed as Exhibit 10.11 to the Form 10-Q filed by Hawaiian Holdings, Inc. on April 26, 2011 in redacted form since confidential treatment has been granted for certain provisions thereof pursuant to Rule 24b-2 of the Securities Exchange Act of 1934, as amended).*‡ | |
10.15.3 | Amendment #3 to General Terms Agreement by and between Rolls- Royce PLC, Rolls-Royce TotalCare Services Limited and Hawaiian Airlines, Inc. dated October 27, 2008 (filed as Exhibit 10.48.2 to the Form 10-K filed by Hawaiian Holdings, Inc. on February 9, 2012 in redacted form since confidential treatment has been granted for certain provisions thereof pursuant to Rule 24b-2 of the Securities Exchange Act of 1934, as amended).*‡ | |
10.15.4 | Amendment #4 to General Terms Agreement by and between Rolls- Royce PLC, Rolls-Royce TotalCare Services Limited and Hawaiian Airlines, Inc. dated October 27, 2008.‡ | |
10.15.5 | Amendment #5 to General Terms Agreement by and between Rolls- Royce PLC, Rolls-Royce TotalCare Services Limited and Hawaiian Airlines, Inc. dated October 27, 2008.‡ | |
10.15.6 | Amendment #6 to General Terms Agreement by and between Rolls- Royce PLC, Rolls-Royce TotalCare Services Limited and Hawaiian Airlines, Inc. dated October 27, 2008.‡ | |
10.15.7 | Amendment #7 to General Terms Agreement by and between Rolls- Royce PLC, Rolls-Royce TotalCare Services Limited and Hawaiian Airlines, Inc. dated October 27, 2008.‡ | |
10.15.8 | Amendment #8 to General Terms Agreement by and between Rolls- Royce PLC, Rolls-Royce TotalCare Services Limited and Hawaiian Airlines, Inc. dated October 27, 2008.‡ | |
10.16 | Amendment #1 to the Side Letter Agreement Number One to General Terms Agreement by and between Rolls-Royce PLC, Rolls-Royce TotalCare Services Limited and Hawaiian Airlines, Inc. dated October 27, 2008 (filed as Exhibit 10.12 to the Form 10-Q/A filed by Hawaiian Holdings, Inc. on July 21, 2011).*‡ | |
10.16.1 | Amendment #2 to the Side Letter Agreement Number One to General Terms Agreement by and between Rolls-Royce PLC, Rolls-Royce TotalCare Services Limited and Hawaiian Airlines, Inc. dated October 27, 2008 (filed as Exhibit 10.49.1 to the Form 10-K filed by Hawaiian Holdings, Inc. on February 9, 2012 in redacted form since confidential treatment has been granted for certain provisions thereof pursuant to Rule 24b-2 of the Securities Exchange Act of 1934, as amended).*‡ | |
10.17 | Amendment No. 1 to Lease Agreement (Aircraft No. 2), dated as of November 10, 2008, between Pegasus Aviation Finance Company and Hawaiian Airlines, Inc. (filed as Exhibit 10.49 to the Form 10-K filed by Hawaiian Holdings, Inc. on February 26, 2009 in redacted form pursuant to a request for confidential treatment for certain provisions thereof pursuant to Rule 24b-2 of the Securities Exchange Act of 1934, as amended).*‡ | |
10.18 | Amendment Number One to Aircraft Lease Agreement, dated as of November 10, 2008, between C.I.T. Leasing Corporation and Hawaiian Airlines, Inc. (filed as Exhibit 10.50 to the Form 10-K filed by Hawaiian Holdings, Inc. on February 26, 2009 in redacted form pursuant to a request for confidential treatment for certain provisions thereof pursuant to Rule 24b-2 of the Securities Exchange Act of 1934, as amended).*‡ | |
10.19 | Complete Fleet Services Agreement, dated as of December 14, 2009, between Delta Air Lines, Inc. and Hawaiian Airlines, Inc. (filed as Exhibit 10.1 to the Form 10-Q filed by Hawaiian Holdings, Inc. on April 27, 2010).* | |
10.20 | Loan Agreement [1217], dated as of April 6, 2011, by and among Hawaiian Airlines, Inc.; Natixis as administrative agent; Wells Fargo Bank Northwest, National Association, not in its individual capacity, except as expressly stated therein, as security trustee; Landesbank Hessen- Thüringen Girozentrale, KfW IPEX-Bank GmbH and Natixis Transport Finance, as joint lead arrangers; and any additional lenders from time to time party thereto (filed as Exhibit 10.1 to the Form 10-Q filed by Hawaiian Holdings, Inc. on July 27, 2011 in redacted form since confidential treatment has been granted for certain provisions thereof pursuant to Rule 24b-2 of the Securities Exchange Act of 1934, as amended). Hawaiian Airlines, Inc. also entered into Loan Agreement [1295], dated as of June 29, 2011 by and among Landesbank Hessen-Thüringen Girozentrale, as administrative agent; Wells Fargo Bank Northwest, National Association, not in its individual capacity, except as expressly stated therein, as security trustee; Landesbank Hessen- Thüringen Girozentrale, KfW IPEX-Bank GmbH and Natixis Transport Finance, as lenders; and any additional lenders from time to time party thereto, which loan agreement is substantially identical to Loan Agreement [1217], except with respect to total principal amount and certain other information as to which Hawaiian Airlines, Inc. has been granted confidential treatment, and pursuant to Regulation S-K Item 601, Instruction 2, this loan agreement was not filed.*‡ | |
10.21 | Purchase Agreement, dated as of June 27, 2011, by and among Wells Fargo Bank Northwest, National Association, solely as owner trustee of trusts beneficially owned by BCC Equipment Leasing Corporation and MDFC Spring Company, and Hawaiian Airlines, Inc. (filed as Exhibit 10.2 to the Form 10-Q filed by Hawaiian Holdings, Inc. on July 27, 2011 in redacted form since confidential treatment has been granted for certain provisions thereof pursuant to Rule 24b-2 of the Securities Exchange Act of 1934, as amended).*‡ | |
88
10.22 | Facility Agreement [Hawaiian 717-200 [55001]], dated as of June 27, 2011 by and between Hawaiian Airlines, Inc. and Boeing Capital Loan Corporation (filed as Exhibit 10.3 to the Form 10-Q/A filed by Hawaiian Holdings, Inc. on December 14, 2011 in redacted form since confidential treatment has been granted for certain provisions thereof pursuant to Rule 24b-2 of the Securities Exchange Act of 1934, as amended). Hawaiian Airlines, Inc. also entered into Facility Agreement [Hawaiian 717-200 [55002]], dated as of June 27, 2011; Facility Agreement [Hawaiian 717-200 [55118]], dated as of June 27, 2011; Facility Agreement [Hawaiian 717-200 [55121]], dated as of June 27, 2011; Facility Agreement [Hawaiian 717-200 [55122]], dated as of June 27, 2011; Facility Agreement [Hawaiian 717-200 [55123]], dated as of June 27, 2011; Facility Agreement [Hawaiian 717-200 [55124]], dated as of June 27, 2011; Facility Agreement [Hawaiian 717-200 [55125]], dated as of June 27, 2011; Facility Agreement [Hawaiian 717-200 [55126]], dated as of June 27, 2011; Facility Agreement [Hawaiian 717-200 [55128]], dated as of June 27, 2011; Facility Agreement [Hawaiian 717-200 [55129]], dated as of June 27, 2011; Facility Agreement [Hawaiian 717-200 [55130]], dated as of June 27, 2011; Facility Agreement [Hawaiian 717-200 [55131]], dated as of June 27, 2011; Facility Agreement [Hawaiian 717-200 [55132]], dated as of June 27, 2011; and Facility Agreement [Hawaiian 717-200 [55151]], dated as of June 27, 2011, which facility agreements are substantially identical to Facility Agreement 55001, and pursuant to Regulation S-K Item 601, Instruction 2, these facility agreements were not filed.*‡ | |
10.23 | Lease Agreement 491HA, dated as of June 28, 2011, by and between Wells Fargo Bank Northwest, National Association, a national banking association organized under the laws of the United States of America, not in its individual capacity, but solely as owner trustee of a trust beneficially owned by BCC Equipment Leasing Corporation, and Hawaiian Airlines, Inc. (filed as Exhibit 10.5 to Form 10-Q/A filed by Hawaiian Holdings, Inc. on December 14, 2011 in redacted form since confidential treatment has been granted for certain provisions thereof pursuant to Rule 24b-2 of the Securities Exchange Act of 1934, as amended). Hawaiian Airlines, Inc. also entered into Lease Agreement 492HA, dated as of June 28, 2011; and Lease Agreement 493HA, dated as of June 28, 2011, which lease agreements are substantially identical to Lease Agreement 491HA, and pursuant to Regulation S-K Item 601, Instruction 2, these lease agreements were not filed.*‡ | |
10.24 | Facility Agreement [Hawaiian A330 [1259]], dated as of June 29, 2011, by and among Hawaiian Airlines, Inc.; Bank of Utah, as security trustee; and each of Norddeutsche Landesbank Girozentrale and BNP Paribas, as loan participants (filed as Exhibit 10.6 to the Form 10-Q/A filed by Hawaiian Holdings, Inc. on December 14, 2011 in redacted form since confidential treatment has been granted for certain provisions thereof pursuant to Rule 24b-2 of the Securities Exchange Act of 1934, as amended). Hawaiian Airlines, Inc. also entered into Facility Agreement [Hawaiian A330 [1302]], dated as of June 29, 2011, which facility agreement is substantially identical to Facility Agreement [Hawaiian A330 [1259]], except with respect to certain information as to which Hawaiian Airlines, Inc. has been granted confidential treatment, and pursuant to Regulation S-K Item 601, Instruction 2, this facility agreement was not filed.*‡ | |
10.25 | Contract Services Agreement, dated as of June 29, 2011, by and between Hawaiian Airlines, Inc. and Airline Contract Maintenance and Equipment, Inc. (filed as Exhibit 10.7 to the Form 10-Q filed by Hawaiian Holdings, Inc. on July 27, 2011 in redacted form since confidential treatment has been granted for certain provisions thereof pursuant to Rule 24b-2 of the Securities Exchange Act of 1934, as amended).*‡ | |
10.26 | Type A Restricted Stock Unit Award Agreement, dated as of February 7, 2013, by and between Mark B. Dunkerley and Hawaiian Holdings, Inc. (filed as Exhibit 10.2 to form 10-Q filed by Hawaiian Holdings, Inc. on April 25, 2013).*+ | |
10.27 | Type B Restricted Stock Unit Award Agreement, dated as of February 7, 2013, by and between Mark B. Dunkerley and Hawaiian Holdings, Inc. (filed as Exhibit 10.3 to form 10-Q filed by Hawaiian Holdings, Inc. on April 25, 2013).*+ | |
10.28 | Airbus A320 Family Purchase Agreement, dated as of March 18, 2013, between Airbus S.A.S. and Hawaiian Airlines, Inc. (filed as Exhibit 10.1 to Form 10-Q/A filed by Hawaiian Holdings, Inc. on October 17, 2013 in redacted form pursuant to a request for confidential treatment for certain provisions thereof pursuant to Rule 24b-2 of the Securities Exchange Act of 1934, as amended).*‡ | |
10.28.1 | Amendment #1 to Airbus A320 Family Purchase Agreement, dated as of March 18, 2013, between Airbus S.A.S. and Hawaiian Airlines, Inc.‡ | |
10.28.2 | Amendment #2 to Airbus A320 Family Purchase Agreement, dated as of March 18, 2013, between Airbus S.A.S. and Hawaiian Airlines, Inc.‡ | |
10.29 | Pass Through Trust Agreement, dated May 29, 2013, between Hawaiian Airlines, Inc. and Wilmington Trust, National Association, as trustee (filed as Exhibit 4.1to the Form 8-K filed by Hawaiian Holdings, Inc. on May 31, 2013).* | |
10.30 | Trust Supplement No. 2013-1A-O, dated as of May 29, 2013, between Wilmington Trust, National Association, as Trustee, and Hawaiian Airlines, Inc. to Pass Through Trust Agreement, dated as of May 29, 2013 (filed as Exhibit 4.2 to the Form 8-K filed by Hawaiian Holdings, Inc. on May 31, 2013).* | |
89
10.31 | Trust Supplement No. 2013-1A-S, dated as of May 29, 2013, between Wilmington Trust, National Association, as Trustee, and Hawaiian Airlines, Inc. to Pass Through Trust Agreement, dated as of May 29, 2013 (filed as Exhibit 4.3 to the Form 8-K filed by Hawaiian Holdings, Inc. on May 31, 2013).* | |
10.32 | Trust Supplement No. 2013-1B-O, dated as of May 29, 2013, between Wilmington Trust, National Association, as Trustee, and Hawaiian Airlines, Inc. to Pass Through Trust Agreement, dated as of May 29, 2013 (filed as Exhibit 4.4 to the Form 8-K filed by Hawaiian Holdings, Inc. on May 31, 2013).* | |
10.33 | Trust Supplement No. 2013-1B-S, dated as of May 29, 2013, between Wilmington Trust, National Association, as Trustee, and Hawaiian Airlines, Inc. to Pass Through Trust Agreement, dated as of May 29, 2013 (filed as Exhibit 4.5 to the Form 8-K filed by Hawaiian Holdings, Inc. on May 31, 2013).* | |
10.34 | Revolving Credit Agreement (2013-1A), dated as of May 29, 2013, between Wilmington Trust, National Association, as subordination agent, as agent and trustee, and as borrower, and Natixis S.A., acting via its New York Branch, as liquidity provider (filed as Exhibit 4.6 to the Form 8-K filed by Hawaiian Holdings, Inc. on May 31, 2013).* | |
10.35 | Revolving Credit Agreement (2013-1B), dated as of May 29, 2013, between Wilmington Trust, National Association, as subordination agent, as agent and trustee, and as borrower, and Natixis S.A., acting via its New York Branch, as liquidity provider (filed as Exhibit 4.7 to the Form 8-K filed by Hawaiian Holdings, Inc. on May 31, 2013).* | |
10.36 | Intercreditor Agreement, dated as of May 29, 2013, among Wilmington Trust, National Association, as trustee, Natixis S.A., acting via its New York Branch, as liquidity provider, and Wilmington Trust, National Association, as subordination agent and trustee (filed as Exhibit 4.8 to the Form 8-K filed by Hawaiian Holdings, Inc. on May 31, 2013).* | |
10.37 | Deposit Agreement (Class A), dated as of May 29, 2013, between Wells Fargo Bank Northwest, National Association, as escrow agent, and Natixis S.A., acting via its New York Branch, as depositary (filed as Exhibit 4.9 to the Form 8-K filed by Hawaiian Holdings, Inc. on May 31, 2013).* | |
10.38 | Deposit Agreement (Class B), dated as of May 29, 2013, between Wells Fargo Bank Northwest, National Association, as escrow agent, and Natixis S.A., acting via its New York Branch, as depositary (filed as Exhibit 4.10 to the Form 8-K filed by Hawaiian Holdings, Inc. on May 31, 2013).* | |
10.39 | Escrow and Paying Agent Agreement (Class A), dated as of May 29, 2013, among Wells Fargo Bank Northwest, National Association, as escrow agent, Citigroup Global Markets Inc., Goldman, Sachs & Co. and Morgan Stanley & Co. LLC, for themselves and on behalf of the several Underwriters of the Certificates, Wilmington Trust, National Association, as trustee, and Wilmington Trust, National Association, as paying agent (filed as Exhibit 4.11 to the Form 8-K filed by Hawaiian Holdings, Inc. on May 31, 2013).* | |
10.40 | Escrow and Paying Agent Agreement (Class B), dated as of May 29, 2013, among Wells Fargo Bank Northwest, National Association, as escrow agent, Citigroup Global Markets Inc., Goldman, Sachs & Co. and Morgan Stanley & Co. LLC, for themselves and on behalf of the several Underwriters of the Certificates, Wilmington Trust, National Association, as trustee, and Wilmington Trust, National Association, as paying agent (filed as Exhibit 4.12 to the Form 8-K filed by Hawaiian Holdings, Inc. on May 31, 2013).* | |
10.41 | Note Purchase Agreement, dated as of May 29, 2013, among Hawaiian Airlines, Inc., Wilmington Trust, National Association, as trustee, Wilmington Trust, National Association, as subordination agent, Wells Fargo Bank Northwest, National Association, as escrow agent, and Wilmington Trust, National Association, as paying agent (filed as the Exhibit 4.13 to the Form 8-K filed by Hawaiian Holdings, Inc. on May 31, 2013).* | |
10.42 | Form of Participation Agreement (Participation Agreement between Hawaiian Airlines, Inc. and Wilmington Trust, National Association, as mortgagee, subordination agent and trustee) (Exhibit B to Note Purchase Agreement) (filed as Exhibit 4.14 to the Form 8-K filed by Hawaiian Holdings, Inc. on May 31, 2013).* | |
10.43 | Form of Indenture (Trust Indenture and Mortgage between Hawaiian Airlines, Inc. and Wilmington Trust, National Association, as mortgagee and securities intermediary) (Exhibit C to Note Purchase Agreement) (filed Exhibit 4.15 to the Form 8-K filed by Hawaiian Holdings, Inc. on May 31, 2013).* | |
10.44 | Form of Hawaiian Airlines Pass Through Certificate, Series 2013-1A-O (filed as Exhibit 4.16 to the Form 8-K filed by Hawaiian Holdings, Inc. on May 31, 2013).* | |
10.45 | Form of Hawaiian Airlines Pass Through Certificate, Series 2013-1B-O (filed as Exhibit 4.17 to the Form 8-K filed by Hawaiian Holdings, Inc. on May 31, 2013).* | |
10.46 | Agreement dated December 11, 2013 by and among Hawaiian Holdings, Inc., Hirzel Capital Management LLC and Zac S. Hirzel. (filed as Exhibit 10.1 to the form 8-K filed by Hawaiian Holdings, Inc. on December 11, 2013).* | |
10.47 | Credit and Guaranty Agreement dated as of November 7, 2014 among Hawaiian Airlines, Inc., Hawaiian Holdings, Inc., certain other subsidiaries of Hawaiian Holdings, Inc, the lenders party thereto and Citibank, N.A.‡ | |
90
10.48 | General Terms Agreement, dated as of December 17, 2014, between Rolls-Royce PLC, Rolls-Royce TotalCare Services Limited and Hawaiian Airlines, Inc. for Trent 7000 Engines.‡ | |
10.49 | Hawaiian Holdings, Inc. 2015 Stock Incentive Plan (filed as Exhibit 10.1 to the Form 8-K filed by Hawaiian Holdings, Inc. on May 12, 2015).*+ | |
10.50 | Form of Hawaiian Holdings, Inc. Restricted Stock Unit Agreement (filed as Exhibit 10.2 to the Form 8-K filed by Hawaiian Holdings, Inc. on May 28, 2015).*+ | |
10.51 | Form of Hawaiian Holdings, Inc. Performance Restricted Stock Unit Agreement (filed as Exhibit 10.3 to the Form 8-K filed by Hawaiian Holdings, Inc. on May 28, 2015).*+ | |
10.52 | Form of Hawaiian Holdings, Inc. Stock Option Agreement (filed as Exhibit 10.4 to the Form 8-K filed by Hawaiian Holdings, Inc. on May 28, 2015).*+ | |
12 | Computation of ratio of earnings to fixed charges for the years ended December 31, 2015, 2014, 2013, 2012, and 2011. | |
21.1 | List of Subsidiaries of Hawaiian Holdings, Inc. | |
23.1 | Consent of Ernst & Young LLP. | |
31.1 | Rule 13a-14(a) Certification of Chief Executive Officer. | |
31.2 | Rule 13a-14(a) Certification of Chief Financial Officer. | |
32.1 | Certification of Chief Executive Officer pursuant to 18 U.S.C. Section 1350, as adopted pursuant to Section 906 of the Sarbanes-Oxley Act of 2002. | |
32.2 | Certification of Chief Financial Officer pursuant to 18 U.S.C. Section 1350, as adopted pursuant to Section 906 of the Sarbanes-Oxley Act of 2002. | |
101.INS | XBRL Instance Document. | |
101.SCH | XBRL Taxonomy Extension Schema Document | |
101.CAL | XBRL Taxonomy Extension Valuation Linkbase Document. | |
101.DEF | XBRL Taxonomy Extension Definition Linkbase Document. | |
101.LAB | XBRL Taxonomy Extension Label Linkbase Document. | |
101.PRE | XBRL Taxonomy Extension Presentation Linkbase Document. | |
+ These exhibits relate to management contracts or compensatory plans or arrangements.
* Previously filed; incorporated herein by reference.
‡ Confidential treatment has been requested for a portion of this exhibit.
91
Schedule II—Hawaiian Holdings, Inc.
Valuation and Qualifying Accounts
Years Ended December 31, 2015, 2014 and 2013
COLUMN A | COLUMN B | COLUMN C ADDITIONS | COLUMN D | COLUMN E | ||||||||||||
Description | Balance at Beginning of Year | (1) Charged to Costs and Expenses | (2) Charged to Other Accounts | Deductions | Balance at End of Year | |||||||||||
(in thousands) | ||||||||||||||||
Allowance for Doubtful Accounts | ||||||||||||||||
2015 | $ | 135 | 484 | — | (453 | ) | (a) | $ | 166 | |||||||
2014 | $ | 101 | 593 | — | (559 | ) | (a) | $ | 135 | |||||||
2013 | $ | 371 | 292 | — | (562 | ) | (a) | $ | 101 | |||||||
Allowance for Obsolescence of Flight Equipment Expendable Parts and Supplies | ||||||||||||||||
2015 | $ | 14,499 | 2,895 | (b) | — | (940 | ) | (c) | $ | 16,454 | ||||||
2014 | $ | 12,801 | 2,193 | (b) | — | (495 | ) | (c) | $ | 14,499 | ||||||
2013 | $ | 10,963 | 2,471 | (b) | — | (633 | ) | (c) | $ | 12,801 | ||||||
Valuation Allowance on Deferred Tax Assets | ||||||||||||||||
2015 | $ | 3,396 | 516 | — | — | $ | 3,912 | |||||||||
2014 | $ | 2,923 | 473 | — | — | $ | 3,396 | |||||||||
2013 | $ | 2,451 | 472 | — | — | $ | 2,923 | |||||||||
_______________________________________________________________________________
(a) | Doubtful accounts written off, net of recoveries. |
(b) | Obsolescence reserve for Hawaiian flight equipment expendable parts and supplies. |
(c) | Spare parts and supplies written off against the allowance for obsolescence. |
92
SIGNATURES
Pursuant to the requirements of Section 13 or 15(d) of the Securities Exchange Act of 1934, as amended, the Registrant has duly caused this report to be signed on its behalf by the undersigned, thereunto duly authorized.
HAWAIIAN HOLDINGS, INC. | |||
February 8, 2016 | By | /s/ SHANNON L. OKINAKA | |
Shannon L. Okinaka Executive Vice President, Chief Financial Officer and Treasurer (Principal Financial and Accounting Officer) | |||
Pursuant to the requirements of the Securities Exchange Act of 1934, as amended, this report has been signed below by the following persons on behalf of the Registrant and in the capacities indicated on February 8, 2016.
Signature | Title | |
/s/ MARK B. DUNKERLEY | President and Chief Executive Officer, and Director (Principal Executive Officer) | |
Mark B. Dunkerley | ||
/s/ SHANNON L. OKINAKA | Executive Vice President, Chief Financial Officer and Treasurer (Principal Financial and Accounting Officer) | |
Shannon L. Okinaka | ||
/s/ LAWRENCE S. HERSHFIELD | Chair of the Board of Directors | |
Lawrence S. Hershfield | ||
/s/ GREGORY S. ANDERSON | Director | |
Gregory S. Anderson | ||
/s/ ZAC S. HIRZEL | Director | |
Zac S. Hirzel | ||
/s/ RANDALL L. JENSON | Director | |
Randall L. Jenson | ||
/s/ TOMOYUKI MORIIZUMI | Director | |
Tomoyuki Moriizumi | ||
/s/ SAMSON POOMAIHEALANI | Director | |
Samson Poomaihealani | ||
/s/ CRYSTAL K. ROSE | Director | |
Crystal K. Rose | ||
/s/ WILLIAM S. SWELBAR | Director | |
William S. Swelbar | ||
/s/ DUANE E. WOERTH | Director | |
Duane E. Woerth | ||
/s/ RICHARD N. ZWERN | Director | |
Richard N. Zwern | ||
93