Attached files
| file | filename |
|---|---|
| EX-99.1 - PRESS RELEASE AND EARNINGS RELEASE ATTACHMENTS - EXELON CORP | d125923dex991.htm |
| 8-K - FORM 8-K - EXELON CORP | d125923d8k.htm |
 Earnings Conference Call 4 th Quarter 2015 February 3, 2016 Exhibit 99.2 |
 2 Q4 2015 Earnings Release Slides Cautionary Statements Regarding Forward-Looking Information
This presentation contains certain forward-looking statements
within the meaning of the Private Securities
Litigation Reform Act of 1995, that are subject to risks and uncertainties. The factors that could cause actual results to differ materially from the
forward-looking statements made by Exelon include those
factors discussed herein, as well as the items
discussed in (1) Exelon’s 2014 Annual Report on Form 10-K in (a) ITEM 1A. Risk Factors, (b) ITEM 7. Management’s Discussion and Analysis of Financial
Condition and Results of Operations and (c) ITEM 8. Financial
Statements and Supplementary Data: Note 22; (2)
Exelon’s Third Quarter 2015 Quarterly Report on
Form 10-Q in (a) Part II, Other Information, ITEM 1A. Risk
Factors; (b) Part 1, Financial Information, ITEM
2. Management’s Discussion and Analysis of Financial Condition and Results of Operations and (c) Part I, Financial Information, ITEM 1. Financial
Statements: Note 19; and (3) other factors discussed in filings
with the SEC by Exelon. Readers are cautioned not
to place undue reliance on these forward-looking
statements, which apply only as of the date of this
presentation. Exelon does not undertake any
obligation to publicly release any revision to its forward-looking statements to reflect events or circumstances after the date of this presentation. |
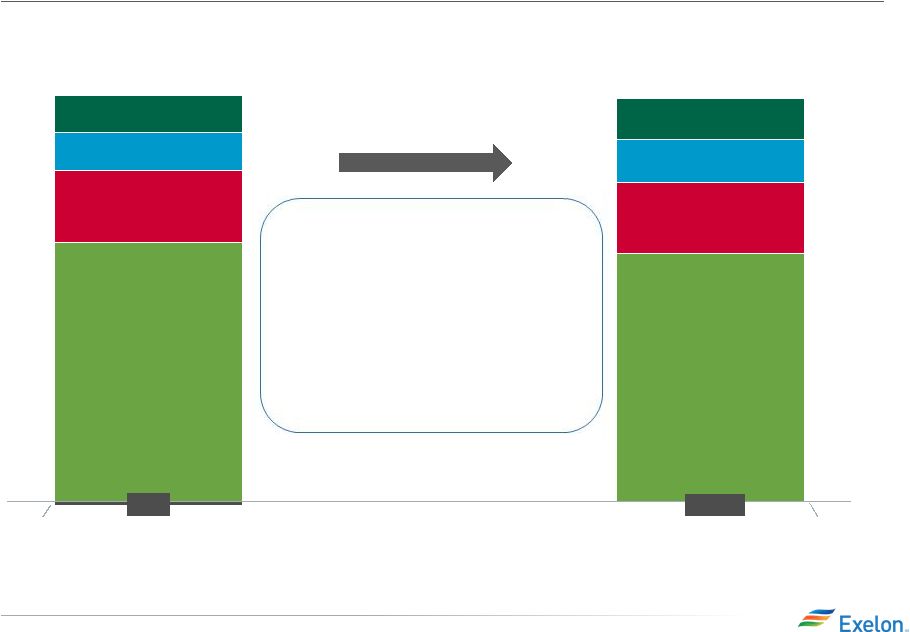
 3 Q4 2015 Earnings Release Slides Delivering Value to Shareholders Through a Defined Capital
Allocation Policy
• Our strong balance sheet underpins our capital allocation
policy •
Capital
decisions
are
made
to
maximize
value
to
our
customers
and
shareholders
• We are harvesting free cash flow from Exelon Generation
to: –
First,
invest in utilities where we can earn an appropriate return, – Invest in contracted assets where we can meet return thresholds, and/or – Return capital to shareholders by retiring debt, repurchasing our
shares, or increasing our dividend
• We are committed to maintaining an attractive dividend • Our board has approved a policy to raise our dividend 2.5% each year
for
the
next
three
years,
beginning
with
the
June
2016
dividend
(1)
(1) Quarterly dividends are subject to declaration by the board
of directors. |
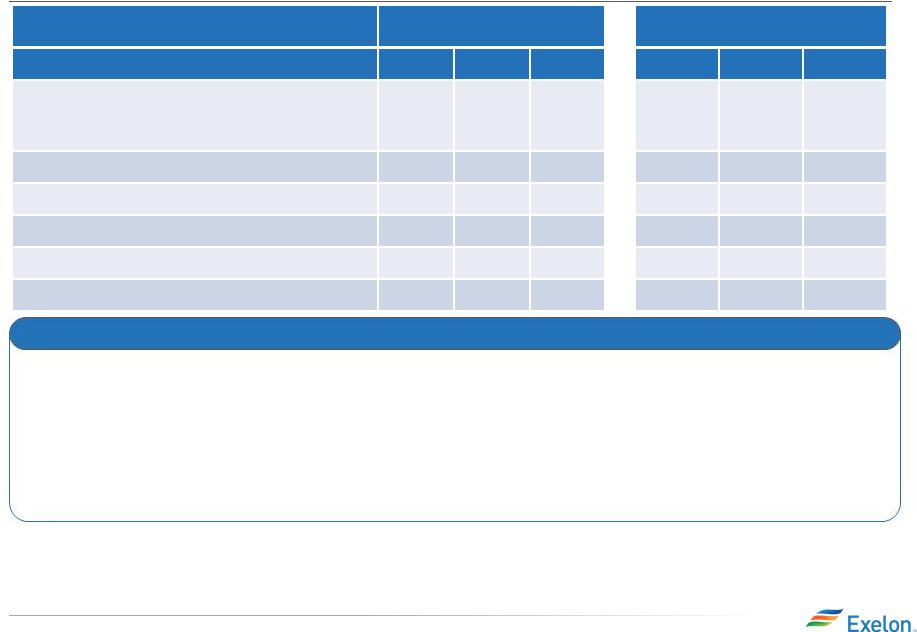
 4 Q4 2015 Earnings Release Slides • 1 st Quartile SAIFI performance • 1 st Quartile CAIDI performance • 1 st Quartile Customer Satisfaction – best ever scores at ComEd and BGE Strong Financial Performance Leading Operational Excellence Positive Regulatory Outcomes • 1 st Quartile SAIFI performance • 1 st Quartile CAIDI performance • 1 st Quartile Customer Satisfaction • Improve PHI operational performance • Unanimous approval of PECO’s rate case settlement and Long Term Infrastructure Improvement Plan • 4 th year of constructive outcomes in ComEd’s formula rate filings • Close PHI transaction • BGE rate case decision in June • ComEd formula rate filing in April • Develop and implement regulatory strategies for PHI Exelon Utilities – Operational Excellence Driving Strong Financial Performance and Positive Regulatory Outcomes 2015 Results 2016 Goals • Exceeded $1B in operating net income • Invested $3.7B to make the grid smarter, more reliable, and provide better services to customers • Quickly integrate PHI to drive synergies and financial results • Invest $3.95B in capital across our three utilities and additional $1.38B at PHI ($18B over the next 5 years, $25B including PHI) • Improve system infrastructure • Better customer experience |
 5 Q4 2015 Earnings Release Slides World Class Operational Performance 2016 Goals Industry Leading Load Serving Business • Full-year Nuclear Capacity Factor: 93.7% • Best average refueling outage duration since 2002: 22 days • Full-year Power dispatch match: 98.6% • Full-year Renewables energy capture: 95.5% • Generation to Load matching strategy meaningfully contributed to 2015 earnings • Industry Leading Load Serving Business: • Served 195 TWhs of wholesale and retail load – 40 TWhs more than in 2014 • ~ 80% power renewal rate • ~30% new customer win rate • Increased our delivered retail gas by 40% to 710 BCF • >90% gas retention rate • Continue to be best in class in operational performance across the generation fleet • Execute on 350MW of contracted renewable projects (Michigan Wind 3 & Bluestem Wind) • Achieve target of serving 210 TWhs of wholesale and retail load • Achieve proper valuation for our nuclear generation assets that rewards their carbon free footprint 210 180 155 195 155 2016 2015 (1) 2014 Target Actual Delivering on electric load serving targets and poised to continue growth Exelon Generation Delivered Strong Operational and Financial Performance in 2015 (1) 2015 target includes 15 TWhs from the Integrys acquisition
(TWhs) |
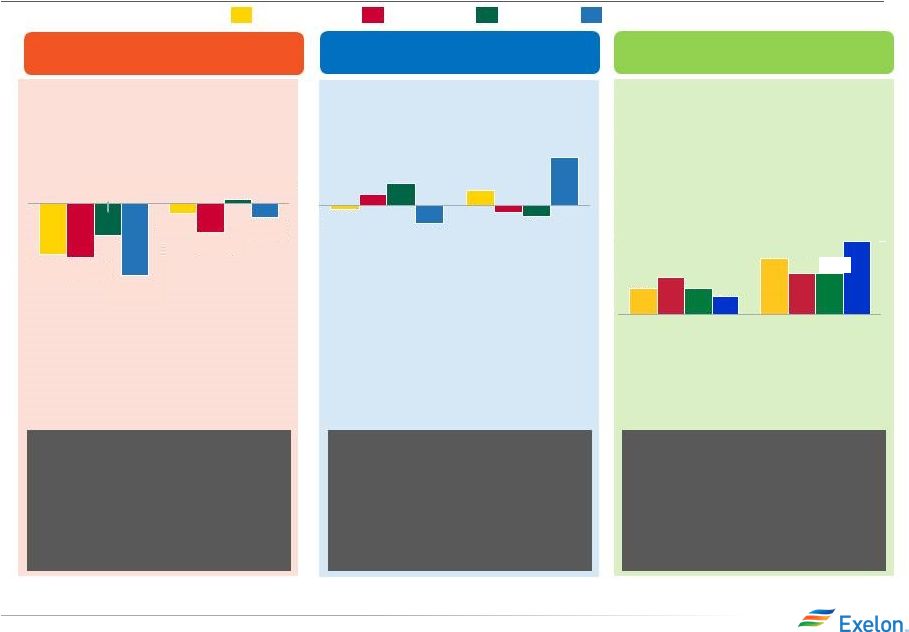
 6 Q4 2015 Earnings Release Slides ($0.13) $1.40 $0.48 $0.43 $0.31 PECO ExGen ComEd BGE HoldCo ExGen ComEd PECO BGE 2016 Guidance $2.40 - $2.70 (2) ~($0.05) $1.25 - $1.35 $0.50 - $0.60 $0.40 - $0.50 $0.25 - $0.35 2015 Actual $2.49 (1) HoldCo 2016 Adjusted Operating Earnings Guidance Expect Q1 2016 Adjusted Operating Earnings of $0.60 - $0.70 per share Key Year-Over-Year Drivers • BGE: higher O&M for storms and bad debt, partially offset by higher distribution rates • PECO: higher distribution rates, partially offset by higher O&M for storms and bad debt • ComEd: increased capital investments in distribution and transmission • ExGen: normalized load optimization in 2016 (1) 2015 results based on 2015 average outstanding shares of 893M. Refer to Earnings Release Attachments for additional details and to the Appendix
for a reconciliation of adjusted (non- GAAP) operating EPS to GAAP
EPS. (2) 2016 earnings guidance based on expected average outstanding shares of 890M and assumes that equity and debt
issued for Pepco Holdings acquisition is unwound in 2016. Earnings guidance for OpCos may not add up to consolidated EPS guidance. Refer to the Appendix for a reconciliation of adjusted (non-GAAP) operating
EPS guidance to GAAP EPS. |
 7 Q4 2015 Earnings Release Slides Key Financial Metrics Impacted by Bonus Depreciation 2016 11.8 2018 13.6 2017 12.8 Distribution Transmission Standalone Bonus Depreciation Impacts Updated Exelon Utilities Net Income ($M) (3) Updated ComEd Rate Base ($B) (4) $1,400 $1,300 $0 $1,200 $1,100 $1,325 2016 $1,250 2018 $1,400 2017 $1,250 $1,175 $1,100 2016 2017 2018 Earnings per Share (1) ($0.09) ($0.11) ($0.06) Cash Flow (2) $625M $675M $600M • Bonus Depreciation reduces earnings in 2016-2018 primarily due to its impact on ExGen’s ability to take
the Domestic Production Activities Deduction and
impacts to ComEd’s rate base
• No re-investment of the incremental cash is contemplated in the earnings impacts listed Exelon Utilities projected average earnings growth is still in the 7-9% range per year from 2015-2018 Exelon Utilities Rate Base growing by $5.5B, more than 25% from 2015 to 2018, despite impact of bonus depreciation 8.6 9.3 10.0 3.2 3.5 3.6 (1) 2016: ExGen ($0.06), ComEd ($0.03); 2017: ExGen ($0.07), ComEd ($0.04); 2018: ComEd ($0.05), BGE ($0.01), PECO ($0.01), ExGen $0.01
(2) Numbers rounded to nearest $25M (3) Does not include PHI net income and represents adjusted (non-GAAP) operating earnings. Refer to slide 38 for a list of adjustments from
GAAP EPS to adjusted (non-GAAP) operating earnings.
(4) Rate base represents end-of-year. Numbers may not add due to rounding |
 8 Q4 2015 Earnings Release Slides Maintaining Investment Grade Credit Ratings is a Top Financial Priority Current Ratings (2)(3) ExCorp ComEd PECO BGE ExGen Moody’s Baa2 A2 Aa3 A3 Baa2 S&P BBB- A- A- A- BBB Fitch BBB+ A- A A- BBB ExGen Debt/EBITDA Ratio (5) Exelon and ExGen S&P FFO/Debt % (1) • Key credit metrics expected to remain above target after including PHI (4) Credit Ratings by Operating Company ExGen Free Cash Flow 2016-2018 ($M) (6) ~$3,200 ~$5,350 ($1,350) Committed Non-Contracted Generation Growth CapEx ($800) Cumulative ExGen FCF 2016-18 Available Free Cash Flow Committed Contracted Generation Growth CapEx 3.2x 3.0x 2.3x 0.0 0.5 1.0 1.5 2.0 2.5 3.0 3.5 2018 2017 2016 ~$4,150 EEI Disclosure ~$2,700 EEI Disclosure 0% 10% 20% 30% 40% 50% 2016 2017 2018 Exelon Target (22%) Exelon ExGen ExGen Target (27%) (1) Metrics exclude PHI and financing associated with PHI. Due to ring-fencing, S&P deconsolidates BGE's financial
profile from Exelon and analyzes it solely as an equity investment (2) Current senior unsecured ratings as of 2/2/2016 for Exelon, Exelon Generation and BGE and senior secured ratings for ComEd
and PECO (3) All ratings have “Stable” outlook, except for at Fitch, which has ComEd on “Positive” and Exelon on
“Ratings Watch Negative,” and Moody’s, which has ComEd on “Positive” outlook
(4)
Exelon Consolidated and ExGen thresholds based on the S&P
Exelon Corp and ExGen Summary Reports published on August 5, 2015. On a combined basis with PHI, the consolidated threshold is 18%
(5)
Reflects net book debt (YE debt less cash on hand) / adjusted
operating EBITDA. EBITDA, a non-GAAP measure, is defined as earnings before interest, taxes, depreciation and amortization. Includes nuclear fuel amortization expense.
(6)
Free Cash Flow = Adjusted Cash Flow from
Operations less Base CapEx and Nuclear Fuel. Free Cash Flow is midpoint of a range based on December 31, 2015 market prices. Adjusted Cash Flow From Operations (non- GAAP) primarily includes net cash flows from operating activities and net cash flows from investing activities excluding
capital expenditures. Includes an extension of bonus depreciation. Does not include impacts of PHI
|
 9 Q4 2015 Earnings Release Slides Cost Management Initiative Update • Cost savings of $350M have been identified and incorporated into current long range
plan, reflecting our high level of confidence in achieving the
reductions •
Additional $50 million of nuclear fuel savings already reflected
in the hedge disclosure •
Savings to be achieved at:
o Exelon Generation - $175M o Corporate Shared Services - $175M • Approximately $100M of savings coming from Information Technology organization
• Remaining savings split among our centralized Corporate functions (e.g. Finance,
Legal, Supply, and Human Resources)
• Savings to be allocated roughly 50% to Exelon Generation and 50% to Exelon
Utilities
• Run-rate savings impact on EPS remains within range communicated at EEI ($0.13 –
$0.18)
(1)
• ~35% of run-rate savings will be achieved by end of 2016
Our enterprise-wide O&M CAGR over the 2015 to 2018
period will be negative with a (1.0%) CAGR at
Exelon Generation (1)
Based on projected 2018 share count of 965M shares, which
assumes PHI merger closes |
 10 Q4 2015 Earnings Release Slides Adjusted O&M Forecast (2) • 2016 forecast of $7.18B (1) • Expect CAGR of ~(0.5)% for 2015-2018 $4,475 $1,275 $775 $750 $4,675 $1,300 $675 $675 ComEd ComEd BGE HoldCo HoldCo PECO ExGen 2016 Guidance ExGen BGE PECO $7,175 $7,250 -$75 2015 Actual -$100 Key Year-over-Year Drivers (2) • Inflation: $150M
• PECO & BGE Storm Costs: $50M
• Utility Bad Debt Costs: $50M
• Baltimore City Conduit Fee (3) : $25M • Pension/OPEB: ($75M)
• Fewer Nuclear Outages: ($75M)
• Cost Management Initiative: ($125M) (1) Refer to the Appendix for a reconciliation of adjusted (non-GAAP) O&M to GAAP O&M. Further, the
Utilities adjusted O&M excludes regulatory O&M costs that are P&L neutral. ExGen adjusted O&M excludes direct cost of sales for certain Constellation businesses, P&L neutral decommissioning costs and the
impact from O&M related to variable interest entities. (2) All amounts rounded to the nearest $25M (3) The Baltimore City Board of Estimates' decision to more than triple the lease fee on BGE’s approximately 12 million
linear feet of electric cable in the City-owned conduit system became effective in Q4 2015.
|
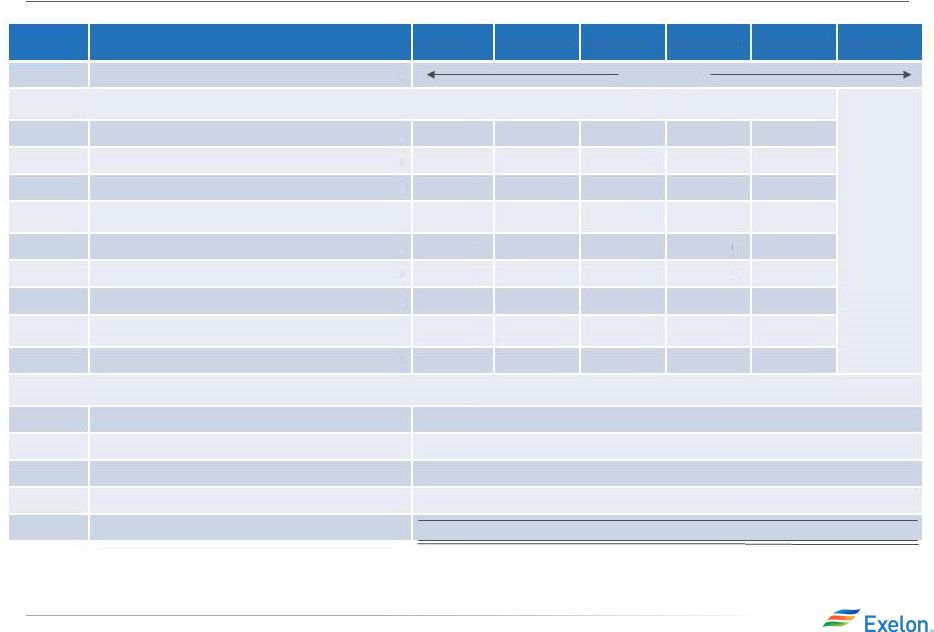
 11 Q4 2015 Earnings Release Slides Exelon Generation: Gross Margin Update 1) Gross margin categories rounded to nearest $50M 2) Total Gross Margin (Non-GAAP) is defined as operating revenues less purchased power and
fuel expense, excluding revenue related to decommissioning,
gross receipts tax, Exelon Nuclear Partners,
operating services agreement with Fort Calhoun and variable interest entities. Total Gross Margin is also net of direct cost of sales for certain Constellation
businesses. See Slide
29 for a Non-GAAP to GAAP reconciliation of Total Gross Margin.
3)
Excludes EDF’s equity ownership share of the CENG Joint
Venture 4)
Mark-to-Market of Hedges assumes mid-point of hedge
percentages •
Ginna
RSSA reflected in gross margin updates
• Behind ratable hedging position reflects the fundamental upside we see in power prices
• Generation ~37-40% open in 2017 • Power position ~5-8% behind ratable, considering cross-commodity hedges
Recent Developments
Gross Margin Category ($M)
(1)
2016
2017
2018
2016
2017
2018
Open Gross Margin
(3)
(including South, West, Canada hedged gross
margin)
$5,200
$5,800
$6,150
$(450)
-
$50
Mark-to-Market of Hedges
(3,4)
$1,700
$800
$250
$500
$50
-
Power New Business / To Go
$450
$800
$1,000
$(50)
-
-
Non-Power Margins Executed
$250
$150
$100
$50
$50
$50
Non-Power New Business / To Go
$200
$300
$400
$(50)
$(50)
$(50)
Total Gross Margin
(2)
$7,800
$7,850
$7,900
-
$50
$50
December 31, 2015
Change from Sept. 30, 2015
|
 12 Q4 2015 Earnings Release Slides Exelon Generation Disclosures December 31, 2015 |
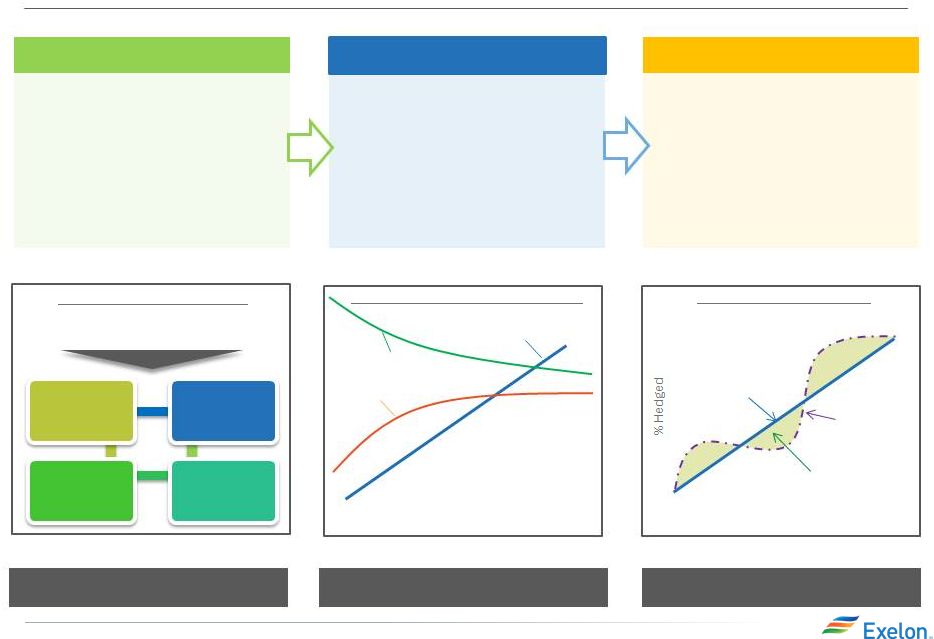 13 Q4 2015 Earnings Release Slides Portfolio Management Strategy Protect Balance Sheet Ensure Earnings Stability Create Value Strategic Policy Alignment •Aligns hedging program with financial policies and financial outlook •Establish minimum hedge targets to meet financial objectives of the company (dividend, credit rating) •Hedge enough commodity risk to meet future cash requirements under a stress scenario Three-Year Ratable Hedging •Ensure stability in near-term cash flows and earnings •Disciplined approach to hedging •Tenor aligns with customer preferences and market liquidity •Multiple channels to market that allow us to maximize margins •Large open position in outer years to benefit from price upside Bull / Bear Program •Ability to exercise fundamental market views to create value within the ratable framework •Modified timing of hedges versus purely ratable •Cross-commodity hedging (heat rate positions, options, etc.) •Delivery locations, regional and zonal spread relationships Exercising Market Views Purely ratable Actual hedge % Market views on timing, product allocation, and regional spreads reflected in actual hedge % High End of Profit Low End of Profit % Hedged Open Generation with LT Contracts Portfolio Management & Optimization Portfolio Management Over Time Align Hedging & Financials Establishing Minimum Hedge Targets Credit Rating Capital & Operating Expenditure Dividend Capital Structure |
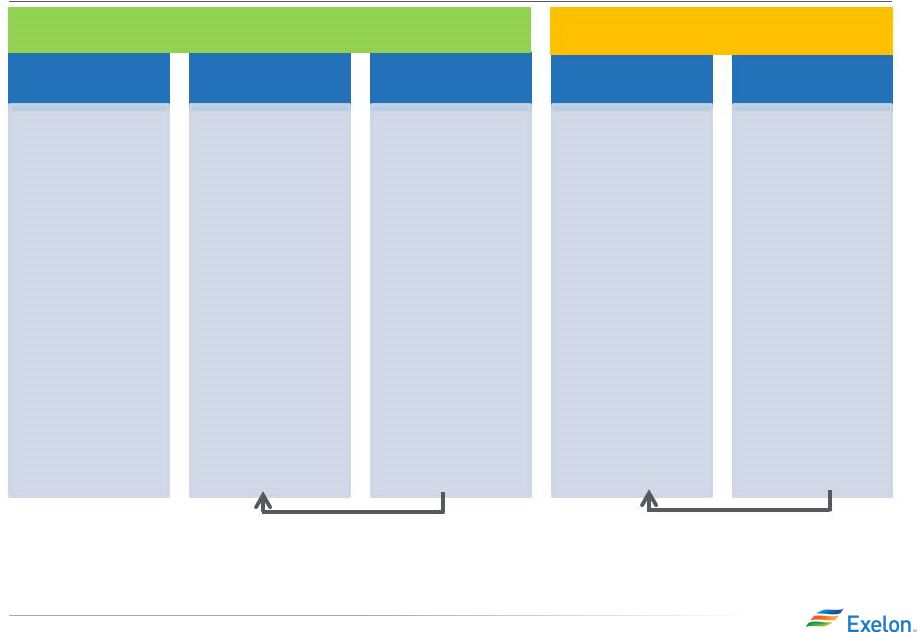 14 Q4 2015 Earnings Release Slides Components of Gross Margin Categories Open Gross Margin •Generation Gross Margin at current market prices, including capacity and ancillary revenues, nuclear fuel amortization and fossils fuels expense •Exploration and Production (4) •Power Purchase Agreement (PPA) Costs and Revenues •Provided at a consolidated level for all regions (includes hedged gross margin for South, West and Canada (1) ) MtM of Hedges (2) •Mark-to-Market (MtM) of power, capacity and ancillary hedges, including cross commodity, retail and wholesale load transactions •Provided directly at a consolidated level for five major regions. Provided indirectly for each of the five major regions via Effective Realized Energy Price (EREP), reference price, hedge %, expected generation “Power” New Business •Retail, Wholesale planned electric sales •Portfolio Management new business •Mid marketing new business “Non-Power” Executed •Retail, Wholesale executed gas sales •Energy Efficiency (4) •BGE Home (4) •Distributed Solar “Non-Power” New Business •Retail, Wholesale planned gas sales •Energy Efficiency (4) •BGE Home (4) •Distributed Solar •Portfolio Management / origination fuels new business •Proprietary trading (3) Margins move from new business to MtM of hedges over the course of the year as sales are executed (5) Margins move from “Non power new business” to
“Non power executed” over the course of the
year Gross margin linked to power production and
sales Gross margin from
other business activities
(1) Hedged gross margins for South, West & Canada regions
will be included with Open Gross Margin, and no expected generation, hedge %, EREP or reference prices provided for this region (2) MtM of hedges provided directly for the five larger regions; MtM of hedges is not provided directly at the regional
level but can be easily estimated using EREP, reference price and hedged MWh (3) Proprietary trading gross margins will generally remain within “Non Power” New Business category and only
move to “Non Power” Executed category upon management discretion (4) Gross margin for these businesses are net of direct “cost of sales”
(5) Margins for South, West & Canada regions and
optimization of fuel and PPA activities captured in Open Gross Margin |
 15 Q4 2015 Earnings Release Slides ExGen Disclosures (1) Gross margin categories rounded to nearest $50M
(2)
Total Gross Margin (Non-GAAP) is defined as operating
revenues less purchased power and fuel expense,
excluding revenue related to decommissioning, gross receipts tax, Exelon Nuclear Partners, operating services agreement with Fort Calhoun and variable
interest entities. Total Gross Margin is also net of direct cost
of sales for certain Constellation
businesses. See Slide 29 for a Non-GAAP to GAAP reconciliation of Total Gross Margin. (3) Excludes EDF’s equity ownership share of the CENG Joint Venture
(4)
Mark-to-Market of Hedges assumes mid-point of hedge
percentages (5)
Based on December 31, 2015 market conditions
Gross Margin Category ($M)
(1)
2016
2017
2018
Open Gross Margin
(including South, West & Canada hedged GM)
(3)
$5,200
$5,800
$6,150
Mark-to-Market of Hedges
(3,4)
$1,700
$800
$250
Power New Business / To Go
$450
$800
$1,000
Non-Power Margins Executed
$250
$150
$100
Non-Power New Business / To Go
$200
$300
$400
Reference Prices
(5)
2016
2017
2018
Henry Hub Natural Gas ($/MMbtu)
$2.49
$2.79
$2.91
Midwest: NiHub ATC prices ($/MWh)
$28.46
$29.23
$29.22
Mid-Atlantic: PJM-W ATC prices ($/MWh)
$34.51
$35.22
$34.16
ERCOT-N ATC Spark Spread ($/MWh)
HSC Gas, 7.2HR, $2.50 VOM
$4.79
$4.66
$4.49
New York: NY Zone A ($/MWh)
$31.82
$34.52
$33.60
New England: Mass Hub ATC Spark Spread($/MWh)
ALQN Gas, 7.5HR, $0.50 VOM
$9.60
$11.32
$9.71
$7,800
$7,850
$7,900
Total Gross Margin
(2) |
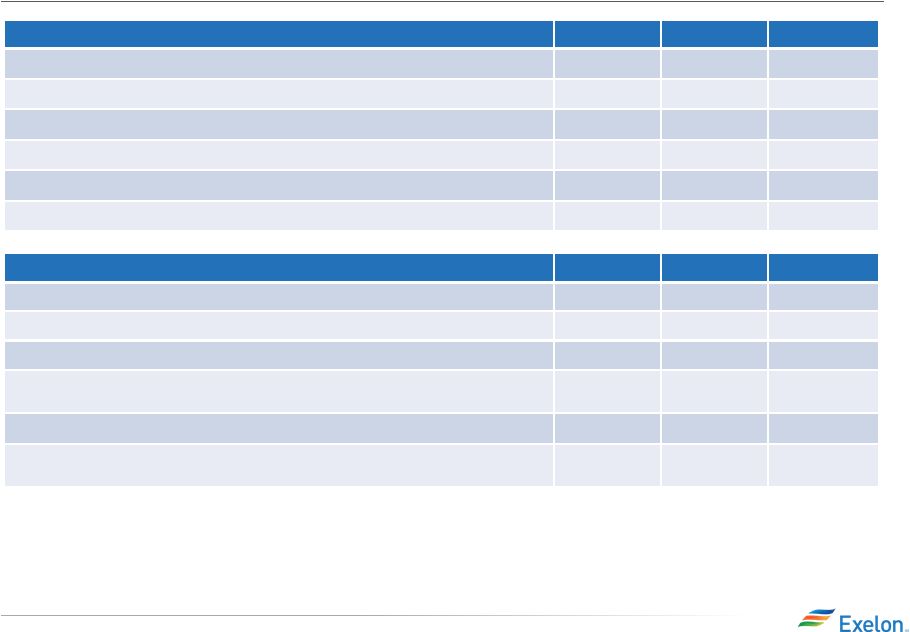
 16 Q4 2015 Earnings Release Slides ExGen Disclosures Generation and Hedges 2016 2017 2018 Exp. Gen (GWh) (1) 199,900 206,500 207,400 Midwest 97,300 96,400 96,800 Mid-Atlantic (2) 63,600 61,600 60,700 ERCOT 17,400 26,500 31,500 New York (2) 9,300 9,200 9,100 New England 12,300 12,800 9,300 % of Expected Generation Hedged (3) 90%-93% 60%-63% 28%-31% Midwest 88%-91% 55%-58% 21%-24% Mid-Atlantic (2) 91%-94% 64%-67% 35%-38% ERCOT 98%-101% 67%-70% 32%-35% New York (2) 83%-86% 71%-74% 41%-44% New England 94%-97% 49%-52% 16%-19% Effective Realized Energy Price ($/MWh) (4) Midwest $34.50 $33.50 $33.00 Mid-Atlantic (2) $47.00 $46.00 $42.50 ERCOT (5) $11.00 $8.00 $3.50 New York (2) $58.50 $44.50 $38.00 New England (5) $20.50 $14.50 $7.00 (1) Expected generation is the volume of energy that best represents our commodity position in energy markets from owned
or contracted for capacity based upon a simulated
dispatch model that makes assumptions regarding future market
conditions, which are calibrated to market quotes for power, fuel, load following products, and options. Expected generation assumes 12 refueling outages in 2016, 15 in 2017, and 14 in 2018 at Exelon-operated nuclear plants, and
Salem. Expected generation assumes capacity factors of 94.1%, 93.4% and 93.7% in 2016, 2017 and 2018 respectively at Exelon-operated nuclear plants, at ownership.
These estimates of expected generation in 2017 and 2018 do not represent guidance or a forecast of future results as Exelon has not completed its planning or optimization processes
for those years. (2) Excludes EDF’s equity ownership share of CENG Joint Venture. (3) Percent of expected generation hedged is the amount of equivalent sales divided by expected
generation. Includes all hedging products, such as wholesale and retail sales of power, options and swaps. (4) Effective realized energy price is representative of an all-in
hedged price, on a per MWh basis, at which expected generation has been hedged. It is developed by considering the energy revenues and costs associated with our hedges and by
considering the fossil fuel that has been purchased to lock in margin. It excludes uranium costs and RPM capacity revenue, but includes the mark-to-market value of capacity contracted
at prices other than RPM clearing prices including our load obligations. It can be compared with the reference prices used to calculate open gross margin in order to determine
the mark-to-market value of Exelon Generation's energy hedges. (5) Spark spreads shown for ERCOT and New England. |
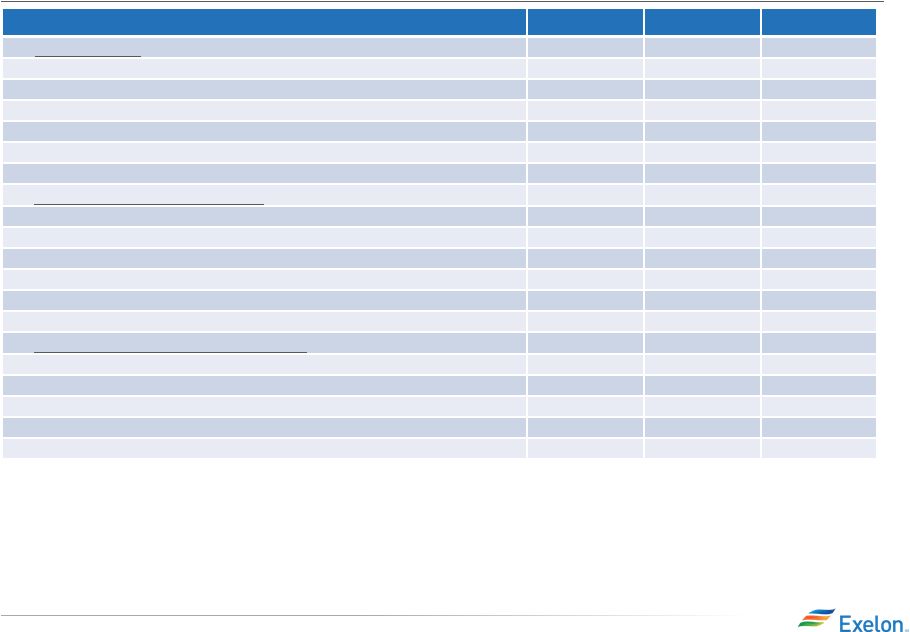
 17 Q4 2015 Earnings Release Slides ExGen Hedged Gross Margin Sensitivities (1) Based on December 31, 2015 market conditions and hedged position; Gas price sensitivities are based on an assumed
gas-power relationship derived from an internal model that is updated periodically; Power prices sensitivities are derived by adjusting the power price assumption while keeping
all other prices inputs constant; Due to correlation of the various assumptions, the hedged gross margin impact calculated by aggregating individual sensitivities may not be
equal to the hedged gross margin impact calculated when correlations between the various assumptions are also considered; Sensitivities based on commodity exposure which includes
open generation and all committed transactions;
Excludes EDF’s equity share of CENG Joint Venture
Gross Margin Sensitivities (With Existing
Hedges) (1)
2016
2017
2018
Henry Hub Natural Gas ($/Mmbtu)
+ $1/Mmbtu
$10
$380
$695
-
$1/Mmbtu
$(5)
$(380)
$(695)
NiHub ATC Energy Price
+ $5/MWh
$55
$225
$380
-
$5/MWh
$(50)
$(220)
$(380)
PJM-W ATC Energy Price
+ $5/MWh
$15
$100
$200
-
$5/MWh
$(10)
$(110)
$(205)
NYPP Zone A ATC Energy Price
+ $5/MWh
$5
$15
$25
-
$5/MWh
$(5)
$(15)
$(25)
Nuclear Capacity Factor
+/-
1%
+/-
$40
+/-
$40
+/-
$40 |
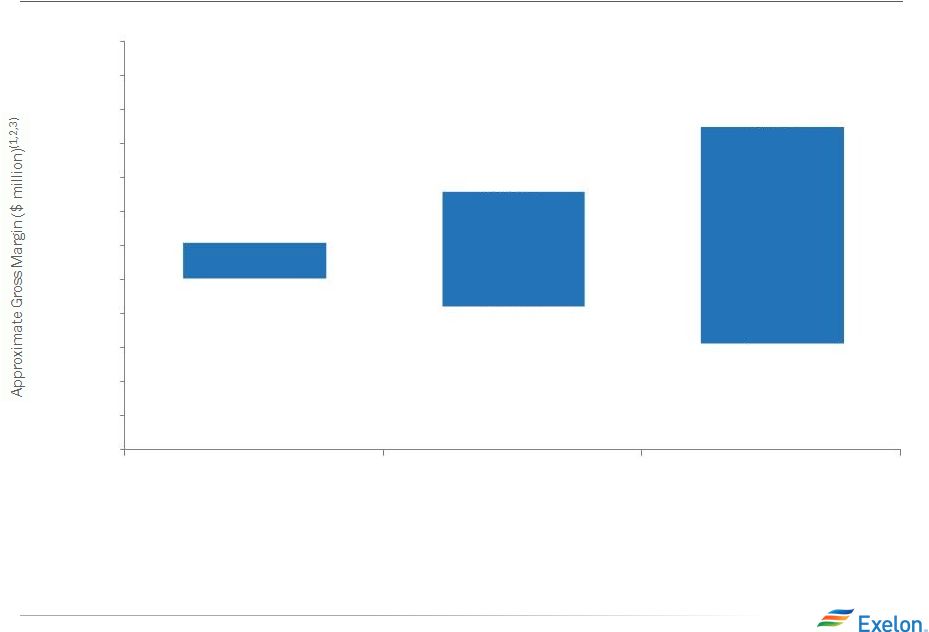 18 Q4 2015 Earnings Release Slides ExGen Hedged Gross Margin Upside/Risk $8,050 $7,500 $8,800 $7,100 (1) (2) Gross Margin Upside/Risk based on commodity exposure which includes open generation and all committed
transactions (3)
Gross Margin (Non-GAAP) is defined as operating revenues
less purchased power and fuel expense, excluding revenue related to decommissioning, gross receipts tax, Exelon Nuclear Partners, operating services agreement with Fort Calhoun and variable interest entities. Total Gross Margin is also net of
direct cost of sales for certain Constellation businesses. See Slide 29 for a Non-GAAP to GAAP reconciliation of Total Gross Margin. Excludes EDF’s equity ownership share of the CENG Joint
Venture. 5,000
5,500
6,000
6,500
7,000
7,500
8,000
8,500
9,000
9,500
10,000
10,500
11,000
2016
2017
2018
$9,750
$6,550
Represents an approximate range of expected gross margin, taking
into account hedges in place, between the 5th and 95th percent confidence levels assuming all unhedged supply is sold into the spot market; Approximate gross margin ranges are based upon an internal simulation model and are subject to
change based upon market inputs, future transactions and potential modeling changes; These ranges of approximate gross margin in 2017 and 2018 do not represent earnings guidance
or a forecast of future results as Exelon has not completed its planning or optimization processes for those years; The price distributions that generate this range are calibrated to
market quotes for power, fuel, load following products, and options as of December 31, 2015 |
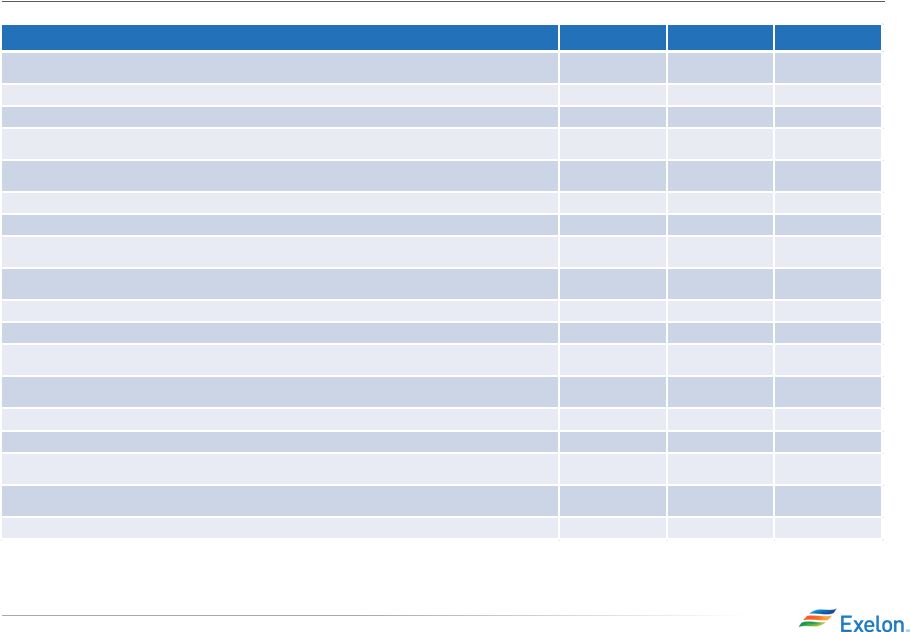
 19 Q4 2015 Earnings Release Slides Illustrative Example of Modeling Exelon
Generation 2017 Gross Margin (1) Mark-to-market rounded to the nearest $5 million (2) Total Gross Margin (Non-GAAP) is defined as operating revenues less purchased power and fuel expense, excluding
revenue related to decommissioning, gross receipts tax, Exelon Nuclear Row Item Midwest Mid-Atlantic ERCOT New York New England South, West & Canada (A) Start with fleet-wide open gross margin (B) Expected Generation (TWh) 96.4 61.6 26.5 9.2 12.8 (C) Hedge % (assuming mid-point of range) 56.5% 65.5% 68.5% 72.5% 50.5% (D=B*C) Hedged Volume (TWh) 54.5 40.3 18.2 6.7 6.5 (E) Effective Realized Energy Price ($/MWh) $33.50 $46.00 $8.00 $44.50 $14.50 (F) Reference Price ($/MWh) $29.23 $35.22 $4.66 $34.52 $11.32 (G=E-F) Difference ($/MWh) $4.27 $10.78 $3.34 $9.98 $3.18 (H=D*G) Mark-to-market value of hedges ($ million)
$235
$435
$60
$65
$20
(I=A+H)
Hedged Gross Margin ($ million)
(J)
Power New Business / To Go ($ million)
(K)
Non-Power Margins Executed ($ million)
(L)
Non-Power New Business / To Go ($ million)
(N=I+J+K+L)
Total Gross Margin
$150
$300
$7,850 million
$5.8 billion
$6,600
$800
Partners operating services agreement with Fort Calhoun and
variable interest entities. Total Gross Margin is also net of direct cost of sales for certain Constellation businesses. See Slide 29 for a Non-GAAP to GAAP reconciliation of Total Gross Margin.
(1)
(2) |
 20 Q4 2015 Earnings Release Slides Additional Disclosures |
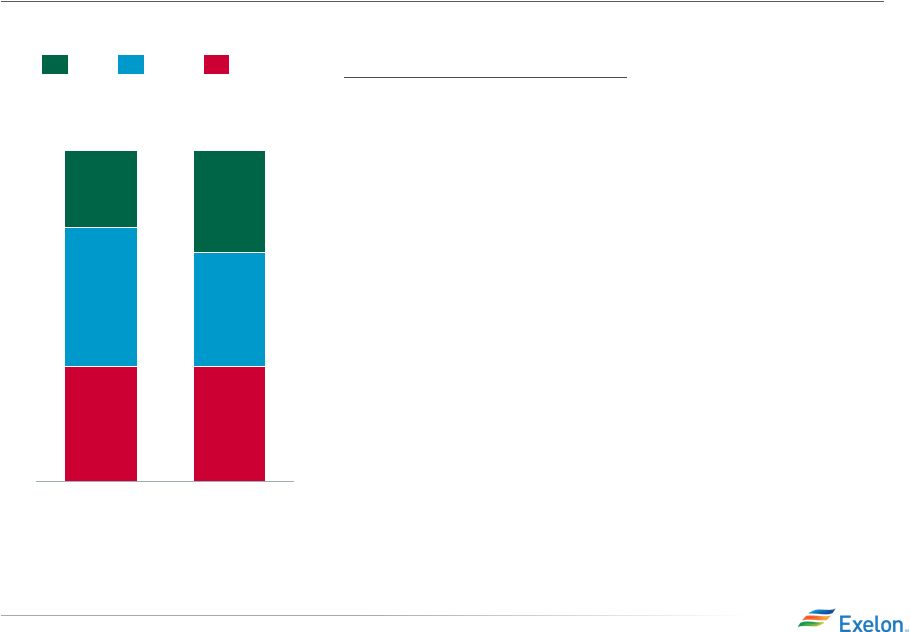 21 Q4 2015 Earnings Release Slides Exelon Utilities Adjusted Operating EPS Contribution (1) Key Drivers – 4Q15 (2) vs. 4Q14 : BGE (+0.02): • Increased revenues due to increased distribution rates and
transmission earnings: $0.02
PECO (-0.02): • Unfavorable weather (RNF): $(0.03) • Decreased uncollectible accounts expense: $0.01 ComEd (+0.00): • Unfavorable weather and volume (3) : $(0.02) • Increased distribution (3) and transmission earnings due to increased capital investments: $0.02 4Q 2015 $0.26 $0.09 $0.09 $0.08 4Q 2014 $0.26 $0.09 $0.11 $0.06 BGE ComEd Numbers may not add due to rounding. (1) (2) (3) PECO Refer to the Earnings Release Attachments for additional details and to the Appendix for a reconciliation of adjusted
(non-GAAP) operating EPS to GAAP EPS. There is a $(0.01) share differential impact
spread across the utilities in Q4 2015. Due to the distribution formula rate, changes in
ComEd’s earnings are driven primarily by changes in 30-year U.S. Treasury rates (inclusive of ROE), rate base and capital structure in addition to weather, load and changes in customer mix.
|
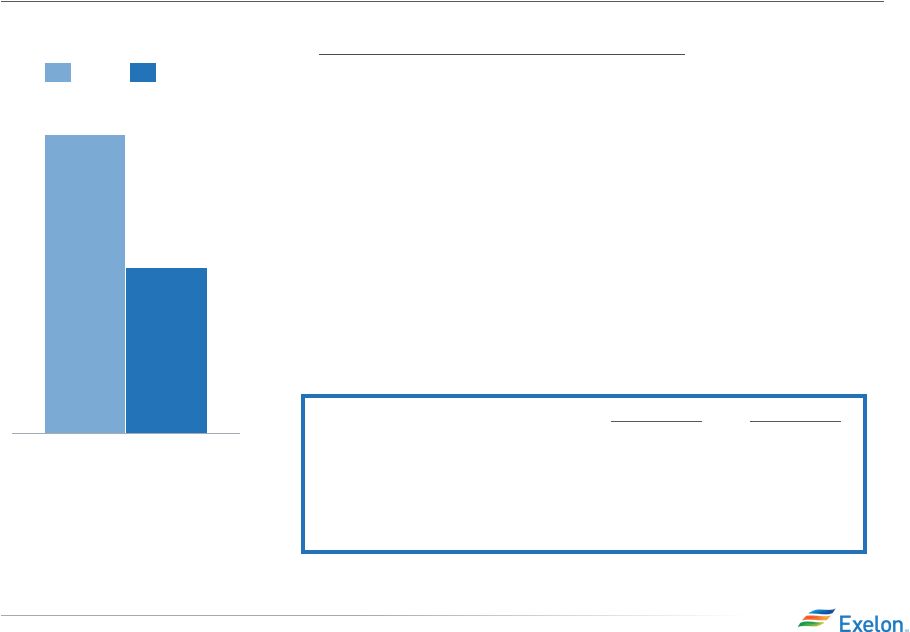 22 Q4 2015 Earnings Release Slides ExGen Adjusted Operating EPS Contribution (1) $0.15 Q4 $0.27 2015 2014 Numbers may not add due to rounding (1) (excludes Salem) Q4 2014 Actual Q4 2015 Actual Planned Refueling Outage Days 97 103 Non-refueling Outage Days 8 21 Nuclear Capacity Factor 94.8% 93.3% Key Drivers – Q4 2015 vs. Q4 2014 ExGen (-0.12): • Increased costs primarily due to timing of nuclear projects: $(0.03)
• Unfavorable impact associated with nuclear refueling outages:
$(0.05)
• Higher depreciation costs primarily due to increased nuclear
decommissioning amortization and ongoing capital expenditures:
$(0.02)
• Favorable settlement of certain state income tax positions: $0.04
• Other: $(0.04) • Share differential: $(0.02) Refer to the Earnings Release Attachments for additional details and to the Appendix for a reconciliation of adjusted
(non-GAAP) operating EPS to GAAP EPS. |
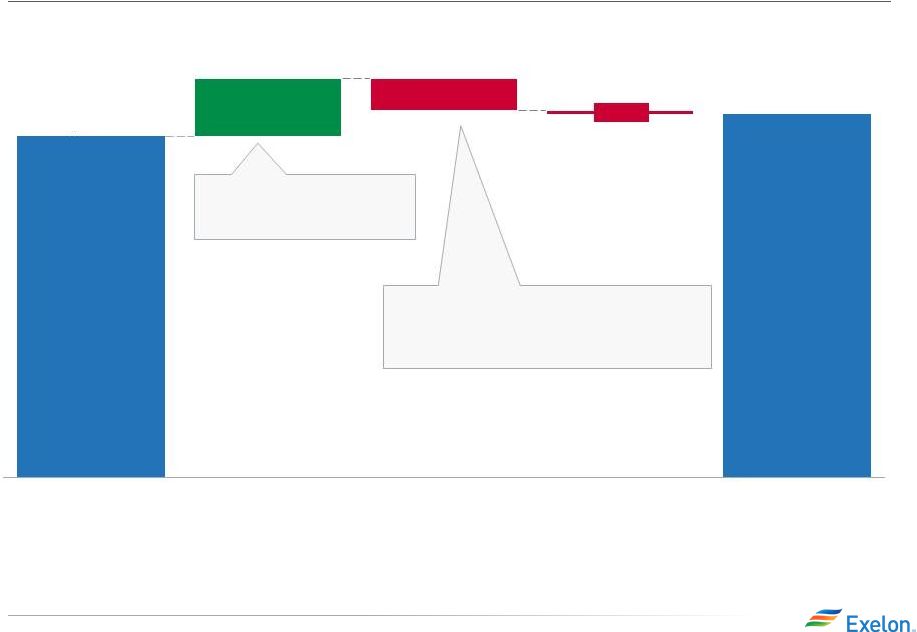
 23 Q4 2015 Earnings Release Slides 2016 (4)(5) $0.50 - $0.60 Other ($0.02) ($0.01) Depreciation & Amortization ($0.05) O&M (3) $0.01 RNF (2) 2015 (1) ComEd Adjusted Operating EPS Bridge 2015 to 2016 Note: Drivers add up to mid-point of 2016 adjusted operating EPS range
(1) Refer to the Earnings Release Attachments for additional
details and to the Appendix for a reconciliation of adjusted (non-GAAP) operating EPS to GAAP EPS. (2) Revenue net fuel (RNF) is defined as operating revenues less purchased power and fuel expense.
(3) O&M excludes regulatory items that are P&L
neutral. (4) Shares Outstanding (diluted) are 893M
in 2015 and 890M in 2016. Refer to slide 38 for a reconciliation of adjusted (non-GAAP) operating EPS guidance to GAAP EPS. (5) Guidance assumes an effective tax rate for 2016 of 39.6%.
Interest $0.07 Distribution $0.06 Transmission $0.01 Weather $0.01 Pension/OPEB $0.01 Storm Costs ($0.01) Inflation $0.14 $0.48 |
 24 Q4 2015 Earnings Release Slides 2016 (4)(5) $0.40 - $0.50 Other ($0.01) O&M (3) ($0.04) RNF (2) PECO Adjusted Operating EPS Bridge 2015 to 2016 Note: Drivers add up to mid-point of 2016 adjusted operating EPS range
(1) Refer to the Earnings Release Attachments for additional
details and to the Appendix for a reconciliation of adjusted (non-GAAP) operating EPS to GAAP EPS. (2) Revenue net fuel (RNF) is defined as operating revenues less purchased power and fuel expense.
(3) O&M excludes regulatory items that are P&L
neutral. (4) Shares Outstanding (diluted) are 893M
in 2015 and 890M in 2016. Refer to slide 38 for a reconciliation of adjusted (non-GAAP) operating EPS guidance to GAAP EPS. (5) Guidance assumes an effective tax rate for 2016 of 26.9%.
2015 (1) $0.08 Electric Distribution Rate Case ($0.01) Weather ($0.01) Weather Normal RNF ($0.02) Weather Related (Storm ($0.01, Bad Debt ($0.01))
($0.01) Rate Case Related (Veg. Mgmt. & Cap
Settlement) ($0.01)
Inflation $0.07
$0.43 |
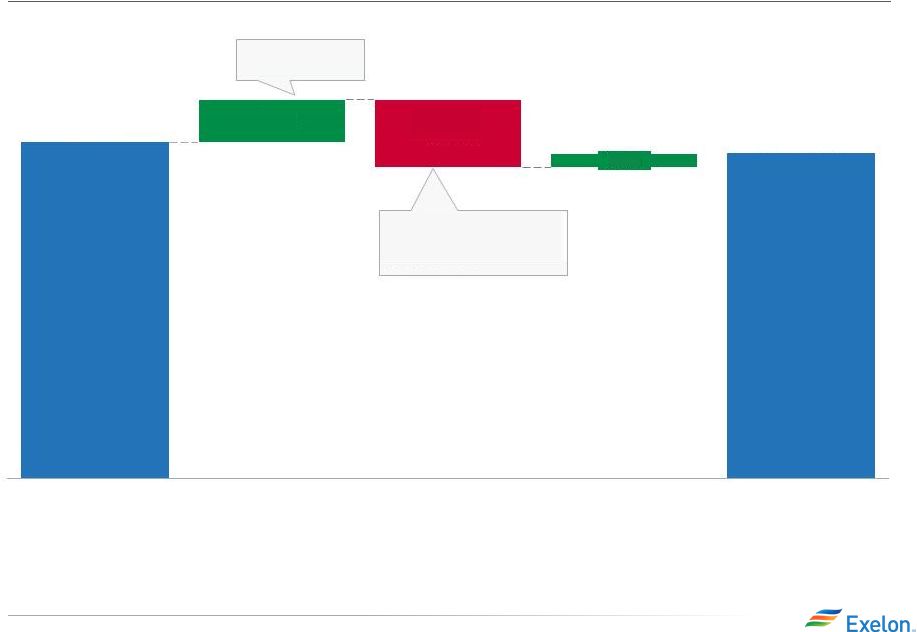 25 Q4 2015 Earnings Release Slides O&M (3) $0.01 RNF (2) 2015 (1) 2016 (4)(5) $0.25 - $0.35 Other BGE Adjusted Operating EPS Bridge 2015 to 2016 ($0.02) Storm Costs ($0.02) Bad Debt ($0.02) Baltimore City Conduit Fee $0.02 Pricing/Mix $0.02 Transmission Note: Drivers add up to mid-point of 2016 adjusted operating EPS range.
(1) Refer to the Earnings Release Attachments for additional
details and to the Appendix for a reconciliation of adjusted (non-GAAP) operating EPS to GAAP EPS. (2) Revenue net fuel (RNF) is defined as operating revenues less purchased power and fuel expense.
(3) O&M excludes regulatory items that are P&L
neutral. (4) Shares Outstanding (diluted) are 893M
in 2015 and 890M in 2016. Refer to slide 38 for a reconciliation of adjusted (non-GAAP) operating EPS guidance to GAAP EPS. (5) Guidance assumes an effective tax rate for 2016 of 39.5%.
$0.04 $(0.06) $0.31 |
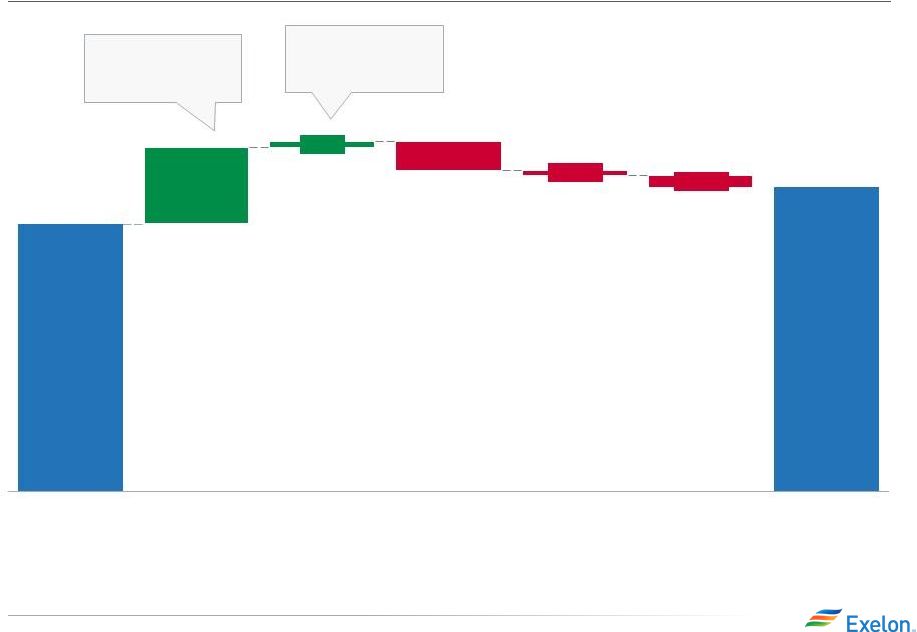
 26 Q4 2015 Earnings Release Slides $1.25 - $1.35 2016 (5)(6) 2015 (1) ($0.04) Gross Margin (2) O&M (3) ($0.09) Other Depreciation & Amortization (4) ($0.08) ExGen Adjusted Operating EPS Bridge 2015 to 2016 Note: Drivers add up to mid-point of 2016 adjusted operating EPS range.
(1)
Refer
to
the
Earnings
Release
Attachments
for
additional
details
and
to
the
Appendix
for
a
reconciliation
of
adjusted
(non-GAAP)
operating
EPS
to
GAAP
EPS.
(2)
Gross Margin (Non-GAAP) is defined as operating revenues
less purchased power and fuel expense, excluding revenue related to decommissioning, gross receipts tax, Exelon Nuclear Partners, operating services agreement with Fort Calhoun and variable interest entities. Total Gross Margin is also net of direct cost of sales for
certain Constellation businesses. See Slide 29 for a Non-GAAP to GAAP reconciliation of Total Gross Margin. (3) O&M excludes items that are P&L neutral (including decommissioning costs and variable interest entities) and
direct cost of sales for certain Constellation businesses. (4) Depreciation & Amortization excludes cost of sales for certain Constellation businesses, which are included in gross
margin (5)
Shares Outstanding (diluted) are 893M in 2015 and 890M in
2016. Refer to slide 38 for a reconciliation of adjusted (non-GAAP) operating EPS guidance to GAAP EPS. (6) Guidance assumes an effective tax rate for 2016 of 34%. ($0.13) Normalized load optimization in 2016 $0.05 Unplanned Generation Outages $0.02 Capacity Revenues $0.02 Higher Load Volumes ($0.06) Capital placed in service ($0.03) Decom Asset Retirement Cost Depreciation $0.06 Employee Benefit Costs $0.06 Cost Management Savings $0.05 Nuclear outages (2 less in 2016) $0.02 Pension/OPEB ($0.07) Inflation ($0.02) Decom Asset Retirement Obligation ($0.05) Decrease in DPAD and the absence of favorable state settlements partially offset by an increase in tax credits ($0.04) Decom, primarily unregulated realized gains ($0.01) Interest $0.02 Other $0.11 $1.40 |
 27 Q4 2015 Earnings Release Slides 2016 Projected Sources and Uses of Cash (1) All amounts rounded to the nearest $25M. Figures may not add due to rounding. (2) Excludes counterparty collateral activity. (3) Adjusted Cash Flow from Operations (non-GAAP) primarily includes net cash flows from operating activities and net cash flows from investing activities excluding capital expenditures. (4) Figures reflect cash CapEx and CENG fleet at 100% (5) Other Financing primarily includes expected changes in short-term debt and tax sharing from the parent. (6) Acquisitions and Divestitures and Equity Investments previously captured in Adjusted Cash Flow from Operations (7) Dividends are subject to declaration by the Board of Directors. (8) Includes cash flow activity from Holding Company, eliminations, and other corporate entities. Consistent and reliable free cash flows Enable growth & value creation Supported by a strong balance sheet Strong balance sheet enables flexibility to raise and deploy capital for growth Exelon intends to return capital to shareholders and bondholders, if the merger is not approved Operational excellence and financial discipline drives free cash flow reliability Generating ~$3.7B of free cash flow in 2016, including $1.3B at ExGen and $2.9B at the Utilities Creating value for customers, communities and shareholders Investing $5.3B, with $4.0B at the Utilities and $1.3B at ExGen ($ in millions) (1) BGE ComEd PECO Total Utilities ExGen Corp (8) Exelon 2016E Cash Balance Beginning Cash Balance (2) 7,750 Adjusted Cash Flow from Operations (2,3) 650 1,575 700 2,925 3,725 (425) 6,225 Base CapEx and Nuclear Fuel (4) 0 0 0 0 (2,475) (100) (2,550) Free Cash Flow 650 1,575 700 2,925 1,250 (525) 3,650 Debt Issuances 750 950 450 2,150 0 0 2,150 Debt Retirements (300) (675) (300) (1,275) 0 (1,875) (3,150) Project Financing n/a n/a n/a n/a 100 n/a 100 Equity Buyback 0 0 0 0 0 (1,600) (1,600) Contribution from Parent 0 475 0 475 0 (475) 0 Other Financing (5) (75) 450 25 400 0 1,075 1,475 Financing 375 1,200 175 1,750 100 (2,875) (1,025) Total Free Cash Flow and Financing Growth 1,025 2,775 850 4,675 1,375 (3,400) 2,625 Utility Investment (825) (2,425) (675) (3,950) 0 0 (3,950) ExGen Growth (4) 0 0 0 0 (1,325) 0 (1,325) Acquisitions and Divestitures (6) 0 0 0 0 0 0 0 Equity Investments (6) 0 0 0 0 (125) 0 (125) Dividend (7) 0 0 0 0 0 (1,150) (1,150) Other CapEx and Dividend (825) (2,425) (675) (3,950) (1,450) (1,150) (6,550) Total Cash Flow, excl. Collateral 200 350 175 725 (100) (4,550) (3,900) Ending Cash Balance (2) 3,850 |
 28 Q4 2015 Earnings Release Slides Pension and OPEB Contributions and Expense (1) Pension and OPEB expenses assume a ~26% and ~28% capitalization rate in 2015 and 2016,
respectively (2)
The Balanced Funding Strategy for the Qualified Plans provides
pension funding of the greater of $250M or minimum required contributions plus amounts required to avoid benefit restrictions and at-risk status (3) Expected return on assets for pension is 7.00% and for OPEB is 6.70% for 2016
(4)
Pension and OPEB discount rates are 4.29% for the majority of
plans at 12/31/15 2015
2016
(in $M)
Pre-Tax
Expense
(1)
Contributions
Pre-Tax
Expense
(1)
Contributions
(2)
Qualified
Pension
(3)(4)
$425
$450
$370
$250
Non-Qualified
Pension
15
15
15
20
OPEB
(3)(4)
30
40
5
35
Total
$470
$505
$390
$305 |
 29 Q4 2015 Earnings Release Slides Additional ExGen Modeling Data Total Gross Margin Reconciliation (in $M) (1) 2016 2017 2018 $8,475 $8,475 $8,525 Other Revenues (4) $(325) $(325) $(325) Direct cost of sales incurred to generate revenues for certain
Constellation businesses
(5)
$(350)
$(300)
$(300)
Total Gross Margin (Non-GAAP, as shown on slide
11) $7,800
$7,850
$7,900
(1)
All amounts rounded to the nearest $25M
(2)
Revenue net of purchased power and fuel expense (RNF), a
non-GAAP measure, is calculated as the GAAP measure of operating revenue less the GAAP measure of purchased power and fuel expense. ExGen does not forecast the GAAP components of RNF separately. RNF also includes the RNF of our proportionate ownership
share of CENG. (3)
Excludes the mark-to-market impact of economic hedging
activities due to the volatility and unpredictability of the future changes to power prices. (4) Other revenues reflects revenues from operating services agreement with Fort Calhoun, variable interest entities, funds
collected through revenues for decommissioning the former PECO nuclear plants through regulated rates and gross receipts tax revenues.
(5)
Reflects the cost of sales and depreciation expense of certain
Constellation businesses of Generation.
(6)
ExGen
amounts for O&M, TOTI, Depreciation & Amortization;
excludes EDF’s equity ownership share of the CENG Joint Venture. (7) to the Appendix for a reconciliation of adjusted (non-GAAP) O&M to GAAP O&M
(8)
TOTI excludes gross receipts tax of $125M
(9)
Depreciation & Amortization excludes the cost of sales
impact of ExGen’s non-power businesses of $25M Key ExGen Modeling Inputs (in $M) (1)(6) 2016 Other Revenues (excluding Gross Receipts Tax) (4) $200 O&M (7) $(4,475) Taxes Other Than Income (TOTI) (8) $(350) Depreciation & Amortization (9) $(1,075) Interest Expense $(375) Effective Tax Rate 34.0% ExGen adjusted O&M excludes direct cost of sales for certain Constellation business, P&L neutral decommissioning
costs and the impact from O&M related to variable interest entities. Refer Revenue Net of Purchased Power and Fuel Expense (2)(3) |
 30 Q4 2015 Earnings Release Slides BGE Exelon Utilities Load PECO Large C&I Small C&I Residential All Customers ComEd 2016E 2015 2016 load is driven by impacts of energy efficiency partially offset by slowly improving economy that result in 2016 usage being lower than 2015 Chicago GMP 2.3% Chicago Unemployment 5.8% 2016 load growth is greater than 2015, attributed to improving economic conditions and moderate customer growth, partially offset by energy efficiency Baltimore GMP 2.4% Baltimore Unemployment 5.3% 2016 load growth is driven by slowly improving economic conditions coupled with solid residential customer growth, partially offset by energy efficiency Philadelphia GMP 1.4% Philadelphia Unemployment 5.3% 2015 2016E 2015 1.1% 2016E (0.3%) (1.4%) (0.8%) (1.5%) 0.1% (0.9%) (0.4%) (2.0%) 0.4% (0.1%) (0.2%) 0.3% (0.3%) 0.6% 1.3% (0.5%) 0.7% 1.5% 1.0% 1.1% 0.7% 2.0% 0.5% Notes: Data is weather normalized and not adjusted for leap year. Source of economic outlook data is IHS (December
2015). Assumes 2015 GDP of 2.5% and U.S. unemployment of 5.0%. ComEd has the ROE collar as part of the distribution formula rate and BGE is decoupled which mitigates the load risk. QTD
and YTD actual data can be found in earnings release tables. BGE amounts have been adjusted for prior quarter true-ups.
|
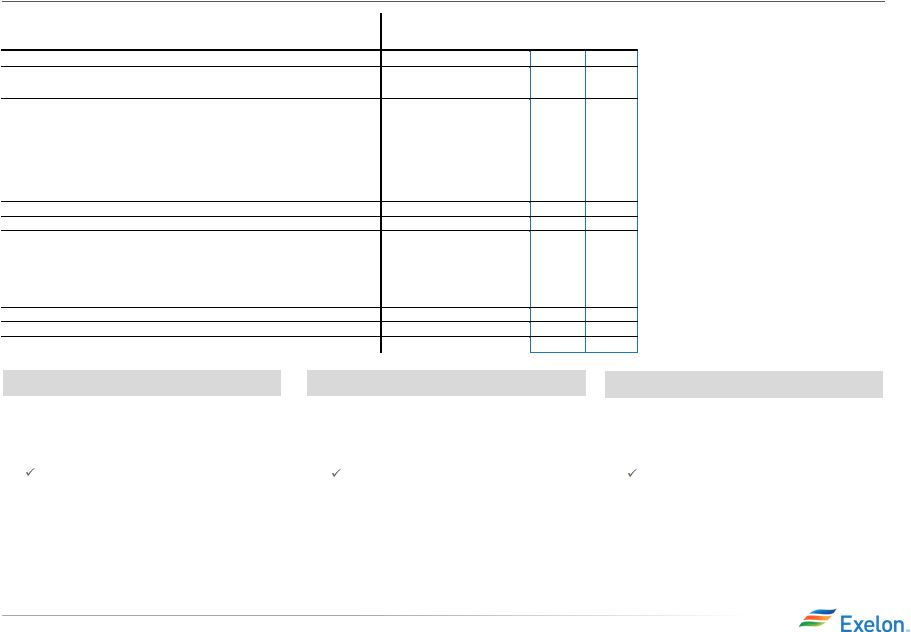
 31 Q4 2015 Earnings Release Slides ComEd April 2015 Distribution Formula Rate Docket # 15-0287 Filing Year Reconciliation Year Common Equity Ratio ROE Requested Rate of Return ~ 7% for both the filing and reconciliation
years Rate Base
$8,277 million–
Filing year (represents projected year-end rate base using
2014 actual plus 2015 projected capital
additions). 2015 and 2016 earnings will reflect
2015 and 2016 year-end rate base respectively.
$7,082 million -
Reconciliation year (represents
year-end rate base for 2014)
Revenue Requirement
Decrease
$67M decrease ($152M decrease due to the 2014 reconciliation offset by a $85M increase related to the filing year). The 2014 reconciliation impact on net income was recorded in 2014 as a regulatory asset.
Timeline
• 04/15/15 Filing Date • 240 Day Proceeding The 2015 distribution formula rate filing established the net revenue requirement used to set the rates that took effect
in January 2016 after the Illinois Commerce
Commission's (ICC’s) review. There are two components to the annual distribution formula rate filing: • Filing Year: Based on 2014 costs and 2015 projected plant additions.
• Annual Reconciliation: For 2014, this amount reconciles the revenue requirement reflected in rates in effect during 2014
to the actual costs for 2014 Calendar Year Actual
Costs and 2015 Projected Net Plant Additions are used to set the rates for calendar year 2016. Rates currently in effect (docket 14-0312) for calendar year 2015 were based on 2013 actual costs and 2014
projected net plant additions
Reconciles Revenue Requirement reflected in rates during 2014
to 2014 Actual Costs Incurred. Revenue requirement 2013 and reflects the impacts of PA 98-0015 (SB9) ~ 46% for both the filing and reconciliation
year 9.14% for the filing year (2014 30-yr Treasury Yield of 3.34% + 580 basis
point risk premium) and 9.09% for the reconciliation year (2014 30-yr Treasury Yield of 3.34% + 580 basis point risk premium 5 basis
points performance metrics penalty). For
2015 and 2016, the actual allowed ROE reflected in net income will ultimately be based on the average of the 30-year Treasury Yield during the respective years plus 580 basis point spread, absent any metric
penalties –
for 2014 is based on docket 13-0318 (2012 actual costs and
2013 projected net plant additions) approved in December Given the retroactive ratemaking provision in the Energy Infrastructure Modernization Act (EIMA) legislation, ComEd net
income during the year will be based on actual
costs with a regulatory asset/liability recorded to reflect any under/over recovery reflected in rates. Revenue Requirement in rate filings impacts cash flow. that year. The annual reconciliation impacts cash flow in 2016 but the earnings impact has been recorded in 2014 as a
regulatory asset. |
 32 Q4 2015 Earnings Release Slides PECO Electric Distribution Rate Case & Settlement Docket # R-2015-2468981 Test Year 2016 Calendar Year Requested Revenue Requirement $190M Requested Common Equity Ratio (1) 53.36% Requested Rate of Return ROE: 10.95%; ROR: 8.19% Proposed Rate Base $4.1B $127M Authorized Returns (2) N/A System Average Increase as % of overall bill 2.9% Timeline • 3/27/15 – PECO filed electric distribution rate case with PaPUC • 12/17/15 – PaPUC Final Order • Increased rates effective on January 1, 2016 The Revenue Requirement increase of $127M represents 67% of the Company’s
original proposal
(1)
Reflects PECO’s expected capital structure as of
12/31/2016 (2)
Due to the “black box” nature of the settlement,
Authorized Return was not agreed upon by the parties in determining the ultimate revenue requirement increase. Revenue Requirement Settlement Increase |
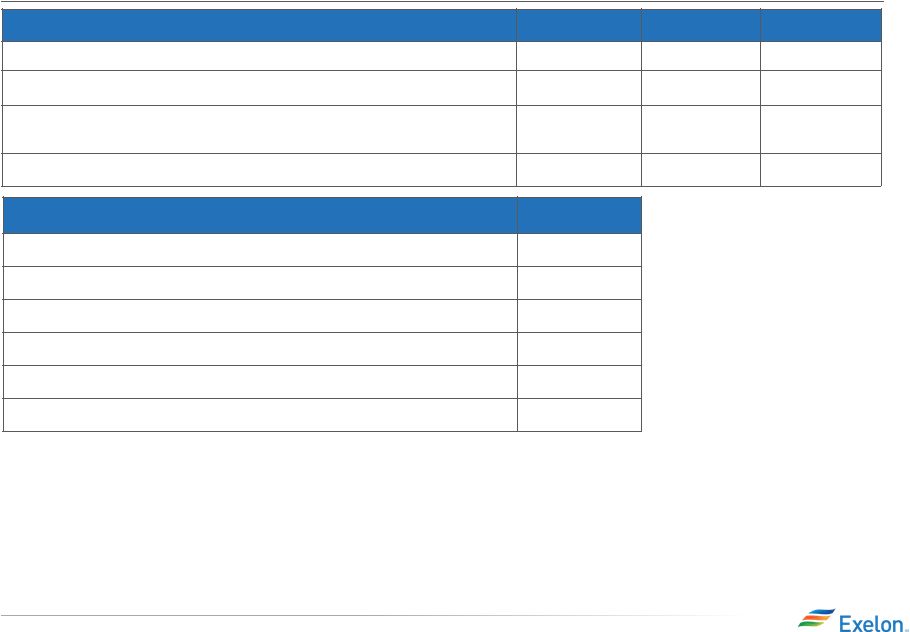
 33 Q4 2015 Earnings Release Slides Electric Gas Docket # 9406 Test Year December 2014- November 2015 Common Equity Ratio (1) 53.7% Requested ROE 10.60% 10.50% Requested Rate of Return 7.95% 7.90% Rate Base (adjusted) $3.0B $1.2B Revenue Requirement Increase (1) $120.9M $79.5M Proposed Distribution Increase as % of overall bill 3.2% 8.8% Notes • 11/06/15 BGE filed application with the MDPSC seeking increases in electric & gas
distribution base rates
• $140M or ~70% of the total $200M distribution rate increase is for recovery of Smart Grid
investment
• Requested incremental conduit fees of $31M be recovered through a rider
• 210 Day Proceeding • 06/03/2016 - PSC order expected • New rates are in effect shortly after the final order (1) Based on the 12 months ended 11/30/2015. BGE Electric and Gas Distribution Rate Case |
 34 Q4 2015 Earnings Release Slides Appendix Reconciliation of Non-GAAP Measures |
 35 Q4 2015 Earnings Release Slides 4Q GAAP EPS Reconciliation Three Months Ended December 31, 2015 ExGen ComEd PECO BGE Other Exelon 2015 Adjusted (non-GAAP) Operating Earnings (Loss) Per Share
$0.15
$0.09
$0.09
$0.08
$(0.04)
$0.38
Unrealized gains related to NDT fund investments
0.05
-
-
-
-
0.05
Merger and integration costs
-
-
-
-
(0.01)
(0.01)
Amortization of commodity contract intangibles
(0.01)
-
-
-
-
(0.01)
Long-Lived asset impairments
(0.01)
-
-
-
-
(0.01)
Reassessment of state deferred income taxes
(0.01)
-
-
-
(0.03)
(0.05)
Reduction in state income tax reserve
0.01
-
-
-
-
0.01
PHI merger related redeemable debt exchange
-
-
-
-
(0.01)
(0.01)
CENG non-controlling interest
(0.02)
-
-
-
-
(0.02)
4Q 2015 GAAP Earnings (Loss) Per Share
$0.17
$0.09
$0.09
$0.08
$(0.09)
$0.33
NOTE: All amounts shown are per Exelon share and represent
contributions to Exelon's EPS. Amounts may not add due to rounding. Three Months Ended December 31, 2014 ExGen ComEd PECO BGE Other Exelon 2014 Adjusted (non-GAAP) Operating Earnings (Loss) Per Share
$0.27
$0.09
$0.11
$0.06
$(0.04)
$0.48
Mark-to-market impact of economic hedging
activities (0.08)
-
-
-
-
(0.08)
Unrealized gains related to NDT fund investments
0.03
-
-
-
-
0.03
Merger and integration costs
(0.01)
-
-
-
(0.02)
(0.03)
Mark-to-market impact of PHI merger related
interest rate swaps -
-
-
-
(0.06)
(0.06)
Reassessment of state deferred income taxes
0.04
-
-
-
(0.01)
0.03
Amortization of commodity contract intangibles
(0.03)
-
-
-
-
(0.03)
Plant retirements and divestitures
0.06
-
-
-
-
0.06
Long-Lived asset impairments
(0.39)
-
-
-
-
(0.39)
Bargain-Purchase gain
0.03
-
-
-
-
0.03
Tax settlements
0.01
-
-
-
-
0.01
CENG non-controlling interest
(0.03)
-
-
-
-
(0.03)
4Q 2014 GAAP Earnings (Loss) Per Share
($0.11)
$0.09
$0.11
$0.06
$(0.13)
$0.02 |
 36 Q4 2015 Earnings Release Slides 4Q YTD GAAP EPS Reconciliation Year Ended December 31, 2014 ExGen ComEd PECO BGE Other Exelon 2014 Adjusted (non-GAAP) Operating Earnings (Loss) Per Share
$1.34
$0.47
$0.41
$0.23
$(0.06)
$2.39
Mark-to-market impact of economic hedging
activities (0.42)
-
-
-
-
(0.42)
Unrealized gains related to NDT fund investments
0.10
-
-
-
-
0.10
Asset retirement obligation
0.02
-
-
-
-
0.02
Plant retirements and divestitures
0.28
-
-
-
-
0.28
Long-Lived asset impairment
(0.49)
-
-
-
(0.02)
(0.50)
Gain on CENG integration
0.18
-
-
-
-
0.18
Merger and integration costs
(0.10)
-
-
-
(0.04)
(0.14)
Mark-to-market impact of PHI merger related interest
swaps -
-
-
-
(0.07)
(0.07)
Amortization of commodity contract intangibles
(0.07)
-
-
-
-
(0.07)
Tax settlements
0.12
-
-
-
-
0.12
Reassessment of state deferred income taxes
0.04
-
-
-
(0.01)
0.03
Bargain-Purchase gain
0.03
-
-
-
-
0.03
CENG non-controlling interest
(0.07)
-
-
-
-
(0.07)
4Q 2014 GAAP Earnings Per Share
$0.97
$0.47
$0.41
$0.23
($0.20)
$1.88
NOTE: All amounts shown are per Exelon share and represent
contributions to Exelon's EPS. Amounts may not add due to rounding. |
 37 Q4 2015 Earnings Release Slides 4Q YTD GAAP EPS Reconciliation (continued) NOTE: All amounts shown are per Exelon share and represent contributions to Exelon's EPS. Amounts may not add
due to rounding. Year Ended December 31,
2015 ExGen
ComEd
PECO
BGE
Other
Exelon
2015 Adjusted (non-GAAP) Operating Earnings (Loss) Per
Share $1.40
$0.48
$0.43
$0.31
$(0.13)
$2.49
Mark-to-market impact of economic hedging
activities 0.18
-
-
-
-
0.18
Unrealized losses related to NDT fund investments
(0.13)
-
-
-
-
(0.13)
Merger and integration costs
(0.02)
(0.01)
-
-
(0.03)
(0.07)
Mark-to-market impact of PHI merger related interest
rate swaps -
-
-
-
(0.02)
(0.02)
Long-lived asset impairment
(0.01)
-
-
-
(0.02)
(0.02)
Asset retirement obligation
0.01
-
-
-
-
0.01
Tax settlements
0.06
-
-
-
-
0.06
Midwest generation bankruptcy recoveries
0.01
-
-
-
-
0.01
PHI merger related redeemable debt exchange
-
-
-
-
(0.01)
(0.01)
Reassessment of state deferred income taxes
(0.01)
-
-
-
(0.03)
(0.05)
Reduction in state income tax reserve
0.01
-
-
-
-
0.01
CENG non-controlling interest
0.04
-
-
-
-
0.04
4Q 2015 GAAP Earnings (Loss) Per Share
$1.54
$0.48
$0.42
$0.31
$(0.20)
$2.54 |
 38 Q4 2015 Earnings Release Slides GAAP to Operating Adjustments NOTE: All amounts shown are per Exelon share and represent contributions to Exelon's EPS. Amounts may not add
due to rounding. •
Exelon’s 2016 adjusted (non-GAAP) operating earnings
excludes the earnings effects of the following: –
Mark-to-market adjustments from economic hedging
activities –
Unrealized gains and losses from NDT fund investments to the
extent not offset by contractual accounting as
described in the notes to the consolidated financial statements
– Certain costs incurred associated with the pending Pepco Holdings, Inc. acquisitions
– Non-cash amortization of intangible assets, net, related to commodity contracts recorded at fair value at
the
date
of
acquisition
of
Integrys
in
2014
– Generation’s non-controlling interest related to CENG exclusion items
– Other unusual items |
 39 Q4 2015 Earnings Release Slides Adjusted O&M Reconciliations to GAAP 2015 Adjusted O&M Reconciliation (in $M) (3) ExGen ComEd PECO BGE Other Exelon GAAP O&M $5,300 $1,575 $800 $675 $(25) $8,325 PHI Acquisition Costs (25) - - - (25) (50) Long-Lived Asset Impairment - - - - (25) (25) Regulatory O&M (1) - (275) (125) - - (400) Decommissioning (1) 50 - - - - 50 Direct cost of sales incurred to generate revenues for certain Constellation businesses (2) (250) - - - - (250) O&M for managed plants that are partially owned (425) - - - - (425) Other 25 - - - - 25 Adjusted O&M (Non-GAAP, as shown on slide 10) $4,675 $1,300 $675 $675 $(75) $7,250 (1) Reflects P&L neutral O&M. (2) Reflects the direct cost of sales of certain Constellation businesses of Generation, which are included in Total Gross
Margin. (3)
All amounts rounded to the nearest $25M.
|
 40 Q4 2015 Earnings Release Slides Adjusted O&M Reconciliations to GAAP 2016 Adjusted O&M Reconciliation (in $M) (3) ExGen ComEd PECO BGE Other Exelon GAAP O&M $5,175 $1,600 $875 $750 $(100) $8,300 Regulatory O&M (1) - (300) (100) - - (400) Decommissioning (1) 50 - - - - 50 Direct cost of sales incurred to generate revenues for certain
Constellation
businesses
(2)
(300)
-
-
-
-
(300)
O&M for managed plants that are partially owned
(400)
-
-
-
-
(400)
Other
(50)
(25)
-
-
-
(75)
Adjusted O&M (Non-GAAP, as shown on slide
10) $4,475
$1,275
$775
$750
$(100)
$7,175
(1)
Reflects P&L neutral O&M.
(2)
Reflects the direct cost of sales of certain Constellation
businesses of Generation, which are included in Total Gross Margin. (3) All amounts rounded to the nearest $25M. |