Attached files
| file | filename |
|---|---|
| 8-K - HANCOCK WHITNEY CORP | hbhc4q158-k.htm |
Exhibit 99.1

For Immediate Release
January 21, 2016
For More Information
Trisha Voltz Carlson
SVP, Investor Relations Manager
504.299.5208
trisha.carlson@hancockbank.com
Hancock reports fourth quarter 2015 financial results
Previously announced increase in energy allowance included in quarterly results
Highlights of the company's fourth quarter 2015 results (compared to third quarter 2015):
|
●
|
Increased the allowance for loan losses within the energy portfolio by $43 million
|
|
●
|
Allowance for energy loans now $78.2 million or 4.95% of energy loans, up from 2.12%
|
|
●
|
Loans increased $940 million, or 25% (annualized)
|
|
●
|
Deposits increased $909 million, or 21% (annualized)
|
|
●
|
Core revenue increased $2.8 million
|
GULFPORT, Miss. (January 21, 2016) — Hancock Holding Company (Nasdaq: HBHC) today announced its financial results for the fourth quarter of 2015. Net income for the fourth quarter of 2015 was $15.3 million, or $.19 per diluted common share, compared to $41.2 million, or $.52 in the third quarter of 2015 and $40.1 million, or $.48, in the fourth quarter of 2014. The linked-quarter decline in earnings was mainly related to the previously announced $43 million (pre-tax), or $.35 per diluted share, increase in the energy allowance. The year-over-year decline in earnings was mainly related to a decrease in purchase accounting income of approximately $9.1 million (pre-tax), and the increase in the energy allowance noted above. Pre-tax, pre-provision earnings were $66.3 million for the fourth quarter of 2015.
"The depth and duration of the current energy cycle continued to deepen and lengthen from original expectations," said President and CEO John M. Hairston. "The action we took in the fourth quarter to increase our allowance for energy was a proactive move on our part to address this change in market conditions. However, while earnings were impacted this quarter, our capital remained solid and we remain focused on achieving our strategic goals. Outside of energy we continued to grow the balance sheet organically and added over $1.2 billion in total assets. While expenses were slightly higher than expected, they were for the most part directed at revenue-generating initiatives as we continue diminishing our concentration in energy-related revenue. As we begin 2016 we are focused on a goal of 25% growth in core pre-tax, pre-provision earnings compared to 2014, and will accomplish this through continued growth in core revenue, controlling expenses and managing through the challenges of today's energy cycle."
1
Hancock reports fourth quarter 2015 financial results
January 21, 2016
Loans
Total loans at December 31, 2015 were $15.7 billion, up $940 million, or 6%, from September 30, 2015. All regions across the footprint reported net loan growth during the quarter, with growth also noted in various business lines such as equipment finance, private banking, indirect, and mortgage.
At December 31, 2015, loans in the energy segment totaled $1.58 billion, or 10% of total loans. The energy portfolio declined approximately $80 million linked-quarter and is comprised of credits to both the E&P industry and support industries. Additional details of the energy portfolio are included in the presentation slides posted on our Investor Relations website.
During the fourth quarter of 2015, the company completed the transaction announced on October 6, 2015 to acquire a healthcare portfolio in Nashville, Tennessee, and added $184.6 million in healthcare loans to the balance sheet.
Average loans totaled $15.2 billion for the fourth quarter of 2015, up $687 million, or 5%, linked-quarter.
Deposits
Total deposits at December 31, 2015 were $18.3 billion, up $909 million, or 5%, from September 30, 2015. Average deposits for the fourth quarter of 2015 were $17.8 billion, up $508 million, or 3%, linked-quarter.
Noninterest-bearing demand deposits (DDAs) totaled $7.3 billion at December 31, 2015, up $1.2 billion from September 30, 2015. The increase reflects a change in the company's consumer checking product offering. Excluding this activity DDA was relatively stable linked-quarter. DDAs comprised 40% of total period-end deposits at December 31, 2015.
Interest-bearing transaction and savings deposits totaled $6.8 billion at the end of the fourth quarter of 2015, down $593 million, or 8%, from September 30, 2015. The decline reflects, in part, the change in products noted above. Time deposits of $2.1 billion decreased $184 million, or 8%, while interest-bearing public fund deposits increased $486 million, or 28%, to $2.3 billion at December 31, 2015. During the fourth quarter of 2015 the company closed its Cayman branch, reclassifying Eurodollar deposits from the time deposit category to interest-bearing transaction accounts. Excluding these changes, the company did report organic growth in money market deposits.
Asset Quality
Nonperforming assets (NPAs) totaled $191 million at December 31, 2015, down $15.2 million from September 30, 2015. During the fourth quarter of 2015, total nonperforming loans decreased approximately $8.7 million while foreclosed and surplus real estate (ORE) and other foreclosed assets decreased approximately $6.5 million. The net decrease in nonperforming loans was mainly related to the payoff of an energy credit during the quarter. Nonperforming
2
Hancock reports fourth quarter 2015 financial results
January 21, 2016
assets as a percent of total loans, ORE and other foreclosed assets was 1.22% at December 31, 2015, down 17 bps from September 30, 2015.
The total allowance for loan losses was $181.2 million at December 31, 2015, up $41.6 million from September 30, 2015. The ratio of the allowance for loan losses to period-end loans was 1.15% at December 31, 2015, up from 0.95% at September 30, 2015. The allowance maintained on the non-FDIC acquired portion of the loan portfolio increased $44.0 million linked-quarter, totaling $158.1 million, while the allowance on the FDIC acquired loan portfolio decreased approximately $2.4 million linked-quarter.
The depth and duration of the current energy cycle continued to deepen and lengthen from what we and many others originally expected. Recent economic and geopolitical events have caused the price of oil to decline even further and there are no indications that there will be a quick recovery. These events, coupled with declining collateral value related to specific credits within the energy portfolio, led us to update our estimated allowance for loan losses. During the fourth quarter the allowance for the energy portfolio was increased $43 million, to $78.2 million, or almost 5% of energy loans. The impact and severity of risk rating migration, associated provision and net charge-offs will depend on overall oil price reduction and the duration of the cycle. While we expect additional charge-offs in the portfolio, we continue to believe the impact of the energy cycle will be manageable and our capital will remain solid. Management currently estimates that charge-offs from energy-related credits could approximate $50-$75 million over the duration of the cycle. Charge-offs for 2015 totaled $3.75 million. Additional details of the energy portfolio are included in the presentation slides posted on our Investor Relations website.
Net charge-offs from the non-FDIC acquired loan portfolio were $7.9 million, or 0.21% of average total loans on an annualized basis in the fourth quarter of 2015, up from $3.5 million, or 0.09% of average total loans in the third quarter of 2015. Included in the fourth quarter total are $3.0 million in charge-offs related to energy credits.
During the fourth quarter of 2015, Hancock recorded a total provision for loan losses of $50.2 million, up $40.1 million from the third quarter of 2015.
Net Interest Income and Net Interest Margin
Net interest income (TE) for the fourth quarter of 2015 was $162.6 million, up $2.5 million from the third quarter of 2015. During the fourth quarter, the impact on net interest income from purchase accounting adjustments (PAAs) declined $0.7 million compared to the third quarter of 2015. Excluding the impact from purchase accounting items, core net interest income increased $3.2 million linked-quarter. Average earning assets were $20.1 billion for the fourth quarter of 2015, up $707 million, or 4%, from the third quarter of 2015.
Net interest income (TE) for the fourth quarter of 2015 was $162.6 million, up $2.5 million from the third quarter of 2015. During the fourth quarter, the impact on net interest income from purchase accounting adjustments (PAAs) declined $0.7 million compared to the third quarter of 2015. Excluding the impact from purchase accounting items, core net interest income increased $3.2 million linked-quarter. Average earning assets were $20.1 billion for the fourth quarter of 2015, up $707 million, or 4%, from the third quarter of 2015.
The reported net interest margin (TE) was 3.21% for the fourth quarter of 2015, down 7 basis points (bps) from the third quarter of 2015. The impact from purchase accounting items contributed to 2 bps of the decline. The core net interest margin (reported net interest income (TE) excluding total net purchase accounting adjustments, annualized, as a percent of average
3
Hancock reports fourth quarter 2015 financial results
January 21, 2016
earning assets) decreased 5 bps to 3.10% during the fourth quarter of 2015. The main driver of the decline was a decrease in the core loan yield of 8 bps. This was slightly offset by an increase in the securities portfolio yield of 5 bps. The cost of funds remained relatively stable (up 1 bp).
Noninterest Income
Noninterest income, including securities transactions, totaled $59.7 million for the fourth quarter of 2015, down $0.6 million, or 1%, from the third quarter of 2015. Included in the total is a reduction of $1.7 million related to the amortization of the FDIC indemnification asset, compared to a reduction of $1.6 million in the third quarter of 2015. Excluding the impact of this item and securities transactions, core noninterest income totaled $61.4 million, down slightly linked-quarter.
Service charges on deposits totaled $19.0 million for the fourth quarter of 2015, up $0.4 million, or 2%, from the third quarter of 2015. Bank card and ATM fees totaled $11.8 million, up $0.1 million, or 1%, from the third quarter of 2015.
Trust fees totaled $11.3 million, down slightly linked-quarter. Investment and annuity income and insurance fees totaled $6.6 million, down $1.8 million, or 21%, linked-quarter.
Fees from secondary mortgage operations totaled $2.9 million for the fourth quarter of 2015, down $0.5 million, or 16%, linked-quarter.
Other noninterest income (excluding the amortization of the FDIC indemnification asset noted above) totaled $9.8 million, up $1.5 million, or 17%, from the third quarter of 2015.
Noninterest Expense & Taxes
Noninterest expense for the fourth quarter of 2015 totaled $156.0 million, up $4.8 million, or 3%, from the third quarter of 2015. There were no nonoperating expenses in either the third or fourth quarters of 2015.
Noninterest expense for the fourth quarter of 2015 totaled $156.0 million, up $4.8 million, or 3%, from the third quarter of 2015. There were no nonoperating expenses in either the third or fourth quarters of 2015.
Total personnel expense was $85.3 million in the fourth quarter of 2015, up $1.2 million, or 1%, from the third quarter of 2015. The increase primarily reflects salary and incentive expenses related to revenue initiatives.
Occupancy and equipment expense totaled $14.5 million in the fourth quarter of 2015, down $0.3 million, or 2%, from the third quarter of 2015.
ORE expense totaled $1.4 million for the fourth quarter of 2015, up $0.9 million from the third quarter of 2015.
Amortization of intangibles totaled $5.7 million for the fourth quarter of 2015, down $0.3 million, or 6%, linked-quarter. Other operating expense totaled $49.2 million in the fourth quarter of 2015, up $3.4 million, or 7%, from the third quarter of 2015. The change linked-quarter mainly
4
Hancock reports fourth quarter 2015 financial results
January 21, 2016
reflects the impact from $1.25 million in insurance proceeds received in the third quarter and an increase of $1.2 million in revenue-related advertising expense in the fourth quarter.
The effective income tax rate for the full year of 2015 was 23%. The effective rate was 26% in the third quarter of 2015. The lower level of earnings and an increase in tax-exempt income impacted the fourth quarter, causing the effective tax rate to be unusually low. Management expects the effective income tax rate to approximate 26-27% in 2016. The effective income tax rate continues to be less than the statutory rate of 35% due primarily to tax-exempt income and tax credits.
Capital
Common shareholders' equity at December 31, 2015 totaled $2.4 billion. The tangible common equity (TCE) ratio was 7.62%, down 62 bps from September 30, 2015. The decline reflects the $1.2 billion of asset growth in the fourth quarter of 2015, a lower level of earnings in the quarter and a decrease in other comprehensive income (OCI) related to the actuarial losses on retirement plans and the market adjustment on the available for sale (AFS) investment portfolio.
During the fourth quarter the company repurchased 173,114 common shares under the 5% common stock buyback authorization announced in late August 2015. The shares were repurchased at an average price of $27.59. Additional capital ratios are included in the financial tables.
Conference Call and Slide Presentation
Management will host a conference call for analysts and investors at 9:00 a.m. Central Time on Friday, January 22, 2016 to review the results. A live listen-only webcast of the call will be available under the Investor Relations section of Hancock's website at www.hancockbank.com. Additional financial tables and a slide presentation related to fourth quarter results are also posted as part of the webcast link. To participate in the Q&A portion of the call, dial (877) 564-1219 or (973) 638-3429. An audio archive of the conference call will be available under the Investor Relations section of our website. A replay of the call will also be available through January 28, 2016 by dialing (855) 859-2056 or (404) 537-3406, passcode 17108504.
About Hancock Holding Company
Hancock Holding Company is a financial services company with regional business headquarters and locations throughout a growing Gulf South corridor. The company's banking subsidiary provides a comprehensive network of full-service financial choices through Hancock Bank locations in Mississippi, Alabama, and Florida and Whitney Bank offices in Louisiana and Texas, including traditional and online banking; commercial and small business banking; energy banking; private banking; trust and investment services; certain insurance services; mortgage services; and consumer financing. More information and online banking are available at www.hancockbank.com and www.whitneybank.com.
Forward-Looking Statements
This news release contains "forward-looking statements" within the meaning of section 27A of the Securities Act of 1933, as amended, and section 21E of the Securities Exchange Act of 1934, as amended, and we intend such forward-looking statements to
This news release contains "forward-looking statements" within the meaning of section 27A of the Securities Act of 1933, as amended, and section 21E of the Securities Exchange Act of 1934, as amended, and we intend such forward-looking statements to
5
Hancock reports fourth quarter 2015 financial results
January 21, 2016
be covered by the safe harbor provisions therein and are including this statement for purposes of invoking these safe-harbor provisions. Forward-looking statements provide projections of results of operations or of financial condition or state other forward-looking information, such as expectations about future conditions and descriptions of plans and strategies for the future.
Forward-looking statements that we may make include, but may not be limited to, comments with respect to future levels of economic activity in our markets, including the impact of volatility of oil and gas prices on our energy portfolio and associated loan loss reserves and possible charge-offs, and the downstream impact on businesses that support the energy sector, especially in the Gulf Coast region, loan growth expectations, deposit trends, credit quality trends, net interest margin trends, future expense levels, success of revenue-generating initiatives, projected tax rates, future profitability, improvements in expense to revenue (efficiency) ratio, purchase accounting impacts such as accretion levels, possible repurchases of shares under stock buyback programs, and the financial impact of regulatory requirements. Hancock's ability to accurately project results, predict the effects of future plans or strategies, or predict market or economic developments is inherently limited. Although Hancock believes that the expectations reflected in its forward-looking statements are based on reasonable assumptions, actual results and performance could differ materially from those set forth in the forward-looking statements. Factors that could cause actual results to differ from those expressed in Hancock's forward-looking statements include, but are not limited to, those risk factors included in Hancock's public filings with the Securities and Exchange Commission, which are available at the SEC's internet site (http://www.sec.gov). You are cautioned not to place undue reliance on these forward-looking statements. Hancock does not intend, and undertakes no obligation, to update or revise any forward-looking statements, whether as a result of differences in actual results, changes in assumptions or changes in other factors affecting such statements, except as required by law.
6
|
HANCOCK HOLDING COMPANY
FINANCIAL HIGHLIGHTS
(Unaudited)
|
||||||||||||||||||||
|
|
||||||||||||||||||||
|
Three Months Ended
|
Twelve Months Ended
|
|||||||||||||||||||
|
(amounts in thousands, except per share data)
|
12/31/2015
|
9/30/2015
|
12/31/2014
|
12/31/2015
|
12/31/2014
|
|||||||||||||||
|
INCOME STATEMENT DATA
|
||||||||||||||||||||
|
Net interest income
|
$
|
158,395
|
$
|
156,830
|
$
|
160,813
|
$
|
625,174
|
$
|
654,694
|
||||||||||
|
Net interest income (TE) (a)
|
162,635
|
160,134
|
163,581
|
638,762
|
665,341
|
|||||||||||||||
|
Provision for loan losses
|
50,196
|
10,080
|
9,718
|
73,038
|
33,840
|
|||||||||||||||
|
Noninterest income excluding securities transactions
|
59,655
|
60,207
|
56,961
|
236,949
|
227,999
|
|||||||||||||||
|
Securities transactions (losses) gains
|
(2
|
)
|
4
|
-
|
335
|
-
|
||||||||||||||
|
Noninterest expense (excluding nonoperating items)
|
156,030
|
151,193
|
144,080
|
603,414
|
580,980
|
|||||||||||||||
|
Nonoperating items
|
-
|
-
|
9,667
|
16,241
|
25,686
|
|||||||||||||||
|
Net income
|
15,307
|
41,166
|
40,092
|
131,461
|
175,722
|
|||||||||||||||
|
Operating income (b)
|
15,307
|
41,166
|
46,376
|
141,801
|
194,145
|
|||||||||||||||
|
Pre-tax, pre-provision (PTPP) profit (TE) (a) (c)
|
66,258
|
69,152
|
66,795
|
256,391
|
286,674
|
|||||||||||||||
|
PERIOD-END BALANCE SHEET DATA
|
||||||||||||||||||||
|
Loans
|
$
|
15,703,314
|
$
|
14,763,050
|
$
|
13,895,276
|
$
|
15,703,314
|
$
|
13,895,276
|
||||||||||
|
Securities
|
4,463,792
|
4,548,922
|
3,826,454
|
4,463,792
|
3,826,454
|
|||||||||||||||
|
Earning assets
|
20,753,095
|
19,526,150
|
18,544,930
|
20,753,095
|
18,544,930
|
|||||||||||||||
|
Total assets
|
22,839,459
|
21,608,150
|
20,747,266
|
22,839,459
|
20,747,266
|
|||||||||||||||
|
Noninterest-bearing deposits
|
7,276,127
|
6,075,558
|
5,945,208
|
7,276,127
|
5,945,208
|
|||||||||||||||
|
Total deposits
|
18,348,912
|
17,439,948
|
16,572,831
|
18,348,912
|
16,572,831
|
|||||||||||||||
|
Common shareholders' equity
|
2,413,143
|
2,453,561
|
2,472,402
|
2,413,143
|
2,472,402
|
|||||||||||||||
|
AVERAGE BALANCE SHEET DATA
|
||||||||||||||||||||
|
Loans
|
$
|
15,198,232
|
$
|
14,511,474
|
$
|
13,578,223
|
$
|
14,433,367
|
$
|
12,938,869
|
||||||||||
|
Securities (d)
|
4,480,972
|
4,425,546
|
3,836,123
|
4,208,195
|
3,816,724
|
|||||||||||||||
|
Earning assets
|
20,140,432
|
19,433,337
|
17,911,143
|
19,173,322
|
17,195,492
|
|||||||||||||||
|
Total assets
|
22,176,566
|
21,481,410
|
20,090,372
|
21,249,628
|
19,436,827
|
|||||||||||||||
|
Noninterest-bearing deposits
|
6,709,188
|
6,032,680
|
5,849,356
|
6,195,234
|
5,641,792
|
|||||||||||||||
|
Total deposits
|
17,821,484
|
17,313,433
|
15,892,507
|
17,124,789
|
15,399,993
|
|||||||||||||||
|
Common shareholders' equity
|
2,453,480
|
2,439,068
|
2,509,509
|
2,442,787
|
2,474,948
|
|||||||||||||||
|
COMMON SHARE DATA
|
||||||||||||||||||||
|
Earnings per share - diluted
|
$
|
0.19
|
$
|
0.52
|
$
|
0.48
|
$
|
1.64
|
$
|
2.10
|
||||||||||
|
Operating earnings per share - diluted (b)
|
0.19
|
0.52
|
0.56
|
1.77
|
2.32
|
|||||||||||||||
|
Cash dividends per share
|
$
|
0.24
|
$
|
0.24
|
$
|
0.24
|
$
|
0.96
|
$
|
0.96
|
||||||||||
|
Book value per share (period-end)
|
$
|
31.14
|
$
|
31.65
|
$
|
30.74
|
$
|
31.14
|
$
|
30.74
|
||||||||||
|
Tangible book value per share (period-end)
|
21.74
|
22.18
|
21.37
|
21.74
|
21.37
|
|||||||||||||||
|
Weighted average number of shares - diluted
|
77,544
|
78,075
|
81,530
|
78,307
|
82,034
|
|||||||||||||||
|
Period-end number of shares
|
77,496
|
77,519
|
80,426
|
77,496
|
80,426
|
|||||||||||||||
|
Market data
|
||||||||||||||||||||
|
High sales price
|
$
|
30.96
|
$
|
32.47
|
$
|
35.67
|
$
|
32.98
|
$
|
38.50
|
||||||||||
|
Low sales price
|
23.35
|
25.20
|
28.68
|
23.35
|
28.68
|
|||||||||||||||
|
Period-end closing price
|
25.17
|
27.05
|
30.70
|
25.17
|
30.70
|
|||||||||||||||
|
Trading volume
|
48,789
|
44,705
|
36,396
|
185,523
|
120,635
|
|||||||||||||||
|
PERFORMANCE RATIOS
|
||||||||||||||||||||
|
Return on average assets
|
0.27
|
%
|
0.76
|
%
|
0.79
|
%
|
0.62
|
%
|
0.90
|
%
|
||||||||||
|
Return on average assets - operating (b)
|
0.27
|
%
|
0.76
|
%
|
0.92
|
%
|
0.67
|
%
|
1.00
|
%
|
||||||||||
|
Return on average common equity
|
2.48
|
%
|
6.70
|
%
|
6.34
|
%
|
5.38
|
%
|
7.10
|
%
|
||||||||||
|
Return on average common equity - operating (b)
|
2.48
|
%
|
6.70
|
%
|
7.33
|
%
|
5.80
|
%
|
7.84
|
%
|
||||||||||
|
Return on average tangible common equity
|
3.53
|
%
|
9.60
|
%
|
9.08
|
%
|
7.72
|
%
|
10.30
|
%
|
||||||||||
|
Return on average tangible common equity - operating (b)
|
3.53
|
%
|
9.60
|
%
|
10.50
|
%
|
8.33
|
%
|
11.37
|
%
|
||||||||||
|
Tangible common equity ratio (e)
|
7.62
|
%
|
8.24
|
%
|
8.59
|
%
|
7.62
|
%
|
8.59
|
%
|
||||||||||
|
Net interest margin (TE) (a)
|
3.21
|
%
|
3.28
|
%
|
3.63
|
%
|
3.33
|
%
|
3.87
|
%
|
||||||||||
|
Average loan/deposit ratio
|
85.28
|
%
|
83.82
|
%
|
85.44
|
%
|
84.28
|
%
|
84.02
|
%
|
||||||||||
|
Efficiency ratio (f)
|
67.63
|
%
|
65.88
|
%
|
62.41
|
%
|
66.14
|
%
|
62.03
|
%
|
||||||||||
|
Allowance for loan losses as a percent of period-end loans
|
1.15
|
%
|
0.95
|
%
|
0.93
|
%
|
1.15
|
%
|
0.93
|
%
|
||||||||||
|
Annualized net non-FDIC acquired charge-offs to average loans
|
0.21
|
%
|
0.09
|
%
|
0.08
|
%
|
0.11
|
%
|
0.13
|
%
|
||||||||||
|
Allowance for loan losses to non-performing loans + accruing loans
|
||||||||||||||||||||
|
90 days past due
|
105.54
|
%
|
78.15
|
%
|
137.96
|
%
|
105.54
|
%
|
137.96
|
%
|
||||||||||
|
Noninterest income excluding securities transactions as a percent
|
||||||||||||||||||||
|
of total revenue (TE) (a)
|
26.84
|
%
|
27.32
|
%
|
25.83
|
%
|
27.06
|
%
|
25.52
|
%
|
||||||||||
|
FTE headcount
|
3,921
|
3,863
|
3,794
|
3,921
|
3,794
|
|||||||||||||||
|
(a) Tax-equivalent (TE) amounts are calculated using a federal income tax rate of 35%.
|
||||||||||||||||||||
|
(b) Net income less tax-effected securities transactions and nonoperating items. Management believes that operating income provides a useful measure of financial performance that helps
|
||||||||||||||||||||
|
investors compare the Company's fundamental operations over time.
|
||||||||||||||||||||
|
(c) Net interest income (TE) and noninterest income less noninterest expense. Management believes that PTPP profit is a useful financial measure because it enables investors to assess the Company's ability to generate capital to cover credit losses through a credit cycle.
|
||||||||||||||||||||
|
(d) Average securities does not include unrealized holding gains/losses on available for sale securities.
|
||||||||||||||||||||
|
(e) The tangible common equity ratio is common shareholders' equity less intangible assets divided by total assets less intangible assets.
|
||||||||||||||||||||
|
(f) The efficiency ratio is noninterest expense to total net interest (TE) and noninterest income, excluding amortization of purchased intangibles, nonoperating items, and securities transactions.
|
||||||||||||||||||||
7
|
HANCOCK HOLDING COMPANY
QUARTERLY HIGHLIGHTS
(Unaudited) |
||||||||||||||||||||
|
Three Months Ended
|
||||||||||||||||||||
|
(amounts in thousands, except per share data)
|
12/31/2015
|
9/30/2015
|
6/30/2015
|
3/31/2015
|
12/31/2014
|
|||||||||||||||
|
INCOME STATEMENT DATA
|
||||||||||||||||||||
|
Net interest income
|
$
|
158,395
|
$
|
156,830
|
$
|
151,791
|
$
|
158,158
|
$
|
160,813
|
||||||||||
|
Net interest income (TE) (a)
|
162,635
|
160,134
|
154,879
|
161,114
|
163,581
|
|||||||||||||||
|
Provision for loan losses
|
50,196
|
10,080
|
6,608
|
6,154
|
9,718
|
|||||||||||||||
|
Noninterest income excluding securities transactions
|
59,655
|
60,207
|
60,874
|
56,213
|
56,961
|
|||||||||||||||
|
Securities transactions (losses) gains
|
(2
|
)
|
4
|
-
|
333
|
-
|
||||||||||||||
|
Noninterest expense (excluding nonoperating items)
|
156,030
|
151,193
|
149,990
|
146,201
|
144,080
|
|||||||||||||||
|
Nonoperating items
|
-
|
-
|
8,927
|
7,314
|
9,667
|
|||||||||||||||
|
Net income
|
15,307
|
41,166
|
34,829
|
40,159
|
40,092
|
|||||||||||||||
|
Operating income (b)
|
15,307
|
41,166
|
40,631
|
44,697
|
46,376
|
|||||||||||||||
|
Pre-tax, pre-provision (PTPP) profit (TE) (a) (c)
|
66,258
|
69,152
|
56,836
|
64,145
|
66,795
|
|||||||||||||||
|
PERIOD-END BALANCE SHEET DATA
|
||||||||||||||||||||
|
Loans
|
$
|
15,703,314
|
$
|
14,763,050
|
$
|
14,344,752
|
$
|
13,924,386
|
$
|
13,895,276
|
||||||||||
|
Securities
|
4,463,792
|
4,548,922
|
4,445,452
|
4,107,904
|
3,826,454
|
|||||||||||||||
|
Earning assets
|
20,753,095
|
19,526,150
|
19,409,963
|
18,568,037
|
18,544,930
|
|||||||||||||||
|
Total assets
|
22,839,459
|
21,608,150
|
21,538,405
|
20,724,511
|
20,747,266
|
|||||||||||||||
|
Noninterest-bearing deposits
|
7,276,127
|
6,075,558
|
6,180,814
|
6,201,403
|
5,945,208
|
|||||||||||||||
|
Total deposits
|
18,348,912
|
17,439,948
|
17,301,788
|
16,860,485
|
16,572,831
|
|||||||||||||||
|
Common shareholders' equity
|
2,413,143
|
2,453,561
|
2,430,040
|
2,425,098
|
2,472,402
|
|||||||||||||||
|
AVERAGE BALANCE SHEET DATA
|
||||||||||||||||||||
|
Loans
|
$
|
15,198,232
|
$
|
14,511,474
|
$
|
14,138,904
|
$
|
13,869,397
|
$
|
13,578,223
|
||||||||||
|
Securities (d)
|
4,480,972
|
4,425,546
|
4,143,097
|
3,772,997
|
3,836,123
|
|||||||||||||||
|
Earning assets
|
20,140,432
|
19,433,337
|
18,780,771
|
18,315,839
|
17,911,143
|
|||||||||||||||
|
Total assets
|
22,176,566
|
21,481,410
|
20,875,090
|
20,443,859
|
20,090,372
|
|||||||||||||||
|
Noninterest-bearing deposits
|
6,709,188
|
6,032,680
|
6,107,900
|
5,924,196
|
5,849,356
|
|||||||||||||||
|
Total deposits
|
17,821,484
|
17,313,433
|
16,862,088
|
16,485,259
|
15,892,507
|
|||||||||||||||
|
Common shareholders' equity
|
2,453,480
|
2,439,068
|
2,430,710
|
2,447,870
|
2,509,509
|
|||||||||||||||
|
COMMON SHARE DATA
|
||||||||||||||||||||
|
Earnings per share - diluted
|
$
|
0.19
|
$
|
0.52
|
$
|
0.44
|
$
|
0.49
|
$
|
0.48
|
||||||||||
|
Operating earnings per share - diluted (b)
|
0.19
|
0.52
|
0.51
|
0.55
|
0.56
|
|||||||||||||||
|
Cash dividends per share
|
$
|
0.24
|
$
|
0.24
|
$
|
0.24
|
$
|
0.24
|
$
|
0.24
|
||||||||||
|
Book value per share (period-end)
|
$
|
31.14
|
$
|
31.65
|
$
|
31.12
|
$
|
31.14
|
$
|
30.74
|
||||||||||
|
Tangible book value per share (period-end)
|
21.74
|
22.18
|
21.63
|
21.55
|
21.37
|
|||||||||||||||
|
Weighted average number of shares - diluted
|
77,544
|
78,075
|
78,115
|
79,661
|
81,530
|
|||||||||||||||
|
Period-end number of shares
|
77,496
|
77,519
|
78,094
|
77,886
|
80,426
|
|||||||||||||||
|
Market data
|
||||||||||||||||||||
|
High sales price
|
$
|
30.96
|
$
|
32.47
|
$
|
32.98
|
$
|
31.13
|
$
|
35.67
|
||||||||||
|
Low sales price
|
23.35
|
25.20
|
28.02
|
24.96
|
28.68
|
|||||||||||||||
|
Period-end closing price
|
25.17
|
27.05
|
31.91
|
29.86
|
30.70
|
|||||||||||||||
|
Trading volume
|
48,789
|
44,705
|
40,162
|
51,866
|
36,396
|
|||||||||||||||
|
PERFORMANCE RATIOS
|
||||||||||||||||||||
|
Return on average assets
|
0.27
|
%
|
0.76
|
%
|
0.67
|
%
|
0.80
|
%
|
0.79
|
%
|
||||||||||
|
Return on average assets - operating (b)
|
0.27
|
%
|
0.76
|
%
|
0.78
|
%
|
0.89
|
%
|
0.92
|
%
|
||||||||||
|
Return on average common equity
|
2.48
|
%
|
6.70
|
%
|
5.75
|
%
|
6.65
|
%
|
6.34
|
%
|
||||||||||
|
Return on average common equity - operating (b)
|
2.48
|
%
|
6.70
|
%
|
6.70
|
%
|
7.41
|
%
|
7.33
|
%
|
||||||||||
|
Return on average tangible common equity
|
3.53
|
%
|
9.60
|
%
|
8.28
|
%
|
9.60
|
%
|
9.08
|
%
|
||||||||||
|
Return on average tangible common equity - operating (b)
|
3.53
|
%
|
9.60
|
%
|
9.66
|
%
|
10.68
|
%
|
10.50
|
%
|
||||||||||
|
Tangible common equity ratio (e)
|
7.62
|
%
|
8.24
|
%
|
8.12
|
%
|
8.40
|
%
|
8.59
|
%
|
||||||||||
|
Net interest margin (TE) (a)
|
3.21
|
%
|
3.28
|
%
|
3.30
|
%
|
3.55
|
%
|
3.63
|
%
|
||||||||||
|
Average loan/deposit ratio
|
85.28
|
%
|
83.82
|
%
|
83.85
|
%
|
84.13
|
%
|
85.44
|
%
|
||||||||||
|
Efficiency ratio (f)
|
67.63
|
%
|
65.88
|
%
|
66.67
|
%
|
64.36
|
%
|
62.41
|
%
|
||||||||||
|
Allowance for loan losses as a percent of period-end loans
|
1.15
|
%
|
0.95
|
%
|
0.91
|
%
|
0.92
|
%
|
0.93
|
%
|
||||||||||
|
Annualized net non-FDIC acquired charge-offs to average loans
|
0.21
|
%
|
0.09
|
%
|
0.03
|
%
|
0.11
|
%
|
0.08
|
%
|
||||||||||
|
Allowance for loan losses to non-performing loans + accruing loans
|
||||||||||||||||||||
|
90 days past due
|
105.54
|
%
|
78.15
|
%
|
100.92
|
%
|
123.14
|
%
|
137.96
|
%
|
||||||||||
|
Noninterest income excluding securities transactions as a percent
|
||||||||||||||||||||
|
of total revenue (TE) (a)
|
26.84
|
%
|
27.32
|
%
|
28.21
|
%
|
25.87
|
%
|
25.83
|
%
|
||||||||||
|
FTE headcount
|
3,921
|
3,863
|
3,825
|
3,785
|
3,794
|
|||||||||||||||
|
(a) Tax-equivalent (TE) amounts are calculated using a federal income tax rate of 35%.
|
||||||||||||||||||||
|
(b) Net income less tax-effected securities transactions and nonoperating items. Management believes that operating income provides a useful measure of financial
|
||||||||||||||||||||
|
performance that helps investors compare the Company's fundamental operations over time.
|
||||||||||||||||||||
|
(c) Net interest income (TE) and noninterest income less noninterest expense. Management believes that PTPP profit is a useful financial measure because it enables investors to assess the Company's ability to generate capital to cover credit losses through a credit cycle.
|
||||||||||||||||||||
|
(d) Average securities does not include unrealized holding gains/losses on available for sale securities.
|
||||||||||||||||||||
|
(e) The tangible common equity ratio is common shareholders' equity less intangible assets divided by total assets less intangible assets.
|
||||||||||||||||||||
|
(f) The efficiency ratio is noninterest expense to total net interest (TE) and noninterest income, excluding amortization of purchased intangibles, nonoperating items, and
|
||||||||||||||||||||
|
securities transactions.
|
||||||||||||||||||||
8
|
HANCOCK HOLDING COMPANY
INCOME STATEMENT
(Unaudited) |
||||||||||||||||||||
|
|
||||||||||||||||||||
|
Three Months Ended
|
Twelve Months Ended
|
|||||||||||||||||||
|
(dollars in thousands, except per share data)
|
12/31/2015
|
9/30/2015
|
12/31/2014
|
12/31/2015
|
12/31/2014
|
|||||||||||||||
|
NET INCOME
|
||||||||||||||||||||
|
Interest income
|
$
|
174,310
|
$
|
171,329
|
$
|
170,971
|
$
|
679,646
|
$
|
692,813
|
||||||||||
|
Interest income (TE)
|
178,550
|
174,633
|
173,739
|
693,234
|
703,460
|
|||||||||||||||
|
Interest expense
|
15,915
|
14,499
|
10,158
|
54,472
|
38,119
|
|||||||||||||||
|
Net interest income (TE)
|
162,635
|
160,134
|
163,581
|
638,762
|
665,341
|
|||||||||||||||
|
Provision for loan losses
|
50,196
|
10,080
|
9,718
|
73,038
|
33,840
|
|||||||||||||||
|
Noninterest income excluding securities transactions
|
59,655
|
60,207
|
56,961
|
236,949
|
227,999
|
|||||||||||||||
|
Securities transactions (losses) gains
|
(2
|
)
|
4
|
-
|
335
|
-
|
||||||||||||||
|
Noninterest expense
|
156,030
|
151,193
|
153,747
|
619,655
|
606,666
|
|||||||||||||||
|
Income before income taxes
|
11,822
|
55,768
|
54,309
|
169,765
|
242,187
|
|||||||||||||||
|
Income tax expense
|
(3,485
|
)
|
14,602
|
14,217
|
38,304
|
66,465
|
||||||||||||||
|
Net income
|
$
|
15,307
|
$
|
41,166
|
$
|
40,092
|
$
|
131,461
|
$
|
175,722
|
||||||||||
|
ADJUSTMENTS FROM NET INCOME TO OPERATING INCOME
|
||||||||||||||||||||
|
Securities transactions gains
|
-
|
-
|
-
|
(333
|
)
|
-
|
||||||||||||||
|
Nonoperating items
|
||||||||||||||||||||
|
Impact of insurance business lines divestiture
|
-
|
-
|
-
|
-
|
(9,101
|
)
|
||||||||||||||
|
FDIC resolution of denied claims
|
-
|
-
|
-
|
1,854
|
10,268
|
|||||||||||||||
|
Nonoperating expense items
|
-
|
-
|
9,667
|
14,387
|
21,058
|
|||||||||||||||
|
Early debt redemption
|
-
|
-
|
-
|
-
|
3,461
|
|||||||||||||||
|
Total nonoperating items
|
-
|
-
|
9,667
|
16,241
|
25,686
|
|||||||||||||||
|
Taxes on adjustments at marginal tax rate
|
-
|
-
|
3,383
|
5,568
|
7,263
|
|||||||||||||||
|
Total adjustments (net of taxes)
|
-
|
-
|
6,284
|
10,340
|
18,423
|
|||||||||||||||
|
Operating income (g)
|
$
|
15,307
|
$
|
41,166
|
$
|
46,376
|
$
|
141,801
|
$
|
194,145
|
||||||||||
|
ADJUSTMENTS FROM NET INCOME TO PTPP PROFIT
|
||||||||||||||||||||
|
Difference between interest income and interest income (TE)
|
4,240
|
3,304
|
2,768
|
13,588
|
10,647
|
|||||||||||||||
|
Provision for loan losses
|
50,196
|
10,080
|
9,718
|
73,038
|
33,840
|
|||||||||||||||
|
Income tax expense
|
(3,485
|
)
|
14,602
|
14,217
|
38,304
|
66,465
|
||||||||||||||
|
Pre-tax, pre-provision (PTPP) profit (TE) (h)
|
$
|
66,258
|
$
|
69,152
|
$
|
66,795
|
$
|
256,391
|
$
|
286,674
|
||||||||||
|
NONINTEREST INCOME AND NONINTEREST EXPENSE
|
||||||||||||||||||||
|
Service charges on deposit accounts
|
$
|
18,971
|
$
|
18,619
|
$
|
19,025
|
$
|
72,813
|
$
|
77,006
|
||||||||||
|
Trust fees
|
11,287
|
11,345
|
11,559
|
45,627
|
44,826
|
|||||||||||||||
|
Bank card and ATM fees
|
11,792
|
11,637
|
11,225
|
46,480
|
45,031
|
|||||||||||||||
|
Investment & annuity fees
|
4,632
|
6,149
|
4,736
|
20,669
|
20,291
|
|||||||||||||||
|
Secondary mortgage market operations
|
2,884
|
3,413
|
2,000
|
12,579
|
8,036
|
|||||||||||||||
|
Insurance commissions and fees
|
1,980
|
2,238
|
1,862
|
8,567
|
9,473
|
|||||||||||||||
|
Amortization of FDIC loss share receivable
|
(1,713
|
)
|
(1,564
|
)
|
(2,113
|
)
|
(5,747
|
)
|
(12,102
|
)
|
||||||||||
|
Other income
|
9,822
|
8,370
|
8,667
|
35,961
|
35,438
|
|||||||||||||||
|
Noninterest income excluding securities transactions
|
59,655
|
60,207
|
56,961
|
236,949
|
227,999
|
|||||||||||||||
|
Securities transactions (losses) gains
|
(2
|
)
|
4
|
-
|
335
|
-
|
||||||||||||||
|
Total noninterest income including securities transactions
|
$
|
59,653
|
$
|
60,211
|
$
|
56,961
|
$
|
237,284
|
$
|
227,999
|
||||||||||
|
Personnel expense
|
$
|
85,315
|
$
|
84,155
|
$
|
79,522
|
$
|
332,120
|
$
|
320,502
|
||||||||||
|
Net occupancy expense
|
10,639
|
11,222
|
10,571
|
44,788
|
43,476
|
|||||||||||||||
|
Equipment expense
|
3,871
|
3,598
|
3,986
|
15,481
|
16,861
|
|||||||||||||||
|
Other real estate expense, net
|
1,361
|
422
|
1,001
|
2,740
|
2,758
|
|||||||||||||||
|
Other operating expense
|
49,153
|
45,769
|
42,555
|
184,101
|
170,586
|
|||||||||||||||
|
Amortization of intangibles
|
5,691
|
6,027
|
6,445
|
24,184
|
26,797
|
|||||||||||||||
|
Total operating expense
|
156,030
|
151,193
|
144,080
|
603,414
|
580,980
|
|||||||||||||||
|
Nonoperating expense items
|
-
|
-
|
9,667
|
16,241
|
25,686
|
|||||||||||||||
|
Total noninterest expense
|
$
|
156,030
|
$
|
151,193
|
$
|
153,747
|
$
|
619,655
|
$
|
606,666
|
||||||||||
|
COMMON SHARE DATA
|
||||||||||||||||||||
|
Earnings per share:
|
||||||||||||||||||||
|
Basic
|
$
|
0.19
|
$
|
0.52
|
$
|
0.48
|
$
|
1.64
|
$
|
2.10
|
||||||||||
|
Diluted
|
0.19
|
0.52
|
0.48
|
1.64
|
2.10
|
|||||||||||||||
|
Operating earnings per share: (g)
|
||||||||||||||||||||
|
Basic
|
$
|
0.19
|
$
|
0.52
|
$
|
0.56
|
$
|
1.77
|
$
|
2.32
|
||||||||||
|
Diluted
|
0.19
|
0.52
|
0.56
|
1.77
|
2.32
|
|||||||||||||||
|
(g) Net income less tax-effected securities transactions and nonoperating items. Management believes that
|
||||||||||||||||||||
|
operating income provides a useful measure of financial performance that helps investors compare the Company's fundamental operations over time.
|
||||||||||||||||||||
|
(h) Net interest income (TE) and noninterest income less noninterest expense. Management believes that PTPP profit is a useful financial measure because it enables investors to assess the Company's ability to generate capital to cover credit losses through a credit cycle.
|
||||||||||||||||||||
9
|
HANCOCK HOLDING COMPANY
INCOME STATEMENT
(Unaudited)
|
||||||||||||||||||||
|
|
||||||||||||||||||||
|
Three months ended
|
||||||||||||||||||||
|
(dollars in thousands)
|
12/31/2015
|
9/30/2015
|
6/30/2015
|
3/31/2015
|
12/31/2014
|
|||||||||||||||
|
Interest income
|
$
|
174,310
|
$
|
171,329
|
$
|
164,920
|
$
|
169,087
|
$
|
170,971
|
||||||||||
|
Interest income (TE)
|
178,550
|
174,633
|
168,008
|
172,043
|
173,739
|
|||||||||||||||
|
Interest expense
|
15,915
|
14,499
|
13,129
|
10,929
|
10,158
|
|||||||||||||||
|
Net interest income (TE)
|
162,635
|
160,134
|
154,879
|
161,114
|
163,581
|
|||||||||||||||
|
Provision for loan losses
|
50,196
|
10,080
|
6,608
|
6,154
|
9,718
|
|||||||||||||||
|
Noninterest income excluding securities transactions
|
59,655
|
60,207
|
60,874
|
56,213
|
56,961
|
|||||||||||||||
|
Securities transactions (losses) gains
|
(2
|
)
|
4
|
-
|
333
|
-
|
||||||||||||||
|
Noninterest expense
|
156,030
|
151,193
|
158,917
|
153,515
|
153,747
|
|||||||||||||||
|
Income before income taxes
|
11,822
|
55,768
|
47,140
|
55,035
|
54,309
|
|||||||||||||||
|
Income tax expense
|
(3,485
|
)
|
14,602
|
12,311
|
14,876
|
14,217
|
||||||||||||||
|
Net income
|
$
|
15,307
|
$
|
41,166
|
$
|
34,829
|
$
|
40,159
|
$
|
40,092
|
||||||||||
|
ADJUSTMENTS FROM NET INCOME TO OPERATING INCOME
|
||||||||||||||||||||
|
Securities transactions gains
|
-
|
-
|
-
|
(333
|
)
|
-
|
||||||||||||||
|
Nonoperating expense
|
-
|
-
|
8,927
|
7,314
|
9,667
|
|||||||||||||||
|
Total nonoperating items
|
-
|
-
|
8,927
|
6,981
|
9,667
|
|||||||||||||||
|
Taxes on adjustments at marginal tax rate
|
-
|
-
|
3,125
|
2,443
|
3,383
|
|||||||||||||||
|
Adjustments (net of taxes)
|
-
|
-
|
5,802
|
4,538
|
6,284
|
|||||||||||||||
|
Operating income (g)
|
$
|
15,307
|
$
|
41,166
|
$
|
40,631
|
$
|
44,697
|
$
|
46,376
|
||||||||||
|
Pre-tax, pre-provision (PTPP) profit (TE) (h)
|
$
|
66,258
|
$
|
69,152
|
$
|
56,836
|
$
|
64,145
|
$
|
66,795
|
||||||||||
|
NONINTEREST INCOME AND NONINTEREST EXPENSE
|
||||||||||||||||||||
|
Service charges on deposit accounts
|
$
|
18,971
|
$
|
18,619
|
$
|
17,908
|
$
|
17,315
|
$
|
19,025
|
||||||||||
|
Trust fees
|
11,287
|
11,345
|
11,795
|
11,200
|
11,559
|
|||||||||||||||
|
Bank card and ATM fees
|
11,792
|
11,637
|
11,868
|
11,183
|
11,225
|
|||||||||||||||
|
Investment & annuity fees
|
4,632
|
6,149
|
4,838
|
5,050
|
4,736
|
|||||||||||||||
|
Secondary mortgage market operations
|
2,884
|
3,413
|
3,618
|
2,664
|
2,000
|
|||||||||||||||
|
Insurance commissions and fees
|
1,980
|
2,238
|
2,595
|
1,754
|
1,862
|
|||||||||||||||
|
Amortization of FDIC loss share receivable
|
(1,713
|
)
|
(1,564
|
)
|
(1,273
|
)
|
(1,197
|
)
|
(2,113
|
)
|
||||||||||
|
Other income
|
9,822
|
8,370
|
9,525
|
8,244
|
8,667
|
|||||||||||||||
|
Noninterest income excluding securities transactions
|
59,655
|
60,207
|
60,874
|
56,213
|
56,961
|
|||||||||||||||
|
Securities transactions (losses) gains
|
(2
|
)
|
4
|
-
|
333
|
-
|
||||||||||||||
|
Total noninterest income including securities transactions
|
$
|
59,653
|
$
|
60,211
|
$
|
60,874
|
$
|
56,546
|
$
|
56,961
|
||||||||||
|
Personnel expense
|
$
|
85,315
|
$
|
84,155
|
$
|
82,533
|
$
|
80,117
|
$
|
79,522
|
||||||||||
|
Net occupancy expense
|
10,639
|
11,222
|
11,765
|
11,162
|
10,571
|
|||||||||||||||
|
Equipment expense
|
3,871
|
3,598
|
4,079
|
3,933
|
3,986
|
|||||||||||||||
|
Other real estate expense, net
|
1,361
|
422
|
501
|
456
|
1,001
|
|||||||||||||||
|
Other operating expense
|
49,153
|
45,769
|
44,964
|
44,215
|
42,555
|
|||||||||||||||
|
Amortization of intangibles
|
5,691
|
6,027
|
6,148
|
6,318
|
6,445
|
|||||||||||||||
|
Total operating expense
|
156,030
|
151,193
|
149,990
|
146,201
|
144,080
|
|||||||||||||||
|
Nonoperating expense items
|
-
|
-
|
8,927
|
7,314
|
9,667
|
|||||||||||||||
|
Total noninterest expense
|
$
|
156,030
|
$
|
151,193
|
$
|
158,917
|
$
|
153,515
|
$
|
153,747
|
||||||||||
|
(g) Net income less tax-effected securities transactions and nonoperating items. Management believes that operating income provides a useful measure of financial performance that helps
|
||||||||||||||||||||
|
investors compare the Company's fundamental operations over time.
|
||||||||||||||||||||
|
(h) Net interest income (TE) and noninterest income less noninterest expense. Management believes that PTPP profit is a useful financial measure because it enables investors to assess the Company's ability to generate capital to cover credit losses through a credit cycle.
|
||||||||||||||||||||
10
|
HANCOCK HOLDING COMPANY
PERIOD-END BALANCE SHEET
(Unaudited)
|
||||||||||||||||||||
|
|
||||||||||||||||||||
|
Three Months Ended
|
||||||||||||||||||||
|
(dollars in thousands)
|
12/31/2015
|
9/30/2015
|
6/30/2015
|
3/31/2015
|
12/31/2014
|
|||||||||||||||
|
ASSETS
|
||||||||||||||||||||
|
Commercial non-real estate loans
|
$
|
6,995,824
|
$
|
6,345,994
|
$
|
6,185,684
|
$
|
5,987,084
|
$
|
6,044,060
|
||||||||||
|
Construction and land development loans
|
1,151,950
|
1,085,585
|
1,120,947
|
1,113,510
|
1,106,761
|
|||||||||||||||
|
Commercial real estate loans
|
3,412,551
|
3,327,386
|
3,212,833
|
3,150,103
|
3,144,048
|
|||||||||||||||
|
Residential mortgage loans
|
2,049,524
|
2,013,789
|
1,955,837
|
1,913,885
|
1,894,181
|
|||||||||||||||
|
Consumer loans
|
2,093,465
|
1,990,296
|
1,869,451
|
1,759,804
|
1,706,226
|
|||||||||||||||
|
Total loans
|
15,703,314
|
14,763,050
|
14,344,752
|
13,924,386
|
13,895,276
|
|||||||||||||||
|
Loans held for sale
|
20,434
|
19,764
|
21,304
|
19,950
|
20,252
|
|||||||||||||||
|
Securities
|
4,463,792
|
4,548,922
|
4,445,452
|
4,107,904
|
3,826,454
|
|||||||||||||||
|
Short-term investments
|
565,555
|
194,414
|
598,455
|
515,797
|
802,948
|
|||||||||||||||
|
Earning assets
|
20,753,095
|
19,526,150
|
19,409,963
|
18,568,037
|
18,544,930
|
|||||||||||||||
|
Allowance for loan losses
|
(181,179
|
)
|
(139,576
|
)
|
(131,087
|
)
|
(128,386
|
)
|
(128,762
|
)
|
||||||||||
|
Goodwill
|
621,193
|
621,193
|
621,193
|
621,193
|
621,193
|
|||||||||||||||
|
Other intangible assets, net
|
107,538
|
113,229
|
119,256
|
125,404
|
132,810
|
|||||||||||||||
|
Other assets
|
1,538,812
|
1,487,154
|
1,519,080
|
1,538,263
|
1,577,095
|
|||||||||||||||
|
Total assets
|
$
|
22,839,459
|
$
|
21,608,150
|
$
|
21,538,405
|
$
|
20,724,511
|
$
|
20,747,266
|
||||||||||
|
LIABILITIES
|
||||||||||||||||||||
|
Noninterest-bearing deposits
|
$
|
7,276,127
|
$
|
6,075,558
|
$
|
6,180,814
|
$
|
6,201,403
|
$
|
5,945,208
|
||||||||||
|
Interest-bearing transaction and savings deposits
|
6,767,881
|
7,360,677
|
6,994,603
|
6,576,658
|
6,531,628
|
|||||||||||||||
|
Interest-bearing public fund deposits
|
2,253,645
|
1,768,133
|
1,962,589
|
1,828,559
|
1,982,616
|
|||||||||||||||
|
Time deposits
|
2,051,259
|
2,235,580
|
2,163,782
|
2,253,865
|
2,113,379
|
|||||||||||||||
|
Total interest-bearing deposits
|
11,072,785
|
11,364,390
|
11,120,974
|
10,659,082
|
10,627,623
|
|||||||||||||||
|
Total deposits
|
18,348,912
|
17,439,948
|
17,301,788
|
16,860,485
|
16,572,831
|
|||||||||||||||
|
Short-term borrowings
|
1,423,644
|
1,049,182
|
1,079,193
|
755,250
|
1,151,573
|
|||||||||||||||
|
Long-term debt
|
495,999
|
497,177
|
507,341
|
516,007
|
374,371
|
|||||||||||||||
|
Other liabilities
|
157,761
|
168,282
|
220,043
|
167,671
|
176,089
|
|||||||||||||||
|
Total liabilities
|
20,426,316
|
19,154,589
|
19,108,365
|
18,299,413
|
18,274,864
|
|||||||||||||||
|
COMMON SHAREHOLDERS' EQUITY
|
||||||||||||||||||||
|
Common stock net of treasury and capital surplus
|
1,715,794
|
1,717,959
|
1,730,344
|
1,726,736
|
1,798,980
|
|||||||||||||||
|
Retained earnings
|
777,944
|
781,769
|
759,780
|
744,131
|
723,497
|
|||||||||||||||
|
Accumulated other comprehensive income
|
(80,595
|
)
|
(46,167
|
)
|
(60,084
|
)
|
(45,769
|
)
|
(50,075
|
)
|
||||||||||
|
Total common shareholders' equity
|
2,413,143
|
2,453,561
|
2,430,040
|
2,425,098
|
2,472,402
|
|||||||||||||||
|
Total liabilities & shareholders' equity
|
$
|
22,839,459
|
$
|
21,608,150
|
$
|
21,538,405
|
$
|
20,724,511
|
$
|
20,747,266
|
||||||||||
|
CAPITAL RATIOS
|
||||||||||||||||||||
|
Tangible common equity
|
$
|
1,684,388
|
$
|
1,719,108
|
$
|
1,689,550
|
$
|
1,678,453
|
$
|
1,718,343
|
||||||||||
|
Tier 1 capital (i)
|
1,844,705
|
1,848,418
|
1,837,369
|
1,812,010
|
1,777,348
|
|||||||||||||||
|
Common equity (period-end) as a percent of total assets (period-end)
|
10.57
|
%
|
11.35
|
%
|
11.28
|
%
|
11.70
|
%
|
11.92
|
%
|
||||||||||
|
Tangible common equity ratio
|
7.62
|
%
|
8.24
|
%
|
8.12
|
%
|
8.40
|
%
|
8.59
|
%
|
||||||||||
|
Leverage (Tier 1) ratio (i)
|
8.55
|
%
|
8.85
|
%
|
9.07
|
%
|
9.17
|
%
|
9.17
|
%
|
||||||||||
|
Tier 1 risk-based capital ratio (i)
|
10.02
|
%
|
10.56
|
%
|
10.77
|
%
|
10.86
|
%
|
11.23
|
%
|
||||||||||
|
Total risk-based capital ratio (i)
|
11.93
|
%
|
12.32
|
%
|
12.53
|
%
|
12.77
|
%
|
12.30
|
%
|
||||||||||
|
(i) Estimated for most recent period-end. Regulatory ratios reflect the impact of Basel III capital requirements effective January 1, 2015.
|
||||||||||||||||||||
11
|
HANCOCK HOLDING COMPANY
AVERAGE BALANCE SHEET
(Unaudited)
|
||||||||||||||||||||
|
|
||||||||||||||||||||
|
Three Months Ended
|
Twelve Months Ended
|
|||||||||||||||||||
|
(dollars in thousands)
|
12/31/2015
|
9/30/2015
|
12/31/2014
|
12/31/2015
|
12/31/2014
|
|||||||||||||||
|
ASSETS
|
||||||||||||||||||||
|
Commercial non-real estate loans
|
$
|
6,643,961
|
$
|
6,261,241
|
$
|
5,727,003
|
$
|
6,250,796
|
$
|
5,401,992
|
||||||||||
|
Construction and land development loans
|
1,100,502
|
1,115,406
|
1,159,378
|
1,105,348
|
1,047,753
|
|||||||||||||||
|
Commercial real estate loans
|
3,384,409
|
3,231,597
|
3,057,022
|
3,239,070
|
3,058,355
|
|||||||||||||||
|
Residential mortgage loans
|
2,028,688
|
1,977,990
|
1,886,230
|
1,960,420
|
1,791,859
|
|||||||||||||||
|
Consumer loans
|
2,040,672
|
1,925,240
|
1,748,590
|
1,877,733
|
1,638,910
|
|||||||||||||||
|
Total loans
|
15,198,232
|
14,511,474
|
13,578,223
|
14,433,367
|
12,938,869
|
|||||||||||||||
|
Loans held for sale
|
16,717
|
17,233
|
15,424
|
18,101
|
16,540
|
|||||||||||||||
|
Securities (j)
|
4,480,972
|
4,425,546
|
3,836,123
|
4,208,195
|
3,816,724
|
|||||||||||||||
|
Short-term investments
|
444,511
|
479,084
|
481,373
|
513,659
|
423,359
|
|||||||||||||||
|
Earning assets
|
20,140,432
|
19,433,337
|
17,911,143
|
19,173,322
|
17,195,492
|
|||||||||||||||
|
Allowance for loan losses
|
(140,798
|
)
|
(132,634
|
)
|
(127,356
|
)
|
(133,470
|
)
|
(129,642
|
)
|
||||||||||
|
Goodwill and other intangible assets
|
731,414
|
737,361
|
757,123
|
740,666
|
768,047
|
|||||||||||||||
|
Other assets
|
1,445,518
|
1,443,346
|
1,549,462
|
1,469,110
|
1,602,930
|
|||||||||||||||
|
Total assets
|
$
|
22,176,566
|
$
|
21,481,410
|
$
|
20,090,372
|
$
|
21,249,628
|
$
|
19,436,827
|
||||||||||
|
LIABILITIES AND SHAREHOLDERS' EQUITY
|
||||||||||||||||||||
|
Noninterest-bearing deposits
|
$
|
6,709,188
|
$
|
6,032,680
|
$
|
5,849,356
|
$
|
6,195,234
|
$
|
5,641,792
|
||||||||||
|
Interest-bearing transaction and savings deposits
|
7,065,338
|
7,270,061
|
6,380,347
|
6,877,394
|
6,173,683
|
|||||||||||||||
|
Interest-bearing public fund deposits
|
1,834,302
|
1,838,952
|
1,598,482
|
1,844,802
|
1,530,972
|
|||||||||||||||
|
Time deposits
|
2,212,656
|
2,171,740
|
2,064,322
|
2,207,359
|
2,053,546
|
|||||||||||||||
|
Total interest-bearing deposits
|
11,112,296
|
11,280,753
|
10,043,151
|
10,929,555
|
9,758,201
|
|||||||||||||||
|
Total deposits
|
17,821,484
|
17,313,433
|
15,892,507
|
17,124,789
|
15,399,993
|
|||||||||||||||
|
Short-term borrowings
|
1,229,603
|
1,050,801
|
1,135,255
|
1,025,133
|
1,005,680
|
|||||||||||||||
|
Long-term debt
|
496,111
|
504,544
|
376,819
|
482,686
|
379,692
|
|||||||||||||||
|
Other liabilities
|
175,888
|
173,564
|
176,282
|
174,233
|
176,514
|
|||||||||||||||
|
Common shareholders' equity
|
2,453,480
|
2,439,068
|
2,509,509
|
2,442,787
|
2,474,948
|
|||||||||||||||
|
Total liabilities & shareholders' equity
|
$
|
22,176,566
|
$
|
21,481,410
|
$
|
20,090,372
|
$
|
21,249,628
|
$
|
19,436,827
|
||||||||||
|
(j) Average securities does not include unrealized holding gains/losses on available for sale securities.
|
||||||||||||||||||||
12
|
HANCOCK HOLDING COMPANY
AVERAGE BALANCE AND NET INTEREST MARGIN SUMMARY
(Unaudited)
|
||||||||||||||||||||||||||||||||||||
|
|
||||||||||||||||||||||||||||||||||||
|
Three Months Ended
|
||||||||||||||||||||||||||||||||||||
|
12/31/2015
|
9/30/2015
|
12/31/2014
|
||||||||||||||||||||||||||||||||||
|
(dollars in millions)
|
Volume
|
Interest
|
Rate
|
Volume
|
Interest
|
Rate
|
Volume
|
Interest
|
Rate
|
|||||||||||||||||||||||||||
|
AVERAGE EARNING ASSETS
|
||||||||||||||||||||||||||||||||||||
|
Commercial & real estate loans (TE) (l)
|
$
|
11,128.8
|
$
|
106.2
|
3.79
|
%
|
$
|
10,608.2
|
$
|
104.4
|
3.91
|
%
|
$
|
9,943.4
|
$
|
105.8
|
4.23 |
%
|
||||||||||||||||||
|
Residential mortgage loans
|
2,028.7
|
20.6
|
4.07
|
%
|
1,978.0
|
20.2
|
4.08
|
%
|
1,886.2
|
20.3
|
4.31 |
%
|
||||||||||||||||||||||||
|
Consumer loans
|
2,040.7
|
25.9
|
5.03
|
%
|
1,925.3
|
24.5
|
5.04
|
%
|
1,748.6
|
23.9
|
5.43 |
%
|
||||||||||||||||||||||||
|
Loan fees & late charges
|
-
|
(0.5
|
)
|
0.00
|
%
|
-
|
0.1
|
0.00
|
%
|
-
|
0.6
|
0.00 |
%
|
|||||||||||||||||||||||
|
Total loans (TE) (m)
|
15,198.2
|
152.2
|
3.98
|
%
|
14,511.5
|
149.2
|
4.09
|
%
|
13,578.2
|
150.6
|
4.41 |
%
|
||||||||||||||||||||||||
|
Loans held for sale
|
16.7
|
0.2
|
4.40
|
%
|
17.2
|
0.2
|
4.07
|
%
|
15.4
|
0.2
|
4.27 |
%
|
||||||||||||||||||||||||
|
US Treasury and government agency securities
|
50.0
|
0.2
|
1.68
|
%
|
166.8
|
0.6
|
1.55
|
%
|
300.0
|
1.1
|
1.52 |
%
|
||||||||||||||||||||||||
|
CMOs and mortgage backed securities
|
4,219.1
|
23.3
|
2.20
|
%
|
4,052.0
|
22.0
|
2.17
|
%
|
3,324.5
|
19.1
|
2.30 |
%
|
||||||||||||||||||||||||
|
Municipals (TE) (l)
|
205.8
|
2.3
|
4.45
|
%
|
200.3
|
2.3
|
4.52
|
%
|
199.3
|
2.3
|
4.63 |
%
|
||||||||||||||||||||||||
|
Other securities
|
6.1
|
0.0
|
1.80
|
%
|
6.4
|
0.0
|
1.59
|
%
|
12.3
|
0.1
|
2.24 |
%
|
||||||||||||||||||||||||
|
Total securities (TE) (k)
|
4,481.0
|
25.8
|
2.30
|
%
|
4,425.5
|
24.9
|
2.25
|
%
|
3,836.1
|
22.6
|
2.36 |
%
|
||||||||||||||||||||||||
|
Total short-term investments
|
444.5
|
0.3
|
0.30
|
%
|
479.1
|
0.3
|
0.24
|
%
|
481.4
|
0.3
|
0.23 |
%
|
||||||||||||||||||||||||
|
Average earning assets yield (TE)
|
$
|
20,140.4
|
178.5
|
3.53
|
%
|
$
|
19,433.3
|
174.6
|
3.57
|
%
|
$
|
17,911.1
|
173.7
|
3.86 |
%
|
|||||||||||||||||||||
|
INTEREST-BEARING LIABILITIES
|
||||||||||||||||||||||||||||||||||||
|
Interest-bearing transaction and savings deposits
|
$
|
7,065.3
|
4.4
|
0.25
|
%
|
$
|
7,270.1
|
3.7
|
0.20
|
%
|
$
|
6,380.3
|
2.1
|
0.13 |
%
|
|||||||||||||||||||||
|
Time deposits
|
2,212.7
|
4.3
|
0.76
|
%
|
2,171.7
|
3.8
|
0.70
|
%
|
2,064.3
|
3.5
|
0.68 |
%
|
||||||||||||||||||||||||
|
Public funds
|
1,834.3
|
1.5
|
0.32
|
%
|
1,839.0
|
1.4
|
0.31
|
%
|
1,598.5
|
1.1
|
0.28 |
%
|
||||||||||||||||||||||||
|
Total interest-bearing deposits
|
11,112.3
|
10.2
|
0.36
|
%
|
11,280.8
|
8.9
|
0.31
|
%
|
10,043.1
|
6.7
|
0.27 |
%
|
||||||||||||||||||||||||
|
Short-term borrowings
|
1,229.6
|
0.4
|
0.14
|
%
|
1,050.8
|
0.3
|
0.10
|
%
|
1,135.3
|
0.3
|
0.09 |
%
|
||||||||||||||||||||||||
|
Long-term debt
|
496.1
|
5.3
|
4.22
|
%
|
504.5
|
5.3
|
4.16
|
%
|
376.8
|
3.1
|
3.28 |
%
|
||||||||||||||||||||||||
|
Total borrowings
|
1,725.7
|
5.7
|
1.31
|
%
|
1,555.3
|
5.6
|
1.42
|
%
|
1,512.1
|
3.4
|
0.88 |
%
|
||||||||||||||||||||||||
|
Total interest-bearing liabilities cost
|
12,838.0
|
15.9
|
0.49
|
%
|
12,836.1
|
14.5
|
0.45
|
%
|
11,555.2
|
10.1
|
0.35 |
%
|
||||||||||||||||||||||||
|
Net interest-free funding sources
|
7,302.4
|
6,597.2
|
6,355.9
|
|||||||||||||||||||||||||||||||||
|
Total cost of funds
|
20,140.4
|
15.9
|
0.31
|
%
|
19,433.3
|
14.5
|
0.30
|
%
|
17,911.1
|
10.1
|
0.23 |
%
|
||||||||||||||||||||||||
|
Net Interest Spread (TE)
|
$
|
162.6
|
3.04
|
%
|
$
|
160.1
|
3.13
|
%
|
$
|
163.6
|
3.51 |
%
|
||||||||||||||||||||||||
|
Net Interest Margin (TE)
|
$
|
20,140.4
|
$
|
162.6
|
3.21
|
%
|
$
|
19,433.3
|
$
|
160.1
|
3.28
|
%
|
$
|
17,911.1
|
$
|
163.6
|
3.63 |
%
|
||||||||||||||||||
|
(k) Average securities does not include unrealized holding gains/losses on available for sale securities.
|
||||||||||||||||||||||||||||||||||||
|
(l) Tax equivalent (te) amounts are calculated using a marginal federal tax rate of 35%.
|
||||||||||||||||||||||||||||||||||||
|
(m) Includes nonaccrual loans.
|
||||||||||||||||||||||||||||||||||||
13
|
HANCOCK HOLDING COMPANY
AVERAGE BALANCE AND NET INTEREST MARGIN SUMMARY
(Unaudited)
|
||||||||||||||||||||||||
|
|
||||||||||||||||||||||||
|
Twelve Months Ended
|
||||||||||||||||||||||||
|
12/31/2015
|
12/31/2014
|
|||||||||||||||||||||||
|
(dollars in millions)
|
Volume
|
Interest
|
Rate
|
Volume
|
Interest
|
Rate
|
||||||||||||||||||
|
AVERAGE EARNING ASSETS
|
||||||||||||||||||||||||
|
Commercial & real estate loans (TE) (l)
|
$
|
10,595.2
|
$
|
419.1
|
3.95
|
%
|
$
|
9,508.1
|
$
|
430.2
|
4.52
|
%
|
||||||||||||
|
Residential mortgage loans
|
1,960.4
|
81.2
|
4.14
|
%
|
1,791.9
|
82.7
|
4.61
|
%
|
||||||||||||||||
|
Consumer loans
|
1,877.7
|
95.4
|
5.08
|
%
|
1,638.9
|
94.7
|
5.78
|
%
|
||||||||||||||||
|
Loan fees & late charges
|
-
|
(0.1
|
)
|
0.00
|
%
|
-
|
2.4
|
0.00
|
%
|
|||||||||||||||
|
Total loans (TE) (m)
|
14,433.3
|
595.6
|
4.13
|
%
|
12,938.9
|
610.0
|
4.71
|
%
|
||||||||||||||||
|
Loans held for sale
|
18.1
|
0.7
|
3.74
|
%
|
16.5
|
0.7
|
4.28
|
%
|
||||||||||||||||
|
US Treasury and government agency securities
|
197.3
|
3.1
|
1.57
|
%
|
145.2
|
2.3
|
1.62
|
%
|
||||||||||||||||
|
CMOs and mortgage backed securities
|
3,804.0
|
83.5
|
2.19
|
%
|
3,450.9
|
79.6
|
2.31
|
%
|
||||||||||||||||
|
Municipals (TE) (l)
|
199.4
|
9.0
|
4.53
|
%
|
206.4
|
9.5
|
4.61
|
%
|
||||||||||||||||
|
Other securities
|
7.5
|
0.2
|
2.76
|
%
|
14.2
|
0.3
|
2.22
|
%
|
||||||||||||||||
|
Total securities (TE) (k)
|
4,208.2
|
95.8
|
2.28
|
%
|
3,816.7
|
91.7
|
2.40
|
%
|
||||||||||||||||
|
Total short-term investments
|
513.7
|
1.2
|
0.24
|
%
|
423.4
|
1.0
|
0.23
|
%
|
||||||||||||||||
|
Average earning assets yield (TE)
|
$
|
19,173.3
|
693.3
|
3.62
|
%
|
$
|
17,195.5
|
703.4
|
4.09
|
%
|
||||||||||||||
|
INTEREST-BEARING LIABILITIES
|
||||||||||||||||||||||||
|
Interest-bearing transaction and savings deposits
|
$
|
6,877.4
|
12.9
|
0.19
|
%
|
$
|
6,173.7
|
6.7
|
0.11
|
%
|
||||||||||||||
|
Time deposits
|
2,207.4
|
15.6
|
0.70
|
%
|
2,053.5
|
12.8
|
0.62
|
%
|
||||||||||||||||
|
Public funds
|
1,844.8
|
5.4
|
0.30
|
%
|
1,531.0
|
3.7
|
0.24
|
%
|
||||||||||||||||
|
Total interest-bearing deposits
|
10,929.6
|
33.9
|
0.31
|
%
|
9,758.2
|
23.2
|
0.24
|
%
|
||||||||||||||||
|
Short-term borrowings
|
1,025.1
|
1.1
|
0.11
|
%
|
1,005.7
|
2.4
|
0.23
|
%
|
||||||||||||||||
|
Long-term debt
|
482.7
|
19.5
|
4.04
|
%
|
379.7
|
12.5
|
3.30
|
%
|
||||||||||||||||
|
Total borrowings
|
1,507.8
|
20.6
|
1.37
|
%
|
1,385.4
|
14.9
|
1.08
|
%
|
||||||||||||||||
|
Total interest-bearing liabilities cost
|
12,437.4
|
54.5
|
0.44
|
%
|
11,143.6
|
38.1
|
0.34
|
%
|
||||||||||||||||
|
Net interest-free funding sources
|
6,735.9
|
6,051.9
|
||||||||||||||||||||||
|
Total cost of funds
|
19,173.3
|
54.5
|
0.28
|
%
|
17,195.5
|
38.1
|
0.22
|
%
|
||||||||||||||||
|
Net Interest Spread (TE)
|
$
|
638.8
|
3.18
|
%
|
$
|
665.3
|
3.75
|
%
|
||||||||||||||||
|
Net Interest Margin (TE)
|
$
|
19,173.3
|
$
|
638.8
|
3.33
|
%
|
$
|
17,195.5
|
$
|
665.3
|
3.87
|
%
|
||||||||||||
|
(k) Average securities does not include unrealized holding gains/losses on available for sale securities.
|
||||||||||||||||||||||||
|
(l) Tax equivalent (te) amounts are calculated using a marginal federal tax rate of 35%.
|
||||||||||||||||||||||||
|
(m) Includes nonaccrual loans.
|
||||||||||||||||||||||||
14
|
HANCOCK HOLDING COMPANY
ASSET QUALITY INFORMATION
(Unaudited)
|
||||||||||||||||||||
|
|
||||||||||||||||||||
|
Three Months Ended
|
Twelve Months Ended
|
|||||||||||||||||||
|
(dollars in thousands)
|
12/31/2015
|
9/30/2015
|
12/31/2014
|
12/31/2015
|
12/31/2014
|
|||||||||||||||
|
Nonaccrual loans (n)
|
$
|
159,713
|
$
|
166,945
|
$
|
79,537
|
$
|
159,713
|
$
|
79,537
|
||||||||||
|
Restructured loans - still accruing
|
4,297
|
5,779
|
8,971
|
4,297
|
8,971
|
|||||||||||||||
|
Total nonperforming loans
|
164,010
|
172,724
|
88,508
|
164,010
|
88,508
|
|||||||||||||||
|
ORE and foreclosed assets
|
27,133
|
33,599
|
59,569
|
27,133
|
59,569
|
|||||||||||||||
|
Total nonperforming assets
|
$
|
191,143
|
$
|
206,323
|
$
|
148,077
|
$
|
191,143
|
$
|
148,077
|
||||||||||
|
Nonperforming assets as a percent of loans, ORE and foreclosed assets
|
1.22
|
%
|
1.39
|
%
|
1.06
|
%
|
1.22
|
%
|
1.06
|
%
|
||||||||||
|
Accruing loans 90 days past due
|
$
|
7,653
|
$
|
5,876
|
$
|
4,825
|
$
|
7,653
|
$
|
4,825
|
||||||||||
|
Accruing loans 90 days past due as a percent of loans
|
0.05
|
%
|
0.04
|
%
|
0.03
|
%
|
0.05
|
%
|
0.03
|
%
|
||||||||||
|
Nonperforming assets + accruing loans 90 days past due
|
||||||||||||||||||||
|
to loans, ORE and foreclosed assets
|
1.26
|
%
|
1.43
|
%
|
1.10
|
%
|
1.26
|
%
|
1.10
|
%
|
||||||||||
|
ALLOWANCE FOR LOAN LOSSES
|
||||||||||||||||||||
|
Beginning Balance
|
$
|
139,576
|
$
|
131,087
|
$
|
125,572
|
$
|
128,762
|
$
|
133,626
|
||||||||||
|
Net provision for loan losses - FDIC acquired loans
|
(1,669
|
)
|
(437
|
)
|
(160
|
)
|
(3,055
|
)
|
(926
|
)
|
||||||||||
|
Provision for loan losses - non-FDIC acquired loans
|
51,865
|
10,517
|
9,878
|
76,093
|
34,766
|
|||||||||||||||
|
Net provision for loan losses
|
50,196
|
10,080
|
9,718
|
73,038
|
33,840
|
|||||||||||||||
|
(Decrease)increase in FDIC loss share receivable
|
(816
|
)
|
552
|
(4,514
|
)
|
(2,800
|
)
|
(19,084
|
)
|
|||||||||||
|
Net charge-offs - FDIC acquired
|
(100
|
)
|
(1,328
|
)
|
(624
|
)
|
1,609
|
2,501
|
||||||||||||
|
Charge-offs - non-FDIC acquired
|
11,602
|
5,972
|
8,229
|
29,163
|
31,502
|
|||||||||||||||
|
Recoveries - non-FDIC acquired
|
(3,725
|
)
|
(2,501
|
)
|
(5,591
|
)
|
(12,951
|
)
|
(14,383
|
)
|
||||||||||
|
Net charge-offs
|
7,777
|
2,143
|
2,014
|
17,821
|
19,620
|
|||||||||||||||
|
Ending Balance
|
$
|
181,179
|
$
|
139,576
|
$
|
128,762
|
$
|
181,179
|
$
|
128,762
|
||||||||||
|
Allowance for loan losses as a percent of period-end loans
|
1.15
|
%
|
0.95
|
%
|
0.93
|
%
|
1.15
|
%
|
0.93
|
%
|
||||||||||
|
Allowance for loan losses to nonperforming loans + accruing loans 90 days past due
|
105.54 | % | 78.15 | % | 137.96 | % | 105.54 | % | 137.96 | % | ||||||||||
|
NET CHARGE-OFF INFORMATION
|
||||||||||||||||||||
|
Net charge-offs - non-FDIC acquired:
|
||||||||||||||||||||
|
Commercial & real estate loans
|
$
|
2,465
|
$
|
666
|
$
|
1,446
|
$
|
2,914
|
$
|
6,437
|
||||||||||
|
Residential mortgage loans
|
75
|
30
|
349
|
948
|
1,641
|
|||||||||||||||
|
Consumer loans
|
5,337
|
2,775
|
843
|
12,350
|
9,041
|
|||||||||||||||
|
Total net charge-offs - non-FDIC acquired
|
$
|
7,877
|
$
|
3,471
|
$
|
2,638
|
$
|
16,212
|
$
|
17,119
|
||||||||||
|
Net charge-offs - non-FDIC acquired to average loans:
|
||||||||||||||||||||
|
Commercial & real estate loans
|
0.09
|
%
|
0.02
|
%
|
0.06
|
%
|
0.03
|
%
|
0.07
|
%
|
||||||||||
|
Residential mortgage loans
|
0.01
|
%
|
0.01
|
%
|
0.07
|
%
|
0.05
|
%
|
0.09
|
%
|
||||||||||
|
Consumer loans
|
1.04
|
%
|
0.57
|
%
|
0.19
|
%
|
0.66
|
%
|
0.55
|
%
|
||||||||||
|
Total net charge-offs - non-FDIC acquired to average loans
|
0.21
|
%
|
0.09
|
%
|
0.08
|
%
|
0.11
|
%
|
0.13
|
%
|
||||||||||
|
(n) Nonaccrual loans and accruing loans past due 90 days or more do not include acquired credit-impaired loans which were written down to fair value upon acquisition and accrete interest income over the remaining life of the loan. Included in nonaccrual loans are $8.8 million, $4.9 million, and $7.0 million at 12/31/15, 9/30/15 and 12/31/14, respectively, in nonaccruing restructured loans.
|
||||||||||||||||||||
15
|
HANCOCK HOLDING COMPANY
ASSET QUALITY INFORMATION
(Unaudited)
|
||||||||||||||||||||
|
|
||||||||||||||||||||
|
Three months ended
|
||||||||||||||||||||
|
(dollars in thousands)
|
12/31/2015
|
9/30/2015
|
6/30/2015
|
3/31/2015
|
12/31/2014
|
|||||||||||||||
|
Nonaccrual loans (n)
|
$
|
159,713
|
$
|
166,945
|
$
|
118,445
|
$
|
90,821
|
$
|
79,537
|
||||||||||
|
Restructured loans - still accruing
|
4,297
|
5,779
|
7,966
|
7,564
|
8,971
|
|||||||||||||||
|
Total nonperforming loans
|
164,010
|
172,724
|
126,411
|
98,385
|
88,508
|
|||||||||||||||
|
ORE and foreclosed assets
|
27,133
|
33,599
|
38,630
|
42,956
|
59,569
|
|||||||||||||||
|
Total nonperforming assets
|
$
|
191,143
|
$
|
206,323
|
$
|
165,041
|
$
|
141,341
|
$
|
148,077
|
||||||||||
|
Nonperforming assets as a percent of loans, ORE and foreclosed assets
|
1.22
|
%
|
1.39
|
%
|
1.15
|
%
|
1.01
|
%
|
1.06
|
%
|
||||||||||
|
Accruing loans 90 days past due
|
$
|
7,653
|
$
|
5,876
|
$
|
3,478
|
$
|
5,872
|
$
|
4,825
|
||||||||||
|
Accruing loans 90 days past due as a percent of loans
|
0.05
|
%
|
0.04
|
%
|
0.02
|
%
|
0.04
|
%
|
0.03
|
%
|
||||||||||
|
Nonperforming assets + accruing loans 90 days past due
|
||||||||||||||||||||
|
to loans, ORE and foreclosed assets
|
1.26
|
%
|
1.43
|
%
|
1.17
|
%
|
1.05
|
%
|
1.10
|
%
|
||||||||||
|
Allowance for loan losses
|
$
|
181,179
|
$
|
139,576
|
$
|
131,087
|
$
|
128,386
|
$
|
128,762
|
||||||||||
|
Allowance for loan losses as a percent of period-end loans
|
1.15
|
%
|
0.95
|
%
|
0.91
|
%
|
0.92
|
%
|
0.93
|
%
|
||||||||||
|
Allowance for loan losses to nonperforming loans + accruing loans 90 days past due
|
105.54
|
% |
78.15
|
% |
100.92
|
% | 123.14 | % | 137.96 | % | ||||||||||
|
Provision for loan losses
|
$
|
50,196
|
$
|
10,080
|
$
|
6,608
|
$
|
6,154
|
$
|
9,718
|
||||||||||
|
NET CHARGE-OFF INFORMATION
|
||||||||||||||||||||
|
Net charge-offs - non-FDIC acquired:
|
||||||||||||||||||||
|
Commercial & real estate loans
|
$
|
2,465
|
$
|
666
|
$
|
(691
|
)
|
$
|
474
|
$
|
1,446
|
|||||||||
|
Residential mortgage loans
|
75
|
30
|
(61
|
)
|
904
|
349
|
||||||||||||||
|
Consumer loans
|
5,337
|
2,775
|
1,962
|
2,276
|
843
|
|||||||||||||||
|
Total net charge-offs - non-FDIC acquired
|
$
|
7,877
|
$
|
3,471
|
$
|
1,210
|
$
|
3,654
|
$
|
2,638
|
||||||||||
|
Net charge-offs - non-FDIC acquired to average loans:
|
||||||||||||||||||||
|
Commercial & real estate loans
|
0.09
|
%
|
0.02
|
%
|
(0.03
|
)%
|
0.02
|
%
|
0.06
|
%
|
||||||||||
|
Residential mortgage loans
|
0.01
|
%
|
0.01
|
%
|
(0.01
|
)%
|
0.19
|
%
|
0.07
|
%
|
||||||||||
|
Consumer loans
|
1.04
|
%
|
0.57
|
%
|
0.43
|
%
|
0.53
|
%
|
0.19
|
%
|
||||||||||
|
Total net charge-offs - non-FDIC acquired to average loans
|
0.21
|
%
|
0.09
|
%
|
0.03
|
%
|
0.11
|
%
|
0.08
|
%
|
||||||||||
|
AVERAGE LOANS
|
||||||||||||||||||||
|
Commercial & real estate loans
|
$
|
11,128,872
|
$
|
10,608,244
|
$
|
10,398,508
|
$
|
10,235,268
|
$
|
9,943,403
|
||||||||||
|
Residential mortgage loans
|
2,028,688
|
1,977,990
|
1,930,553
|
1,902,873
|
1,886,230
|
|||||||||||||||
|
Consumer loans
|
2,040,672
|
1,925,240
|
1,809,843
|
1,731,256
|
1,748,590
|
|||||||||||||||
|
Total average loans
|
$
|
15,198,232
|
$
|
14,511,474
|
$
|
14,138,904
|
$
|
13,869,397
|
$
|
13,578,223
|
||||||||||
|
(n) Nonaccrual loans and accruing loans past due 90 days or more do not include acquired credit-impaired loans which were written down to fair value upon acquisition and accrete interest income over the remaining life of the loan. Included in nonaccrual loans are $8.8 million, $4.9 million, $4.9 million, $5.0 million, and $7.0 million at 12/31/15, 9/30/15, 06/30/15, 03/31/15, and 12/31/14, respectively, in nonaccruing restructured loans.
|
||||||||||||||||||||
16
|
HANCOCK HOLDING COMPANY
SUPPLEMENTAL ASSET QUALITY INFORMATION
(Unaudited)
|
||||||||||||||||
|
|
||||||||||||||||
| Originated Loans | Acquired Loans (o) | FDIC Acquired (p) | Total | |||||||||||||
|
(dollars in thousands)
|
|
12/31/2015 | ||||||||||||||
|
Nonaccrual loans (q)
|
$
|
156,721
|
$
|
2,992
|
-
|
$
|
159,713
|
|||||||||
|
Restructured loans - still accruing
|
4,297
|
-
|
-
|
4,297
|
||||||||||||
|
Total nonperforming loans
|
161,018
|
2,992
|
-
|
164,010
|
||||||||||||
|
ORE and foreclosed assets (r)
|
18,580
|
-
|
8,553
|
27,133
|
||||||||||||
|
Total nonperforming assets
|
$
|
179,598
|
$
|
2,992
|
$
|
8,553
|
$
|
191,143
|
||||||||
|
Accruing loans 90 days past due
|
$
|
7,653
|
-
|
-
|
$
|
7,653
|
||||||||||
|
Allowance for loan losses
|
$
|
158,026
|
$
|
33
|
$
|
23,120
|
$
|
181,179
|
||||||||
|
|
9/30/2015 | |||||||||||||||
|
Nonaccrual loans (q)
|
$
|
163,930
|
$
|
3,015
|
-
|
$
|
166,945
|
|||||||||
|
Restructured loans - still accruing
|
5,779
|
-
|
-
|
5,779
|
||||||||||||
|
Total nonperforming loans
|
169,709
|
3,015
|
-
|
172,724
|
||||||||||||
|
ORE and foreclosed assets (r)
|
21,849
|
-
|
11,750
|
33,599
|
||||||||||||
|
Total nonperforming assets
|
$
|
191,558
|
$
|
3,015
|
$
|
11,750
|
$
|
206,323
|
||||||||
|
Accruing loans 90 days past due
|
$
|
5,747
|
129
|
-
|
$
|
5,876
|
||||||||||
|
Allowance for loan losses
|
$
|
113,898
|
$
|
173
|
$
|
25,505
|
$
|
139,576
|
||||||||
| Originated Loans | Acquired Loans (o) | FDIC Acquired (p) | Total | |||||||||||||
|
LOANS OUTSTANDING
|
|
12/31/2015 | ||||||||||||||
|
Commercial non-real estate loans
|
$
|
6,930,453
|
$
|
59,843
|
$
|
5,528
|
$
|
6,995,824
|
||||||||
|
Construction and land development loans
|
1,139,743
|
5,080
|
7,127
|
1,151,950
|
||||||||||||
|
Commercial real estate loans
|
3,220,509
|
176,460
|
15,582
|
3,412,551
|
||||||||||||
|
Residential mortgage loans
|
1,887,256
|
27
|
162,241
|
2,049,524
|
||||||||||||
|
Consumer loans
|
2,080,626
|
20
|
12,819
|
2,093,465
|
||||||||||||
|
Total loans
|
$
|
15,258,587
|
$
|
241,430
|
$
|
203,297
|
$
|
15,703,314
|
||||||||
|
Change in loan balance from previous quarter
|
$
|
1,180,400
|
$
|
(228,589
|
)
|
$
|
(11,547
|
)
|
$
|
940,264
|
||||||
|
|
9/30/2015 | |||||||||||||||
|
Commercial non-real estate loans
|
$
|
6,232,310
|
$
|
107,985
|
$
|
5,699
|
$
|
6,345,994
|
||||||||
|
Construction and land development loans
|
1,068,895
|
8,297
|
8,393
|
1,085,585
|
||||||||||||
|
Commercial real estate loans
|
2,956,354
|
352,896
|
18,136
|
3,327,386
|
||||||||||||
|
Residential mortgage loans
|
1,843,756
|
819
|
169,214
|
2,013,789
|
||||||||||||
|
Consumer loans
|
1,976,872
|
22
|
13,402
|
1,990,296
|
||||||||||||
|
Total loans
|
$
|
14,078,187
|
$
|
470,019
|
$
|
214,844
|
$
|
14,763,050
|
||||||||
|
Change in loan balance from previous quarter
|
$
|
687,696
|
$
|
(259,605
|
)
|
$
|
(9,793
|
)
|
$
|
418,298
|
||||||
|
(o) Loans which have been acquired and no allowance brought forward in accordance with acquisition accounting. Acquired-performing loans in pools with fully accreted purchase fair value discounts are reported as originated loans.
|
||||||||||||||||
|
(p) Loans acquired in an FDIC-assisted transaction. Non-single family loss share agreement expired at 12/31/14. As of 12/31/15, $170.1 million in loans and $1.7 million in ORE remain covered by the FDIC single family loss share agreement, providing considerable protection against credit risk. As of 9/30/15, $177.5 million in loans and $2.3 million in ORE remained covered by the FDIC single family loss share agreement.
|
||||||||||||||||
|
(q) Included in originated nonaccrual loans are $8.8 million and $4.9 million at 12/31/15 and 9/30/15, respectively, in nonaccruing restructured loans.
|
||||||||||||||||
|
(r) ORE received in settlement of acquired loans is no longer subject to purchase accounting guidance and has been included with ORE from originated loans. ORE received in settlement of covered loans remains covered under the FDIC loss share agreements.
|
||||||||||||||||
17

Fourth Quarter 2015Financial Results January 21, 2016

Certain of the statements or information included in this presentation may constitute forward-looking statements. Forward-looking statements include projections of revenue, costs, results of operations or financial condition or statements regarding future market conditions or our potential plans and strategies for the future. Hancock’s ability to accurately project results, predict the effects of future plans or strategies, or predict market or economic developments is inherently limited. We believe that the expectations reflected or implied by any forward-looking statements are based on reasonable assumptions, but actual results and performance could differ materially from those set forth in the forward-looking statements. Factors that could cause actual results or outcomes to differ from those expressed in the Company's forward-looking statements include, but are not limited to, those outlined in Hancock's SEC filings, including the “Risk Factors” section of the Company’s 10-K for the year ended December 31, 2014, and as updated by the Company’s subsequent SEC filings. Hancock undertakes no obligation to update or revise any forward-looking statements, and you are cautioned not to place undue reliance on such forward-looking statements. Forward Looking Statements 2

Hancock Holding Company $22.8 billion in Total Assets$15.7 billion in Total Loans$18.3 billion in Total DepositsTangible Common Equity (TCE) 7.62%Nearly 200 banking locations and 275 ATMs across a five-state footprintApproximately 4,000 employees corporate-wideRated among the strongest, safest financial institutions in the country by BauerFinancial, Inc.Earned top customer service marks with Greenwich Excellence Awards As of December 31, 2015 3
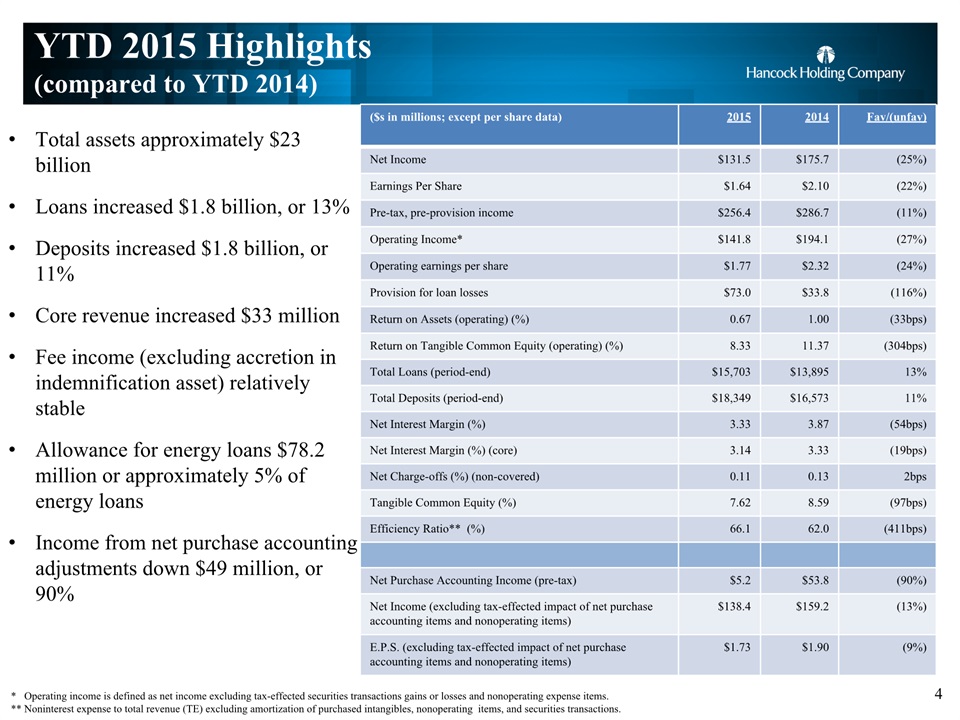
YTD 2015 Highlights(compared to YTD 2014) Total assets approximately $23 billionLoans increased $1.8 billion, or 13% Deposits increased $1.8 billion, or 11%Core revenue increased $33 millionFee income (excluding accretion in indemnification asset) relatively stableAllowance for energy loans $78.2 million or approximately 5% of energy loansIncome from net purchase accounting adjustments down $49 million, or 90% ($s in millions; except per share data) 2015 2014 Fav/(unfav) Net Income $131.5 $175.7 (25%) Earnings Per Share $1.64 $2.10 (22%) Pre-tax, pre-provision income $256.4 $286.7 (11%) Operating Income* $141.8 $194.1 (27%) Operating earnings per share $1.77 $2.32 (24%) Provision for loan losses $73.0 $33.8 (116%) Return on Assets (operating) (%) 0.67 1.00 (33bps) Return on Tangible Common Equity (operating) (%) 8.33 11.37 (304bps) Total Loans (period-end) $15,703 $13,895 13% Total Deposits (period-end) $18,349 $16,573 11% Net Interest Margin (%) 3.33 3.87 (54bps) Net Interest Margin (%) (core) 3.14 3.33 (19bps) Net Charge-offs (%) (non-covered) 0.11 0.13 2bps Tangible Common Equity (%) 7.62 8.59 (97bps) Efficiency Ratio** (%) 66.1 62.0 (411bps) Net Purchase Accounting Income (pre-tax) $5.2 $53.8 (90%) Net Income (excluding tax-effected impact of net purchase accounting items and nonoperating items) $138.4 $159.2 (13%) E.P.S. (excluding tax-effected impact of net purchase accounting items and nonoperating items) $1.73 $1.90 (9%) 4 * Operating income is defined as net income excluding tax-effected securities transactions gains or losses and nonoperating expense items. ** Noninterest expense to total revenue (TE) excluding amortization of purchased intangibles, nonoperating items, and securities transactions.
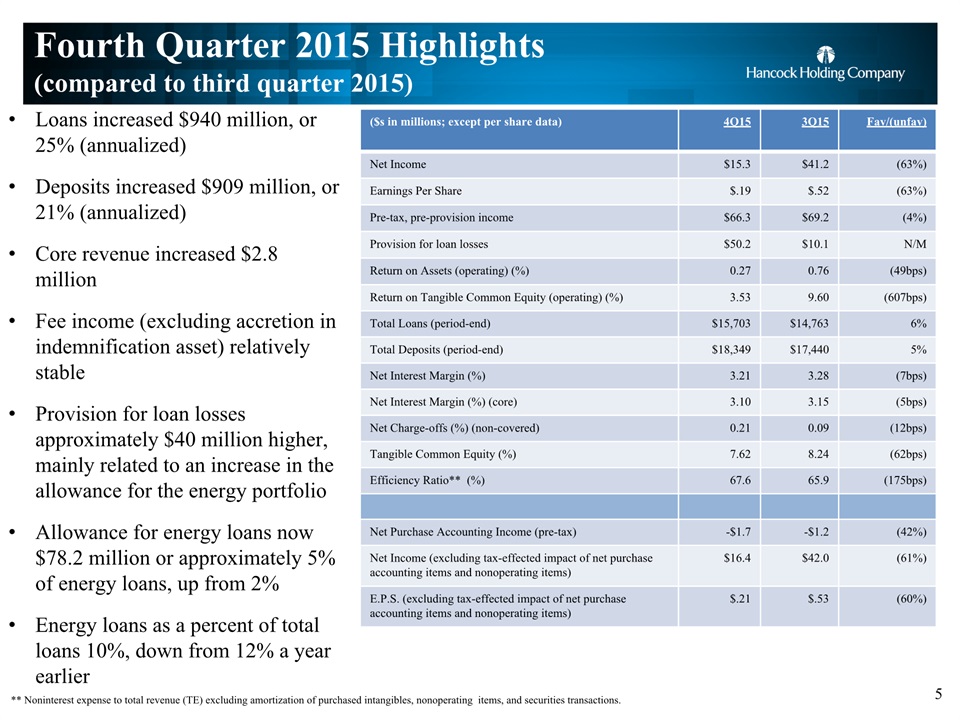
Fourth Quarter 2015 Highlights(compared to third quarter 2015) Loans increased $940 million, or 25% (annualized)Deposits increased $909 million, or 21% (annualized)Core revenue increased $2.8 millionFee income (excluding accretion in indemnification asset) relatively stableProvision for loan losses approximately $40 million higher, mainly related to an increase in the allowance for the energy portfolioAllowance for energy loans now $78.2 million or approximately 5% of energy loans, up from 2%Energy loans as a percent of total loans 10%, down from 12% a year earlier ($s in millions; except per share data) 4Q15 3Q15 Fav/(unfav) Net Income $15.3 $41.2 (63%) Earnings Per Share $.19 $.52 (63%) Pre-tax, pre-provision income $66.3 $69.2 (4%) Provision for loan losses $50.2 $10.1 N/M Return on Assets (operating) (%) 0.27 0.76 (49bps) Return on Tangible Common Equity (operating) (%) 3.53 9.60 (607bps) Total Loans (period-end) $15,703 $14,763 6% Total Deposits (period-end) $18,349 $17,440 5% Net Interest Margin (%) 3.21 3.28 (7bps) Net Interest Margin (%) (core) 3.10 3.15 (5bps) Net Charge-offs (%) (non-covered) 0.21 0.09 (12bps) Tangible Common Equity (%) 7.62 8.24 (62bps) Efficiency Ratio** (%) 67.6 65.9 (175bps) Net Purchase Accounting Income (pre-tax) -$1.7 -$1.2 (42%) Net Income (excluding tax-effected impact of net purchase accounting items and nonoperating items) $16.4 $42.0 (61%) E.P.S. (excluding tax-effected impact of net purchase accounting items and nonoperating items) $.21 $.53 (60%) 5 ** Noninterest expense to total revenue (TE) excluding amortization of purchased intangibles, nonoperating items, and securities transactions.
Fourth Quarter 2015 Highlights(compared to third quarter 2015) Loans increased $940 million, or 25% (annualized)Deposits increased $909 million, or 21% (annualized)Core revenue increased $2.8 millionFee income (excluding accretion in indemnification asset) relatively stableProvision for loan losses approximately $40 million higher, mainly related to an increase in the allowance for the energy portfolioAllowance for energy loans now $78.2 million or approximately 5% of energy loans, up from 2%Energy loans as a percent of total loans 10%, down from 12% a year earlier ($s in millions; except per share data) 4Q15 3Q15 Fav/(unfav) Net Income $15.3 $41.2 (63%) Earnings Per Share $.19 $.52 (63%) Pre-tax, pre-provision income $66.3 $69.2 (4%) Provision for loan losses $50.2 $10.1 N/M Return on Assets (operating) (%) 0.27 0.76 (49bps) Return on Tangible Common Equity (operating) (%) 3.53 9.60 (607bps) Total Loans (period-end) $15,703 $14,763 6% Total Deposits (period-end) $18,349 $17,440 5% Net Interest Margin (%) 3.21 3.28 (7bps) Net Interest Margin (%) (core) 3.10 3.15 (5bps) Net Charge-offs (%) (non-covered) 0.21 0.09 (12bps) Tangible Common Equity (%) 7.62 8.24 (62bps) Efficiency Ratio** (%) 67.6 65.9 (175bps) Net Purchase Accounting Income (pre-tax) -$1.7 -$1.2 (42%) Net Income (excluding tax-effected impact of net purchase accounting items and nonoperating items) $16.4 $42.0 (61%) E.P.S. (excluding tax-effected impact of net purchase accounting items and nonoperating items) $.21 $.53 (60%) 5 ** Noninterest expense to total revenue (TE) excluding amortization of purchased intangibles, nonoperating items, and securities transactions.
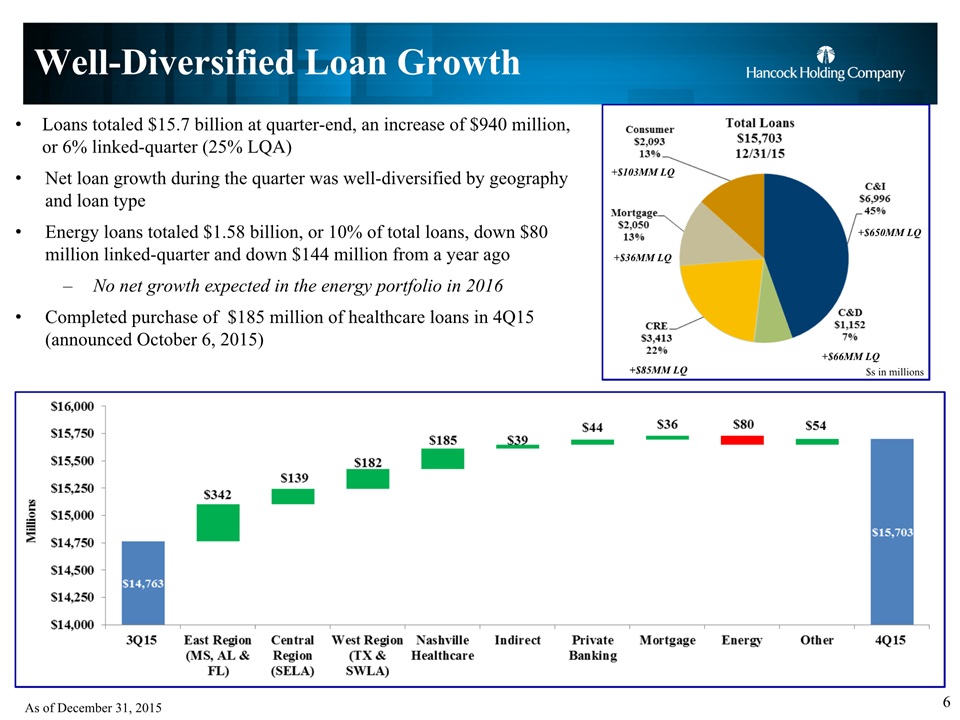
Well-Diversified Loan Growth Loans totaled $15.7 billion at quarter-end, an increase of $940 million, or 6% linked-quarter (25% LQA)Net loan growth during the quarter was well-diversified by geography and loan typeEnergy loans totaled $1.58 billion, or 10% of total loans, down $80 million linked-quarter and down $144 million from a year agoNo net growth expected in the energy portfolio in 2016Completed purchase of $185 million of healthcare loans in 4Q15 (announced October 6, 2015) $s in millions 6 +$650MM LQ +$66MM LQ +$85MM LQ +$36MM LQ +$103MM LQ As of December 31, 2015
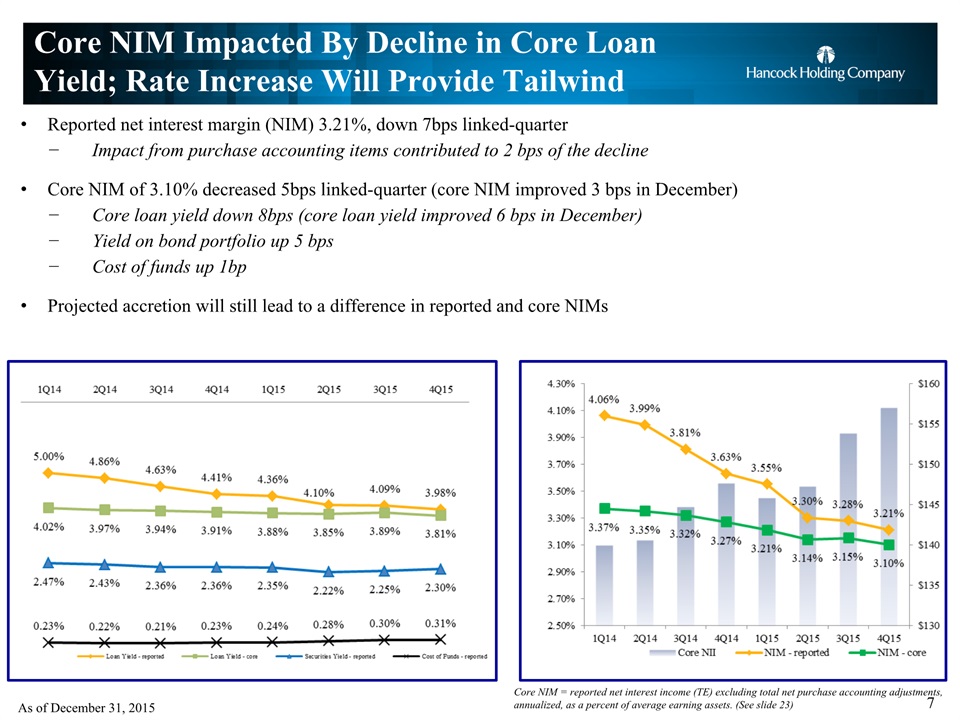
Core NIM Impacted By Decline in Core Loan Yield; Rate Increase Will Provide Tailwind Core NIM = reported net interest income (TE) excluding total net purchase accounting adjustments, annualized, as a percent of average earning assets. (See slide 23) Reported net interest margin (NIM) 3.21%, down 7bps linked-quarter Impact from purchase accounting items contributed to 2 bps of the declineCore NIM of 3.10% decreased 5bps linked-quarter (core NIM improved 3 bps in December)Core loan yield down 8bps (core loan yield improved 6 bps in December)Yield on bond portfolio up 5 bps Cost of funds up 1bpProjected accretion will still lead to a difference in reported and core NIMs 7 As of December 31, 2015

Energy Portfolio Well-Managed The allowance for the energy portfolio was increased in the fourth quarter to $78.2 millionManagement currently estimates that charge-offs from energy-related credits could approximate $50-$75 million over the duration of the cycle 8 As of December 31, 2015 $s in billions Approximately $70 million in payoffs in 4Q15; approximately $200 million in payoffs for 2015
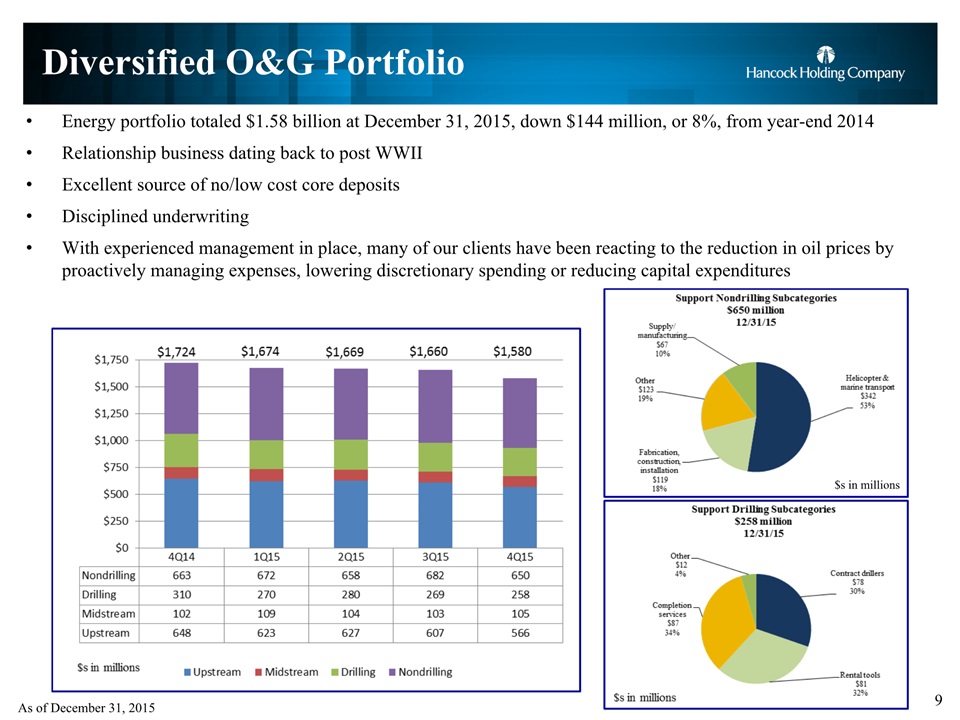
Diversified O&G Portfolio 9 As of December 31, 2015 Energy portfolio totaled $1.58 billion at December 31, 2015, down $144 million, or 8%, from year-end 2014Relationship business dating back to post WWIIExcellent source of no/low cost core depositsDisciplined underwritingWith experienced management in place, many of our clients have been reacting to the reduction in oil prices by proactively managing expenses, lowering discretionary spending or reducing capital expenditures $s in millions

Energy Portfolio Statistics Borrowing base redeterminations twice per year (spring and fall); all credits were reviewed in 4Q15 and adjustments made to overall commitment levelsRBL commitments reduced approximately 15% on average in the spring of 2015 due to lower commodity prices, and again reduced an additional 9-10% on average in the fall redetermination due to continued low commodity pricesOur clients breakeven at different prices/barrel oil Breakeven varies depending on the basinOur customers are diversified across 12 primary basins in the U.S. and in the Gulf of MexicoApproximately $41 million linked-quarter decrease in E&P outstandings; Priority, secured loans; approximately 60% oil, 40% gasCurrent line utilization is approximately 63%, down slightly linked-quarterLend only on proved reserves (on a risked basis); 90%+ are covered by Proved Developed Producing Reserves aloneApproximately $42 million linked-quarter decrease in support sector outstandings; Current line utilization is approximately 63%Credits with working capital lines have 47% line utilization 10 As of December 31, 2015
Energy Allowance and Balance Trends 11 Total outstandingat 3-31-15 Total outstandingat 6-30-15 Total outstandingat 9-30-15 Total outstandingat 12-31-15 Energy ALLL3-31-15 Energy ALLL6-30-15 Energy ALLL9-30-15 Energy ALLL12-31-15 $623MM $627MM $607MM $566MM Upstream $5.0MM $10.1MM $11.0MM $12.7MM $109MM $104MM $103MM $105MM Midstream $0.6MM $0.7MM $0.7MM $0.7MM $270MM $280MM $269MM $258MM Support – Drilling $4.1MM $7.9MM $7.4MM $33.1MM $672MM $658MM $682MM $650MM Support – Non-drilling $10.3MM $11.9MM $16.1MM $31.7MM $1.67B $1.67B $1.66B $1.58B Total Energy Allowance (%) $20.0MM (1.17%) $30.6MM (1.91%) $35.2MM (2.12%) $78.2MM(4.95%) Management currently estimates that charge-offs from energy-related credits could approximate $50-$75 million over the duration of the cycle; Charge-offs for 2015 totaled $3.75 million
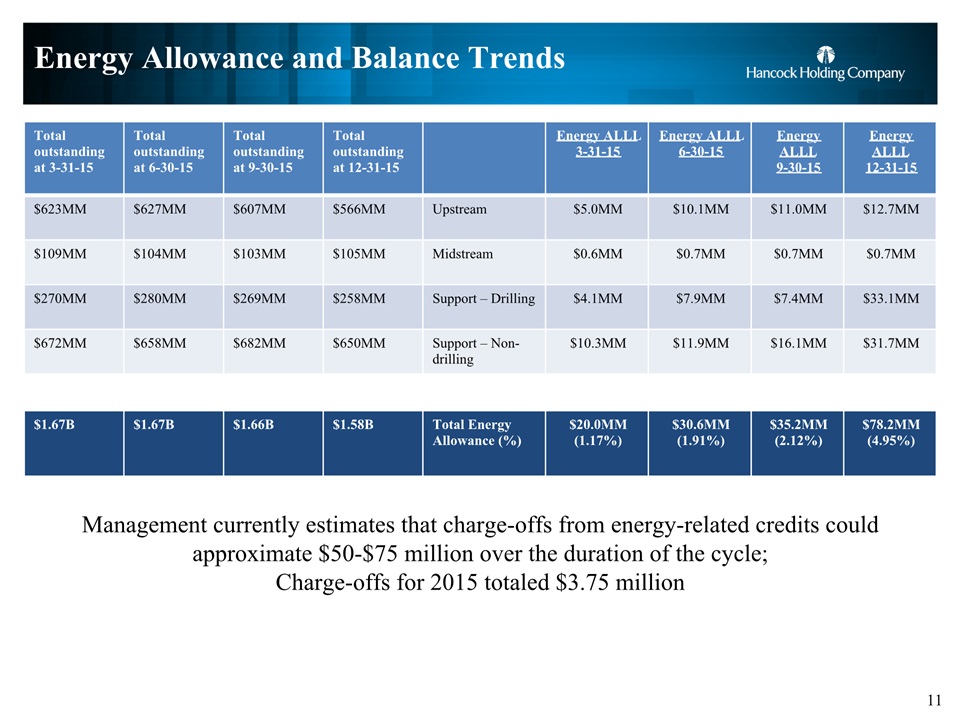
Energy Allowance and Balance Trends 11 Total outstandingat 3-31-15 Total outstandingat 6-30-15 Total outstandingat 9-30-15 Total outstandingat 12-31-15 Energy ALLL3-31-15 Energy ALLL6-30-15 Energy ALLL9-30-15 Energy ALLL12-31-15 $623MM $627MM $607MM $566MM Upstream $5.0MM $10.1MM $11.0MM $12.7MM $109MM $104MM $103MM $105MM Midstream $0.6MM $0.7MM $0.7MM $0.7MM $270MM $280MM $269MM $258MM Support – Drilling $4.1MM $7.9MM $7.4MM $33.1MM $672MM $658MM $682MM $650MM Support – Non-drilling $10.3MM $11.9MM $16.1MM $31.7MM $1.67B $1.67B $1.66B $1.58B Total Energy Allowance (%) $20.0MM (1.17%) $30.6MM (1.91%) $35.2MM (2.12%) $78.2MM(4.95%) Management currently estimates that charge-offs from energy-related credits could approximate $50-$75 million over the duration of the cycle; Charge-offs for 2015 totaled $3.75 million
Asset Quality Measures Reflect Impact Of Energy Cycle NPA ratio 1.22%, down 17 bps linked-quarter Nonperforming assets totaled $191 million, down $15.2 million from September 30, 2015Nonperforming energy loans totaled $70 million at December 31, 2015, down $28 million from last quarterProvision for loan losses was $50.2 million, up $40.1 million from 3Q15Increase for energy allowance added $43 million to fourth quarter 2015 loan loss provisionNon-FDIC acquired net charge-offs totaled $7.9 million, or 21 bps, up from $3.5 million, or 9 bps, in 3Q15Energy charge-offs in the fourth quarter of 2015 totaled $3.0 millionCriticized commercial loans totaled $761 million at December 31, 2015, down $45.8 million from September 30, 2015Criticized energy loans totaled $452 million at December 31, 2015, down $16 million linked-quarter Total HBHC Nonaccrual Loans 12 Criticized Loans - Commercial As of December 31, 2015
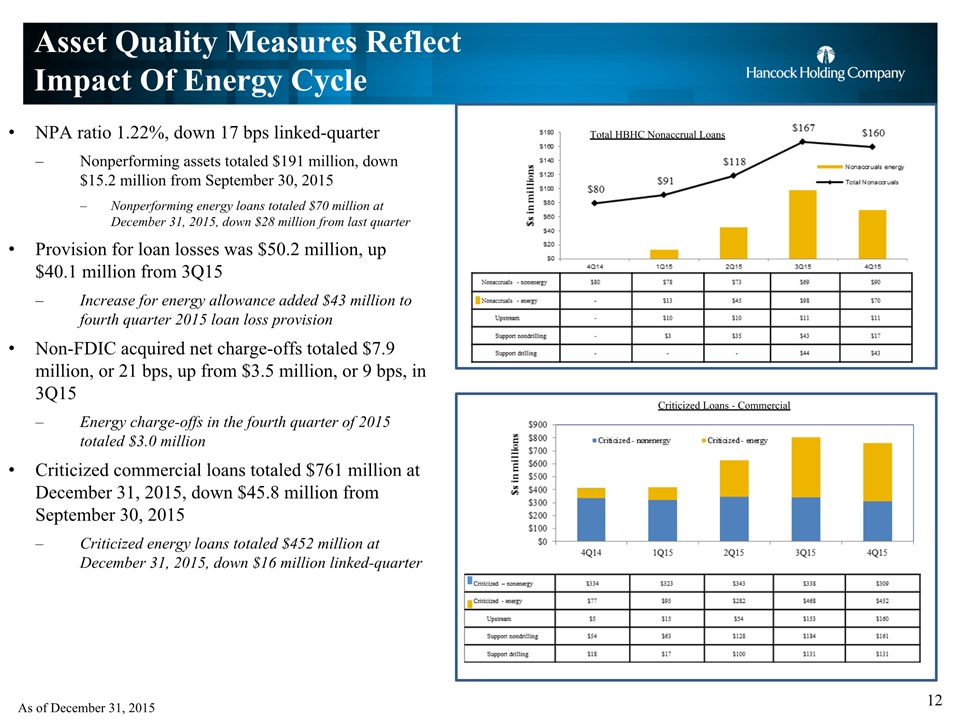
Asset Quality Measures Reflect Impact Of Energy Cycle NPA ratio 1.22%, down 17 bps linked-quarter Nonperforming assets totaled $191 million, down $15.2 million from September 30, 2015Nonperforming energy loans totaled $70 million at December 31, 2015, down $28 million from last quarterProvision for loan losses was $50.2 million, up $40.1 million from 3Q15Increase for energy allowance added $43 million to fourth quarter 2015 loan loss provisionNon-FDIC acquired net charge-offs totaled $7.9 million, or 21 bps, up from $3.5 million, or 9 bps, in 3Q15Energy charge-offs in the fourth quarter of 2015 totaled $3.0 millionCriticized commercial loans totaled $761 million at December 31, 2015, down $45.8 million from September 30, 2015Criticized energy loans totaled $452 million at December 31, 2015, down $16 million linked-quarter Total HBHC Nonaccrual Loans 12 Criticized Loans - Commercial As of December 31, 2015

Allowance For Loan Losses The allowance for loan losses was $181.2 million (1.15%) up $41.6 million from $139.6 million (0.95%) linked-quarterThe allowance maintained on the non-FDIC acquired portion of the loan portfolio increased $44.0 million linked-quarter, totaling $158.1 million, while the allowance on the FDIC acquired loan portfolio decreased approximately $2.4 million linked-quarterImpact of the current energy cycle on the allowance:The fourth quarter’s energy allowance increase of $43.0 million was driven by a change in expectation of the depth and duration of the current energy cycleChanges in collateral values for impaired credits contributed $11 million of increaseQualitative factors related to depth and duration of the cycle added $30 million; we now expect a prolonged period of oversupply which indicates that the cycle will be deeper and longer than prior expectationsRisk rating changes added $2 million of the increaseALLL for energy credits was $78.2 million, or 4.95%, at December 31, 2015, up from $35.2 million, or 2.12%, at September 30, 2015Energy nonaccruals down $28 million linked-quarter; criticized energy loans down $16 million linked-quarterCoverage ratio of nonperforming energy loans increased to 112% at December 31, 2015Coverage ratio of criticized energy loans more than doubled in the fourth quarter of 2015Should pricing pressures on oil continue, we could continue to see downward pressure on risk ratings that could lead to additional provision expense in future quartersImpact and severity will depend on overall oil price reduction and duration of the cycle 13 As of December 31, 2015
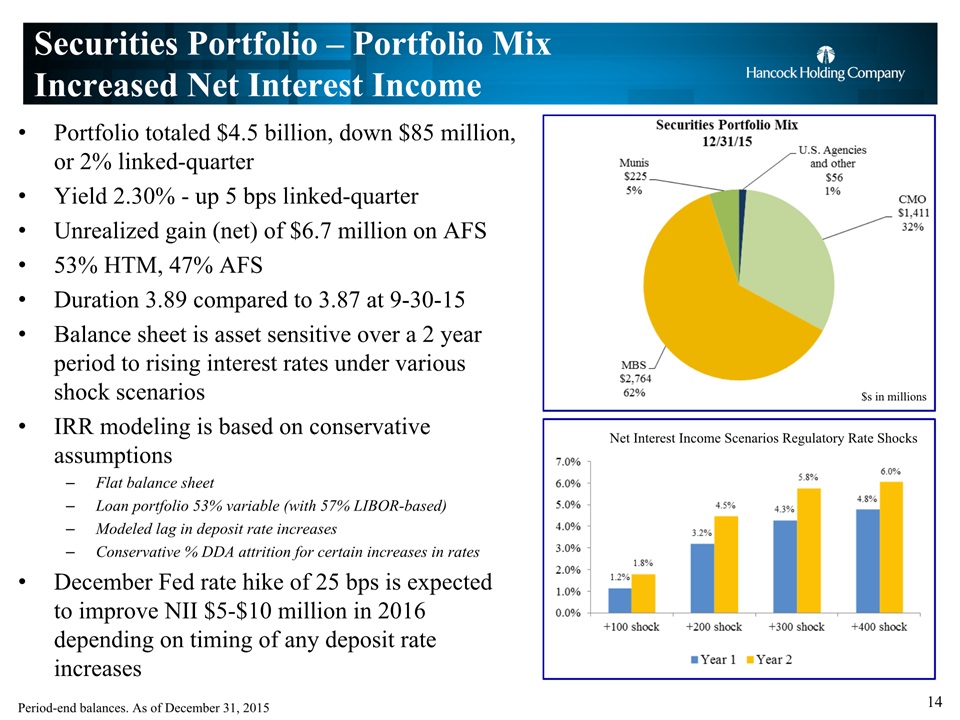
Securities Portfolio – Portfolio Mix Increased Net Interest Income Portfolio totaled $4.5 billion, down $85 million, or 2% linked-quarter Yield 2.30% - up 5 bps linked-quarterUnrealized gain (net) of $6.7 million on AFS53% HTM, 47% AFSDuration 3.89 compared to 3.87 at 9-30-15Balance sheet is asset sensitive over a 2 year period to rising interest rates under various shock scenariosIRR modeling is based on conservative assumptionsFlat balance sheetLoan portfolio 53% variable (with 57% LIBOR-based)Modeled lag in deposit rate increasesConservative % DDA attrition for certain increases in ratesDecember Fed rate hike of 25 bps is expected to improve NII $5-$10 million in 2016 depending on timing of any deposit rate increases $s in millions 14 Net Interest Income Scenarios Regulatory Rate Shocks Period-end balances. As of December 31, 2015
Securities Portfolio – Portfolio Mix Increased Net Interest Income Portfolio totaled $4.5 billion, down $85 million, or 2% linked-quarter Yield 2.30% - up 5 bps linked-quarterUnrealized gain (net) of $6.7 million on AFS53% HTM, 47% AFSDuration 3.89 compared to 3.87 at 9-30-15Balance sheet is asset sensitive over a 2 year period to rising interest rates under various shock scenariosIRR modeling is based on conservative assumptionsFlat balance sheetLoan portfolio 53% variable (with 57% LIBOR-based)Modeled lag in deposit rate increasesConservative % DDA attrition for certain increases in ratesDecember Fed rate hike of 25 bps is expected to improve NII $5-$10 million in 2016 depending on timing of any deposit rate increases $s in millions 14 Net Interest Income Scenarios Regulatory Rate Shocks Period-end balances. As of December 31, 2015
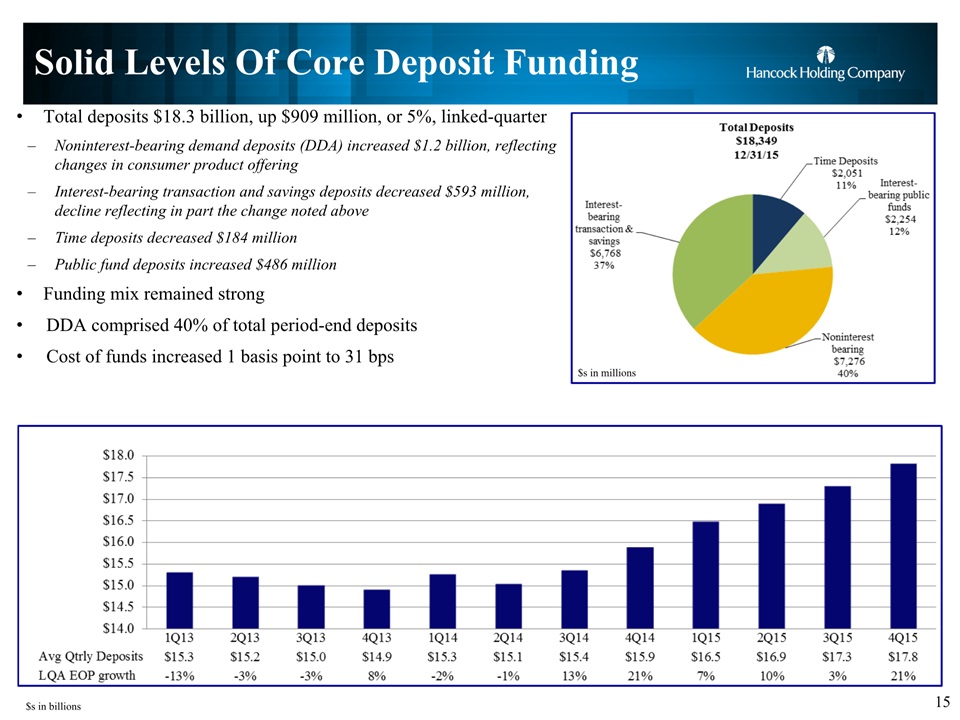
Solid Levels Of Core Deposit Funding Total deposits $18.3 billion, up $909 million, or 5%, linked-quarterNoninterest-bearing demand deposits (DDA) increased $1.2 billion, reflecting changes in consumer product offeringInterest-bearing transaction and savings deposits decreased $593 million, decline reflecting in part the change noted aboveTime deposits decreased $184 million Public fund deposits increased $486 millionFunding mix remained strongDDA comprised 40% of total period-end depositsCost of funds increased 1 basis point to 31 bps $s in billions 15 $s in millions
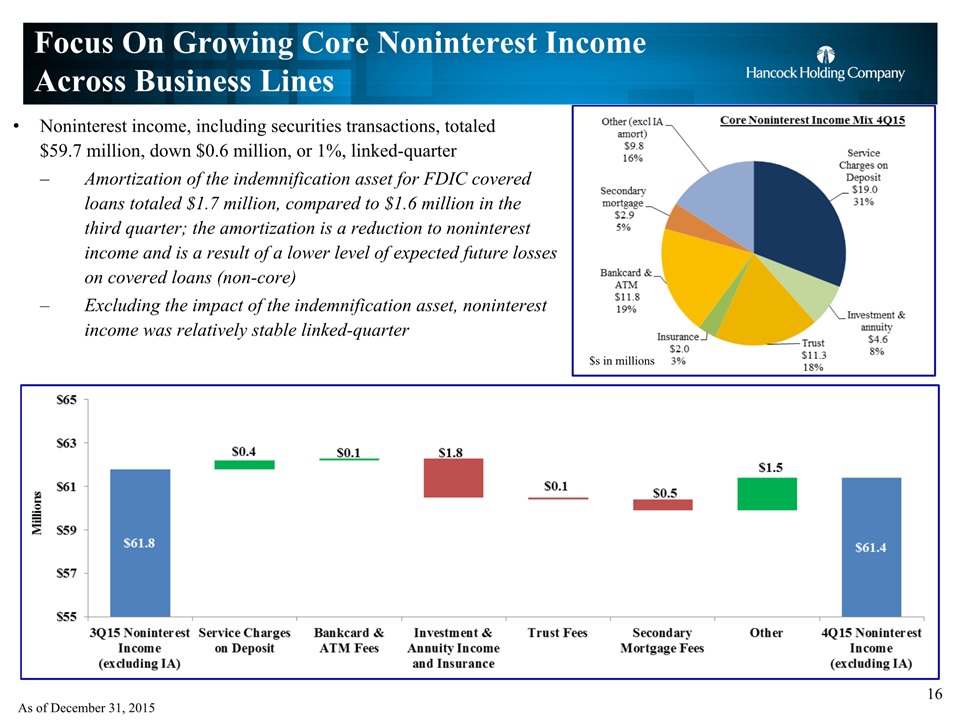
Focus On Growing Core Noninterest Income Across Business Lines Noninterest income, including securities transactions, totaled $59.7 million, down $0.6 million, or 1%, linked-quarterAmortization of the indemnification asset for FDIC covered loans totaled $1.7 million, compared to $1.6 million in the third quarter; the amortization is a reduction to noninterest income and is a result of a lower level of expected future losses on covered loans (non-core)Excluding the impact of the indemnification asset, noninterest income was relatively stable linked-quarter 16 As of December 31, 2015 $s in millions

Quarterly Expenses Increased; Remain Focused On Expense Control Operating expenses totaled $156.0 million in 4Q15, up $4.8 million, or 3%, linked-quarterPersonnel expense totaled $85.3 million, up $1.2 million, or 1%, linked-quarter, mainly related to an increase in salary and incentive expense for revenue initiativesOccupancy and equipment totaled $14.5 million, down $0.3 million, or 2%, linked-quarterORE expense totaled $1.4 million, up $0.9 million linked-quarterAdvertising expense totaled $4.1 million, up $1.2 million linked-quarterOther operating expense increased $2.2 million, or 5%, linked-quarter 17 $s in millions As of December 31, 2015; excluding nonoperating expense items.
Continuing Efforts To Diversify Loan Portfolio Through Healthcare LPO and Team in Nashville 18 Acquired approximately $185 million in healthcare loans in 4Q15Operating today in markets such as Houston with its well-known medical sector, and New Orleans with its revitalized medical district, we see this acquisition of bankers and loans as a strategic fit for our marketsNew LPO in Nashville, known as the healthcare capital of the country, will allow us to better offer our financial products and services to an industry that is growing across our footprintCorporate banking product sophistication should also benefit the clients who are joining us via this transaction and enable this talented team of healthcare bankers to capitalize on additional opportunities available across our footprint As of December 31, 2015
Quarterly Expenses Increased; Remain Focused On Expense Control Operating expenses totaled $156.0 million in 4Q15, up $4.8 million, or 3%, linked-quarterPersonnel expense totaled $85.3 million, up $1.2 million, or 1%, linked-quarter, mainly related to an increase in salary and incentive expense for revenue initiativesOccupancy and equipment totaled $14.5 million, down $0.3 million, or 2%, linked-quarterORE expense totaled $1.4 million, up $0.9 million linked-quarterAdvertising expense totaled $4.1 million, up $1.2 million linked-quarterOther operating expense increased $2.2 million, or 5%, linked-quarter 17 $s in millions As of December 31, 2015; excluding nonoperating expense items.

Continuing Efforts To Diversify Loan Portfolio Through Healthcare LPO and Team in Nashville 18 Acquired approximately $185 million in healthcare loans in 4Q15Operating today in markets such as Houston with its well-known medical sector, and New Orleans with its revitalized medical district, we see this acquisition of bankers and loans as a strategic fit for our marketsNew LPO in Nashville, known as the healthcare capital of the country, will allow us to better offer our financial products and services to an industry that is growing across our footprintCorporate banking product sophistication should also benefit the clients who are joining us via this transaction and enable this talented team of healthcare bankers to capitalize on additional opportunities available across our footprint As of December 31, 2015
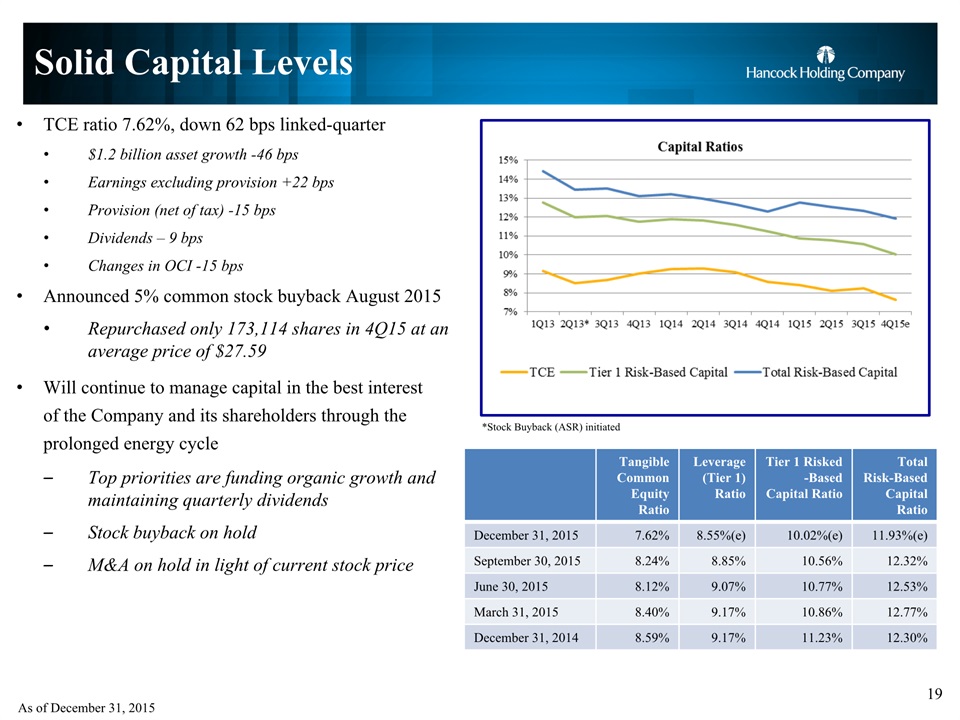
Solid Capital Levels TCE ratio 7.62%, down 62 bps linked-quarter$1.2 billion asset growth -46 bpsEarnings excluding provision +22 bpsProvision (net of tax) -15 bpsDividends – 9 bpsChanges in OCI -15 bpsAnnounced 5% common stock buyback August 2015Repurchased only 173,114 shares in 4Q15 at an average price of $27.59Will continue to manage capital in the best interestof the Company and its shareholders through the prolonged energy cycleTop priorities are funding organic growth and maintaining quarterly dividendsStock buyback on hold M&A on hold in light of current stock price *Stock Buyback (ASR) initiated 19 Tangible Common Equity Ratio Leverage (Tier 1) Ratio Tier 1 Risked-Based Capital Ratio Total Risk-Based Capital Ratio December 31, 2015 7.62% 8.55%(e) 10.02%(e) 11.93%(e) September 30, 2015 8.24% 8.85% 10.56% 12.32% June 30, 2015 8.12% 9.07% 10.77% 12.53% March 31, 2015 8.40% 9.17% 10.86% 12.77% December 31, 2014 8.59% 9.17% 11.23% 12.30% As of December 31, 2015

2016 Strategic Objectives Loan growth 7-9% (EOP)Fund loan growth primarily with depositsCore pre-tax, pre-provision growth of 25% compared to 2014Assumes no additional rate hikes in 2016Expect core revenue growth of 9-10%Expect expense growth of 2% or lessBased on current expectations, provision for loan losses in the range of $11 - $15 million per quarter 20 As of December 31, 2015

Near-Term Outlook 4Q15 Items to note Outlook Loans +25% LQA +13% Y-o-Y Includes $80 million in net reductions from energy portfolio; includes $185 million in purchased healthcare portfolio 7-9% EOP growth for full year 2016(includes approximately $200 million of expected paydowns from energy portfolio) Net Interest Margin (NIM) 3.21% reported3.10% core Reported down 7bps; Core down 5bps Continued downward pressure on reported NIM due to purchase accounting; core NIM expected to improve 3-5 bps Core Revenue $218.3 million Excludes PAAs(see slide 23) Recent growth reflects initiatives started in the prior several quarters; expect growth as initiatives continue to mature Loan Loss Provision $50.2 million Includes $43 million of allowance increase related to energy $11-$15 million per quarterDepends on depth and duration of the cycle Noninterest Expense $156.0 million operating No nonoperating costs Expect expenses flat to down in 1Q16 21 As of December 31, 2015
Appendix:EPS calculation $s in thousands, except E.P.S. Three Months Ended 12/31/15 Three Months Ended 9/30/15 Three Months Ended 12/31/14 Net income to common shareholders $15,307 $41,166 $46,376 Income allocated to participating securities (354) ($840) ($981) Net income allocated to common shareholders $14,953 $40,326 $45,395 Weighted average common shares – diluted 77,544 78,075 81,530 E.P.S. - diluted $.19 $.52 $.56 See Note 9 in the most recent 10Q for more details on the two-class method for E.P.S. calculation. 22
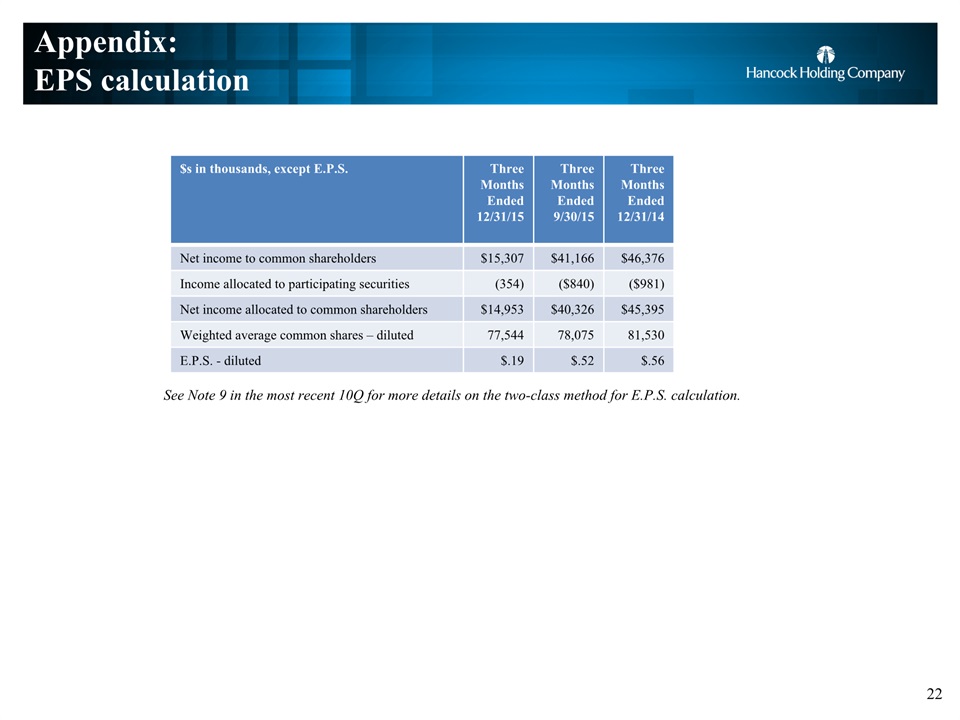
Appendix:EPS calculation $s in thousands, except E.P.S. Three Months Ended 12/31/15 Three Months Ended 9/30/15 Three Months Ended 12/31/14 Net income to common shareholders $15,307 $41,166 $46,376 Income allocated to participating securities (354) ($840) ($981) Net income allocated to common shareholders $14,953 $40,326 $45,395 Weighted average common shares – diluted 77,544 78,075 81,530 E.P.S. - diluted $.19 $.52 $.56 See Note 9 in the most recent 10Q for more details on the two-class method for E.P.S. calculation. 22
Appendix: Purchase Accounting Adjustments Core NII & NIM Reconciliation ($s in millions) 4Q15 3Q15 2Q15 1Q15 4Q14 Net Interest Income (TE) – reported (NII) $162.6 $160.1 $154.9 $161.1 $163.6 Whitney expected loan accretion (performing) 0.4 0.6 1.1 1.2 2.7 Whitney expected loan accretion (credit impaired) 5.2 5.6 6.8 11.3 13.8 Peoples First expected loan accretion 0.9 1.1 0.9 1.1 .7 Excess cash recoveries* --- --- --- 2.8 --- Total Loan Accretion $6.5 $7.3 $8.7 $16.4 $17.2 Whitney premium bond amortization (0.8) (0.9) (1.0) (1.0) (1.2) Whitney and Peoples First CD accretion --- --- --- --- --- Total Net Purchase Accounting Adjustments (PAAs) impacting NII $5.7 $6.4 $7.7 $15.3 $16.0 Net Interest Income (TE) – core(Reported NII less net PAAs) $157.0 $153.8 $147.2 $145.8 $147.6 Average Earning Assets $20,140 $19,433 $18,781 $18,316 $17,911 Net Interest Margin – reported 3.21% 3.28% 3.30% 3.55% 3.63% Net Purchase Accounting Adjustments (%) .11% .13% .16% .34% .36% Net Interest Margin - core 3.10% 3.15% 3.14% 3.21% 3.27% * Excess cash recoveries include cash collected on certain zero carrying value acquired loan pools above expected amounts. 23
Appendix: Purchase Accounting Impact/Trend Impact of Purchase Accounting Adjustments(projections will be updated quarterly; subject to change) $s in millions *Projected revenue includes loan accretion from Whitney and Peoples First, offset by amortization of the Whitney bond portfolio premium and amortization of the Peoples First indemnification asset. 24 N/M N/M N/M As of December 31, 2015
Appendix: Non-GAAP Reconciliation (Net Income, ROA, E.P.S.) $s in millions (except EPS) Three Months Ended 12/31/15 Three Months Ended 9/30/15 Three Months Ended 12/31/14 Twelve Months Ended 12/31/15 Twelve Months Ended 12/31/14 Net income $15.3 $41.2 $40.1 $131.5 $194.1 Adjustments from net to operating income Securities transactions gains - - - (.3) - Total nonoperating expense items (pre-tax) - - 9.7 16.2 25.7 Taxes on adjustments at marginal tax rate - - 3.4 5.6 7.3 Total adjustments (net of taxes) - - 6.3 10.3 18.4 Operating income $15.3 $41.2 $46.4 $141.8 $194.1 Adjustments from operating to core income PAA – Net Interest Margin (see slide 23) 5.7 6.4 16.0 35.1 92.5 Intangible Amortization (noninterest expense) -5.7 -6.0 -6.4 -24.2 -26.6 Amortization of Indemnification Asset (noninterest income) -1.7 -1.6 -2.1 -5.7 -12.1 Total Purchase Accounting Adjustments (PAA) (pre-tax) $-1.7 $-1.2 $7.4 $5.2 $53.8 Taxes on adjustments at marginal tax rate -0.6 -0.4 2.6 1.8 18.9 Total PA adjustments (net of taxes) -1.1 -0.8 4.8 3.4 34.9 Core Income (Operating less purchase accounting items) $16.4 $42.0 $41.6 $138.4 $159.2 Average Assets $22,177 $21,481 $20,090 $21,250 $19,437 ROA (operating) 0.27% 0.76% 0.92% 0.67% 1.00% ROA (core) 0.29% 0.77% 0.82% 0.65% 0.82% Weighted Average Diluted Shares (thousands) 77,544 78,075 81,530 78,307 82,034 E.P.S. (operating) $0.19 $.52 $.56 $1.77 $2.32 E.P.S. (core) $0.21 $.53 $.50 $1.73 $1.90 25
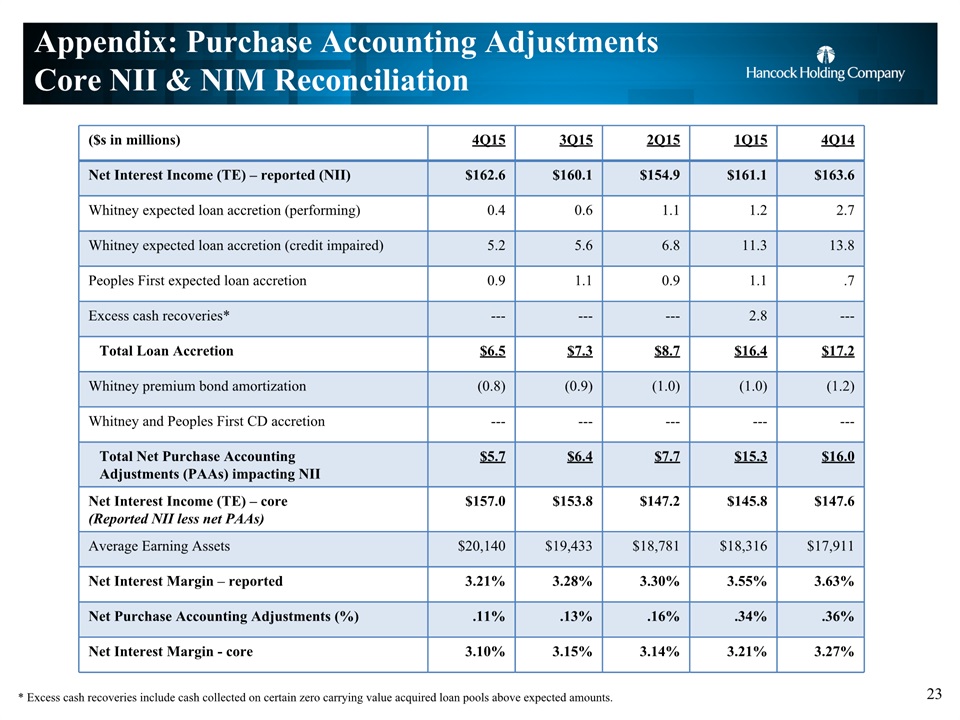
Appendix: Purchase Accounting Adjustments Core NII & NIM Reconciliation ($s in millions) 4Q15 3Q15 2Q15 1Q15 4Q14 Net Interest Income (TE) – reported (NII) $162.6 $160.1 $154.9 $161.1 $163.6 Whitney expected loan accretion (performing) 0.4 0.6 1.1 1.2 2.7 Whitney expected loan accretion (credit impaired) 5.2 5.6 6.8 11.3 13.8 Peoples First expected loan accretion 0.9 1.1 0.9 1.1 .7 Excess cash recoveries* --- --- --- 2.8 --- Total Loan Accretion $6.5 $7.3 $8.7 $16.4 $17.2 Whitney premium bond amortization (0.8) (0.9) (1.0) (1.0) (1.2) Whitney and Peoples First CD accretion --- --- --- --- --- Total Net Purchase Accounting Adjustments (PAAs) impacting NII $5.7 $6.4 $7.7 $15.3 $16.0 Net Interest Income (TE) – core(Reported NII less net PAAs) $157.0 $153.8 $147.2 $145.8 $147.6 Average Earning Assets $20,140 $19,433 $18,781 $18,316 $17,911 Net Interest Margin – reported 3.21% 3.28% 3.30% 3.55% 3.63% Net Purchase Accounting Adjustments (%) .11% .13% .16% .34% .36% Net Interest Margin - core 3.10% 3.15% 3.14% 3.21% 3.27% * Excess cash recoveries include cash collected on certain zero carrying value acquired loan pools above expected amounts. 23

Appendix: Purchase Accounting Impact/Trend Impact of Purchase Accounting Adjustments(projections will be updated quarterly; subject to change) $s in millions *Projected revenue includes loan accretion from Whitney and Peoples First, offset by amortization of the Whitney bond portfolio premium and amortization of the Peoples First indemnification asset. 24 N/M N/M N/M As of December 31, 2015
Appendix: Non-GAAP Reconciliation (Net Income, ROA, E.P.S.) $s in millions (except EPS) Three Months Ended 12/31/15 Three Months Ended 9/30/15 Three Months Ended 12/31/14 Twelve Months Ended 12/31/15 Twelve Months Ended 12/31/14 Net income $15.3 $41.2 $40.1 $131.5 $194.1 Adjustments from net to operating income Securities transactions gains - - - (.3) - Total nonoperating expense items (pre-tax) - - 9.7 16.2 25.7 Taxes on adjustments at marginal tax rate - - 3.4 5.6 7.3 Total adjustments (net of taxes) - - 6.3 10.3 18.4 Operating income $15.3 $41.2 $46.4 $141.8 $194.1 Adjustments from operating to core income PAA – Net Interest Margin (see slide 23) 5.7 6.4 16.0 35.1 92.5 Intangible Amortization (noninterest expense) -5.7 -6.0 -6.4 -24.2 -26.6 Amortization of Indemnification Asset (noninterest income) -1.7 -1.6 -2.1 -5.7 -12.1 Total Purchase Accounting Adjustments (PAA) (pre-tax) $-1.7 $-1.2 $7.4 $5.2 $53.8 Taxes on adjustments at marginal tax rate -0.6 -0.4 2.6 1.8 18.9 Total PA adjustments (net of taxes) -1.1 -0.8 4.8 3.4 34.9 Core Income (Operating less purchase accounting items) $16.4 $42.0 $41.6 $138.4 $159.2 Average Assets $22,177 $21,481 $20,090 $21,250 $19,437 ROA (operating) 0.27% 0.76% 0.92% 0.67% 1.00% ROA (core) 0.29% 0.77% 0.82% 0.65% 0.82% Weighted Average Diluted Shares (thousands) 77,544 78,075 81,530 78,307 82,034 E.P.S. (operating) $0.19 $.52 $.56 $1.77 $2.32 E.P.S. (core) $0.21 $.53 $.50 $1.73 $1.90 25
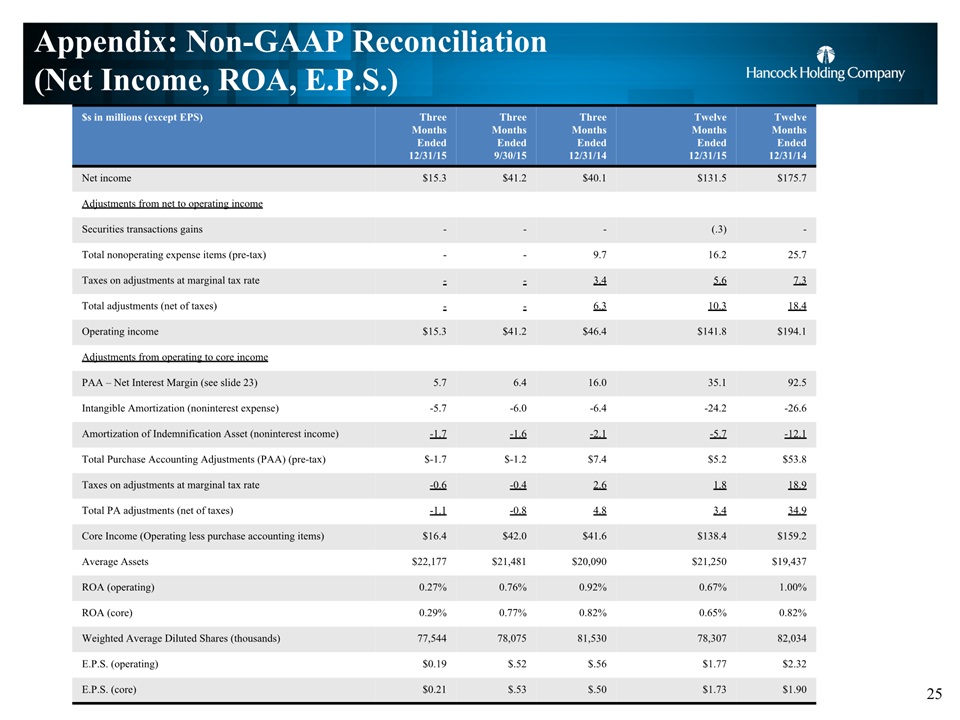
Appendix: Non-GAAP Reconciliation (Net Income, ROA, E.P.S.) $s in millions (except EPS) Three Months Ended 12/31/15 Three Months Ended 9/30/15 Three Months Ended 12/31/14 Twelve Months Ended 12/31/15 Twelve Months Ended 12/31/14 Net income $15.3 $41.2 $40.1 $131.5 $175.7 Adjustments from net to operating income Securities transactions gains - - - (.3) - Total nonoperating expense items (pre-tax) - - 9.7 16.2 25.7 Taxes on adjustments at marginal tax rate - - 3.4 5.6 7.3 Total adjustments (net of taxes) - - 6.3 10.3 18.4 Operating income $15.3 $41.2 $46.4 $141.8 $194.1 Adjustments from operating to core income PAA – Net Interest Margin (see slide 23) 5.7 6.4 16.0 35.1 92.5 Intangible Amortization (noninterest expense) -5.7 -6.0 -6.4 -24.2 -26.6 Amortization of Indemnification Asset (noninterest income) -1.7 -1.6 -2.1 -5.7 -12.1 Total Purchase Accounting Adjustments (PAA) (pre-tax) $-1.7 $-1.2 $7.4 $5.2 $53.8 Taxes on adjustments at marginal tax rate -0.6 -0.4 2.6 1.8 18.9 Total PA adjustments (net of taxes) -1.1 -0.8 4.8 3.4 34.9 Core Income (Operating less purchase accounting items) $16.4 $42.0 $41.6 $138.4 $159.2 Average Assets $22,177 $21,481 $20,090 $21,250 $19,437 ROA (operating) 0.27% 0.76% 0.92% 0.67% 1.00% ROA (core) 0.29% 0.77% 0.82% 0.65% 0.82% Weighted Average Diluted Shares (thousands) 77,544 78,075 81,530 78,307 82,034 E.P.S. (operating) $0.19 $.52 $.56 $1.77 $2.32 E.P.S. (core) $0.21 $.53 $.50 $1.73 $1.90 25
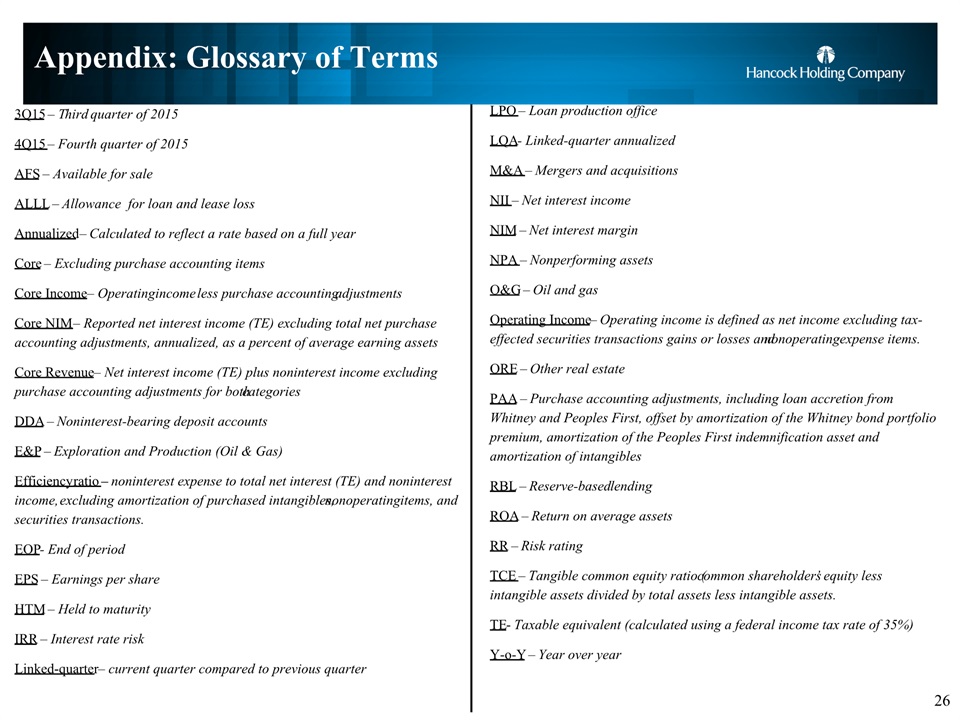
LPO – Loan production officeLQA- Linked-quarter annualizedM&A – Mergers and acquisitionsNII – Net interest income NIM – Net interest marginNPA – Nonperforming assetsO&G – Oil and gasOperating Income – Operating income is defined as net income excluding tax-effected securities transactions gains or losses and nonoperating expense items. ORE – Other real estatePAA – Purchase accounting adjustments, including loan accretion from Whitney and Peoples First, offset by amortization of the Whitney bond portfolio premium, amortization of the Peoples First indemnification asset and amortization of intangiblesRBL – Reserve-based lendingROA – Return on average assetsRR – Risk ratingTCE – Tangible common equity ratio (common shareholders’ equity less intangible assets divided by total assets less intangible assets.TE- Taxable equivalent (calculated using a federal income tax rate of 35%)Y-o-Y – Year over year Appendix: Glossary of Terms 3Q15 – Third quarter of 20154Q15 – Fourth quarter of 2015AFS – Available for saleALLL – Allowance for loan and lease lossAnnualized – Calculated to reflect a rate based on a full yearCore – Excluding purchase accounting itemsCore Income – Operating income less purchase accounting adjustmentsCore NIM – Reported net interest income (TE) excluding total net purchase accounting adjustments, annualized, as a percent of average earning assetsCore Revenue – Net interest income (TE) plus noninterest income excluding purchase accounting adjustments for both categoriesDDA – Noninterest-bearing deposit accountsE&P – Exploration and Production (Oil & Gas)Efficiency ratio – noninterest expense to total net interest (TE) and noninterest income, excluding amortization of purchased intangibles, nonoperating items, and securities transactions.EOP- End of periodEPS – Earnings per shareHTM – Held to maturityIRR – Interest rate riskLinked-quarter – current quarter compared to previous quarter 26

Fourth Quarter 2015Financial ResultsJanuary 21, 2016