Attached files
| file | filename |
|---|---|
| 8-K - 8-K - 99 CENTS ONLY STORES LLC | a15-24950_18k.htm |
| EX-99.1 - EX-99.1 - 99 CENTS ONLY STORES LLC | a15-24950_1ex99d1.htm |
Exhibit 99.2
Q3 FY16 Conference Call Supplemental Operating & Financial Data December 14, 2015
Forward Looking Statements Please note that this presentation will refer to a management analysis of company financial results that can be found at the end of the earnings release issued earlier today, December 14, 2015. This analysis summarizes certain information regarding results of operations presented on a non-GAAP basis. The Company cautions that these financial measures should be viewed in addition and not as an alternative to the Company’s complete consolidated financial statements and financial notes prepared in accordance with generally accepted accounting principles. A reconciliation of these non-GAAP measures to their most directly comparable GAAP measure is included in the earnings release. This presentation contains forward looking statements under the Private Securities Litigation Reform Act of 1995. The words expect, estimate, anticipate, plan, predict, believe, intend, and similar expressions and variations thereof are intended to identify forward looking statements. Such statements include comments regarding the intent, belief, or current expectations of the company with respect to, among other things, trends affecting the financial condition or results of operations of the Company; the business and growth strategies of the Company, including new store openings; the results of the Company’s operational and other initiatives, including pursuant to the Company’s profit improvement plans; the results of operations for future periods and potential uses of capital. These statements do not guarantee future performance and therefore, undue reliance should not be placed upon them. For a more detailed discussion of the factors that can cause actual results to differ materially from those projected in any forward-looking statements, the Company refers you to 99 Cents Only Store’s most recent 10-Q and 10-K filed with the SEC or posted on the Company’s website.
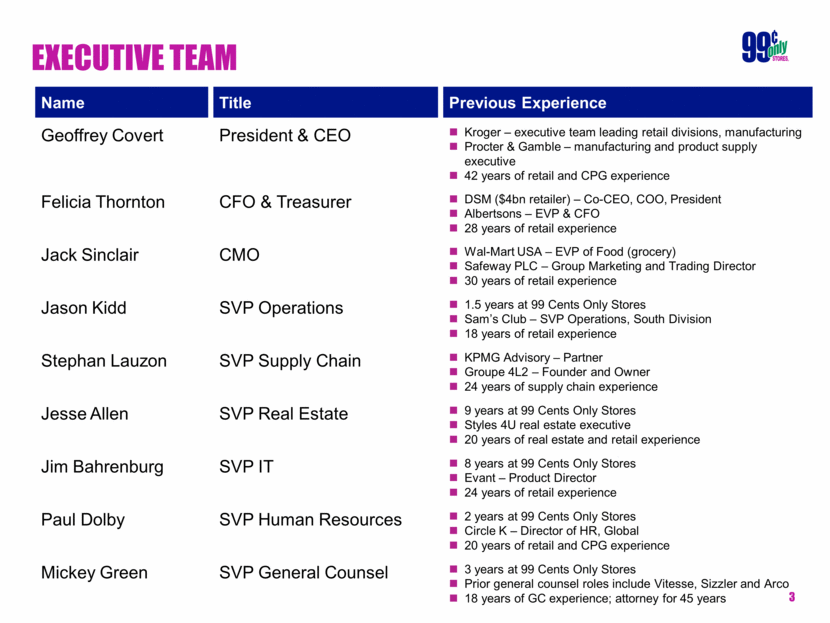
Executive Team Name Title Previous Experience Geoffrey Covert President & CEO Kroger – executive team leading retail divisions, manufacturing Procter & Gamble – manufacturing and product supply executive 42 years of retail and CPG experience Felicia Thornton CFO & Treasurer DSM ($4bn retailer) – Co-CEO, COO, President Albertsons – EVP & CFO 28 years of retail experience Jack Sinclair CMO Wal-Mart USA – EVP of Food (grocery) Safeway PLC – Group Marketing and Trading Director 30 years of retail experience Jason Kidd SVP Operations 1.5 years at 99 Cents Only Stores Sam’s Club – SVP Operations, South Division 18 years of retail experience Stephan Lauzon SVP Supply Chain KPMG Advisory – Partner Groupe 4L2 – Founder and Owner 24 years of supply chain experience Jesse Allen SVP Real Estate 9 years at 99 Cents Only Stores Styles 4U real estate executive 20 years of real estate and retail experience Jim Bahrenburg SVP IT 8 years at 99 Cents Only Stores Evant – Product Director 24 years of retail experience Paul Dolby SVP Human Resources 2 years at 99 Cents Only Stores Circle K – Director of HR, Global 20 years of retail and CPG experience Mickey Green SVP General Counsel 3 years at 99 Cents Only Stores Prior general counsel roles include Vitesse, Sizzler and Arco 18 years of GC experience; attorney for 45 years
Immediate areas of emphasis Improve the customer shopping experience Getting the right product to the right store at the right time Reduce shrink and scrap Inventory management and reduction
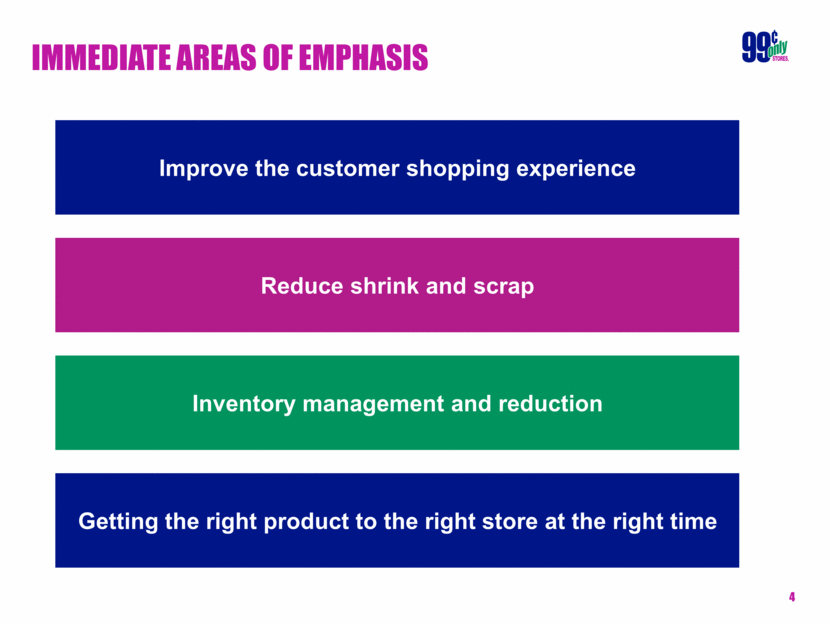
Sales bridge-FY16 Q3 vs. FY15 Q3 Same-store sales impact ~140 bps Markdown of seasonal merchandise to clear excess inventory; same-store sales impact of ~50 bps Primarily driven by challenges associated with fresh and consumable categories $478.3 $31.5 $6.5 $2.4 $9.2 $0.2 $491.5 ($M) FY15 Q3 Sales New / Non- Comp Stores Cannibalization Seasonal Inventory Reduction Remaining Declines in Comp Sales Bargain Wholesale FY16 Q3 Sales
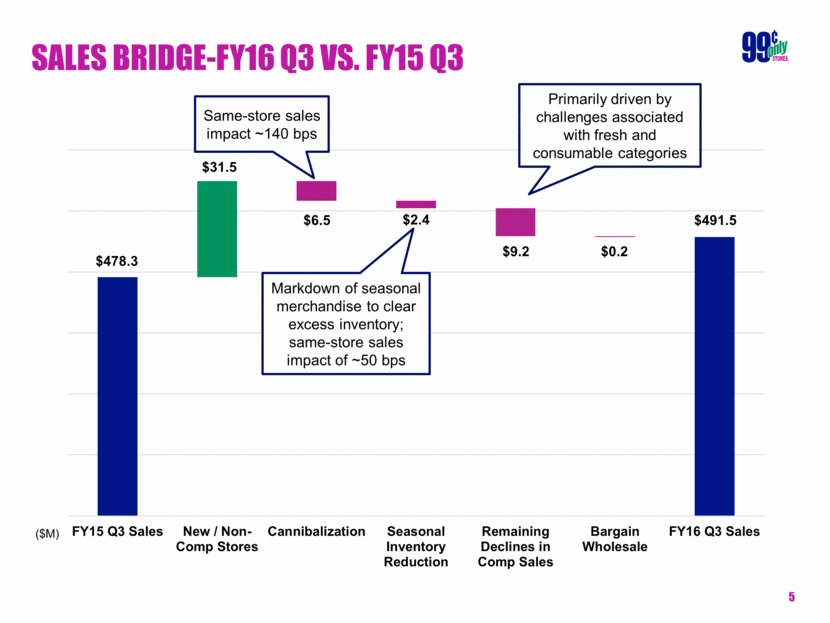
Halloween update Challenge Seasonal buying for Halloween 2015 was far in excess of what the Company would reasonably sell Solution Aggressive move-through of products through promotional activities (e.g., “Buy One, Get One Free”) and other aggressive markdowns Results Halloween promotional activities delighted current customers, but negatively impacted the Company’s financial performance: 50 bps and 60bps impact on Q3 same store sales and gross margin, respectively We remain committed to the exciting, fun, treasure hunt customer experience with the right value proposition
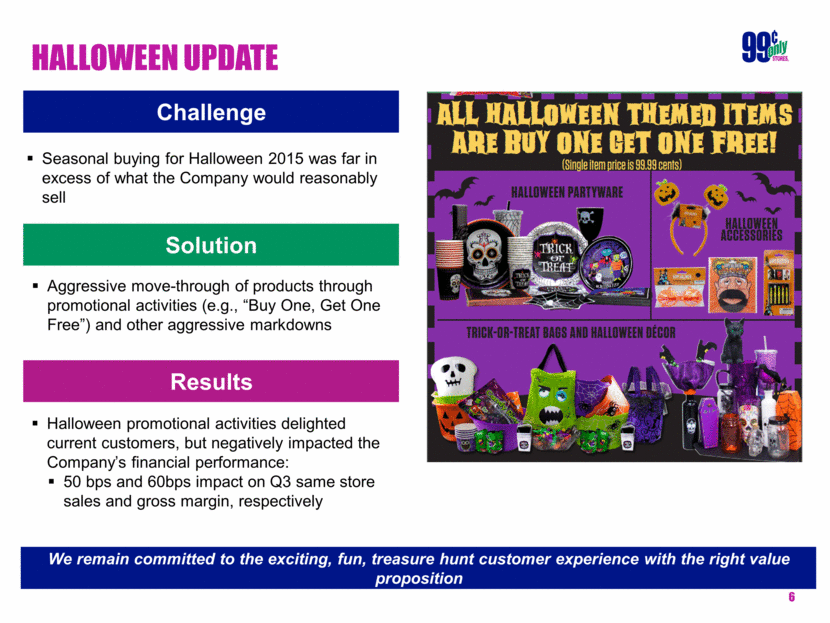
Gross Margin Bridge-FY16 Q3 vs. FY15 Q3 Higher shrink & produce scrap Higher inbound expenses; higher product costs including ~35 bps in fresh produce 31.4% 0.6% 1.7% 1.6% 0.6% 0.1% 26.8% FY15 Q3 Gross Margin Seasonal Inventory Reduction Higher Product Cost & Inbound Expenses Shrink & Scrap Distribution & Transportation Other Misc. FY16 Q3 Gross Margin
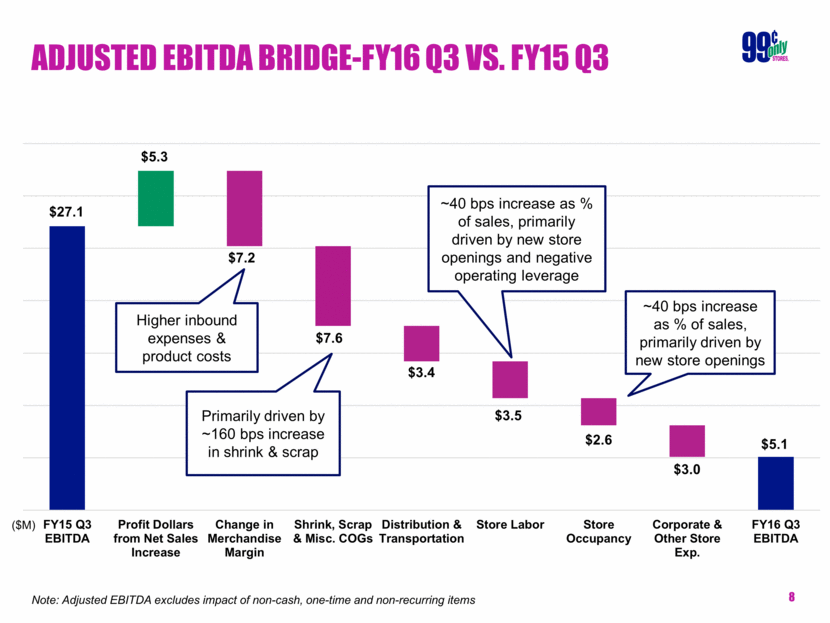
Adjusted EBITDA Bridge-FY16 Q3 vs. FY15 Q3 Note: Adjusted EBITDA excludes impact of non-cash, one-time and non-recurring items Primarily driven by ~160 bps increase in shrink & scrap ~40 bps increase as % of sales, primarily driven by new store openings and negative operating leverage $27.1 $5.3 $7.2 $7.6 $3.4 $3.5 $2.6 $3.0 $5.1 ($M) Higher inbound expenses & product costs FY15 Q3 EBITDA Profit Dollars from Net Sales Increase Change in Merchandise Margin Shrink, Scrap & Misc. COGs Distribution & Transportation Store Labor Store Occupancy Corporate & Other Store Exp. FY16 Q3 EBITDA ~40 bps increase as % of sales, primarily driven by new store openings
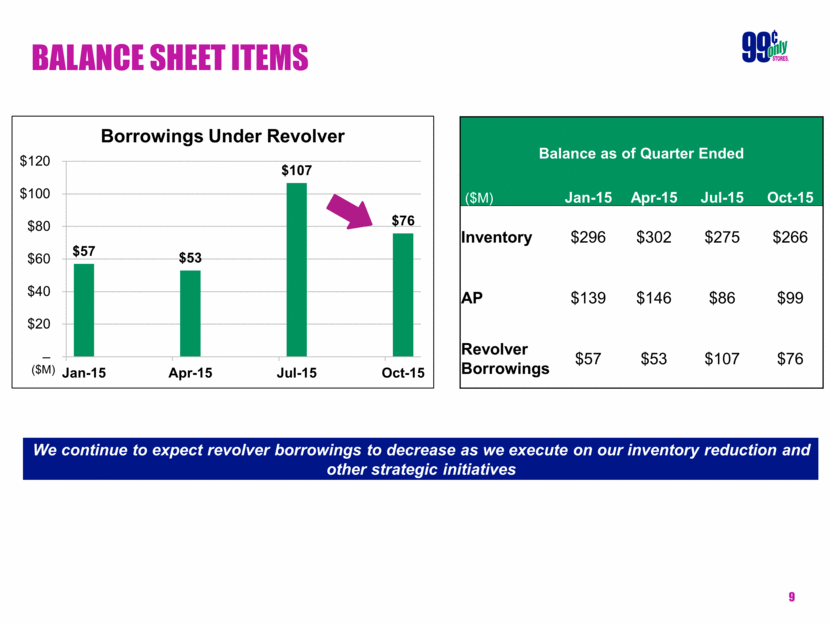
BALANCE SHEET ITEMS ($M) Balance as of Quarter Ended ($M) Jan-15 Apr-15 Jul-15 Oct-15 Inventory $296 $302 $275 $266 AP $139 $146 $86 $99 Revolver Borrowings $57 $53 $107 $76 We continue to expect revolver borrowings to decrease as we execute on our inventory reduction and other strategic initiatives $57 $53 $107 $76 – $20 $40 $60 $80 $100 $120 Jan-15 Apr-15 Jul-15 Oct-15 Borrowings Under Revolver
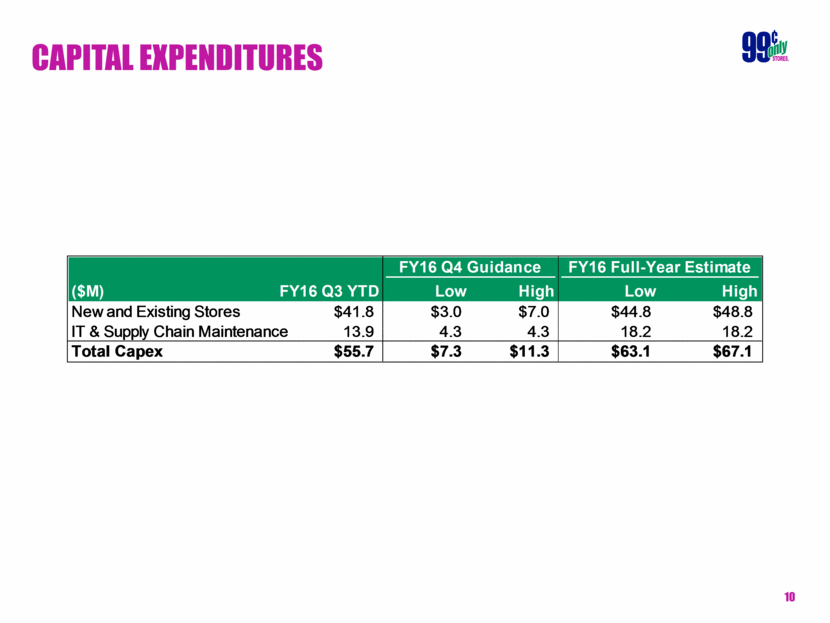
CAPITAL EXPENDITURES FY16 Q4 Guidance FY16 Full-Year Estimate ($M) FY16 Q3 YTD Low High Low High New and Existing Stores $41.8 $3.0 $7.0 $44.8 $48.8 IT & Supply Chain Maintenance 13.9 4.3 4.3 18.2 18.2 Total Capex $55.7 $7.3 $11.3 $63.1 $67.1
