Attached files
| file | filename |
|---|---|
| 8-K - CURRENT REPORT OF MATERIAL EVENTS OR CORPORATE CHANGES - Monogram Residential Trust, Inc. | a15-23523_18k.htm |
Exhibit 99.1
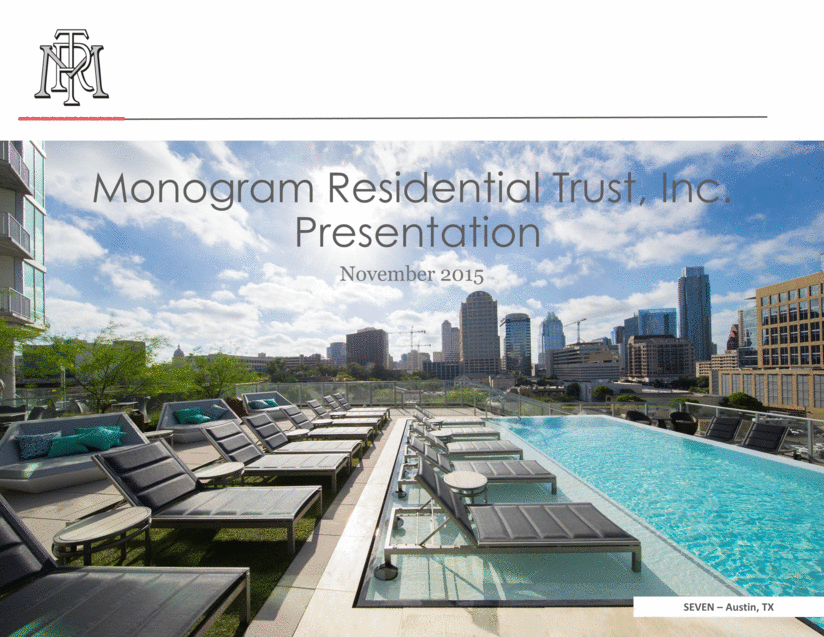
1 Monogram Residential Trust, Inc. Presentation November 2015 SEVEN – Austin, TX
Forward Looking Statements This presentation contains forward-looking statements relating to the business and financial outlook of Monogram Residential Trust, Inc. (“Monogram”) that are based on our current expectations, estimates, forecasts and projections and are not guarantees of future performance. Actual results may differ materially from those expressed in these forward-looking statements, and you should not place undue reliance on any such statements. A number of important factors could cause actual results to differ materially from the forward-looking statements contained in this presentation. Such factors include the risk that we may not meet our expected funds from operations, net operating income or other performance metrics, and other factors described in the Risk Factors section of Monogram’s Annual Report on Form 10-K for the year ended December 31, 2014 and in subsequent filings with the SEC. Forward-looking statements in this presentation speak only as of the date on which such statements were made, and we undertake no obligation to update any such statements that may become untrue because of subsequent events. We claim the safe harbor protection for forward-looking statements contained in the Private Securities Litigation Reform Act of 1995. MONOGRAM RESIDENTIAL TRUST 2
Important Information Funds from operations (“FFO”) is a non-GAAP performance financial measure that is widely recognized as a measure of REIT operating performance. We use FFO as currently defined by NAREIT to be net income (loss), computed in accordance with GAAP and gains (or losses) from sales of property (including deemed sales and settlements of pre-existing relationships), plus depreciation and amortization on real estate assets, impairment write-downs of depreciable real estate or of investments in unconsolidated real estate partnerships, joint ventures and subsidiaries that are driven by measurable decreases in the fair value of depreciable real estate assets, and after related adjustments for unconsolidated partnerships, joint ventures and subsidiaries and noncontrolling interests. Net Operating Income (“NOI”) is calculated as total consolidated rental revenue less total property operating expenses, including real estate taxes. NOI does not include property management revenues, interest income, property management expenses, depreciation, interest and other finance expense, corporate general and administrative expenses, overhead allocations and other non-onsite operations. We believe that NOI provides a supplemental measure of our operating performance because NOI reflects the operating performance of our properties and excludes items that are not generally associated with real estate industry defined property operations. Our Same Store multifamily communities are defined as those that are stabilized and comparable for both the current and prior reporting year. We view Same Store NOI as an important measure of the operating performance of our properties because it allows us to compare operating results of properties owned for the entirety of the current and comparable periods and therefore eliminates variations caused by lease up activity, acquisitions or dispositions during the periods under review. MONOGRAM RESIDENTIAL TRUST 3
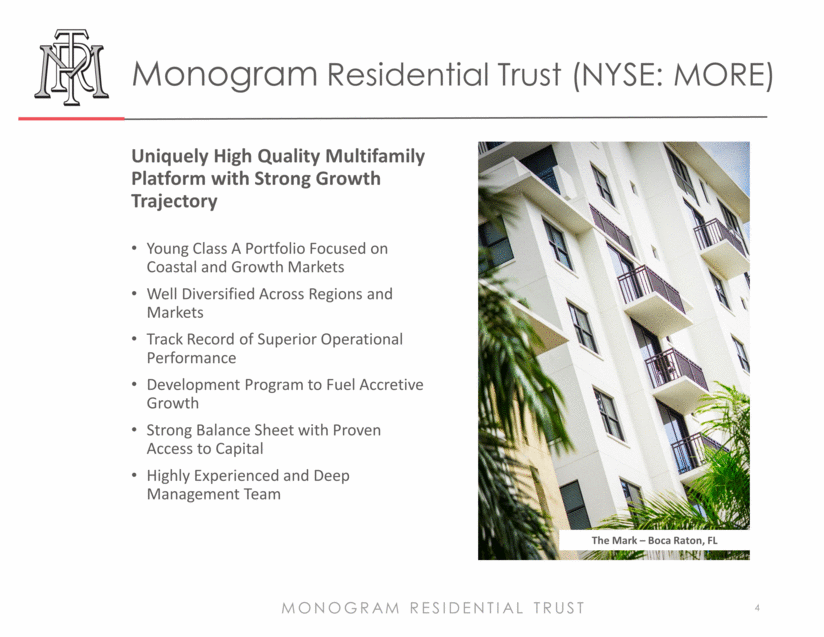
Monogram Residential Trust (NYSE: MORE) Uniquely High Quality Multifamily Platform with Strong Growth Trajectory Young Class A Portfolio Focused on Coastal and Growth Markets Well Diversified Across Regions and Markets Track Record of Superior Operational Performance Development Program to Fuel Accretive Growth Strong Balance Sheet with Proven Access to Capital Highly Experienced and Deep Management Team MONOGRAM RESIDENTIAL TRUST 4 The Mark – Boca Raton, FL
Corporate Highlights MONOGRAM RESIDENTIAL TRUST 5 Listed shares of common stock on the New York Stock Exchange on November 21, 2014 January 2015 entered into a new $200 million credit facility with an accordion feature to increase the amount available May 2015 acquired PGGM’s JV interest in six multifamily communities and one mezzanine loan for gross costs of $225 million Disposed of two properties (Houston, Chicago) for an economic gain of $63 million and recycled proceeds via 1031 exchange into two acquisitions in higher growth coastal areas (Boca Raton, San Diego) and expect remaining proceeds to be invested by January 2016 Substantial progress in continuing to complete and stabilize existing development pipeline Eight communities completed and fully stabilized with an average return on cost of approximately 6.9% Five communities currently in lease up Four communities currently under construction, one in pre-development and additional site held for future development As of September 30, 2015, the weighted average occupancy of our stabilized communities was 95.7% with an average monthly rental revenue per unit of $1,846 Increased the 2015 Same Store NOI growth forecast from 3.0% - 3.75% to 3.75% - 4.25%
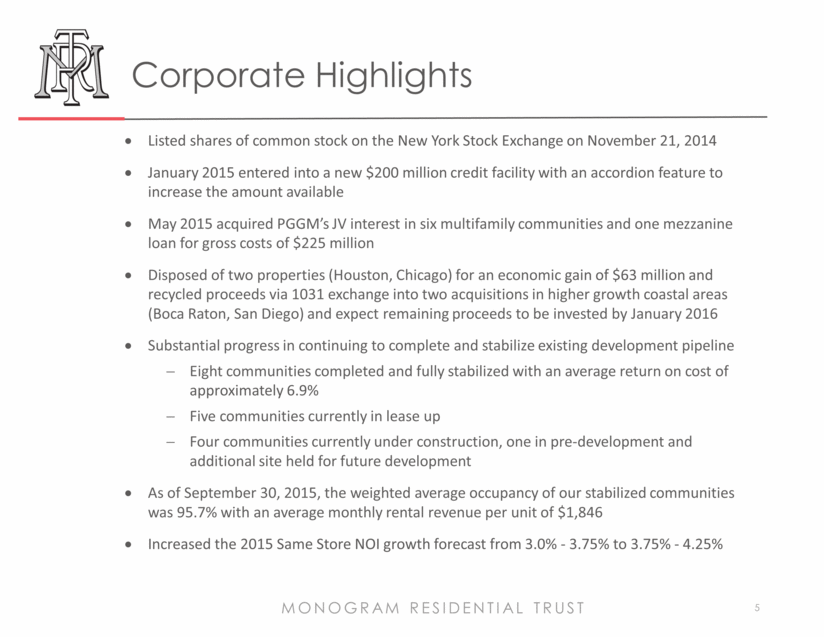
A Strategy for Growth & Value Creation MONOGRAM RESIDENTIAL TRUST 6 Class A Communities in High-Density Urban and Infill Submarkets Transit oriented locations Vibrant areas offering cultural, retail and restaurant amenities Affluent neighborhoods, with favorable rent vs. own characteristics Target Major Markets, With Track Record of Growth Preferential focus on desirable coastal regions Top markets with high renter demand and significant institutional capital Well Diversified Across Regions and Markets Same Store NOI does not exceed 20% concentration in any region Diversified among socioeconomic factors EV – San Diego, CA
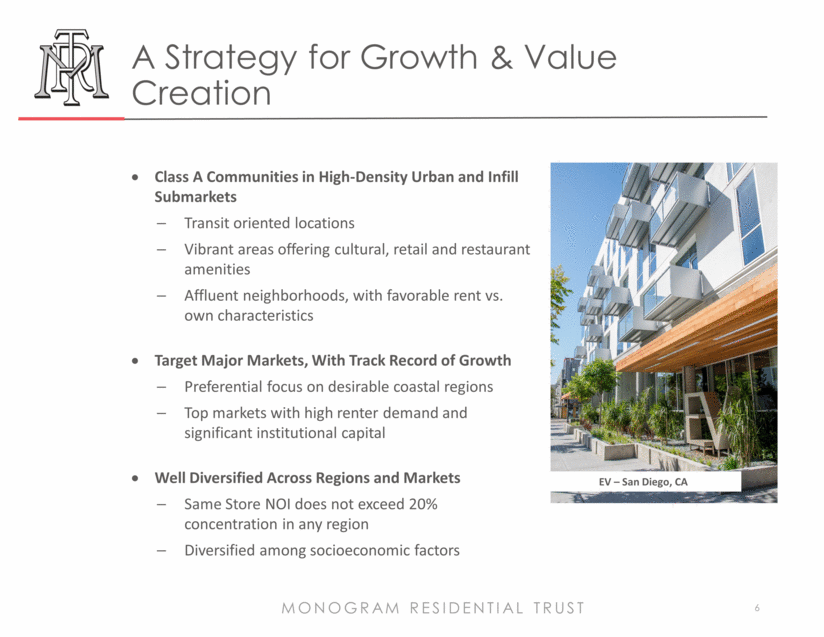
MONOGRAM RESIDENTIAL TRUST 7 Portfolio assembled post-financial crisis with ~90% of acquisitions occurring in 2009-2011 Focus on off-market transactions (short sales, foreclosures, failed condos, future development potential, etc.) More recent shift in investment to development in core locations Capture incremental value creation at appropriate time in the cycle Recent acquisitions into core coastal markets from recycled gains on dispositions (in Millions) Consolidated Acquisition Volume by Year (1) (2) (in Millions) Total Consolidated Development Capital Commitments by Year (1) Proven Track Record of Growth Notes Inclusive of acquisition costs of properties subsequently sold. Assets acquired in the PGGM acquisition during May 2015 are reflected in prior years. No acquisition activity in 2014. No new development commitments in 2015. Acquisition activity in 2015 was part of the 1031 like kind exchange. 0 200 400 600 800 '07 '08 '09 '10 '11 '12 '13 '14 15 0 250 500 750 1,000 '07 '08 '09 '10 '11 '12 '13 '14 '15
High Quality, Class A Property Portfolio MONOGRAM RESIDENTIAL TRUST 8 The youngest portfolio among the listed multifamily REITs, with an average age of approximately 5 years Current average monthly rental revenue per unit of $1,846, commanding a premium market rent due to new construction, amenities and overall high quality of communities – rents expected to further increase upon stabilization of development communities Significantly lower average annual cap-ex spend per unit vs. other listed multifamily REITs Monogram’s Favorable Competitive Positioning Key Portfolio Metrics Monogram (1) Select Publicly Traded Multifamily Average (2) Property Age (in years) 5 20 Avg. Rental Revenue per Unit $1,846 $1,679 Occupancy 95.7% 96.0% Total Cap-Ex per Unit (Annual) (3)(4) $610 $1,628 Source: Company documents Notes Based on Monogram’s stabilized portfolio as of September 30, 2015 Companies include AIV, AVB, CPT, EQR, ESS, MAA, PPS and UDR (where disclosure is available) 3-year average (2012-2014) Excludes Monogram’s retail tenant improvements
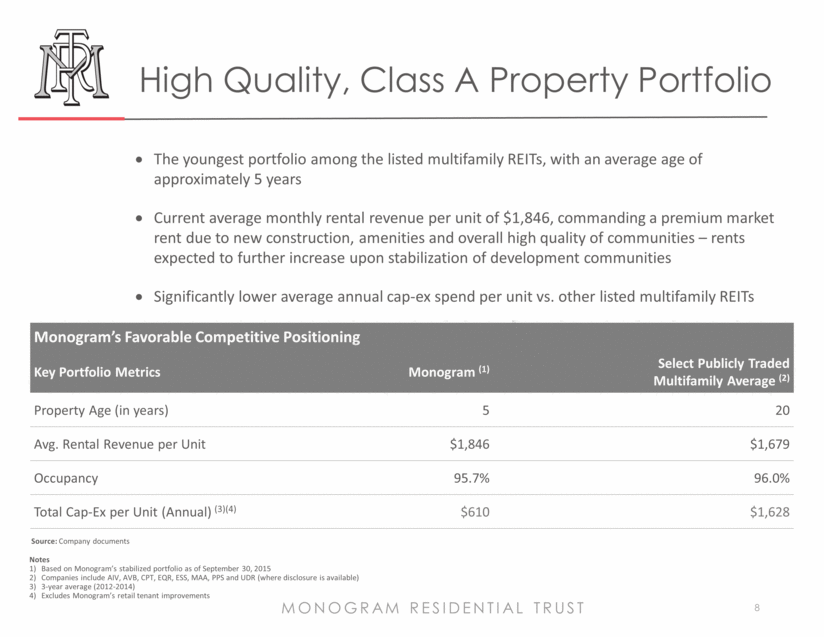
Market Overview 9 Monogram’s markets feature strong levels of job growth Demand exceeding completions in the majority of Monogram markets Net Completions Rate (% change in existing units, 2Q14 – 2Q15) Absorption Rate vs. Net Completions Rate: 2Q15 (2) Notes Employment Growth by Absolute change - Marcus & Millichap Research Services, BLS Absorption Rate vs Net Completion Rate - Witten Advisors, LLC MONOGRAM RESIDENTIAL TRUST 0.0% 1.0% 2.0% 3.0% 4.0% 5.0% 0.0% 1.0% 2.0% 3.0% 4.0% 5.0% Absorption Rate (% change in occupied units, 2Q14 – 2Q15) Aus Ral Orl Dal Den SJ Hou Sea DC Mia SF Phx Atl SD LA LV Phi NYC Bos FtL Employment Growth (1) Y-O-Y Change through 9.30.2015 Market Absolute Change Percent Change 1. Dallas- Ft. Worth 107,000 3.2% 2. Los Angeles 89,200 2.1% 3. Atlanta 71,500 2.8% 4. Washington, D.C. 62,800 2.1% 5. New York 62,500 1.5% 6. Seattle 58,700 3.2% 7. San Jose 47,200 4.7% 8. San Diego 47,200 3.5% 9. Boston 46,800 1.8% 10. Phoenix 46,200 2.5% U.S. 2,752,000 2.0% Bold denotes Monogram market
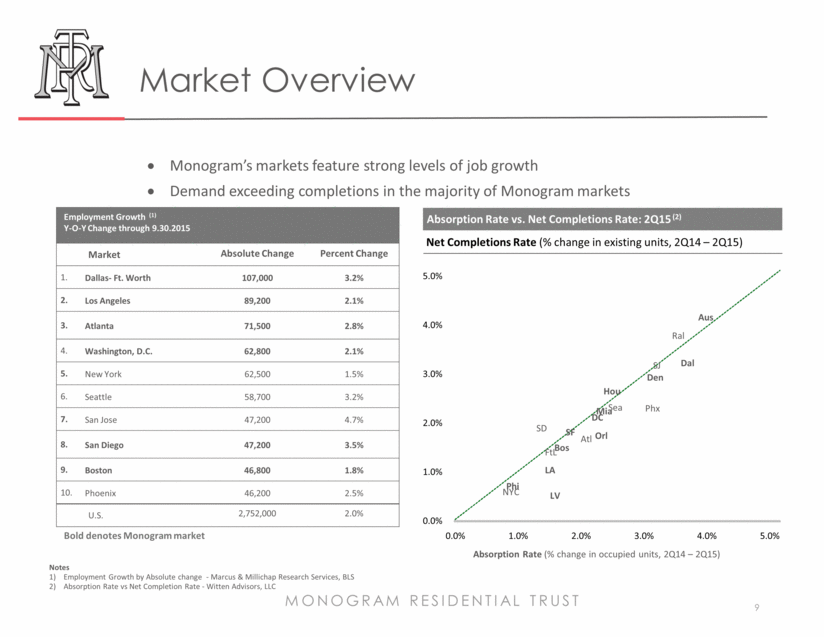
Scaled Platform Focused in Major Markets, with Significant Coastal Presence 38 Stabilized Properties, 7 Lease Ups, 5 Developments, 1 Land Held For Development, 51 Total Properties, ~14k Units (1) Southern California 11% Total NOI Northern California 17% Total NOI Texas 18% Total NOI Colorado 12% Total NOI Florida 9% Total NOI Mid Atlantic 15% Total NOI New England 10% Total NOI Georgia 3% Total NOI Notes 1) Regional percentage of total NOI based on Monogram’s share of YTD net operating income for its stabilized portfolio through September 30, 2015; unit and property counts include stabilized, lease up, and development assets as of September 30, 2015 MONOGRAM RESIDENTIAL TRUST 10 Nevada 5% NOI
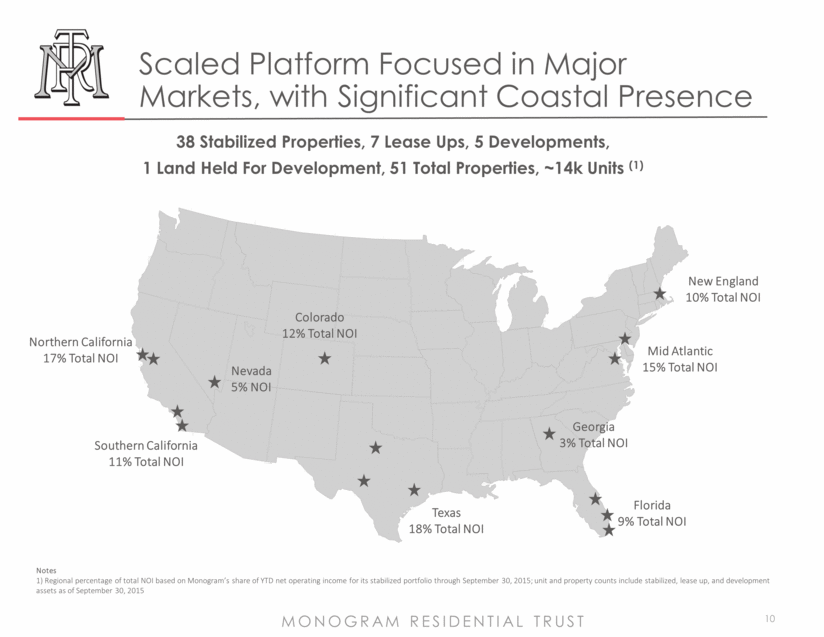
Notes Unmarried college students living in dormitories are counted as living in their parents’ home Source: Witten Advisors, via US Census Bureau data as of 2Q15 Market Overview MONOGRAM RESIDENTIAL TRUST 11 Significant growth in “millennial” population – group with highest propensity to rent Favorable employment trends within this group driving rental demand in Monogram’s markets Average age of resident in Monogram portfolio is 38 and further along in career path Homeownership is nearing a 20-year low, indicating a relative growth in the demand base as well 18-34 Year Old Population Living at Home (1) Young Adults Living with Parents 3.5M Above Long-Term Average Long-Term Average: 19.3MM 22.8MM Living with Parents (MM) Sources: Marcus & Millichap Research Services, U.S. Census Bureau 69.0% 2Q15: 63.4% 64.0% Overall Homeownership Rate (2) 16.0 17.0 18.0 19.0 20.0 21.0 22.0 23.0 24.0 60% 61% 62% 63% 64% 65% 66% 67% 68% 69% 70% 60 65 70 75 80 85 90 95 00 05 10 15
Strategic Joint Ventures Offer Efficient Capital for Growth MONOGRAM RESIDENTIAL TRUST 12 Two primary institutional JV relationships: PGGM joint venture Interests in both stabilized and development investments 23 properties, containing 6,350 units in 11 markets Gross cost of approximately $1.8 billion NPS joint venture Interests in stabilized investments 14 properties, containing 3,748 units in 9 markets Gross cost of approximately $925 million Enhances return on capital via promotes and fee income Generates $4.4 million(1) of fee income for Monogram annually which is projected to grow once developments are stabilized Buy / sell provisions which may allow for future wholly owned growth Approximately $584 million of total JV property interests represent potential attractive acquisition opportunities with minimal transaction costs if Monogram determines they would be accretive acquisitions Note: 1) The $4.4 million was based upon a trailing twelve calculation.
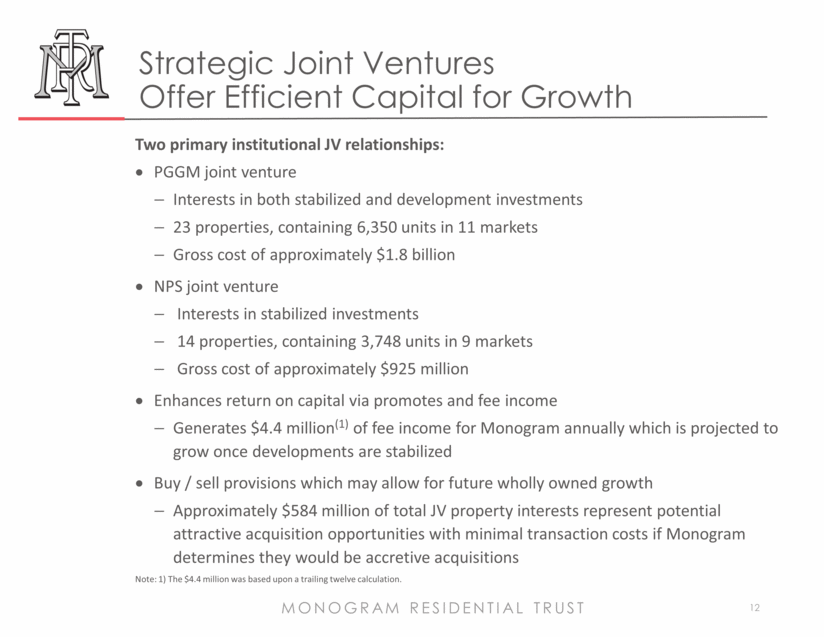
PGGM Transaction 13 In May 2015, MRT acquired PGGM’s joint venture interests in six multifamily communities and one mezzanine loan for a gross purchase price of $224.6 million Six multifamily communities, representing over 2,000 units, were 95.1% occupied as of September 30, 2015 Transaction was funded through $106.9 million of existing debt attributable to purchased interests and $119.8 million from existing credit facilities and cash on hand The transaction results in approximately $3.5 million(1) per year of incremental recurring FFO, with realized promote and disposition fees totalling $4.5 million. Investment is consistent with stated strategy of increasing wholly owned asset base through organic growth / purchase of JV property interest while simplifying the balance sheet and providing increased flexibility for financing and capital deployment MONOGRAM RESIDENTIAL TRUST The Cameron – Silver Spring, MD Grand Reserve – Dallas, TX SKYE 2905 – Denver, CO Note 1) Based on 2016 projections
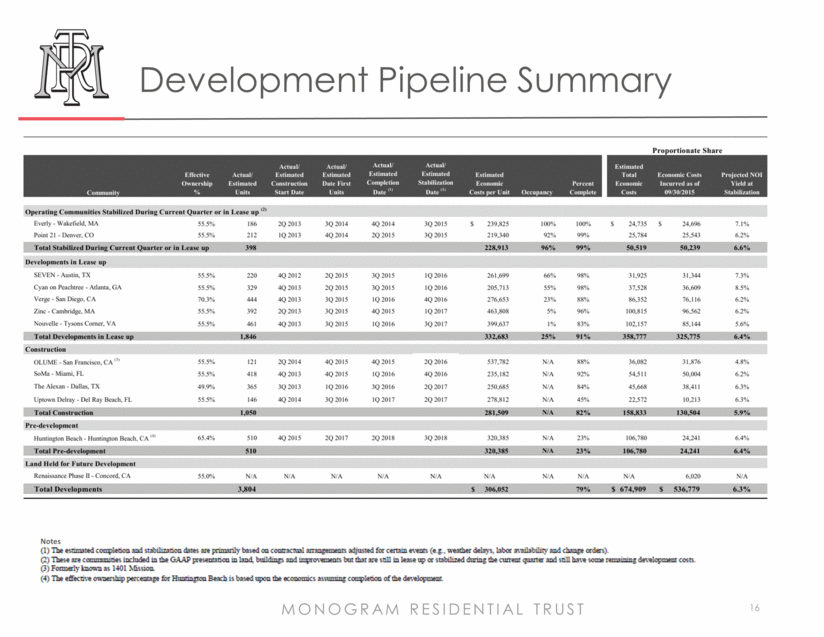
Development Program To Drive Accretive Growth 14 A significant portion of the portfolio will be co-developed by us or purchased at completion under the limited partnership agreements We believe this provides: Strategic Growth – Allocate capital to opportunities that enhance market mix and portfolio quality Value Creation – Spread between stabilized yields and cap rates drives growth in cash flows and NAV over time Lower Risk and More Efficient Capital Deployment – In addition to in-house development, we partner with best-of-class development partners, which provides the ability to invest in a wider variety of investment opportunities Monogram’s potential risk under its development program largely minimized: Eight communities completed and fully stabilized Five communities currently in lease up Four communities currently under construction, one in pre-development and additional site held for future development Cost-overrun and completion guarantees secured from development partners MONOGRAM RESIDENTIAL TRUST
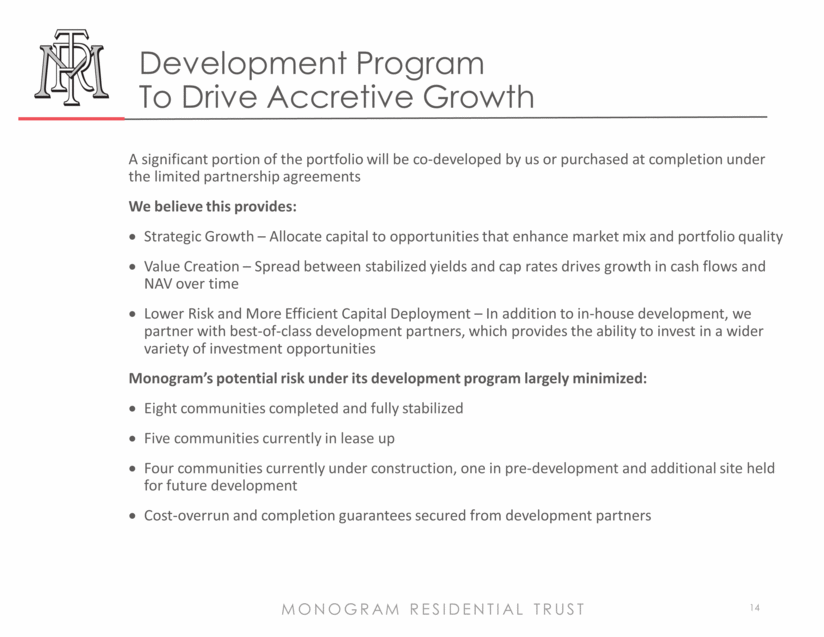
Development Portfolio Primarily Focused in Major, Coastal Markets (1) (2) 15 Southern California 1 Development, $163MM Northern California 1 Development, $65MM, 1 Land Held for Development Texas 1 Development, $92MM Florida 2 Developments, $139MM Notes Development Portfolio as of September 30, 2015; development costs represent costs for all on site development and construction recognized for GAAP, adjusted for certain consolidated allocated costs, former sponsor-related fees and other non-cash capitalized costs Excludes lease up and completed communities MONOGRAM RESIDENTIAL TRUST SOMA – Miami, FL OLUME – San Francisco, CA
16 MONOGRAM RESIDENTIAL TRUST Development Pipeline Summary Notes
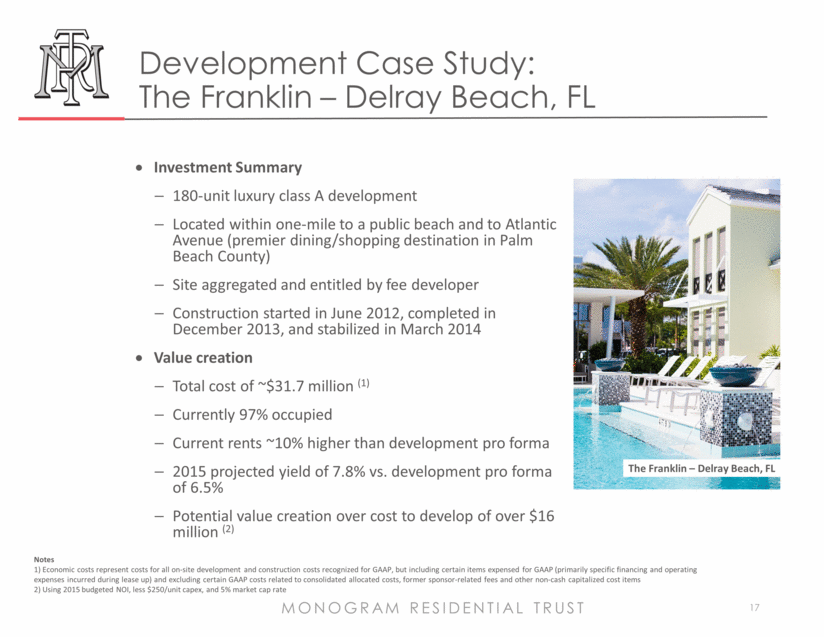
Development Case Study: The Franklin – Delray Beach, FL MONOGRAM RESIDENTIAL TRUST 17 Investment Summary 180-unit luxury class A development Located within one-mile to a public beach and to Atlantic Avenue (premier dining/shopping destination in Palm Beach County) Site aggregated and entitled by fee developer Construction started in June 2012, completed in December 2013, and stabilized in March 2014 Value creation Total cost of ~$31.7 million (1) Currently 97% occupied Current rents ~10% higher than development pro forma 2015 projected yield of 7.8% vs. development pro forma of 6.5% Potential value creation over cost to develop of over $16 million (2) Notes 1) Economic costs represent costs for all on-site development and construction costs recognized for GAAP, but including certain items expensed for GAAP (primarily specific financing and operating expenses incurred during lease up) and excluding certain GAAP costs related to consolidated allocated costs, former sponsor-related fees and other non-cash capitalized cost items 2) Using 2015 budgeted NOI, less $250/unit capex, and 5% market cap rate The Franklin – Delray Beach, FL
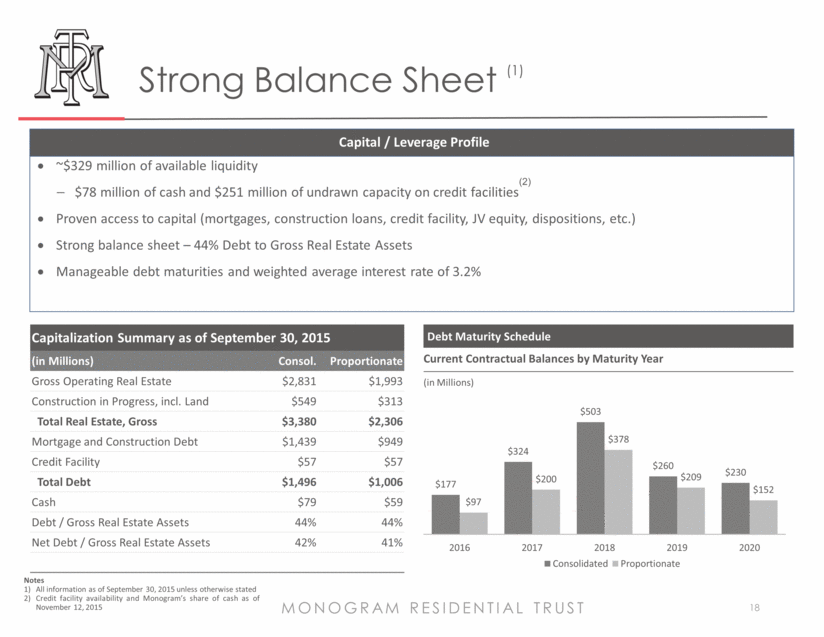
Strong Balance Sheet (1) MONOGRAM RESIDENTIAL TRUST 18 ~$329 million of available liquidity $78 million of cash and $251 million of undrawn capacity on credit facilities(2) Proven access to capital (mortgages, construction loans, credit facility, JV equity, dispositions, etc.) Strong balance sheet – 44% Debt to Gross Real Estate Assets Manageable debt maturities and weighted average interest rate of 3.2% Capital / Leverage Profile Current Contractual Balances by Maturity Year Debt Maturity Schedule Capitalization Summary as of September 30, 2015 (in Millions) Consol. Proportionate Gross Operating Real Estate $2,831 $1,993 Construction in Progress, incl. Land $549 $313 Total Real Estate, Gross $3,380 $2,306 Mortgage and Construction Debt $1,439 $949 Credit Facility $57 $57 Total Debt $1,496 $1,006 Cash $79 $59 Debt / Gross Real Estate Assets 44% 44% Net Debt / Gross Real Estate Assets 42% 41% Notes All information as of September 30, 2015 unless otherwise stated Credit facility availability and Monogram’s share of cash as of November 12, 2015 (in Millions) $177 $324 $503 $260 $230 $97 $200 $378 $209 $152 2016 2017 2018 2019 2020 Consolidated Proportionate
Summary MONOGRAM RESIDENTIAL TRUST 19 High quality, diversified portfolio, with significant concentrations in primary markets and coastal regions Younger portfolio than any other listed multifamily REITs which drives strong resident demand and minimizes near-term cap-ex resulting in premium rents Multiple growth drivers, including internal growth from lease-up and stabilization of existing portfolio and development pipeline, as well as incremental external growth through acquisitions and development Flexible capital structure with modest leverage and proven access to multiple sources of capital Deep and experienced management team, with track record of success and value creation
