Attached files
| file | filename |
|---|---|
| 8-K - 8-K SANDLER O'NEILL CONFERENCE NOV 2015 - YADKIN FINANCIAL Corp | sandleroneillconference8-k.htm |
(NYSE: YDKN) 2015 Q3 Investor Presentation November 2015

Forward Looking Statements Information in this presentation contains forward-looking statements within the meaning of the Private Securities Litigation Reform Act of 1995. These statements involve risks and uncertainties that could cause actual results to differ materially, including without limitation, reduced earnings due to larger than expected credit losses in the sectors of our loan portfolio secured by real estate due to economic factors, including declining real estate values, increasing interest rates, increasing unemployment, or changes in payment behavior or other factors; reduced earnings due to larger credit losses because our loans are concentrated by loan type, industry segment, borrower type, or location of the borrower or collateral; the rate of delinquencies and amount of loans charged-off; the adequacy of the level of our allowance for loan losses and the amount of loan loss provisions required in future periods; costs or difficulties related to the integration of the banks we acquired or may acquire may be greater than expected; factors relating to our proposed acquisition of NewBridge Bancorp (“NewBridge”), including our ability to consummate the transaction on a timely basis, if at all, our ability to effectively and timely integrate the operations of Yadkin and NewBridge, our ability to achieve the estimated synergies from this proposed transaction and once integrated, the effects of such business combination on our future financial condition, operating results, strategy and plans; results of examinations by our regulatory authorities, including the possibility that the regulatory authorities may, among other things, require us to increase our allowance for loan losses or writedown assets; the amount of our loan portfolio collateralized by real estate, and the weakness in the commercial real estate market; our ability to maintain appropriate levels of capital; adverse changes in asset quality and resulting credit risk-related losses and expenses; increased funding costs due to market illiquidity, increased competition for funding, and increased regulatory requirements with regard to funding; significant increases in competitive pressure in the banking and financial services industries; changes in political conditions or the legislative or regulatory environment, including the effect of recent financial reform legislation on the banking industry; general economic conditions, either nationally or regionally and especially in our primary service area, becoming less favorable than expected resulting in, among other things, a deterioration in credit quality; our ability to retain our existing customers, including our deposit relationships; changes occurring in business conditions and inflation; changes in monetary and tax policies; ability of borrowers to repay loans; risks associated with a failure in or breach of our operational or security systems or infrastructure, or those of our third party vendors and other service providers or other third parties, including as a result of cyber attacks, which could disrupt our businesses, result in the disclosure or misuse of confidential or proprietary information, damage our reputation, increase our costs and cause losses; changes in accounting principles, policies or guidelines; changes in the assessment of whether a deferred tax valuation allowance is necessary; our reliance on secondary sources such as Federal Home Loan Bank advances, sales of securities and loans, federal funds lines of credit from correspondent banks and out-of-market time deposits, to meet our liquidity needs; loss of consumer confidence and economic disruptions resulting from terrorist activities or other military actions; and changes in the securities markets. Additional factors that could cause actual results to differ materially are discussed in the Company’s filings with the Securities and Exchange Commission ("SEC"), including without limitation its Annual Report on Form 10-K, its Quarterly Reports on Form 10-Q, and its Current Reports on Form 8-K. The forward-looking statements in this presentation speak only as of the date of the presentation, and the Company does not assume any obligation to update such forward-looking statements. Pro forma combined information which combines Yadkin and VantageSouth Banchares, Inc. contained in this presentation are used for illustrative purposes only. The pro forma information does nor purport to project our results of operations or financial condition for any future period or for any future date. Non‐GAAP Measures Statements included in this presentation include non‐GAAP measures and should be read along with the accompanying tables to the October 22, 2015 presentation and earnings release which provide a reconciliation of non‐GAAP measures to GAAP measures. Management believes that these non‐GAAP measures provide additional useful information that allows readers to evaluate the ongoing performance of the Company. Non‐GAAP measures should not be considered as an alternative to any measure of performance or financial condition as promulgated under GAAP, and investors should consider the Company's performance and financial condition as reported under GAAP and all other relevant information when assessing the performance or financial condition of the Company. Non‐GAAP measures have limitations as analytical tools, and investors should not consider them in isolation or as a substitute for analysis of the Company's results or financial condition as reported under GAAP. Important Information 2

Investment Thesis 3 Experienced Management Management team has an average of over 25 years of experience Growth Markets Centered in one of the fastest-growing regions in the U.S. Asset Generation is a core strength Over $1.5 billion in loan origination in last 4 qtrs Strong Operating Metrics Q3 2015 annualized Operating ROTCE of 13.85% and Operating ROAA of 1.15% Conservative Balance Sheet Strong asset quality metrics, increasing shareholders’ equity, significant credit mark from Yadkin and prior acquisitions, and asset sensitive position Pending Attractive NewBridge Acquisition Acquisition of NewBridge is strategically compelling, financially attractive with approximately 10% EPS accretion and a TBV earnback of approximately 2.5 years, and has a low risk profile YDKN (70) NBBC (42) YDKN County NBBC County County of Overlap Legend

Delivering on Yadkin-VantageSouth MOE Potential 4 Notes: - Market capitalizations are calculated using the final closing stock price of the quarter. Q2 2014 combined market capitalization is as of Jan 24, 2014, the final trading day prior to the Yadkin-VSB merger announcement. This market capitalization is also adjusted to include the VantageSouth common equity raised at the same time. - Q2 2014 represents pro forma combination of Yadkin Financial Corporation and VantageSouth Bancshares, Inc. results. Q2 and Q3 2015 represent actual results. All periods exclude securities gains and losses, merger and conversion costs, and restructuring charges. - Results from Q2 2014 do not include any acquisition accounting impact from the Yadkin-VantageSouth merger. Q2 2014 Combined Q2 2015 Q3 2015 % Change Q3 2015 vs Q2 2014 Operating EPS $0.31 $0.38 $0.40 29% Operating Pre-Tax, Pre-Provision Income ($mm) $15.1 $20.0 $21.4 42% Operating Efficiency Ratio 65.9% 60.0% 57.3% (13.1%) Operating ROAA 1.01% 1.14% 1.15% 14% Operating ROTCE 10.93% 13.35% 13.85% 27% . Net Interest Margin (FTE) 4.06% 4.29% 4.19% 3% Annualized Qtr / Qtr Loan Growth 3.4% 5.8% 3.2% (4.5%) Net Charge-Offs / Avg. Loans (Annualized) (0.08%) 0.12% 0.12% NM Market Capitalization ($000s) $532,304 $664,387 $681,489 28%

NewBridge Transaction Rationale 5 Low Risk Profile Experienced management team with a proven track record of integrating acquisitions Comprehensive due diligence process and thorough review of loan portfolio Supplemented with experienced 3rd party vendors Compatible cultures with familiar customer base Financially Attractive Positions franchise for top tier financial performance Enhances business model economies of scale EPS accretion of approximately 10% After full realization of expense savings Minimal dilution to tangible book value TBV accretive in approximately 2.5 years IRR in excess of 20% Strong pro forma capital position Strategically Compelling Strengthens YDKN’s leading position as the largest community bank in North Carolina Over $7 billion in assets with #1 market share among community banks Statewide presence serving North Carolina’s premier markets Adds significant scale in the Piedmont Triad Complements existing footprint in Raleigh, Charlotte and Wilmington Bolsters long-term growth potential Broadens and deepens competitive strengths

Stock Price Performance Since Announcement 6 Source: SNL Financial Note: Market pricing data as of 11/6/2015 YDKN announced quarterly cash dividend of $0.10 per share payable on November 19 to shareholders of record as of November 5 -8.0% -6.0% -4.0% -2.0% 0.0% 2.0% 4.0% 6.0% 8.0% 10.0% 12.0% KRE (8.6%) YDKN (10.0%)

Overview of Pro Forma Franchise 7 Source: SNL Financial and MapInfo Professional Note: Projected population growth from 2016 to 2021 Note: Community Bank defined as an institution with less than or equal to $25 billion in total assets (1) Figures reflect balance sheet data as of 6/30/2015; Market capitalization based on YDKN stock price of $22.79 as of 10/12/15 YDKN (70) NBBC (42) YDKN County NBBC County County of Overlap Legend Charlotte Comm. Bank Rank: #2 Deposits: $784mm Market Tot: $216.2bn Pop. Growth: 7.0% Piedmont Triad Comm. Bank Rank: #2 Deposits: $1.6bn Market Tot: $46.3bn Pop. Growth: 3.7% Raleigh / Durham- Chapel Hill Comm. Bank Rank: #1 Deposits: $1.2bn Market Tot: $32.2bn Pop. Growth: 7.8% Wilmington Comm. Bank Rank: #2 Deposits: $366mm Market Tot: $5.1bn Pop. Growth: 6.9% Pro Forma Financial Highlights (1) Branches: 112 Assets: $7.1 billion Loans: $5.0 billion Deposits: $5.2 billion Market Cap: $1.2 billion

Transaction Assumptions 8 Earnings estimates based on First Call consensus Gross credit mark of 1.3%, $25.7 million Reversal of existing credit mark of $11.7 million Net transaction-related credit mark of $14.0 million Reversal of existing ALLL Mark up of pension liability of $5 million One-time merger related expenses of $29 million (pre-tax) Approximately 30% realized at close Cost savings expected to be 33.5% of estimated NBBC expense base 37.5% realized in 2016, 100% realized by year-end 2017 Branch consolidations of approximately 10% of the combined company No revenue synergies included in modeling Core deposit intangible of 1.0% of non-time deposits, amortized sum-of-years digits over 8 years TRUPS mark of $11.4 million Anticipate special dividend of $0.50 per share to YDKN shareholders prior to close Both YDKN and NBBC to continue paying current quarterly dividends Estimated close in early Q2 2016
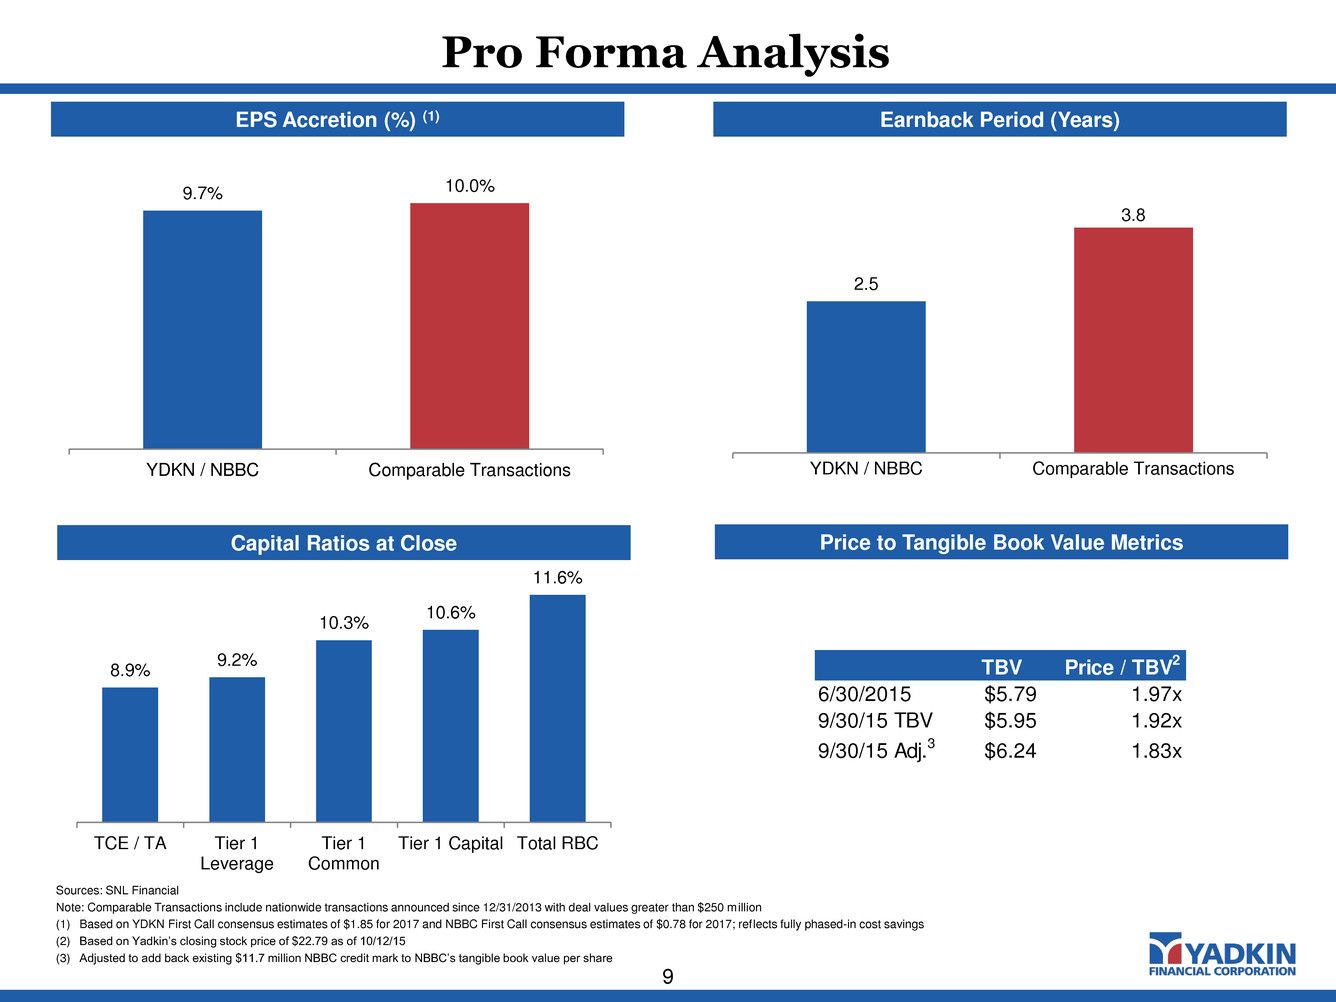
Pro Forma Analysis 9 Sources: SNL Financial Note: Comparable Transactions include nationwide transactions announced since 12/31/2013 with deal values greater than $250 million (1) Based on YDKN First Call consensus estimates of $1.85 for 2017 and NBBC First Call consensus estimates of $0.78 for 2017; reflects fully phased-in cost savings (2) Based on Yadkin’s closing stock price of $22.79 as of 10/12/15 (3) Adjusted to add back existing $11.7 million NBBC credit mark to NBBC’s tangible book value per share 9.7% 10.0% YDKN / NBBC Comparable Transactions Earnback Period (Years) 2.5 3.8 YDKN / NBBC Comparable Transactions EPS Accretion (%) (1) Capital Ratios at Close 8.9% 9.2% 10.3% 10.6% 11.6% TCE / TA Tier 1 Leverage Tier 1 Common Tier 1 Capital Total RBC Price to Tangible Book Value Metrics TBV Price / TBV2 6/30/2015 $5.79 1.97x 9/30/15 TBV $5.95 1.92x 9/30/15 Adj.3 $6.24 1.83x

Transaction Timeline 10 November 2015: File merger application November 2015: File Form S-4 Registration Statement January 2016: Integration Kick-off meeting March 2016: Target regulatory and shareholder approval Early Q2 2016: Close Merger Q3 2016: Conversion December 2016: Cost saves fully realized; one time costs completed

Growth Markets: Population Growth and Business Climate 11 Business Climate: 14 Fortune 500 companies headquartered in NC 7 in Charlotte MSA, 5 in Triad, 2 in Raleigh-Cary MSA NC is the #1 state for corporate relocations and has been for 8 of the past 9 years NC claimed top spot in Site Selection magazine’s listing of the best business climates in North America in 3 of the last 4 years Google Fiber broke ground in the Raleigh-Durham and Charlotte in June Since the beginning of 2015, 69 companies have announced relocations or expansions in Wake County (Raleigh/Durham area) Charlotte and Raleigh ranked #9 and #14, respectively, on Glassdoor’s June 2015 “Recovery Index” – a measure of growth in employment, new jobs, and wages Sources: SNL Financial, Relocation data from Site Selection magazine; all other data from U.S. Census Bureau , U.S. Bureau of Labor Statistics, and Charlotte Chamber of Commerce. Population Growth: Raleigh - MSA is projected to grow by over 2x the national average between 2015 – 2020 Charlotte - 17th largest U.S. city with a population of 796,921, making it the 3rd fastest growing big city in the U.S. in 2013 Piedmont Triad has over 20 colleges and universities and a population of over 1.6 million NC is projected to be the 7th largest state in 2030, up from 9th currently In NC 3+ million people to be added by 2030 Projected Population Growth ('16 - '21) by MSA Raleigh Charlotte Greensboro- High Point US 8.19% 7.01% 4.24% 3.69%
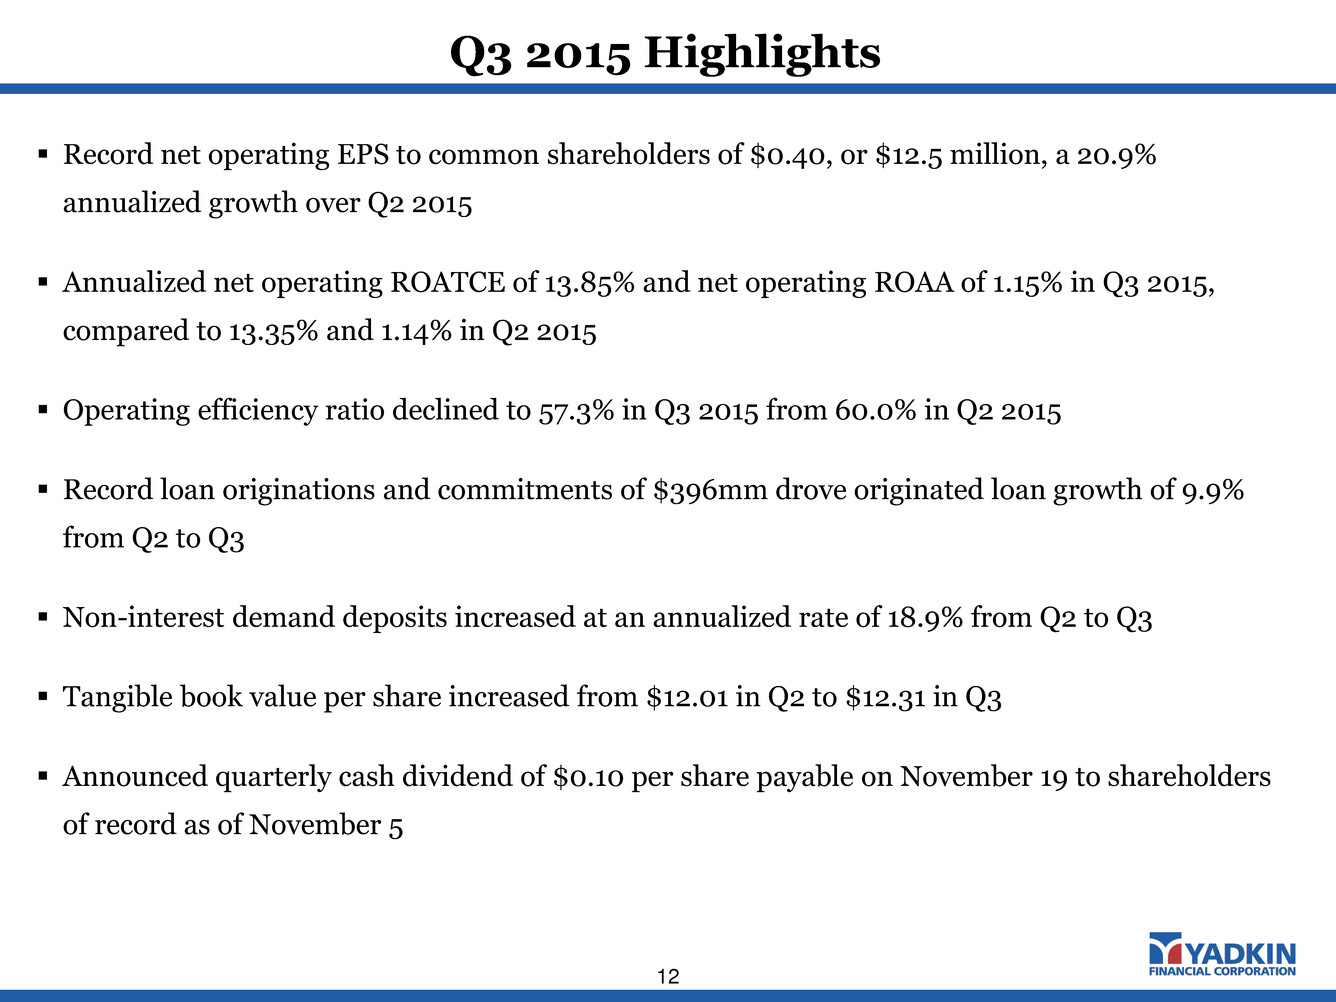
Q3 2015 Highlights 12 Record net operating EPS to common shareholders of $0.40, or $12.5 million, a 20.9% annualized growth over Q2 2015 Annualized net operating ROATCE of 13.85% and net operating ROAA of 1.15% in Q3 2015, compared to 13.35% and 1.14% in Q2 2015 Operating efficiency ratio declined to 57.3% in Q3 2015 from 60.0% in Q2 2015 Record loan originations and commitments of $396mm drove originated loan growth of 9.9% from Q2 to Q3 Non-interest demand deposits increased at an annualized rate of 18.9% from Q2 to Q3 Tangible book value per share increased from $12.01 in Q2 to $12.31 in Q3 Announced quarterly cash dividend of $0.10 per share payable on November 19 to shareholders of record as of November 5
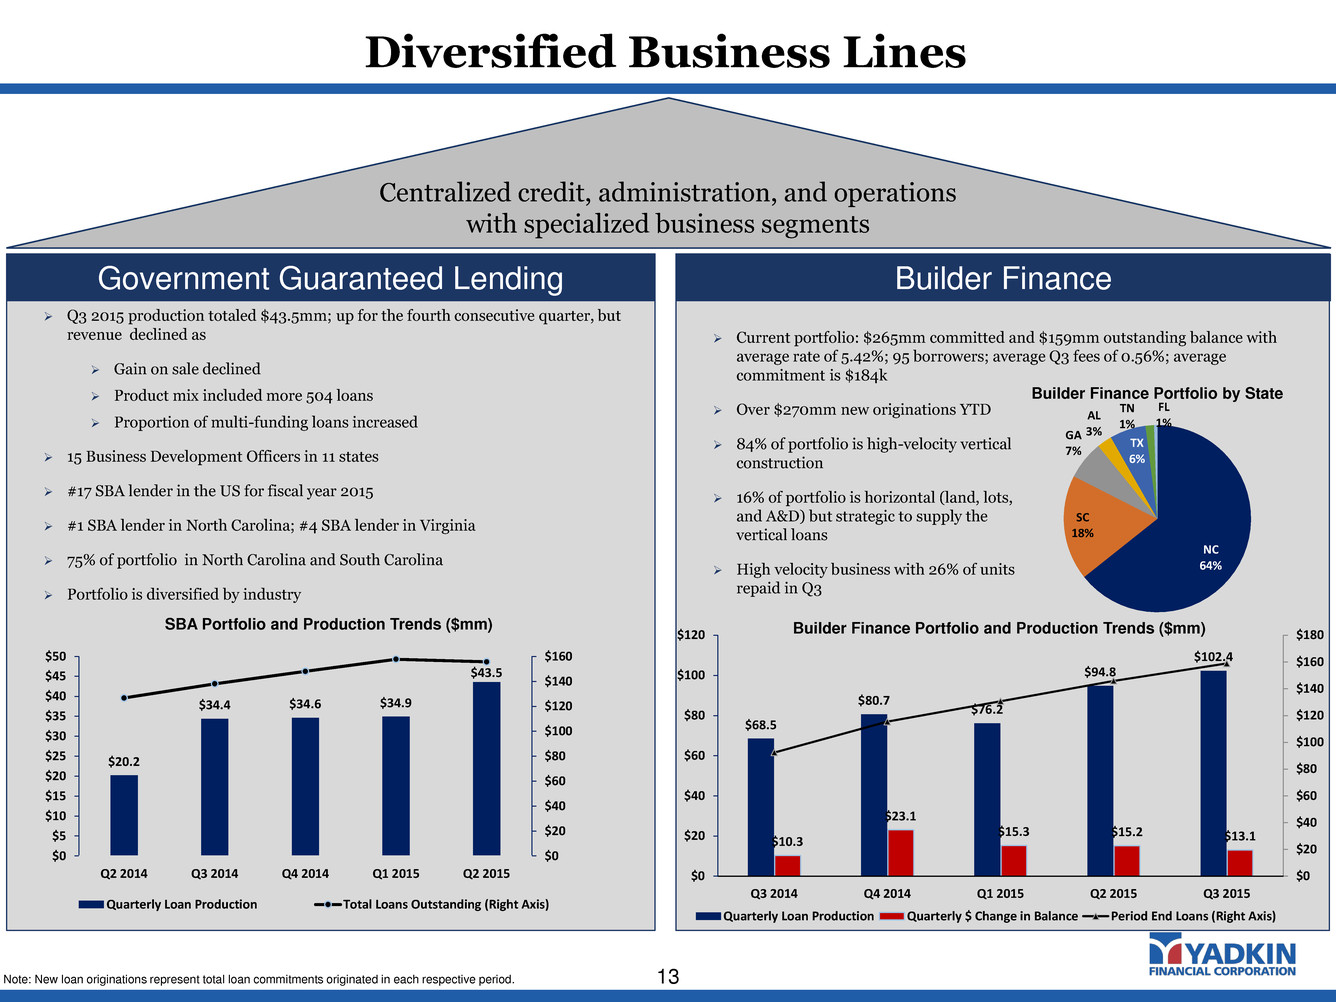
Current portfolio: $265mm committed and $159mm outstanding balance with average rate of 5.42%; 95 borrowers; average Q3 fees of 0.56%; average commitment is $184k Over $270mm new originations YTD 84% of portfolio is high-velocity vertical construction 16% of portfolio is horizontal (land, lots, and A&D) but strategic to supply the vertical loans High velocity business with 26% of units repaid in Q3 Diversified Business Lines 13 Q3 2015 production totaled $43.5mm; up for the fourth consecutive quarter, but revenue declined as Gain on sale declined Product mix included more 504 loans Proportion of multi-funding loans increased 15 Business Development Officers in 11 states #17 SBA lender in the US for fiscal year 2015 #1 SBA lender in North Carolina; #4 SBA lender in Virginia 75% of portfolio in North Carolina and South Carolina Portfolio is diversified by industry Centralized credit, administration, and operations with specialized business segments Government Guaranteed Lending Builder Finance SBA Portfolio and Production Trends ($mm) Builder Finance Portfolio and Production Trends ($mm) Builder Finance Portfolio by State Note: New loan originations represent total loan commitments originated in each respective period. $68.5 $80.7 $76.2 $94.8 $102.4 $10.3 $23.1 $15.3 $15.2 $13.1 $0 $20 $40 $60 $80 $100 $120 $140 $160 $180 $0 $20 $40 $60 $80 $100 $120 Q3 2014 Q4 2014 Q1 2015 Q2 2015 Q3 2015 Quarterly Loan Production Quarterly $ Change in Balance Period End Loans (Right Axis) $20.2 $34.4 $34.6 $34.9 $43.5 $0 $20 $40 $60 $80 $100 $120 $140 $160 $0 $5 $10 $1 $20 $25 30 $35 $40 $45 $50 Q2 2014 Q3 2014 Q4 2014 Q1 2015 Q2 2015 Quarterly Loan Production Total Loans Outstanding (Right Axis) NC 64% SC 18% GA 7% AL 3% TX 6% TN 1% FL 1%

Diversified Business Lines 14 42 Commercial Bankers covering the Carolinas Total commercial loan portfolio of $1.9bn Over $690 million deposits 71% are low-cost transactional deposits Q3 loan production of $207mm 60% variable and 40% fixed Note: New loan originations represent total loan commitments originated in each respective period. Centralized credit, administration, and operations with specialized business segments Commercial Banking 49 Mortgage Loan Officers covering the Carolinas Supported by 39 underwriting, administrative, servicing, and operations personnel Plan to hire additional loan officers in Q4 Q3 loan production of $84mm, up 5% annualized from Q2 Purchase grew to over 70% of total production Origination income of $1.8 million in Q3 Net MSR amortization and valuation allowance of combined $(352k) Mortgage Portfolio by Loan Type Production by Loan Type Production by Region Q2 Actual Q3 Actual Product Mix Margin Mix Margin Conventional 66% 2.480% 61% 2.580% Government 23% 3.234% 29% 3.519% Jumbo 2% 1.999% 1% 1.360% Portfolio 9% 9% Margin Excl. Portfolio 2.661% 2.855% Non-Owner Occupied CRE 39.7% Owner Occupied CRE 29.1% C&I 20.4% Agricu ture 4.4% 1-4 Fam. Sec. 6.4% Consumer 0.0% Non-Owner Occupied CRE 51.0% Owner Occupied CRE 12.6% C&I 33.0% Agriculture 1.7% 1-4 Fam. Sec. 1.6% Triangle Area 42.4% East 15.2% Charlotte Area 22.8% West 19.7%
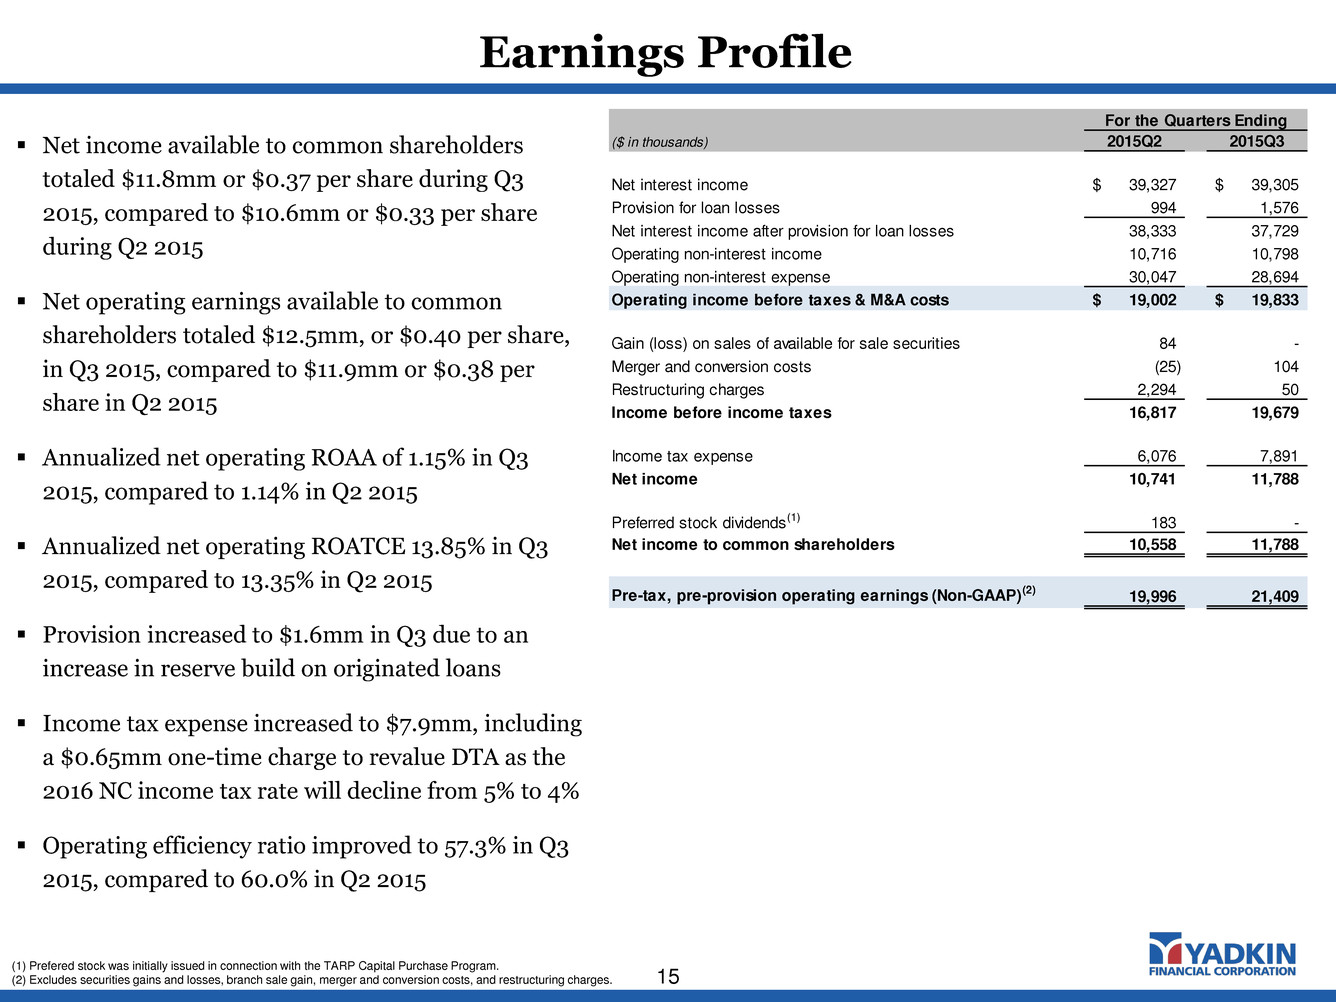
Net income available to common shareholders totaled $11.8mm or $0.37 per share during Q3 2015, compared to $10.6mm or $0.33 per share during Q2 2015 Net operating earnings available to common shareholders totaled $12.5mm, or $0.40 per share, in Q3 2015, compared to $11.9mm or $0.38 per share in Q2 2015 Annualized net operating ROAA of 1.15% in Q3 2015, compared to 1.14% in Q2 2015 Annualized net operating ROATCE 13.85% in Q3 2015, compared to 13.35% in Q2 2015 Provision increased to $1.6mm in Q3 due to an increase in reserve build on originated loans Income tax expense increased to $7.9mm, including a $0.65mm one-time charge to revalue DTA as the 2016 NC income tax rate will decline from 5% to 4% Operating efficiency ratio improved to 57.3% in Q3 2015, compared to 60.0% in Q2 2015 (1) Prefered stock was initially issued in connection with the TARP Capital Purchase Program. (2) Excludes securities gains and losses, branch sale gain, merger and conversion costs, and restructuring charges. Earnings Profile 15 For the Quarters Ending ($ in thousands) 2015Q2 2015Q3 Net interest income 39,327$ 39,305$ Provision for loan losses 994 1,576 Net interest income after provision for loan losses 38,333 37,729 Operating non-interest income 10,716 10,798 Operating non-interest expense 30,047 28,694 Operating income before taxes & M&A costs 19,002$ 19,833$ Gain (loss) on sales of available for sale securities 84 - Merger and conversion costs (25) 104 Restructuring charges 2,294 50 Income before income taxes 16,817 19,679 Income tax expense 6,076 7,891 Net income 10,741 11,788 Preferred stock dividends(1) 183 - Net income to common shareholders 10,558 11,788 Pre-tax, pre-provision operating earnings (Non-GAAP)(2) 19,996 21,409

Net Interest Income 16 4.68% 4.43% 4.33% 4.29% 4.19% 4.46% 4.25% 4.23% 4.12% 4.09% 3.72% 3.77% 3.74% 3.77% 3.77% 3.50% 3.75% 4.00% 4.25% 4.50% 4.75% Q3 2014 Q4 2014 Q1 2015 Q2 2015 Q3 2015 GAAP NIM (FTE) Adjusted NIM (Less Accelerated Loan Accretion, Includes Scheduled Accretion & Amortization) Core NIM (Excludes All Purchase Accounting Impacts) Combined Net Interest Margin (%) Continued loan pricing pressure weighed on earning asset yields and NIM and core NIM (non-GAAP) Impact of acquisition accounting on net interest margin is declining Focus remains on disciplined loan pricing and low-cost, core deposits Average Yields and Rates For the Quarter Ended, 2015Q2 2015Q3 Loans 5.47% 5.36% Securities 2.35% 2.35% Other earning assets 0.37% 0.34% Total earning assets 4.83% 4.72% Interest bearing deposits (0.48%) (0.48%) Borrowed funds (1.61%) (1.59%) Total interest bearing liabilities (0.65%) (0.66%) Net interest margin (FTE) 4.29% 4.19% Cost of funds 0.53% 0.53%

Diverse Drivers of Non-Interest Income Growth 17 $1,885 $2,133 $1,390 $1,911 $2,492 $1,520 $1,002 $1,322 $1,633 $1,731 $2,072 $2,917 $2,873 $3,677 $3,009 $3,265 $3,506 $3,253 $3,495 $3,566 $0 $2,000 $4,000 $6,000 $8,000 $10,000 $12,000 Q3 2014 Q4 2014 Q1 2015 Q2 2015 Q3 2015 Other Mortgage SBA Service charges & fees on deposits accounts Combined Operating Non-Interest Income Composition1 ($000) $8,742 $9,558 Operating non-interest income totaled $10.8mm in the Q3 2015, a 23.5% increase from Q3 2014 Record SBA production of $43.5mm in Q3 as pipeline strengthened but gain on sale declined, product mix included more 504 loans, and the proportion of multi-funding loans increased Mortgage revenue increased to $1.7mm, benefiting from a 5% annualized production increase over Q2 2015 and despite a $0.1mm MSR impairment compared to a $0.2mm MSR recovery in Q2 (1) Excludes securities gains and losses and branch sale gain. $8,838 $10,716 $10,798 Change from Q3 2014 to Q3 2015 9.2% 45.2% 13.9% 32.2%
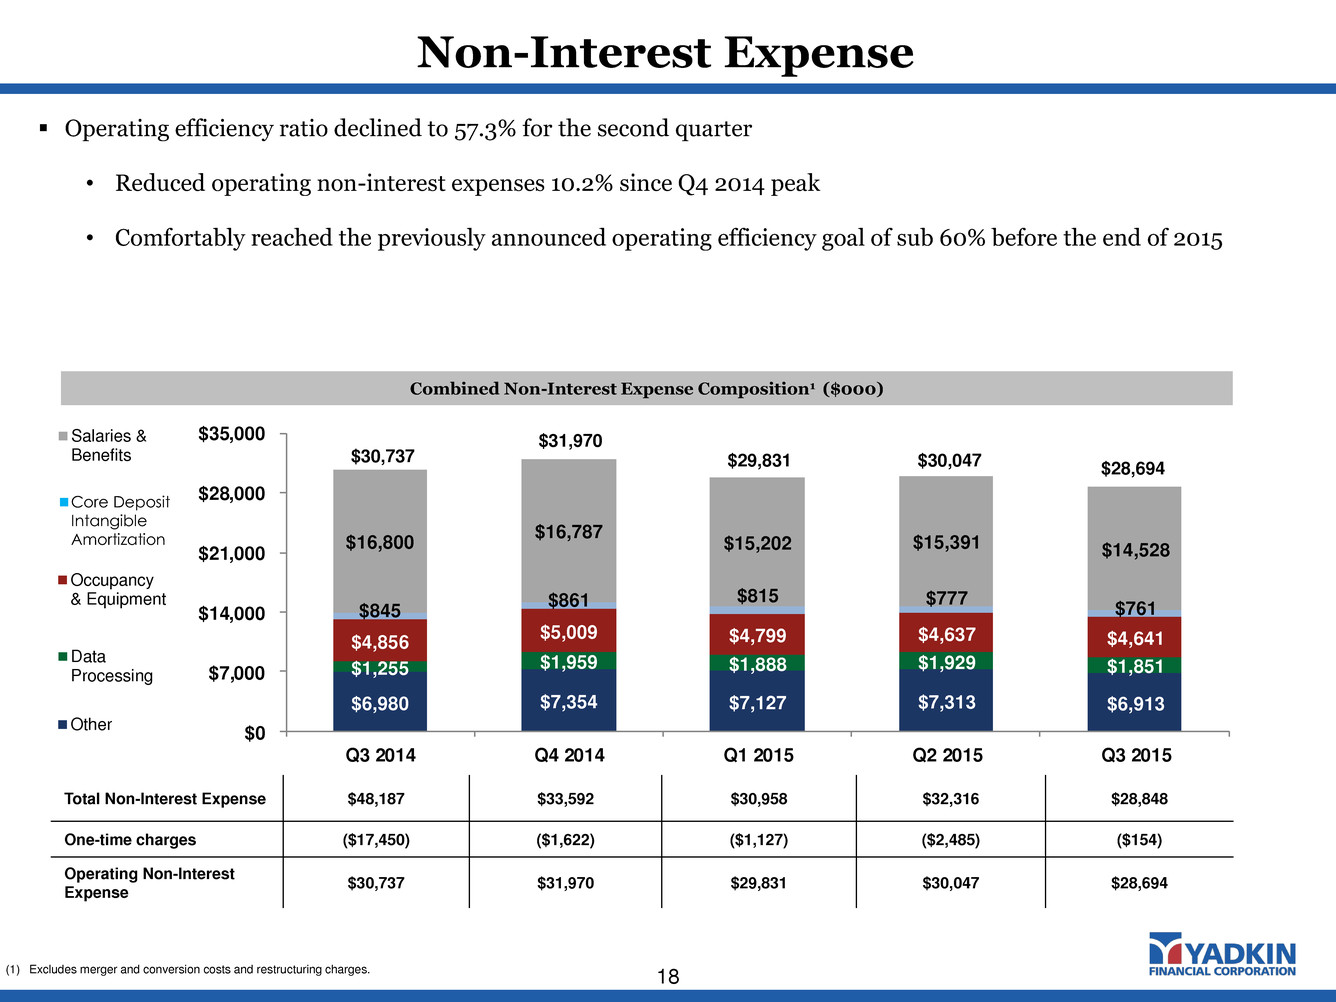
Non-Interest Expense 18 $6,980 $7,354 $7,127 $7,313 $6,913 $1,255 $1,959 $1,888 $1,929 $1,851 $4,856 $5,009 $4,799 $4,637 $4,641 $845 $861 $815 $777 $761 $16,800 $16,787 $15,202 $15,391 $14,528 $0 $7,000 $14,000 $21,000 $28,000 $35,000 Q3 2014 Q4 2014 Q1 2015 Q2 2015 Q3 2015 Combined Non-Interest Expense Composition1 ($000) Operating efficiency ratio declined to 57.3% for the second quarter • Reduced operating non-interest expenses 10.2% since Q4 2014 peak • Comfortably reached the previously announced operating efficiency goal of sub 60% before the end of 2015 Total Non-Interest Expense $48,187 $33,592 $30,958 $32,316 $28,848 One-time charges ($17,450) ($1,622) ($1,127) ($2,485) ($154) Operating Non-Interest Expense $30,737 $31,970 $29,831 $30,047 $28,694 $2,884 $4,687 $4,569 $4,376 $4,006 $644 $1,075 $1,105 $1,096 $1,030 $1,547 $2,408 $2,497 $2,600 $2,636 $5,991 $11,009 $10,034 $9,452 $9,014 $0 $4,000 $8,000 $12,000 $16,000 $20,000 Q1 2013 Q2 2013 Q3 2013 Q4 2013 Q1 2014 Other Data Processing Occupancy & Equipment Salaries & Benefits $2,884 $4,687 $4,569 $4,376 $4,006 $644 $1,075 $1,105 $1,096 $1,030 $1,547 $2,408 $2,497 $2,600 $2,636 $5,991 $11,009 $10,034 $9,452 $9,014 $0 $4,000 $8,000 $12,000 $16,000 $20,000 Q1 2013 Q2 2013 Q3 2013 Q4 2013 Q1 2014 Other Data Processing Occupancy & Equipment Salaries & Benefits $2,884 $4,687 $4,569 $4,376 $4,006 $644 $1,075 $1,105 $1,096 $1,030 $1,547 $2,408 $2,497 $2,600 $2,636 $5,991 $11,009 $10,034 $9,452 $9,014 $0 $4,000 $8,000 $12,000 $16,000 $20,000 Q1 2013 Q2 2013 Q3 2013 Q4 2013 Q1 2014 Other Data Processing Occupancy & Equipment Salaries & Benefits $30,737 $31,970 $29,831 (1) Excludes merger and conversion costs and restructuring charges. $2,884 $4,687 $4,569 $4,376 $4,006 $644 $1,075 $1,105 $1,096 $1,030 $1,547 $2,408 $2,497 $2,600 $2,636 $5,991 $11,009 $10,034 $9,452 $9,014 $0 $4,000 $8,000 $12,000 $16,000 $20,000 Q1 2013 Q2 2 13 Q3 2 13 Q4 2013 Q1 2014 Other Data Processing Occupancy & Equipment Salaries & Benefits n Core Deposit Intangible Amortization $30,047 $28,694
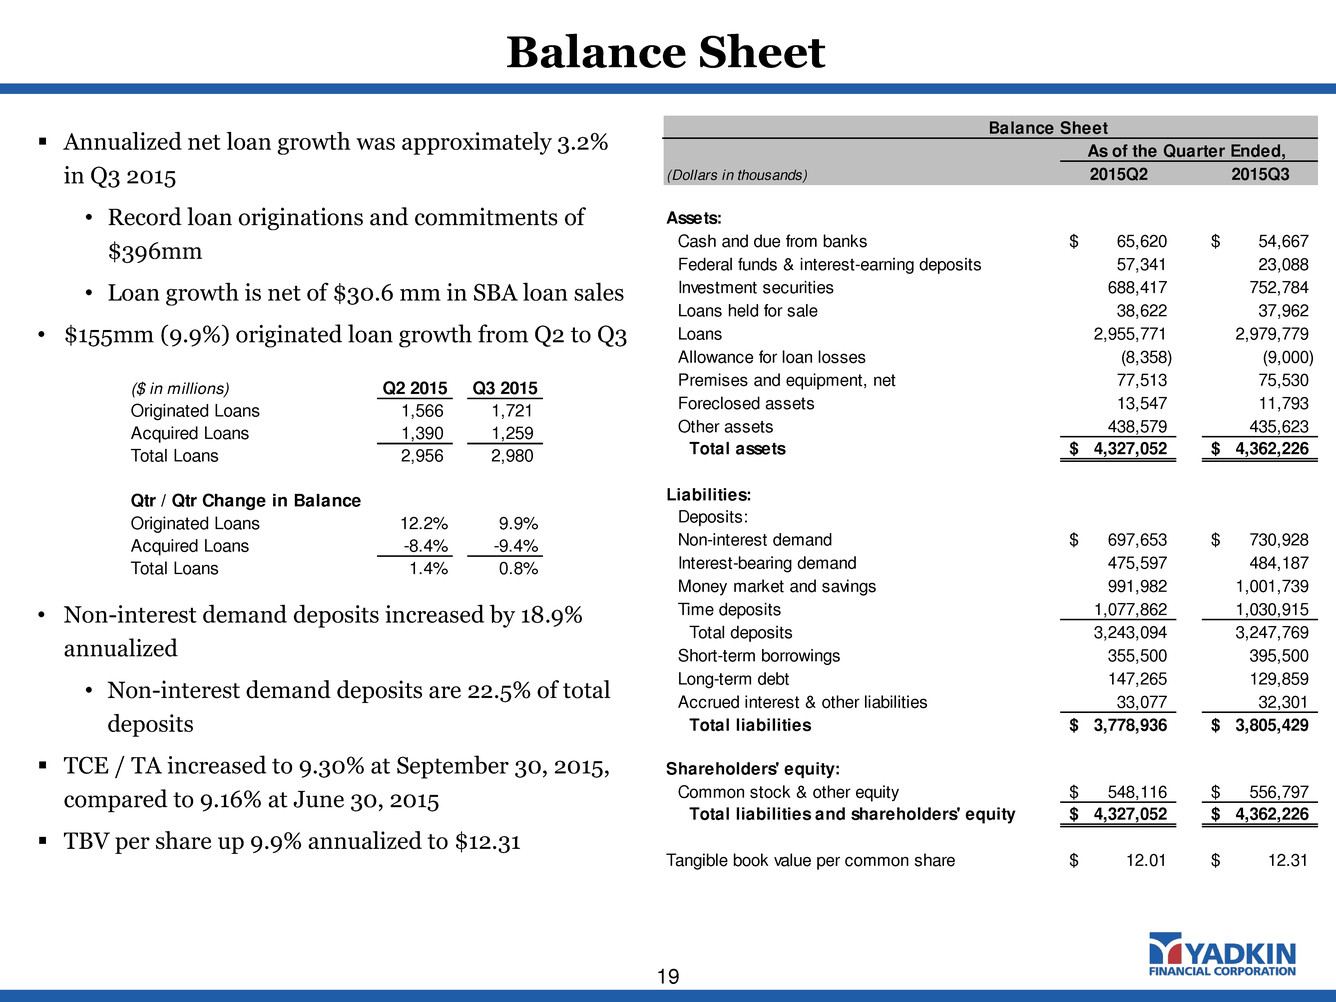
Balance Sheet 19 Annualized net loan growth was approximately 3.2% in Q3 2015 • Record loan originations and commitments of $396mm • Loan growth is net of $30.6 mm in SBA loan sales • $155mm (9.9%) originated loan growth from Q2 to Q3 • Non-interest demand deposits increased by 18.9% annualized • Non-interest demand deposits are 22.5% of total deposits TCE / TA increased to 9.30% at September 30, 2015, compared to 9.16% at June 30, 2015 TBV per share up 9.9% annualized to $12.31 Balance Sheet As of the Quarter Ended, (Dollars in thousands) 2015Q2 2015Q3 Assets: Cash and due from banks 65,620$ 54,667$ Federal funds & interest-earning deposits 57,341 23,088 Investment securities 688,417 752,784 Loans held for sale 38,622 37,962 Loans 2,955,771 2,979,779 Allowance for loan losses (8,358) (9,000) Premises and equipment, net 77,513 75,530 Foreclosed assets 13,547 11,793 Other assets 438,579 435,623 Total assets 4,327,052$ 4,362,226$ Liabilities: Deposits: Non-interest demand 697,653$ 730,928$ Interest-bearing demand 475,597 484,187 Money market and savings 991,982 1,001,739 Time deposits 1,077,862 1,030,915 Total deposits 3,243,094 3,247,769 Short-term borrowings 355,500 395,500 Long-term debt 147,265 129,859 Accrued interest & other liabilities 33,077 32,301 Total liabilities 3,778,936$ 3,805,429$ Shareholders' equity: Common stock & other equity 548,116$ 556,797$ Total liabilities and shareholders' equity 4,327,052$ 4,362,226$ Tangible book value per common share 12.01$ 12.31$ ($ in millions) Q2 2015 Q3 2015 Originated Loans 1,566 1,721 Acquire Loans 1,390 1,259 Total Loans 2,956 2,980 Qtr / Qtr Change in Balance Originated Loans 12.2% 9.9% Acquired Loans -8.4% -9.4% Total Loans 1.4% 0.8%

Positive Balance Sheet Trends 20 Tangible Book Value per Share Growth – Post Merger Loan Composition Q2 2015 ($mm) $10.93 $11.44 $11.75 $12.01 $12.31 $10.50 $11.00 $11.50 $12.00 $12.50 Q3 2014 Q4 2014 Q1 2015 Q2 2015 Q3 2015 Loan growth of $208 million or 6.1% annualized since Q2 2014, excluding $30 million remaining fair value mark to Yadkin loans Balanced loan portfolio Loan growth is virtually all variable rate as fixed rate production is offset with fixed rate curtailments and fixed rate payoffs 31.3% growth in non-interest deposit deposits since Q2 2014; DDA now represents 21.5% of total deposits C&I $494.5 16.4% O.O. CRE $663.0 22.0% C&D $367.8 12.2% Non O.O. CRE $551.2 18.3% Multifamily $145.3 4.8% 1-4 Family $375.4 12.4% HELOCs $274.2 9.1% Farmland / Ag. Production $94.3 3.1% Consumer & Other $52.2 1.7% Fixed Rate 54%Floating Rate 46% Loan Portfolio – Fixed vs. Floating Dividend: $0.10 13.5% growth from Q3 ’14 to Q3 ’15 (including dividend)

Asset Sensitive Balance Sheet 21 Static Shock Impact on Economic Value of Equity Static Shock Impact on Net Interest Income Variable Rate Loan Floors Yadkin is positioned to benefit in a rising rate environment Yadkin is in an asset sensitive position on a short- and long-term basis Slight asset sensitivity trades off some current period income for improved earnings and equity impact in a rising rate environment (0.5%) 0.7% 3.2% 6.3% 9.1% 2.6% 0.5% (5.0%) 0.0% 5.0% 10.0% -100 Shock 100 Shock 200 Shock 300 Shock 400 Shock YC Flatten YC Steepen Source: FICAST Data Corporation. (2.3%) 1.1% 2.3% 3.3% 4.2% 4.3% (1.8%) (5.0%) 0.0% 5.0% 10.0% -100 Shock 100 Shock 200 Shock 300 Shock 400 Shock YC Flatten YC Steepen Grouping Balance % of Total Balance Cumulative % of Total Balances a. No Floor $323.7 28% 28% b. Floor Reached 132.1 12% 40% c. 0-25 bps to Reach Floor 43.1 4% 44% d. 26-50 bps to Reach Floor 48.5 4% 48% e. 51-75 bps to Reach Floor 163.9 14% 62% f. 76-100 bps to Reach Floor 144.7 13% 75% g. 101-125 bps to Reach Floor 132.0 12% 86% h. 126-150 bps to Reach Floor 43.6 4% 90% i. 151-175 bps to Reach Floor 66.3 6% 96% j. 176-200 bps to Reach Floor 13.6 1% 97% k. 201-250 bps to Reach Floor 17.0 1% 99% l. 251-300 bps to Reach Floor 11.6 1% 100% m. 301+ bps to Reach Floor 3.2 0% 100% $1,143.2 100% In th em on ey flo or s = $6 87 MM

Strong Capital Position 22 9.3% 9.4% 10.5% 10.6% 12.0% 10.5% 10.4% 11.6% 11.6% 12.0% 2.0% 6.0% 10.0% 14.0% TCE / TA Tier 1 Leverage Common Equity Tier 1 Tier 1 Risk-Based Total Risk-Based Yadkin Financial Yadkin Bank Regulatory Capital Ratios – Holding Company and Bank Level (9/30/15) Announced quarterly cash dividend of $0.10 per share payable on November 19 to shareholders of record as of November 5

Loan Loss Reserves Breakdown ($ in thousands) Non- Purchased Impaired Purchased Impaired (SOP 03-3) Total ALLL balance at 6/30/15 7,000$ 1,358$ 8,358$ Net charge-offs (934) 0 (934) Provision for loan losses 1,536 40 1,576 ALLL balance at 9/30/15 7,602 1,398 9,000 Remaining credit mark 19,685 11,749 31,434 Remaining interest rate mark 3,526 8,135 11,661 Total effective reserve 30,813$ 21,282$ 52,095$ Loan balances 2,820,118$ 159,661$ 2,979,779$ ALLL percentage 0.27% 0.88% 0.30% Remaining credit mark percentage 0.70% 7.36% 1.05% Remaining interest rate mark percentage 0.13% 5.10% 0.39% Effective reserve percentage 1.09% 13.33% 1.75%21.2% 21.9% 20.4% 21.0% 23.3% 10.0% 20.0% 30.0% 40.0% Q3 2014 Q4 2014 Q1 2015 Q2 2015 Q3 2015 Strong Asset Quality 23 Effective Reserve of 1.75% or $52.1mm Classified Asset Ratio (1) – Bank Level (1) Classified Asset Ratio = Classified Assets / (Tier 1 Capital + Loan Loss Reserves) Net charge-offs - 12bps Remaining mark declined by $4.1mm in Q3 2015 Q3 increase driven by one credit; not systemic as 30-89 days past due loans are at lowest point since merger completion
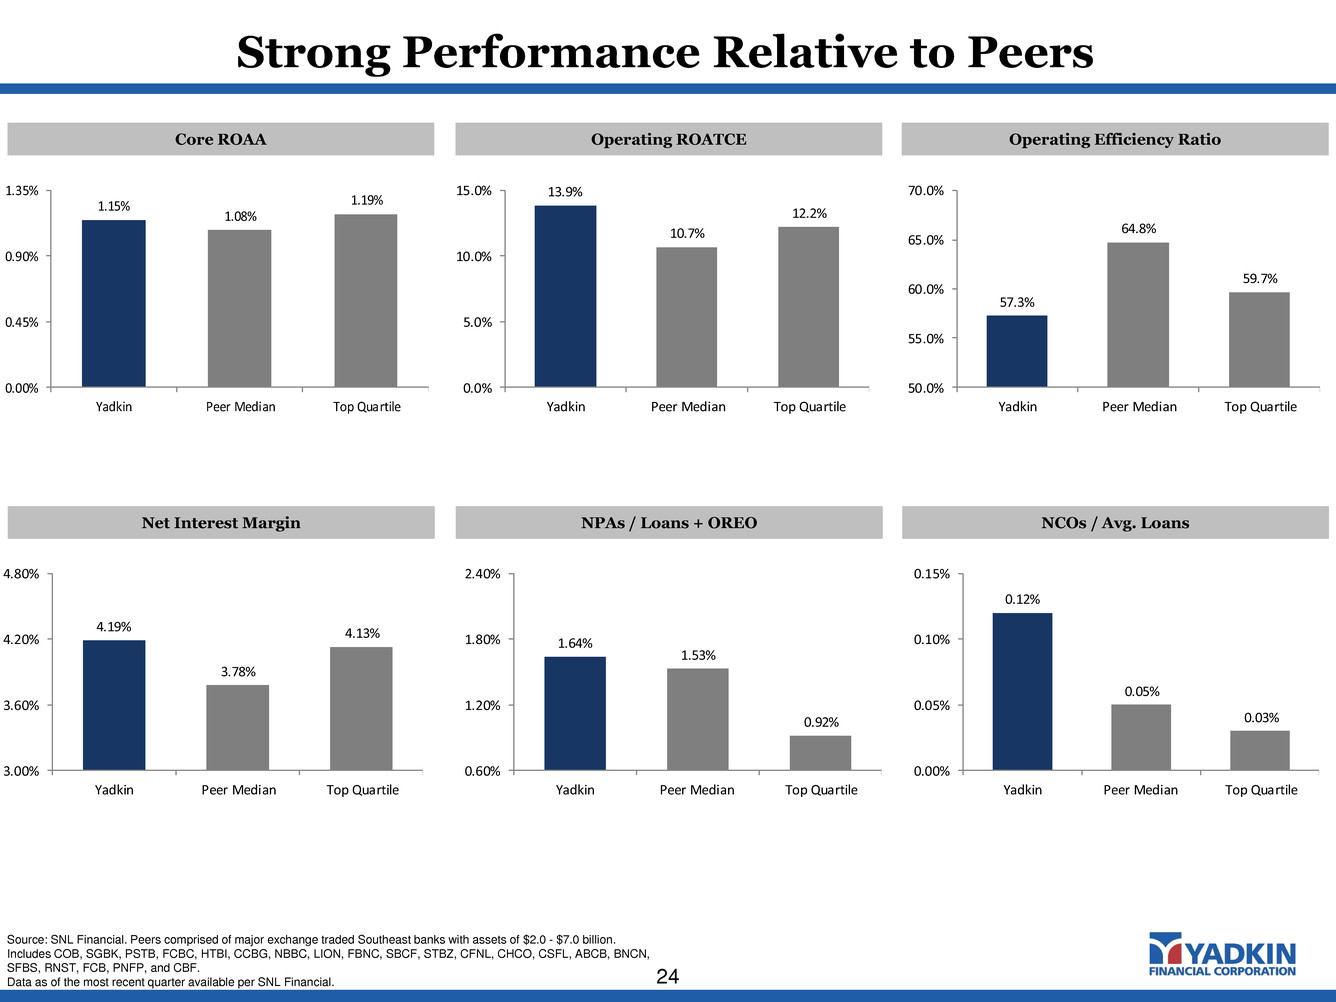
Strong Performance Relative to Peers 24 1.15% 1.08% 1.19% 0.00% 0.45% 0.90% 1.35% Yadkin Peer Median Top Quartile Core ROAA Operating ROATCE Operating Efficiency Ratio 13.9% 10.7% 12.2% 0.0% 5.0% 10.0% 15.0% Yadkin Peer Median Top Quartile 57.3% 64.8% 59.7% 50.0% 55.0% 60.0% 65.0% 70.0% Yadkin Pee Median Top Quartile 4.19% 3.78% 4.13% 3.00% 3.60% 4.20% 4.80% Yadkin Peer Median Top Quartile Net Interest Margin NPAs / Loans + OREO NCOs / Avg. Loans 1.64% 1.53% 0.92% 0.60% 1.20% 1.80% 2.40% Yadkin Peer Median Top Quartile 0.12% 0.05% 0.03% 0.00% 0.05% 0.10% 0.15% Yadkin P er Median Top Quartile Source: SNL Financial. Peers comprised of major exchange traded Southeast banks with assets of $2.0 - $7.0 billion. Includes COB, SGBK, PSTB, FCBC, HTBI, CCBG, NBBC, LION, FBNC, SBCF, STBZ, CFNL, CHCO, CSFL, ABCB, BNCN, SFBS, RNST, FCB, PNFP, and CBF. Data as of the most recent quarter available per SNL Financial.
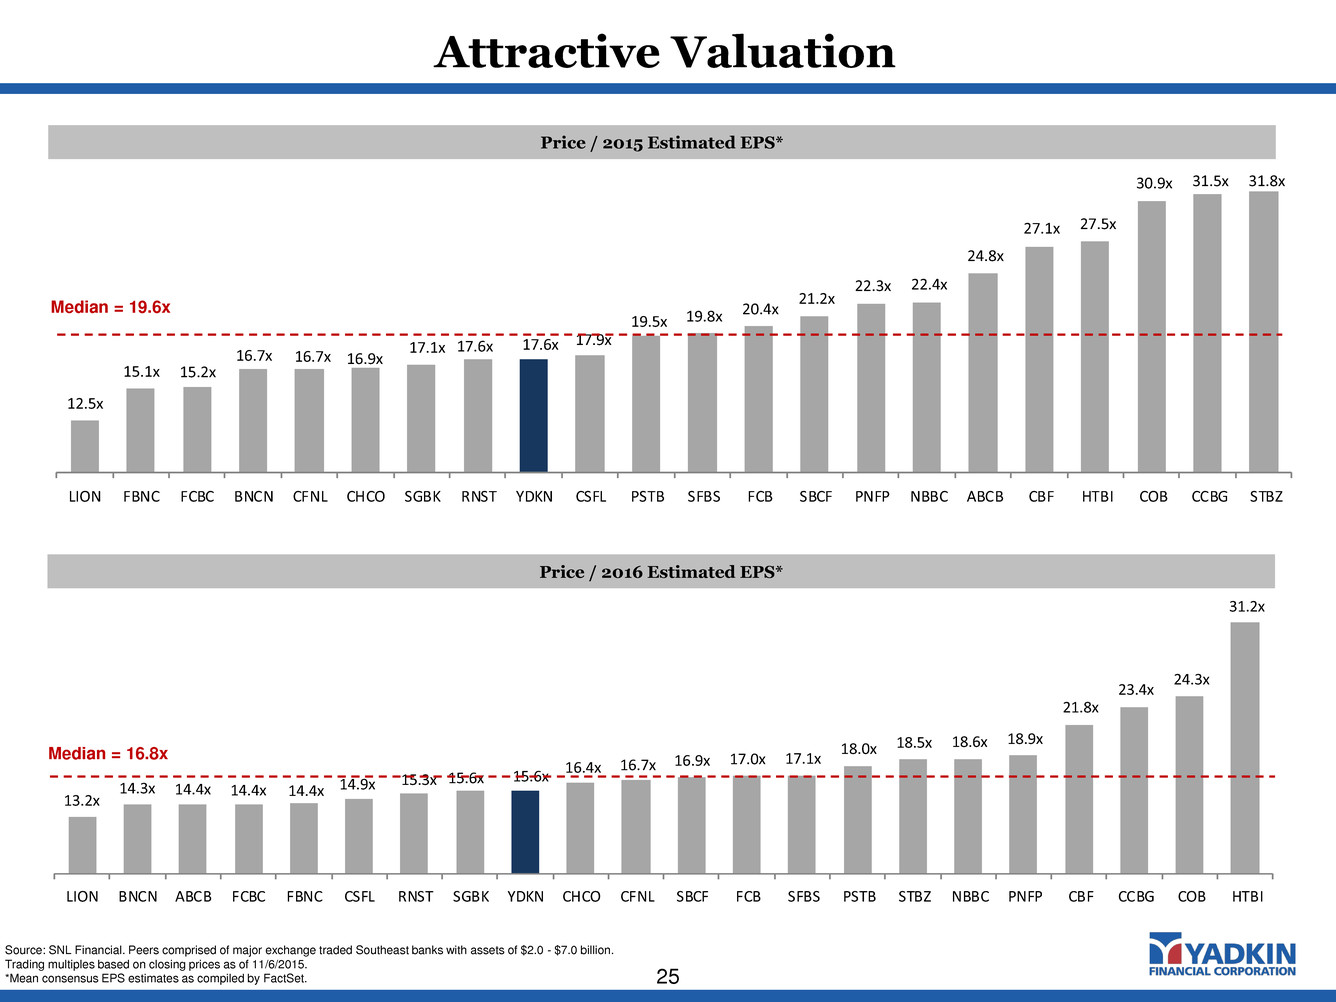
Attractive Valuation 25 13.2x 14.3x 14.4x 14.4x 14.4x 14.9x 15.3x 15.6x 15.6x 16.4x 16.7x 16.9x 17.0x 17.1x 18.0x 18.5x 18.6x 18.9x 21.8x 23.4x 24.3x 31.2x LION BNCN ABCB FCBC FBNC CSFL RNST SGBK YDKN CHCO CFNL SBCF FCB SFBS PSTB STBZ NBBC PNFP CBF CCBG COB HTBI Price / 2016 Estimated EPS* Median = 16.8x Source: SNL Financial. Peers comprised of major exchange traded Southeast banks with assets of $2.0 - $7.0 billion. Trading multiples based on closing prices as of 11/6/2015. *Mean consensus EPS estimates as compiled by FactSet. 12.5x 15.1x 15.2x 16.7x 16.7x 16.9x 17.1x 17.6x 17.6x 17.9x 19.5x 19.8x 20.4x 21.2x 22.3x 22.4x 24.8x 27.1x 27.5x 30.9x 31.5x 31.8x LION FBNC FCBC BNCN CFNL CHCO SGBK RNST YDKN CSFL PSTB SFBS FCB SBCF PNFP NBBC ABCB CBF HTBI COB CCBG STBZ Price / 2015 Estimated EPS* Median = 19.6x
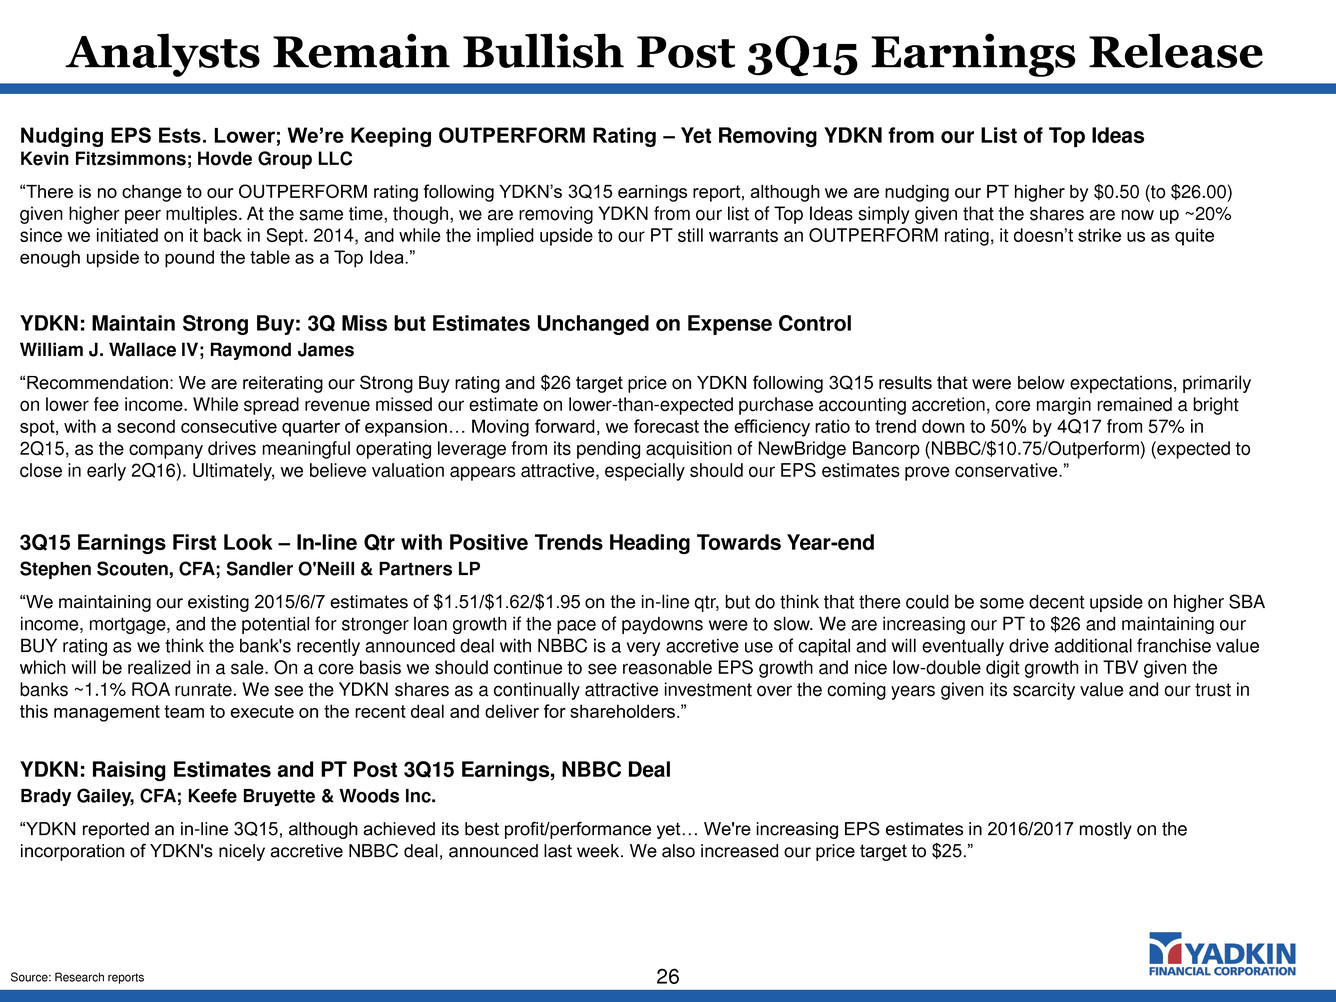
Analysts Remain Bullish Post 3Q15 Earnings Release 26 Nudging EPS Ests. Lower; We’re Keeping OUTPERFORM Rating – Yet Removing YDKN from our List of Top Ideas Kevin Fitzsimmons; Hovde Group LLC “There is no change to our OUTPERFORM rating following YDKN’s 3Q15 earnings report, although we are nudging our PT higher by $0.50 (to $26.00) given higher peer multiples. At the same time, though, we are removing YDKN from our list of Top Ideas simply given that the shares are now up ~20% since we initiated on it back in Sept. 2014, and while the implied upside to our PT still warrants an OUTPERFORM rating, it doesn’t strike us as quite enough upside to pound the table as a Top Idea.” YDKN: Maintain Strong Buy: 3Q Miss but Estimates Unchanged on Expense Control William J. Wallace IV; Raymond James “Recommendation: We are reiterating our Strong Buy rating and $26 target price on YDKN following 3Q15 results that were below expectations, primarily on lower fee income. While spread revenue missed our estimate on lower-than-expected purchase accounting accretion, core margin remained a bright spot, with a second consecutive quarter of expansion… Moving forward, we forecast the efficiency ratio to trend down to 50% by 4Q17 from 57% in 2Q15, as the company drives meaningful operating leverage from its pending acquisition of NewBridge Bancorp (NBBC/$10.75/Outperform) (expected to close in early 2Q16). Ultimately, we believe valuation appears attractive, especially should our EPS estimates prove conservative.” Source: Research reports 3Q15 Earnings First Look – In-line Qtr with Positive Trends Heading Towards Year-end Stephen Scouten, CFA; Sandler O'Neill & Partners LP “We maintaining our existing 2015/6/7 estimates of $1.51/$1.62/$1.95 on the in-line qtr, but do think that there could be some decent upside on higher SBA income, mortgage, and the potential for stronger loan growth if the pace of paydowns were to slow. We are increasing our PT to $26 and maintaining our BUY rating as we think the bank's recently announced deal with NBBC is a very accretive use of capital and will eventually drive additional franchise value which will be realized in a sale. On a core basis we should continue to see reasonable EPS growth and nice low-double digit growth in TBV given the banks ~1.1% ROA runrate. We see the YDKN shares as a continually attractive investment over the coming years given its scarcity value and our trust in this management team to execute on the recent deal and deliver for shareholders.” YDKN: Raising Estimates and PT Post 3Q15 Earnings, NBBC Deal Brady Gailey, CFA; Keefe Bruyette & Woods Inc. “YDKN reported an in-line 3Q15, although achieved its best profit/performance yet… We're increasing EPS estimates in 2016/2017 mostly on the incorporation of YDKN's nicely accretive NBBC deal, announced last week. We also increased our price target to $25.”

Analyst Recommendations 27 Firm Rating Price Target 2015 Estimate 2016 Estimate 2017 Estimate Raymond James Financial Inc. Strong Buy $26.00 $1.52 $1.80 $2.00 Hovde Group LLC Outperform $26.00 $1.53 $1.79 $2.03 Sandler O'Neill & Partners LP Buy $26.00 $1.51 $1.62 $1.95 Keefe Bruyette & Woods Inc. Outperform $25.00 $1.51 $1.74 $1.90 FIG Partners LLC Market Perform $24.25 $1.55 $1.70 $1.95 Consensus $25.45 $1.52 $1.73 $1.97 Source: SNL Financial

Contact: Terry Earley (919) 659-9015 terry.earley@yadkinbank.com

Additional Information About the Proposed Transaction and Where to Find It This communication is being made in respect of the proposed transaction involving Yadkin and NewBridge. This material is not a solicitation of any vote or approval of Yadkin’s or NewBridge’s shareholders and is not a substitute for the joint proxy statement/prospectus or any other documents which Yadkin and NewBridge may send to their respective shareholders in connection with the proposed merger. This communication does not constitute an offer to sell or the solicitation of an offer to buy any securities. In connection with the proposed transaction, Yadkin intends to file with the Securities and Exchange Commission (“SEC”) a Registration Statement on Form S-4 that will include a joint proxy statement of Yadkin and NewBridge and a prospectus of Yadkin, as well as other relevant documents concerning the proposed transaction. Investors and security holders are also urged to carefully review and consider each of Yadkin’s and NewBridge’s public filings with the SEC, including but not limited to their Annual Reports on Form 10-K, their proxy statements, their Current Reports on Form 8-K and their Quarterly Reports on Form 10-Q. Both NewBridge and Yadkin will mail the joint proxy statement/prospectus to their respective shareholders. BEFORE MAKING ANY VOTING OR INVESTMENT DECISIONS, INVESTORS AND SHAREHOLDERS OF YADKIN AND NEWBRIDGE ARE URGED TO CAREFULLY READ THE ENTIRE REGISTRATION STATEMENT AND JOINT PROXY STATEMENT/PROSPECTUS REGARDING THE PROPOSED MERGER WHEN IT BECOMES AVAILABLE AND ANY OTHER RELEVANT DOCUMENTS FILED WITH THE SEC, AS WELL AS ANY AMENDMENTS OR SUPPLEMENTS TO THOSE DOCUMENTS, BECAUSE THEY WILL CONTAIN IMPORTANT INFORMATION ABOUT THE PROPOSED TRANSACTION. Investors and security holders may obtain a free copy of the proxy statement/prospectus (when available) and other filings containing information about Yadkin and NewBridge at the SEC’s website at www.sec.gov. The joint proxy statement/prospectus (when available) and the other filings may also be obtained free of charge at Yadkin’s website at www.yadkinbank.com, or at NewBridge’s website at www.newbridgebank.com. Yadkin, NewBridge and certain of their respective directors and executive officers, under the SEC’s rules, may be deemed to be participants in the solicitation of proxies of Yadkin’s and NewBridge’s shareholders in connection with the proposed transaction. Information about the directors and executive officers of Yadkin and their ownership of Yadkin common stock is set forth in the proxy statement for Yadkin’s 2015 Annual Meeting of Shareholders, as filed with the SEC on Schedule 14A on April 10, 2015. Information about the directors and executive officers of NewBridge and their ownership of NewBridge’s common stock is set forth in the proxy statement for NewBridge’s 2015 Annual Meeting of Shareholders, as filed with the SEC on a Schedule 14A on April 2, 2015. Additional information regarding the interests of those participants and other persons who may be deemed participants in the transaction may be obtained by reading the joint proxy statement/prospectus regarding the proposed transaction when it becomes available. Free copies of this document may be obtained as described in the preceding paragraph. Important Information 29
