Attached files
| file | filename |
|---|---|
| 8-K - FORM 8-K - PROASSURANCE CORP | v424271_8k.htm |
Exhibit 99.1

ProAssurance Q4 2015 Investor Presentation Updated as of November 10, 2015
Forward Looking Statements 2 This presentation contains Forward Looking Statements and other information designed to convey our projections and expectations regarding future results. There are a number of factors which could cause our actual results to vary materially from those projected in this presentation. The principal risk factors that may cause these differences are described in various documents we file with the Securities and Exchange Commission, such as our Current Reports on Form 8 - K, and our regular reports on Forms 10 - Q and 10 - K, particularly in “Item 1A, Risk Factors.” Please review this presentation in conjunction with a thorough reading and understanding of these risk factors. This presentation contains Non - GAAP measures, and we may reference Non - GAAP measures in our remarks and discussions. A reconciliation of these measures to GAAP measures is included in this presentation and is also available in our latest quarterly news release, which is available in the Investor Relations section of our website, www.ProAssurance.com, and in the related Current Report on Form 8K disclosing that release . N on - GAAP Measures

ProAssurance Corporate Profile Healthcare - centric specialty insurance writer Healthcare Professional Liability (HCPL) Only public company writing predominately HCPL Life sciences and medical device liability Workers' compensation Legal professional liability Alternative Risk Transfer Market Cap: $2.5 billion Shareholders’ Equity: $2.0 billion 40 locations in three countries 941 employees Writing in 50 states & DC Emerging international business 3 Corporate Headquarters Claims Offices Claims / Underwriting Offices Underwriting Offices Cayman Islands Lloyds Business Unit Principal Offices Employees Lines of Business HCPL 18 440 Healthcare Professional Liability PRA Corporate 1 84 Corporate functions (Accounting, Legal, etc.) PICA 1 91 Professional Liability for Podiatry & Chiropractic Eastern 7 251 Workers’ Compensation Captive Facilities (all lines) Medmarc 2 48 Products Liability Legal Professional Liability PRA Risk Solutions 1 3 Alternative Risk Transfer September 30, 2015

ProAssurance Brand Profile 4 Specialty P&C Workers’ Comp Healthcare Professional Liability Medical Technology & Life Sciences Products Liability Legal Professional Liability Alternative Risk Transfer

Mission, Vision and Values 5 Mission We exist to protect others Vision We will be the best in the world at understanding and providing solutions for the risks our customers encounter as healers, innovators, employers, and professionals. Through an integrated family of specialty companies, products, and services, we will be a trusted partner enabling those we serve to focus on their vital work. As the employer of choice, we embrace every day as a singular opportunity to reach for extraordinary outcomes, build and deepen superior relationships, and accomplish our mission with infectious enthusiasm and unbending integrity Values Integrity Relationships Leadership Enthusiasm

Financial Performance Our commentary on financial results

September 30, 2015 Income Statement Highlights Solid profitability in a challenging market in millions, except per share data Qtr Ended Nine Months Ended September 30, 2015 2014 2015 2014 Gross Premiums Written $ 236 $ 227 $ 651 $ 632 Net Investment Result $ 27 $ 33 $ 86 $ 96 Total Revenues $ 175 $ 204 $ 586 $ 634 Total Expenses (Includes Loss Costs) $ 164 $ 157 $ 488 $ 460 Net Income (Includes Realized Investment Gains & Losses) $ 10 $ 35 $ 81 $ 131 Operating Income $ 34 $ 40 $ 105 $ 126 Net Income per Diluted Share $ 0.19 $ 0.59 $ 1.46 $ 2.19 Operating Income per Diluted Share $ 0.63 $ 0.68 $ 1.88 $ 2.10 7

Balance Sheet Highlights Split adjusted, in billions, except Book Value per share Shareholders’ Equity $ 2.0 $ 2.2 $ 2.4 Total Investments 3.7 4.0 3.9 Total Assets 5.0 5.2 5.2 Total Policy Liabilities 2.4 2.4 2.4 $1.26 $1.42 $1.70 $1.86 $2.16 $2.27 $2.39 $2.16 $2.00 2007 2008 2009 2010 2011 2012 2013 2014 Q3 15 Shareholders’ Equity: 59% Increase Since 2007 Book Value per Share $ 37.76 $ 38.17 $ 39.13 Maintaining the financial strength required to keep our insurance promise 8 9/30/15 12/31/14 12/31/13 Book Value per share is affected by our continuing purchase of common stock at prices above Book Value per Share

52% 50% 88% 146% 160% 357% 521% 298% 229% 247% 314% 534% 671% 862% 884% 983% 941% 959% 1095% 1484% 1698% 2012% 2040% 2345% 91 92 93 94 95 96 97 98 99 00 01 02 03 04 05 06 07 08 09 10 11 12 13 14 TOTAL RETURN at 10/31/15 Split Adjusted Since Inception: 2345% 10 Year 10/31/05 - 10/31/15 : 177% 5 Year 10/31/10 - 10/31/15 : 126% Reflects all stock splits and includes all dividends in the year declared. Source: SNL The Payoff: Consistent Value Creation 9 $2.62 $3.85 $3.80 $4.77 $6.24 $6.59 $11.60 $15.74 $10.09 $8.34 $8.79 $10.50 $16.08 $19.56 $24.32 $24.96 $27.46 $26.39 $26.86 $30.30 $39.91 $42.19 $48.48 $45.15 $52.96 SHARE PRICE at 10/31/15 Split Adjusted Since Inception: 1921% (CAGR: 13%) 10 Year 10/31/05 - 10/31/15 : 126% ( CAGR : 9%) 5 Year 10/31/10 - 10/31/15: 84% ( CAGR : 13%)

Reflects all stock splits and includes all dividends in the year declared. Source: SNL The Payoff: Consistent Value Creation 10 $1.84 $2.29 $3.14 $3.32 $4.28 $4.91 $5.79 $6.62 $6.96 $7.61 $8.01 $8.75 $9.39 $10.46 $12.30 $16.81 $19.35 $21.35 $26.30 $30.17 $35.67 $40.23 $43.56 $46.46 $46.98 BOOK VALUE PER SHARE + DIVIDENDS at 9/30/15 Split Adjusted Since Inception: 2460% (CAGR: 15%) 10 Year 2005 - 2014 : 344% ( CAGR : 16%) 5 Year 2010 - 2014 : 77% ( CAGR : 12%) 52% 50% 88% 146% 160% 357% 521% 298% 229% 247% 314% 534% 671% 862% 884% 983% 941% 959% 1095% 1484% 1698% 2012% 2040% 2345% 91 92 93 94 95 96 97 98 99 00 01 02 03 04 05 06 07 08 09 10 11 12 13 14 TOTAL RETURN at 10/31/15 Split Adjusted Since Inception: 2345% 10 Year 10/31/05 - 10/31/15 : 177% 5 Year 10/31/10 - 10/31/15 : 126%

Focused on Shareholder Value Maintaining profitability and bottom line focus Growing book value per share R epurchasing shares above book value per share Producing sustainable shareholder value 0.0 0.5 1.0 1.5 2.0 $- $10.00 $20.00 $30.00 $40.00 $50.00 Sep-91 Feb-93 Jul-94 Dec-95 May-97 Oct-98 Mar-00 Aug-01 Jan-03 Jun-04 Nov-05 Apr-07 Sep-08 Feb-10 Jul-11 Dec-12 May-14 Oct-15 Price to Book Stock Price $ BV/Share $ Stock Price at 10/31/15 to Q3 2015 Book: 1.4x Average Since Inception: 1.4x Unadjusted for dividends Prices Adjusted for 2:1 Stock Split 11

Capital Discussion We focus on the creation of meaningful shareholder value through a disciplined approach to capital management
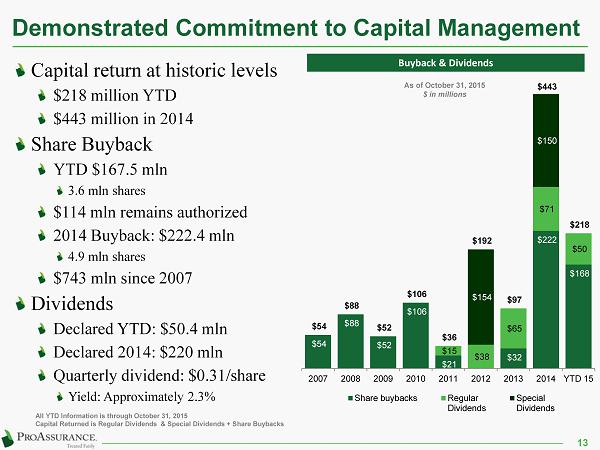
Demonstrated Commitment to Capital Management Capital return at historic levels $218 million YTD $443 million in 2014 Share Buyback YTD $167.5 mln 3.6 mln shares $114 mln remains authorized 2014 Buyback: $222.4 mln 4.9 mln shares $743 mln since 2007 Dividends Declared YTD: $50.4 mln Declared 2014: $220 mln Quarterly dividend: $0.31/share Yield: Approximately 2.3% $168 $222 $32 $21 $106 $52 $88 $54 $50 $71 $65 $38 $15 $150 $154 $218 $443 $97 $192 $36 $106 $52 $88 $54 YTD 15 2014 2013 2012 2011 2010 2009 2008 2007 Share buybacks Regular Dividends Special Dividends As of October 31, 2015 $ in millions Buyback & Dividends 13 All YTD Information is through October 31, 2015 Capital Returned is Regular Dividends & Special Dividends + Share Buybacks

Capital Growth and Total Capital Return 14 A superb track record under the current senior management team ( Q2 2007 to Q3 2015) Shareholders Equity grown from $1.2 billion to $2.0 billion (67%) $1.3 billion returned to shareholders through share repurchase and dividends Additionally, $754 million deployed in key strategic acquisitions to transform ProAssurance $ in 000’s Dividends Declared Share Repurchase Acquisition Total 2007 ̶ $ 54,201 ̶ $ 54,201 2008 ̶ 87,561 ̶ 87,561 2009 ̶ 52,045 $ 137,800 189,845 2010 ̶ 106,347 233,000 339,347 2011 $ 15,269 21,013 ̶ 36,282 2012 192,466 ̶ 24,000 216,466 2013 64,777 32,454 153,700 250,931 2014 220,464 222,360 205,244 648,068 YTD 15* 50,418 167,506 ̶ 217,924 Total $ 543,394 $ 743,487 $ 753,744 $ 2,040,625 Through 10/31/15

Subsidiary Dividends to Corporate 15 Primary source of liquidity Ordinary dividends permitted without regulatory approval Generally once per year/ subsidiary Amounts and criteria vary by domiciliary state Extraordinary dividends require regulatory approval Subsidiary capital requirements play a major role $162 $56 $149 $229 $311 $285 2015 2014 Subsidiary Dividend History 2014 – 2015 in millions Extraordinary Ordinary

Strong Capital Position and Minimal Debt Committed to enhancing shareholder value through effective capital management R etaining capital needed for the market turn and M&A 17% 12% 10% 6% 2% 3% 3% 2% 13% 16% 22% 25% $- $0.5 $1.0 $1.5 $2.0 $2.5 Q3 15 2014 2013 2012 2011 2010 2009 2008 2007 2006 2005 2004 $ in billions Debt Equity Debt to Equity No Debt Prior to 2001 Premiums to Surplus Debt to Equity $350 million long - term debt $250 million 10 - year notes due 11/15/2023 @ 5.30% Coupon $100 million on revolver Collateral earning a higher rate than interest charged Debt - to - capital easily supports financial ratings 16 1.3 1.0 0.5 0.4 0.3 0.3 0.3 0.3 0.2 0.2 0.4 0.4 $- $0.5 $1.0 $1.5 $2.0 $2.5 2015* 2014 2013 2012 2011 2010 2009 2008 2007 2006 2005 2004 Premiums Equity Premiums to Surplus $ in billions * Q3 2015 Surplus vs. Annualized 2015 Premium. Q3 2015 Premium is $221.3 million

Capital Management Priorities 17 The manner in which capital is used has an effect on financial ratings Conceptual Model of Projected A. M. Best BCAR Scores if Premiums Increase Surplus is Reduced Excess Capital vs. Excess Capacity “A+” Rating Threshold

Consolidated Operational Highlights Our commentary on operational results and updates on recent transactions and strategy

Strong Operational Results 2009 - 2014 Combined Ratio: 82.1% (Avg Since 2009: 66.6%) Operating Ratio: 64.2% (Avg Since 2009: 41.5%) 69.1% 68.0% 52.5% 57.3% 70.6% 82.1% 89.9% 38.8% 39.8% 27.6% 32.6% 46.1% 64.2% 74.4% 2009 2010 2011 2012 2013 2014 YTD 15 Combined Ratio and Operating Ratio History Combined Ratio Operating Ratio 19

ProAssurance Outperforms in Insurance Source: A.M . Best Aggregates and Averages for Each Line of Business (1991 - 2013), 2014 Data is preliminary for SNL 104.2% 100.0% 101.5% 107.0% 89.3% 91.1% 87.8% 69.9% 59.2% 88.7% 72.5% 63.1% 1991-2014 10-Year 5-Year Average Combined Ratio Overall P&C MPL PRA - MPL Only PRA - All Lines 20

Consistent Approach to Reserves Recognizing loss trends as they appear No change in reserving philosophy or process Reserve Development History by Quarter by Year $16 $20 $19 $25 $40 $48 $53 $48 $34 $20 $31 $37 $38 $50 $60 $39 $42 $35 $25 $30 $43 $33 $52 $50 $49 $43 $36 $44 $104 $108 $138 $184 $114 $82 $49 $11 $17 $23 $36 $105 $185 $207 $234 $326 $272 $223 $182 $105 2003 2004 2005 2006 2007 2008 2009 2010 2011 2012 2013 2014 2015 Total Q4 Q3 Q2 Q1 $ in millions 21 HCPL Predominating 2003 — 2015

1 2 Physician & Dental 48.5% Ancillary Healthcare 3.0% Life Sciences & Med Tech 3.9% Hospitals & Facilities 4.8% Attorneys 3.6% Workers' Comp 30.0% Lloyd's 6.0% Other 0.2% Specialty P&C: 64.0% YTD 2015 Policyholders: ~79,000 Physician & Dental 58.4% Ancillary Healthcare 10.8% Life Sciences & Med Tech 1.5% Hospitals & Facilities 0.6% Attorneys 15.4% Workers' Comp 12.3% Other 1.0% YTD 2015 Premiums, Policyholder & Distribution YTD 2015 Premium: $651mln Tail Premium Allocated by Line Distribution Sources at 9/30/15 HCPL LPL Life Sciences Workers’ Comp Agent / Broker 71% 91% 100% 100% Direct 29% 9% -- -- 22 9 /30/15

Reinsurance Programs Professional Liability Medical Technology & Life Sciences Workers' Compensation Reinsured Retention Coverage Offered up to Maximum Standard Policy Limits -------- 5% to 10% retained based on layer Coverage Offered up to Maximum Standard Policy Limits -------- 20% Retention s Coverage up to $149.5 million per loss event -------- 0% Retention 100% Retained up to $1 million 100% Retained up to $1 million 100% Retained up to $500,000 23

Eastern Insurance Update 24 Driver of significant top line growth in 2015 Profitable operations also contributing to bottom line success Expected cross selling / cross licensing opportunities are emerging $2.9 million in YTD premiums Continues building the platform to serve the needs of larger integrated health systems and healthcare delivery organizations Workers’ compensation represents one of the single largest liability expenditures for healthcare entities Eastern and ProAssurance underwrite large healthcare books of business, which will continue to be a target market for both companies

Lloyd’s Syndicate 1729 Update 25 First policies underwritten January 1, 2014 $46.9 million in gross premiums written (to ProAssurance) for the nine months reported 9/30/15 Current capacity for 2015 is approximately $113.5 million ProAssurance is providing 58% of underwriting capital $65 million in underwriting capital for 2015 Six - Year commitment of up to $200 million Remaining capital from other corporates and private names Benefits to ProAssurance Diversification Opportunities to participate in international healthcare liability Meet needs of U.S. insureds with international business
The ProAssurance Response 26 Our long - term focus on financial strength is central to our overall strategy and success ProAssurance has always evolved ahead of the curve We have proven our ability to thrive across insurance cycles We have an unmatched combination of financial strength and deep experience We are building the platform that will allow us to serve the broad spectrum of healthcare Prudently leveraging our success and experience with the addition of specialized expertise Broad capabilities to meet evolving demands Eastern, Medmarc, PICA & Mid - Continent Traditional HCPL companies deepen our capabilities

Healthcare Realities American healthcare is wrestling with the question of cost vs. care — we can deliver more care than we can afford Restructuring is producing profound changes in healthcare Healthcare delivery is being pushed down to lower cost providers The U.S. spends a greater proportion of GDP on healthcare and the percentage is increasing 27 6.0% 8.0% 10.0% 12.0% 14.0% 16.0% 18.0% 1995 1996 1997 1998 1999 2000 2001 2002 2003 2004 2005 2006 2007 2008 2009 2010 2011 2012 2013 Healthcare Spending as a Percentage of GDP (1995 - 2013) US France Germany OECD Global Japan UK
Healthcare Realities The Affordable Care Act (ACA) is creating additional layers of complexity Healthcare delivery will be in continuous flux for years to come Will additional coverage under the ACA help or hurt Worker’s Compensation writers? Will the healthcare burden shift Potential liability effects of the ACA High deductible health plans – higher patient expectations, delayed care, collection disputes Provider consolidation – impersonal care More patients – longer waits, increased frustration New providers – lack of continuity of care 28
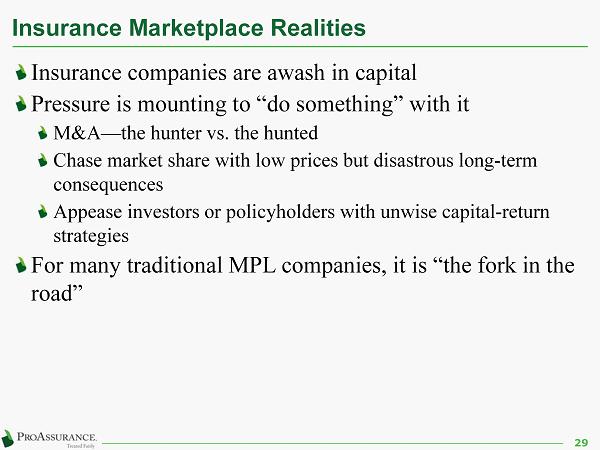
Insurance Marketplace Realities 29 Insurance companies are awash in capital Pressure is mounting to “do something” with it M&A — the hunter vs. the hunted Chase market share with low prices but disastrous long - term consequences Appease investors or policyholders with unwise capital - return strategies For many traditional MPL companies, it is “the fork in the road”

Positioned to Succeed 30 ProAssurance has the right combination of geographic scope, broad experience, and financial strength for success in the new world of healthcare liability Medical Protective (Main Berkshire HCPL) National Recent Hospital Experience $570 Doctors Co National Limited Hospital Experience $695 MLMIC NY Only $499 ProAssurance Size, Scope & Experience $460 Coverys Limited Active Scope $424 PRI NY Only Negative Surplus $380 NORCAL Limited Scope Minimal Hospital Experience $293 MAG Mutual $229 Hospitals Ins. Co $225 ISMIE $222 MCIC $218 MMIC $161 SVMIC $143 MM - MD $136 Controlled Risk $121 MICA $115 MM - NC $97 National Chiropractic Mutual National Limited Focus $92 OMSNIC National Dental & Related $92 COPIC $82 -$0.5 $0.0 $0.5 $1.0 $1.5 $2.0 0 10 20 30 40 50 Size & Scope of Top HCPL Writers Surplus billions Active States Bubble Size = 2014 Direct Premiums Written in millions SNL 2014 Statutory Data, >50% HCPL, Direct Written Premiums >$80 million

Continuing Emphasis on Strategic M&A 31 Seeking additional M&A but current environment may favor organic growth 1. Purchased Company 2. Demutualization Original Companies OHIC HOSPITALS ONLY 2 1 1 1 1 1 1 1 1 1 1 3 4 4 1 4 3. Renewal Rights 4. Assumed Business 2 2 † 2 3 1 3 3 1 SERTA 2 PROFESSIONAL PROTECTIVE INSURANCE, LTD . 1

Strategic Successes Leveraging our reach, expertise and financial strength The Certitude tm program in partnership with Ascension Health CAPAssurance is a joint venture California - based CAP - MPT 30 - years of profitable experience in the hospital and facilities market 32 *www.ascensionhealth.org/index.php?option=com_locations&view=locations&Itemid=148 States with Active Certitude Programs States with Ascension Health Ministry Locations* States with Active CAPAssurance Policies

Strategic Successes: Certitude 33 Largest Catholic healthcare system in the U.S. 20,000+ physicians (affiliated or employed) Coverage for affiliated physicians with staff privileges at Ascension facilities Insurance operations performed by ProAssurance Joint marketing; coordinated claims and risk management efforts Also covering Ascension’s employed physicians and facilities in certain states and Cayman Shared risk through quota share participation by Ascension’s captive on first $1M Current inforce : ~1,800 insured risks; $30 million TTM premium Now operational in Alabama, Connecticut, D.C., Florida, Illinois, Indiana, Kansas, Maryland, Michigan, Missouri, Pennsylvania, Texas and Wisconsin Adding additional states in 2015

Strategic Successes: CAPAssurance 34 Joint program with CAP - MPT, incepted June 2013 Hospitals and large physician groups, now in four states Written by ProAssurance on E&S paper Joint efforts on underwriting, marketing, claims and risk management Utilizes CAP - MPT’s local knowledge and relationships, with ProAssurance’s hospital and large group expertise Risk sharing by CAP through variable quota share participation on first $1M Approximately $4.5M of inforce premium, including three hospitals
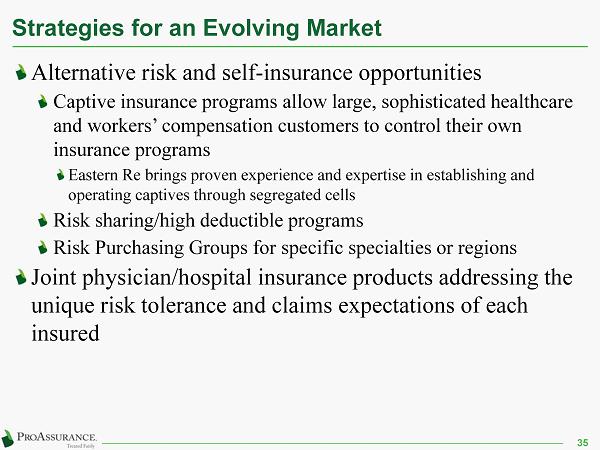
Strategies for an Evolving Market 35 Alternative risk and self - insurance opportunities Captive insurance programs allow large, sophisticated healthcare and workers’ compensation customers to control their own insurance programs Eastern Re brings proven experience and expertise in establishing and operating captives through segregated cells Risk sharing/high deductible programs Risk Purchasing Groups for specific specialties or regions Joint physician/hospital insurance products addressing the unique risk tolerance and claims expectations of each insured

Strategic Opportunities 36 ProAssurance Risk Solutions sm Newly formed unit brings proven expertise to address complex risk financing challenges in both healthcare and workers’ compensation Run - off liabilities in M&A transactions Assumption of existing reserve liabilities for large organizations seeking to repurpose capital resources Specialized self - insurance plans Offers financial flexibility through more efficient securitization/collateralization of self - funded risks ProAssurance Complex Medicine (ProCxM) Newly announced program for larger entities with self - insured retentions Proprietary analytics provides advanced underwriting & pricing capabilities in conjunction with Pro - Praxis, an underwriting agency capitalized by Cooper Gay Swett & Crawford Group

Strategic Opportunities Through Lloyd’s Syndicate 1729 is an investment opportunity with significant insurance benefits Potentially provides access to international medical professional liability opportunities Leverage Medmarc’s expertise to underwrite international medical technology and life sciences risks Increases flexibility for ProAssurance when working with complex risks Primary and excess business can be written 37

Strategic Opportunities Through Medmarc Medmarc is a market - leader in medical products and life sciences liability Increasing presence in device and drug development by larger healthcare organizations Increasing globalization of testing and development efforts are a natural fit with Lloyd’s Syndicate 1729 Provides ProAssurance and our agents with another arrow in our product quiver at the complex end of the healthcare delivery continuum 38

Strategic Opportunities Through Mid - Continent ProAssurance Mid - Continent Underwriters addresses the needs of ancillary healthcare providers This market is increasing rapidly as the push to reduce healthcare costs drives care through lower cost providers who are an important part of the healthcare continuum 39
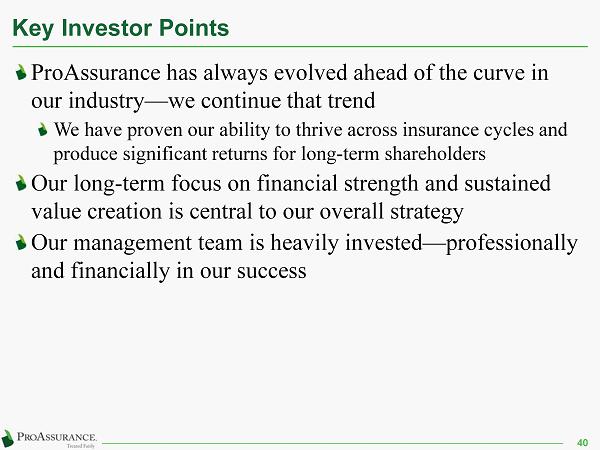
Key Investor Points 40 ProAssurance has always evolved ahead of the curve in our industry — we continue that trend We have proven our ability to thrive across insurance cycles and produce significant returns for long - term shareholders Our long - term focus on financial strength and sustained value creation is central to our overall strategy Our management team is heavily invested — professionally and financially in our success

Segment Highlights We report results in three operational segments Specialty Property Casualty Insurance Workers’ Compensation Insurance Lloyd’s Syndicate 1729

Qtr Ended Six Months Ended September 30, 2015 2014 2015 2014 Gross Premiums Written $ 161 $ 163 $ 417 $ 430 Net Premiums Earned $ 116 $ 124 $ 343 $ 375 Total Revenues $ 117 $ 125 $ 348 $ 379 Net Losses & Loss Adjustment Expenses $ 64 $ 64 $ 197 $ 191 Underwriting & Operating Expenses $ 26 $ 34 $ 80 $ 101 Operating Result $ 27 $ 27 $ 70 $ 87 2015 Specialty P&C Financial Highlights in millions, except ratios 42 Current Accident Year Net Loss Ratio 85.6% 85.6% 86.7% 85.8% Prior Accident Year Net Loss Ratio (30.3%) (34.2%) (29.3%) (34.8%) Net Loss Ratio 55.3% 51.4% 57.4% 51.0% Underwriting Expense Ratio 22.7% 27.3% 23.3% 27.0% Combined Ratio 78.0% 78.7% 80.7% 78.7%
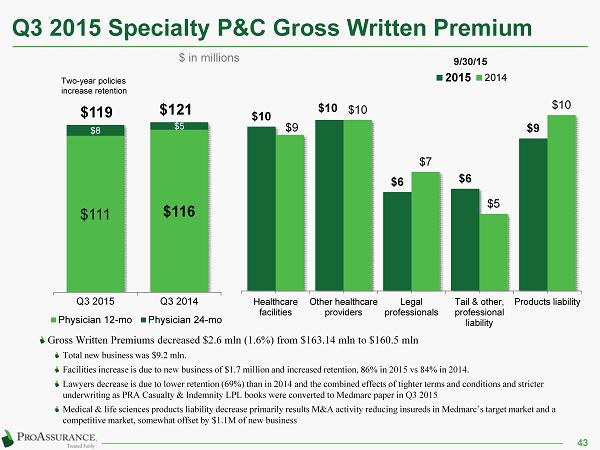
Q3 2015 Specialty P&C Gross Written Premium 43 $10 $10 $6 $6 $9 $9 $10 $7 $5 $10 Healthcare facilities Other healthcare providers Legal professionals Tail & other, professional liability Products liability 2015 2014 $111 $116 $8 $5 $119 $121 Q3 2015 Q3 2014 Physician 12-mo Physician 24-mo $ in millions 9/30/15 Gross Written Premiums decreased $2.6 mln (1.6%) from $163.14 mln to $160.5 mln Total new business was $9.2 mln. Facilities increase is due to new business of $1.7 million and increased retention, 86% in 2015 vs 84% in 2014. Lawyers decrease is due to lower retention (69%) than in 2014 and the combined effects of tighter terms and conditions and stricter underwriting as PRA Casualty & Indemnity LPL books were converted to Medmarc paper in Q3 2015 Medical & life sciences products liability decrease primarily results M&A activity reducing insureds in Medmarc’s target market and a competitive market, somewhat offset by $1.1M of new business Two - year policies increase retention

YTD 2015 Specialty P&C Gross Written Premium 44 $30 $25 $23 $18 $25 $29 $26 $23 $17 $28 Healthcare facilities Other healthcare providers Legal professionals Tail & other, professional liability Products liability 2015 2014 $270 $290 $25 $17 $295 $307 YTD 2015 YTD 2014 Physician 12-mo Physician 24-mo $ in millions 9/30/15 Total Gross Written Premiums decreased $13.1M (3.0%) from $429.7M to $416.7M Physician new business of $15.9M, somewhat offset by retention of 88% Facilities increase is due to new business of $4.5M, partially offset by retention of 84% Lawyers decrease is due to lower retention (79 %) than in 2014 and the combined effects of tighter terms and conditions and stricter underwriting as PRA Casualty & Indemnity LPL books were converted to Medmarc paper Medical & life sciences products liability decrease is primarily results from retention losses due to M&A activity in Medmarc ’s target market and a competitive market, somewhat offset by $2.9M of new business Two - year policies increase retention
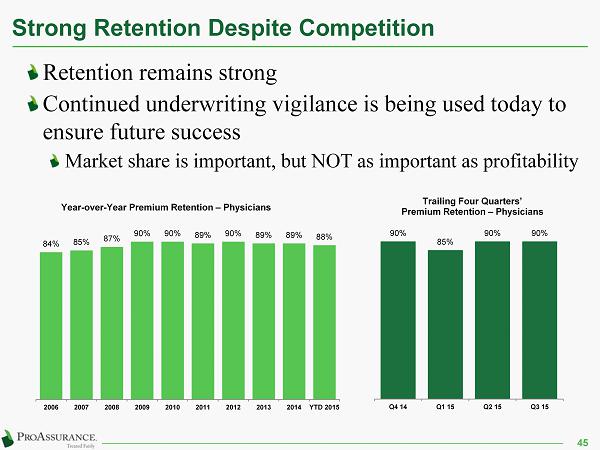
Strong Retention Despite Competition Retention remains strong Continued underwriting vigilance is being used today to ensure future success Market share is important, but NOT as important as profitability 84% 85% 87% 90% 90% 89% 90% 89% 89% 88% 2006 2007 2008 2009 2010 2011 2012 2013 2014 YTD 2015 Year - over - Year Premium Retention – Physicians 90% 85% 90% 90% Q4 14 Q1 15 Q2 15 Q3 15 Trailing Four Quarters’ Premium Retention – Physicians 45

No Overall Change in HCPL Loss Trends Current accident year loss ratio adjustments have been minor — in either direction Minimal changes on renewed business 2001 2002 2003 2004 2005 2006 2007 2008 2009 2010 2011 2012 2013 2014 9/30/2015 Annual 23% 28% 28% 19% 11% 3% -2% -6% -4% -2% -2% 0% -1% 0% 1% Cumulative 23% 57% 101% 139% 165% 173% 168% 152% 142% 137% 132% 132% 130% 131% 132% -10% 30% 70% 110% 150% MD/DO Charged Rate History PICA excluded to facilitate accurate comparisons over time 46

Differentiate Through Claims Defense 47 We leverage our financial strength to give our insureds the opportunity for an uncompromising defense of each claim Differentiates our product Provides long - term financial and marketing advantages Retains business and deters future lawsuits Increasingly important as claims data becomes public Malpractice outcomes now public in 26 states Dropped or Dismissed 66% Dropped or Dismissed 66% Defense Verdict 12% Defense Verdict 7% Plaintiff Verdict 4% Plaintiff Verdict 1% Settled or ADR 18% Settled or ADR 26% ProAssurance 78% Favorable Outcomes Industry 73% Favorable Outcomes NO PAID LOSSES PRA: 78% Industry: 73% Source: ProAssurance: as reported to PIAA Industry: PIAA 2013 Claim Trend Analysis, ProAssurance Excluded Claims Outcomes Ten Year Average 2004 - 2013

The Ohio Example: 2006 – 2013 Data Comprehensive, reliable data provided by the Ohio Department of Insurance Broad range of competitors and business approaches www.insurance.ohio.gov/Legal/Reports/Documents/Ohio2013MedicalProfessionalLiabilityClosedClaimReport.pdf 92% 75% 8% 25% ProAssurance All Others With Indemnity NO Indemnity More Claims Closed With No Indemnity 87% 96% 13% 4% ProAssurance All Others Closed With Trial Closed by Settlement, ADR or Without Trial More Claims Defended in Court $33,480 $71,624 ProAssurance All Others EXTRAORDINARY OUTCOMES: 2x Lower Average Indemnity Payment per Closed Claim 48
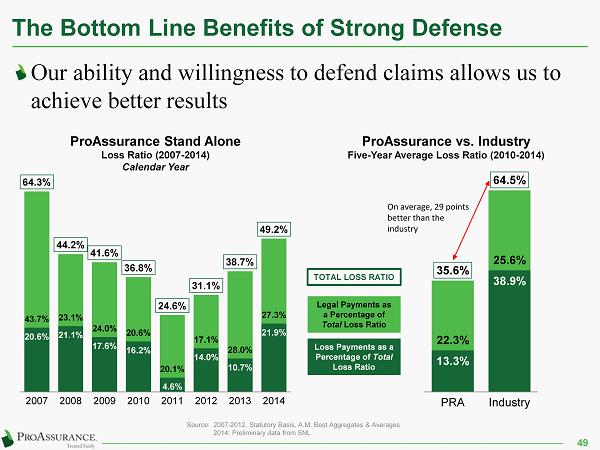
On average, 29 points better than the industry The Bottom Line Benefits of Strong Defense Our ability and willingness to defend claims allows us to achieve better results 20.6% 21.1% 17.6% 16.2% 4.6% 14.0% 10.7% 21.9% 43.7% 23.1% 24.0% 20.6% 20.1% 17.1% 28.0% 27.3% 64.3% 44.2% 41.6% 36.8% 24.6% 31.1% 38.7% 49.2% 2007 2008 2009 2010 2011 2012 2013 2014 13.3% 38.9% 22.3% 25.6% 35.6% 64.5% PRA Industry Source: 2007 - 2012, Statutory Basis, A.M. Best Aggregates & Averages 2014: Preliminary data from SNL ProAssurance vs. Industry Five - Year Average Loss Ratio ( 2010 - 2014) Legal Payments as a Percentage of Total Loss Ratio Loss Payments as a Percentage of Total Loss Ratio ProAssurance Stand Alone Loss Ratio ( 2007 - 2014) Calendar Year 49 TOTAL LOSS RATIO
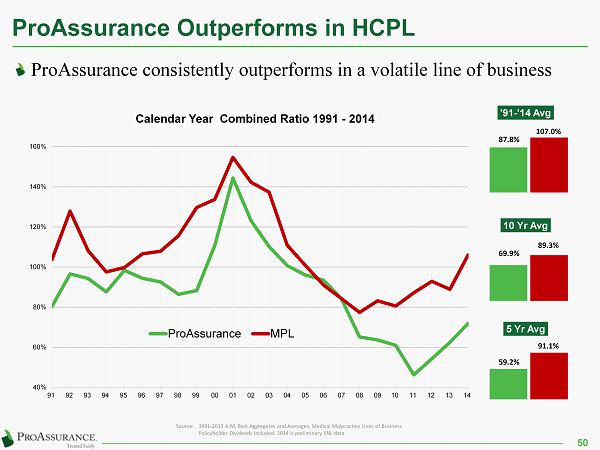
ProAssurance Outperforms in HCPL ProAssurance consistently outperforms in a volatile line of business 40% 60% 80% 100% 120% 140% 160% 91 92 93 94 95 96 97 98 99 00 01 02 03 04 05 06 07 08 09 10 11 12 13 14 Calendar Year Combined Ratio 1991 - 2014 ProAssurance MPL Source: 1991 - 2013 A.M. Best Aggregates and Averages, Medical Malpractice Lines of Business Policyholder Dividends Included. 2014 is preliminary SNL data '91 - '14 Avg 5 Yr Avg 87.8% 107.0% 10 Yr Avg 69.9% 89.3% 59.2% 91.1% 50

Segment Highlights We repo rt results in three operational segments Specialty Property Casualty Insurance Workers’ Compensation In surance Lloyd’s Syndicate 1729
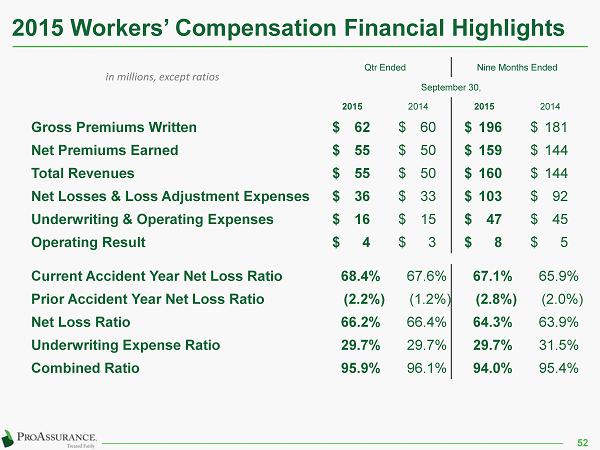
Qtr Ended Nine Months Ended September 30, 2015 2014 2015 2014 Gross Premiums Written $ 62 $ 60 $ 196 $ 181 Net Premiums Earned $ 55 $ 50 $ 159 $ 144 Total Revenues $ 55 $ 50 $ 160 $ 144 Net Losses & Loss Adjustment Expenses $ 36 $ 33 $ 103 $ 92 Underwriting & Operating Expenses $ 16 $ 15 $ 47 $ 45 Operating Result $ 4 $ 3 $ 8 $ 5 2015 Workers’ Compensation Financial Highlights in millions, except ratios 52 Current Accident Year Net Loss Ratio 68.4% 67.6% 67.1% 65.9% Prior Accident Year Net Loss Ratio (2.2%) (1.2%) (2.8%) (2.0%) Net Loss Ratio 66.2% 66.4% 64.3% 63.9% Underwriting Expense Ratio 29.7% 29.7% 29.7% 31.5% Combined Ratio 95.9% 96.1% 94.0% 95.4%

Consistent Profitability in Workers' Comp 53 Historical Combined Ratio (1) excluding fair value adjustments, intangible asset amortization, transaction - related and other one - time charges (1) 79.1% 65.6% 80.2% 87.7% 96.0% 89.7% 91.8% 93.0% 96.0% 94.0% 92.7% 92.4% 2006 2007 2008 2009 2010 2011 2012 2013 2014 Q3 2015 2006 – 2013 is Traditional Workers’ Compensation only (1)

How Eastern Differentiates 54 Disciplined individual account underwriting with focus on rate adequacy in rural territories Dedicated to effective claims management and returning injured workers to wellness Understands market dynamics and regulatory concerns Use of local knowledge that has always differentiated ProAssurance

Eastern Business Profile 55 Offices Licensed and actively seeking business Licensed, accepting “border” business Eastern Re (Cayman) Licensed in 30 states Avoiding high - hazard states within the Eastern footprint

Workers' Compensation Risk Diversification Wide diversification by class code and market segment 7,057 active policies in Traditional Programs Over 600 class c odes a ctively written 56 Physicians/Dentists 10.2% Nursing Homes Skilled 2.7% Hospital 7.3% Clerical / Office 16.0% Colleges/Schools 10.2% Auto Dealers 4.8% Auto Service Centers 1.7% Salesmen - Outside 3.7% Restaurant 3.2% Banks 2.0% 20.2% Healthcare and Related Risks Top 10 Classes (Traditional) Payroll Exposure as of September 30, 2015 Exposure Base: PA, DE, MD, VA, NC, SC

Workers' Compensation Risk Diversification Wide diversification by class code and market segment 2,626 active Inova ® policies (Alternative Markets) Over 4 00 class c odes a ctively written 57 Physician / Dentists 4.7% Nursing Homes Skilled 3.4% Social Rehab Facilities 3.1% Retirement/Life Care Community 2.7% Clerical / Office 17.1% Colleges/Schools 7.2% Auto Dealers 6.3% Salesmen - Outside 6.1% Grocery Store - Retail 2.0% Restaurant 2.6% 13.9% Healthcare and Related Risks Top 10 Classes (Alternative) Payroll Exposure as of September 30, 2015 Exposure Base: PA, DE, MD, VA, NC, SC

Broad Product Spectrum Guaranteed Cost 57.2% INOVA (Alternative Markets) 28.4% Policyholder Dividend 7.9% Deductible Plans 4.0% Retrospective Rating 2.5% Guaranteed Cost Policies Loss - Sensitive Dividend Plans Deductible Plans Retrospective Rating Plans Alternative Market Programs ParallelPay – “ Pay as you Go” TPA Services Claims Administration and Risk Management 9/30/15 Active Policies at 9/30/15 Traditional WC Programs 7,057 Alternative Markets 2,626 9,683 58
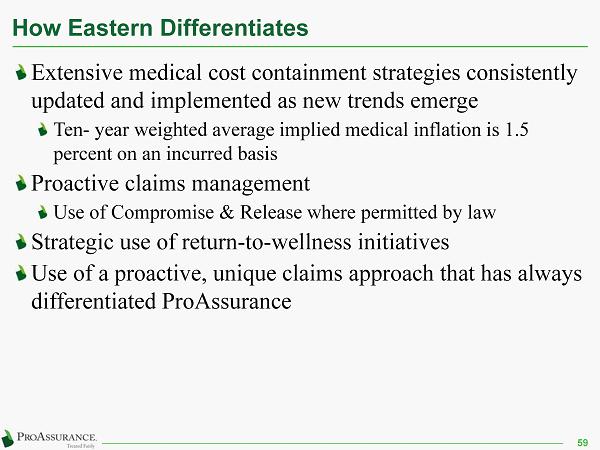
How Eastern Differentiates Extensive medical cost containment strategies consistently updated and implemented as new trends emerge Ten - year weighted average implied medical inflation is 1.5 percent on an incurred basis Proactive claims management Use of Compromise & Release where permitted by law Strategic use of return - to - wellness initiatives Use of a proactive, unique claims approach that has always differentiated ProAssurance 59
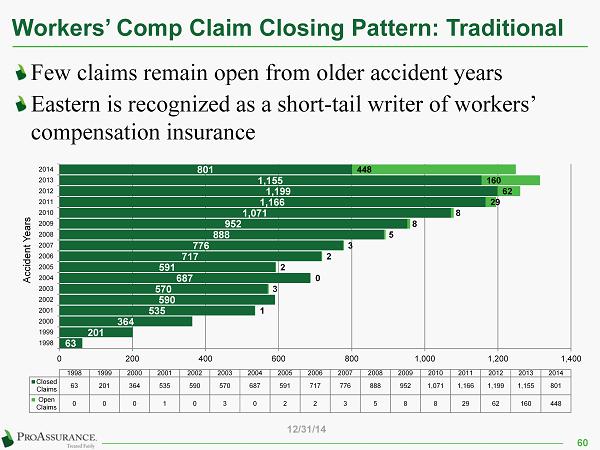
Workers’ Comp Claim Closing Pattern: Traditional 60 Few claims remain open from older accident years Eastern is recognized as a short - tail writer of workers’ compensation insurance 63 201 364 535 590 570 687 591 717 776 888 952 1,071 1,166 1,199 1,155 801 1 3 0 2 2 3 5 8 8 29 62 160 448 0 200 400 600 800 1,000 1,200 1,400 1998 1999 2000 2001 2002 2003 2004 2005 2006 2007 2008 2009 2010 2011 2012 2013 2014 Accident Years 1998 1999 2000 2001 2002 2003 2004 2005 2006 2007 2008 2009 2010 2011 2012 2013 2014 Closed Claims 63 201 364 535 590 570 687 591 717 776 888 952 1,071 1,166 1,199 1,155 801 Open Claims 0 0 0 1 0 3 0 2 2 3 5 8 8 29 62 160 448 12/31/14

Workers’ Comp Claim Closing Pattern: Alternative 61 Few claims remain open from older accident years Eastern is recognized as a short - tail writer of workers’ compensation insurance 35 66 103 175 267 407 424 310 324 334 384 404 495 484 511 411 0 2 2 1 3 7 17 67 214 0 100 200 300 400 500 600 1999 2000 2001 2002 2003 2004 2005 2006 2007 2008 2009 2010 2011 2012 2013 2014 Accident Years 1999 2000 2001 2002 2003 2004 2005 2006 2007 2008 2009 2010 2011 2012 2013 2014 Closed Claims 35 66 103 175 267 407 424 310 324 334 384 404 495 484 511 411 Open Claims 0 0 0 0 0 0 0 0 2 2 1 3 7 17 67 214 12/31/14

How Eastern Differentiates Captive insurance solutions provided through Eastern Re Segregated cell company based in Cayman Opens additional business opportunities for healthcare professional liability business Strategic partnerships with select independent agencies that share philosophies on controlling workers’ compensation costs Value - added risk management services cements brand loyalty 62
Segment Highlights We repo rt results in three operational segments Specialty Property Casualty Insurance Workers’ Compensation Insurance Lloyd’s Syndicate 1729

As reported September 30, 2015 Qtr Ended Six Months Ended June 30, 2015 2014 2015 2014 Gross Premiums Written $ 16 $ 6 $ 47 $ 27 Net Premiums Earned $ 12 $ 3 $ 27 $ 6 Total Revenues $ 12 $ 3 $ 28 $ 7 Net Losses & Loss Adjustment Expenses $ 9 $ 3 $ 18 $ 4 Underwriting & Operating Expenses $ 6 $ 3 $ 13 $ 6 Segment Operating Result $ (3) $ (2) $ (5) $ (4) YTD Lloyd’s Segment Financial Highlights in millions, except ratios 64 Net Loss Ratio 73.0% 73.6% 68.3% 68.9% Underwriting Expense Ratio 47.4% 75.0% 49.2% 93.8% Loss ratios will fluctuate as Syndicate 1729 writes additional business and the book matures Expense ratio will decline as start - up expenses transition to operating expenses

Casualty $24.5 52% Property Insurance $11.9 25% Property Reinsurance $1.9 4% Catastrophe Reinsurance $8.6 19% Lloyd’s Syndicate 1729: Business Detail Broad spread of risk Casualty includes $14.9 million ceded by PRA/PICA (Podiatry) Property is primarily US 65 For the 9 months reported September 30, 2015 $ in millions Syndicate 1729 Gross Written Premium is $81.5 million ProAssurance 57.5 % Share is $46.9 million Broken out by category:

Segment Highlights Corporate U.S. investing activities Non - premium revenues Corporate expenses U. S. taxes
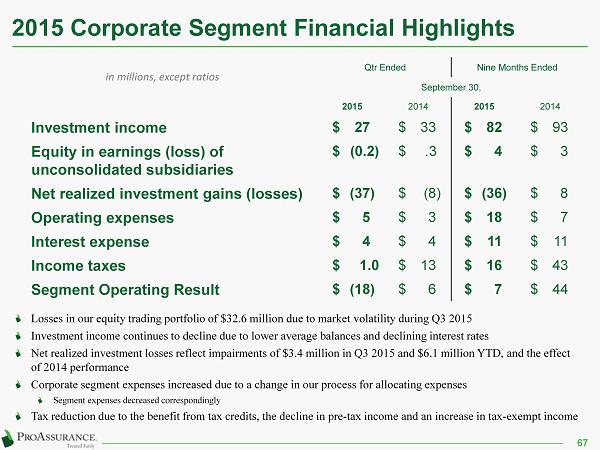
Qtr Ended Nine Months Ended September 30, 2015 2014 2015 2014 Investment income $ 27 $ 33 $ 82 $ 93 Equity in earnings (loss) of unconsolidated subsidiaries $ (0.2) $ .3 $ 4 $ 3 Net realized investment gains (losses) $ (37) $ (8) $ (36) $ 8 Operating expenses $ 5 $ 3 $ 18 $ 7 Interest expense $ 4 $ 4 $ 11 $ 11 Income taxes $ 1.0 $ 13 $ 16 $ 43 Segment Operating Result $ (18) $ 6 $ 7 $ 44 2015 Corporate Segment Financial Highlights in millions, except ratios 67 Losses in our equity trading portfolio of $32.6 million due to market volatility during Q3 2015 Investment income continues to decline due to lower average balances and declining interest rates Net realized investment losses reflect impairments of $3.4 million in Q3 2015 and $6.1 million YTD, and the effect of 2014 performance Corporate segment expenses increased due to a change in our process for allocating expenses Segment expenses decreased correspondingly Tax reduction due to the benefit from tax credits, the decline in pre - tax income and an increase in tax - exempt income
Corporate Segment Financial Highlights Overall investment result decreased primarily due to lower average balances on fixed income investments Corporate segment expenses increased due to a change in our process for allocating expenses Segment expenses decreased correspondingly 68

Investment Portfolio Detail ProAssurance remains conservatively invested to ensure our ability to keep our long - term promise of insurance protection

2015 Investment Overview Maintained duration of approximately four years Obtained a tax effective book yield of 4.0% Maintained duration at 3.6% and credit quality at A+ 70 2016 Investment Strategy & Outlook Continuing capital management activities will reduce the size of the portfolio Maintaining optimum allocation remains paramount R equires ongoing re - allocation Ensures non - correlation of returns Duration management is also important We will not extend duration in search of incremental yield

All as of 9/30/15 ProAssurance: Q3 2015 Investment Profile Fixed Income 75% Short Term (incl cash) 4% Equities & Equity Substitutes 19% BOLI 2% $3.7 Billion Overall Portfolio State & Muni 34% Corporate 46% Asset Backed 15% Govt & Agency 5% $2.8 Billion Fixed Income Portfolio (75% of Invested Assets) Average duration: 3.6 years Unchanged since year - end 2014 Average tax - equivalent income yield: 4.0% Investment grade: 93% Weighted average: A+ Full portfolio disclosure on our website: investor.proassurance.com/CustomPage/Index?KeyGenPage=305596 71 DAILY Cash Equities Bonds 87% MONTHS (NEGOTIATED) LPs (Secondary Liquidity) 8% 30 - 90 DAYS HFs/Privates 4% 6 MONTHS BOLI 1% Sources of Liquidity

Other 13% Auto 12% Non Agency MBS 1% Agency MBS/CMBS 64% Non Agency CMBS 10% ProAssurance Portfolio Detail: Asset Backed 9/30/15 Subject to Rounding Asset Backed: $408 Million (10% of Invested Assets) Weighted Average Rating: “ AAA” 72
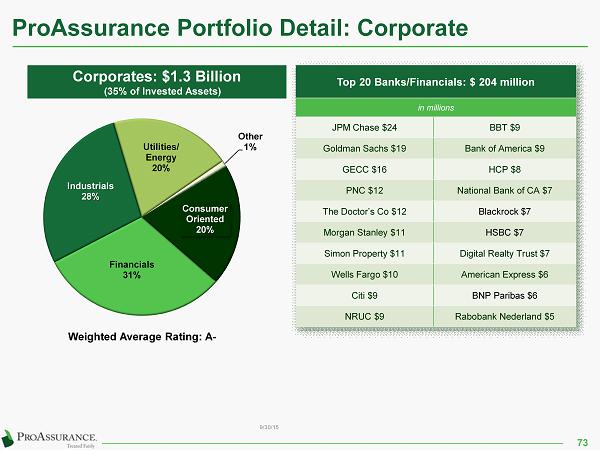
Financials 31% Industrials 28% Utilities/ Energy 20% Other 1% Consumer Oriented 20% ProAssurance Portfolio Detail: Corporate Corporates: $ 1.3 Billion (35% of Invested Assets) Weighted Average Rating: A - Top 20 Banks/Financials: $ 204 million in millions JPM Chase $24 BBT $9 Goldman Sachs $19 Bank of America $9 GECC $16 HCP $8 PNC $12 National Bank of CA $7 The Doctor’s Co $12 Blackrock $7 Morgan Stanley $11 HSBC $7 Simon Property $11 Digital Realty Trust $7 Wells Fargo $10 American Express $6 Citi $9 BNP Paribas $6 NRUC $9 Rabobank Nederland $5 9/30/15 73
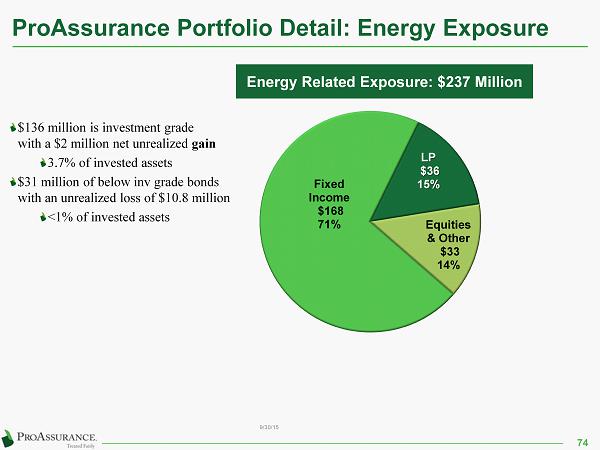
Fixed Income $168 71% LP $36 15% Equities & Other $33 14% ProAssurance Portfolio Detail: Energy Exposure Energy Related Exposure: $237 Million 9/30/15 74 $136 million is investment grade with a $2 million net unrealized gain 3.7% of invested assets $31 million of below inv grade bonds with an unrealized loss of $ 10.8 million <1% of invested assets

General Obligation 21% Special Revenue 61% Prerefunded 18% ProAssurance Portfolio Detail: Municipals Municipals: $ 1.0 Billion (26% of Invested Assets) Top 10 Municipal Holdings in millions State of Texas $15 Connecticut State Housing Authority $13 Omaha Public Power $12 Missouri State Highways $12 Triborough Bridge $12 South Carolina State Public Service $12 University of Alabama Revenue $12 North Carolina Capital Improvement $11 Port Authority of New York & New Jersey $11 Pennsylvania State $10 Weighted Average Rating: AA 3/31/15 75

Equities 35% Alternative Equity & Debt 14% Real Estate LP 4% Private Equity 14% Convertible Bonds 4% Short Inv Grade Bond Fund 1% Inflation Focused Bond Fund 9% Tax Credits 19% ProAssurance Portfolio: Equities & Other 3/31/15 Equities & Other: $708 Million (19% of Invested Assets) 5.6% TE Book Yield 13.4% TE IRR 76

Additional Financial Detail

Capital Growth: 2008‒Q3 2015 2008 2009 2010 2011 2012 2013 2014 Q2 15 Dividends (15,269) (192,466) (64,777) (220,464) (33,931) Earnings 177,725 222,026 231,598 287,096 275,470 297,523 196,565 70,972 Employee Stock Transactions 11,673 7,205 6,147 6,167 7,780 9,261 11,246 2,655 Stock Issued 112,478 Treasury Stock (87,561) (46,884) (106,347) (20,317) (32,054) (222,360) (123,301) Unrealized G/L (45,800) 98,663 19,870 50,913 15,343 (85,719) (1,457) (17,155) Total Equity 1,424 1,705 1,856 2,164 2,271 2,394 2,158 2,057 $112,478 11,673 7,205 6,147 6,167 7,780 9,261 11,246 2,655 177,725 222,026 231,598 287,096 275,470 297,523 196,565 70,972 (15,269) (192,466) (64,777) (220,464) (33,931) $(87,561) $(46,884) $(106,347) $(20,317) $(32,054) $(222,360) $(123,301) (45,800) 98,663 19,870 50,913 15,343 (85,719) (1, 457) (17,155) TREASURY STOCK in $000’s except total equity (000,000’s) 78
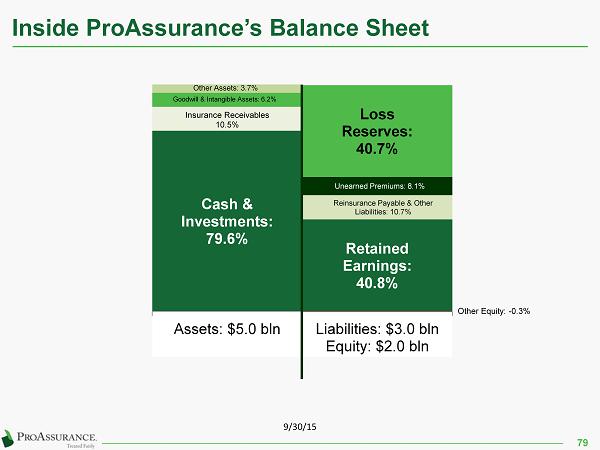
Inside ProAssurance’s Balance Sheet Cash & Investments: 79.6% Insurance Receivables 10.5% Goodwill & Intangible Assets: 6.2% Other Assets: 3.7% Retained Earnings: 40.8% Other Equity: - 0.3% Reinsurance Payable & Other Liabilities: 10.7% Unearned Premiums: 8.1% Loss Reserves: 40.7% Assets: $5.0 bln Liabilities: $3.0 bln Equity: $2.0 bln 9/30/15 79

Inside ProAssurance’s Income Statement - YTD 80 Net Premiums Earned: 90.3% Net Realized Investment Gains: - 6.1% Net Investment Income: 14.0% Other: 1.8% Net Income: 13.9% Provision for Income Taxes: 2.8% Underwriting, Policy Acquisitions, Operating and Interest Expenses: 29.1% Net Losses and Loss Adjustment Expenses: 54.2% Revenues: $586mln Expenses: $325 mln Net Income: $71 mln 9/30/15

Book Value per Share History Through Q3 2015 81 $21.35 $26.30 $30.17 $35.42 $36.85 $39.13 $38.17 37.76 $20.26 $24.04 $26.58 $31.93 $33.34 $35.64 $32.66 32.01 $20.80 $23.13 $25.29 $29.80 $30.98 $34.67 $31.63 31.33 12/31/08 12/31/09 12/31/10 12/31/11 12/31/12 12/31/13 12/31/2014 Book Value per Share Tangible Book Value per Share Tangible Book Value per Share excl. Unrealized Gains / Losses Q3 2015

Book Value per Share 82 Components 9/30/15 12/31/14 Change Total Book Value $ 37.76 $ 38.17 $ (0.41) Less: Goodwill & Intangible Assets 5.75 5.51 0.24 Tangible Book Value $ 32.01 $ 32.66 $ (0.65) Less: Unrealized Gain / Loss 0.68 1.03 (0.35) Tangible Book Value excl Unreal G/L $ 31.33 $ 31.63 $ 0.30 Estimated Effect of Treasury Shares $ (1.03) $ (0.52) $ (0.51) Outstanding Shares (000s) 53,150 56,534 (3,384) Treasury Shares (000s) 9,348 5,763 3,585

4.3% 5.5% - 2.3% - 1.1% - 1.2% Pre-Tax Underwriting Profit $66 Pre-Tax Investment Income $86 Non-Operating Gains $(36) Taxes $(17) Interest & Intangibles $(16) 5.2% 5.4% 0.5% - 2.5% - 1.2% Pre-Tax Underwriting Profit $92 Pre-Tax Investment Income $96 Non-Operating Gains $8 Taxes $(43) Interest & Intangibles $(21) YTD 2015 Return on Equity: 5.2% Components of Return on Equity 83 Long - term ROE target: 12% - 14% Five Year Average ROE: Ten year Average ROE: ($ in millions) 9/30/15 YTD 2014 Return on Equity: 7.4% Full year 2014 ROE: 8.6%

Now Reporting in Four Segments 84 • Healthcare Professional Liability • Products Liability • Lawyers’ Professional Liability Specialty P&C • Traditional • Captive Market Facility Workers’ Compensation • Syndicate 1729 (58%) (including investments & taxes) Lloyd’s • PRA Corp – parent company • Internal agency operations • Investments, except Lloyd’s • Taxes, except Lloyd’s • Debt Corporate / Other ProAssurance Consolidated

Q3 2015 Condensed Results by Segment 85 Specialty P&C Workers' Comp Lloyd's Syndicate Corporate / Other Elimination 2015 2014 Gross premiums written $ 160,516 $ 61,788 $ 16,355 $ — $ (2,754 ) $ 235,905 $ 226,686 Net premiums written 140,846 56,244 16,019 — — 213,110 200,909 Net premiums earned 115,593 54,577 11,915 — — 182,085 177,028 Net losses and LAE 63,974 36,132 8,700 — — 108,806 99,222 Underwriting, policy acquisition & operating expenses 26,251 16,231 5,644 5,137 (238 ) 53,025 54,185 Underwriting Result $ 25,368 $ 2,214 $ (2,429 ) $ (5,137 ) $ 238 $ 20,254 $ 23,621 % of total 125.3 % 10.9 % (12.0 )% (25.4 )% 1.2 % 100.0 % Net investment result — — 260 26,461 — 26,721 33,128 Net realized inv gains / (losses) — — 9 (36,641 ) — (36,632 ) (8,131 ) Other income 1,660 61 (283 ) 1,559 (238 ) 2,759 1,808 SPC dividend expense / (income) — (1,933 ) — — — (1,933 ) (483 ) Interest expense — — — 3,637 — 3,637 3,606 Income tax expense 132 990 1,122 12,525 Segment operating result $ 27,028 $ 4,208 $ (2,575 ) $ (18,385 ) $ — $ 10,276 $ 34,778 Net loss ratio 55.3 % 66.2 % 73.0 % n/a n/a 59.8 % 56.0 % Expense ratio 22.7 % 29.7 % 47.4 % n/a n/a 29.1 % 30.6 % Combined ratio 78.0 % 95.9 % 120.4 % n/a n/a 88.9 % 86.6 %

YTD 2015 Condensed Results by Segment 86 Specialty P&C Workers' Comp Lloyd's Syndicate Corporate / Other Elimination 2015 2014 Gross premiums written $ 416,656 $ 195,964 $ 46,886 $ — $ (8,163 ) $ 651,343 $ 632,011 Net premiums written 361,564 178,060 42,231 — — 581,855 568,575 Net premiums earned 343,065 159,436 26,776 — — 529,277 525,061 Net losses and LAE 197,056 102,545 18,283 — — 317,884 287,643 Underwriting, policy acquisition & operating expenses 80,057 47,421 13,187 17,670 (427 ) 157,908 158,856 Underwriting Result $ 65,952 $ 9,470 $ (4,694 ) $ (17,670 ) $ 427 $ 53,485 $ 78,562 % of total 123.3 % 17.7 % (8.8 )% (33.0 )% 0.8 % 100.0 % Net investment result — — 653 85,369 — 86,022 95,555 Net realized inv gains / (losses) — — 25 (35,645 ) — (35,620 ) 7,659 Other income 4,533 361 209 1,828 (427 ) 6,504 6,055 SPC dividend expense / (income) — 1,481 — — — 1,481 2,355 Interest expense — — — 10,978 — 10,978 10,697 Income tax expense 752 15,932 16,684 43,328 Segment operating result $ 70,485 $ 8,350 $ (4,559 ) $ 6,972 $ — $ 81,248 $ 131,451 Net loss ratio 57.4 % 64.3 % 68.3 % n/a n/a 60.1 % 54.8 % Expense ratio 23.3 % 29.7 % 49.2 % n/a n/a 29.8 % 30.3 % Combined ratio 80.7 % 94.0 % 117.5 % n/a n/a 89.9 % 85.1 %