Attached files
| file | filename |
|---|---|
| 8-K - 8-K - HERMAN MILLER INC | hmi8k_110915.htm |

Delivering Growth by Design NASDAQ: MLHR Baird 2015 Industrial Conference Brian Walker, President and Chief Executive Officer Jeff Stutz, Executive Vice President, Chief Financial Officer November 9, 2015

2 This information contains forward-looking statements within the meaning of Section 27A of the Securities Act of 1933, as amended, and Section 21E of the Securities Exchange Act, as amended, that are based on management’s beliefs, assumptions, current expectations, estimates, and projections about the office furniture industry, the economy, and the company itself. Words like “anticipates,” “believes,” “confident,” “estimates,” “expects,” “forecasts,” likely,” “plans,” “projects,” “should,” variations of such words, and similar expressions identify such forward-looking statements. These statements do not guarantee future performance and involve certain risks, uncertainties, and assumptions that are difficult to predict with regard to timing, extent, likelihood, and degree of occurrence. These risks include, without limitation, the success of our growth strategy, employment and general economic conditions, the pace of economic recovery in the U.S, and in our International markets, the increase in white-collar employment, the willingness of customers to undertake capital expenditures, the types of products purchased by customers, competitive-pricing pressures, the availability and pricing of raw materials, our reliance on a limited number of suppliers, our ability to expand globally given the risks associated with regulatory and legal compliance challenges and accompanying currency fluctuations, the ability to increase prices to absorb the additional costs of raw materials, the financial strength of our dealers and the financial strength of our customers, the mix of our products purchased by customers, our ability to locate new DWR studios, negotiate favorable lease terms for new and existing locations and the implementation of our studio portfolio transformation, our ability to attract and retain key executives and other qualified employees, our ability to continue to make product innovations, the success of newly introduced products, our ability to serve all of our markets, possible acquisitions, divestitures or alliances, the pace and level of government procurement, the outcome of pending litigation or governmental audits or investigations, political risk in the markets we serve, and other risks identified in our filings with the Securities and Exchange Commission. Therefore, actual results and outcomes may materially differ from what we express or forecast. Furthermore, Herman Miller, Inc., undertakes no obligation to update, amend or clarify forward-looking statements. Forward looking statements

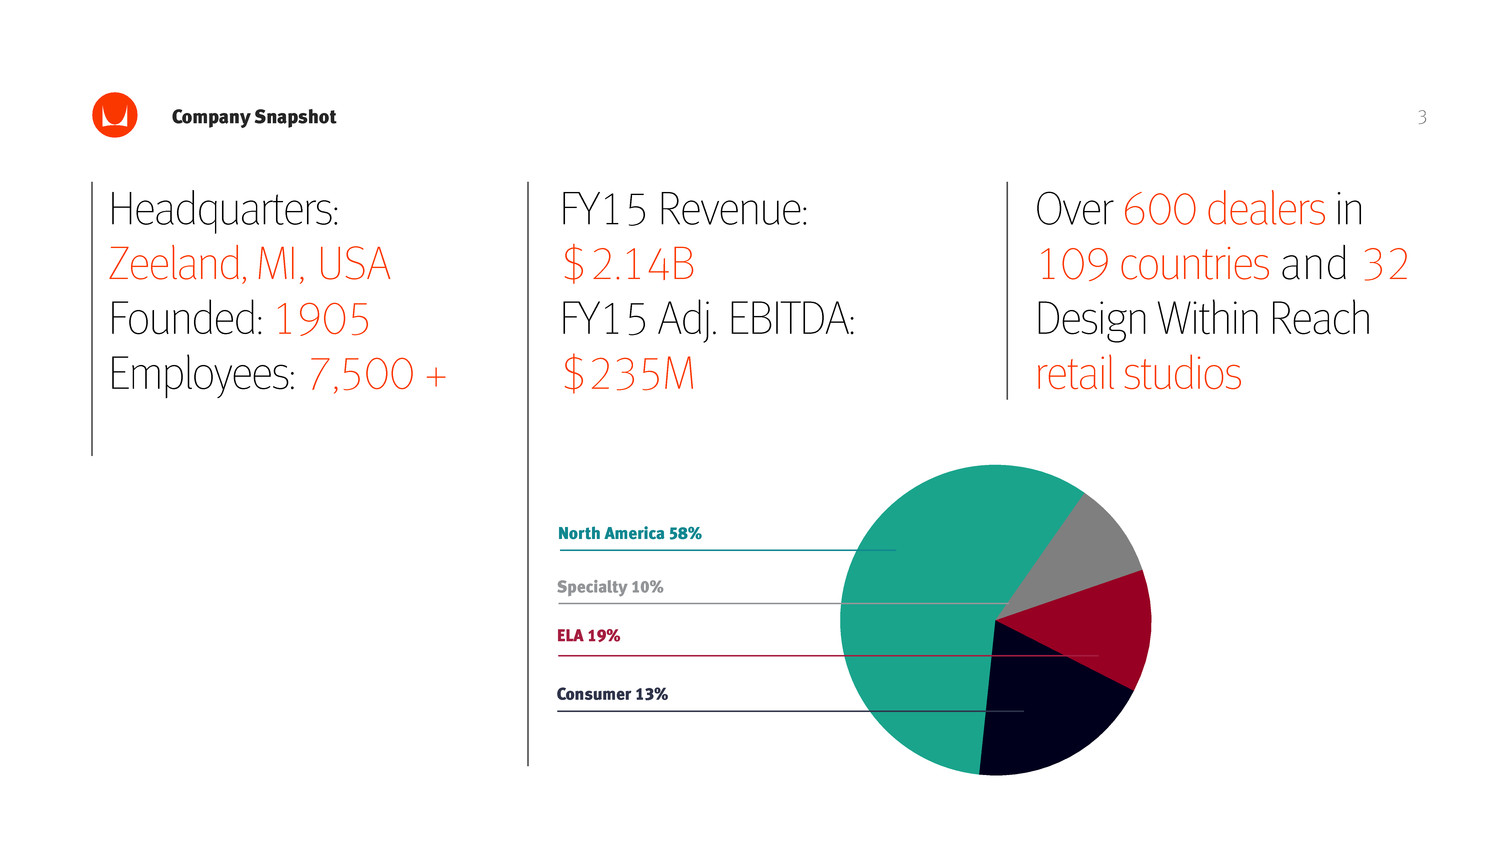
3 Headquarters: Zeeland, MI, USA Founded: 1905 Employees: 7,500 + FY15 Revenue: $2.14B FY15 Adj. EBITDA: $235M Over 600 dealers in 109 countries and 32 Design Within Reach retail studios Company Snapshot North America 58% Specialty 10% ELA 19% Consumer 13%

Work Heal Live Learn A global lifestyle brand dedicated to creating inspiring places.

5 Large addressable market Over the past five years, we have increased our market opportunity by approximately 50% to $35 billion. Value Drivers

6Value Drivers Structurally Higher Margins Over the same period, we have expanded consolidated gross margin by over 400 basis points.

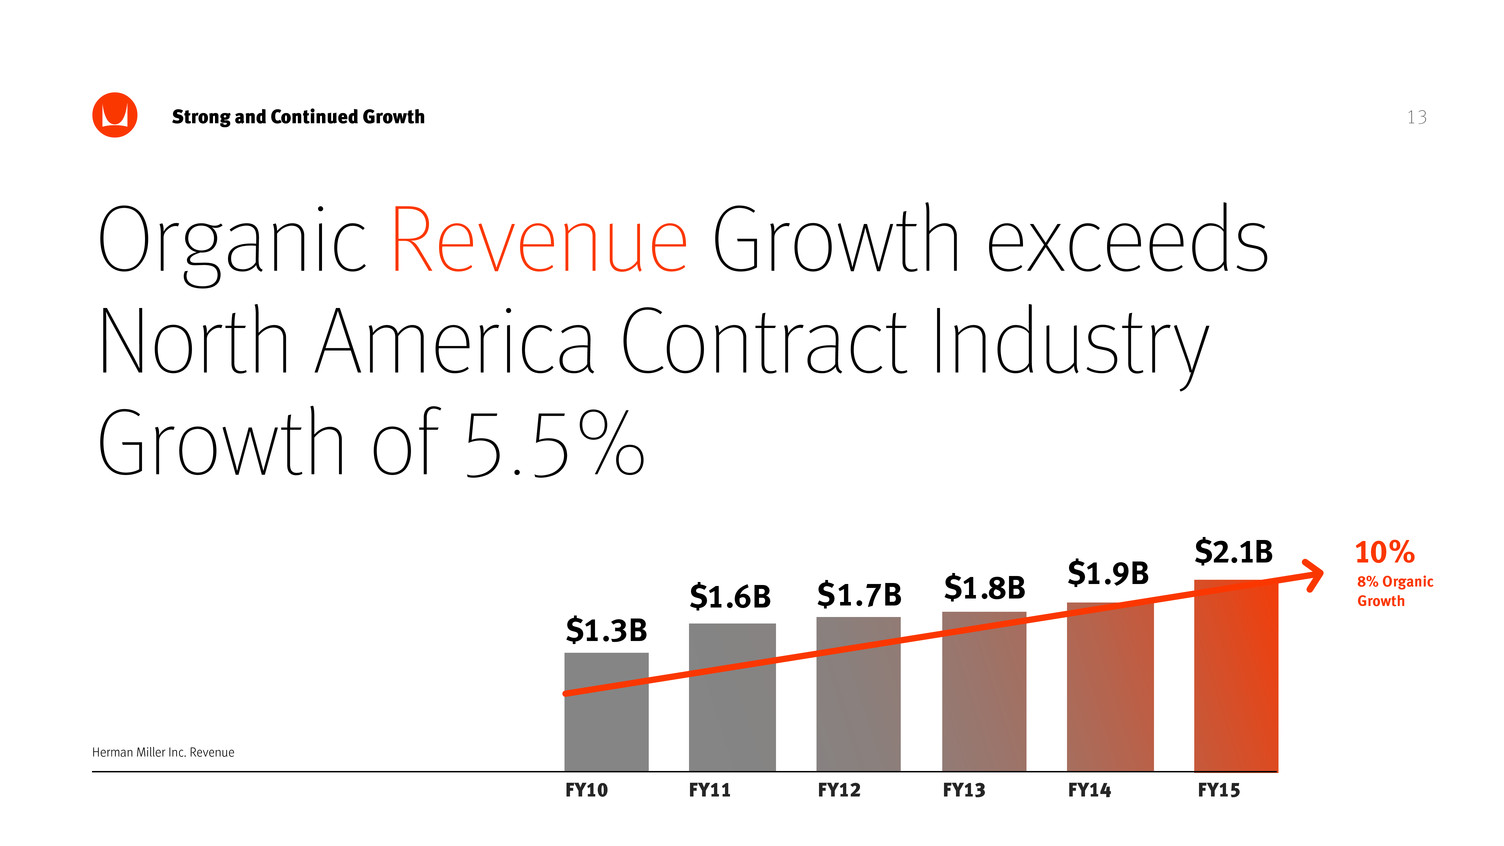
7Value Drivers Faster growth areas Since 2010, we’ve increased revenue by an average of 8% per year on an organic basis.

8Our Strategy Aims To Drive Four Fundamental Shifts Product Centric North America Office Industry Brand Solutions Global Everywhere Industry + Consumer From: To:

9Growth Enablers Channel Expansion • Over 600 contract dealers in 109 countries • 32 Design Within Reach retail studios • Direct to consumer catalog marketing program • Multiple eCommerce storefronts Global, omni-channel reach across contract and consumer

10Growth Enablers Targeted Acquisitions 2010 2012 2013 2015 Net Sales in FY15 +$470 million Audience Channel Geography Product Gross Margin in FY15 +130 bps

11Growth Enablers Product Innovation • 22% of our sales in fiscal 2015 were from products developed in the past 4 years • Introduced over 40 new products and extensions in fiscal 2015 • Investment in design, research and development at 3.3% of sales in fiscal 2015

12 Lean Enterprise • Focused improvement through: Customer first orientation Waste reduction Asset efficiency Growth Enablers Sales per Operational Sq. Foot +54% Sales per Employee Tangible Asset Turnover +23% +50% to 3x Improvement from FY10 to FY15

13Strong and Continued Growth Herman Miller Inc. Revenue Organic Revenue Growth exceeds North America Contract Industry Growth of 5.5% FY10 FY11 FY12 FY13 FY14 FY15 $1.9B $2.1B 10% 8% Organic Growth$1.8B$1.7B$1.6B $1.3B

14Strong and Continued Growth 16% Annual Growth Rate in EBITDA FY10 FY11 FY12 FY13 FY14 FY15 $206M $235M $182M$180M$165M $113M Herman Miller Inc. Adjusted EBITDA(1) (1)Represents a Non-GAAP measure; see Appendix for reconciliation

15Increasing Cash Flows and Dividends (1) Cash flow from operations less CAPEX plus domestic pension contributions; (2) Debt plus domestic pension liabilities FY10 FY11 FY12 FY13 FY14 FY15 CURRENT $5 $5 $19 $30 $33 $35 $95 $98 $112 $86 Adj. Free Cash Flow (1) ($ millions) FY10 FY11 FY12 FY13 FY14 FY15 $150 $100 $50 $0 Return on invested capital of 23% over last 5 years Debt and Pension Liabilities (2) ($ millions) $287 $266 $275 $251 $291 $400 $350 $300 $250 $200 $150 $100 $79 $104 FY10 FY11 FY12 FY13 FY14 FY15 $397 Dividends Paid ($ millions) $5 $35 $30 $25 $20 $15 $10 $5 $0

16Future Value Drivers—3 to 5 Year Horizon Core Contract Industry 2-3% New Products and Initiatives 1-1.5% Design Within Reach Studios / eCommerce Expansion 1-1.5% Estimated Annual Organic Revenue Growth 4-6% Targeted Acquisitions 1-2% Estimated Annual Revenue Growth Including Acquisitions 5-8% Operating income growth of 2x to 2.5x organic revenue growth rate Revenue Operating Income

17Investment Highlights • Leading global brands • Large addressable market • Industry leader in design and innovation • Global, omni-channel reach • Robust operating performance • Strong balance sheet and returns on capital

Questions?

Appendix

Segment Overviews

21 North America 58% Specialty 10% ELA 19% Consumer 13% Appendix – Segment Overviews Overview FY15 Percent of Consolidated Revenues Macro-Economic Drivers Five Year Revenue Trend (in US$ millions) FY15 Adj. EBITDA Margin 12.2% Description: Design, manufacture and sale of furniture products for office, education and healthcare environments in the United States and Canada Source: BIFMA North America Consumption (in US$ billions) Healthcare Construction Spending (in US$ billions) Education Construction Spending (in US$ billions) 2009 2010 2011 2012 2013 2014 9.2 9.9 11.1 11.3 11.5 12.2 5 YEAR CAGR 5.7% FY10 FY11 FY12 FY13 FY14 FY15 5 YEAR CAGR 5% (7% organic) Other Leading Economic Indicators include: Corporate profitability, service sector employment, Architectural Billings Index (ABI), Office vacancy rates, CEO and small business confidence, Non-residential Construction North America Furniture Solutions Source: U.S. Census Bureau and AIA Fcst, June 2015 Source: U.S. Census Bureau and AIA Fcst, June 2015 2002 2003 2004 2005 2006 2007 2008 2009 2010 2011 2012 2013 2014 2015 2016 History Forecast 2002 2003 2004 2005 2006 2007 2008 2009 2010 2011 2012 2013 2014 2015 2016 History Forecast 73.9 74.3 74.3 79.7 84.9 96.8 104.9 103.2 88.4 85.780.979.784.785.0 79.1 27.1 79.3 32.2 34.4 38.5 43.8 46.9 44.8 39.3 41.639.338.4 42.5 40.2 40.7 990 1,225 1,219 1,222 1,216 1,242$1300 $1100 $900 $700 $500 On-going revenue Divested dealers

22 North America 58% Specialty 10% ELA 19% Consumer 13% Appendix – Segment Overviews FY15 Percent of Consolidated Revenues Five Year Revenue Trend (in US$ millions) FY15 Adj. EBITDA Margin Source: CSIL (January 2015) Regional Office Furniture Consumption (in US$ billions) GDP Forecast 223 290 347 377 392 410 5 YEAR CAGR 13% (10% organic) 2.6% 2.2% 3.4% 3.6% 3.7% 3.8% 7.0% 7.9%8.0% 3.2% 3.5% 1.1% 2.0% 6.9% 2016 2017 UK Europe & Cent. Asia Middle East & Africa IndiaChina Mexico Brazil Region Annual 5 Year CAGR Consumption Europe $8.0 -1.5% China $10.7 12.7% India $1.8 6.7% Brazil $2.1 4.3% Mexico $0.4 -8.5% Source: World Bank 8.3% Overview Macro-Economic Drivers Description: Design, manufacture and sale of furniture products primarily for office settings in EMEA (43% of sales in FY15), Latin America (19% of sales in FY15) and Asia-Pacific (38% of sales in FY15) ELA Furniture Solutions FY10 FY11 FY12 FY13 FY14 FY15

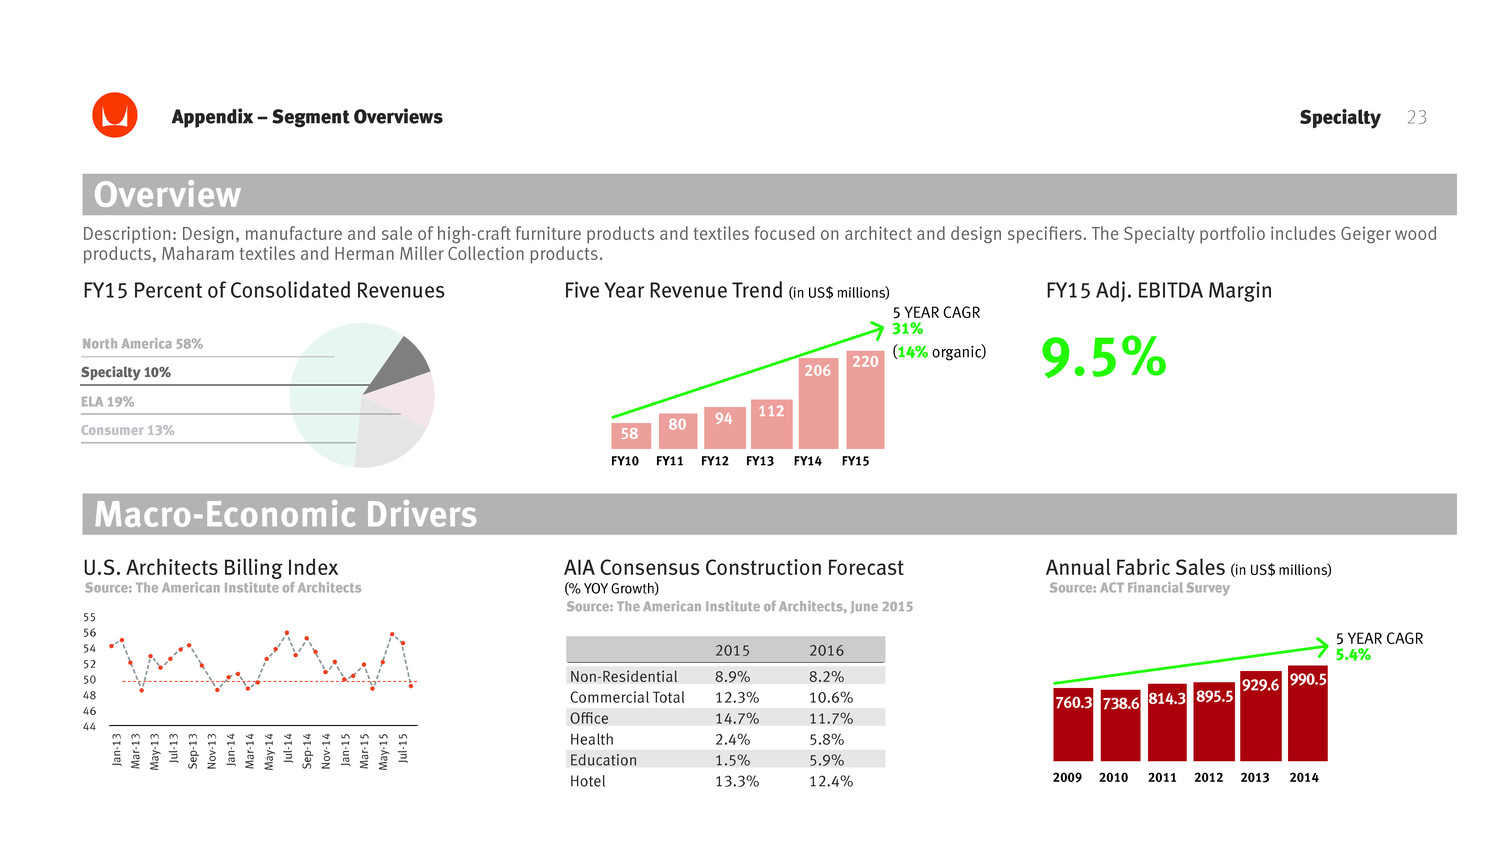
23 North America 58% Specialty 10% ELA 19% Consumer 13% FY15 Percent of Consolidated Revenues Five Year Revenue Trend (in US$ millions) FY15 Adj. EBITDA Margin 58 80 94 112 206 220 5 YEAR CAGR 31% (14% organic) 9.5% SpecialtyAppendix – Segment Overviews FY10 FY11 FY12 FY13 FY14 FY15 Overview Macro-Economic Drivers Description: Design, manufacture and sale of high-craft furniture products and textiles focused on architect and design specifiers. The Specialty portfolio includes Geiger wood products, Maharam textiles and Herman Miller Collection products. Annual Fabric Sales (in US$ millions) Source: ACT Financial Survey AIA Consensus Construction Forecast (% YOY Growth) Source: The American Institute of Architects, June 2015 2015 2016 Non-Residential 8.9% 8.2% Commercial Total 12.3% 10.6% Office 14.7% 11.7% Health 2.4% 5.8% Education 1.5% 5.9% Hotel 13.3% 12.4% U.S. Architects Billing Index 55 56 54 52 50 48 46 44 Jan-1 3 M ar -1 3 M ay -1 3 Ju l-1 3 Sep-1 3 N ov -1 3 Jan-1 4 M ar -1 4 M ay -1 4 Ju l-1 4 Sep-1 4 N ov -1 4 Jan-1 5 M ar -1 5 M ay -1 5 Ju l-1 5 Source: The American Institute of Architects 2009 2010 2011 2012 2013 2014 738.6 814.3 895.5 929.6 990.5 760.3 5 YEAR CAGR 5.4%

24 North America 58% Specialty 10% ELA 19% Consumer 13% FY15 Percent of Consolidated Revenues Five Year Revenue Trend (in US$ millions) FY15 Adj. EBITDA Margin 48 54 64 64 68 271 5 YEAR CAGR 41% (10% organic) 11% ConsumerAppendix – Segment Overviews FY10 FY11 FY12 FY13 FY14 FY15 Overview Macro-Economic Drivers Description: Sale of modern design furnishings and accessories in North America through multiple channels, including 32 Design Within Reach studios, eCommerce storefronts, direct mailing catalogs and independent retailers. Source: National Assoc. of Realtors U.S. Economic Outlook (Oct 2015) Existing Home Sales (thousands of units) Housing Starts (thousands of units) Furniture and Home Furnishing Stores Annual Sales Growth FY10 FY11 FY12 FY13 FY14 0.6% 2.6% 4.4% 3.6% 3.5% Source: US Census Bureau 2013 2014 2015 2016 4,940 5,284 5,468 Source: National Assoc. of Realtors U.S. Economic Outlook (Oct 2015) History Forecast 5,090 2013 2014 2015 2016 1,001 1,124 1,318 History Forecast 9,25

25 This presentation contains Adjusted EBITDA, Adjusted EBITDA ratios, and Organic Sales Growth, all of which constitute non-GAAP financial measures. Each of these financial measures is calculated by excluding items the Company believes are not indicative of its ongoing operating performance. The Company presents these non-GAAP financial measures because it considers them to be important supplemental indicators of financial performance and believes them to be useful in analyzing ongoing results from operations. These non-GAAP financial measures are not measures of financial performance under GAAP and should not be considered alternatives to GAAP. Non-GAAP financial measures have limitations as analytical tools and should not be considered in isolation or as a substitute for analysis of the Company’s results as reported under GAAP. In addition, you should be aware that in the future the Company may incur expenses similar to the adjustments presented. Appendix –Reconciliation of Non-GAAP Measures

26Appendix –Reconciliation of Non-GAAP Measures Organic Sales Growth (Decline) by Reportable Segment ($ Millions); (unaudited) Sales, as reported Performance Adjustments Dealer Divestitures Cumulative foreign exchange Acquisition-base year Sales, pro forma Compound Annual Growth Rate, as reported Compound Annual Growth Rate, pro forma $ 989.7 (86.5) - $ 903.2 $ 1,318.3 (86.5) - - $ 1,231.8 $ 222.7 $ 222.7 $ 57.8 $ 57.8 $ 48.1 $ 48.1 $ 0.5 $ 0.5 $ 1,241.9 - 8.0 - $ 1,249.9 4.6% 6.7% $ 2,142.2 - 27.5 (366.2) $ 1,803.5 10.2% 7.9% $ 409.9 18.6 (64.4) $ 364.1 13.0% 10.3% $ 219.9 0.4 (107.5) $ 112.8 30.6% 14.3% $ 270.5 0.4 (194.3) $ 76.6 41.3% 9.8% $ - $ - North America ELA Specialty Consumer Corporate Total 2010 2010 2010 2010 2010 20102015 2015 2015 2015 2015 2015

27Appendix –Herman Miller Inc. Reconciliation of Non-GAAP Measures Adjusted EBITDA by Reportable Segment ($ Millions) (unaudited) Segment Operating Earnings Add: Allocated Depreciation & Amortization Add: Restructuring/Impairment Expenses Adjusted EBITDA Revenue by Segment Adjusted EBITDA Margin Segment Operating Earnings Add: Allocated Depreciation & Amortization Add: Restructuring/Impairment Expenses Adjusted EBITDA Revenue by Segment Adjusted EBITDA Margin Segment Operating Earnings Add: Allocated Depreciation & Amortization Add: Acquisition-related Adjustments Add: Legacy Pension Expenses Add: Restructuring/Impairment Expenses Less: POSH Contingent Consideration Reduction Adjusted EBITDA Revenue by Segment Adjusted EBITDA Margin Segment Operating Earnings Add: Allocated Depreciation & Amortization Add: Acquisition-related Adjustments Add: Restructuring/Impairment Expenses Less: Other, net Adjusted EBITDA Revenue by Segment Adjusted EBITDA Margin $ 75.8 33.6 - $ 109.4 $ 989.7 11.1% $ 99.5 30.1 - $ 129.6 $ 1,224.8 10.6% $ 76.6 28.0 - 26.5 - - $ 131.1 $ 1,221.9 10.7% $ 125.2 26.5 - - - $ 151.7 $ 1,241.9 12.2% $ (0.2) 5.9 - $ 5.7 $ 222.7 2.6% $ 18.7 5.9 - $ 24.6 $ 290.4 8.5% $ 24.7 6.6 - - - - $ 31.3 $ 377.3 8.3% $ 25.9 8.2 - - - $ 34.1 $ 409.9 8.3% $ (5.2) 2.3 - $ (2.9) $ 57.8 -5.0% $ (1.3) 2.3 - $ 1.0 $ 80.2 1.3% $ 1.8 2.4 - 1.7 - - $ 5.9 $ 111.7 5.3% $ 13.5 7.4 - - - $ 20.9 $ 219.9 9.5% $ 10.6 0.8 - $ 11.4 $ 48.1 23.7% $ 12.1 0.8 - $ 12.9 $ 53.8 23.9% $ 13.6 0.6 - - - - $ 14.2 $ 64.0 22.2% $ 14.7 7.3 7.8 - - $ 29.8 $ 270.5 11.0% $ (27.5) - 16.7 $ (10.8) $ 0.5 0.0% $ (5.7) - 3.0 $ (2.7) $ - 0.0% $ (1.8) - - - 1.2 - $ (0.6) $ - 0.0% $ (15.9) 0.4 2.2 12.7 (0.7) $ (1.3) $ - 0.0% $ 53.5 42.6 16.7 $ 112.8 $ 1,318.8 8.6% $ 123.3 39.1 3.0 $ 165.4 $ 1,649.2 10.0% $ 114.9 37.6 - 28.2 1.2 - $ 181.9 $ 1,774.9 10.2% $ 163.4 49.8 10.0 12.7 (0.7) $ 235.2 $ 2,142.2 11.0% $ 96.9 28.7 - $ 125.6 $ 1,218.5 10.3% $ (27.0) 26.8 - 147.0 - - $ 146.8 $ 1,216.3 12.1% 1.0% $ 32.1 5.7 - $ 37.8 $ 347.3 10.9% $ (23.1) 7.6 - - - (2.6) $ 28.1 $ 392.2 7.2% 4.6% $ 1.1 2.2 - $3.3 $ 94.1 3.5% $ (5.3) 6.8 1.4 12.2 - - $ 15.1 $ 205.8 7.3% 12.4% $ 14.1 0.7 - $ 14.8 $ 64.2 23.1% $ 9.9 1.2 - 5.2 - - $ 16.3 $ 67.7 24.1% 0.4% $ (6.6) - 5.4 $ (1.2) $ - 0.0% $ (26.4) - - - 26.5 - $ 0.1 $ - 0.0% 0.0% $ 137.6 37.3 5.4 $ 180.3 $ 1,724.1 10.5% $ (25.7) 42.4 1.4 164.4 26.5 (2.6) $ 206.4 $ 1,882.0 11.0% 2.4% NA NAELA ELASpecialty Specialty2010 Actual 2011 Actual 2012 Actual 2013 Actual 2014 Actual 2015 Actual Consumer ConsumerCorporate CorporateConsol. Consol.

