Attached files
| file | filename |
|---|---|
| 8-K - 8-K - AMERICAN SCIENCE & ENGINEERING, INC. | a15-22651_18k.htm |
| EX-99.1 - EX-99.1 - AMERICAN SCIENCE & ENGINEERING, INC. | a15-22651_1ex99d1.htm |
EXHIBIT 99.2
November 9, 2015 American Science and Engineering, Inc. Q2 Fiscal Year 2016 Earnings Call Presentation
Safe Harbor Statement 2 ©2015 American Science and Engineering, Inc. The foregoing presentation contains statements concerning AS&E’s financial performance, markets and business operations that may be considered “forward-looking” under applicable securities laws. AS&E wishes to caution readers of this material that actual results might differ materially from those projected in any forward-looking statements. Factors which might cause actual results to differ materially from those projected in the forward-looking statements contained herein include the following: significant reductions, delays or cancellations (in full or in part) in procurements of the Company’s systems by the United States and other governments; disruption in the supply of any source component incorporated into AS&E's products; litigation seeking to restrict the use of intellectual property used by the Company; limitations under certain laws on the Company’s ability to protect its own intellectual property; potential product liability claims against the Company; global political trends and events which affect public perception of the threat presented by drugs, explosives and other contraband; global economic developments and the ability of governments and private organizations to fund purchases of the Company’s products to address such threats; the potential insufficiency of Company resources, including human resources, capital, plant and equipment and management systems, to accommodate any future growth; technical problems and other delays that could impact new product development and the Company’s ability to adapt to changes in technology and customer requirements; competitive pressures; lengthy sales cycles both in US government procurement and procurement abroad; and future delays in federal funding. These and certain other factors which might cause actual results to differ materially from those projected are detailed from time to time in AS&E’s periodic reports and registration statements filed with the Securities and Exchange Commission, which important factors are incorporated herein by reference. AS&E undertakes no obligation to update forward looking statements to reflect changed assumptions, the occurrence of unanticipated events, or changes in future operating results, financial condition or business over time. Readers are further advised to review the “Risk Factors” set forth in the Company’s Annual Report on Form 10-K, which further detail and supplement the factors described in this Safe Harbor Statement. Among other disclosures, the Risk Factors disclose risks pertaining to that portion of the Company’s business that is dependent on U.S. government contracting as well as international customers. As a contractor with the U.S. government, a significant number of the Company’s government contracts may be terminated at the government’s discretion.
Sales by Product Line: Q2 FY16 vs. Q2 FY15 (000’s) 3 ©2015 American Science and Engineering, Inc. Q2 FY16 Q2 FY15 Increase/ (Decrease) Cargo Systems $ 681 $ 4,035 $ (3,354) Mobile Cargo Systems 9,210 2,772 6,438 Parcel and Personnel Systems 2,317 1,534 783 Service 11,712 12,062 (350) Other 1,217 2,663 (1,446) Total Sales $ 25,137 $ 23,066 $ 2,071 Q2 FY15 Q2 FY16 Service 46% Parcel and Personnel Systems 9% Mobile Cargo Systems 37% Cargo Systems 3% Other 5% Cargo Systems 17% Mobile Cargo Systems 12% Parcel and Personnel Systems 7% Service 52% Other 12%
Consolidated Statement of Operations: Q2 FY16 vs. Q2 FY15 (000’s) 4 ©2015 American Science and Engineering, Inc. Quarter Ended September 30, 2015 September 30, 2014 Increase/ (Decrease) Total net sales and contract revenues $ 25,137 $ 23,066 $ 2,071 Total cost of sales and contracts 12,783 13,383 (600) Gross profit 12,354 9,683 2,671 Expenses: Selling, general and administrative expenses 6,772 9,118 (2,346) Research and development costs 4,751 6,418 (1,667) Total operating expenses 11,523 15,536 (4,013) Operating income (loss) 831 (5,853) 6,684 Interest and other income (expense), net (117) (21) (96) Income (loss) before provision for (benefit from) income taxes 714 (5,874) 6,588 Provision for (benefit from) income taxes 250 (1,968) 2,218 Net income (loss) $ 464 $ (3,906) $ 4,370 Income (loss) per share – Basic $ 0.06 $ (0.49) $ (0.55) Income (loss) per share – Diluted $ 0.06 $ (0.49) $ (0.55)
Sales by Product Line: YTD FY16 vs. YTD FY15 (000’s) 5 ©2015 American Science and Engineering, Inc. Six Months Ended September 30, 2015 September 30, 2014 Increase/ (Decrease) Cargo Systems $ 9,590 $ 13,181 $ (3,591) Mobile Cargo Systems 16,318 14,335 1,983 Parcel and Personnel Systems 4,823 2,299 2,524 Service 24,015 24,348 (333) Other 1,835 4,440 (2,605) Total Sales $ 56,581 $ 58,603 $ (2,022) YTD FY15 YTD FY16 Service 42% Parcel and Personnel Systems 9% Mobile Cargo Systems 29% Cargo Systems 17% Other 3% Cargo Systems 22% Mobile Cargo Systems 24% Parcel and Personnel Systems 4% Service 42% Other 8%

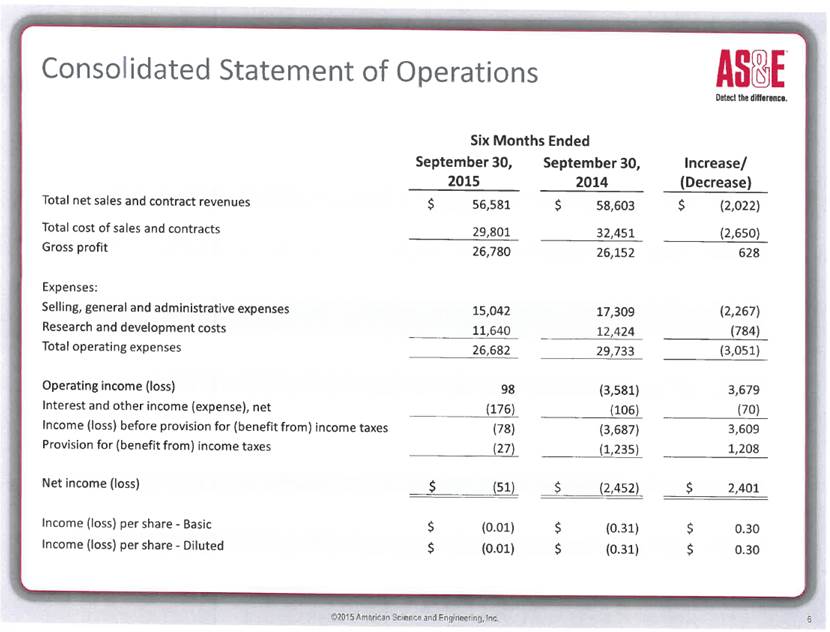
Consolidated Statement of Operations 6 ©2015 American Science and Engineering, Inc. Six Months Ended September 30, 2015 September 30, 2014 Increase/ (Decrease) Total net sales and contract revenues $ 56,581 $ 58,603 $ (2,202) Total cost of sales and contracts 29,801 32,451 (2,650) Gross profit 26,780 26,152 628 Expenses: Selling, general and administrative expenses 15,042 17,309 (2,267) Research and development costs 11,640 12,424 (784) Total operating expenses 26,682 29,733 (3,051) Operating income (loss) 98 (3,581) 3,679 Interest and other income (expense), net (176) (106) (70) Income (loss) before provision for (benefit from) income taxes (78) (3,687) 3,609 Provision for (benefit from) income taxes (27) (1,235) 1,208 Net income (loss) $ (51) $ (2,452) $ 2,401 Income (loss) per share - Basic $ (0.01) $ (0.31) $ 0.30 Income (loss) per share - Diluted $ (0.01) $ (0.31) $ 0.30
Cash and Investments Balance at September 30, 2015 (000’s) 7 ©2015 American Science and Engineering, Inc. M a r ch 3 1 , 2 01 5 S e p t e m b e r 3 0 , 20 1 5 R e s t r ic t e d C a s h a nd I n v e s t m e n ts - L o n g - T e r m $ 208 $ 231 R e s t r ic t e d C a s h a nd I n v e s t m e n t s - C u r r e n t $ 6 , 193 $ 5 , 596 S h o r t - T e r m I n v e s t m e n t s $ 24 , 533 $ 7, 6 94 C a s h a nd C a s h E qui v a l e n t s $ 6 8 , 835 $ 7 9 , 293 0 $ 2 0 , 0 0 0 $ 4 0 , 0 0 0 $ 6 0 , 0 0 0 $ 8 0 , 0 0 0 $ 1 0 0 , 0 0 0 $ 9 0 , 0 0 0 $ 7 0 , 0 0 0 $ 5 0 , 0 0 0 $ 3 0 , 0 0 0 $ 1 0 , 0 0 0
Backlog (000’s) 8 ©2015 American Science and Engineering, Inc. $- $40,000 $80,000 $120,000 $160,000 $200,000 $240,000 Q2'12 Q2'13 Q2'14 Q2 '15 Q2 '16 Backlog $211,151 $222,270 $174,965 $158,075 $149,300
Strategic Initiatives Update 9 ©2015 American Science and Engineering, Inc.
Geographic Expansion 10 ©2015 American Science and Engineering, Inc. Counterterrorism: Five ZBV® systems booked and deployed to combat terrorism in a North African country Event Security: ZBV systems are deployed to screen for explosives at a high-profile event in APAC ZBV and MINI Z® are deployed for counterterrorism applications at World’s Fair ZBV systems deployed to protect VIP and screen for explosives
Portfolio Expansion 11 ©2015 American Science and Engineering, Inc. We continue to make significant progress in Portfolio Expansion Release of the next generation Z Portal® system: Enhanced detection capability: Multi-technology with up to six views of scanned cargo Higher throughput, drive-through screening system: 250 trucks or 400 passenger vehicles per hour Compact, construction-less design: Fits into existing toll booth lanes and eliminates the need for extensive civil works Medium Energy Mobile Scanner (MEM) Awarded IDIQ by U.S. CBP Will leverage our innovative detection technology on a new mobile platform Broadens our portfolio of port and border security detection solutions Next generation Z Portal system for high throughput screening of cargo and vehicles provides up to six images of car undergoing inspection
Services Evolution Service continues to be a differentiator for us with the highest levels of customer satisfaction Multi-Year Service Contracts Multi-Vendor Service is an extension of our traditional Services offering and provides a single point of support for 3rd party platforms Rental and Leasing Program Managed Services 12 ©2015 American Science and Engineering, Inc.
Strategic Initiatives Update 13 ©2015 American Science and Engineering, Inc.
VALUES Q & A An audio replay and a copy of the presentation slides will be available on the AS&E website at ir.as-e.com. Learn more about AS&E products and technologies at www.as-e.com and follow us on Twitter @ase_detects
Are you following us on Twitter @ase_detects? If not, look what you’ve been missing