Attached files
| file | filename |
|---|---|
| 8-K - 8-K - VISA INC. | d44556d8k.htm |
| EX-3.1 - EX-3.1 - VISA INC. | d44556dex31.htm |
| EX-2.1 - EX-2.1 - VISA INC. | d44556dex21.htm |
| EX-3.3 - EX-3.3 - VISA INC. | d44556dex33.htm |
| EX-2.2 - EX-2.2 - VISA INC. | d44556dex22.htm |
| EX-3.2 - EX-3.2 - VISA INC. | d44556dex32.htm |
| EX-99.1 - EX-99.1 - VISA INC. | d44556dex991.htm |
| EX-10.1 - EX-10.1 - VISA INC. | d44556dex101.htm |
| EX-10.2 - EX-10.2 - VISA INC. | d44556dex102.htm |
Visa Inc. to Acquire Visa Europe November 2, 2015 Exhibit 99.2
Forward-Looking Statements This presentation contains forward-looking statements within the meaning of the U.S. Private Securities Litigation Reform Act of 1995. Forward-looking statements generally are identified by words such as "expect,” “outlook,” "will," "potential" and other similar expressions. Examples of forward-looking statements include, but are not limited to, statements we make about our revenue, client incentives, operating margin, tax rate, earnings per share, free cash flow, and the growth of those items. Examples of forward-looking statements include, but are not limited to, statements Visa Inc. makes about the expected date of closing of the acquisition, the potential benefits of the transaction; our post-acquisition plans; our clients’ experience; our ability to create value; the transaction’s creation of scale, efficiencies and financial strength, and revenue synergies and opportunities; growth in European payments volume; the nature of the transaction’s financing, our plans regarding the repurchase of our class A common stock; our leverage; our ability to pursue future growth opportunities; our investment credit ratings; our earnings per share, revenue, cost savings, tax rate and savings and transaction costs; and the nature of current or future litigation. By their nature, forward-looking statements: (i) speak only as of the date they are made; (ii) are not statements of historical fact or guarantees of future performance; and (iii) are subject to risks, uncertainties, assumptions or changes in circumstances that are difficult to predict or quantify. Therefore, actual results could differ materially and adversely from our forward-looking statements due to a variety of factors, including the following: the risk that the transaction may not be consummated; the risk that Visa Europe’s business will not be successfully integrated with our business; costs associated with the acquisition; matters arising in connection with the parties' efforts to comply with and satisfy applicable regulatory approvals and closing conditions relating to the transaction; the impact of laws, regulations and marketplace barriers; developments in litigation and government enforcement, including those affecting interchange reimbursement fees, antitrust and tax; new lawsuits, investigations or proceedings, or changes to our potential exposure in connection with pending lawsuits, investigations or proceedings; economic factors; industry developments, such as competitive pressure, rapid technological developments and disintermediation from our payments network; system developments; the loss of organizational effectiveness or key employees; the failure to integrate other acquisitions successfully or to effectively develop new products and businesses; natural disasters, terrorist attacks, military or political conflicts, and public health emergencies; and various other factors, including those most fully described in our filings with the U.S. Securities and Exchange Commission, including those most fully described in our filings with the U.S. Securities and Exchange Commission, including those contained in our Annual Report on Form 10-K for the fiscal year ended September 30, 2014, our and its quarterly subsequent reports filed on Forms 10-Q for the third quarter of 2015 and our other filings with the U.S. Securities and Exchange Commission. You should not place undue reliance on such statements. Except as required by law, we do not intend to update or revise any forward–looking statements as a result of new information, future developments or otherwise. This presentation does not constitute an offer to sell or the solicitation of an offer to buy any securities. The convertible preferred stock of Visa Inc. will be issued only pursuant to the terms of the transaction's definitive agreements.
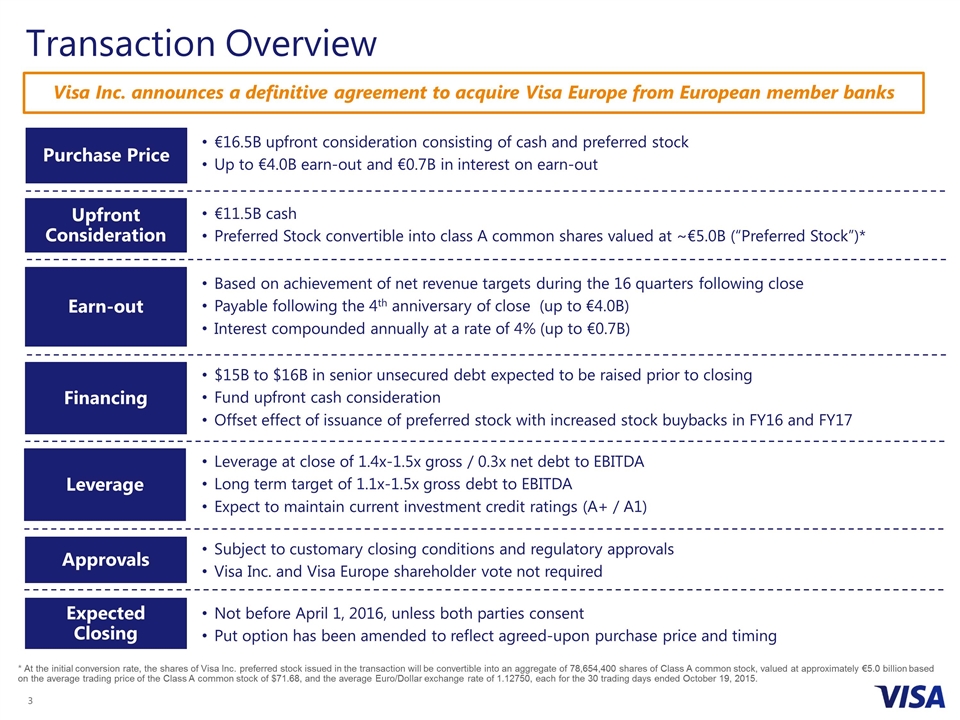
€16.5B upfront consideration consisting of cash and preferred stock Up to €4.0B earn-out and €0.7B in interest on earn-out Upfront Consideration Purchase Price €11.5B cash Preferred Stock convertible into class A common shares valued at ~€5.0B (“Preferred Stock”)* Earn-out Based on achievement of net revenue targets during the 16 quarters following close Payable following the 4th anniversary of close (up to €4.0B) Interest compounded annually at a rate of 4% (up to €0.7B) $15B to $16B in senior unsecured debt expected to be raised prior to closing Fund upfront cash consideration Offset effect of issuance of preferred stock with increased stock buybacks in FY16 and FY17 Financing Leverage Leverage at close of 1.4x-1.5x gross / 0.3x net debt to EBITDA Long term target of 1.1x-1.5x gross debt to EBITDA Expect to maintain current investment credit ratings (A+ / A1) Expected Closing Not before April 1, 2016, unless both parties consent Put option has been amended to reflect agreed-upon purchase price and timing Approvals Subject to customary closing conditions and regulatory approvals Visa Inc. and Visa Europe shareholder vote not required Visa Inc. announces a definitive agreement to acquire Visa Europe from European member banks Transaction Overview * At the initial conversion rate, the shares of Visa Inc. preferred stock issued in the transaction will be convertible into an aggregate of 78,654,400 shares of Class A common stock, valued at approximately €5.0 billion based on the average trading price of the Class A common stock of $71.68, and the average Euro/Dollar exchange rate of 1.12750, each for the 30 trading days ended October 19, 2015.
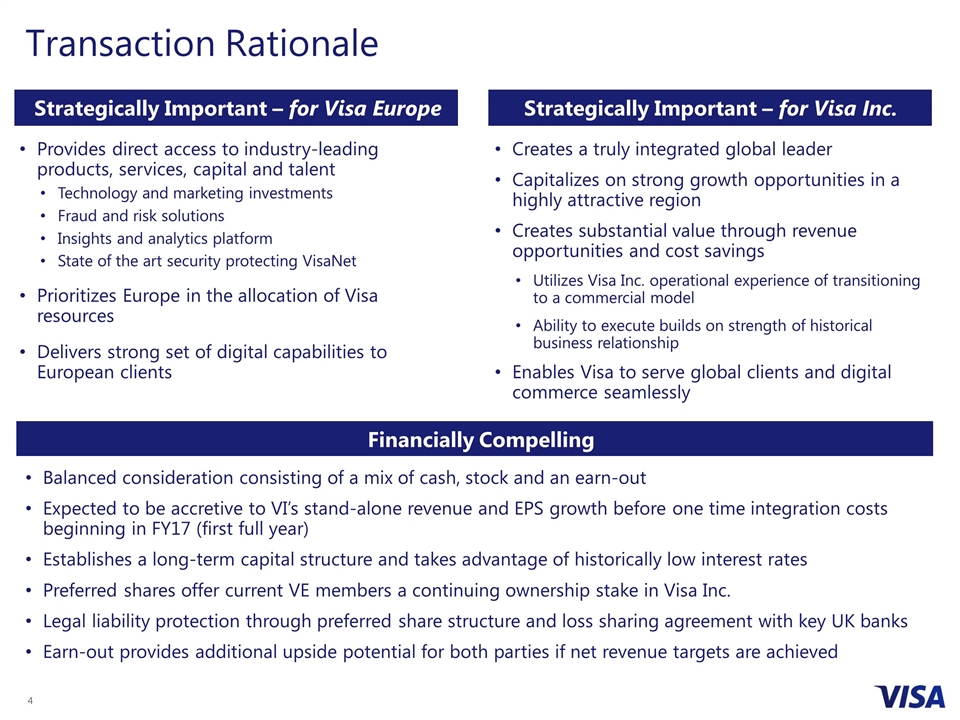
Strategically Important – for Visa Europe Transaction Rationale Strategically Important – for Visa Inc. Provides direct access to industry-leading products, services, capital and talent Technology and marketing investments Fraud and risk solutions Insights and analytics platform State of the art security protecting VisaNet Prioritizes Europe in the allocation of Visa resources Delivers strong set of digital capabilities to European clients Creates a truly integrated global leader Capitalizes on strong growth opportunities in a highly attractive region Creates substantial value through revenue opportunities and cost savings Utilizes Visa Inc. operational experience of transitioning to a commercial model Ability to execute builds on strength of historical business relationship Enables Visa to serve global clients and digital commerce seamlessly Financially Compelling Balanced consideration consisting of a mix of cash, stock and an earn-out Expected to be accretive to VI’s stand-alone revenue and EPS growth before one time integration costs beginning in FY17 (first full year) Establishes a long-term capital structure and takes advantage of historically low interest rates Preferred shares offer current VE members a continuing ownership stake in Visa Inc. Legal liability protection through preferred share structure and loss sharing agreement with key UK banks Earn-out provides additional upside potential for both parties if net revenue targets are achieved
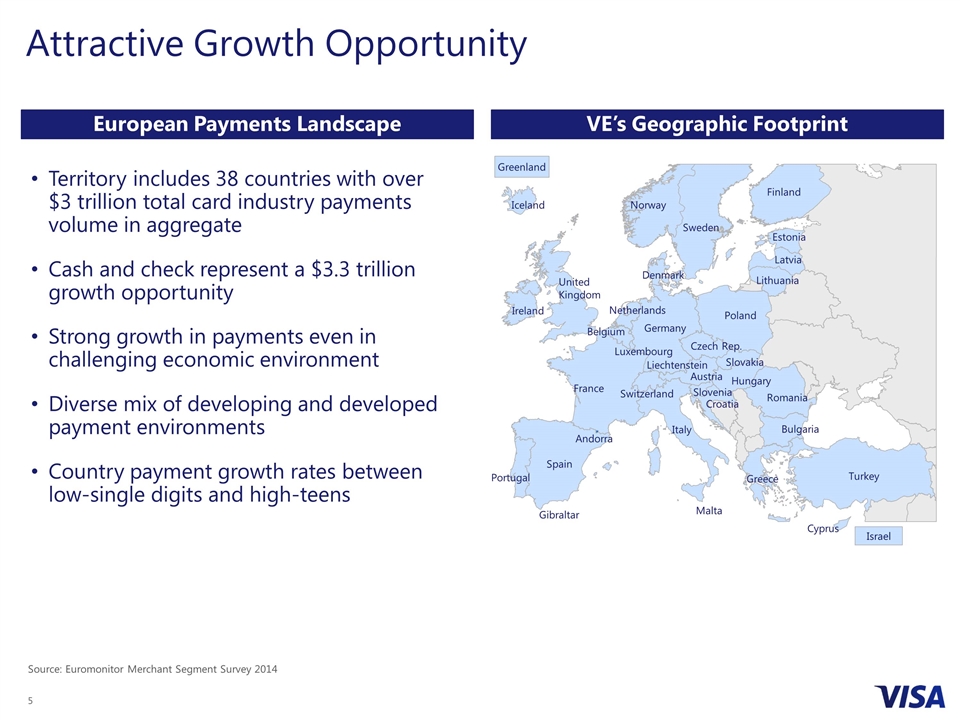
Attractive Growth Opportunity Territory includes 38 countries with over $3 trillion total card industry payments volume in aggregate Cash and check represent a $3.3 trillion growth opportunity Strong growth in payments even in challenging economic environment Diverse mix of developing and developed payment environments Country payment growth rates between low-single digits and high-teens Denmark Austria Spain France Portugal Andorra Belgium Ireland United Kingdom Netherlands Luxembourg Switzerland Italy Greece Liechtenstein Germany Latvia Estonia Finland Lithuania Sweden Norway Poland Czech Rep. Slovakia Hungary Slovenia Croatia Bulgaria Romania Turkey Malta Iceland Israel Cyprus Gibraltar VE’s Geographic Footprint European Payments Landscape Source: Euromonitor Merchant Segment Survey 2014 Greenland
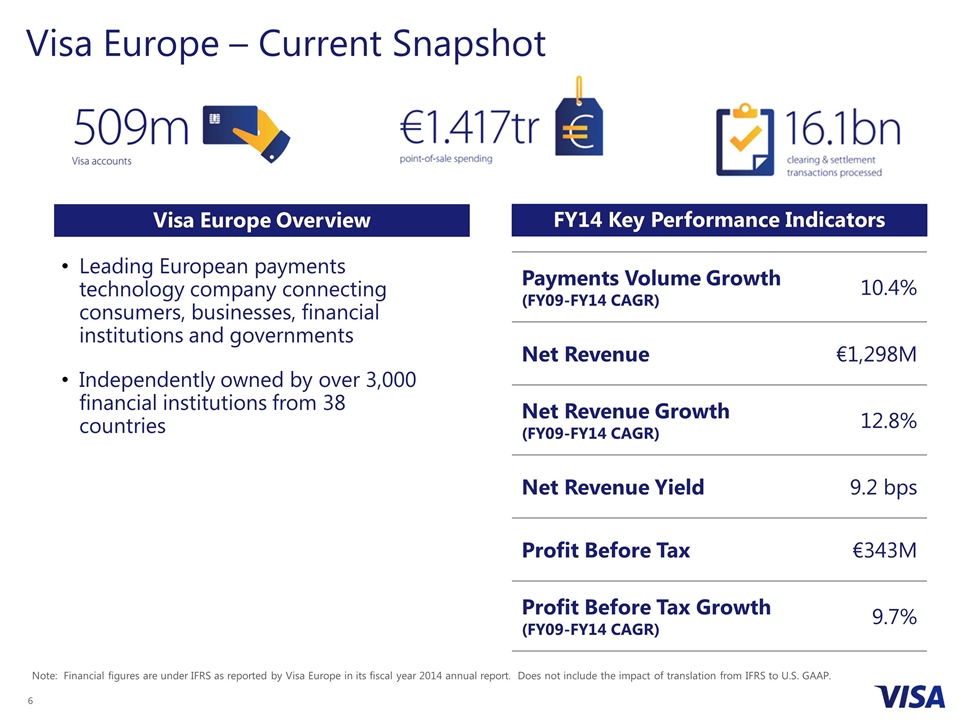
Visa Europe – Current Snapshot Leading European payments technology company connecting consumers, businesses, financial institutions and governments Independently owned by over 3,000 financial institutions from 38 countries Note: Financial figures are under IFRS as reported by Visa Europe in its fiscal year 2014 annual report. Does not include the impact of translation from IFRS to U.S. GAAP. FY14 Key Performance Indicators Payments Volume Growth (FY09-FY14 CAGR) 10.4% Net Revenue €1,298M Net Revenue Growth (FY09-FY14 CAGR) 12.8% Net Revenue Yield 9.2 bps Profit Before Tax €343M Profit Before Tax Growth (FY09-FY14 CAGR) 9.7% Visa Europe Overview
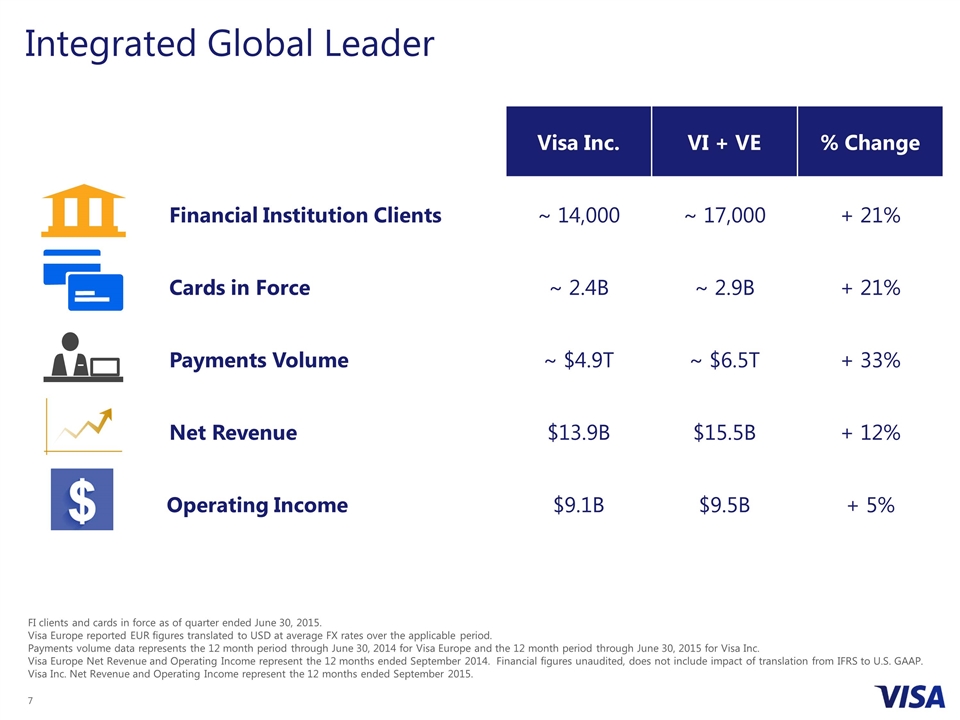
Integrated Global Leader Visa Inc. VI + VE % Change Financial Institution Clients ~ 14,000 ~ 17,000 + 21% Cards in Force ~ 2.4B ~ 2.9B + 21% Payments Volume ~ $4.9T ~ $6.5T + 33% Net Revenue $13.9B $15.5B + 12% Operating Income $9.1B $9.5B + 5% FI clients and cards in force as of quarter ended June 30, 2015. Visa Europe reported EUR figures translated to USD at average FX rates over the applicable period. Payments volume data represents the 12 month period through June 30, 2014 for Visa Europe and the 12 month period through June 30, 2015 for Visa Inc. Visa Europe Net Revenue and Operating Income represent the 12 months ended September 2014. Financial figures unaudited, does not include impact of translation from IFRS to U.S. GAAP. Visa Inc. Net Revenue and Operating Income represent the 12 months ended September 2015.
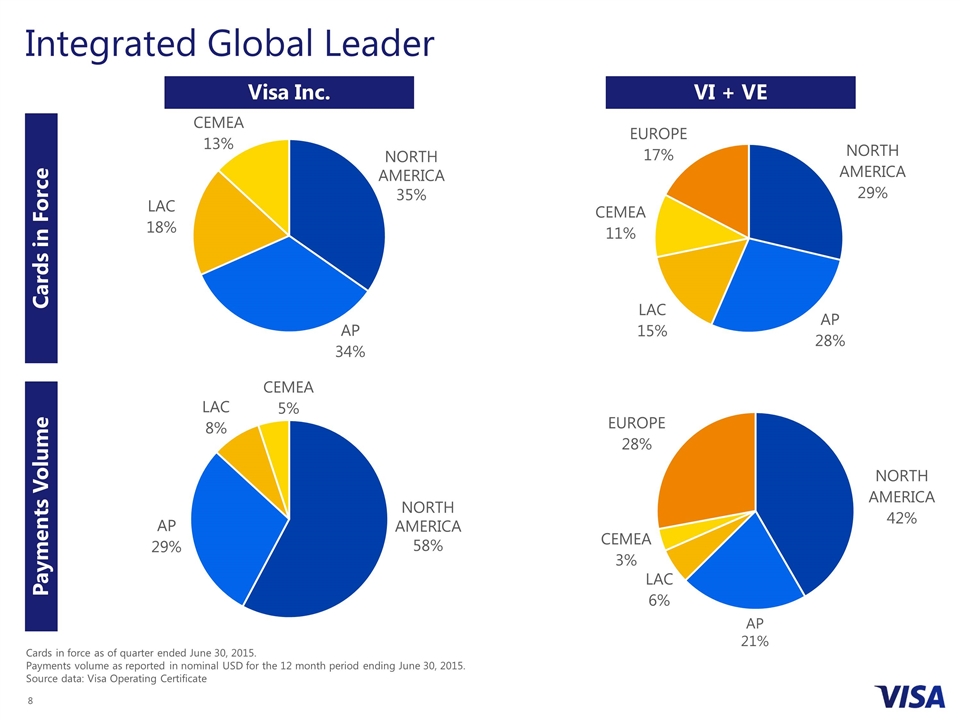
Integrated Global Leader Cards in Force Payments Volume Cards in force as of quarter ended June 30, 2015. Payments volume as reported in nominal USD for the 12 month period ending June 30, 2015. Source data: Visa Operating Certificate Visa Inc. VI + VE NORTH AMERICA58% NORTH AMERICA35% AP 21%
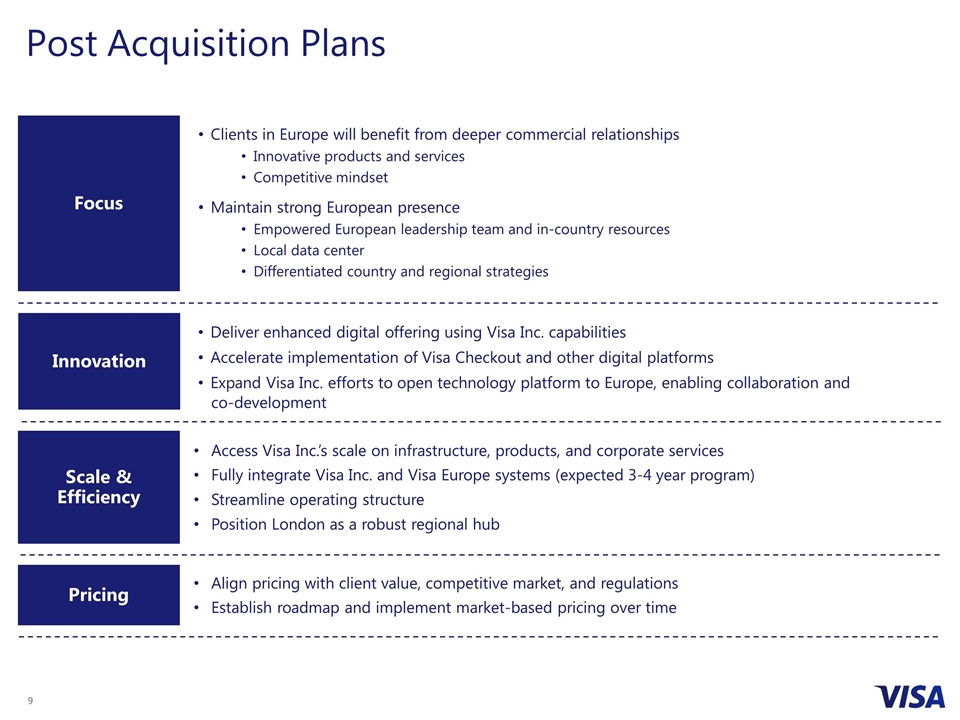
Clients in Europe will benefit from deeper commercial relationships Innovative products and services Competitive mindset Maintain strong European presence Empowered European leadership team and in-country resources Local data center Differentiated country and regional strategies Focus Scale & Efficiency Access Visa Inc.’s scale on infrastructure, products, and corporate services Fully integrate Visa Inc. and Visa Europe systems (expected 3-4 year program) Streamline operating structure Position London as a robust regional hub Align pricing with client value, competitive market, and regulations Establish roadmap and implement market-based pricing over time Pricing Post Acquisition Plans Innovation Deliver enhanced digital offering using Visa Inc. capabilities Accelerate implementation of Visa Checkout and other digital platforms Expand Visa Inc. efforts to open technology platform to Europe, enabling collaboration and co-development
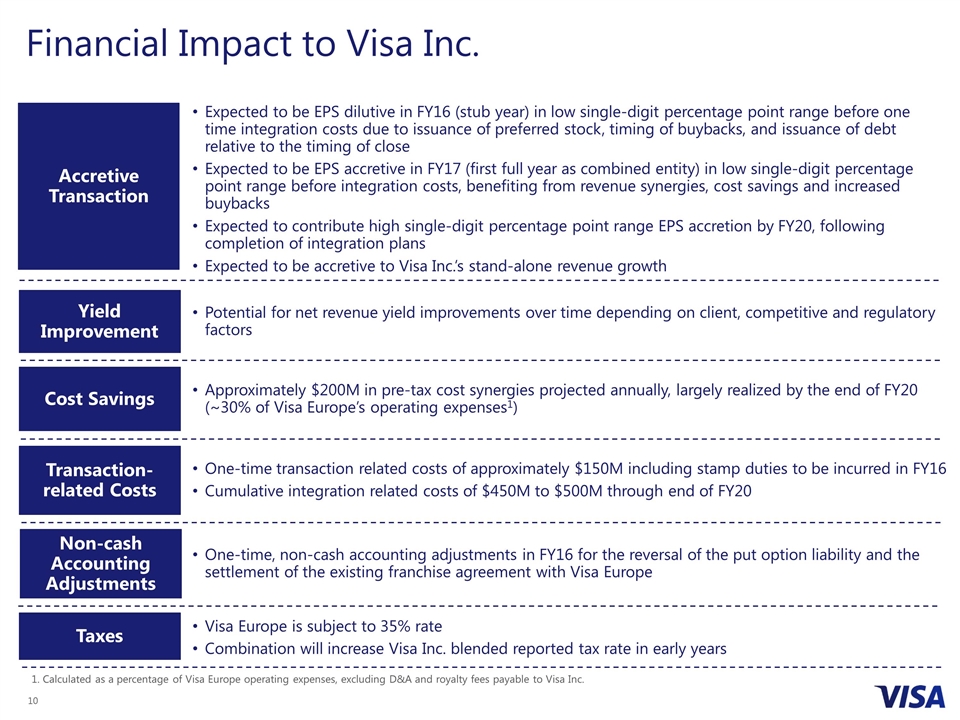
Expected to be EPS dilutive in FY16 (stub year) in low single-digit percentage point range before one time integration costs due to issuance of preferred stock, timing of buybacks, and issuance of debt relative to the timing of close Expected to be EPS accretive in FY17 (first full year as combined entity) in low single-digit percentage point range before integration costs, benefiting from revenue synergies, cost savings and increased buybacks Expected to contribute high single-digit percentage point range EPS accretion by FY20, following completion of integration plans Expected to be accretive to Visa Inc.’s stand-alone revenue growth Yield Improvement Accretive Transaction Potential for net revenue yield improvements over time depending on client, competitive and regulatory factors Cost Savings Approximately $200M in pre-tax cost synergies projected annually, largely realized by the end of FY20 (~30% of Visa Europe’s operating expenses1) One-time transaction related costs of approximately $150M including stamp duties to be incurred in FY16 Cumulative integration related costs of $450M to $500M through end of FY20 Transaction-related Costs Non-cash Accounting Adjustments One-time, non-cash accounting adjustments in FY16 for the reversal of the put option liability and the settlement of the existing franchise agreement with Visa Europe Taxes Visa Europe is subject to 35% rate Combination will increase Visa Inc. blended reported tax rate in early years Financial Impact to Visa Inc. 1. Calculated as a percentage of Visa Europe operating expenses, excluding D&A and royalty fees payable to Visa Inc.
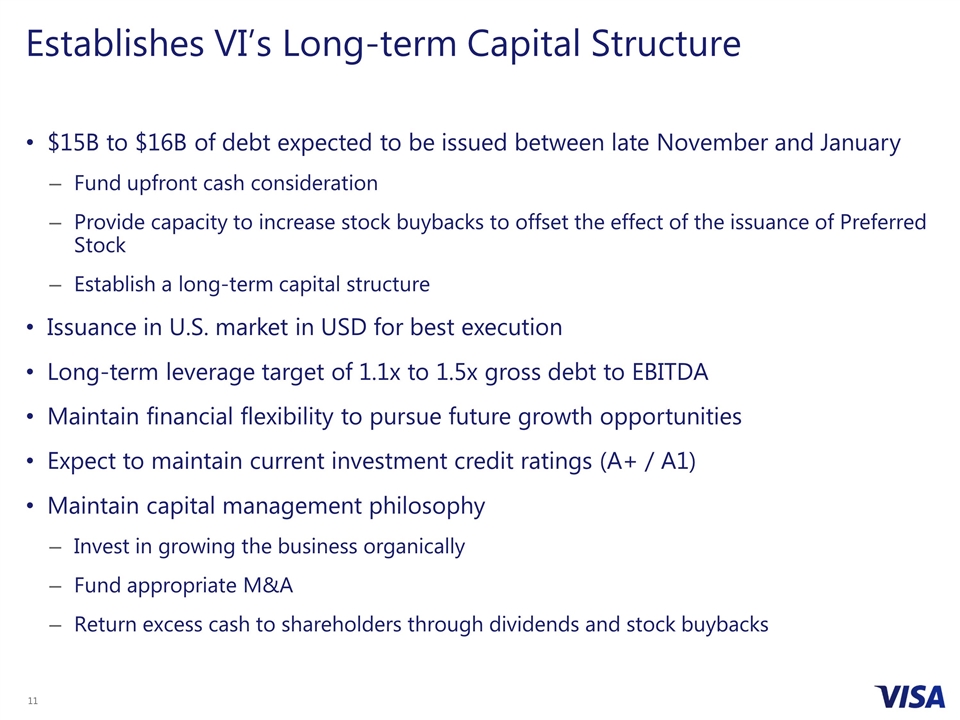
$15B to $16B of debt expected to be issued between late November and January Fund upfront cash consideration Provide capacity to increase stock buybacks to offset the effect of the issuance of Preferred Stock Establish a long-term capital structure Issuance in U.S. market in USD for best execution Long-term leverage target of 1.1x to 1.5x gross debt to EBITDA Maintain financial flexibility to pursue future growth opportunities Expect to maintain current investment credit ratings (A+ / A1) Maintain capital management philosophy Invest in growing the business organically Fund appropriate M&A Return excess cash to shareholders through dividends and stock buybacks Establishes VI’s Long-term Capital Structure
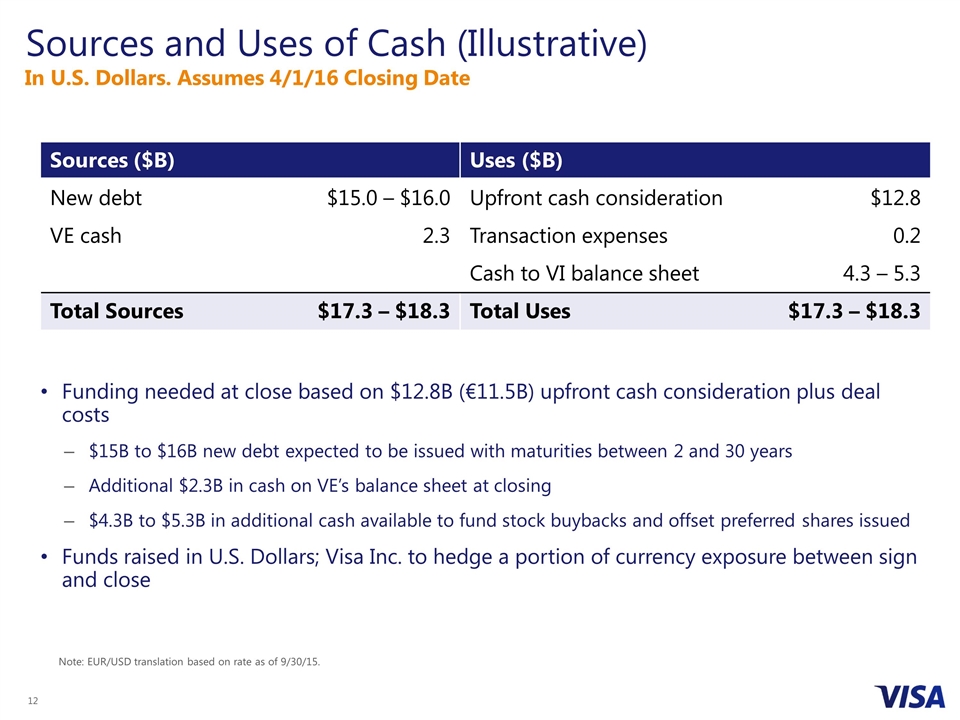
Sources and Uses of Cash (Illustrative) Funding needed at close based on $12.8B (€11.5B) upfront cash consideration plus deal costs $15B to $16B new debt expected to be issued with maturities between 2 and 30 years Additional $2.3B in cash on VE’s balance sheet at closing $4.3B to $5.3B in additional cash available to fund stock buybacks and offset preferred shares issued Funds raised in U.S. Dollars; Visa Inc. to hedge a portion of currency exposure between sign and close Note: EUR/USD translation based on rate as of 9/30/15. In U.S. Dollars. Assumes 4/1/16 Closing Date Sources ($B) Uses ($B) New debt $15.0 – $16.0 Upfront cash consideration $12.8 VE cash 2.3 Transaction expenses 0.2 Cash to VI balance sheet 4.3 – 5.3 Total Sources $17.3 – $18.3 Total Uses $17.3 – $18.3
Preferred Stock Structure Allows VE members to share in the growth of the combined business Preferred stock, along with UK Loss Sharing Agreement, creates two new layers of safeguards against liabilities from legal actions relating to interchange in the Visa Europe territory Two series of preferred stock to be issued upon closing to (i) UK & Ireland members of VE and (ii) all other members of VE Convertible into shares of class A common stock of Visa Inc. or its equivalent upon occurrence of certain events Value of preferred stock will be reduced in an amount equal to any covered losses by adjusting downward the number of class A shares into which the preferred are convertible Visa Inc. retains responsibility for 30% of liability (if any) relating to inter-regional interchange fees UK Loss Sharing Agreement: Signed by largest 11 UK members (~91% of UK-based membership) Visa Inc. indemnified for up to €2.5 billion in potential litigation losses relating to UK domestic interchange fees Coverage becomes available after certain levels of litigation losses are paid from the UK & Ireland preferred stock In addition, outside the UK, existing indemnities will remain in place
Accounting Considerations Earn-out accounted for as contingent consideration reflecting additional upside to both parties if net revenue targets are achieved Fair value of obligation recorded as a liability on balance sheet at close, based on probability-weighted estimate of payout Marked-to-market (based on likelihood of payout) as non-operating expense or income over the earn-out period Preferred Shares accounted for as equity at close, based on the value of Class A share equivalents (~€5B*) As litigation payments are made the recorded value of equity is reduced with offset to litigation expense Assuming sufficient collateral is available to pay all claims, this indemnification will fully offset any litigation expense flowing through Visa Inc.’s earnings with respect to the claims covered Visa Inc. also expects to record in FY16: One-time loss related to the settlement of the existing EU franchise right agreement between VE and VI, which under U.S. GAAP, is deemed to be below market value given the growth in VE’s business. This one-time accounting event will have no impact on VI’s results going forward One-time gain associated with the reversal of the VE put liability * At the initial conversion rate, the shares of Visa Inc. preferred stock issued in the transaction will be convertible into an aggregate of 78,654,400 shares of Class A common stock, valued at approximately €5.0 billion based on the average trading price of the Class A common stock of $71.68, and the average Euro/Dollar exchange rate of 1.12750, each for the 30 trading days ended October 19, 2015.
Summary Strategically important to both Visa Inc. and Visa Europe Creates even stronger integrated global leader Delivers Visa Inc.’s scale, resources and capabilities to European clients Capitalizes on strong growth opportunities in attractive region Financially compelling Balanced consideration consisting of a mix of cash, stock, and an earn-out Accretive to EPS growth in first full year (FY17) Establishes long-term capital structure Ability to execute Utilizes Visa Inc. operational experience Builds on strong historical relationship
Appendix
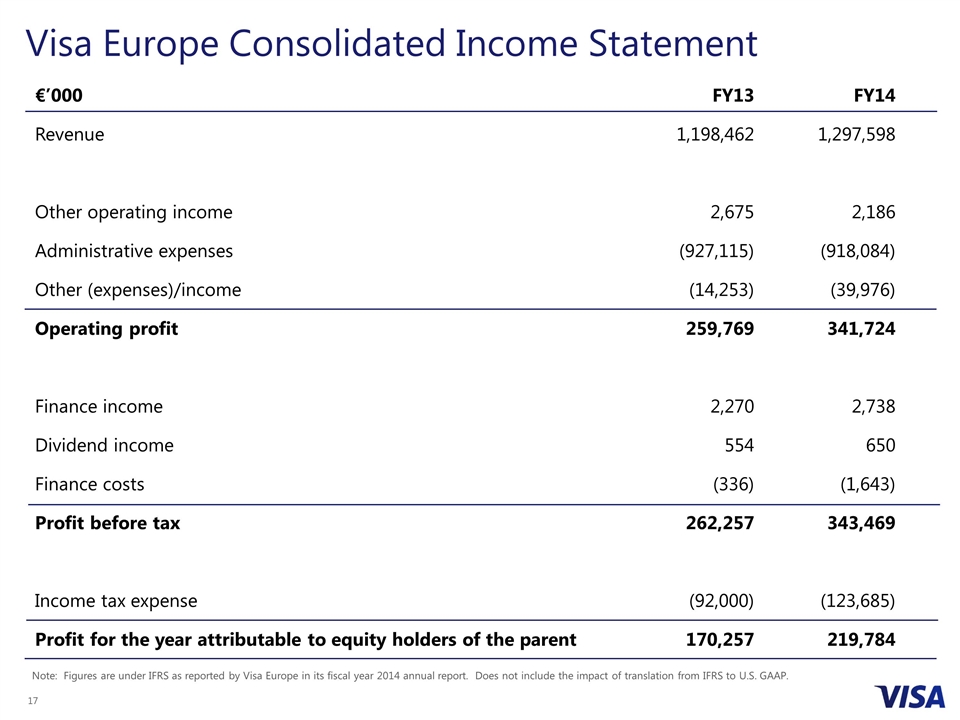
Visa Europe Consolidated Income Statement €’000 FY13 FY14 Revenue 1,198,462 1,297,598 Other operating income 2,675 2,186 Administrative expenses (927,115) (918,084) Other (expenses)/income (14,253) (39,976) Operating profit 259,769 341,724 Finance income 2,270 2,738 Dividend income 554 650 Finance costs (336) (1,643) Profit before tax 262,257 343,469 Income tax expense (92,000) (123,685) Profit for the year attributable to equity holders of the parent 170,257 219,784 Note: Figures are under IFRS as reported by Visa Europe in its fiscal year 2014 annual report. Does not include the impact of translation from IFRS to U.S. GAAP.
