Attached files
| file | filename |
|---|---|
| 8-K - FORM 8-K - PUBLIC SERVICE ENTERPRISE GROUP INC | d54354d8k.htm |
| EX-99 - EX-99 - PUBLIC SERVICE ENTERPRISE GROUP INC | d54354dex99.htm |
 Public
Service Enterprise Group PSEG Earnings Conference Call
3rd Quarter 2015 October 30, 2015 EXHIBIT 99.1 |
 1 Forward-Looking Statement • adverse changes in the demand for or the price of the capacity and energy that we sell into wholesale electricity
markets, •
adverse changes in energy industry law, policies and regulation,
including market structures and transmission planning, • any inability of our transmission and distribution businesses to obtain adequate and timely rate relief and regulatory
approvals from federal and state regulators,
•
changes in federal and state environmental regulations and
enforcement that could increase our costs or limit our operations, • changes in nuclear regulation and/or general developments in the nuclear power industry, including various impacts from
any accidents or incidents experienced at our facilities or by others in the industry, that could limit operations of our nuclear generating units,
•
actions or activities at one of our nuclear units located on a
multi-unit site that might adversely affect our ability to continue to operate that unit or other units located at the same site, • any inability to manage our energy obligations, available supply and risks,
•
any deterioration in our credit quality or the credit quality of
our counterparties, •
availability of capital and credit at commercially reasonable
terms and conditions and our ability to meet cash needs, • changes in the cost of, or interruption in the supply of, fuel and other commodities necessary to the operation of our
generating units, •
delays in receipt of necessary permits and approvals for our
construction and development activities,
•
delays or unforeseen cost escalations in our construction and
development activities, •
any inability to achieve, or continue to sustain, our expected
levels of operating performance,
•
any equipment failures, accidents, severe weather events or
other incidents that impact our ability to provide safe and reliable service to our customers, and any inability to obtain sufficient insurance coverage or recover proceeds of insurance with respect to such events,
•
acts of terrorism, cybersecurity attacks or intrusions that
could adversely impact our businesses,
•
increases in competition in energy supply markets as well as for
transmission projects, •
any inability to realize anticipated tax benefits or retain tax
credits, •
challenges associated with recruitment and/or retention of a
qualified workforce, •
adverse performance of our decommissioning and defined benefit
plan trust fund investments and changes in funding requirements, • changes in technology, such as distributed generation and micro grids, and greater reliance on these technologies, and
•
changes in customer behaviors, including increases in energy
efficiency, net-metering and demand response. adverse outcomes of any legal, regulatory or other proceeding,
settlement, investigation or claim applicable to us and/or the energy industry, Certain of the matters discussed in this report about our and our subsidiaries' future performance, including, without
limitation, future revenues, earnings, strategies, prospects, consequences and all other statements that are not purely historical constitute “forward-looking statements”
within the meaning of the Private Securities Litigation Reform Act of 1995. Such forward-looking statements are subject to risks and uncertainties, which could cause actual results to differ
materially from those anticipated. Such statements are based on management's beliefs as well as assumptions made by and information currently available to management. When used herein,
the words “anticipate,” “intend,” “estimate,” “believe,” “expect,” “plan,” “should,” “hypothetical,” “potential,”
“forecast,” “project,” variations of such words and similar expressions are intended to identify forward-looking statements. Factors that may cause actual results to differ are often presented with the forward-looking statements themselves. Other
factors that could cause actual results to differ materially from those contemplated in any forward-looking statements made by us herein are discussed in filings we make with the United
States Securities and Exchange Commission (SEC), including our Annual Report on Form 10-K and subsequent reports on Form 10-Q and Form 8-K and available on our website:
http://www.pseg.com. These factors include, but are not limited to: All of the forward-looking statements made in this report are qualified by these cautionary statements and we cannot
assure you that the results or developments anticipated by management will be realized or even if realized, will have the expected consequences to, or effects on, us or our business
prospects, financial condition or results of operations. Readers are cautioned not to place undue reliance on these forward-looking statements in making any investment decision.
Forward-looking statements made in this report apply only as of the date of this report. While we may elect to update forward-looking statements from time to time, we specifically
disclaim any obligation to do so, even if internal estimates change, unless otherwise required by applicable securities laws. The forward-looking statements contained in this report are intended to qualify for the safe harbor provisions of
Section 27A of the Securities Act of 1933, as amended, and Section 21E of the Securities Exchange Act of 1934, as amended. |
 2 GAAP Disclaimer These materials and other financial releases can be found on the pseg.com website under the investor tab,
or at http://investor.pseg.com/
PSEG presents Operating Earnings and Adjusted Earnings Before Interest, Taxes,
Depreciation and Amortization (EBITDA) in addition to its Net Income
reported in accordance with accounting principles generally accepted in
the United States (GAAP). Operating Earnings and Adjusted EBITDA are non- GAAP financial measures that differ from Net Income. Operating Earnings exclude gains or losses
associated with Nuclear Decommissioning Trust (NDT), Mark-to-Market (MTM)
accounting, and other material one-time items. PSEG presents
Operating Earnings because management believes that it is appropriate for
investors to consider results excluding these items in addition to the results reported in accordance with GAAP. PSEG believes that the non-GAAP financial measure of Operating Earnings
provides a consistent and comparable measure of performance of its businesses to help
shareholders understand performance trends.
PSEG is presenting Adjusted EBITDA because it provides investors with additional information to
compare our business performance to other companies and understand performance trends.
Adjusted EBITDA excludes the same items as our Operating Earnings measure
as well as income tax expense, interest expense, depreciation and
amortization and major maintenance expense costs at Power’s fossil
generation facilities. This information is not intended to be viewed as an alternative
to GAAP information. The last two slides in this presentation (Slides A
and B) include a list of items excluded from Net Income to reconcile to
Operating Earnings and Adjusted EBITDA with a reference to that slide included on each of the slides where the non-GAAP information appears.
|
 PSEG
2015 Q3 Review
Ralph Izzo Chairman, President and Chief Executive Officer |
 4 Q3 Earnings Summary – Successful Quarter $ millions (except EPS) 2015 2014 Operating Earnings $ 403 $ 393 Reconciling Items, Net of Tax 36 51 Net Income $ 439 $ 444 EPS from Operating Earnings* $ 0.80 $ 0.77 Quarter ended September 30
* See Slide A for Items excluded from Net Income to reconcile to Operating
Earnings. |
 5 Year to Date Earnings Summary – Strong Growth $ millions (except EPS) 2015 2014 Operating Earnings $ 1,221 $ 1,153 Reconciling Items, Net of Tax 149 (111) Net Income $ 1,370 $ 1,042 EPS from Operating Earnings* $ 2.41 $ 2.27 Nine months ended September 30
* See Slide A for Items excluded from Net Income to reconcile to Operating
Earnings. |
 6 PSEG – Q3 2015 Highlights Operating Earnings of $0.80 vs. $0.77 per share in Q3 2014 Solid results driven by PSE&G’s continuing investment in transmission, weather,
and Power’s strong hedging and plant operations
Updating full-year operating earnings guidance to $2.85 - $2.95 per share Executing on operational goals Continued control of O&M supports full-year expectations Nuclear operated at a 95% capacity factor; CCGTs operated at 73% capacity factor
PSEG’s 5-Year Capital Spending program increased 20%
Agreement reached on GSMP settlement provides for $905 million over 3 years
Power announced $1.5 billion investment in ~1,300 MWs of new CCGT
capacity Market developments
Constructive regulatory environment
PJM Capacity Performance
FERC NOPR on price formation
Reliability One award recognizes PSE&G as the most reliable electric utility
in the Mid-Atlantic Region for the 14
year in a row th |
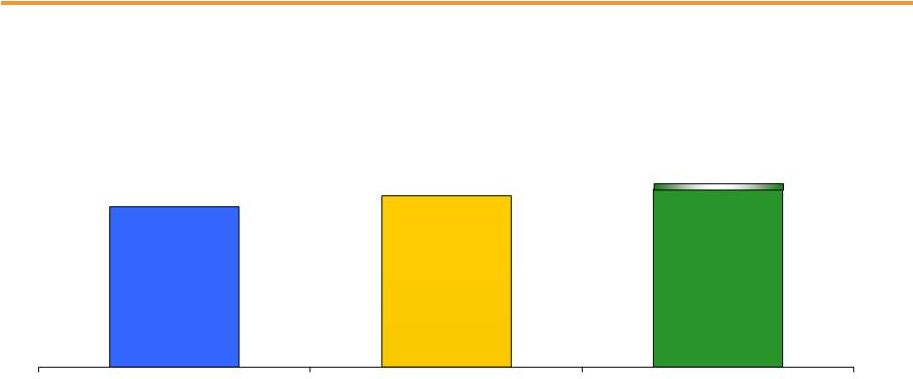 7 $2.85 - $2.95E $2.58 * See Slide A for Items excluded from Net Income to reconcile to Operating Earnings. E = Estimate.
$2.76
Full-year 2015 guidance update reflects the strength of operating results for the
first nine months of the year, and assumes normal weather and unit
operations PSEG –
Updating Full-Year 2015 Operating Earnings Guidance
2013 Operating Earnings*
2014 Operating Earnings*
2015 Operating Earnings Guidance |
 PSEG
2015 Q3 Operating Company Review
Daniel Cregg EVP and Chief Financial Officer |
 9 Q3 Operating Earnings by Subsidiary Operating Earnings Earnings per Share $ millions (except EPS) 2015 2014 2015 2014 PSE&G $ 222 $ 200 $ 0.44 $ 0.39 PSEG Power 170 171 0.33 0.34 PSEG Enterprise/Other 11 22 0.03 0.04 Operating Earnings* $ 403 $ 393 $ 0.80 $ 0.77 Quarter ended September 30 * See Slide A for Items excluded from Net Income to reconcile to Operating Earnings. |
 10 PSEG EPS Reconciliation – Q3 2015 versus Q3 2014 Re-Contracting & Lower Cost to Serve 0.07 Capacity (0.03) O&M (0.03) Taxes & Other (0.02) Transmission 0.03 Weather 0.02 Electric Demand & Other Revenue 0.01 Pension and Other O&M (0.01) Q3 2015 Operating Earnings* Q3 2014 Operating Earnings* PSEG Power PSE&G Enterprise/ Other * See Slide A for Items excluded from Net Income to reconcile to Operating Earnings.
Absence of Tax Settlement Revenue growth supported EPS increase $0.77 0.05 $0.80 (0.01) (0.01) 0.00 0.25 0.50 0.75 1.00 |
 11 Year to Date Operating Earnings by Subsidiary Operating Earnings Earnings per Share $ millions (except EPS) 2015 2014 2015 2014 PSE&G $ 631 $ 565 $ 1.24 $ 1.11 PSEG Power 558 551 1.10 1.09 PSEG Enterprise/Other 32 37 0.07 0.07 Operating Earnings* $ 1,221 $ 1,153 $ 2.41 $ 2.27 Nine months ended September 30 •See Slide A for Items excluded from Net Income to reconcile to Operating Earnings. |
 12 PSEG EPS Reconciliation – YTD 2015 versus YTD 2014 * See Slide A for Items excluded from Net Income to reconcile to Operating Earnings.
** Prior quarter results for reconciling items may not add to year-to-date (YTD) totals due to rounding.
Revenue growth supported EPS increase
$2.27 0.13 0.01 $2.41 0.00 0.50 1.00 1.50 2.00 2.50 YTD 2015 Operating Earnings* YTD 2014 Operating Earnings* Re-Contracting, Market Pricing, and Lower Cost to Serve 0.22 Gas Send Out and Fixed Cost Recovery 0.04 Higher Volume 0.02 Capacity (0.21) O&M (0.05) D&A (0.01) PSEG Power** Transmission 0.10 Electric Volume, Weather, Demand and Other Revenue 0.05 Gas Volume and Demand 0.02 Pension and Other O&M (0.03) Taxes & Other (0.01) PSE&G ** |
 PSE&G 2015 Q3 Review |
 14 PSE&G – Q3 Earnings Summary $ millions (except EPS) Q3 2015 Q3 2014 Variance Operating Revenues $ 1,766 $ 1,655 $ 111 Operating Expenses Energy Costs 740 668 72 Operation & Maintenance 391 366 25 Depreciation & Amortization 231 238 (7) Total Operating Expenses 1,362 1,272 90 Operating Earnings / Net Income $ 222 $ 200 22 EPS from Operating Earnings $ 0.44 $ 0.39 $ 0.05 |
 15 $0.39 0.04 0.02 $0.44 (0.01) 0.00 0.10 0.20 0.30 0.40 0.50 PSE&G EPS Reconciliation – Q3 2015 versus Q3 2014 Q3 2015 Operating Earnings Q3 2014 Operating Earnings Transmission 0.03 Electric Demand & Other Revenue 0.01 Pension and Other O&M Weather Continued reliability investments are a driver of growth |
 16 5,548 5,106 3,242 4,587 3,397 2,101 5,253 4,540 1,886 0 1,000 2,000 3,000 4,000 5,000 6,000 7,000 July August September PSE&G – Monthly Summer Weather Data 2015 vs. 2014 vs. Normal PSE&G Monthly Temperature Humidity Index (THI) +37.8% Q3 2015 vs. Q3 2014 +19% Q3 2015 vs. Normal 2015 2014 Normal |
 17 PSE&G – Q3 Operating Highlights GSMP settlement reached with BPU Staff and Division of Rate Counsel to invest $905 million
over 3 years to replace and modernize PSE&G’s gas distribution system starting
in 2016 Energy Strong investments continuing: Gas mains replacement
prioritized 2016 FERC Formula Rate filing submitted for ~$146 million in
increased annual transmission revenue PSE&G lowered gas rates by $70
million on October 1; Since January 2009, the average residential gas
customer has seen annual gas bills decline by 47%, or $792
Updating PSE&G operating earnings guidance to $785 - $805 million, up from $760 - $775 million on recovery of costs related to higher levels of capital spend, and weather PSE&G earned its authorized return Capital investment of ~$2 billion through September 30, as part of $2.9 billion planned for the full year
Operations Regulatory and Market Environment Financial Growth in transmission revenues added $0.03 per share over Q3 2014 Q3 electric sales up 7% on weather that was 38% warmer than Q3 2014 and 19% warmer than normal;
Summer 2015 was PSE&G’s 5 th warmest on record Weather normalized electric sales advanced 0.8% in Q3 and 0.4% for the YTD period
O&M remains under control |
 PSEG
Power 2015 Q3 Review |
 19 PSEG Power – Q3 Earnings Summary $ millions (except EPS) Q3 2015 Q3 2014 Variance Operating Revenues $ 1,096 $ 1,138 $ (42) Operating Earnings 170 171 (1) Reconciling Items, Net of Tax** 36 51 (15) Net Income 206 222 (16) EPS from Operating Earnings* $ 0.33 $ 0.34 $ (0.01) * See Slide A for Items excluded from Net Income to reconcile to Operating Earnings.
**Includes the financial impact from positions with forward delivery
months. |
 20 $0.34 0.04 (0.03) $0.33 (0.02) 0.00 0.10 0.20 0.30 0.40 0.50 Re-Contracting and Lower Cost to Serve 0.07 Capacity (0.03) PSEG Power EPS Reconciliation – Q3 2015 versus Q3 2014 Q3 2015 Operating Earnings* Q3 2014 Operating Earnings* O&M * See Slide A for Items excluded from Income from Net Income to reconcile to Operating Earnings.
Taxes and Other |
 PSEG Power’s Adjusted EBITDA – Q3 2015, Year-to-Date and Full-Year 2015 Guidance Three Months Ended September 30, Nine Months (YTD) Ended September 30, Full-Year 2015 Guidance ($ in millions) 2015 2014 2015 2014 Low High Operating Earnings** $170 $171 $558 $551 $620 $650 Add: Fossil Major Maintenance, pre-tax 10 10 111 117 115 115 Depreciation & Amortization, pre-tax 76 71 228 217 305 305 Interest Expense, pre-tax 30 31 93 91 125 125 Income Taxes 115 103 338 337 380 400 Adjusted EBITDA $401 $386 $1,328 $1,313 $1,545E $1,595E 21 PSEG Power – Adjusted EBITDA* * See Slide B for a reconciliation of Adjusted EBITDA to Operating Earnings and Net Income. E = Estimate.
** See Slide A for Items excluded from Net Income to reconcile to
Operating Earnings; Includes the financial impact from Mark-to-Market positions with forward delivery months. |
 22 PSEG Power – Generation Measures 7,565 7,787 1,831 1,192 5,294 5,739 0 7,500 15,000 2014 2015 Quarter ended September 30 Total Nuclear Total Coal* Oil & Natural Gas * Includes figures for Pumped Storage. Includes Hudson and Mercer when run on gas.
PSEG Power – Generation (GWh) 14,690 14,718 Quarter ended September 30 PSEG Power – Capacity Factors (%) 2014 2015 Combined Cycle PJM and NY 67.5% 73.4% Coal NJ (Coal/Gas) 21.5% 3.7% PA 71.8% 65.1% CT 5.3% 1.3% Nuclear 92.0% 95.4% |
 23 PSEG Power – Generation Measures 22,152 22,748 6,096 4,995 13,058 14,745 0 15,000 30,000 45,000 2014 2015 Nine Months ended September 30 * Includes figures for Pumped Storage. Includes Hudson and Mercer when run on gas.
PSEG Power – Generation (GWh) 41,306 42,488 Nine Months ended September 30 PSEG Power – Capacity Factors (%) 2014 2015 Combined Cycle PJM and NY 54.7% 64.1% Coal* NJ (Coal/Gas) 18.6% 7.5% PA 78.1% 76.3% CT 27.1% 22.9% Nuclear 90.8% 92.2% Total Nuclear Total Coal* Oil & Natural Gas |
 24 PSEG Power – Fuel Costs Quarter ended September 30 ($ millions) 2014 2015 Coal 42 27 Oil & Gas 140 94 Total Fossil 182 121 Nuclear 53 56 Total Fuel Cost 235 177 Total Generation (GWh) 14,690 14,718 $ / MWh 16 12 PSEG Power – Fuel Costs Nine months ended September 30 ($ millions) 2014 2015 Coal 170 139 Oil & Gas 623 423 Total Fossil 793 562 Nuclear 162 162 Total Fuel Cost 955 724 Total Generation (GWh) 41,306 42,488 $ / MWh 23 17 |
 25 PSEG Power – Gross Margin Performance Capacity pricing of $168/MW-day similar to Q3 2014 on lower megawatts from HEDD retirements Marcellus production and lack of take away capacity dampened local natural gas and power prices during a warmer-than-normal summer Spark spreads improved Regional Performance Region Q3 2015 Gross Margin ($M) 2015 Performance PJM $573 Re-contracting, higher hedge prices and lower fuel costs offset the decline in capacity payments from lower MWs and lower energy prices New England $17 Lower volumes and lower prices New York $29 Higher volume offset lower prices $0 $30 $60 2013 2014 2015 PSEG Power Gross Margin ($/MWh) $42 $51 $40 Quarter ended September 30 $0 $30 $60 2013 2014 2015 Nine months ended September 30 $43 $47 $44 |
 Developing
1,300 MW of new, efficient CCGT capacity in PJM 26
• Construction of 755 MW Keys Energy Center to begin this Fall on a new, natural gas fired power plant in Maryland (SWMAAC*) at an estimated cost of $825 to $875 million • Power cleared a new 540 MW CCGT unit, Sewaren 7 located in New Jersey (EMAAC*), in the recent 2018/2019 RPM auction; the new unit is expected to cost $625 to $675 million and will replace the older Sewaren units upon completion • Both Keys and Sewaren 7 are targeted to be in-service in 2018 *SWMAAC = SOUTHWEST/EMAAC = EASTERN MID-ATLANTIC AREA COUNCIL LOCATIONAL DELIVERABILITY AREA WITHIN PJM.
SEWAREN 7 SITE
KEYS ENERGY
CENTER SITE |
 27 Hedging Update… Contracted Energy* Volume TWh 9 36 36 Base Load % Hedged 100% 100% 55-60% (Nuclear and Base Load Coal) Price $/MWh $52 $51 $49 Volume TWh 4 19 19 Intermediate Coal, Combined % Hedged 35-40% 0% 0% Cycle, Peaking Price $/MWh $52 - - Volume TWh 12** 55-57 55-57 Total % Hedged 80-85% 65-70% 35-40% Price $/MWh $52 $51 $49 Oct-Dec 2015 2016 2017 * Hedge percentages and prices as of September 30, 2015. Revenues of full requirement load deals based on contract price, including
renewable energy credits, ancillary, and transmission
components but excluding capacity. Hedges include positions with MTM accounting treatment and options. **Volumes reflect rounding. |
 PJM
Capacity Market Pricing RPM –
Auction Results Delivery Year 2015 / 2016* 2016 / 2017*+ 2017 / 2018+ 2018 / 2019 Power’s Average Prices*($/MW-day) $168 $172 $177 $215 RTO Prices ($/MW-day) $136 $59 $120 $165/$150 (CP/Base) Power’s Cleared Capacity (MW) 8,750 8,700 8,700 8,650 PJM Capacity Revenues ($ Millions) Calendar Year 2016 2017 2018 Through 5/31/19 Capacity Revenues $542 $555 $631 $281 *PSEG POWER’S AVERAGE PRICES AND CLEARED CAPACITY (MW) REFLECT BASE AND INCREMENTAL AUCTIONS.
DELIVERY YEAR RUNS FROM JUNE 1 TO MAY 31 OF THE NEXT CALENDAR YEAR.
+ INCLUDES RESULTS OF CP TRANSITION AUCTIONS FOR ‘16/’17 AND ‘17/’18
AS OF SEPTEMBER 10, 2015. 2018/2019 RPM Auction
Highlights • Cleared new 540 MW
Sewaren 7 CCGT • EMAAC
separated • CP reflects cost to
meet new performance obligation •
CP construct favors portfolio approach ~98% of Power’s PJM fleet that
cleared the 2018/2019 RPM auction met the new CP standards 28
|
 Regulatory and Market Environment Capacity Performance auction results and FERC NOPRs continue to be supportive of price formation Supreme Court review of Demand Response (DR) and Maryland subsidized generation Power’s average hedge price for 2015 is $52/MWh vs. $48/MWh for 2014 29 PSEG Power – Q3 Operating Highlights CCGT capacity factor of 73% in Q3, YTD CCGT capacity factor of 64% Nuclear capacity factor of 95% in Q3, YTD nuclear capacity factor of 92% Salem 2 refueling underway; Peach Bottom 3 refueling and uprate began late September
Q3 output flat vs. Q3 2014, YTD output up 3% from higher nuclear and CCGT performance
Operations Power to construct a new, $625 - $675 million 540 MW CCGT at Sewaren that cleared the 2018/2019 RPM auction Updating Power’s full-year 2015 operating earnings guidance to $620 - $650 million, from $620 - $680 million; Adjusted 2015 EBITDA guidance also updated to $1.545 - $1.595 billion Power’s total debt as a percentage of capital at September 30 was 30% Financial |
 PSEG |
 PSEG
Financial Highlights Updating 2015 operating earnings guidance to $2.85
- $2.95 per share
Focused on maintaining operating efficiency and customer reliability
PSE&G’s 2015 operating earnings guidance increased to $785 - $805 million versus 2014 operating earnings of $725 million Power’s 2015 operating earnings guidance revised to $620 - $650 million, versus 2014 operating earnings of $642 million PSE&G reached a settlement with BPU Staff and Division of Rate Counsel to invest $905 million over 3 years in its Gas System Modernization Program Financial position remains strong At September 30: Consolidated PSEG debt stood at 42% of capital; Power debt was 30% of capital Long history of returning cash to the shareholder through the common dividend, with opportunity for future growth 31 |
 Robust
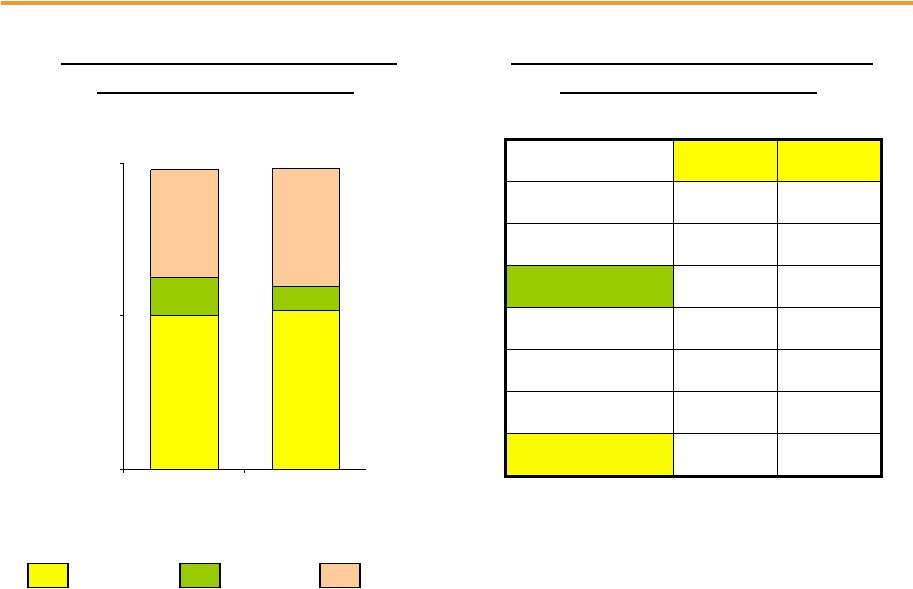
pipeline of investment opportunities 32
2010 –
2014: $12.6 Billion
PSEG’s Current 5-Year Capital Spending Program
24% Higher than Prior Period
*INCLUDES ALL PLANNED SPENDING. **ENERGY STRONG EXCLUDES RISK AND CONTINGENCY. ***POWER
CAPITAL SPENDING EXCLUDES NUCLEAR FUEL. ****INCLUDES PENNEAST
PIPELINE EQUITY INVESTMENT OF $0.1B. E=ESTIMATE. DATA AS OF OCTOBER 30, 2015. 2015E - 2019E*: $15.6 Billion Power Total*** $2.7B PSE&G Total $9.8B PSE&G Total $11.8B Power Total*** $3.6B |
 PSEG
2015 Updated Guidance for Operating Income –
by Subsidiary and PSEG Power Adjusted EBITDA
$ millions (except EPS)
2015E 2014 PSE&G $785 - $805 $725 PSEG Power $620 - $650 $642 PSEG Enterprise/Other $40 - $45 $33 Operating Earnings* $1,445 - $1,500 $1,400 Earnings per Share $2.85 - $2.95E $2.76 Anticipates Another Year of Growth in Operating Earnings $ millions (except EPS) 2015E 2014 PSEG Power $1,545 - $1,595 $1,584 * See Slide A for Items excluded from Net Income to reconcile to Operating Earnings; Includes the financial impact from
Mark-to-Market positions with forward delivery months. **
See Slide B for a reconciliation of Adjusted EBITDA to Operating Earnings and Net Income. E = Estimate. PSEG Power Adjusted EBITDA** 33 |
 PSEG
Liquidity as of September 30, 2015 34
Expiration Total Available Company Facility Date Facility Usage Liquidity ($Millions) PSE&G 5-year Credit Facility Apr-20 $600 (A ) $34 $566 PSEG Money Pool 5-Year Credit Facility (Power) Apr-19 $1,600 $201 $1,399 5-Year Credit Facility (Power) Apr-20 $1,000 (B) $14 $986 5-year Credit Facility (PSEG) Apr-19 $500 $10 $490 5-year Credit Facility (PSEG) Apr-20 $500 (C) $0 $500 Total Money Pool $3,600 $225 $3,375 Total $4,200 $259 $3,941 $227 (A) PSE&G facility will be reduced by $29 million in April 2016,and $14 million in March 2018.
PSE&G ST Investment
$0 (B) Power facility will be reduced by $48 million in April 2016, and $24 million in March 2018.
Total Liquidity Available
$4,168 (C) PSEG facility will be reduced by $23 million in April 2016, and $12 million in March 2018.
Total Money Pool Liquidity Available
$3,602 PSEG / Power PSEG Money Pool ST Investment |
 A Items Excluded from Net Income to Reconcile to Operating Earnings Please see Slide 2 for an explanation of PSEG’s use of Operating Earnings as a non-GAAP financial measure
and how it differs from Net Income.
2015 2014 2015 2014 2014 2013 Operating Earnings 403 $ 393 $ 1,221 $ 1,153 $ 1,400 $ 1,309 $ Gain (Loss) on Nuclear Decommissioning Trust (NDT) Fund Related Activity (PSEG Power) (14) 17 (11) 40 68 40 Gain (Loss) on Mark-to-Market (MTM) (a) (PSEG Power) 50 36 58 (138) 66 (74) Storm O&M, net of insurance recoveries (PSEG Power) - (2) 102 (13) (16) (32) Net Income 439 $ 444 $ 1,370 $ 1,042 $ 1,518 $ 1,243 $ Fully Diluted Average Shares Outstanding (in Millions) 508 507 508 507 508 508 Operating Earnings 0.80 $ 0.77 $ 2.41 $ 2.27 $ 2.76 $ 2.58 $ Gain (Loss) on NDT Fund Related Activity (PSEG Power) (0.02) 0.04 (0.02) 0.08 0.13 0.08 Gain (Loss) on MTM (a) (PSEG Power) 0.09 0.07 0.11 (0.27) 0.13 (0.14) Storm O&M, net of insurance recoveries (PSEG Power) - (0.01) 0.20 (0.03) (0.03) (0.07) Net Income 0.87 $ 0.87 $ 2.70 $ 2.05 $ 2.99 $ 2.45 $ (a) Includes the financial impact from positions with forward delivery months. ($ Per Share Impact - Diluted, Unaudited) ($ Millions, Unaudited) PUBLIC SERVICE ENTERPRISE GROUP INCORPORATED Reconciling Items, net of tax Three Months Ended Year Ended Consolidated Operating Earnings Reconciliation Nine Months Ended December 31, September 30, September 30, |
 B Items Excluded from Net Income to Reconcile to Operating Earnings and Adjusted EBITDA Please see Slide 2 for an explanation of PSEG’s use of Operating Earnings and Adjusted EBITDA as non-GAAP
financial measures and how they differ from Net Income.
2015 2014 2015 2014 Adjusted EBITDA 401 $ 386 $ 1,328 $ 1,313 $ 1,584 $ Fossil Major Maintenance, pre-tax (10) (10) (111) (117) (144) Depreciation and Amortization, pre-tax (b) (76) (71) (228) (217) (291) Interest Expense, pre-tax (b) (30) (31) (93) (91) (120) Income Taxes (b) (115) (103) (338) (337) (387) Operating Earnings 170 $ 171 $ 558 $ 551 $ 642 $ Gain (Loss) on NDT Fund Related Activity, pre-tax (24) 36 (14) 85 138 Gain (Loss) on MTM, pre-tax (a) 84 60 98 (233) 111 Storm O&M, net of insurance recoveries, pre-tax - (4) 172 (23) (27) Income Taxes related to Operating Earnings reconciling items (24) (41) (107) 60 (104) Net Income 206 $ 222 $ 707 $ 440 $ 760 $ (a) Includes the financial impact from positions with forward delivery months. (b) Excludes amounts related to Operating Earnings reconciling items. September 30, Three Months Ended Year Ended ($ Millions, Unaudited) Nine Months Ended September 30, Reconciling Items 2014 December 31, PSEG Power Adjusted EBITDA Reconciliation |