Attached files
| file | filename |
|---|---|
| 8-K - FORM 8-K - PUBLIC SERVICE ENTERPRISE GROUP INC | d54354d8k.htm |
| EX-99.1 - EX-99.1 - PUBLIC SERVICE ENTERPRISE GROUP INC | d54354dex991.htm |
EXHIBIT 99

|
Investor News | NYSE: PEG |
For further information, contact:
| • Kathleen A. Lally, Vice President – Investor Relations |
Phone: 973-430-6565 | |||
| • Carlotta Chan, Manager - Investor Relations |
Phone: 973-430-6596 |
PSEG ANNOUNCES 2015 THIRD QUARTER RESULTS
$0.87 PER SHARE NET INCOME
Operating Earnings of $0.80 Per Share
Company Updates Full Year Guidance to $2.85 - $2.95 Per Share
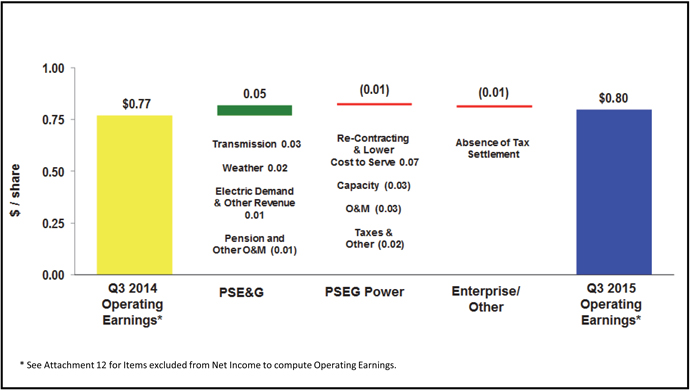
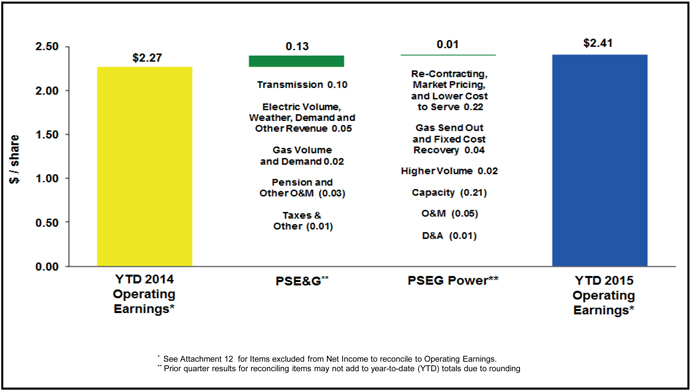
October 30, 2015 (Newark, NJ) (NYSE – PEG) Public Service Enterprise Group (PSEG) today reported third quarter 2015 Net Income of $439 million or $0.87 per share as compared to Net Income of $444 million or $0.87 per share for the third quarter of 2014. Operating earnings for the third quarter of 2015 were $403 million or $0.80 per share compared to the third quarter of 2014 operating earnings of $393 million or $0.77 per share.
Ralph Izzo, chairman, president and CEO, said “PSEG reported another good quarter. While the businesses benefited from favorable weather, our results also reflect the benefit from our strategy of increasing investment in infrastructure, a disciplined approach to cost management and the continued availability of low-cost gas supply. Based on our strong results, we are increasing the lower end of our operating earnings guidance yielding a range for the full year of $2.85 - $2.95 per share.”
PSEG believes that the non-GAAP financial measure of “Operating Earnings” provides a consistent and comparable measure of performance of its businesses to help shareholders understand performance trends. Operating Earnings exclude the impact of gains/(losses) associated with Nuclear Decommissioning Trust (NDT), certain Mark-to-Market (MTM) accounting and other material one-time items. The table below provides a reconciliation of PSEG’s Net Income to Operating Earnings (a non-GAAP measure) for the third quarter. See Attachment 12 for a complete list of items excluded from Net Income in the determination of Operating Earnings.
PSEG CONSOLIDATED EARNINGS (unaudited)
Third Quarter Comparative Results
2015 and 2014
| Income | Diluted Earnings | |||||||||||||||
| ($ millions) | Per Share | |||||||||||||||
| 2015 | 2014 | 2015 | 2014 | |||||||||||||
| Operating Earnings |
$ | 403 | $ | 393 | $ | 0.80 | $ | 0.77 | ||||||||
| Reconciling Items |
36 | 51 | 0.07 | 0.10 | ||||||||||||
|
|
|
|
|
|
|
|
|
|||||||||
| Net Income |
$ | 439 | $ | 444 | $ | 0.87 | $ | 0.87 | ||||||||
|
|
|
|
|
|
|
|
|
|||||||||
| Average Shares |
508M | 507M | ||||||||||||||
“Our position of financial strength allows us to make significant investments in our businesses,” Izzo said. “Since the start of the year, our 5-year capital program has been increased by 20% to $15.6 billion. The increase in spending should produce double-digit growth in PSE&G’s rate base through 2019 from 2014 as we also enhance the competitive position of PSEG Power’s generating fleet with the addition of approximately 1300 MWs of new, efficient gas-fired combined cycle capacity. The investment program should assure customers receive clean, reliable delivery of electricity and natural gas as we also position PSEG to continue to deliver value for shareholders over the long-term.”
Our revised Operating Earnings guidance by company for the full year is as follows:
Operating Earnings
($ millions, except EPS)
| 2015E | 2014A | |||||
| PSE&G |
$785 - $805 | $ | 725 | |||
| PSEG Power |
$620 - $650 | $ | 642 | |||
| PSEG Enterprise/Other |
$40 - $45 | $ | 33 | |||
|
|
|
|
||||
| Total |
$1,445 - $1,500 | $ | 1,400 | |||
|
|
|
|
||||
| Earnings Per Share |
$2.85 - $2.95 | $ | 2.76 | |||
|
|
|
|
||||
Operating Earnings Review and Outlook by Operating Subsidiary
See Attachment 6 for detail regarding the quarter-over-quarter reconciliations for each of PSEG’s businesses.
PSE&G
PSE&G reported operating earnings of $222 million ($0.44 per share) for the third quarter of 2015 compared with operating earnings of $200 million ($0.39 per share) for the third quarter of 2014.
PSE&G’s earnings reflect the impact of warmer than normal weather, and an increase in revenue associated with an expanded capital program which more than offset a moderate increase in operating expenses.
Returns from PSE&G’s expanded investment in transmission added $0.03 per share to earnings in the quarter. Weather conditions, which were warmer than normal and warmer than the year ago period, improved quarter-over-quarter earnings by $0.02 per share. A slight increase in electric demand coupled with revenue recovery of infrastructure-related investment programs improved quarter-over-quarter earnings by $0.01 per share. An increase in pension expense led to a reduction in quarter-over-quarter earnings by $0.01 per share.
Electric sales grew 7% during the third quarter as residential customers responded to temperatures that were 38% higher than the levels experienced in the year-ago period and 19% higher than normal. On a weather-normalized basis, electric sales advanced 0.8% in the quarter resulting in weather-normalized electric sales growth of 0.4% for the nine months ended September.
In September 2015, the NJ Board of Public Utilities (BPU) approved PSE&G’s filing requesting a reduction of $70 million in annual Basic Gas Supply Service (BGSS) revenues. The change, which was effective on October 1, 2015, reduced the BGSS rate to 40 cents per therm from 45 cents per therm. Including this reduction in gas charges, the typical residential customer has experienced a 47%, or $792, decline in their annual gas bill since January 2009.
PSE&G, in September 2015, reached a settlement in principle with the Staff of the BPU and the NJ Division of Rate Counsel on the company’s Gas System Modernization Program (GSMP). The settlement provides for investing $905 million over a three year period beginning in 2016.
PSE&G filed an update of its Formula Rate for transmission at the Federal Energy Regulatory Commission in October 2015. The update, which reflects an increase in the level of PSE&G’s investment in transmission, would provide for approximately $146 million in increased annual transmission revenue effective January 1, 2016.
The forecast of PSE&G’s operating earnings for 2015 is now $785 - $805 million versus $760 - $775 million. Operating earnings for the full year are benefiting from the recovery of costs associated with higher levels of capital spending. The increase in the forecast is mostly due to warmer than normal weather.
PSEG Power
PSEG Power reported operating earnings of $170 million ($0.33 per share) for the third quarter of 2015 and Adjusted EBITDA of $401 million compared with operating earnings of $171 million ($0.34 per share) and Adjusted EBITDA of $386 million for the third quarter of 2014.
PSEG believes that the non-GAAP financial measure of “Adjusted EBITDA” is useful in evaluating Power’s operating performance because it provides investors with additional information to compare our business performance to other companies and to understand performance trends.
Adjusted EBITDA excludes the same items as our Operating Earnings measure as well as income tax expense and interest expense, depreciation and amortization and major maintenance at Power’s fossil generation facilities. See Attachment 12 for a complete list of items excluded from Net Income in the determination of Adjusted EBITDA.
Power’s results for the quarter reflect the impact of strong hedging, an increase in operation from the gas-fired combined cycle fleet and an improvement in spark spreads with the availability of low-cost gas supply which offset the anticipated effect of a decline in capacity prices.
Power retired approximately 1800 MWs in the second quarter of older, less efficient peaking capacity that didn’t meet NJ’s environmental standards. The loss of the revenue on this capacity reduced Power’s quarter-over-quarter earnings by $0.03 per share. This decline in earnings was offset by higher average prices received on energy hedges as well as an improvement in spark spreads. These two items combined to increase quarter-over-quarter earnings by $0.07 per share. An increase in O&M expenses reduced quarter-over-quarter earnings by $0.03 per share. The increase in operating expense primarily reflects differences in the timing of outages at PSEG Power’s nuclear facilities, and is not a reflection of a higher embedded level of expense. The absence of prior year tax benefits reduced quarter-over-quarter earnings by $0.02 per share.
Output during the quarter of 14.7 TWh was in line with year-ago levels. The fleet’s flexibility continues to be demonstrated as an improvement in output from the nuclear fleet and increased production from the gas-fired combined cycle fleet offset a decline in production from Power’s coal-fired stations.
The nuclear fleet operated at an average capacity factor of 95%, producing 7.8 TWh of output or 53% of Power’s generation, a 3% increase over year-ago levels. Performance of the nuclear facilities reflects the absence of repair work at Salem 2 in 2014 which was partially offset in the third quarter of 2015 by an early start to the refueling outage at Peach Bottom 3. Production from the gas-fired combined cycle fleet (CCGT) increased 7% to 5.4 TWh, or 36% of total generation, as the CCGT fleet operated at a 73% capacity factor during the quarter in response to improved spark spreads. Output of the CCGT fleet also benefited from the completion of up-rate work which added 94 MWs of efficient capacity at the Linden and Bergen Generating Stations over the past year. Higher summer demand also had a favorable impact on the dispatch of Power’s peaking capacity. Dispatch of the coal fleet was affected by a decline in the price of gas and lower wholesale energy prices.
Power’s fleet is expected to produce energy at the lower end of its forecast of output for 2015 of 55 – 57 TWh. Approximately
80% – 85% of anticipated production for the fourth quarter is hedged at an average price of $52 per MWh. For 2016, Power has hedged 65% - 70% of its forecast generation of 55 – 57 TWh at an average price of $51 per MWh; for 2017, Power has hedged
35% - 40% of its forecast generation of 55 – 57 TWh at an average price of $49 per MWh. The percent of energy hedged over 2016 – 2017 is consistent with – but, at the lower end of the range for Power’s prescribed ratable hedging policy.
PSEG Power cleared a new 540 MW CCGT at Sewaren as part of PJM’s Reliability Pricing Model Base Residual Auction. The plant, which represents an investment of $625 - $675 million, is targeted to be completed and supplying energy to New Jersey and the region by the summer of 2018.
The forecast range of Power’s operating earnings for 2015 is now $620 - $650 million versus $620 - $680 million. The forecast of operating earnings represents adjusted EBITDA for the full year of $1,545 - $1,595 million. Results for the year have been influenced by the expected decline in year-over-year capacity revenue, an increase in the average price of hedged energy and lower wholesale energy prices.
PSEG Enterprise/Other
PSEG Enterprise/Other reported operating earnings of $11 million ($0.03 per share) for the third quarter of 2015 compared with operating earnings of $22 million ($0.04 per share) for the third quarter of 2014. The decline in operating earnings reflects the absence of prior year tax benefits at PSEG Energy Holdings partially offset by lower operating and maintenance expense and higher interest income at Parent.
The forecast of PSEG Enterprise/Other full year operating earnings for 2015 remains $40 - $45 million.
FORWARD-LOOKING STATEMENT
Certain of the matters discussed in this report about our and our subsidiaries’ future performance, including, without limitation, future revenues, earnings, strategies, prospects, consequences and all other statements that are not purely historical constitute “forward-looking statements” within the meaning of the Private Securities Litigation Reform Act of 1995. Such forward-looking statements are subject to risks and uncertainties, which could cause actual results to differ materially from those anticipated. Such statements are based on management’s beliefs as well as assumptions made by and information currently available to management. When used herein, the words “anticipate,” “intend,” “estimate,” “believe,” “expect,” “plan,” “should,” “hypothetical,” “potential,” “forecast,” “project,” variations of such words and similar expressions are intended to identify forward-looking statements. Factors that may cause actual results to differ are often presented with the forward-looking statements themselves. Other factors that could cause actual results to differ materially from those contemplated in any forward-looking statements made by us herein are discussed in filings we make with the United States Securities and Exchange Commission (SEC), including our Annual Report on Form 10-K and subsequent reports on Form 10-Q and Form 8-K and available on our website: http://www.pseg.com. These factors include, but are not limited to:
| • | adverse changes in the demand for or the price of the capacity and energy that we sell into wholesale electricity markets, |
| • | adverse changes in energy industry law, policies and regulation, including market structures and transmission planning, |
| • | any inability of our transmission and distribution businesses to obtain adequate and timely rate relief and regulatory approvals from federal and state regulators, |
| • | changes in federal and state environmental regulations and enforcement that could increase our costs or limit our operations, |
| • | changes in nuclear regulation and/or general developments in the nuclear power industry, including various impacts from any accidents or incidents experienced at our facilities or by others in the industry, that could limit operations of our nuclear generating units, |
| • | actions or activities at one of our nuclear units located on a multi-unit site that might adversely affect our ability to continue to operate that unit or other units located at the same site, |
| • | any inability to manage our energy obligations, available supply and risks, |
| • | adverse outcomes of any legal, regulatory or other proceeding, settlement, investigation or claim applicable to us and/or the energy industry, |
| • | any deterioration in our credit quality or the credit quality of our counterparties, |
| • | availability of capital and credit at commercially reasonable terms and conditions and our ability to meet cash needs, |
| • | changes in the cost of, or interruption in the supply of, fuel and other commodities necessary to the operation of our generating units, |
| • | delays in receipt of necessary permits and approvals for our construction and development activities, |
| • | delays or unforeseen cost escalations in our construction and development activities, |
| • | any inability to achieve, or continue to sustain, our expected levels of operating performance, |
| • | any equipment failures, accidents, severe weather events or other incidents that impact our ability to provide safe and reliable service to our customers, and any inability to obtain sufficient insurance coverage or recover proceeds of insurance with respect to such events, |
| • | acts of terrorism, cybersecurity attacks or intrusions that could adversely impact our businesses, |
| • | increases in competition in energy supply markets as well as for transmission projects, |
| • | any inability to realize anticipated tax benefits or retain tax credits, |
| • | challenges associated with recruitment and/or retention of a qualified workforce, |
| • | adverse performance of our decommissioning and defined benefit plan trust fund investments and changes in funding requirements, |
| • | changes in technology, such as distributed generation and micro grids, and greater reliance on these technologies, and |
| • | changes in customer behaviors, including increases in energy efficiency, net-metering and demand response. |
All of the forward-looking statements made in this report are qualified by these cautionary statements and we cannot assure you that the results or developments anticipated by management will be realized or even if realized, will have the expected consequences to, or effects on, us or our business prospects, financial condition or results of operations. Readers are cautioned not to place undue reliance on these forward-looking statements in making any investment decision. Forward-looking statements made in this report apply only as of the date of this report. While we may elect to update forward-looking statements from time to time, we specifically disclaim any obligation to do so, even if internal estimates change, unless otherwise required by applicable securities laws.
The forward-looking statements contained in this report are intended to qualify for the safe harbor provisions of Section 27A of the Securities Act of 1933, as amended, and Section 21E of the Securities Exchange Act of 1934, as amended.
Attachment 1
PUBLIC SERVICE ENTERPRISE GROUP INCORPORATED
Operating Earnings and Per Share Results by Subsidiary
(Unaudited)
| Three Months Ended | Nine Months Ended | |||||||||||||||
| September 30, | September 30, | |||||||||||||||
| 2015 | 2014 | 2015 | 2014 | |||||||||||||
| Earnings Results ($ Millions) | ||||||||||||||||
| PSE&G |
$ | 222 | $ | 200 | $ | 631 | $ | 565 | ||||||||
| PSEG Power |
170 | 171 | 558 | 551 | ||||||||||||
| PSEG Enterprise/Other |
11 | 22 | 32 | 37 | ||||||||||||
|
|
|
|
|
|
|
|
|
|||||||||
| Operating Earnings |
$ | 403 | $ | 393 | $ | 1,221 | $ | 1,153 | ||||||||
|
|
|
|
|
|
|
|
|
|||||||||
| Reconciling Items(a) |
36 | 51 | 149 | (111 | ) | |||||||||||
|
|
|
|
|
|
|
|
|
|||||||||
| Net Income |
$ | 439 | $ | 444 | $ | 1,370 | $ | 1,042 | ||||||||
|
|
|
|
|
|
|
|
|
|||||||||
| Fully Diluted Average Shares Outstanding (in Millions) |
508 | 507 | 508 | 507 | ||||||||||||
|
|
|
|
|
|
|
|
|
|||||||||
| Per Share Results (Diluted) | ||||||||||||||||
| PSE&G |
$ | 0.44 | $ | 0.39 | $ | 1.24 | $ | 1.11 | ||||||||
| PSEG Power |
0.33 | 0.34 | 1.10 | 1.09 | ||||||||||||
| PSEG Enterprise/Other |
0.03 | 0.04 | 0.07 | 0.07 | ||||||||||||
|
|
|
|
|
|
|
|
|
|||||||||
| Operating Earnings |
$ | 0.80 | $ | 0.77 | $ | 2.41 | $ | 2.27 | ||||||||
|
|
|
|
|
|
|
|
|
|||||||||
| Reconciling Items(a) |
0.07 | 0.10 | 0.29 | (0.22 | ) | |||||||||||
|
|
|
|
|
|
|
|
|
|||||||||
| Net Income |
$ | 0.87 | $ | 0.87 | $ | 2.70 | $ | 2.05 | ||||||||
|
|
|
|
|
|
|
|
|
|||||||||
| (a) | See Attachment 12 for details of items excluded from Net Income to compute Operating Earnings. |
Attachment 2
PUBLIC SERVICE ENTERPRISE GROUP INCORPORATED
Consolidating Statements of Operations
(Unaudited, $ Millions)
| Three Months Ended September 30, 2015 | ||||||||||||||||
| PSEG | PSEG Enterprise/ Other (a) |
PSE&G | PSEG Power |
|||||||||||||
| OPERATING REVENUES |
$ | 2,688 | $ | (174 | ) | $ | 1,766 | $ | 1,096 | |||||||
| OPERATING EXPENSES |
||||||||||||||||
| Energy Costs |
815 | (292 | ) | 740 | 367 | |||||||||||
| Operation and Maintenance |
746 | 92 | 391 | 263 | ||||||||||||
| Depreciation and Amortization |
313 | 7 | 231 | 75 | ||||||||||||
|
|
|
|
|
|
|
|
|
|||||||||
| Total Operating Expenses |
1,874 | (193 | ) | 1,362 | 705 | |||||||||||
|
|
|
|
|
|
|
|
|
|||||||||
| OPERATING INCOME |
814 | 19 | 404 | 391 | ||||||||||||
| Income from Equity Method Investments |
3 | — | — | 3 | ||||||||||||
| Other Income and (Deductions) |
33 | — | 22 | 11 | ||||||||||||
| Other-Than-Temporary Impairments |
(30 | ) | — | — | (30 | ) | ||||||||||
| Interest Expense |
(96 | ) | 1 | (67 | ) | (30 | ) | |||||||||
|
|
|
|
|
|
|
|
|
|||||||||
| INCOME BEFORE INCOME TAXES |
724 | 20 | 359 | 345 | ||||||||||||
| Income Tax Benefit (Expense) |
(285 | ) | (9 | ) | (137 | ) | (139 | ) | ||||||||
|
|
|
|
|
|
|
|
|
|||||||||
| NET INCOME |
$ | 439 | $ | 11 | $ | 222 | $ | 206 | ||||||||
|
|
|
|
|
|
|
|
|
|||||||||
| OPERATING EARNINGS |
$ | 403 | $ | 11 | $ | 222 | $ | 170 | ||||||||
| Reconciling Items Excluded from Net Income (b) |
36 | — | — | 36 | ||||||||||||
|
|
|
|
|
|
|
|
|
|||||||||
| NET INCOME |
$ | 439 | $ | 11 | $ | 222 | $ | 206 | ||||||||
|
|
|
|
|
|
|
|
|
|||||||||
| Three Months Ended September 30, 2014 | ||||||||||||||||
| PSEG | PSEG Enterprise/ Other (a) |
PSE&G | PSEG Power |
|||||||||||||
| OPERATING REVENUES |
$ | 2,641 | $ | (152 | ) | $ | 1,655 | $ | 1,138 | |||||||
| OPERATING EXPENSES |
||||||||||||||||
| Energy Costs |
863 | (277 | ) | 668 | 472 | |||||||||||
| Operation and Maintenance |
714 | 106 | 366 | 242 | ||||||||||||
| Depreciation and Amortization |
318 | 9 | 238 | 71 | ||||||||||||
|
|
|
|
|
|
|
|
|
|||||||||
| Total Operating Expenses |
1,895 | (162 | ) | 1,272 | 785 | |||||||||||
|
|
|
|
|
|
|
|
|
|||||||||
| OPERATING INCOME |
746 | 10 | 383 | 353 | ||||||||||||
| Income from Equity Method Investments |
3 | (1 | ) | — | 4 | |||||||||||
| Other Income and (Deductions) |
66 | 2 | 14 | 50 | ||||||||||||
| Other-Than-Temporary Impairments |
(10 | ) | — | — | (10 | ) | ||||||||||
| Interest Expense |
(100 | ) | 2 | (71 | ) | (31 | ) | |||||||||
|
|
|
|
|
|
|
|
|
|||||||||
| INCOME BEFORE INCOME TAXES |
705 | 13 | 326 | 366 | ||||||||||||
| Income Tax Benefit (Expense) |
(261 | ) | 9 | (126 | ) | (144 | ) | |||||||||
|
|
|
|
|
|
|
|
|
|||||||||
| NET INCOME |
$ | 444 | $ | 22 | $ | 200 | $ | 222 | ||||||||
|
|
|
|
|
|
|
|
|
|||||||||
| OPERATING EARNINGS |
$ | 393 | $ | 22 | $ | 200 | $ | 171 | ||||||||
| Reconciling Items Excluded from Net Income (b) |
51 | — | — | 51 | ||||||||||||
|
|
|
|
|
|
|
|
|
|||||||||
| NET INCOME |
$ | 444 | $ | 22 | $ | 200 | $ | 222 | ||||||||
|
|
|
|
|
|
|
|
|
|||||||||
| (a) | Includes activities at Energy Holdings, PSEG Long Island and the Parent as well as intercompany eliminations. |
| (b) | See Attachment 12 for details of items excluded from Net Income to compute Operating Earnings. |
Attachment 3
PUBLIC SERVICE ENTERPRISE GROUP INCORPORATED
Consolidating Statements of Operations
(Unaudited, $ Millions)
| Nine Months Ended September 30, 2015 | ||||||||||||||||
| PSEG | PSEG Enterprise/ Other (a) |
PSE&G | PSEG Power |
|||||||||||||
| OPERATING REVENUES |
$ | 8,137 | $ | (943 | ) | $ | 5,234 | $ | 3,846 | |||||||
| OPERATING EXPENSES |
||||||||||||||||
| Energy Costs |
2,577 | (1,268 | ) | 2,176 | 1,669 | |||||||||||
| Operation and Maintenance |
2,170 | 251 | 1,171 | 748 | ||||||||||||
| Depreciation and Amortization |
960 | 22 | 712 | 226 | ||||||||||||
|
|
|
|
|
|
|
|
|
|||||||||
| Total Operating Expenses |
5,707 | (995 | ) | 4,059 | 2,643 | |||||||||||
|
|
|
|
|
|
|
|
|
|||||||||
| OPERATING INCOME |
2,430 | 52 | 1,175 | 1,203 | ||||||||||||
| Income from Equity Method Investments |
10 | (1 | ) | — | 11 | |||||||||||
| Other Income and (Deductions) |
135 | 1 | 57 | 77 | ||||||||||||
| Other-Than-Temporary Impairments |
(45 | ) | — | — | (45 | ) | ||||||||||
| Interest Expense |
(291 | ) | 6 | (203 | ) | (94 | ) | |||||||||
|
|
|
|
|
|
|
|
|
|||||||||
| INCOME BEFORE INCOME TAXES |
2,239 | 58 | 1,029 | 1,152 | ||||||||||||
| Income Tax Benefit (Expense) |
(869 | ) | (26 | ) | (398 | ) | (445 | ) | ||||||||
|
|
|
|
|
|
|
|
|
|||||||||
| NET INCOME |
$ | 1,370 | $ | 32 | $ | 631 | $ | 707 | ||||||||
|
|
|
|
|
|
|
|
|
|||||||||
| OPERATING EARNINGS |
$ | 1,221 | $ | 32 | $ | 631 | $ | 558 | ||||||||
| Reconciling Items Excluded from Net Income (b) |
149 | — | — | 149 | ||||||||||||
|
|
|
|
|
|
|
|
|
|||||||||
| NET INCOME |
$ | 1,370 | $ | 32 | $ | 631 | $ | 707 | ||||||||
|
|
|
|
|
|
|
|
|
|||||||||
| Nine Months Ended September 30, 2014 | ||||||||||||||||
| PSEG | PSEG Enterprise/ Other (a) |
PSE&G | PSEG Power |
|||||||||||||
| OPERATING REVENUES |
$ | 8,113 | $ | (946 | ) | $ | 5,235 | $ | 3,824 | |||||||
| OPERATING EXPENSES |
||||||||||||||||
| Energy Costs |
3,008 | (1,306 | ) | 2,278 | 2,036 | |||||||||||
| Operation and Maintenance |
2,370 | 309 | 1,190 | 871 | ||||||||||||
| Depreciation and Amortization |
919 | 22 | 682 | 215 | ||||||||||||
|
|
|
|
|
|
|
|
|
|||||||||
| Total Operating Expenses |
6,297 | (975 | ) | 4,150 | 3,122 | |||||||||||
|
|
|
|
|
|
|
|
|
|||||||||
| OPERATING INCOME |
1,816 | 29 | 1,085 | 702 | ||||||||||||
| Income from Equity Method Investments |
10 | (1 | ) | — | 11 | |||||||||||
| Other Income and (Deductions) |
154 | 3 | 41 | 110 | ||||||||||||
| Other-Than-Temporary Impairments |
(14 | ) | — | — | (14 | ) | ||||||||||
| Interest Expense |
(291 | ) | 7 | (206 | ) | (92 | ) | |||||||||
|
|
|
|
|
|
|
|
|
|||||||||
| INCOME BEFORE INCOME TAXES |
1,675 | 38 | 920 | 717 | ||||||||||||
| Income Tax Benefit (Expense) |
(633 | ) | (1 | ) | (355 | ) | (277 | ) | ||||||||
|
|
|
|
|
|
|
|
|
|||||||||
| NET INCOME |
$ | 1,042 | $ | 37 | $ | 565 | $ | 440 | ||||||||
|
|
|
|
|
|
|
|
|
|||||||||
| OPERATING EARNINGS |
$ | 1,153 | $ | 37 | $ | 565 | $ | 551 | ||||||||
| Reconciling Items Excluded from Net Income (b) |
(111 | ) | — | — | (111 | ) | ||||||||||
|
|
|
|
|
|
|
|
|
|||||||||
| NET INCOME |
$ | 1,042 | $ | 37 | $ | 565 | $ | 440 | ||||||||
|
|
|
|
|
|
|
|
|
|||||||||
| (a) | Includes activities at Energy Holdings, PSEG Long Island and the Parent as well as intercompany eliminations. |
| (b) | See Attachment 12 for details of items excluded from Net Income to compute Operating Earnings. |
Attachment 4
PUBLIC SERVICE ENTERPRISE GROUP INCORPORATED
Capitalization Schedule
(Unaudited, $ Millions)
| September 30, | December 31, | |||||||
| 2015 | 2014 | |||||||
| DEBT |
||||||||
| Long-Term Debt |
$ | 9,163 | $ | 8,869 | ||||
| Securitization Debt |
68 | 259 | ||||||
| Project Level, Non-Recourse Debt |
7 | 16 | ||||||
|
|
|
|
|
|||||
| Total Debt |
9,238 | 9,144 | ||||||
| STOCKHOLDERS’ EQUITY |
||||||||
| Common Stock |
4,894 | 4,876 | ||||||
| Treasury Stock |
(667 | ) | (635 | ) | ||||
| Retained Earnings |
9,005 | 8,227 | ||||||
| Accumulated Other Comprehensive Loss |
(299 | ) | (283 | ) | ||||
|
|
|
|
|
|||||
| Total Common Stockholders’ Equity |
12,933 | 12,185 | ||||||
| Noncontrolling Interests - Equity Investments |
1 | 1 | ||||||
|
|
|
|
|
|||||
| Total Equity |
12,934 | 12,186 | ||||||
|
|
|
|
|
|||||
| Total Capitalization |
$ | 22,172 | $ | 21,330 | ||||
|
|
|
|
|
|||||
Attachment 5
PUBLIC SERVICE ENTERPRISE GROUP INCORPORATED
CONDENSED CONSOLIDATED STATEMENTS OF CASH FLOWS
(Unaudited, $ Millions)
| Nine Months Ended September 30, | ||||||||
| 2015 | 2014 | |||||||
| CASH FLOWS FROM OPERATING ACTIVITIES |
||||||||
| Net Income |
$ | 1,370 | $ | 1,042 | ||||
| Adjustments to Reconcile Net Income to Net Cash Flows From Operating Activities |
1,858 | 1,494 | ||||||
|
|
|
|
|
|||||
| NET CASH PROVIDED BY OPERATING ACTIVITIES |
3,228 | 2,536 | ||||||
|
|
|
|
|
|||||
| NET CASH USED IN INVESTING ACTIVITIES |
(2,841 | ) | (1,988 | ) | ||||
|
|
|
|
|
|||||
| NET CASH USED IN FINANCING ACTIVITIES |
(518 | ) | (338 | ) | ||||
|
|
|
|
|
|||||
| Net Change in Cash and Cash Equivalents |
(131 | ) | 210 | |||||
| Cash and Cash Equivalents at Beginning of Period |
402 | 493 | ||||||
|
|
|
|
|
|||||
| Cash and Cash Equivalents at End of Period |
$ | 271 | $ | 703 | ||||
|
|
|
|
|
|||||
Attachment 6
PUBLIC SERVICE ENTERPRISE GROUP INCORPORATED
Quarter-over-Quarter EPS Reconciliation
September 30, 2015 vs. September 30, 2014
(Unaudited)
Attachment 7
PUBLIC SERVICE ENTERPRISE GROUP INCORPORATED
Year-over-Year EPS Reconciliation
September 30, 2015 vs. September 30, 2014
(Unaudited)
Attachment 8
PUBLIC SERVICE ELECTRIC & GAS COMPANY
Retail Sales and Revenues
(Unaudited)
September 30, 2015
Electric Sales and Revenues
| Three Months | Change vs. | Nine Months | Change vs. | |||||||||||||
| Ended | 2014 | Ended | 2014 | |||||||||||||
| Sales (millions kWh) |
||||||||||||||||
| Residential |
4,596 | 12.7 | % | 11,019 | 7.2 | % | ||||||||||
| Commercial & Industrial |
7,678 | 4.0 | % | 21,331 | 1.9 | % | ||||||||||
| Street Lighting |
69 | -3.3 | % | 234 | 0.6 | % | ||||||||||
| Interdepartmental |
3 | 21.7 | % | 7 | 0.3 | % | ||||||||||
|
|
|
|
|
|||||||||||||
| Total |
12,346 | 7.1 | % | 32,591 | 3.7 | % | ||||||||||
|
|
|
|
|
|||||||||||||
| Revenue ($ millions) |
||||||||||||||||
| Residential |
$ | 757 | 14.7 | % | $ | 1,777 | 9.7 | % | ||||||||
| Commercial & Industrial |
629 | 0.1 | % | 1,625 | -0.5 | % | ||||||||||
| Street Lighting |
17 | 2.4 | % | 52 | 2.8 | % | ||||||||||
| Other Operating Revenues* |
158 | 16.7 | % | 458 | 19.3 | % | ||||||||||
|
|
|
|
|
|||||||||||||
| Total |
$ | 1,561 | 8.4 | % | $ | 3,912 | 6.1 | % | ||||||||
|
|
|
|
|
|||||||||||||
| Three Months | Change vs. | Nine Months | Change vs. | |||||||||||||
| Ended | 2014 | Ended | 2014 | |||||||||||||
| Weather Data |
||||||||||||||||
| THI Hours - Actual |
13,896 | 37.8 | % | 18,710 | 38.4 | % | ||||||||||
| THI Hours - Normal |
11,679 | 15,752 | ||||||||||||||
| * | Primarily sales of Non-Utility Generator energy to PJM and Transmission related revenues. |
Attachment 9
PUBLIC SERVICE ELECTRIC & GAS COMPANY
Retail Sales and Revenues
(Unaudited)
September 30, 2015
Gas Sold and Transported
| Three Months | Change vs. | Nine Months | Change vs. | |||||||||||||
| Ended | 2014 | Ended | 2014 | |||||||||||||
| Sales (millions therms)* |
||||||||||||||||
| Firm Sales |
||||||||||||||||
| Residential Sales |
96 | -5.8 | % | 1,168 | 3.6 | % | ||||||||||
| Commercial & Industrial |
100 | 2.5 | % | 805 | 4.4 | % | ||||||||||
|
|
|
|
|
|||||||||||||
| Total Firm Sales |
196 | -1.7 | % | 1,973 | 3.9 | % | ||||||||||
|
|
|
|
|
|||||||||||||
| Non-Firm Sales |
||||||||||||||||
| Commercial & Industrial |
670 | -6.0 | % | 1,625 | -11.1 | % | ||||||||||
|
|
|
|
|
|||||||||||||
| Total Non-Firm Sales |
670 | 1,625 | ||||||||||||||
|
|
|
|
|
|||||||||||||
| Total Sales |
866 | -5.0 | % | 3,598 | -3.5 | % | ||||||||||
|
|
|
|
|
|||||||||||||
| Revenue ($ millions) |
||||||||||||||||
| Residential Sales - Firm |
$ | 39 | -19.1 | % | $ | 224 | -45.2 | % | ||||||||
| Commercial & Industrial - Firm Sales |
15 | -25.8 | % | 197 | -16.0 | % | ||||||||||
| Non-Firm Sales |
9 | 26.1 | % | 28 | -11.6 | % | ||||||||||
| Other Operating Revenues** |
42 | 3.6 | % | 129 | 0.8 | % | ||||||||||
|
|
|
|
|
|||||||||||||
| Total |
$ | 105 | -9.4 | % | $ | 578 | -28.0 | % | ||||||||
|
|
|
|
|
|||||||||||||
| Gas Transported |
$ | 100 | 1.3 | % | $ | 744 | 0.0 | % | ||||||||
| Three Months | Change vs. | Nine Months | Change vs. | |||||||||||||
| Ended | 2014 | Ended | 2014 | |||||||||||||
| Weather Data |
||||||||||||||||
| Degree Days - Actual |
1 | -96.1 | % | 3,557 | 2.5 | % | ||||||||||
| Degree Days - Normal |
29 | 3,039 | ||||||||||||||
| * | CSG rate included in non-firm sales |
| ** | Primarily Appliance Service. |
Attachment 10
PSEG POWER LLC
Generation Measures*
(Unaudited)
| GWhr Breakdown | GWhr Breakdown | |||||||||||||||
| Three Months Ended | Nine Months Ended | |||||||||||||||
| September 30, | September 30, | |||||||||||||||
| 2015 | 2014 | 2015 | 2014 | |||||||||||||
| Nuclear - NJ |
5,393 | 5,113 | 15,249 | 14,653 | ||||||||||||
| Nuclear - PA |
2,394 | 2,452 | 7,499 | 7,499 | ||||||||||||
|
|
|
|
|
|
|
|
|
|||||||||
| Total Nuclear |
7,787 | 7,565 | 22,748 | 22,152 | ||||||||||||
| Fossil - Coal/Natural Gas - NJ** |
72 | 563 | 542 | 1,441 | ||||||||||||
| Fossil - Coal - PA |
1,108 | 1,221 | 3,853 | 3,945 | ||||||||||||
| Fossil - Coal - CT |
12 | 47 | 600 | 710 | ||||||||||||
|
|
|
|
|
|
|
|
|
|||||||||
| Total Coal |
1,192 | 1,831 | 4,995 | 6,096 | ||||||||||||
| Fossil - Oil & Natural Gas - NJ |
4,160 | 3,767 | 10,932 | 9,419 | ||||||||||||
| Fossil - Oil & Natural Gas - NY |
1,547 | 1,523 | 3,691 | 3,398 | ||||||||||||
| Fossil - Oil & Natural Gas - CT |
32 | 4 | 122 | 241 | ||||||||||||
|
|
|
|
|
|
|
|
|
|||||||||
| Total Oil & Natural Gas |
5,739 | 5,294 | 14,745 | 13,058 | ||||||||||||
|
|
|
|
|
|
|
|
|
|||||||||
| 14,718 | 14,690 | 42,488 | 41,306 | |||||||||||||
|
|
|
|
|
|
|
|
|
|||||||||
| % Generation by Fuel Type | % Generation by Fuel Type | |||||||||||||||
| Three Months Ended | Nine Months Ended | |||||||||||||||
| September 30, | September 30, | |||||||||||||||
| 2015 | 2014 | 2015 | 2014 | |||||||||||||
| Nuclear - NJ |
37 | % | 35 | % | 36 | % | 35 | % | ||||||||
| Nuclear - PA |
16 | % | 16 | % | 18 | % | 18 | % | ||||||||
|
|
|
|
|
|
|
|
|
|||||||||
| Total Nuclear |
53 | % | 51 | % | 54 | % | 53 | % | ||||||||
| Fossil - Coal/Natural Gas - NJ** |
0 | % | 4 | % | 1 | % | 3 | % | ||||||||
| Fossil - Coal - PA |
8 | % | 9 | % | 9 | % | 10 | % | ||||||||
| Fossil - Coal - CT |
0 | % | 0 | % | 1 | % | 2 | % | ||||||||
|
|
|
|
|
|
|
|
|
|||||||||
| Total Coal |
8 | % | 13 | % | 11 | % | 15 | % | ||||||||
| Fossil - Oil & Natural Gas - NJ |
28 | % | 26 | % | 26 | % | 23 | % | ||||||||
| Fossil - Oil & Natural Gas - NY |
11 | % | 10 | % | 9 | % | 8 | % | ||||||||
| Fossil - Oil & Natural Gas - CT |
0 | % | 0 | % | 0 | % | 1 | % | ||||||||
|
|
|
|
|
|
|
|
|
|||||||||
| Total Oil & Natural Gas |
39 | % | 36 | % | 35 | % | 32 | % | ||||||||
|
|
|
|
|
|
|
|
|
|||||||||
| 100 | % | 100 | % | 100 | % | 100 | % | |||||||||
|
|
|
|
|
|
|
|
|
|||||||||
| * | Excludes Solar and Kalaeloa |
| ** | Includes Pumped Storage. Pumped Storage accounted for <1% of total generation for the three and nine months ended September 30, 2015 and 2014. Generation includes natural gas fuel switching intervals. |
Attachment 11
PUBLIC SERVICE ENTERPRISE GROUP INCORPORATED
Statistical Measures
(Unaudited)
| Three Months Ended | Nine Months Ended | |||||||||||||||
| September 30, | September 30, | |||||||||||||||
| 2015 | 2014 | 2015 | 2014 | |||||||||||||
| Weighted Average Common Shares Outstanding (millions) |
||||||||||||||||
| Basic |
505 | 506 | 505 | 506 | ||||||||||||
| Diluted |
508 | 507 | 508 | 507 | ||||||||||||
| Stock Price at End of Period |
$ | 42.16 | $ | 37.24 | ||||||||||||
| Dividends Paid per Share of Common Stock |
$ | 0.39 | $ | 0.37 | $ | 1.17 | $ | 1.11 | ||||||||
| Dividend Payout Ratio* |
53.8 | % | 53.6 | % | ||||||||||||
| Dividend Yield |
3.7 | % | 4.0 | % | ||||||||||||
| Price/Earnings Ratio* |
14.5 | 13.5 | ||||||||||||||
| Rate of Return on Average Common Equity* |
11.8 | % | 12.0 | % | ||||||||||||
| Book Value per Common Share |
$ | 25.90 | $ | 23.89 | ||||||||||||
| Market Price as a Percent of Book Value |
165 | % | 156 | % | ||||||||||||
| Total Shareholder Return |
8.4 | % | -7.8 | % | 4.9 | % | 19.8 | % | ||||||||
| * | Calculation based on Operating Earnings for the 12 month period ended. |
Attachment 12
PUBLIC SERVICE ENTERPRISE GROUP INCORPORATED
Consolidated Operating Earnings Reconciliation
| Three Months Ended | Nine Months Ended | Year Ended | ||||||||||||||||||||||
| September 30, | September 30, | December 31, | ||||||||||||||||||||||
| Reconciling Items, net of tax | 2015 | 2014 | 2015 | 2014 | 2014 | 2013 | ||||||||||||||||||
| ($ Millions, Unaudited) | ||||||||||||||||||||||||
| Operating Earnings |
$ | 403 | $ | 393 | $ | 1,221 | $ | 1,153 | $ | 1,400 | $ | 1,309 | ||||||||||||
| Gain (Loss) on Nuclear Decommissioning Trust (NDT) Fund Related Activity (PSEG Power) |
(14 | ) | 17 | (11 | ) | 40 | 68 | 40 | ||||||||||||||||
| Gain (Loss) on Mark-to-Market (MTM)(a) (PSEG Power) |
50 | 36 | 58 | (138 | ) | 66 | (74 | ) | ||||||||||||||||
| Storm O&M, net of insurance recoveries (PSEG Power) |
— | (2 | ) | 102 | (13 | ) | (16 | ) | (32 | ) | ||||||||||||||
|
|
|
|
|
|
|
|
|
|
|
|
|
|||||||||||||
| Net Income |
$ | 439 | $ | 444 | $ | 1,370 | $ | 1,042 | $ | 1,518 | $ | 1,243 | ||||||||||||
|
|
|
|
|
|
|
|
|
|
|
|
|
|||||||||||||
| Fully Diluted Average Shares Outstanding (in Millions) |
508 | 507 | 508 | 507 | 508 | 508 | ||||||||||||||||||
|
|
|
|
|
|
|
|
|
|
|
|
|
|||||||||||||
| ($ Per Share Impact - Diluted, Unaudited) | ||||||||||||||||||||||||
| Operating Earnings |
$ | 0.80 | $ | 0.77 | $ | 2.41 | $ | 2.27 | $ | 2.76 | $ | 2.58 | ||||||||||||
| Gain (Loss) on NDT Fund Related Activity (PSEG Power) |
(0.02 | ) | 0.04 | (0.02 | ) | 0.08 | 0.13 | 0.08 | ||||||||||||||||
| Gain (Loss) on MTM(a) (PSEG Power) |
0.09 | 0.07 | 0.11 | (0.27 | ) | 0.13 | (0.14 | ) | ||||||||||||||||
| Storm O&M, net of insurance recoveries (PSEG Power) |
— | (0.01 | ) | 0.20 | (0.03 | ) | (0.03 | ) | (0.07 | ) | ||||||||||||||
|
|
|
|
|
|
|
|
|
|
|
|
|
|||||||||||||
| Net Income |
$ | 0.87 | $ | 0.87 | $ | 2.70 | $ | 2.05 | $ | 2.99 | $ | 2.45 | ||||||||||||
|
|
|
|
|
|
|
|
|
|
|
|
|
|||||||||||||
| (a) | Includes the financial impact from positions with forward delivery months. |
PSEG Power Adjusted EBITDA Reconciliation
| Three Months Ended | Nine Months Ended | Year Ended | ||||||||||||||||||
| September 30, | September 30, | December 31, | ||||||||||||||||||
| Reconciling Items | 2015 | 2014 | 2015 | 2014 | 2014 | |||||||||||||||
| ($ Millions, Unaudited) | ||||||||||||||||||||
| Adjusted EBITDA |
$ | 401 | $ | 386 | $ | 1,328 | $ | 1,313 | $ | 1,584 | ||||||||||
| Fossil Major Maintenance, pre-tax |
(10 | ) | (10 | ) | (111 | ) | (117 | ) | (144 | ) | ||||||||||
| Depreciation and Amortization, pre-tax (b) |
(76 | ) | (71 | ) | (228 | ) | (217 | ) | (291 | ) | ||||||||||
| Interest Expense, pre-tax (b) |
(30 | ) | (31 | ) | (93 | ) | (91 | ) | (120 | ) | ||||||||||
| Income Taxes (b) |
(115 | ) | (103 | ) | (338 | ) | (337 | ) | (387 | ) | ||||||||||
|
|
|
|
|
|
|
|
|
|
|
|||||||||||
| Operating Earnings |
$ | 170 | $ | 171 | $ | 558 | $ | 551 | $ | 642 | ||||||||||
| Gain (Loss) on NDT Fund Related Activity, pre-tax |
(24 | ) | 36 | (14 | ) | 85 | 138 | |||||||||||||
| Gain (Loss) on MTM, pre-tax (a) |
84 | 60 | 98 | (233 | ) | 111 | ||||||||||||||
| Storm O&M, net of insurance recoveries, pre-tax |
— | (4 | ) | 172 | (23 | ) | (27 | ) | ||||||||||||
| Income Taxes related to Operating Earnings reconciling items |
(24 | ) | (41 | ) | (107 | ) | 60 | (104 | ) | |||||||||||
|
|
|
|
|
|
|
|
|
|
|
|||||||||||
| Net Income |
$ | 206 | $ | 222 | $ | 707 | $ | 440 | $ | 760 | ||||||||||
|
|
|
|
|
|
|
|
|
|
|
|||||||||||
| (a) | Includes the financial impact from positions with forward delivery months. |
| (b) | Excludes amounts related to Operating Earnings reconciling items. |