Attached files
| file | filename |
|---|---|
| 8-K - FORM 8-K - KEYCORP /NEW/ | d35124d8k.htm |
| EX-99.1 - EX-99.1 - KEYCORP /NEW/ | d35124dex991.htm |
 KeyCorp Acquisition of First Niagara Financial Group October 30, 2015 Better Together Exhibit 99.2 |
 FORWARD-LOOKING STATEMENTS AND ADDITIONAL
INFORMATION DISCLOSURE This communication contains forward-looking statements within the meaning of the Private Securities Litigation Reform Act of 1995 including, but not limited to, KeyCorp’s and First Niagara’s expectations or predictions of future financial or business performance or conditions. Forward-looking statements are typically identified by words such as “believe,” “expect,” “anticipate,” “intend,” “target,” “estimate,” “continue,” “positions,” “plan,” “predict,” “project,” “forecast,” “guidance,” “goal,” “objective,” “prospects,” “possible” or “potential,” by future conditional verbs such as “assume,” “will,” “would,” “should,” “could” or “may”, or by variations of such words or by similar expressions. These forward-looking statements are subject to numerous assumptions, risks and uncertainties, which change over time. Forward-looking statements speak only as of the date they are made and we assume no duty to update forward-looking statements. Actual results may differ materially from current projections. In addition to factors previously disclosed in KeyCorp’s and First Niagara’s reports filed with the SEC and those identified elsewhere in this communication, the following factors, among others, could cause actual results to differ materially from forward-looking statements or historical performance: ability to obtain regulatory approvals and meet other closing conditions to the merger, including approval by KeyCorp and First Niagara shareholders on the expected terms and schedule, including the risk that regulatory approvals required for the merger are not obtained or are obtained subject to conditions that are not anticipated; delay in closing the merger; difficulties and delays in integrating the First Niagara business or fully realizing cost savings and other benefits; business disruption following the merger; changes in asset quality and credit risk; the inability to sustain revenue and earnings growth; changes in interest rates and capital markets; inflation; customer acceptance of KeyCorp’s products and services; customer borrowing, repayment, investment and deposit practices; customer disintermediation; the introduction, withdrawal, success and timing of business initiatives; competitive conditions; the inability to realize cost savings or revenues or to implement integration plans and other consequences associated with mergers, acquisitions and divestitures; economic conditions; and the impact, extent and timing of technological changes, capital management activities, and other actions of the Federal Reserve Board and legislative and regulatory actions and reforms. Annualized, pro forma, projected and estimated numbers are used for illustrative purpose only, are not forecasts and may not reflect actual results. This presentation also includes certain non-GAAP financial measures related to “tangible common equity,” “Common Equity Tier 1,” “Tier 1 common equity,” “pre-provision net revenue,” and “cash efficiency ratio.” Management believes these ratios may assist investors, analysts and regulators in analyzing Key’s financials. Although Key has procedures in place to ensure that these measures are calculated using the appropriate GAAP or regulatory components, they have limitations as analytical tools and should not be considered in isolation, or as a substitute for analysis of results under GAAP. For more information on these calculations and to view the reconciliations to the most comparable GAAP measures, please refer to our most recent earnings press release. 2 Better Together |
 3 Shelby_Sales-Presentation_150928_v5.pptx\28 SEP 2015\6:59 PM\11 A Compelling Strategic Opportunity (a) Upon full realization of cost savings (FY2018); no revenue synergies assumed (b) MSA denotes Metropolitan Statistical Area Better Together Strengthens Franchise Strengthens Franchise Leverages Complementary Business Models Leverages Complementary Business Models Generates Attractive Financial Returns Generates Attractive Financial Returns Strengthens core operating and financial metrics (a) Creates leading bank in Upstate New York with a strong presence across the Northeast, Midwest and Pacific Northwest
Builds on Key’s brand and presence in shared markets with complementary new
markets –
Leading position in MSAs
(b) of Buffalo, Albany, Syracuse and Rochester – Establishes Key’s presence in attractive MSAs (Pittsburgh, Philadelphia, Hartford, New Haven) EPS accretion of 5% (a) IRR approximates 15% and ROIC exceeds 10% Expected cost savings of $400 million create $2.8 billion of shareholder value Drives revenue synergies by deploying stronger combined product set into existing client relationships
Efficient use of capital –
capital ratios remain strong
Significant revenue opportunity by delivering broader suite of products to new and
existing clients –
KEY: commercial payments; capital markets; commercial mortgage; private banking
and investments –
FNFG: residential mortgage; indirect auto lending; retail and commercial
insurance brokerage Complementary business mix creates a more balanced
franchise across consumer and commercial businesses Powerful combination
creates high-performing regional bank with compelling shareholder returns
13 Largest U.S. Commercial Bank
$135 billion assets $100 billion deposits – Increases ROTCE by ~200 bps – Cash efficiency ratio improves by ~300 bps – Adds one million clients and $25 billion of core deposits th (b) |
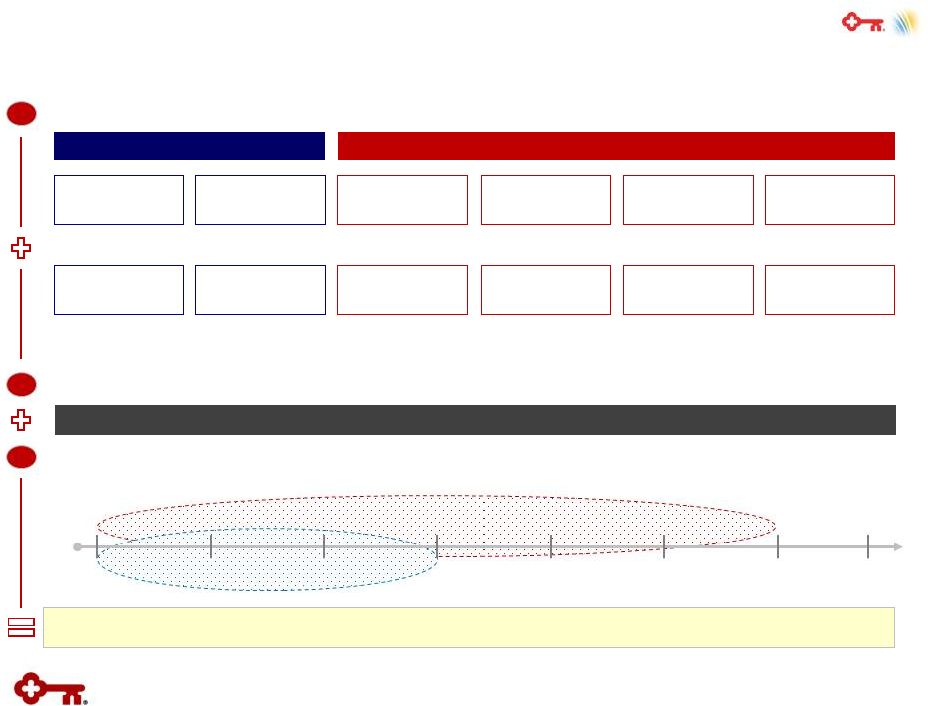
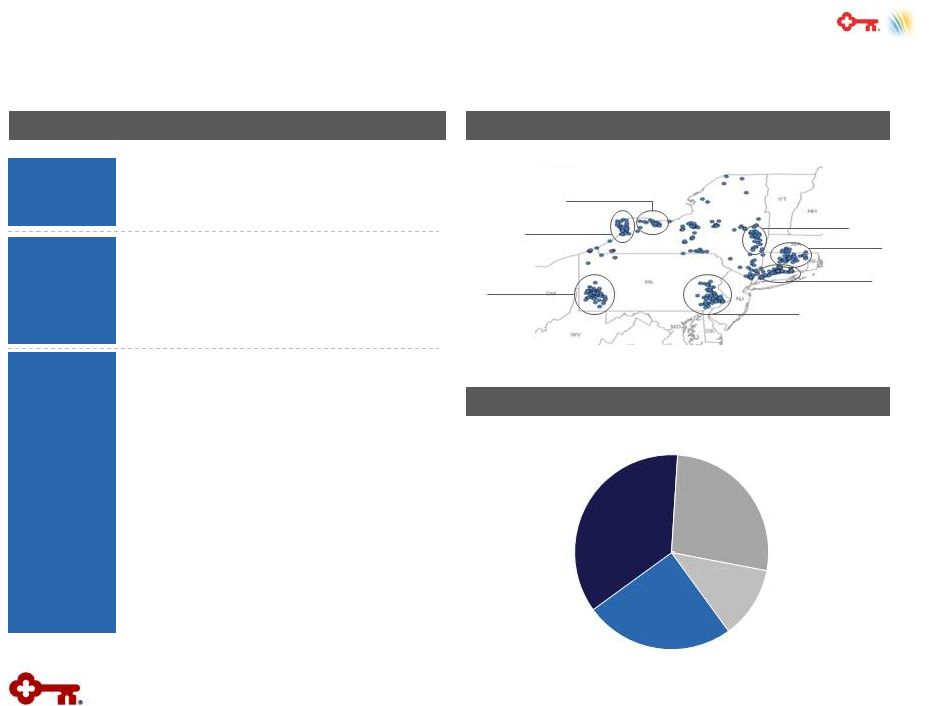 • Operates similar businesses in attractive, core and contiguous markets to Key – Banking segment is 95% of FNFG revenue – ~65% of First Niagara’s core deposits are in its New York markets -- all known and core to Key – One million clients and more than $14B in commercial loan balances – Strong risk culture • Compatible culture with Key – Focused on clients and communities Company Overview (3Q15) Company Overview (3Q15) Branch Footprint Branch Footprint Loan Portfolio (3Q15) Loan Portfolio (3Q15) 394 Branches | $29B Deposits 43 | $2.1B 58 | $2.8B 52 | $10.3B 20 | $1.4B 31 | $2.2B 35 | $1.9B 27 | $1.8B Better Together Company Company Financial Financial Business Profile Business Profile • Headquarters: Buffalo, NY • Employees: 5,397 • Branches: 394 • Revenue (LTM) (a) : $1.4B • Assets: $39B • Loans: $23B • Deposits: $29B 4 Overview of First Niagara (a) LTM denotes last twelve months $23.4B $ in billions Commercial & Industrial ($6.0) Residential Real Estate ($6.3) Other Consumer ($2.8) Commercial Real Estate ($8.3) |
 5 Attractive Transaction Economics Better Together • $4.1 billion in aggregate consideration – First Niagara shareholders receive 0.68 Key shares and $2.30 in cash for each FNFG common share
– Implied value of $11.40 per FNFG common share, based on Key’s closing share price as of October 29
• Transaction metrics in-line with precedent transactions – P / TBV: 1.7x Core deposit premium: 6.7% P / 2016E EPS: 18.7x P / 2016E EPS (with synergies): 8.5x Key Transaction Terms Key Transaction Terms Financial Impact Financial Impact • Generates compelling financial metrics – Increases ROTCE by ~200 bps – Cash efficiency ratio improves by ~300 bps, driven by $400 million in annual cost savings
– EPS accretion of 5% – IRR approximates 15% and ROIC exceeds 10% – Tangible book value dilution of ~12% • Drives revenue synergies by deploying stronger combined product set to existing clients
• Efficient use of capital – capital ratios remain strong • Increases scale of Key by ~40% in loans; deposits; total assets (a) Upon full realization of cost savings (FY2018); no revenue synergies assumed
Financial Assumptions Financial Assumptions • Cost savings of $400 million pre-tax, or ~40% of FNFG’s current noninterest expense
• Meaningful revenue synergies identified, but not included in financial analysis
• Merger and integration costs of approximately $550 million pre-tax • Purchase accounting adjustments include ~3% loan mark and ~1.5% core deposit intangible
• Key’s existing share repurchase program suspended until closing of transaction; no change to
Key’s dividend plans, including anticipated increase to $0.085 per share in
2Q16 –
Key anticipates requesting resumption of share repurchase activity in our 2016 CCAR
submission •
Expected closing in 3Q16, subject to shareholder approval from Key and First Niagara
and customary regulatory approvals
(a) |
 Combined
Company Uniquely Positioned to Unlock Value 6
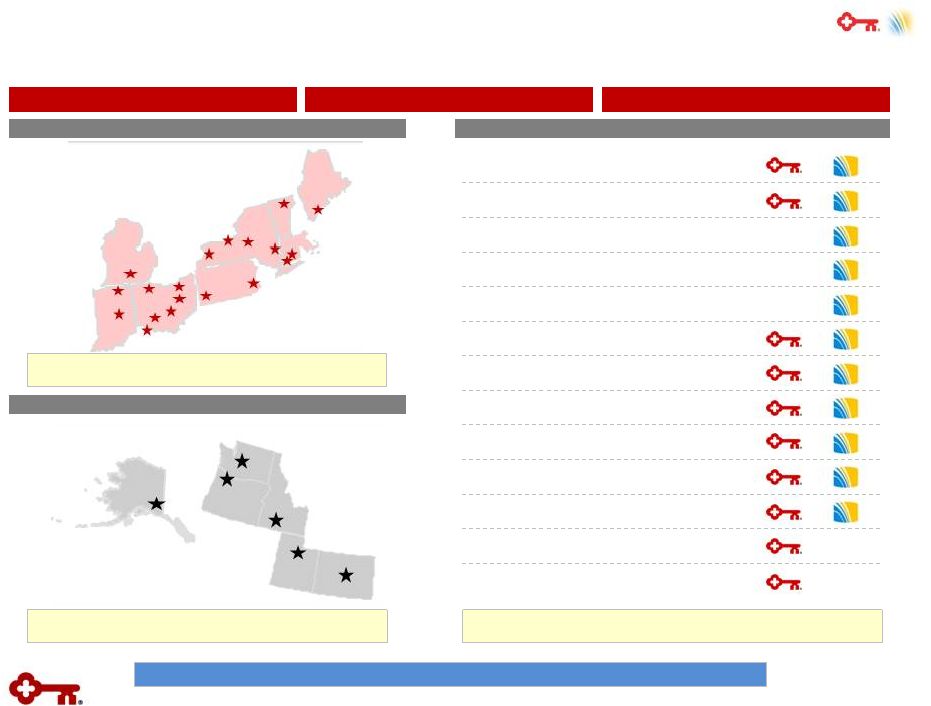
High Growth Markets High Growth Markets Three Million Clients Three Million Clients High Density Markets High Density Markets Commercial payments Retail banking (branch; card; auto; etc.) Private banking Residential mortgage Indirect auto lending Insurance brokerage Small business banking Business banking Commercial banking Asset-based lending Equipment finance Commercial mortgage banking & servicing Investment banking (mid market/industry focus) Leading market presence across the I-90 corridor from Toledo, OH to Albany, NY Top 5 branch share in Seattle, Denver, Portland, Salt Lake City and Boise – all growing faster than national average Broad, Complementary Product Capabilities Broad, Complementary Product Capabilities Complementary products provide extensive client cross-sell and revenue growth opportunities Compelling Franchise and Capabilities Attractive Geographic Footprint Attractive Geographic Footprint Complementary Product Offering Complementary Product Offering Better Together |
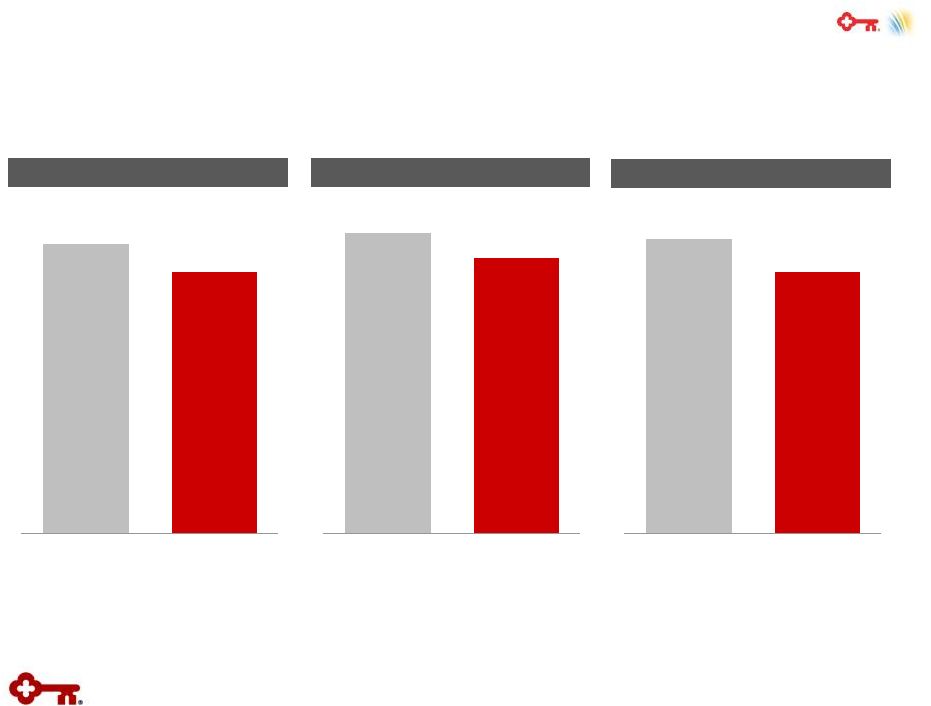
 Strengthens Position in Attractive Northeast Markets
7 Source: SNL Financial; data as of June 2015 (a) Excludes any potential deposit divestiture; all figures cap all branches at $250MM to adjust for commercial and headquarters deposits; MSA
rankings reflect total deposit rankings
(b) Northeast region defined as Connecticut, Maine, Massachusetts, New York, Pennsylvania and Vermont
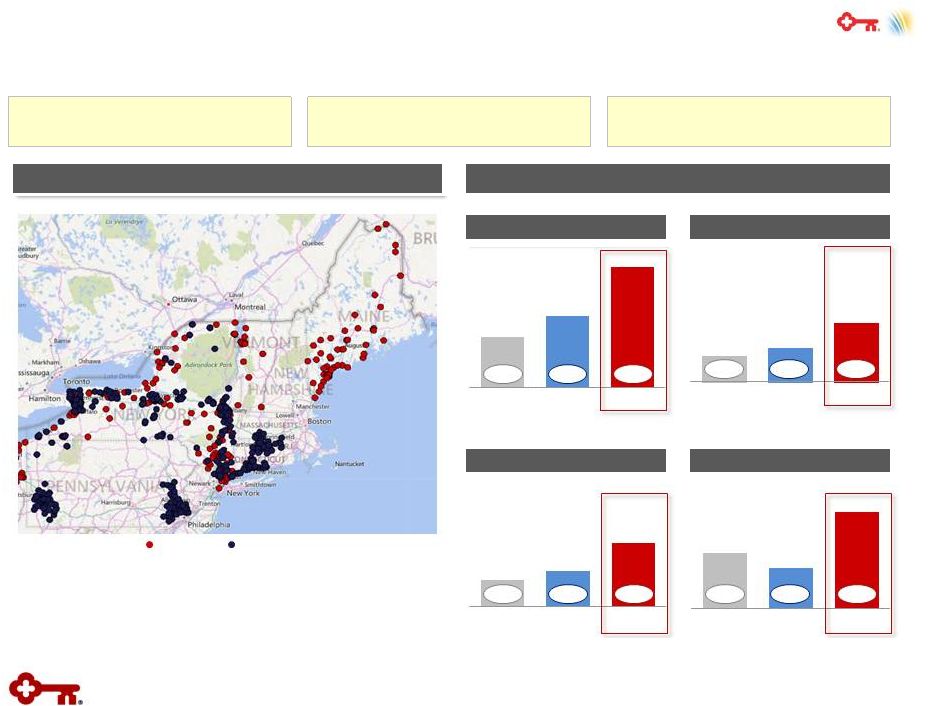
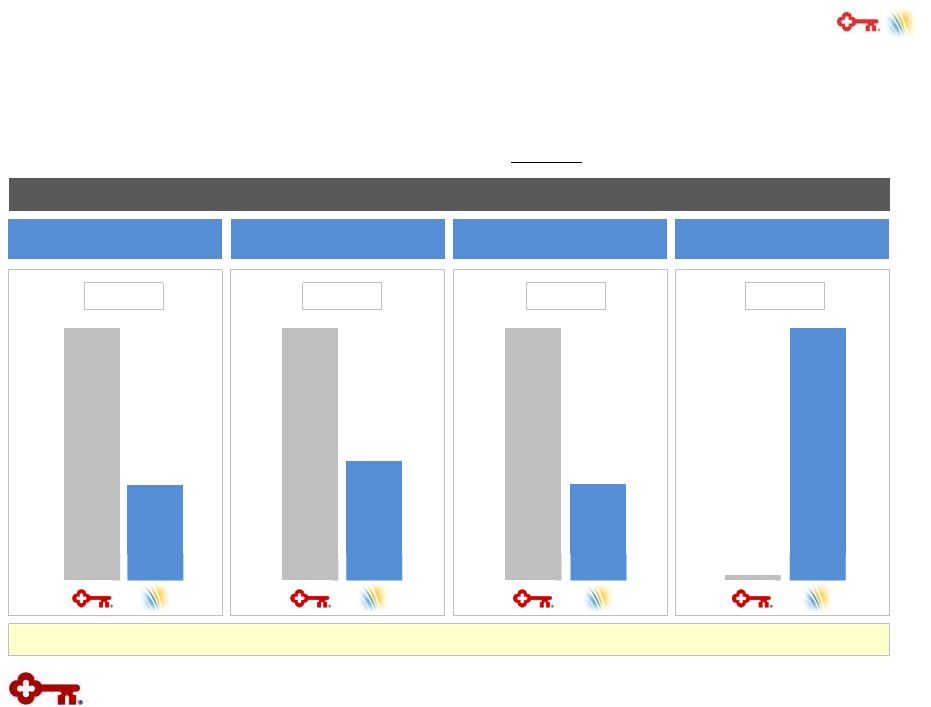
Better Together Pro Forma Branch Footprint Pro Forma Branch Footprint Leading Retail Presence in Upstate NY (a) Leading Retail Presence in Upstate NY (a) 3.3 4.7 8.0 KEY FNFG Pro Forma 1.7 2.2 3.9 KEY FNFG Pro Forma 1.1 1.4 2.5 KEY FNFG Pro Forma $ in billions Buffalo, NY Buffalo, NY Albany, NY Albany, NY Rochester, NY Rochester, NY Syracuse, NY Syracuse, NY KEY FNFG #3 #2 #1 #4 #2 #1 #6 #5 #1 #4 #6 #1 Leading Position from Toledo to Albany Leading Market Share Banks Outperform Shared Market Presence Accelerates Value Realization • Combination creates the 13 largest U.S. commercial bank • Approximately $50 billion in deposits and nearly 700 branches in the Northeast, representing approximately half of the combined national franchise (b) 1.1 0.8 1.9 KEY FNFG Pro Forma th |
 8 Enhanced Product Capabilities Drive Value Traditional Bank Products Traditional Bank Products Capital Markets Capabilities Capital Markets Capabilities Deposits & payments Loans Wealth management & private banking Equipment finance Commercial mortgage banking Derivatives & foreign exchange Equity capital markets Equity research M&A / financial sponsors / leveraged finance Investment grade & high-yield debt Loan syndications Public finance Consumer Energy
Healthcare Industrial Public Sector Real Estate
Technology Consumer
Energy Healthcare Industrial Public Sector Real
Estate Technology …as well as
deep industry expertise… Key has broad product capabilities…
4% Y-o-Y average loan
growth $39 B in AUM $70 B deposits at 15 bps #3 bank-owned equipment finance co. by new business volume (a) #3 commercial mortgage servicer (master/primary) (b) >125 M&A deals completed since 2011 106 transactions, raising $96 B YTD15 Rates, commodity & currency solutions 144 transactions, raising $ 49 B YTD15 55 transactions, raising $22 B YTD15 759 companies under coverage >140 transactions, raising $27 B YTD15 1 2 …that can be deployed against our common targeted client and prospect base (middle market businesses and their
owners)… 3 …Driving Meaningful Opportunities to Acquire and Expand Client Relationships
Note: Data as of 3Q15 unless otherwise noted
(a) Source: Monitor Bank 100; ranking based on new business volume as of FY14 (b) Source: Mortgage Bankers Association year-end 2014 rankings Better Together $10 $50 $1,500 $2,000 Commercial client revenue size ($MM) $25 $100 $250 $500 KEY Focus FNFG Focus |
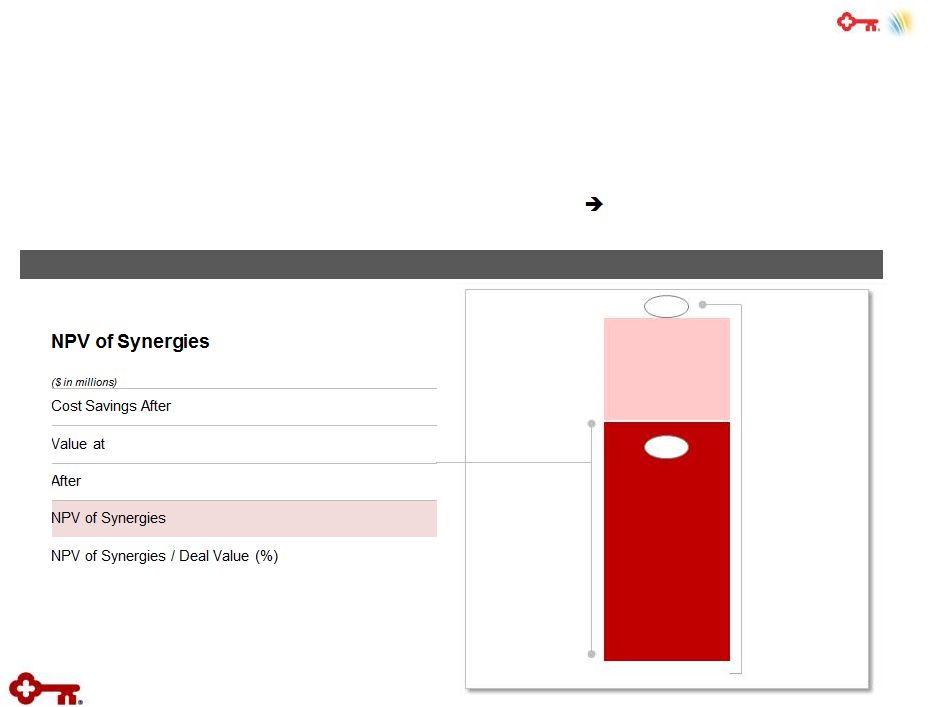 9 Significant Value Created from Cost Savings Unlocked value from cost synergies provides strong upside for shareholders • High degree of market overlap accelerates benefit realization – > 30% of FNFG branches within two miles of a Key branch • FNFG’s technology infrastructure largely outsourced Key has opportunity to efficiently scale our existing platform Summary Summary Note: Analysis assumes effective tax rate of 35% Better Together KEY / First Niagara -Tax $260 12x 3,120 -tax Restructuring Charges (358) $2,762 67% Total Deal Value Synergies ~67% $2.8B $4.1B |
 Substantial Revenue Growth Potential
Comparative Revenue Productivity (Key’s Business Bank, Middle Market &
Commercial Real Estate vs. FNFG) Comparative Revenue Productivity
(Key’s Business Bank, Middle Market & Commercial Real Estate vs. FNFG) Commercial Deposits / Loan Commitments Commercial Deposits / Loan Commitments Payments Fee Income / Loan Commitments Payments Fee Income / Loan Commitments Investment Management Fees / Consumer Household Investment Management Fees / Consumer Household Insurance Revenue / Client Insurance Revenue / Client ~3x ~2x ~3x ~50x Better Together Opportunity to drive revenue growth by delivering broader suite of products to new and
existing clients • All transaction return metrics presented herein exclude the benefit of revenue synergies
10 Complementary products provide significant potential to expand revenue across our collective client base |
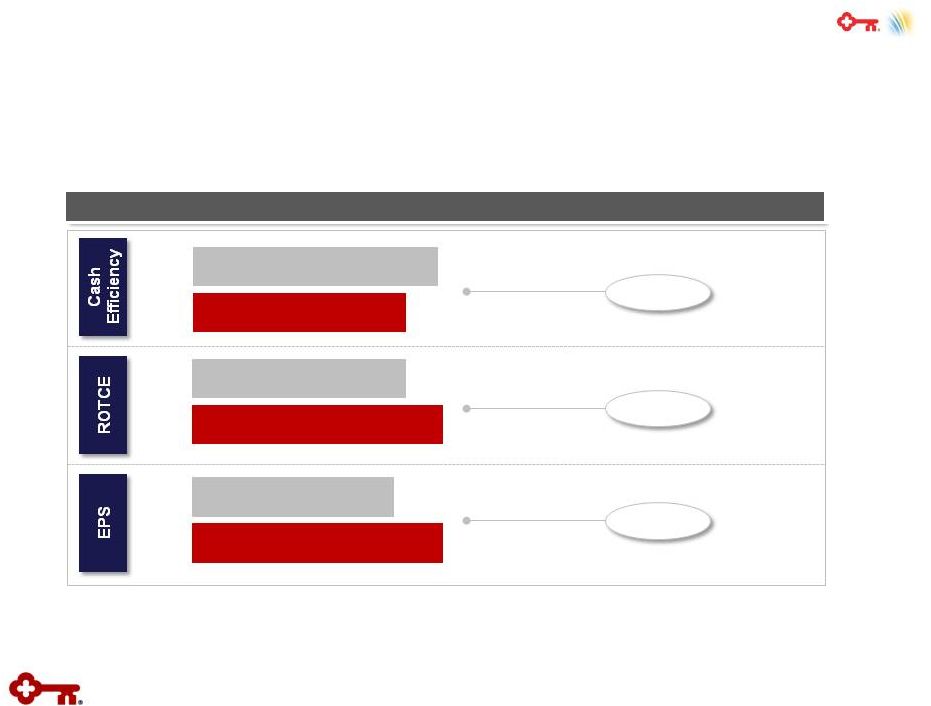 Better Together FY18 Financial Performance Metrics FY18 Financial Performance Metrics Key Pro Forma Key Pro Forma Key Pro Forma > 300 bps > 200 bps ~5% 11 Attractive Financial Impact The First Niagara acquisition generates compelling financial returns for Key • IRR approximates 15% and ROIC exceeds 10% • Meaningful improvement in efficiency and profitability metrics Note: Above figures depict consensus International Brokers’ Estimate System estimates (I/B/E/S) FY18 estimates for Key and First
Niagara, adjusted for the transaction and $400MM in annual cost
savings. No revenue synergies assumed |
 12 Strong Pro Forma Capital Position The acquisition is an efficient use of capital – Key’s capital ratios remain strong • Key is well-positioned for 2016 CCAR submission and additional capital actions
CET1 Ratio (%) (a)(b)(c) CET1 Ratio (%) (a)(b)(c) Tier 1 Ratio (%) (a)(b) Tier 1 Ratio (%) (a)(b) Leverage Ratio (%) (a)(b) Leverage Ratio (%) (a)(b) 10.5 ~9.5 KEY Current Pro Forma Est. at Close 10.9 ~10.0 KEY Current Pro Forma Est. at Close 10.7 ~9.5 KEY Current Pro Forma Est. at Close Better Together (a) Non-GAAP measure
(b) 9-30-15 ratio is estimated
(c) The final Basel III capital framework rules, effective January 1, 2015 for Key, introduced a new capital measure, “Common Equity Tier
1” (CET1) |
 Disciplined Diligence and Integration Approach
Thorough Due Diligence Process Thorough Due Diligence Process • -Comprehensive, executive-led due diligence process involving more than 300 employees of
both Key and First Niagara
• -Organized teams across focus diligence areas led by senior leaders with support from
functional experts and external advisors
• --Extensive credit diligence, including thorough loan file review – Reviewed loans to more than 1,100 borrowers representing ~50% of First Niagara’s total
commitments – Balanced review of commercial and consumer loan portfolios, including top credit relationships
and all substandard loans > $250k
• Holistic risk assessment across all major risk categories, including compliance and legal;
operational; model; market; credit; rate; and strategic risks
Disciplined Integration
Approach Disciplined Integration Approach • Key has the management resources and infrastructure to acquire and integrate First Niagara
seamlessly into our Company
• Familiarity with First Niagara’s businesses and markets will accelerate Key’s ability to
integrate successfully
• Key’s technology and operations infrastructure is scalable and can efficiently leverage the
incremental volume and activity generated by the transaction
• Core integration leadership team has significant prior M&A integration experience
– Integration team will be led by Chris Gorman, President of Key Corporate Bank, and staffed with
representatives from both Key and First Niagara
Better Together 13 |
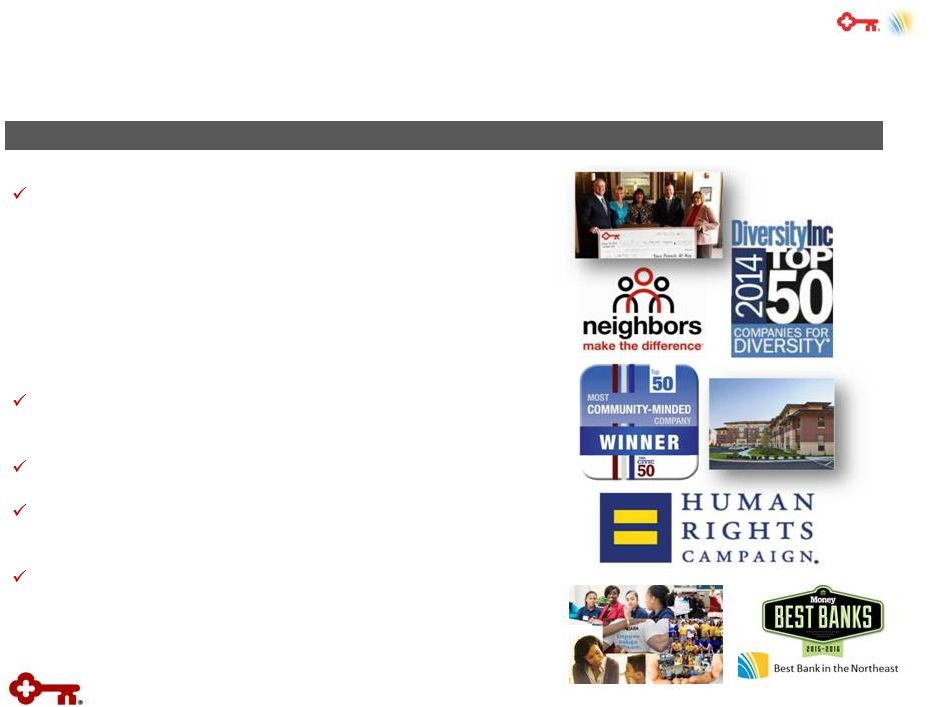 14 Our Mission: Helping Clients and Communities Thrive Strong commitment to our communities Key and FNFG have award winning cultures of philanthropy, community development and civic service – $30 million dollars given annually to nonprofit organizations – Nearly $5 billion combined in lending and investments supporting underserved individuals and communities – Over 500,000 employee volunteer hours in the past three years One of America’s Most Community-minded Companies (The Civic 50) Diversity Inc. “Top 50” company 7x winner: “One of the Best Places to Work” (Corporate Equality Index, Human Rights Campaign) FNFG selected as “Best Bank in the Northeast” by Money
magazine Corporate Responsibility is Important to the Communities That We So Proudly Serve
Corporate Responsibility is Important to the Communities That We So Proudly
Serve Better
Together |
 15 Shelby_Sales-Presentation_150928_v5.pptx\28 SEP 2015\6:59 PM\11 A Compelling Strategic Opportunity Better Together Strengthens Franchise Strengthens Franchise Leverages Complementary Business Models Leverages Complementary Business Models Generates Attractive Financial Returns Generates Attractive Financial Returns Powerful combination creates high-performing regional bank with compelling shareholder returns
Better Together
|
| Appendix Better Together |
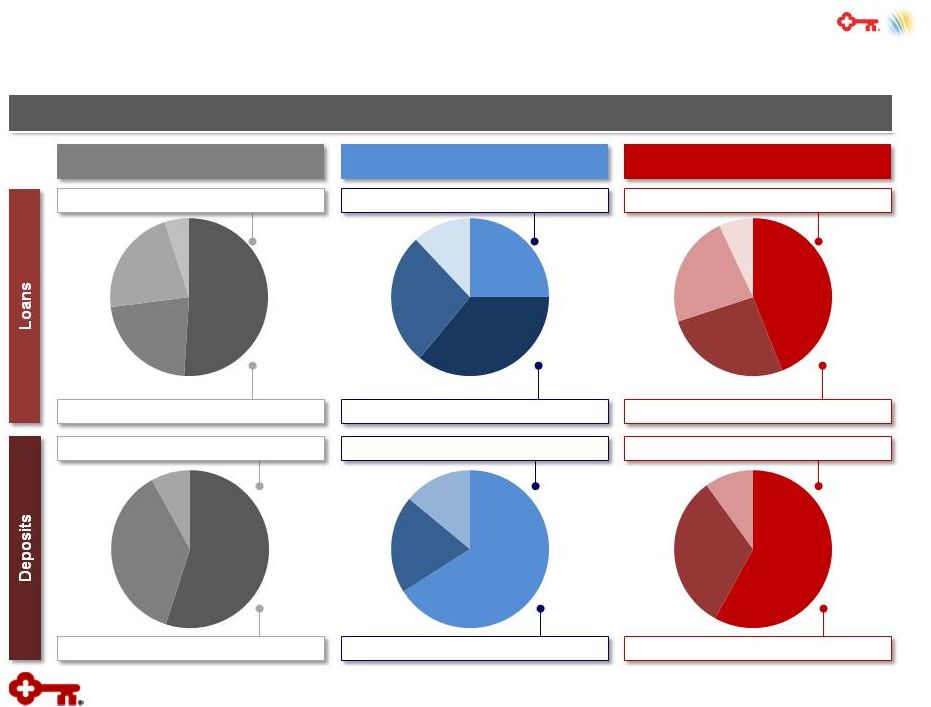 CRE
22% Cost of Deposits = 0.18%
Cost of Deposits = 0.18%
Cost of Deposits = 0.24%
Cost of Deposits = 0.24%
Cost of Deposits = 0.15%
Cost of Deposits = 0.15%
Pro Forma Loan and Deposit Summary
17 Source: KEY & FNFG 3Q earnings releases Summary (3Q15) Summary (3Q15) Key First Niagara Pro Forma Total Average Loans = $23.4 B Total Average Loans = $82.7 B C&I 51% Residential Real Estate 22% Other Consumer 5% CRE 36% C&I 25% Residential Real Estate 27% Other Consumer 12% C&I 44% CRE 26% Residential Real Estate 23% Other Consumer 7% Commercial = 73% Consumer = 27% Commercial = 61% Consumer = 39% Commercial = 70% Consumer = 30% Yield on Loans = 3.7% Yield on Loans = 3.6% Yield on Loans = 3.7% Better Together Total Average Deposits = $70.5 B Total Average Deposits = $28.6 B Total Average Deposits = $99.1 B Noninterest- Bearing 37% Checking/ Savings/ MMDA 55% CDs 8% Noninterest- Bearing 20% CDs 14% CDs 10% Checking/ Savings/ MMDA 66% Checking/ Savings/ MMDA 58% Noninterest- Bearing 32% Total Average Loans = $59.3 B Non-Time = 92% Time = 8% Non-Time = 86% Time = 14% Non-Time = 90% Time = 10% |
 IMPORTANT
ADDITIONAL INFORMATION AND WHERE TO FIND IT
In connection with the proposed merger, KeyCorp will file with the SEC a Registration Statement on Form S-4 that will include the Joint Proxy Statement of KeyCorp and First Niagara and a Prospectus of KeyCorp, as well as other relevant documents concerning the proposed transaction. This communication does not constitute an offer to sell or the solicitation of an offer to buy any securities or a solicitation of any vote or approval. INVESTORS AND SHAREHOLDERS ARE URGED TO READ THE REGISTRATION STATEMENT AND THE JOINT PROXY STATEMENT/PROSPECTUS REGARDING THE MERGER WHEN IT BECOMES AVAILABLE AND ANY OTHER RELEVANT DOCUMENTS FILED WITH THE SEC, AS WELL AS ANY AMENDMENTS OR SUPPLEMENTS TO THOSE DOCUMENTS, BECAUSE THEY WILL CONTAIN IMPORTANT INFORMATION. A free copy of the Joint Proxy Statement/Prospectus, as well as other filings containing information about KeyCorp and First Niagara, may be obtained at the SEC’s Internet site (http://www.sec.gov). You will also be able to obtain these documents, free of charge, from KeyCorp at investor.key.com or from First Niagara by accessing First Niagara’s website at www.firstniagara.com. Copies of the Joint Proxy Statement/Prospectus can also be obtained, free of charge, by directing a request to KeyCorp Investor Relations at Investor Relations, KeyCorp, 127 Public Square, Mailcode OH-01-27-0737, Cleveland, Ohio 44114-1306, by calling (216) 689-3000, or by sending an e-mail to investor_relations@keybank.com or to First Niagara Investor Relations at 726 Exchange Street, Suite 618, Buffalo, New York 14210, by calling (716) 819-5669 or by sending an e-mail to investor@fnfg.com. In addition, KeyCorp and First Niagara use their respective Investor Relations websites and social media outlets as channels of distribution of material company information. Such information is accessible on KeyCorp’s and First Niagara’s Investor Relations websites, as well as on their respective Facebook pages and through their Twitter accounts and LinkedIn accounts. KeyCorp and First Niagara and certain of their respective directors and executive officers may be deemed to be participants in the solicitation of proxies from the respective shareholders of KeyCorp and First Niagara in respect of the transaction described in the Joint Proxy Statement/Prospectus. Information regarding KeyCorp’s directors and executive officers is contained in KeyCorp’s Proxy Statement on Schedule 14A, dated April 7, 2015, which is filed with the SEC. Information regarding First Niagara’s directors and executive officers is contained in First Niagara’s Proxy Statement on Schedule 14A, dated March 23, 2015, which is filed with the SEC. Additional information regarding the interests of those participants and other persons who may be deemed participants in the transaction may be obtained by reading the Joint Proxy Statement/Prospectus regarding the proposed merger when it becomes available. Free copies of this document may be obtained as described in the preceding paragraph. 18 Better Together |