Attached files
| file | filename |
|---|---|
| EX-99.2 - EX-99.2 - SANFILIPPO JOHN B & SON INC | d58663dex992.htm |
| 8-K - FORM 8-K - SANFILIPPO JOHN B & SON INC | d58663d8k.htm |
 FY 2015
Annual Stockholder Meeting
October 28, 2015 1 Exhibit 99.1 |
 Some
of the statements in this presentation and any statements by management
constitute “forward-looking statements” about John B. Sanfilippo &
Son, Inc. Such statements include, in particular, statements about our
plans, strategies, business prospects, changes and trends in our
business and the markets in which we operate. In some cases, you can
identify forward-looking statements by the use of words such as
“may,” “will,” “could,” “would,”
“should,” “expect,” “plan,” “anticipate,” “intend,” “believe,” “estimate,” “forecast,” “predict,” “propose,” “potential” or “continue” or the
negative of those terms or other comparable terminology. These
statements represent our present expectations or beliefs concerning
future events and are not guarantees. Such statements speak only as of
the date they are made, and we do not undertake any obligation to update
any forward-looking statement. We caution that forward-looking
statements are qualified by important factors, risks and uncertainties
that could cause actual results to differ materially from those in the forward- looking statements. Our periodic reports filed with the Securities and Exchange
Commission, including our Forms 10-K and 10-Q and any amendments thereto,
describe some of these factors, risks and uncertainties.
Forward-Looking Statements
2 |
 • JBSS Overview and Strategic Goals - Jeffrey Sanfilippo Chairman & CEO • FY 2015 Financial Milestones - Mike Valentine CFO & Group President • Brand Marketing Overview- Howard Brandeisky Sr. VP Global Marketing & Customer Solutions • Capital Expenditures Overview - Jasper Sanfilippo Jr. COO & President • Closing Remarks - Jeffrey Sanfilippo Chairman & CEO Agenda 3 |
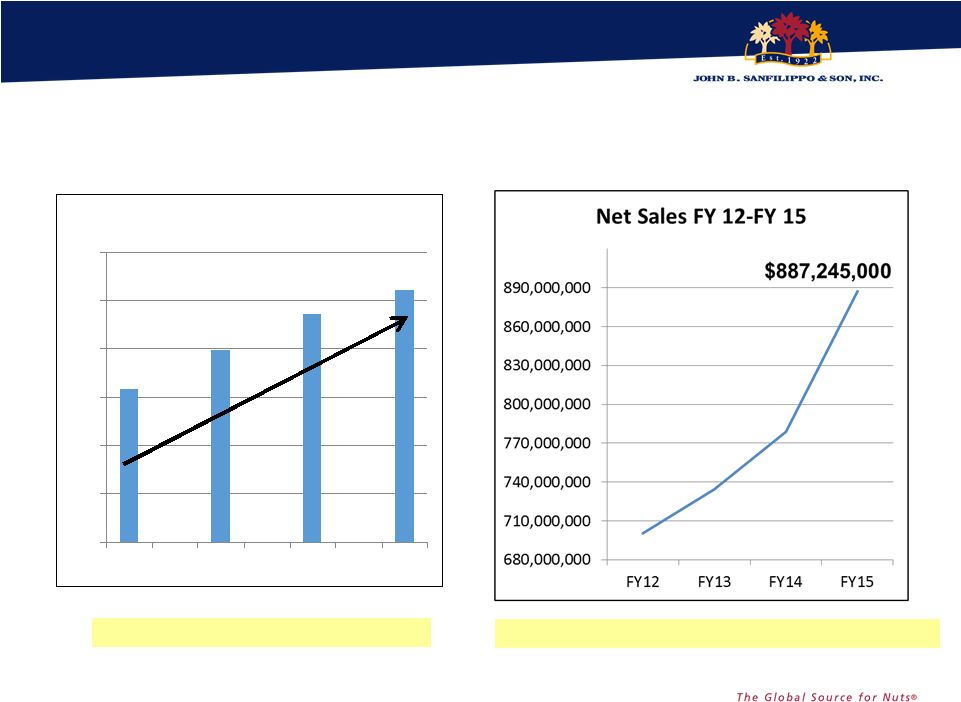 Consistent success over past 4 fiscal years
Diluted EPS improvement of 65%
4 0 0.5 1 1.5 2 2.5 3 FY12 FY13 FY14 FY15 Diluted EPS FY 12-FY 15 Net Sales increased by 27% to a record $887.2 million $ $ |
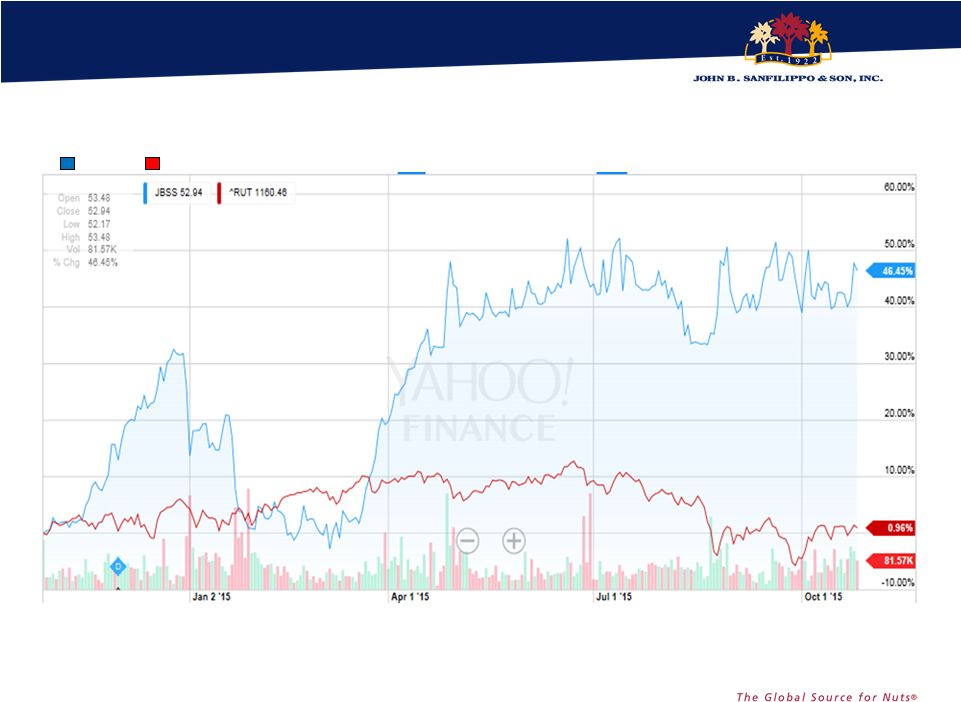 Continuing to Create Shareholder Value
5 Stock Price $32.00 10/24/2014 Stock Price $52.94 10/26/2015 Outperformed the Russell 2000 Index by over 45%! JBSS Russell 2000 |
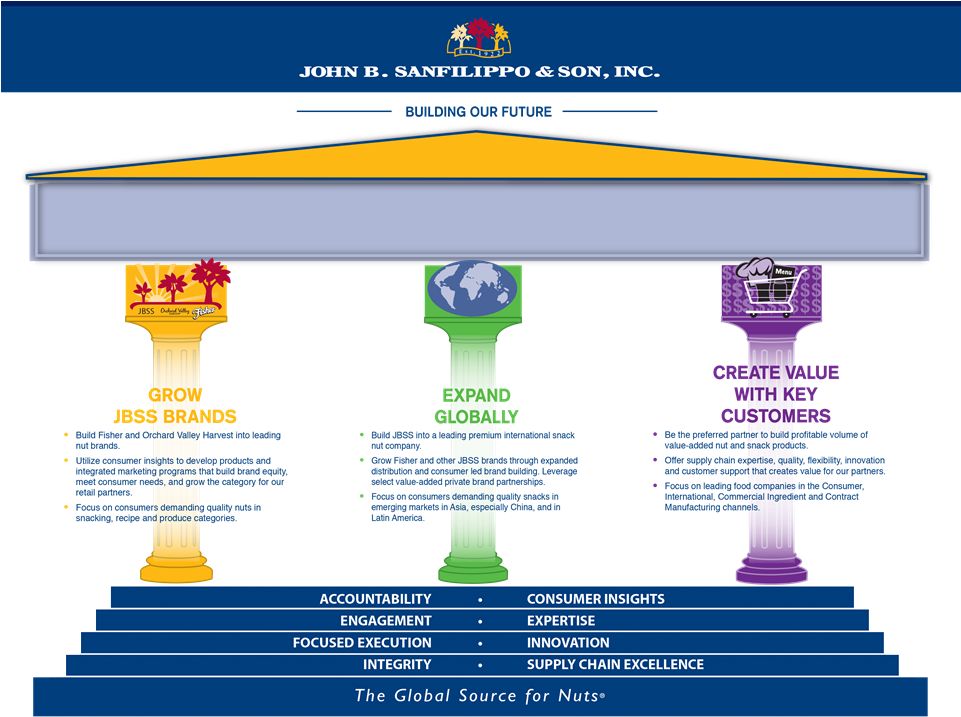
 Vision To be the global source for nuts, committed to quality, expertise and innovation that delivers an unmatched experience to our customer and consumer Core Values Integrity People Investment Customer Driven Quality Innovation Execution Continuous Improvement Safety Resource Conservation 6 |
 FY 2015 Strategy Update
7 |
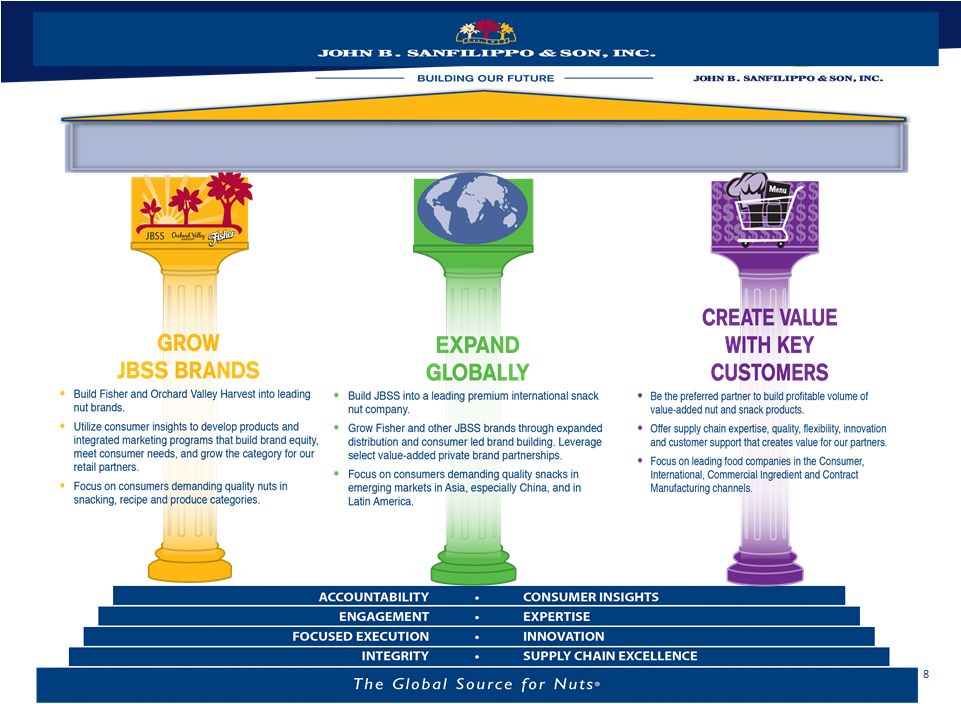 8 |
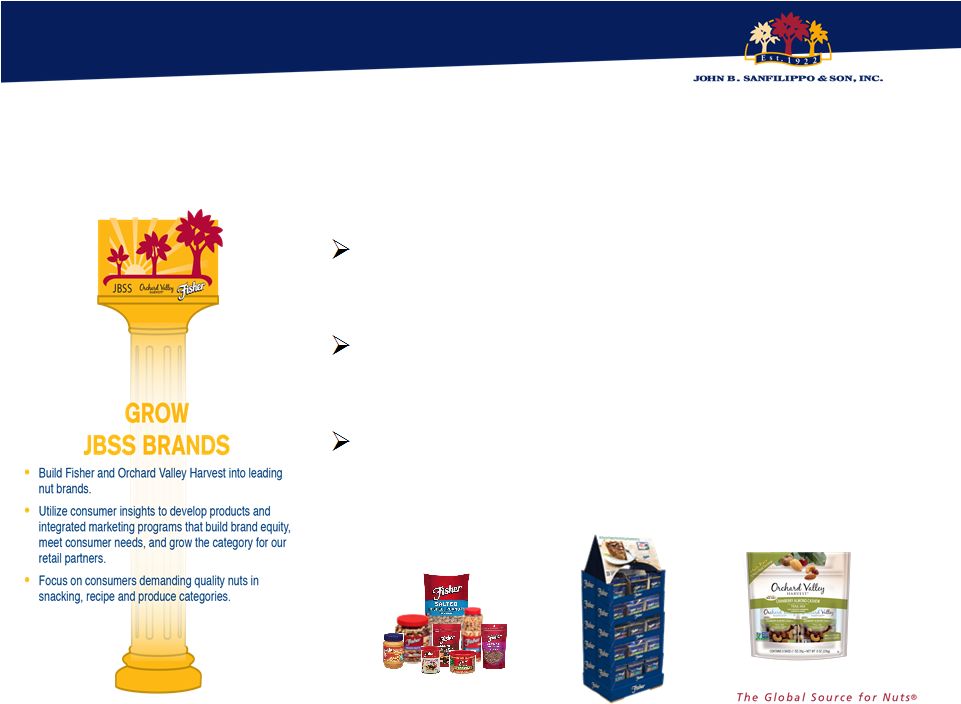 Fisher
recipe nuts grew market share +2.2 points*
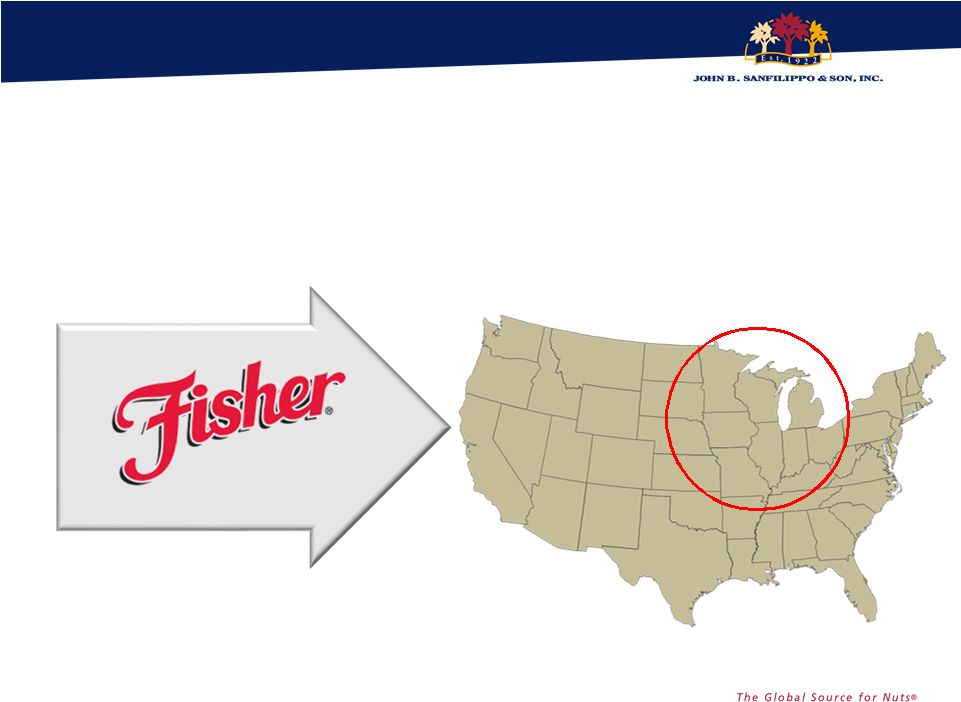
Fisher snack nuts market share growth in
high franchise Midwest.
Orchard Valley Harvest expanded distribution
and increased velocity resulting in double-
digit revenue growth over FY 2014.
FY 2015 Accomplishments
9 *Source: IRI: Total Nut Category – Multi Outlet Geography Fiscal Year Ending 6/28/15 |
 Launched Fisher Flagship Store on
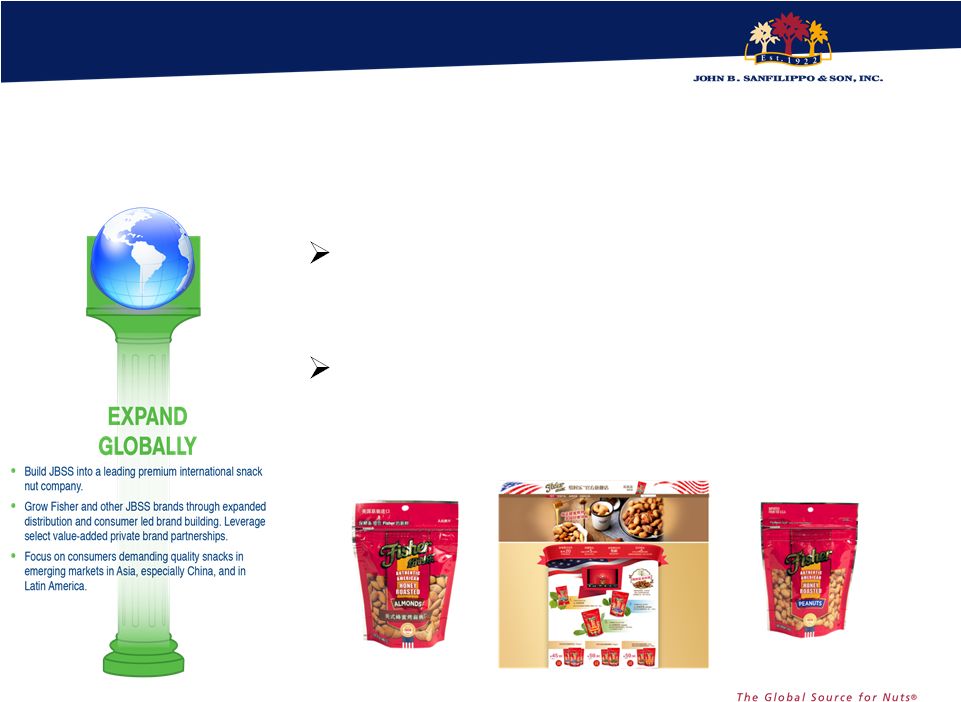
Tmall in China. Developed a Fisher stand-up bag product line for China. 10 FY 2015 Accomplishments |
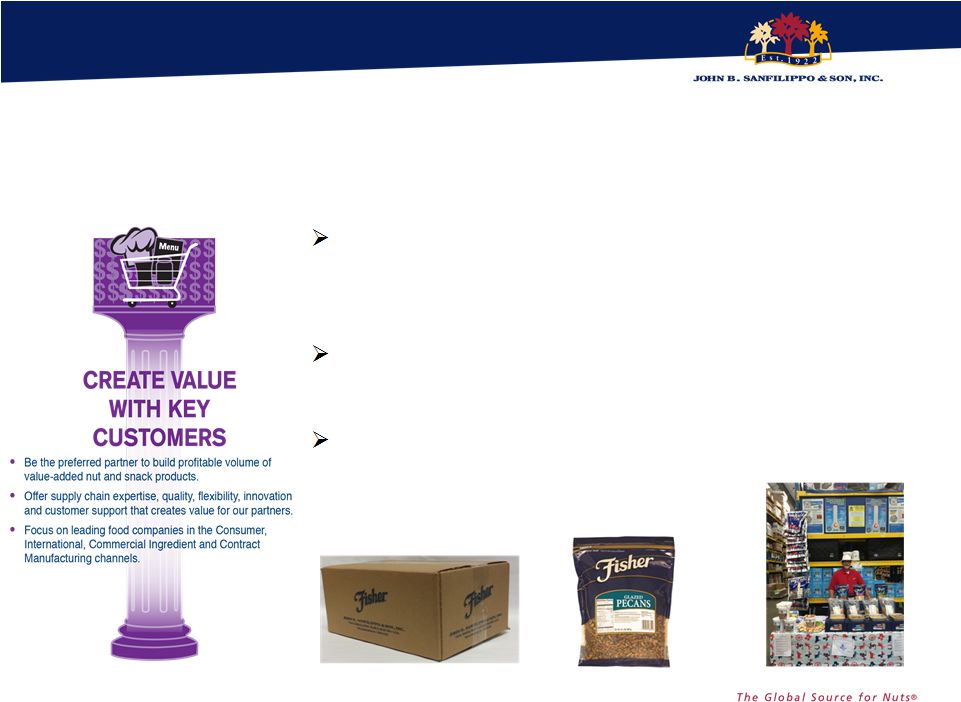 11 Leveraged our innovation capabilities to launch 15 new items for our key contract manufacturing customers. Optimized Food Service and Industrial Ingredient customer and product portfolios. Expanded Fisher brand awareness in the Commercial Ingredients channel. FY 2015 Accomplishments |
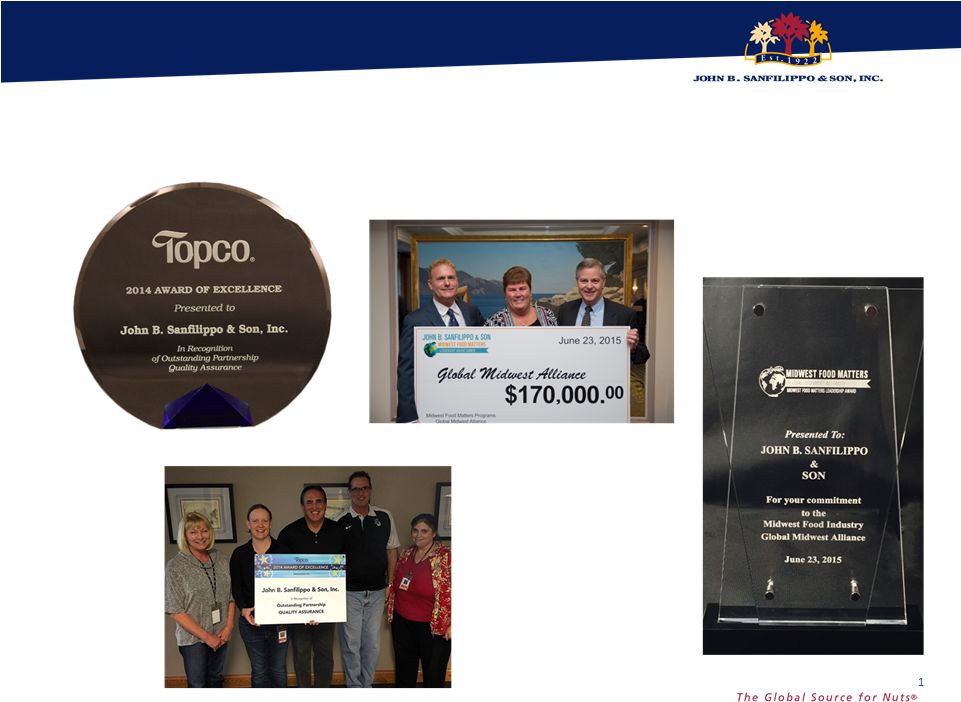 Awards
& Recognitions 12 |
 13 Nut Category Review |
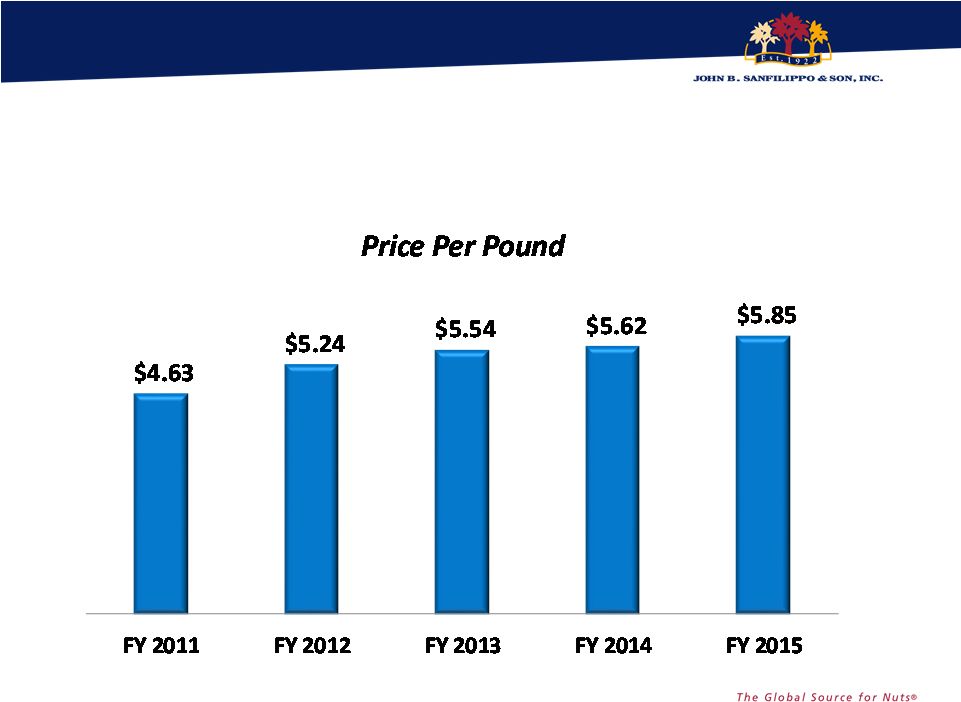 Steady
Increase in Retail Prices Over the Last 5 Years
Source: IRI: Total Nut Category – Multi Outlet Geography Time Periods: to FY 11 Year Ending 7/3/11 to FY 15 Year Ending 6/28/15 14 +26% Since FY 2011 |
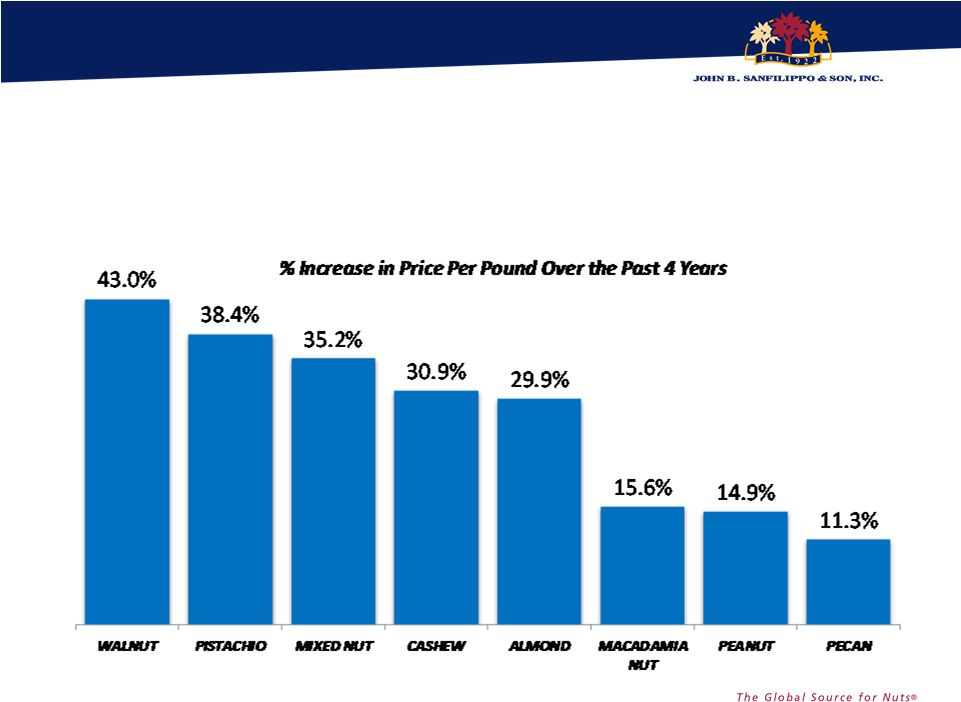 Retail
Prices Up Across Most Major Nut Types over the Last 4 Years
Source: IRI: Total Nut Category –
Multi Outlet Geography –
From FY 15 Year Ending 6/28/15 versus FY 11 Ending 7/3/11
15 |
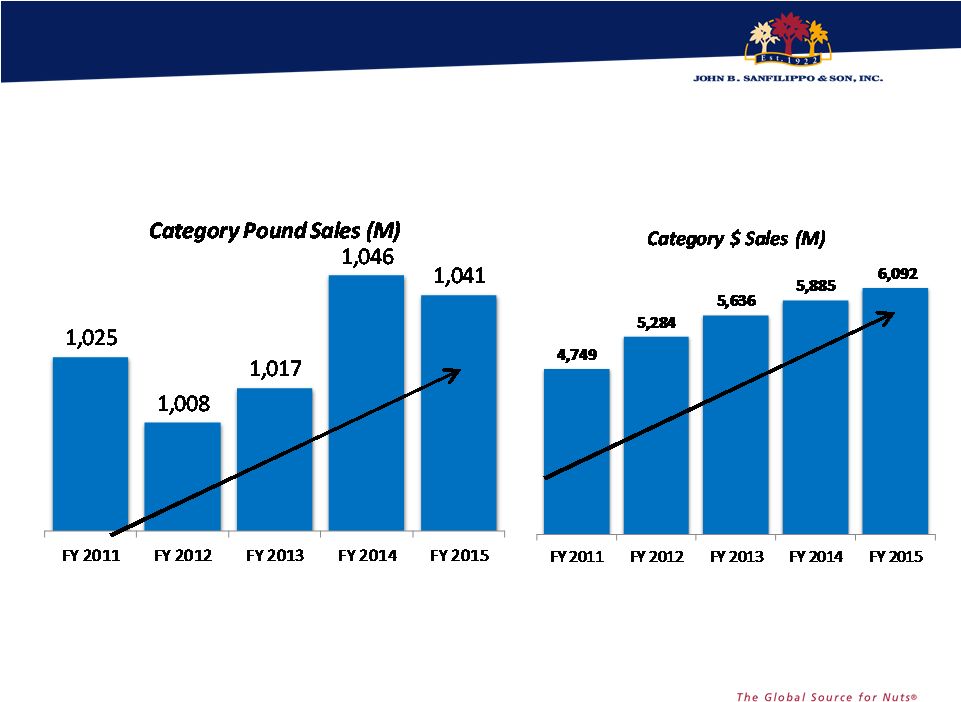 Steady
Category Growth 16
Source: IRI: Total Nut Category – Multi Outlet Geography Time Periods: to FY 11 Year Ending 7/3/11 to FY 15 Year Ending 6/28/15 |
 JBSS
Sales Channel Updates
17 |
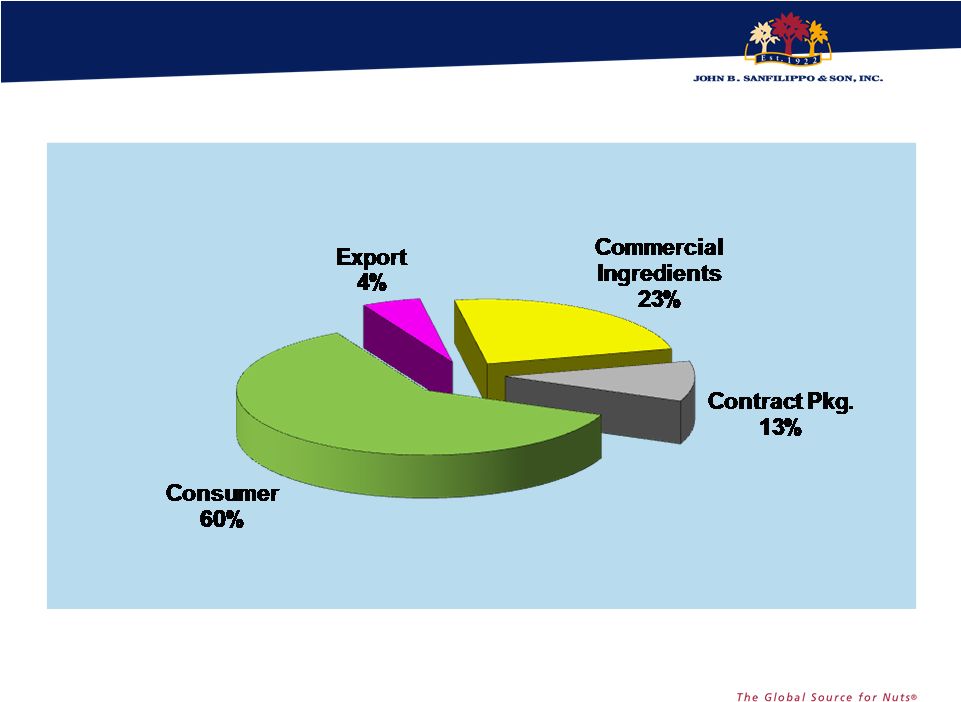 $529 Fiscal 2015 Net Sales $887 Million Business Channel Diversification (Millions of $) 18 $36 $207 $115 |
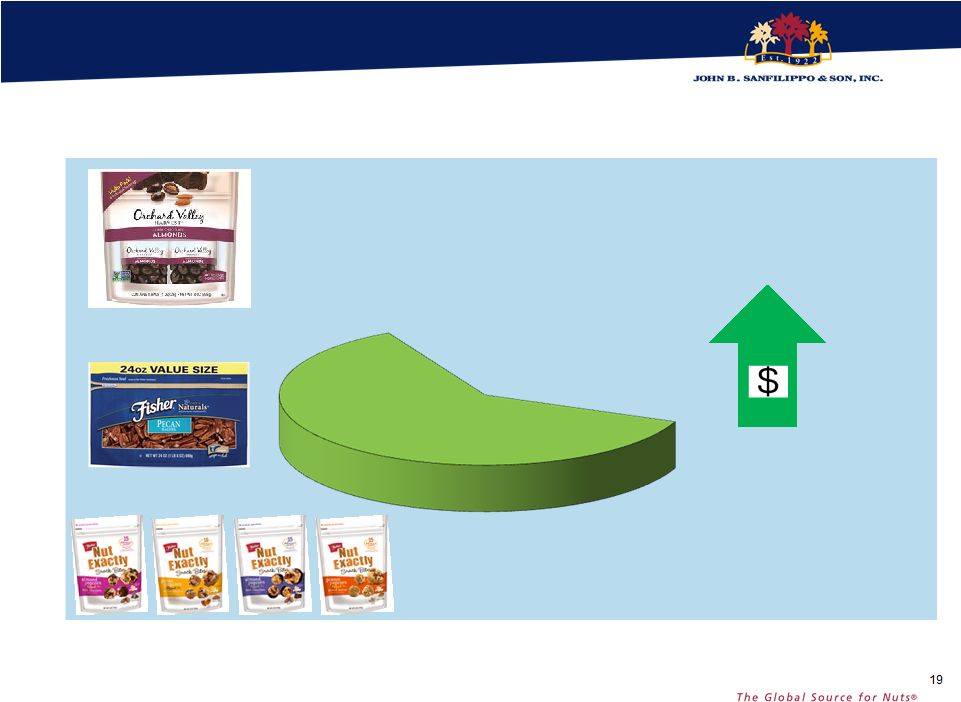 19 Fiscal 2015 Net Sales $529 Million Consumer 60% vs. FY ‘14 FY 2015 Consumer Channel 16.7% |
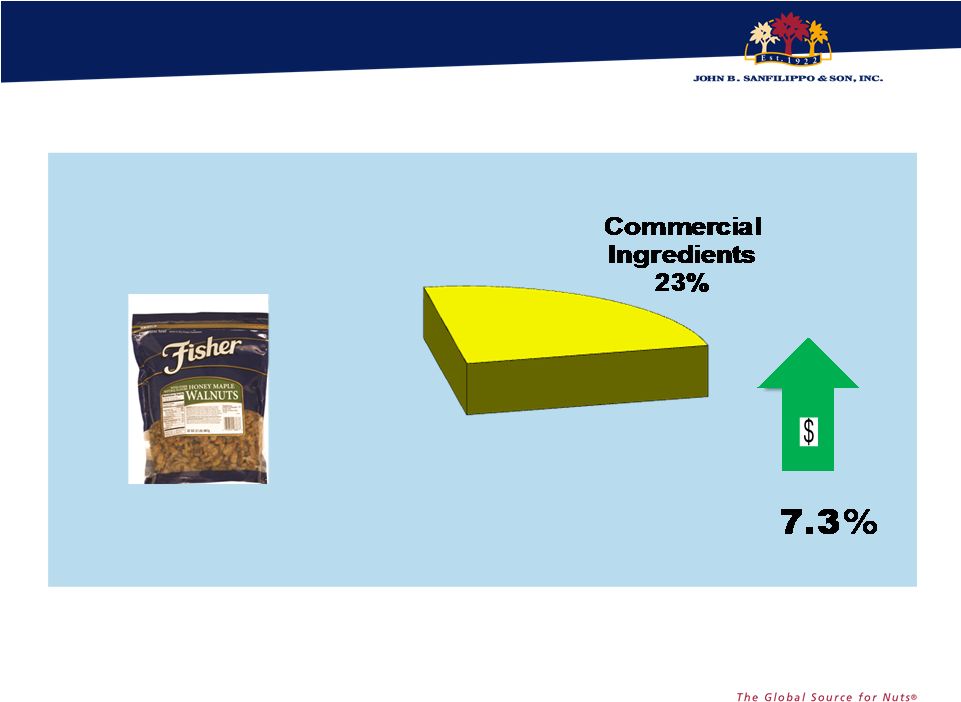 Fiscal 2015 Net Sales $207 Million FY 2015 Commercial Ingredients Channel vs. FY ‘14 20 |
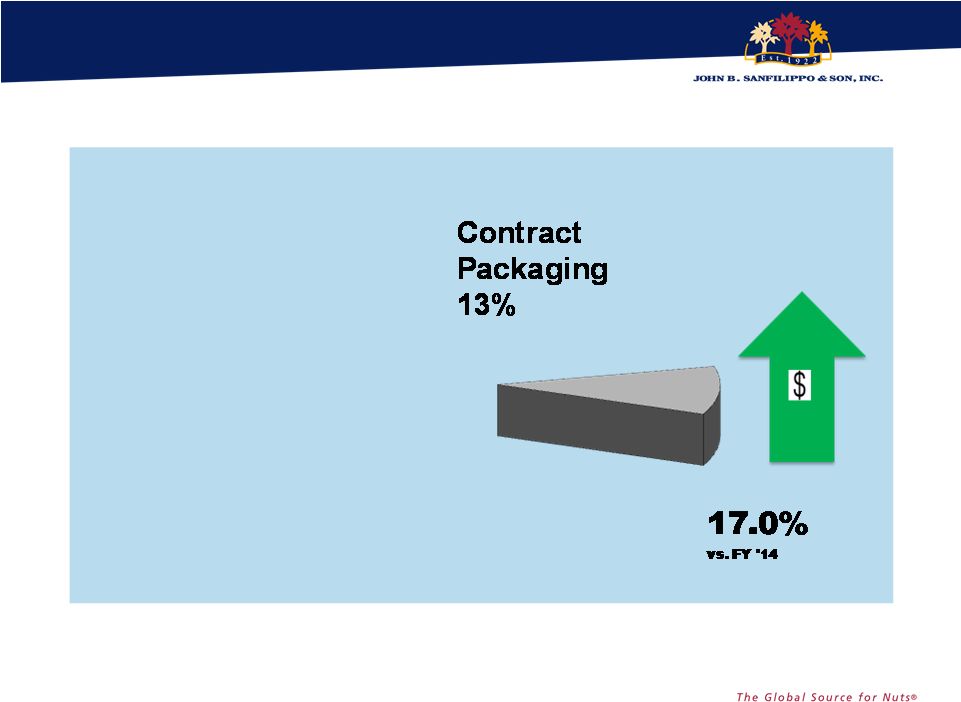 FY 2015
Contract Packaging Channel Fiscal 2015 Net Sales $115
Million 21 |
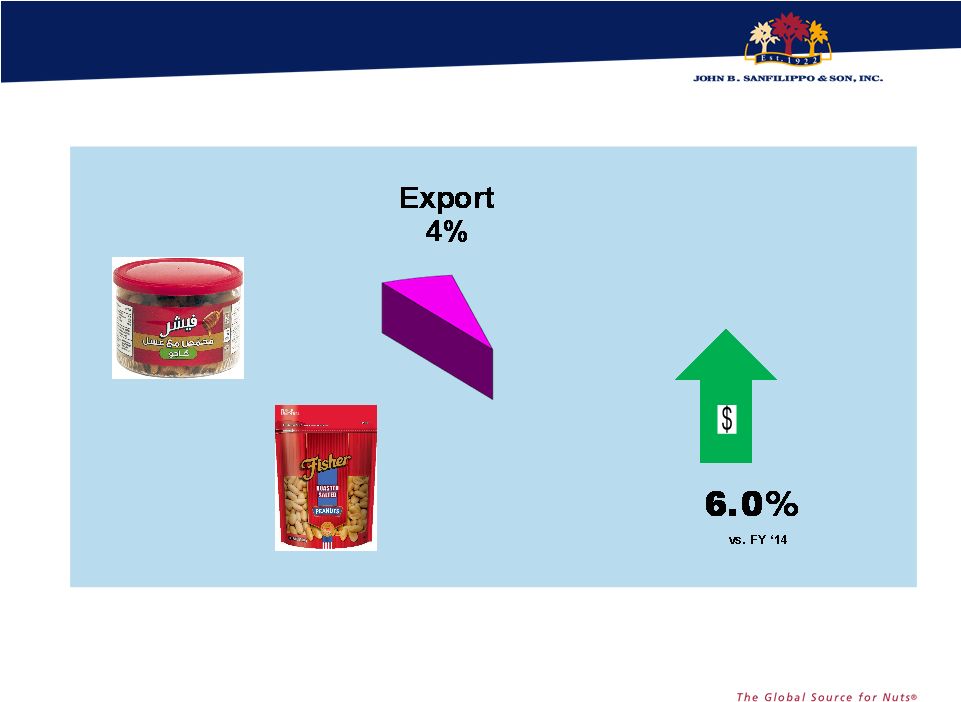 FY 2015
Export Channel Fiscal 2015 Net Sales $36
Million 22 |
 FY 2015
Financial Milestones
23 |
 JBSS
Stockholders’ Equity FYs 1991- 2015
24 In millions of $ |
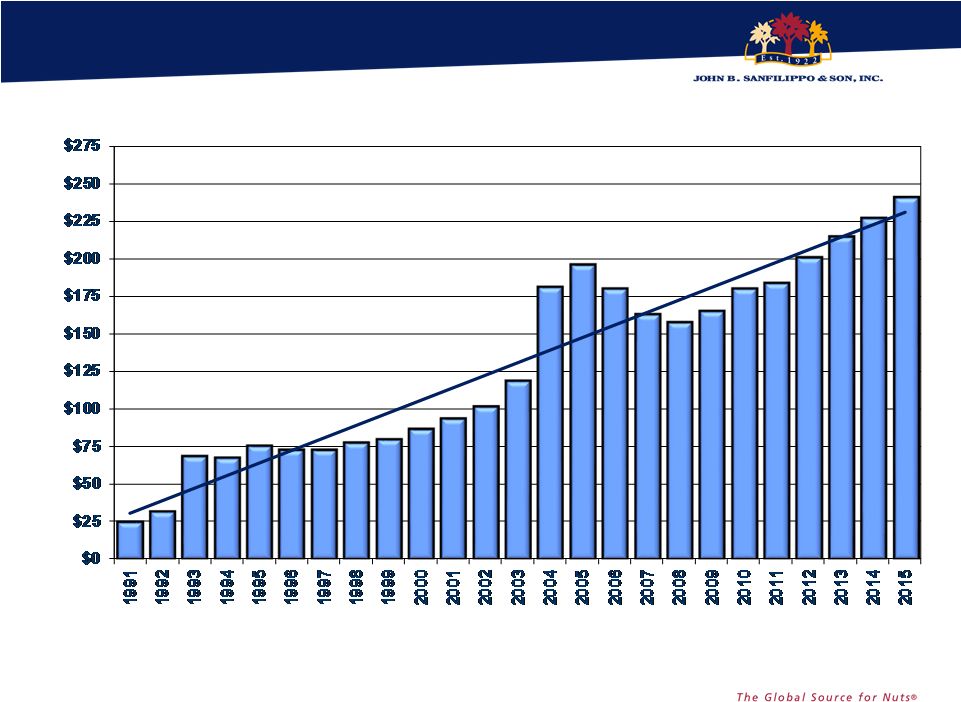
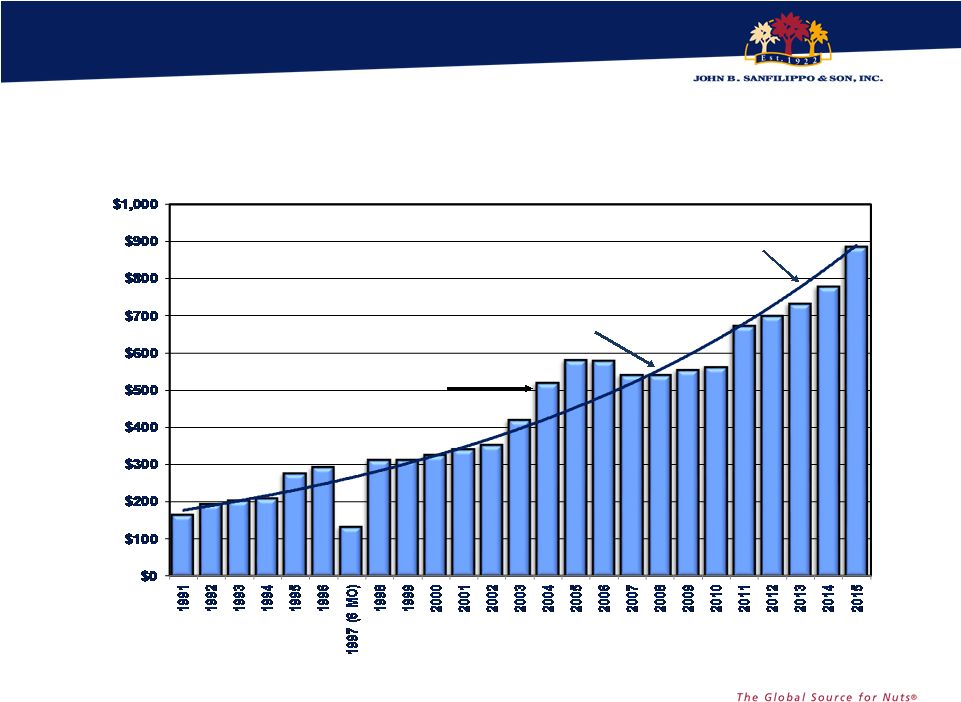 JBSS Net Sales FYs 1991- 2015 25 Increased pound volume and prices SKU Rat., De- emphasized Industrial Sales, Lower Prices Low Carb Diet Run Up $887 In millions of $ |
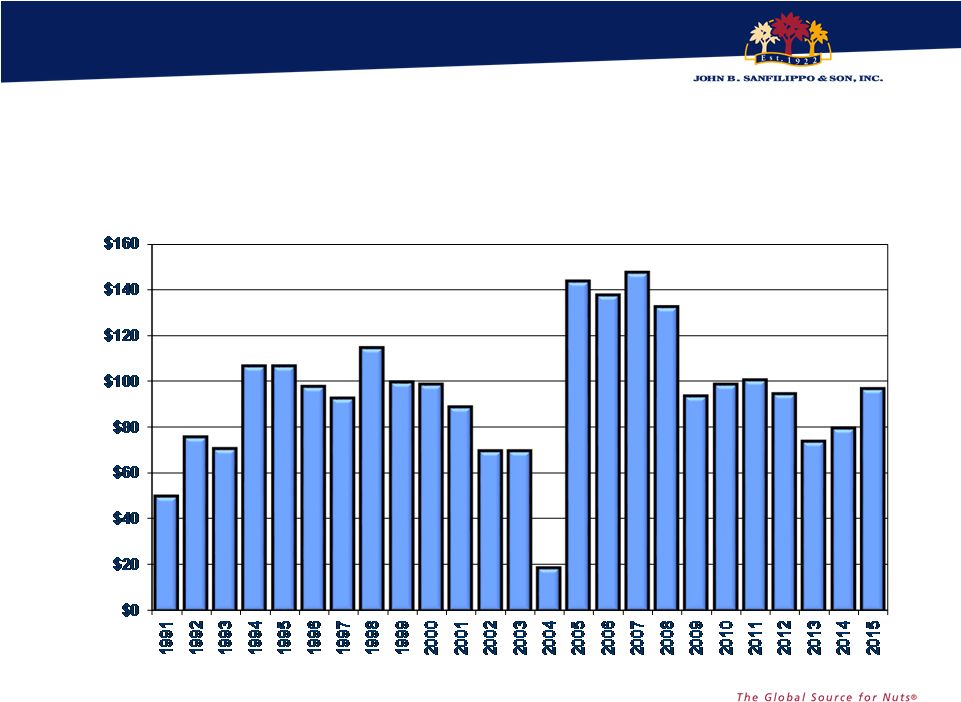 JBSS Total Outstanding Debt FYs 1991- 2015 26 In millions of $ |
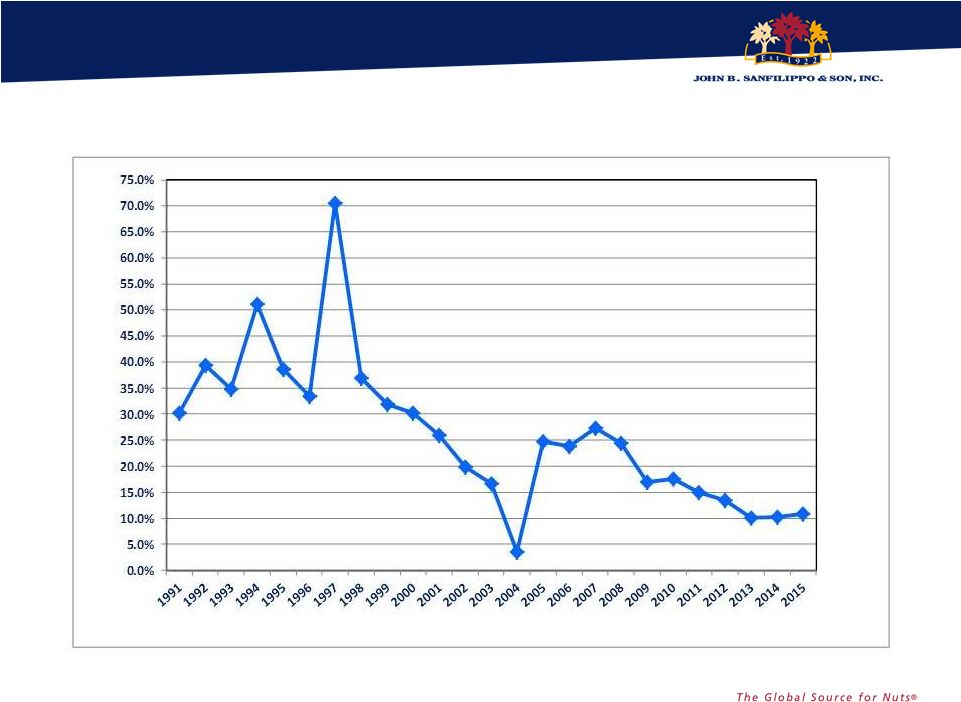 JBSS
Total Outstanding Debt As % of Net Sales FYs 1991 –
2015 27 |
 EBITDA EBITDA consists of earnings before interest, taxes, depreciation, amortization and noncontrolling interest. EBITDA is not a measurement of financial performance under accounting principles generally accepted in the United States of America ("GAAP"), and does not represent cash flow from operations. EBITDA is presented solely as a supplemental disclosure because management believes that it is important in evaluating JBSS's financial performance and market valuation. In conformity with Regulation G, a reconciliation of EBITDA to the most directly comparable financial measures calculated and presented in accordance with GAAP is presented in the following slide. 28 |
 Reconciliation of Net Income (Loss) to EBITDA
(In $,000's) FY2005 FY2006 FY2007 FY2008 FY2009 FY2010 FY2011 FY2012 FY2013 FY2014 FY2015 NET INCOME (LOSS) 14,499 (16,721) (13,577) (5,957) 6,917 14,425 2,835 17,122 21,760 26,287 29,305 INTEREST EXPENSE 3,998 6,516 9,347 10,502 7,646 5,653 6,444 5,364 4,754 4,354 3,966 INCOME TAX (BENEFIT) EXPENSE 9,269 (8,689) (7,520) (897) (259) 8,447 (49) 9,099 13,536 13,545 15,559 DEPRECIATION/ AMORTIZATION 10,501 10,000 13,584 15,742 15,922 15,825 16,968 17,117 16,717 16,278 16,284 EBITDA 38,267 (8,894) 1,834 19,390 30,226 44,350 26,198 48,702 56,767 60,464 65,114 NET SALES 581,729 579,564 540,858 541,771 553,846 561,633 674,212 700,575 734,334 778,622 887,245 EBITDA MARGIN (% OF NET SALES) 6.6% -1.5% 0.3% 3.6% 5.5% 7.9% 3.9% 7.0% 7.7% 7.8% 7.3% POUNDS SOLD (000’s) 278,741 248,137 246,142 221,958 217,465 224,302 232,746 212,553 221,762 240,417 253,514 EBITDA PER POUND SOLD 0.137 (0.036) 0.007 0.087 0.139 0.198 0.113 0.229 0.256 0.252 0.257 29 |
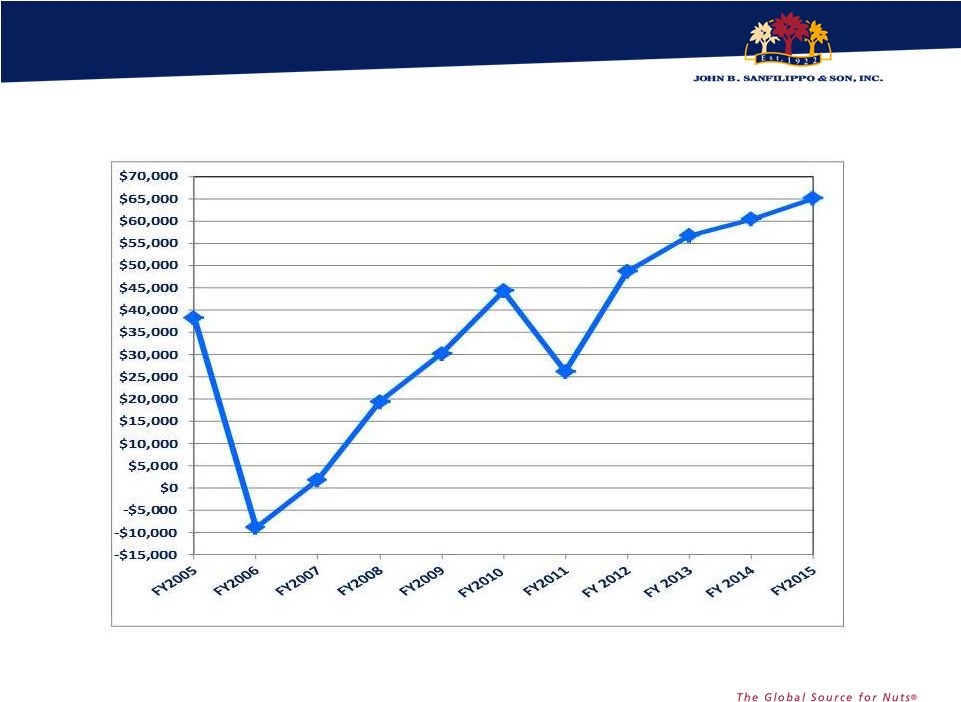 EBITDA* * EBITDA is a non-GAAP measure. See slide entitled “Reconciliation of Net (Loss) Income to EBITDA” for reconciliation to GAAP measure 30 |
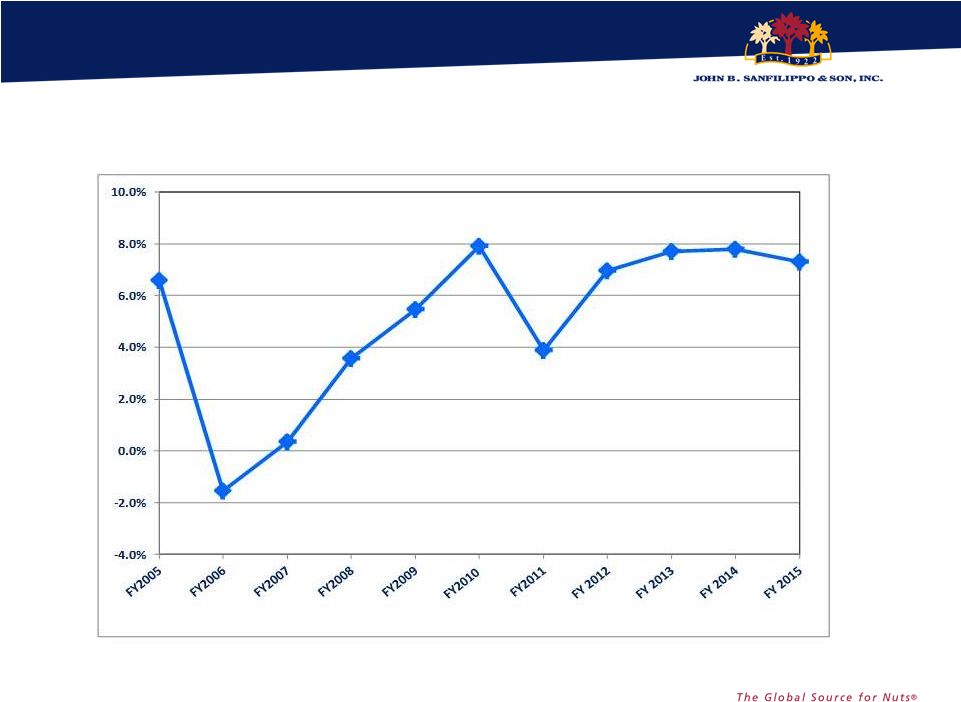 EBITDA*
Margin (% of Net Sales) * EBITDA
is a non-GAAP measure. See slide entitled “Reconciliation of Net (Loss) Income to EBITDA” for reconciliation to GAAP measure 31 |
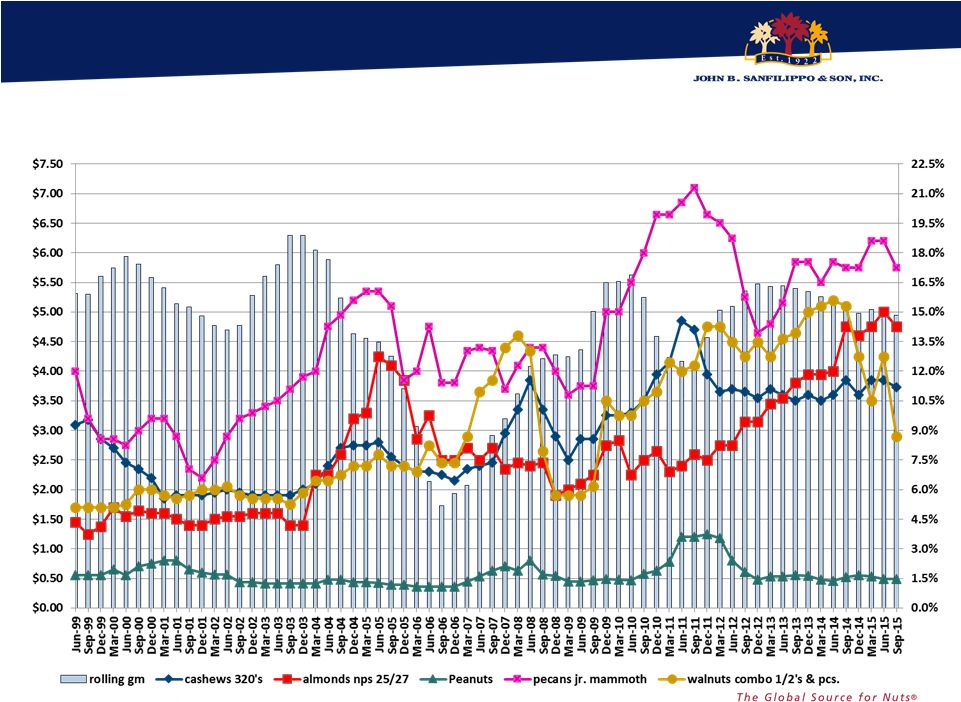 32 PEANUT AND TREE NUT SPOT MARKET PRICES VS. JBSS ROLLING 4 QTR. GROSS MARGIN % |
 Highlights: Q1 2016 vs. Q1 2015
(in 000’s except EPS)
33 $ Change % Change Net
Sales $
20,740 10.1% Sales Volume (lbs.
sold) Flat Flat Gross
Profit $
2,521 8.2% Net
Income $
2,075 35.1% Earnings Per Share $
0.18 34.0% Operating Cash Flows $13,103
47.0%
Total
Debt $
4,821 8.3% |
 FY 2015
Brand Marketing Overview
34 |
 Recipe
Nuts Snack Nuts
Grow Brands 35 |
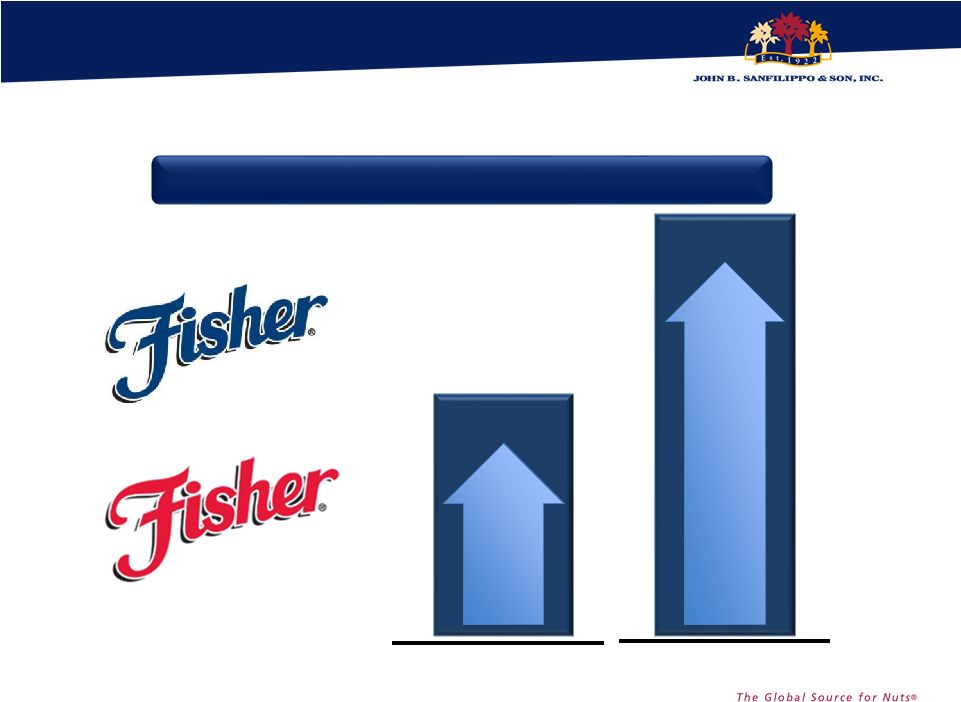 Strong
Growth on the Fisher brand in FY15 Total Fisher Brand Growth FY15
vs. FY14 +8%
+14% Recipe Nuts Snack Nuts POUND SALES DOLLAR SALES 36 Source: JBSS shipment data |
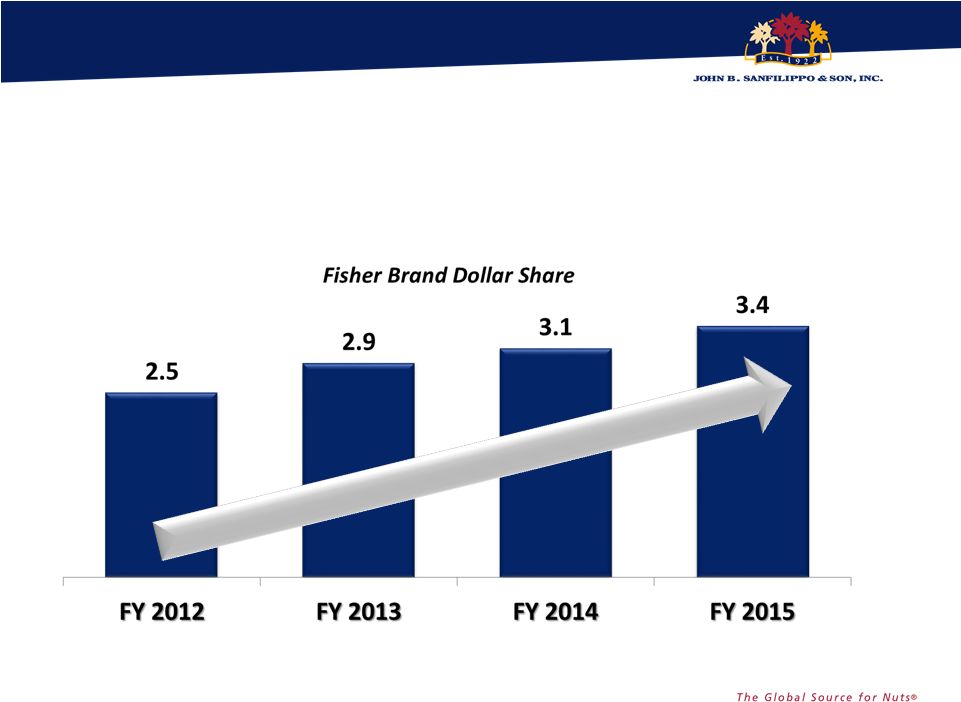 Fisher
Brand has Grown Share of Market Source:
IRI: Total Nut Category – Multi Outlet Geography – Year Ending 6/28/15 37 |
 38 Recipe Nuts |
 0.0% 5.0% 10.0% 15.0% 20.0% 25.0% 30.0% 35.0% 40.0% Quarter Ending 04-01-Ending 07-01-Ending 09-30-Ending 12-30-Ending 03-31-Ending 06-30-Ending
09-29-Ending 12-29-Ending 03-30-Ending 06-29-Ending 09-28-Ending 12-28-Ending 03-29-Ending 06-28- 12 Quarter 12 Quarter 12 Quarter 12 Quarter 13 Quarter 13 Quarter 13 Quarter 13 Quarter 14 Quarter 14 Quarter 14 Quarter 14 Quarter 15 Quarter 15 Fisher Pound % Change vs. Same Period Prior Year Strong and Sustained Growth on Fisher Recipe Nuts for 3 ½ years Source: IRI: Total Nut Category – Multi Outlet Geography – Quarter Week Data Ending 6/28/15 Recipe Nuts 14 Consecutive Quarters of Growth! 39 |
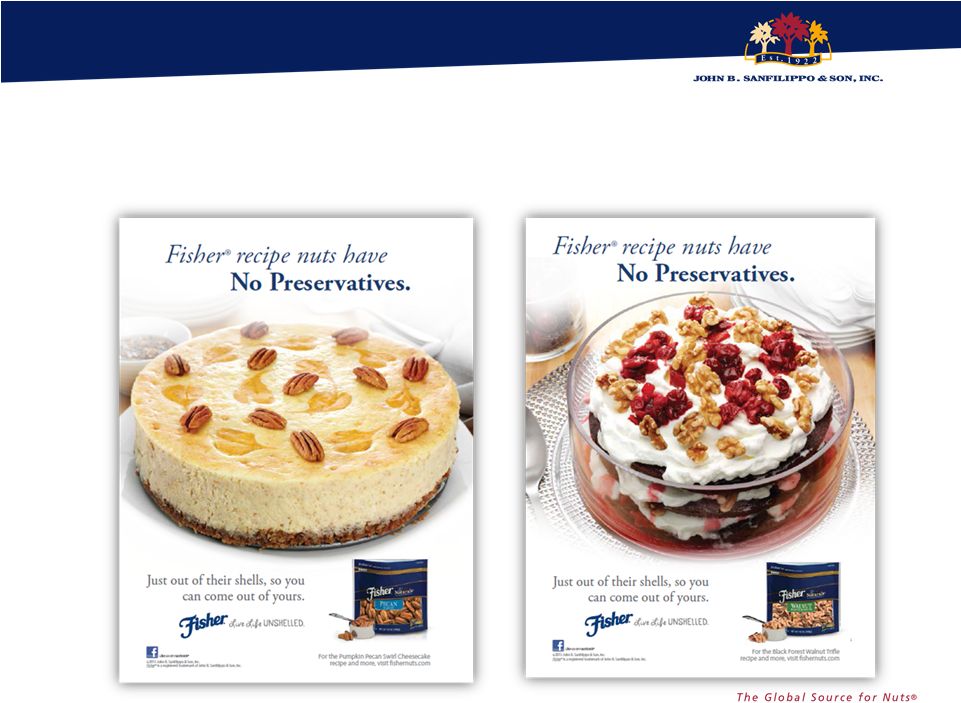 “No Preservatives” Message Key Driver
for Share Growth 40 |
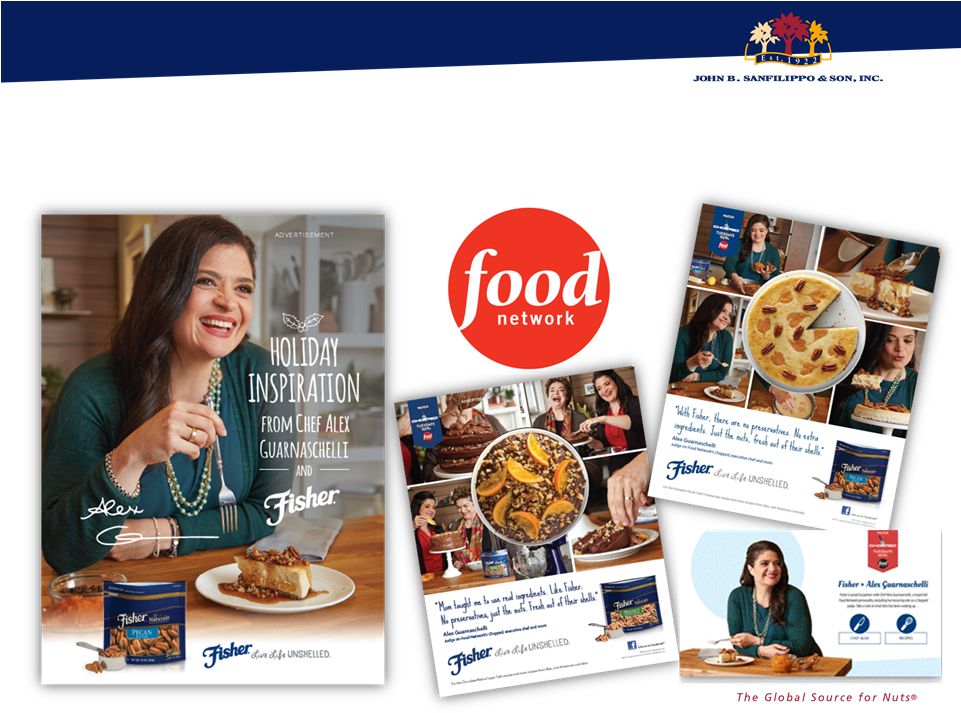 Continue
to Build Fisher Brand Equity with Food Network Sponsorship
41 |
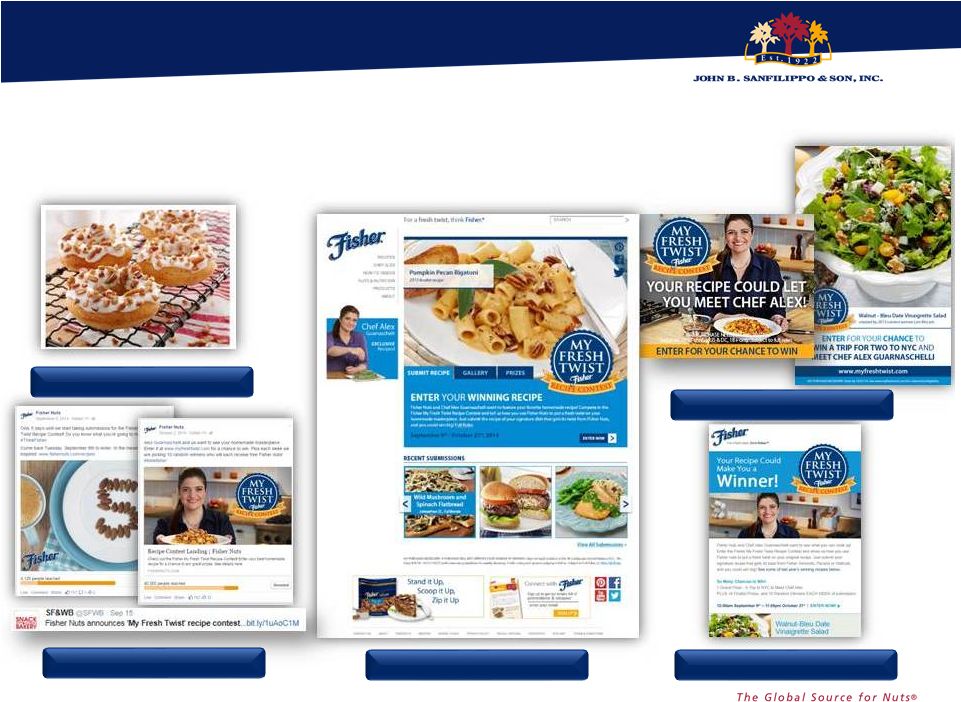 Integrated Marketing Key to
Building Brand Equity 42 Website Social Media Public Relations Food Network Email |
 Building
Brand Presence and Equity “Away From
Home” 43
Merchandised Foodservice Location |
 44 Snack Nuts |
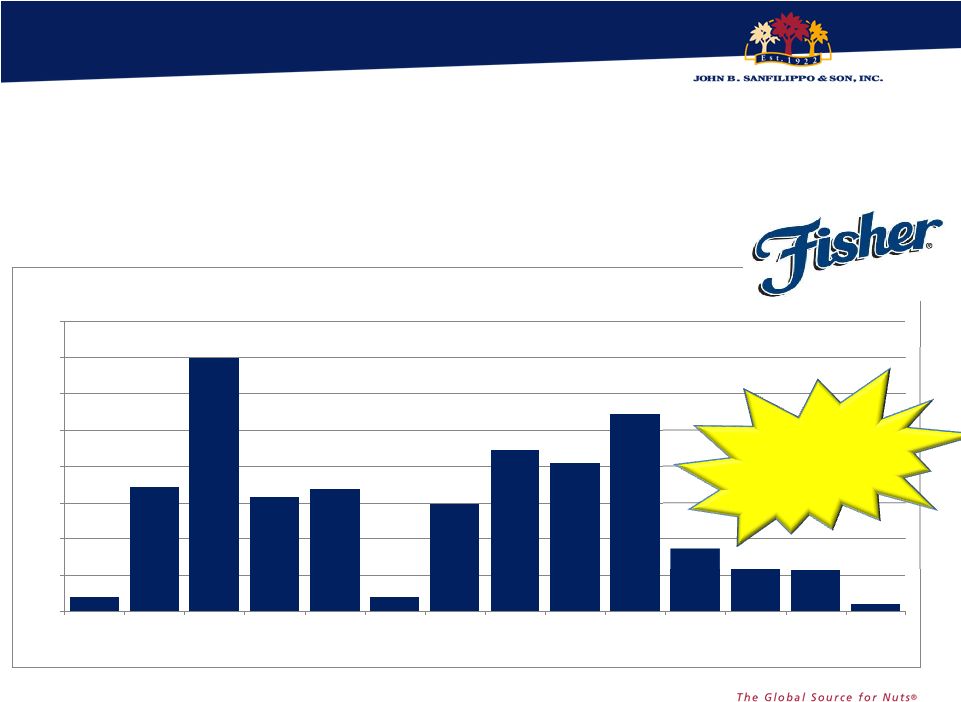
 Fisher
Snack Nut Strategy Focuses on Midwest High Franchise Markets
Snack Nuts 45 |
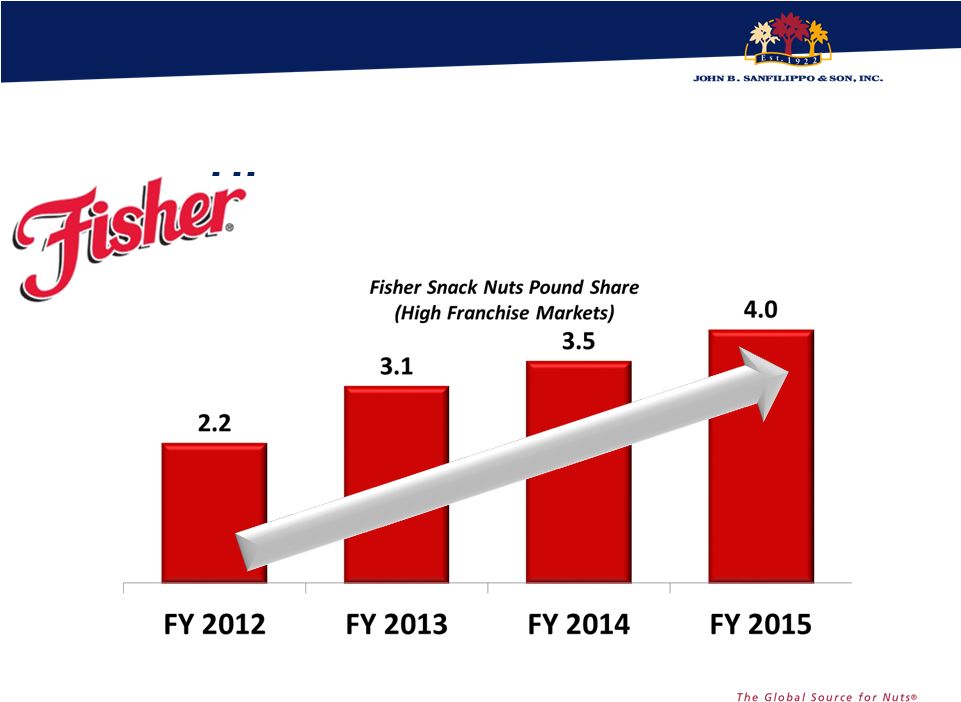 Source: IRI: Ttl Snack Nut Category – Fisher High Franchise Geography – Years Ending 6/28/15 We Are Growing our Pound Share in High Franchise Markets 46 Snack Nuts |
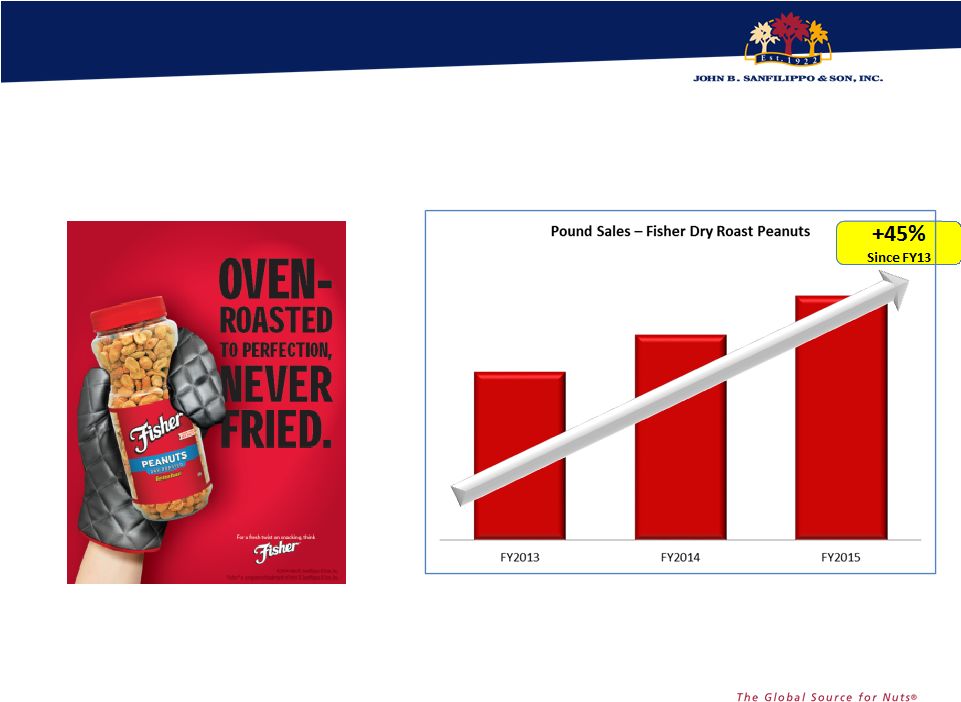 Driving
Results on our Core Dry Roast Peanut Business
47 +45% Since FY13 Source: IRI: Ttl Snack Nut Category – Fisher High Franchise Geography –Years Ending 6/28/15 |
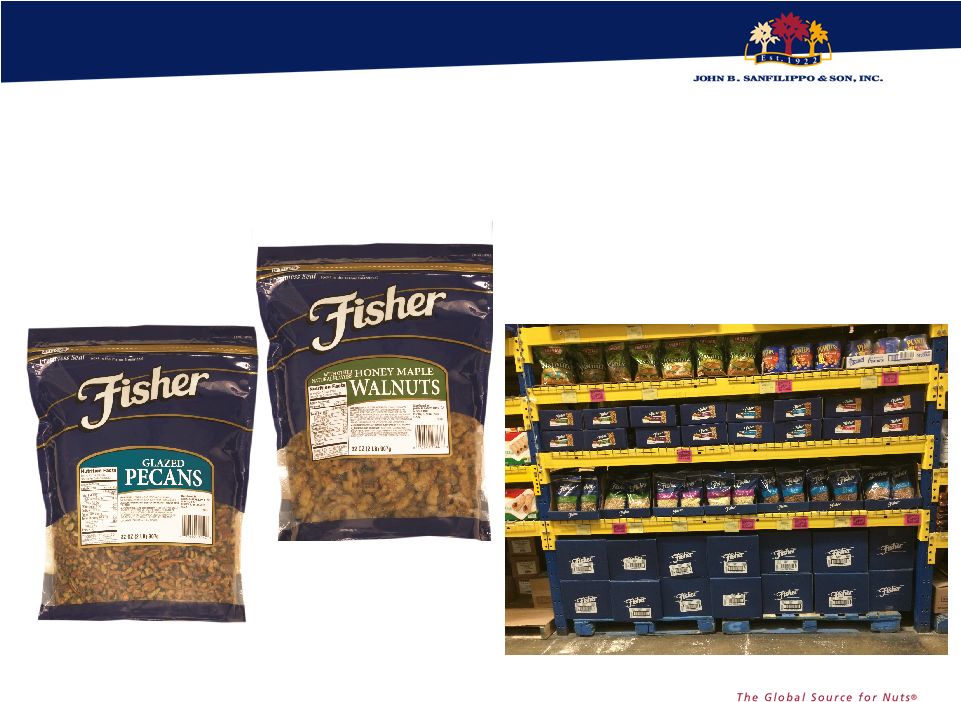
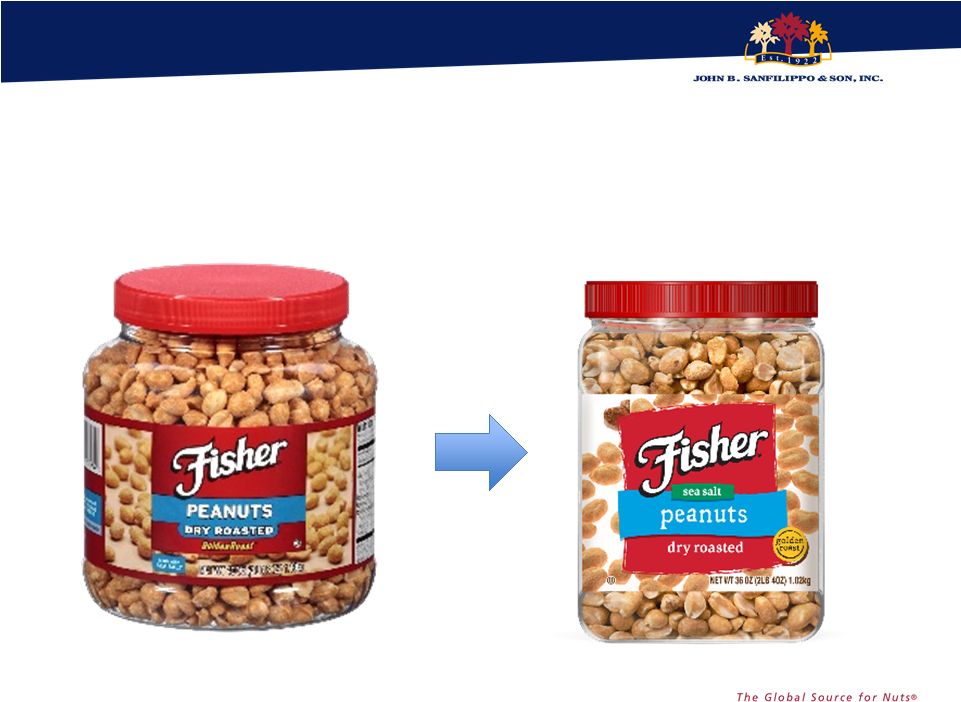 New Look
for Fisher Snack Nuts 48 |
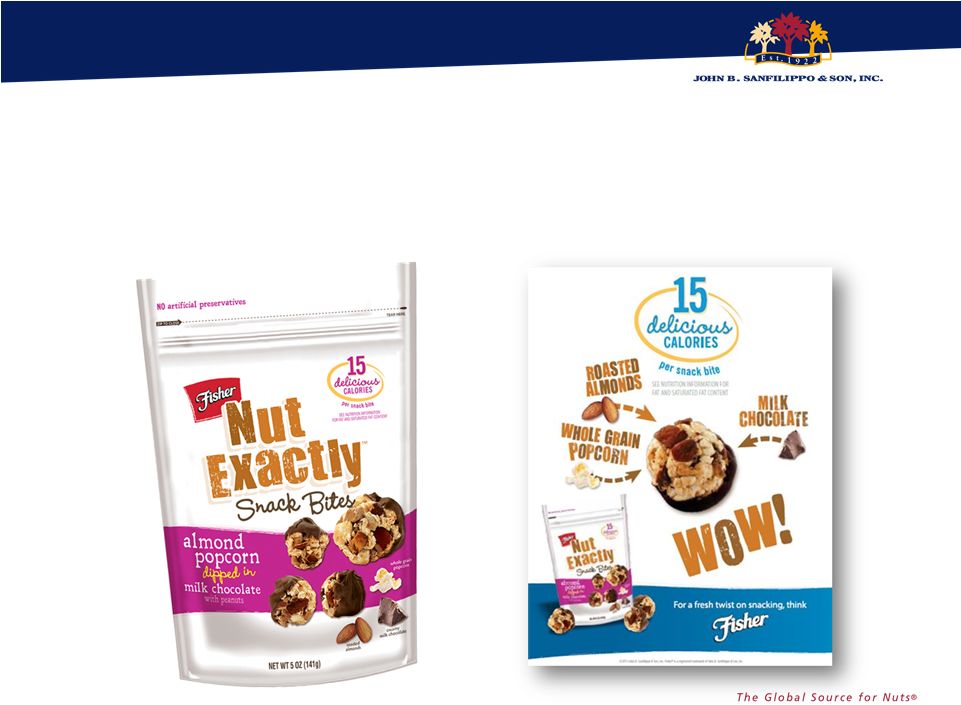 A Snack
Bite combining Consumer favorites
49 |
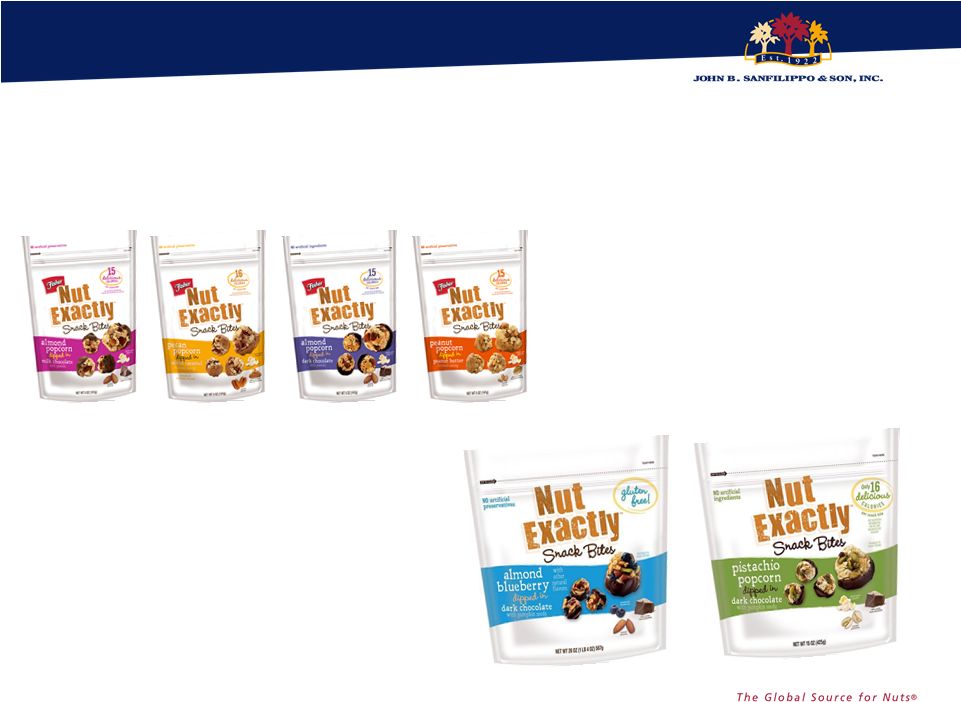 Introducing Fisher Nut Exactly
50 4 Great Popcorn Varieties for Grocery Channel Unique Varieties for the Club Channel |
 Meeting
needs of the Snack Consumer Snacking
Yogurt/Veggies Popcorn Nuts Chips Candy Bars New Segment: Lighter than nuts, more substantial than popcorn Indulgent Healthier 51 |
 Retailers Like our New Snacking
Concept Too 52 |
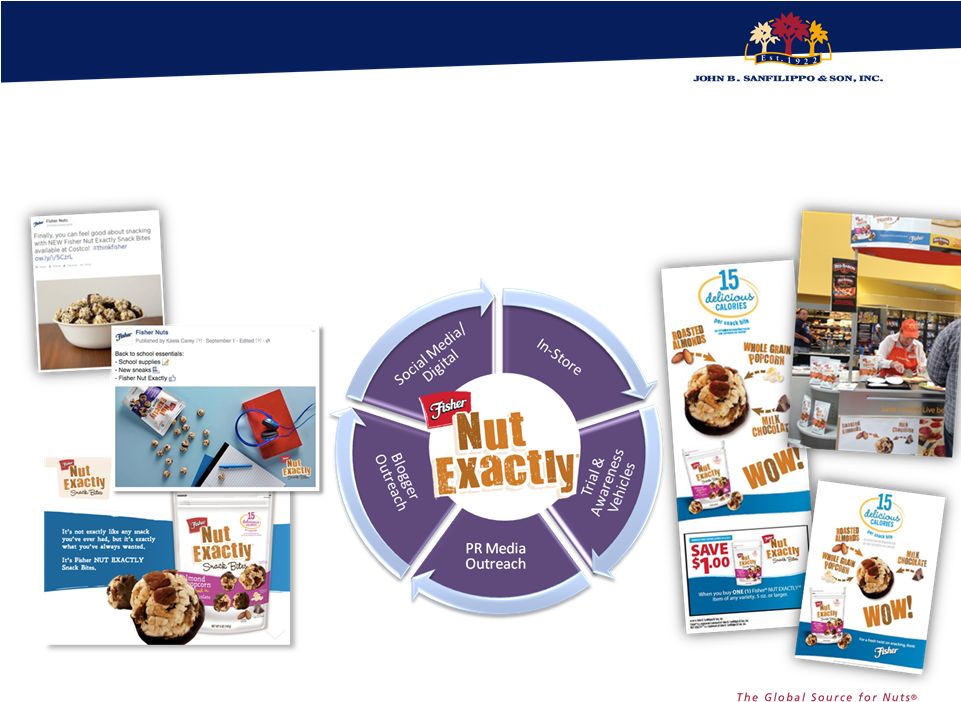 Marketing Support is Designed to Build
Consumer Awareness and Drive Trial |
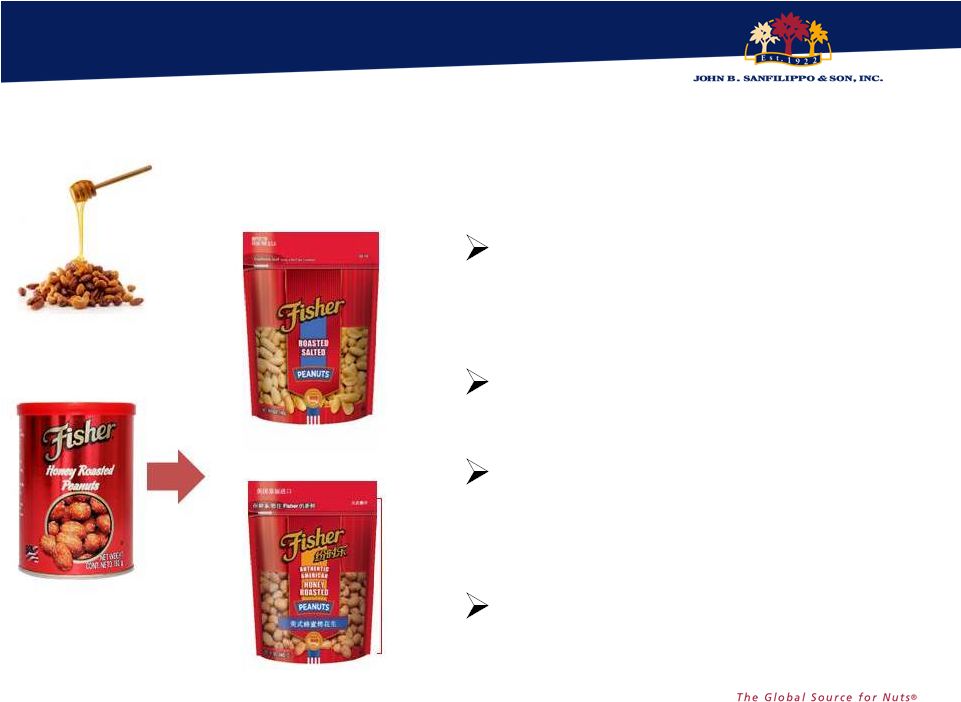 Launching Fisher International
Line Globally 54 Stand-up Bag - Premium Graphics Improved Value Perception “Authentic American” Consumer Communication Portfolio Focused on Honey Roasted
International
China |
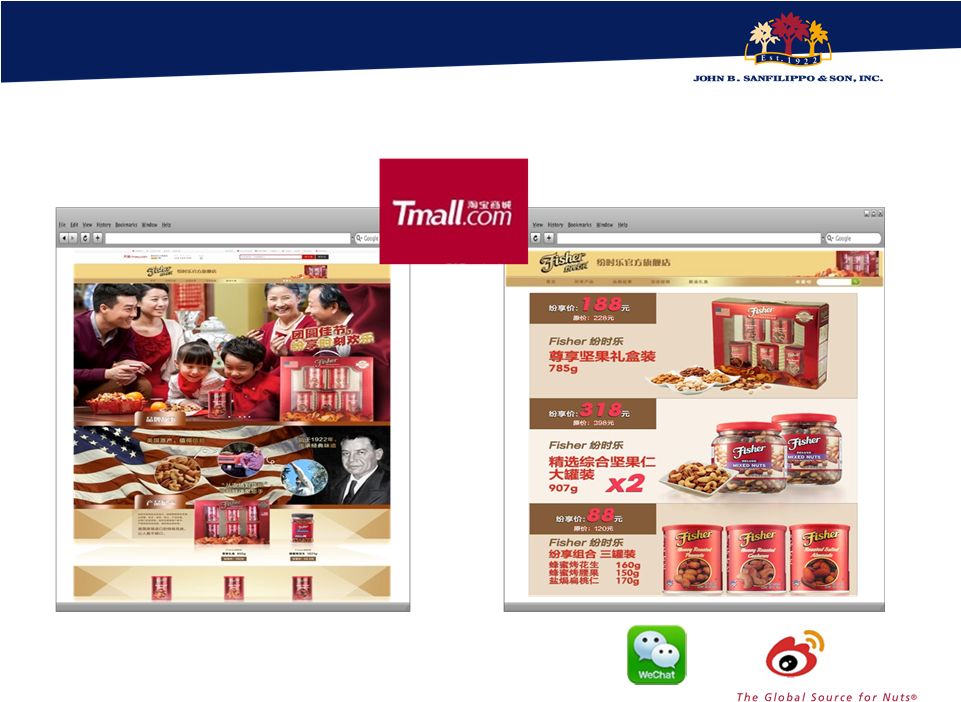 Fisher
Flagship Store on Tmall in China Supported with digital marketing
via and
55 |
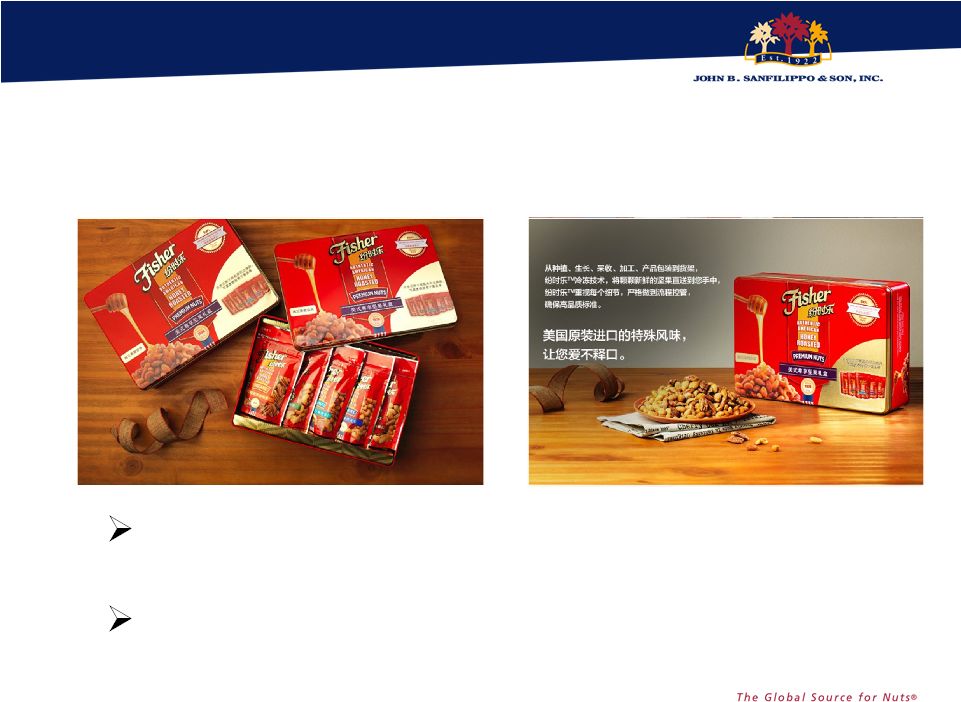 New
Premium Chinese New Year Gift Pack
Third-generation offering for key Holiday season
Building Fisher image and equity with consumers
56 |
 Pure
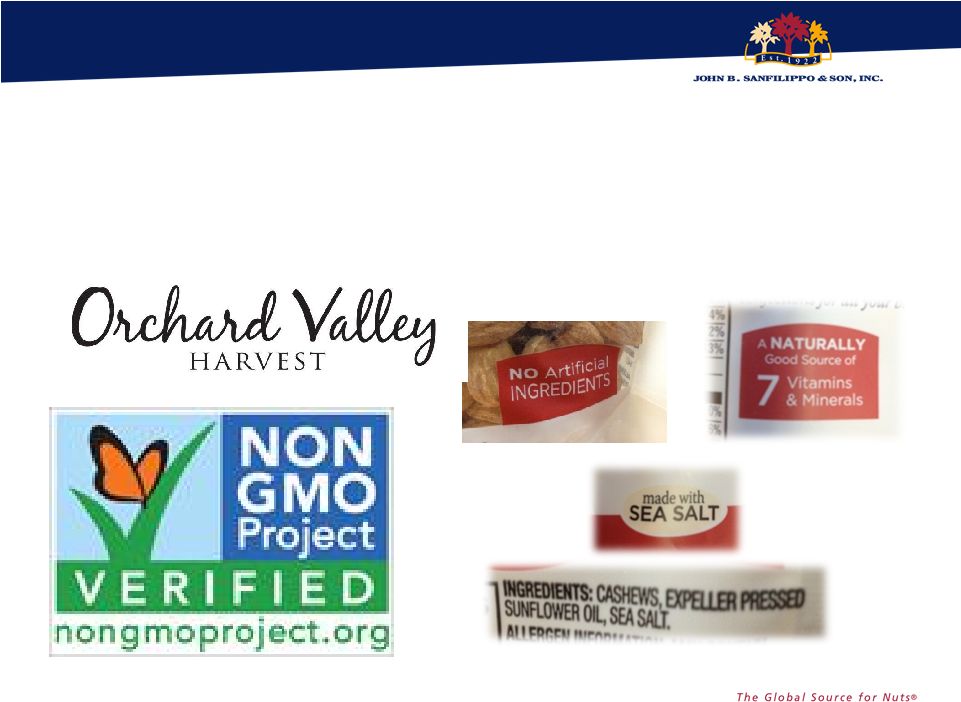
and Simple Goodness 57 |
 Pure & Simple Goodness
Supports a healthy lifestyle
Close to the earth
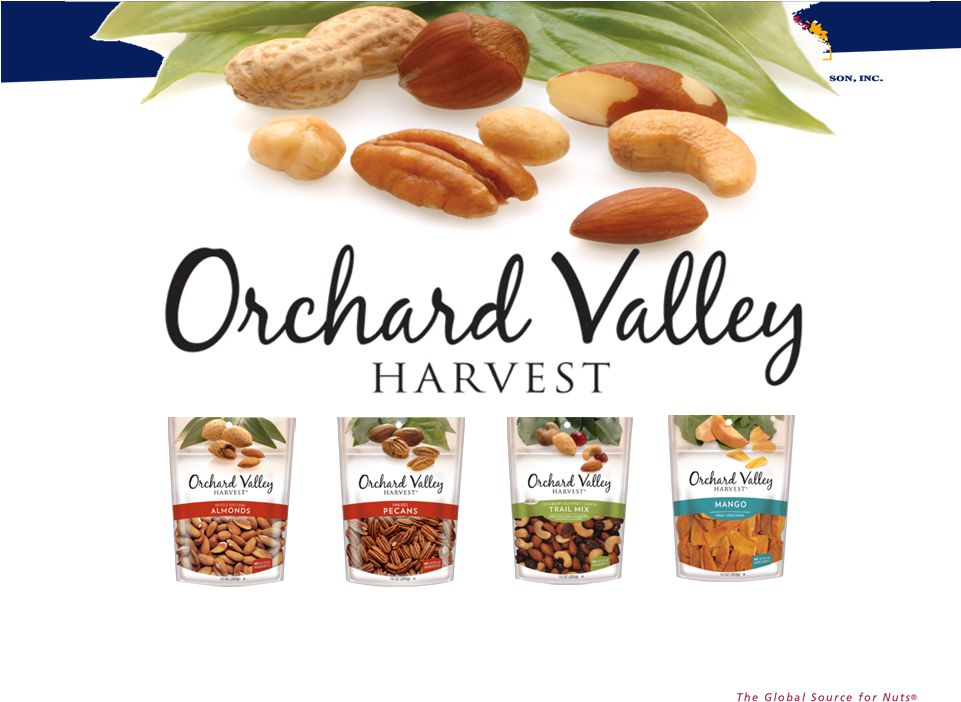
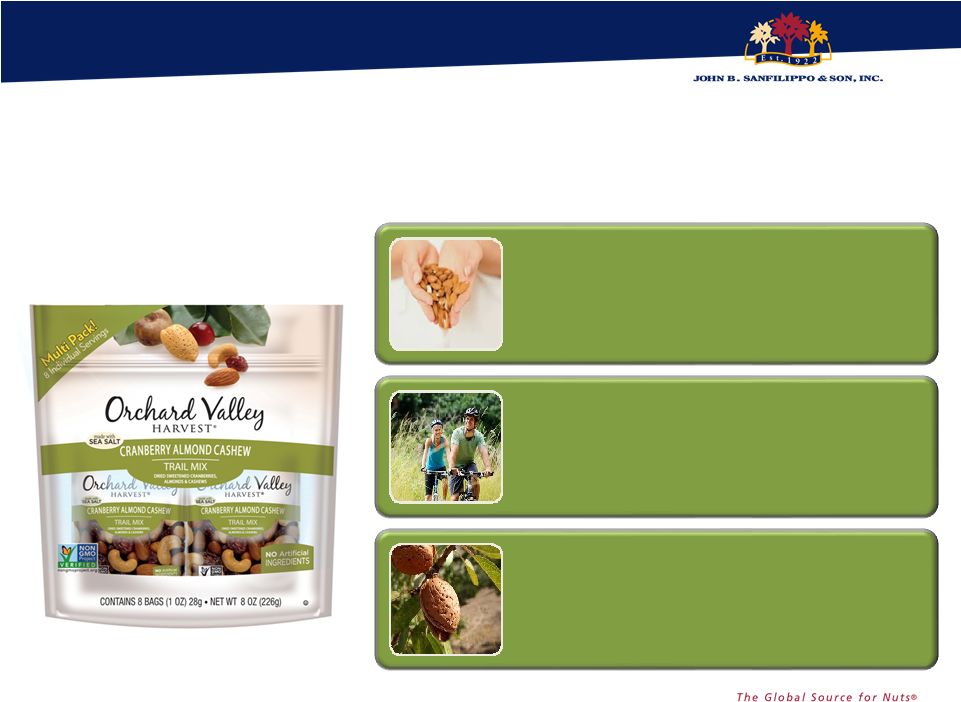
58 Our Orchard Valley Harvest Brand is On-Trend with Today’s Consumer |
 The
Brand Consumers Trust for Pure & Simple Goodness
59 |
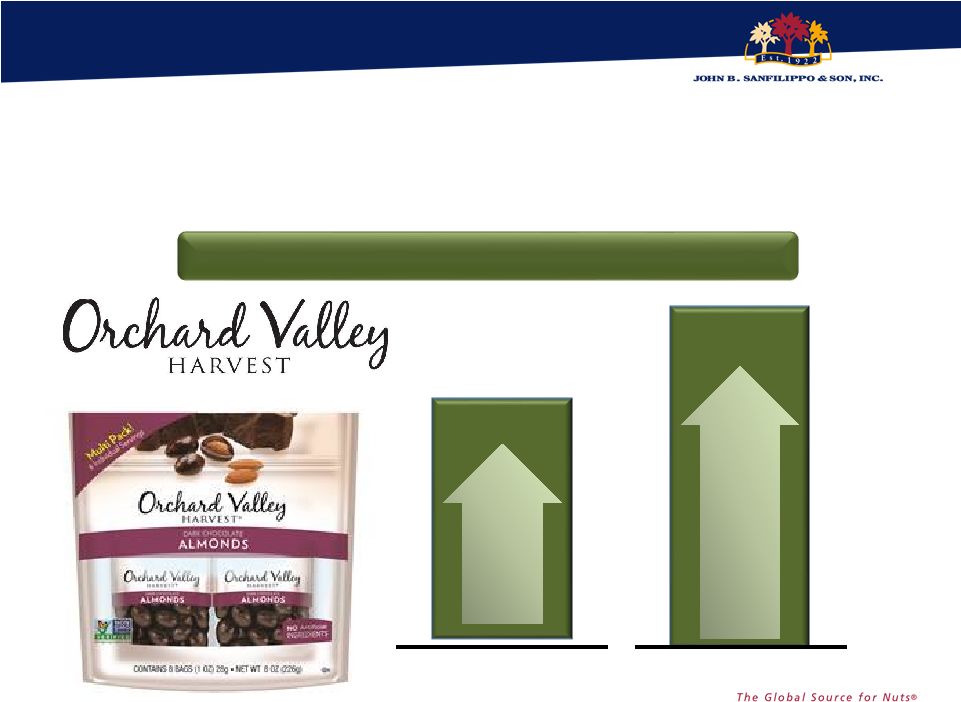 Strong
Growth on Orchard Valley Harvest
Orchard Valley Harvest Growth FY15 vs. FY14
+34% +48% POUND SALES DOLLAR SALES 60 Source: JBSS shipment data |
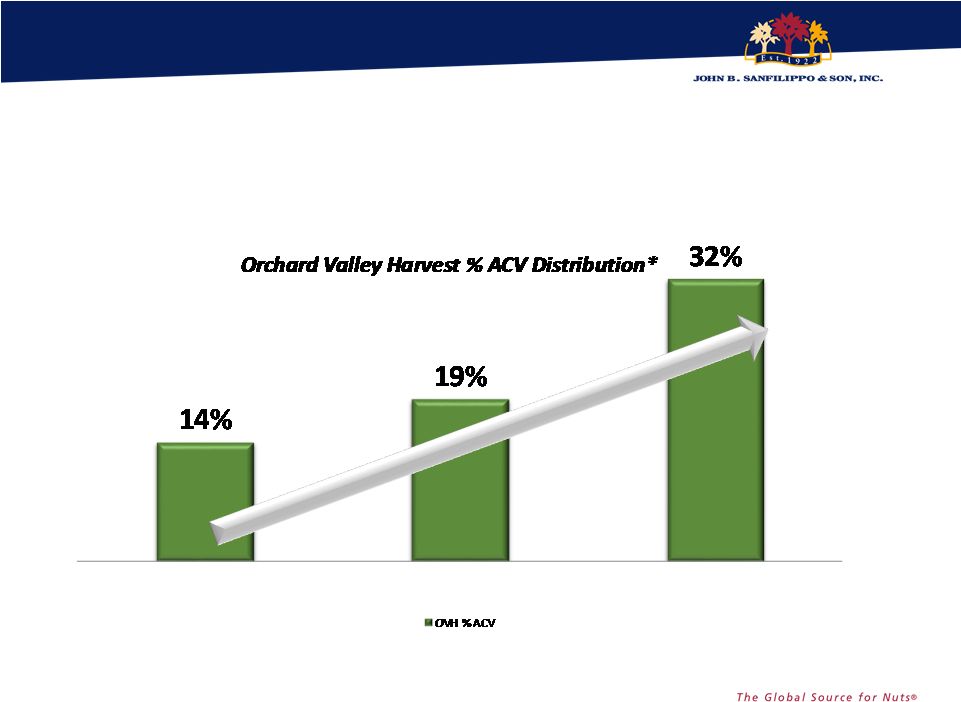 Source: IRI: Ttl Produce Nut Category – Total US Food Geography–Year Ending 6/28/15 *Note: % ACV refers to % “All Commodity Volume” as measured by IRI
61 Strong Distribution Gains FY 2013 FY 2014 FY 2015 |
 Source: The Hartman Group : Eating Occasions, Compass 2012
The Hartman Group: Reimagining Health and
Wellness, 2013 Snacking accounts for
over 53% of all eating
occasions in the U.S.
38% of consumers snack
several times per day
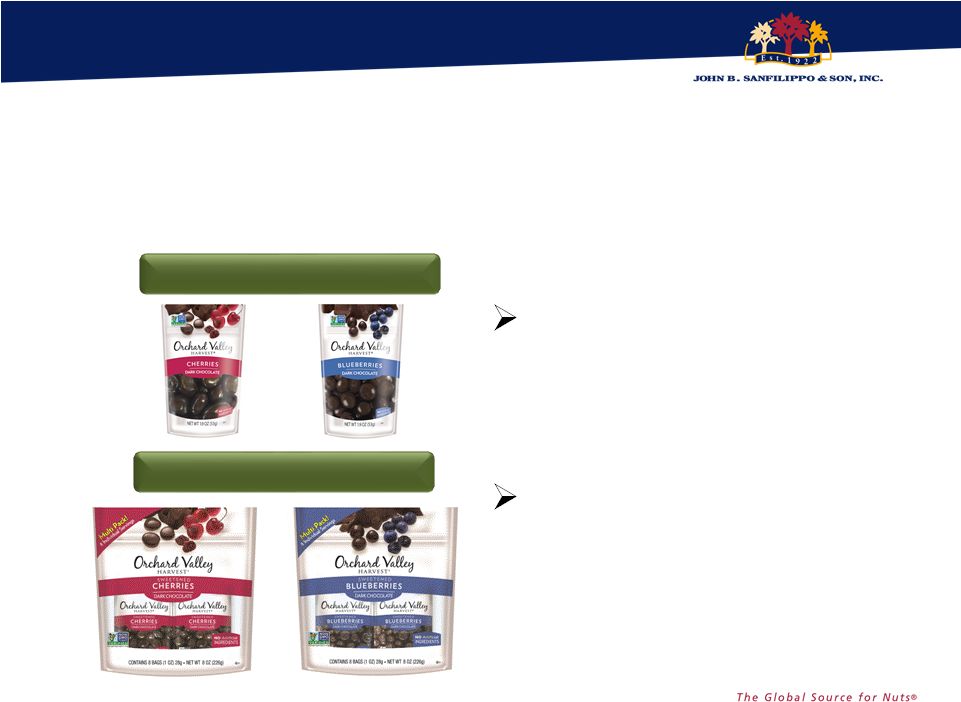
Grab ‘n Go Mini’s
Multi-Packs 62 We continue to expand our portfolio to address consumer demand for on-the-go Goodness |
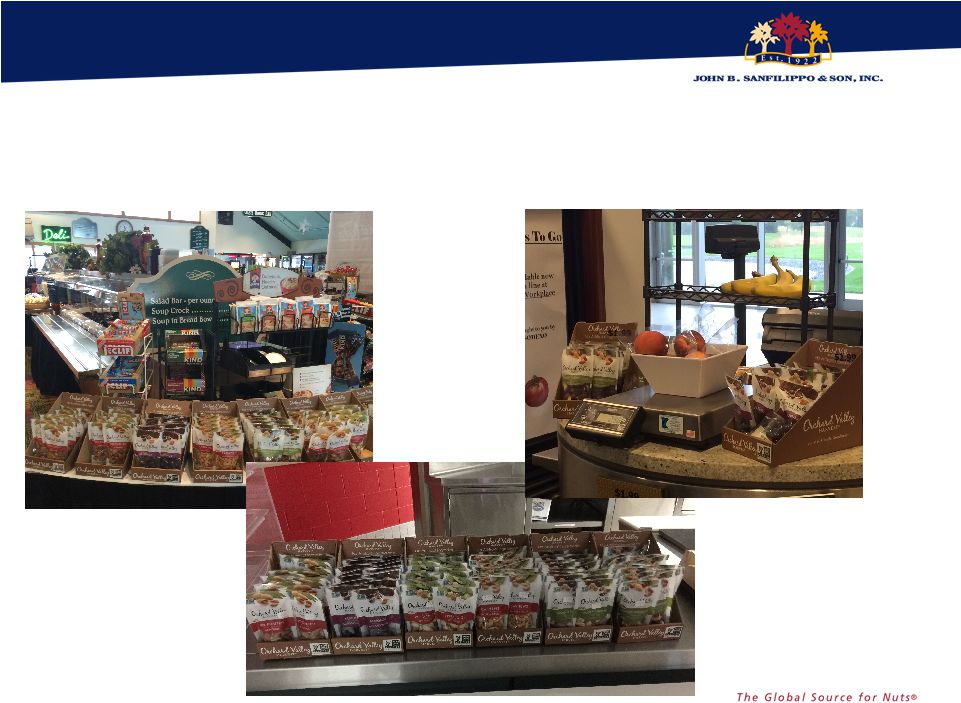 Expanding to Front of House Foodservice
Locations 63 University Setting Sodexho B&I Location Michigan Ski Resort |
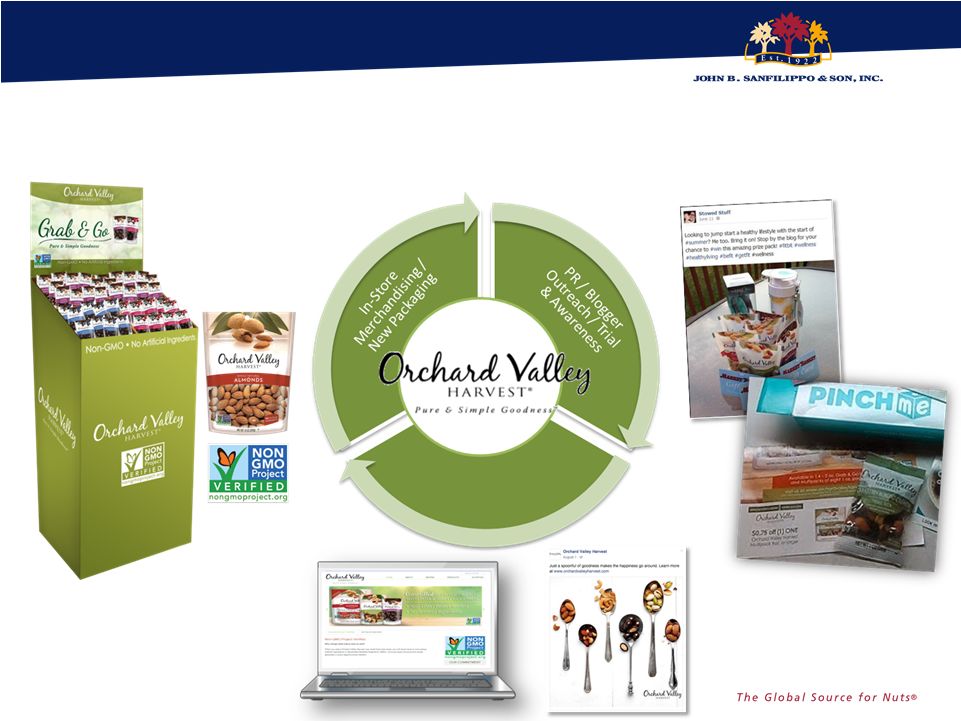 64 Impactful Marketing Support Digital Initiatives Website / Ibotta |
 Capital
Expenditures History
65 |
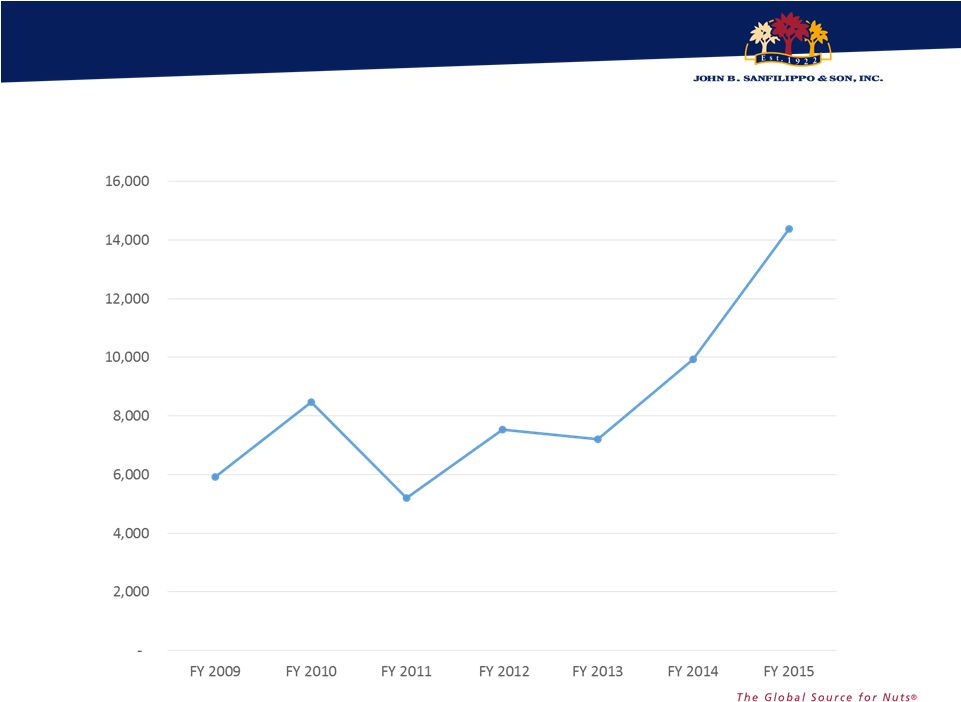 JBSS CAP EX HISTORY
66 $000’S |
 JBSS CAP EX HISTORY
67 Category FY 2009 FY 2010 FY 2011 FY 2012 FY 2013 FY 2014 FY 2015 Non-Manufacturing and Other 1,512 1,581 1,647 1,836 1,888 1,115 2,094 OPERATIONS: - ELGIN 1,854 3,522 1,536 2,621 2,373 5,365 5,033 GUSTINE 470 355 1,086 1,140 345 878 763 SELMA 405 1,136 124 394 1,605 1,697 3,321 BAINBRIDGE 1,362 1,255 351 1,137 774 750 2,778 GARYSBURG 309 500 428 403 222 123 403 MODESTO - 132 23 - - - - TOTAL OPERATIONS. 4,400 6,900 3,548 5,695 5,319 8,813 12,298 TOTAL CAP EX 5,912 8,481 5,195 7,531 7,207 9,928 14,392 $000’S |
 Closing
Comments 68 |
 IMPORTANCE OF CULTURE
Your culture produces your results.
The word change means, “to make or become
different”.
The single most important change in actions that
needs to occur during a time of cultural
transition is the shift to greater accountability.
69 |
 Principles of Successful Strategy
• Differentiation – create distinction from competition • Focus – tradeoffs to allocate resources • System – building interrelated network of activities 70 |
 71 FY 2016 Doing What Matters Most * Grow Brands & Key Customers *Maximize Return on Capital * Optimize Business Practices * Deliver the Employment Promise |
 72 JBSS Mission To be the global leader of quality driven, innovative nut solutions that enhance the customer and consumer experience and achieve consistent, profitable growth for our shareholders. We will accomplish this through our commitment to a dynamic infrastructure that maximizes the potential of our brands, people and processes |
 Thank
You! 73 |